UNITED STATES
SECURITIES AND EXCHANGE COMMISSION
Washington, D.C. 20549
FORM N-CSR
CERTIFIED SHAREHOLDER REPORT OF REGISTERED
MANAGEMENT INVESTMENT COMPANIES
Investment Company Act file number | 811-09913 | |
| AIM Counselor Series Trust (Invesco Counselor Series Trust) | ||
| (Exact name of registrant as specified in charter) | ||
| 11 Greenway Plaza, Suite 1000 Houston, Texas 77046 | ||
| (Address of principal executive offices) (Zip code) | ||
| Sheri Morris 11 Greenway Plaza, Suite 1000 Houston, Texas 77046 | ||
| (Name and address of agent for service) | ||
Registrant’s telephone number, including area code: | (713) 626-1919 |
Date of fiscal year end: | 8/31 | |
Date of reporting period: | 8/31/17 | |
Item 1. Report to Stockholders.
| ||||
 | Annual Report to Shareholders
| August 31, 2017
| ||
| ||||
Invesco American Franchise Fund
Nasdaq: A: VAFAX ◾ B: VAFBX ◾ C: VAFCX ◾ R: VAFRX ◾ Y: VAFIX ◾ R5: VAFNX ◾ R6: VAFFX | ||||

2 Letters to Shareholders 4 Performance Summary 4 Management’s Discussion 6 Long-Term Fund Performance 8 Supplemental Information 9Schedule of Investments 11 Financial Statements 13 Notes to Financial Statements 20 Financial Highlights 21 Auditor’s Report 22 Fund Expenses 23 Approval of Investment Advisory and Sub-Advisory Contracts 25 Tax Information 26 Proxy Results T-1 Trustees and Officers
Letters to Shareholders
Philip Taylor | Dear Shareholders: This annual report includes information about your Fund, including performance data and a complete list of its investments as of the close of the reporting period. Inside is a discussion of how your Fund was managed and the factors that affected its performance during the reporting period. The reporting period began with stock market volatility in the US and abroad, largely the result of uncertainty about global economic growth and monetary policy. While economic data in the US were generally positive, news overseas was less upbeat. The European Central Bank and central banks in China and Japan – as well as other countries – maintained extraordinarily accommodative monetary policies in response to economic weakness. Citing generally positive economic data – specifically, realized and expected labor market conditions and inflation – the US Federal Reserve raised interest rates three times during the reporting period: in December 2016, and in March and |

June 2017. The major US stock market rally that began in November 2016 continued through the end of the reporting period, with major stock market indexes repeatedly hitting new record highs.
Short-term market volatility can prompt some investors to abandon their investment plans – and can cause others to settle for whatever returns the market has to offer. The investment professionals at Invesco, in contrast, invest with high conviction. This means that, no matter the asset class or the strategy, each investment team has a passion to exceed. We want to help investors achieve better outcomes, such as seeking higher returns, helping mitigate risk and generating income. Of course, investing with high conviction can’t guarantee a profit or ensure success; no investment strategy can. To learn more about how we invest with high conviction, visit invesco.com/HighConviction.
You, too, can invest with high conviction by maintaining a long-term investment perspective and by working with your financial adviser on a regular basis. During periods of short-term market volatility or uncertainty, your financial adviser can keep you focused on your long-term investment goals – a new home, a child’s college education or a secure retirement. He or she also can share research about the economy, the markets and individual investment options.
Visit our website for more information on your investments
Our website, invesco.com/us, offers a wide range of market insights and investment perspectives. On the website, you’ll find detailed information about our funds, including performance, holdings and portfolio manager commentaries. You can access information about your account by completing a simple, secure online registration. To do so, select “Log In” on the right side of the homepage, and then select “Register for Individual Account Access.”
In addition to the resources accessible on our website and through our mobile app, you can obtain timely updates to help you stay informed about the markets and the economy by connecting with Invesco on Twitter, LinkedIn or Facebook. You can access our blog at blog.invesco.us.com. Our goal is to provide you the information you want, when and where you want it.
Finally, I’m pleased to share with you Invesco’s commitment to both the Principles for Responsible Investment and to considering environmental, social and governance issues in our robust investment process. I invite you to learn more at invesco.com/esg.
Have questions?
For questions about your account, contact an Invesco client services representative at 800 959 4246. For Invesco-related questions or comments, please email me directly at phil@invesco.com.
All of us at Invesco look forward to serving your investment management needs. Thank you for investing with us.
Sincerely,

Philip Taylor
Senior Managing Director, Invesco Ltd.
2 Invesco American Franchise Fund
Bruce Crockett | Dear Fellow Shareholders: Among the many important lessons I’ve learned in more than 40 years in a variety of business endeavors is the value of a trusted advocate. As independent chair of the Invesco Funds Board, I can assure you that the members of the Board are strong advocates for the interests of investors in Invesco’s mutual funds. We work hard to represent your interests through oversight of the quality of the investment management services your funds receive and other matters important to your investment, including but not limited to: ∎ Ensuring that Invesco offers a diverse lineup of mutual funds that your financial adviser can use to strive to meet your financial needs as your investment goals change over time. ∎ Monitoring how the portfolio management teams of the Invesco funds are performing in light of changing economic and market conditions. |

∎ Assessing each portfolio management team’s investment performance within the context of the investment strategy described in the fund’s prospectus.
∎ Monitoring for potential conflicts of interests that may impact the nature of the services that your funds receive.
We believe one of the most important services we provide our fund shareholders is the annual review of the funds’ advisory and sub-advisory contracts with Invesco Advisers and its affiliates. This review is required by the Investment Company Act of 1940 and focuses on the nature and quality of the services Invesco provides as the adviser to the Invesco funds and the reasonableness of the fees that it charges for those services. Each year, we spend months carefully reviewing information received from Invesco and a variety of independent sources, such as performance and fee data prepared by Lipper, Inc. (a subsidiary of Broadridge Financial Solutions, Inc.), an independent, third-party firm widely recognized as a leader in its field. We also meet with our independent legal counsel and other independent advisers to review and help us assess the information that we have received. Our goal is to assure that you receive quality investment management services for a reasonable fee.
I trust the measures outlined above provide assurance that you have a worthy advocate when it comes to choosing the Invesco Funds.
As always, please contact me at bruce@brucecrockett.com with any questions or concerns you may have. On behalf of the Board, we look forward to continuing to represent your interests and serving your needs.
Sincerely,

Bruce L. Crockett
Independent Chair
Invesco Funds Board of Trustees
3 Invesco American Franchise Fund
Management’s Discussion of Fund Performance
Performance summary For the fiscal year ended August 31, 2017, Class A shares of Invesco American Franchise Fund (the Fund), at net asset value (NAV), outperformed the Fund’s style-specific benchmark, the Russell 1000 Growth Index. Your Fund’s long-term performance appears later in this report.
|
| |||
Fund vs. Indexes Total returns, 8/31/16 to 8/31/17, at net asset value (NAV). Performance shown does not include applicable contingent deferred sales charges (CDSC) or front-end sales charges, which would have reduced performance.
| ||||
Class A Shares | 24.19 | % | ||
Class B Shares | 24.24 | |||
Class C Shares | 23.23 | |||
Class R Shares | 23.93 | |||
Class Y Shares | 24.47 | |||
Class R5 Shares | 24.63 | |||
Class R6 Shares | 24.72 | |||
S&P 500 Indexq (Broad Market Index) | 16.23 | |||
Russell 1000 Growth Indexq (Style-Specific Index) | 20.82 | |||
Lipper Large-Cap Growth Funds Index∎ (Peer Group Index) | 21.57 | |||
Source(s): qFactSet Research Systems Inc.; ∎Lipper Inc. |
| |||
Market conditions and your Fund
The fiscal year began with major US stock market indexes posting gains, with most hitting record highs following the US presidential election. Investors seemed to believe that the new administration’s plans to reduce tax rates, scale back regulations and increase infrastructure spending had the potential to stimulate economic growth. However, that was called into question in the first quarter of 2017, when headlines out of Washington, DC, suggested that enacting significant regulatory and tax reform might be more difficult than previously anticipated. Signs of an improving economy prompted the US Federal Reserve to raise interest rates three times during the reporting period: in December 2016 and in March and June 2017. In the first quarter of 2017, the US economy grew at an anemic rate, with gross domestic product rising at an annualized rate of just 1.2%.1 However, the
economy picked up steam during the second quarter. Unemployment continued its years-long decline, hitting a 16-year low of 4.3% in the summer of 2017.2 US equities were strong throughout the reporting period, and major US equity market indexes hit new record highs during the summer.
While US stock market indexes rose for the reporting period, individual market sectors performed very differently from one another. Information technology (IT), financials and industrials were the strongest-performing sectors, while energy, telecommunication services and real estate were the weakest-performing sectors.
During the fiscal year, the Fund’s Class A shares at NAV produced a double-digit gain and outperformed the style-specific benchmark. Fund holdings in the IT, consumer discretionary and consumer staples sectors outperformed, while holdings in the energy and health care sectors underperformed.
On a relative basis, the Fund outperformed its style-specific index by the widest margin in the IT sector due to strong stock selection and overweight exposure to the sector. Alibaba Group, a Chinese e-commerce company, was a leading contributor to performance. The company’s stock price rose after they reported better-than-expected year-over-year results and increased revenue from its video and social networking platforms. Social media giant Facebook was also a contributor to performance during the reporting period. The company’s stock rose on better-than-expected fourth quarter results driven by a continued migration to mobile, increasing video usage, contributions from Instagram and better user metrics.
Stock selection in the consumer discretionary sector also contributed to performance relative to the Fund’s style-specific benchmark. Retail and e-commerce giant Amazon.com was a leading contributor to performance. After a short pause toward the second half of 2016, the company’s stock price rose in early 2017 on better-than-expected fourth quarter margins. Electronics manufacturing giant Sony also contributed to performance within the sector. The company’s earnings were ahead of expectations on better results in financials, music and TV, boosting the stock. We continue to see deeply discounted valuation in Sony paired with solid growth acceleration and multiple catalysts ahead.
In contrast, overweight exposure to the energy sector was the leading detractor from performance relative to the Fund’s style-specific benchmark. The energy sector was the worst-performing sector in the style-specific index as crude prices declined on concerns over increasing US energy supplies and fears that the OPEC cuts enacted in November 2016 would not continue after June 2017. Despite OPEC
| Portfolio Composition | ||||
By sector | % of total net assets | |||
Information Technology | 43.1% | |||
| Consumer Discretionary | 24.0 | |||
| Health Care | 15.0 | |||
Industrials | 5.4 | |||
Consumer Staples | 3.4 | |||
Materials | 3.0 | |||
Financials | 2.5 | |||
Telecommunication Services | 1.7 | |||
| Energy | 1.2 | |||
| Real Estate | 0.5 | |||
| Money Market Funds | ||||
| Plus Other Assets Less Liabilities | 0.2 | |||
| Top 10 Equity Holdings* | ||||||
| % of total net assets | ||||||
1. |
Amazon.com, Inc. | 6.8% | ||||
| 2. | Alphabet Inc.-Class A | 6.8 | ||||
| 3. | Facebook, Inc.-Class A | 6.0 | ||||
| 4. | Apple Inc. | 4.8 | ||||
| 5. | Alibaba Group Holding Ltd.-ADR | 4.1 | ||||
| 6. | Sony Corp. | 3.4 | ||||
| 7. | Lowe’s Cos., Inc. | 3.3 | ||||
| 8. | UnitedHealth Group Inc. | 3.1 | ||||
| 9. | Broadcom Ltd. | 2.8 | ||||
| 10. | Celgene Corp. | 2.7 | ||||
Total Net Assets | $ | 10.3 billion | ||
Total Number of Holdings* | 60 | |||
The Fund’s holdings are subject to change, and there is no assurance that the Fund will continue to hold any particular security.
*Excluding money market fund holdings.
Data presented here are as of August 31, 2017.
4 Invesco American Franchise Fund
members eventually agreeing in May to extend the cuts through March 2018, the sector still did not fully recover. Fund holdings were not immune to the sector decline as Halliburton and Anadarko Petroleum were two of the largest detractors from both absolute and relative performance during the reporting period. During the reporting period, we sold our position in Anadarko Petroleum.
Fund holdings within the health care sector detracted from relative results versus the style-specific benchmark despite producing a double-digit positive return. Amgen, a biotechnology company, was the leading detractor in the sector. The stock declined after the company issued concerning guidance surrounding the durability of its legacy franchises. We exited our position in Amgen during the second quarter of this year. Bristol-Myers Squibb was also a notable detractor from Fund performance. The company suffered an unforeseen setback in a trial for its lead immune-oncology drug for lung cancer. During the reporting period, we sold our position in Bristol-Myers Squibb.
Near-term economic growth seems uncertain despite US consumer and business confidence being strong. Given this scenario, we are seeking opportunities in companies that are taking share within their respective industries. Though we anticipate a possible slowdown in the economy, we continue to prudently balance the Fund between dynamic growth opportunities and more durable growth opportunities.
Thank you for your commitment to Invesco American Franchise Fund and for sharing our long-term investment horizon.
| 1 | Bureau of Economic Analysis |
| 2 | Bureau of Labor Statistics, Bloomberg |
The views and opinions expressed in management’s discussion of Fund performance are those of Invesco Advisers, Inc. These views and opinions are subject to change at any time based on factors such as market and economic conditions. These views and opinions may not be relied upon as investment advice or recommendations, or as an offer for a particular security. The information is not a complete analysis of every aspect of any market, country, industry, security or the Fund. Statements of fact are from sources considered reliable, but Invesco Advisers, Inc. makes no representation or warranty as to their completeness or accuracy. Although historical performance is no guarantee of future results, these insights may help you understand our investment management philosophy.
See important Fund and, if applicable, index disclosures later in this report.

Erik Voss
Chartered Financial Analyst, Portfolio Manager, is lead manager of Invesco American Franchise Fund. He joined Invesco in 2010. Mr. Voss earned a BS in mathematics and an MS in finance from the University of Wisconsin.

Ido Cohen
Portfolio Manager, is manager of Invesco American Franchise Fund. He joined Invesco in 2010. Mr. Cohen earned a BS in economics from The Wharton School of the University of Pennsylvania.
5 Invesco American Franchise Fund
Your Fund’s Long-Term Performance
Results of a $10,000 Investment – Oldest Share Class(es)
Fund and index data from 8/31/07
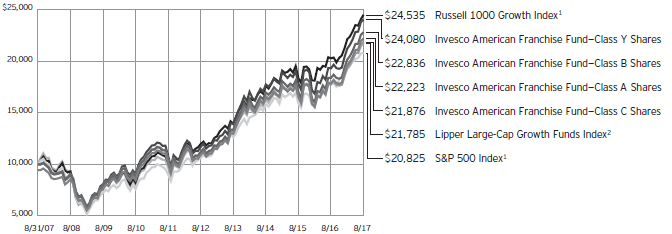
| 1 | Source: FactSet Research Systems Inc. |
| 2 | Source: Lipper Inc. |
Past performance cannot guarantee comparable future results.
The data shown in the chart include reinvested distributions, applicable sales charges and Fund expenses including management fees. Results for Class B shares are calculated as if a hypothetical shareholder had liquidated his entire investment in the Fund at the close of the reporting period and paid the contingent deferred sales charges, if applicable.
Index results include reinvested dividends, but they do not reflect sales charges. Performance of the peer group, if applicable, reflects fund expenses and management fees; performance of a market index does not. Performance shown in the chart and table(s) does not reflect deduction of taxes a shareholder would pay on Fund distributions or sale of Fund shares.
6 Invesco American Franchise Fund
Average Annual Total Returns As of 8/31/17, including maximum applicable sales charges
|
| |||
Class A Shares | ||||
Inception (6/23/05) | 8.65 | % | ||
10 Years | 8.31 | |||
5 Years | 13.95 | |||
1 Year | 17.33 | |||
Class B Shares | ||||
Inception (6/23/05) | 8.74 | % | ||
10 Years | 8.61 | |||
5 Years | 15.03 | |||
1 Year | 19.24 | |||
Class C Shares | ||||
Inception (6/23/05) | 8.35 | % | ||
10 Years | 8.14 | |||
5 Years | 14.37 | |||
1 Year | 22.23 | |||
Class R Shares | ||||
10 Years | 8.65 | % | ||
5 Years | 14.96 | |||
1 Year | 23.93 | |||
Class Y Shares | ||||
Inception (6/23/05) | 9.40 | % | ||
10 Years | 9.19 | |||
5 Years | 15.53 | |||
1 Year | 24.47 | |||
Class R5 Shares | ||||
10 Years | 9.19 | % | ||
5 Years | 15.65 | |||
1 Year | 24.63 | |||
Class R6 Shares | ||||
10 Years | 9.16 | % | ||
5 Years | 15.75 | |||
1 Year | 24.72 | |||
Effective June 1, 2010, Class A, Class B, Class C and Class I shares of the predecessor fund, Van Kampen American Franchise Fund, advised by Van Kampen Asset Management were reorganized into Class A, Class B, Class C and Class Y shares, respectively, of Invesco Van Kampen American Franchise Fund (renamed Invesco American Franchise Fund). Returns shown above, prior to June 1, 2010, for Class A, Class B, Class C and Class Y shares are blended returns of the predecessor fund and Invesco American Franchise Fund. Share class returns will differ from the predecessor fund because of different expenses.
Class R shares incepted on May 23, 2011. Performance shown prior to that date is that of the Fund’s and the predecessor fund’s Class A shares, restated to reflect the higher 12b-1 fees
Average Annual Total Returns As of 6/30/17, the most recent calendar quarter end, including maximum applicable sales charges
|
| |||
Class A Shares | ||||
Inception (6/23/05) | 8.32 | % | ||
10 Years | 7.43 | |||
5 Years | 13.55 | |||
1 Year | 18.39 | |||
Class B Shares | ||||
Inception (6/23/05) | 8.41 | % | ||
10 Years | 7.70 | |||
5 Years | 14.59 | |||
1 Year | 20.25 | |||
Class C Shares | ||||
Inception (6/23/05) | 8.04 | % | ||
10 Years | 7.26 | |||
5 Years | 13.99 | |||
1 Year | 23.35 | |||
Class R Shares | ||||
10 Years | 7.76 | % | ||
5 Years | 14.55 | |||
1 Year | 24.91 | |||
Class Y Shares | ||||
Inception (6/23/05) | 9.08 | % | ||
10 Years | 8.29 | |||
5 Years | 15.13 | |||
1 Year | 25.59 | |||
Class R5 Shares | ||||
10 Years | 8.29 | % | ||
5 Years | 15.24 | |||
1 Year | 25.70 | |||
Class R6 Shares | ||||
10 Years | 8.26 | % | ||
5 Years | 15.31 | |||
1 Year | 25.81 | |||
applicable to Class R shares.
Class R5 shares incepted on December 22, 2010. Performance shown prior to that date is that of the Fund’s and the predecessor fund’s Class A shares and includes the 12b-1 fees applicable to Class A shares.
Class R6 shares incepted on September 24, 2012. Performance shown prior to that date is that of the Fund’s and the predecessor fund’s Class A shares and includes the 12b-1 fees applicable to Class A shares.
The performance data quoted represent past performance and cannot guarantee comparable future results; current performance may be lower or higher. Please visit invesco.com/performance for the most recent month-end performance. Performance figures reflect reinvested distributions, changes in net asset
value and the effect of the maximum sales charge unless otherwise stated. Investment return and principal value will fluctuate so that you may have a gain or loss when you sell shares.
The total annual Fund operating expense ratio set forth in the most recent Fund prospectus as of the date of this report for Class A, Class B, Class C, Class R, Class Y, Class R5 and Class R6 shares was 1.08%, 1.08%, 1.83%, 1.33%, 0.83%, 0.71% and 0.63%, respectively. The expense ratios presented above may vary from the expense ratios presented in other sections of this report that are based on expenses incurred during the period covered by this report.
Class A share performance reflects the maximum 5.50% sales charge, and Class B and Class C share performance reflects the applicable contingent deferred sales charge (CDSC) for the period involved. For shares purchased prior to June 1, 2010, the CDSC on Class B shares declines from 5% at the time of purchase to 0% at the beginning of the sixth year. For shares purchased on or after June 1, 2010, the CDSC on Class B shares declines from 5% at the time of purchase to 0% at the beginning of the seventh year. The CDSC on Class C shares is 1% for the first year after purchase. Class R, Class Y, Class R5 and Class R6 shares do not have a front-end sales charge or a CDSC; therefore, performance is at net asset value.
The performance of the Fund’s share classes will differ primarily due to different sales charge structures and class expenses.
Fund performance reflects any applicable fee waivers and/or expense reimbursements. Had the adviser not waived fees and/or reimbursed expenses currently or in the past, returns would have been lower. See current prospectus for more information.
7 Invesco American Franchise Fund
Invesco American Franchise Fund’s investment objective is to seek long-term capital appreciation.
∎ Unless otherwise stated, information presented in this report is as of August 31, 2017, and is based on total net assets.
∎ Unless otherwise noted, all data provided by Invesco.
∎ To access your Fund’s reports/prospectus, visit invesco.com/fundreports.
About share classes
| ∎ | Class B shares may not be purchased for new or additional investments. Please see the prospectus for more information. |
| ∎ | Class R shares are generally available only to employer sponsored retirement and benefit plans. Please see the prospectus for more information. |
| ∎ | Class Y shares are available only to certain investors. Please see the prospectus for more information. |
| ∎ | Class R5 shares and Class R6 shares are available for use by retirement plans that meet certain standards and for institutional investors. Class R6 shares are also available through intermediaries that have established an agreement with Invesco Distributors, Inc. to make such shares available for use in retail omnibus accounts. Please see the prospectus for more information. |
Principal risks of investing in the Fund
| ∎ | Foreign securities risk. The Fund’s foreign investments may be adversely affected by political and social instability, changes in economic or taxation policies, difficulty in enforcing obligations, decreased liquidity or increased volatility. Foreign investments also involve the risk of the possible seizure, nationalization or expropriation of the issuer or foreign deposits (in which the Fund could lose its entire investments in a certain market) and the possible adoption of foreign governmental restrictions such as exchange controls. Unless the Fund has hedged its foreign securities risk, foreign securities risk also involves the risk of negative foreign currency rate fluctuations, which may cause the value of securities denominated in such foreign currency (or other instruments through which the Fund has exposure to foreign currencies) to decline in value. Currency exchange rates may fluctuate significantly over short periods of time. Currency hedging strategies, if used, are not always successful. |
| ∎ | Growth investing risk. Growth stocks tend to be more expensive relative to the issuing company’s earnings or assets compared with other types of stock. As a result, they tend to be more sensitive to changes in, or investors’ expectations of, the issuing company’s earnings and can be more volatile. |
| ∎ | Management risk. The Fund is actively managed and depends heavily on the Adviser’s judgment about markets, interest rates or the attractiveness, relative values, liquidity, or potential appreciation of particular investments made for the Fund’s portfolio. The Fund could experience losses if these judgments prove to be incorrect. Additionally, legislative, regulatory, or tax developments may adversely affect management of the Fund and, therefore, the ability of the Fund to achieve its investment objective. |
| ∎ | Market risk. The market values of the Fund’s investments, and therefore the value of the Fund’s shares, will go up and down, sometimes rapidly or unpredictably. Market risk may affect a single issuer, industry or section of the economy, or it may affect the market as a whole. Individual stock prices tend to go up and down more dramatically than those of certain other types of investments, such as bonds. During a general downturn in the financial markets, multiple asset classes may decline in value. When markets perform well, there can be no assurance that specific investments held by the Fund will rise in value. |
| ∎ | Mid-capitalization companies risk. Mid-capitalization companies tend to be more vulnerable to changing market conditions and may have more limited product lines and markets, less experienced management and fewer financial resources than larger companies. These companies’ securities may be more volatile and less liquid than those of more established companies, and their returns may vary, sometimes significantly, from the overall securities market. |
| ∎ | Sector focus risk. The Fund may from time to time invest a significant amount of its assets (i.e. over 25%) in one market |
This report must be accompanied or preceded by a currently effective Fund prospectus, which contains more complete information, including sales charges and expenses. Investors should read it carefully before investing.
|
| NOT FDIC INSURED | MAY LOSE VALUE | NO BANK GUARANTEE |
sector or group of related industries. In this event, the Fund’s performance will depend to a greater extent on the overall condition of the sector or group of industries and there is increased risk that the Fund will lose significant value if conditions adversely affect that sector or group of industries. |
About indexes used in this report
| ∎ | The S&P 500® Index is an unmanaged index considered representative of the US stock market. |
| ∎ | The Russell 1000® Growth Index is an unmanaged index considered representative of large-cap growth stocks. The Russell 1000 Growth Index is a trademark/service mark of the Frank Russell Co. Russell® is a trademark of the Frank Russell Co. |
| ∎ | The Lipper Large-Cap Growth Funds Index is an unmanaged index considered representative of large-cap growth funds tracked by Lipper. |
| ∎ | The Fund is not managed to track the performance of any particular index, including the index(es) described here, and consequently, the performance of the Fund may deviate significantly from the performance of the index(es). |
| ∎ | A direct investment cannot be made in an index. Unless otherwise indicated, index results include reinvested dividends, and they do not reflect sales charges. Performance of the peer group, if applicable, reflects fund expenses; performance of a market index does not. |
Other information
| ∎ | The returns shown in management’s discussion of Fund performance are based on net asset values (NAVs) calculated for shareholder transactions. Generally accepted accounting principles require adjustments to be made to the net assets of the Fund at period end for financial reporting purposes, and as such, the NAVs for shareholder transactions and the returns based on those NAVs may differ from the NAVs and returns reported in the Financial Highlights. |
| ∎ | Industry classifications used in this report are generally according to the Global Industry Classification Standard, which was developed by and is the exclusive property and a service mark of MSCI Inc. and Standard & Poor’s. |
8 Invesco American Franchise Fund
Schedule of Investments(a)
August 31, 2017
| Shares | Value | |||||||
Common Stocks & Other Equity Interests–99.81% |
| |||||||
| Aerospace & Defense–2.38% | ||||||||
Boeing Co. (The) | 364,507 | $ | 87,357,747 | |||||
Raytheon Co. | 864,586 | 157,363,298 | ||||||
| 244,721,045 | ||||||||
| Airlines–1.01% | ||||||||
Alaska Air Group, Inc. | 624,733 | 46,642,566 | ||||||
Southwest Airlines Co. | 1,102,913 | 57,505,884 | ||||||
| 104,148,450 | ||||||||
| Application Software–2.29% | ||||||||
salesforce.com, inc.(b) | 2,458,443 | 234,756,722 | ||||||
| Biotechnology–6.24% | ||||||||
Alexion Pharmaceuticals, Inc.(b) | 1,361,497 | 193,890,788 | ||||||
BioMarin Pharmaceutical Inc.(b) | 920,279 | 82,999,963 | ||||||
Celgene Corp.(b) | 1,958,988 | 272,162,203 | ||||||
Incyte Corp.(b) | 663,033 | 91,107,364 | ||||||
| 640,160,318 | ||||||||
| Cable & Satellite–5.08% | ||||||||
Altice USA, Inc. Class–A(b)(c) | 1,634,607 | 49,871,860 | ||||||
Charter Communications, Inc.–Class A(b) | 308,071 | 122,778,616 | ||||||
Comcast Corp.–Class A | 2,801,732 | 113,778,337 | ||||||
DISH Network Corp.–Class A(b) | 4,090,515 | 234,345,604 | ||||||
| 520,774,417 | ||||||||
| Commodity Chemicals–0.86% | ||||||||
LyondellBasell Industries N.V.–Class A | 969,332 | 87,811,786 | ||||||
| Communications Equipment–0.38% | ||||||||
Palo Alto Networks, Inc.(b) | 295,730 | 39,240,414 | ||||||
| Consumer Electronics–3.37% | ||||||||
Sony Corp. (Japan) | 8,744,600 | 345,875,562 | ||||||
| Data Processing & Outsourced Services–6.18% | ||||||||
First Data Corp.–Class A(b) | 7,813,938 | 143,854,599 | ||||||
Mastercard Inc.–Class A | 1,685,375 | 224,660,487 | ||||||
Visa Inc.–Class A | 2,568,211 | 265,861,203 | ||||||
| 634,376,289 | ||||||||
| Environmental & Facilities Services–1.20% | ||||||||
Republic Services, Inc. | 1,889,421 | 123,265,826 | ||||||
| Financial Exchanges & Data–1.63% | ||||||||
London Stock Exchange Group PLC (United Kingdom) | 2,423,116 | 123,776,158 | ||||||
S&P Global Inc. | 280,853 | 43,344,043 | ||||||
| 167,120,201 | ||||||||
| Health Care Equipment–1.71% | ||||||||
Intuitive Surgical, Inc.(b) | 71,829 | 72,164,442 | ||||||
Stryker Corp. | 727,533 | 102,851,340 | ||||||
| 175,015,782 | ||||||||
| Shares | Value | |||||||
| Home Entertainment Software–7.46% | ||||||||
Activision Blizzard, Inc. | 4,019,636 | $ | 263,527,336 | |||||
Electronic Arts Inc.(b) | 2,237,451 | 271,850,296 | ||||||
Nintendo Co., Ltd. (Japan) | 685,400 | 230,358,557 | ||||||
| 765,736,189 | ||||||||
| Home Improvement Retail–3.26% | ||||||||
Lowe’s Cos., Inc. | 4,521,318 | 334,080,187 | ||||||
| Hotels, Resorts & Cruise Lines–3.21% | ||||||||
Norwegian Cruise Line Holdings Ltd.(b) | 1,735,699 | 103,204,662 | ||||||
Royal Caribbean Cruises Ltd. | 1,818,121 | 226,283,340 | ||||||
| 329,488,002 | ||||||||
| Housewares & Specialties–0.60% | ||||||||
Newell Brands, Inc. | 1,274,781 | 61,546,427 | ||||||
| Industrial Gases–0.75% | ||||||||
Air Products and Chemicals, Inc. | 529,214 | 76,931,839 | ||||||
| Industrial Machinery–0.76% | ||||||||
Stanley Black & Decker Inc. | 540,451 | 77,824,944 | ||||||
| Internet & Direct Marketing Retail–8.48% | ||||||||
Amazon.com, Inc.(b) | 707,223 | 693,502,874 | ||||||
Netflix Inc.(b) | 251,161 | 43,880,338 | ||||||
Priceline Group Inc. (The)(b) | 71,600 | 132,608,928 | ||||||
| 869,992,140 | ||||||||
| Internet Software & Services–16.81% | ||||||||
Alibaba Group Holding Ltd.–ADR (China)(b) | 2,435,783 | 418,321,372 | ||||||
Alphabet Inc.–Class A(b) | 725,956 | 693,462,210 | ||||||
Facebook, Inc.–Class A(b) | 3,563,925 | 612,888,182 | ||||||
| 1,724,671,764 | ||||||||
| Investment Banking & Brokerage–0.93% | ||||||||
Charles Schwab Corp. (The) | 1,205,975 | 48,118,403 | ||||||
Goldman Sachs Group, Inc. (The) | 210,430 | 47,081,608 | ||||||
| 95,200,011 | ||||||||
| Life Sciences Tools & Services–0.64% | ||||||||
Thermo Fisher Scientific, Inc. | 351,063 | 65,697,930 | ||||||
| Managed Health Care–3.10% | ||||||||
UnitedHealth Group Inc. | 1,598,835 | 318,008,281 | ||||||
| Oil & Gas Equipment & Services–0.55% | ||||||||
Halliburton Co. | 1,462,107 | 56,978,310 | ||||||
| Oil & Gas Exploration & Production–0.68% | ||||||||
Parsley Energy, Inc.–Class A(b) | 2,595,848 | 65,025,993 | ||||||
Pioneer Natural Resources Co. | 39,899 | 5,172,905 | ||||||
| 70,198,898 | ||||||||
| Packaged Foods & Meats–0.71% | ||||||||
Tyson Foods, Inc.–Class A | 1,145,188 | 72,490,400 | ||||||
See accompanying Notes to Financial Statements which are an integral part of the financial statements.
9 Invesco American Franchise Fund
| Shares | Value | |||||||
| Pharmaceuticals–3.29% | ||||||||
Allergan PLC | 1,110,855 | $ | 254,919,005 | |||||
Zoetis Inc. | 1,321,298 | 82,845,385 | ||||||
| 337,764,390 | ||||||||
| Semiconductors–3.19% | ||||||||
Broadcom Ltd. | 1,134,480 | 285,968,374 | ||||||
NVIDIA Corp. | 245,321 | 41,567,190 | ||||||
| 327,535,564 | ||||||||
| Soft Drinks–0.93% | ||||||||
Monster Beverage Corp.(b) | 1,716,274 | 95,802,415 | ||||||
| Specialized REIT’s–0.48% | ||||||||
American Tower Corp.–Class A | 331,788 | 49,121,213 | ||||||
| Specialty Chemicals–1.41% | ||||||||
Ecolab Inc. | 265,496 | 35,390,617 | ||||||
Sherwin-Williams Co. (The) | 321,603 | 109,110,250 | ||||||
| 144,500,867 | ||||||||
| Systems Software–2.03% | ||||||||
Microsoft Corp. | 2,266,813 | 169,489,608 | ||||||
ServiceNow, Inc.(b) | 330,255 | 38,372,328 | ||||||
| 207,861,936 | ||||||||
| Technology Hardware, Storage & Peripherals–4.80% | ||||||||
Apple Inc. | 3,001,685 | 492,276,340 | ||||||
| Tobacco–1.72% | ||||||||
Philip Morris International Inc. | 1,511,593 | 176,750,569 | ||||||
| Shares | Value | |||||||
| Wireless Telecommunication Services–1.69% | ||||||||
Sprint Corp.(b) | 20,967,994 | $ | 172,985,951 | |||||
Total Common Stocks & Other Equity Interests (Cost $5,944,731,236) |
| 10,240,711,379 | ||||||
Money Market Funds–0.08% |
| |||||||
Government & Agency Portfolio– | 4,647,378 | 4,647,378 | ||||||
Treasury Portfolio–Institutional Class, 0.90%(d) | 3,098,252 | 3,098,252 | ||||||
Total Money Market Funds |
| 7,745,630 | ||||||
TOTAL INVESTMENTS IN SECURITIES (excluding investments purchased with cash collateral from securities on loan)–99.89% (Cost $5,952,476,866) |
| 10,248,457,009 | ||||||
Investments Purchased with Cash |
| |||||||
Money Market Fund–0.00% |
| |||||||
Government & Agency Portfolio– | 3,175 | 3,175 | ||||||
TOTAL INVESTMENTS IN SECURITIES–99.89% |
| 10,248,460,184 | ||||||
OTHER ASSETS LESS LIABILITIES–0.11% |
| 11,779,630 | ||||||
NET ASSETS–100.00% |
| $ | 10,260,239,814 | |||||
Investment Abbreviations:
| ADR | – American Depositary Receipt | |
| REIT | – Real Estate Investment Trust |
Notes to Schedule of Investments:
| (a) | Industry and/or sector classifications used in this report are generally according to the Global Industry Classification Standard, which was developed by and is the exclusive property and a service mark of MSCI Inc. and Standard & Poor’s. |
| (b) | Non-income producing security. |
| (c) | All or a portion of this security was out on loan at August 31, 2017. |
| (d) | The money market fund and the Fund are affiliated by having the same investment adviser. The rate shown is the 7-day SEC standardized yield as of August 31, 2017. |
| (e) | The security has been segregated to satisfy the commitment to return the cash collateral received in securities lending transactions upon the borrower’s return of the securities loaned. See Note 1I. |
See accompanying Notes to Financial Statements which are an integral part of the financial statements.
10 Invesco American Franchise Fund
Statement of Assets and Liabilities
August 31, 2017
Assets: | ||||
Investments in securities, at value (Cost $5,944,731,236)* | $ | 10,240,711,379 | ||
Investments in affiliated money market funds, at value and cost | 7,748,805 | |||
Receivable for: | ||||
Investments sold | 19,231,560 | |||
Fund shares sold | 2,106,609 | |||
Dividends | 4,742,451 | |||
Investment for trustee deferred compensation and retirement plans | 2,615,324 | |||
Other assets | 174,997 | |||
Total assets | 10,277,331,125 | |||
Liabilities: | ||||
Payable for: | ||||
Fund shares reacquired | 6,475,802 | |||
Collateral upon return of securities loaned | 3,175 | |||
Accrued fees to affiliates | 6,560,110 | |||
Accrued trustees’ and officers’ fees and benefits | 20,650 | |||
Accrued other operating expenses | 1,123,222 | |||
Trustee deferred compensation and retirement plans | 2,908,352 | |||
Total liabilities | 17,091,311 | |||
Net assets applicable to shares outstanding | $ | 10,260,239,814 | ||
Net assets consist of: | ||||
Shares of beneficial interest | $ | 5,618,928,228 | ||
Undistributed net investment income (loss) | (2,747,008 | ) | ||
Undistributed net realized gain | 348,078,710 | |||
Net unrealized appreciation | 4,295,979,884 | |||
| $ | 10,260,239,814 | |||
Net Assets: | ||||
Class A | $ | 9,333,083,759 | ||
Class B | $ | 58,860,339 | ||
Class C | $ | 370,960,169 | ||
Class R | $ | 34,479,341 | ||
Class Y | $ | 264,309,082 | ||
Class R5 | $ | 67,740,167 | ||
Class R6 | $ | 130,806,957 | ||
Shares outstanding, no par value, |
| |||
Class A | 460,942,732 | |||
Class B | 2,988,428 | |||
Class C | 19,717,998 | |||
Class R | 1,731,896 | |||
Class Y | 12,815,146 | |||
Class R5 | 3,278,880 | |||
Class R6 | 6,304,728 | |||
Class A: | ||||
Net asset value per share | $ | 20.25 | ||
Maximum offering price per share | ||||
(Net asset value of $20.25 ¸ 94.50%) | $ | 21.43 | ||
Class B: | ||||
Net asset value and offering price per share | $ | 19.70 | ||
Class C: | ||||
Net asset value and offering price per share | $ | 18.81 | ||
Class R: | ||||
Net asset value and offering price per share | $ | 19.91 | ||
Class Y: | ||||
Net asset value and offering price per share | $ | 20.62 | ||
Class R5: | ||||
Net asset value and offering price per share | $ | 20.66 | ||
Class R6: | ||||
Net asset value and offering price per share | $ | 20.75 | ||
| * | At August 31, 2017, securities with an aggregate value of $3,051 were on loan to brokers. |
See accompanying Notes to Financial Statements which are an integral part of the financial statements.
11 Invesco American Franchise Fund
Statement of Operations
For the year ended August 31, 2017
Investment income: |
| |||
Dividends (net of foreign withholding taxes of $354,704) | $ | 85,753,600 | ||
Dividends from affiliated money market funds (includes securities lending income of $20,663) | 341,444 | |||
Total investment income | 86,095,044 | |||
Expenses: | ||||
Advisory fees | 55,698,959 | |||
Administrative services fees | 763,563 | |||
Custodian fees | 270,930 | |||
Distribution fees: | ||||
Class A | 21,486,152 | |||
Class B | 211,990 | |||
Class C | 3,654,027 | |||
Class R | 150,842 | |||
Transfer agent fees — A, B, C, R and Y | 16,798,474 | |||
Transfer agent fees — R5 | 53,696 | |||
Transfer agent fees — R6 | 5,057 | |||
Trustees’ and officers’ fees and benefits | 202,045 | |||
Registration and filing fees | 174,587 | |||
Reports to shareholders | 2,369,965 | |||
Professional services fees | 94,225 | |||
Other | 147,151 | |||
Total expenses | 102,081,663 | |||
Less: Fees waived and expense offset arrangement(s) | (256,591 | ) | ||
Net expenses | 101,825,072 | |||
Net investment income (loss) | (15,730,028 | ) | ||
Realized and unrealized gain (loss) from: | ||||
Net realized gain (loss) from: | ||||
Investment securities (includes net gains from securities sold to affiliates of $5,604,244) | 545,168,365 | |||
Foreign currencies | (103,302 | ) | ||
| 545,065,063 | ||||
Change in net unrealized appreciation (depreciation) of: | ||||
Investment securities | 1,535,147,464 | |||
Foreign currencies | (25,027 | ) | ||
| 1,535,122,437 | ||||
Net realized and unrealized gain | 2,080,187,500 | |||
Net increase in net assets resulting from operations | $ | 2,064,457,472 | ||
See accompanying Notes to Financial Statements which are an integral part of the financial statements.
12 Invesco American Franchise Fund
Statement of Changes in Net Assets
For the years ended August 31, 2017 and 2016
| 2017 | 2016 | |||||||
Operations: | ||||||||
Net investment income (loss) | $ | (15,730,028 | ) | $ | (5,205,861 | ) | ||
Net realized gain | 545,065,063 | 394,895,687 | ||||||
Change in net unrealized appreciation | 1,535,122,437 | 299,342,179 | ||||||
Net increase in net assets resulting from operations | 2,064,457,472 | 689,032,005 | ||||||
Distributions to shareholders from net realized gains: | ||||||||
Class A | (315,582,028 | ) | (404,436,791 | ) | ||||
Class B | (3,787,985 | ) | (7,572,828 | ) | ||||
Class C | (14,719,337 | ) | (19,559,023 | ) | ||||
Class R | (1,131,439 | ) | (1,576,213 | ) | ||||
Class Y | (5,919,585 | ) | (7,356,909 | ) | ||||
Class R5 | (2,009,822 | ) | (2,447,999 | ) | ||||
Class R6 | (4,503,505 | ) | (3,991,542 | ) | ||||
Total distributions from net realized gains | (347,653,701 | ) | (446,941,305 | ) | ||||
Share transactions–net: | ||||||||
Class A | (483,952,097 | ) | (286,789,679 | ) | ||||
Class B | (66,076,907 | ) | (55,638,345 | ) | ||||
Class C | (58,433,043 | ) | (19,536,713 | ) | ||||
Class R | 440,489 | (2,647,321 | ) | |||||
Class Y | 77,763,045 | (9,414,064 | ) | |||||
Class R5 | 2,940,200 | 1,812,719 | ||||||
Class R6 | (12,016,209 | ) | 26,177,006 | |||||
Net increase (decrease) in net assets resulting from share transactions | (539,334,522 | ) | (346,036,397 | ) | ||||
Net increase (decrease) in net assets | 1,177,469,249 | (103,945,697 | ) | |||||
Net assets: | ||||||||
Beginning of year | 9,082,770,565 | 9,186,716,262 | ||||||
End of year (includes undistributed net investment income (loss) of $(2,747,008) and $(6,891,255), respectively) | $ | 10,260,239,814 | $ | 9,082,770,565 | ||||
Notes to Financial Statements
August 31, 2017
NOTE 1—Significant Accounting Policies
Invesco American Franchise Fund (the “Fund”) is a series portfolio of AIM Counselor Series Trust (Invesco Counselor Series Trust) (the “Trust”). The Trust is a Delaware statutory trust registered under the Investment Company Act of 1940, as amended (the “1940 Act”), as an open-end series management investment company consisting of fourteen separate portfolios, each authorized to issue an unlimited number of shares of beneficial interest. The assets, liabilities and operations of each portfolio are accounted for separately. Information presented in these financial statements pertains only to the Fund. Matters affecting each portfolio or class will be voted on exclusively by the shareholders of such portfolio or class.
The Fund’s investment objective is to seek long-term capital appreciation.
The Fund currently consists of seven different classes of shares: Class A, Class B, Class C, Class R, Class Y, Class R5 and Class R6. Class Y shares are available only to certain investors. Class A shares are sold with a front-end sales charge unless certain waiver criteria are met and under certain circumstances load waived shares may be subject to contingent deferred sales charges (“CDSC”). Class C shares are sold with a CDSC. Class R, Class Y, Class R5 and Class R6 shares are sold at net asset value. Effective November 30, 2010, new or additional investments in Class B shares are no longer permitted. Existing shareholders of Class B shares may continue to reinvest dividends and capital gains distributions in Class B shares until they convert to Class A shares. Also, shareholders in Class B shares will be able to exchange those shares for Class B shares of other Invesco Funds offering such shares until they convert to Class A shares. Generally, Class B shares will automatically convert to Class A shares on or about the month-end, which is at least eight years after the date of purchase. Redemption of Class B shares prior to the conversion date will be subject to a CDSC.
The Fund is an investment company and accordingly follows the investment company accounting and reporting guidance in accordance with Financial Accounting Standards Board Accounting Standards Codification Topic 946, Financial Services — Investment Companies.
The following is a summary of the significant accounting policies followed by the Fund in the preparation of its financial statements.
| A. | Security Valuations — Securities, including restricted securities, are valued according to the following policy. |
A security listed or traded on an exchange (except convertible securities) is valued at its last sales price or official closing price as of the close of the customary trading session on the exchange where the security is principally traded, or lacking any sales or official closing price on a
13 Invesco American Franchise Fund
particular day, the security may be valued at the closing bid price on that day. Securities traded in the over-the-counter market are valued based on prices furnished by independent pricing services or market makers. When such securities are valued by an independent pricing service they may be considered fair valued. Futures contracts are valued at the final settlement price set by an exchange on which they are principally traded. Listed options are valued at the mean between the last bid and asked prices from the exchange on which they are principally traded. Options not listed on an exchange are valued by an independent source at the mean between the last bid and asked prices. For purposes of determining net asset value (“NAV”) per share, futures and option contracts generally are valued 15 minutes after the close of the customary trading session of the New York Stock Exchange (“NYSE”).
Investments in open-end and closed-end registered investment companies that do not trade on an exchange are valued at the end-of-day net asset value per share. Investments in open-end and closed-end registered investment companies that trade on an exchange are valued at the last sales price or official closing price as of the close of the customary trading session on the exchange where the security is principally traded.
Debt obligations (including convertible securities) and unlisted equities are fair valued using an evaluated quote provided by an independent pricing service. Evaluated quotes provided by the pricing service may be determined without exclusive reliance on quoted prices, and may reflect appropriate factors such as institution-size trading in similar groups of securities, developments related to specific securities, dividend rate (for unlisted equities), yield (for debt obligations), quality, type of issue, coupon rate (for debt obligations), maturity (for debt obligations), individual trading characteristics and other market data. Pricing services generally value debt obligations assuming orderly transactions of institutional round lot size, but a Fund may hold or transact in the same securities in smaller, odd lot sizes. Odd lots often trade at lower prices than institutional round lots. Debt obligations are subject to interest rate and credit risks. In addition, all debt obligations involve some risk of default with respect to interest and/or principal payments.
Foreign securities’ (including foreign exchange contracts) prices are converted into U.S. dollar amounts using the applicable exchange rates as of the close of the NYSE. If market quotations are available and reliable for foreign exchange-traded equity securities, the securities will be valued at the market quotations. Because trading hours for certain foreign securities end before the close of the NYSE, closing market quotations may become unreliable. If between the time trading ends on a particular security and the close of the customary trading session on the NYSE, events occur that the investment adviser determines are significant and make the closing price unreliable, the Fund may fair value the security. If the event is likely to have affected the closing price of the security, the security will be valued at fair value in good faith using procedures approved by the Board of Trustees. Adjustments to closing prices to reflect fair value may also be based on a screening process of an independent pricing service to indicate the degree of certainty, based on historical data, that the closing price in the principal market where a foreign security trades is not the current value as of the close of the NYSE. Foreign securities’ prices meeting the approved degree of certainty that the price is not reflective of current value will be priced at the indication of fair value from the independent pricing service. Multiple factors may be considered by the independent pricing service in determining adjustments to reflect fair value and may include information relating to sector indices, American Depositary Receipts and domestic and foreign index futures. Foreign securities may have additional risks including exchange rate changes, potential for sharply devalued currencies and high inflation, political and economic upheaval, the relative lack of issuer information, relatively low market liquidity and the potential lack of strict financial and accounting controls and standards.
Securities for which market prices are not provided by any of the above methods may be valued based upon quotes furnished by independent sources. The last bid price may be used to value equity securities. The mean between the last bid and asked prices is used to value debt obligations, including corporate loans.
Securities for which market quotations are not readily available or became unreliable are valued at fair value as determined in good faith by or under the supervision of the Trust’s officers following procedures approved by the Board of Trustees. Issuer specific events, market trends, bid/asked quotes of brokers and information providers and other market data may be reviewed in the course of making a good faith determination of a security’s fair value.
The Fund may invest in securities that are subject to interest rate risk, meaning the risk that the prices will generally fall as interest rates rise and, conversely, the prices will generally rise as interest rates fall. Specific securities differ in their sensitivity to changes in interest rates depending on their individual characteristics. Changes in interest rates may result in increased market volatility, which may affect the value and/or liquidity of certain Fund investments.
Valuations change in response to many factors including the historical and prospective earnings of the issuer, the value of the issuer’s assets, general economic conditions, interest rates, investor perceptions and market liquidity. Because of the inherent uncertainties of valuation, the values reflected in the financial statements may materially differ from the value received upon actual sale of those investments.
| B. | Securities Transactions and Investment Income — Securities transactions are accounted for on a trade date basis. Realized gains or losses on sales are computed on the basis of specific identification of the securities sold. Interest income (net of withholding tax, if any) is recorded on the accrual basis from settlement date. Dividend income (net of withholding tax, if any) is recorded on the ex-dividend date. |
The Fund may periodically participate in litigation related to Fund investments. As such, the Fund may receive proceeds from litigation settlements. Any proceeds received are included in the Statement of Operations as realized gain (loss) for investments no longer held and as unrealized gain (loss) for investments still held.
Brokerage commissions and mark ups are considered transaction costs and are recorded as an increase to the cost basis of securities purchased and/or a reduction of proceeds on a sale of securities. Such transaction costs are included in the determination of net realized and unrealized gain (loss) from investment securities reported in the Statement of Operations and the Statement of Changes in Net Assets and the net realized and unrealized gains (losses) on securities per share in the Financial Highlights. Transaction costs are included in the calculation of the Fund’s net asset value and, accordingly, they reduce the Fund’s total returns. These transaction costs are not considered operating expenses and are not reflected in net investment income reported in the Statement of Operations and the Statement of Changes in Net Assets, or the net investment income per share and the ratios of expenses and net investment income reported in the Financial Highlights, nor are they limited by any expense limitation arrangements between the Fund and the investment adviser.
The Fund allocates income and realized and unrealized capital gains and losses to a class based on the relative net assets of each class.
| C. | Country Determination — For the purposes of making investment selection decisions and presentation in the Schedule of Investments, the investment adviser may determine the country in which an issuer is located and/or credit risk exposure based on various factors. These factors include the laws of the country under which the issuer is organized, where the issuer maintains a principal office, the country in which the issuer derives 50% or more of its total revenues and the country that has the primary market for the issuer’s securities, as well as other criteria. Among the other criteria that may be evaluated for making this determination are the country in which the issuer maintains 50% or more of its assets, |
14 Invesco American Franchise Fund
| the type of security, financial guarantees and enhancements, the nature of the collateral and the sponsor organization. Country of issuer and/or credit risk exposure has been determined to be the United States of America, unless otherwise noted. |
| D. | Distributions — Distributions from net investment income and net realized capital gain, if any, are generally declared and paid annually and recorded on the ex-dividend date. The Fund may elect to treat a portion of the proceeds from redemptions as distributions for federal income tax purposes. |
| E. | Federal Income Taxes — The Fund intends to comply with the requirements of Subchapter M of the Internal Revenue Code of 1986, as amended (the “Internal Revenue Code”), necessary to qualify as a regulated investment company and to distribute substantially all of the Fund’s taxable earnings to shareholders. As such, the Fund will not be subject to federal income taxes on otherwise taxable income (including net realized capital gain) that is distributed to shareholders. Therefore, no provision for federal income taxes is recorded in the financial statements. |
The Fund recognizes the tax benefits of uncertain tax positions only when the position is more likely than not to be sustained. Management has analyzed the Fund’s uncertain tax positions and concluded that no liability for unrecognized tax benefits should be recorded related to uncertain tax positions. Management is not aware of any tax positions for which it is reasonably possible that the total amounts of unrecognized tax benefits will change materially in the next 12 months.
The Fund files tax returns in the U.S. Federal jurisdiction and certain other jurisdictions. Generally, the Fund is subject to examinations by such taxing authorities for up to three years after the filing of the return for the tax period.
| F. | Expenses — Fees provided for under the Rule 12b-1 plan of a particular class of the Fund are charged to the operations of such class. Transfer agency fees and expenses and other shareholder recordkeeping fees and expenses attributable to Class R5 and Class R6 are allocated to each share class based on relative net assets. Sub-accounting fees attributable to Class R5 are charged to the operations of the class. Transfer agency fees and expenses and other shareholder recordkeeping fees and expenses relating to all other classes are allocated among those classes based on relative net assets. All other expenses are allocated among the classes based on relative net assets. |
| G. | Accounting Estimates — The preparation of financial statements in conformity with accounting principles generally accepted in the United States of America (“GAAP”) requires management to make estimates and assumptions that affect the reported amounts of assets and liabilities at the date of the financial statements and the reported amounts of revenues and expenses during the reporting period including estimates and assumptions related to taxation. Actual results could differ from those estimates by a significant amount. In addition, the Fund monitors for material events or transactions that may occur or become known after the period-end date and before the date the financial statements are released to print. |
| H. | Indemnifications — Under the Trust’s organizational documents, each Trustee, officer, employee or other agent of the Trust is indemnified against certain liabilities that may arise out of the performance of their duties to the Fund. Additionally, in the normal course of business, the Fund enters into contracts, including the Fund’s servicing agreements, that contain a variety of indemnification clauses. The Fund’s maximum exposure under these arrangements is unknown as this would involve future claims that may be made against the Fund that have not yet occurred. The risk of material loss as a result of such indemnification claims is considered remote. |
| I. | Securities Lending — The Fund may lend portfolio securities having a market value up to one-third of the Fund’s total assets. Such loans are secured by collateral equal to no less than the market value of the loaned securities determined daily by the securities lending provider. Such collateral will be cash or debt securities issued or guaranteed by the U.S. Government or any of its sponsored agencies. Cash collateral received in connection with these loans is invested in short-term money market instruments or affiliated money market funds and is shown as such on the Schedule of Investments. The Fund bears the risk of loss with respect to the investment of collateral. It is the Fund’s policy to obtain additional collateral from or return excess collateral to the borrower by the end of the next business day, following the valuation date of the securities loaned. Therefore, the value of the collateral held may be temporarily less than the value of the securities on loan. When loaning securities, the Fund retains certain benefits of owning the securities, including the economic equivalent of dividends or interest generated by the security. Lending securities entails a risk of loss to the Fund if, and to the extent that, the market value of the securities loaned were to increase and the borrower did not increase the collateral accordingly, and the borrower failed to return the securities. The securities loaned are subject to termination at the option of the borrower or the Fund. Upon termination, the borrower will return to the Fund the securities loaned and the Fund will return the collateral. Upon the failure of the borrower to return the securities, collateral may be liquidated and the securities may be purchased on the open market to replace the loaned securities. The Fund could experience delays and costs in gaining access to the collateral and the securities may lose value during the delay which could result in potential losses to the Fund. Some of these losses may be indemnified by the lending agent. The Fund bears the risk of any deficiency in the amount of the collateral available for return to the borrower due to any loss on the collateral invested. Dividends received on cash collateral investments for securities lending transactions, which are net of compensation to counterparties, are included in Dividends from affiliated money market funds on the Statement of Operations. The aggregate value of securities out on loan, if any, is shown as a footnote on the Statement of Assets and Liabilities. |
| J. | Foreign Currency Translations — Foreign currency is valued at the close of the NYSE based on quotations posted by banks and major currency dealers. Portfolio securities and other assets and liabilities denominated in foreign currencies are translated into U.S. dollar amounts at date of valuation. Purchases and sales of portfolio securities (net of foreign taxes withheld on disposition) and income items denominated in foreign currencies are translated into U.S. dollar amounts on the respective dates of such transactions. The Fund does not separately account for the portion of the results of operations resulting from changes in foreign exchange rates on investments and the fluctuations arising from changes in market prices of securities held. The combined results of changes in foreign exchange rates and the fluctuation of market prices on investments (net of estimated foreign tax withholding) are included with the net realized and unrealized gain or loss from investments in the Statement of Operations. Reported net realized foreign currency gains or losses arise from (1) sales of foreign currencies, (2) currency gains or losses realized between the trade and settlement dates on securities transactions, and (3) the difference between the amounts of dividends, interest, and foreign withholding taxes recorded on the Fund’s books and the U.S. dollar equivalent of the amounts actually received or paid. Net unrealized foreign currency gains and losses arise from changes in the fair values of assets and liabilities, other than investments in securities at fiscal period end, resulting from changes in exchange rates. |
The Fund may invest in foreign securities, which may be subject to foreign taxes on income, gains on investments or currency repatriation, a portion of which may be recoverable. Foreign taxes, if any, are recorded based on the tax regulations and rates that exist in the foreign markets in which the Fund invests and are shown in the Statement of Operations.
15 Invesco American Franchise Fund
| K. | Forward Foreign Currency Contracts — The Fund may engage in foreign currency transactions either on a spot (i.e. for prompt delivery and settlement) basis, or through forward foreign currency contracts, to manage or minimize currency or exchange rate risk. |
The Fund may also enter into forward foreign currency contracts for the purchase or sale of a security denominated in a foreign currency in order to “lock in” the U.S. dollar price of that security, or the Fund may also enter into forward foreign currency contracts that do not provide for physical settlement of the two currencies, but instead are settled by a single cash payment calculated as the difference between the agreed upon exchange rate and the spot rate at settlement based upon an agreed upon notional amount (non-deliverable forwards). The Fund will set aside liquid assets in an amount equal to the daily mark-to-market obligation for forward foreign currency contracts.
A forward foreign currency contract is an obligation between two parties (“Counterparties”) to purchase or sell a specific currency for an agreed-upon price at a future date. The use of forward foreign currency contracts does not eliminate fluctuations in the price of the underlying securities the Fund owns or intends to acquire but establishes a rate of exchange in advance. Fluctuations in the value of these contracts are measured by the difference in the contract date and reporting date exchange rates and are recorded as unrealized appreciation (depreciation) until the contracts are closed. When the contracts are closed, realized gains (losses) are recorded. Realized and unrealized gains (losses) on the contracts are included in the Statement of Operations. The primary risks associated with forward foreign currency contracts include failure of the Counterparty to meet the terms of the contract and the value of the foreign currency changing unfavorably. These risks may be in excess of the amounts reflected in the Statement of Assets and Liabilities.
NOTE 2—Advisory Fees and Other Fees Paid to Affiliates
The Trust has entered into a master investment advisory agreement with Invesco Advisers, Inc. (the “Adviser” or “Invesco”). Under the terms of the investment advisory agreement, the Fund accrues daily and pays monthly an advisory fee to the Adviser based on the annual rate of the Fund’s average daily net assets as follows:
| Average Daily Net Assets | Rate | |||||||
First $250 million | 0 | .695% | ||||||
Next $250 million | 0 | .67% | ||||||
Next $500 million | 0 | .645% | ||||||
Next $550 million | 0 | .62% | ||||||
Next $3.45 billion | 0 | .60% | ||||||
Next $250 million | 0 | .595% | ||||||
Next $2.25 billion | 0 | .57% | ||||||
Next $2.5 billion | 0 | .545% | ||||||
Over $10 billion | 0 | .52% | ||||||
For the year ended August 31, 2017, the effective advisory fees incurred by the Fund was 0.59%.
Under the terms of a master sub-advisory agreement between the Adviser and each of Invesco Asset Management Deutschland GmbH, Invesco Asset Management Limited, Invesco Asset Management (Japan) Limited, Invesco Hong Kong Limited, Invesco Senior Secured Management, Inc. and Invesco Canada Ltd. (collectively, the “Affiliated Sub-Advisers”) the Adviser, not the Fund, will pay 40% of the fees paid to the Adviser to any such Affiliated Sub-Adviser(s) that provide(s) discretionary investment management services to the Fund based on the percentage of assets allocated to such Affiliated Sub-Adviser(s).
The Adviser has contractually agreed, through at least June 30, 2018, to waive advisory fees and/or reimburse expenses of all shares to the extent necessary to limit total annual fund operating expenses after fee waiver and/or expense reimbursement (excluding certain items discussed below) of Class A, Class B, Class C, Class R, Class Y, Class R5 and Class R6 shares to 2.00%, 2.75%, 2.75%, 2.25%, 1.75%, 1.75% and 1.75%, respectively, of average daily net assets (the “expense limits”). In determining the Adviser’s obligation to waive advisory fees and/or reimburse expenses, the following expenses are not taken into account, and could cause the total annual fund operating expenses after fee waiver and/or expense reimbursement to exceed the numbers reflected above: (1) interest; (2) taxes; (3) dividend expense on short sales; (4) extraordinary or non-routine items, including litigation expenses; and (5) expenses that the Fund has incurred but did not actually pay because of an expense offset arrangement. Unless Invesco continues the fee waiver agreement, it will terminate on June 30, 2018. During its term, the fee waiver agreement cannot be terminated or amended to increase the expense limits or reduce the advisory fee waivers without approval of the Board of Trustees. The Adviser did not waive fees and/or reimburse expenses during the period under this expense limit.
Further, the Adviser has contractually agreed, through at least June 30, 2019, to waive the advisory fee payable by the Fund in an amount equal to 100% of the net advisory fees the Adviser receives from the affiliated money market funds on investments by the Fund of uninvested cash (excluding investments of cash collateral from securities lending) in such affiliated money market funds.
For the year ended August 31, 2017, the Adviser waived advisory fees of $79,351.
The Trust has entered into a master administrative services agreement with Invesco pursuant to which the Fund has agreed to pay Invesco for certain administrative costs incurred in providing accounting services to the Fund. For the year ended August 31, 2017, expenses incurred under the agreement are shown in the Statement of Operations as Administrative services fees.
The Trust has entered into a transfer agency and service agreement with Invesco Investment Services, Inc. (“IIS”) pursuant to which the Fund has agreed to pay IIS a fee for providing transfer agency and shareholder services to the Fund and reimburse IIS for certain expenses incurred by IIS in the course of providing such services. IIS may make payments to intermediaries that provide omnibus account services, sub-accounting services and/or networking services. All fees payable by IIS to intermediaries that provide omnibus account services or sub-accounting services are charged back to the Fund, subject to certain limitations approved by the Trust’s Board of Trustees. For the year ended August 31, 2017, expenses incurred under the agreement are shown in the Statement of Operations as Transfer agent fees.
Shares of the Fund are distributed by Invesco Distributors, Inc. (“IDI”). The Fund has adopted a distribution plan pursuant to Rule 12b-1 under the 1940 Act, and a service plan (collectively, the “Plans”) for Class A, Class B, Class C and Class R shares to compensate IDI for the sale, distribution,
16 Invesco American Franchise Fund
shareholder servicing and maintenance of shareholder accounts for these shares. Under the Plans, the Fund will incur annual fees of up to 0.25% of Class A average daily net assets, up to 1.00% each of Class B and Class C average daily net assets and up to 0.50% of Class R average daily net assets. The fees are accrued daily and paid monthly.
With respect to Class B and Class C shares, the Fund is authorized to reimburse in future years any distribution related expenses that exceed the maximum annual reimbursement rate for such class, so long as such reimbursement does not cause the Fund to exceed the Class B and Class C maximum annual reimbursement rate, respectively. With respect to Class A shares, distribution related expenses that exceed the maximum annual reimbursement rate for such class are not carried forward to future years and the Fund will not reimburse IDI for any such expenses.
For the year ended August 31, 2017, expenses incurred under these arrangements are shown in the Statement of Operations as Distribution fees.
Front-end sales commissions and CDSC (collectively, the “sales charges”) are not recorded as expenses of the Fund. Front-end sales commissions are deducted from proceeds from the sales of Fund shares prior to investment in Class A shares of the Fund. CDSC are deducted from redemption proceeds prior to remittance to the shareholder. During the year ended August 31, 2017, IDI advised the Fund that IDI retained $501,838 in front-end sales commissions from the sale of Class A shares and $6,010, $1,170 and $10,873 from Class A, Class B and Class C shares, respectively, for CDSC imposed on redemptions by shareholders.
For the year ended August 31, 2017, the Fund incurred $31,109 in brokerage commissions with Invesco Capital Markets, Inc., an affiliate of the Adviser and IDI, for portfolio transactions executed on behalf of the Fund.
Certain officers and trustees of the Trust are officers and directors of the Adviser, IIS and/or IDI.
NOTE 3—Additional Valuation Information
GAAP defines fair value as the price that would be received to sell an asset or paid to transfer a liability in an orderly transaction between market participants at the measurement date, under current market conditions. GAAP establishes a hierarchy that prioritizes the inputs to valuation methods, giving the highest priority to readily available unadjusted quoted prices in an active market for identical assets (Level 1) and the lowest priority to significant unobservable inputs (Level 3), generally when market prices are not readily available or are unreliable. Based on the valuation inputs, the securities or other investments are tiered into one of three levels. Changes in valuation methods may result in transfers in or out of an investment’s assigned level:
| Level 1 — | Prices are determined using quoted prices in an active market for identical assets. |
| Level 2 — | Prices are determined using other significant observable inputs. Observable inputs are inputs that other market participants may use in pricing a security. These may include quoted prices for similar securities, interest rates, prepayment speeds, credit risk, yield curves, loss severities, default rates, discount rates, volatilities and others. |
| Level 3 — | Prices are determined using significant unobservable inputs. In situations where quoted prices or observable inputs are unavailable (for example, when there is little or no market activity for an investment at the end of the period), unobservable inputs may be used. Unobservable inputs reflect the Fund’s own assumptions about the factors market participants would use in determining fair value of the securities or instruments and would be based on the best available information. |
The following is a summary of the tiered valuation input levels, as of August 31, 2017. The level assigned to the securities valuations may not be an indication of the risk or liquidity associated with investing in those securities. Because of the inherent uncertainties of valuation, the values reflected in the financial statements may materially differ from the value received upon actual sale of those investments.
The Fund’s policy is to recognize transfers in and out of the valuation levels as of the end of the reporting period.
During the year ended August 31, 2017, there were transfers from Level 1 to Level 2 of $345,875,562, due to foreign fair value adjustments.
| Level 1 | Level 2 | Level 3 | Total | |||||||||||||
Common Stocks & Other Equity Interests | $ | 9,664,477,260 | $ | 576,234,119 | $ | — | $ | 10,240,711,379 | ||||||||
Money Market Funds | 7,748,805 | — | — | 7,748,805 | ||||||||||||
Total Investments | $ | 9,672,226,065 | $ | 576,234,119 | $ | — | $ | 10,248,460,184 | ||||||||
NOTE 4—Security Transactions with Affiliated Funds
The Fund is permitted to purchase or sell securities from or to certain other Invesco Funds under specified conditions outlined in procedures adopted by the Board of Trustees of the Trust. The procedures have been designed to ensure that any purchase or sale of securities by the Fund from or to another fund or portfolio that is or could be considered an affiliate by virtue of having a common investment adviser (or affiliated investment advisers), common Trustees and/or common officers complies with Rule 17a-7 of the 1940 Act. Further, as defined under the procedures, each transaction is effected at the current market price. Pursuant to these procedures, for the year ended August 31, 2017, the Fund engaged in securities purchases of $23,000,951 and securities sales of $58,855,691, which resulted in net realized gains of $5,604,244.
NOTE 5—Expense Offset Arrangement(s)
The expense offset arrangement is comprised of transfer agency credits which result from balances in demand deposit accounts used by the transfer agent for clearing shareholder transactions. For the year ended August 31, 2017, the Fund received credits from this arrangement, which resulted in the reduction of the Fund’s total expenses of $177,240.
17 Invesco American Franchise Fund
NOTE 6—Trustees’ and Officers’ Fees and Benefits
Trustees’ and Officers’ Fees and Benefits include amounts accrued by the Fund to pay remuneration to certain Trustees and Officers of the Fund. Trustees have the option to defer compensation payable by the Fund, and Trustees’ and Officers’ Fees and Benefits also include amounts accrued by the Fund to fund such deferred compensation amounts. Those Trustees who defer compensation have the option to select various Invesco Funds in which their deferral accounts shall be deemed to be invested. Finally, certain current Trustees were eligible to participate in a retirement plan that provided for benefits to be paid upon retirement to Trustees over a period of time based on the number of years of service. The Fund may have certain former Trustees who also participate in a retirement plan and receive benefits under such plan. Trustees’ and Officers’ Fees and Benefits include amounts accrued by the Fund to fund such retirement benefits. Obligations under the deferred compensation and retirement plans represent unsecured claims against the general assets of the Fund.
NOTE 7—Cash Balances
The Fund is permitted to temporarily carry a negative or overdrawn balance in its account with State Street Bank and Trust Company, the custodian bank. Such balances, if any at period-end, are shown in the Statement of Assets and Liabilities under the payable caption Amount due custodian. To compensate the custodian bank for such overdrafts, the overdrawn Fund may either (1) leave funds as a compensating balance in the account so the custodian bank can be compensated by earning the additional interest; or (2) compensate by paying the custodian bank at a rate agreed upon by the custodian bank and Invesco, not to exceed the contractually agreed upon rate.
NOTE 8—Distributions to Shareholders and Tax Components of Net Assets
Tax Character of Distributions to Shareholders Paid During the Fiscal Years Ended August 31, 2017 and 2016:
| 2017 | 2016 | |||||||
Long-term capital gain | $ | 347,653,701 | $ | 446,941,305 | ||||
Tax Components of Net Assets at Period-End:
| 2017 | ||||
Undistributed ordinary income | $ | 20,277,283 | ||
Undistributed long-term gain | 377,795,653 | |||
Net unrealized appreciation — investments | 4,245,985,917 | |||
Net unrealized appreciation (depreciation) — foreign currencies | (259 | ) | ||
Temporary book/tax differences | (2,747,008 | ) | ||
Shares of beneficial interest | 5,618,928,228 | |||
Total net assets | $ | 10,260,239,814 | ||
The difference between book-basis and tax-basis unrealized appreciation (depreciation) is due to differences in the timing of recognition of gains and losses on investments for tax and book purposes. The Fund’s net unrealized appreciation (depreciation) difference is attributable primarily to wash sales.
The temporary book/tax differences are a result of timing differences between book and tax recognition of income and/or expenses. The Fund’s temporary book/tax differences are the result of the trustee deferral of compensation and retirement plan benefits.
Capital loss carryforward is calculated and reported as of a specific date. Results of transactions and other activity after that date may affect the amount of capital loss carryforward actually available for the Fund to utilize. Capital losses generated in years beginning after December 22, 2010 can be carried forward for an unlimited period, whereas previous losses expire in eight tax years. Capital losses with an expiration period may not be used to offset capital gains until all net capital losses without an expiration date have been utilized. Capital loss carryforwards with no expiration date will retain their character as either short-term or long-term capital losses instead of as short-term capital losses as under prior law. The ability to utilize capital loss carryforwards in the future may be limited under the Internal Revenue Code and related regulations based on the results of future transactions.
The Fund does not have a capital loss carryforward as of August 31, 2017.
NOTE 9—Investment Transactions
The aggregate amount of investment securities (other than short-term securities, U.S. Treasury obligations and money market funds, if any) purchased and sold by the Fund during the year ended August 31, 2017 was $4,486,314,448 and $5,281,848,758, respectively. Cost of investments, including any derivatives, on a tax basis includes the adjustments for financial reporting purposes as of the most recently completed federal income tax reporting period-end.
| Unrealized Appreciation (Depreciation) of Investments on a Tax Basis | ||||
Aggregate unrealized appreciation of investments | $ | 4,281,472,303 | ||
Aggregate unrealized (depreciation) of investments | (35,486,386 | ) | ||
Net unrealized appreciation of investments | $ | 4,245,985,917 | ||
Cost of investments for tax purposes is $6,002,474,267.
18 Invesco American Franchise Fund
NOTE 10—Reclassification of Permanent Differences
Primarily as a result of differing book/tax treatment of net operating losses, on August 31, 2017, undistributed net investment income (loss) was increased by $19,874,275 and undistributed net realized gain was decreased by $19,874,275. This reclassification had no effect on the net assets of the Fund.
NOTE 11—Share Information
| Summary of Share Activity | ||||||||||||||||
| Years ended August 31, | ||||||||||||||||
| 2017(a) | 2016 | |||||||||||||||
| Shares | Amount | Shares | Amount | |||||||||||||
Sold: | ||||||||||||||||
Class A | 12,475,916 | $ | 227,584,879 | 11,018,677 | $ | 178,385,249 | ||||||||||
Class B | 97,701 | 1,676,775 | 76,428 | 1,198,972 | ||||||||||||
Class C | 1,821,997 | 30,987,010 | 1,373,794 | 21,088,137 | ||||||||||||
Class R | 343,868 | 6,246,367 | 385,728 | 6,135,501 | ||||||||||||
Class Y | 8,406,129 | 155,276,463 | 2,425,004 | 39,927,655 | ||||||||||||
Class R5 | 815,945 | 15,226,131 | 866,249 | 14,040,010 | ||||||||||||
Class R6 | 970,854 | 19,198,323 | 2,687,395 | 41,141,890 | ||||||||||||
Issued as reinvestment of dividends: | ||||||||||||||||
Class A | 18,007,120 | 299,278,337 | 23,357,342 | 381,892,508 | ||||||||||||
Class B | 230,785 | 3,731,794 | 468,373 | 7,456,502 | ||||||||||||
Class C | 891,166 | 13,830,890 | 1,189,374 | 18,352,040 | ||||||||||||
Class R | 69,117 | 1,131,439 | 97,598 | 1,576,212 | ||||||||||||
Class Y | 289,922 | 4,899,683 | 382,605 | 6,339,768 | ||||||||||||
Class R5 | 118,755 | 2,009,336 | 147,701 | 2,447,403 | ||||||||||||
Class R6 | 265,224 | 4,503,505 | 240,310 | 3,991,543 | ||||||||||||
Automatic conversion of Class B shares to Class A shares: | ||||||||||||||||
Class A | 3,220,644 | 58,132,539 | 2,986,781 | 48,313,269 | ||||||||||||
Class B | (3,309,936 | ) | (58,132,539 | ) | (3,066,056 | ) | (48,313,269 | ) | ||||||||
Reacquired: | ||||||||||||||||
Class A | (59,557,846 | ) | (1,068,947,852 | ) | (55,216,726 | ) | (895,380,705 | ) | ||||||||
Class B | (772,453 | ) | (13,352,937 | ) | (1,015,764 | ) | (15,980,550 | ) | ||||||||
Class C | (6,068,697 | ) | (103,250,943 | ) | (3,870,093 | ) | (58,976,890 | ) | ||||||||
Class R | (396,535 | ) | (6,937,317 | ) | (650,883 | ) | (10,359,034 | ) | ||||||||
Class Y | (4,433,503 | ) | (82,413,101 | ) | (3,373,005 | ) | (55,681,487 | ) | ||||||||
Class R5 | (777,694 | ) | (14,295,267 | ) | (892,248 | ) | (14,674,694 | ) | ||||||||
Class R6 | (1,917,346 | ) | (35,718,037 | ) | (1,111,779 | ) | (18,956,427 | ) | ||||||||
Net increase (decrease) in share activity | (29,208,867 | ) | $ | (539,334,522 | ) | (21,493,195 | ) | $ | (346,036,397 | ) | ||||||
| (a) | There are entities that are record owners of more than 5% of the outstanding shares of the Fund and in the aggregate own 26% of the outstanding shares of the Fund. IDI has an agreement with these entities to sell Fund shares. The Fund, Invesco and/or Invesco affiliates may make payments to these entities, which are considered to be related to the Fund, for providing services to the Fund, Invesco and/or Invesco affiliates including but not limited to services such as securities brokerage, distribution, third party record keeping and account servicing. The Fund has no knowledge as to whether all or any portion of the shares owned of record by these entities are also owned beneficially. |
19 Invesco American Franchise Fund
NOTE 12—Financial Highlights
The following schedule presents financial highlights for a share of the Fund outstanding throughout the periods indicated.
| Net asset value, beginning of period | Net investment income (loss)(a) | Net gains on securities (both realized and unrealized) | Total from investment operations | Dividends from net investment income | Distributions from net realized gains | Total distributions | Net asset value, end of period | Total return(b) | Net assets, end of period (000’s omitted) | Ratio of expenses to average net assets with fee waivers and/or expenses absorbed | Ratio of expenses to average net assets without fee waivers and/or expenses absorbed | Ratio of net investment income (loss) to average net assets | Portfolio turnover(c) | |||||||||||||||||||||||||||||||||||||||||||
Class A | ||||||||||||||||||||||||||||||||||||||||||||||||||||||||
Year ended 08/31/17 | $ | 16.96 | $ | (0.03 | ) | $ | 3.99 | $ | 3.96 | $ | — | $ | (0.67 | ) | $ | (0.67 | ) | $ | 20.25 | 24.19 | % | $ | 9,333,084 | 1.06 | %(d) | 1.06 | %(d) | (0.15 | )%(d) | 48 | % | |||||||||||||||||||||||||
Year ended 08/31/16 | 16.49 | (0.01 | ) | 1.30 | 1.29 | — | (0.82 | ) | (0.82 | ) | 16.96 | 7.99 | 8,253,739 | 1.08 | 1.08 | (0.04 | ) | 59 | ||||||||||||||||||||||||||||||||||||||
Year ended 08/31/15 | 18.07 | (0.05 | ) | 0.08 | 0.03 | — | (1.61 | ) | (1.61 | ) | 16.49 | 0.27 | 8,320,796 | 1.05 | 1.05 | (0.28 | ) | 74 | ||||||||||||||||||||||||||||||||||||||
Year ended 08/31/14 | 14.82 | (0.04 | ) | 3.99 | 3.95 | (0.02 | ) | (0.68 | ) | (0.70 | ) | 18.07 | 27.22 | 9,034,217 | 1.08 | 1.08 | (0.27 | ) | 77 | |||||||||||||||||||||||||||||||||||||
Year ended 08/31/13 | 12.47 | 0.02 | 2.33 | 2.35 | (0.00 | ) | — | (0.00 | ) | 14.82 | 18.89 | 5,428,321 | 1.06 | 1.14 | 0.17 | 80 | ||||||||||||||||||||||||||||||||||||||||
Class B | ||||||||||||||||||||||||||||||||||||||||||||||||||||||||
Year ended 08/31/17 | 16.51 | (0.03 | ) | 3.89 | 3.86 | — | (0.67 | ) | (0.67 | ) | 19.70 | 24.24 | (e) | 58,860 | 1.06 | (d)(e) | 1.06 | (d)(e) | (0.15 | )(d)(e) | 48 | |||||||||||||||||||||||||||||||||||
Year ended 08/31/16 | 16.08 | (0.01 | ) | 1.26 | 1.25 | — | (0.82 | ) | (0.82 | ) | 16.51 | 7.94 | (e) | 111,323 | 1.08 | (e) | 1.08 | (e) | (0.04 | )(e) | 59 | |||||||||||||||||||||||||||||||||||
Year ended 08/31/15 | 17.66 | (0.05 | ) | 0.08 | 0.03 | — | (1.61 | ) | (1.61 | ) | 16.08 | 0.27 | (e) | 165,265 | 1.05 | (e) | 1.05 | (e) | (0.28 | )(e) | 74 | |||||||||||||||||||||||||||||||||||
Year ended 08/31/14 | 14.50 | (0.04 | ) | 3.90 | 3.86 | (0.02 | ) | (0.68 | ) | (0.70 | ) | 17.66 | 27.20 | (e) | 247,220 | 1.08 | (e) | 1.08 | (e) | (0.27 | )(e) | 77 | ||||||||||||||||||||||||||||||||||
Year ended 08/31/13 | 12.20 | 0.02 | 2.28 | 2.30 | (0.00 | ) | — | (0.00 | ) | 14.50 | 18.90 | (e) | 226,796 | 1.06 | (e) | 1.14 | (e) | 0.17 | (e) | 80 | ||||||||||||||||||||||||||||||||||||
Class C | ||||||||||||||||||||||||||||||||||||||||||||||||||||||||
Year ended 08/31/17 | 15.92 | (0.15 | ) | 3.71 | 3.56 | — | (0.67 | ) | (0.67 | ) | 18.81 | 23.23 | 370,960 | 1.81 | (d) | 1.81 | (d) | (0.90 | )(d) | 48 | ||||||||||||||||||||||||||||||||||||
Year ended 08/31/16 | 15.64 | (0.12 | ) | 1.22 | 1.10 | — | (0.82 | ) | (0.82 | ) | 15.92 | 7.18 | 367,233 | 1.83 | 1.83 | (0.79 | ) | 59 | ||||||||||||||||||||||||||||||||||||||
Year ended 08/31/15 | 17.34 | (0.17 | ) | 0.08 | (0.09 | ) | — | (1.61 | ) | (1.61 | ) | 15.64 | (0.46 | ) | 381,264 | 1.80 | 1.80 | (1.03 | ) | 74 | ||||||||||||||||||||||||||||||||||||
Year ended 08/31/14 | 14.34 | (0.16 | ) | 3.84 | 3.68 | — | (0.68 | ) | (0.68 | ) | 17.34 | 26.23 | 417,687 | 1.83 | 1.83 | (1.02 | ) | 77 | ||||||||||||||||||||||||||||||||||||||
Year ended 08/31/13 | 12.16 | (0.08 | ) | 2.26 | 2.18 | — | — | — | 14.34 | 17.93 | 271,960 | 1.81 | 1.89 | (0.58 | ) | 80 | ||||||||||||||||||||||||||||||||||||||||
Class R | ||||||||||||||||||||||||||||||||||||||||||||||||||||||||
Year ended 08/31/17 | 16.72 | (0.07 | ) | 3.93 | 3.86 | — | (0.67 | ) | (0.67 | ) | 19.91 | 23.93 | 34,479 | 1.31 | (d) | 1.31 | (d) | (0.40 | )(d) | 48 | ||||||||||||||||||||||||||||||||||||
Year ended 08/31/16 | 16.31 | (0.05 | ) | 1.28 | 1.23 | — | (0.82 | ) | (0.82 | ) | 16.72 | 7.70 | 28,686 | 1.33 | 1.33 | (0.29 | ) | 59 | ||||||||||||||||||||||||||||||||||||||
Year ended 08/31/15 | 17.93 | (0.09 | ) | 0.08 | (0.01 | ) | — | (1.61 | ) | (1.61 | ) | 16.31 | 0.03 | 30,716 | 1.30 | 1.30 | (0.53 | ) | 74 | |||||||||||||||||||||||||||||||||||||
Year ended 08/31/14 | 14.74 | (0.09 | ) | 3.96 | 3.87 | — | (0.68 | ) | (0.68 | ) | 17.93 | 26.83 | 31,760 | 1.33 | 1.33 | (0.52 | ) | 77 | ||||||||||||||||||||||||||||||||||||||
Year ended 08/31/13 | 12.43 | (0.01 | ) | 2.32 | 2.31 | — | — | — | 14.74 | 18.58 | 19,576 | 1.31 | 1.39 | (0.08 | ) | 80 | ||||||||||||||||||||||||||||||||||||||||
Class Y | ||||||||||||||||||||||||||||||||||||||||||||||||||||||||
Year ended 08/31/17 | 17.22 | 0.02 | 4.05 | 4.07 | — | (0.67 | ) | (0.67 | ) | 20.62 | 24.47 | 264,309 | 0.81 | (d) | 0.81 | (d) | 0.10 | (d) | 48 | |||||||||||||||||||||||||||||||||||||
Year ended 08/31/16 | 16.69 | 0.04 | 1.31 | 1.35 | — | (0.82 | ) | (0.82 | ) | 17.22 | 8.26 | 147,246 | 0.83 | 0.83 | 0.21 | 59 | ||||||||||||||||||||||||||||||||||||||||
Year ended 08/31/15 | 18.22 | (0.01 | ) | 0.09 | 0.08 | — | (1.61 | ) | (1.61 | ) | 16.69 | 0.56 | 152,179 | 0.80 | 0.80 | (0.03 | ) | 74 | ||||||||||||||||||||||||||||||||||||||
Year ended 08/31/14 | 14.93 | (0.00 | ) | 4.01 | 4.01 | (0.04 | ) | (0.68 | ) | (0.72 | ) | 18.22 | 27.48 | 141,094 | 0.83 | 0.83 | (0.02 | ) | 77 | |||||||||||||||||||||||||||||||||||||
Year ended 08/31/13 | 12.57 | 0.06 | 2.34 | 2.40 | (0.04 | ) | — | (0.04 | ) | 14.93 | 19.13 | 92,418 | 0.81 | 0.89 | 0.42 | 80 | ||||||||||||||||||||||||||||||||||||||||
Class R5 | ||||||||||||||||||||||||||||||||||||||||||||||||||||||||
Year ended 08/31/17 | 17.23 | 0.03 | 4.07 | 4.10 | — | (0.67 | ) | (0.67 | ) | 20.66 | 24.63 | 67,740 | 0.72 | (d) | 0.72 | (d) | 0.19 | (d) | 48 | |||||||||||||||||||||||||||||||||||||
Year ended 08/31/16 | 16.68 | 0.05 | 1.32 | 1.37 | — | (0.82 | ) | (0.82 | ) | 17.23 | 8.39 | 53,789 | 0.71 | 0.71 | 0.33 | 59 | ||||||||||||||||||||||||||||||||||||||||
Year ended 08/31/15 | 18.20 | 0.01 | 0.08 | 0.09 | — | (1.61 | ) | (1.61 | ) | 16.68 | 0.62 | 50,052 | 0.71 | 0.71 | 0.06 | 74 | ||||||||||||||||||||||||||||||||||||||||
Year ended 08/31/14 | 14.90 | 0.02 | 4.01 | 4.03 | (0.05 | ) | (0.68 | ) | (0.73 | ) | 18.20 | 27.65 | 52,164 | 0.70 | 0.70 | 0.11 | 77 | |||||||||||||||||||||||||||||||||||||||
Year ended 08/31/13 | 12.55 | 0.06 | 2.34 | 2.40 | (0.05 | ) | — | (0.05 | ) | 14.90 | 19.22 | 151,535 | 0.75 | 0.75 | 0.48 | 80 | ||||||||||||||||||||||||||||||||||||||||
Class R6 | ||||||||||||||||||||||||||||||||||||||||||||||||||||||||
Year ended 08/31/17 | 17.29 | 0.05 | 4.08 | 4.13 | — | (0.67 | ) | (0.67 | ) | 20.75 | 24.72 | 130,807 | 0.64 | (d) | 0.64 | (d) | 0.27 | (d) | 48 | |||||||||||||||||||||||||||||||||||||
Year ended 08/31/16 | 16.72 | 0.07 | 1.32 | 1.39 | — | (0.82 | ) | (0.82 | ) | 17.29 | 8.49 | 120,754 | 0.63 | 0.63 | 0.42 | 59 | ||||||||||||||||||||||||||||||||||||||||
Year ended 08/31/15 | 18.22 | 0.03 | 0.08 | 0.11 | — | (1.61 | ) | (1.61 | ) | 16.72 | 0.73 | 86,444 | 0.62 | 0.62 | 0.15 | 74 | ||||||||||||||||||||||||||||||||||||||||
Year ended 08/31/14 | 14.92 | 0.03 | 4.01 | 4.04 | (0.06 | ) | (0.68 | ) | (0.74 | ) | 18.22 | 27.69 | 137,509 | 0.63 | 0.63 | 0.18 | 77 | |||||||||||||||||||||||||||||||||||||||
Year ended 08/31/13(f) | 13.03 | 0.07 | 1.87 | 1.94 | (0.05 | ) | — | (0.05 | ) | 14.92 | 14.98 | 113,955 | 0.65 | (g) | 0.65 | (g) | 0.58 | (g) | 80 | |||||||||||||||||||||||||||||||||||||
| (a) | Calculated using average shares outstanding. |
| (b) | Includes adjustments in accordance with accounting principles generally accepted in the United States of America and as such, the net asset value for financial reporting purposes and the returns based upon those net asset values may differ from the net asset value and returns for shareholder transactions. Does not include sales charges and is not annualized for periods less than one year, if applicable. |
| (c) | Portfolio turnover is calculated at the fund level and is not annualized for periods less than one year, if applicable. For the year ended August 31, 2014, the portfolio turnover calculation excludes the value of securities purchased of $1,921,954,452 and sales of $1,568,687,370 in the effort to realign the Fund’s portfolio holdings after the reorganization of Invesco Constellation Fund into the Fund. For the year ended August 31, 2013, the portfolio turnover calculation excludes the value of securities purchased of $279,161,573 and sales of $299,305,234 in the effort to realign the Fund’s portfolio holdings after the reorganization of Invesco Leisure Fund into the Fund. |
| (d) | Ratios are based on average daily net assets (000’s omitted) of $8,594,461, $84,796, $365,403, $30,168, $199,081, $58,264 and $119,930 for Class A, Class B, Class C, Class R, Class Y, Class R5 and Class R6 shares, respectively. |
| (e) | The total return, ratio of expenses to average net assets and ratio of net investment income (loss) to average net assets reflect actual 12b-1 fees of 0.25%, 0.25%, 0.25%, 0.25% and 0.25% for the years ended August 31, 2017, 2016, 2015, 2014 and 2013, respectively. |
| (f) | Commencement date of September 24, 2012. |
| (g) | Annualized. |
20 Invesco American Franchise Fund
Report of Independent Registered Public Accounting Firm
To the Board of Trustees of AIM Counselor Series Trust (Invesco Counselor Series Trust)
and Shareholders of Invesco American Franchise Fund:
In our opinion, the accompanying statement of assets and liabilities, including the schedule of investments, and the related statements of operations and of changes in net assets and the financial highlights present fairly, in all material respects, the financial position of Invesco American Franchise Fund (one of the portfolios constituting AIM Counselor Series Trust (Invesco Counselor Series Trust), hereafter referred to as the “Fund”) as of August 31, 2017, the results of its operations for the year then ended, the changes in its net assets for each of the two years in the period then ended and the financial highlights for each of the periods indicated therein, in conformity with accounting principles generally accepted in the United States of America. These financial statements and financial highlights (hereafter referred to as “financial statements”) are the responsibility of the Fund’s management. Our responsibility is to express an opinion on these financial statements based on our audits. We conducted our audits of these financial statements in accordance with the standards of the Public Company Accounting Oversight Board (United States). Those standards require that we plan and perform the audit to obtain reasonable assurance about whether the financial statements are free of material misstatement. An audit includes examining, on a test basis, evidence supporting the amounts and disclosures in the financial statements, assessing the accounting principles used and significant estimates made by management, and evaluating the overall financial statement presentation. We believe that our audits, which included confirmation of securities as of August 31, 2017 by correspondence with the custodian, transfer agent and brokers, and when replies were not received from brokers, we performed other auditing procedures, provide a reasonable basis for our opinion.
PricewaterhouseCoopers LLP
Houston, Texas
October 30, 2017
21 Invesco American Franchise Fund
Calculating your ongoing Fund expenses
Example
As a shareholder of the Fund, you incur two types of costs: (1) transaction costs, which may include sales charges (loads) on purchase payments or contingent deferred sales charges on redemptions, if any; and (2) ongoing costs, including management fees, distribution and/or service (12b-1) fees, and other Fund expenses. This example is intended to help you understand your ongoing costs (in dollars) of investing in the Fund and to compare these costs with ongoing costs of investing in other mutual funds. The example is based on an investment of $1,000 invested at the beginning of the period and held for the entire period March 1, 2017 through August 31, 2017.
Actual expenses
The table below provides information about actual account values and actual expenses. You may use the information in this table, together with the amount you invested, to estimate the expenses that you paid over the period. Simply divide your account value by $1,000 (for example, an $8,600 account value divided by $1,000 = 8.6), then multiply the result by the number in the table under the heading entitled “Actual Expenses Paid During Period” to estimate the expenses you paid on your account during this period.
Hypothetical example for comparison purposes
The table below also provides information about hypothetical account values and hypothetical expenses based on the Fund’s actual expense ratio and an assumed rate of return of 5% per year before expenses, which is not the Fund’s actual return.
The hypothetical account values and expenses may not be used to estimate the actual ending account balance or expenses you paid for the period. You may use this information to compare the ongoing costs of investing in the Fund and other funds. To do so, compare this 5% hypothetical example with the 5% hypothetical examples that appear in the shareholder reports of the other funds.
Please note that the expenses shown in the table are meant to highlight your ongoing costs only and do not reflect any transaction costs, such as sales charges (loads) on purchase payments or contingent deferred sales charges on redemptions, if any. Therefore, the hypothetical information is useful in comparing ongoing costs only, and will not help you determine the relative total costs of owning different funds. In addition, if these transaction costs were included, your costs would have been higher.
| Class | Beginning Account Value (03/01/17) | ACTUAL | HYPOTHETICAL (5% annual return before | Annualized Expense Ratio | ||||||||||||||||||||
| Ending Account Value (08/31/17)1 | Expenses Paid During Period2 | Ending Account Value (08/31/17) | Expenses Paid During Period2 | |||||||||||||||||||||
| A | $ | 1,000.00 | $ | 1,131.90 | $ | 5.59 | $ | 1,019.96 | $ | 5.30 | 1.04 | % | ||||||||||||
| B | 1,000.00 | 1,132.20 | 5.59 | 1,019.96 | 5.30 | 1.04 | ||||||||||||||||||
| C | 1,000.00 | 1,127.00 | 9.60 | 1,016.18 | 9.10 | 1.79 | ||||||||||||||||||
| R | 1,000.00 | 1,130.60 | 6.93 | 1,018.70 | 6.56 | 1.29 | ||||||||||||||||||
| Y | 1,000.00 | 1,133.00 | 4.25 | 1,021.22 | 4.02 | 0.79 | ||||||||||||||||||
| R5 | 1,000.00 | 1,133.90 | 3.82 | 1,021.63 | 3.62 | 0.71 | ||||||||||||||||||
| R6 | 1,000.00 | 1,134.50 | 3.34 | 1,022.08 | 3.16 | 0.62 | ||||||||||||||||||
| 1 | The actual ending account value is based on the actual total return of the Fund for the period March 1, 2017 through August 31, 2017, after actual expenses and will differ from the hypothetical ending account value which is based on the Fund’s expense ratio and a hypothetical annual return of 5% before expenses. |
| 2 | Expenses are equal to the Fund’s annualized expense ratio as indicated above multiplied by the average account value over the period, multiplied by 184/365 to reflect the most recent fiscal half year. |
22 Invesco American Franchise Fund
Approval of Investment Advisory and Sub-Advisory Contracts
The Board of Trustees (the Board) of AIM Counselor Series Trust (Invesco Counselor Series Trust) is required under the Investment Company Act of 1940, as amended, to approve annually the renewal of Invesco American Franchise Fund’s (the Fund) investment advisory agreements. During contract renewal meetings held on June 12-13, 2017, the Board as a whole, and the disinterested or “independent” Trustees, who comprise over 75% of the Board, voting separately, approved the continuance for the Fund of the Master Investment Advisory Agreement with Invesco Advisers, Inc. (Invesco Advisers and the investment advisory agreement) and the Master Intergroup Sub-Advisory Contract for Mutual Funds with Invesco Asset Management Deutschland GmbH, Invesco Asset Management Limited, Invesco Asset Management (Japan) Limited, Invesco Hong Kong Limited, Invesco Senior Secured Management, Inc. and Invesco Canada Ltd. (collectively, the Affiliated Sub-Advisers and the sub-advisory contracts) for another year, effective July 1, 2017.
In evaluating the fairness and reasonableness of compensation under the Fund’s investment advisory agreement and sub-advisory contracts, the Board considered, among other things, the factors discussed below. The Board determined that continuation of the Fund’s investment advisory agreement and the sub-advisory contracts is in the best interest of the Fund and its shareholders and that the compensation payable to Invesco Advisers and the Affiliated Sub-Advisers under the agreements is fair and reasonable.
The Board’s Fund Evaluation Process
The Board’s Investments Committee has established three Sub-Committees, which meet throughout the year to review the performance of funds advised by Invesco Advisers (the Invesco Funds). Over the course of each year, the Sub-Committees meet with portfolio managers for their assigned Invesco Funds and other members of management to review the performance, investment objective(s), policies, strategies, limitations and investment risks of these funds. The Board had the benefit of reports from the Sub-Committees and Investments Committee throughout the year in considering approval of the continuance of each Invesco Fund’s investment advisory agreement and sub-advisory contracts for another year.
During the contract renewal process, the Board receives comparative performance and fee data regarding the Invesco Funds prepared by Invesco Advisers and Broadridge Financial Solutions, Inc. (Broadridge), an independent provider of investment company data. The Board also receives an independent written evaluation from the Senior Officer, an officer of the Invesco Funds who reports directly to the independent Trustees. The Senior Officer’s
evaluation is prepared as part of his responsibility to manage the process by which the Invesco Funds’ proposed management fees are negotiated during the annual contract renewal process to ensure they are negotiated in a manner that is at arms’ length and reasonable. In addition to meetings with Invesco Advisers and fund counsel, the independent Trustees also discuss the continuance of the investment advisory agreement and sub-advisory contracts in separate sessions with the Senior Officer and with independent legal counsel.
The Trustees recognized that the advisory fee rates for the Invesco Funds are, in most cases, the result of years of review and negotiation. The Trustees’ deliberations and conclusions in a particular year may be based in part on their deliberations and conclusions regarding these arrangements throughout the year and in prior years. The Trustees’ review and conclusions are based on the comprehensive consideration of all information presented to them and are not the result of any single determinative factor. Moreover, one Trustee may have weighed a particular piece of information or factor differently than another Trustee.
The discussion below is a summary of the Senior Officer’s independent written evaluation with respect to the Fund’s investment advisory agreement as well as a discussion of the material factors and related conclusions that formed the basis for the Board’s approval of the Fund’s investment advisory agreement and sub-advisory contracts. This information is current as of June 13, 2017, and does not reflect consideration of factors that became known to the Board after that date.
Factors and Conclusions and Summary of Independent Written Fee Evaluation
| A. | Nature, Extent and Quality of Services Provided by Invesco Advisers and the Affiliated Sub-Advisers |
The Board reviewed the advisory services provided to the Fund by Invesco Advisers under the Fund’s investment advisory agreement, the performance of Invesco Advisers in providing these services, and the credentials and experience of the officers and employees of Invesco Advisers who provide these services, including the Fund’s portfolio manager or managers. The Board’s review included consideration of Invesco Advisers’ investment process oversight, credit analysis and investment risk management. The Board also considered non-advisory services that Invesco Advisers and its affiliates provide to the Invesco Funds such as various back office support functions, trading operations, internal audit, valuation and legal and compliance.
In determining whether to continue the Fund’s investment advisory agreement, the Board considered the benefits of reapproving an
existing relationship as contrasted with the greater uncertainty that may be associated with entering into a new relationship. The Board concluded that the nature, extent and quality of the services provided to the Fund by Invesco Advisers are appropriate and satisfactory.
The Board reviewed the services that may be provided by the Affiliated Sub-Advisers under the sub-advisory contracts and the credentials and experience of the officers and employees of the Affiliated Sub-Advisers who provide these services. The Board noted that the Affiliated Sub-Advisers have offices and personnel that are located in financial centers around the world. As a result, the Board noted that the Affiliated Sub-Advisers can provide research and investment analysis on the markets and economies of various countries in which the Fund may invest, make recommendations regarding securities and assist with security trades. The Board concluded that the sub-advisory contracts may benefit the Fund and its shareholders by permitting Invesco Advisers to use the resources and talents of the Affiliated Sub-Advisers in managing the Fund. The Board concluded that the nature, extent and quality of the services that may be provided by the Affiliated Sub-Advisers are appropriate and satisfactory.
| B. | Fund Investment Performance |
The Board considered Fund investment performance as a relevant factor in considering whether to approve the investment advisory agreement. The Board did not view Fund performance as a relevant factor in considering whether to approve the sub-advisory contracts for the Fund, as no Affiliated Sub-Adviser currently manages assets of the Fund.
The Board compared the Fund’s investment performance over multiple time periods ending December 31, 2016 to the performance of funds in the Broadridge performance universe and against the Lipper Large-Cap Growth Funds Index. The Board noted that performance of Class A shares of the Fund was in the third quintile of its performance universe for the one and five year periods and the fourth quintile for the three year period (the first quintile being the best performing funds and the fifth quintile being the worst performing funds). The Board noted that performance of Class A shares of the Fund was above the performance of the Index for the one year period and below the performance of the Index for the three and five year periods. The Trustees also reviewed more recent Fund performance and this review did not change their conclusions.
| C. | Advisory and Sub-Advisory Fees |
The Board compared the Fund’s contractual management fee rate to the contractual management fee rates of funds in the Fund’s Broadridge expense group at a common asset level. The Board noted that the contractual management fee rate for Class A shares of the
23 Invesco American Franchise Fund
Fund was below the median contractual management fee rate of funds in its expense group. The Board noted that the term “contractual management fee” for funds in the expense group may include both advisory and certain administrative services fees, but that Broadridge does not provide information on a fund by fund basis as to what is included. The Board noted that Invesco Advisers does not separately charge the Invesco Funds for the administrative services included in the term as defined by Broadridge. The Board also reviewed the methodology used by Broadridge in providing expense group information, which includes using each fund’s contractual management fee schedule (including any applicable breakpoints) as reported in the most recent prospectus or statement of additional information for each fund in the expense group.
The Board also compared the Fund’s effective advisory fee rate (the advisory fee rate after advisory fee waivers and before other expense limitations/waivers) to the effective advisory fee rates of other mutual funds advised by Invesco Advisers and its affiliates with investment strategies comparable to those of the Fund, based on asset balances of December 31, 2016. The Board noted that the Fund’s rate was below the rate of one such mutual fund.
The Board also considered the fees charged by Invesco Advisers and the Affiliated Sub-Advisers to other client accounts with investment strategies comparable to those of the Fund. The Board noted that Invesco Advisers or the Affiliated Sub-Advisers may charge lower fees to large institutional clients. Invesco Advisers reviewed with the Board the significantly greater scope of services it provides to the Invesco Funds relative to certain other types of client accounts. These additional services include provision of administrative services, officers and office space, oversight of service providers, preparation of annual registration statement updates and financial information and regulatory compliance under the Investment Company Act of 1940, as amended.
Invesco Advisers also reviewed generally the higher frequency of shareholder purchases and redemptions in the Invesco Funds relative to the flow of assets for other client accounts. Invesco Advisers advised the Board that advance notice of redemptions is often provided to Invesco Advisers by institutional clients. The Board did note that sub-advisory fee rates charged by the Affiliated Sub-Advisers to manage the Invesco Funds and to manage other client accounts tended to be more comparable, reflecting a similar scope of services.
The Board also considered the services that may be provided by the Affiliated Sub-Advisers pursuant to the sub-advisory contracts, as well as the fees payable by Invesco Advisers to the Affiliated Sub-Advisers pursuant to the sub-advisory contracts. The Board also noted that the sub-advisory fees are not paid directly by the Fund, but rather, are payable by Invesco Advisers to the Affiliated Sub-Advisers.
| D. | Economies of Scale and Breakpoints |
The Board considered the extent to which there are economies of scale in the provision of advisory services to the Fund. The Board also considered that the Fund benefits from economies of scale through contractual breakpoints in the Fund’s advisory fee schedule. The Board noted that the Fund shares directly in economies of scale through lower fees charged by third party service providers based on the combined size of the Invesco Funds advised by Invesco Advisers.
| E. | Profitability and Financial Resources |
The Board reviewed information from Invesco Advisers concerning the costs of the advisory and other services that Invesco Advisers and its affiliates provide to the Fund and the Invesco Funds and the profitability of Invesco Advisers and its affiliates in providing these services. The Board noted that Invesco Advisers continues to operate at a net profit from services Invesco Advisers and its affiliates provide to the Invesco Funds and the Fund. The Board did not deem the level of profits realized by Invesco Advisers and its affiliates from providing services to the Fund to be excessive given the nature, quality and extent of the services provided. The Board received and accepted information from Invesco Advisers demonstrating that Invesco Advisers and each Affiliated Sub-Adviser are financially sound and have the resources necessary to perform their obligations under the investment advisory agreement and sub-advisory contracts.
| F. | Collateral Benefits to Invesco Advisers and its Affiliates |
The Board considered various other benefits received by Invesco Advisers and its affiliates from the relationship with the Fund, including the fees received for providing transfer agency and distribution services to the Fund. The Board considered comparative information regarding fees charged for these services, including information provided by Broadridge and other independent sources. The Board considered the performance of Invesco Advisers and its affiliates in providing these services and the organizational structure employed to provide these services. The Board also considered that these services are provided to the Fund pursuant to written contracts that are reviewed and approved on an annual basis by the Board; and that the services are required for the operation of the Fund.
The Board considered the benefits realized by Invesco Advisers and the Affiliated Sub-Advisers as a result of portfolio brokerage transactions executed through “soft dollar” arrangements. The Board noted that soft dollar arrangements may result in the Fund bearing costs to purchase research that may be used by Invesco Advisers or the Affiliated Sub-Advisers with other clients and may reduce Invesco Adviser’s or the Affiliated Sub-Adviser’s expenses. The Board also considered that it receives periodic reports from the Chief Compliance Officer of the Invesco Funds demonstrating that these arrangements are consistent with regulatory
requirements. The Board did not deem the soft dollar arrangements to be inappropriate.
The Board considered that the Fund’s uninvested cash and cash collateral from any securities lending arrangements may be invested in money market funds advised by Invesco Advisers pursuant to procedures approved by the Board. The Board noted that Invesco Advisers receives advisory fees from these affiliated money market funds attributable to such investments, although Invesco Advisers has contractually agreed to waive through varying periods the advisory fees payable by the Invesco Funds with respect to certain investments in the affiliated money market funds. The waiver is in an amount equal to 100% of the net advisory fee Invesco Advisers receives from the affiliated money market funds with respect to the Fund’s investment in the affiliated money market funds of uninvested cash, but not cash collateral. The Board concluded that the amount of advisory fees received by Invesco Advisers from the Fund’s investment of cash collateral from any securities lending arrangements in the affiliated money market funds is fair and reasonable.
The Board also considered that the Fund may use an affiliated broker to execute certain trades for the Fund to, among other things, control information leakage, and was advised that such trades would be executed in compliance with rules under the federal securities laws and consistent with best execution obligations.
24 Invesco American Franchise Fund
Tax Information
Form 1099-DIV, Form 1042-S and other year–end tax information provide shareholders with actual calendar year amounts that should be included in their tax returns. Shareholders should consult their tax advisors.
The following distribution information is being provided as required by the Internal Revenue Code or to meet a specific state’s requirement.
The Fund designates the following amounts or, if subsequently determined to be different, the maximum amount allowable for its fiscal year ended August 31, 2017:
Federal and State Income Tax | ||||
Long-Term Capital Gain Distributions | $ | 347,653,701 | ||
Qualified Dividend Income* | 0 | % | ||
Corporate Dividends Received Deduction* | 0 | % | ||
U.S. Treasury Obligations* | 0 | % | ||
Tax-Exempt Interest Dividends* | 0 | % | ||
| * | The above percentages are based on ordinary income dividends paid to shareholders during the Fund’s fiscal year. |
25 Invesco American Franchise Fund
Proxy Results
A Special Joint Meeting (“Meeting”) of Shareholders of Invesco American Franchise Fund, an investment portfolio of AIM Counselor Series Trust (Invesco Counselor Series Trust), a Delaware statutory trust (“Trust”), was held on March 9, 2017. The Meeting was held for the following purposes:
| (1) | Elect 15 trustees to the Board, each of whom will serve until his or her successor is elected and qualified. |
| (2) | Approve an amendment to the Trust’s Agreement and Declaration of Trust that would permit fund mergers and other significant transactions upon the Board’s approval but without shareholder approval of such transactions. |
The results of the voting on the above matters were as follows:
| Matters | Votes For | Votes Withheld | ||||||||||||||||
| (1)* | David C. Arch | 1,425,647,604 | 36,521,875 | |||||||||||||||
| James T. Bunch | 1,425,181,099 | 36,988,380 | ||||||||||||||||
| Bruce L. Crockett | 1,425,174,694 | 36,994,785 | ||||||||||||||||
| Jack M. Fields | 1,426,060,874 | 36,108,605 | ||||||||||||||||
| Martin L. Flanagan | 1,426,481,477 | 35,688,002 | ||||||||||||||||
| Cynthia Hostetler | 1,426,489,972 | 35,679,505 | ||||||||||||||||
| Dr. Eli Jones | 1,426,255,832 | 35,913,647 | ||||||||||||||||
| Dr. Prema Mathai-Davis | 1,425,363,789 | 36,805,689 | ||||||||||||||||
| Teresa M. Ressel | 1,426,514,880 | 35,654,598 | ||||||||||||||||
| Dr. Larry Soll | 1,424,932,245 | 37,237,234 | ||||||||||||||||
| Ann Barnett Stern | 1,426,260,049 | 35,909,429 | ||||||||||||||||
| Raymond Stickel, Jr. | 1,425,391,657 | 36,777,822 | ||||||||||||||||
| Philip A. Taylor | 1,426,285,212 | 35,884,267 | ||||||||||||||||
| Robert C. Troccoli | 1,426,075,097 | 36,094,382 | ||||||||||||||||
| Christopher L. Wilson | 1,426,594,956 | 35,574,523 | ||||||||||||||||
| Votes For | Votes Against | Votes Abstain | Broker Non-Votes | |||||||||||||||
| (2)* | Approve an amendment to the Trust’s Agreement and Declaration of Trust that would permit fund mergers and other significant transactions upon the Board’s approval but without shareholder approval of such transactions | 751,302,707 | 79,810,344 | 41,561,890 | 589,495,482 | |||||||||||||
The Meeting was adjourned until April 11, 2017, with respect to the following proposals:
| (3) | Approve changing the fundamental investment restriction regarding the purchase or sale of physical commodities. |
| 4(a) | Approve an amendment to the current Master Intergroup Sub-Advisory Contract to add Invesco PowerShares Capital Management LLC. |
| 4(b) | Approve an amendment to the current Master Intergroup Sub-Advisory Contract to add Invesco Asset Management (India) Private Limited. |
Invesco American Franchise Fund did not receive sufficient shareholder votes to pass Proposals 3 and 4(a) - (b).
The results of the voting on the above matters were as follows:
| Matters | Votes For | Votes Against | Votes Abstain | Broker Non-Votes | ||||||||||||||
| (3) | Approve changing the fundamental investment restriction regarding the purchase or sale of physical commodities | 144,218,298 | 19,691,644 | 13,348,841 | 109,670,528 | |||||||||||||
| 4(a) | Approve an amendment to the current Master Intergroup Sub-Advisory Contract to add Invesco PowerShares Capital Management LLC | 151,724,106 | 11,942,504 | 13,592,205 | 109,670,496 | |||||||||||||
| 4(b) | Approve an amendment to the current Master Intergroup Sub-Advisory Contract to add Invesco Asset Management (India) Private Limited | 148,040,765 | 15,399,652 | 13,818,379 | 109,670,515 | |||||||||||||
| * | Each of proposal 1 and 2 required approval by a combined vote of all of the portfolios of AIM Counselor Series Trust (Invesco Counselor Series Trust). |
26 Invesco American Franchise Fund
Trustees and Officers
The address of each trustee and officer is AIM Counselor Series Trust (Invesco Counselor Series Trust) (the “Trust”), 11 Greenway Plaza, Suite 1000, Houston, Texas 77046-1173. The trustees serve for the life of the Trust, subject to their earlier death, incapacitation, resignation, retirement or removal as more specifically provided in the Trust’s organizational documents. Each officer serves for a one year term or until their successors are elected and qualified. Column two below includes length of time served with predecessor entities, if any.
| Name, Year of Birth and Position(s) Held with the Trust | Trustee and/ or Officer Since | Principal Occupation(s) During Past 5 Years | Number of Overseen by | Other Directorship(s) Held by Trustee During Past 5 Years | ||||
| Interested Persons | ||||||||
| Martin L. Flanagan1 — 1960 Trustee | 2007 | Executive Director, Chief Executive Officer and President, Invesco Ltd. (ultimate parent of Invesco and a global investment management firm); Trustee, The Invesco Funds; Vice Chair, Investment Company Institute; and Member of Executive Board, SMU Cox School of Business
Formerly: Advisor to the Board, Invesco Advisers, Inc. (formerly known as Invesco Institutional (N.A.), Inc.); Chairman and Chief Executive Officer, Invesco Advisers, Inc. (registered investment adviser); Director, Chairman, Chief Executive Officer and President, Invesco Holding Company (US), Inc. (formerly IVZ Inc.) (holding company), Invesco Group Services, Inc. (service provider) and Invesco North American Holdings, Inc. (holding company); Director, Chief Executive Officer and President, Invesco Holding Company Limited (parent of Invesco and a global investment management firm); Director, Invesco Ltd.; Chairman, Investment Company Institute and President, Co-Chief Executive Officer, Co-President, Chief Operating Officer and Chief Financial Officer, Franklin Resources, Inc. (global investment management organization) | 144 | None | ||||
Philip A. Taylor2 — 1954 Trustee and Senior Vice President | 2006 | Head of the Americas and Senior Managing Director, Invesco Ltd.; Director, Invesco Advisers, Inc. (formerly known as Invesco Institutional (N.A.), Inc.) (registered investment adviser); Director, Chairman, Chief Executive Officer and President, Invesco Management Group, Inc. (formerly known as Invesco Aim Management Group, Inc.) (financial services holding company); Director and Chairman, Invesco Investment Services, Inc. (formerly known as Invesco Aim Investment Services, Inc.) (registered transfer agent); Chief Executive Officer, Invesco Corporate Class Inc. (corporate mutual fund company); Director, Chairman and Chief Executive Officer, Invesco Canada Ltd. (formerly known as Invesco Trimark Ltd./Invesco Trimark Ltèe) (registered investment adviser and registered transfer agent); Trustee and Senior Vice President, The Invesco Funds; Director, Invesco Investment Advisers LLC (formerly known as Van Kampen Asset Management).
Formerly: Co-Chairman, Co-President and Co-Chief Executive Officer, Invesco Advisers, Inc. (formerly known as Invesco Institutional (N.A.), Inc.) (registered investment adviser); Director, Chief Executive Officer and President, Van Kampen Exchange Corp; President and Principal Executive Officer, The Invesco Funds (other than AIM Treasurer’s Series Trust (Invesco Treasurer’s Series Trust), Short-Term Investments Trust and Invesco Management Trust); Executive Vice President, The Invesco Funds (AIM Treasurer’s Series Trust (Invesco Treasurer’s Series Trust), Short-Term Investments Trust and Invesco Management Trust only); Director and President, INVESCO Funds Group, Inc. (registered investment adviser and registered transfer agent); Director and Chairman, IVZ Distributors, Inc. (formerly known as INVESCO Distributors, Inc.) (registered broker dealer); Director, President and Chairman, Invesco Inc. (holding company), Invesco Canada Holdings Inc. (holding company), Trimark Investments Ltd./Placements Trimark Ltèe and Invesco Financial Services Ltd/Services Financiers Invesco Ltèe; Chief Executive Officer, Invesco Canada Fund Inc. (corporate mutual fund company); Director and Chairman, Van Kampen Investor Services Inc.; Director, Chief Executive Officer and President, 1371 Preferred Inc. (holding company) and Van Kampen Investments Inc.; Director and President, AIM GP Canada Inc. (general partner for limited partnerships) and Van Kampen Advisors, Inc.; Director and Chief Executive Officer, Invesco Trimark Dealer Inc. (registered broker dealer); Director, Invesco Distributors, Inc. (formerly known as Invesco Aim Distributors, Inc.) (registered broker dealer); Manager, Invesco PowerShares Capital Management LLC; Director, Chief Executive Officer and President, Invesco Advisers, Inc.; Director, Chairman, Chief Executive Officer and President, Invesco Aim Capital Management, Inc.; President, Invesco Trimark Dealer Inc. and Invesco Trimark Ltd./Invesco Trimark Ltèe; Director and President, AIM Trimark Corporate Class Inc. and AIM Trimark Canada Fund Inc.; Senior Managing Director, Invesco Holding Company Limited; Director and Chairman, Fund Management Company (former registered broker dealer); President and Principal Executive Officer, The Invesco Funds (AIM Treasurer’s Series Trust (Invesco Treasurer’s Series Trust), and Short-Term Investments Trust only); President, AIM Trimark Global Fund Inc. and AIM Trimark Canada Fund Inc. | 144 | None |
| 1 | Mr. Flanagan is considered an interested person (within the meaning of Section 2(a)(19) of the 1940 Act) of the Trust because he is an officer of the Adviser to the Trust, and an officer and a director of Invesco Ltd., ultimate parent of the Adviser. |
| 2 | Mr. Taylor is considered an interested person (within the meaning of Section 2(a)(19) of the 1940 Act) of the Trust because he is an officer and a director of the Adviser. |
T-1 Invesco American Franchise Fund
Trustees and Officers—(continued)
| Name, Year of Birth and Position(s) Held with the Trust | Trustee and/ or Officer Since | Principal Occupation(s) During Past 5 Years | Number of Complex Overseen by Trustee | Other Directorship(s) Held by Trustee During | ||||
| Independent Trustees | ||||||||
Bruce L. Crockett — 1944 Trustee and Chair | 2003 | Chairman, Crockett Technologies Associates (technology consulting company)
Formerly: Director, Captaris (unified messaging provider); Director, President and Chief Executive Officer, COMSAT Corporation; Chairman, Board of Governors of INTELSAT (international communications company); ACE Limited (insurance company); Independent Directors Council and Investment Company Institute: Member of the Audit Committee, Investment Company Institute; Member of the Executive Committee and Chair of the Governance Committee, Independent Directors Council | 144 | Director and Chairman of the Audit Committee, ALPS (Attorneys Liability Protection Society) (insurance company); Director and Member of the Audit Committee, Ferroglobe PLC (metallurgical company) | ||||
David C. Arch — 1945 Trustee | 2010 | Chairman of Blistex Inc. (consumer health care products manufacturer); Member, World Presidents’ Organization | 144 | Board member of the Illinois Manufacturers’ Association | ||||
James T. Bunch — 1942 Trustee | 2000 | Managing Member, Grumman Hill Group LLC (family office/private equity investments)
Formerly: Chairman of the Board, Denver Film Society; Chairman of the Board of Trustees, Evans Scholarship Foundation; Chairman, Board of Governors, Western Golf Association | 144 | Trustee, Evans Scholarship Foundation | ||||
Jack M. Fields — 1952 Trustee | 2003 | Chief Executive Officer, Twenty First Century Group, Inc. (government affairs company); and Discovery Learning Alliance (non-profit)
Formerly: Owner and Chief Executive Officer, Dos Angeles Ranch L.P. (cattle, hunting, corporate entertainment); Director, Insperity, Inc. (formerly known as Administaff); Chief Executive Officer, Texana Timber LP (sustainable forestry company); Director of Cross Timbers Quail Research Ranch (non-profit); and member of the U.S. House of Representatives | 144 | None | ||||
Cynthia Hostetler — 1962 Trustee | 2017 | Non-Executive Director and Trustee of a number of public and private business corporations
Formerly: Head of Investment Funds and Private Equity, Overseas Private Investment Corporation; President, First Manhattan Bancorporation, Inc.; Attorney, Simpson Thacher & Bartlett LLP | 144 | Vulcan Materials Company (construction materials company); Trilinc Global Impact Fund; Aberdeen Investment Funds (4 portfolios); Artio Global Investment LLC (mutual fund complex); Edgen Group, Inc. (specialized energy and infrastructure products distributor) | ||||
Eli Jones — 1961 Trustee | 2016 | Professor and Dean, Mays Business School — Texas A&M University
Formerly: Professor and Dean, Walton College of Business, University of Arkansas and E.J. Ourso College of Business, Louisiana State University; Director, Arvest Bank | 144 | Insperity, Inc. (formerly known as Administaff) (human resources provider) | ||||
Prema Mathai-Davis — 1950 Trustee | 2003 | Retired.
Formerly: Chief Executive Officer, YWCA of the U.S.A. | 144 | None | ||||
Teresa M. Ressel — 1962 Trustee | 2017 | Non-executive director and trustee of a number of public and private business corporations
Formerly: Chief Financial Officer, Olayan America, The Olayan Group (international investor/commercial/industrial); Chief Executive Officer, UBS Securities LLC; Group Chief Operating Officer, Americas, UBS AG; Assistant Secretary for Management & Budget and CFO, US Department of the Treasury; Chief Compliance Officer, Kaiser Permanente; Program Manager, Hewlett-Packard; Nuclear Engineering, General Dynamics Corporation | 144 | Atlantic Power Corporation (power generation company); ON Semiconductor Corp. (semiconductor supplier) | ||||
Larry Soll — 1942 Trustee | 1997 | Retired.
Formerly: Chairman, Chief Executive Officer and President, Synergen Corp. (a biotechnology company) | 144 | None | ||||
Ann Barnett Stern — 1957 Trustee | 2017 | President and Chief Executive Officer, Houston Endowment Inc. (private philanthropic institution)
Formerly: Executive Vice President and General Counsel, Texas Children’s Hospital; Attorney, Beck, Redden and Secrest, LLP; Business Law Instructor, University of St. Thomas; Attorney, Andrews & Kurth LLP | 144 | Federal Reserve Bank of Dallas | ||||
Raymond Stickel, Jr. — 1944 Trustee | 2005 | Retired.
Formerly: Director, Mainstay VP Series Funds, Inc. (25 portfolios); Partner, Deloitte & Touche | 144 | None | ||||
Robert C. Troccoli — 1949 Trustee | 2016 | Adjunct Professor, University of Denver — Daniels College of Business
Formerly: Senior Partner, KPMG LLP | 144 | None | ||||
Christopher L. Wilson — 1957 Trustee | 2017 | Managing Partner, CT2, LLC (investing and consulting firm)
Formerly: President/Chief Executive Officer, Columbia Funds, Bank of America Corporation; President/Chief Executive Officer, CDC IXIS Asset Management Services, Inc.; Principal & Director of Operations, Scudder Funds, Scudder, Stevens & Clark, Inc.; Assistant Vice President, Fidelity Investments | 144 | TD Asset Management USA Inc. (mutual fund complex) (22 portfolios); ISO New England, Inc. (non-profit organization managing regional electricity market) |
T-2 Invesco American Franchise Fund
Trustees and Officers—(continued)
| Name, Year of Birth and Position(s) Held with the Trust | Trustee and/ or Officer Since | Principal Occupation(s) During Past 5 Years | Number of Complex Overseen by Trustee | Other Directorship(s) Held by Trustee During | ||||
| Other Officers | ||||||||
Sheri Morris — 1964 President, Principal Executive Officer and Treasurer | 2003 | President, Principal Executive Officer and Treasurer, The Invesco Funds; Vice President, Invesco Advisers, Inc. (formerly known as Invesco Institutional (N.A.), Inc.) (registered investment adviser); and Vice President, PowerShares Exchange-Traded Fund Trust, PowerShares Exchange-Traded Fund Trust II, PowerShares India Exchange-Traded Fund Trust, PowerShares Actively Managed Exchange-Traded Fund Trust and PowerShares Actively Managed Exchange-Traded Commodity Fund Trust
Formerly: Vice President and Principal Financial Officer, The Invesco Funds; Vice President, Invesco Aim Advisers, Inc., Invesco Aim Capital Management, Inc. and Invesco Aim Private Asset Management, Inc.; Assistant Vice President and Assistant Treasurer, The Invesco Funds and Assistant Vice President, Invesco Advisers, Inc., Invesco Aim Capital Management, Inc. and Invesco Aim Private Asset Management, Inc.; and Treasurer, PowerShares Exchange-Traded Fund Trust, PowerShares Exchange-Traded Fund Trust II, PowerShares India Exchange-Traded Fund Trust and PowerShares Actively Managed Exchange-Traded Fund Trust | N/A | N/A | ||||
Russell C. Burk — 1958 Senior Vice President and Senior Officer | 2005 | Senior Vice President and Senior Officer, The Invesco Funds | N/A | N/A | ||||
John M. Zerr — 1962 Senior Vice President, Chief Legal Officer and Secretary | 2006 | Director, Senior Vice President, Secretary and General Counsel, Invesco Management Group, Inc. (formerly known as Invesco AIM Management Group, Inc.); Senior Vice President, Invesco Advisers, Inc. (formerly known as Invesco Institutional (N.A.), Inc.) (registered investment adviser); Senior Vice President and Secretary, Invesco Distributors, Inc. (formerly known as Invesco AIM Distributors, Inc.); Director, Vice President and Secretary, Invesco Investment Services, Inc. (formerly known as Invesco AIM Investment Services, Inc.) Senior Vice President, Chief Legal Officer and Secretary, The Invesco Funds; Managing Director, Invesco PowerShares Capital Management LLC; Director, Secretary and General Counsel, Invesco Investment Advisers LLC (formerly known as Van Kampen Asset Management); Secretary and General Counsel, Invesco Capital Markets, Inc. (formerly known as Van Kampen Funds Inc.) and Chief Legal Officer, PowerShares Exchange-Traded Fund Trust, PowerShares Exchange-Traded Fund Trust II, PowerShares India Exchange-Traded Fund Trust, PowerShares Actively Managed Exchange-Traded Fund Trust and PowerShares Actively Managed Exchange-Traded Commodity Fund Trust; Manager and Secretary, Invesco Indexing LLC
Formerly: Director, Secretary, General Counsel and Senior Vice President, Van Kampen Exchange Corp.; Director, Vice President and Secretary, IVZ Distributors, Inc. (formerly known as INVESCO Distributors, Inc.); Director and Vice President, INVESCO Funds Group, Inc.; Director and Vice President, Van Kampen Advisors Inc.; Director, Vice President, Secretary and General Counsel, Van Kampen Investor Services Inc.; Director, Invesco Distributors, Inc. (formerly known as Invesco AIM Distributors, Inc.); Director, Senior Vice President, General Counsel and Secretary, Invesco AIM Advisers, Inc. and Van Kampen Investments Inc.; Director, Vice President and Secretary, Fund Management Company; Director, Senior Vice President, Secretary, General Counsel and Vice President, Invesco AIM Capital Management, Inc.; Chief Operating Officer and General Counsel, Liberty Ridge Capital, Inc. (an investment adviser); Vice President and Secretary, PBHG Funds (an investment company) and PBHG Insurance Series Fund (an investment company); Chief Operating Officer, General Counsel and Secretary, Old Mutual Investment Partners (a broker-dealer); General Counsel and Secretary, Old Mutual Fund Services (an administrator) and Old Mutual Shareholder Services (a shareholder servicing center); Executive Vice President, General Counsel and Secretary, Old Mutual Capital, Inc. (an investment adviser); and Vice President and Secretary, Old Mutual Advisors Funds (an investment company) | N/A | N/A | ||||
Gregory G. McGreevey — 1962 Senior Vice President | 2012 | Senior Managing Director, Invesco Ltd.; Director, Chairman, President, and Chief Executive Officer, Invesco Advisers, Inc. (formerly known as Invesco Institutional (N.A.), Inc.) (registered investment adviser); Director, Invesco Mortgage Capital, Inc. and Invesco Senior Secured Management, Inc.; and Senior Vice President, The Invesco Funds
Formerly: Assistant Vice President, The Invesco Funds | N/A | N/A | ||||
Kelli Gallegos — 1970 Vice President, Principal Financial Officer and Assistant Treasurer | 2008 | Vice President, Principal Financial Officer and Assistant Treasurer, The Invesco Funds; Assistant Treasurer, Invesco PowerShares Capital Management LLC, PowerShares Exchange-Traded Fund Trust, PowerShares Exchange-Traded Fund Trust II, PowerShares India Exchange-Traded Fund Trust, PowerShares Actively Managed Exchange-Traded Fund Trust and PowerShares Actively Managed Exchange-Traded Commodity Fund Trust
Formerly: Assistant Vice President, The Invesco Funds | N/A | N/A |
T-3 Invesco American Franchise Fund
Trustees and Officers—(continued)
| Name, Year of Birth and Position(s) Held with the Trust | Trustee and/ or Officer Since | Principal Occupation(s) During Past 5 Years | Number of Complex Overseen by Trustee | Other Directorship(s) Held by Trustee During | ||||
| Other Officers—(continued) | ||||||||
Tracy Sullivan — 1962 Vice President, Chief Tax Officer and Assistant Treasurer | 2008 | Vice President, Chief Tax Officer and Assistant Treasurer, The Invesco Funds; Assistant Treasurer, Invesco PowerShares Capital Management LLC, PowerShares Exchange-Traded Fund Trust, PowerShares Exchange-Traded Fund Trust II, PowerShares India Exchange-Traded Fund Trust, PowerShares Actively Managed Exchange-Traded Fund Trust and PowerShares Actively Managed Exchange-Traded Commodity Fund Trust
Formerly: Assistant Vice President, The Invesco Funds | N/A | N/A | ||||
Crissie M. Wisdom — 1969 Anti-Money Laundering Compliance Officer | 2013 | Anti-Money Laundering Compliance Officer, Invesco Advisers, Inc. (formerly known as Invesco Institutional (N.A.), Inc.) (registered investment adviser), Invesco Capital Markets, Inc. (formerly known as Van Kampen Funds Inc.), Invesco Distributors, Inc., Invesco Investment Services, Inc., Invesco Management Group, Inc., The Invesco Funds, and PowerShares Exchange-Traded Fund Trust, PowerShares Exchange-Traded Fund Trust II, PowerShares India Exchange-Traded Fund Trust, PowerShares Actively Managed Exchange-Traded Fund Trust and PowerShares Actively Managed Exchange-Traded Commodity Fund Trust; Anti-Money Laundering Compliance Officer and Bank Secrecy Act Officer, INVESCO National Trust Company and Invesco Trust Company; and Fraud Prevention Manager and Controls and Risk Analysis Manager for Invesco Investment Services, Inc.
Formerly: Anti-Money Laundering Compliance Officer, Van Kampen Exchange Corp. | N/A | N/A | ||||
Robert R. Leveille — 1969 Chief Compliance Officer | 2016 | Chief Compliance Officer, Invesco Advisers, Inc. (registered investment adviser); and Chief Compliance Officer, The Invesco Funds
Formerly: Chief Compliance Officer, Putnam Investments and the Putnam Funds | N/A | N/A |
The Statement of Additional Information of the Trust includes additional information about the Fund’s Trustees and is available upon request, without charge, by calling 1.800.959.4246. Please refer to the Fund’s Statement of Additional Information for information on the Fund’s sub-advisers.
Office of the Fund 11 Greenway Plaza, Suite 1000 Houston, TX 77046-1173 | Investment Adviser Invesco Advisers, Inc. 1555 Peachtree Street, N.E. Atlanta, GA 30309 | Distributor Invesco Distributors, Inc. 11 Greenway Plaza, Suite 1000 Houston, TX 77046-1173 | Auditors PricewaterhouseCoopers LLP 1000 Louisiana Street, Suite 5800 Houston, TX 77002-5678 | |||
Counsel to the Fund Stradley Ronon Stevens & Young, LLP 2005 Market Street, Suite 2600 Philadelphia, PA 19103-7018 | Counsel to the Independent Trustees Goodwin Procter LLP 901 New York Avenue, N.W. Washington, D.C. 20001 | Transfer Agent Invesco Investment Services, Inc. 11 Greenway Plaza, Suite 1000 Houston, TX 77046-1173 | Custodian State Street Bank and Trust Company 225 Franklin Street Boston, MA 02110-2801 | |||
T-4 Invesco American Franchise Fund
Explore High-Conviction Investing with Invesco

Go paperless with eDelivery
Visit invesco.com/edelivery to enjoy the convenience and security of anytime electronic access to your investment documents.
With eDelivery, you can elect to have any or all of the following materials delivered straight to your inbox to download, save and print from your own computer:
∎ Fund reports and prospectuses
∎ Quarterly statements
∎ Daily confirmations
∎ Tax forms
Invesco mailing information
Send general correspondence to Invesco Investment Services, Inc., P.O. Box 219078, Kansas City, MO 64121-9078.
Important notice regarding delivery of security holder documents
To reduce Fund expenses, only one copy of most shareholder documents may be mailed to shareholders with multiple accounts at the same address (Householding). Mailing of your shareholder documents may be householded indefinitely unless you instruct us otherwise. If you do not want the mailing of these documents to be combined with those for other members of your household, please contact Invesco Investment Services, Inc. at 800 959 4246 or contact your financial institution. We will begin sending you individual copies for each account within 30 days after receiving your request.
Fund holdings and proxy voting information
The Fund provides a complete list of its holdings four times in each fiscal year, at the quarter ends. For the second and fourth quarters, the lists appear in the Fund’s semiannual and annual reports to shareholders. For the first and third quarters, the Fund files the lists with the Securities and Exchange Commission (SEC) on Form N-Q. The most recent list of portfolio holdings is available at invesco.com/completeqtrholdings. Shareholders can also look up the Fund’s Forms N-Q on the SEC website at sec.gov. Copies of the Fund’s Forms N-Q may be reviewed and copied at the SEC Public Reference Room in Washington, D.C. You can obtain information on the operation of the Public Reference Room, including information about duplicating fee charges, by calling 202 551 8090 or 800 732 0330, or by electronic request at the following email address: publicinfo@sec.gov. The SEC file numbers for the Fund are shown below.
A description of the policies and procedures that the Fund uses to determine how to vote proxies relating to portfolio securities is available without charge, upon request, from our Client Services department at 800 959 4246 or at invesco.com/proxyguidelines. The information is also available on the SEC website, sec.gov.
Information regarding how the Fund voted proxies related to its portfolio securities during the most recent 12-month period ended June 30 is available at invesco.com/proxysearch. The information is also available on the SEC website, sec.gov. Invesco Advisers, Inc. is an investment adviser; it provides investment advisory services to individual and institutional clients and does not sell securities. Invesco Distributors, Inc. is the US distributor for Invesco Ltd.’s retail mutual funds, exchange-traded funds and institutional money market funds. Both are wholly owned, indirect subsidiaries of Invesco Ltd. |  |
SEC file numbers: 811-09913 and 333-36074 Invesco Distributors, Inc. VK-AMFR-AR-1 10132017 1505
| ||||
 | Annual Report to Shareholders
| August 31, 2017
| ||
| ||||
Invesco California Tax-Free Income Fund
| ||||
| Nasdaq: | ||||
A: CLFAX ◾ B: CLFBX ◾ C: CLFCX ◾ Y: CLFDX ◾ R6: CLFSX | ||||

Letters to Shareholders
Philip Taylor | Dear Shareholders: This annual report includes information about your Fund, including performance data and a complete list of its investments as of the close of the reporting period. Inside is a discussion of how your Fund was managed and the factors that affected its performance during the reporting period. The reporting period began with stock market volatility in the US and abroad, largely the result of uncertainty about global economic growth and monetary policy. While economic data in the US were generally positive, news overseas was less upbeat. The European Central Bank and central banks in China and Japan – as well as other countries – maintained extraordinarily accommodative monetary policies in response to economic weakness. Citing generally positive economic data – specifically, realized and expected labor market conditions and inflation – the US Federal Reserve raised interest rates three times during the reporting period: in December 2016, and in March and June 2017. The major US stock market rally that began in November 2016 continued through the end of the reporting period, with major stock market indexes repeatedly hitting new record highs. |

Short-term market volatility can prompt some investors to abandon their investment plans – and can cause others to settle for whatever returns the market has to offer. The investment professionals at Invesco, in contrast, invest with high conviction. This means that, no matter the asset class or the strategy, each investment team has a passion to exceed. We want to help investors achieve better outcomes, such as seeking higher returns, helping mitigate risk and generating income. Of course, investing with high conviction can’t guarantee a profit or ensure success; no investment strategy can. To learn more about how we invest with high conviction, visit invesco.com/HighConviction.
You, too, can invest with high conviction by maintaining a long-term investment perspective and by working with your financial adviser on a regular basis. During periods of short-term market volatility or uncertainty, your financial adviser can keep you focused on your long-term investment goals – a new home, a child’s college education or a secure retirement. He or she also can share research about the economy, the markets and individual investment options.
Visit our website for more information on your investments
Our website, invesco.com/us, offers a wide range of market insights and investment perspectives. On the website, you’ll find detailed information about our funds, including performance, holdings and portfolio manager commentaries. You can access information about your account by completing a simple, secure online registration. To do so, select “Log In” on the right side of the homepage, and then select “Register for Individual Account Access.”
In addition to the resources accessible on our website and through our mobile app, you can obtain timely updates to help you stay informed about the markets and the economy by connecting with Invesco on Twitter, LinkedIn or Facebook. You can access our blog at blog.invesco.us.com. Our goal is to provide you the information you want, when and where you want it.
Finally, I’m pleased to share with you Invesco’s commitment to both the Principles for Responsible Investment and to considering environmental, social and governance issues in our robust investment process. I invite you to learn more at invesco.com/esg.
Have questions?
For questions about your account, contact an Invesco client services representative at 800 959 4246. For Invesco-related questions or comments, please email me directly at phil@invesco.com.
All of us at Invesco look forward to serving your investment management needs. Thank you for investing with us.
Sincerely,

Philip Taylor
Senior Managing Director, Invesco Ltd.
2 Invesco California Tax-Free Income Fund
Bruce Crockett | Dear Fellow Shareholders: Among the many important lessons I’ve learned in more than 40 years in a variety of business endeavors is the value of a trusted advocate. As independent chair of the Invesco Funds Board, I can assure you that the members of the Board are strong advocates for the interests of investors in Invesco’s mutual funds. We work hard to represent your interests through oversight of the quality of the investment management services your funds receive and other matters important to your investment, including but not limited to: ∎ Ensuring that Invesco offers a diverse lineup of mutual funds that your financial adviser can use to strive to meet your financial needs as your investment goals change over time. ∎ Monitoring how the portfolio management teams of the Invesco funds are performing in light of changing economic and market conditions. |

∎ Assessing each portfolio management team’s investment performance within the context of the investment strategy described in the fund’s prospectus.
∎ Monitoring for potential conflicts of interests that may impact the nature of the services that your funds receive.
We believe one of the most important services we provide our fund shareholders is the annual review of the funds’ advisory and sub-advisory contracts with Invesco Advisers and its affiliates. This review is required by the Investment Company Act of 1940 and focuses on the nature and quality of the services Invesco provides as the adviser to the Invesco funds and the reasonableness of the fees that it charges for those services. Each year, we spend months carefully reviewing information received from Invesco and a variety of independent sources, such as performance and fee data prepared by Lipper, Inc. (a subsidiary of Broadridge Financial Solutions, Inc.), an independent, third-party firm widely recognized as a leader in its field. We also meet with our independent legal counsel and other independent advisers to review and help us assess the information that we have received. Our goal is to assure that you receive quality investment management services for a reasonable fee.
I trust the measures outlined above provide assurance that you have a worthy advocate when it comes to choosing the Invesco Funds.
As always, please contact me at bruce@brucecrockett.com with any questions or concerns you may have. On behalf of the Board, we look forward to continuing to represent your interests and serving your needs.
Sincerely,

Bruce L. Crockett
Independent Chair
Invesco Funds Board of Trustees
3 Invesco California Tax-Free Income Fund
Management’s Discussion of Fund Performance
Performance summary
For the fiscal year ended August 31, 2017, Class A shares of Invesco California Tax-Free Income Fund (the Fund), at net asset value (NAV), underperformed the S&P Municipal Bond California 5+ Year Investment Grade Index, the Fund’s style-specific benchmark.
Your Fund’s long-term performance appears later in this report.
Fund vs. Indexes
Total returns, 8/31/16 to 8/31/17, at net asset value (NAV). Performance shown does not include applicable contingent deferred sales charges (CDSC) or front-end sales charges, which would have reduced performance.
Class A Shares | -0.41 | % | ||
Class B Shares | -0.46 | |||
Class C Shares | -0.86 | |||
Class Y Shares | -0.24 | |||
Class R6 Shares* | -0.33 | |||
S&P Municipal Bond Indexq (Broad Market Index) | 0.92 | |||
S&P Municipal Bond California 5+ Year Investment Grade Indexq (Style-Specific Index) | 0.50 | |||
Lipper California Municipal Debt Funds Index∎ (Peer Group Index) | 0.20 |
Source(s): qFactSet Research Systems Inc.; ∎Lipper Inc.
*Class R6 shares incepted on April 4, 2017. See page 7 for more information.
Market conditions and your Fund
During the reporting period, California’s fiscal situation continued to improve, buoyed by economic growth, a steady unemployment rate and an improving housing market. The state benefits from a large, diverse economy, high wealth levels and a moderate debt burden. The population of California, the nation’s most populous state, grew by an estimated 5.4% between 2010 and 2016.1 California’s economy is the nation’s largest, its per capita income and median household income remain above the national medians, and the unemployment rate of 4.8% in July 2017 was a dramatic improvement from a peak of 12.2% in October 2010.2 Moody’s affirmed California’s general obligation bond rating of Aa3 with a stable outlook, while in August 2017, Fitch and Standard & Poor’s each maintained a rating of AA- with a stable outlook.3
California’s financial performance has been volatile relative to most states with revenues sensitive to both gross domestic product and stock market performance. This stems from a high percentage of California’s total personal income taxes coming from a relatively small number of high-income citizens, which can make the state’s tax collections vary widely. Passage of temporary tax increases in 2012 improved the state’s financial standing, but it also increased the sensitivity of tax revenues to the economic cycle. Positively, an extension of the temporary tax increase was approved by California voters in November 2016. In 2014, California voters approved a constitutional amendment that created a rainy day fund for the state if specific spending criteria are met, or in the event of a natural disaster. This rainy day fund may provide the state with greater flexibility during periods of economic weakness. California’s
constitution establishes a high priority for the repayment of the state’s general obligation bonds; this priority of payments may provide general obligation bondholders some reassurance during periods of weak economic and revenue growth.
For the reporting period, investment grade municipal bonds, as measured by the S&P Municipal Bond Index, returned 0.92%. Investment grade California municipal bonds, as measured by the S&P Municipal Bond California 5+ Year Investment Grade Index, returned 0.50%. Both non-California and California investment grade municipal bonds managed to produce positive returns despite the sell-off following the presidential election in November 2016. Positive investor sentiment regarding the future of the economy resulted in a risk-on trade that led to a Treasury market sell-off, with municipals following closely behind. During the majority of the fiscal year, the municipal market benefited from a number of favorable technical factors, including a flattening yield curve, strong demand and an overall lower-than expected supply of municipal securities.
Beginning in August 2016, issuance rose significantly; indeed, October issuance was the largest in municipal history, totaling $53.4 billion.5 A great deal of this issuance was a result of issuers anticipating potential year-end volatility related to the US presidential election and the December US Federal Reserve (the Fed) meeting. In September, the market posted its first negative monthly performance since June 2015.6 Overall, demand for municipals remained solid in the third quarter of 2016 and flows into the asset class were strong across all sectors of the municipal market. The close of the third quarter marked the 52nd consecutive week of positive flows into municipal bond mutual funds.7
Portfolio Composition
By credit sector, based on total investments
Revenue Bonds | 70.5 | % | ||
Pre-refunded Bonds | 14.4 | |||
General Obligation Bonds | 14.3 | |||
Other | 0.8 |
Top Five Debt Holdings
% of total net assets
1. | Southern California Metropolitan Water District; Series 2009 B | 2.1 | % | |||
2. | California State University; Series 2012 A | 1.8 | ||||
3. | San Francisco (City & County of) Airport Commission (San Francisco International Airport); Series 2011 C | 1.3 | ||||
4. | Bay Area Toll Authority (San Francisco Bay Area); Series 2009 F-1 | 1.3 | ||||
5. | California (State of); Series 2009 | 1.2 |
Total Net Assets | $ | 443.0 million | ||
Total Number of Holdings | 278 | |||
The Fund’s holdings are subject to change, and there is no assurance that the Fund will continue to hold any particular security.
Data presented here are as of August 31, 2017.
| 4 Invesco California Tax-Free Income Fund |
Following the victory of President Trump, market sentiment shifted to the potential impact that comprehensive tax reform might have on municipal demand, contributing to the Treasury sell-off. As a result, municipals retraced most of 2016’s positive performance. However, in the first two months of 2017, municipals regained much of the ground they lost in the post-election sell-off, and fund flows turned positive once again.
Over the fiscal year, the Fed raised interest rates by a quarter point three times, initially in December 2016, and then again in March and June of 2017.8 Because the hikes were widely anticipated, the market reaction to these announcements was muted.
Dominating municipal headlines were the budget impasse in Illinois, Chicago’s unfunded pension liabilities and Puerto Rico’s downward fiscal spiral. While worrisome, these developments were not enough to outweigh the positive impact of US economic performance during the reporting period, and in July, after over two years, Illinois passed a budget which was supportive to municipal performance.
At the close of the reporting period, we believed the municipal bond market remained strong. Defaults and downgrades were muted, but it will take time to decipher the priorities and policies of the new administration, some of which may likely affect the municipal market.
Over the reporting period, security selection in non-rated issues and tobacco settlement bonds significantly contributed to the Fund’s performance versus the style-specific benchmark. An overweight allocation to short duration bonds (0.00-1.99 years) also benefited Fund performance. The Fund’s overweight exposure to prerefunded bonds and security selection in the dedicated tax and utilities sectors detracted from the Fund’s relative performance. Additionally, security selection in long duration bonds (10.00-19.99 years) was a detractor from the Fund’s performance relative to the style-specific benchmark.
During the reporting period, leverage contributed to Fund performance. The Fund achieved a leveraged position through the use of inverse floating rate securities. The Fund uses leverage because we believe that, over time, leveraging provides opportunities for additional income and total return for shareholders. However, the use of leverage also can expose shareholders to additional volatility.
We wish to remind you that the Fund is subject to interest rate risk, meaning when interest rates rise, the value of fixed income securities tends to fall.
This risk may be greater in the current market environment because interest rates are at or near historic lows. The degree to which the value of fixed income securities may decline due to rising interest rates may vary depending on the speed and magnitude of the increase in interest rates as well as individual security characteristics such as price, maturity, duration and coupon and market forces such as supply and demand for similar securities. We are monitoring interest rates as well as the market, economic and geopolitical factors that may impact the direction, speed and magnitude of changes to interest rates across the maturity spectrum, including the potential impact of monetary policy changes by the Fed and certain foreign central banks. If interest rates rise, markets may experience increased volatility, which may affect the value and/or liquidity of certain of the Fund’s investments.
Thank you for investing in Invesco California Tax-Free Income Fund and for sharing our long-term investment horizon.
| 1 | Source: US Census Bureau |
| 2 | Source: Bureau of Labor Statistics |
| 3 | Sources: Moody’s, Fitch Ratings, Standard & Poor’s. A credit rating is an assessment provided by a nationally recognized statistical rating organization (NRSRO) of the creditworthiness of an issuer with respect to debt obligations, including specific securities, money market instruments or other debts. Ratings are measured on a scale that generally ranges from Aaa (highest) to C (lowest); ratings are subject to change without notice. “Non-Rated” indicates the debtor was not rated, and should not be interpreted as indicating low quality. For more information on rating methodology, please visit www.moodys.com and select “Rating Methodologies” under Research and Ratings on the homepage; www.fitchratings. com and select “Ratings Definitions” on the homepage; and www.standardandpoors.com and select “Understanding Ratings” under Rating Resources on the homepage. |
| 4 | Source: Balletopedia |
| 5 | Source: The Bond Buyer |
| 6 | Source: Standard & Poor’s |
| 7 | Source: Barclays |
| 8 | Source: US Federal Reserve |
The views and opinions expressed in management’s discussion of Fund performance are those of Invesco Advisers, Inc. These views and opinions are subject to change at any time based on factors such as market and economic conditions. These views and opinions may not be relied upon as investment advice or recommendations, or as an offer for a particular security. The information is not a complete analysis of every aspect of any market, country, industry, security or the Fund. Statements of fact are from sources considered reliable, but Invesco Advisers, Inc. makes no representation or warranty as to their completeness or accuracy. Although historical performance is no guarantee of future results, these insights may help you understand our investment management philosophy.
See important Fund and, if applicable, index disclosures later in this report.

Mark Paris
Portfolio Manager and Head of Portfolio Management and Trading for Invesco’s Municipal Bond Team, is manager of Invesco California Tax-Free Income Fund. He joined Invesco in 2010. Mr. Paris earned a BBA in finance from Baruch College – The City University of New York.

Jack Connelly
Portfolio Manager, is manager of Invesco California Tax-Free Income Fund. He joined Invesco in 2016. Mr. Connelly earned a BA in philosophy from Wheaton College and masters degrees from the University of Rhode Island and Yale University.

Tim O’Reilly
Portfolio Manager, is manager of Invesco California Tax-Free Income Fund. He joined Invesco in 2010. Mr. O’Reilly earned a BS in finance from Eastern Illinois University and an MBA in finance from the University of Illinois at Chicago.

James Phillips
Portfolio Manager, is manager of Invesco California Tax-Free Income Fund. He joined Invesco in 2010. Mr. Phillips earned a BA in American literature from Empire State College, the independent study division of the State University of New York, and an MBA in finance from the University at Albany, State University of New York.

Robert Stryker
Chartered Financial Analyst, Portfolio Manager, is manager of Invesco California Tax-Free Income Fund. He joined Invesco in 2010. Mr. Stryker earned a BS in finance from the University of Illinois, Chicago.

Julius Williams
Portfolio Manager, is manager of Invesco California Tax-Free Income Fund. He joined Invesco in 2010. Mr. Williams earned a BA in economics and sociology and a Master of Education degree in educational psychology from the University of Virginia.
| 5 Invesco California Tax-Free Income Fund |
Your Fund’s Long-Term Performance
Results of a $10,000 Investment – Oldest Share Class(es)
Fund and index data from 8/31/07
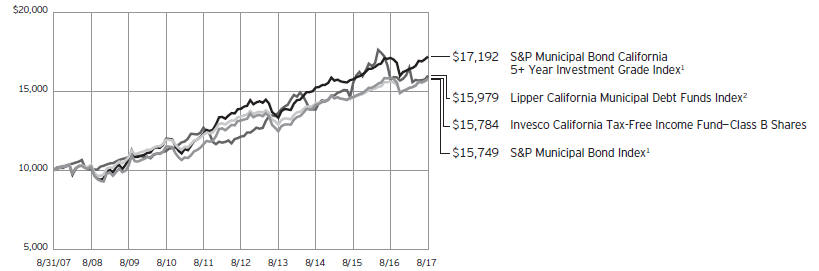
| 1 | Source: FactSet Research Systems Inc. |
| 2 | Source: Lipper Inc. |
Past performance cannot guarantee comparable future results.
The data shown in the chart include reinvested distributions, applicable sales charges and Fund expenses including management fees. Results for Class B shares are calculated as if a hypothetical
shareholder had liquidated his entire investment in the Fund at the close of the reporting period and paid the contingent deferred sales charges, if applicable. Index results include reinvested dividends, but they do not reflect sales charges. Performance of the peer group,
if applicable, reflects fund expenses and management fees; performance of a market index does not. Performance shown in the chart and table(s) does not reflect deduction of taxes a shareholder would pay on Fund distributions or sale of Fund shares.
continued from page 9
| ∎ | A direct investment cannot be made in an index. Unless otherwise indicated, index results include reinvested dividends, and they do not reflect sales charges. Performance of the peer group, if applicable, reflects fund expenses; performance of a market index does not. |
Other information
| ∎ | The returns shown in management’s discussion of Fund performance are based on net asset values (NAVs) calculated for shareholder transactions. Generally accepted accounting principles require adjustments to be made to the net assets of the Fund at period end for financial reporting purposes, and as such, the NAVs for shareholder transactions and the returns based on those NAVs may differ from the NAVs and returns reported in the Financial Highlights. |
6 Invesco California Tax-Free Income Fund
Average Annual Total Returns As of 8/31/17, including maximum applicable sales charges
|
| |||
Class A Shares | ||||
Inception (7/28/97) | 4.28 | % | ||
10 Years | 4.20 | |||
5 Years | 2.80 | |||
1 Year | -4.64 | |||
Class B Shares | ||||
Inception (7/11/84) | 6.28 | % | ||
10 Years | 4.67 | |||
5 Years | 3.39 | |||
1 Year | -5.25 | |||
Class C Shares | ||||
Inception (7/28/97) | 4.00 | % | ||
10 Years | 4.13 | |||
5 Years | 3.19 | |||
1 Year | -1.82 | |||
Class Y Shares | ||||
Inception (7/28/97) | 4.77 | % | ||
10 Years | 4.90 | |||
5 Years | 3.94 | |||
1 Year | -0.24 | |||
Class R6 Shares | ||||
10 Years | 4.66 | % | ||
5 Years | 3.72 | |||
1 Year | -0.33 | |||
Effective June 1, 2010, Class A, Class B, Class C and Class I shares of the predecessor fund, Morgan Stanley California Tax-Free Income Fund, advised by Morgan Stanley Investment Advisors Inc. were reorganized into Class A, Class B, Class C and Class Y shares, respectively, of Invesco California Tax-Free Income Fund. Returns shown above, prior to June 1, 2010, for Class A, Class B, Class C and Class Y shares are blended returns of the predecessor fund and Invesco California Tax-Free Income Fund. Share class returns will differ from the predecessor fund because of different expenses.
Class R6 shares incepted on April 4, 2017. Performance shown prior to that date is that of the Fund’s and the predecessor fund’s Class A shares and includes the 12b-1 fees applicable to Class A shares.
The performance data quoted represent past performance and cannot guarantee comparable future results; current performance may be lower or higher. Please visit invesco.com/performance for the most recent month-end performance. Performance figures reflect reinvested distributions, changes in net asset
Average Annual Total Returns As of 6/30/17, the most recent calendar quarter end, including maximum applicable sales charges
|
| |||
Class A Shares | ||||
Inception (7/28/97) | 4.25 | % | ||
10 Years | 4.00 | |||
��5 Years | 2.98 | |||
1 Year | -5.89 | |||
Class B Shares | ||||
Inception (7/11/84) | 6.06 | % | ||
10 Years | 4.48 | |||
5 Years | 3.59 | |||
1 Year | -6.43 | |||
Class C Shares | ||||
Inception (7/28/97) | 3.97 | % | ||
10 Years | 3.94 | |||
5 Years | 3.37 | |||
1 Year | -3.21 | |||
Class Y Shares | ||||
Inception (7/28/97) | 4.74 | % | ||
10 Years | 4.72 | |||
5 Years | 4.14 | |||
1 Year | -1.48 | |||
Class R6 Shares | ||||
10 Years | 4.46 | % | ||
5 Years | 3.90 | |||
1 Year | -1.69 | |||
value and the effect of the maximum sales charge unless otherwise stated. Investment return and principal value will fluctuate so that you may have a gain or loss when you sell shares.
The total annual Fund operating expense ratio set forth in the most recent Fund prospectus as of the date of this report for Class A, Class B, Class C, Class Y and Class R6 shares was 0.94%, 0.94%, 1.44%, 0.69% and 0.68%, respectively. The expense ratios presented above may vary from the expense ratios presented in other sections of this report that are based on expenses incurred during the period covered by this report.
Class A share performance reflects the maximum 4.25% sales charge, and Class B and Class C share performance reflects the applicable contingent deferred sales charge (CDSC) for the period involved. The CDSC on Class B shares declines from 5% beginning at the time of purchase to 0% at the beginning of the seventh year. The CDSC on Class C shares is 1% for the first year after purchase. Class Y and Class R6 shares do not have a front-end sales charge or a CDSC; therefore, performance is at net asset value.
The performance of the Fund’s share classes will differ primarily due to different sales charge structures and class expenses.
Fund performance reflects any applicable fee waivers and/or expense reimbursements. Had the adviser not waived fees and/or reimbursed expenses currently or in the past, returns would have been lower. See current prospectus for more information.
7 Invesco California Tax-Free Income Fund
Invesco California Tax-Free Income Fund’s investment objective is to provide a high level of current income exempt from federal and California income tax, consistent with the preservation of capital.
| ∎ | Unless otherwise stated, information presented in this report is as of August 31, 2017, and is based on total net assets. |
| ∎ | Unless otherwise noted, all data provided by Invesco. |
| ∎ | To access your Fund’s reports/prospectus, visit invesco.com/fundreports. |
About share classes
| ∎ | Class B shares may not be purchased for new or additional investments. Please see the prospectus for more information. |
| ∎ | Class Y shares are available to only certain investors. Please see the prospectus for more information. |
| ∎ | Class R6 shares are available for use by retirement plans that meet certain standards and for institutional investors. Class R6 shares are also available through intermediaries that have established an agreement with Invesco Distributors, Inc. to make such shares available for use in retail omnibus accounts. Please see the prospectus for more information. |
Principal risks of investing in the Fund
| ∎ | Alternative minimum tax risk. A portion of the Fund’s otherwise tax-exempt income may be taxable to those shareholders subject to the federal alternative minimum tax. |
| ∎ | California and US territories municipal securities risk. The Fund is more susceptible to political, economic, regulatory or other factors affecting issuers of California municipal securities than a fund which does not focus its investments in such issuers. As with California municipal securities, events in any of the territories where the Fund is invested may affect the Fund’s investments and its performance. |
| ∎ | Changing fixed income market conditions risk. The current low interest rate environment was created in part by the Federal Reserve Board (FRB) and certain foreign central banks keeping the federal funds and equivalent foreign rates near, at or below zero. Increases in the federal funds and equivalent foreign rates may expose fixed income markets to heightened volatility and reduced liquidity for certain fixed income investments, particularly those with longer maturities. In addition, decreases in fixed income dealer market-mak- |
| ing capacity may also potentially lead to heightened volatility and reduced liquidity in the fixed income markets. As a result, the value of the Fund’s investments and share price may decline. Changes in central bank policies could also result in higher than normal shareholder redemptions, which could potentially increase portfolio turnover and the Fund’s transaction costs. |
| ∎ | Debt securities risk. The prices of debt securities held by the Fund will be affected by changes in interest rates, the creditworthiness of the issuer and other factors. An increase in prevailing interest rates typically causes the value of existing debt securities to fall and often has a greater impact on longer-duration debt securities and higher quality debt securities. Falling interest rates will cause the Fund to reinvest the proceeds of debt securities that have been repaid by the issuer at lower interest rates. Falling interest rates may also reduce the Fund’s distributable income because interest payments on floating rate debt instruments held by the Fund will decline. The Fund could lose money on investments in debt securities if the issuer or borrower fails to meet its obligations to make interest payments and/or to repay principal in a timely manner. Changes in an issuer’s financial strength, the market’s perception of such strength or in the credit rating of the issuer or the security may affect the value of debt securities. The Adviser’s credit analysis may fail to anticipate such changes, which could result in buying a debt security at an inopportune time or failing to sell a debt security in advance of a price decline or other credit event. |
| ∎ | Derivatives risk. The value of a derivative instrument depends largely on (and is derived from) the value of an underlying security, currency, commodity, interest rate, index or other asset (each referred to as an underlying asset). In addition to risks relating to the underlying assets, the use of deriv- |
| atives may include other, possibly greater, risks, including counterparty, leverage and liquidity risks. Counter-party risk is the risk that the counter-party to the derivative contract will default on its obligation to pay the Fund the amount owed or otherwise perform under the derivative contract. Derivatives create leverage risk because they do not require payment up front equal to the economic exposure created by owning the derivative. As a result, an adverse change in the value of the underlying asset could result in the Fund sustaining a loss that is substantially greater than the amount invested in the derivative, which may make the Fund’s returns more volatile and increase the risk of loss. Derivative instruments may also be less liquid than more traditional investments and the Fund may be unable to sell or close out its derivative positions at a desirable time or price. This risk may be more acute under adverse market conditions, during which the Fund may be most in need of liquidating its derivative positions. Derivatives may also be harder to value, less tax efficient and subject to changing government regulation that could impact the Fund’s ability to use certain derivatives or their cost. Also, derivatives used for hedging or to gain or limit exposure to a particular market segment may not provide the expected benefits, particularly during adverse market conditions. |
| ∎ | High yield debt securities (junk bond) risk. Investments in high yield debt securities (“junk bonds”) and other lower-rated securities will subject the Fund to substantial risk of loss. These securities are considered to be speculative with respect to the issuer’s ability to pay interest and principal when due, are more susceptible to default or decline in market value and are less liquid than investment grade debt securities. Prices of high yield debt securities tend to be very volatile. |
| ∎ | Inverse floating rate obligations risk. The price of inverse floating rate obligations (inverse floaters) is expected to decline when interest rates rise, and generally will decline further than the price of a bond with a similar maturity. The price of inverse floaters is typically more volatile than the price of bonds with similar maturities. These risks can |
This report must be accompanied or preceded by a currently effective Fund prospectus, which contains more complete information, including sales charges and expenses. Investors should read it carefully before investing.
|
| NOT FDIC INSURED | MAY LOSE VALUE | NO BANK GUARANTEE |
8 Invesco California Tax-Free Income Fund
be particularly high if leverage is used in the formula that determines the interest payable by the inverse floater, which may make the Fund’s returns more volatile and increase the risk of loss. Additionally, these securities may lose some or all of their principal and, in some cases, the Fund could lose money in excess of its investment. |
| ∎ | Liquidity risk. The Fund may be unable to sell illiquid investments at the time or price it desires and, as a result, could lose its entire investment in such investments. Liquid securities can become illiquid during periods of market stress. If a significant amount of the Fund’s securities become illiquid, the Fund may not be able to timely pay redemption proceeds and may need to sell securities at significantly reduced prices. |
| ∎ | Management risk. The Fund is actively managed and depends heavily on the Adviser’s judgment about markets, interest rates or the attractiveness, relative values, liquidity, or potential appreciation of particular investments made for the Fund’s portfolio. The Fund could experience losses if these judgments prove to be incorrect. Additionally, legislative, regulatory, or tax developments may adversely affect management of the Fund and, therefore, the ability of the Fund to achieve its investment objective. |
| ∎ | Market risk. The market values of the Fund’s investments, and therefore the value of the Fund’s shares, will go up and down, sometimes rapidly or unpredictably. Market risk may affect a single issuer, industry or section of the economy, or it may affect the market as a whole. Individual stock prices tend to go up and down more dramatically than those of certain other types of investments, such as bonds. During a general downturn in the financial markets, multiple asset classes may decline in value. When markets perform well, there can be no assurance that specific investments held by the Fund will rise in value. |
| ∎ | Medium- and lower-grade municipal securities risk. Medium- and lower-grade municipal securities generally involve more volatility and greater risks, including credit, market, liquidity and management risks, than higher-grade securities. Furthermore, many issuers of medium- and lower-grade securities choose not to have a rating assigned to their obligations. As such, the Fund’s portfolio may consist of a higher portion of unrated securities than an investment company investing solely in higher-grade securities. Unrated secu- |
rities may not be as attractive to as many buyers as are rated securities, which may have the effect of limiting the Fund’s ability to sell such securities at their fair value. |
| ∎ | Money market fund risk. Although money market funds generally seek to preserve the value of an investment at $1.00 per share, the Fund may lose money by investing in money market funds. A money market fund’s sponsor has no legal obligation to provide financial support to the money market fund. The credit quality of a money market fund’s holdings can change rapidly in certain markets, and the default of a single holding could have an adverse impact on the money market fund’s share price. A money market fund’s share price can also be negatively affected during periods of high redemption pressures, illiquid markets and/or significant market volatility. Furthermore, amendments to money market fund regulations could impact a money market fund’s operations and possibly negatively impact its return. |
| ∎ | Municipal issuer focus risk. The municipal issuers in which the Fund invests may be located in the same geographic area or may pay their interest obligations from revenue of similar projects, such as hospitals, airports, utility systems and housing finance agencies. This may make the Fund’s investments more susceptible to similar social, economic, political or regulatory occurrences, making the Fund more susceptible to experience a drop in its share price than if the Fund had been more diversified across issuers that did not have similar characteristics. |
| ∎ | Municipal securities risk. The risk of a municipal obligation generally depends on the financial and credit status of the issuer. Constitutional amendments, legislative enactments, executive orders, administrative regulations, voter initiatives, and the issuer’s regional economic conditions may affect the municipal security’s value, interest payments, repayment of principal and the Fund’s ability to sell the security. Failure of a municipal security issuer to comply with applicable tax requirements may make income paid thereon taxable, resulting in a decline in the security’s value. In addition, there could be changes in applicable tax laws or tax treatments that reduce or eliminate the current federal income tax exemption on municipal securities or otherwise adversely affect the current federal or state tax status of municipal securities. |
| ∎ | Variable-rate demand notes risk. The absence of an active secondary market for certain variable and floating rate notes could make it difficult to dispose of these instruments, which could result in a loss. |
| ∎ | When-issued, delayed delivery and forward commitment risks. When-issued and delayed delivery transactions subject the Fund to market risk because the value or yield of a security at delivery may be more or less than the purchase price or yield generally available when delivery occurs, and counter-party risk because the Fund relies on the buyer or seller, as the case may be, to consummate the transaction. These transactions also have a leveraging effect on the Fund because the Fund commits to purchase securities that it does not have to pay for until a later date, which increases the Fund’s overall investment exposure and, as a result, its volatility. |
| ∎ | Zero coupon or pay-in-kind securities risk. The value, interest rates, and liquidity of non-cash paying instruments, such as zero coupon and pay-in-kind securities, are subject to greater fluctuation than other types of securities. The higher yields and interest rates on pay-in-kind securities reflect the payment deferral and increased credit risk associated with such instruments and that such investments may represent a higher credit risk than loans that periodically pay interest. |
About indexes used in this report
| ∎ | The S&P Municipal Bond Index is a broad, market value-weighted index that seeks to measure the performance of the US municipal bond market. |
| ∎ | The S&P Municipal Bond California 5+ Year Investment Grade Index is a subset of the broad S&P Municipal Bond Index. This index of market value-weighted investment grade US municipal bonds seeks to measure the performance of California-issued US municipals whose maturities are greater than or equal to five years. |
| ∎ | The Lipper California Municipal Debt Funds Index is an unmanaged index considered representative of California municipal debt funds tracked by Lipper. |
| ∎ | The Fund is not managed to track the performance of any particular index, including the index(es) described here, and consequently, the performance of the Fund may deviate significantly from the performance of the index(es). |
continued on page 6
9 Invesco California Tax-Free Income Fund
Schedule of Investments
August 31, 2017
| Interest Rate | Maturity Date | Principal Amount (000) | Value | |||||||||||||
Municipal Obligations–109.35% | ||||||||||||||||
| California–106.01% | ||||||||||||||||
ABAG Finance Authority For Non-profit Corps. (Sharp Healthcare); Series 2014 A, RB | 5.00 | % | 08/01/2043 | $ | 500 | $ | 564,820 | |||||||||
Alhambra (City of) (Atherton Baptist Homes); Series 2010 A, RB(a)(b) | 7.63 | % | 01/01/2020 | 1,575 | 1,820,590 | |||||||||||
Alhambra Elementary School District (Election of 1999); Series 1999 A, Unlimited Tax CAB GO Bonds (INS–AGM)(c)(d) | 0.00 | % | 09/01/2020 | 1,925 | 1,861,552 | |||||||||||
Anaheim (City of) Public Financing Authority (Electric System Distribution Facilities); Series 2011 A, RB | 5.38 | % | 10/01/2036 | 2,500 | 2,838,375 | |||||||||||
Antelope Valley-East Kern Water Agency; | ||||||||||||||||
Series 2016, Ref. Water RB | 5.00 | % | 06/01/2036 | 650 | 766,344 | |||||||||||
Series 2016, Ref. Water RB | 5.00 | % | 06/01/2037 | 1,000 | 1,177,290 | |||||||||||
Bakersfield (City of); Series 2007 A, Wastewater RB(a)(b) | 5.00 | % | 09/15/2017 | 2,215 | 2,218,699 | |||||||||||
Bay Area Toll Authority (San Francisco Bay Area); | ||||||||||||||||
Series 2008 F-1, Toll Bridge RB(a)(b) | 5.00 | % | 04/01/2018 | 2,500 | 2,562,974 | |||||||||||
Series 2008 F-1, Toll Bridge RB(a)(b)(e) | 5.00 | % | 04/01/2018 | 1,250 | 1,281,488 | |||||||||||
Series 2009 F-1, Toll Bridge RB(a)(b)(e) | 5.13 | % | 04/01/2019 | 1,500 | 1,602,840 | |||||||||||
Series 2009 F-1, Toll Bridge RB(a)(b)(e) | 5.25 | % | 04/01/2019 | 4,685 | 5,015,433 | |||||||||||
Series 2009 F-1, Toll Bridge RB(a)(b)(e) | 5.25 | % | 04/01/2019 | 5,205 | 5,572,109 | |||||||||||
Series 2017, Ref. Sub. Toll Bridge RB | 4.00 | % | 04/01/2037 | 1,720 | 1,848,931 | |||||||||||
Series 2017, Ref. Sub. Toll Bridge RB | 4.00 | % | 04/01/2049 | 630 | 663,321 | |||||||||||
Series 2017 F-1, Toll Bridge RB(e) | 5.00 | % | 04/01/2056 | 3,465 | 4,016,489 | |||||||||||
Bay Area Water Supply & Conservation Agency; Series 2013 A, RB | 5.00 | % | 10/01/2034 | 1,950 | 2,260,908 | |||||||||||
Beverly Hills Unified School District (Election of 2008); | ||||||||||||||||
Series 2009, Unlimited Tax CAB GO Bonds(d) | 0.00 | % | 08/01/2026 | 1,465 | 1,207,482 | |||||||||||
Series 2009, Unlimited Tax CAB GO Bonds(d) | 0.00 | % | 08/01/2032 | 3,045 | 1,944,324 | |||||||||||
Brea Olinda Unified School District; Series 2002 A, Ref. COP (INS–AGM)(c) | 5.50 | % | 08/01/2018 | 1,090 | 1,094,251 | |||||||||||
California (County of) Tobacco Securitization Agency (Alameda County Tobacco Asset Securitization Corp.); Series 2006 C, Tobacco Settlement Sub. CAB RB(d) | 0.00 | % | 06/01/2055 | 12,000 | 420,360 | |||||||||||
California (County of) Tobacco Securitization Agency (Gold Country Settlement Funding Corp.); Series 2006, Tobacco Settlement Asset-Backed CAB RB(d) | 0.00 | % | 06/01/2033 | 1,580 | 628,445 | |||||||||||
California (County of) Tobacco Securitization Agency (Los Angeles County Securitization Corp.); Series 2006, Tobacco Settlement Asset-Backed RB | 5.70 | % | 06/01/2046 | 1,030 | 1,030,051 | |||||||||||
California (State of) (Green Bonds); Series 2014, Various Purpose Unlimited Tax GO Bonds | 5.00 | % | 10/01/2037 | 3,245 | 3,830,885 | |||||||||||
California (State of) Educational Facilities Authority (Loma Linda University); Series 2017 A, Ref. RB | 5.00 | % | 04/01/2042 | 1,715 | 1,963,435 | |||||||||||
California (State of) Educational Facilities Authority (Pepperdine University); Series 2016, Ref. RB | 5.00 | % | 10/01/2049 | 1,000 | 1,176,190 | |||||||||||
California (State of) Educational Facilities Authority (Pitzer College); Series 2009, RB | 6.00 | % | 04/01/2040 | 2,000 | 2,244,820 | |||||||||||
California (State of) Educational Facilities Authority (Stanford University); Series 2007 T-1, RB(e) | 5.00 | % | 03/15/2039 | 3,190 | 4,245,252 | |||||||||||
California (State of) Educational Facilities Authority (University of Southern California); Series 2009 B, RB(a)(b)(e) | 5.25 | % | 10/01/2018 | 1,800 | 1,887,930 | |||||||||||
California (State of) Health Facilities Financing Authority (Adventist Health System West); Series 2009 A, RB(a)(b) | 5.75 | % | 09/01/2019 | 500 | 548,585 | |||||||||||
California (State of) Health Facilities Financing Authority (Catholic Healthcare West); | ||||||||||||||||
Series 2009 A, RB(a)(b) | 6.00 | % | 07/01/2019 | 500 | 546,930 | |||||||||||
Series 2011 A, RB | 5.25 | % | 03/01/2041 | 2,500 | 2,734,300 | |||||||||||
California (State of) Health Facilities Financing Authority (Cedars Sinai Medical Center); | ||||||||||||||||
Series 2015, Ref. RB | 5.00 | % | 11/15/2031 | 1,300 | 1,559,987 | |||||||||||
Series 2015, Ref. RB | 5.00 | % | 11/15/2032 | 1,250 | 1,496,887 | |||||||||||
Series 2015, Ref. RB | 5.00 | % | 11/15/2033 | 1,000 | 1,194,220 | |||||||||||
California (State of) Health Facilities Financing Authority (Cedars-Sinai Medical Center); Series 2009, RB(a)(b) | 5.00 | % | 08/15/2019 | 1,050 | 1,135,239 | |||||||||||
See accompanying Notes to Financial Statements which are an integral part of the financial statements.
10 Invesco California Tax-Free Income Fund
| Interest Rate | Maturity Date | Principal Amount (000) | Value | |||||||||||||
| California–(continued) | ||||||||||||||||
California (State of) Health Facilities Financing Authority (Children’s Hospital Los Angeles); | ||||||||||||||||
Series 2010, RB(a)(b) | 5.25 | % | 07/01/2020 | $ | 2,950 | $ | 3,310,814 | |||||||||
Series 2017 A, Ref. RB | 5.00 | % | 08/15/2047 | 1,715 | 1,937,058 | |||||||||||
California (State of) Health Facilities Financing Authority (Kaiser Permanente); Subseries 2017 A-2, RB | 4.00 | % | 11/01/2044 | 2,690 | 2,834,749 | |||||||||||
California (State of) Health Facilities Financing Authority (Lucile Salter Packard Children’s Hospital at Stanford); | ||||||||||||||||
Series 2016 B, RB | 5.00 | % | 08/15/2055 | 1,750 | 2,009,577 | |||||||||||
Series 2017, RB | 4.00 | % | 11/15/2047 | 560 | 590,727 | |||||||||||
California (State of) Health Facilities Financing Authority (Providence Health & Services); |
| |||||||||||||||
Series 2008, RB(a)(b) | 6.50 | % | 10/01/2018 | 20 | 21,244 | |||||||||||
Series 2008, RB(a)(b) | 6.50 | % | 10/01/2018 | 980 | 1,040,956 | |||||||||||
California (State of) Health Facilities Financing Authority (Scripps Health); Series 2010 A, RB | 5.00 | % | 11/15/2036 | 4,000 | 4,348,120 | |||||||||||
California (State of) Health Facilities Financing Authority (St. Joseph Health System); Series 2013 A, RB | 5.00 | % | 07/01/2037 | 1,000 | 1,139,540 | |||||||||||
California (State of) Health Facilities Financing Authority (Stanford Hospital); Series 2008 A-2, Ref. RB | 5.25 | % | 11/15/2040 | 2,000 | 2,299,240 | |||||||||||
California (State of) Health Facilities Financing Authority (Sutter Health); Series 2011 B, RB | 5.50 | % | 08/15/2026 | 1,000 | 1,128,120 | |||||||||||
California (State of) Municipal Finance Authority (American Heritage Education Foundation); |
| |||||||||||||||
Series 2016 A, Ref. RB | 5.00 | % | 06/01/2036 | 1,000 | 1,111,370 | |||||||||||
Series 2016 A, Ref. RB | 5.00 | % | 06/01/2046 | 1,140 | 1,250,751 | |||||||||||
California (State of) Municipal Finance Authority (California Baptist University); Series 2016 A, RB(f) | 5.00 | % | 11/01/2046 | 1,000 | 1,060,370 | |||||||||||
California (State of) Municipal Finance Authority (Caritas Affordable Housing, Inc.); |
| |||||||||||||||
Series 2014 A, Sr. Mobile Home Park RB | 5.25 | % | 08/15/2039 | 1,200 | 1,332,540 | |||||||||||
Series 2014 A, Sr. Mobile Home Park RB | 5.25 | % | 08/15/2049 | 1,420 | 1,566,686 | |||||||||||
California (State of) Municipal Finance Authority (Caritas Projects); Series 2012 A, Sr. Mobile Home Park RB | 5.50 | % | 08/15/2047 | 1,500 | 1,659,090 | |||||||||||
California (State of) Municipal Finance Authority (Chevron U.S.A. Inc.); Series 2010 A, VRD Recovery Zone Facility RB(g) | 0.65 | % | 11/01/2035 | 1,500 | 1,500,000 | |||||||||||
California (State of) Municipal Finance Authority (Community Medical Centers); Series 2017 A, Ref. RB | 5.00 | % | 02/01/2047 | 1,380 | 1,560,145 | |||||||||||
California (State of) Municipal Finance Authority (Eisenhower Medical Center); |
| |||||||||||||||
Series 2010 A, RB(a)(b) | 5.50 | % | 07/01/2020 | 1,000 | 1,127,790 | |||||||||||
Series 2010 A, RB(a)(b) | 5.75 | % | 07/01/2020 | 1,500 | 1,702,140 | |||||||||||
Series 2017 A, Ref. RB | 5.00 | % | 07/01/2047 | 1,000 | 1,135,290 | |||||||||||
California (State of) Municipal Finance Authority (Emerson College); Series 2011, RB | 5.75 | % | 01/01/2033 | 1,315 | 1,483,662 | |||||||||||
California (State of) Municipal Finance Authority (Touro College and University System); Series 2014 A, RB | 5.25 | % | 01/01/2034 | 620 | 683,823 | |||||||||||
California (State of) Municipal Finance Authority (University of La Verne); Series 2017 A, Ref. RB | 5.00 | % | 06/01/2043 | 600 | 695,814 | |||||||||||
California (State of) Municipal Finance Authority (University of La Verne); Series 2010 A, RB(a)(b) | 6.13 | % | 06/01/2020 | 1,000 | 1,143,060 | |||||||||||
California (State of) Pollution Control Finance Authority; Series 2012, Water Furnishing | 5.00 | % | 07/01/2037 | 3,000 | 3,232,950 | |||||||||||
California (State of) Pollution Control Financing Authority (Waste Management Inc.); Series 2015 B-1, Ref. Solid Waste Disposal RB(h) | 3.00 | % | 11/01/2025 | 1,500 | 1,578,885 | |||||||||||
California (State of) Public Works Board (Various Capital); Series 2011 A, Lease RB | 5.13 | % | 10/01/2031 | 2,000 | 2,271,620 | |||||||||||
California (State of) Public Works Board (Various Correctional Facilities); Series 2014 A, Lease RB | 5.00 | % | 09/01/2039 | 3,000 | 3,449,790 | |||||||||||
California (State of) Public Works Board (Various State Universities); Series 2013 H, Lease RB(a)(b) | 5.00 | % | 09/01/2023 | 1,000 | 1,220,860 | |||||||||||
California (State of) School Finance Authority (Alliance for College-Ready Public Schools); |
| |||||||||||||||
Series 2013 A, School Facility RB | 6.30 | % | 07/01/2043 | 840 | 959,750 | |||||||||||
Series 2015, School Facility RB(f) | 5.00 | % | 07/01/2045 | 1,265 | 1,390,324 | |||||||||||
California (State of) School Finance Authority (Aspire Public Schools); |
| |||||||||||||||
Series 2015 A, Ref. Charter School RB(f) | 5.00 | % | 08/01/2045 | 1,000 | 1,103,640 | |||||||||||
Series 2016, Ref. Charter School RB(f) | 5.00 | % | 08/01/2046 | 750 | 827,183 | |||||||||||
California (State of) School Finance Authority (Green Dot Public Schools); Series 2015 A, School Facility RB(f) | 5.00 | % | 08/01/2045 | 1,500 | 1,623,090 | |||||||||||
See accompanying Notes to Financial Statements which are an integral part of the financial statements.
11 Invesco California Tax-Free Income Fund
| Interest Rate | Maturity Date | Principal Amount (000) | Value | |||||||||||||
| California–(continued) | ||||||||||||||||
California (State of) School Finance Authority (KIPP LA); | ||||||||||||||||
Series 2015 A, Facilities RB(f) | 5.00 | % | 07/01/2045 | $ | 500 | $ | 554,590 | |||||||||
Series 2017 A, RB(f) | 5.00 | % | 07/01/2037 | 590 | 677,355 | |||||||||||
Series 2017 A, RB(f) | 5.00 | % | 07/01/2047 | 370 | 419,114 | |||||||||||
California (State of) Statewide Communities Development Authority (Adventist Health System); | ||||||||||||||||
Series 2015, Ref. RB | 5.00 | % | 03/01/2033 | 775 | 906,370 | |||||||||||
Series 2015, Ref. RB | 5.00 | % | 03/01/2045 | 2,315 | 2,617,455 | |||||||||||
California (State of) Statewide Communities Development Authority (Alliance for College-Ready Public Schools); Series 2012, School Facility RB | 6.10 | % | 07/01/2032 | 820 | 902,615 | |||||||||||
California (State of) Statewide Communities Development Authority (American Baptist Homes of the West); Series 2010, RB | 6.25 | % | 10/01/2039 | 2,000 | 2,170,000 | |||||||||||
California (State of) Statewide Communities Development Authority (California Baptist University); | ||||||||||||||||
Series 2007 A, RB | 5.40 | % | 11/01/2027 | 1,785 | 1,826,430 | |||||||||||
Series 2014 A, RB | 5.13 | % | 11/01/2023 | 715 | 783,476 | |||||||||||
California (State of) Statewide Communities Development Authority (Cottage Health System Obligated Group); Series 2010, RB | 5.25 | % | 11/01/2030 | 1,675 | 1,842,718 | |||||||||||
California (State of) Statewide Communities Development Authority (Henry Mayo Newhall Memorial Hospital); Series 2014 A, RB (INS–AGM)(c) | 5.25 | % | 10/01/2043 | 600 | 679,014 | |||||||||||
California (State of) Statewide Communities Development Authority (Huntington Memorial Hospital); Series 2014 B, Ref. RB | 5.00 | % | 07/01/2044 | 750 | 850,448 | |||||||||||
California (State of) Statewide Communities Development Authority (John Muir Health); Series 2016 A, Ref. RB | 5.00 | % | 08/15/2051 | 3,000 | 3,405,060 | |||||||||||
California (State of) Statewide Communities Development Authority (Lancer Educational Student Housing); Series 2016, Ref. RB(f) | 5.00 | % | 06/01/2046 | 1,000 | 1,043,860 | |||||||||||
California (State of) Statewide Communities Development Authority (Loma Linda University Medical Center); Series 2014, RB | 5.50 | % | 12/01/2054 | 1,500 | 1,650,195 | |||||||||||
California (State of) Statewide Communities Development Authority (Methodist Hospital); Series 2009, RB(a)(b) | 6.75 | % | 08/01/2019 | 445 | 494,938 | |||||||||||
California (State of) Statewide Communities Development Authority (Southern California Presbyterian Homes); | ||||||||||||||||
Series 2009, Senior Living RB(f) | 6.25 | % | 11/15/2019 | 1,275 | 1,339,897 | |||||||||||
Series 2009, Senior Living RB(f) | 7.25 | % | 11/15/2041 | 500 | 550,855 | |||||||||||
California (State of) Statewide Communities Development Authority (Terraces at San Joaquin Garden); Series 2012, RB | 5.63 | % | 10/01/2032 | 1,000 | 1,093,120 | |||||||||||
California (State of) Statewide Communities Development Authority (University of California — Irvine East Campus Apartments); | ||||||||||||||||
Series 2012, Ref. Student Housing RB | 5.38 | % | 05/15/2038 | 2,000 | 2,232,660 | |||||||||||
Series 2017, Student Housing RB | 5.00 | % | 05/15/2047 | 1,500 | 1,741,320 | |||||||||||
California (State of) Statewide Finance Authority (Pooled Tobacco Securitization); Series 2006 A, Tobacco Settlement CAB Turbo RB(d) | 0.00 | % | 06/01/2046 | 8,000 | 1,139,120 | |||||||||||
California (State of); | ||||||||||||||||
Series 2004 A-9, Ref. VRD Unlimited Tax GO Bonds (LOC–State Street Bank & Trust Co.)(g)(i) | 0.73 | % | 05/01/2034 | 2,285 | 2,285,000 | |||||||||||
Series 2009, Various Purpose Unlimited Tax GO Bonds | 5.75 | % | 04/01/2031 | 5,000 | 5,385,950 | |||||||||||
Series 2009, Various Purpose Unlimited Tax GO Bonds | 6.00 | % | 11/01/2035 | 1,750 | 1,937,512 | |||||||||||
Series 2009, Various Purpose Unlimited Tax GO Bonds | 6.00 | % | 04/01/2038 | 1,250 | 1,347,875 | |||||||||||
Series 2010, Unlimited Tax GO Bonds | 5.25 | % | 11/01/2040 | 3,000 | 3,382,020 | |||||||||||
Series 2011, Various Purpose Unlimited Tax GO Bonds | 5.00 | % | 09/01/2032 | 2,450 | 2,816,691 | |||||||||||
Series 2011, Various Purpose Unlimited Tax GO Bonds | 5.00 | % | 10/01/2041 | 2,500 | 2,853,825 | |||||||||||
Series 2012, Ref. Unlimited Tax GO Bonds | 5.25 | % | 02/01/2030 | 1,000 | 1,170,410 | |||||||||||
Series 2015, Unlimited Tax GO Bonds | 5.00 | % | 08/01/2045 | 1,000 | 1,164,480 | |||||||||||
Series 2017, Ref. Unlimited Tax GO Bonds | 5.00 | % | 08/01/2035 | 1,370 | 1,632,547 | |||||||||||
Series 2017, Various Purpose Unlimited Tax GO Bonds | 4.00 | % | 11/01/2047 | 1,000 | 1,068,760 | |||||||||||
Series 2017, Various Purpose Unlimited Tax GO Bonds(e) | 5.00 | % | 11/01/2047 | 3,400 | 4,032,911 | |||||||||||
See accompanying Notes to Financial Statements which are an integral part of the financial statements.
12 Invesco California Tax-Free Income Fund
| Interest Rate | Maturity Date | Principal Amount (000) | Value | |||||||||||||
| California–(continued) | ||||||||||||||||
California Infrastructure & Economic Development Bank (Academy Motion Picture Arts and Sciences Obligated Group); | ||||||||||||||||
Series 2015, Ref. RB | 5.00 | % | 11/01/2035 | $ | 1,000 | $ | 1,168,780 | |||||||||
Series 2015, Ref. RB | 5.00 | % | 11/01/2041 | 4,265 | 4,942,026 | |||||||||||
California Infrastructure & Economic Development Bank (Broad Museum); Series 2011 A, RB | 5.00 | % | 06/01/2021 | 2,000 | 2,299,800 | |||||||||||
California Infrastructure & Economic Development Bank (The Walt Disney Family Museum); | ||||||||||||||||
Series 2016, Ref. RB | 5.00 | % | 02/01/2030 | 200 | 238,668 | |||||||||||
Series 2016, Ref. RB | 5.00 | % | 02/01/2031 | 550 | 651,937 | |||||||||||
California Public Finance Authority (Henry Mayo Newhall Hospital); | ||||||||||||||||
Series 2017, Ref. RB | 5.00 | % | 10/15/2037 | 1,000 | 1,113,760 | |||||||||||
Series 2017, Ref. RB | 5.00 | % | 10/15/2047 | 1,000 | 1,096,590 | |||||||||||
California State University; | ||||||||||||||||
Series 2009 A, Systemwide RB(a)(b) | 5.25 | % | 05/01/2019 | 1,000 | 1,073,870 | |||||||||||
Series 2012 A, Systemwide RB(e) | 5.00 | % | 11/01/2037 | 6,750 | 7,845,863 | |||||||||||
Chino Basin Regional Financing Authority (Inland Empire Utilities Agency); Series 2008 A, RB(a)(b) | 5.00 | % | 11/01/2017 | 725 | 730,242 | |||||||||||
Clovis Unified School District (Election of 2004); Series 2004 A, Unlimited Tax CAB GO Bonds (INS–NATL)(c)(d) | 0.00 | % | 08/01/2029 | 735 | 523,937 | |||||||||||
East Bay Municipal Utility District; Series 2010 A, Ref. Sub. Water System RB(a)(b) | 5.00 | % | 06/01/2020 | 2,000 | 2,228,000 | |||||||||||
Eastern Municipal Water District; | ||||||||||||||||
Series 2016 A, Ref. Sub. Water and Wastewater RB | 5.00 | % | 07/01/2045 | 1,775 | 2,087,773 | |||||||||||
Series 2016 A, Ref. Water and Wastewater RB | 5.00 | % | 07/01/2033 | 1,005 | 1,209,186 | |||||||||||
Eden (Township of) Healthcare District; Series 2010, COP(a)(b) | 6.13 | % | 06/01/2020 | 1,000 | 1,142,470 | |||||||||||
El Monte Union High School District (Election of 2008); Series 2009 A, Unlimited Tax GO Bonds(a)(b) | 5.50 | % | 06/01/2019 | 1,000 | 1,081,140 | |||||||||||
El Segundo Unified School District (Election of 2008); Series 2009 A, Unlimited Tax CAB GO Bonds(d) | 0.00 | % | 08/01/2033 | 4,430 | 2,586,278 | |||||||||||
Emeryville (City of) Public Financing Authority (Alameda County); | ||||||||||||||||
Series 2014 A, Ref. Tax Allocation RB (INS–AGM)(c) | 5.00 | % | 09/01/2032 | 445 | 514,180 | |||||||||||
Series 2014 A, Ref. Tax Allocation RB (INS–AGM)(c) | 5.00 | % | 09/01/2033 | 385 | 442,989 | |||||||||||
Series 2014 A, Ref. Tax Allocation RB (INS–AGM)(c) | 5.00 | % | 09/01/2034 | 500 | 573,245 | |||||||||||
Fairfield (City of) Community Facilities District No. 3 (North Cordelia General Improvements); Series 2008, Special Tax RB | 6.00 | % | 09/01/2032 | 1,800 | 1,886,058 | |||||||||||
Fontana (City of) Public Financing Authority (North Fontana Redevelopment); Series 2003 A, Tax Allocation RB (INS–AMBAC)(c) | 5.38 | % | 09/01/2025 | 1,500 | 1,505,460 | |||||||||||
Fontana (City of) Redevelopment Agency (Downtown Redevelopment); Series 2000, Ref. Tax Allocation RB (INS–NATL)(c) | 5.00 | % | 09/01/2021 | 1,480 | 1,483,404 | |||||||||||
Foothill-Eastern Transportation Corridor Agency; Series 2015, Ref. CAB Toll Road RB (INS–AGM)(c)(d) | 0.00 | % | 01/15/2035 | 2,745 | 1,415,240 | |||||||||||
Fremont Community Facilities District No. 1 (Pacific Commons); | ||||||||||||||||
Series 2015, Ref. Special Tax RB | 5.00 | % | 09/01/2035 | 815 | 919,247 | |||||||||||
Series 2015, Ref. Special Tax RB | 5.00 | % | 09/01/2045 | 905 | 1,004,342 | |||||||||||
Fullerton (City of) Community Facilities District No. 1 (Amerige Heights); | ||||||||||||||||
Series 2012, Ref. Special Tax RB | 5.00 | % | 09/01/2026 | 1,960 | 2,236,105 | |||||||||||
Series 2012, Ref. Special Tax RB | 5.00 | % | 09/01/2032 | 1,090 | 1,217,334 | |||||||||||
Gilroy Unified School District (Election of 2008); | ||||||||||||||||
Series 2009 A, Unlimited Tax CAB GO Bonds(b)(d) | 0.00 | % | 08/01/2029 | 615 | 465,506 | |||||||||||
Series 2009 A, Unlimited Tax CAB GO Bonds(b)(d) | 0.00 | % | 08/01/2031 | 2,235 | 1,586,023 | |||||||||||
Series 2009 A, Unlimited Tax CAB GO Bonds (INS–AGC)(c)(d) | 0.00 | % | 08/01/2029 | 4,735 | 3,375,297 | |||||||||||
Series 2009 A, Unlimited Tax CAB GO Bonds (INS–AGC)(c)(d) | 0.00 | % | 08/01/2031 | 1,415 | 914,670 | |||||||||||
Glendora (City of) Public Finance Authority; Series 2003 A, Project No. One Tax Allocation RB | 5.00 | % | 09/01/2024 | 2,425 | 2,433,415 | |||||||||||
Golden State Tobacco Securitization Corp.; | ||||||||||||||||
Series 2007 A-1, Sr. Tobacco Settlement Asset-Backed RB | 5.00 | % | 06/01/2033 | 3,375 | 3,371,962 | |||||||||||
Series 2007 A-1, Sr. Tobacco Settlement Asset-Backed RB | 5.13 | % | 06/01/2047 | 4,740 | 4,720,945 | |||||||||||
Series 2013 A, Enhanced Tobacco Settlement Asset-Backed RB | 5.00 | % | 06/01/2030 | 2,000 | 2,326,580 | |||||||||||
Series 2015 A, Ref. Tobacco Settlement Asset-Backed RB | 5.00 | % | 06/01/2040 | 695 | 802,398 | |||||||||||
Series 2015 A, Ref. Tobacco Settlement Asset-Backed RB | 5.00 | % | 06/01/2045 | 1,165 | 1,338,900 | |||||||||||
Series 2017 A-1, Ref. Tobacco Settlement Asset-Backed RB | 5.00 | % | 06/01/2028 | 1,000 | 1,196,990 | |||||||||||
See accompanying Notes to Financial Statements which are an integral part of the financial statements.
13 Invesco California Tax-Free Income Fund
| Interest Rate | Maturity Date | Principal Amount (000) | Value | |||||||||||||
| California–(continued) | ||||||||||||||||
Hollister Joint Powers Financing Authority; Series 2016, Ref. Wastewater RB (INS–AGM)(c) | 5.00 | % | 06/01/2036 | $ | 1,270 | $ | 1,497,317 | |||||||||
Inglewood (City of) Redevelopment Agency (Merged Redevelopment); Series 1998 A, Ref. Tax Allocation RB (INS–AMBAC)(c) | 5.25 | % | 05/01/2023 | 1,000 | 1,103,790 | |||||||||||
Inland Empire Tobacco Securitization Authority; |
| |||||||||||||||
Series 2007 A, Tobacco Settlement RB | 4.63 | % | 06/01/2021 | 1,560 | 1,556,396 | |||||||||||
Series 2007 C-1, Asset-Backed Tobacco Settlement CAB Turbo RB(d) | 0.00 | % | 06/01/2036 | 5,000 | 1,335,750 | |||||||||||
Series 2007 C-2, Asset-Backed Tobacco Settlement CAB Turbo RB(d) | 0.00 | % | 06/01/2047 | 10,000 | 1,201,500 | |||||||||||
Irvine (City of) Community Facilities District No. 2013-3 (Great Park Improvement Area No. 1) ; |
| |||||||||||||||
Series 2014, Special Tax RB | 5.00 | % | 09/01/2044 | 445 | 489,700 | |||||||||||
Series 2014, Special Tax RB | 5.00 | % | 09/01/2049 | 445 | 488,815 | |||||||||||
Irvine Ranch Water District; Series 2016, Special Assessment RB(e) | 5.25 | % | 02/01/2046 | 4,305 | 5,226,744 | |||||||||||
Irvine Unified School District (Community Facilities District No. 06-1- Portola Springs); Series 2010, Special Tax RB | 6.70 | % | 09/01/2035 | 515 | 571,521 | |||||||||||
Irvine Unified School District (Community Facilities District No. 09-1); Series 2017 B, Special Tax RB | 5.00 | % | 09/01/2047 | 500 | 573,185 | |||||||||||
Irvine Unified School District; Series 2015, Ref. Special Tax RB (INS–BAM)(c) | 5.00 | % | 09/01/2038 | 3,500 | 4,009,985 | |||||||||||
Kern (County of) (Capital Improvments); Series 2009 A, COP(a)(b) | 5.75 | % | 02/01/2019 | 1,000 | 1,070,460 | |||||||||||
Kern (County of) Water Agency Improvement District No. 4; Series 2008 A, Water Revenue COP(a)(b) | 5.00 | % | 05/01/2018 | 1,700 | 1,748,637 | |||||||||||
Lodi (City of); |
| |||||||||||||||
Series 2007 A, Wastewater System Revenue COP(a)(b) | 5.00 | % | 10/01/2017 | 740 | 742,679 | |||||||||||
Series 2007 A, Wastewater System Revenue COP (INS–AGM)(c) | 5.00 | % | 10/01/2037 | 260 | 260,863 | |||||||||||
Long Beach (City of) Bond Finance Authority (Aquarium of the Pacific); Series 2012, Ref. RB | 5.00 | % | 11/01/2029 | 2,000 | 2,302,200 | |||||||||||
Long Beach (City of) Bond Finance Authority (Natural Gas Purchase); Series 2007 A, RB | 5.50 | % | 11/15/2032 | 2,665 | 3,379,806 | |||||||||||
Long Beach (City of) Financing Authority; Series 1992, RB (INS–AMBAC)(c) | 6.00 | % | 11/01/2017 | 3,380 | 3,403,491 | |||||||||||
Long Beach (City of); |
| |||||||||||||||
Series 2010 A, Sr. Airport RB | 5.00 | % | 06/01/2040 | 2,500 | 2,723,375 | |||||||||||
Series 2015, Marina System RB | 5.00 | % | 05/15/2045 | 1,615 | 1,776,145 | |||||||||||
Los Angeles (City of) Community Facilities District No. 4 (Playa Vista–Phase 1); Series 2014, Ref. Special Tax RB | 5.00 | % | 09/01/2031 | 600 | 679,908 | |||||||||||
Los Angeles (City of) Department of Airports (Los Angeles International Airport); |
| |||||||||||||||
Series 2010 A, Sr. RB | 5.00 | % | 05/15/2035 | 2,500 | 2,751,625 | |||||||||||
Series 2010 B, Sub. RB | 5.00 | % | 05/15/2040 | 1,000 | 1,100,650 | |||||||||||
Series 2013, RB(h) | 5.00 | % | 05/15/2043 | 3,000 | 3,333,960 | |||||||||||
Los Angeles (City of) Department of Airports; Series 2015 C, Ref. Sub. RB | 5.00 | % | 05/15/2038 | 1,000 | 1,168,850 | |||||||||||
Los Angeles (City of) Department of Water & Power; |
| |||||||||||||||
Series 2011 A, Power System RB(e) | 5.00 | % | 07/01/2022 | 1,800 | 2,077,074 | |||||||||||
Series 2011 A, Water System RB | 5.25 | % | 07/01/2039 | 1,500 | 1,707,405 | |||||||||||
Series 2016 A, Ref. Water System RB | 5.00 | % | 07/01/2041 | 2,000 | 2,354,200 | |||||||||||
Subseries 2008 A-1, Power System RB | 5.25 | % | 07/01/2038 | 2,000 | 2,072,120 | |||||||||||
Los Angeles (City of) Harbor Department; Series 2014 A, Ref. RB(h) | 5.00 | % | 08/01/2036 | 1,000 | 1,143,530 | |||||||||||
Los Angeles Community College District (Election of 2003); Series 2008 F-1, Unlimited Tax GO Bonds(a)(b)(e) | 5.00 | % | 08/01/2018 | 2,000 | 2,079,120 | |||||||||||
Los Angeles County Schools Regionalized Business Services Corp. (Los Angeles County Schools Pooled Financing Program); Series 1999 A, CAB COP (INS–AMBAC)(c)(d) | 0.00 | % | 08/01/2024 | 1,265 | 1,088,710 | |||||||||||
Los Angeles Unified School District (Election of 2004); Series 2009 I, Unlimited Tax GO Bonds (INS–AGC)(c) | 5.00 | % | 01/01/2034 | 3,000 | 3,221,700 | |||||||||||
Marin (County of) Water District Financing Authority; Series 2017, Sub. RB | 5.00 | % | 07/01/2047 | 2,225 | 2,649,463 | |||||||||||
Menifee Union School District (Election of 2008); Series 2009 C, Unlimited Tax CAB GO Bonds (INS–AGC)(c)(d) | 0.00 | % | 08/01/2035 | 940 | 499,525 | |||||||||||
Montclair (City of) Redevelopment Agency (Montclair Redevelopment Project No. V); Series 2001, Ref. Tax Allocation RB (INS–NATL)(c) | 5.00 | % | 10/01/2020 | 915 | 918,129 | |||||||||||
Montebello Unified School District (Election of 2004); Series 2009 A-1, Unlimited Tax GO | 5.25 | % | 08/01/2019 | 1,000 | 1,084,560 | |||||||||||
Moorpark Unified School District (Election of 2008); Series 2009 A, Unlimited Tax CAB GO Bonds (INS–AGC)(c)(d) | 0.00 | % | 08/01/2031 | 840 | 533,400 | |||||||||||
See accompanying Notes to Financial Statements which are an integral part of the financial statements.
14 Invesco California Tax-Free Income Fund
| Interest Rate | Maturity Date | Principal Amount (000) | Value | |||||||||||||
| California–(continued) | ||||||||||||||||
Morongo Band of Mission Indians (The) (Enterprise Casino); Series 2008 B, RB(f) | 6.50 | % | 03/01/2028 | $ | 1,000 | $ | 1,020,830 | |||||||||
Napa Valley Unified School District; Series 2016 C, Ref. Unlimited Tax GO Bonds | 5.00 | % | 08/01/2041 | 2,000 | 2,378,020 | |||||||||||
National City (City of) Community Development Commission (National City Redevelopment); Series 2011, Tax Allocation RB | 7.00 | % | 08/01/2032 | 1,500 | 1,818,870 | |||||||||||
Norco (City of) Financing Authority; Series 2009, Ref. Enterprise RB (INS–AGM)(c) | 5.63 | % | 10/01/2034 | 1,000 | 1,085,200 | |||||||||||
Northern California Transmission Agency (California-Oregon Transmission); Series 2016, Ref. RB | 5.00 | % | 05/01/2038 | 1,250 | 1,466,575 | |||||||||||
Oakland Unified School District (County of Alameda); Series 2015 A, Unlimited Tax GO Bonds | 5.00 | % | 08/01/2040 | 1,070 | 1,253,484 | |||||||||||
Orange (County of) Community Facilities District No. 2015-1 (Esencia Village); |
| |||||||||||||||
Series 2015 A, Special Tax RB | 5.00 | % | 08/15/2035 | 125 | 141,490 | |||||||||||
Series 2015 A, Special Tax RB | 5.25 | % | 08/15/2045 | 615 | 696,002 | |||||||||||
Orange (County of) Community Facilities District No. 2016-1 (Esencia Village); Series 2016 A, Special Tax RB | 5.00 | % | 08/15/2046 | 2,000 | 2,248,540 | |||||||||||
Palomar Pomerado Health; Series 2009, COP(a)(b) | 6.75 | % | 11/01/2019 | 2,000 | 2,254,140 | |||||||||||
Pittsburg Unified School District (Election of 2006); Series 2009 B, Unlimited Tax GO Bonds(a)(b) | 5.50 | % | 08/01/2018 | 1,000 | 1,043,450 | |||||||||||
Pomona (City of) Public Financing Authority (Merged Redevelopment); Series 2007 AW, Sub. RB | 5.13 | % | 02/01/2033 | 1,075 | 1,076,172 | |||||||||||
Port Hueneme (City of) (Capital Improvement Program); Series 1992, Ref. COP (INS–NATL)(c) | 6.00 | % | 04/01/2019 | 445 | 465,746 | |||||||||||
Rancho Cordova (City of) Community Facilities District No. 2003-1 (Sunridge Anatolia); Series 2012, Ref. Special Tax RB | 5.00 | % | 09/01/2027 | 1,000 | 1,113,330 | |||||||||||
Redding (City of) Redevelopment Agency (Canby-Hilltop-Cypress Redevelopment); Series 2003 A, Tax Allocation RB (INS–NATL)(c) | 5.00 | % | 09/01/2023 | 1,400 | 1,404,648 | |||||||||||
Regents of the University of California; |
| |||||||||||||||
Series 2009 O, General RB(a)(b)(e) | 5.75 | % | 05/15/2019 | 705 | 764,312 | |||||||||||
Series 2009 O, General RB(a)(b)(e) | 5.75 | % | 05/15/2019 | 1,050 | 1,138,337 | |||||||||||
Series 2016 L, Ref. Medical Center Pooled RB(e) | 5.00 | % | 05/15/2041 | 3,420 | 3,986,078 | |||||||||||
Riverside (City of); |
| |||||||||||||||
Series 2008 B, Water RB (INS–AGM)(c) | 5.00 | % | 10/01/2033 | 1,000 | 1,044,290 | |||||||||||
Series 2008 D, Electric RB (INS–AGM)(c) | 5.00 | % | 10/01/2038 | 1,800 | 1,872,738 | |||||||||||
Riverside (County of) Community Facilities District No. 07-2 (Clinton Keith); Series 2015, Special Tax Bonds | 5.00 | % | 09/01/2044 | 1,000 | 1,095,350 | |||||||||||
Riverside (County of) Public Financing Authority (Desert Communities and Interstate 215 Corridor); |
| |||||||||||||||
Series 2017 A, Ref. Tax Allocation RB (INS–BAM)(c) | 5.00 | % | 10/01/2034 | 1,000 | 1,192,080 | |||||||||||
Series 2017 A, Ref. Tax Allocation RB (INS–BAM)(c) | 4.00 | % | 10/01/2040 | 500 | 534,675 | |||||||||||
Riverside (County of) Transportation Commission; Series 2010 A, Limited Sales Tax RB | 5.00 | % | 06/01/2032 | 1,500 | 1,654,935 | |||||||||||
RNR School Financing Authority (Community Facilities District No. 92-1); Series 2017 A, Special Tax RB (INS–BAM)(c) | 5.00 | % | 09/01/2041 | 1,610 | 1,860,951 | |||||||||||
Romoland School District Community Facilities No. 2004-1; Series 2015, Ref. Special Tax Bonds | 5.00 | % | 09/01/2038 | 1,000 | 1,120,170 | |||||||||||
Sacramento (County of); |
| |||||||||||||||
Series 2008 A, Sr. Airport System RB(a)(b) | 5.00 | % | 07/01/2018 | 1,015 | 1,051,195 | |||||||||||
Series 2008 A, Sr. Airport System RB (INS–AGM)(c) | 5.00 | % | 07/01/2032 | 1,000 | 1,031,440 | |||||||||||
Series 2010, Sr. Airport System RB | 5.00 | % | 07/01/2040 | 2,200 | 2,404,424 | |||||||||||
San Buenaventura (City of) (Community Memorial Health System); Series 2011, RB | 7.50 | % | 12/01/2041 | 2,000 | 2,340,800 | |||||||||||
San Diego (City of) Public Facilities Financing Authority (Ballpark Refunding); Series 2016, Ref. Lease RB | 5.00 | % | 10/15/2031 | 1,525 | 1,825,928 | |||||||||||
San Diego (City of) Public Facilities Financing Authority; |
| |||||||||||||||
Series 2016 A, Ref. Sr. Sewer RB | 5.00 | % | 05/15/2039 | 1,565 | 1,859,893 | |||||||||||
Series 2016 B, Ref. Sub. Water RB | 5.00 | % | 08/01/2036 | 1,500 | 1,787,460 | |||||||||||
Subseries 2012 A, Ref. Water RB | 5.00 | % | 08/01/2032 | 2,215 | 2,575,580 | |||||||||||
San Diego (City of) Regional Building Authority (County Operations Center); Series 2016 A, Ref. RB | 5.00 | % | 10/15/2034 | 1,500 | 1,772,850 | |||||||||||
San Diego (County of) Regional Airport Authority; |
| |||||||||||||||
Series 2017 B, Sub. Airport RB(h) | 5.00 | % | 07/01/2037 | 1,000 | 1,170,110 | |||||||||||
Series 2017 B, Sub. Airport RB(h) | 5.00 | % | 07/01/2047 | 1,500 | 1,735,785 | |||||||||||
San Diego (County of) Regional Transportation Commission; Series 2014 A, Sales & Use Tax RB(e) | 5.00 | % | 04/01/2048 | 2,980 | 3,462,969 | |||||||||||
San Diego Community College District (Election of 2002); Series 2009, Unlimited Tax GO | 5.25 | % | 08/01/2019 | 1,500 | 1,626,840 | |||||||||||
See accompanying Notes to Financial Statements which are an integral part of the financial statements.
15 Invesco California Tax-Free Income Fund
| Interest Rate | Maturity Date | Principal Amount (000) | Value | |||||||||||||
| California–(continued) | ||||||||||||||||
San Diego Community College District (Election of 2006); Series 2011, Unlimited Tax GO Bonds(a)(b) | 5.00 | % | 08/01/2021 | $ | 2,500 | $ | 2,888,875 | |||||||||
San Diego Unified School District; Series 2012 R-2, Ref. Unlimited Tax Conv. CAB GO Bonds(j) | 6.63 | % | 07/01/2041 | 1,250 | 1,021,000 | |||||||||||
San Francisco (City & County of) Airport Commission (San Francisco International Airport); | ||||||||||||||||
Series 2009 E, Second Series RB | 6.00 | % | 05/01/2039 | 1,000 | 1,084,290 | |||||||||||
Series 2011 C, Ref. Second Series RB(h) | 5.00 | % | 05/01/2023 | 5,000 | 5,662,850 | |||||||||||
Series 2011 G, Ref. Second Series Government Loan Program RB(a)(b) | 5.25 | % | 05/03/2021 | 1,450 | 1,676,722 | |||||||||||
Series 2011 G, Ref. Second Series Government Loan Program RB | 5.25 | % | 05/01/2028 | �� | 550 | 631,015 | ||||||||||
San Francisco (City & County of) Public Utilities Commission (Water System Improvement Program); Subseries 2011 A, Water RB | 5.00 | % | 11/01/2036 | 4,000 | 4,586,880 | |||||||||||
San Francisco (City & County of) Redevelopment Financing Authority (Mission Bay North Redevelopment); Series 2011 C, Tax Allocation RB(a)(b) | 6.75 | % | 02/01/2021 | 1,000 | 1,196,750 | |||||||||||
San Francisco (City & County of) Redevelopment Financing Authority (Mission Bay South Redevelopment); Series 2011 D, Tax Allocation RB(a)(b) | 7.00 | % | 02/01/2021 | 500 | 602,385 | |||||||||||
San Francisco (City & County of) Successor Agency to the Redevelopment Agency (Mission Bay South Redevelopment); | ||||||||||||||||
Series 2014 A, Tax Allocation RB | 5.00 | % | 08/01/2043 | 1,060 | 1,196,454 | |||||||||||
Series 2016 B, Tax Allocation RB (INS–NATL)(c) | 5.00 | % | 08/01/2043 | 2,100 | 2,422,854 | |||||||||||
Series 2016 C, Ref. Tax Allocation RB (INS–NATL)(c) | 5.00 | % | 08/01/2041 | 590 | 681,208 | |||||||||||
San Francisco (City & County of) Successor Agency to the Redevelopment Agency Community Facilities District No. 6 (Mission Bay South Public Improvements); Series 2013 A, Ref. Special Tax RB | 5.00 | % | 08/01/2033 | 500 | 550,550 | |||||||||||
San Francisco (City of) Bay Area Rapid Transit District (Election of 2016 Green Bond); Series 2017 A-1, Unlimited Tax GO Bonds(e) | 5.00 | % | 08/01/2047 | 3,425 | 4,116,165 | |||||||||||
San Francisco (City of) Bay Area Rapid Transit District; | ||||||||||||||||
Series 2012 A, RB | 5.00 | % | 07/01/2036 | 1,000 | 1,158,540 | |||||||||||
Series 2015 A, Ref. RB | 5.00 | % | 07/01/2032 | 1,500 | 1,798,260 | |||||||||||
San Joaquin Hills Transportation Corridor Agency; | ||||||||||||||||
Series 2014 A, Ref. Sr. Lien Toll Road RB | 5.00 | % | 01/15/2044 | 1,730 | 1,922,912 | |||||||||||
Series 2014 B, Ref. Jr. Lien Toll Road RB | 5.25 | % | 01/15/2044 | 2,000 | 2,199,960 | |||||||||||
San Jose Evergreen Community College District (Election of 2004); Series 2008 B, Unlimited Tax CAB GO Bonds (INS–AGM)(c)(d) | 0.00 | % | 09/01/2031 | 3,110 | 2,041,342 | |||||||||||
San Luis Obispo (County of) Financing Authority (Lopez Dam Improvement); Series 2011 A, Ref. RB (INS–AGM)(c) | 5.00 | % | 08/01/2030 | 1,500 | 1,679,565 | |||||||||||
San Mateo (City of) Foster School District (Election 2008); Series 2010, Unlimited Tax Conv. CAB GO Bonds(j) | 6.63 | % | 08/01/2042 | 510 | 445,908 | |||||||||||
Santa Clara (County of) Financing Authority (Multiple Facilities); Series 2008 L, Ref. Lease RB(a)(b) | 5.25 | % | 05/15/2018 | 3,000 | 3,096,900 | |||||||||||
Santa Margarita Water District (Community Facilities District No. 2013-1); | ||||||||||||||||
Series 2013, Special Tax RB | 5.63 | % | 09/01/2036 | 1,000 | 1,133,960 | |||||||||||
Series 2013, Special Tax RB | 5.63 | % | 09/01/2043 | 1,000 | 1,122,350 | |||||||||||
Santaluz Community Facilities District No. 2 (Improvement Area No. 1); | ||||||||||||||||
Series 2011 A, Ref. Special Tax RB | 5.00 | % | 09/01/2028 | 825 | 904,035 | |||||||||||
Series 2011 A, Ref. Special Tax RB | 5.00 | % | 09/01/2029 | 715 | 781,023 | |||||||||||
Series 2011 A, Ref. Special Tax RB | 5.10 | % | 09/01/2030 | 465 | 508,770 | |||||||||||
Silicon Valley Tobacco Securitization Authority (Santa Clara); Series 2007 A, Tobacco Settlement CAB Turbo RB(d) | 0.00 | % | 06/01/2036 | 4,000 | 1,399,520 | |||||||||||
Simi Valley Unified School District (Election of 2004); | ||||||||||||||||
Series 2007 C, Unlimited Tax CAB GO Bonds (INS–AGM)(c)(d) | 0.00 | % | 08/01/2028 | 3,480 | 2,590,895 | |||||||||||
Series 2007 C, Unlimited Tax CAB GO Bonds (INS–AGM)(c)(d) | 0.00 | % | 08/01/2030 | 2,765 | 1,887,168 | |||||||||||
South Orange (County of) Public Financing Authority (Ladera Ranch); Series 2014 A, Ref. Sr. Lien Special Tax RB | 5.00 | % | 08/15/2034 | 895 | 985,690 | |||||||||||
Southern California Metropolitan Water District; Series 2009 B, Ref. RB(e) | 5.00 | % | 07/01/2027 | 8,585 | 9,237,374 | |||||||||||
Southern California Public Power Authority (Milford Wind Corridor Phase II); | ||||||||||||||||
Series 2011 1, RB(e) | 5.25 | % | 07/01/2031 | 2,100 | 2,421,531 | |||||||||||
Series 2011-1, RB(e) | 5.25 | % | 07/01/2029 | 2,100 | 2,426,655 | |||||||||||
See accompanying Notes to Financial Statements which are an integral part of the financial statements.
16 Invesco California Tax-Free Income Fund
| Interest Rate | Maturity Date | Principal Amount (000) | Value | |||||||||||||
| California–(continued) | ||||||||||||||||
Southern California Tobacco Securitization Authority (San Diego County Tobacco Asset Securitization Corp.); | ||||||||||||||||
Series 2006 A-1, Sr. Tobacco Settlement Asset-Backed RB | 5.00 | % | 06/01/2037 | $ | 860 | $ | 859,914 | |||||||||
Series 2006 A-1, Sr. Tobacco Settlement Asset-Backed RB | 5.13 | % | 06/01/2046 | 3,840 | 3,839,770 | |||||||||||
Temecula (City of) Redevelopment Agency (Temecula Redevelopment Project No. 1); Series 2002, Tax Allocation RB (INS–NATL)(c) | 5.13 | % | 08/01/2027 | 2,150 | 2,180,358 | |||||||||||
Tustin (City of) Public Financing Authority; Series 2011 A, Water RB(a)(b) | 5.00 | % | 04/01/2021 | 1,000 | 1,144,250 | |||||||||||
Tustin Unified School District (Community Facilities District No. 97-1); Series 2015, Ref. Special Tax RB (INS–BAM)(c) | 5.00 | % | 09/01/2038 | 3,000 | 3,421,650 | |||||||||||
Val Verde Unified School District; Series 2009 A, Ref. COP (INS–AGC)(c) | 5.13 | % | 03/01/2036 | 1,475 | 1,553,426 | |||||||||||
Walnut (City of) Energy Center Authority; Series 2010 A, Ref. RB | 5.00 | % | 01/01/2035 | 3,000 | 3,234,060 | |||||||||||
West Contra Costa Unified School District; Series 2005, Unlimited Tax CAB GO Bonds | 0.00 | % | 08/01/2025 | 2,500 | 2,108,725 | |||||||||||
Western Riverside (County of) Water & Wastewater Financing Authority (Eastern Municipal Water District Improvement); Series 2009, RB (INS–AGC)(c) | 5.63 | % | 09/01/2039 | 1,000 | 1,078,300 | |||||||||||
Whittier (City of) (Presbyterian Intercommunity Hospital, Inc.); Series 2014, Health Facility RB | 5.00 | % | 06/01/2044 | 1,500 | 1,660,755 | |||||||||||
Yosemite Community College District (Election of 2004); Series 2008 C, Unlimited Tax CAB GO Bonds (INS–AGM)(c)(d) | 0.00 | % | 08/01/2024 | 4,685 | 4,112,960 | |||||||||||
| 469,598,204 | ||||||||||||||||
| Guam–1.90% | ||||||||||||||||
Guam (Territory of) (Section 30); | ||||||||||||||||
Series 2009 A, Limited Obligation RB(a)(b) | 5.38 | % | 12/01/2019 | 1,000 | 1,099,400 | |||||||||||
Series 2009 A, Limited Obligation RB(a)(b) | 5.63 | % | 12/01/2019 | 660 | 729,267 | |||||||||||
Series 2016 A, Ref. Limited Obligation RB | 5.00 | % | 12/01/2034 | 1,000 | 1,126,020 | |||||||||||
Series 2016 A, Ref. Limited Obligation RB | 5.00 | % | 12/01/2046 | 1,750 | 1,926,733 | |||||||||||
Guam (Territory of) International Airport Authority; Series 2013 C, General RB(h) | 6.25 | % | 10/01/2034 | 1,000 | 1,132,730 | |||||||||||
Guam (Territory of) Waterworks Authority; Series 2014 A, Ref. Water & Wastewater System RB | 5.00 | % | 07/01/2035 | 765 | 836,114 | |||||||||||
Guam (Territory of); Series 2011 A, Business Privilege Tax RB | 5.13 | % | 01/01/2042 | 1,500 | 1,572,840 | |||||||||||
| 8,423,104 | ||||||||||||||||
| Virgin Islands–1.44% | ||||||||||||||||
Virgin Islands (Government of) Port Authority; | ||||||||||||||||
Series 2014 A, Ref. Marine RB(h) | 5.00 | % | 09/01/2029 | 1,645 | 1,750,247 | |||||||||||
Series 2014 A, Ref. RB(h) | 5.00 | % | 09/01/2033 | 1,500 | 1,577,235 | |||||||||||
Virgin Islands (Government of) Public Finance Authority (Matching Fund Loan Note — Diageo); Series 2009 A, Sub. RB | 6.63 | % | 10/01/2029 | 1,310 | 1,023,595 | |||||||||||
Virgin Islands (Government of) Public Finance Authority (Matching Fund Loan Note); Series 2010 A, Sr. Lien RB | 5.00 | % | 10/01/2029 | 1,200 | 941,232 | |||||||||||
Virgin Islands (Government of) Public Finance Authority; Series 2015, RB(f) | 5.00 | % | 09/01/2033 | 1,000 | 1,105,350 | |||||||||||
| 6,397,659 | ||||||||||||||||
TOTAL INVESTMENTS IN SECURITIES(k)–109.35% (Cost $448,759,319) | 484,418,967 | |||||||||||||||
FLOATING RATE NOTE OBLIGATIONS–(10.25)% | ||||||||||||||||
Notes with interest and fee rates ranging from 1.31% to 1.36% at 08/31/2017 and contractual maturities of collateral ranging from 07/01/2022 to 04/01/2056 (See Note 1J)(l) | (45,420,000 | ) | ||||||||||||||
OTHER ASSETS LESS LIABILITIES–0.90% | 3,971,748 | |||||||||||||||
NET ASSETS–100.00% | $ | 442,970,715 | ||||||||||||||
Investment Abbreviations:
| AGC | – Assured Guaranty Corp. | |
| AGM | – Assured Guaranty Municipal Corp. | |
| AMBAC | – American Municipal Bond Assurance Corp. | |
| BAM | – Build America Mutual Assurance Co. | |
| CAB | – Capital Appreciation Bonds | |
| Conv. | – Convertible |
| COP | – Certificates of Participation | |
| GO | – General Obligation | |
| INS | – Insurer | |
| Jr. | – Junior | |
| LOC | – Letter of Credit | |
| NATL | – National Public Finance Guarantee Corp. |
| RB | – Revenue Bonds | |
| Ref. | – Refunding | |
| Sr. | – Senior | |
| Sub. | – Subordinated | |
| VRD | – Variable Rate Demand |
See accompanying Notes to Financial Statements which are an integral part of the financial statements.
17 Invesco California Tax-Free Income Fund
Notes to Schedule of Investments:
| (a) | Security has an irrevocable call by the issuer or mandatory put by the holder. Maturity date reflects such call or put. |
| (b) | Advance refunded; secured by an escrow fund of U.S. Government obligations or other highly rated collateral. |
| (c) | Principal and/or interest payments are secured by the bond insurance company listed. |
| (d) | Zero coupon bond issued at a discount. |
| (e) | Underlying security related to TOB Trusts entered into by the Fund. See Note 1J. |
| (f) | Security purchased or received in a transaction exempt from registration under the Securities Act of 1933, as amended (the “1933 Act”). The security may be resold pursuant to an exemption from registration under the 1933 Act, typically to qualified institutional buyers. The aggregate value of these securities at August 31, 2017 was $15,949,408, which represented 3.60% of the Fund’s Net Assets. |
| (g) | Demand security payable upon demand by the Fund at specified time intervals no greater than thirteen months. Interest rate is redetermined periodically based on current market interest rates. Rate shown is the rate in effect on August 31, 2017. |
| (h) | Security subject to the alternative minimum tax. |
| (i) | Principal and interest payments are fully enhanced by a letter of credit from the bank listed or a predecessor bank, branch or subsidiary. |
| (j) | Convertible CAB. The interest rate shown represents the coupon rate at which the bond will accrue at a specified future date. |
| (k) | This table provides a listing of those entities that have either issued, guaranteed, backed or otherwise enhanced the credit quality of more than 5% of the securities held in the portfolio. In instances where the entity has guaranteed, backed or otherwise enhanced the credit quality of a security, it is not primarily responsible for the issuer’s obligations but may be called upon to satisfy the issuer’s obligations. |
| Entity | Percentage | |||
Assured Guaranty Municipal Corp. | 5.3 | % | ||
| (l) | Floating rate note obligations related to securities held. The interest and fee rates shown reflect the rates in effect at August 31, 2017. At August 31, 2017, the Fund’s investments with a value of $74,063,513 are held by TOB Trusts and serve as collateral for the $45,420,000 in the floating rate note obligations outstanding at that date. |
See accompanying Notes to Financial Statements which are an integral part of the financial statements.
18 Invesco California Tax-Free Income Fund
Statement of Assets and Liabilities
August 31, 2017
Assets: | ||||
Investments in securities, at value (Cost $448,759,319) | $ | 484,418,967 | ||
Receivable for: | ||||
Investments sold | 5,013,863 | |||
Fund shares sold | 1,646,448 | |||
Interest | 5,646,246 | |||
Investment for trustee deferred compensation and retirement plans | 63,295 | |||
Other assets | 52,091 | |||
Total assets | 496,840,910 | |||
Liabilities: | ||||
Floating rate note obligations | 45,420,000 | |||
Payable for: | ||||
Investments purchased | 6,817,663 | |||
Dividends | 533,578 | |||
Fund shares reacquired | 447,028 | |||
Amount due custodian | 267,011 | |||
Accrued fees to affiliates | 186,979 | |||
Accrued trustees’ and officers’ fees and benefits | 3,865 | |||
Accrued other operating expenses | 71,433 | |||
Trustee deferred compensation and retirement plans | 122,638 | |||
Total liabilities | 53,870,195 | |||
Net assets applicable to shares outstanding | $ | 442,970,715 | ||
Net assets consist of: | ||||
Shares of beneficial interest | $ | 426,755,643 | ||
Undistributed net investment income | 1,095,593 | |||
Undistributed net realized gain (loss) | (20,540,169 | ) | ||
Net unrealized appreciation | 35,659,648 | |||
| $ | 442,970,715 | |||
Net Assets: | ||||
Class A | $ | 338,903,593 | ||
Class B | $ | 6,347,840 | ||
Class C | $ | 52,424,198 | ||
Class Y | $ | 45,284,912 | ||
Class R6 | $ | 10,172 | ||
Shares outstanding, no par value, |
| |||
Class A | 27,964,672 | |||
Class B | 518,904 | |||
Class C | 4,299,045 | |||
Class Y | 3,722,570 | |||
Class R6 | 836 | |||
Class A: | ||||
Net asset value per share | $ | 12.12 | ||
Maximum offering price per share | ||||
(Net asset value of $12.12 ¸ 95.75%) | $ | 12.66 | ||
Class B: | ||||
Net asset value and offering price per share | $ | 12.23 | ||
Class C: | ||||
Net asset value and offering price per share | $ | 12.19 | ||
Class Y: | ||||
Net asset value and offering price per share | $ | 12.16 | ||
Class R6: | ||||
Net asset value and offering price per share | $ | 12.17 | ||
See accompanying Notes to Financial Statements which are an integral part of the financial statements.
19 Invesco California Tax-Free Income Fund
Statement of Operations
For the year ended August 31, 2017
Investment income: |
| |||
Interest | $ | 20,654,116 | ||
Other income | 32,080 | |||
Total investment income | 20,686,196 | |||
Expenses: | ||||
Advisory fees | 2,059,680 | |||
Administrative services fees | 117,848 | |||
Distribution fees: | ||||
Class A | 824,012 | |||
Class B | 23,489 | |||
Class C | 393,835 | |||
Interest, facilities and maintenance fees | 630,412 | |||
Transfer agent fees — A, B, C & Y | 288,746 | |||
Transfer agent fees — R6 | 4 | |||
Trustees’ and officers’ fees and benefits | 26,933 | |||
Registration and filing fees | 65,255 | |||
Reports to shareholders | 59,978 | |||
Professional services fees | 72,143 | |||
Other | 50,814 | |||
Total expenses | 4,613,149 | |||
Less: Expense offset arrangement(s) | (505 | ) | ||
Net expenses | 4,612,644 | |||
Net investment income | 16,073,552 | |||
Realized and unrealized gain (loss) from: | ||||
Net realized gain (loss) from investment securities | (1,881,826 | ) | ||
Change in net unrealized appreciation (depreciation) of investment securities | (17,490,240 | ) | ||
Net realized and unrealized gain (loss) | (19,372,066 | ) | ||
Net increase (decrease) in net assets resulting from operations | $ | (3,298,514 | ) | |
See accompanying Notes to Financial Statements which are an integral part of the financial statements.
20 Invesco California Tax-Free Income Fund
Statement of Changes in Net Assets
For the years ended August 31, 2017 and 2016
| 2017 | 2016 | |||||||
Operations: | ||||||||
Net investment income | $ | 16,073,552 | $ | 15,194,150 | ||||
Net realized gain (loss) | (1,881,826 | ) | 219,635 | |||||
Change in net unrealized appreciation (depreciation) | (17,490,240 | ) | 17,473,921 | |||||
Net increase (decrease) in net assets resulting from operations | (3,298,514 | ) | 32,887,706 | |||||
Distributions to shareholders from net investment income: | ||||||||
Class A | (12,411,601 | ) | (12,088,642 | ) | ||||
Class B | (348,286 | ) | (527,646 | ) | ||||
Class C | (1,688,648 | ) | (1,242,629 | ) | ||||
Class Y | (1,609,659 | ) | (1,115,568 | ) | ||||
Class R6 | (171 | ) | — | |||||
Total distributions from net investment income | (16,058,365 | ) | (14,974,485 | ) | ||||
Share transactions–net: | ||||||||
Class A | 222,451 | 38,109,178 | ||||||
Class B | (5,768,586 | ) | (3,093,170 | ) | ||||
Class C | (2,219,476 | ) | 27,128,597 | |||||
Class Y | 7,794,247 | 14,173,625 | ||||||
Class R6 | 10,000 | — | ||||||
Net increase in net assets resulting from share transactions | 38,636 | 76,318,230 | ||||||
Net increase (decrease) in net assets | (19,318,243 | ) | 94,231,451 | |||||
Net assets: | ||||||||
Beginning of year | 462,288,958 | 368,057,507 | ||||||
End of year (includes undistributed net investment income of $1,095,593 and $1,374,790, respectively) | $ | 442,970,715 | $ | 462,288,958 | ||||
Notes to Financial Statements
August 31, 2017
NOTE 1—Significant Accounting Policies
Invesco California Tax-Free Income Fund (the “Fund”) is a series portfolio of AIM Counselor Series Trust (Invesco Counselor Series Trust)(the “Trust”). The Trust is a Delaware statutory trust registered under the Investment Company Act of 1940, as amended (the “1940 Act”), as an open-end series management investment company consisting of fourteen separate portfolios, each authorized to issue an unlimited number of shares of beneficial interest. The assets, liabilities and operations of each portfolio are accounted for separately. Information presented in these financial statements pertains only to the Fund. Matters affecting each portfolio or class will be voted on exclusively by the shareholders of such portfolio or class.
The Fund’s investment objective is to provide a high level of current income exempt from federal and California income tax, consistent with the preservation of capital.
The Fund currently consists of five different classes of shares: Class A, Class B, Class C, Class Y and Class R6. On April 4, 2017, the Fund began offering Class R6 shares. Class Y shares are available only to certain investors. Class A shares are sold with a front-end sales charge unless certain waiver criteria are met and under certain circumstances load waived shares may be subject to contingent deferred sales charges (“CDSC”). Class C shares are sold with a CDSC. Class Y and Class R6 shares are sold at net asset value. Effective November 30, 2010, new or additional investments in Class B shares are no longer permitted. Existing shareholders of Class B shares may continue to reinvest dividends and capital gains distributions in Class B shares until they convert to Class A shares. Also, shareholders in Class B shares will be able to exchange those shares for Class B shares of other Invesco Funds offering such shares until they convert to Class A shares. Generally, Class B shares will automatically convert to Class A shares on or about the month-end, which is at least eight years after the date of purchase. Redemption of Class B shares prior to the conversion date will be subject to a CDSC.
The Fund is an investment company and accordingly follows the investment company accounting and reporting guidance in accordance with Financial Accounting Standards Board Accounting Standards Codification Topic 946, Financial Services — Investment Companies.
The following is a summary of the significant accounting policies followed by the Fund in the preparation of its financial statements.
| A. | Security Valuations — Securities, including restricted securities, are valued according to the following policy. |
Securities are fair valued using an evaluated quote provided by an independent pricing service approved by the Board of Trustees. Evaluated quotes provided by the pricing service may be determined without exclusive reliance on quoted prices, and may reflect appropriate factors such as institution-size trading in similar groups of securities, developments related to specific securities, dividend rate (for unlisted equities), yield (for debt obligations), quality, type of issue, coupon rate (for debt obligations), maturity (for debt obligations), individual trading characteristics and other market data.
21 Invesco California Tax-Free Income Fund
Pricing services generally value debt obligations assuming orderly transactions of institutional round lot size, but a Fund may hold or transact in the same securities in smaller, odd lot sizes. Odd lots often trade at lower prices than institutional round lots. Debt obligations are subject to interest rate and credit risks. In addition, all debt obligations involve some risk of default with respect to interest and/or principal payments.
Securities for which market quotations either are not readily available or became unreliable are valued at fair value as determined in good faith by or under the supervision of the Trust’s officers following procedures approved by the Board of Trustees. Some of the factors which may be considered in determining fair value are fundamental analytical data relating to the investment; the nature and duration of any restrictions on transferability or disposition; trading in similar securities by the same issuer or comparable companies; relevant political, economic or issuer specific news; and other relevant factors under the circumstances.
The Fund may invest in securities that are subject to interest rate risk, meaning the risk that the prices will generally fall as interest rates rise and, conversely, the prices will generally rise as interest rates fall. Specific securities differ in their sensitivity to changes in interest rates depending on their individual characteristics. Changes in interest rates may result in increased market volatility, which may affect the value and/or liquidity of certain Fund investments.
Valuations change in response to many factors including the historical and prospective earnings of the issuer, the value of the issuer’s assets, general economic conditions, interest rates, investor perceptions and market liquidity. Because of the inherent uncertainties of valuation, the values reflected in the financial statements may materially differ from the value received upon actual sale of those investments.
| B. | Securities Transactions and Investment Income — Securities transactions are accounted for on a trade date basis. Realized gains or losses on sales are computed on the basis of specific identification of the securities sold. Interest income (net of withholding tax, if any) is recorded on the accrual basis from settlement date. Bond premiums and discounts are amortized and/or accreted over the lives of the respective securities. Dividend income (net of withholding tax, if any) is recorded on the ex-dividend date. |
The Fund may periodically participate in litigation related to Fund investments. As such, the Fund may receive proceeds from litigation settlements. Any proceeds received are included in the Statement of Operations as realized gain (loss) for investments no longer held and as unrealized gain (loss) for investments still held.
Brokerage commissions and mark ups are considered transaction costs and are recorded as an increase to the cost basis of securities purchased and/or a reduction of proceeds on a sale of securities. Such transaction costs are included in the determination of net realized and unrealized gain (loss) from investment securities reported in the Statement of Operations and the Statement of Changes in Net Assets and the net realized and unrealized gains (losses) on securities per share in the Financial Highlights. Transaction costs are included in the calculation of the Fund’s net asset value and, accordingly, they reduce the Fund’s total returns. These transaction costs are not considered operating expenses and are not reflected in net investment income reported in the Statement of Operations and the Statement of Changes in Net Assets, or the net investment income per share and the ratios of expenses and net investment income reported in the Financial Highlights, nor are they limited by any expense limitation arrangements between the Fund and the investment adviser.
The Fund allocates realized and unrealized capital gains and losses to a class based on the relative net assets of each class. The Fund allocates income to a class based on the relative value of the settled shares of each class.
| C. | Country Determination — For the purposes of making investment selection decisions and presentation in the Schedule of Investments, the investment adviser may determine the country in which an issuer is located and/or credit risk exposure based on various factors. These factors include the laws of the country under which the issuer is organized, where the issuer maintains a principal office, the country in which the issuer derives 50% or more of its total revenues and the country that has the primary market for the issuer’s securities, as well as other criteria. Among the other criteria that may be evaluated for making this determination are the country in which the issuer maintains 50% or more of its assets, the type of security, financial guarantees and enhancements, the nature of the collateral and the sponsor organization. Country of issuer and/or credit risk exposure has been determined to be the United States of America, unless otherwise noted. |
| D. | Distributions — Distributions from net investment income, if any, are declared daily and paid monthly. Distributions from net realized capital gain, if any, are generally declared and paid annually and recorded on the ex-dividend date. The Fund may elect to treat a portion of the proceeds from redemptions as distributions for federal income tax purposes. |
| E. | Federal Income Taxes — The Fund intends to comply with the requirements of Subchapter M of the Internal Revenue Code of 1986, as amended (the “Internal Revenue Code”), necessary to qualify as a regulated investment company and to distribute substantially all of the Fund’s taxable and tax-exempt earnings to shareholders. As such, the Fund will not be subject to federal income taxes on otherwise taxable income (including net realized capital gain) that is distributed to shareholders. Therefore, no provision for federal income taxes is recorded in the financial statements. |
The Fund recognizes the tax benefits of uncertain tax positions only when the position is more likely than not to be sustained. Management has analyzed the Fund’s uncertain tax positions and concluded that no liability for unrecognized tax benefits should be recorded related to uncertain tax positions. Management is not aware of any tax positions for which it is reasonably possible that the total amounts of unrecognized tax benefits will change materially in the next 12 months.
In addition, the Fund intends to invest in such municipal securities to allow it to qualify to pay shareholders “exempt-interest dividends”, as defined in the Internal Revenue Code.
The Fund files tax returns in the U.S. Federal jurisdiction and certain other jurisdictions. Generally, the Fund is subject to examinations by such taxing authorities for up to three years after the filing of the return for the tax period.
| F. | Expenses — Fees provided for under the Rule 12b-1 plan of a particular class of the Fund and which are directly attributable to that class are charged to the operations of such class. All other expenses are allocated among the classes based on relative net assets. |
| G. | Interest, Facilities and Maintenance Fees — Interest, Facilities and Maintenance Fees include interest and related borrowing costs such as commitment fees and other expenses associated with lines of credit and interest and administrative expenses related to establishing and maintaining floating rate note obligations, if any. |
| H. | Accounting Estimates — The preparation of financial statements in conformity with accounting principles generally accepted in the United States of America (“GAAP”) requires management to make estimates and assumptions that affect the reported amounts of assets and liabilities at the date of the financial statements and the reported amounts of revenues and expenses during the reporting period including estimates and assumptions related to taxation. Actual results could differ from those estimates by a significant amount. In addition, the Fund monitors for material events or transactions that may occur or become known after the period-end date and before the date the financial statements are released to print. |
22 Invesco California Tax-Free Income Fund
| I. | Indemnifications — Under the Trust’s organizational documents, each Trustee, officer, employee or other agent of the Trust is indemnified against certain liabilities that may arise out of the performance of their duties to the Fund. Additionally, in the normal course of business, the Fund enters into contracts, including the Fund’s servicing agreements, that contain a variety of indemnification clauses. The Fund’s maximum exposure under these arrangements is unknown as this would involve future claims that may be made against the Fund that have not yet occurred. The risk of material loss as a result of such indemnification claims is considered remote. |
| J. | Floating Rate Note Obligations — The Fund invests in inverse floating rate securities, such as Tender Option Bonds (“TOBs”), for investment purposes and to enhance the yield of the Fund. Such securities may be purchased in the secondary market without first owning an underlying bond but generally are created through the sale of fixed rate bonds by the Fund to special purpose trusts established by a broker dealer or by the Fund (“TOB Trusts”) in exchange for cash and residual interests in the TOB Trusts’ assets and cash flows, which are in the form of inverse floating rate securities. The TOB Trusts finance the purchases of the fixed rate bonds by issuing floating rate notes to third parties and allowing the Fund to retain residual interests in the bonds. The floating rate notes issued by the TOB Trusts have interest rates that reset weekly and the floating rate note holders have the option to tender their notes to the TOB Trusts for redemption at par at each reset date. The residual interests held by the Fund (inverse floating rate securities) include the right of the Fund (1) to cause the holders of the floating rate notes to tender their notes at par at the next interest rate reset date, and (2) to transfer the municipal bond from the TOB Trust to the Fund, thereby collapsing the TOB Trust. Inverse floating rate securities tend to underperform the market for fixed rate bonds in a rising interest rate environment, but tend to outperform the market for fixed rate bonds when interest rates decline or remain relatively stable. |
The Fund generally invests in inverse floating rate securities that include embedded leverage, thus exposing the Fund to greater risks and increased costs. The primary risks associated with inverse floating rate securities are varying degrees of liquidity and decreases in the value of such securities in response to changes in interest rates to a greater extent than fixed rate securities having similar credit quality, redemption provisions and maturity, which may cause the Fund’s net asset value to be more volatile than if it had not invested in inverse floating rate securities. In certain instances, the short-term floating rate notes created by the TOB Trust may not be able to be sold to third parties or, in the case of holders tendering (or putting) such notes for repayment of principal, may not be able to be remarketed to third parties. In such cases, the TOB Trust holding the fixed rate bonds may be collapsed with the entity that contributed the fixed rate bonds to the TOB Trust. In the case where a TOB Trust is collapsed with the Fund, the Fund will be required to repay the principal amount of the tendered securities, which may require the Fund to sell other portfolio holdings to raise cash to meet that obligation. The Fund could therefore be required to sell other portfolio holdings at a disadvantageous time or price to raise cash to meet this obligation, which risk will be heightened during times of market volatility, illiquidity or uncertainty. The embedded leverage in the TOB Trust could cause the Fund to lose more money than the value of the asset it has contributed to the TOB Trust and greater levels of leverage create the potential for greater losses. In addition, a Fund may enter into reimbursement agreements with the liquidity provider of certain TOB transactions in connection with certain residuals held by the Fund. These agreements commit a Fund to reimburse the liquidity provider to the extent that the liquidity provider must provide cash to a TOB Trust, including following the termination of a TOB Trust resulting from a mandatory tender event (“liquidity shortfall”). The reimbursement agreement will effectively make the Fund liable for the amount of the negative difference, if any, between the liquidation value of the underlying security and the purchase price of the floating rate notes issued by the TOB Trust.
The Fund accounts for the transfer of fixed rate bonds to the TOB Trusts as secured borrowings, with the securities transferred remaining in the Fund’s investment assets, and the related floating rate notes reflected as Fund liabilities under the caption Floating rate note obligations on the Statement of Assets and Liabilities. The carrying amount of the Fund’s Floating rate note obligations as reported on the Statement of Assets and Liabilities approximates its fair value. The Fund records the interest income from the fixed rate bonds under the caption Interest and records the expenses related to floating rate obligations and any administrative expenses of the TOB Trusts as a component of Interest, facilities and maintenance fees on the Statement of Operations.
Final rules implementing section 619 of the Dodd-Frank Wall Street Reform and Consumer Protection Act (the “Volcker Rule”) prohibit banking entities from engaging in proprietary trading of certain instruments and limit such entities’ investments in, and relationships with, “covered funds”, as defined in the rules. These rules preclude banking entities and their affiliates from sponsoring and/or providing services for existing TOB Trusts. A new TOB structure is being utilized by the Fund wherein the Fund, as holder of the residuals, will perform certain duties previously performed by banking entities as “sponsors” of TOB Trusts. These duties may be performed by a third-party service provider. The Fund’s expanded role under the new TOB structure may increase its operational and regulatory risk. The new structure is substantially similar to the previous structure; however, pursuant to the Volcker Rule, the remarketing agent would not be able to repurchase tendered floaters for its own account upon a failed remarketing. In the event of a failed remarketing, a banking entity serving as liquidity provider may loan the necessary funds to the TOB Trust to purchase the tendered floaters. The TOB Trust, not the Fund, would be the borrower and the loan from the liquidity provider will be secured by the purchased floaters now held by the TOB Trust. However, as previously described, the Fund would bear the risk of loss with respect to any liquidity shortfall to the extent it entered into a reimbursement agreement with the liquidity provider.
Further, the SEC and various banking agencies recently adopted rules implementing credit risk retention requirements for asset-backed securities (the “Risk Retention Rules”). The Risk Retention Rules require the sponsor of a TOB Trust to retain at least 5% of the credit risk of the underlying assets supporting the TOB Trust’s municipal bonds. The Fund has adopted policies intended to comply with the Risk Retention Rules. The Risk Retention Rules may adversely affect the Fund’s ability to engage in TOB Trust transactions or increase the costs of such transactions in certain circumstances.
There can be no assurances that the new TOB structure will continue to be a viable form of leverage. Further, there can be no assurances that alternative forms of leverage will be available to the Fund in order to maintain current levels of leverage. Any alternative forms of leverage may be less advantageous to the Fund, and may adversely affect the Fund’s net asset value, distribution rate and ability to achieve its investment objective.
TOBs are presently classified as private placement securities. Private placement securities are subject to restrictions on resale because they have not been registered under the Securities Act of 1933, as amended (the “1933 Act”), or are otherwise not readily marketable. As a result of the absence of a public trading market for these securities, they may be less liquid than publicly traded securities. Although atypical, these securities may be resold in privately negotiated transactions, the prices realized from these sales could be less than those originally paid by the Fund or less than what may be considered the fair value of such securities.
23 Invesco California Tax-Free Income Fund
| K. | Other Risks — The value of, payment of interest on, repayment of principal for and the ability to sell a municipal security may be affected by constitutional amendments, legislative enactments, executive orders, administrative regulations, voter initiatives and the economics of the regions in which the issuers are located. |
Since many municipal securities are issued to finance similar projects, especially those relating to education, health care, transportation and utilities, conditions in those sectors can affect the overall municipal securities market and the Fund’s investments in municipal securities.
There is some risk that a portion or all of the interest received from certain tax-free municipal securities could become taxable as a result of determinations by the Internal Revenue Service.
NOTE 2—Advisory Fees and Other Fees Paid to Affiliates
The Trust has entered into a master investment advisory agreement with Invesco Advisers, Inc. (the “Adviser” or “Invesco”). Under the terms of the investment advisory agreement, the Fund accrues daily and pays monthly an advisory fee to the Adviser based on the annual rate of the Fund’s average daily net assets as follows:
| Average Daily Net Assets | Rate | |||||||
First $500 million | 0 | .47% | ||||||
Next $250 million | 0 | .445% | ||||||
Next $250 million | 0 | .42% | ||||||
Next $250 million | 0 | .395% | ||||||
Over $1.25 billion | 0 | .37% | ||||||
For the year ended August 31, 2017, the effective advisory fees incurred by the Fund was 0.47%.
Under the terms of a master sub-advisory agreement between the Adviser and each of Invesco Asset Management Deutschland GmbH, Invesco Asset Management Limited, Invesco Asset Management (Japan) Limited, Invesco Hong Kong Limited, Invesco Senior Secured Management, Inc. and Invesco Canada Ltd. (collectively, the “Affiliated Sub-Advisers”) the Adviser, not the Fund, will pay 40% of the fees paid to the Adviser to any such Affiliated Sub-Adviser(s) that provide(s) discretionary investment management services to the Fund based on the percentage of assets allocated to such Affiliated Sub-Adviser(s).
The Adviser has contractually agreed, through at least June 30, 2018, to waive advisory fees and/or reimburse expenses to the extent necessary to limit total annual fund operating expenses and/or reimbursement (excluding certain items discussed below) of Class A, Class B, Class C, Class Y and Class R6 shares to 1.50%, 2.00%, 2.00%, 1.25% and 1.25%, respectively, of the Fund’s average daily net assets (the “expense limits”). In determining the Adviser’s obligation to waive advisory fees and/or reimburse expenses, the following expenses are not taken into account, and could cause the net annual fund operating expenses and/or reimbursement to exceed the numbers reflected above: (1) interest, facilities and maintenance fees; (2) taxes; (3) dividend expense on short sales; (4) extraordinary or non-routine items, including litigation expenses; and (5) expenses that the Fund has incurred but did not actually pay because of an expense offset arrangement. Unless Invesco continues the fee waiver agreement, it will terminate on June 30, 2018. During its term, the fee waiver agreement cannot be terminated or amended to increase the expense limits or reduce the advisory fee waivers without approval of the Board of Trustees. The Adviser did not waive fees and/or reimburse expenses during the period under this expense limit.
The Trust has entered into a master administrative services agreement with Invesco pursuant to which the Fund has agreed to pay Invesco for certain administrative costs incurred in providing accounting services to the Fund. For the year ended August 31, 2017, expenses incurred under the agreement are shown in the Statement of Operations as Administrative services fees.
The Trust has entered into a transfer agency and service agreement with Invesco Investment Services, Inc. (“IIS”) pursuant to which the Fund has agreed to pay IIS a fee for providing transfer agency and shareholder services to the Fund and reimburse IIS for certain expenses incurred by IIS in the course of providing such services. IIS may make payments to intermediaries that provide omnibus account services, sub-accounting services and/or networking services. All fees payable by IIS to intermediaries that provide omnibus account services or sub-accounting services are charged back to the Fund, subject to certain limitations approved by the Trust’s Board of Trustees. For the year ended August 31, 2017, expenses incurred under the agreement are shown in the Statement of Operations as Transfer agent fees.
Shares of the Fund are distributed by Invesco Distributors, Inc. (“IDI”), an affiliate of the Adviser. The Fund has adopted a Plan of Distribution (the “Plan”) pursuant to Rule 12b-1 under the 1940 Act. The Plan provides that the Fund will reimburse IDI for distribution related expenses that IDI incurs up to a maximum of the following annual rates: (1) Class A — up to 0.25% of the average daily net assets of Class A shares; (2) Class B — up to 0.75% of the average daily net assets of Class B shares; and (3) Class C — up to 0.75% of the average daily net assets of Class C shares. The fees are accrued daily and paid monthly.
In the case of Class B shares, provided that the Plan continues in effect, any cumulative expenses incurred by IDI, but not yet reimbursed to IDI, may be recovered through the payment of future distribution fees from the Fund pursuant to the Plan and contingent deferred sales charges paid by investors upon redemption of Class B shares.
For the year ended August 31, 2017, expenses incurred under these agreements are shown in the Statement of Operations as Distribution fees.
Front-end sales commissions and CDSC (collectively, the “sales charges”) are not recorded as expenses of the Fund. Front-end sales commissions are deducted from proceeds from the sales of Fund shares prior to investment in Class A shares of the Fund. CDSC are deducted from redemption proceeds prior to remittance to the shareholder. During the year ended August 31, 2017, IDI advised the Fund that IDI retained $43,982 in front-end sales commissions from the sale of Class A shares and $42,332 and $4,978 from Class A and Class C shares, respectively, for CDSC imposed on redemptions by shareholders.
Certain officers and trustees of the Trust are officers and directors of the Adviser, IIS and/or IDI.
24 Invesco California Tax-Free Income Fund
NOTE 3—Additional Valuation Information
GAAP defines fair value as the price that would be received to sell an asset or paid to transfer a liability in an orderly transaction between market participants at the measurement date, under current market conditions. GAAP establishes a hierarchy that prioritizes the inputs to valuation methods, giving the highest priority to readily available unadjusted quoted prices in an active market for identical assets (Level 1) and the lowest priority to significant unobservable inputs (Level 3), generally when market prices are not readily available or are unreliable. Based on the valuation inputs, the securities or other investments are tiered into one of three levels. Changes in valuation methods may result in transfers in or out of an investment’s assigned level:
| Level 1 — | Prices are determined using quoted prices in an active market for identical assets. |
| Level 2 — | Prices are determined using other significant observable inputs. Observable inputs are inputs that other market participants may use in pricing a security. These may include quoted prices for similar securities, interest rates, prepayment speeds, credit risk, yield curves, loss severities, default rates, discount rates, volatilities and others. |
| Level 3 — | Prices are determined using significant unobservable inputs. In situations where quoted prices or observable inputs are unavailable (for example, when there is little or no market activity for an investment at the end of the period), unobservable inputs may be used. Unobservable inputs reflect the Fund’s own assumptions about the factors market participants would use in determining fair value of the securities or instruments and would be based on the best available information. |
As of August 31, 2017, all of the securities in this Fund were valued based on Level 2 inputs (see the Schedule of Investments for security categories). The level assigned to the securities valuations may not be an indication of the risk or liquidity associated with investing in those securities. Because of the inherent uncertainties of valuation, the values reflected in the financial statements may materially differ from the value received upon actual sale of those investments.
The Fund’s policy is to recognize transfers in and out of the valuation levels as of the end of the reporting period. During the year ended August 31, 2017, there were no transfers between valuation levels.
NOTE 4—Expense Offset Arrangement(s)
The expense offset arrangement is comprised of transfer agency credits which result from balances in demand deposit accounts used by the transfer agent for clearing shareholder transactions. For the year ended August 31, 2017, the Fund received credits from this arrangement, which resulted in the reduction of the Fund’s total expenses of $505.
NOTE 5—Security Transactions with Affiliated Funds
The Fund is permitted to purchase or sell securities from or to certain other Invesco Funds under specified conditions outlined in procedures adopted by the Board of Trustees of the Trust. The procedures have been designed to ensure that any purchase or sale of securities by the Fund from or to another fund or portfolio that is or could be considered an affiliate by virtue of having a common investment adviser (or affiliated investment advisers), common Trustees and/or common officers complies with Rule 17a-7 of the 1940 Act. Further, as defined under the procedures, each transaction is effected at the current market price. Pursuant to these procedures, for the year ended August 31, 2017, the Fund engaged in securities purchases of $46,426,012 and securities sales of $49,530,928, which did not result in any realized gains (losses).
NOTE 6—Trustees’ and Officers’ Fees and Benefits
Trustees’ and Officers’ Fees and Benefits include amounts accrued by the Fund to pay remuneration to certain Trustees and Officers of the Fund. Trustees have the option to defer compensation payable by the Fund, and Trustees’ and Officers’ Fees and Benefits also include amounts accrued by the Fund to fund such deferred compensation amounts. Those Trustees who defer compensation have the option to select various Invesco Funds in which their deferral accounts shall be deemed to be invested. Finally, certain current Trustees were eligible to participate in a retirement plan that provided for benefits to be paid upon retirement to Trustees over a period of time based on the number of years of service. The Fund may have certain former Trustees who also participate in a retirement plan and receive benefits under such plan. Trustees’ and Officers’ Fees and Benefits include amounts accrued by the Fund to fund such retirement benefits. Obligations under the deferred compensation and retirement plans represent unsecured claims against the general assets of the Fund.
NOTE 7—Cash Balances and Borrowings
The Fund is permitted to temporarily carry a negative or overdrawn balance in its account with SSB, the custodian bank. Such balances, if any at period-end, are shown in the Statement of Assets and Liabilities under the payable caption Amount due custodian. To compensate the custodian bank for such overdrafts, the overdrawn Fund may either (1) leave funds as a compensating balance in the account so the custodian bank can be compensated by earning the additional interest; or (2) compensate by paying the custodian bank at a rate agreed upon by the custodian bank and Invesco, not to exceed the contractually agreed upon rate.
Inverse floating rate obligations resulting from the transfer of bonds to TOB Trusts are accounted for as secured borrowings. The average floating rate notes outstanding and average annual interest and fee rate related to inverse floating rate note obligations during the year ended August 31, 2017 were $41,015,769 and 1.37%, respectively.
25 Invesco California Tax-Free Income Fund
NOTE 8—Distributions to Shareholders and Tax Components of Net Assets
Tax Character of Distributions to Shareholders Paid During the Fiscal Years Ended August 31, 2017 and 2016:
| 2017 | 2016 | |||||||
Ordinary income | $ | 16,058,365 | $ | 14,974,485 | ||||
Tax Components of Net Assets at Period-End:
| 2017 | ||||
Undistributed tax-exempt income | $ | 523,751 | ||
Net unrealized appreciation — investments | 36,217,013 | |||
Temporary book/tax differences | (118,253 | ) | ||
Capital loss carryforward | (20,407,439 | ) | ||
Shares of beneficial interest | 426,755,643 | |||
Total net assets | $ | 442,970,715 | ||
The difference between book-basis and tax-basis unrealized appreciation (depreciation) is due to differences in the timing of recognition of gains and losses on investments for tax and book purposes. The Fund’s net unrealized appreciation difference is attributable primarily to TOBs, accretion of bond discount differences and wash sales.
The temporary book/tax differences are a result of timing differences between book and tax recognition of income and/or expenses. The Fund’s temporary book/tax differences are the result of the trustee deferral of compensation and retirement plan benefits.
Capital loss carryforward is calculated and reported as of a specific date. Results of transactions and other activity after that date may affect the amount of capital loss carryforward actually available for the Fund to utilize. Capital losses generated in years beginning after December 22, 2010 can be carried forward for an unlimited period, whereas previous losses expire in eight tax years. Capital losses with an expiration period may not be used to offset capital gains until all net capital losses without an expiration date have been utilized. Capital loss carryforwards with no expiration date will retain their character as either short-term or long-term capital losses instead of as short-term capital losses as under prior law. The ability to utilize capital loss carryforwards in the future may be limited under the Internal Revenue Code and related regulations based on the results of future transactions.
The Fund has a capital loss carryforward as of August 31, 2017, which expires as follows:
| Capital Loss Carryforward* | ||||||||||||
| Expiration | Short-Term | Long-Term | Total | |||||||||
August 31, 2018 | $ | 6,678,872 | $ | — | $ | 6,678,872 | ||||||
August 31, 2019 | 1,906,728 | — | 1,906,728 | |||||||||
Not subject to expiration | 5,453,993 | 6,367,846 | 11,821,839 | |||||||||
| $ | 14,039,593 | $ | 6,367,846 | $ | 20,407,439 | |||||||
| * | Capital loss carryforward as of the date listed above is reduced for limitations, if any, to the extent required by the Internal Revenue Code and may be further limited depending upon a variety of factors, including the realization of net unrealized gains or losses as of the date of any reorganization. |
NOTE 9—Investment Transactions
The aggregate amount of investment securities (other than short-term securities, U.S. Treasury obligations and money market funds, if any) purchased and sold by the Fund during the year ended August 31, 2017 was $94,942,150 and $86,676,091, respectively. Cost of investments, including any derivatives, on a tax basis includes the adjustments for financial reporting purposes as of the most recently completed federal income tax reporting period-end.
| Unrealized Appreciation (Depreciation) of Investments on a Tax Basis | ||||
Aggregate unrealized appreciation of investments | $39,708,894 | |||
Aggregate unrealized (depreciation) of investments | (3,491,881 | ) | ||
Net unrealized appreciation of investments | $36,217,013 | |||
Cost of investments for tax purposes is $448,201,954.
NOTE 10—Reclassification of Permanent Differences
Primarily as a result of differing book/tax treatment of expired capital loss carryforward, on August 31, 2017, undistributed net investment income was decreased by $294,384, undistributed net realized gain (loss) was increased by $9,460,904 and shares of beneficial interest was decreased by $9,166,520. This reclassification had no effect on the net assets of the Fund.
26 Invesco California Tax-Free Income Fund
NOTE 11—Share Information
| Summary of Share Activity | ||||||||||||||||
| Years ended August 31, | ||||||||||||||||
| 2017(a) | 2016 | |||||||||||||||
| Shares | Amount | Shares | Amount | |||||||||||||
Sold: | ||||||||||||||||
Class A | 4,359,014 | $ | 52,644,916 | 5,657,336 | $ | 70,012,558 | ||||||||||
Class B | 480 | 5,784 | 2,917 | 36,479 | ||||||||||||
Class C | 1,537,870 | 18,738,611 | 2,721,783 | 34,105,068 | ||||||||||||
Class Y | 2,756,250 | 33,163,059 | 1,522,465 | 19,073,009 | ||||||||||||
Class R6(b) | 836 | 10,000 | — | — | ||||||||||||
Issued as reinvestment of dividends: | ||||||||||||||||
Class A | 651,664 | 7,839,857 | 577,072 | 7,152,874 | ||||||||||||
Class B | 14,586 | 177,106 | 20,332 | 254,037 | ||||||||||||
Class C | 95,400 | 1,155,290 | 65,425 | 818,321 | ||||||||||||
Class Y | 68,844 | 830,380 | 40,279 | 502,225 | ||||||||||||
Automatic conversion of Class B shares to Class A shares: | ||||||||||||||||
Class A | 371,094 | 4,451,315 | 156,325 | 1,943,962 | ||||||||||||
Class B | (367,571 | ) | (4,451,315 | ) | (154,843 | ) | (1,943,962 | ) | ||||||||
Reacquired: | ||||||||||||||||
Class A | (5,399,055 | ) | (64,713,637 | ) | (3,303,947 | ) | (41,000,216 | ) | ||||||||
Class B | (123,940 | ) | (1,500,161 | ) | (114,862 | ) | (1,439,724 | ) | ||||||||
Class C | (1,829,326 | ) | (22,113,377 | ) | (621,459 | ) | (7,794,792 | ) | ||||||||
Class Y | (2,185,868 | ) | (26,199,192 | ) | (432,587 | ) | (5,401,609 | ) | ||||||||
Net increase (decrease) in share activity | (49,722 | ) | $ | 38,636 | 6,136,236 | $ | 76,318,230 | |||||||||
| (a) | There are entities that are record owners of more than 5% of the outstanding shares of the Fund and in the aggregate own 60% of the outstanding shares of the Fund. IDI has an agreement with these entities to sell Fund shares. The Fund, Invesco and/or Invesco affiliates may make payments to these entities, which are considered to be related to the Fund, for providing services to the Fund, Invesco and/or Invesco affiliates including but not limited to services such as securities brokerage, distribution, third party record keeping and account servicing. The Fund has no knowledge as to whether all or any portion of the shares owned of record by these entities are also owned beneficially. |
| (b) | Commencement date of April 4, 2017. |
27 Invesco California Tax-Free Income Fund
NOTE 12—Financial Highlights
The following schedule presents financial highlights for a share of the Fund outstanding throughout the periods indicated.
| Net asset value, beginning of period | Net investment income(a) | Net gains (losses) on securities (both realized and unrealized) | Total from investment operations | Dividends from net investment income | Net asset value, end of period | Total return(b) | Net assets, end of period (000’s omitted) | Ratio of expenses to average net assets with fee waivers and/or expenses absorbed | Ratio of expenses to average net assets without fee waivers and/or expenses absorbed | Supplemental ratio of interest, facilities and maintenance fees) | Ratio of net investment income to average net assets | Portfolio turnover(c) | ||||||||||||||||||||||||||||||||||||||||
Class A |
| |||||||||||||||||||||||||||||||||||||||||||||||||||
Year ended 08/31/17 | $ | 12.63 | $ | 0.45 | $ | (0.51 | ) | $ | (0.06 | ) | $ | (0.45 | ) | $ | 12.12 | (0.41 | )% | $ | 338,904 | 1.02 | %(d) | 1.02 | %(d) | 0.88 | %(d) | 3.70 | %(d) | 18 | % | |||||||||||||||||||||||
Year ended 08/31/16 | 12.09 | 0.46 | 0.54 | 1.00 | (0.46 | ) | 12.63 | 8.37 | 353,372 | 0.94 | 0.94 | 0.87 | 3.71 | 7 | ||||||||||||||||||||||||||||||||||||||
Year ended 08/31/15 | 12.15 | 0.48 | (0.06 | ) | 0.42 | (0.48 | ) | 12.09 | 3.48 | 300,873 | 0.91 | 0.91 | 0.86 | 3.94 | 12 | |||||||||||||||||||||||||||||||||||||
Year ended 08/31/14 | 11.20 | 0.49 | 0.95 | 1.44 | (0.49 | ) | 12.15 | 13.14 | 296,200 | 0.93 | 0.93 | 0.87 | 4.25 | 12 | ||||||||||||||||||||||||||||||||||||||
Year ended 08/31/13 | 12.28 | 0.49 | (1.08 | ) | (0.59 | ) | (0.49 | ) | 11.20 | (5.06 | ) | 165,142 | 0.89 | 0.89 | 0.84 | 4.02 | 12 | |||||||||||||||||||||||||||||||||||
Class B |
| |||||||||||||||||||||||||||||||||||||||||||||||||||
Year ended 08/31/17 | 12.75 | 0.45 | (0.52 | ) | (0.07 | ) | (0.45 | ) | 12.23 | (0.46 | )(e) | 6,348 | 1.02 | (d)(e) | 1.02 | (d)(e) | 0.88 | (d)(e) | 3.70 | (d)(e) | 18 | |||||||||||||||||||||||||||||||
Year ended 08/31/16 | 12.20 | 0.46 | 0.55 | 1.01 | (0.46 | ) | 12.75 | 8.41 | (e) | 12,689 | 0.94 | (e) | 0.94 | (e) | 0.87 | (e) | 3.71 | (e) | 7 | |||||||||||||||||||||||||||||||||
Year ended 08/31/15 | 12.26 | 0.49 | (0.06 | ) | 0.43 | (0.49 | ) | 12.20 | 3.51 | (e) | 15,150 | 0.88 | (e) | 0.88 | (e) | 0.83 | (e) | 3.97 | (e) | 12 | ||||||||||||||||||||||||||||||||
Year ended 08/31/14 | 11.28 | 0.50 | 0.98 | 1.48 | (0.50 | ) | 12.26 | 13.35 | (e) | 16,419 | 0.93 | (e) | 0.93 | (e) | 0.87 | (e) | 4.25 | (e) | 12 | |||||||||||||||||||||||||||||||||
Year ended 08/31/13 | 12.37 | 0.49 | (1.09 | ) | (0.60 | ) | (0.49 | ) | 11.28 | (5.11 | )(e) | 155,900 | 0.93 | (e) | 0.93 | (e) | 0.88 | (e) | 3.98 | (e) | 12 | |||||||||||||||||||||||||||||||
Class C |
| |||||||||||||||||||||||||||||||||||||||||||||||||||
Year ended 08/31/17 | 12.71 | 0.39 | (0.52 | ) | (0.13 | ) | (0.39 | ) | 12.19 | (0.94 | ) | 52,424 | 1.52 | (d) | 1.52 | (d) | 1.38 | (d) | 3.20 | (d) | 18 | |||||||||||||||||||||||||||||||
Year ended 08/31/16 | 12.16 | 0.40 | 0.54 | 0.94 | (0.39 | ) | 12.71 | 7.88 | 57,137 | 1.44 | 1.44 | 1.37 | 3.21 | 7 | ||||||||||||||||||||||||||||||||||||||
Year ended 08/31/15 | 12.23 | 0.42 | (0.07 | ) | 0.35 | (0.42 | ) | 12.16 | 2.87 | 28,335 | 1.41 | 1.41 | 1.36 | 3.44 | 12 | |||||||||||||||||||||||||||||||||||||
Year ended 08/31/14 | 11.27 | 0.44 | 0.96 | 1.40 | (0.44 | ) | 12.23 | 12.62 | (f) | 20,485 | 1.43 | (f) | 1.43 | (f) | 1.37 | (f) | 3.75 | (f) | 12 | |||||||||||||||||||||||||||||||||
Year ended 08/31/13 | 12.36 | 0.43 | (1.09 | ) | (0.66 | ) | �� | (0.43 | ) | 11.27 | (5.57 | ) | 21,558 | 1.40 | 1.40 | 1.35 | 3.51 | 12 | ||||||||||||||||||||||||||||||||||
Class Y |
| |||||||||||||||||||||||||||||||||||||||||||||||||||
Year ended 08/31/17 | 12.68 | 0.48 | (0.52 | ) | (0.04 | ) | (0.48 | ) | 12.16 | (0.24 | ) | 45,285 | 0.77 | (d) | 0.77 | (d) | 0.63 | (d) | 3.95 | (d) | 18 | |||||||||||||||||||||||||||||||
Year ended 08/31/16 | 12.13 | 0.49 | 0.55 | 1.04 | (0.49 | ) | 12.68 | 8.70 | 39,091 | 0.69 | 0.69 | 0.62 | 3.96 | 7 | ||||||||||||||||||||||||||||||||||||||
Year ended 08/31/15 | 12.20 | 0.51 | (0.07 | ) | 0.44 | (0.51 | ) | 12.13 | 3.65 | 23,698 | 0.66 | 0.66 | 0.61 | 4.19 | 12 | |||||||||||||||||||||||||||||||||||||
Year ended 08/31/14 | 11.24 | 0.52 | 0.96 | 1.48 | (0.52 | ) | 12.20 | 13.48 | 22,380 | 0.69 | 0.69 | 0.63 | 4.49 | 12 | ||||||||||||||||||||||||||||||||||||||
Year ended 08/31/13 | 12.33 | 0.52 | (1.09 | ) | (0.57 | ) | (0.52 | ) | 11.24 | (4.88 | ) | 20,569 | 0.65 | 0.65 | 0.60 | 4.26 | 12 | |||||||||||||||||||||||||||||||||||
Class R6 |
| |||||||||||||||||||||||||||||||||||||||||||||||||||
Year ended 08/31/17(g) | 11.97 | 0.19 | 0.21 | 0.40 | (0.20 | ) | 12.17 | 3.40 | 10 | 0.81 | (d)(h) | 0.81 | (d)(h) | 0.67 | (d)(h) | 3.91 | (d)(h) | 18 | ||||||||||||||||||||||||||||||||||
| (a) | Calculated using average shares outstanding. |
| (b) | Includes adjustments in accordance with accounting principles generally accepted in the United States of America and as such, the net asset value for financial reporting purposes and the returns based upon those net asset values may differ from the net asset value and returns for shareholder transactions. Does not include sales charges and is not annualized for periods less than one year, if applicable. |
| (c) | Portfolio turnover is calculated at the fund level and is not annualized for periods less than one year, if applicable. |
| (d) | Ratios are based on average daily net assets (000’s omitted) of $335,314, $9,511, $52,511, $40,889 and $10 for Class A, Class B, Class C, Class Y and Class R6 shares, respectively. |
| (e) | The total return, ratio of expenses to average net assets and ratio of net investment income to average net assets reflect actual 12b-1 fees of 0.25%, 0.25%, 0.22%, 0.24% and 0.27% for the years ended August 31, 2017, 2016, 2015, 2014 and 2013, respectively. |
| (f) | The total return, ratio of expenses to average net assets and ratio of net investment income to average net assets reflect actual 12b-1 fees of 0.74%. |
| (g) | Commencement date of April 4, 2017. |
| (h) | Annualized. |
28 Invesco California Tax-Free Income Fund
Report of Independent Registered Public Accounting Firm
To the Board of Trustees of AIM Counselor Series Trust (Invesco Counselor Series Trust)
and Shareholders of Invesco California Tax-Free Income Fund:
In our opinion, the accompanying statement of assets and liabilities, including the schedule of investments, and the related statements of operations and of changes in net assets and the financial highlights present fairly, in all material respects, the financial position of Invesco California Tax-Free Income Fund (one of the funds constituting AIM Counselor Series Trust (Invesco Counselor Series Trust), hereafter referred to as the “Fund”) as of August 31, 2017, the results of its operations for the year then ended, the changes in its net assets for each of the two years in the period then ended and the financial highlights for each of the periods indicated therein, in conformity with accounting principles generally accepted in the United States of America. These financial statements and financial highlights (hereafter referred to as “financial statements”) are the responsibility of the Fund’s management. Our responsibility is to express an opinion on these financial statements based on our audits. We conducted our audits of these financial statements in accordance with the standards of the Public Company Accounting Oversight Board (United States). Those standards require that we plan and perform the audit to obtain reasonable assurance about whether the financial statements are free of material misstatement. An audit includes examining, on a test basis, evidence supporting the amounts and disclosures in the financial statements, assessing the accounting principles used and significant estimates made by management, and evaluating the overall financial statement presentation. We believe that our audits, which included confirmation of securities as of August 31, 2017 by correspondence with the custodian and brokers, and when replies were not received from brokers, we performed other auditing procedures, provide a reasonable basis for our opinion.
PricewaterhouseCoopers LLP
Houston, Texas
October 30, 2017
29 Invesco California Tax-Free Income Fund
Calculating your ongoing Fund expenses
Example
As a shareholder of the Fund, you incur two types of costs: (1) transaction costs, which may include sales charges (loads) on purchase payments or contingent deferred sales charges on redemptions, if any; and (2) ongoing costs, including management fees, distribution and/or service (12b-1) fees, and other Fund expenses. This example is intended to help you understand your ongoing costs (in dollars) of investing in the Fund and to compare these costs with ongoing costs of investing in other mutual funds. With the exception of the actual ending account value and expenses of the Class R6 shares, the example is based on an investment of $1,000 invested at the beginning of the period and held for the entire period March 1, 2017 through August 31, 2017. The actual ending account value and expenses of the Class R6 shares in the example below are based on an investment of $1,000 invested as of close of business April 4, 2017 (commencement date) and held through August 31, 2017.
Actual expenses
The table below provides information about actual account values and actual expenses. You may use the information in this table, together with the amount you invested, to estimate the expenses that you paid over the period. Simply divide your account value by $1,000 (for example, an $8,600 account value divided by $1,000 = 8.6), then multiply the result by the number in the table under the heading entitled “Actual Expenses Paid During Period” to estimate the expenses you paid on your account during this period (as of close of business April 4, 2017 through August 31, 2017 for the Class R6 shares). Because the actual ending account value and expense information in the example is not based upon a six month period for the Class R6 shares, the ending account value and expense information may not provide a meaningful comparison to mutual funds that provide such information for a full six month period.
Hypothetical example for comparison purposes
The table below also provides information about hypothetical account values and hypothetical expenses based on the Fund’s actual expense ratio and an assumed rate of return of 5% per year before expenses, which is not the Fund’s actual return.
The hypothetical account values and expenses may not be used to estimate the actual ending account balance or expenses you paid for the period. You may use this information to compare the ongoing costs of investing in the Fund and other funds. To do so, compare this 5% hypothetical example with the 5% hypothetical examples that appear in the shareholder reports of the other funds.
Please note that the expenses shown in the table are meant to highlight your ongoing costs only and do not reflect any transaction costs, such as sales charges (loads) on purchase payments or contingent deferred sales charges on redemptions, if any. Therefore, the hypothetical information is useful in comparing ongoing costs only, and will not help you determine the relative total costs of owning different funds. In addition, if these transaction costs were included, your costs would have been higher.
| Class | Beginning Account Value (03/01/17) | ACTUAL | HYPOTHETICAL (5% annual return before expenses) | Annualized Expense Ratio | ||||||||||||||||||||
| Ending Account Value (08/31/17)1 | Expenses Paid During Period2 | Ending Account Value (08/31/17) | Expenses Paid During Period3 | |||||||||||||||||||||
A | $ | 1,000.00 | $ | 1,038.60 | $ | 5.24 | $ | 1,020.06 | $ | 5.19 | 1.02 | % | ||||||||||||
B | 1,000.00 | 1,037.50 | 5.19 | 1,020.11 | 5.14 | 1.01 | ||||||||||||||||||
C | 1,000.00 | 1,036.10 | 7.80 | 1,017.54 | 7.73 | 1.52 | ||||||||||||||||||
Y | 1,000.00 | 1,038.90 | 3.96 | 1,021.32 | 3.92 | 0.77 | ||||||||||||||||||
R6 | 1,000.00 | 1,034.00 | 3.39 | 1,021.12 | 4.13 | 0.81 | ||||||||||||||||||
| 1 | The actual ending account value is based on the actual total return of the Fund for the period March 1, 2017 through August 31, 2017 (as of close of business April 4, 2017 through August 31, 2017 for the Class R6 shares), after actual expenses and will differ from the hypothetical ending account value which is based on the Fund’s expense ratio and a hypothetical annual return of 5% before expenses. |
| 2 | Actual expenses are equal to the Fund’s annualized expense ratio as indicated above multiplied by the average account value over the period, multiplied by 184/365 to reflect the most recent fiscal half year. For the Class R6 shares actual expenses are equal to the annualized expense ratio indicated above multiplied by the average account value over the period, multiplied by 150 (as of close of business April 4, 2017 through August 31, 2017)/365. Because the Class R6 shares have not been in existence for a full six month period, the actual ending account value and expense information shown may not provide a meaningful comparison to fund expense information of classes that show such data for a full six month period and, because the actual ending account value and expense information in the expense example covers a short time period, return and expense data may not be indicative of return and expense data for longer time periods. |
| 3 | Hypothetical expenses are equal to the annualized expense ratio indicated above multiplied by the average account value over the period, multiplied by 184/365 to reflect a one-half year period. The hypothetical ending account value and expenses may be used to compare ongoing costs of investing in Class R6 shares of the Fund and other funds because such data is based on a full six month period. |
30 Invesco California Tax-Free Income Fund
Approval of Investment Advisory and Sub-Advisory Contracts
The Board of Trustees (the Board) of AIM Counselor Series Trust (Invesco Counselor Series Trust) is required under the Investment Company Act of 1940, as amended, to approve annually the renewal of Invesco California Tax-Free Income Fund’s (the Fund) investment advisory agreements. During contract renewal meetings held on June 12-13, 2017, the Board as a whole, and the disinterested or “independent” Trustees, who comprise over 75% of the Board, voting separately, approved the continuance for the Fund of the Master Investment Advisory Agreement with Invesco Advisers, Inc. (Invesco Advisers and the investment advisory agreement) and the Master Intergroup Sub-Advisory Contract for Mutual Funds with Invesco Asset Management Deutschland GmbH, Invesco Asset Management Limited, Invesco Asset Management (Japan) Limited, Invesco Hong Kong Limited, Invesco Senior Secured Management, Inc. and Invesco Canada Ltd. (collectively, the Affiliated Sub-Advisers and the sub-advisory contracts) for another year, effective July 1, 2017.
In evaluating the fairness and reasonableness of compensation under the Fund’s investment advisory agreement and sub-advisory contracts, the Board considered, among other things, the factors discussed below. The Board determined that continuation of the Fund’s investment advisory agreement and the sub-advisory contracts is in the best interest of the Fund and its shareholders and that the compensation payable to Invesco Advisers and the Affiliated Sub-Advisers under the agreements is fair and reasonable.
The Board’s Fund Evaluation Process
The Board’s Investments Committee has established three Sub-Committees, which meet throughout the year to review the performance of funds advised by Invesco Advisers (the Invesco Funds). Over the course of each year, the Sub-Committees meet with portfolio managers for their assigned Invesco Funds and other members of management to review the performance, investment objective(s), policies, strategies, limitations and investment risks of these funds. The Board had the benefit of reports from the Sub-Committees and Investments Committee throughout the year in considering approval of the continuance of each Invesco Fund’s investment advisory agreement and sub-advisory contracts for another year.
During the contract renewal process, the Board receives comparative performance and fee data regarding the Invesco Funds prepared by Invesco Advisers and Broadridge Financial Solutions, Inc. (Broadridge), an independent provider of investment company data. The Board also receives an independent written evaluation from the Senior Officer, an officer of the Invesco Funds who reports directly to the independent Trustees. The Senior Officer’s
evaluation is prepared as part of his responsibility to manage the process by which the Invesco Funds’ proposed management fees are negotiated during the annual contract renewal process to ensure they are negotiated in a manner that is at arms’ length and reasonable. In addition to meetings with Invesco Advisers and fund counsel, the independent Trustees also discuss the continuance of the investment advisory agreement and sub-advisory contracts in separate sessions with the Senior Officer and with independent legal counsel.
The Trustees recognized that the advisory fee rates for the Invesco Funds are, in most cases, the result of years of review and negotiation. The Trustees’ deliberations and conclusions in a particular year may be based in part on their deliberations and conclusions regarding these arrangements throughout the year and in prior years. The Trustees’ review and conclusions are based on the comprehensive consideration of all information presented to them and are not the result of any single determinative factor. Moreover, one Trustee may have weighed a particular piece of information or factor differently than another Trustee.
The discussion below is a summary of the Senior Officer’s independent written evaluation with respect to the Fund’s investment advisory agreement as well as a discussion of the material factors and related conclusions that formed the basis for the Board’s approval of the Fund’s investment advisory agreement and sub-advisory contracts. This information is current as of June 13, 2017, and does not reflect consideration of factors that became known to the Board after that date.
Factors and Conclusions and Summary of Independent Written Fee Evaluation
| A. | Nature, Extent and Quality of Services Provided by Invesco Advisers and the Affiliated Sub-Advisers |
The Board reviewed the advisory services provided to the Fund by Invesco Advisers under the Fund’s investment advisory agreement, the performance of Invesco Advisers in providing these services, and the credentials and experience of the officers and employees of Invesco Advisers who provide these services, including the Fund’s portfolio manager or managers. The Board’s review included consideration of Invesco Advisers’ investment process oversight, credit analysis and investment risk management. The Board also considered non-advisory services that Invesco Advisers and its affiliates provide to the Invesco Funds such as various back office support functions, trading operations, internal audit, valuation and legal and compliance.
In determining whether to continue the Fund’s investment advisory agreement, the Board considered the benefits of reapproving an
existing relationship as contrasted with the greater uncertainty that may be associated with entering into a new relationship. The Board concluded that the nature, extent and quality of the services provided to the Fund by Invesco Advisers are appropriate and satisfactory.
The Board reviewed the services that may be provided by the Affiliated Sub-Advisers under the sub-advisory contracts and the credentials and experience of the officers and employees of the Affiliated Sub-Advisers who provide these services. The Board noted that the Affiliated Sub-Advisers have offices and personnel that are located in financial centers around the world. As a result, the Board noted that the Affiliated Sub-Advisers can provide research and investment analysis on the markets and economies of various countries in which the Fund may invest, make recommendations regarding securities and assist with security trades. The Board concluded that the sub-advisory contracts may benefit the Fund and its shareholders by permitting Invesco Advisers to use the resources and talents of the Affiliated Sub-Advisers in managing the Fund. The Board concluded that the nature, extent and quality of the services that may be provided by the Affiliated Sub-Advisers are appropriate and satisfactory.
| B. | Fund Investment Performance |
The Board considered Fund investment performance as a relevant factor in considering whether to approve the investment advisory agreement. The Board did not view Fund performance as a relevant factor in considering whether to approve the sub-advisory contracts for the Fund, as no Affiliated Sub-Adviser currently manages assets of the Fund.
The Board compared the Fund’s investment performance over multiple time periods ending December 31, 2016 to the performance of funds in the Broadridge performance universe and against the Lipper California Municipal Debt Funds Index. The Board noted that performance of Class A shares of the Fund was in the third quintile of its performance universe for the one and five year periods and the second quintile for the three year period (the first quintile being the best performing funds and the fifth quintile being the worst performing funds). The Board noted that performance of Class A shares of the Fund was below the performance of the Index for the one, three and five year periods. The Trustees also reviewed more recent Fund performance and this review did not change their conclusions.
| C. | Advisory and Sub-Advisory Fees |
The Board compared the Fund’s contractual management fee rate to the contractual management fee rates of funds in the Fund’s Broadridge expense group at a common asset level. The Board noted that the contractual management fee rate for Class A shares of the Fund was at the median contractual
31 Invesco California Tax-Free Income Fund
management fee rate of funds in its expense group. The Board noted that the term “contractual management fee” for funds in the expense group may include both advisory and certain administrative services fees, but that Broadridge does not provide information on a fund by fund basis as to what is included. The Board noted that Invesco Advisers does not separately charge the Invesco Funds for the administrative services included in the term as defined by Broadridge. The Board also reviewed the methodology used by Broadridge in providing expense group information, which includes using each fund’s contractual management fee schedule (including any applicable breakpoints) as reported in the most recent prospectus or statement of additional information for each fund in the expense group.
The Board also compared the Fund’s effective advisory fee rate (the advisory fee rate after advisory fee waivers and before other expense limitations/waivers) to the effective advisory fee rates of other mutual funds advised by Invesco Advisers and its affiliates with investment strategies comparable to those of the Fund, based on asset balances as of December 31, 2016. The Board noted that the Fund’s rate was below the rate of one such closed-end fund.
The Board noted that Invesco Advisers and the Affiliated Sub-Advisers do not manage other client accounts with investment strategies comparable to those of the Fund.
The Board also considered the services that may be provided by the Affiliated Sub-Advisers pursuant to the sub-advisory contracts, as well as the fees payable by Invesco Advisers to the Affiliated Sub-Advisers pursuant to the sub-advisory contracts. The Board also noted that the sub-advisory fees are not paid directly by the Fund, but rather, are payable by Invesco Advisers to the Affiliated Sub-Advisers.
| D. | Economies of Scale and Breakpoints |
The Board considered the extent to which there are economies of scale in the provision of advisory services to the Fund. The Board also considered that the Fund may benefit from economies of scale through contractual breakpoints in the Fund’s advisory fee schedule. The Board noted that the Fund shares directly in economies of scale through lower fees charged by third party service providers based on the combined size of the Invesco Funds advised by Invesco Advisers.
| E. | Profitability and Financial Resources |
The Board reviewed information from Invesco Advisers concerning the costs of the advisory and other services that Invesco Advisers and its affiliates provide to the Fund and the Invesco Funds and the profitability of Invesco Advisers and its affiliates in providing these services. The Board noted that Invesco Advisers continues to operate at a net profit from services Invesco Advisers and its affiliates provide to the Invesco Funds and the Fund. The Board did not deem the level of profits realized by Invesco Advisers and its affiliates from providing services to the Fund to be excessive given the nature, quality and
extent of the services provided. The Board received and accepted information from Invesco Advisers demonstrating that Invesco Advisers and each Affiliated Sub-Adviser are financially sound and have the resources necessary to perform their obligations under the investment advisory agreement and sub-advisory contracts.
| F. | Collateral Benefits to Invesco Advisers and its Affiliates |
The Board considered various other benefits received by Invesco Advisers and its affiliates from the relationship with the Fund, including the fees received for providing transfer agency and distribution services to the Fund. The Board considered comparative information regarding fees charged for these services, including information provided by Broadridge and other independent sources. The Board considered the performance of Invesco Advisers and its affiliates in providing these services and the organizational structure employed to provide these services. The Board also considered that these services are provided to the Fund pursuant to written contracts that are reviewed and approved on an annual basis by the Board; and that the services are required for the operation of the Fund.
The Board considered the benefits realized by Invesco Advisers and the Affiliated Sub-Advisers as a result of portfolio brokerage transactions executed through “soft dollar” arrangements. Invesco Advisers noted that the Fund does not execute brokerage transactions through “soft dollar” arrangements to any significant degree.
The Board considered that the Fund’s uninvested cash and cash collateral from any securities lending arrangements may be invested in money market funds advised by Invesco Advisers pursuant to procedures approved by the Board. The Board noted that Invesco Advisers receives advisory fees from these affiliated money market funds attributable to such investments, although Invesco Advisers has contractually agreed to waive through varying periods the advisory fees payable by the Invesco Funds with respect to certain investments in the affiliated money market funds. The waiver is in an amount equal to 100% of the net advisory fee Invesco Advisers receives from the affiliated money market funds with respect to the Fund’s investment in the affiliated money market funds of uninvested cash, but not cash collateral. The Board concluded that the amount of advisory fees received by Invesco Advisers from the Fund’s investment of cash collateral from any securities lending arrangements in the affiliated money market funds is fair and reasonable.
32 Invesco California Tax-Free Income Fund
Tax Information
Form 1099-DIV, Form 1042-S and other year-end tax information provide shareholders with actual calendar year amounts that should be included in their tax returns. Shareholders should consult their tax advisors.
The following distribution information is being provided as required by the Internal Revenue Code or to meet a specific state’s requirement.
The Fund designates the following amounts or, if subsequently determined to be different, the maximum amount allowable for its fiscal year ended August 31, 2017:
Federal and State Income Tax | ||||
Qualified Dividend Income* | 0.00 | % | ||
Corporate Dividends Received Deduction* | 0.00 | % | ||
Tax-Exempt Interest Dividends* | 100.00 | % | ||
U.S. Treasury Obligations* | 0.00 | % | ||
| * | The above percentages are based on ordinary income dividends paid to shareholders during the Fund’s fiscal year. |
33 Invesco California Tax-Free Income Fund
Proxy Results
A Special Joint Meeting (“Meeting”) of Shareholders of Invesco California Tax-Free Income Fund, an investment portfolio of AIM Counselor Series Trust (Invesco Counselor Series Trust), a Delaware statutory trust (“Trust”), was held on March 9, 2017. The Meeting was held for the following purposes:
| (1) | Elect 15 trustees to the Board, each of whom will serve until his or her successor is elected and qualified. |
| (2) | Approve an amendment to the Trust’s Agreement and Declaration of Trust that would permit fund mergers and other significant transactions upon the Board’s approval but without shareholder approval of such transactions. |
The results of the voting on the above matters were as follows:
| Matters | Votes For | Votes Withheld | ||||||||||||||||
| (1)* | David C. Arch | 1,425,647,604 | 36,521,875 | |||||||||||||||
| James T. Bunch | 1,425,181,099 | 36,988,380 | ||||||||||||||||
| Bruce L. Crockett | 1,425,174,694 | 36,994,785 | ||||||||||||||||
| Jack M. Fields | 1,426,060,874 | 36,108,605 | ||||||||||||||||
| Martin L. Flanagan | 1,426,481,477 | 35,688,002 | ||||||||||||||||
| Cynthia Hostetler | 1,426,489,972 | 35,679,505 | ||||||||||||||||
| Dr. Eli Jones | 1,426,255,832 | 35,913,647 | ||||||||||||||||
| Dr. Prema Mathai-Davis | 1,425,363,789 | 36,805,689 | ||||||||||||||||
| Teresa M. Ressel | 1,426,514,880 | 35,654,598 | ||||||||||||||||
| Dr. Larry Soll | 1,424,932,245 | 37,237,234 | ||||||||||||||||
| Ann Barnett Stern | 1,426,260,049 | 35,909,429 | ||||||||||||||||
| Raymond Stickel, Jr. | 1,425,391,657 | 36,777,822 | ||||||||||||||||
| Philip A. Taylor | 1,426,285,212 | 35,884,267 | ||||||||||||||||
| Robert C. Troccoli | 1,426,075,097 | 36,094,382 | ||||||||||||||||
| Christopher L. Wilson | 1,426,594,956 | 35,574,523 | ||||||||||||||||
| Votes For | Votes Against | Votes Abstain | Broker Non-Votes | |||||||||||||||
| (2)* | Approve an amendment to the Trust’s Agreement and Declaration of Trust that would permit fund mergers and other significant transactions upon the Board’s approval but without shareholder approval of such transactions | 751,302,707 | 79,810,344 | 41,561,890 | 589,495,482 | |||||||||||||
The Meeting was adjourned until April 11, 2017, with respect to the following proposals:
| (3) | Approve changing the fundamental investment restriction regarding the purchase or sale of physical commodities. |
| 4(a) | Approve an amendment to the current Master Intergroup Sub-Advisory Contract to add Invesco PowerShares Capital Management LLC. |
| 4(b) | Approve an amendment to the current Master Intergroup Sub-Advisory Contract to add Invesco Asset Management (India) Private Limited. |
Invesco California Tax-Free Income Fund did not receive sufficient shareholder votes to pass Proposals 3 and 4(a) - (b).
The results of the voting on the above matters were as follows:
| Matters | Votes For | Votes Against | Votes Abstain | Broker Non-Votes | ||||||||||||||
| (3) | Approve changing the fundamental investment restriction regarding the purchase or sale of physical commodities | 11,177,764 | 1,184,377 | 1,197,604 | 5,439,266 | |||||||||||||
| 4(a) | Approve an amendment to the current Master Intergroup Sub-Advisory Contract to add Invesco PowerShares Capital Management LLC | 11,875,296 | 664,549 | 1,019,900 | 5,439,266 | |||||||||||||
| 4(b) | Approve an amendment to the current Master Intergroup Sub-Advisory Contract to add Invesco Asset Management (India) Private Limited | 11,608,913 | 989,921 | 960,910 | 5,439,267 | |||||||||||||
| * | Each of proposal 1 and 2 required approval by a combined vote of all of the portfolios of AIM Counselor Series Trust (Invesco Counselor Series Trust). |
34 Invesco California Tax-Free Income Fund
Trustees and Officers
The address of each trustee and officer is AIM Counselor Series Trust (Invesco Counselor Series Trust) (the “Trust”), 11 Greenway Plaza, Suite 1000, Houston, Texas 77046-1173. The trustees serve for the life of the Trust, subject to their earlier death, incapacitation, resignation, retirement or removal as more specifically provided in the Trust’s organizational documents. Each officer serves for a one year term or until their successors are elected and qualified. Column two below includes length of time served with predecessor entities, if any.
| Name, Year of Birth and Position(s) Held with the Trust | Trustee and/ or Officer Since | Principal Occupation(s) During Past 5 Years | Number of Overseen by | Other Directorship(s) Held by Trustee During Past 5 Years | ||||
| Interested Persons | ||||||||
| Martin L. Flanagan1 — 1960 Trustee | 2007 | Executive Director, Chief Executive Officer and President, Invesco Ltd. (ultimate parent of Invesco and a global investment management firm); Trustee, The Invesco Funds; Vice Chair, Investment Company Institute; and Member of Executive Board, SMU Cox School of Business
Formerly: Advisor to the Board, Invesco Advisers, Inc. (formerly known as Invesco Institutional (N.A.), Inc.); Chairman and Chief Executive Officer, Invesco Advisers, Inc. (registered investment adviser); Director, Chairman, Chief Executive Officer and President, Invesco Holding Company (US), Inc. (formerly IVZ Inc.) (holding company), Invesco Group Services, Inc. (service provider) and Invesco North American Holdings, Inc. (holding company); Director, Chief Executive Officer and President, Invesco Holding Company Limited (parent of Invesco and a global investment management firm); Director, Invesco Ltd.; Chairman, Investment Company Institute and President, Co-Chief Executive Officer, Co-President, Chief Operating Officer and Chief Financial Officer, Franklin Resources, Inc. (global investment management organization) | 144 | None | ||||
Philip A. Taylor2 — 1954 Trustee and Senior Vice President | 2006 | Head of the Americas and Senior Managing Director, Invesco Ltd.; Director, Invesco Advisers, Inc. (formerly known as Invesco Institutional (N.A.), Inc.) (registered investment adviser); Director, Chairman, Chief Executive Officer and President, Invesco Management Group, Inc. (formerly known as Invesco Aim Management Group, Inc.) (financial services holding company); Director and Chairman, Invesco Investment Services, Inc. (formerly known as Invesco Aim Investment Services, Inc.) (registered transfer agent); Chief Executive Officer, Invesco Corporate Class Inc. (corporate mutual fund company); Director, Chairman and Chief Executive Officer, Invesco Canada Ltd. (formerly known as Invesco Trimark Ltd./Invesco Trimark Ltèe) (registered investment adviser and registered transfer agent); Trustee and Senior Vice President, The Invesco Funds; Director, Invesco Investment Advisers LLC (formerly known as Van Kampen Asset Management).
Formerly: Co-Chairman, Co-President and Co-Chief Executive Officer, Invesco Advisers, Inc. (formerly known as Invesco Institutional (N.A.), Inc.) (registered investment adviser); Director, Chief Executive Officer and President, Van Kampen Exchange Corp; President and Principal Executive Officer, The Invesco Funds (other than AIM Treasurer’s Series Trust (Invesco Treasurer’s Series Trust), Short-Term Investments Trust and Invesco Management Trust); Executive Vice President, The Invesco Funds (AIM Treasurer’s Series Trust (Invesco Treasurer’s Series Trust), Short-Term Investments Trust and Invesco Management Trust only); Director and President, INVESCO Funds Group, Inc. (registered investment adviser and registered transfer agent); Director and Chairman, IVZ Distributors, Inc. (formerly known as INVESCO Distributors, Inc.) (registered broker dealer); Director, President and Chairman, Invesco Inc. (holding company), Invesco Canada Holdings Inc. (holding company), Trimark Investments Ltd./Placements Trimark Ltèe and Invesco Financial Services Ltd/Services Financiers Invesco Ltèe; Chief Executive Officer, Invesco Canada Fund Inc. (corporate mutual fund company); Director and Chairman, Van Kampen Investor Services Inc.; Director, Chief Executive Officer and President, 1371 Preferred Inc. (holding company) and Van Kampen Investments Inc.; Director and President, AIM GP Canada Inc. (general partner for limited partnerships) and Van Kampen Advisors, Inc.; Director and Chief Executive Officer, Invesco Trimark Dealer Inc. (registered broker dealer); Director, Invesco Distributors, Inc. (formerly known as Invesco Aim Distributors, Inc.) (registered broker dealer); Manager, Invesco PowerShares Capital Management LLC; Director, Chief Executive Officer and President, Invesco Advisers, Inc.; Director, Chairman, Chief Executive Officer and President, Invesco Aim Capital Management, Inc.; President, Invesco Trimark Dealer Inc. and Invesco Trimark Ltd./Invesco Trimark Ltèe; Director and President, AIM Trimark Corporate Class Inc. and AIM Trimark Canada Fund Inc.; Senior Managing Director, Invesco Holding Company Limited; Director and Chairman, Fund Management Company (former registered broker dealer); President and Principal Executive Officer, The Invesco Funds (AIM Treasurer’s Series Trust (Invesco Treasurer’s Series Trust), and Short-Term Investments Trust only); President, AIM Trimark Global Fund Inc. and AIM Trimark Canada Fund Inc. | 144 | None |
| 1 | Mr. Flanagan is considered an interested person (within the meaning of Section 2(a)(19) of the 1940 Act) of the Trust because he is an officer of the Adviser to the Trust, and an officer and a director of Invesco Ltd., ultimate parent of the Adviser. |
| 2 | Mr. Taylor is considered an interested person (within the meaning of Section 2(a)(19) of the 1940 Act) of the Trust because he is an officer and a director of the Adviser. |
T-1 Invesco California Tax-Free Income Fund
Trustees and Officers—(continued)
| Name, Year of Birth and Position(s) Held with the Trust | Trustee and/ or Officer Since | Principal Occupation(s) During Past 5 Years | Number of Complex Overseen by Trustee | Other Directorship(s) Held by Trustee During | ||||
| Independent Trustees | ||||||||
Bruce L. Crockett — 1944 Trustee and Chair | 2003 | Chairman, Crockett Technologies Associates (technology consulting company)
Formerly: Director, Captaris (unified messaging provider); Director, President and Chief Executive Officer, COMSAT Corporation; Chairman, Board of Governors of INTELSAT (international communications company); ACE Limited (insurance company); Independent Directors Council and Investment Company Institute: Member of the Audit Committee, Investment Company Institute; Member of the Executive Committee and Chair of the Governance Committee, Independent Directors Council | 144 | Director and Chairman of the Audit Committee, ALPS (Attorneys Liability Protection Society) (insurance company); Director and Member of the Audit Committee, Ferroglobe PLC (metallurgical company) | ||||
David C. Arch — 1945 Trustee | 2010 | Chairman of Blistex Inc. (consumer health care products manufacturer); Member, World Presidents’ Organization | 144 | Board member of the Illinois Manufacturers’ Association | ||||
James T. Bunch — 1942 Trustee | 2000 | Managing Member, Grumman Hill Group LLC (family office/private equity investments)
Formerly: Chairman of the Board, Denver Film Society; Chairman of the Board of Trustees, Evans Scholarship Foundation; Chairman, Board of Governors, Western Golf Association | 144 | Trustee, Evans Scholarship Foundation | ||||
Jack M. Fields — 1952 Trustee | 2003 | Chief Executive Officer, Twenty First Century Group, Inc. (government affairs company); and Discovery Learning Alliance (non-profit)
Formerly: Owner and Chief Executive Officer, Dos Angeles Ranch L.P. (cattle, hunting, corporate entertainment); Director, Insperity, Inc. (formerly known as Administaff); Chief Executive Officer, Texana Timber LP (sustainable forestry company); Director of Cross Timbers Quail Research Ranch (non-profit); and member of the U.S. House of Representatives | 144 | None | ||||
Cynthia Hostetler — 1962 Trustee | 2017 | Non-Executive Director and Trustee of a number of public and private business corporations
Formerly: Head of Investment Funds and Private Equity, Overseas Private Investment Corporation; President, First Manhattan Bancorporation, Inc.; Attorney, Simpson Thacher & Bartlett LLP | 144 | Vulcan Materials Company (construction materials company); Trilinc Global Impact Fund; Aberdeen Investment Funds (4 portfolios); Artio Global Investment LLC (mutual fund complex); Edgen Group, Inc. (specialized energy and infrastructure products distributor) | ||||
Eli Jones — 1961 Trustee | 2016 | Professor and Dean, Mays Business School — Texas A&M University
Formerly: Professor and Dean, Walton College of Business, University of Arkansas and E.J. Ourso College of Business, Louisiana State University; Director, Arvest Bank | 144 | Insperity, Inc. (formerly known as Administaff) (human resources provider) | ||||
Prema Mathai-Davis — 1950 Trustee | 2003 | Retired.
Formerly: Chief Executive Officer, YWCA of the U.S.A. | 144 | None | ||||
Teresa M. Ressel — 1962 Trustee | 2017 | Non-executive director and trustee of a number of public and private business corporations
Formerly: Chief Financial Officer, Olayan America, The Olayan Group (international investor/commercial/industrial); Chief Executive Officer, UBS Securities LLC; Group Chief Operating Officer, Americas, UBS AG; Assistant Secretary for Management & Budget and CFO, US Department of the Treasury; Chief Compliance Officer, Kaiser Permanente; Program Manager, Hewlett-Packard; Nuclear Engineering, General Dynamics Corporation | 144 | Atlantic Power Corporation (power generation company); ON Semiconductor Corp. (semiconductor supplier) | ||||
Larry Soll — 1942 Trustee | 1997 | Retired.
Formerly: Chairman, Chief Executive Officer and President, Synergen Corp. (a biotechnology company) | 144 | None | ||||
Ann Barnett Stern — 1957 Trustee | 2017 | President and Chief Executive Officer, Houston Endowment Inc. (private philanthropic institution)
Formerly: Executive Vice President and General Counsel, Texas Children’s Hospital; Attorney, Beck, Redden and Secrest, LLP; Business Law Instructor, University of St. Thomas; Attorney, Andrews & Kurth LLP | 144 | Federal Reserve Bank of Dallas | ||||
Raymond Stickel, Jr. — 1944 Trustee | 2005 | Retired.
Formerly: Director, Mainstay VP Series Funds, Inc. (25 portfolios); Partner, Deloitte & Touche | 144 | None | ||||
Robert C. Troccoli — 1949 Trustee | 2016 | Adjunct Professor, University of Denver — Daniels College of Business
Formerly: Senior Partner, KPMG LLP | 144 | None | ||||
Christopher L. Wilson — 1957 Trustee | 2017 | Managing Partner, CT2, LLC (investing and consulting firm)
Formerly: President/Chief Executive Officer, Columbia Funds, Bank of America Corporation; President/Chief Executive Officer, CDC IXIS Asset Management Services, Inc.; Principal & Director of Operations, Scudder Funds, Scudder, Stevens & Clark, Inc.; Assistant Vice President, Fidelity Investments | 144 | TD Asset Management USA Inc. (mutual fund complex) (22 portfolios); ISO New England, Inc. (non-profit organization managing regional electricity market) |
T-2 Invesco California Tax-Free Income Fund
Trustees and Officers—(continued)
| Name, Year of Birth and Position(s) Held with the Trust | Trustee and/ or Officer Since | Principal Occupation(s) During Past 5 Years | Number of Complex Overseen by Trustee | Other Directorship(s) Held by Trustee During | ||||
| Other Officers | ||||||||
Sheri Morris — 1964 President, Principal Executive Officer and Treasurer | 2003 | President, Principal Executive Officer and Treasurer, The Invesco Funds; Vice President, Invesco Advisers, Inc. (formerly known as Invesco Institutional (N.A.), Inc.) (registered investment adviser); and Vice President, PowerShares Exchange-Traded Fund Trust, PowerShares Exchange-Traded Fund Trust II, PowerShares India Exchange-Traded Fund Trust, PowerShares Actively Managed Exchange-Traded Fund Trust and PowerShares Actively Managed Exchange-Traded Commodity Fund Trust
Formerly: Vice President and Principal Financial Officer, The Invesco Funds; Vice President, Invesco Aim Advisers, Inc., Invesco Aim Capital Management, Inc. and Invesco Aim Private Asset Management, Inc.; Assistant Vice President and Assistant Treasurer, The Invesco Funds and Assistant Vice President, Invesco Advisers, Inc., Invesco Aim Capital Management, Inc. and Invesco Aim Private Asset Management, Inc.; and Treasurer, PowerShares Exchange-Traded Fund Trust, PowerShares Exchange-Traded Fund Trust II, PowerShares India Exchange-Traded Fund Trust and PowerShares Actively Managed Exchange-Traded Fund Trust | N/A | N/A | ||||
Russell C. Burk — 1958 Senior Vice President and Senior Officer | 2005 | Senior Vice President and Senior Officer, The Invesco Funds | N/A | N/A | ||||
John M. Zerr — 1962 Senior Vice President, Chief Legal Officer and Secretary | 2006 | Director, Senior Vice President, Secretary and General Counsel, Invesco Management Group, Inc. (formerly known as Invesco AIM Management Group, Inc.); Senior Vice President, Invesco Advisers, Inc. (formerly known as Invesco Institutional (N.A.), Inc.) (registered investment adviser); Senior Vice President and Secretary, Invesco Distributors, Inc. (formerly known as Invesco AIM Distributors, Inc.); Director, Vice President and Secretary, Invesco Investment Services, Inc. (formerly known as Invesco AIM Investment Services, Inc.) Senior Vice President, Chief Legal Officer and Secretary, The Invesco Funds; Managing Director, Invesco PowerShares Capital Management LLC; Director, Secretary and General Counsel, Invesco Investment Advisers LLC (formerly known as Van Kampen Asset Management); Secretary and General Counsel, Invesco Capital Markets, Inc. (formerly known as Van Kampen Funds Inc.) and Chief Legal Officer, PowerShares Exchange-Traded Fund Trust, PowerShares Exchange-Traded Fund Trust II, PowerShares India Exchange-Traded Fund Trust, PowerShares Actively Managed Exchange-Traded Fund Trust and PowerShares Actively Managed Exchange-Traded Commodity Fund Trust; Manager and Secretary, Invesco Indexing LLC
Formerly: Director, Secretary, General Counsel and Senior Vice President, Van Kampen Exchange Corp.; Director, Vice President and Secretary, IVZ Distributors, Inc. (formerly known as INVESCO Distributors, Inc.); Director and Vice President, INVESCO Funds Group, Inc.; Director and Vice President, Van Kampen Advisors Inc.; Director, Vice President, Secretary and General Counsel, Van Kampen Investor Services Inc.; Director, Invesco Distributors, Inc. (formerly known as Invesco AIM Distributors, Inc.); Director, Senior Vice President, General Counsel and Secretary, Invesco AIM Advisers, Inc. and Van Kampen Investments Inc.; Director, Vice President and Secretary, Fund Management Company; Director, Senior Vice President, Secretary, General Counsel and Vice President, Invesco AIM Capital Management, Inc.; Chief Operating Officer and General Counsel, Liberty Ridge Capital, Inc. (an investment adviser); Vice President and Secretary, PBHG Funds (an investment company) and PBHG Insurance Series Fund (an investment company); Chief Operating Officer, General Counsel and Secretary, Old Mutual Investment Partners (a broker-dealer); General Counsel and Secretary, Old Mutual Fund Services (an administrator) and Old Mutual Shareholder Services (a shareholder servicing center); Executive Vice President, General Counsel and Secretary, Old Mutual Capital, Inc. (an investment adviser); and Vice President and Secretary, Old Mutual Advisors Funds (an investment company) | N/A | N/A | ||||
Gregory G. McGreevey — 1962 Senior Vice President | 2012 | Senior Managing Director, Invesco Ltd.; Director, Chairman, President, and Chief Executive Officer, Invesco Advisers, Inc. (formerly known as Invesco Institutional (N.A.), Inc.) (registered investment adviser); Director, Invesco Mortgage Capital, Inc. and Invesco Senior Secured Management, Inc.; and Senior Vice President, The Invesco Funds
Formerly: Assistant Vice President, The Invesco Funds | N/A | N/A | ||||
Kelli Gallegos — 1970 Vice President, Principal Financial Officer and Assistant Treasurer | 2008 | Vice President, Principal Financial Officer and Assistant Treasurer, The Invesco Funds; Assistant Treasurer, Invesco PowerShares Capital Management LLC, PowerShares Exchange-Traded Fund Trust, PowerShares Exchange-Traded Fund Trust II, PowerShares India Exchange-Traded Fund Trust, PowerShares Actively Managed Exchange-Traded Fund Trust and PowerShares Actively Managed Exchange-Traded Commodity Fund Trust
Formerly: Assistant Vice President, The Invesco Funds | N/A | N/A |
T-3 Invesco California Tax-Free Income Fund
Trustees and Officers—(continued)
| Name, Year of Birth and Position(s) Held with the Trust | Trustee and/ or Officer Since | Principal Occupation(s) During Past 5 Years | Number of Complex Overseen by Trustee | Other Directorship(s) Held by Trustee During | ||||
| Other Officers—(continued) | ||||||||
Tracy Sullivan — 1962 Vice President, Chief Tax Officer and Assistant Treasurer | 2008 | Vice President, Chief Tax Officer and Assistant Treasurer, The Invesco Funds; Assistant Treasurer, Invesco PowerShares Capital Management LLC, PowerShares Exchange-Traded Fund Trust, PowerShares Exchange-Traded Fund Trust II, PowerShares India Exchange-Traded Fund Trust, PowerShares Actively Managed Exchange-Traded Fund Trust and PowerShares Actively Managed Exchange-Traded Commodity Fund Trust
Formerly: Assistant Vice President, The Invesco Funds | N/A | N/A | ||||
Crissie M. Wisdom — 1969 Anti-Money Laundering Compliance Officer | 2013 | Anti-Money Laundering Compliance Officer, Invesco Advisers, Inc. (formerly known as Invesco Institutional (N.A.), Inc.) (registered investment adviser), Invesco Capital Markets, Inc. (formerly known as Van Kampen Funds Inc.), Invesco Distributors, Inc., Invesco Investment Services, Inc., Invesco Management Group, Inc., The Invesco Funds, and PowerShares Exchange-Traded Fund Trust, PowerShares Exchange-Traded Fund Trust II, PowerShares India Exchange-Traded Fund Trust, PowerShares Actively Managed Exchange-Traded Fund Trust and PowerShares Actively Managed Exchange-Traded Commodity Fund Trust; Anti-Money Laundering Compliance Officer and Bank Secrecy Act Officer, INVESCO National Trust Company and Invesco Trust Company; and Fraud Prevention Manager and Controls and Risk Analysis Manager for Invesco Investment Services, Inc.
Formerly: Anti-Money Laundering Compliance Officer, Van Kampen Exchange Corp. | N/A | N/A | ||||
Robert R. Leveille — 1969 Chief Compliance Officer | 2016 | Chief Compliance Officer, Invesco Advisers, Inc. (registered investment adviser); and Chief Compliance Officer, The Invesco Funds
Formerly: Chief Compliance Officer, Putnam Investments and the Putnam Funds | N/A | N/A |
The Statement of Additional Information of the Trust includes additional information about the Fund’s Trustees and is available upon request, without charge, by calling 1.800.959.4246. Please refer to the Fund’s Statement of Additional Information for information on the Fund’s sub-advisers.
Office of the Fund 11 Greenway Plaza, Suite 1000 Houston, TX 77046-1173 | Investment Adviser Invesco Advisers, Inc. 1555 Peachtree Street, N.E. Atlanta, GA 30309 | Distributor Invesco Distributors, Inc. 11 Greenway Plaza, Suite 1000 Houston, TX 77046-1173 | Auditors PricewaterhouseCoopers LLP 1000 Louisiana Street, Suite 5800 Houston, TX 77002-5678 | |||
Counsel to the Fund Stradley Ronon Stevens & Young, LLP 2005 Market Street, Suite 2600 Philadelphia, PA 19103-7018 | Counsel to the Independent Trustees Goodwin Procter LLP 901 New York Avenue, N.W. Washington, D.C. 20001 | Transfer Agent Invesco Investment Services, Inc. 11 Greenway Plaza, Suite 1000 Houston, TX 77046-1173 | Custodian State Street Bank and Trust Company 225 Franklin Street Boston, MA 02110-2801 | |||
T-4 Invesco California Tax-Free Income Fund
Explore High-Conviction Investing with Invesco

Go paperless with eDelivery
Visit invesco.com/edelivery to enjoy the convenience and security of anytime electronic access to your investment documents.
With eDelivery, you can elect to have any or all of the following materials delivered straight to your inbox to download, save and print from your own computer:
∎ Fund reports and prospectuses
∎ Quarterly statements
∎ Daily confirmations
∎ Tax forms
Invesco mailing information
Send general correspondence to Invesco Investment Services, Inc., P.O. Box 219078, Kansas City, MO 64121-9078.
Important notice regarding delivery of security holder documents
To reduce Fund expenses, only one copy of most shareholder documents may be mailed to shareholders with multiple accounts at the same address (Householding). Mailing of your shareholder documents may be householded indefinitely unless you instruct us otherwise. If you do not want the mailing of these documents to be combined with those for other members of your household, please contact Invesco Investment Services, Inc. at 800 959 4246 or contact your financial institution. We will begin sending you individual copies for each account within 30 days after receiving your request.
Fund holdings and proxy voting information
The Fund provides a complete list of its holdings four times in each fiscal year, at the quarter ends. For the second and fourth quarters, the lists appear in the Fund’s semiannual and annual reports to shareholders. For the first and third quarters, the Fund files the lists with the Securities and Exchange Commission (SEC) on Form N-Q. The most recent list of portfolio holdings is available at invesco.com/completeqtrholdings. Shareholders can also look up the Fund’s Forms N-Q on the SEC website at sec.gov. Copies of the Fund’s Forms N-Q may be reviewed and copied at the SEC Public Reference Room in Washington, D.C. You can obtain information on the operation of the Public Reference Room, including information about duplicating fee charges, by calling 202 551 8090 or 800 732 0330, or by electronic request at the following email address: publicinfo@sec.gov.
The SEC file numbers for the Fund are shown below.
A description of the policies and procedures that the Fund uses to determine how to vote proxies relating to portfolio securities is available without charge, upon request, from our Client Services department at 800 959 4246 or at invesco.com/proxyguidelines.
The information is also available on the SEC website, sec.gov.
Information regarding how the Fund voted proxies related to its portfolio securities during the most recent 12-month period ended June 30 is available at invesco.com/proxysearch. The information is also available on the SEC website, sec.gov. Invesco Advisers, Inc. is an investment adviser; it provides investment advisory services to individual and institutional clients and does not sell securities. Invesco Distributors, Inc. is the US distributor for Invesco Ltd.’s retail mutual funds, exchange-traded funds and institutional money market funds. Both are wholly owned, indirect subsidiaries of Invesco Ltd. |  |
SEC file numbers: 811-09913 and 333-36074 Invesco Distributors, Inc. MS-CTFI-AR-1 10132017 0918
| ||||
 |
Annual Report to Shareholders
|
August 31, 2017 | ||
| ||||
Invesco Core Plus Bond Fund
| ||||
| Nasdaq: | ||||
| A: ACPSX ∎ B: CPBBX ∎ C: CPCFX ∎ R: CPBRX ∎ Y: CPBYX ∎ R5: CPIIX ∎ R6: CPBFX | ||||

Letters to Shareholders
Philip Taylor
| Dear Shareholders: This annual report includes information about your Fund, including performance data and a complete list of its investments as of the close of the reporting period. Inside is a discussion of how your Fund was managed and the factors that affected its performance during the reporting period. The reporting period began with stock market volatility in the US and abroad, largely the result of uncertainty about global economic growth and monetary policy. While economic data in the US were generally positive, news overseas was less upbeat. The European Central Bank and central banks in China and Japan – as well as other countries – maintained extraordinarily accommodative monetary policies in response to economic weakness. Citing | |
| generally positive economic data – specifically, realized and expected labor market conditions and inflation – the US Federal Reserve raised interest rates three times during the reporting period: in December 2016, and in March and June 2017. The major US stock market rally that began in November 2016 continued through the end of the reporting period, with major stock market indexes repeatedly hitting new record highs. | ||

Short-term market volatility can prompt some investors to abandon their investment plans – and can cause others to settle for whatever returns the market has to offer. The investment professionals at Invesco, in contrast, invest with high conviction. This means that, no matter the asset class or the strategy, each investment team has a passion to exceed. We want to help investors achieve better outcomes, such as seeking higher returns, helping mitigate risk and generating income. Of course, investing with high conviction can’t guarantee a profit or ensure success; no investment strategy can. To learn more about how we invest with high conviction, visit invesco.com/HighConviction.
You, too, can invest with high conviction by maintaining a long-term investment perspective and by working with your financial adviser on a regular basis. During periods of short-term market volatility or uncertainty, your financial adviser can keep you focused on your long-term investment goals – a new home, a child’s college education or a secure retirement. He or she also can share research about the economy, the markets and individual investment options.
Visit our website for more information on your investments
Our website, invesco.com/us, offers a wide range of market insights and investment perspectives. On the website, you’ll find detailed information about our funds, including performance, holdings and portfolio manager commentaries. You can access information about your account by completing a simple, secure online registration. To do so, select “Log In” on the right side of the homepage, and then select “Register for Individual Account Access.”
In addition to the resources accessible on our website and through our mobile app, you can obtain timely updates to help you stay informed about the markets and the economy by connecting with Invesco on Twitter, LinkedIn or Facebook. You can access our blog at blog.invesco.us.com. Our goal is to provide you the information you want, when and where you want it.
Finally, I’m pleased to share with you Invesco’s commitment to both the Principles for Responsible Investment and to considering environmental, social and governance issues in our robust investment process. I invite you to learn more at invesco.com/esg.
Have questions?
For questions about your account, contact an Invesco client services representative at 800 959 4246. For Invesco-related questions or comments, please email me directly at phil@invesco.com.
All of us at Invesco look forward to serving your investment management needs. Thank you for investing with us.
Sincerely,

Philip Taylor
Senior Managing Director, Invesco Ltd.
| 2 | Invesco Core Plus Bond Fund |
Bruce Crockett
| Dear Fellow Shareholders: Among the many important lessons I’ve learned in more than 40 years in a variety of business endeavors is the value of a trusted advocate. As independent chair of the Invesco Funds Board, I can assure you that the members of the Board are strong advocates for the interests of investors in Invesco’s mutual funds. We work hard to represent your interests through oversight of the quality of the investment management services your funds receive and other matters important to your investment, including but not limited to: ∎ Ensuring that Invesco offers a diverse lineup of mutual funds that your financial adviser can use to strive to meet your financial needs as your investment goals change over time. ∎ Monitoring how the portfolio management teams of the Invesco funds are performing in light of changing economic and market conditions. |

∎ Assessing each portfolio management team’s investment performance within the context of the investment strategy described in the fund’s prospectus.
∎ Monitoring for potential conflicts of interests that may impact the nature of the services that your funds receive.
We believe one of the most important services we provide our fund shareholders is the annual review of the funds’ advisory and sub-advisory contracts with Invesco Advisers and its affiliates. This review is required by the Investment Company Act of 1940 and focuses on the nature and quality of the services Invesco provides as the adviser to the Invesco funds and the reasonableness of the fees that it charges for those services. Each year, we spend months carefully reviewing information received from Invesco and a variety of independent sources, such as performance and fee data prepared by Lipper, Inc. (a subsidiary of Broadridge Financial Solutions, Inc.), an independent, third-party firm widely recognized as a leader in its field. We also meet with our independent legal counsel and other independent advisers to review and help us assess the information that we have received. Our goal is to assure that you receive quality investment management services for a reasonable fee.
I trust the measures outlined above provide assurance that you have a worthy advocate when it comes to choosing the Invesco Funds.
As always, please contact me at bruce@brucecrockett.com with any questions or concerns you may have. On behalf of the Board, we look forward to continuing to represent your interests and serving your needs.
Sincerely,

Bruce L. Crockett
Independent Chair
Invesco Funds Board of Trustees
| 3 | Invesco Core Plus Bond Fund |
Management’s Discussion of Fund Performance
Performance summary For the fiscal year ended August 31, 2017, Class A shares of Invesco Core Plus Bond Fund (the Fund), at net asset value (NAV), outperformed the Fund’s broad market/style-specific index, the Bloomberg Barclays U.S. Aggregate Index. Your Fund’s long-term performance appears later in this report.
|
| |||
Fund vs. Indexes |
| |||
Total returns, 8/31/16 to 8/31/17, at net asset value (NAV). Performance shown does not include applicable contingent deferred sales charges (CDSC) or front-end sales charges, which would have reduced performance.
|
| |||
Class A Shares | 2.88 | % | ||
Class B Shares | 2.02 | |||
Class C Shares | 2.02 | |||
Class R Shares | 2.53 | |||
Class Y Shares | 3.04 | |||
Class R5 Shares | 3.08 | |||
Class R6 Shares | 3.12 | |||
Bloomberg Barclays U.S. Aggregate Indexq (Broad Market/Style-Specific Index) | 0.49 | |||
Lipper Core Plus Bond Funds Index∎ (Peer Group Index) | 2.27 | |||
Source(s): qFactSet Research Systems Inc.; ∎Lipper Inc.
| ||||
Market conditions and your Fund
Positive economic growth in the US continued at a slightly higher pace than the prior fiscal year. The US economy continued to add jobs, keeping the unemployment rate near 4.5% while inflation remained subdued.1 Against this backdrop, the US Federal Reserve (the Fed) raised the federal funds target rate from a range of 0.25% to 0.50% at the start of the reporting period to a range of 1.00% to 1.25% at the close of the reporting period. This was accomplished with three 0.25% rate hikes in December 2016, and in March and June 2017.2 The three quarter-point increases marked just the second, third and fourth rate hikes over the last decade.2 Working against these positive developments, however, were global macroeconomic headwinds in the form of slower global growth, suboptimal inflation, and the lingering impact of Brexit – the decision by UK voters to leave the European Union. These headwinds, coupled with continued low US inflation, could limit future Fed rate hikes in the near-term. Bank of Japan
and the European Central Bank maintained their negative interest rates in an attempt to stimulate growth by encouraging investors to spend rather than save. These actions continued to drive overseas investments into higher yielding segments of the fixed income markets like US and emerging market (EM) debt.
The US 10-year Treasury yield continued to inch upward at the start of the reporting period3 and spiked following the US presidential election, forcing bond returns into negative territory. As normalcy returned to the markets, longer-term yields fell steadily throughout the rest of the reporting period as inflation and long-term growth forecasts tempered expectations. The 10-year US Treasury yield ended the reporting period at 2.12%, 54 basis points lower than at the beginning of the fiscal year.3 (A basis point is one one-hundredth of a percentage point.)
The broader bond market, as represented by the Bloomberg Barclays U.S. Aggregate Bond Index, gained 0.49% for the reporting period. Muted performance was largely
attributable to the volatility in US Treasury yields over the reporting period. Government-related, corporate and securitized sectors posted positive returns for the fiscal year while Treasury returns were negative. Out-of-index exposure, such as high yield and EM debt, provided strong gains despite concerns over global growth, volatile commodity prices and a series of Fed interest rate hikes. Helping to support returns in high yield and EM debt were very accommodative central bank policies and signs of recovery in various EM economies.
The Fund, at NAV, generated positive returns for the reporting period and outperformed its broad market/style-specific benchmark. Overweight exposure to investment grade credit, particularly focused within the energy sector, was one of the most notable contributors to the Fund’s relative performance during the reporting period. Overweight exposure to and security selection in commercial mortgage-backed securities, particularly non-agency securities, also added to Fund performance relative to the Fund’s broad market/style-specific index. The Fund’s out-of-index exposure to high yield and EM debt during the reporting period also contributed to the Fund’s relative performance. Security selection in the basic industry sector was the most notable detractor from relative Fund performance. Out-of-index exposure to US Treasury inflation protected securities (TIPS) also detracted from the Fund’s relative performance during the reporting period, given persistently low inflation and TIPS’ underperformance relative to nominal Treasury bonds. The Fund’s allocation to cash holdings was a drag on relative performance as we took gains, sold riskier holdings and awaited better opportunities to deploy cash toward the end of the reporting period.
The Fund benefited from incremental income earned from transactions in the
Portfolio Composition |
By security type | % of total net assets |
U.S. Dollar Denominated Bonds & Notes | 49.5 | % | ||
Asset-Backed Securities | 14.0 | |||
U.S. Government Sponsored Agency Mortgage-Backed Securities |
| 14.4 |
| |
U.S. Treasury Securities | 13.7 | |||
Securities each less than 1% portfolio | 0.9 | |||
Money Market Funds Plus Other Assets Less Liabilities
|
| 7.5
|
| |
Top Five Debt Issuers |
| % of total net assets |
1. U.S. Treasury | 13.7 | % | ||
2. Federal National Mortgage Association | 6.0 | |||
3. Federal Home Loan Mortgage Corp. | 5.2 | |||
4. Government National Mortgage Association | 2.9 | |||
5. AerCap Global Aviation Trust
|
| 1.4
|
| |
Total Net Assets | $ | 3.4 billion |
Total Number of Holdings*
|
| 880
|
| |
| The Fund’s holdings are subject to change, and there is no assurance that the Fund will continue to hold any particular security. | ||||
| *Excluding money market fund holdings. | ||||
Data presented here are as of August 31, 2017. |
| |||
| 4 | Invesco Core Plus Bond Fund |
highly liquid to-be-announced (TBA) market for agency mortgage-backed securities (MBS). Such transactions involve the Fund selling an MBS to a financial institution, with an agreement to repurchase a substantially similar security at an agreed upon price and date. Cash received by the Fund as a result of this repurchase transaction may be invested in short-term instruments, and the income from these investments, together with any additional fee income received from this activity, generates income for the Fund.
The Fund also may use active duration and yield curve positioning for risk management and for generating excess return versus its broad market/style-spe-cific benchmark. Duration measures a portfolio’s price sensitivity to interest rate changes. Yield curve positioning refers to actively emphasizing particular points (maturities) along the yield curve with favorable risk-return expectations. Duration of the portfolio was maintained close to that of the benchmark, on average, and the timing of changes and the degree of variance from the Fund’s benchmark during the reporting period provided a small boost to relative returns. Buying and selling US Treasury futures and interest rate swaptions were important tools used for the management of interest rate risk and to maintain our targeted portfolio duration.
Part of the Fund’s strategy to manage credit and currency risk in the portfolio during the reporting period entailed purchasing and selling credit and currency derivatives. We sought to manage credit market risk by purchasing and selling protection through credit default swaps at various points throughout the fiscal year. The currency management was carried out via currency forwards and options on an as-needed basis and we believe this was effective in managing the currency positioning within the Fund.
We wish to remind you that the Fund is subject to interest rate risk, meaning when interest rates rise, the value of fixed income securities tends to fall. The risk may be greater in the current market environment because interest rates are at or near historic lows. The degree to which the value of fixed income securities may decline due to rising interest
rates may vary depending on the speed and magnitude of the increase in interest rates, as well as individual security characteristics such as price, maturity, duration and coupon and market forces such as supply and demand for similar securities. We are monitoring interest rates, as well as the market, economic and geopolitical factors that may impact the direction, speed and magnitude of changes to interest rates across the maturity spectrum, including the potential impact of monetary policy changes by the Fed and certain foreign central banks. If interest rates rise, markets may experience increased volatility, which may affect the value and/or liquidity of certain of the Fund’s investments.
Thank you for investing in Invesco Core Plus Bond Fund and for sharing our long-term investment horizon.
| 1 | Source: Bureau of Labor Statistics |
| 2 | Source: US Federal Reserve |
| 3 | Source: US Treasury Department |
The views and opinions expressed in management’s discussion of Fund performance are those of Invesco Advisers, Inc. These views and opinions are subject to change at any time based on factors such as market and economic conditions. These views and opinions may not be relied upon as investment advice or recommendations, or as an offer for a particular security. The information is not a complete analysis of every aspect of any market, country, industry, security or the Fund. Statements of fact are from sources considered reliable, but Invesco Advisers, Inc. makes no representation or warranty as to their completeness or accuracy. Although historical performance is no guarantee of future results, these insights may help you understand our investment management philosophy.
See important Fund and, if applicable, index disclosures later in this report.
 | Matt Brill Chartered Financial Analyst, Portfolio Manager, is manager of Invesco Core Plus Bond Fund. He joined Invesco | |
| in 2013. Mr. Brill earned a BA in economics from Washington and Lee University. | ||
 | Chuck Burge Portfolio Manager, is manager of Invesco Core Plus Bond Fund. He joined Invesco in 2002. Mr. Burge earned a BS in | |
| economics from Texas A&M University and an MBA in finance and accounting from Rice University. | ||
 | Michael Hyman Portfolio Manager, is manager of Invesco Core Plus Bond Fund. He joined Invesco in 2013. Mr. Hyman earned a | |
| BSE in finance from Pennsylvania State University and an MBA from the Stern School of Business at New York University. | ||
 | Joseph Portera Portfolio Manager, is manager of Invesco Core Plus Bond Fund. He joined Invesco in 2012. Mr. Portera | |
| earned BA and MA degrees in Soviet studies and an MA in international political economy and development from Fordham University. | ||
 | Rashique Rahman Portfolio Manager, is manager of Invesco Core Plus Bond Fund. Mr. Rahman is the Head of Emerging Markets for | |
| Invesco Fixed Income. He joined Invesco in 2014. Mr. Rahman did undergraduate work at the University of California, Los Angeles, and earned an MA and an MBA from Columbia University. | ||
 | Scott Roberts Chartered Financial Analyst, Portfolio Manager, is manager of Invesco Core Plus Bond Fund. He joined Invesco | |
| in 2000. Mr. Roberts earned a BBA in finance from the University of Houston. | ||
 | Robert Waldner Chartered Financial Analyst, Portfolio Manager, is manager of Invesco Core Plus Bond Fund. He joined Invesco | |
| in 2013. Mr. Waldner earned a BSE degree in civil engineering from Princeton University. | ||
| 5 | Invesco Core Plus Bond Fund |
Your Fund’s Long-Term Performance
Results of a $10,000 Investment — Oldest Share Class(es) since Inception
Fund and index data from 6/3/09
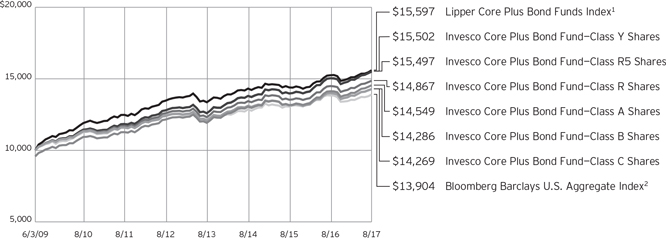
| 1 | Source: Lipper Inc. |
| 2 | Source: FactSet Research Systems Inc. |
Past performance cannot guarantee comparable future results.
The data shown in the chart include reinvested distributions, applicable sales charges and Fund expenses including management fees. Results for Class B shares are calculated as if a hypothetical shareholder had
liquidated his entire investment in the Fund at the close of the reporting period and paid the contingent deferred sales charges, if applicable. Index results include reinvested dividends, but they do not reflect sales charges. Performance of the peer group, if applicable, reflects fund expenses
and management fees; performance of a market index does not. Performance shown in the chart and table(s) does not reflect deduction of taxes a shareholder would pay on Fund distributions or sale of Fund shares.
| 6 | Invesco Core Plus Bond Fund |
Average Annual Total Returns |
| |||
As of 8/31/17, including maximum applicable sales charges |
| |||
Class A Shares | ||||
Inception (6/3/09) | 4.65 | % | ||
5 Years | 2.74 | |||
1 Year | -1.49 | |||
Class B Shares | ||||
Inception (6/3/09) | 4.42 | % | ||
5 Years | 2.49 | |||
1 Year | -2.97 | |||
Class C Shares | ||||
Inception (6/3/09) | 4.41 | % | ||
5 Years | 2.87 | |||
1 Year | 1.02 | |||
Class R Shares | ||||
Inception (6/3/09) | 4.93 | % | ||
5 Years | 3.37 | |||
1 Year | 2.53 | |||
Class Y Shares | ||||
Inception (6/3/09) | 5.46 | % | ||
5 Years | 3.90 | |||
1 Year | 3.04 | |||
Class R5 Shares | ||||
Inception (6/3/09) | 5.46 | % | ||
5 Years | 3.91 | |||
1 Year | 3.08 | |||
Class R6 Shares | ||||
Inception | 5.39 | % | ||
5 Years | 3.96 | |||
1 Year
|
| 3.12
|
| |
Average Annual Total Returns |
| |||
As of 6/30/17, the most recent calendar quarter end, including maximum applicable sales charges |
| |||
Class A Shares | ||||
Inception (6/3/09) | 4.57 | % | ||
5 Years | 2.91 | |||
1 Year | -1.60 | |||
Class B Shares | ||||
Inception (6/3/09) | 4.34 | % | ||
5 Years | 2.66 | |||
1 Year | -3.05 | |||
Class C Shares | ||||
Inception (6/3/09) | 4.34 | % | ||
5 Years | 3.01 | |||
1 Year | 1.04 | |||
Class R Shares | ||||
Inception (6/3/09) | 4.86 | % | ||
5 Years | 3.53 | |||
1 Year | 2.54 | |||
Class Y Shares | ||||
Inception (6/3/09) | 5.39 | % | ||
5 Years | 4.04 | |||
1 Year | 2.96 | |||
Class R5 Shares | ||||
Inception (6/3/09) | 5.39 | % | ||
5 Years | 4.05 | |||
1 Year | 3.09 | |||
Class R6 Shares | ||||
Inception | 5.32 | % | ||
5 Years | 4.11 | |||
1 Year
|
| 3.14
|
| |
Class R6 shares incepted on September 24, 2012. Performance shown prior to that date is that of Class A shares and includes the 12b-1 fees applicable to Class A shares.
The performance data quoted represent past performance and cannot guarantee comparable future results; current performance may be lower or higher. Please visit invesco.com/performance for the most recent month-end performance. Performance figures reflect reinvested distributions, changes in net asset value and the effect of the maximum sales charge unless otherwise stated. Investment return and principal value will fluctuate so that you may have a gain or loss when you sell shares.
The net annual Fund operating expense ratio set forth in the most recent Fund prospectus as of the date of this report for Class A, Class B, Class C, Class R, Class Y, Class R5 and Class R6 shares was
0.75%, 1.50% 1.50%, 1.00%, 0.50%, 0.50% and 0.50%, respectively.1,2 The total annual Fund operating expense ratio set forth in the most recent Fund prospectus as of the date of this report for Class A, Class B, Class C, Class R, Class Y, Class R5 and Class R6 shares was 0.95%, 1.70%, 1.70%, 1.20%, 0.70%, 0.63% and 0.53%, respectively. The expense ratios presented above may vary from the expense ratios presented in other sections of this report that are based on expenses incurred during the period covered by this report.
Class A share performance reflects the maximum 4.25% sales charge, and Class B and Class C share performance reflects the applicable contingent deferred sales charge (CDSC) for the period involved. The CDSC on Class B shares declines from 5% beginning at the time of purchase to 0% at the beginning of the seventh year. The CDSC on Class C shares is 1% for the first year after purchase.
Class R, Class Y, Class R5 and Class R6 shares do not have a front-end sales charge or a CDSC; therefore, performance is at net asset value.
The performance of the Fund’s share classes will differ primarily due to different sales charge structures and class expenses.
Fund performance reflects any applicable fee waivers and/or expense reimbursements. Had the adviser not waived fees and/or reimbursed expenses currently or in the past, returns would have been lower. See current prospectus for more information.
| 1 | Total annual Fund operating expenses after any contractual fee waivers and/or expense reimbursements by the adviser in effect through at least December 31, 2017. See current prospectus for more information. |
| 2 | Total annual Fund operating expenses after any contractual fee waivers and/or expense reimbursements by the adviser in effect through at least June 30, 2019. See current prospectus for more information. |
| 7 | Invesco Core Plus Bond Fund |
Invesco Core Plus Bond Fund’s investment objective is total return, comprised of current income and capital appreciation.
∎ Unless otherwise stated, information presented in this report is as of August 31, 2017, and is based on total net assets.
∎ Unless otherwise noted, all data provided by Invesco.
∎ To access your Fund’s reports/prospectus, visit invesco.com/fundreports.
About share classes ∎ Class B shares may not be purchased for new or additional investments. Please see the prospectus for more information. ∎ Class R shares are generally available only to employer sponsored retirement and benefit plans. Please see the prospectus for more information. ∎ Class Y shares are available only to certain investors. Please see the prospectus for more information. ∎ Class R5 shares and Class R6 shares are available for use by retirement plans that meet certain standards and for institutional investors. Class R6 shares are also available through intermediaries that have established an agreement with Invesco Distributors, Inc. to make such shares available for use in retail omnibus accounts. Please see the prospectus for more information.
Principal risks of investing in the Fund ∎ Active trading risk. Active trading of portfolio securities may result in added expenses, a lower return and increased tax liability. ∎ Changing fixed income market conditions risk. The current low interest rate environment was created in part by the Federal Reserve Board (FRB) and certain foreign central banks keeping the federal funds and equivalent foreign rates near, at or below zero. Increases in the federal funds and equivalent foreign rates may expose fixed income markets to heightened volatility and reduced liquidity for certain fixed income investments, particularly those with longer maturities. In addition, decreases in fixed income dealer market-making capacity may also potentially lead to heightened volatility and reduced liquidity in the fixed income markets. As a result, the value of the Fund’s investments and share price may decline. Changes in central bank policies could also result in higher than normal shareholder redemptions, which could potentially increase portfolio turnover and the Fund’s transaction costs. ∎ Collateralized loan obligations risk. CLOs are subject to the risks of | substantial losses due to actual defaults by underlying borrowers, which will be greater during periods of economic or financial stress. CLOs may also lose value due to collateral defaults and disappearance of subordinate tranches, market anticipation of defaults, and investor aversion to CLO securities as a class. The risks of CLOs will be greater if the Fund invests in CLOs that hold loans of uncreditworthy borrowers or if the Fund holds subordinate tranches of the CLO that absorbs losses from the defaults before senior tranches. In addition, CLOs are subject to interest rate risk and credit risk. ∎ Debt securities risk. The prices of debt securities held by the Fund will be affected by changes in interest rates, the creditworthiness of the issuer and other factors. An increase in prevailing interest rates typically causes the value of existing debt securities to fall and often has a greater impact on longer-duration debt securities and higher quality debt securities. Falling interest rates will cause the Fund to reinvest the proceeds of debt securities that have been repaid by the issuer at lower interest rates. Falling interest rates may also reduce the Fund’s distributable income because interest payments on floating rate debt instruments held by the Fund will decline. The Fund could lose money on investments in debt securities if the issuer or borrower fails to meet its obligations to make interest payments and/or to repay principal in a timely manner. Changes in an issuer’s financial strength, the market’s perception of such strength or in the credit rating of the issuer or the security may affect the value of debt securities. The Adviser’s credit analysis may fail to anticipate such changes, which could result in buying a debt security at an inopportune time or failing to sell a debt security in advance of a price decline or other credit event. ∎ Derivatives risk. The value of a derivative instrument depends largely on (and is derived from) the | value of an underlying security, currency, commodity, interest rate, index or other asset (each referred to as an underlying asset). In addition to risks relating to the underlying assets, the use of derivatives may include other, possibly greater, risks, including counterparty, leverage and liquidity risks. Counterparty risk is the risk that the counterparty to the derivative contract will default on its obligation to pay the Fund the amount owed or otherwise perform under the derivative contract. Derivatives create leverage risk because they do not require payment up front equal to the economic exposure created by owning the derivative. As a result, an adverse change in the value of the underlying asset could result in the Fund sustaining a loss that is substantially greater than the amount invested in the derivative, which may make the Fund’s returns more volatile and increase the risk of loss. Derivative instruments may also be less liquid than more traditional investments and the Fund may be unable to sell or close out its derivative positions at a desirable time or price. This risk may be more acute under adverse market conditions, during which the Fund may be most in need of liquidating its derivative positions. Derivatives may also be harder to value, less tax efficient and subject to changing government regulation that could impact the Fund’s ability to use certain derivatives or their cost. Also, derivatives used for hedging or to gain or limit exposure to a particular market segment may not provide the expected benefits, particularly during adverse market conditions. ∎ Emerging markets securities risk. Emerging markets (also referred to as developing markets) are generally subject to greater market volatility, political, social and economic instability, uncertain trading markets and more governmental limitations on foreign investment than more developed markets. In addition, companies operating in emerging markets may be subject to | ||
This report must be accompanied or preceded by a currently effective Fund prospectus, which contains more complete information, including sales charges and expenses. Investors should read it carefully before investing.
| ||||
NOT FDIC INSURED | MAY LOSE VALUE | NO BANK GUARANTEE | ||||
| 8 �� | Invesco Core Plus Bond Fund |
lower trading volume and greater price fluctuations than companies in more developed markets. Securities law and the enforcement of systems of taxation in many emerging market countries may change quickly and unpredictably. In addition, investments in emerging markets securities may also be subject to additional transaction costs, delays in settlement procedures, and lack of timely information.
∎ Foreign government debt risk. Investments in foreign government debt securities (sometimes referred to as sovereign debt securities) involve certain risks in addition to those relating to foreign securities or debt securities generally. The issuer of the debt or the governmental authorities that control the repayment of the debt may be unable or unwilling to repay principal or interest when due in accordance with the terms of such debt, and the Fund may have limited recourse in the event of a default against the defaulting government. Without the approval of debt holders, some governmental debtors have in the past been able to reschedule or restructure their debt payments or declare moratoria on payments.
∎ Foreign securities risk. The Fund’s foreign investments may be adversely affected by political and social instability, changes in economic or taxation policies, difficulty in enforcing obligations, decreased liquidity or increased volatility. Foreign investments also involve the risk of the possible seizure, nationalization or expropriation of the issuer or foreign deposits (in which the Fund could lose its entire investments in a certain market) and the possible adoption of foreign governmental restrictions such as exchange controls. Unless the Fund has hedged its foreign securities risk, foreign securities risk also involves the risk of negative foreign currency rate fluctuations, which may cause the value of securities denominated in such foreign currency (or other instruments through which the Fund has exposure to foreign currencies) to decline in value. Currency exchange rates may fluctuate significantly over short periods of time. Currency hedging strategies, if used, are not always successful.
∎ High yield debt securities (junk bond) risk. Investments in high yield debt securities (“junk bonds”) and other lowerrated securities will subject the Fund to substantial risk of loss. These securities are considered to be speculative with respect to the issuer’s ability to pay interest
and principal when due, are more susceptible to default or decline in market value and are less liquid than investment grade debt securities. Prices of high yield debt securities tend to be very volatile.
∎ Liquidity risk. The Fund may be unable to sell illiquid investments at the time or price it desires and, as a result, could lose its entire investment in such investments. Liquid securities can become illiquid during periods of market stress. If a significant amount of the Fund’s securities become illiquid, the Fund may not be able to timely pay redemption proceeds and may need to sell securities at significantly reduced prices.
∎ Management risk. The Fund is actively managed and depends heavily on the Adviser’s judgment about markets, interest rates or the attractiveness, relative values, liquidity, or potential appreciation of particular investments made for the Fund’s portfolio. The Fund could experience losses if these judgments prove to be incorrect. Additionally, legislative, regulatory, or tax developments may adversely affect management of the Fund and, therefore, the ability of the Fund to achieve its investment objective.
∎ Market risk. The market values of the Fund’s investments, and therefore the value of the Fund’s shares, will go up and down, sometimes rapidly or unpredictably. Market risk may affect a single issuer, industry or section of the economy, or it may affect the market as a whole. Individual stock prices tend to go up and down more dramatically than those of certain other types of investments, such as bonds. During a general downturn in the financial markets, multiple asset classes may decline in value. When markets perform well, there can be no assurance that specific investments held by the Fund will rise in value.
∎ Mortgage- and asset-backed securities risk. Mortgage- and asset-backed securities, including collateralized debt obligations and collateralized mortgage obligations, are subject to prepayment or call risk, which is the risk that a borrower’s payments may be received earlier or later than expected due to changes in prepayment rates on underlying loans. This could result in the Fund reinvesting these early payments at lower interest rates, thereby reducing the Fund’s income. Mortgage- and asset-backed securities also are subject to extension risk, which is the risk that an unexpected rise in interest rates could reduce the rate of prepayments,
causing the price of the mortgage- and asset-backed securities and the Fund’s share price to fall. An unexpectedly high rate of defaults on the mortgages held by a mortgage pool may adversely affect the value of mortgage-backed securities and could result in losses to the Fund. The Fund may invest in mortgage pools that include subprime mortgages, which are loans made to borrowers with weakened credit histories or with lower capacity to make timely payments on their mortgages. Privately issued mortgage-related securities are not subject to the same underwriting requirements as those with government or government-sponsored entity guarantees and, therefore, mortgage loans underlying privately issued mortgage-related securities may have less favorable collateral, credit risk or other underwriting characteristics, and wider variances in interest rate, term, size, purpose and borrower characteristics.
∎ Municipal securities risk. The risk of a municipal obligation generally depends on the financial and credit status of the issuer. Constitutional amendments, legislative enactments, executive orders, administrative regulations, voter initiatives, and the issuer’s regional economic conditions may affect the municipal security’s value, interest payments, repayment of principal and the Fund’s ability to sell the security. Failure of a municipal security issuer to comply with applicable tax requirements may make income paid thereon taxable, resulting in a decline in the security’s value. In addition, there could be changes in applicable tax laws or tax treatments that reduce or eliminate the current federal income tax exemption on municipal securities or otherwise adversely affect the current federal or state tax status of municipal securities.
∎ TBA transactions risk. TBA transactions involve the risk of loss if the securities received are less favorable than what was anticipated by the Fund when entering into the TBA transaction, or if the counterparty fails to deliver the securities. When the Fund enters into a short sale of a TBA mortgage it does not own, the Fund may have to purchase deliverable mortgages to settle the short sale at a higher price than anticipated, thereby causing a loss. As there is no limit on how much the price of mortgage securities can increase, the Fund’s exposure is unlimited. The Fund may not always be able to purchase mortgage securities to close out the short position at a particular time
| 9 | Invesco Core Plus Bond Fund |
or at an acceptable price. In addition, taking short positions results in a form of leverage, which could increase the volatility of the Fund’s share price.
∎ US government obligations risk. Obligations of US government agencies and authorities receive varying levels of support and may not be backed by the full faith and credit of the US government, which could affect the Fund’s ability to recover should they default. No assurance can be given that the US government will provide financial support to its agencies and authorities if it is not obligated by law to do so.
∎ When-issued, delayed delivery and forward commitment risks. When-issued and delayed delivery transactions subject the Fund to market risk because the value or yield of a security at delivery may be more or less than the purchase price or yield generally available when delivery occurs, and counterparty risk because the Fund relies on the buyer or seller, as the case may be, to consummate the transaction. These transactions also have a leveraging effect on the Fund because the Fund commits to purchase securities that it does not have to pay for until a later date, which increases the Fund’s overall investment exposure and, as a result, its volatility.
∎ Zero coupon or pay-in-kind securities risk. The value, interest rates, and liquidity of non-cash paying instruments, such as zero coupon and pay-in-kind securities, are subject to greater fluctuation than other types of securities. The higher yields and interest rates on pay-in-kind securities reflect the payment deferral and increased credit risk associated with such instruments and that such investments may represent a higher credit risk than loans that periodically pay interest.
About indexes used in this report
∎ The Bloomberg Barclays U.S. Aggregate Index is an unmanaged index considered representative of the US investment grade, fixed-rate bond market.
∎ The Lipper Core Plus Bond Funds Index is an unmanaged index considered representative of core plus bond funds tracked by Lipper.
∎ The Fund is not managed to track the performance of any particular index, including the index(es) described here, and consequently, the performance of the Fund may deviate significantly from the performance of the index(es).
∎ A direct investment cannot be made in an index. Unless otherwise indicated, index results include reinvested dividends, and they do not reflect sales charges. Performance of the peer group, if applicable, reflects fund expenses; performance of a market index does not.
Other information
∎ The returns shown in management’s discussion of Fund performance are based on net asset values (NAVs) calculated for shareholder transactions. Generally accepted accounting principles require adjustments to be made to the net assets of the Fund at period end for financial reporting purposes, and as such, the NAVs for shareholder transactions and the returns based on those NAVs may differ from the NAVs and returns reported in the Financial Highlights.
| 10 | Invesco Core Plus Bond Fund |
Schedule of Investments(a)
August 31, 2017
| Principal Amount | Value | |||||||
U.S. Dollar Denominated Bonds & Notes–49.49% |
| |||||||
| Aerospace & Defense–0.03% | ||||||||
Bombardier Inc. (Canada), Sr. Unsec. Notes, | ||||||||
6.00%, 10/15/2022(b) | $ | 80,000 | $ | 81,600 | ||||
7.50%, 03/15/2025(b) | 155,000 | 164,882 | ||||||
KLX Inc., Sr. Unsec. Gtd. Notes, 5.88%, 12/01/2022(b) | 141,000 | 148,226 | ||||||
Moog Inc., Sr. Unsec. Gtd. Notes, 5.25%, 12/01/2022(b) | 97,000 | 101,365 | ||||||
TransDigm Inc., Sr. Unsec. Gtd. Sub. Global Notes, | ||||||||
6.50%, 07/15/2024 | 55,000 | 57,406 | ||||||
6.50%, 05/15/2025 | 426,000 | 439,845 | ||||||
| 993,324 | ||||||||
| Agricultural & Farm Machinery–0.01% | ||||||||
Titan International Inc., Sr. Sec. Gtd. First Lien Global Notes, 6.88%, 10/01/2020 | 316,000 | 326,665 | ||||||
| Air Freight & Logistics–0.00% | ||||||||
XPO Logistics, Inc., Sr. Unsec. Gtd. Notes, 6.50%, 06/15/2022(b) | 90,000 | 94,950 | ||||||
| Airlines–2.74% | ||||||||
American Airlines Pass Through Trust, | ||||||||
Series 2015-2, Class B, Sec. Third Lien Pass Through Ctfs., 4.40%, 03/22/2025 | 8,148,423 | 8,372,252 | ||||||
Series 2016-3, Class AA, Sr. Sec. First Lien Pass Through Ctfs., 3.00%, 04/15/2030 | 7,614,000 | 7,545,440 | ||||||
Series 2017-1, Class A, Sec. Second Lien Pass Through Ctfs., 4.00%, 08/15/2030 | 5,479,000 | 5,744,137 | ||||||
Series 2017-1, Class B, Sec. Third Lien Pass Through Ctfs., 4.95%, 08/15/2026 | 5,830,000 | 6,101,550 | ||||||
Series 2017-1, Class AA, Sr. Sec. First Lien Pass Through Ctfs., 3.65%, 08/15/2030 | 6,849,000 | 7,090,242 | ||||||
Series 2017-2, Class A, Sec. Second Lien Pass Through Ctfs., 3.60%, 04/15/2031 | 9,181,000 | 9,272,709 | ||||||
Series 2017-2, Class AA, Sr. Sec. First Lien Pass Through Ctfs., 3.35%, 04/15/2031 | 11,432,000 | 11,568,938 | ||||||
Delta Air Lines, Inc., Sr. Unsec. Global Notes, | ||||||||
2.88%, 03/13/2020 | 4,744,000 | 4,816,863 | ||||||
3.63%, 03/15/2022 | 7,899,000 | 8,146,314 | ||||||
LATAM Airlines Group S.A. Pass Through Trust (Chile), Series 2015-1, Class A, Sec. Global Pass Through Ctfs., 4.20%, 08/15/2029 | 5,962,211 | 6,051,645 | ||||||
| Principal Amount | Value | |||||||
| Airlines–(continued) | ||||||||
Norwegian Air Shuttle ASA Pass Through Trust (Norway), | ||||||||
Series 2016-1, Class A, Sec. Pass Through Ctfs., 4.88%, | $ | 2,513,910 | $ | 2,621,022 | ||||
Series 2016-1, Class B, Sec. Pass Through Ctfs., 7.50%, | 11,960,038 | 12,901,891 | ||||||
US Airways Pass Through Trust, Series 2012-1, Class B, Sec. Second Lien Pass Through Ctfs., 8.00%, 04/01/2021 | 7,169 | 7,736 | ||||||
WestJet Airlines Ltd. (Canada), Sr. Unsec. Gtd. Notes, 3.50%, 06/16/2021(b) | 1,665,000 | 1,705,742 | ||||||
| 91,946,481 | ||||||||
| Alternative Carriers–0.01% | ||||||||
Level 3 Financing, Inc., Sr. Unsec. Gtd. Global Notes, | ||||||||
5.25%, 03/15/2026 | 97,000 | 99,546 | ||||||
5.38%, 05/01/2025 | 287,000 | 296,328 | ||||||
| 395,874 | ||||||||
| Aluminum–0.01% | ||||||||
Alcoa Nederland Holding B.V., Sr. Unsec. Gtd. Notes, 6.75%, 09/30/2024(b) | 200,000 | 220,961 | ||||||
Novelis Corp., Sr. Unsec. Gtd. Notes, 6.25%, 08/15/2024(b) | 154,000 | 162,470 | ||||||
| 383,431 | ||||||||
| Apparel Retail–0.22% | ||||||||
Gap, Inc. (The), Sr. Unsec. Global Bonds, 5.95%, 04/12/2021 | 144,000 | 156,481 | ||||||
Hot Topic, Inc., Sr. Sec. Gtd. First Lien Notes, 9.25%, 06/15/2021(b) | 308,000 | 280,280 | ||||||
L Brands, Inc., Sr. Unsec. Gtd. Global Notes, | ||||||||
5.63%, 02/15/2022 | 6,438,000 | 6,832,327 | ||||||
6.75%, 07/01/2036 | 22,000 | 21,038 | ||||||
6.88%, 11/01/2035 | 88,000 | 84,480 | ||||||
| 7,374,606 | ||||||||
| Apparel, Accessories & Luxury Goods–0.03% | ||||||||
Hanesbrands Inc., Sr. Unsec. Gtd. Notes, | ||||||||
4.63%, 05/15/2024(b) | 682,000 | 711,838 | ||||||
4.88%, 05/15/2026(b) | 297,000 | 309,251 | ||||||
| 1,021,089 | ||||||||
| Asset Management & Custody Banks–1.07% | ||||||||
Affiliated Managers Group, Inc., Sr. Unsec. Global Notes, 4.25%, 02/15/2024 | 2,865,000 | 3,062,546 | ||||||
See accompanying Notes to Financial Statements which are an integral part of the financial statements.
11 Invesco Core Plus Bond Fund
| Principal Amount | Value | |||||||
| Asset Management & Custody Banks–(continued) | ||||||||
Apollo Management Holdings L.P., Sr. Unsec. Gtd. Notes, 4.00%, 05/30/2024(b) | $ | 5,598,000 | $ | 5,754,464 | ||||
Bank of New York Mellon Corp. (The), Sr. Unsec. Sub. Medium-Term Notes, 3.30%, 08/23/2029 | 11,257,000 | 11,307,167 | ||||||
Blackstone Holdings Finance Co. LLC, Sr. Unsec. Gtd. Notes, 5.00%, 06/15/2044(b) | 6,934,000 | 7,940,630 | ||||||
Brookfield Asset Management Inc. (Canada), Sr. Unsec. Notes, 4.00%, 01/15/2025 | 785,000 | 812,965 | ||||||
Carlyle Holdings II Finance LLC, Sr. Unsec. Gtd. Notes, 5.63%, 03/30/2043(b) | 5,747,000 | 6,658,034 | ||||||
Prime Security Services Borrower, LLC/Prime Finance, Inc., Sec. Gtd. Second Lien Notes, 9.25%, 05/15/2023(b) | 429,000 | 475,117 | ||||||
| 36,010,923 | ||||||||
| Auto Parts & Equipment–0.01% | ||||||||
Dana Inc., Sr. Unsec. Notes, | ||||||||
5.38%, 09/15/2021 | 53,000 | 54,590 | ||||||
5.50%, 12/15/2024 | 164,000 | 171,380 | ||||||
| 225,970 | ||||||||
| Automobile Manufacturers–0.35% | ||||||||
Ford Motor Credit Co. LLC, Sr. Unsec. Global Notes, | ||||||||
2.68%, 01/09/2020 | 5,468,000 | 5,514,587 | ||||||
3.10%, 05/04/2023 | 1,753,000 | 1,744,477 | ||||||
General Motors Financial Co., Inc., Sr. Unsec. Gtd. Notes, 3.15%, 01/15/2020 | 4,304,000 | 4,389,977 | ||||||
| 11,649,041 | ||||||||
| Automotive Retail–0.01% | ||||||||
Lithia Motors, Inc., Sr. Unsec. Gtd. Notes, 5.25%, 08/01/2025(b) | 85,000 | 86,913 | ||||||
Murphy Oil USA, Inc., Sr. Unsec. Gtd. Global Notes, 5.63%, 05/01/2027 | 222,000 | 238,927 | ||||||
| 325,840 | ||||||||
| Biotechnology–0.22% | ||||||||
Shire Acquisitions Investments Ireland DAC, Sr. Unsec. Gtd. Global Notes, 2.88%, 09/23/2023 | 7,500,000 | 7,476,184 | ||||||
| Brewers–0.64% | ||||||||
Anheuser-Busch InBev Finance, Inc. (Belgium), Sr. Unsec. Gtd. Global Notes, | ||||||||
3.65%, 02/01/2026 | 7,519,000 | 7,846,945 | ||||||
4.90%, 02/01/2046 | 5,000,000 | 5,730,485 | ||||||
Heineken NV (Netherlands), Sr. Unsec. Notes, 4.35%, 03/29/2047(b) | 7,345,000 | 7,837,736 | ||||||
| 21,415,166 | ||||||||
| Principal Amount | Value | |||||||
| Broadcasting–0.09% | ||||||||
AMC Networks Inc., Sr. Unsec. Gtd. Global Notes, | ||||||||
4.75%, 08/01/2025 | $ | 44,000 | $ | 44,275 | ||||
5.00%, 04/01/2024 | 155,000 | 160,231 | ||||||
CBS Corp., Sr. Unsec. Gtd. Notes, 3.50%, 01/15/2025 | 1,420,000 | 1,453,578 | ||||||
Clear Channel Worldwide Holdings, Inc., Series B, | ||||||||
Sr. Unsec. Gtd. Global Notes, 6.50%, 11/15/2022 | 309,000 | 319,429 | ||||||
Sr. Unsec. Gtd. Sub. Global Notes, 7.63%, 03/15/2020 | 242,000 | 242,000 | ||||||
iHeartCommunications, Inc., Sr. Sec. Gtd. First Lien Global Notes, 9.00%, 12/15/2019 | 252,000 | 201,600 | ||||||
Netflix, Inc., Sr. Unsec. Global Notes, 5.75%, 03/01/2024 | 249,000 | 268,297 | ||||||
Nexstar Broadcasting, Inc., Sr. Unsec. Gtd. Notes, 5.63%, 08/01/2024(b) | 112,000 | 115,920 | ||||||
Tribune Media Co., Sr. Unsec. Gtd. Global Notes, 5.88%, 07/15/2022 | 123,000 | 128,228 | ||||||
| 2,933,558 | ||||||||
| Building Products–0.27% | ||||||||
Allegion PLC, Sr. Unsec. Gtd. Notes, 5.88%, 09/15/2023 | 100,000 | 107,219 | ||||||
Builders FirstSource, Inc., Sr. Unsec. Gtd. Notes, 10.75%, 08/15/2023(b) | 252,000 | 287,595 | ||||||
Gibraltar Industries Inc., Sr. Unsec. Gtd. Sub. Global Notes, 6.25%, 02/01/2021 | 146,000 | 150,563 | ||||||
Owens Corning, Sr. Unsec. Gtd. Global Notes, 4.30%, 07/15/2047 | 6,158,000 | 6,004,426 | ||||||
St. Marys Cement Inc. (Brazil), Sr. Unsec. Gtd. Notes, 5.75%, 01/28/2027(b) | 200,000 | 211,500 | ||||||
Standard Industries Inc., Sr. Unsec. Notes, | ||||||||
5.00%, 02/15/2027(b) | 179,000 | 184,146 | ||||||
6.00%, 10/15/2025(b) | 2,021,000 | 2,177,627 | ||||||
| 9,123,076 | ||||||||
| Cable & Satellite–1.00% | ||||||||
Altice Financing S.A. (Luxembourg), | ||||||||
Sr. Sec. Gtd. First Lien Bonds, 7.50%, 05/15/2026(b) | 200,000 | 219,000 | ||||||
Sr. Sec. Gtd. First Lien Notes, 6.63%, 02/15/2023(b) | 200,000 | 211,500 | ||||||
Altice Luxembourg S.A. (Luxembourg), Sr. Unsec. Gtd. Notes, 7.75%, 05/15/2022(b) | 240,000 | 255,300 | ||||||
Altice US Finance I Corp., Sr. Sec. Notes, 5.50%, 05/15/2026(b) | 200,000 | 211,500 | ||||||
See accompanying Notes to Financial Statements which are an integral part of the financial statements.
12 Invesco Core Plus Bond Fund
| Principal Amount | Value | |||||||
| Cable & Satellite–(continued) | ||||||||
CCO Holdings LLC/CCO Holdings Capital Corp., | ||||||||
Sr. Unsec. Global Notes, 5.75%, 09/01/2023 | $ | 245,000 | $ | 256,637 | ||||
Sr. Unsec. Notes, 5.75%, 02/15/2026(b) | 535,000 | 567,100 | ||||||
Charter Communications Operating, LLC/Charter Communications Operating Capital Corp., | ||||||||
4.46%, 07/23/2022 | 2,000,000 | 2,111,304 | ||||||
4.91%, 07/23/2025 | 2,187,000 | 2,341,801 | ||||||
6.83%, 10/23/2055 | 6,341,000 | 7,441,332 | ||||||
Sr. Sec. Gtd. First Lien Notes, 5.38%, 05/01/2047(b) | 4,585,000 | 4,696,505 | ||||||
Comcast Corp., Sr. Unsec. Gtd. Global Notes, 3.40%, 07/15/2046 | 2,095,000 | 1,907,241 | ||||||
Cox Communications, Inc., Sr. Unsec. Notes, 3.35%, 09/15/2026(b) | 5,845,000 | 5,810,187 | ||||||
CSC Holdings LLC, | ||||||||
Sr. Unsec. Global Notes, 6.75%, 11/15/2021 | 396,000 | 437,580 | ||||||
Sr. Unsec. Notes, 10.13%, 01/15/2023(b) | 500,000 | 580,625 | ||||||
DISH DBS Corp., Sr. Unsec. Gtd. Global Notes, | ||||||||
5.88%, 11/15/2024 | 1,992,000 | 2,151,360 | ||||||
7.88%, 09/01/2019 | 387,000 | 425,700 | ||||||
Intelsat Jackson Holdings S.A. (Luxembourg), | ||||||||
Sr. Unsec. Gtd. Global Bonds, 5.50%, 08/01/2023 | 115,000 | 96,744 | ||||||
Sr. Unsec. Gtd. Global Notes, 7.25%, 10/15/2020 | 303,000 | 289,365 | ||||||
Sirius XM Radio Inc., Sr. Unsec. Gtd. Notes, | ||||||||
3.88%, 08/01/2022(b) | 1,736,000 | 1,770,720 | ||||||
5.38%, 04/15/2025(b) | 165,000 | 174,694 | ||||||
5.38%, 07/15/2026(b) | 162,000 | 170,100 | ||||||
6.00%, 07/15/2024(b) | 159,000 | 172,118 | ||||||
Unitymedia Hessen GmbH & Co. KG/Unitymedia NRW GmbH (Germany), Sr. Sec. Gtd. First Lien Bonds, 5.00%, 01/15/2025(b) | 200,000 | 211,250 | ||||||
UPCB Finance IV Ltd. (Netherlands), Sr. Sec. First Lien Notes, 5.38%, 01/15/2025(b) | 200,000 | 207,500 | ||||||
Virgin Media Finance PLC (United Kingdom), Sr. Unsec. Gtd. Notes, 6.00%, 10/15/2024(b) | 200,000 | 211,000 | ||||||
Virgin Media Secured Finance PLC (United Kingdom), Sr. Sec. Gtd. First Lien Notes, 5.50%, 08/15/2026(b) | 200,000 | 211,500 | ||||||
| Principal Amount | Value | |||||||
| Cable & Satellite–(continued) | ||||||||
VTR Finance B.V. (Chile), Sr. Sec. First Lien Notes, 6.88%, 01/15/2024(b) | $ | 250,000 | $ | 266,562 | ||||
Ziggo Secured Finance B.V. (Netherlands), Sr. Sec. Gtd. First Lien Notes, 5.50%, 01/15/2027(b) | 250,000 | 258,750 | ||||||
| 33,664,975 | ||||||||
| Casinos & Gaming–0.08% | ||||||||
Boyd Gaming Corp., Sr. Unsec. Gtd. Global Notes, | ||||||||
6.38%, 04/01/2026 | 163,000 | 177,874 | ||||||
6.88%, 05/15/2023 | 173,000 | 186,624 | ||||||
Codere Finance 2 (Luxembourg) S.A. (Spain), Sr. Sec. Gtd. First Lien Notes, 7.63%, 11/01/2021(b) | 200,000 | 199,435 | ||||||
Melco Resorts Finance Ltd. (Hong Kong), Sr. Unsec. Notes, 4.88%, 06/06/2025(b) | 200,000 | 201,500 | ||||||
MGM Resorts International, Sr. Unsec. Gtd. Notes, | ||||||||
4.63%, 09/01/2026 | 784,000 | 797,720 | ||||||
6.00%, 03/15/2023 | 85,000 | 94,137 | ||||||
7.75%, 03/15/2022 | 110,000 | 129,044 | ||||||
Pinnacle Entertainment, Inc., Sr. Unsec. Global Notes, 5.63%, 05/01/2024 | 345,000 | 355,781 | ||||||
Scientific Games International Inc., Sr. Unsec. Gtd. Global Notes, 10.00%, 12/01/2022 | 297,000 | 331,155 | ||||||
Wynn Las Vegas LLC/Wynn Las Vegas Capital Corp., Sr. Unsec. Gtd. Notes, | ||||||||
5.25%, 05/15/2027(b) | 86,000 | 87,075 | ||||||
5.50%, 03/01/2025(b) | 186,000 | 195,067 | ||||||
| 2,755,412 | ||||||||
| Coal & Consumable Fuels–0.00% | ||||||||
SunCoke Energy Partners, L.P./ SunCoke Energy Partners Finance Corp., Sr. Unsec. Gtd. Notes, 7.50%, 06/15/2025(b) | 161,000 | 164,623 | ||||||
| Commercial Printing–0.01% | ||||||||
Multi-Color Corp., Sr. Unsec. Gtd. Notes, 6.13%, 12/01/2022(b) | 188,000 | 196,460 | ||||||
| Commodity Chemicals–0.01% | ||||||||
Koppers Inc., Sr. Unsec. Gtd. Notes, 6.00%, 02/15/2025(b) | 159,000 | 169,335 | ||||||
Valvoline Inc., Sr. Unsec. Gtd. Notes, 5.50%, 07/15/2024(b) | 243,000 | 258,795 | ||||||
| 428,130 | ||||||||
| Communications Equipment–0.03% | ||||||||
CommScope Technologies LLC, Sr. Unsec. Gtd. Notes, 6.00%, 06/15/2025(b) | 446,000 | 476,105 | ||||||
See accompanying Notes to Financial Statements which are an integral part of the financial statements.
13 Invesco Core Plus Bond Fund
| Principal Amount | Value | |||||||
| Communications Equipment–(continued) | ||||||||
Hughes Satellite Systems Corp., | ||||||||
Sr. Sec. Gtd. First Lien Global Notes, 5.25%, 08/01/2026 | $ | 191,000 | $ | 201,027 | ||||
Sr. Unsec. Gtd. Global Notes, 7.63%, 06/15/2021 | 249,000 | 283,549 | ||||||
| 960,681 | ||||||||
| Construction & Engineering–0.19% | ||||||||
AECOM, Sr. Unsec. Gtd. Global Notes, 5.13%, 03/15/2027 | 3,429,000 | 3,501,866 | ||||||
Valmont Industries, Inc., Sr. Unsec. Gtd. Global Notes, 5.25%, 10/01/2054 | 2,916,000 | 2,891,738 | ||||||
| 6,393,604 | ||||||||
| Construction Machinery & Heavy Trucks–0.02% | ||||||||
Meritor Inc., Sr. Unsec. Gtd. Notes, | ||||||||
6.25%, 02/15/2024 | 259,000 | 273,892 | ||||||
6.75%, 06/15/2021 | 94,000 | 97,760 | ||||||
Oshkosh Corp., Sr. Unsec. Gtd. Global Notes, 5.38%, 03/01/2025 | 250,000 | 262,500 | ||||||
Terex Corp., Sr. Unsec. Gtd. Notes, 5.63%, 02/01/2025(b) | 158,000 | 166,295 | ||||||
| 800,447 | ||||||||
| Consumer Finance–1.23% | ||||||||
Ally Financial Inc., Sr. Unsec. Global Notes, | ||||||||
4.13%, 03/30/2020 | 4,449,000 | 4,588,031 | ||||||
5.13%, 09/30/2024 | 469,000 | 506,520 | ||||||
Sr. Unsec. Gtd. Global Notes, | ||||||||
8.00%, 03/15/2020 | 145,000 | 163,850 | ||||||
Capital One Financial Corp., Sr. Unsec. Global Notes, | ||||||||
3.05%, 03/09/2022 | 5,345,000 | 5,422,585 | ||||||
3.75%, 03/09/2027 | 14,465,000 | 14,652,134 | ||||||
Discover Bank, Sr. Unsec. Global Bonds, 3.45%, 07/27/2026 | 5,000,000 | 4,959,322 | ||||||
Navient Corp., Sr. Unsec. Medium-Term Notes, | ||||||||
7.25%, 01/25/2022 | 120,000 | 131,676 | ||||||
8.00%, 03/25/2020 | 235,000 | 260,474 | ||||||
Synchrony Financial, Sr. Unsec. Global Notes, 4.50%, 07/23/2025 | 9,795,000 | 10,317,069 | ||||||
UNIFIN Financiera, S.A.B. de C.V. SOFOM, E.N.R. (Mexico), Sr. Unsec. Gtd. Notes, 7.00%, 01/15/2025(b) | 283,000 | 281,585 | ||||||
| 41,283,246 | ||||||||
| Copper–0.10% | ||||||||
First Quantum Minerals Ltd. (Zambia), Sr. Unsec. Gtd. Notes, 7.00%, 02/15/2021(b) | 295,000 | 305,325 | ||||||
Freeport-McMoRan Inc., Sr. Unsec. Gtd. Global Notes, 5.40%, 11/14/2034 | 355,000 | 343,462 | ||||||
| Principal Amount | Value | |||||||
| Copper–(continued) | ||||||||
Lundin Mining Corp. (Canada), Sr. Sec. Gtd. First Lien Notes, 7.88%, 11/01/2022(b) | $ | 2,193,000 | $ | 2,401,335 | ||||
Southern Copper Corp. (Peru), Sr. Unsec. Global Notes, 7.50%, 07/27/2035 | 200,000 | 258,880 | ||||||
| 3,309,002 | ||||||||
| Data Processing & Outsourced Services–0.17% | ||||||||
Fidelity National Information Services, Inc., Sr. Unsec. Global Notes, 4.50%, 08/15/2046 | 4,764,000 | 4,992,734 | ||||||
First Data Corp., | ||||||||
Sec. Gtd. Second Lien Notes, 5.75%, 01/15/2024(b) | 125,000 | 132,031 | ||||||
Sr. Sec. Gtd. First Lien Notes, 5.00%, 01/15/2024(b) | 80,000 | 83,600 | ||||||
Sr. Unsec. Gtd. Notes, 7.00%, 12/01/2023(b) | 444,000 | 480,630 | ||||||
| 5,688,995 | ||||||||
| Diversified Banks–6.84% | ||||||||
ANZ New Zealand (Int’l) Ltd. (New Zealand), Sr. Unsec. Gtd. Notes, 2.13%, 07/28/2021(b) | 4,415,000 | 4,377,073 | ||||||
Australia and New Zealand Banking Group Ltd. (Australia), Jr. Unsec. Sub. Notes, 6.75%(b)(c) | 11,549,000 | 12,949,316 | ||||||
Banco de Bogotá S.A. (Colombia), Sr. Unsec. Notes, 4.38%, 08/03/2027(b) | 400,000 | 402,476 | ||||||
Banco do Brasil S.A. (Brazil), | 200,000 | 212,250 | ||||||
Unsec. Sub. Euro Notes, 5.88%, 01/19/2023(b) | 200,000 | 212,000 | ||||||
Banco Mercantil del Norte, S.A. (Mexico), Jr. Unsec. Sub. Notes, 7.63%(b)(c) | 200,000 | 215,787 | ||||||
Banco Nacional de Desenvolvimento Economico e Social (Brazil), Sr. Unsec. Notes, 4.75%, 05/09/2024(b) | 205,000 | 206,025 | ||||||
Bank of America Corp., | ||||||||
Sr. Unsec. Global Notes, 3.71%, 04/24/2028 | 4,712,000 | 4,830,168 | ||||||
Sr. Unsec. Medium-Term Global Notes, 3.59%, 07/21/2028 | 9,424,000 | 9,585,381 | ||||||
Unsec. Sub. Medium-Term Notes, 4.20%, 08/26/2024 | 5,435,000 | 5,717,596 | ||||||
Series L, Sr. Unsec. Global Notes, 2.60%, 01/15/2019 | 5,386,000 | 5,440,601 | ||||||
Series X, Jr. Unsec. Sub. Notes, 6.25%(c) | 4,333,000 | 4,755,467 | ||||||
Series Z, Jr. Unsec. Sub. Notes, 6.50%(c) | 3,360,000 | 3,792,600 | ||||||
Series DD, Jr. Unsec. Sub. Notes, 6.30%(c) | 2,080,000 | 2,350,400 | ||||||
See accompanying Notes to Financial Statements which are an integral part of the financial statements.
14 Invesco Core Plus Bond Fund
| Principal Amount | Value | |||||||
| Diversified Banks–(continued) | ||||||||
Barclays PLC (United Kingdom), Unsec. Sub. Global Notes, 4.84%, 05/09/2028 | $ | 2,065,000 | $ | 2,150,359 | ||||
BBVA Bancomer S.A. (Mexico), Sr. Unsec. Notes, 4.38%, 04/10/2024(b) | 1,385,000 | 1,457,676 | ||||||
Citigroup Inc., Sr. Unsec. Global Notes, | ||||||||
2.88%, 07/24/2023 | 3,520,000 | 3,536,868 | ||||||
3.67%, 07/24/2028 | 14,137,000 | 14,336,911 | ||||||
Unsec. Sub. Global Notes, 5.50%, 09/13/2025 | 7,130,000 | 8,075,809 | ||||||
Unsec. Sub. Notes, 4.45%, 09/29/2027 | 10,555,000 | 11,203,874 | ||||||
Series Q, Jr. Unsec. Sub. Global Notes, 5.95%(c) | 2,300,000 | 2,432,250 | ||||||
Series T, Jr. Unsec. Sub. Global Notes, 6.25%(c) | 6,904,000 | 7,723,850 | ||||||
Credit Bank of Moscow Via CBOM Finance PLC (Russia), Jr. Unsec. Sub. Notes, 8.88%(b)(c) | 208,000 | 193,188 | ||||||
Crédit Agricole S.A. (France), Unsec. Sub. Notes, 4.38%, 03/17/2025(b) | 1,160,000 | 1,213,589 | ||||||
Development Bank of Kazakhstan JSC (Kazakhstan), REGS, Sr. Unsec. Euro Notes, 4.13%, 12/10/2022(b) | 300,000 | 306,075 | ||||||
Dresdner Funding Trust I (Germany), REGS, Jr. Unsec. Sub. Euro Notes, 8.15%, 06/30/2031(b) | 135,000 | 172,862 | ||||||
Export-Import Bank of India (India), REGS, Sr. Unsec. Euro Bonds, 3.38%, 08/05/2026(b) | 200,000 | 197,683 | ||||||
Global Bank Corp. (Panama), Sr. Unsec. Notes, 4.50%, 10/20/2021(b) | 7,642,000 | 7,817,120 | ||||||
HBOS PLC (United Kingdom), Unsec. Sub. Medium-Term Global Notes, 6.75%, 05/21/2018(b) | 1,360,000 | 1,404,245 | ||||||
HSBC Holdings PLC (United Kingdom), | ||||||||
Jr. Unsec. Sub. Global Bonds, 6.00%(c) | 11,595,000 | 12,206,370 | ||||||
Sr. Unsec. Global Notes, 4.00%, 03/30/2022 | 1,050,000 | 1,119,110 | ||||||
Unsec. Sub. Global Notes, 4.38%, 11/23/2026 | 2,169,000 | 2,284,544 | ||||||
Industrial Senior Trust (Guatemala), REGS, Sr. Unsec. Gtd. Euro Notes, 5.50%, 11/01/2022(b) | 500,000 | 509,250 | ||||||
ING Groep N.V. (Netherlands), Jr. Unsec. Sub. Global Notes, 6.50%(c) | 2,710,000 | 2,909,863 | ||||||
| Principal Amount | Value | |||||||
| Diversified Banks–(continued) | ||||||||
Intesa Sanpaolo S.p.A. (Italy), Sr. Unsec. Gtd. Medium-Term Notes, 3.88%, 01/15/2019 | $ | 2,840,000 | $ | 2,905,003 | ||||
Sr. Unsec. Notes, 3.13%, 07/14/2022(b) | 5,641,000 | 5,666,957 | ||||||
JPMorgan Chase & Co., Sr. Unsec. Global Notes, | ||||||||
3.54%, 05/01/2028 | 7,958,000 | 8,122,989 | ||||||
3.78%, 02/01/2028 | 6,597,000 | 6,842,794 | ||||||
Sr. Unsec. Medium-Term Global Bonds, 2.30%, 08/15/2021 | 8,950,000 | 8,981,862 | ||||||
Unsec. Sub. Global Notes, 3.63%, 12/01/2027 | 5,610,000 | 5,671,034 | ||||||
Series 1, Jr. Unsec. Sub. Global Notes, 7.90%(c) | 4,500,000 | 4,646,250 | ||||||
Nordea Bank AB (Sweden), Jr. Unsec. Sub. Notes, 5.50%(b)(c) | 3,909,000 | 4,055,587 | ||||||
Royal Bank of Scotland Group PLC (The) (United Kingdom), | ||||||||
Sr. Unsec. Notes, 3.50%, 05/15/2023 | 11,594,000 | 11,727,812 | ||||||
Unsec. Sub. Global Bonds, 5.13%, 05/28/2024 | 600,000 | 636,450 | ||||||
Société Générale S.A. (France), Jr. Unsec. Sub. Notes, 7.38%(b)(c) | 2,988,000 | 3,227,040 | ||||||
Standard Chartered PLC (United Kingdom), | ||||||||
Jr. Unsec. Sub. Notes, 7.75%(b)(c) | 5,720,000 | 6,270,550 | ||||||
Unsec. Sub. Notes, 4.30%, 02/19/2027(b) | 3,242,000 | 3,318,594 | ||||||
Turkiye Garanti Bankasi A.S. (Turkey), Unsec. Sub. Notes, 6.13%, 05/24/2027(b) | 200,000 | 202,036 | ||||||
Wells Fargo & Co., | ||||||||
Unsec. Sub. Global Notes, 5.38%, 11/02/2043 | 8,500,000 | 9,956,245 | ||||||
Unsec. Sub. Medium-Term Notes, 4.75%, 12/07/2046 | 4,215,000 | 4,580,849 | ||||||
Series U, Jr. Unsec. Sub. Global Notes, 5.88%(c) | 5,356,000 | 5,958,550 | ||||||
Yapi ve Kredi Bankasi A.S. (Turkey), Sr. Unsec. Notes, 5.85%, 06/21/2024(b) | 300,000 | 305,649 | ||||||
| 229,374,887 | ||||||||
| Diversified Capital Markets–0.30% | ||||||||
Credit Suisse Group AG (Switzerland), Jr. Unsec. Sub. Notes, 7.50%(b)(c) | 305,000 | 344,650 | ||||||
Credit Suisse Group Funding (Guernsey) Ltd. (Switzerland), Sr. Unsec. Gtd. Global Notes, 3.75%, 03/26/2025 | 3,055,000 | 3,132,398 | ||||||
Macquarie Bank Ltd. (Australia), Jr. Unsec. Sub. Notes, 6.13%(b)(c) | 6,470,000 | 6,694,972 | ||||||
| 10,172,020 | ||||||||
See accompanying Notes to Financial Statements which are an integral part of the financial statements.
15 Invesco Core Plus Bond Fund
| Principal Amount | Value | |||||||
| Diversified Chemicals–0.30% | ||||||||
Chemours Co. (The), Sr. Unsec. Gtd. Global Notes, | ||||||||
5.38%, 05/15/2027 | $ | 2,293,000 | $ | 2,402,295 | ||||
6.63%, 05/15/2023 | 3,931,000 | 4,220,911 | ||||||
7.00%, 05/15/2025 | 75,000 | 82,875 | ||||||
OCP S.A. (Morocco), | ||||||||
Sr. Unsec. Notes, | ||||||||
4.50%, 10/22/2025(b) | 1,940,000 | 1,965,462 | ||||||
REGS, Sr. Unsec. Euro Notes, | ||||||||
4.50%, 10/22/2025(b) | 700,000 | 708,959 | ||||||
6.88%, 04/25/2044(b) | 400,000 | 453,216 | ||||||
Trinseo Materials Operating S.C.A./Trinseo Materials Finance, Inc., Sr. Unsec. Notes, 5.38%, 09/01/2025(b) | 97,000 | 99,304 | ||||||
| 9,933,022 | ||||||||
| Diversified Metals & Mining–0.83% | ||||||||
Corp. Nacional del Cobre de Chile (Chile), Sr. Unsec. Notes, 3.63%, 08/01/2027(b) | 200,000 | 202,454 | ||||||
Glencore Finance Canada Ltd. (Switzerland), Sr. Unsec. Gtd. Notes, 2.70%, 10/25/2017(b) | 8,220,000 | 8,220,822 | ||||||
HudBay Minerals, Inc. (Canada), Sr. Unsec. Gtd. Notes, 7.63%, 01/15/2025(b) | 328,000 | 362,850 | ||||||
MMC Norilsk Nickel OJSC via MMC Finance DAC (Russia), | ||||||||
Sr. Unsec. Notes, | ||||||||
4.10%, 04/11/2023(b) | 7,095,000 | 7,072,828 | ||||||
6.63%, 10/14/2022(b) | 295,000 | 332,244 | ||||||
Teck Resources Ltd. (Canada), | ||||||||
Sr. Unsec. Gtd. Global Notes, | ||||||||
4.75%, 01/15/2022 | 105,000 | 109,988 | ||||||
Sr. Unsec. Notes, | ||||||||
6.13%, 10/01/2035 | 185,000 | 203,962 | ||||||
Vedanta Resources PLC (India), | ||||||||
Sr. Unsec. Notes, | ||||||||
6.13%, 08/09/2024(b) | 10,734,000 | 10,868,175 | ||||||
6.38%, 07/30/2022(b) | 300,000 | 313,500 | ||||||
| 27,686,823 | ||||||||
| Diversified REIT’s–0.35% | ||||||||
Select Income REIT, Sr. Unsec. Global Notes, 4.50%, 02/01/2025 | 1,570,000 | 1,594,928 | ||||||
Trust F/1401 (Mexico), | ||||||||
Sr. Unsec. Notes, | ||||||||
5.25%, 12/15/2024(b) | 1,300,000 | 1,384,500 | ||||||
5.25%, 01/30/2026(b) | 8,353,000 | 8,818,404 | ||||||
| 11,797,832 | ||||||||
| Diversified Support Services–0.01% | ||||||||
Aeropuerto Internacional de Tocumen, S.A. (Panama), REGS, Sr. Sec. First Lien Euro Notes, 5.63%, 05/18/2036(b) | 200,000 | 215,000 | ||||||
| Principal Amount | Value | |||||||
| Diversified Support Services–(continued) | ||||||||
Jaguar Holding Co. II/Pharmaceutical Product Development, LLC, Sr. Unsec. Gtd. Notes, 6.38%, 08/01/2023(b) | $ | 90,000 | $ | 94,613 | ||||
| 309,613 | ||||||||
| Electric Utilities–0.48% | ||||||||
Adani Transmission Ltd. (India), Sr. Sec. Notes, 4.00%, 08/03/2026(b) | 200,000 | 203,794 | ||||||
CLP Power Hong Kong Financing Ltd. (Hong Kong), REGS, Sr. Unsec. Gtd. Medium-Term Euro Notes, 3.13%, 05/06/2025(b) | 200,000 | 202,642 | ||||||
Exelon Corp., Jr. Unsec. Sub. Notes, 3.50%, 06/01/2022 | 2,463,000 | 2,555,207 | ||||||
Korea Hydro & Nuclear Power Co., Ltd. (South Korea), REGS, Sr. Unsec. Medium-Term Euro Notes, 3.00%, 09/19/2022(b) | 200,000 | 202,963 | ||||||
OmGrid Funding Ltd. (Oman), Sr. Unsec. Gtd. Bonds, 5.20%, 05/16/2027(b) | 200,000 | 204,418 | ||||||
Perusahaan Listrik Negara PT (Indonesia), Sr. Unsec. Notes, 4.13%, 05/15/2027(b) | 200,000 | 202,250 | ||||||
Southern Co. (The), Series B, Jr. Unsec. Sub. Global Notes, 5.50%, 03/15/2057 | 10,539,000 | 11,224,035 | ||||||
State Grid Overseas Investment (2014) Ltd. (China), | 200,000 | 236,373 | ||||||
Sr. Unsec. Gtd. Notes, 3.50%, 05/04/2027(b) | 500,000 | 513,951 | ||||||
Trinidad Generation Unlimited (Trinidad), REGS, Sr. Unsec. Euro Notes, 5.25%, 11/04/2027(b) | 400,000 | 408,080 | ||||||
| 15,953,713 | ||||||||
| Electrical Components & Equipment–0.02% | ||||||||
EnerSys, Sr. Unsec. Gtd. Notes, 5.00%, 04/30/2023(b) | 185,000 | 191,475 | ||||||
Sensata Technologies B.V., | ||||||||
Sr. Unsec. Gtd. Notes, | ||||||||
4.88%, 10/15/2023(b) | 100,000 | 104,625 | ||||||
5.00%, 10/01/2025(b) | 260,000 | 274,300 | ||||||
| 570,400 | ||||||||
| Environmental & Facilities Services–0.01% | ||||||||
Advanced Disposal Services, Inc., Sr. Unsec. Gtd. Notes, 5.63%, 11/15/2024(b) | 84,000 | 87,780 | ||||||
CD&R Waterworks Merger Sub, LLC, Sr. Unsec. Notes, 6.13%, 08/15/2025(b) | 143,000 | 146,575 | ||||||
| 234,355 | ||||||||
See accompanying Notes to Financial Statements which are an integral part of the financial statements.
16 Invesco Core Plus Bond Fund
| Principal Amount | Value | |||||||
| Fertilizers & Agricultural Chemicals–0.01% | ||||||||
Israel Chemicals Ltd. (Israel), REGS, Sr. Unsec. Euro Bonds, 4.50%, 12/02/2024(b) | $ | 300,000 | $ | 312,000 | ||||
| Financial Exchanges & Data–0.23% | ||||||||
Moody’s Corp., Sr. Unsec. Global Notes, | ||||||||
2.75%, 07/15/2019 | 1,470,000 | 1,493,647 | ||||||
4.88%, 02/15/2024 | 3,099,000 | 3,495,582 | ||||||
5.25%, 07/15/2044 | 1,140,000 | 1,339,527 | ||||||
MSCI Inc., Sr. Unsec. Gtd. Notes, 5.25%, 11/15/2024(b) | 175,000 | 186,375 | ||||||
Nasdaq, Inc., Sr. Unsec. Notes, 3.85%, 06/30/2026 | 1,205,000 | 1,252,992 | ||||||
| 7,768,123 | ||||||||
| Food Distributors–0.01% | ||||||||
US Foods, Inc., Sr. Unsec. Gtd. Notes, 5.88%, 06/15/2024(b) | 365,000 | 380,513 | ||||||
| Food Retail–0.27% | ||||||||
Alimentation Couche-Tard Inc. (Canada), Sr. Unsec. Gtd. Notes, | ||||||||
2.70%, 07/26/2022(b) | 5,851,000 | 5,890,518 | ||||||
4.50%, 07/26/2047(b) | 2,594,000 | 2,719,940 | ||||||
Ingles Markets, Inc., Sr. Unsec. Global Notes, 5.75%, 06/15/2023 | 324,000 | 319,950 | ||||||
| 8,930,408 | ||||||||
| Gas Utilities–0.03% | ||||||||
AmeriGas Partners, L.P./AmeriGas Finance Corp., Sr. Unsec. Global Notes, | ||||||||
5.63%, 05/20/2024 | 124,000 | 129,270 | ||||||
5.88%, 08/20/2026 | 298,000 | 305,450 | ||||||
Ferrellgas L.P./Ferrellgas Finance Corp., Sr. Unsec. Global Notes, 6.50%, 05/01/2021 | 94,000 | 90,475 | ||||||
NGL Energy Partners L.P./NGL Energy Finance Corp., Sr. Unsec. Gtd. Global Notes, 6.13%, 03/01/2025 | 49,000 | 43,855 | ||||||
Suburban Propane Partners, L.P./Suburban Energy Finance Corp., Sr. Unsec. Global Notes, 5.50%, 06/01/2024 | 381,000 | 375,761 | ||||||
| 944,811 | ||||||||
| General Merchandise Stores–0.28% | ||||||||
Dollar Tree, Inc., Sr. Unsec. Gtd. Global Notes, 5.75%, 03/01/2023 | 8,966,000 | 9,503,960 | ||||||
| Health Care Equipment–0.37% | ||||||||
Becton, Dickinson and Co., | ||||||||
Sr. Unsec. Notes, | ||||||||
3.36%, 06/06/2024 | 5,074,000 | 5,146,134 | ||||||
3.70%, 06/06/2027 | 4,718,000 | 4,800,199 | ||||||
4.67%, 06/06/2047 | 1,951,000 | 2,050,399 | ||||||
| Principal Amount | Value | |||||||
| Health Care Equipment–(continued) | ||||||||
Hill-Rom Holdings, Inc., Sr. Unsec. Gtd. Notes, 5.00%, 02/15/2025(b) | $ | 190,000 | $ | 194,750 | ||||
Teleflex Inc., Sr. Unsec. Gtd. Global Notes, | ||||||||
4.88%, 06/01/2026 | 39,000 | 40,170 | ||||||
5.25%, 06/15/2024 | 15,000 | 15,750 | ||||||
| 12,247,402 | ||||||||
| Health Care Facilities–0.37% | ||||||||
Acadia Healthcare Co., Inc., Sr. Unsec. Gtd. Global Notes, 6.50%, 03/01/2024 | 143,000 | 154,082 | ||||||
Community Health Systems, Inc., | ||||||||
Sr. Sec. Gtd. First Lien Global Notes, | ||||||||
5.13%, 08/01/2021 | 264,000 | 265,320 | ||||||
Sr. Sec. Gtd. First Lien Notes, | ||||||||
6.25%, 03/31/2023 | 244,000 | 246,745 | ||||||
Sr. Unsec. Gtd. Global Notes, | ||||||||
6.88%, 02/01/2022 | 66,737 | 55,642 | ||||||
8.00%, 11/15/2019 | 160,000 | 159,000 | ||||||
HCA Healthcare, Inc., Sr. Unsec. Notes, 6.25%, 02/15/2021 | 130,000 | 140,400 | ||||||
HCA, Inc., | ||||||||
Sr. Sec. Gtd. First Lien Global Notes, | ||||||||
5.88%, 03/15/2022 | 136,000 | 150,620 | ||||||
6.50%, 02/15/2020 | 675,000 | 735,750 | ||||||
Sr. Sec. Gtd. First Lien Notes, | ||||||||
5.25%, 04/15/2025 | 690,000 | 744,337 | ||||||
5.50%, 06/15/2047 | 7,837,000 | 8,130,887 | ||||||
Sr. Unsec. Gtd. Notes, | ||||||||
5.38%, 02/01/2025 | 130,000 | 137,150 | ||||||
5.88%, 02/15/2026 | 160,000 | 173,000 | ||||||
HealthSouth Corp., Sr. Unsec. Gtd. Global Notes, 5.75%, 09/15/2025 | 225,000 | 235,125 | ||||||
LifePoint Health, Inc., | ||||||||
Sr. Unsec. Gtd. Global Notes, | ||||||||
5.38%, 05/01/2024 | 194,000 | 201,275 | ||||||
Sr. Unsec. Gtd. Notes, | ||||||||
5.88%, 12/01/2023 | 23,000 | 24,208 | ||||||
Tenet Healthcare Corp., | ||||||||
Sec. Gtd. Second Lien Notes, | ||||||||
7.50%, 01/01/2022(b) | 23,000 | 24,898 | ||||||
Sr. Sec. Gtd. First Lien Global Notes, | ||||||||
6.00%, 10/01/2020 | 180,000 | 192,150 | ||||||
Sr. Unsec. Global Notes, | ||||||||
6.75%, 06/15/2023 | 117,000 | 116,708 | ||||||
8.00%, 08/01/2020 | 281,000 | 285,440 | ||||||
8.13%, 04/01/2022 | 215,000 | 226,556 | ||||||
| 12,399,293 | ||||||||
| Health Care REIT’s–0.73% | ||||||||
HCP, Inc., Sr. Unsec. Global Notes, | ||||||||
4.00%, 12/01/2022 | 9,288,000 | 9,849,399 | ||||||
4.25%, 11/15/2023 | 5,830,000 | 6,255,199 | ||||||
See accompanying Notes to Financial Statements which are an integral part of the financial statements.
17 Invesco Core Plus Bond Fund
| Principal Amount | Value | |||||||
| Health Care REIT’s–(continued) | ||||||||
Physicians Realty L.P., Sr. Unsec. Gtd. Global Notes, 4.30%, 03/15/2027 | $ | 3,666,000 | $ | 3,788,426 | ||||
Senior Housing Properties Trust, Sr. Unsec. Notes, 6.75%, 12/15/2021 | 2,550,000 | 2,866,337 | ||||||
Welltower Inc., Sr. Unsec. Notes, 5.25%, 01/15/2022 | 1,626,000 | 1,801,570 | ||||||
| 24,560,931 | ||||||||
| Health Care Services–0.47% | ||||||||
AMN Healthcare, Inc., Sr. Unsec. Gtd. Notes, 5.13%, 10/01/2024(b) | 138,000 | 142,140 | ||||||
Eagle Holding Co. II, LLC, Sr. Unsec. PIK Notes, 8.38% PIK Rate, 7.63% Cash Rate, 05/15/2022(b)(d) | 184,000 | 190,670 | ||||||
Laboratory Corp. of America Holdings, Sr. Unsec. Notes, | ||||||||
3.25%, 09/01/2024 | 9,714,000 | 9,855,344 | ||||||
3.60%, 09/01/2027 | 4,420,000 | 4,514,108 | ||||||
MEDNAX, Inc., Sr. Unsec. Gtd. Notes, 5.25%, 12/01/2023(b) | 287,000 | 296,686 | ||||||
MPH Acquisition Holdings LLC, Sr. Unsec. Gtd. Notes, 7.13%, 06/01/2024(b) | 359,000 | 385,476 | ||||||
Surgery Center Holdings, Inc., | ||||||||
Sr. Unsec. Gtd. Notes, | ||||||||
6.75%, 07/01/2025(b) | 32,000 | 30,360 | ||||||
8.88%, 04/15/2021(b) | 36,000 | 37,170 | ||||||
Team Health Holdings, Inc., Sr. Unsec. Gtd. Notes, 6.38%, 02/01/2025(b) | 160,000 | 154,600 | ||||||
| 15,606,554 | ||||||||
| Health Care Supplies–0.01% | ||||||||
Yestar Healthcare Holdings Co. Ltd. (China), REGS, Sr. Unsec. Euro Bonds, 6.90%, 09/15/2021(b) | 200,000 | 208,973 | ||||||
| Home Entertainment Software–0.09% | ||||||||
Electronic Arts Inc., Sr. Unsec. Global Notes, 3.70%, 03/01/2021 | 2,790,000 | 2,919,948 | ||||||
| Home Improvement Retail–0.01% | ||||||||
Hillman Group Inc. (The), Sr. Unsec. Gtd. Notes, 6.38%, 07/15/2022(b) | 265,000 | 255,394 | ||||||
| Homebuilding–0.44% | ||||||||
Ashton Woods USA LLC/Ashton Woods Finance Co., | ||||||||
Sr. Unsec. Notes, | ||||||||
6.75%, 08/01/2025(b) | 126,000 | 125,685 | ||||||
6.88%, 02/15/2021(b) | 157,000 | 161,514 | ||||||
| Principal Amount | Value | |||||||
| Homebuilding–(continued) | ||||||||
Beazer Homes USA, Inc., | ||||||||
Sr. Unsec. Gtd. Global Notes, | ||||||||
6.75%, 03/15/2025 | $ | 216,000 | $ | 229,230 | ||||
8.75%, 03/15/2022 | 145,000 | 160,588 | ||||||
CalAtlantic Group, Inc., | ||||||||
Sr. Unsec. Gtd. Global Notes, | ||||||||
8.38%, 01/15/2021 | 40,000 | 46,800 | ||||||
Sr. Unsec. Gtd. Notes, | ||||||||
5.25%, 06/01/2026 | 107,000 | 110,745 | ||||||
5.38%, 10/01/2022 | 157,000 | 170,737 | ||||||
KB Home, Sr. Unsec. Gtd. Notes, 7.50%, 09/15/2022 | 20,000 | 23,050 | ||||||
Lennar Corp., | ||||||||
Sr. Unsec. Gtd. Global Notes, | ||||||||
4.75%, 11/15/2022 | 310,000 | 327,437 | ||||||
Sr. Unsec. Gtd. Notes, | ||||||||
4.50%, 04/30/2024 | 3,439,000 | 3,559,365 | ||||||
MDC Holdings, Inc., Sr. Unsec. Gtd. Notes, 6.00%, 01/15/2043 | 9,960,000 | 9,586,500 | ||||||
Meritage Homes Corp., Sr. Unsec. Gtd. Global Notes, | ||||||||
6.00%, 06/01/2025 | 83,000 | 89,640 | ||||||
7.15%, 04/15/2020 | 55,000 | 60,775 | ||||||
Taylor Morrison Communities Inc./ Taylor Morrison Holdings II, Inc., Sr. Unsec. Gtd. Notes, 5.88%, 04/15/2023(b) | 68,000 | 71,740 | ||||||
| 14,723,806 | ||||||||
| Hotel and Resort REIT’s–0.16% | ||||||||
Hospitality Properties Trust, Sr. Unsec. Notes, 4.95%, 02/15/2027 | 2,775,000 | 2,945,291 | ||||||
Host Hotels & Resorts L.P., Series F, Sr. Unsec. Global Notes, 4.50%, 02/01/2026 | 2,280,000 | 2,426,356 | ||||||
| 5,371,647 | ||||||||
| Hotels, Resorts & Cruise Lines–0.01% | ||||||||
Choice Hotels International, Inc., Sr. Unsec. Gtd. Notes, 5.75%, 07/01/2022 | 290,000 | 323,531 | ||||||
| Household Products–0.50% | ||||||||
Church & Dwight Co., Inc., Sr. Unsec. Global Notes, 2.45%, 08/01/2022 | 1,976,000 | 1,984,901 | ||||||
Reynolds Group Issuer Inc./LLC (New Zealand), | ||||||||
Sr. Sec. Gtd. First Lien Global Notes, 5.75%, 10/15/2020 | 13,686,000 | 13,942,612 | ||||||
Sr. Sec. Gtd. First Lien Notes, | ||||||||
5.13%, 07/15/2023(b) | 42,000 | 43,785 | ||||||
Sr. Unsec. Gtd. Notes, | ||||||||
7.00%, 07/15/2024(b) | 218,000 | 233,805 | ||||||
Spectrum Brands, Inc., Sr. Unsec. Gtd. Global Notes, 5.75%, 07/15/2025 | 305,000 | 325,588 | ||||||
See accompanying Notes to Financial Statements which are an integral part of the financial statements.
18 Invesco Core Plus Bond Fund
| Principal Amount | Value | |||||||
| Household Products–(continued) | ||||||||
Springs Industries, Inc., Sr. Sec. Global Notes, 6.25%, 06/01/2021 | $ | 97,000 | $ | 100,395 | ||||
| 16,631,086 | ||||||||
| Housewares & Specialties–0.16% | ||||||||
Newell Brands Inc., Sr. Unsec. Global Notes, 3.85%, 04/01/2023 | 4,952,000 | 5,241,449 | ||||||
| Hypermarkets & Super Centers–0.73% | ||||||||
Costco Wholesale Corp., Sr. Unsec. Global Notes, | ||||||||
2.15%, 05/18/2021 | 12,077,000 | 12,170,482 | ||||||
2.75%, 05/18/2024 | 4,971,000 | 5,035,698 | ||||||
3.00%, 05/18/2027 | 7,168,000 | 7,247,934 | ||||||
| 24,454,114 | ||||||||
| Independent Power Producers & Energy Traders–0.04% | ||||||||
AES Corp. (The), | ||||||||
Sr. Unsec. Global Notes, | ||||||||
8.00%, 06/01/2020 | 15,000 | 17,231 | ||||||
Sr. Unsec. Notes, | ||||||||
5.50%, 03/15/2024 | 85,000 | 88,931 | ||||||
5.50%, 04/15/2025 | 487,000 | 507,697 | ||||||
Calpine Corp., Sr. Unsec. Global Notes, 5.38%, 01/15/2023 | 143,000 | 136,923 | ||||||
Dynegy Inc., Sr. Unsec. Gtd. Global Notes, 7.38%, 11/01/2022 | 100,000 | 104,000 | ||||||
NRG Energy, Inc., Sr. Unsec. Gtd. Global Notes, | ||||||||
6.25%, 05/01/2024 | 240,000 | 248,400 | ||||||
6.63%, 03/15/2023 | 123,000 | 127,613 | ||||||
6.63%, 01/15/2027 | 62,000 | 65,410 | ||||||
| 1,296,205 | ||||||||
| Industrial Conglomerates–0.02% | ||||||||
Alfa S.A.B. de C.V. (Mexico), REGS, Sr. Unsec. Euro Notes, 6.88%, 03/25/2044(b) | 300,000 | 335,625 | ||||||
CITIC Ltd. (China), REGS, Sr. Unsec. Medium-Term Euro Notes, 3.13%, 02/28/2022(b) | 200,000 | 202,116 | ||||||
| 537,741 | ||||||||
| Industrial Machinery–0.00% | ||||||||
Mueller Industries, Inc., Unsec. Sub. Deb., 6.00%, 03/01/2027 | 34,000 | 35,020 | ||||||
| Integrated Oil & Gas–0.47% | ||||||||
Ecopetrol S.A. (Colombia), Sr. Unsec. Global Notes, 5.88%, 05/28/2045 | 100,000 | 96,625 | ||||||
Petrobras Global Finance B.V. (Brazil), Sr. Unsec. Gtd. Global Notes, | ||||||||
4.38%, 05/20/2023 | 200,000 | 196,750 | ||||||
6.13%, 01/17/2022 | 78,000 | 82,973 | ||||||
7.25%, 03/17/2044 | 101,000 | 104,661 | ||||||
7.38%, 01/17/2027 | 200,000 | 221,250 | ||||||
| Principal Amount | Value | |||||||
| Integrated Oil & Gas–(continued) | ||||||||
Petróleos del Perú S.A. (Peru), | ||||||||
Sr. Unsec. Notes, | ||||||||
4.75%, 06/19/2032(b) | $ | 375,000 | $ | 395,524 | ||||
5.63%, 06/19/2047(b) | 400,000 | 428,581 | ||||||
Petróleos Mexicanos (Mexico), | ||||||||
Sr. Unsec. Gtd. Global Bonds, | ||||||||
6.63%, 06/15/2035 | 200,000 | 217,600 | ||||||
Sr. Unsec. Gtd. Global Notes, | ||||||||
6.50%, 06/02/2041 | 450,000 | 474,168 | ||||||
6.88%, 08/04/2026 | 300,000 | 345,223 | ||||||
Sr. Unsec. Gtd. Notes, | ||||||||
5.38%, 03/13/2022(b) | 300,000 | 323,298 | ||||||
6.50%, 03/13/2027(b) | 333,000 | 372,951 | ||||||
6.50%, 03/13/2027(b) | 4,374,000 | 4,898,852 | ||||||
6.75%, 09/21/2047(b) | 6,649,000 | 7,132,296 | ||||||
PTT PCL (Thailand), REGS, Sr. Unsec. Euro Notes, 3.38%, 10/25/2022(b) | 500,000 | 515,674 | ||||||
| 15,806,426 | ||||||||
| Integrated Telecommunication Services–2.72% | ||||||||
AT&T Inc., | ||||||||
Sr. Unsec. Global Notes, | ||||||||
3.40%, 05/15/2025 | 4,505,000 | 4,496,623 | ||||||
3.90%, 08/14/2027 | 14,579,000 | 14,761,996 | ||||||
4.75%, 05/15/2046 | 5,080,000 | 4,886,277 | ||||||
5.15%, 02/14/2050 | 13,072,000 | 13,234,223 | ||||||
5.25%, 03/01/2037 | 5,465,000 | 5,794,493 | ||||||
5.30%, 08/14/2058 | 12,453,000 | 12,681,114 | ||||||
5.70%, 03/01/2057 | 5,620,000 | 6,028,301 | ||||||
Sr. Unsec. Notes, | ||||||||
3.95%, 01/15/2025 | 1,021,000 | 1,056,768 | ||||||
4.45%, 04/01/2024 | 3,183,000 | 3,419,491 | ||||||
CenturyLink, Inc., | ||||||||
Series S, Sr. Unsec. Notes, 6.45%, 06/15/2021 | 150,000 | 157,687 | ||||||
Series Y, Sr. Unsec. Global Notes, 7.50%, 04/01/2024 | 122,000 | 128,100 | ||||||
Cincinnati Bell Inc., Sr. Unsec. Gtd. Notes, 7.00%, 07/15/2024(b) | 92,000 | 91,540 | ||||||
Frontier Communications Corp., | ||||||||
Sr. Unsec. Global Notes, | ||||||||
10.50%, 09/15/2022 | 120,000 | 108,150 | ||||||
11.00%, 09/15/2025 | 410,000 | 357,725 | ||||||
Ooredoo International Finance Ltd. (Qatar), REGS, Sr. Unsec. Gtd. Medium-Term Euro Notes, 5.00%, 10/19/2025(b) | 400,000 | 438,855 | ||||||
SFR Group S.A. (France), | ||||||||
Sr. Sec. Gtd. First Lien Bonds, | ||||||||
6.00%, 05/15/2022(b) | 916,000 | 964,090 | ||||||
Sr. Sec. Gtd. First Lien Notes, | ||||||||
7.38%, 05/01/2026(b) | 200,000 | 216,000 | ||||||
T-Mobile USA, Inc., | ||||||||
Sr. Unsec. Gtd. Global Bonds, | ||||||||
6.50%, 01/15/2026 | 405,000 | 450,056 | ||||||
Sr. Unsec. Gtd. Global Notes, | ||||||||
6.38%, 03/01/2025 | 1,108,000 | 1,193,870 | ||||||
See accompanying Notes to Financial Statements which are an integral part of the financial statements.
19 Invesco Core Plus Bond Fund
| Principal Amount | Value | |||||||
| Integrated Telecommunication Services–(continued) | ||||||||
Telecom Italia Capital S.A. (Italy), | ||||||||
Sr. Unsec. Gtd. Global Notes, | ||||||||
6.38%, 11/15/2033 | $ | 82,000 | $ | 94,300 | ||||
7.20%, 07/18/2036 | 160,000 | 199,200 | ||||||
Verizon Communications Inc., | ||||||||
Sr. Unsec. Global Bonds, | ||||||||
5.25%, 03/16/2037 | 3,760,000 | 4,066,925 | ||||||
Sr. Unsec. Global Notes, | ||||||||
1.75%, 08/15/2021 | 1,397,000 | 1,372,766 | ||||||
4.13%, 08/15/2046 | 1,701,000 | 1,514,749 | ||||||
4.52%, 09/15/2048 | 12,527,000 | 11,735,394 | ||||||
5.01%, 08/21/2054 | 1,698,000 | 1,670,089 | ||||||
| 91,118,782 | ||||||||
| Internet & Direct Marketing Retail–1.30% | ||||||||
Amazon.com, Inc., | ||||||||
Sr. Unsec. Notes, | ||||||||
2.80%, 08/22/2024(b) | 6,984,000 | 7,091,459 | ||||||
3.15%, 08/22/2027(b) | 9,661,000 | 9,841,530 | ||||||
3.88%, 08/22/2037(b) | 7,052,000 | 7,289,318 | ||||||
4.05%, 08/22/2047(b) | 7,586,000 | 7,831,855 | ||||||
4.25%, 08/22/2057(b) | 11,198,000 | 11,647,773 | ||||||
| 43,701,935 | ||||||||
| Internet Software & Services–0.18% | ||||||||
Alibaba Group Holding Ltd. (China), Sr. Unsec. Global Notes, 3.60%, 11/28/2024 | 200,000 | 210,167 | ||||||
Tencent Holdings Ltd. (China), Sr. Unsec. Notes, 3.38%, 05/02/2019(b) | 5,779,000 | 5,904,381 | ||||||
| 6,114,548 | ||||||||
| Investment Banking & Brokerage–1.72% | ||||||||
Cantor Fitzgerald, L.P., Unsec. Notes, 6.50%, 06/17/2022(b) | 1,896,000 | 2,145,144 | ||||||
E*TRADE Financial Corp., Sr. Unsec. Global Notes, 2.95%, 08/24/2022 | 6,247,000 | 6,282,139 | ||||||
Goldman Sachs Group Inc. (The), | 1,921,000 | 2,073,667 | ||||||
Sr. Unsec. Global Notes, 3.75%, 05/22/2025 | 5,776,000 | 5,955,538 | ||||||
Jefferies Group LLC, Sr. Unsec. Global Notes, 4.85%, 01/15/2027 | 3,780,000 | 4,041,627 | ||||||
Morgan Stanley, | ||||||||
Sr. Unsec. Global Notes, | ||||||||
3.59%, 07/22/2028 | 14,137,000 | 14,341,174 | ||||||
Sr. Unsec. Medium-Term Global Notes, | ||||||||
5.50%, 07/28/2021 | 4,875,000 | 5,425,865 | ||||||
Series G, Unsec. Sub. Medium-Term Notes, | ||||||||
4.35%, 09/08/2026 | 5,000,000 | 5,259,825 | ||||||
Raymond James Financial, Inc., Sr. Unsec. Global Notes, 4.95%, 07/15/2046 | 10,915,000 | 11,995,656 | ||||||
| 57,520,635 | ||||||||
| Principal Amount | Value | |||||||
| Leisure Facilities–0.01% | ||||||||
Cedar Fair L.P./Canada’s Wonderland Co./Magnum Management Corp., Sr. Unsec. Gtd. Global Notes, 5.38%, 06/01/2024 | $ | 115,000 | $ | 121,613 | ||||
Six Flags Entertainment Corp., Sr. Unsec. Gtd. Notes, 4.88%, 07/31/2024(b) | 177,000 | 178,991 | ||||||
| 300,604 | ||||||||
| Life & Health Insurance–0.88% | ||||||||
American Equity Investment Life Holding Co., Sr. Unsec. Global Notes, 5.00%, 06/15/2027 | 7,395,000 | 7,783,238 | ||||||
Dai-ichi Life Insurance Co., Ltd. (The) (Japan), Jr. Unsec. Sub. Notes, 4.00%(b)(c) | 3,335,000 | 3,364,181 | ||||||
Forethought Financial Group, Inc., Sr. Unsec. Notes, 8.63%, 04/15/2021(b) | 50,000 | 56,596 | ||||||
MetLife, Inc., | ||||||||
Sr. Unsec. Global Notes, | ||||||||
4.13%, 08/13/2042 | 2,200,000 | 2,279,829 | ||||||
Series C, Jr. Unsec. Sub. Global Notes, 5.25%(c) | 8,176,000 | 8,503,040 | ||||||
Prudential Financial, Inc., | ||||||||
Jr. Unsec. Sub. Global Notes, | ||||||||
5.63%, 06/15/2043 | 5,479,000 | 5,958,413 | ||||||
8.88%, 06/15/2068 | 1,640,000 | 1,730,200 | ||||||
| 29,675,497 | ||||||||
| Managed Health Care–0.08% | ||||||||
Centene Corp., Sr. Unsec. Notes, 4.75%, 01/15/2025 | 65,000 | 67,600 | ||||||
Molina Healthcare, Inc., Sr. Unsec. Gtd. Notes, 4.88%, 06/15/2025(b) | 120,000 | 118,350 | ||||||
UnitedHealth Group Inc., Sr. Unsec. Global Notes, 3.75%, 07/15/2025 | 2,086,000 | 2,220,445 | ||||||
WellCare Health Plans Inc., Sr. Unsec. Notes, 5.25%, 04/01/2025 | 265,000 | 278,912 | ||||||
| 2,685,307 | ||||||||
| Marine Ports & Services–0.02% | ||||||||
DP World Ltd. (United Arab Emirates), REGS, Sr. Unsec. Medium-Term Euro Notes, 6.85%, 07/02/2037(b) | 200,000 | 248,361 | ||||||
PT Pelabuhan Indonesia II (Indonesia), | ||||||||
4.25%, 05/05/2025(b) | 200,000 | 205,500 | ||||||
REGS, Sr. Unsec. Euro Notes, | ||||||||
4.25%, 05/05/2025(b) | 300,000 | 308,520 | ||||||
| 762,381 | ||||||||
See accompanying Notes to Financial Statements which are an integral part of the financial statements.
20 Invesco Core Plus Bond Fund
| Principal Amount | Value | |||||||
| Metal & Glass Containers–0.03% | ||||||||
Ardagh Packaging Finance PLC / Ardagh Holdings USA Inc. (Ireland), Sr. Unsec. Gtd. Notes, 6.00%, 02/15/2025(b) | $ | 200,000 | $ | 212,500 | ||||
Ball Corp., Sr. Unsec. Gtd. Global Notes, 5.25%, 07/01/2025 | 455,000 | 497,087 | ||||||
Berry Global, Inc., | ||||||||
Sec. Gtd. Second Lien Global Notes, 6.00%, 10/15/2022 | 60,000 | 63,825 | ||||||
Sec. Gtd. Second Lien Notes, | ||||||||
5.50%, 05/15/2022 | 87,000 | 91,024 | ||||||
| 864,436 | ||||||||
| Movies & Entertainment–0.36% | ||||||||
21st Century Fox America, Inc., Sr. Unsec. Gtd. Global Notes, 6.55%, 03/15/2033 | 180,000 | 229,765 | ||||||
AMC Entertainment Holdings, Inc., Sr. Unsec. Gtd. Sub. Global Notes, 5.75%, 06/15/2025 | 310,000 | 297,212 | ||||||
Globo Comunicação e Participações S.A. (Brazil), Sr. Sec. Notes, 5.13%, 03/31/2027(b) | 267,000 | 269,768 | ||||||
Lions Gate Entertainment Corp., Sr. Unsec. Gtd. Notes, 5.88%, 11/01/2024(b) | 183,000 | 192,150 | ||||||
Time Warner, Inc., Sr. Unsec. Gtd. Global Deb., 5.35%, 12/15/2043 | 2,100,000 | 2,267,550 | ||||||
Viacom Inc., | ||||||||
Jr. Unsec. Sub. Global Notes, | ||||||||
5.88%, 02/28/2057 | 4,620,000 | 4,631,550 | ||||||
6.25%, 02/28/2057 | 2,220,000 | 2,236,650 | ||||||
Sr. Unsec. Global Notes, | ||||||||
3.45%, 10/04/2026 | 2,032,000 | 1,959,997 | ||||||
| 12,084,642 | ||||||||
| Multi-Line Insurance–0.87% | ||||||||
AIG Global Funding, Sr. Sec. First Lien Notes, 2.70%, 12/15/2021(b) | 6,594,000 | 6,673,286 | ||||||
American Financial Group, Inc., Sr. Unsec. Notes, 3.50%, 08/15/2026 | 2,690,000 | 2,717,347 | ||||||
American International Group, Inc., Sr. Unsec. Global Notes, 3.90%, 04/01/2026 | 5,670,000 | 5,938,103 | ||||||
Massachusetts Mutual Life Insurance Co., Unsec. Sub. Notes, 4.90%, 04/01/2077(b) | 5,165,000 | 5,759,946 | ||||||
Nationwide Mutual Insurance Co., Unsec. Sub. Notes, 4.95%, 04/22/2044(b) | 2,185,000 | 2,471,630 | ||||||
XLIT Ltd. (Bermuda), Unsec. Gtd. Sub. Bonds, 5.50%, 03/31/2045 | 5,097,000 | 5,642,221 | ||||||
| 29,202,533 | ||||||||
| Principal Amount | Value | |||||||
| Office REIT’s–0.09% | ||||||||
Alexandria Real Estate Equities, Inc., Sr. Unsec. Gtd. Global Notes, 3.95%, 01/15/2027 | $ | 2,805,000 | $ | 2,916,904 | ||||
| Office Services & Supplies–0.28% | ||||||||
Pitney Bowes Inc., Sr. Unsec. Global Notes, | ||||||||
3.38%, 10/01/2021 | 8,285,000 | 8,307,763 | ||||||
4.63%, 03/15/2024 | 1,070,000 | 1,096,493 | ||||||
| 9,404,256 | ||||||||
| Oil & Gas Drilling–0.02% | ||||||||
Ensco PLC, Sr. Unsec. Global Notes, 4.50%, 10/01/2024 | 220,000 | 162,250 | ||||||
Precision Drilling Corp. (Canada), | ||||||||
Sr. Unsec. Gtd. Global Notes, | ||||||||
5.25%, 11/15/2024 | 193,000 | 170,805 | ||||||
6.50%, 12/15/2021 | 81,000 | 78,975 | ||||||
7.75%, 12/15/2023 | 19,000 | 18,952 | ||||||
Transocean Inc., Sr. Unsec. Gtd. Global Notes, 7.50%, 04/15/2031 | 170,000 | 144,075 | ||||||
Vantage Drilling International, | ||||||||
Sr. Sec. Gtd. First Lien Global Notes, 7.50%, 11/01/2019(f) | 356,000 | 0 | ||||||
Sr. Sec. Second Lien Notes | ||||||||
10.00%, 12/31/2020(b) | 9,000 | 8,865 | ||||||
| 583,922 | ||||||||
| Oil & Gas Equipment & Services–0.02% | ||||||||
Archrock Partners, L.P./Archrock Partners Finance Corp., Sr. Unsec. Gtd. Global Notes, 6.00%, 10/01/2022 | 85,000 | 83,087 | ||||||
SESI, L.L.C., Sr. Unsec. Gtd. Global Notes, | ||||||||
6.38%, 05/01/2019 | 78,000 | 78,098 | ||||||
7.13%, 12/15/2021 | 223,000 | 225,230 | ||||||
Weatherford International Ltd., | ||||||||
Sr. Unsec. Gtd. Notes, | ||||||||
6.50%, 08/01/2036 | 222,000 | 185,925 | ||||||
8.25%, 06/15/2023 | 62,000 | 61,380 | ||||||
| 633,720 | ||||||||
| Oil & Gas Exploration & Production–2.03% | ||||||||
Anadarko Petroleum Corp., Sr. Unsec. Notes, 5.55%, 03/15/2026 | 4,878,000 | 5,443,004 | ||||||
Antero Resources Corp., Sr. Unsec. Gtd. Global Notes, 5.63%, 06/01/2023 | 318,000 | 325,950 | ||||||
California Resources Corp., Sec. Gtd. Second Lien Notes, 8.00%, 12/15/2022(b) | 104,000 | 57,980 | ||||||
Callon Petroleum Co., Sr. Unsec. Gtd. Global Notes, 6.13%, 10/01/2024 | 300,000 | 306,000 | ||||||
See accompanying Notes to Financial Statements which are an integral part of the financial statements.
21 Invesco Core Plus Bond Fund
| Principal Amount | Value | |||||||
| Oil & Gas Exploration & Production–(continued) | ||||||||
CNOOC Curtis Funding No.1 Pty Ltd. (China), REGS, Sr. Unsec. Gtd. Euro Notes, 4.50%, 10/03/2023(b) | $ | 200,000 | $ | 217,392 | ||||
CNOOC Finance (2015) U.S.A. LLC (China), Sr. Unsec. Gtd. Global Notes, 3.50%, 05/05/2025 | 400,000 | 406,223 | ||||||
Concho Resources Inc., Sr. Unsec. Gtd. Global Notes, | ||||||||
4.38%, 01/15/2025 | 1,907,000 | 1,988,047 | ||||||
5.50%, 04/01/2023 | 23,556,000 | 24,306,847 | ||||||
Continental Resources Inc., Sr. Unsec. Gtd. Global Notes, 3.80%, 06/01/2024 | 270,000 | 253,800 | ||||||
Denbury Resources Inc., Sr. Unsec. Gtd. Sub. Notes, 5.50%, 05/01/2022 | 80,000 | 37,000 | ||||||
Dolphin Energy Ltd. (United Arab Emirates), REGS, Sr. Sec. Euro Bonds, 5.50%, 12/15/2021(b) | 200,000 | 220,718 | ||||||
EP Energy LLC/Everest Acquisition Finance Inc., Sr. Sec. Gtd. First Lien Notes, 8.00%, 11/29/2024(b) | 152,000 | 148,960 | ||||||
Genesis Energy L.P./Genesis Energy Finance Corp., Sr. Unsec. Gtd. Notes, 6.50%, 10/01/2025 | 88,000 | 86,680 | ||||||
Gulfport Energy Corp., | ||||||||
Sr. Unsec. Gtd. Global Notes, | ||||||||
6.63%, 05/01/2023 | 35,000 | 35,088 | ||||||
Sr. Unsec. Gtd. Notes, | ||||||||
6.00%, 10/15/2024(b) | 294,000 | 288,855 | ||||||
Hess Corp., Sr. Unsec. Global Notes, 5.80%, 04/01/2047 | 2,071,000 | 2,085,163 | ||||||
Newfield Exploration Co., Sr. Unsec. Global Notes, 5.63%, 07/01/2024 | 359,000 | 384,130 | ||||||
Noble Energy, Inc., Sr. Unsec. Global Notes, | ||||||||
3.85%, 01/15/2028 | 9,477,000 | 9,471,290 | ||||||
4.95%, 08/15/2047 | 14,400,000 | 14,460,898 | ||||||
Oasis Petroleum Inc., Sr. Unsec. Gtd. Global Notes, 6.88%, 01/15/2023 | 254,000 | 247,015 | ||||||
ONGC Videsh Ltd. (India), REGS, Sr. Unsec. Gtd. Euro Notes, 3.75%, 05/07/2023(b) | 200,000 | 206,734 | ||||||
Parsley Energy LLC/Parsley Finance Corp., Sr. Unsec. Gtd. Notes, 6.25%, 06/01/2024(b) | 316,000 | 331,800 | ||||||
Pertamina Persero PT (Indonesia), REGS, Sr. Unsec. Medium-Term Euro Notes, 4.30%, 05/20/2023(b) | 200,000 | 209,603 | ||||||
QEP Resources, Inc., | ||||||||
Sr. Unsec. Global Notes, | ||||||||
5.25%, 05/01/2023 | 79,000 | 75,741 | ||||||
Sr. Unsec. Notes, | ||||||||
6.88%, 03/01/2021 | 355,000 | 369,200 | ||||||
| Principal Amount | Value | |||||||
| Oil & Gas Exploration & Production–(continued) | ||||||||
Range Resources Corp., | ||||||||
Sr. Unsec. Gtd. Global Notes, | ||||||||
4.88%, 05/15/2025 | $ | 181,000 | $ | 174,213 | ||||
Sr. Unsec. Gtd. Notes, | ||||||||
5.88%, 07/01/2022(b) | 157,000 | 160,140 | ||||||
Rice Energy Inc., Sr. Unsec. Gtd. Global Notes, 7.25%, 05/01/2023 | 175,000 | 187,250 | ||||||
RSP Permian, Inc., Sr. Unsec. Gtd. Notes, 5.25%, 01/15/2025(b) | 251,000 | 252,882 | ||||||
SM Energy Co., Sr. Unsec. Global Notes, 6.13%, 11/15/2022 | 124,000 | 117,800 | ||||||
Southwestern Energy Co., Sr. Unsec. Global Notes, 4.10%, 03/15/2022 | 342,000 | 317,205 | ||||||
Tengizchevroil Finance Co. International Ltd. (Kazakhstan), | ||||||||
Sr. Sec. Bonds, | ||||||||
4.00%, 08/15/2026(b) | 3,800,000 | 3,812,073 | ||||||
REGS, Sr. Sec. Gtd. Euro Bonds, | ||||||||
4.00%, 08/15/2026(b) | 200,000 | 200,601 | ||||||
Whiting Petroleum Corp., Sr. Unsec. Gtd. Global Notes, 6.25%, 04/01/2023 | 406,000 | 378,595 | ||||||
WildHorse Resource Development Corp., Sr. Unsec. Gtd. Notes, 6.88%, 02/01/2025(b) | 237,000 | 233,445 | ||||||
WPX Energy Inc., Sr. Unsec. Notes, 5.25%, 09/15/2024 | 204,000 | 200,940 | ||||||
| 67,999,262 | ||||||||
| Oil & Gas Refining & Marketing–0.01% | ||||||||
Reliance Industries Ltd. (India), REGS, Sr. Unsec. Euro Notes, 4.13%, 01/28/2025(b) | 250,000 | 263,018 | ||||||
| Oil & Gas Storage & Transportation–5.14% | ||||||||
Andeavor Logistics L.P./Tesoro Logistics Finance Corp., | ||||||||
Sr. Unsec. Gtd. Global Notes, | ||||||||
6.38%, 05/01/2024 | 356,000 | 388,485 | ||||||
Sr. Unsec. Gtd. Notes, | ||||||||
5.25%, 01/15/2025 | 32,000 | 34,200 | ||||||
Antero Midstream Partners LP/Antero Midstream Finance Corp., Sr. Unsec. Gtd. Global Notes, 5.38%, 09/15/2024 | 307,000 | 314,675 | ||||||
Energy Transfer Equity, L.P., Sr. Sec. First Lien Notes, 5.88%, 01/15/2024 | 512,000 | 554,240 | ||||||
Energy Transfer, LP, | ||||||||
Sr. Unsec. Notes, | ||||||||
4.20%, 04/15/2027 | 3,519,000 | 3,575,200 | ||||||
4.75%, 01/15/2026 | 9,668,000 | 10,215,073 | ||||||
5.30%, 04/15/2047 | 7,439,000 | 7,447,678 | ||||||
See accompanying Notes to Financial Statements which are an integral part of the financial statements.
22 Invesco Core Plus Bond Fund
| Principal Amount | Value | |||||||
| Oil & Gas Storage & Transportation–(continued) | ||||||||
Enterprise Products Operating LLC, | ||||||||
Series D, Jr. Unsec. Sub. Gtd. Deb., 4.88%, 08/16/2077 | $ | 15,981,000 | $ | 16,032,139 | ||||
Series E, Jr. Unsec. Sub. Gtd. Deb., 5.25%, 08/16/2077 | 15,141,000 | 15,194,501 | ||||||
EQT Midstream Partners L.P., Sr. Unsec. Notes, 4.00%, 08/01/2024 | 2,255,000 | 2,307,252 | ||||||
Holly Energy Partners L.P./Holly Energy Finance Corp., Sr. Unsec. Gtd. Notes, 6.00%, 08/01/2024(b) | 93,000 | 97,185 | ||||||
Kinder Morgan Energy Partners, L.P., Sr. Unsec. Gtd. Notes, 2.65%, 02/01/2019 | 6,243,000 | 6,294,467 | ||||||
Kinder Morgan, Inc., Sr. Unsec. Gtd. Medium-Term Global Notes, | ||||||||
7.75%, 01/15/2032 | 16,441,000 | 21,188,832 | ||||||
7.80%, 08/01/2031 | 2,350,000 | 3,017,381 | ||||||
MPLX LP, | ||||||||
Sr. Unsec. Global Bonds, | ||||||||
4.50%, 07/15/2023 | 22,197,000 | 23,619,928 | ||||||
Sr. Unsec. Global Notes, | ||||||||
4.88%, 06/01/2025 | 125,000 | 134,049 | ||||||
5.50%, 02/15/2023 | 16,089,000 | 16,552,886 | ||||||
NGPL PipeCo. LLC, | ||||||||
Sr. Unsec. Bonds, | ||||||||
4.88%, 08/15/2027(b) | 4,069,000 | 4,211,415 | ||||||
Sr. Unsec. Notes, | ||||||||
4.38%, 08/15/2022(b) | 2,435,000 | 2,508,050 | ||||||
7.77%, 12/15/2037(b) | 3,253,000 | 4,049,985 | ||||||
ONEOK, Inc., Sr. Unsec. Gtd. Global Notes, | ||||||||
4.00%, 07/13/2027 | 2,421,000 | 2,454,979 | ||||||
4.25%, 02/01/2022 | 3,510,000 | 3,664,272 | ||||||
Sabine Pass Liquefaction, LLC, | ||||||||
Sr. Sec. First Lien Global Notes, | ||||||||
4.20%, 03/15/2028 | 14,628,000 | 14,737,710 | ||||||
5.00%, 03/15/2027 | 4,086,000 | 4,341,375 | ||||||
5.63%, 04/15/2023 | 3,000,000 | 3,328,125 | ||||||
5.63%, 03/01/2025 | 822,000 | 909,337 | ||||||
SemGroup Corp., Sr. Unsec. Gtd. Notes, 6.38%, 03/15/2025(b) | 185,000 | 183,150 | ||||||
Targa Resources Partners L.P./Targa Resources Partners Finance Corp., | ||||||||
Sr. Unsec. Gtd. Global Bonds, | ||||||||
5.25%, 05/01/2023 | 145,000 | 148,806 | ||||||
Sr. Unsec. Gtd. Notes, | ||||||||
5.13%, 02/01/2025(b) | 242,000 | 249,865 | ||||||
Williams Cos., Inc. (The), | ||||||||
Sr. Unsec. Global Notes, | ||||||||
4.55%, 06/24/2024 | 469,000 | 481,609 | ||||||
Sr. Unsec. Notes, | ||||||||
7.88%, 09/01/2021 | 109,000 | 127,257 | ||||||
| Principal Amount | Value | |||||||
| Oil & Gas Storage & Transportation–(continued) | ||||||||
Williams Partners L.P., Sr. Unsec. Notes, 4.13%, 11/15/2020 | $ | 3,708,000 | $ | 3,894,603 | ||||
| 172,258,709 | ||||||||
| Other Diversified Financial Services–0.48% | ||||||||
Equate Petrochemical B.V. (Kuwait), REGS, Sr. Unsec. Gtd. Euro Notes, 3.00%, 03/03/2022(b) | 200,000 | 199,686 | ||||||
Fondo MIVIVIENDA S.A. (Peru), REGS, Sr. Unsec. Euro Notes, 3.50%, 01/31/2023(b) | 300,000 | 307,650 | ||||||
Majapahit Holding B.V. (Indonesia), REGS, Sr. Unsec. Gtd. Euro Notes, 7.75%, 01/20/2020(b) | 200,000 | 224,700 | ||||||
Minmetals Bounteous Finance (BVI) Ltd. (China), | ||||||||
REGS, Sr. Unsec. Gtd. Euro Bonds, | ||||||||
3.13%, 07/27/2021(b) | 300,000 | 302,409 | ||||||
4.20%, 07/27/2026(b) | 200,000 | 208,216 | ||||||
Peru Enhanced Pass-Through Finance Ltd. (Peru), REGS, Class A-2, Sr. Sec. First Lien Pass Through Euro Ctfs., 0.00% 06/02/2025(b)(g) | 300,000 | 254,250 | ||||||
SMBC Aviation Capital Finance DAC (Ireland), Sr. Unsec. Gtd. Notes, 3.00%, 07/15/2022(b) | 4,567,000 | 4,594,948 | ||||||
SPARC EM SPC Panama Metro Line 2 S.P. (Cayman Islands), Sr. Sec. Notes, 0.00% | 3,054,000 | 2,739,056 | ||||||
VFH Parent LLC/Orchestra Co-Issuer Inc., Sec. Gtd. Second Lien Notes, 6.75%, 06/15/2022(b) | 3,331,000 | 3,472,567 | ||||||
Washington Prime Group, L.P., Sr. Unsec. Notes, 5.95%, 08/15/2024 | 3,805,000 | 3,900,795 | ||||||
| 16,204,277 | ||||||||
| Packaged Foods & Meats–0.18% | ||||||||
B&G Foods, Inc., Sr. Unsec. Gtd. Notes, 5.25%, 04/01/2025 | 122,000 | 125,812 | ||||||
JBS Investments GmbH (Brazil), Sr. Unsec. Gtd. Notes, 7.25%, 04/03/2024(b) | 250,000 | 253,125 | ||||||
Kraft Heinz Foods Co. (The), Sr. Unsec. Gtd. Global Notes, 4.38%, 06/01/2046 | 4,780,000 | 4,682,933 | ||||||
Lamb Weston Holdings, Inc., Sr. Unsec. Gtd. Notes, 4.63%, 11/01/2024(b) | 248,000 | 256,990 | ||||||
Minerva Luxembourg S.A. (Brazil), Sr. Unsec. Gtd. Notes, 6.50%, 09/20/2026(b) | 200,000 | 201,832 | ||||||
TreeHouse Foods, Inc., Sr. Unsec. Gtd. Notes, 6.00%, 02/15/2024(b) | 350,000 | 372,750 | ||||||
| 5,893,442 | ||||||||
See accompanying Notes to Financial Statements which are an integral part of the financial statements.
23 Invesco Core Plus Bond Fund
| Principal Amount | Value | |||||||
| Paper Packaging–0.01% | ||||||||
Graphic Packaging International Inc., Sr. Unsec. Gtd. Notes, 4.88%, 11/15/2022 | $ | 240,000 | $ | 255,600 | ||||
| Paper Products–0.18% | ||||||||
Clearwater Paper Corp., Sr. Unsec. Gtd. Global Notes, 4.50%, 02/01/2023 | 5,664,000 | 5,678,160 | ||||||
Mercer International Inc. (Canada), | ||||||||
Sr. Unsec. Global Notes, | ||||||||
7.75%, 12/01/2022 | 105,000 | 112,219 | ||||||
Sr. Unsec. Notes, | ||||||||
6.50%, 02/01/2024(b) | 77,000 | 80,561 | ||||||
PH Glatfelter Co., Sr. Unsec. Gtd. Global Notes, 5.38%, 10/15/2020 | 114,000 | 116,137 | ||||||
| 5,987,077 | ||||||||
| Pharmaceuticals–0.23% | ||||||||
Eli Lilly and Co., Sr. Unsec. Global Notes, 2.35%, 05/15/2022 | 2,280,000 | 2,305,112 | ||||||
Endo DAC/Endo Finance LLC/Endo Finco Inc., Sr. Unsec. Gtd. Notes, 6.00%, 07/15/2023(b) | 200,000 | 169,000 | ||||||
Mylan N.V., Sr. Unsec. Gtd. Global Notes, 5.25%, 06/15/2046 | 4,127,000 | 4,453,578 | ||||||
Valeant Pharmaceuticals International, Inc., | ||||||||
Sr. Unsec. Gtd. Notes, | ||||||||
5.63%, 12/01/2021(b) | 280,000 | 257,600 | ||||||
5.88%, 05/15/2023(b) | 33,000 | 28,174 | ||||||
6.13%, 04/15/2025(b) | 175,000 | 148,312 | ||||||
7.00%, 10/01/2020(b) | 88,000 | 88,110 | ||||||
7.25%, 07/15/2022(b) | 80,000 | 76,500 | ||||||
REGS, Sr. Sec. Gtd. First Lien Euro Notes, | ||||||||
7.00%, 03/15/2024(b) | 150,000 | 159,562 | ||||||
| 7,685,948 | ||||||||
| Property & Casualty Insurance–0.27% | ||||||||
Allstate Corp. (The), Sr. Unsec. Notes, 4.20%, 12/15/2046 | 3,105,000 | 3,316,676 | ||||||
Arch Capital Finance LLC, Sr. Unsec. Gtd. Notes, 5.03%, 12/15/2046 | 3,499,000 | 3,972,376 | ||||||
Liberty Mutual Group Inc., Jr. Unsec. Gtd. Sub. Bonds, 7.80%, | 1,320,000 | 1,669,800 | ||||||
Qatar Reinsurance Co. Ltd. (Qatar), REGS, Unsec. Sub. Gtd. Euro Bonds, 4.95%(b)(c) | 200,000 | 199,800 | ||||||
| 9,158,652 | ||||||||
| Railroads–0.03% | ||||||||
Autopistas del Sol S.A. (Costa Rica), Sr. Sec. Notes, 7.38%, 12/30/2030(b) | 200,000 | 210,500 | ||||||
| Principal Amount | Value | |||||||
| Railroads–(continued) | ||||||||
Autoridad del Canal de Panamá (Panama), REGS, Sr. Unsec. Euro Bonds, 4.95%, 07/29/2035(b) | $ | 300,000 | $ | 334,125 | ||||
Kenan Advantage Group Inc. (The), Sr. Unsec. Notes, 7.88%, 07/31/2023(b) | 202,000 | 212,100 | ||||||
Lima Metro Line 2 Finance Ltd. (Peru), Sr. Sec. First Lien Bonds, 5.88%, 07/05/2034(b) | 300,000 | 327,750 | ||||||
| 1,084,475 | ||||||||
| Regional Banks–0.16% | ||||||||
CIT Group Inc., Sr. Unsec. Global Notes, | ||||||||
5.00%, 08/15/2022 | 241,000 | 260,882 | ||||||
5.00%, 08/01/2023 | 186,000 | 202,043 | ||||||
M&T Bank Corp., Series F, Jr. Unsec. Sub. Global Notes, 5.13%(c) | 4,668,000 | 4,913,070 | ||||||
| 5,375,995 | ||||||||
| Reinsurance–0.05% | ||||||||
Reinsurance Group of America, Inc., Sr. Unsec. Medium-Term Notes, 4.70%, 09/15/2023 | 1,650,000 | 1,801,948 | ||||||
| Research & Consulting Services–0.01% | ||||||||
IHS Markit Ltd., Sr. Unsec. Gtd. Notes, 5.00%, 11/01/2022(b) | 174,000 | 187,920 | ||||||
| Residential REIT’s–0.07% | ||||||||
Essex Portfolio L.P., Sr. Unsec. Gtd. Global Notes, 3.63%, 08/15/2022 | 2,135,000 | 2,215,547 | ||||||
| Restaurants–0.92% | ||||||||
1011778 BC ULC/ New Red Finance, Inc. (Canada), | ||||||||
Sec. Gtd. Second Lien Notes, | ||||||||
5.00%, 10/15/2025(b) | 7,305,000 | 7,505,887 | ||||||
Sec. Gtd. Second Lien Notes, | ||||||||
6.00%, 04/01/2022(b) | 7,755,000 | 8,026,425 | ||||||
Sr. Sec. Gtd. First Lien Notes, | ||||||||
4.63%, 01/15/2022(b) | 14,340,000 | 14,752,275 | ||||||
Aramark Services, Inc., Sr. Unsec. Gtd. Notes, 5.00%, 04/01/2025(b) | 158,000 | 167,085 | ||||||
Carrols Restaurant Group, Inc., | ||||||||
Sec. Gtd. Second Lien Global Notes, 8.00%, 05/01/2022 | 95,000 | 101,413 | ||||||
Sec. Gtd. Second Lien Notes, 8.00%, 05/01/2022(b) | 68,000 | 72,590 | ||||||
KFC Holding Co. (The)/Pizza Hut Holdings LLC/Taco Bell of America LLC, Sr. Unsec. Gtd. Notes, 4.75%, 06/01/2027(b) | 84,000 | 86,520 | ||||||
| 30,712,195 | ||||||||
See accompanying Notes to Financial Statements which are an integral part of the financial statements.
24 Invesco Core Plus Bond Fund
| Principal Amount | Value | |||||||
| Retail REIT’s–0.16% | ||||||||
Brixmor Operating Partnership LP, Sr. Unsec. Global Notes, 3.25%, 09/15/2023 | $ | 5,360,000 | $ | 5,350,703 | ||||
| Semiconductors–1.45% | ||||||||
Analog Devices, Inc., Sr. Unsec. Global Notes, | ||||||||
3.13%, 12/05/2023 | 4,975,000 | 5,098,022 | ||||||
4.50%, 12/05/2036 | 1,230,000 | 1,291,411 | ||||||
Broadcom Corp./Broadcom Cayman Finance Ltd., Sr. Unsec. Gtd. Notes, 3.00%, 01/15/2022(b) | 18,410,000 | 18,697,656 | ||||||
Micron Technology, Inc., Sr. Unsec. Global Notes, 5.50%, 02/01/2025 | 187,000 | 198,220 | ||||||
NXP B.V./NXP Funding LLC (Netherlands), | ||||||||
Sr. Unsec. Gtd. Notes, | ||||||||
4.63%, 06/01/2023(b) | 4,702,000 | 5,042,895 | ||||||
5.75%, 03/15/2023(b) | 2,120,000 | 2,219,375 | ||||||
Sr. Unsec. Notes, | ||||||||
3.88%, 09/01/2022(b) | 13,736,000 | 14,242,364 | ||||||
QUALCOMM Inc., Sr. Unsec. Global Notes, 3.00%, 05/20/2022 | 1,652,000 | 1,705,362 | ||||||
| 48,495,305 | ||||||||
| Sovereign Debt–0.99% | ||||||||
Argentine Republic Government International Bond (Argentina), | ||||||||
Sr. Unsec. Global Bonds, | ||||||||
5.63%, 01/26/2022 | 444,000 | 465,528 | ||||||
6.25%, 04/22/2019 | 9,010,000 | 9,496,540 | ||||||
6.88%, 01/26/2027 | 127,000 | 137,104 | ||||||
Sr. Unsec. Notes, | ||||||||
7.13%, 06/28/2117(b) | 110,000 | 109,010 | ||||||
Banque Ouest Africaine de Développement (Supranational), Sr. Unsec. Notes, 5.00%, 07/27/2027(b) | 200,000 | 205,376 | ||||||
Bermuda Government International Bond (Bermuda), REGS, Sr. Unsec. Euro Notes, 3.72%, 01/25/2027(b) | 200,000 | 204,616 | ||||||
Chile Government International Bond (Chile), Sr. Unsec. Global Notes, 3.86%, 06/21/2047 | 7,296,000 | 7,607,430 | ||||||
Colombia Government International Bond (Colombia), Sr. Unsec. Global Notes, 3.88%, 04/25/2027 | 300,000 | 306,075 | ||||||
Dominican Republic International Bond (Dominican Repubic), Sr. Unsec. Bonds, 5.50%, 01/27/2025(b) | 455,000 | 483,438 | ||||||
Ecuador Government International Bond (Ecuador), Sr. Unsec. Bonds, 8.75%, 06/02/2023(b) | 200,000 | 204,250 | ||||||
| Principal Amount | Value | |||||||
| Sovereign Debt–(continued) | ||||||||
Guatemala Government Bond (Guatemala), Sr. Unsec. Notes, 4.50%, 05/03/2026(b) | $ | 200,000 | $ | 203,750 | ||||
Honduras Government International Bond (Honduras), REGS, Sr. Unsec. Euro Notes, 8.75%, 12/16/2020(b) | 300,000 | 345,135 | ||||||
Hungary Government International Bond (Hungary), Sr. Unsec. Global Notes, 5.38%, 02/21/2023 | 300,000 | 340,711 | ||||||
Indonesia Government International Bond (Indonesia), REGS, Sr. Unsec. Medium-Term Euro Notes, 4.13%, 01/15/2025(b) | 300,000 | 316,260 | ||||||
Jamaica Government International Bond (Jamaica), | ||||||||
Sr. Unsec. Global Notes, | ||||||||
6.75%, 04/28/2028 | 303,000 | 354,510 | ||||||
7.88%, 07/28/2045 | 5,932,000 | 7,281,530 | ||||||
8.00%, 03/15/2039 | 200,000 | 247,014 | ||||||
Jordan Government International Bond (Jordan), Sr. Unsec. Notes, 5.75%, 01/31/2027(b) | 200,000 | 199,607 | ||||||
KazAgro National Management Holding JSC (Kazakhstan), REGS, Sr. Unsec. Medium-Term Euro Notes, 4.63%, 05/24/2023(b) | 200,000 | 201,266 | ||||||
KSA Sukuk Ltd. (Saudi Arabia), Sr. Unsec. Notes, 3.63%, 04/20/2027(b) | 200,000 | 206,580 | ||||||
Mexico Government International Bond (Mexico), Sr. Unsec. Global Notes, 4.15%, 03/28/2027 | 200,000 | 212,704 | ||||||
Sr. Unsec. Medium-Term Global Notes, 4.75%, 03/08/2044 | 200,000 | 209,200 | ||||||
Oman Government International Bond (Oman), | ||||||||
Sr. Unsec. Notes, | ||||||||
5.38%, 03/08/2027(b) | 200,000 | 208,893 | ||||||
6.50%, 03/08/2047(b) | 200,000 | 209,640 | ||||||
REGS, Sr. Unsec. Euro Notes, | ||||||||
3.63%, 06/15/2021(b) | 200,000 | 201,673 | ||||||
5.38%, 03/08/2027(b) | 300,000 | 312,993 | ||||||
Panama Government International Bond (Panama), Sr. Unsec. Global Bonds, 3.88%, 03/17/2028 | 200,000 | 212,000 | ||||||
Philippine Government International Bond (Philippines), Sr. Unsec. Global Bonds, 3.95%, 01/20/2040 | 200,000 | 211,428 | ||||||
Provincia de Buenos Aires (Argentina), REGS, Sr. Unsec. Euro Notes, 5.75%, 06/15/2019(b) | 500,000 | 518,125 | ||||||
See accompanying Notes to Financial Statements which are an integral part of the financial statements.
25 Invesco Core Plus Bond Fund
| Principal Amount | Value | |||||||
| Sovereign Debt–(continued) | ||||||||
Provincia de Córdoba (Argentina), Sr. Unsec. Notes, 7.13%, | $ | 150,000 | $ | 154,259 | ||||
Republic of Poland Government International Bond (Poland), | ||||||||
Sr. Unsec. Global Notes, | ||||||||
3.25%, 04/06/2026 | 85,000 | 88,009 | ||||||
4.00%, 01/22/2024 | 150,000 | 162,568 | ||||||
Senegal Government International Bond (Senegal), Unsec. Notes, 6.25%, 05/23/2033(b) | 390,000 | 402,675 | ||||||
Slovenia Government International Bond (Slovenia), REGS, Sr. Unsec. Euro Notes, 5.25%, 02/18/2024(b) | 300,000 | 346,653 | ||||||
Sri Lanka Government International Bond (Sri Lanka), Sr. Unsec. Notes, 6.20%, 05/11/2027(b) | 200,000 | 211,000 | ||||||
Trinidad & Tobago Government International Bond (Trinidad), Sr. Unsec. Notes, 4.50%, | 200,000 | 204,000 | ||||||
Turkey Government International Bond (Turkey), Sr. Unsec. Global Notes, 4.88%, 04/16/2043 | 200,000 | 184,944 | ||||||
Uruguay Government International Bond (Uruguay), | ||||||||
Sr. Unsec. Global Bonds, | ||||||||
4.13%, 11/20/2045 | 150,000 | 147,000 | ||||||
5.10%, 06/18/2050 | 150,000 | 157,594 | ||||||
| 33,271,088 | ||||||||
| Specialized Consumer Services–0.01% | ||||||||
ServiceMaster Co., LLC (The), | ||||||||
Sr. Unsec. Gtd. Notes, | ||||||||
5.13%, 11/15/2024(b) | 259,000 | 266,770 | ||||||
Sr. Unsec. Notes, | ||||||||
7.45%, 08/15/2027 | 191,000 | 207,951 | ||||||
| 474,721 | ||||||||
| Specialized Finance–1.83% | ||||||||
AerCap Global Aviation Trust (Ireland), Jr. Unsec. Gtd. Sub. Notes, 6.50%, 06/15/2045(b) | 41,843,000 | 45,347,351 | ||||||
Air Lease Corp., Sr. Unsec. Global Notes, | ||||||||
3.00%, 09/15/2023 | 8,891,000 | 8,904,666 | ||||||
3.38%, 06/01/2021 | 3,965,000 | 4,094,812 | ||||||
3.88%, 04/01/2021 | 2,425,000 | 2,543,923 | ||||||
Aircastle Ltd., | ||||||||
Sr. Unsec. Global Notes, | ||||||||
4.13%, 05/01/2024 | 86,000 | 89,010 | ||||||
7.63%, 04/15/2020 | 55,000 | 61,738 | ||||||
Sr. Unsec. Notes, | ||||||||
5.00%, 04/01/2023 | 327,000 | 349,890 | ||||||
| 61,391,390 | ||||||||
| Principal Amount | Value | |||||||
| Specialized REIT’s–0.38% | ||||||||
American Tower Corp., Sr. Unsec. Notes, 5.05%, 09/01/2020 | $ | 718,000 | $ | 776,730 | ||||
Crown Castle Towers LLC, Sr. Sec. Gtd. First Lien Notes, 4.88%, 08/15/2020(b) | 4,419,000 | 4,704,165 | ||||||
CyrusOne L.P./CyrusOne Finance Corp., Sr. Unsec. Gtd. Notes, 5.00%, 03/15/2024(b) | 57,000 | 59,708 | ||||||
EPR Properties, Sr. Unsec. Gtd. Global Notes, 7.75%, 07/15/2020 | 4,692,000 | 5,323,480 | ||||||
Equinix Inc., Sr. Unsec. Notes, 5.88%, 01/15/2026 | 481,000 | 529,100 | ||||||
GLP Capital LP/GLP Financing II Inc., Sr. Unsec. Gtd. Notes, 5.38%, 04/15/2026 | 156,000 | 169,845 | ||||||
Iron Mountain Inc., Sr. Unsec. Gtd. Notes, 6.00%, 08/15/2023 | 142,000 | 151,407 | ||||||
Iron Mountain US Holdings, Inc., Sr. Unsec. Gtd. Notes, 5.38%, 06/01/2026(b) | 172,000 | 182,750 | ||||||
Lamar Media Corp., Sr. Unsec. Gtd. Global Notes, 5.75%, 02/01/2026 | 445,000 | 482,825 | ||||||
Rayonier A.M. Products Inc., Sr. Unsec. Gtd. Notes, 5.50%, 06/01/2024(b) | 201,000 | 197,985 | ||||||
SBA Communications Corp., Sr. Unsec. Global Notes, 4.88%, 09/01/2024 | 316,000 | 328,640 | ||||||
| 12,906,635 | ||||||||
| Specialty Chemicals–0.04% | ||||||||
Ashland LLC, Sr. Unsec. Gtd. Global Notes, 4.75%, 08/15/2022 | 180,000 | 188,100 | ||||||
Axalta Coating Systems, LLC, Sr. Unsec. Gtd. Notes, 4.88%, 08/15/2024(b) | 310,000 | 317,750 | ||||||
GCP Applied Technologies Inc., Sr. Unsec. Gtd. Notes, 9.50%, 02/01/2023(b) | 120,000 | 135,600 | ||||||
Kraton Polymers LLC/Kraton Polymers Capital Corp., Sr. Unsec. Gtd. Notes, 10.50%, 04/15/2023(b) | 134,000 | 154,938 | ||||||
PolyOne Corp., Sr. Unsec. Global Notes, 5.25%, 03/15/2023 | 276,000 | 290,490 | ||||||
PQ Corp., Sr. Sec. Gtd. First Lien Notes, 6.75%, 11/15/2022(b) | 93,000 | 101,021 | ||||||
Venator Finance S.a.r.l./Venator Materials Corp. (Luxembourg), Sr. Unsec. Gtd. Notes, 5.75%, 07/15/2025(b) | 75,000 | 76,781 | ||||||
| 1,264,680 | ||||||||
| Steel–0.25% | ||||||||
ArcelorMittal (Luxembourg), Sr. Unsec. Global Notes, 7.50%, 10/15/2039 | 175,000 | 206,719 | ||||||
See accompanying Notes to Financial Statements which are an integral part of the financial statements.
26 Invesco Core Plus Bond Fund
| Principal Amount | Value | |||||||
| Steel–(continued) | ||||||||
FMG Resources (August 2006) Pty. Ltd. (Australia), Sr. Sec. Gtd. Notes, 9.75%, 03/01/2022(b) | $ | 276,000 | $ | 313,260 | ||||
Steel Dynamics, Inc., Sr. Unsec. Gtd. Global Notes, | ||||||||
5.00%, 12/15/2026 | 258,000 | 274,447 | ||||||
5.13%, 10/01/2021 | 2,592,000 | 2,676,240 | ||||||
United States Steel Corp., Sr. Unsec. Global Notes, 6.88%, 08/15/2025 | 4,602,000 | 4,705,545 | ||||||
Vale Canada Ltd. (Brazil), Sr. Unsec. Global Bonds, 7.20%, 09/15/2032 | 200,000 | 217,130 | ||||||
| 8,393,341 | ||||||||
| Systems Software–0.53% | ||||||||
Microsoft Corp., Sr. Unsec. Global Notes, 4.25%, 02/06/2047 | 3,476,000 | 3,835,891 | ||||||
VMware, Inc., Sr. Unsec. Global Notes, | ||||||||
2.30%, 08/21/2020 | 8,427,000 | 8,459,524 | ||||||
3.90%, 08/21/2027 | 5,310,000 | 5,368,036 | ||||||
| 17,663,451 | ||||||||
| Technology Distributors–0.16% | ||||||||
Avnet, Inc., Sr. Unsec. Global Notes, 4.63%, 04/15/2026 | 5,031,000 | 5,262,680 | ||||||
CDW LLC/CDW Finance Corp., Sr. Unsec. Gtd. Notes, 5.00%, 09/01/2025 | 158,000 | 165,703 | ||||||
| 5,428,383 | ||||||||
| Technology Hardware, Storage & Peripherals–0.54% | ||||||||
Apple Inc., Sr. Unsec. Global Notes, 4.25%, 02/09/2047 | 2,965,000 | 3,218,682 | ||||||
Dell International LLC/ EMC Corp., | ||||||||
Sr. Sec. Gtd. First Lien Notes, | ||||||||
6.02%, 06/15/2026(b) | 7,684,000 | 8,583,128 | ||||||
8.35%, 07/15/2046(b) | 4,166,000 | 5,409,151 | ||||||
Sr. Unsec. Gtd. Notes, | ||||||||
7.13%, 06/15/2024(b) | 413,000 | 457,914 | ||||||
Diebold Nixdorf, Inc., Sr. Unsec. Gtd. Global Notes, 8.50%, 04/15/2024 | 200,000 | 219,000 | ||||||
Western Digital Corp., Sr. Unsec. Gtd. Global Notes, 10.50%, 04/01/2024 | 275,000 | 327,594 | ||||||
| 18,215,469 | ||||||||
| Tobacco–0.35% | ||||||||
BAT Capital Corp. (United Kingdom), | ||||||||
Sr. Unsec. Gtd. Notes, | ||||||||
2.76%, 08/15/2022(b) | 5,271,000 | 5,290,864 | ||||||
3.22%, 08/15/2024(b) | 6,463,000 | 6,521,012 | ||||||
| 11,811,876 | ||||||||
| Principal Amount | Value | |||||||
| Trading Companies & Distributors–0.04% | ||||||||
BMC East, LLC, Sr. Sec. Gtd. First Lien Notes, 5.50%, 10/01/2024(b) | $ | 231,000 | $ | 241,684 | ||||
Fly Leasing Ltd. (Ireland), Sr. Unsec. Global Notes, 6.75%, 12/15/2020 | 200,000 | 207,750 | ||||||
H&E Equipment Services, Inc., Sr. Unsec. Gtd. Notes, 5.63%, 09/01/2025(b) | 271,000 | 281,162 | ||||||
Herc Rentals Inc., Sec. Gtd. Second Lien Notes, 7.75%, 06/01/2024(b) | 102,000 | 111,945 | ||||||
United Rentals North America, Inc., | ||||||||
Sr. Unsec. Gtd. Global Notes, | ||||||||
5.50%, 07/15/2025 | 130,000 | 139,100 | ||||||
Sr. Unsec. Gtd. Notes, | ||||||||
5.50%, 05/15/2027 | 222,000 | 235,875 | ||||||
5.88%, 09/15/2026 | 40,000 | 43,550 | ||||||
| 1,261,066 | ||||||||
| Trucking–0.30% | ||||||||
Avis Budget Car Rental LLC/Avis Budget Finance Inc., Sr. Unsec. Gtd. Notes, 5.25%, 03/15/2025(b) | 250,000 | 245,312 | ||||||
DAE Funding LLC (United Arab Emirates), | ||||||||
Sr. Unsec. Gtd. Notes, | ||||||||
4.00%, 08/01/2020(b) | 6,449,000 | 6,545,735 | ||||||
4.50%, 08/01/2022(b) | 2,561,000 | 2,621,824 | ||||||
Hertz Corp. (The), | ||||||||
Sec. Gtd. Second Lien Notes, | ||||||||
7.63%, 06/01/2022(b) | 66,000 | 66,990 | ||||||
Sr. Unsec. Gtd. Global Notes, | ||||||||
5.88%, 10/15/2020 | 426,000 | 410,025 | ||||||
6.75%, 04/15/2019 | 165,000 | 164,794 | ||||||
7.38%, 01/15/2021 | 85,000 | 84,150 | ||||||
| 10,138,830 | ||||||||
| Wireless Telecommunication Services–1.01% | ||||||||
América Móvil, S.A.B. de C.V. (Mexico), Sr. Unsec. Gtd. Global Notes, 6.13%, 03/30/2040 | 1,115,000 | 1,391,586 | ||||||
Axiata SPV2 Bhd. (Malaysia), REGS, Sr. Unsec. Medium-Term Euro Notes, 4.36%, 03/24/2026(b) | 200,000 | 214,928 | ||||||
Bharti Airtel International Netherlands B.V. (India), Sr. Unsec. Gtd. Notes, 5.35%, 05/20/2024(b) | 500,000 | 536,250 | ||||||
Bharti Airtel Ltd. (India), Sr. Unsec. Notes, 4.38%, 06/10/2025(b) | 200,000 | 203,644 | ||||||
Empresa Nacional de Telecomunicaciones S.A. (Chile), REGS, Sr. Unsec. Euro Notes, 4.88%, 10/30/2024(b) | 700,000 | 743,583 | ||||||
See accompanying Notes to Financial Statements which are an integral part of the financial statements.
27 Invesco Core Plus Bond Fund
| Principal Amount | Value | |||||||
| Wireless Telecommunication Services–(continued) | ||||||||
MTN (Mauritius) Investments Ltd. (South Africa), REGS, Sr. Unsec. Gtd. Euro Notes, 6.50%, 10/13/2026(b) | $ | 200,000 | $ | 213,695 | ||||
Rogers Communications Inc. (Canada), Sr. Unsec. Gtd. Global Notes, 5.00%, 03/15/2044 | 2,955,000 | 3,412,690 | ||||||
Sprint Communications Inc., | ||||||||
Sr. Unsec. Global Notes, | ||||||||
11.50%, 11/15/2021 | 140,000 | 178,150 | ||||||
Sr. Unsec. Gtd. Notes, | ||||||||
7.00%, 03/01/2020(b) | 105,000 | 114,975 | ||||||
Sprint Corp., Sr. Unsec. Gtd. Global Notes, | ||||||||
7.25%, 09/15/2021 | 179,000 | 197,571 | ||||||
7.63%, 02/15/2025 | 90,000 | 101,475 | ||||||
7.88%, 09/15/2023 | 665,000 | 758,100 | ||||||
Sprint Spectrum Co. LLC/Sprint Spectrum Co. II LLC/Sprint Spectrum Co. III LLC, Class A-1, Sr. Sec. Gtd. First Lien Asset-Backed Notes, 3.36%, 03/20/2023(b) | 24,498,000 | 24,881,438 | ||||||
Turkcell Iletisim Hizmetleri A.S. (Turkey), Sr. Unsec. Notes, 5.75%, 10/15/2025(b) | 330,000 | 352,688 | ||||||
Wind Acquisition Finance S.A. (Italy), | ||||||||
Sec. Gtd. Second Lien Notes, | ||||||||
7.38%, 04/23/2021(b) | 200,000 | 208,250 | ||||||
Sr. Sec. Gtd. First Lien Notes, | ||||||||
4.75%, 07/15/2020(b) | 300,000 | 304,875 | ||||||
| 33,813,898 | ||||||||
Total U.S. Dollar Denominated Bonds & Notes |
| 1,658,368,756 | ||||||
Asset-Backed Securities–14.04% |
| |||||||
Adjustable Rate Mortgage Trust, |
| |||||||
Series 2004-2, Class 6A1, Variable Rate Pass Through Ctfs., 3.41%, 02/25/2035(h) | 2,668,787 | 2,691,222 | ||||||
Series 2005-1, Class 4A1, Variable Rate Pass Through Ctfs., 3.47%, 05/25/2035(h) | 1,635,537 | 1,639,525 | ||||||
Banc of America Commercial Mortgage Trust, Series 2015-UBS7, Class AS, Variable Rate Pass Through Ctfs., 3.99%, 09/15/2048(h) | 4,394,000 | 4,695,043 | ||||||
Barclays Bank Commercial Mortgage Securities Trust, Series 2015-RRI, Class D, Floating Rate Pass Through Ctfs., 4.23% (1 mo. USD LIBOR + 3.00%), 05/15/2032(b)(i) | 3,730,000 | 3,739,523 | ||||||
| Principal Amount | Value | |||||||
Bear Stearns Adjustable Rate Mortgage Trust, | ||||||||
Series 2003-6, Class 1A3, Variable Rate Pass Through Ctfs., 3.21%, 08/25/2033(h) | $ | 300,519 | $ | 299,967 | ||||
Series 2004-10, Class 21A1, Variable Rate Pass Through Ctfs., 3.53%, 01/25/2035(h) | 960,490 | 976,383 | ||||||
Series 2005-2, Class A1, Floating Rate Pass Through Ctfs., 3.26% (1 yr. U.S. Treasury Yield Curve Rate + 2.45%), 03/25/2035(i) | 3,588,986 | 3,631,875 | ||||||
Series 2005-2, Class A2, Floating Rate Pass Through Ctfs., 3.64% (1 yr. USD LIBOR + 1.95%), 03/25/2035(i) | 1,705,738 | 1,727,368 | ||||||
Series 2005-5, Class A1, Floating Rate Pass Through Ctfs., 3.28% (1 yr. U.S. Treasury Yield Curve Rate + 2.05%), 08/25/2035(i) | 2,750,854 | 2,800,331 | ||||||
Series 2006-1, Class A1, Floating Rate Pass Through Ctfs., 2.91% (1 yr. U.S. Treasury Yield Curve Rate + 2.25%), 02/25/2036(i) | 1,042,263 | 1,046,170 | ||||||
Bear Stearns ALT-A Trust, Series 2004-11, Class 2A3, Variable Rate Pass Through Ctfs., 3.38%, 11/25/2034(h) | 2,869,726 | 2,863,597 | ||||||
BlueMountain CLO Ltd. (Cayman Islands), Series 2014-4A, Class A1R, Floating Rate Pass Through Ctfs., 2.67% (3 mo. USD LIBOR + 1.35%), 11/30/2026(b)(i) | 7,083,333 | 7,099,584 | ||||||
BX Trust, Series 2017-SLCT, Class A, Floating Rate Pass Through Ctfs., 2.17% (1 mo. USD LIBOR + 0.92%), 07/15/2034(b)(i) | 13,397,000 | 13,441,560 | ||||||
Canyon Capital CLO Ltd., Series 2006-1A, Class A2, Floating Rate Pass Through Ctfs., 1.52% (3 mo. USD LIBOR + 0.27%), 12/15/2020(b)(i) | 18,053,579 | 18,039,392 | ||||||
Carlyle Global Market Strategies CLO Ltd, Series 2014-1A, Class AR, Floating Rate Pass Through Ctfs., 2.60% (3 mo. USD LIBOR + 1.30%), 04/17/2025(b)(i) | 10,000,000 | 10,060,665 | ||||||
Cent CLO Ltd. (Cayman Islands), Series 2014-22A, Class A1R, Floating Rate Pass Through Ctfs., 2.72% (3 mo. USD LIBOR + 1.41%), 11/07/2026(b)(i) | 11,785,000 | 11,891,065 | ||||||
CFCRE Commercial Mortgage Trust, Series 2011-C2, Class C, Variable Rate Pass Through Ctfs., 5.95%, 12/15/2047(b)(h) | 5,000,000 | 5,550,826 | ||||||
CGDB Commercial Mortgage Trust, Series 2017-BIO, Class C, Floating Rate Pass Through Ctfs., 2.33% (1 mo. USD LIBOR + 1.10%), 05/15/2030(b)(i) | 5,570,000 | 5,563,001 | ||||||
See accompanying Notes to Financial Statements which are an integral part of the financial statements.
28 Invesco Core Plus Bond Fund
| Principal Amount | Value | |||||||
CGDBB Commercial Mortgage Trust, | ||||||||
Series 2017-BIOC, Class A, Floating Rate Pass Through Ctfs., 2.04% (1 mo. USD LIBOR + 0.79%), 07/15/2028(b)(i) | $ | 12,581,000 | $ | 12,599,523 | ||||
Series 2017-BIOC, Class C, Floating Rate Pass Through Ctfs., 2.30% (1 mo. USD LIBOR + 1.05%), 07/15/2028(b)(i) | 8,124,000 | 8,114,473 | ||||||
Series 2017-BIOC, Class D, Floating Rate Pass Through Ctfs., 2.85% (1 mo. USD LIBOR + 1.60%), 07/15/2028(b)(i) | 4,973,000 | 4,964,446 | ||||||
CGRBS Commercial Mortgage Trust, Series 2013-VN05, Class A, Pass Through Ctfs., 3.37%, 03/13/2035(b) | 1,647,256 | 1,719,942 | ||||||
Chase Mortgage Trust, | ||||||||
Series 2016-1, Class M3, Variable Rate Pass Through Ctfs., 3.75%, 04/25/2045(b)(h) | 3,286,940 | 3,354,039 | ||||||
Series 2016-2, Class M2, Variable Rate Pass Through Ctfs., 3.75%, 12/25/2045(b)(h) | 12,575,268 | 12,914,190 | ||||||
Series 2016-2, Class M3, Variable Rate Pass Through Ctfs., 3.75%, 12/25/2045(b)(h) | 5,595,782 | 5,692,428 | ||||||
Citigroup Commercial Mortgage Trust, | ||||||||
Series 2012-GC8, Class B, Pass Through Ctfs., 4.29%, 09/10/2045(b) | 1,300,000 | 1,379,303 | ||||||
Series 2013-GC11, Class D, Variable Rate Pass Through Ctfs., 4.60%, 04/10/2046(b)(h) | 752,554 | 713,510 | ||||||
Series 2015-GC27, Class A5, Pass Through Ctfs., 3.14%, 02/10/2048 | 1,233,335 | 1,262,012 | ||||||
Citigroup Mortgage Loan Trust, Inc., | ||||||||
Series 2004-HYB3, Class 2A, Variable Rate Pass Through Ctfs., 3.15%, 09/25/2034(h) | 2,099,773 | 2,048,614 | ||||||
Series 2004-UST1, Class A4, Variable Rate Pass Through Ctfs., 3.30%, 08/25/2034(h) | 797,735 | 778,200 | ||||||
Commercial Mortgage Loan Trust, Series 2008-LS1, Class A1A, Variable Rate Pass Through Ctfs., 6.27%, 12/10/2049(h) | 783,115 | 782,544 | ||||||
| Principal Amount | Value | |||||||
Commercial Mortgage Trust, | ||||||||
Series 2013-SFS, Class A1, Pass Through Ctfs., 1.87%, | $ | 512,908 | $ | 507,512 | ||||
Series 2013-THL, Class A2, Floating Rate Pass Through Ctfs., 2.28% (1 mo. USD LIBOR + 1.05%), 06/08/2030(b)(i) | 2,875,000 | 2,876,944 | ||||||
Series 2015-CR25, Class B, Variable Rate Pass Through Ctfs., 4.70%, 08/10/2048(h) | 5,267,000 | 5,642,685 | ||||||
Series 2016-GCT, Class B, Pass Through Ctfs., 3.09%, | 4,595,000 | 4,665,647 | ||||||
Series 2016-GCT, Class C, Variable Rate Pass Through Ctfs., 3.58%, 08/10/2029(b)(h) | 2,115,000 | 2,156,459 | ||||||
Countrywide Asset-Backed Ctfs., Series 2003-1, Class 3A, Floating Rate Pass Through Ctfs., 1.91% (1 mo. USD LIBOR + 0.68%), 06/25/2033(i) | 158,303 | 154,452 | ||||||
Countrywide Home Loans Mortgage Pass Through Trust, Series 2007-13, Class A10, Pass Through Ctfs., 6.00%, 08/25/2037 | 466,013 | 421,653 | ||||||
Credit Suisse First Boston Mortgage Securities Corp., Series 2004-AR5, Class 3A1, Variable Rate Pass Through Ctfs., 3.35%, | 2,445,202 | 2,463,890 | ||||||
CSAIL Commercial Mortgage Trust, Series 2015-C3, Class A4, Pass Through Ctfs., 3.72%, 08/15/2048 | 1,125,283 | 1,194,838 | ||||||
DB Master Finance LLC, Series 2015-1A, Class A2II, Pass Through Ctfs., 3.98%, | 12,896,325 | 13,310,483 | ||||||
DBUBS Mortgage Trust, Series 2011-LC1A, Class E, Variable Rate Pass Through Ctfs., 5.87%, | 638,333 | 678,615 | ||||||
Deephaven Residential Mortgage Trust, | ||||||||
Series 2017-2A, Class A2, Variable Rate Pass Through Ctfs., 2.61%, 06/25/2047(b)(h) | 1,895,393 | 1,899,981 | ||||||
Series 2017-2A, Class A3, Variable Rate Pass Through Ctfs., 2.71%, 06/25/2047(b)(h) | 2,049,572 | 2,054,547 | ||||||
Deutsche Mortgage Securities Inc Re-REMIC Trust Certificates, Series 2007-WM1, Class A1, Variable Rate Pass Through Ctfs., 3.17%, 06/27/2037(b)(h) | 9,435,847 | 9,598,911 | ||||||
Dominos Pizza Master Issuer LLC, Series 2017-1A, Class A2II, Pass Through Ctfs., 3.08%, | 8,863,000 | 8,888,524 | ||||||
See accompanying Notes to Financial Statements which are an integral part of the financial statements.
29 Invesco Core Plus Bond Fund
| Principal Amount | Value | |||||||
First Horizon Alternative Mortgage Securities Trust, | ||||||||
Series 2005-FA8, Class 2A1, Pass Through Ctfs., 5.00%, 11/25/2020 | $ | 113,497 | $ | 114,325 | ||||
Series 2006-FA5, Class A3, Pass Through Ctfs., 6.25%, 08/25/2036 | 244,430 | 198,656 | ||||||
GMACM Mortgage Loan Trust, Series 2006-AR1, Class 1A1, Variable Rate Pass Through Ctfs., 3.85%, 04/19/2036(h) | 1,102,067 | 1,050,744 | ||||||
GP Portfolio Trust, Series 2014-GPP, Class B, Floating Rate Pass Through Ctfs., 2.78% (1 mo. USD LIBOR + 1.55%), 02/15/2027(b)(i) | 5,000,000 | 5,010,236 | ||||||
GS Mortgage Securities Corp II, Series 2013-KING, Class A, Pass Through Ctfs., 2.71%, | 1,470,173 | 1,494,049 | ||||||
GS Mortgage Securities Trust, Series 2013-G1, Class A1, Pass Through Ctfs., 2.06%, 04/10/2031(b) | 955,238 | 937,178 | ||||||
GSR Mortgage Loan Trust, Series 2005-AR6, Class 3A2, Variable Rate Pass Through Ctfs., 3.25%, 09/25/2035(h) | 505,685 | 506,737 | ||||||
H/2 Asset Funding Ltd. (Cayman Islands), Series 2015-1A, Class AFL, Floating Rate Pass Through Ctfs., 2.89% (1 mo. USD LIBOR + 1.65%), 06/24/2049(b)(i) | 651,211 | 648,945 | ||||||
Harborview Mortgage Loan Trust, Series 2005-9, Class 2A1C, Floating Rate Pass Through Ctfs., 1.68% (1 mo. USD LIBOR + 0.45%), 06/20/2035(i) | 30,418 | 30,281 | ||||||
Hertz Vehicle Financing II LP, Series 2015-1A, Class A, Pass Through Ctfs., 2.73%, 03/25/2021(b) | 13,789,000 | 13,793,823 | ||||||
HMH Trust, Series 2017-NSS, Class A, Pass Through Ctfs., 3.06%, 07/05/2031(b) | 9,500,000 | 9,659,270 | ||||||
ICG US CLO Ltd. (Cayman Islands), Series 2014-3A, Class A1BR, Pass Through Ctfs., 2.97%, | 15,847,000 | 15,904,493 | ||||||
Jimmy Johns Funding LLC, | ||||||||
Series 2017-1A, Class A2I, Pass Through Ctfs., 3.61%, | 7,709,595 | 7,811,909 | ||||||
Series 2017-1A, Class A2II, Pass Through Ctfs., 4.85%, | 9,300,000 | 9,523,076 | ||||||
| Principal Amount | Value | |||||||
JP Morgan Chase Commercial Mortgage Securities Trust, | ||||||||
Series 2007-CB19, Class AM, Variable Rate Pass Through Ctfs., 5.99%, 02/12/2049(h) | $ | 60,575 | $ | 60,864 | ||||
Series 2011-C5, Class D, Variable Rate Pass Through Ctfs., 5.59%, 08/15/2046(b)(h) | 452,400 | 463,511 | ||||||
Series 2012-CBX, Class E, Variable Rate Pass Through Ctfs., 5.39%, 06/15/2045(b)(h) | 613,211 | 624,628 | ||||||
Series 2012-LC9, Class B, Variable Rate Pass Through Ctfs., 3.81%, 12/15/2047(b)(h) | 5,000,000 | 5,210,545 | ||||||
Series 2013-LC11, Class C, Variable Rate Pass Through Ctfs., 3.96%, 04/15/2046(h) | 2,864,000 | 2,892,571 | ||||||
JP Morgan Mortgage Trust, | ||||||||
Series 2005-A3, Class 1A1, Variable Rate Pass Through Ctfs., 3.15%, 06/25/2035(h) | 1,074,013 | 1,062,844 | ||||||
Series 2005-A3, Class 6A5, Variable Rate Pass Through Ctfs., 3.54%, 06/25/2035(h) | 1,189,619 | 1,173,903 | ||||||
Series 2005-A5, Class 1A2, Variable Rate Pass Through Ctfs., 3.59%, 08/25/2035(h) | 1,518,926 | 1,518,739 | ||||||
Series 2005-A6, Class 7A1, Variable Rate Pass Through Ctfs., 3.59%, 08/25/2035(h) | 943,259 | 917,055 | ||||||
Series 2007-A4, Class 3A1, Variable Rate Pass Through Ctfs., 3.48%, 06/25/2037(h) | 1,439,382 | 1,297,851 | ||||||
Series 2015-3, Class B2, Variable Rate Pass Through Ctfs., 3.69%, 05/25/2045(b)(h) | 9,451,171 | 9,358,085 | ||||||
JPMBB Commercial Mortgage Securities Trust, | ||||||||
Series 2013-C17, Class C, Variable Rate Pass Through Ctfs., 5.05%, 01/15/2047(h) | 12,750,000 | 13,188,529 | ||||||
Series 2015-C31, Class A3, Pass Through Ctfs., 3.80%, 08/15/2048 | 1,064,445 | 1,142,156 | ||||||
Series 2016-C1, Class B, Variable Rate Pass Through Ctfs., 4.90%, 03/15/2049(h) | 5,083,000 | 5,582,597 | ||||||
Katonah Ltd., Series 2007-IA, Class A2L, Floating Rate Pass Through Ctfs., 2.81% (3 mo. USD LIBOR + 1.50%), 04/23/2022(b)(i) | 2,630,000 | 2,640,771 | ||||||
Lehman Mortgage Trust, Series 2006-1, Class 3A5, Pass Through Ctfs., 5.50%, 02/25/2036 | 343,445 | 352,753 | ||||||
See accompanying Notes to Financial Statements which are an integral part of the financial statements.
30 Invesco Core Plus Bond Fund
| Principal Amount | Value | |||||||
LSTAR Commercial Mortgage Trust, Series 2014-2, Class A2, Pass Through Ctfs., 2.77%, | $ | 573,646 | $ | 574,381 | ||||
Luminent Mortgage Trust, Series 2005-1, Class A1, Floating Rate Pass Through Ctfs., 1.49% (1 mo. USD LIBOR + 0.26%), 11/25/2035(i) | 1,125,782 | 1,061,100 | ||||||
MAD Mortgage Trust, Series 2017-330M, Class A, Variable Rate Pass Through Ctfs., 3.29%, 08/15/2034(b)(h) | 11,633,000 | 11,965,241 | ||||||
Merrill Lynch Mortgage Investors Trust, | ||||||||
Series 2005-3, Class 3A, Variable Rate Pass Through Ctfs., 3.20%, 11/25/2035(h) | 1,526,585 | 1,538,082 | ||||||
Series 2005-A5, Class A9, Variable Rate Pass Through Ctfs., 3.12%, 06/25/2035(h) | 2,063,686 | 2,043,074 | ||||||
Morgan Stanley Capital I Trust, | ||||||||
Series 2006-HQ10, Class AJ, Variable Rate Pass Through Ctfs., 5.39%, 11/12/2041(h) | 2,171,622 | 2,175,691 | ||||||
Series 2014-150E, Class C, Variable Rate Pass Through Ctfs., 4.44%, 09/09/2032(b)(h) | 3,350,000 | 3,600,876 | ||||||
Series 2015-XLF2, Class AFSA, Floating Rate Pass Through Ctfs., 3.10% (1 mo. USD LIBOR + 1.87%), 08/15/2026(b)(i) | 400,682 | 401,426 | ||||||
Northwoods Capital XI Ltd. (Cayman Islands), Series 2014-11A, Class AR, Floating Rate Pass Through Ctfs., 2.49% (3 mo. USD LIBOR + 1.19%), 04/15/2025(b)(i) | 18,793,000 | 18,826,341 | ||||||
Northwoods Capital XII Ltd. (Cayman Islands), Series 2014-12A, Class AR, Floating Rate Pass Through Ctfs., 2.36% (3 mo. USD LIBOR + 1.23%), 09/15/2025(b)(i) | 4,250,000 | 4,260,898 | ||||||
OCP CLO Ltd. (Cayman Islands), Series 2012-2A, Class A1R, Floating Rate Pass Through Ctfs., 2.71% (3 mo. USD LIBOR + 1.40%), 11/22/2025(b)(i) | 4,901,622 | 4,950,425 | ||||||
Provident Home Equity Loan Trust, Series 2000-2, Class A1, Floating Rate Pass Through Ctfs., 1.77% (1 mo. USD LIBOR + 0.54%), 08/25/2031(i) | 199,232 | 163,645 | ||||||
| Principal Amount | Value | |||||||
RBSSP Resecuritization Trust, Series 2009-12, Class 17A1, Variable Rate Pass Through Ctfs., 3.00%, 10/25/2035(b)(h) | $ | 2,591,667 | $ | 2,623,665 | ||||
Regatta V Funding Ltd. (Cayman Islands), Series 2014-1A, Class A1AR, Floating Rate Pass Through Ctfs., 2.47% (3 mo. USD LIBOR + 1.16%), 10/25/2026(b)(i) | 5,200,000 | 5,202,525 | ||||||
Residential Funding Mortgage Sec I Trust, Series 2005-S9, Class A10, Pass Through Ctfs., 6.25%, 12/25/2035 | 1,316,951 | 1,283,820 | ||||||
Sequoia Mortgage Trust, | ||||||||
Series 2013-3, Class A1, Variable Rate Pass Through Ctfs., 2.00%, 03/25/2043(h) | 1,791,370 | 1,716,581 | ||||||
Series 2013-4, Class A3, Variable Rate Pass Through Ctfs., 1.55%, 04/25/2043(h) | 1,503,318 | 1,471,930 | ||||||
Series 2013-7, Class A2, Variable Rate Pass Through Ctfs., 3.00%, 06/25/2043(h) | 1,493,195 | 1,509,993 | ||||||
Shellpoint Asset Funding Trust, Series 2013-1, Class A3, Variable Rate Pass Through Ctfs., 3.75%, 07/25/2043(b)(h) | 2,482,313 | 2,537,973 | ||||||
Specialty Underwriting & Residential Finance Trust, Series 2004-BC2, Class A2, Floating Rate Pass Through Ctfs., 1.77% (1 mo. USD LIBOR + 0.54%), 05/25/2035(i) | 41,645 | 39,249 | ||||||
Stoney Lane Funding I Corp., Series 2007-1A, Class A2, Floating Rate Pass Through Ctfs., 1.68% (3 mo. USD LIBOR + 0.38%), | 2,013,000 | 2,005,951 | ||||||
Structured Adjustable Rate Mortgage Loan Trust, | ||||||||
Series 2004-8, Class 3A, Variable Rate Pass Through Ctfs., 3.43%, 07/25/2034(h) | 2,138,891 | 2,139,730 | ||||||
Series 2004-12, Class 3A2, Variable Rate Pass Through Ctfs., 3.40%, 09/25/2034(h) | 1,680,625 | 1,666,492 | ||||||
Suntrust Alternative Loan Trust, Series 2005-1F, Class 2A8, Pass Through Ctfs., 6.00%, 12/25/2035 | 328,349 | 324,484 | ||||||
Symphony CLO II Ltd. (Cayman Islands), | ||||||||
Series 2006-2A, Class A2B, Floating Rate Pass Through Ctfs., 1.65% (3 mo. USD LIBOR + 0.33%), 10/25/2020(b)(i) | 1,676,160 | 1,678,189 | ||||||
Series 2006-2A, Class A3, Floating Rate Pass Through Ctfs., 1.74% (3 mo. USD LIBOR + 0.42%), 10/25/2020(b)(i) | 2,882,000 | 2,883,854 | ||||||
See accompanying Notes to Financial Statements which are an integral part of the financial statements.
31 Invesco Core Plus Bond Fund
| Principal Amount | Value | |||||||
Thornburg Mortgage Securities Trust, | ||||||||
Series 2003-6, Class A2, Floating Rate Pass Through Ctfs., 2.23% (1 mo. USD LIBOR + 1.00%), 12/25/2033 (i) | $ | 1,045,311 | $ | 962,010 | ||||
Series 2005-1, Class A3, Variable Rate Pass Through Ctfs., 3.06%, 04/25/2045(h) | 2,097,250 | 2,107,658 | ||||||
Series 2005-2, Class A1, Variable Rate Pass Through Ctfs., 3.06%, 07/25/2045(h) | 2,418,406 | 2,356,291 | ||||||
Towd Point Mortgage Trust, Series 2017-2, Class A1, Variable Rate Pass Through Ctfs., 2.75%, 04/25/2057(b)(h) | 7,455,829 | 7,549,329 | ||||||
UBS-Barclays Commercial Mortgage Trust, | ||||||||
Series 2012-C3, Class A4, Pass Through Ctfs., 3.09%, 08/10/2049 | 264,769 | 274,314 | ||||||
Series 2012-C4, Class A5, Pass Through Ctfs., 2.85%, 12/10/2045 | 532,433 | 544,193 | ||||||
UBS-Citigroup Commercial Mortgage Trust, Series 2011-C1, Class C, Variable Rate Pass Through Ctfs., 6.25%, 01/10/2045(b)(h) | 4,500,000 | 5,048,077 | ||||||
Wachovia Bank Commercial Mortgage Trust, Series 2006-C27, Class AJ, Variable Rate Pass Through Ctfs., 5.83%, 07/15/2045(h) | 2,031,540 | 2,052,397 | ||||||
WaMu Mortgage Pass Through Trust, | ||||||||
Series 2003-AR8, Class A, Variable Rate Pass Through Ctfs., 3.21%, 08/25/2033(h) | 813,208 | 823,653 | ||||||
Series 2005-AR10, Class 1A3, Variable Rate Pass Through Ctfs., 3.26%, 09/25/2035(h) | 343,463 | 352,705 | ||||||
Series 2005-AR12, Class 1A8, Variable Rate Pass Through Ctfs., 2.86%, 10/25/2035(h) | 1,356,737 | 1,366,687 | ||||||
Series 2007-HY2, Class 2A2, Variable Rate Pass Through Ctfs., 3.29%, 11/25/2036(h) | 935,075 | 883,978 | ||||||
Wells Fargo Commercial Mortgage Trust, Series 2014-TISH, Class B, Floating Rate Pass Through Ctfs., 2.58% (1 mo. USD LIBOR + 1.35%), 02/15/2027(b)(i) | 9,500,000 | 9,537,280 | ||||||
| Principal Amount | Value | |||||||
Wells Fargo Mortgage Backed Securities Trust, | ||||||||
Series 2003-J, Class 2A1, Variable Rate Pass Through Ctfs., 2.98%, 10/25/2033(h) | $ | 748,154 | $ | 760,120 | ||||
Series 2004-K, Class 1A2, Variable Rate Pass Through Ctfs., 3.48%, 07/25/2034(h) | 516,587 | 520,166 | ||||||
Series 2004-Z, Class 2A1, Variable Rate Pass Through Ctfs., 3.00%, 12/25/2034(h) | 604,697 | 617,041 | ||||||
Series 2005-AR2, Class 2A2, Variable Rate Pass Through Ctfs., 3.17%, 03/25/2035(h) | 1,396,099 | 1,413,244 | ||||||
Series 2005-AR14, Class A1, Variable Rate Pass Through Ctfs., 3.48%, 08/25/2035(h) | 707,633 | 718,032 | ||||||
Series 2005-AR16, Class 4A8, Variable Rate Pass Through Ctfs., 3.37%, 10/25/2035(h) | 4,620,000 | 4,725,432 | ||||||
Series 2006-AR8, Class 1A3, Variable Rate Pass Through Ctfs., 3.25%, 04/25/2036(h) | 1,222,358 | 1,214,764 | ||||||
Series 2007-7, Class A1, Pass Through Ctfs., 6.00%, 06/25/2037 | 799,791 | 806,425 | ||||||
WFRBS Commercial Mortgage Trust, | ||||||||
Series 2011-C5, Class B, Variable Rate Pass Through Ctfs., 5.86%, 11/15/2044(b)(h) | 5,000,000 | 5,576,135 | ||||||
Series 2012-C6, Class B, Pass Through Ctfs., 4.70%, 04/15/2045 | 5,739,000 | 6,188,590 | ||||||
Series 2012-C9, Class D, Variable Rate Pass Through Ctfs., 4.96%, 11/15/2045(b)(h) | 568,832 | 557,362 | ||||||
Series 2013-C14, Class A5, Pass Through Ctfs., 3.34%, 06/15/2046 | 1,485,143 | 1,556,027 | ||||||
Series 2013-C15, Class B, Variable Rate Pass Through Ctfs., 4.63%, 08/15/2046(h) | 3,800,000 | 4,087,498 | ||||||
Series 2013-C16, Class B, Variable Rate Pass Through Ctfs., 5.15%, 09/15/2046(h) | 3,127,000 | 3,446,930 | ||||||
Series 2014-C20, Class A2, Pass Through Ctfs., 3.04%, 05/15/2047 | 1,018,550 | 1,037,375 | ||||||
Total Asset-Backed Securities |
| 470,495,915 | ||||||
U.S. Government Sponsored Agency Mortgage-Backed Securities–14.41% |
| |||||||
| Collateralized Mortgage Obligations–0.32% | ||||||||
Fannie Mae REMICs, IO, | ||||||||
7.00%, 05/25/2033 | 12,500 | 3,151 | ||||||
6.00%, 07/25/2033 | 8,585 | 1,636 | ||||||
See accompanying Notes to Financial Statements which are an integral part of the financial statements.
32 Invesco Core Plus Bond Fund
| Principal Amount | Value | |||||||
| Collateralized Mortgage Obligations–(continued) | ||||||||
Freddie Mac Multifamily Securitization, Series K038, Class XI, Variable Rate Pass Through Ctfs., 1.33%, 03/25/2024(h) | $ | 25,491,330 | $ | 1,609,176 | ||||
Freddie Mac Whole Loan Securities Trust, Series 2017-SC02, Class 2A1, Pass Through Ctfs., 3.50%, 05/25/2047 | 7,857,949 | 8,003,522 | ||||||
Ginnie Mae REMICs, IO, 1.56%, 09/20/2064(h) | 11,336,487 | 964,736 | ||||||
| 10,582,221 | ||||||||
| Federal Home Loan Mortgage Corp. (FHLMC)–5.23% | ||||||||
Pass Through Ctfs., | ||||||||
6.00%, 07/01/2019 to 02/01/2034 | 353,485 | 393,221 | ||||||
7.00%, 07/01/2019 to 10/01/2034 | 1,625,807 | 1,864,129 | ||||||
3.50%, 08/01/2026 | 945,808 | 995,134 | ||||||
7.50%, 05/01/2030 to 05/01/2035 | 889,512 | 1,038,917 | ||||||
8.50%, 08/01/2031 | 52,066 | 63,446 | ||||||
3.00%, 02/01/2032 | 2,922,694 | 3,024,673 | ||||||
6.50%, 07/01/2032 to 09/01/2036 | 371,252 | 413,393 | ||||||
8.00%, 08/01/2032 | 45,353 | 53,904 | ||||||
5.50%, 01/01/2034 to 07/01/2040 | 2,901,934 | 3,207,723 | ||||||
5.00%, 07/01/2034 to 06/01/2040 | 3,413,214 | 3,753,510 | ||||||
4.50%, 02/01/2040 to 10/01/2046 | 37,243,061 | 40,589,459 | ||||||
Pass Through Ctfs., ARM, | ||||||||
3.54% (1 yr. USD LIBOR + 1.95%), 12/01/2036(i) | 108,076 | 114,735 | ||||||
3.71% (1 yr. USD LIBOR + 2.05%), 02/01/2037(i) | 28,465 | 30,286 | ||||||
3.69% (1 yr. USD LIBOR + 1.88%), 05/01/2037(i) | 262,971 | 277,868 | ||||||
Pass Through Ctfs., TBA, | ||||||||
4.00%, 10/01/2017(j) | 34,000,000 | 35,876,644 | ||||||
3.50%, 10/01/2047(j) | 80,850,000 | 83,648,170 | ||||||
| 175,345,212 | ||||||||
| Federal National Mortgage Association (FNMA)–5.97% | ||||||||
Pass Through Ctfs., | ||||||||
5.00%, 03/01/2018 to 12/01/2039 | 884,937 | 967,400 | ||||||
5.50%, 11/01/2018 to 06/01/2040 | 1,815,024 | 2,031,820 | ||||||
7.50%, 03/01/2021 to 08/01/2037 | 854,124 | 1,009,512 | ||||||
8.00%, 08/01/2021 to 04/01/2033 | 88,510 | 108,272 | ||||||
6.00%, 03/01/2022 to 10/01/2039 | 54,470 | 59,162 | ||||||
6.50%, 07/01/2028 to 01/01/2037 | 181,666 | 204,173 | ||||||
| Principal Amount | Value | |||||||
| Federal National Mortgage Association (FNMA)–(continued) | ||||||||
7.00%, 07/01/2029 to 02/01/2034 | $ | 556,724 | $ | 624,326 | ||||
9.50%, 04/01/2030 | 15,361 | 17,993 | ||||||
3.50%, 12/01/2030 to 11/01/2046 | 42,142,228 | 43,981,613 | ||||||
8.50%, 10/01/2032 | 83,057 | 103,819 | ||||||
3.00%, 08/01/2043 | 4,659,608 | 4,740,513 | ||||||
Pass Through Ctfs., ARM, | ||||||||
3.04% (1 yr. U.S. Treasury Yield Curve Rate + 2.20%), 05/01/2035(i) | 325,180 | 342,435 | ||||||
3.29% (1 yr. USD LIBOR + 1.66%), 01/01/2037(i) | 174,753 | 182,719 | ||||||
3.42% (1 yr. USD LIBOR + 1.74%), 03/01/2038(i) | 105,530 | 111,027 | ||||||
Pass Through Ctfs., TBA, | ||||||||
2.50%, 10/01/2032(j) | 40,620,000 | 41,130,922 | ||||||
3.00%, 10/01/2032 to 10/01/2047(j) | 38,660,000 | 39,769,370 | ||||||
3.50%, 10/01/2047(j) | 18,500,000 | 19,137,011 | ||||||
4.00%, 10/01/2047(j) | 43,000,000 | 45,363,319 | ||||||
| 199,885,406 | ||||||||
| Government National Mortgage Association (GNMA)–2.89% | ||||||||
Pass Through Ctfs., | ||||||||
7.50%, 06/15/2023 to 05/15/2032 | 19,302 | 20,556 | ||||||
9.00%, 09/15/2024 to 10/15/2024 | 13,645 | 13,698 | ||||||
8.50%, 02/15/2025 | 5,681 | 5,701 | ||||||
8.00%, 08/15/2025 to 09/15/2026 | 35,989 | 37,691 | ||||||
6.56%, 01/15/2027 | 132,876 | 146,239 | ||||||
7.00%, 10/15/2028 to 09/15/2032 | 312,541 | 352,239 | ||||||
6.00%, 11/15/2028 to 02/15/2033 | 78,194 | 89,119 | ||||||
6.50%, 01/15/2029 to 09/15/2034 | 195,936 | 217,373 | ||||||
5.50%, 06/15/2035 | 89,888 | 100,585 | ||||||
5.00%, 07/15/2035 to 08/15/2035 | 59,530 | 64,987 | ||||||
Pass Through Ctfs., ARM, | ||||||||
2.38% (1 yr. U.S. Treasury Yield Curve Rate + 1.50%), 01/20/2025 (i) | 38,073 | 39,189 | ||||||
2.63% (1 yr. U.S. Treasury Yield Curve Rate + 1.50%), 05/20/2025 (i) | 11,298 | 11,637 | ||||||
3.00% (1 yr. U.S. Treasury Yield Curve Rate + 1.50%), 06/20/2025 (i) | 7,098 | 7,277 | ||||||
Pass Through Ctfs., TBA, | ||||||||
3.00%, 10/01/2047(j) | 59,000,000 | 60,135,060 | ||||||
4.00%, 10/01/2047(j) | 33,930,000 | 35,713,975 | ||||||
| 96,955,326 | ||||||||
Total U.S. Government Sponsored Agency Mortgage-Backed Securities (Cost $481,912,342) |
| 482,768,165 | ||||||
See accompanying Notes to Financial Statements which are an integral part of the financial statements.
33 Invesco Core Plus Bond Fund
| Principal Amount | Value | |||||||
U.S. Treasury Securities–13.65% |
| |||||||
| U.S. Treasury Bills–0.27%(k)(l) | ||||||||
1.04%, 02/01/2018 | $ | 55,000 | $ | 54,757 | ||||
1.10%, 02/01/2018 | 9,030,000 | 8,990,135 | ||||||
1.11%, 02/01/2018 | 15,000 | 14,934 | ||||||
| 9,059,826 | ||||||||
| U.S. Treasury Notes–9.01% | ||||||||
1.50%, 08/15/2020 | 79,269,100 | 79,428,566 | ||||||
1.88%, 07/31/2022 | 144,105,800 | 145,197,848 | ||||||
1.63%, 08/31/2022 | 5,000,000 | 4,980,566 | ||||||
2.13%, 07/31/2024 | 26,297,300 | 26,610,093 | ||||||
2.25%, 08/15/2027 | 45,292,200 | 45,813,237 | ||||||
| 302,030,310 | ||||||||
| U.S. Treasury Inflation — Indexed Notes–1.60%(m) | ||||||||
0.13%, 04/15/2021 | 53,225,250 | 53,491,898 | ||||||
| U.S. Treasury Bonds–2.77% | ||||||||
3.00%, 05/15/2047 | 88,041,400 | 92,966,216 | ||||||
Total U.S. Treasury Securities |
| 457,548,250 | ||||||
| Shares | ||||||||
Preferred Stocks–0.64% |
| |||||||
| Investment Banking & Brokerage–0.58% | ||||||||
Goldman Sachs Group, Inc. (The), Series J, 5.50% Pfd. | 446,324 | 12,019,505 | ||||||
Morgan Stanley, Series F, 6.88% Pfd. | 249,737 | 7,264,850 | ||||||
| 19,284,355 | ||||||||
| Regional Banks–0.06% | ||||||||
CIT Group Inc., Series A, 5.80% Pfd. | 45,000 | 46,969 | ||||||
PNC Financial Services Group, Inc. (The), Series P, 6.13% Pfd. | 27,000 | 771,120 | ||||||
SunTrust Banks, Inc., Series G, 5.05% Pfd. | 1,187,000 | 1,207,772 | ||||||
| 2,025,861 | ||||||||
Total Preferred Stocks |
| 21,310,216 | ||||||
| Principal Amount | ||||||||
Municipal Obligations–0.04% |
| |||||||
Georgia (State of) Municipal Electric Authority (Plant Vogtle Units 3 & 4 Project J); Series 2010 A, Taxable Build America RB, 6.64%, 04/01/2057 | $ | 500,000 | 644,375 | |||||
Georgia (State of) Municipal Electric Authority (Plant Vogtle Units 3 & 4 Project M); Series 2010 A, Taxable Build America RB, 6.66%, 04/01/2057 | 550,000 | 695,453 | ||||||
Total Municipal Obligations |
| 1,339,828 | ||||||
| Principal Amount | Value | |||||||
Non-U.S. Dollar Denominated Bonds & |
| |||||||
| Health Care Services–0.00% | ||||||||
Synlab Unsecured Bondco PLC (United Kingdom), REGS, Sr. Unsec. Gtd. Euro Bonds, 8.25%, 07/01/2023(b) | EUR | 150,000 | $ | 199,015 | ||||
| Sovereign Debt–0.01% | ||||||||
Indonesia Government International Bond (Indonesia), Sr. Unsec. Notes, 2.15%, | EUR | 100,000 | 121,770 | |||||
Ivory Coast Government International Bond (Ivory Coast), Sr. Unsec. Bonds, 5.13%, 06/15/2025(b) | EUR | 100,000 | 123,744 | |||||
| 245,514 | ||||||||
Total Non-U.S. Dollar Denominated Bonds & Notes |
| 444,529 | ||||||
| Shares | ||||||||
Common Stocks & Other Equity Interests–0.00% |
| |||||||
| Auto Parts & Equipment–0.00% | ||||||||
Exide Technologies(e)(o) | 14,555 | 5,822 | ||||||
| Other Diversified Financial Services–0.00% | ||||||||
iPayment Holdings, Inc.–Wts., expiring 12/29/2022(e)(o) | 172,245 | 129,184 | ||||||
Total Common Stocks & Other Equity Interests |
| 135,006 | ||||||
Money Market Funds–17.17% |
| |||||||
Government & Agency Portfolio–Institutional Class, 0.93%(p) | 345,188,710 | 345,188,710 | ||||||
Treasury Portfolio–Institutional Class, 0.90%(p) | 230,122,802 | 230,122,802 | ||||||
Total Money Market Funds |
| 575,311,512 | ||||||
Options Purchased–0.19% |
| |||||||
(Cost $7,815,280)(q) | 6,517,396 | |||||||
TOTAL INVESTMENTS IN SECURITIES–109.64% |
| 3,674,239,573 | ||||||
OTHER ASSETS LESS LIABILITIES–(9.64)% |
| (322,982,684 | ) | |||||
NET ASSETS–100.00% |
| $ | 3,351,256,889 | |||||
See accompanying Notes to Financial Statements which are an integral part of the financial statements.
34 Invesco Core Plus Bond Fund
Investment Abbreviations:
| ARM | – Adjustable Rate Mortgage | |
| CLO | – Collateralized Loan Obligation | |
| Ctfs. | – Certificates | |
| Deb. | – Debentures | |
| EUR | – Euro | |
| Gtd. | – Guaranteed | |
| IO | – Interest Only | |
| Jr. | – Junior | |
| LIBOR | – London Interbank Offered Rate | |
| Pfd. | – Preferred | |
| PIK | – Payment in Kind |
| RB | – Revenue Bonds | |
| REGS | – Regulation S | |
| REIT | – Real Estate Investment Trust | |
| REMICs | – Real Estate Mortgage Investment Conduits | |
| Sec. | – Secured | |
| Sr. | – Senior | |
| Sub. | – Subordinated | |
| TBA | – To Be Announced | |
| Unsec. | – Unsecured | |
| USD | – U.S. Dollar | |
| Wts. | – Warrants |
| Notes | to Schedule of Investments: |
| (a) | Industry and/or sector classifications used in this report are generally according to the Global Industry Classification Standard, which was developed by and is the exclusive property and a service mark of MSCI Inc. and Standard & Poor’s. |
| (b) | Security purchased or received in a transaction exempt from registration under the Securities Act of 1933, as amended (the “1933 Act”). The security may be resold pursuant to an exemption from registration under the 1933 Act, typically to qualified institutional buyers. The aggregate value of these securities at August 31, 2017 was $853,939,282, which represented 25.48% of the Fund’s Net Assets. |
| (c) | Perpetual bond with no specified maturity date. |
| (d) | All or a portion of this security is Pay-in-Kind. Pay-in-Kind securities pay interest income in the form of securities. |
| (e) | Security valued using significant unobservable inputs (Level 3). See Note 3. |
| (f) | Defaulted security. Currently, the issuer is partially or fully in default with respect to interest payments. The value of this security at August 31, 2017 represented less than 1% of the Fund’s Net Assets. |
| (g) | Zero coupon bond issued at a discount. |
| (h) | Interest rate is redetermined periodically based on the cash flows generated by the pool of assets backing the security, less any applicable fees. The rate shown is the rate in effect August 31, 2017. |
| (i) | Interest or dividend rate is redetermined periodically. Rate shown is the rate in effect on August 31, 2017. |
| (j) | Security purchased on a forward commitment basis. This security is subject to dollar roll transactions. See Note 1M. |
| (k) | Securities are traded on a discount basis. The interest rate shown represents the discount rate at the time of purchase by the Fund. |
| (l) | All or a portion of the value was pledged and/or designated as collateral to cover margin requirements for open futures contracts and swap agreements. See Note 1L and Note 1P. |
| (m) | Principal amount of security and interest payments are adjusted for inflation. See Note 1I. |
| (n) | Foreign denominated security. Principal amount is denominated in the currency indicated. |
| (o) | Non-income producing security. |
| (p) | The money market fund and the Fund are affiliated by having the same investment adviser. The rate shown is the 7-day SEC standardized yield as of August 31, 2017. |
| (q) | The table below details options purchased. See Note 1N and Note 1O: |
| Open Over-The-Counter Foreign Currency Options Purchased | ||||||||||||||||||||||||||||||
| Description | Type of Contract | Counterparty | Expiration Date | Exercise Price | Notional Value | Value | ||||||||||||||||||||||||
CHF versus EUR | Call | Deutsche Bank Securities Inc. | 04/26/2018 | CHF | 1.15 | EUR | 55,000,000 | $ | 1,193,379 | |||||||||||||||||||||
CHF versus GBP | Call | Goldman Sachs International | 01/25/2018 | CHF | 1.2765 | GBP | 49,000,000 | 594,866 | ||||||||||||||||||||||
CHF versus USD | Call | Goldman Sachs International | 09/01/2017 | CHF | 0.9788 | USD | 93,300,000 | 48 | ||||||||||||||||||||||
USD versus EUR | Call | Morgan Stanley & Co. International PLC | 12/01/2017 | USD | 1.2115 | EUR | 154,500,000 | 1,958,165 | ||||||||||||||||||||||
Subtotal — Call | 3,746,458 | |||||||||||||||||||||||||||||
EUR versus NOK | Put | Bank of America Merrill Lynch | 10/13/2017 | NOK | 9.35 | EUR | 85,000,000 | 1,589,304 | ||||||||||||||||||||||
USD versus MXN | Put | Morgan Stanley & Co. International PLC | 08/13/2018 | MXN | 17.46 | USD | 64,000,000 | 1,059,256 | ||||||||||||||||||||||
Subtotal — Put |
| 2,648,560 | ||||||||||||||||||||||||||||
Subtotal Foreign Currency Options Purchased — Currency Risk |
| $ | 6,395,018 | |||||||||||||||||||||||||||
| Open Over-The-Counter Interest Rate Swaptions Purchased | ||||||||||||||||||||||||||||||||||||
| Description | Type of Contract | Counterparty | Exercise Rate | Payment Frequency | Pay/ Receive Exercise Rate | Floating Rate Index | Payment Frequency | Expiration Date | Notional Value | Value | ||||||||||||||||||||||||||
10 Year Interest Rate Swap | Put | Barclays Bank PLC | 0.50 | % | Semi-Annually | Pay | 6 Month JPY LIBOR | Semi-Annually | 02/09/2018 | JPY | 15,612,000,000 | $ | 122,378 | |||||||||||||||||||||||
Subtotal Interest Rate Swaptions Purchased — Interest Rate Risk | $ | 122,378 | ||||||||||||||||||||||||||||||||||
Total Options Purchased (Cost $7,815,280) | $ | 6,517,396 | ||||||||||||||||||||||||||||||||||
See accompanying Notes to Financial Statements which are an integral part of the financial statements.
35 Invesco Core Plus Bond Fund
| Open Over-The-Counter Foreign Currency Options Written | ||||||||||||||||||||||||||||||||||
| Description | Type of Contract | Counterparty | Expiration Date | Excercise Price | Premiums Received | Notional Value | Value | Unrealized Appreciation | ||||||||||||||||||||||||||
USD versus EUR | Call | Morgan Stanley & Co. International PLC | 12/01/2017 | USD 1.2475 | $ | 1,086,229 | EUR | 154,500,000 | $ | (692,860 | ) | $ | 393,369 | |||||||||||||||||||||
MXN versus USD | Call | Morgan Stanley & Co. International PLC | 08/13/2018 | MXN 22.17 | 1,156,928 | USD | 64,000,000 | (916,414 | ) | 240,514 | ||||||||||||||||||||||||
Total Foreign Currency Options Written — Currency Risk |
| $ | 2,243,157 | $ | (1,609,274 | ) | $ | 633,883 | ||||||||||||||||||||||||||
| Open Futures Contracts | ||||||||||||||||||||
| Long Futures Contracts | Number of Contracts | Expiration Month | Notional Value | Value | Unrealized Appreciation | |||||||||||||||
U.S. Treasury 2 Year Notes | 218 | December-2017 | $ | 47,156,125 | $ | 16,564 | $ | 16,564 | ||||||||||||
U.S. Treasury 5 Year Notes | 1,772 | December-2017 | 209,982,000 | 345,732 | 345,732 | |||||||||||||||
U.S. Treasury 10 Year Notes | 1,446 | December-2017 | 183,619,406 | 500,475 | 500,475 | |||||||||||||||
U.S. Treasury Ultra Bonds | 25 | December-2017 | 4,226,563 | 24,945 | 24,945 | |||||||||||||||
Subtotal — Long Futures Contracts | 887,716 | 887,716 | ||||||||||||||||||
| Short Futures Contracts | ||||||||||||||||||||
U.S. Treasury 10 Year Ultra Bonds | 1,565 | December-2017 | (213,671,406 | ) | 179,674 | 179,674 | ||||||||||||||
U.S. Treasury Long Bonds | 291 | December-2017 | (45,423,281 | ) | 188,003 | 188,003 | ||||||||||||||
Subtotal — Short Futures Contracts | 367,677 | 367,677 | ||||||||||||||||||
Total Futures Contracts — Interest Rate Risk |
| $ | 1,255,393 | $ | 1,255,393 | |||||||||||||||
| Open Forward Foreign Currency Contracts | ||||||||||||||||||||||
| Settlement Date | Counterparty | Contract to | Unrealized Appreciation (Depreciation) | |||||||||||||||||||
| Deliver | Receive | |||||||||||||||||||||
| 09/21/2017 | CIBC World Markets Corp. | USD | 33,038,308 | CAD | 42,317,117 | $ | 857,261 | |||||||||||||||
| 09/21/2017 | Morgan Stanley & Co. International PLC | USD | 31,858,313 | CAD | 41,181,037 | 1,127,268 | ||||||||||||||||
| 10/03/2017 | JPMorgan Chase Bank, N.A. | EUR | 27,000,000 | NOK | 259,775,100 | 1,309,072 | ||||||||||||||||
| 11/06/2017 | Barclays Bank PLC | USD | 44,661,470 | EUR | 41,500,000 | 4,926,036 | ||||||||||||||||
| 11/06/2017 | Goldman Sachs International | USD | 59,565,482 | EUR | 51,395,581 | 1,846,053 | ||||||||||||||||
| 11/06/2017 | TD Bank, N.A. | USD | 40,120,515 | EUR | 36,450,000 | 3,432,849 | ||||||||||||||||
| 11/30/2017 | Barclays Bank PLC | NZD | 44,068,455 | USD | 32,000,000 | 411,398 | ||||||||||||||||
| 11/30/2017 | Barclays Bank PLC | USD | 32,331,124 | CAD | 40,562,240 | 177,220 | ||||||||||||||||
| 11/30/2017 | Citigroup Global Markets Inc. | USD | 32,000,000 | CLP | 20,872,000,000 | 1,201,231 | ||||||||||||||||
| 11/30/2017 | Deutsche Bank Securities Inc. | USD | 29,548,075 | EUR | 25,000,000 | 360,571 | ||||||||||||||||
| 11/30/2017 | Morgan Stanley & Co. International PLC | USD | 66,000,000 | NOK | 521,918,678 | 1,405,902 | ||||||||||||||||
| 01/29/2018 | Goldman Sachs International | GBP | 21,070,000 | CHF | 26,623,841 | 665,215 | ||||||||||||||||
| 04/30/2018 | Deutsche Bank Securities Inc. | EUR | 25,850,000 | CHF | 29,646,073 | 233,345 | ||||||||||||||||
| 04/30/2018 | Deutsche Bank Securities Inc. | USD | 31,092,923 | EUR | 25,850,000 | 109,977 | ||||||||||||||||
Subtotal | 18,063,398 | |||||||||||||||||||||
| 09/21/2017 | CIBC World Markets Corp. | CAD | 25,357,020 | USD | 19,500,000 | (810,710 | ) | |||||||||||||||
| 09/21/2017 | Goldman Sachs International | CAD | 42,317,117 | USD | 32,800,000 | (1,095,569 | ) | |||||||||||||||
| 09/21/2017 | Morgan Stanley &Co. International PLC | CAD | 15,824,017 | USD | 12,000,000 | (674,873 | ) | |||||||||||||||
| 10/03/2017 | Goldman Sachs International | EUR | 453,011 | USD | 531,294 | (9,000 | ) | |||||||||||||||
| 10/03/2017 | JPMorgan Chase Bank, N.A. | NOK | 259,775,100 | SEK | 261,343,882 | (555,267 | ) | |||||||||||||||
| 10/03/2017 | JPMorgan Chase Bank, N.A. | SEK | 261,343,882 | EUR | 27,453,011 | (213,511 | ) | |||||||||||||||
| 11/06/2017 | Barclays Bank PLC | EUR | 36,450,000 | USD | 39,740,013 | (3,813,351 | ) | |||||||||||||||
| 11/06/2017 | BNP Paribas S.A. | EUR | 41,500,000 | USD | 45,514,710 | (4,072,796 | ) | |||||||||||||||
| 11/06/2017 | Deutsche Bank Securities Inc. | EUR | 42,000,000 | USD | 48,350,400 | (1,834,546 | ) | |||||||||||||||
| 11/06/2017 | TD Bank, N.A. | EUR | 9,395,581 | USD | 10,920,456 | (306,133 | ) | |||||||||||||||
| 11/30/2017 | CIBC World Markets Corp. | CAD | 40,562,240 | USD | 32,000,000 | (508,344 | ) | |||||||||||||||
| 11/30/2017 | Citigroup Global Markets Inc. | GBP | 68,227 | USD | 87,524 | (966 | ) | |||||||||||||||
| 11/30/2017 | Citigroup Global Markets Inc. | KRW | 29,017,300,000 | USD | 25,671,075 | (158,941 | ) | |||||||||||||||
See accompanying Notes to Financial Statements which are an integral part of the financial statements.
36 Invesco Core Plus Bond Fund
| Open Forward Foreign Currency Contracts — continued | ||||||||||||||||||||||
| Settlement Date | Counterparty | Contract to | Unrealized Appreciation (Depreciation) | |||||||||||||||||||
| Deliver | Receive | |||||||||||||||||||||
| 11/30/2017 | Deutsche Bank Securities Inc. | CHF | 60,599,404 | USD | 63,022,493 | $ | (550,622 | ) | ||||||||||||||
| 11/30/2017 | Deutsche Bank Securities Inc. | EUR | 919,261 | USD | 1,083,495 | (13,258 | ) | |||||||||||||||
| 01/29/2018 | Goldman Sachs International | CHF | 26,623,841 | USD | 27,964,164 | (86,648 | ) | |||||||||||||||
| 01/29/2018 | Goldman Sachs International | USD | 27,529,641 | GBP | 21,070,000 | (144,044 | ) | |||||||||||||||
| 04/30/2018 | Deutsche Bank Securities Inc. | CHF | 29,646,073 | USD | 31,082,064 | (354,181 | ) | |||||||||||||||
Subtotal | (15,202,760 | ) | ||||||||||||||||||||
Total Open Forward Foreign Currency Contracts — Currency Risk | $ | 2,860,638 | ||||||||||||||||||||
| Open Centrally Cleared Interest Rate Swap Agreements | ||||||||||||||||||||||||||||||||||||||
| Pay/ Receive Floating Rate | Floating Rate Index | Payment Frequency | (Pay)/Receive Fixed Rate | Payment Frequency | Maturity Date | Notional Value | Upfront Payments Paid (Received) | Value | Unrealized Appreciation (Depreciation)(a) | |||||||||||||||||||||||||||||
| Pay | 3 Month USD LIBOR | Quarterly | 2.4979 | % | Semi-Annually | 12/19/2026 | USD | 54,200,000 | $ | — | $ | 2,072,733 | $ | 2,072,733 | ||||||||||||||||||||||||
| Pay | 3 Month USD LIBOR | Quarterly | 2.3508 | Semi-Annually | 02/13/2027 | USD | 27,000,000 | — | 676,231 | 676,231 | ||||||||||||||||||||||||||||
| Pay | 3 Month USD LIBOR | Quarterly | 2.5003 | Semi-Annually | 03/07/2027 | USD | 77,400,000 | — | 2,958,385 | 2,958,385 | ||||||||||||||||||||||||||||
Subtotal | — | 5,707,349 | 5,707,349 | |||||||||||||||||||||||||||||||||||
| Pay | 3 Month CBA | Quarterly | 1.5988 | Semi-Annually | 08/04/2019 | CAD | 411,000,000 | — | (86,128 | ) | (86,128 | ) | ||||||||||||||||||||||||||
| Receive | 3 Month USD LIBOR | Quarterly | (1.6095 | ) | Semi-Annually | 08/08/2019 | USD | (376,000,000 | ) | — | (560,155 | ) | (560,155 | ) | ||||||||||||||||||||||||
Subtotal | — | (646,283 | ) | (646,283 | ) | |||||||||||||||||||||||||||||||||
Total Centrally Cleared Interest Rate Swap Agreements — Interest Rate Risk | $ | — | $ | 5,061,066 | $ | 5,061,066 | ||||||||||||||||||||||||||||||||
(a) The daily variation margin receivable (payable) at period end is recorded in the Statement of Assets and Liabilities. | ||||||||||||||||||||||||||||||||||||||
| Open Over-The-Counter Interest Rate Swap Agreements – Interest Rate Risk | ||||||||||||||||||||||||||||||||||||||||||
| Counterparty | Pay/Receive Floating Rate | Floating Rate Index | Payment Frequency | (Pay)/Receive Fixed Rate | Payment Frequency | Maturity Date | Notional Value | Upfront Payments Paid (Received) | Value | Unrealized Appreciation (Depreciation) | ||||||||||||||||||||||||||||||||
Goldman Sachs International | Pay | Overnight FBIL MIBOR | Semi-Annually | 6.0525 | % | Semi-Annually | 08/07/2022 | INR | 4,657,000,000 | $ | — | $ | (117,350 | ) | $ | (117,350 | ) | |||||||||||||||||||||||||
Abbreviations:
| CAD | – Canadian Dollar | |
| CBA | – Canadian Bankers Acceptances | |
| CHF | – Swiss Franc | |
| CLP | – Chilean Peso | |
| EUR | – Euro | |
| FBIL | – Financial Benchmarks India Pvt. Ltd. | |
| GBP | – British Pound Sterling | |
| INR | – Indian Rupee | |
| JPY | – Japanese Yen | |
| KRW | – South Korean Won | |
| LIBOR | – London Interbank Offered Rate | |
| MIBOR | – Mumbai Inter-Bank Outright Rate | |
| MXN | – Mexican New Peso | |
| NOK | – Norwegian Krone | |
| NZD | – New Zealand Dollar | |
| SEK | – Swedish Krona | |
| USD | – U.S. Dollar |
See accompanying Notes to Financial Statements which are an integral part of the financial statements.
37 Invesco Core Plus Bond Fund
Statement of Assets and Liabilities
August 31, 2017
Assets: | ||||
Investments in securities, at value (Cost $3,047,614,116) | $ | 3,098,928,061 | ||
Investments in affiliated money market funds, at value and cost | 575,311,512 | |||
Other investments: | ||||
Variation margin receivable — centrally cleared swap agreements | 113,183 | |||
Swaps receivable — OTC | 842,066 | |||
Unrealized appreciation on forward foreign currency contracts outstanding | 18,063,398 | |||
Foreign currencies, at value (Cost $877,052) | 879,635 | |||
Receivable for: | ||||
Investments sold | 379,675,220 | |||
Fund shares sold | 20,937,081 | |||
Dividends and interest | 20,880,048 | |||
Fund expenses absorbed | 330,287 | |||
Investments matured, at value (Cost $181,248) | 265,291 | |||
Principal paydowns | 65,032 | |||
Investment for trustee deferred compensation and retirement plans | 121,598 | |||
Other assets | 169,161 | |||
Total assets | 4,116,581,573 | |||
Liabilities: | ||||
Other investments: | ||||
Options written, at value (premiums received $2,243,157) | 1,609,274 | |||
Swaps payable — OTC | 374,160 | |||
Variation margin payable — futures contracts | 159,323 | |||
Unrealized depreciation on forward foreign currency contracts outstanding | 15,202,760 | |||
Unrealized depreciation on swap agreements — OTC | 117,350 | |||
Payable for: | ||||
Investments purchased | 741,061,530 | |||
Dividends | 821,511 | |||
Fund shares reacquired | 3,864,077 | |||
Amount due custodian | 401,765 | |||
Accrued fees to affiliates | 1,006,629 | |||
Accrued trustees’ and officers’ fees and benefits | 8,176 | |||
Accrued other operating expenses | 561,731 | |||
Trustee deferred compensation and retirement plans | 136,398 | |||
Total liabilities | 765,324,684 | |||
Net assets applicable to shares outstanding | $ | 3,351,256,889 | ||
Net assets consist of: | ||||
Shares of beneficial interest | $ | 3,301,729,465 | ||
Undistributed net investment income | 4,218,080 | |||
Undistributed net realized gain | (15,787,526 | ) | ||
Net unrealized appreciation | 61,096,870 | |||
| $ | 3,351,256,889 | |||
Net Assets: | ||||
Class A | $ | 805,356,075 | ||
Class B | $ | 3,080,190 | ||
Class C | $ | 130,591,432 | ||
Class R | $ | 10,403,016 | ||
Class Y | $ | 1,278,700,264 | ||
Class R5 | $ | 4,807,085 | ||
Class R6 | $ | 1,118,318,827 | ||
Shares outstanding, no par value, |
| |||
Class A | 73,034,061 | |||
Class B | 279,344 | |||
Class C | 11,848,499 | |||
Class R | 943,937 | |||
Class Y | 115,886,333 | |||
Class R5 | 436,001 | |||
Class R6 | 101,470,243 | |||
Class A: | ||||
Net asset value per share | $ | 11.03 | ||
Maximum offering price per share | ||||
(Net asset value of $11.03 ¸ 95.75%) | $ | 11.52 | ||
Class B: | ||||
Net asset value and offering price per share | $ | 11.03 | ||
Class C: | ||||
Net asset value and offering price per share | $ | 11.02 | ||
Class R: | ||||
Net asset value and offering price per share | $ | 11.02 | ||
Class Y: | ||||
Net asset value and offering price per share | $ | 11.03 | ||
Class R5: | ||||
Net asset value and offering price per share | $ | 11.03 | ||
Class R6: | ||||
Net asset value and offering price per share | $ | 11.02 | ||
See accompanying Notes to Financial Statements which are an integral part of the financial statements.
38 Invesco Core Plus Bond Fund
Statement of Operations
For the year ended August 31, 2017
Investment income: |
| |||
Interest (net of foreign withholding taxes of $22) | $ | 85,027,832 | ||
Dividends from affiliated money market funds | 2,245,877 | |||
Dividends | 1,084,432 | |||
Total investment income | 88,358,141 | |||
Expenses: | ||||
Advisory fees | 11,038,853 | |||
Administrative services fees | 528,014 | |||
Custodian fees | 106,525 | |||
Distribution fees: | ||||
Class A | 1,801,118 | |||
Class B | 46,374 | |||
Class C | 1,160,431 | |||
Class R | 44,099 | |||
Transfer agent fees — A, B, C, R and Y | 2,303,157 | |||
Transfer agent fees — R5 | 1,114 | |||
Transfer agent fees — R6 | 2,195 | |||
Trustees’ and officers’ fees and benefits | 58,274 | |||
Registration and filing fees | 281,521 | |||
Reports to shareholders | 607,353 | |||
Professional services fees | 90,774 | |||
Other | 133,734 | |||
Total expenses | 18,203,536 | |||
Less: Fees waived, expenses reimbursed and expense offset arrangement(s) | (2,081,253 | ) | ||
Net expenses | 16,122,283 | |||
Net investment income | 72,235,858 | |||
Realized and unrealized gain (loss) from: | ||||
Net realized gain (loss) from: | ||||
Investment securities (includes net gain (loss) from securities sold to affiliates of (6,538)) | (24,320,668 | ) | ||
Foreign currencies | (426,946 | ) | ||
Forward foreign currency contracts | (199,787 | ) | ||
Futures contracts | 17,906,558 | |||
Option contracts written | 2,102,853 | |||
Swap agreements | 3,962,818 | |||
| (975,172 | ) | |||
Change in net unrealized appreciation (depreciation) of: | ||||
Investment securities | 14,700,029 | |||
Foreign currencies | 1,078 | |||
Forward foreign currency contracts | 3,822,864 | |||
Futures contracts | 1,590,140 | |||
Option contracts written | (173,840 | ) | ||
Swap agreements | 4,600,047 | |||
| 24,540,318 | ||||
Net realized and unrealized gain | 23,565,146 | |||
Net increase in net assets resulting from operations | $ | 95,801,004 | ||
See accompanying Notes to Financial Statements which are an integral part of the financial statements.
39 Invesco Core Plus Bond Fund
Statement of Changes in Net Assets
For the years ended August 31, 2017 and 2016
| 2017 | 2016 | |||||||
Operations: | ||||||||
Net investment income | $ | 72,235,858 | $ | 28,208,862 | ||||
Net realized gain (loss) | (975,172 | ) | 12,204,022 | |||||
Change in net unrealized appreciation | 24,540,318 | 41,212,715 | ||||||
Net increase in net assets resulting from operations | 95,801,004 | 81,625,599 | ||||||
Distributions to shareholders from net investment income: | ||||||||
Class A | (20,764,232 | ) | (18,207,241 | ) | ||||
Class B | (98,923 | ) | (182,004 | ) | ||||
Class C | (2,469,732 | ) | (1,976,312 | ) | ||||
Class R | (232,383 | ) | (188,532 | ) | ||||
Class Y | (22,112,990 | ) | (4,551,318 | ) | ||||
Class R5 | (108,453 | ) | (6,224 | ) | ||||
Class R6 | (35,493,900 | ) | (11,809,582 | ) | ||||
Total distributions from net investment income | (81,280,613 | ) | (36,921,213 | ) | ||||
Distributions to shareholders from net realized gains: | ||||||||
Class A | (971,424 | ) | — | |||||
Class B | (7,548 | ) | — | |||||
Class C | (154,780 | ) | — | |||||
Class R | (11,703 | ) | — | |||||
Class Y | (722,824 | ) | — | |||||
Class R5 | (6,212 | ) | — | |||||
Class R6 | (1,507,462 | ) | — | |||||
Total distributions from net realized gains | (3,381,953 | ) | — | |||||
Share transactions–net: | ||||||||
Class A | 120,979,944 | 165,278,190 | ||||||
Class B | (3,265,745 | ) | (2,332,379 | ) | ||||
Class C | 22,078,328 | 39,727,034 | ||||||
Class R | 2,829,212 | 1,422,632 | ||||||
Class Y | 982,782,379 | 173,818,144 | ||||||
Class R5 | 4,562,834 | (579,270 | ) | |||||
Class R6 | (26,764,022 | ) | 862,088,662 | |||||
Net increase in net assets resulting from share transactions | 1,103,202,930 | 1,239,423,013 | ||||||
Net increase in net assets | 1,114,341,368 | 1,284,127,399 | ||||||
Net assets: | ||||||||
Beginning of year | 2,236,915,521 | 952,788,122 | ||||||
End of year (includes undistributed net investment income of $4,218,080 and $5,034,067, respectively) | $ | 3,351,256,889 | $ | 2,236,915,521 | ||||
Notes to Financial Statements
August 31, 2017
NOTE 1—Significant Accounting Policies
Invesco Core Plus Bond Fund (the “Fund”) is a series portfolio of AIM Counselor Series Trust (Invesco Counselor Series Trust) (the “Trust”). The Trust is a Delaware statutory trust registered under the Investment Company Act of 1940, as amended (the “1940 Act”), as an open-end series management investment company consisting of fourteen separate portfolios, each authorized to issue an unlimited number of shares of beneficial interest. The assets, liabilities and operations of each portfolio are accounted for separately. Information presented in these financial statements pertains only to the Fund. Matters affecting each portfolio or class will be voted on exclusively by the shareholders of such portfolio or class.
The Fund’s investment objective is total return, comprised of current income and capital appreciation.
The Fund currently consists of seven different classes of shares: Class A, Class B, Class C, Class R, Class Y, Class R5 and Class R6. Class Y shares are available only to certain investors. Class A shares are sold with a front-end sales charge unless certain waiver criteria are met and under certain
40 Invesco Core Plus Bond Fund
circumstances load waived shares may be subject to contingent deferred sales charges (“CDSC”). Class C shares are sold with a CDSC. Class R, Class Y, Class R5 and Class R6 shares are sold at net asset value. Effective November 30, 2010, new or additional investments in Class B shares are no longer permitted. Existing shareholders of Class B shares may continue to reinvest dividends and capital gains distributions in Class B shares until they convert to Class A shares. Also, shareholders in Class B shares will be able to exchange those shares for Class B shares of other Invesco Funds offering such shares until they convert to Class A shares. Generally, Class B shares will automatically convert to Class A shares on or about the month-end, which is at least eight years after the date of purchase. Redemption of Class B shares prior to the conversion date will be subject to a CDSC.
The Fund is an investment company and accordingly follows the investment company accounting and reporting guidance in accordance with Financial Accounting Standards Board Accounting Standards Codification Topic 946, Financial Services — Investment Companies.
The following is a summary of the significant accounting policies followed by the Fund in the preparation of its financial statements.
| A. | Security Valuations — Securities, including restricted securities, are valued according to the following policy. |
Debt obligations (including convertible securities) and unlisted equities are fair valued using an evaluated quote provided by an independent pricing service. Evaluated quotes provided by the pricing service may be determined without exclusive reliance on quoted prices, and may reflect appropriate factors such as institution-size trading in similar groups of securities, developments related to specific securities, dividend rate (for unlisted equities), yield (for debt obligations), quality, type of issue, coupon rate (for debt obligations), maturity (for debt obligations), individual trading characteristics and other market data. Pricing services generally value debt obligations assuming orderly transactions of institutional round lot size, but a Fund may hold or transact in the same securities in smaller, odd lot sizes. Odd lots often trade at lower prices than institutional round lots. Debt obligations are subject to interest rate and credit risks. In addition, all debt obligations involve some risk of default with respect to interest and/or principal payments.
A security listed or traded on an exchange (except convertible securities) is valued at its last sales price or official closing price as of the close of the customary trading session on the exchange where the security is principally traded, or lacking any sales or official closing price on a particular day, the security may be valued at the closing bid price on that day. Securities traded in the over-the-counter market are valued based on prices furnished by independent pricing services or market makers. When such securities are valued by an independent pricing service they may be considered fair valued. Futures contracts are valued at the final settlement price set by an exchange on which they are principally traded. Listed options are valued at the mean between the last bid and asked prices from the exchange on which they are principally traded. Options not listed on an exchange are valued by an independent source at the mean between the last bid and asked prices. For purposes of determining net asset value (“NAV”) per share, futures and option contracts generally are valued 15 minutes after the close of the customary trading session of the New York Stock Exchange (“NYSE”).
Investments in open-end and closed-end registered investment companies that do not trade on an exchange are valued at the end-of-day net asset value per share. Investments in open-end and closed-end registered investment companies that trade on an exchange are valued at the last sales price or official closing price as of the close of the customary trading session on the exchange where the security is principally traded.
Swap agreements are fair valued using an evaluated quote, if available, provided by an independent pricing service. Evaluated quotes provided by the pricing service are valued based on a model which may include end-of-day net present values, spreads, ratings, industry, company performance and returns of referenced assets. Centrally cleared swap agreements are valued at the daily settlement price determined by the relevant exchange or clearinghouse.
Foreign securities’ (including foreign exchange contracts) prices are converted into U.S. dollar amounts using the applicable exchange rates as of the close of the NYSE. If market quotations are available and reliable for foreign exchange-traded equity securities, the securities will be valued at the market quotations. Because trading hours for certain foreign securities end before the close of the NYSE, closing market quotations may become unreliable. If between the time trading ends on a particular security and the close of the customary trading session on the NYSE, events occur that the investment adviser determines are significant and make the closing price unreliable, the Fund may fair value the security. If the event is likely to have affected the closing price of the security, the security will be valued at fair value in good faith using procedures approved by the Board of Trustees. Adjustments to closing prices to reflect fair value may also be based on a screening process of an independent pricing service to indicate the degree of certainty, based on historical data, that the closing price in the principal market where a foreign security trades is not the current value as of the close of the NYSE. Foreign securities’ prices meeting the approved degree of certainty that the price is not reflective of current value will be priced at the indication of fair value from the independent pricing service. Multiple factors may be considered by the independent pricing service in determining adjustments to reflect fair value and may include information relating to sector indices, American Depositary Receipts and domestic and foreign index futures. Foreign securities may have additional risks including exchange rate changes, potential for sharply devalued currencies and high inflation, political and economic upheaval, the relative lack of issuer information, relatively low market liquidity and the potential lack of strict financial and accounting controls and standards.
Securities for which market prices are not provided by any of the above methods may be valued based upon quotes furnished by independent sources. The last bid price may be used to value equity securities. The mean between the last bid and asked prices is used to value debt obligations, including corporate loans.
Securities for which market quotations are not readily available or became unreliable are valued at fair value as determined in good faith by or under the supervision of the Trust’s officers following procedures approved by the Board of Trustees. Issuer specific events, market trends, bid/asked quotes of brokers and information providers and other market data may be reviewed in the course of making a good faith determination of a security’s fair value.
The Fund may invest in securities that are subject to interest rate risk, meaning the risk that the prices will generally fall as interest rates rise and, conversely, the prices will generally rise as interest rates fall. Specific securities differ in their sensitivity to changes in interest rates depending on their individual characteristics. Changes in interest rates may result in increased market volatility, which may affect the value and/or liquidity of certain Fund investments.
Valuations change in response to many factors including the historical and prospective earnings of the issuer, the value of the issuer’s assets, general economic conditions, interest rates, investor perceptions and market liquidity. Because of the inherent uncertainties of valuation, the values reflected in the financial statements may materially differ from the value received upon actual sale of those investments.
| B. | Investment Transactions and Investment Income — Securities transactions are accounted for on a trade date basis. Realized gains or losses on sales are computed on the basis of specific identification of the securities sold. Interest income (net of withholding tax, if any) is |
41 Invesco Core Plus Bond Fund
| recorded on the accrual basis from settlement date. Bond premiums and discounts are amortized and/or accreted over the lives of the respective securities. Pay-in-kind received in the form of securities in-lieu of cash is recorded as interest income. Paydown gains and losses on mortgage and asset-backed securities are recorded as adjustments to interest income. Dividend income (net of withholding tax, if any) is recorded on the ex-dividend date. |
The Fund may periodically participate in litigation related to Fund investments. As such, the Fund may receive proceeds from litigation settlements. Any proceeds received are included in the Statement of Operations as realized gain (loss) for investments no longer held and as unrealized gain (loss) for investments still held.
Brokerage commissions and mark ups are considered transaction costs and are recorded as an increase to the cost basis of securities purchased and/or a reduction of proceeds on a sale of securities. Such transaction costs are included in the determination of net realized and unrealized gain (loss) from investment securities reported in the Statement of Operations and the Statement of Changes in Net Assets and the net realized and unrealized gains (losses) on securities per share in the Financial Highlights. Transaction costs are included in the calculation of the Fund’s net asset value and, accordingly, they reduce the Fund’s total returns. These transaction costs are not considered operating expenses and are not reflected in net investment income reported in the Statement of Operations and the Statement of Changes in Net Assets, or the net investment income per share and the ratios of expenses and net investment income reported in the Financial Highlights, nor are they limited by any expense limitation arrangements between the Fund and the investment adviser.
The Fund allocates realized and unrealized capital gains and losses to a class based on the relative net assets of each class. The Fund allocates income to a class based on the relative value of the settled shares of each class.
| C. | Country Determination — For the purposes of making investment selection decisions and presentation in the Schedule of Investments, the investment adviser may determine the country in which an issuer is located and/or credit risk exposure based on various factors. These factors include the laws of the country under which the issuer is organized, where the issuer maintains a principal office, the country in which the issuer derives 50% or more of its total revenues and the country that has the primary market for the issuer’s securities, as well as other criteria. Among the other criteria that may be evaluated for making this determination are the country in which the issuer maintains 50% or more of its assets, the type of security, financial guarantees and enhancements, the nature of the collateral and the sponsor organization. Country of issuer and/or credit risk exposure has been determined to be the United States of America, unless otherwise noted. |
| D. | Distributions — Distributions from net investment income, if any, are declared daily and paid monthly. Distributions from net realized capital gain, if any, are generally declared and paid annually and recorded on the ex-dividend date. The Fund may elect to treat a portion of the proceeds from redemptions as distributions for federal income tax purposes. |
| E. | Federal Income Taxes — The Fund intends to comply with the requirements of Subchapter M of the Internal Revenue Code of 1986, as amended (the “Internal Revenue Code”), necessary to qualify as a regulated investment company and to distribute substantially all of the Fund’s taxable earnings to shareholders. As such, the Fund will not be subject to federal income taxes on otherwise taxable income (including net realized capital gain) that is distributed to shareholders. Therefore, no provision for federal income taxes is recorded in the financial statements. |
The Fund recognizes the tax benefits of uncertain tax positions only when the position is more likely than not to be sustained. Management has analyzed the Fund’s uncertain tax positions and concluded that no liability for unrecognized tax benefits should be recorded related to uncertain tax positions. Management is not aware of any tax positions for which it is reasonably possible that the total amounts of unrecognized tax benefits will change materially in the next 12 months.
The Fund files tax returns in the U.S. Federal jurisdiction and certain other jurisdictions. Generally, the Fund is subject to examinations by such taxing authorities for up to three years after the filing of the return for the tax period.
| F. | Expenses — Fees provided for under the Rule 12b-1 plan of a particular class of the Fund are charged to the operations of such class. Transfer agency fees and expenses and other shareholder recordkeeping fees and expenses attributable to Class R5 and Class R6 are allocated to each share class based on relative net assets. Sub-accounting fees attributable to Class R5 are charged to the operations of the class. Transfer agency fees and expenses and other shareholder recordkeeping fees and expenses relating to all other classes are allocated among those classes based on relative net assets. All other expenses are allocated among the classes based on relative net assets. |
| G. | Accounting Estimates — The preparation of financial statements in conformity with accounting principles generally accepted in the United States of America (“GAAP”) requires management to make estimates and assumptions that affect the reported amounts of assets and liabilities at the date of the financial statements and the reported amounts of revenues and expenses during the reporting period including estimates and assumptions related to taxation. Actual results could differ from those estimates by a significant amount. In addition, the Fund monitors for material events or transactions that may occur or become known after the period-end date and before the date the financial statements are released to print. |
| H. | Indemnifications — Under the Trust’s organizational documents, each Trustee, officer, employee or other agent of the Trust is indemnified against certain liabilities that may arise out of the performance of their duties to the Fund. Additionally, in the normal course of business, the Fund enters into contracts, including the Fund’s servicing agreements, that contain a variety of indemnification clauses. The Fund’s maximum exposure under these arrangements is unknown as this would involve future claims that may be made against the Fund that have not yet occurred. The risk of material loss as a result of such indemnification claims is considered remote. |
| I. | Treasury Inflation-Protected Securities — The Fund may invest in Treasury Inflation-Protected Securities (“TIPS”). TIPS are fixed income securities whose principal value is periodically adjusted to the rate of inflation. The principal value of TIPS will be adjusted upward or downward, and any increase or decrease in the principal amount of TIPS will be included as interest income in the Statement of Operations, even though investors do not receive their principal until maturity. |
| J. | Foreign Currency Translations — Foreign currency is valued at the close of the NYSE based on quotations posted by banks and major currency dealers. Portfolio securities and other assets and liabilities denominated in foreign currencies are translated into U.S. dollar amounts at date of valuation. Purchases and sales of portfolio securities (net of foreign taxes withheld on disposition) and income items denominated in foreign currencies are translated into U.S. dollar amounts on the respective dates of such transactions. The Fund does not separately account for the portion of the results of operations resulting from changes in foreign exchange rates on investments and the fluctuations arising from changes in market prices of securities held. The combined results of changes in foreign exchange rates and the fluctuation of market prices on investments (net of estimated foreign tax withholding) are included with the net realized and unrealized gain or loss from investments in the |
42 Invesco Core Plus Bond Fund
| Statement of Operations. Reported net realized foreign currency gains or losses arise from (1) sales of foreign currencies, (2) currency gains or losses realized between the trade and settlement dates on securities transactions, and (3) the difference between the amounts of dividends, interest, and foreign withholding taxes recorded on the Fund’s books and the U.S. dollar equivalent of the amounts actually received or paid. Net unrealized foreign currency gains and losses arise from changes in the fair values of assets and liabilities, other than investments in securities at fiscal period end, resulting from changes in exchange rates. |
The Fund may invest in foreign securities, which may be subject to foreign taxes on income, gains on investments or currency repatriation, a portion of which may be recoverable. Foreign taxes, if any, are recorded based on the tax regulations and rates that exist in the foreign markets in which the Fund invests and are shown in the Statement of Operations.
| K. | Forward Foreign Currency Contracts — The Fund may engage in foreign currency transactions either on a spot (i.e. for prompt delivery and settlement) basis, or through forward foreign currency contracts, to manage or minimize currency or exchange rate risk. |
The Fund may also enter into forward foreign currency contracts for the purchase or sale of a security denominated in a foreign currency in order to “lock in” the U.S. dollar price of that security, or the Fund may also enter into forward foreign currency contracts that do not provide for physical settlement of the two currencies, but instead are settled by a single cash payment calculated as the difference between the agreed upon exchange rate and the spot rate at settlement based upon an agreed upon notional amount (non-deliverable forwards). The Fund will set aside liquid assets in an amount equal to the daily mark-to-market obligation for forward foreign currency contracts.
A forward foreign currency contract is an obligation between two parties (“Counterparties”) to purchase or sell a specific currency for an agreed-upon price at a future date. The use of forward foreign currency contracts does not eliminate fluctuations in the price of the underlying securities the Fund owns or intends to acquire but establishes a rate of exchange in advance. Fluctuations in the value of these contracts are measured by the difference in the contract date and reporting date exchange rates and are recorded as unrealized appreciation (depreciation) until the contracts are closed. When the contracts are closed, realized gains (losses) are recorded. Realized and unrealized gains (losses) on the contracts are included in the Statement of Operations. The primary risks associated with forward foreign currency contracts include failure of the Counterparty to meet the terms of the contract and the value of the foreign currency changing unfavorably. These risks may be in excess of the amounts reflected in the Statement of Assets and Liabilities.
| L. | Futures Contracts — The Fund may enter into futures contracts to manage exposure to interest rate, equity and market price movements and/or currency risks. A futures contract is an agreement between Counterparties to purchase or sell a specified underlying security, currency or commodity (or delivery of a cash settlement price, in the case of an index future) for a fixed price at a future date. The Fund currently invests only in exchange-traded futures and they are standardized as to maturity date and underlying financial instrument. Initial margin deposits required upon entering into futures contracts are satisfied by the segregation of specific securities or cash as collateral at the futures commission merchant (broker). During the period the futures contracts are open, changes in the value of the contracts are recognized as unrealized gains or losses by recalculating the value of the contracts on a daily basis. Subsequent or variation margin payments are received or made depending upon whether unrealized gains or losses are incurred. These amounts are reflected as receivables or payables on the Statement of Assets and Liabilities. When the contracts are closed or expire, the Fund recognizes a realized gain or loss equal to the difference between the proceeds from, or cost of, the closing transaction and the Fund’s basis in the contract. The net realized gain (loss) and the change in unrealized gain (loss) on futures contracts held during the period is included on the Statement of Operations. The primary risks associated with futures contracts are market risk and the absence of a liquid secondary market. If the Fund were unable to liquidate a futures contract and/or enter into an offsetting closing transaction, the Fund would continue to be subject to market risk with respect to the value of the contracts and continue to be required to maintain the margin deposits on the futures contracts. Futures contracts have minimal Counterparty risk since the exchange’s clearinghouse, as Counterparty to all exchange-traded futures, guarantees the futures against default. Risks may exceed amounts recognized in the Statement of Assets and Liabilities. |
| M. | Dollar Rolls and Forward Commitment Transactions — The Fund may enter into dollar roll transactions to enhance the Fund’s performance. The Fund executes its dollar roll transactions in the to be announced (“TBA”) market whereby the Fund makes a forward commitment to purchase a security and, instead of accepting delivery, the position is offset by the sale of the security with a simultaneous agreement to repurchase at a future date. |
The Fund accounts for dollar roll transactions as purchases and sales and realizes gains and losses on these transactions. These transactions increase the Fund’s portfolio turnover rate. The Fund will segregate liquid assets in an amount equal to its dollar roll commitments. Dollar roll transactions may be considered borrowings under the 1940 Act.
Dollar roll transactions involve the risk that a Counterparty to the transaction may fail to complete the transaction. If this occurs, the Fund may lose the opportunity to purchase or sell the security at the agreed upon price. Dollar roll transactions also involve the risk that the value of the securities retained by the Fund may decline below the price of the securities that the Fund has sold but is obligated to purchase under the agreement.
| N. | Call Options Purchased and Written — The Fund may write call options and/or buy call options. A covered call option gives the purchaser of such option the right to buy, and the writer the obligation to sell, the underlying security or foreign currency at the stated exercise price during the option period. An uncovered call option exists without the ownership of the underlying security. Options written by the Fund normally will have expiration dates between three and nine months from the date written. The exercise price of a call option may be below, equal to, or above the current market value of the underlying security at the time the option is written. |
Additionally, the Fund may enter into an option on a swap agreement, also called a “swaption”. A swaption is an option that gives the buyer the right, but not the obligation, to enter into a swap on a future date in exchange for paying a market-based premium. A receiver swaption gives the owner the right to receive the total return of a specified asset, reference rate or index. Swaptions also include options that allow an existing swap to be terminated or extended by one of the Counterparties.
When the Fund writes a covered call option, an amount equal to the premium received by the Fund is recorded as an asset and an equivalent liability in the Statement of Assets and Liabilities. The amount of the liability is subsequently “marked-to-market” to reflect the current market value of the option written. If a written covered call option expires on the stipulated expiration date, or if the Fund enters into a closing purchase transaction, the Fund realizes a gain (or a loss if the closing purchase transaction exceeds the premium received when the option was written) without regard to any unrealized gain or loss on the underlying security, and the liability related to such option is extinguished. If a written covered call option is exercised, the Fund realizes a gain or a loss from the sale of the underlying security and the proceeds of the sale are
43 Invesco Core Plus Bond Fund
increased by the premium originally received. Realized and unrealized gains and losses on call options written are included in the Statement of Operations as Net realized gain (loss) from and Change in net unrealized appreciation (depreciation) of Option contracts written. A risk in writing a covered call option is that the Fund gives up the opportunity for profit if the market price of the security increases and the option is exercised. The risk in writing an uncovered call option is that the Fund may incur significant losses if the value of the written security exceeds the exercise price of the option.
When the Fund buys a call option, an amount equal to the premium paid by the Fund is recorded as an investment on the Statement of Assets and Liabilities. The amount of the investment is subsequently “marked-to-market” to reflect the current value of the option purchased. Realized and unrealized gains and losses on call options purchased are included in the Statement of Operations as Net realized gain (loss) from and Change in net unrealized appreciation (depreciation) of Investment securities. A risk in buying an option is that the Fund pays a premium whether or not the option is exercised. In addition, there can be no assurance that a liquid secondary market will exist for any option purchased.
| O. | Put Options Purchased and Written — The Fund may purchase and write put options including options on securities indexes, or foreign currency and/or futures contracts. By purchasing a put option, the Fund obtains the right (but not the obligation) to sell the option’s underlying instrument at a fixed strike price. In return for this right, the Fund pays an option premium. The option’s underlying instrument may be a security, securities index, or a futures contract. |
Additionally, the Fund may enter into an option on a swap agreement, also called a “swaption”. A swaption is an option that gives the buyer the right, but not the obligation, to enter into a swap on a future date in exchange for paying a market-based premium. A receiver swaption gives the owner the right to receive the total return of a specified asset, reference rate or index. Swaptions also include options that allow an existing swap to be terminated or extended by one of the Counterparties.
Put options may be used by the Fund to hedge securities it owns by locking in a minimum price at which the Fund can sell. If security prices fall, the put option could be exercised to offset all or a portion of the Fund’s resulting losses. At the same time, because the maximum the Fund has at risk is the cost of the option, purchasing put options does not eliminate the potential for the Fund to profit from an increase in the value of the underlying portfolio securities. The Fund may write put options to earn additional income in the form of option premiums if it expects the price of the underlying instrument to remain stable or rise during the option period so that the option will not be exercised. The risk in this strategy is that the price of the underlying securities may decline by an amount greater than the premium received. Put options written are reported as a liability in the Statement of Assets and Liabilities. Realized and unrealized gains and losses on put options purchased and put options written are included in the Statement of Operations as Net realized gain (loss) from and Change in net unrealized appreciation (depreciation) of Investment securities and Option contracts written, respectively. A risk in buying an option is that the Fund pays a premium whether or not the option is exercised. In addition, there can be no assurance that a liquid secondary market will exist for any option purchased.
| P. | Swap Agreements — The Fund may enter into various swap transactions, including interest rate, total return, index, currency and credit default swap contracts (“CDS”) for investment purposes or to manage interest rate, currency or credit risk. Such transactions are agreements between Counterparties. A swap agreement may be negotiated bilaterally and traded over-the-counter (“OTC”) between two parties (“uncleared/OTC”) or, in some instances, must be transacted through a future commission merchant (“FCM”) and cleared through a clearinghouse that serves as a central Counterparty (“centrally cleared swap”). These agreements may contain among other conditions, events of default and termination events, and various covenants and representations such as provisions that require the Fund to maintain a pre-determined level of net assets, and/or provide limits regarding the decline of the Fund’s NAV over specific periods of time. If the Fund were to trigger such provisions and have open derivative positions at that time, the Counterparty may be able to terminate such agreement and request immediate payment in an amount equal to the net liability positions, if any. |
Interest rate, total return, index, and currency swap agreements are two-party contracts entered into primarily to exchange the returns (or differentials in rates of returns) earned or realized on particular predetermined investments or instruments. The gross returns to be exchanged or “swapped” between the parties are calculated with respect to a notional amount, i.e., the return on or increase in value of a particular dollar amount invested at a particular interest rate or return of an underlying asset, in a particular foreign currency, or in a “basket” of securities representing a particular index.
In a centrally cleared swap, the Fund’s ultimate Counterparty is a central clearinghouse. The Fund initially will enter into centrally cleared swaps through an executing broker. When a fund enters into a centrally cleared swap, it must deliver to the central Counterparty (via the FCM) an amount referred to as “initial margin.” Initial margin requirements are determined by the central Counterparty, but an FCM may require additional initial margin above the amount required by the central Counterparty. Initial margin deposits required upon entering into centrally cleared swaps are satisfied by cash or securities as collateral at the FCM. Securities deposited as initial margin are designated on the Schedule of Investments and cash deposited is recorded on the Statement of Assets and Liabilities. During the term of a cleared swap agreement, a “variation margin” amount may be required to be paid by the Fund or may be received by the Fund, based on the daily change in price of the underlying reference instrument subject to the swap agreement and is recorded as a receivable or payable for variation margin in the Statement of Assets and Liabilities until the centrally cleared swap is terminated at which time a realized gain or loss is recorded.
A CDS is an agreement between Counterparties to exchange the credit risk of an issuer. A buyer of a CDS is said to buy protection by paying a fixed payment over the life of the agreement and in some situations an upfront payment to the seller of the CDS. If a defined credit event occurs (such as payment default or bankruptcy), the Fund as a protection buyer would cease paying its fixed payment, the Fund would deliver eligible bonds issued by the reference entity to the seller, and the seller would pay the full notional value, or the “par value”, of the referenced obligation to the Fund. A seller of a CDS is said to sell protection and thus would receive a fixed payment over the life of the agreement and an upfront payment, if applicable. If a credit event occurs, the Fund as a protection seller would cease to receive the fixed payment stream, the Fund would pay the buyer “par value” or the full notional value of the referenced obligation, and the Fund would receive the eligible bonds issued by the reference entity. In turn, these bonds may be sold in order to realize a recovery value. Alternatively, the seller of the CDS and its Counterparty may agree to net the notional amount and the market value of the bonds and make a cash payment equal to the difference to the buyer of protection. If no credit event occurs, the Fund receives the fixed payment over the life of the agreement. As the seller, the Fund would effectively add leverage to its portfolio because, in addition to its total net assets, the Fund would be subject to investment exposure on the notional amount of the CDS. In connection with these agreements, cash and securities may be identified as collateral in accordance with the terms of the respective swap agreements to provide assets of value and recourse in the event of default under the swap agreement or bankruptcy/insolvency
44 Invesco Core Plus Bond Fund
of a party to the swap agreement. If a Counterparty becomes bankrupt or otherwise fails to perform its obligations due to financial difficulties, the Fund may experience significant delays in obtaining any recovery in a bankruptcy or other reorganization proceeding. The Fund may obtain only limited recovery or may obtain no recovery in such circumstances. The Fund’s maximum risk of loss from Counterparty risk, either as the protection seller or as the protection buyer, is the value of the contract. The risk may be mitigated by having a master netting arrangement between the Fund and the Counterparty and by the designation of collateral by the Counterparty to cover the Fund’s exposure to the Counterparty.
Implied credit spreads represent the current level at which protection could be bought or sold given the terms of the existing CDS contract and serve as an indicator of the current status of the payment/performance risk of the CDS. An implied spread that has widened or increased since entry into the initial contract may indicate a deteriorating credit profile and increased risk of default for the reference entity. A declining or narrowing spread may indicate an improving credit profile or decreased risk of default for the reference entity. Alternatively, credit spreads may increase or decrease reflecting the general tolerance for risk in the credit markets.
An interest rate swap is an agreement between Counterparties pursuant to which the parties exchange a floating rate payment for a fixed rate payment based on a specified notional amount.
Changes in the value of centrally cleared and OTC swap agreements are recognized as unrealized gains (losses) in the Statement of Operations by “marking to market” on a daily basis to reflect the value of the swap agreement at the end of each trading day. Payments received or paid at the beginning of the agreement are reflected as such on the Statement of Assets and Liabilities and may be referred to as upfront payments. The Fund accrues for the fixed payment stream and amortizes upfront payments, if any, on swap agreements on a daily basis with the net amount, recorded as a component of realized gain (loss) on the Statement of Operations. A liquidation payment received or made at the termination of a swap agreement is recorded as realized gain (loss) on the Statement of Operations. The Fund segregates cash or liquid securities having a value at least equal to the amount of the potential obligation of a Fund under any swap transaction. Cash held as collateral is recorded as deposits with brokers on the Statement of Assets and Liabilities. Entering into these agreements involves, to varying degrees, lack of liquidity and elements of credit, market, and Counterparty risk in excess of amounts recognized on the Statement of Assets and Liabilities. Such risks involve the possibility that a swap is difficult to sell or liquidate; the Counterparty does not honor its obligations under the agreement and unfavorable interest rates and market fluctuations. It is possible that developments in the swaps market, including potential government regulation, could adversely affect the Fund’s ability to terminate existing swap agreements or to realize amounts to be received under such agreements. A short position in a security poses more risk than holding the same security long. As there is no limit on how much the price of the security can increase, the Fund’s exposure is unlimited.
Notional amounts of each individual credit default swap agreement outstanding as of August 31, 2017 for which the Fund is the seller of protection are disclosed in the open swap agreements table. These potential amounts would be partially offset by any recovery values of the respective referenced obligations, upfront payments received upon entering into the agreement, or net amounts received from the settlement of buy protection credit default swap agreements entered into by the Fund for the same referenced entity or entities.
| Q. | Other Risks — The Fund may invest in obligations issued by agencies and instrumentalities of the U.S. Government that may vary in the level of support they receive from the government. The government may choose not to provide financial support to government sponsored agencies or instrumentalities if it is not legally obligated to do so. In this case, if the issuer defaulted, the Fund may not be able to recover its investment in such issuer from the U.S. Government. Many securities purchased by the Fund are not guaranteed by the U.S. Government. |
| R. | Leverage Risk — Leverage exists when the Fund can lose more than it originally invests because it purchases or sells an instrument or enters into a transaction without investing an amount equal to the full economic exposure of the instrument or transaction. |
| S. | Collateral — To the extent the Fund has designated or segregated a security as collateral and that security is subsequently sold, it is the Fund’s practice to replace such collateral no later than the next business day. |
NOTE 2—Advisory Fees and Other Fees Paid to Affiliates
The Trust has entered into a master investment advisory agreement with Invesco Advisers, Inc. (the “Adviser” or “Invesco”). Under the terms of the investment advisory agreement, the Fund accrues daily and pays monthly an advisory fee to the Adviser based on the annual rate of the Fund’s average daily net assets as follows:
| Average Daily Net Assets | Rate | |||||||
First $500 million | 0 | .45% | ||||||
Next $500 million | 0 | .425% | ||||||
Next $1.5 billion | 0 | .40% | ||||||
Next $2.5 billion | 0 | .375% | ||||||
Over $5 billion | 0 | .35% | ||||||
For the year ended August 31, 2017, the effective advisory fees incurred by the Fund was 0.41%.
Under the terms of a master sub-advisory agreement between the Adviser and each of Invesco Asset Management Deutschland GmbH, Invesco Asset Management Limited, Invesco Asset Management (Japan) Limited, Invesco Hong Kong Limited, Invesco Senior Secured Management, Inc. and Invesco Canada Ltd. (collectively, the “Affiliated Sub-Advisers”) the Adviser, not the Fund, will pay 40% of the fees paid to the Adviser to any such Affiliated Sub-Adviser(s) that provide(s) discretionary investment management services to the Fund based on the percentage of assets allocated to such Affiliated Sub-Adviser(s).
Effective December 16, 2016, the Adviser has contractually agreed, through at least December 31, 2017, to waive advisory fees and/or reimburse expenses of all shares to the extent necessary to limit total annual fund operating expenses after fee waiver and/or expense reimbursement (excluding certain items discussed below) of Class A, Class B, Class C, Class R, Class Y, Class R5 and Class R6 shares to 0.75%, 1.50%, 1.50%, 1.00%, 0.50%, 0.50% and 0.50%, respectively, of the Fund’s average daily net assets (the “expense limits”). Prior to December 16, 2016, the Adviser had contractually agreed to waive advisory fees and/or reimburse expenses of all shares to the extent necessary to limit total annual fund operating expenses after fee waiver and/or expense reimbursement (excluding certain items discussed below) of Class A, Class B, Class C, Class R,
45 Invesco Core Plus Bond Fund
Class Y, Class R5 and Class R6 shares to 0.86%, 1.61%, 1.61%, 1.11%, 0.61%, 0.61% and 0.61%, respectively, of the Fund’s average daily net assets (the “expense limits”). In determining the Adviser’s obligation to waive advisory fees and/or reimburse expenses, the following expenses are not taken into account, and could cause the total annual fund operating expenses after fee waiver and/or reimbursement to exceed the numbers reflected above: (1) interest; (2) taxes; (3) dividend expense on short sales; (4) extraordinary or non-routine items, including litigation expenses; and (5) expenses that the Fund has incurred but did not actually pay because of an expense offset arrangement. Unless Invesco continues the fee waiver agreement, it will terminate on December 31, 2017. During its term, the fee waiver agreement cannot be terminated or amended to increase the expense limits or reduce the advisory fee waivers without approval of the Board of Trustees.
Further, the Adviser has contractually agreed, through at least June 30, 2019, to waive the advisory fee payable by the Fund in an amount equal to 100% of the net advisory fees the Adviser receives from the affiliated money market funds on investments by the Fund of uninvested cash in such affiliated money market funds.
For the year ended August 31, 2017, the Adviser waived advisory fees of $370,793 and reimbursed class level expenses of $783,708, $5,045, $126,232, $9,594 and $779,750 of Class A, Class B, Class C, Class R and Class Y shares, respectively.
The Trust has entered into a master administrative services agreement with Invesco pursuant to which the Fund has agreed to pay Invesco for certain administrative costs incurred in providing accounting services to the Fund. For the year ended August 31, 2017, expenses incurred under the agreement are shown in the Statement of Operations as Administrative services fees.
The Trust has entered into a transfer agency and service agreement with Invesco Investment Services, Inc. (“IIS”) pursuant to which the Fund has agreed to pay IIS a fee for providing transfer agency and shareholder services to the Fund and reimburse IIS for certain expenses incurred by IIS in the course of providing such services. IIS may make payments to intermediaries that provide omnibus account services, sub-accounting services and/or networking services. All fees payable by IIS to intermediaries that provide omnibus account services or sub-accounting services are charged back to the Fund, subject to certain limitations approved by the Trust’s Board of Trustees. For the year ended August 31, 2017, expenses incurred under the agreement are shown in the Statement of Operations as Transfer agent fees.
The Trust has entered into master distribution agreements with Invesco Distributors, Inc. (“IDI”) to serve as the distributor for the Class A, Class B, Class C, Class R, Class Y, Class R5 and Class R6 shares of the Fund. The Trust has adopted plans pursuant to Rule 12b-1 under the 1940 Act with respect to the Fund’s Class A, Class B, Class C and Class R shares (collectively, the “Plans”). The Fund, pursuant to the Plans, pays IDI compensation at the annual rate of 0.25% of the Fund’s average daily net assets of Class A shares, 1.00% of the average daily net assets of Class B and Class C shares and 0.50% of the average daily net assets of Class R shares. The fees are accrued daily and paid monthly. Of the Plan payments, up to 0.25% of the average daily net assets of each class of shares may be paid to furnish continuing personal shareholder services to customers who purchase and own shares of such classes. Any amounts not paid as a service fee under the Plans would constitute an asset-based sales charge. Rules of the Financial Industry Regulatory Authority (“FINRA”) impose a cap on the total sales charges, including asset-based sales charges, that may be paid by any class of shares of the Fund. For the year ended August 31, 2017, expenses incurred under the Plans are shown in the Statement of Operations as Distribution fees.
Front-end sales commissions and CDSC (collectively, the “sales charges”) are not recorded as expenses of the Fund. Front-end sales commissions are deducted from proceeds from the sales of Fund shares prior to investment in Class A shares of the Fund. CDSC are deducted from redemption proceeds prior to remittance to the shareholder. During the year ended August 31, 2017, IDI advised the Fund that IDI retained $336,886 in front-end sales commissions from the sale of Class A shares and $64,379, $209 and $11,977 from Class A, Class B and Class C shares, respectively, for CDSC imposed on redemptions by shareholders.
Certain officers and trustees of the Trust are officers and directors of the Adviser, IIS and/or IDI.
NOTE 3—Additional Valuation Information
GAAP defines fair value as the price that would be received to sell an asset or paid to transfer a liability in an orderly transaction between market participants at the measurement date, under current market conditions. GAAP establishes a hierarchy that prioritizes the inputs to valuation methods, giving the highest priority to readily available unadjusted quoted prices in an active market for identical assets (Level 1) and the lowest priority to significant unobservable inputs (Level 3), generally when market prices are not readily available or are unreliable. Based on the valuation inputs, the securities or other investments are tiered into one of three levels. Changes in valuation methods may result in transfers in or out of an investment’s assigned level:
| Level 1 — | Prices are determined using quoted prices in an active market for identical assets. |
| Level 2 — | Prices are determined using other significant observable inputs. Observable inputs are inputs that other market participants may use in pricing a security. These may include quoted prices for similar securities, interest rates, prepayment speeds, credit risk, yield curves, loss severities, default rates, discount rates, volatilities and others. |
| Level 3 — | Prices are determined using significant unobservable inputs. In situations where quoted prices or observable inputs are unavailable (for example, when there is little or no market activity for an investment at the end of the period), unobservable inputs may be used. Unobservable inputs reflect the Fund’s own assumptions about the factors market participants would use in determining fair value of the securities or instruments and would be based on the best available information. |
The following is a summary of the tiered valuation input levels, as of August 31, 2017. The level assigned to the securities valuations may not be an indication of the risk or liquidity associated with investing in those securities. Because of the inherent uncertainties of valuation, the values reflected in the financial statements may materially differ from the value received upon actual sale of those investments.
46 Invesco Core Plus Bond Fund
The Fund’s policy is to recognize transfers in and out of the valuation levels as of the end of the reporting period. During the year ended August 31, 2017, there were no transfers between valuation levels.
| Level 1 | Level 2 | Level 3 | Total | |||||||||||||
U.S. Dollar Denominated Bonds & Notes | $ | — | $ | 1,658,368,756 | $ | — | $ | 1,658,368,756 | ||||||||
Asset-Backed Securities | — | 470,495,915 | — | 470,495,915 | ||||||||||||
U.S. Government Sponsored Agency Mortgage-Backed Securities | — | 482,768,165 | — | 482,768,165 | ||||||||||||
U.S. Treasury Securities | — | 457,548,250 | — | 457,548,250 | ||||||||||||
Preferred Stocks | 20,055,475 | 1,254,741 | — | 21,310,216 | ||||||||||||
Municipal Obligations | — | 1,339,828 | — | 1,339,828 | ||||||||||||
Non-U.S. Dollar Denominated Bonds & Notes | — | 444,529 | — | 444,529 | ||||||||||||
Common Stocks & Other Equity Interests | — | — | 135,006 | 135,006 | ||||||||||||
Options Purchased | — | 6,517,396 | — | 6,517,396 | ||||||||||||
Money Market Funds | 575,311,512 | — | — | 575,311,512 | ||||||||||||
Investments Matured | — | 265,291 | — | 265,291 | ||||||||||||
| 595,366,987 | 3,079,002,871 | 135,006 | 3,674,504,864 | |||||||||||||
Forward Foreign Currency Contracts* | — | 2,860,638 | — | 2,860,638 | ||||||||||||
Futures Contracts* | 1,255,393 | — | — | 1,255,393 | ||||||||||||
Options Written* | — | (1,609,274 | ) | — | (1,609,274 | ) | ||||||||||
Swap Agreements* | — | 4,943,716 | — | 4,943,716 | ||||||||||||
Total Investments | $ | 596,622,380 | $ | 3,085,197,951 | $ | 135,006 | $ | 3,681,955,337 | ||||||||
| * | Forward foreign currency contracts, futures contracts and swap agreements are valued at unrealized appreciation (depreciation). Options written are shown at value. |
NOTE 4—Derivative Investments
The Fund may enter into an International Swaps and Derivatives Association Master Agreement (“ISDA Master Agreement”) under which a Fund may trade OTC derivatives. An OTC transaction entered into under an ISDA Master Agreement typically involves a collateral posting arrangement, payment netting provisions and close-out netting provisions. These netting provisions allow for reduction of credit risk through netting of contractual obligations. The enforceability of the netting provisions of the ISDA Master Agreement depends on the governing law of the ISDA Master Agreement, among other factors.
For financial reporting purposes, the Fund does not offset OTC derivative assets or liabilities that are subject to ISDA Master Agreements in the Statement of Assets and Liabilities.
Value of Derivative Investments at Period-End
The table below summarizes the value of the Fund’s derivative investments, detailed by primary risk exposure, held as of August 31, 2017:
| Value | ||||||||||||
| Derivative Assets | Currency Risk | Interest Rate Risk | Total | |||||||||
Unrealized appreciation on futures contracts — Exchange-Traded(a) | $ | — | $ | 1,255,393 | $ | 1,255,393 | ||||||
Unrealized appreciation on swap agreements — Centrally Cleared(a) | — | 5,707,349 | 5,707,349 | |||||||||
Options purchased, at value — OTC(b) | 6,395,018 | 122,378 | 6,517,396 | |||||||||
Unrealized appreciation on forward foreign currency contracts outstanding | 18,063,398 | — | 18,063,398 | |||||||||
Total Derivative Assets | 24,458,416 | 7,085,120 | 31,543,536 | |||||||||
Derivatives not subject to master netting agreements | — | (6,962,742 | ) | (6,962,742 | ) | |||||||
Total Derivative Assets subject to master netting agreements | $ | 24,458,416 | $ | 122,378 | $ | 24,580,794 | ||||||
| Value | ||||||||||||
| Derivative Liabilities | Currency Risk | Interest Rate Risk | Total | |||||||||
Unrealized depreciation on swap agreements — Centrally Cleared(a) | $ | — | $ | (646,283 | ) | $ | (646,283 | ) | ||||
Unrealized depreciation on swap agreements — OTC | — | (117,350 | ) | (117,350 | ) | |||||||
Options written, at value — OTC | (1,609,274 | ) | — | (1,609,274 | ) | |||||||
Unrealized depreciation on forward foreign currency contracts outstanding | (15,202,760 | ) | — | (15,202,760 | ) | |||||||
Total Derivative Liabilities | (16,812,034 | ) | (763,633 | ) | (17,575,667 | ) | ||||||
Derivatives not subject to master netting agreements | — | 646,283 | 646,283 | |||||||||
Total Derivative Liabilities subject to master netting agreements | $ | (16,812,034 | ) | $ | (117,350 | ) | $ | (16,929,384 | ) | |||
| (a) | The daily variation margin receivable (payable) at period end is recorded in the Statement of Assets and Liabilities. |
| (b) | Options purchased, at value as reported in the Schedule of Investments. |
47 Invesco Core Plus Bond Fund
Offsetting Assets and Liabilities
The table below reflects the Fund’s exposure to Counterparties subject to either an ISDA Master Agreement or other agreement for OTC derivative transactions as of August 31, 2017.
| Financial Derivative Assets | Financial Derivative Liabilities | Collateral (Received)/ Pledged | ||||||||||||||||||||||||||||||||||||||||||||||
| Counterparty | Forward Foreign Currency Contracts | Options Purchased | Swap Agreements | Total Assets | Forward Foreign Currency Contracts | Options Written | Swap Agreements | Total Liabilities | Net Value of Derivatives | Non-Cash | Cash | Net Amount | ||||||||||||||||||||||||||||||||||||
Bank of America Merrill Lynch | $ | — | $ | 1,589,304 | $ | — | $ | 1,589,304 | $ | — | $ | — | $ | — | $ | — | $ | 1,589,304 | $ | — | $ | — | $ | 1,589,304 | ||||||||||||||||||||||||
Barclays Bank PLC | 5,514,654 | 122,378 | — | 5,637,032 | (3,813,351 | ) | — | — | (3,813,351 | ) | 1,823,681 | — | — | 1,823,681 | ||||||||||||||||||||||||||||||||||
BNP Paribas S.A. | — | — | — | — | (4,072,796 | ) | — | — | (4,072,796 | ) | (4,072,796 | ) | — | — | (4,072,796 | ) | ||||||||||||||||||||||||||||||||
CIBC World Markets Corp. | 857,261 | — | — | 857,261 | (1,319,054 | ) | — | — | (1,319,054 | ) | (461,793 | ) | — | — | (461,793 | ) | ||||||||||||||||||||||||||||||||
Citigroup Global Markets Inc. | 1,201,231 | — | — | 1,201,231 | (159,907 | ) | — | — | (159,907 | ) | 1,041,324 | — | — | 1,041,324 | ||||||||||||||||||||||||||||||||||
Deutsche Bank Securities Inc. | 703,893 | 1,193,379 | — | 1,897,272 | (2,752,607 | ) | — | — | (2,752,607 | ) | (855,335 | ) | — | — | (855,335 | ) | ||||||||||||||||||||||||||||||||
Goldman Sachs International | 2,511,268 | 594,914 | 302,096 | 3,408,278 | (1,335,261 | ) | — | (117,350 | ) | (1,452,611 | ) | 1,955,667 | — | — | 1,955,667 | |||||||||||||||||||||||||||||||||
JPMorgan Chase Bank, N.A. | 1,309,072 | — | — | 1,309,072 | (768,778 | ) | — | — | (768,778 | ) | 540,294 | — | — | 540,294 | ||||||||||||||||||||||||||||||||||
Morgan Stanley & Co. International PLC | 2,533,170 | 3,017,421 | 539,970 | 6,090,561 | (674,873 | ) | (1,609,274 | ) | (374,160 | ) | (2,658,307 | ) | 3,432,254 | — | — | 3,432,254 | ||||||||||||||||||||||||||||||||
TD Bank, N.A. | 3,432,849 | — | — | 3,432,849 | (306,133 | ) | — | — | (306,133 | ) | 3,126,716 | — | — | 3,126,716 | ||||||||||||||||||||||||||||||||||
Total | $ | 18,063,398 | $ | 6,517,396 | $ | 842,066 | $ | 25,422,860 | $ | (15,202,760 | ) | $ | (1,609,274 | ) | $ | (491,510 | ) | $ | (17,303,544 | ) | $ | 8,119,316 | $ | — | $ | — | $ | 8,119,316 | ||||||||||||||||||||
Effect of Derivative Investments for the year ended August 31, 2017
The table below summarizes the gains (losses) on derivative investments, detailed by primary risk exposure, recognized in earnings during the period:
| Location of Gain (Loss) on Statement of Operations | ||||||||||||||||
| Credit Risk | Currency Risk | Interest Rate Risk | Total | |||||||||||||
Realized Gain (Loss): | ||||||||||||||||
Forward foreign currency contracts | $ | — | $ | (199,787 | ) | $ | — | $ | (199,787 | ) | ||||||
Futures contracts | — | — | 17,906,558 | 17,906,558 | ||||||||||||
Options purchased(a) | (1,111,350 | ) | 2,002,708 | (2,039,576 | ) | (1,148,218 | ) | |||||||||
Options written | 38,750 | 1,569,868 | 494,235 | 2,102,853 | ||||||||||||
Swap agreements | (1,136,679 | ) | — | 5,099,497 | 3,962,818 | |||||||||||
Change in Net Unrealized Appreciation (Depreciation): | ||||||||||||||||
Forward foreign currency contracts | — | 3,822,864 | — | 3,822,864 | ||||||||||||
Futures contracts | — | — | 1,590,140 | 1,590,140 | ||||||||||||
Options purchased(a) | 59,366 | 1,106,661 | (814,740 | ) | 351,287 | |||||||||||
Options written | (66,633 | ) | (107,207 | ) | — | (173,840 | ) | |||||||||
Swap agreements | 104,276 | — | 4,495,771 | 4,600,047 | ||||||||||||
Total | $ | (2,112,270 | ) | $ | 8,195,107 | $ | 26,731,885 | $ | 32,814,722 | |||||||
| (a) | Options purchased are included in the net realized gain (loss) from investment securities and the change in net unrealized appreciation (depreciation) of investment securities. |
The table below summarizes the eleven month average notional value of options written and the twelve month average notional value of forward foreign currency contracts, futures contracts, options purchased and swap agreements.
| Forward Foreign Currency Contracts | Futures Contracts | Options Purchased | Options Written | Swap Agreements | ||||||||||||||||
Average notional value | $ | 716,931,052 | $ | 447,494,097 | $ | 400,464,308 | $ | 129,124,727 | $ | 367,893,357 | ||||||||||
48 Invesco Core Plus Bond Fund
NOTE 5—Security Transactions with Affiliated Funds
The Fund is permitted to purchase or sell securities from or to certain other Invesco Funds under specified conditions outlined in procedures adopted by the Board of Trustees of the Trust. The procedures have been designed to ensure that any purchase or sale of securities by the Fund from or to another fund or portfolio that is or could be considered an affiliate by virtue of having a common investment adviser (or affiliated investment advisers), common Trustees and/or common officers complies with Rule 17a-7 of the 1940 Act. Further, as defined under the procedures, each transaction is effected at the current market price. Pursuant to these procedures, for the year ended August 31, 2017, the Fund engaged in securities sales of $157,786, which resulted in net realized gains (losses) of $(6,538).
NOTE 6—Expense Offset Arrangement(s)
The expense offset arrangement is comprised of transfer agency credits which result from balances in demand deposit accounts used by the transfer agent for clearing shareholder transactions. For the year ended August 31, 2017, the Fund received credits from this arrangement, which resulted in the reduction of the Fund’s total expenses of $6,131.
NOTE 7—Trustees’ and Officers’ Fees and Benefits
Trustees’ and Officers’ Fees and Benefits include amounts accrued by the Fund to pay remuneration to certain Trustees and Officers of the Fund. Trustees have the option to defer compensation payable by the Fund, and Trustees’ and Officers’ Fees and Benefits also include amounts accrued by the Fund to fund such deferred compensation amounts. Those Trustees who defer compensation have the option to select various Invesco Funds in which their deferral accounts shall be deemed to be invested. Finally, certain current Trustees were eligible to participate in a retirement plan that provided for benefits to be paid upon retirement to Trustees over a period of time based on the number of years of service. The Fund may have certain former Trustees who also participate in a retirement plan and receive benefits under such plan. Trustees’ and Officers’ Fees and Benefits include amounts accrued by the Fund to fund such retirement benefits. Obligations under the deferred compensation and retirement plans represent unsecured claims against the general assets of the Fund.
NOTE 8—Cash Balances
The Fund may borrow for leveraging in an amount up to 5% of the Fund’s total assets (excluding the amount borrowed) at the time the borrowing is made. In doing so, the Fund is permitted to temporarily carry a negative or overdrawn balance in its account with State Street Bank and Trust Company, the custodian bank. Such balances, if any at period end, are shown in the Statement of Assets and Liabilities under the payable caption Amount due custodian. To compensate the custodian bank for such overdrafts, the overdrawn Fund may either (1) leave funds as a compensating balance in the account so the custodian bank can be compensated by earning the additional interest; or (2) compensate by paying the custodian bank at a rate agreed upon by the custodian bank and Invesco, not to exceed the contractually agreed upon rate. The Fund may not purchase additional securities when any borrowings from banks exceed 5% of the Fund’s total assets.
NOTE 9—Distributions to Shareholders and Tax Components of Net Assets
Tax Character of Distributions to Shareholders Paid During the Fiscal Years Ended August 31, 2017 and 2016:
| 2017 | 2016 | |||||||
Ordinary income | $ | 84,662,566 | $ | 36,921,213 | ||||
Tax Components of Net Assets at Period-End:
| 2017 | ||||
Undistributed ordinary income | $ | 9,253,184 | ||
Net unrealized appreciation — investments | 52,775,621 | |||
Net unrealized appreciation — foreign currencies | 5,253 | |||
Temporary book/tax differences | (127,952 | ) | ||
Capital loss carryforward | (12,378,682 | ) | ||
Shares of beneficial interest | 3,301,729,465 | |||
Total net assets | $ | 3,351,256,889 | ||
The difference between book-basis and tax-basis unrealized appreciation (depreciation) is due to differences in the timing of recognition of gains and losses on investments for tax and book purposes. The Fund’s net unrealized appreciation difference is attributable primarily to wash sales and bond premium amortization differences.
The temporary book/tax differences are a result of timing differences between book and tax recognition of income and/or expenses. The Fund’s temporary book/tax differences are the result of the trustee deferral of compensation and retirement plan benefits.
Capital loss carryforward is calculated and reported as of a specific date. Results of transactions and other activity after that date may affect the amount of capital loss carryforward actually available for the Fund to utilize. Capital losses generated in years beginning after December 22, 2010 can be carried forward for an unlimited period, whereas previous losses expire in eight tax years. Capital losses with an expiration period may not be used to offset capital gains until all net capital losses without an expiration date have been utilized. Capital loss carryforwards with no expiration date will retain their character as either short-term or long-term capital losses instead of as short-term capital losses as under prior law. The ability to utilize capital loss carryforwards in the future may be limited under the Internal Revenue Code and related regulations based on the results of future transactions.
49 Invesco Core Plus Bond Fund
The Fund has a capital loss carryforward as of August 31, 2017, which expires as follows:
| Capital Loss Carryforward* | ||||||||||||
| Expiration | Short-Term | Long-Term | Total | |||||||||
Not subject to expiration | $ | 12,378,682 | $ | — | $ | 12,378,682 | ||||||
| * | Capital loss carryforward as of the date listed above is reduced for limitations, if any, to the extent required by the Internal Revenue Code and may be further limited depending upon a variety of factors, including the realization of net unrealized gains or losses as of the date of any reorganization. |
NOTE 10—Investment Transactions
The aggregate amount of investment securities (other than short-term securities, U.S. Treasury obligations and money market funds, if any) purchased and sold by the Fund during the year ended August 31, 2017 was $10,074,685,193 and $9,167,624,266, respectively. During the same period, purchases and sales of U.S. Treasury obligations were $5,430,321,276 and $5,465,018,420, respectively. Cost of investments, including any derivatives, on a tax basis includes the adjustments for financial reporting purposes as of the most recently completed federal income tax reporting period-end.
| Unrealized Appreciation (Depreciation) of Investments on a Tax Basis | ||||
Aggregate unrealized appreciation of investments | $ | 79,700,800 | ||
Aggregate unrealized (depreciation) of investments | (26,925,179 | ) | ||
Net unrealized appreciation of investments | $ | 52,775,621 | ||
Cost of investments for tax purposes is $3,629,179,716.
NOTE 11—Reclassification of Permanent Differences
Primarily as a result of differing book/tax treatment of asset and mortgage backed dollar rolls, foreign currency transactions, income from derivative investments, and distributions, on August 31, 2017, undistributed net investment income was increased by $8,228,768, undistributed net realized gain was decreased by $8,680,917 and shares of beneficial interest was increased by $452,149. This reclassification had no effect on the net assets of the Fund.
50 Invesco Core Plus Bond Fund
NOTE 12—Share Information
| Summary of Share Activity | ||||||||||||||||
| Years ended August 31, | ||||||||||||||||
| 2017(a) | 2016 | |||||||||||||||
| Shares | Amount | Shares | Amount | |||||||||||||
Sold: | ||||||||||||||||
Class A | 33,451,331 | $ | 362,820,648 | 26,698,308 | $ | 286,930,530 | ||||||||||
Class B | 37,384 | 405,268 | 86,209 | 925,677 | ||||||||||||
Class C | 6,645,883 | 72,162,945 | 6,359,817 | 68,330,896 | ||||||||||||
Class R | 439,360 | 4,761,581 | 277,672 | 2,979,551 | ||||||||||||
Class Y | 107,161,244 | 1,164,413,002 | 21,485,228 | 233,677,834 | ||||||||||||
Class R5 | 503,718 | 5,384,508 | 6,891 | 74,320 | ||||||||||||
Class R6(b) | 6,939,220 | 74,702,460 | 84,538,568 | 932,038,810 | ||||||||||||
Issued as reinvestment of dividends: | ||||||||||||||||
Class A | 1,793,670 | 19,459,518 | 1,492,493 | 16,042,790 | ||||||||||||
Class B | 8,033 | 86,939 | 14,107 | 151,169 | ||||||||||||
Class C | 206,989 | 2,243,400 | 159,425 | 1,714,237 | ||||||||||||
Class R | 22,257 | 241,383 | 17,498 | 187,876 | ||||||||||||
Class Y | 1,650,827 | 17,948,864 | 249,081 | 2,691,271 | ||||||||||||
Class R5 | 10,533 | 114,131 | 471 | 5,021 | ||||||||||||
Class R6 | 3,412,400 | 37,001,362 | 1,094,486 | 11,809,582 | ||||||||||||
Automatic conversion of Class B shares to Class A shares: | ||||||||||||||||
Class A | 196,233 | 2,127,779 | 189,382 | 2,031,185 | ||||||||||||
Class B | (196,285 | ) | (2,127,779 | ) | (189,423 | ) | (2,031,185 | ) | ||||||||
Reacquired: | ||||||||||||||||
Class A | (24,337,323 | ) | (263,428,001 | ) | (13,017,269 | ) | (139,726,315 | ) | ||||||||
Class B | (150,712 | ) | (1,630,173 | ) | (128,873 | ) | (1,378,040 | ) | ||||||||
Class C | (4,831,062 | ) | (52,328,017 | ) | (2,822,220 | ) | (30,318,099 | ) | ||||||||
Class R | (200,503 | ) | (2,173,752 | ) | (162,547 | ) | (1,744,795 | ) | ||||||||
Class Y | (18,440,799 | ) | (199,579,487 | ) | (5,839,784 | ) | (62,550,961 | ) | ||||||||
Class R5 | (86,397 | ) | (935,805 | ) | (62,030 | ) | (658,611 | ) | ||||||||
Class R6 | (12,708,357 | ) | (138,467,844 | ) | (7,683,716 | ) | (81,759,730 | ) | ||||||||
Net increase in share activity | 101,527,644 | $ | 1,103,202,930 | 112,763,774 | $ | 1,239,423,013 | ||||||||||
| (a) | There are entities that are record owners of more than 5% of the outstanding shares of the Fund and in the aggregate own 63% of the outstanding shares of the Fund. IDI has an agreement with these entities to sell Fund shares. The Fund, Invesco and/or Invesco affiliates may make payments to these entities, which are considered to be related to the Fund, for providing services to the Fund, Invesco and/or Invesco affiliates including but not limited to services such as securities brokerage, distribution, third party record keeping and account servicing. The Fund has no knowledge as to whether all or any portion of the shares owned of record by these entities are also owned beneficially. |
| In addition, 7% of the outstanding shares of the Fund are owned by the Advisor or an affiliate of the Adviser. |
| (b) | During the year ended August 31, 2016, Class R6 shares valued at $892,241,733 were issued to investors in the CollegeBound 529 program. The program and the Fund are affiliated by having the same investment adviser. |
51 Invesco Core Plus Bond Fund
NOTE 13—Financial Highlights
The following schedule presents financial highlights for a share of the Fund outstanding throughout the periods indicated.
| Net asset value, beginning of period | Net investment income(a) | Net gains (losses) on securities (both realized and unrealized) | Total from investment operations | Dividends from net investment income | Distributions from net realized gains | Total distributions | Net asset value, end of period | Total return(b) | Net assets, end of period (000’s omitted) | Ratio of expenses to average net assets with fee waivers and/or expenses absorbed | Ratio of expenses to average net assets without fee waivers and/or expenses absorbed | Ratio of net investment income to average net assets | Portfolio turnover(c) | |||||||||||||||||||||||||||||||||||||||||||
Class A | ||||||||||||||||||||||||||||||||||||||||||||||||||||||||
Year ended 08/31/17 | $ | 11.05 | $ | 0.28 | $ | 0.03 | $ | 0.31 | $ | (0.31 | ) | $ | (0.02 | ) | $ | (0.33 | ) | $ | 11.03 | 2.88 | % | $ | 805,356 | 0.76 | %(d) | 0.88 | %(d) | 2.54 | %(d) | 547 | % | |||||||||||||||||||||||||
Year ended 08/31/16 | 10.63 | 0.25 | 0.51 | 0.76 | (0.34 | ) | — | (0.34 | ) | 11.05 | 7.33 | 684,628 | 0.83 | 0.92 | 2.40 | 518 | ||||||||||||||||||||||||||||||||||||||||
Year ended 08/31/15 | 10.92 | 0.30 | (0.20 | ) | 0.10 | (0.39 | ) | — | (0.39 | ) | 10.63 | 0.91 | 495,226 | 0.84 | 0.97 | 2.78 | 537 | |||||||||||||||||||||||||||||||||||||||
Year ended 08/31/14 | 10.41 | 0.39 | 0.58 | 0.97 | (0.46 | ) | — | (0.46 | ) | 10.92 | 9.44 | 333,641 | 0.81 | 1.03 | 3.62 | 398 | ||||||||||||||||||||||||||||||||||||||||
Year ended 08/31/13 | 10.95 | 0.31 | (0.51 | ) | (0.20 | ) | (0.34 | ) | — | (0.34 | ) | 10.41 | (1.92 | ) | 324,537 | 0.73 | 0.99 | 2.86 | 252 | |||||||||||||||||||||||||||||||||||||
Class B | ||||||||||||||||||||||||||||||||||||||||||||||||||||||||
Year ended 08/31/17 | 11.05 | 0.20 | 0.03 | 0.23 | (0.23 | ) | (0.02 | ) | (0.25 | ) | 11.03 | 2.11 | 3,080 | 1.51 | (d) | 1.63 | (d) | 1.79 | (d) | 547 | ||||||||||||||||||||||||||||||||||||
Year ended 08/31/16 | 10.63 | 0.17 | 0.51 | 0.68 | (0.26 | ) | — | (0.26 | ) | 11.05 | 6.53 | 6,420 | 1.58 | 1.67 | 1.65 | 518 | ||||||||||||||||||||||||||||||||||||||||
Year ended 08/31/15 | 10.91 | 0.22 | (0.19 | ) | 0.03 | (0.31 | ) | — | (0.31 | ) | 10.63 | 0.25 | 8,494 | 1.59 | 1.72 | 2.03 | 537 | |||||||||||||||||||||||||||||||||||||||
Year ended 08/31/14 | 10.41 | 0.31 | 0.57 | 0.88 | (0.38 | ) | — | (0.38 | ) | 10.91 | 8.53 | 11,899 | 1.56 | 1.78 | 2.87 | 398 | ||||||||||||||||||||||||||||||||||||||||
Year ended 08/31/13 | 10.95 | 0.23 | (0.51 | ) | (0.28 | ) | (0.26 | ) | — | (0.26 | ) | 10.41 | (2.66 | ) | 15,876 | 1.48 | 1.74 | 2.11 | 252 | |||||||||||||||||||||||||||||||||||||
Class C | ||||||||||||||||||||||||||||||||||||||||||||||||||||||||
Year ended 08/31/17 | 11.05 | 0.20 | 0.02 | 0.22 | (0.23 | ) | (0.02 | ) | (0.25 | ) | 11.02 | 2.02 | 130,591 | 1.51 | (d) | 1.63 | (d) | 1.79 | (d) | 547 | ||||||||||||||||||||||||||||||||||||
Year ended 08/31/16 | 10.63 | 0.17 | 0.51 | 0.68 | (0.26 | ) | — | (0.26 | ) | 11.05 | 6.53 | 108,579 | 1.58 | 1.67 | 1.65 | 518 | ||||||||||||||||||||||||||||||||||||||||
Year ended 08/31/15 | 10.91 | 0.22 | (0.19 | ) | 0.03 | (0.31 | ) | — | (0.31 | ) | 10.63 | 0.25 | 65,160 | 1.59 | 1.72 | 2.03 | 537 | |||||||||||||||||||||||||||||||||||||||
Year ended 08/31/14 | 10.41 | 0.31 | 0.57 | 0.88 | (0.38 | ) | — | (0.38 | ) | 10.91 | 8.53 | 38,142 | 1.56 | 1.78 | 2.87 | 398 | ||||||||||||||||||||||||||||||||||||||||
Year ended 08/31/13 | 10.94 | 0.23 | (0.50 | ) | (0.27 | ) | (0.26 | ) | — | (0.26 | ) | 10.41 | (2.56 | ) | 35,770 | 1.48 | 1.74 | 2.11 | 252 | |||||||||||||||||||||||||||||||||||||
Class R | ||||||||||||||||||||||||||||||||||||||||||||||||||||||||
Year ended 08/31/17 | 11.05 | 0.25 | 0.02 | 0.27 | (0.28 | ) | (0.02 | ) | (0.30 | ) | 11.02 | 2.53 | 10,403 | 1.01 | (d) | 1.13 | (d) | 2.29 | (d) | 547 | ||||||||||||||||||||||||||||||||||||
Year ended 08/31/16 | 10.63 | 0.23 | 0.51 | 0.74 | (0.32 | ) | — | (0.32 | ) | 11.05 | 7.06 | 7,545 | 1.08 | 1.17 | 2.15 | 518 | ||||||||||||||||||||||||||||||||||||||||
Year ended 08/31/15 | 10.91 | 0.27 | (0.19 | ) | 0.08 | (0.36 | ) | — | (0.36 | ) | 10.63 | 0.75 | 5,848 | 1.09 | 1.22 | 2.53 | 537 | |||||||||||||||||||||||||||||||||||||||
Year ended 08/31/14 | 10.41 | 0.36 | 0.57 | 0.93 | (0.43 | ) | — | (0.43 | ) | 10.91 | 9.07 | 3,554 | 1.06 | 1.28 | 3.37 | 398 | ||||||||||||||||||||||||||||||||||||||||
Year ended 08/31/13 | 10.95 | 0.28 | (0.51 | ) | (0.23 | ) | (0.31 | ) | — | (0.31 | ) | 10.41 | (2.16 | ) | 2,820 | 0.98 | 1.24 | 2.61 | 252 | |||||||||||||||||||||||||||||||||||||
Class Y | ||||||||||||||||||||||||||||||||||||||||||||||||||||||||
Year ended 08/31/17 | 11.06 | 0.30 | 0.03 | 0.33 | (0.34 | ) | (0.02 | ) | (0.36 | ) | 11.03 | 3.04 | 1,278,700 | 0.51 | (d) | 0.63 | (d) | 2.79 | (d) | 547 | ||||||||||||||||||||||||||||||||||||
Year ended 08/31/16 | 10.64 | 0.28 | 0.51 | 0.79 | (0.37 | ) | — | (0.37 | ) | 11.06 | 7.59 | 282,260 | 0.58 | 0.67 | 2.65 | 518 | ||||||||||||||||||||||||||||||||||||||||
Year ended 08/31/15 | 10.92 | 0.33 | (0.19 | ) | 0.14 | (0.42 | ) | — | (0.42 | ) | 10.64 | 1.25 | 102,380 | 0.59 | 0.72 | 3.03 | 537 | |||||||||||||||||||||||||||||||||||||||
Year ended 08/31/14 | 10.42 | 0.42 | 0.56 | 0.98 | (0.48 | ) | — | (0.48 | ) | 10.92 | 9.61 | 9,699 | 0.56 | 0.78 | 3.87 | 398 | ||||||||||||||||||||||||||||||||||||||||
Year ended 08/31/13 | 10.95 | 0.34 | (0.50 | ) | (0.16 | ) | (0.37 | ) | — | (0.37 | ) | 10.42 | (1.58 | ) | 1,456 | 0.48 | 0.74 | 3.11 | 252 | |||||||||||||||||||||||||||||||||||||
Class R5 | ||||||||||||||||||||||||||||||||||||||||||||||||||||||||
Year ended 08/31/17 | 11.05 | 0.30 | 0.04 | 0.34 | (0.34 | ) | (0.02 | ) | (0.36 | ) | 11.03 | 3.17 | 4,807 | 0.50 | (d) | 0.51 | (d) | 2.80 | (d) | 547 | ||||||||||||||||||||||||||||||||||||
Year ended 08/31/16 | 10.63 | 0.28 | 0.51 | 0.79 | (0.37 | ) | — | (0.37 | ) | 11.05 | 7.60 | 90 | 0.58 | 0.60 | 2.65 | 518 | ||||||||||||||||||||||||||||||||||||||||
Year ended 08/31/15 | 10.91 | 0.33 | (0.19 | ) | 0.14 | (0.42 | ) | — | (0.42 | ) | 10.63 | 1.25 | 668 | 0.59 | 0.60 | 3.03 | 537 | |||||||||||||||||||||||||||||||||||||||
Year ended 08/31/14 | 10.40 | 0.41 | 0.58 | 0.99 | (0.48 | ) | — | (0.48 | ) | 10.91 | 9.72 | 1,495 | 0.56 | 0.60 | 3.87 | 398 | ||||||||||||||||||||||||||||||||||||||||
Year ended 08/31/13 | 10.94 | 0.34 | (0.51 | ) | (0.17 | ) | (0.37 | ) | — | (0.37 | ) | 10.40 | (1.68 | ) | 1,960 | 0.48 | 0.56 | 3.11 | 252 | |||||||||||||||||||||||||||||||||||||
Class R6 | ||||||||||||||||||||||||||||||||||||||||||||||||||||||||
Year ended 08/31/17 | 11.05 | 0.30 | 0.03 | 0.33 | (0.34 | ) | (0.02 | ) | (0.36 | ) | 11.02 | 3.12 | 1,118,319 | 0.47 | (d) | 0.48 | (d) | 2.83 | (d) | 547 | ||||||||||||||||||||||||||||||||||||
Year ended 08/31/16 | 10.63 | 0.30 | 0.50 | 0.80 | (0.38 | ) | — | (0.38 | ) | 11.05 | 7.71 | 1,147,393 | 0.48 | 0.50 | 2.75 | 518 | ||||||||||||||||||||||||||||||||||||||||
Year ended 08/31/15 | 10.91 | 0.34 | (0.19 | ) | 0.15 | (0.43 | ) | — | (0.43 | ) | 10.63 | 1.32 | 275,013 | 0.52 | 0.53 | 3.10 | 537 | |||||||||||||||||||||||||||||||||||||||
Year ended 08/31/14 | 10.41 | 0.42 | 0.56 | 0.98 | (0.48 | ) | — | (0.48 | ) | 10.91 | 9.64 | 267,254 | 0.54 | 0.56 | 3.89 | 398 | ||||||||||||||||||||||||||||||||||||||||
Year ended 08/31/13(e) | 10.97 | 0.32 | (0.54 | ) | (0.22 | ) | (0.34 | ) | — | �� | (0.34 | ) | 10.41 | (2.07 | ) | 185,513 | 0.48 | (f) | 0.54 | (f) | 3.11 | (f) | 252 | |||||||||||||||||||||||||||||||||
| (a) | Calculated using average shares outstanding. |
| (b) | Includes adjustments in accordance with accounting principles generally accepted in the United States of America and as such, the net asset value for financial reporting purposes and the returns based upon those net asset values may differ from the net asset value and returns for shareholder transactions. Does not include sales charges and is not annualized for periods less than one year, if applicable. |
| (c) | Portfolio turnover is calculated at the fund level and is not annualized for periods less than one year, if applicable. |
| (d) | Ratios are based on average daily net assets (000’s omitted) of $720,447, $4,637, $116,043, $8,820, $716,809, $3,397 and $1,106,874 for Class A, Class B, Class C, Class R, Class Y, Class R5 and Class R6 shares, respectively. |
| (e) | Commencement date of September 24, 2012 for Class R6 shares. |
| (f) | Annualized. |
52 Invesco Core Plus Bond Fund
Report of Independent Registered Public Accounting Firm
To the Board of Trustees of AIM Counselor Series Trust (Invesco Counselor Series Trust)
and Shareholders of Invesco Core Plus Bond Fund:
In our opinion, the accompanying statement of assets and liabilities, including the schedule of investments, and the related statements of operations and of changes in net assets and the financial highlights present fairly, in all material respects, the financial position of Invesco Core Plus Bond Fund (one of the portfolios constituting AIM Counselor Series Trust (Invesco Counselor Series Trust), hereafter referred to as the “Fund”) as of August 31, 2017, the results of its operations for the year then ended, the changes in its net assets for each of the two years in the period then ended and the financial highlights for each of the periods indicated therein, in conformity with accounting principles generally accepted in the United States of America. These financial statements and financial highlights (hereafter referred to as “financial statements”) are the responsibility of the Fund’s management. Our responsibility is to express an opinion on these financial statements based on our audits. We conducted our audits of these financial statements in accordance with the standards of the Public Company Accounting Oversight Board (United States). Those standards require that we plan and perform the audit to obtain reasonable assurance about whether the financial statements are free of material misstatement. An audit includes examining, on a test basis, evidence supporting the amounts and disclosures in the financial statements, assessing the accounting principles used and significant estimates made by management, and evaluating the overall financial statement presentation. We believe that our audits, which included confirmation of securities as of August 31, 2017 by correspondence with the custodian, transfer agent and brokers, and when replies were not received from brokers, we performed other auditing procedures, provide a reasonable basis for our opinion.
PricewaterhouseCoopers LLP
Houston, Texas
October 30, 2017
53 Invesco Core Plus Bond Fund
Calculating your ongoing Fund expenses
Example
As a shareholder of the Fund, you incur two types of costs: (1) transaction costs, which may include sales charges (loads) on purchase payments or contingent deferred sales charges on redemptions, if any; and (2) ongoing costs, including management fees, distribution and/or service (12b-1) fees, and other Fund expenses. This example is intended to help you understand your ongoing costs (in dollars) of investing in the Fund and to compare these costs with ongoing costs of investing in other mutual funds. The example is based on an investment of $1,000 invested at the beginning of the period and held for the entire period March 1, 2017 through August 31, 2017.
Actual expenses
The table below provides information about actual account values and actual expenses. You may use the information in this table, together with the amount you invested, to estimate the expenses that you paid over the period. Simply divide your account value by $1,000 (for example, an $8,600 account value divided by $1,000 = 8.6), then multiply the result by the number in the table under the heading entitled “Actual Expenses Paid During Period” to estimate the expenses you paid on your account during this period.
Hypothetical example for comparison purposes
The table below also provides information about hypothetical account values and hypothetical expenses based on the Fund’s actual expense ratio and an assumed rate of return of 5% per year before expenses, which is not the Fund’s actual return.
The hypothetical account values and expenses may not be used to estimate the actual ending account balance or expenses you paid for the period. You may use this information to compare the ongoing costs of investing in the Fund and other funds. To do so, compare this 5% hypothetical example with the 5% hypothetical examples that appear in the shareholder reports of the other funds.
Please note that the expenses shown in the table are meant to highlight your ongoing costs only and do not reflect any transaction costs, such as sales charges (loads) on purchase payments or contingent deferred sales charges on redemptions, if any. Therefore, the hypothetical information is useful in comparing ongoing costs only, and will not help you determine the relative total costs of owning different funds. In addition, if these transaction costs were included, your costs would have been higher.
| Class | Beginning Account Value (03/01/17) | ACTUAL | HYPOTHETICAL (5% annual return before | Annualized Expense Ratio | ||||||||||||||||||||
| Ending Account Value (08/31/17)1 | Expenses Paid During Period2 | Ending Account Value (08/31/17) | Expenses Paid During Period2 | |||||||||||||||||||||
| A | $ | 1,000.00 | $ | 1,037.00 | $ | 3.70 | $ | 1,021.58 | $ | 3.67 | 0.72 | % | ||||||||||||
| B | 1,000.00 | 1,032.20 | 7.53 | 1,017.80 | 7.48 | 1.47 | ||||||||||||||||||
| C | 1,000.00 | 1,032.20 | 7.53 | 1,017.80 | 7.48 | 1.47 | ||||||||||||||||||
| R | 1,000.00 | 1,034.80 | 4.97 | 1,020.32 | 4.94 | 0.97 | ||||||||||||||||||
| Y | 1,000.00 | 1,037.30 | 2.41 | 1,022.84 | 2.40 | 0.47 | ||||||||||||||||||
| R5 | 1,000.00 | 1,037.30 | 2.62 | 1,022.63 | 2.60 | 0.51 | ||||||||||||||||||
| R6 | 1,000.00 | 1,037.50 | 2.47 | 1,022.79 | 2.45 | 0.48 | ||||||||||||||||||
| 1 | The actual ending account value is based on the actual total return of the Fund for the period March 1, 2017 through August 31, 2017, after actual expenses and will differ from the hypothetical ending account value which is based on the Fund’s expense ratio and a hypothetical annual return of 5% before expenses. |
| 2 | Expenses are equal to the Fund’s annualized expense ratio as indicated above multiplied by the average account value over the period, multiplied by 184/365 to reflect the most recent fiscal half year. |
54 Invesco Core Plus Bond Fund
Approval of Investment Advisory and Sub-Advisory Contracts
The Board of Trustees (the Board) of AIM Counselor Series Trust (Invesco Counselor Series Trust) is required under the Investment Company Act of 1940, as amended, to approve annually the renewal of Invesco Core Plus Bond Fund’s (the Fund) investment advisory agreements. During contract renewal meetings held on June 12-13, 2017, the Board as a whole, and the disinterested or “independent” Trustees, who comprise over 75% of the Board, voting separately, approved the continuance for the Fund of the Master Investment Advisory Agreement with Invesco Advisers, Inc. (Invesco Advisers and the investment advisory agreement) and the Master Intergroup Sub-Advisory Contract for Mutual Funds with Invesco Asset Management Deutschland GmbH, Invesco Asset Management Limited, Invesco Asset Management (Japan) Limited, Invesco Hong Kong Limited, Invesco Senior Secured Management, Inc. and Invesco Canada Ltd. (collectively, the Affiliated Sub-Advisers and the sub-advisory contracts) for another year, effective July 1, 2017.
In evaluating the fairness and reasonableness of compensation under the Fund’s investment advisory agreement and sub-advisory contracts, the Board considered, among other things, the factors discussed below. The Board determined that continuation of the Fund’s investment advisory agreement and the sub-advisory contracts is in the best interest of the Fund and its shareholders and that the compensation payable to Invesco Advisers and the Affiliated Sub-Advisers under the agreements is fair and reasonable.
The Board’s Fund Evaluation Process
The Board’s Investments Committee has established three Sub-Committees, which meet throughout the year to review the performance of funds advised by Invesco Advisers (the Invesco Funds). Over the course of each year, the Sub-Committees meet with portfolio managers for their assigned Invesco Funds and other members of management to review the performance, investment objective(s), policies, strategies, limitations and investment risks of these funds. The Board had the benefit of reports from the Sub-Committees and Investments Committee throughout the year in considering approval of the continuance of each Invesco Fund’s investment advisory agreement and sub-advisory contracts for another year.
During the contract renewal process, the Board receives comparative performance and fee data regarding the Invesco Funds prepared by Invesco Advisers and Broadridge Financial Solutions, Inc. (Broadridge), an independent provider of investment company data. The Board also receives an independent written evaluation from the Senior Officer, an officer of the Invesco Funds who reports directly to the independent Trustees. The Senior Officer’s
evaluation is prepared as part of his responsibility to manage the process by which the Invesco Funds’ proposed management fees are negotiated during the annual contract renewal process to ensure they are negotiated in a manner that is at arms’ length and reasonable. In addition to meetings with Invesco Advisers and fund counsel, the independent Trustees also discuss the continuance of the investment advisory agreement and sub-advisory contracts in separate sessions with the Senior Officer and with independent legal counsel.
The Trustees recognized that the advisory fee rates for the Invesco Funds are, in most cases, the result of years of review and negotiation. The Trustees’ deliberations and conclusions in a particular year may be based in part on their deliberations and conclusions regarding these arrangements throughout the year and in prior years. The Trustees’ review and conclusions are based on the comprehensive consideration of all information presented to them and are not the result of any single determinative factor. Moreover, one Trustee may have weighed a particular piece of information or factor differently than another Trustee.
The discussion below is a summary of the Senior Officer’s independent written evaluation with respect to the Fund’s investment advisory agreement as well as a discussion of the material factors and related conclusions that formed the basis for the Board’s approval of the Fund’s investment advisory agreement and sub-advisory contracts. This information is current as of June 13, 2017, and does not reflect consideration of factors that became known to the Board after that date.
Factors and Conclusions and Summary of Independent Written Fee Evaluation
| A. | Nature, Extent and Quality of Services Provided by Invesco Advisers and the Affiliated Sub-Advisers |
The Board reviewed the advisory services provided to the Fund by Invesco Advisers under the Fund’s investment advisory agreement, the performance of Invesco Advisers in providing these services, and the credentials and experience of the officers and employees of Invesco Advisers who provide these services, including the Fund’s portfolio manager or managers. The Board’s review included consideration of Invesco Advisers’ investment process oversight, credit analysis and investment risk management. The Board also considered non-advisory services that Invesco Advisers and its affiliates provide to the Invesco Funds such as various back office support functions, trading operations, internal audit, valuation and legal and compliance.
In determining whether to continue the Fund’s investment advisory agreement, the Board considered the benefits of reapproving an
existing relationship as contrasted with the greater uncertainty that may be associated with entering into a new relationship. The Board concluded that the nature, extent and quality of the services provided to the Fund by Invesco Advisers are appropriate and satisfactory.
The Board reviewed the services that may be provided by the Affiliated Sub-Advisers under the sub-advisory contracts and the credentials and experience of the officers and employees of the Affiliated Sub-Advisers who provide these services. The Board noted that the Affiliated Sub-Advisers have offices and personnel that are located in financial centers around the world. As a result, the Board noted that the Affiliated Sub-Advisers can provide research and investment analysis on the markets and economies of various countries in which the Fund may invest, make recommendations regarding securities and assist with security trades. The Board concluded that the sub-advisory contracts may benefit the Fund and its shareholders by permitting Invesco Advisers to use the resources and talents of the Affiliated Sub-Advisers in managing the Fund. The Board concluded that the nature, extent and quality of the services that may be provided by the Affiliated Sub-Advisers are appropriate and satisfactory.
| B. | Fund Investment Performance |
The Board considered Fund investment performance as a relevant factor in considering whether to approve the investment advisory agreement. The Board did not view Fund performance as a relevant factor in considering whether to approve the sub-advisory contracts for the Fund, as no Affiliated Sub-Adviser currently manages assets of the Fund.
The Board compared the Fund’s investment performance over multiple time periods ending December 31, 2016 to the performance of funds in the Broadridge performance universe and against the Lipper Core Plus Bond Funds Index. The Board noted that performance of Class A shares of the Fund was in the second quintile for the one year period and the first quintile for the three and five year periods (the first quintile being the best performing funds and the fifth quintile being the worst performing funds). The Board noted that performance of Class A shares of the Fund was above the performance of the Index for the one, three and five year periods. The Trustees also reviewed more recent Fund performance and this review did not change their conclusions.
| C. | Advisory and Sub-Advisory Fees |
The Board compared the Fund’s contractual management fee rate to the contractual management fee rates of funds in the Fund’s Broadridge expense group at a common asset level. The Board noted that the contractual management fee rate for Class A shares of the Fund was below the median contractual management fee rate of funds in its expense
55 Invesco Core Plus Bond Fund
group. The Board noted that the term “contractual management fee” for funds in the expense group may include both advisory and certain administrative services fees, but that Broadridge does not provide information on a fund by fund basis as to what is included. The Board noted that Invesco Advisers does not separately charge the Invesco Funds for the administrative services included in the term as defined by Broadridge. The Board also reviewed the methodology used by Broadridge in providing expense group information, which includes using each fund’s contractual management fee schedule (including any applicable breakpoints) as reported in the most recent prospectus or statement of additional information for each fund in the expense group.
The Board noted that Invesco Advisers has contractually agreed to waive fees and/or limit expenses of the Fund through at least December 31, 2017 in an amount necessary to limit total annual operating expenses to a specified percentage of average daily net assets for each class of the Fund.
The Board also compared the Fund’s effective advisory fee rate (the advisory fee rate after advisory fee waivers and before other expense limitations/waivers) to the effective advisory fee rates of other mutual funds advised by Invesco Advisers and its affiliates with investment strategies comparable to those of the Fund, based on asset balances as of December 31, 2016. The Board noted that the Fund’s rate was below the rate of one mutual fund.
The Board also considered the fees charged by Invesco Advisers and the Affiliated Sub-Advisers to other client accounts with investment strategies comparable to those of the Fund. The Board noted that Invesco Advisers or the Affiliated Sub-Advisers may charge lower fees to large institutional clients. Invesco Advisers reviewed with the Board the significantly greater scope of services it provides to the Invesco Funds relative to certain other types of client accounts. These additional services include provision of administrative services, officers and office space, oversight of service providers, preparation of annual registration statement updates and financial information and regulatory compliance under the Investment Company Act of 1940, as amended.
Invesco Advisers also reviewed generally the higher frequency of shareholder purchases and redemptions in the Invesco Funds relative to the flow of assets for other client accounts. Invesco Advisers advised the Board that advance notice of redemptions is often provided to Invesco Advisers by institutional clients. The Board did note that sub-advisory fee rates charged by the Affiliated Sub-Advisers to manage the Invesco Funds and to manage other client accounts tended to be more comparable, reflecting a similar scope of services.
The Board also considered the services that may be provided by the Affiliated Sub-Advisers pursuant to the sub-advisory contracts, as well as the fees payable by Invesco Advisers to the
Affiliated Sub-Advisers pursuant to the sub-advisory contracts. The Board also noted that the sub-advisory fees are not paid directly by the Fund, but rather, are payable by Invesco Advisers to the Affiliated Sub-Advisers.
| D. | Economies of Scale and Breakpoints |
The Board considered the extent to which there are economies of scale in the provision of advisory services to the Fund. The Board also considered that the Fund benefits from economies of scale through contractual breakpoints in the Fund’s advisory fee schedule. The Board noted that the Fund shares directly in economies of scale through lower fees charged by third party service providers based on the combined size of the Invesco Funds advised by Invesco Advisers.
| E. | Profitability and Financial Resources |
The Board reviewed information from Invesco Advisers concerning the costs of the advisory and other services that Invesco Advisers and its affiliates provide to the Fund and the Invesco Funds and the profitability of Invesco Advisers and its affiliates in providing these services. The Board noted that Invesco Advisers continues to operate at a net profit from services Invesco Advisers and its affiliates provide to the Invesco Funds and the Fund. The Board did not deem the level of profits realized by Invesco Advisers and its affiliates from providing services to the Fund to be excessive given the nature, quality and extent of the services provided. The Board received and accepted information from Invesco Advisers demonstrating that Invesco Advisers and each Affiliated Sub-Adviser are financially sound and have the resources necessary to perform their obligations under the investment advisory agreement and sub-advisory contracts.
| F. | Collateral Benefits to Invesco Advisers and its Affiliates |
The Board considered various other benefits received by Invesco Advisers and its affiliates from the relationship with the Fund, including the fees received for providing transfer agency and distribution services to the Fund. The Board considered comparative information regarding fees charged for these services, including information provided by Broadridge and other independent sources. The Board considered the performance of Invesco Advisers and its affiliates in providing these services and the organizational structure employed to provide these services. The Board also considered that these services are provided to the Fund pursuant to written contracts that are reviewed and approved on an annual basis by the Board; and that the services are required for the operation of the Fund.
The Board considered the benefits realized by Invesco Advisers and the Affiliated Sub-Advisers as a result of portfolio brokerage transactions executed through “soft dollar” arrangements. Invesco Advisers noted that the Fund does not execute brokerage transactions through “soft dollar” arrangements to any significant degree.
The Board considered that the Fund’s uninvested cash and cash collateral from any securities lending arrangements may be
invested in money market funds advised by Invesco Advisers pursuant to procedures approved by the Board. The Board noted that Invesco Advisers receives advisory fees from these affiliated money market funds attributable to such investments, although Invesco Advisers has contractually agreed to waive through varying periods the advisory fees payable by the Invesco Funds with respect to certain investments in the affiliated money market funds. The waiver is in an amount equal to 100% of the net advisory fee Invesco Advisers receives from the affiliated money market funds with respect to the Fund’s investment in the affiliated money market funds of uninvested cash, but not cash collateral. The Board concluded that the amount of advisory fees received by Invesco Advisers from the Fund’s investment of cash collateral from any securities lending arrangements in the affiliated money market funds is fair and reasonable.
56 Invesco Core Plus Bond Fund
Tax Information
Form 1099-DIV, Form 1042-S and other year–end tax information provide shareholders with actual calendar year amounts that should be included in their tax returns. Shareholders should consult their tax advisors.
The following distribution information is being provided as required by the Internal Revenue Code or to meet a specific state’s requirement.
The Fund designates the following amounts or, if subsequently determined to be different, the maximum amount allowable for its fiscal year ended August 31, 2017:
Federal and State Income Tax | ||||
Qualified Dividend Income* | 1.18 | % | ||
Corporate Dividends Received Deduction* | 1.18 | % | ||
U.S. Treasury Obligations* | 8.89 | % | ||
| * | The above percentages are based on ordinary income dividends paid to shareholders during the Fund’s fiscal year. |
57 Invesco Core Plus Bond Fund
Proxy Results
A Special Joint Meeting (“Meeting”) of Shareholders of Invesco Core Plus Bond Fund, an investment portfolio of AIM Counselor Series Trust (Invesco Counselor Series Trust), a Delaware statutory trust (“Trust”), was held on March 9, 2017. The Meeting was held for the following purposes:
| (1) | Elect 15 trustees to the Board, each of whom will serve until his or her successor is elected and qualified. |
| (2) | Approve an amendment to the Trust’s Agreement and Declaration of Trust that would permit fund mergers and other significant transactions upon the Board’s approval but without shareholder approval of such transactions. |
The results of the voting on the above matters were as follows:
| Matters | Votes For | Votes Withheld | ||||||||||||||||
| (1)* | David C. Arch | 1,425,647,604 | 36,521,875 | |||||||||||||||
| James T. Bunch | 1,425,181,099 | 36,988,380 | ||||||||||||||||
| Bruce L. Crockett | 1,425,174,694 | 36,994,785 | ||||||||||||||||
| Jack M. Fields | 1,426,060,874 | 36,108,605 | ||||||||||||||||
| Martin L. Flanagan | 1,426,481,477 | 35,688,002 | ||||||||||||||||
| Cynthia Hostetler | 1,426,489,972 | 35,679,505 | ||||||||||||||||
| Dr. Eli Jones | 1,426,255,832 | 35,913,647 | ||||||||||||||||
| Dr. Prema Mathai-Davis | 1,425,363,789 | 36,805,689 | ||||||||||||||||
| Teresa M. Ressel | 1,426,514,880 | 35,654,598 | ||||||||||||||||
| Dr. Larry Soll | 1,424,932,245 | 37,237,234 | ||||||||||||||||
| Ann Barnett Stern | 1,426,260,049 | 35,909,429 | ||||||||||||||||
| Raymond Stickel, Jr. | 1,425,391,657 | 36,777,822 | ||||||||||||||||
| Philip A. Taylor | 1,426,285,212 | 35,884,267 | ||||||||||||||||
| Robert C. Troccoli | 1,426,075,097 | 36,094,382 | ||||||||||||||||
| Christopher L. Wilson | 1,426,594,956 | 35,574,523 | ||||||||||||||||
| Votes For | Votes Against | Votes Abstain | Broker Non-Votes | |||||||||||||||
| (2)* | Approve an amendment to the Trust’s Agreement and Declaration of Trust that would permit fund mergers and other significant transactions upon the Board’s approval but without shareholder approval of such transactions | 751,302,707 | 79,810,344 | 41,561,890 | 589,495,482 | |||||||||||||
The Meeting was adjourned until April 11, 2017, with respect to the following proposals:
| (3) | Approve changing the fundamental investment restriction regarding the purchase or sale of physical commodities. |
| 4(a) | Approve an amendment to the current Master Intergroup Sub-Advisory Contract to add Invesco PowerShares Capital Management LLC. |
| 4(b) | Approve an amendment to the current Master Intergroup Sub-Advisory Contract to add Invesco Asset Management (India) Private Limited. |
Invesco Core Plus Bond Fund did not receive sufficient shareholder votes to pass Proposals 3 and 4(a) - (b).
The results of the voting on the above matters were as follows:
| Matters | Votes For | Votes Against | Votes Abstain | Broker Non-Votes | ||||||||||||||
| (3) | Approve changing the fundamental investment restriction regarding the purchase or sale of physical commodities | 68,601,334 | 4,134,327 | 3,548,523 | 17,113,097 | |||||||||||||
| 4(a) | Approve an amendment to the current Master Intergroup Sub-Advisory Contract to add Invesco PowerShares Capital Management LLC | 70,677,099 | 2,200,119 | 3,405,899 | 17,113,083 | |||||||||||||
| 4(b) | Approve an amendment to the current Master Intergroup Sub-Advisory Contract to add Invesco Asset Management (India) Private Limited | 69,658,877 | 3,152,126 | 3,473,188 | 17,113,090 | |||||||||||||
| * | Each of proposal 1 and 2 required approval by a combined vote of all of the portfolios of AIM Counselor Series Trust (Invesco Counselor Series Trust). |
58 Invesco Core Plus Bond Fund
Trustees and Officers
The address of each trustee and officer is AIM Counselor Series Trust (Invesco Counselor Series Trust) (the “Trust”), 11 Greenway Plaza, Suite 1000, Houston, Texas 77046-1173. The trustees serve for the life of the Trust, subject to their earlier death, incapacitation, resignation, retirement or removal as more specifically provided in the Trust’s organizational documents. Each officer serves for a one year term or until their successors are elected and qualified. Column two below includes length of time served with predecessor entities, if any.
| Name, Year of Birth and Position(s) Held with the Trust | Trustee and/ or Officer Since | Principal Occupation(s) During Past 5 Years | Number of Overseen by | Other Directorship(s) Held by Trustee During Past 5 Years | ||||
| Interested Persons | ||||||||
| Martin L. Flanagan1 — 1960 Trustee | 2007 | Executive Director, Chief Executive Officer and President, Invesco Ltd. (ultimate parent of Invesco and a global investment management firm); Trustee, The Invesco Funds; Vice Chair, Investment Company Institute; and Member of Executive Board, SMU Cox School of Business
Formerly: Advisor to the Board, Invesco Advisers, Inc. (formerly known as Invesco Institutional (N.A.), Inc.); Chairman and Chief Executive Officer, Invesco Advisers, Inc. (registered investment adviser); Director, Chairman, Chief Executive Officer and President, Invesco Holding Company (US), Inc. (formerly IVZ Inc.) (holding company), Invesco Group Services, Inc. (service provider) and Invesco North American Holdings, Inc. (holding company); Director, Chief Executive Officer and President, Invesco Holding Company Limited (parent of Invesco and a global investment management firm); Director, Invesco Ltd.; Chairman, Investment Company Institute and President, Co-Chief Executive Officer, Co-President, Chief Operating Officer and Chief Financial Officer, Franklin Resources, Inc. (global investment management organization) | 144 | None | ||||
Philip A. Taylor2 — 1954 Trustee and Senior Vice President | 2006 | Head of the Americas and Senior Managing Director, Invesco Ltd.; Director, Invesco Advisers, Inc. (formerly known as Invesco Institutional (N.A.), Inc.) (registered investment adviser); Director, Chairman, Chief Executive Officer and President, Invesco Management Group, Inc. (formerly known as Invesco Aim Management Group, Inc.) (financial services holding company); Director and Chairman, Invesco Investment Services, Inc. (formerly known as Invesco Aim Investment Services, Inc.) (registered transfer agent); Chief Executive Officer, Invesco Corporate Class Inc. (corporate mutual fund company); Director, Chairman and Chief Executive Officer, Invesco Canada Ltd. (formerly known as Invesco Trimark Ltd./Invesco Trimark Ltèe) (registered investment adviser and registered transfer agent); Trustee and Senior Vice President, The Invesco Funds; Director, Invesco Investment Advisers LLC (formerly known as Van Kampen Asset Management).
Formerly: Co-Chairman, Co-President and Co-Chief Executive Officer, Invesco Advisers, Inc. (formerly known as Invesco Institutional (N.A.), Inc.) (registered investment adviser); Director, Chief Executive Officer and President, Van Kampen Exchange Corp; President and Principal Executive Officer, The Invesco Funds (other than AIM Treasurer’s Series Trust (Invesco Treasurer’s Series Trust), Short-Term Investments Trust and Invesco Management Trust); Executive Vice President, The Invesco Funds (AIM Treasurer’s Series Trust (Invesco Treasurer’s Series Trust), Short-Term Investments Trust and Invesco Management Trust only); Director and President, INVESCO Funds Group, Inc. (registered investment adviser and registered transfer agent); Director and Chairman, IVZ Distributors, Inc. (formerly known as INVESCO Distributors, Inc.) (registered broker dealer); Director, President and Chairman, Invesco Inc. (holding company), Invesco Canada Holdings Inc. (holding company), Trimark Investments Ltd./Placements Trimark Ltèe and Invesco Financial Services Ltd/Services Financiers Invesco Ltèe; Chief Executive Officer, Invesco Canada Fund Inc. (corporate mutual fund company); Director and Chairman, Van Kampen Investor Services Inc.; Director, Chief Executive Officer and President, 1371 Preferred Inc. (holding company) and Van Kampen Investments Inc.; Director and President, AIM GP Canada Inc. (general partner for limited partnerships) and Van Kampen Advisors, Inc.; Director and Chief Executive Officer, Invesco Trimark Dealer Inc. (registered broker dealer); Director, Invesco Distributors, Inc. (formerly known as Invesco Aim Distributors, Inc.) (registered broker dealer); Manager, Invesco PowerShares Capital Management LLC; Director, Chief Executive Officer and President, Invesco Advisers, Inc.; Director, Chairman, Chief Executive Officer and President, Invesco Aim Capital Management, Inc.; President, Invesco Trimark Dealer Inc. and Invesco Trimark Ltd./Invesco Trimark Ltèe; Director and President, AIM Trimark Corporate Class Inc. and AIM Trimark Canada Fund Inc.; Senior Managing Director, Invesco Holding Company Limited; Director and Chairman, Fund Management Company (former registered broker dealer); President and Principal Executive Officer, The Invesco Funds (AIM Treasurer’s Series Trust (Invesco Treasurer’s Series Trust), and Short-Term Investments Trust only); President, AIM Trimark Global Fund Inc. and AIM Trimark Canada Fund Inc. | 144 | None |
| 1 | Mr. Flanagan is considered an interested person (within the meaning of Section 2(a)(19) of the 1940 Act) of the Trust because he is an officer of the Adviser to the Trust, and an officer and a director of Invesco Ltd., ultimate parent of the Adviser. |
| 2 | Mr. Taylor is considered an interested person (within the meaning of Section 2(a)(19) of the 1940 Act) of the Trust because he is an officer and a director of the Adviser. |
T-1 Invesco Core Plus Bond Fund
Trustees and Officers—(continued)
| Name, Year of Birth and Position(s) Held with the Trust | Trustee and/ or Officer Since | Principal Occupation(s) During Past 5 Years | Number of Complex Overseen by Trustee | Other Directorship(s) Held by Trustee During | ||||
| Independent Trustees | ||||||||
Bruce L. Crockett — 1944 Trustee and Chair | 2003 | Chairman, Crockett Technologies Associates (technology consulting company)
Formerly: Director, Captaris (unified messaging provider); Director, President and Chief Executive Officer, COMSAT Corporation; Chairman, Board of Governors of INTELSAT (international communications company); ACE Limited (insurance company); Independent Directors Council and Investment Company Institute: Member of the Audit Committee, Investment Company Institute; Member of the Executive Committee and Chair of the Governance Committee, Independent Directors Council | 144 | Director and Chairman of the Audit Committee, ALPS (Attorneys Liability Protection Society) (insurance company); Director and Member of the Audit Committee, Ferroglobe PLC (metallurgical company) | ||||
David C. Arch — 1945 Trustee | 2010 | Chairman of Blistex Inc. (consumer health care products manufacturer); Member, World Presidents’ Organization | 144 | Board member of the Illinois Manufacturers’ Association | ||||
James T. Bunch — 1942 Trustee | 2000 | Managing Member, Grumman Hill Group LLC (family office/private equity investments)
Formerly: Chairman of the Board, Denver Film Society; Chairman of the Board of Trustees, Evans Scholarship Foundation; Chairman, Board of Governors, Western Golf Association | 144 | Trustee, Evans Scholarship Foundation | ||||
Jack M. Fields — 1952 Trustee | 2003 | Chief Executive Officer, Twenty First Century Group, Inc. (government affairs company); and Discovery Learning Alliance (non-profit)
Formerly: Owner and Chief Executive Officer, Dos Angeles Ranch L.P. (cattle, hunting, corporate entertainment); Director, Insperity, Inc. (formerly known as Administaff); Chief Executive Officer, Texana Timber LP (sustainable forestry company); Director of Cross Timbers Quail Research Ranch (non-profit); and member of the U.S. House of Representatives | 144 | None | ||||
Cynthia Hostetler — 1962 Trustee | 2017 | Non-Executive Director and Trustee of a number of public and private business corporations
Formerly: Head of Investment Funds and Private Equity, Overseas Private Investment Corporation; President, First Manhattan Bancorporation, Inc.; Attorney, Simpson Thacher & Bartlett LLP | 144 | Vulcan Materials Company (construction materials company); Trilinc Global Impact Fund; Aberdeen Investment Funds (4 portfolios); Artio Global Investment LLC (mutual fund complex); Edgen Group, Inc. (specialized energy and infrastructure products distributor) | ||||
Eli Jones — 1961 Trustee | 2016 | Professor and Dean, Mays Business School — Texas A&M University
Formerly: Professor and Dean, Walton College of Business, University of Arkansas and E.J. Ourso College of Business, Louisiana State University; Director, Arvest Bank | 144 | Insperity, Inc. (formerly known as Administaff) (human resources provider) | ||||
Prema Mathai-Davis — 1950 Trustee | 2003 | Retired.
Formerly: Chief Executive Officer, YWCA of the U.S.A. | 144 | None | ||||
Teresa M. Ressel — 1962 Trustee | 2017 | Non-executive director and trustee of a number of public and private business corporations
Formerly: Chief Financial Officer, Olayan America, The Olayan Group (international investor/commercial/industrial); Chief Executive Officer, UBS Securities LLC; Group Chief Operating Officer, Americas, UBS AG; Assistant Secretary for Management & Budget and CFO, US Department of the Treasury; Chief Compliance Officer, Kaiser Permanente; Program Manager, Hewlett-Packard; Nuclear Engineering, General Dynamics Corporation | 144 | Atlantic Power Corporation (power generation company); ON Semiconductor Corp. (semiconductor supplier) | ||||
Larry Soll — 1942 Trustee | 1997 | Retired.
Formerly: Chairman, Chief Executive Officer and President, Synergen Corp. (a biotechnology company) | 144 | None | ||||
Ann Barnett Stern — 1957 Trustee | 2017 | President and Chief Executive Officer, Houston Endowment Inc. (private philanthropic institution)
Formerly: Executive Vice President and General Counsel, Texas Children’s Hospital; Attorney, Beck, Redden and Secrest, LLP; Business Law Instructor, University of St. Thomas; Attorney, Andrews & Kurth LLP | 144 | Federal Reserve Bank of Dallas | ||||
Raymond Stickel, Jr. — 1944 Trustee | 2005 | Retired.
Formerly: Director, Mainstay VP Series Funds, Inc. (25 portfolios); Partner, Deloitte & Touche | 144 | None | ||||
Robert C. Troccoli — 1949 Trustee | 2016 | Adjunct Professor, University of Denver — Daniels College of Business
Formerly: Senior Partner, KPMG LLP | 144 | None | ||||
Christopher L. Wilson — 1957 Trustee | 2017 | Managing Partner, CT2, LLC (investing and consulting firm)
Formerly: President/Chief Executive Officer, Columbia Funds, Bank of America Corporation; President/Chief Executive Officer, CDC IXIS Asset Management Services, Inc.; Principal & Director of Operations, Scudder Funds, Scudder, Stevens & Clark, Inc.; Assistant Vice President, Fidelity Investments | 144 | TD Asset Management USA Inc. (mutual fund complex) (22 portfolios); ISO New England, Inc. (non-profit organization managing regional electricity market) |
T-2 Invesco Core Plus Bond Fund
Trustees and Officers—(continued)
| Name, Year of Birth and Position(s) Held with the Trust | Trustee and/ or Officer Since | Principal Occupation(s) During Past 5 Years | Number of Complex Overseen by Trustee | Other Directorship(s) Held by Trustee During | ||||
| Other Officers | ||||||||
Sheri Morris — 1964 President, Principal Executive Officer and Treasurer | 2003 | President, Principal Executive Officer and Treasurer, The Invesco Funds; Vice President, Invesco Advisers, Inc. (formerly known as Invesco Institutional (N.A.), Inc.) (registered investment adviser); and Vice President, PowerShares Exchange-Traded Fund Trust, PowerShares Exchange-Traded Fund Trust II, PowerShares India Exchange-Traded Fund Trust, PowerShares Actively Managed Exchange-Traded Fund Trust and PowerShares Actively Managed Exchange-Traded Commodity Fund Trust
Formerly: Vice President and Principal Financial Officer, The Invesco Funds; Vice President, Invesco Aim Advisers, Inc., Invesco Aim Capital Management, Inc. and Invesco Aim Private Asset Management, Inc.; Assistant Vice President and Assistant Treasurer, The Invesco Funds and Assistant Vice President, Invesco Advisers, Inc., Invesco Aim Capital Management, Inc. and Invesco Aim Private Asset Management, Inc.; and Treasurer, PowerShares Exchange-Traded Fund Trust, PowerShares Exchange-Traded Fund Trust II, PowerShares India Exchange-Traded Fund Trust and PowerShares Actively Managed Exchange-Traded Fund Trust | N/A | N/A | ||||
Russell C. Burk — 1958 Senior Vice President and Senior Officer | 2005 | Senior Vice President and Senior Officer, The Invesco Funds | N/A | N/A | ||||
John M. Zerr — 1962 Senior Vice President, Chief Legal Officer and Secretary | 2006 | Director, Senior Vice President, Secretary and General Counsel, Invesco Management Group, Inc. (formerly known as Invesco AIM Management Group, Inc.); Senior Vice President, Invesco Advisers, Inc. (formerly known as Invesco Institutional (N.A.), Inc.) (registered investment adviser); Senior Vice President and Secretary, Invesco Distributors, Inc. (formerly known as Invesco AIM Distributors, Inc.); Director, Vice President and Secretary, Invesco Investment Services, Inc. (formerly known as Invesco AIM Investment Services, Inc.) Senior Vice President, Chief Legal Officer and Secretary, The Invesco Funds; Managing Director, Invesco PowerShares Capital Management LLC; Director, Secretary and General Counsel, Invesco Investment Advisers LLC (formerly known as Van Kampen Asset Management); Secretary and General Counsel, Invesco Capital Markets, Inc. (formerly known as Van Kampen Funds Inc.) and Chief Legal Officer, PowerShares Exchange-Traded Fund Trust, PowerShares Exchange-Traded Fund Trust II, PowerShares India Exchange-Traded Fund Trust, PowerShares Actively Managed Exchange-Traded Fund Trust and PowerShares Actively Managed Exchange-Traded Commodity Fund Trust; Manager and Secretary, Invesco Indexing LLC
Formerly: Director, Secretary, General Counsel and Senior Vice President, Van Kampen Exchange Corp.; Director, Vice President and Secretary, IVZ Distributors, Inc. (formerly known as INVESCO Distributors, Inc.); Director and Vice President, INVESCO Funds Group, Inc.; Director and Vice President, Van Kampen Advisors Inc.; Director, Vice President, Secretary and General Counsel, Van Kampen Investor Services Inc.; Director, Invesco Distributors, Inc. (formerly known as Invesco AIM Distributors, Inc.); Director, Senior Vice President, General Counsel and Secretary, Invesco AIM Advisers, Inc. and Van Kampen Investments Inc.; Director, Vice President and Secretary, Fund Management Company; Director, Senior Vice President, Secretary, General Counsel and Vice President, Invesco AIM Capital Management, Inc.; Chief Operating Officer and General Counsel, Liberty Ridge Capital, Inc. (an investment adviser); Vice President and Secretary, PBHG Funds (an investment company) and PBHG Insurance Series Fund (an investment company); Chief Operating Officer, General Counsel and Secretary, Old Mutual Investment Partners (a broker-dealer); General Counsel and Secretary, Old Mutual Fund Services (an administrator) and Old Mutual Shareholder Services (a shareholder servicing center); Executive Vice President, General Counsel and Secretary, Old Mutual Capital, Inc. (an investment adviser); and Vice President and Secretary, Old Mutual Advisors Funds (an investment company) | N/A | N/A | ||||
Gregory G. McGreevey — 1962 Senior Vice President | 2012 | Senior Managing Director, Invesco Ltd.; Director, Chairman, President, and Chief Executive Officer, Invesco Advisers, Inc. (formerly known as Invesco Institutional (N.A.), Inc.) (registered investment adviser); Director, Invesco Mortgage Capital, Inc. and Invesco Senior Secured Management, Inc.; and Senior Vice President, The Invesco Funds
Formerly: Assistant Vice President, The Invesco Funds | N/A | N/A | ||||
Kelli Gallegos — 1970 Vice President, Principal Financial Officer and Assistant Treasurer | 2008 | Vice President, Principal Financial Officer and Assistant Treasurer, The Invesco Funds; Assistant Treasurer, Invesco PowerShares Capital Management LLC, PowerShares Exchange-Traded Fund Trust, PowerShares Exchange-Traded Fund Trust II, PowerShares India Exchange-Traded Fund Trust, PowerShares Actively Managed Exchange-Traded Fund Trust and PowerShares Actively Managed Exchange-Traded Commodity Fund Trust
Formerly: Assistant Vice President, The Invesco Funds | N/A | N/A |
T-3 Invesco Core Plus Bond Fund
Trustees and Officers—(continued)
| Name, Year of Birth and Position(s) Held with the Trust | Trustee and/ or Officer Since | Principal Occupation(s) During Past 5 Years | Number of Complex Overseen by Trustee | Other Directorship(s) Held by Trustee During | ||||
| Other Officers—(continued) | ||||||||
Tracy Sullivan — 1962 Vice President, Chief Tax Officer and Assistant Treasurer | 2008 | Vice President, Chief Tax Officer and Assistant Treasurer, The Invesco Funds; Assistant Treasurer, Invesco PowerShares Capital Management LLC, PowerShares Exchange-Traded Fund Trust, PowerShares Exchange-Traded Fund Trust II, PowerShares India Exchange-Traded Fund Trust, PowerShares Actively Managed Exchange-Traded Fund Trust and PowerShares Actively Managed Exchange-Traded Commodity Fund Trust
Formerly: Assistant Vice President, The Invesco Funds | N/A | N/A | ||||
Crissie M. Wisdom — 1969 Anti-Money Laundering Compliance Officer | 2013 | Anti-Money Laundering Compliance Officer, Invesco Advisers, Inc. (formerly known as Invesco Institutional (N.A.), Inc.) (registered investment adviser), Invesco Capital Markets, Inc. (formerly known as Van Kampen Funds Inc.), Invesco Distributors, Inc., Invesco Investment Services, Inc., Invesco Management Group, Inc., The Invesco Funds, and PowerShares Exchange-Traded Fund Trust, PowerShares Exchange-Traded Fund Trust II, PowerShares India Exchange-Traded Fund Trust, PowerShares Actively Managed Exchange-Traded Fund Trust and PowerShares Actively Managed Exchange-Traded Commodity Fund Trust; Anti-Money Laundering Compliance Officer and Bank Secrecy Act Officer, INVESCO National Trust Company and Invesco Trust Company; and Fraud Prevention Manager and Controls and Risk Analysis Manager for Invesco Investment Services, Inc.
Formerly: Anti-Money Laundering Compliance Officer, Van Kampen Exchange Corp. | N/A | N/A | ||||
Robert R. Leveille — 1969 Chief Compliance Officer | 2016 | Chief Compliance Officer, Invesco Advisers, Inc. (registered investment adviser); and Chief Compliance Officer, The Invesco Funds
Formerly: Chief Compliance Officer, Putnam Investments and the Putnam Funds | N/A | N/A |
The Statement of Additional Information of the Trust includes additional information about the Fund’s Trustees and is available upon request, without charge, by calling 1.800.959.4246. Please refer to the Fund’s Statement of Additional Information for information on the Fund’s sub-advisers.
Office of the Fund 11 Greenway Plaza, Suite 1000 Houston, TX 77046-1173 | Investment Adviser Invesco Advisers, Inc. 1555 Peachtree Street, N.E. Atlanta, GA 30309 | Distributor Invesco Distributors, Inc. 11 Greenway Plaza, Suite 1000 Houston, TX 77046-1173 | Auditors PricewaterhouseCoopers LLP 1000 Louisiana Street, Suite 5800 Houston, TX 77002-5678 | |||
Counsel to the Fund Stradley Ronon Stevens & Young, LLP 2005 Market Street, Suite 2600 Philadelphia, PA 19103-7018 | Counsel to the Independent Trustees Goodwin Procter LLP 901 New York Avenue, N.W. Washington, D.C. 20001 | Transfer Agent Invesco Investment Services, Inc. 11 Greenway Plaza, Suite 1000 Houston, TX 77046-1173 | Custodian State Street Bank and Trust Company 225 Franklin Street Boston, MA 02110-2801 | |||
T-4 Invesco Core Plus Bond Fund
Explore High-Conviction Investing with Invesco

Go paperless with eDelivery
Visit invesco.com/edelivery to enjoy the convenience and security of anytime electronic access to your investment documents.
With eDelivery, you can elect to have any or all of the following materials delivered straight to your inbox to download, save and print from your own computer:
| ∎ | Fund reports and prospectuses |
| ∎ | Quarterly statements |
| ∎ | Daily confirmations |
| ∎ | Tax forms |
Invesco mailing information
Send general correspondence to Invesco Investment Services, Inc., P.O. Box 219078, Kansas City, MO 64121-9078.
Important notice regarding delivery of security holder documents
To reduce Fund expenses, only one copy of most shareholder documents may be mailed to shareholders with multiple accounts at the same address (Householding). Mailing of your shareholder documents may be householded indefinitely unless you instruct us otherwise. If you do not want the mailing of these documents to be combined with those for other members of your household, please contact Invesco Investment Services, Inc. at 800 959 4246 or contact your financial institution. We will begin sending you individual copies for each account within 30 days after receiving your request.
Fund holdings and proxy voting information
The Fund provides a complete list of its holdings four times in each fiscal year, at the quarter ends. For the second and fourth quarters, the lists appear in the Fund’s semiannual and annual reports to shareholders. For the first and third quarters, the Fund files the lists with the Securities and Exchange Commission (SEC) on Form N-Q. The most recent list of portfolio holdings is available at invesco.com/completeqtrholdings. Shareholders can also look up the Fund’s Forms N-Q on the SEC website at sec.gov. Copies of the Fund’s Forms N-Q may be reviewed and copied at the SEC Public Reference Room in Washington, D.C. You can obtain information on the operation of the Public Reference Room, including information about duplicating fee charges, by calling 202 551 8090 or 800 732 0330, or by electronic request at the following email address: publicinfo@sec.gov. The SEC file numbers for the Fund are shown below.
A description of the policies and procedures that the Fund uses to determine how to vote proxies relating to portfolio securities is available without charge, upon request, from our Client Services department at 800 959 4246 or at invesco.com/proxyguidelines. The information is also available on the SEC website, sec.gov.
Information regarding how the Fund voted proxies related to its portfolio securities during the most recent 12-month period ended June 30 is available at invesco.com/proxysearch. The information is also available on the SEC website, sec.gov. Invesco Advisers, Inc. is an investment adviser; it provides investment advisory services to individual and institutional clients and does not sell securities. Invesco Distributors, Inc. is the US distributor for Invesco Ltd.’s retail mutual funds, exchange-traded funds and institutional money market funds. Both are wholly owned, indirect subsidiaries of Invesco Ltd. |  |
SEC file numbers: 811-09913 and 333-36074 | Invesco Distributors, Inc. | CPB-AR-1 | 10232017 | 1149 |
| ||||
 | Annual Report to Shareholders
| August 31, 2017
| ||
| ||||
Invesco Equally-Weighted S&P 500 Fund
| ||||
| Nasdaq: | ||||
| A: VADAX ◾ B: VADBX ◾ C: VADCX ◾ R: VADRX ◾ Y: VADDX ◾ R6: VADFX | ||||

Letters to Shareholders
Philip Taylor | Dear Shareholders: This annual report includes information about your Fund, including performance data and a complete list of its investments as of the close of the reporting period. Inside is a discussion of how your Fund was managed and the factors that affected its performance during the reporting period. The reporting period began with stock market volatility in the US and abroad, largely the result of uncertainty about global economic growth and monetary policy. While economic data in the US were generally positive, news overseas was less upbeat. The European Central Bank and central banks in China and Japan – as well as other countries – maintained extraordinarily accommodative monetary policies in response to economic weakness. Citing generally positive economic data – specifically, realized and expected labor market conditions and inflation – the US Federal Reserve raised interest |

rates three times during the reporting period: in December 2016, and in March and June 2017. The major US stock market rally that began in November 2016 continued through the end of the reporting period, with major stock market indexes repeatedly hitting new record highs.
Short-term market volatility can prompt some investors to abandon their investment plans – and can cause others to settle for whatever returns the market has to offer. The investment professionals at Invesco, in contrast, invest with high conviction. This means that, no matter the asset class or the strategy, each investment team has a passion to exceed. We want to help investors achieve better outcomes, such as seeking higher returns, helping mitigate risk and generating income. Of course, investing with high conviction can’t guarantee a profit or ensure success; no investment strategy can. To learn more about how we invest with high conviction, visit invesco.com/HighConviction.
You, too, can invest with high conviction by maintaining a long-term investment perspective and by working with your financial adviser on a regular basis. During periods of short-term market volatility or uncertainty, your financial adviser can keep you focused on your long-term investment goals – a new home, a child’s college education or a secure retirement. He or she also can share research about the economy, the markets and individual investment options.
Visit our website for more information on your investments
Our website, invesco.com/us, offers a wide range of market insights and investment perspectives. On the website, you’ll find detailed information about our funds, including performance, holdings and portfolio manager commentaries. You can access information about your account by completing a simple, secure online registration. To do so, select “Log In” on the right side of the homepage, and then select “Register for Individual Account Access.”
In addition to the resources accessible on our website and through our mobile app, you can obtain timely updates to help you stay informed about the markets and the economy by connecting with Invesco on Twitter, LinkedIn or Facebook. You can access our blog at blog.invesco.us.com. Our goal is to provide you the information you want, when and where you want it.
Finally, I’m pleased to share with you Invesco’s commitment to both the Principles for Responsible Investment and to considering environmental, social and governance issues in our robust investment process. I invite you to learn more at invesco.com/esg.
Have questions?
For questions about your account, contact an Invesco client services representative at 800 959 4246. For Invesco-related questions or comments, please email me directly at phil@invesco.com.
All of us at Invesco look forward to serving your investment management needs. Thank you for investing with us.
Sincerely,

Philip Taylor
Senior Managing Director, Invesco Ltd.
2 Invesco Equally-Weighted S&P 500 Fund
Bruce Crockett | Dear Fellow Shareholders: Among the many important lessons I’ve learned in more than 40 years in a variety of business endeavors is the value of a trusted advocate. As independent chair of the Invesco Funds Board, I can assure you that the members of the Board are strong advocates for the interests of investors in Invesco’s mutual funds. We work hard to represent your interests through oversight of the quality of the investment management services your funds receive and other matters important to your investment, including but not limited to: ∎ Ensuring that Invesco offers a diverse lineup of mutual funds that your financial adviser can use to strive to meet your financial needs as your investment goals change over time. ∎ Monitoring how the portfolio management teams of the Invesco funds are performing in light of changing economic and market conditions. |

| ∎ | Assessing each portfolio management team’s investment performance within the context of the investment strategy described in the fund’s prospectus. |
| ∎ | Monitoring for potential conflicts of interests that may impact the nature of the services that your funds receive. |
We believe one of the most important services we provide our fund shareholders is the annual review of the funds’ advisory and sub-advisory contracts with Invesco Advisers and its affiliates. This review is required by the Investment Company Act of 1940 and focuses on the nature and quality of the services Invesco provides as the adviser to the Invesco funds and the reasonableness of the fees that it charges for those services. Each year, we spend months carefully reviewing information received from Invesco and a variety of independent sources, such as performance and fee data prepared by Lipper, Inc. (a subsidiary of Broadridge Financial Solutions, Inc.), an independent, third-party firm widely recognized as a leader in its field. We also meet with our independent legal counsel and other independent advisers to review and help us assess the information that we have received. Our goal is to assure that you receive quality investment management services for a reasonable fee.
I trust the measures outlined above provide assurance that you have a worthy advocate when it comes to choosing the Invesco Funds.
As always, please contact me at bruce@brucecrockett.com with any questions or concerns you may have. On behalf of the Board, we look forward to continuing to represent your interests and serving your needs.
Sincerely,

Bruce L. Crockett
Independent Chair
Invesco Funds Board of Trustees
3 Invesco Equally-Weighted S&P 500 Fund
Management’s Discussion of Fund Performance
Performance summary
For the fiscal year ended August 31, 2017, Class A shares of Invesco Equally- Weighted S&P 500 Fund (the Fund), at net asset value (NAV), underperformed the S&P 500 Index.
Your Fund’s long-term performance appears later in this report.
Fund vs. Indexes
Total returns, 8/31/16 to 8/31/17, at net asset value (NAV). Performance shown does not include applicable contingent deferred sales charges (CDSC) or front-end sales charges, which would have reduced performance.
Class A Shares | 12.41 | % | ||
Class B Shares | 11.56 | |||
Class C Shares | 11.56 | |||
Class R Shares | 12.13 | |||
Class Y Shares | 12.69 | |||
Class R6 Shares | 12.84 | |||
S&P 500 Indexq (Broad Market Index) | 16.23 | |||
S&P 500 Equal Weight Indexq (Style-Specific Index) | 13.04 | |||
Lipper Multi-Cap Core Funds Index∎ (Peer Group Index) | 14.49 |
Source(s): qFactSet Research Systems Inc.; ∎Lipper Inc.
Market conditions and your Fund
The fiscal year began with major US stock market indexes posting gains, with most hitting record highs following the US presidential election. Investors seemed to believe that the new administration’s plans to reduce tax rates, scale back regulations and increase infrastructure spending had the potential to stimulate economic growth. However, that was called into question in the first quarter of 2017, when headlines out of Washington, DC, suggested that enacting significant regulatory and tax reform might be more difficult than previously anticipated. Signs of an improving economy prompted the US Federal Reserve (the Fed) to raise interest rates three times during the reporting period: in December 2016 and in March and June 2017. In the first quarter of 2017, the US economy grew at an anemic rate, with gross domestic product rising at an annualized
rate of just 1.2% .1 However, the economy picked up steam during the second quarter. Unemployment continued its years-long decline, hitting a 16-year low of 4.3% in the summer of 2017.2 US equities were strong throughout the reporting period, and major US equity market indexes hit new record highs during the summer.
While US stock market indexes rose for the reporting period ended August 31, 2017, individual market sectors performed very differently from one another. Information technology (IT), financials and industrials were the strongest-performing sectors, while energy, telecommunication services and real estate were the weakest-performing sectors.
The Fund generally invests in each common stock included in the S&P 500 Index in approximately equal proportions, which differs from the market capitalization weighted approach of the S&P 500
Index. Due to the equally weighted nature of the Fund and the capitalization weighted nature of the S&P 500 Index, the Fund will lag the S&P 500 Index when large-cap stocks outperform mid-cap stocks or when market leadership is narrow.
During the fiscal year, the telecommunication services, health care, materials and utilities sectors contributed the most to the Fund’s relative performance. Specifically, the Fund’s underweight allocations in the consumer staples, health care and telecommunication services sectors contributed to the Fund’s performance relative to the S&P 500 Index. Eight out of 11 sectors in which the Fund was invested delivered positive absolute Fund performance.
Holdings in the consumer discretionary and IT sectors were the largest overall detractors from Fund performance relative to the S&P 500 Index. The Fund’s underweight allocation in the IT sector hurt relative Fund performance as did overweight exposure to the real estate sector. The Fund’s underweight exposure to mega-cap and larger capitalization stocks within the S&P 500 Index also was a damper on relative performance.
The top contributor to Fund performance during the reporting period was chipmaker NVIDIA, which delivered strong performance as the company reported robust revenue growth, especially in its graphics processing unit.
Also contributing to relative Fund performance was NRG Energy, an independent power producer and energy trader. In addition, IT companies Western Digital and Micron Technology were strong performers. Micron Technology saw its stock price rise as revenue growth and increasing earnings per share helped boost the stock.
Portfolio Composition
| By sector | % of total net assets | |||
Consumer Discretionary | 15.6 | % | ||
Information Technology | 13.8 | |||
Industrials | 13.5 | |||
Financials | 13.4 | |||
Health Care | 12.8 | |||
Real Estate | 6.6 | |||
Consumer Staples | 6.4 | |||
Energy | 5.8 | |||
Utilities | 5.8 | |||
Materials | 5.0 | |||
| Telecommunication Services | 0.7 | |||
Money Market Funds Plus Other Assets Less Liabilities | 0.6 | |||
Top 10 Equity Holdings*
| % of total net assets | ||||
1. NRG Energy, Inc. | 0.3 | % | ||
2. Alexion Pharmaceuticals, Inc. | 0.3 | |||
3. Vertex Pharmaceuticals, Inc. | 0.3 | |||
4. Gilead Sciences, Inc. | 0.3 | |||
5. Scripps Networks Interactive Inc.-Class A | 0.3 | |||
6. Boeing Co. (The) | 0.3 | |||
7. Ralph Lauren Corp. | 0.3 | |||
8. Rockwell Collins, Inc. | 0.3 | |||
9. Biogen Inc. | 0.2 | |||
10. Red Hat, Inc. | 0.2 | |||
Total Net Assets | $ | 7.5 billion | ||
Total Number of Holdings* | 505 | |||
The Fund’s holdings are subject to change, and there is no assurance that the Fund will continue to hold any particular security.
*Excluding money market fund holdings.
Data presented here are as of August 31, 2017.
4 Invesco Equally-Weighted S&P 500 Fund
Range Resources was the largest detractor from Fund performance as the company’s stock price was hampered by falling oil and gas prices. L Brands also struggled during the fiscal year. The company operates stores such as Bath & Body Works and Victoria’s Secret, whose sales were hurt as brick-and-mortar stores failed to keep pace with online retailers.
Pharmaceutical company Endo International was also a detractor from Fund performance.
Please note that the Fund’s strategy is principally implemented through equity investments, but the Fund also may use derivative instruments, including S&P 500 futures contracts, to gain exposure to the equity market. During the reporting period, the Fund invested in S&P 500 futures contracts, which generated a positive return and were a slight contributor to Fund performance. Derivatives can be a cost-effective way to gain exposure to asset classes. However, derivatives may amplify traditional investment risks through the creation of leverage and may be less liquid than traditional securities.
Thank you for your investment in Invesco Equally-Weighted S&P 500 Index Fund.
1 Bureau of Economic Analysis
2 Bureau of Labor Statistics, Bloomberg
The views and opinions expressed in management’s discussion of Fund performance are those of Invesco Advisers, Inc. These views and opinions are subject to change at any time based on factors such as market and economic conditions. These views and opinions may not be relied upon as investment advice or recommendations, or as an offer for a particular security. The information is not a complete analysis of every aspect of any market, country, industry, security or the Fund. Statements of fact are from sources considered reliable, but Invesco Advisers, Inc. makes no representation or warranty as to their completeness or accuracy. Although historical performance is no guarantee of future results, these insights may help you understand our investment management philosophy.
See important Fund and, if applicable, index disclosures later in this report.
 | Anthony Munchak Chartered Financial Analyst, Portfolio Manager, is manager of Invesco Equally-Weighted S&P 500 Fund. He joined | |
| Invesco in 2000. Mr. Munchak earned a BS and an MS in finance from Boston College and an MBA from Bentley College. | ||
 | Glen Murphy Chartered Financial Analyst, Portfolio Manager, is manager of Invesco Equally-Weighted S&P 500 Fund. He joined Invesco in | |
| 1995. Mr. Murphy earned a BA from the University of Massachusetts at Amherst and an MS in finance from Boston College. | ||
 | Francis Orlando Chartered Financial Analyst, Portfolio Manager, is manager of Invesco Equally-Weighted S&P 500 Fund. He joined Invesco in | |
| 1987. Mr. Orlando earned a BA in business administration from Merrimack College and an MBA from Boston University. | ||
 | Daniel Tsai Chartered Financial Analyst, Portfolio Manager, is manager of Invesco Equally-Weighted S&P 500 Fund. He joined Invesco in | |
| 2000. Mr. Tsai earned a BS in mechanical engineering from National Taiwan University, an MS in mechanical engineering from the University of Michigan and an MS in computer science from Wayne State University. | ||
 | Anne Unflat Portfolio Manager, is manager of Invesco Equally-Weighted S&P 500 Fund. She joined Invesco in 1988. | |
| Ms. Unflat earned a BA in economics from Queens College and an MBA in finance from St. John’s University. | ||
 | Donna Chapman Wilson Portfolio Manager and Director of Portfolio Management, is manager of Invesco Equally-Weighted S&P 500 Fund. She joined Invesco in | |
| 1997. Ms. Chapman Wilson earned a BA in economics from Hampton University and an MBA in finance from the Wharton School of the University of Pennsylvania. | ||
5 Invesco Equally-Weighted S&P 500 Fund
Your Fund’s Long-Term Performance
Results of a $10,000 Investment – Oldest Share Class(es)
Fund and index data from 8/31/07
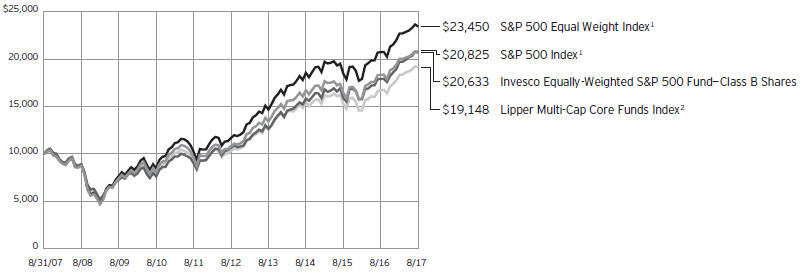
| 1 | Source: FactSet Research Systems Inc. |
| 2 | Source: Lipper Inc. |
Past performance cannot guarantee comparable future results.
The data shown in the chart include reinvested distributions, applicable sales charges and Fund expenses including management fees. Results for Class B shares are calculated as if a hypothetical
shareholder had liquidated his entire investment in the Fund at the close of the reporting period and paid the contingent deferred sales charges, if applicable. Index results include reinvested dividends, but they do not reflect sales charges. Performance of the peer group,
if applicable, reflects fund expenses and management fees; performance of a market index does not. Performance shown in the chart and table(s) does not reflect deduction of taxes a shareholder would pay on Fund distributions or sale of Fund shares.
continued from page 8
| ∎ | Market risk. The market values of the Fund’s investments, and therefore the value of the Fund’s shares, will go up and down, sometimes rapidly or unpredictably. Market risk may affect a single issuer, industry or section of the economy, or it may affect the market as a whole. Individual stock prices tend to go up and down more dramatically than those of certain other types of investments, such as bonds. During a general downturn in the financial markets, multiple asset classes may decline in value. When markets perform well, there can be no assurance that specific investments held by the Fund will rise in value. |
About indexes used in this report
| ∎ | The S&P 500® Index is an unmanaged index considered representative of the US stock market. |
| ∎ | The S&P 500® Equal Weight Index is the equally weighted version of the S&P 500 Index. |
| ∎ | The Lipper Multi-Cap Core Funds Index is an unmanaged index considered representative of multicap core funds tracked by Lipper. |
| ∎ | A direct investment cannot be made in an index. Unless otherwise indicated, index results include reinvested dividends, and they do not reflect sales charges. Performance of the peer group, if applicable, reflects fund expenses; performance of a market index does not. |
Other information
| ∎ | The returns shown in management’s discussion of Fund performance are based on net asset values (NAVs) calculated for shareholder transactions. Generally accepted accounting principles require adjustments to be made to the net assets of the Fund at period end for financial reporting purposes, and as such, the NAVs for shareholder transactions and the returns based on those NAVs may differ from the NAVs and returns reported in the Financial Highlights. |
| ∎ | Industry classifications used in this report are generally according to the Global Industry Classification Standard, which was developed by and is the exclusive property and a service mark of MSCI Inc. and Standard & Poor’s. |
6 Invesco Equally-Weighted S&P 500 Fund
Average Annual Total Returns
As of 8/31/17, including maximum applicable sales charges
Class A Shares | ||||
Inception (7/28/97) | 8.34 | % | ||
10 Years | 7.55 | |||
5 Years | 12.98 | |||
1 Year | 6.23 | |||
Class B Shares | ||||
Inception (12/1/87) | 11.03 | % | ||
10 Years | 7.51 | |||
5 Years | 13.16 | |||
1 Year | 6.56 | |||
Class C Shares | ||||
Inception (7/28/97) | 7.84 | % | ||
10 Years | 7.36 | |||
5 Years | 13.42 | |||
1 Year | 10.56 | |||
Class R Shares | ||||
Inception (3/31/08) | 9.80 | % | ||
5 Years | 13.97 | |||
1 Year | 12.13 | |||
Class Y Shares | ||||
Inception (7/28/97) | 8.90 | % | ||
10 Years | 8.43 | |||
5 Years | 14.55 | |||
1 Year | 12.69 | |||
Class R6 Shares | ||||
10 Years | 8.35 | % | ||
5 Years | 14.65 | |||
1 Year | 12.84 | |||
Average Annual Total Returns
As of 6/30/17, the most recent calendar quarter end, including maximum applicable sales charges
Class A Shares | ||||
Inception (7/28/97) | 8.38 | % | ||
10 Years | 7.01 | |||
5 Years | 13.55 | |||
1 Year | 10.15 | |||
Class B Shares | ||||
Inception (12/1/87) | 11.08 | % | ||
10 Years | 6.97 | |||
5 Years | 13.75 | |||
1 Year | 10.71 | |||
Class C Shares | ||||
Inception (7/28/97) | 7.89 | % | ||
10 Years | 6.83 | |||
5 Years | 14.00 | |||
1 Year | 14.66 | |||
Class R Shares | ||||
Inception (3/31/08) | 9.93 | % | ||
5 Years | 14.56 | |||
1 Year | 16.29 | |||
Class Y Shares | ||||
Inception (7/28/97) | 8.95 | % | ||
10 Years | 7.89 | |||
5 Years | 15.13 | |||
1 Year | 16.89 | |||
Class R6 Shares | ||||
10 Years | 7.80 | % | ||
5 Years | 15.22 | |||
1 Year | 17.01 | |||
based on expenses incurred during the period covered by this report.
Class A share performance reflects the maximum 5.50% sales charge, and Class B and Class C share performance reflects the applicable contingent deferred sales charge (CDSC) for the period involved. The CDSC on Class B shares declines from 5% beginning at the time of purchase to 0% at the beginning of the seventh year. The CDSC on Class C shares is 1% for the first year after purchase. Class R, Class Y and Class R6 shares do not have a front-end sales charge or a CDSC; therefore, performance is at net asset value.
The performance of the Fund’s share classes will differ primarily due to different sales charge structures and class expenses.
Fund performance reflects any applicable fee waivers and/or expense reimbursements. Had the adviser not waived fees and/or reimbursed expenses currently or in the past, returns would have been lower. See current prospectus for more information.
Effective June 1, 2010, Class A, Class B, Class C, Class R, Class W and Class I shares of the predecessor fund, Morgan Stanley Equally-Weighted S&P 500 Fund, advised by Morgan Stanley Investment Advisors Inc. were reorganized into Class A, Class B, Class C, Class R, Class A and Class Y shares, respectively, of Invesco Equally-Weighted S&P 500 Fund. Returns shown above, prior to June 1, 2010, for Class A, Class B, Class C, Class R and Class Y shares are blended returns of the predecessor fund and Invesco Equally-Weighted S&P 500 Fund. Share class returns will differ from the predecessor fund because of different expenses.
Class R6 shares incepted on September 24, 2012. Performance shown prior to that date is that of the Fund’s and the predecessor fund’s Class A shares and includes the 12b-1 fees applicable to Class A shares.
The performance data quoted represent past performance and cannot guarantee comparable future results; current performance may be lower or higher. Please visit invesco.com/performance for the most recent month-end performance. Performance figures reflect reinvested distributions, changes in net asset value and the effect of the maximum sales charge unless otherwise stated. Investment return and principal value will fluctuate so that you may have a gain or loss when you sell shares.
The total annual Fund operating expense ratio set forth in the most recent Fund prospectus as of the date of this report for Class A, Class B, Class C, Class R, Class Y and Class R6 shares was 0.54%, 1.29%, 1.23%, 0.79%, 0.29% and 0.16%, respectively. The expense ratios presented above may vary from the expense ratios presented in other sections of this report that are
7 Invesco Equally-Weighted S&P 500 Fund
Invesco Equally-Weighted S&P 500 Fund’s investment objective is total return through growth of capital and current income.
| ∎ | Unless otherwise stated, information presented in this report is as of August 31, 2017, and is based on total net assets. |
| ∎ | Unless otherwise noted, all data provided by Invesco. |
| ∎ | To access your Fund’s reports/prospectus, visit invesco.com/fundreports. |
About share classes
| ∎ | Class B shares may not be purchased for new or additional investments. Please see the prospectus for more information. |
| ∎ | Class R shares are generally available only to employer sponsored retirement and benefit plans. Please see the prospectus for more information. |
| ∎ | Class Y shares are available only to certain investors. Please see the prospectus for more information. |
| ∎ | Class R6 shares are available for use by retirement plans that meet certain standards and for institutional investors. Class R6 shares are also available through intermediaries that have established an agreement with Invesco Distributors, Inc. to make such shares available for use in retail omnibus accounts. Please see the prospectus for more information. |
Principal risks of investing in the Fund
| ∎ | Depositary receipts risk. Investing in depositary receipts involves the same risks as direct investments in foreign securities. In addition, the underlying issuers of certain depositary receipts are under no obligation to distribute shareholder communications or pass through any voting rights with respect to the deposited securities to the holders of such receipts. The Fund may therefore receive less timely information or have less control than if it invested directly in the foreign issuer. |
| ∎ | Derivatives risk. The value of a derivative instrument depends largely on (and is derived from) the value of an underlying security, currency, commodity, interest rate, index or other asset (each referred to as an underlying asset). In addition to risks relating to the underlying assets, the use of derivatives may include other, possibly greater, risks, including counterparty, leverage and liquidity risks. Counterparty risk is the risk that the counterparty |
to the derivative contract will default on its obligation to pay the Fund the amount owed or otherwise perform under the derivative contract. Derivatives create leverage risk because they do not require payment up front equal to the economic exposure created by owning the derivative. As a result, an adverse change in the value of the underlying asset could result in the Fund sustaining a loss that is substantially greater than the amount invested in the derivative, which may make the Fund’s returns more volatile and increase the risk of loss. Derivative instruments may also be less liquid than more traditional investments and the Fund may be unable to sell or close out its derivative positions at a desirable time or price. This risk may be more acute under adverse market conditions, during which the Fund may be most in need of liquidating its derivative positions. Derivatives may also be harder to value, less tax efficient and subject to changing government regulation that could impact the Fund’s ability to use certain derivatives or their cost. Also, derivatives used for hedging or to gain or limit exposure to a particular market segment may not provide the expected benefits, particularly during adverse market conditions. |
| ∎ | Emerging markets securities risk. Emerging markets (also referred to as developing markets) are generally subject to greater market volatility, political, social and economic instability, uncertain trading markets and more governmental limitations on foreign investment than more developed markets. In addition, companies operating in emerging markets may be subject to lower trading volume and greater price fluctuations than companies in more developed markets. Securities law and the enforcement of systems of taxation in many emerging |
market countries may change quickly and unpredictably. In addition, investments in emerging markets securities may also be subject to additional transaction costs, delays in settlement procedures, and lack of timely information. |
| ∎ | Foreign securities risk. The Fund’s foreign investments may be adversely affected by political and social instability, changes in economic or taxation policies, difficulty in enforcing obligations, decreased liquidity or increased volatility. Foreign investments also involve the risk of the possible seizure, nationalization or expropriation of the issuer or foreign deposits (in which the Fund could lose its entire investments in a certain market) and the possible adoption of foreign governmental restrictions such as exchange controls. Unless the Fund has hedged its foreign securities risk, foreign securities risk also involves the risk of negative foreign currency rate fluctuations, which may cause the value of securities denominated in such foreign currency (or other instruments through which the Fund has exposure to foreign currencies) to decline in value. Currency exchange rates may fluctuate significantly over short periods of time. Currency hedging strategies, if used, are not always successful. |
| ∎ | Indexing risk. The Fund is operated as a passively managed index fund and, therefore, the adverse performance of a particular security necessarily will not result in the elimination of the security from the Fund’s portfolio. Ordinarily, the Adviser will not sell the Fund’s portfolio securities except to reflect additions or deletions of the securities that comprise the Index, or as may be necessary to raise cash to pay Fund shareholders who sell Fund shares. As such, the Fund will be negatively affected by declines in the securities represented by the Index. Also, there is no guarantee that the Adviser will be able to correlate the Fund’s performance with that of the Index. |
continued on page 6
This report must be accompanied or preceded by a currently effective Fund prospectus, which contains more complete information, including sales charges and expenses. Investors should read it carefully before investing. |
| NOT FDIC INSURED | MAY LOSE VALUE | NO BANK GUARANTEE |
8 Invesco Equally-Weighted S&P 500 Fund
Schedule of Investments(a)
August 31, 2017
| Shares | Value | |||||||
Common Stocks & Other Equity Interests–99.45% |
| |||||||
| Advertising–0.34% | ||||||||
Interpublic Group of Cos., Inc. (The) | 617,469 | $ | 12,435,826 | |||||
Omnicom Group Inc. | 182,361 | 13,199,289 | ||||||
| 25,635,115 | ||||||||
| Aerospace & Defense–2.35% | ||||||||
Arconic Inc. | 543,219 | 13,835,788 | ||||||
Boeing Co. (The) | 78,210 | 18,743,809 | ||||||
General Dynamics Corp. | 74,509 | 15,002,387 | ||||||
L3 Technologies, Inc. | 89,376 | 16,219,956 | ||||||
Lockheed Martin Corp. | 53,654 | 16,385,395 | ||||||
Northrop Grumman Corp. | 57,900 | 15,760,959 | ||||||
Raytheon Co. | 92,347 | 16,808,077 | ||||||
Rockwell Collins, Inc. | 141,560 | 18,551,438 | ||||||
Textron Inc. | 314,284 | 15,428,202 | ||||||
TransDigm Group, Inc. | 55,060 | 14,351,940 | ||||||
United Technologies Corp. | 123,196 | 14,749,025 | ||||||
| 175,836,976 | ||||||||
| Agricultural & Farm Machinery–0.18% | ||||||||
Deere & Co. | 118,002 | 13,679,972 | ||||||
| Agricultural Products–0.20% | ||||||||
Archer-Daniels-Midland Co. | 353,700 | 14,614,884 | ||||||
| Air Freight & Logistics–0.83% | ||||||||
C.H. Robinson Worldwide, Inc. | 219,016 | 15,469,100 | ||||||
Expeditors International of Washington, Inc. | 271,163 | 15,212,244 | ||||||
FedEx Corp. | 72,007 | 15,436,861 | ||||||
United Parcel Service, Inc.–Class B | 138,861 | 15,880,144 | ||||||
| 61,998,349 | ||||||||
| Airlines–0.85% | ||||||||
Alaska Air Group, Inc. | 165,267 | 12,338,834 | ||||||
American Airlines Group Inc. | 295,652 | 13,227,471 | ||||||
Delta Air Lines, Inc. | 280,370 | 13,230,660 | ||||||
Southwest Airlines Co. | 249,957 | 13,032,758 | ||||||
United Continental Holdings Inc.(b) | 188,538 | 11,681,814 | ||||||
| 63,511,537 | ||||||||
| Alternative Carriers–0.17% | ||||||||
Level 3 Communications, Inc.(b) | 238,333 | 12,972,465 | ||||||
| Apparel Retail–0.85% | ||||||||
Foot Locker, Inc. | 271,311 | 9,558,286 | ||||||
Gap, Inc. (The) | 651,006 | 15,376,762 | ||||||
L Brands, Inc. | 284,176 | 10,292,855 | ||||||
Ross Stores, Inc. | 239,871 | 14,020,460 | ||||||
TJX Cos., Inc. (The) | 201,716 | 14,584,067 | ||||||
| 63,832,430 | ||||||||
| Shares | Value | |||||||
| Apparel, Accessories & Luxury Goods–1.49% | ||||||||
Coach, Inc. | 318,118 | $ | 13,265,521 | |||||
Hanesbrands, Inc. | 673,424 | 16,337,266 | ||||||
Michael Kors Holdings Ltd.(b) | 416,315 | 17,576,819 | ||||||
PVH Corp. | 140,755 | 17,719,647 | ||||||
Ralph Lauren Corp. | 211,866 | 18,620,903 | ||||||
Under Armour, Inc.–Class A(b) | 352,556 | 5,693,780 | ||||||
Under Armour, Inc.–Class C(b) | 353,712 | 5,341,051 | ||||||
VF Corp. | 268,614 | 16,887,762 | ||||||
| 111,442,749 | ||||||||
| Application Software–1.47% | ||||||||
Adobe Systems Inc.(b) | 107,659 | 16,704,371 | ||||||
ANSYS, Inc.(b) | 119,357 | 15,375,569 | ||||||
Autodesk, Inc.(b) | 140,277 | 16,056,105 | ||||||
Citrix Systems, Inc.(b) | 189,766 | 14,841,599 | ||||||
Intuit Inc. | 106,000 | 14,993,700 | ||||||
salesforce.com, inc.(b) | 170,304 | 16,262,329 | ||||||
Synopsys, Inc.(b) | 198,351 | 15,951,387 | ||||||
| 110,185,060 | ||||||||
| Asset Management & Custody Banks–1.86% | ||||||||
Affiliated Managers Group, Inc. | 91,466 | 16,161,128 | ||||||
Ameriprise Financial, Inc. | 117,498 | 16,274,648 | ||||||
Bank of New York Mellon Corp. (The) | 300,860 | 15,728,961 | ||||||
BlackRock, Inc. | 35,513 | 14,880,302 | ||||||
Franklin Resources, Inc. | 340,258 | 14,709,353 | ||||||
Invesco Ltd.(c) | 433,055 | 14,195,543 | ||||||
Northern Trust Corp. | 161,988 | 14,335,938 | ||||||
State Street Corp. | 170,148 | 15,736,988 | ||||||
T. Rowe Price Group Inc. | 202,845 | 17,112,004 | ||||||
| 139,134,865 | ||||||||
| Auto Parts & Equipment–0.44% | ||||||||
BorgWarner, Inc. | 345,960 | 16,056,004 | ||||||
Delphi Automotive PLC | 173,444 | 16,720,001 | ||||||
| 32,776,005 | ||||||||
| Automobile Manufacturers–0.41% | ||||||||
Ford Motor Co. | 1,335,353 | 14,728,943 | ||||||
General Motors Co. | 432,803 | 15,814,622 | ||||||
| 30,543,565 | ||||||||
| Automotive Retail–0.71% | ||||||||
Advance Auto Parts, Inc. | 115,786 | 11,335,449 | ||||||
AutoZone, Inc.(b) | 24,510 | 12,952,065 | ||||||
CarMax, Inc.(b) | 249,328 | 16,742,375 | ||||||
O’Reilly Automotive, Inc.(b) | 63,830 | 12,518,978 | ||||||
| 53,548,867 | ||||||||
| Biotechnology–2.12% | ||||||||
AbbVie Inc. | 213,326 | 16,063,448 | ||||||
Alexion Pharmaceuticals, Inc.(b) | 141,036 | 20,084,937 | ||||||
See accompanying Notes to Financial Statements which are an integral part of the financial statements.
9 Invesco Equally-Weighted S&P 500 Fund
| Shares | Value | |||||||
| Biotechnology–(continued) | ||||||||
Amgen Inc. | 90,591 | $ | 16,104,362 | |||||
Biogen Inc.(b) | 57,187 | 18,103,117 | ||||||
Celgene Corp.(b) | 125,750 | 17,470,448 | ||||||
Gilead Sciences, Inc. | 229,713 | 19,229,275 | ||||||
Incyte Corp.(b) | 124,852 | 17,155,913 | ||||||
Regeneron Pharmaceuticals, Inc.(b) | 31,237 | 15,521,665 | ||||||
Vertex Pharmaceuticals Inc.(b) | 121,167 | 19,452,150 | ||||||
| 159,185,315 | ||||||||
| Brewers–0.20% | ||||||||
Molson Coors Brewing Co.–Class B | 170,051 | 15,262,077 | ||||||
| Broadcasting–0.63% | ||||||||
CBS Corp.–Class B | 244,810 | 15,682,529 | ||||||
Discovery Communications, Inc.–Class A(b) | 240,424 | 5,339,817 | ||||||
Discovery Communications, Inc.–Class C(b) | 339,826 | 7,139,744 | ||||||
Scripps Networks Interactive Inc.–Class A | 221,167 | 18,942,953 | ||||||
| 47,105,043 | ||||||||
| Building Products–0.94% | ||||||||
A.O. Smith Corp. | 214,610 | 11,951,631 | ||||||
Allegion PLC | 192,444 | 15,147,267 | ||||||
Fortune Brands Home & Security, Inc. | 234,756 | 14,679,293 | ||||||
Johnson Controls International PLC | 353,279 | 13,986,315 | ||||||
Masco Corp. | 399,314 | 14,682,776 | ||||||
| 70,447,282 | ||||||||
| Cable & Satellite–0.61% | ||||||||
Charter Communications, Inc.–Class A(b) | 44,653 | 17,796,007 | ||||||
Comcast Corp.–Class A | 365,261 | 14,833,249 | ||||||
DISH Network Corp.–Class A(b) | 228,582 | 13,095,463 | ||||||
| 45,724,719 | ||||||||
| Casinos & Gaming–0.41% | ||||||||
MGM Resorts International | 437,236 | 14,411,299 | ||||||
Wynn Resorts Ltd. | 114,687 | 15,940,346 | ||||||
| 30,351,645 | ||||||||
| Commodity Chemicals–0.22% | ||||||||
LyondellBasell Industries N.V.–Class A | 181,515 | 16,443,444 | ||||||
| Communications Equipment–1.01% | ||||||||
Cisco Systems, Inc. | 473,780 | 15,260,454 | ||||||
F5 Networks, Inc.(b) | 114,945 | 13,722,134 | ||||||
Harris Corp. | 136,277 | 16,748,443 | ||||||
Juniper Networks, Inc. | 519,485 | 14,405,319 | ||||||
Motorola Solutions, Inc. | 172,478 | 15,198,762 | ||||||
| 75,335,112 | ||||||||
| Computer & Electronics Retail–0.19% | ||||||||
Best Buy Co., Inc. | 255,676 | 13,872,980 | ||||||
| Construction & Engineering–0.58% | ||||||||
Fluor Corp. | 320,657 | 12,367,741 | ||||||
| Shares | Value | |||||||
| Construction & Engineering–(continued) | ||||||||
Jacobs Engineering Group, Inc. | 270,472 | $ | 14,738,019 | |||||
Quanta Services, Inc.(b) | 454,371 | 16,325,550 | ||||||
| 43,431,310 | ||||||||
| Construction Machinery & Heavy Trucks–0.62% | ||||||||
Caterpillar Inc. | 140,317 | 16,485,844 | ||||||
Cummins Inc. | 93,339 | 14,876,370 | ||||||
PACCAR Inc. | 232,189 | 15,401,096 | ||||||
| 46,763,310 | ||||||||
| Construction Materials–0.36% | ||||||||
Martin Marietta Materials, Inc. | 63,292 | 13,417,271 | ||||||
Vulcan Materials Co. | 114,036 | 13,828,005 | ||||||
| 27,245,276 | ||||||||
| Consumer Electronics–0.20% | ||||||||
Garmin Ltd. | 286,422 | 14,750,733 | ||||||
| Consumer Finance–0.99% | ||||||||
American Express Co. | 185,063 | 15,933,925 | ||||||
Capital One Financial Corp. | 185,618 | 14,777,049 | ||||||
Discover Financial Services | 245,376 | 14,464,915 | ||||||
Navient Corp. | 973,950 | 12,856,140 | ||||||
Synchrony Financial | 517,856 | 15,944,786 | ||||||
| 73,976,815 | ||||||||
| Copper–0.24% | ||||||||
Freeport-McMoRan Inc.(b) | 1,202,467 | 17,772,462 | ||||||
| Data Processing & Outsourced Services–2.31% | ||||||||
Alliance Data Systems Corp. | 61,577 | 13,885,613 | ||||||
Automatic Data Processing, Inc. | 148,460 | 15,806,536 | ||||||
Fidelity National Information Services, Inc. | 175,658 | 16,322,141 | ||||||
Fiserv, Inc.(b) | 120,970 | 14,965,199 | ||||||
Global Payments Inc. | 166,806 | 15,928,305 | ||||||
Mastercard Inc.–Class A | 120,793 | 16,101,707 | ||||||
Paychex, Inc. | 253,798 | 14,474,100 | ||||||
PayPal Holdings, Inc.(b) | 278,323 | 17,166,963 | ||||||
Total System Services, Inc. | 249,915 | 17,274,125 | ||||||
Visa Inc.–Class A | 157,175 | 16,270,756 | ||||||
Western Union Co. (The) | 781,824 | 14,792,110 | ||||||
| 172,987,555 | ||||||||
| Department Stores–0.58% | ||||||||
Kohl’s Corp. | 392,460 | 15,612,059 | ||||||
Macy’s, Inc. | 654,735 | 13,598,846 | ||||||
Nordstrom, Inc. | 315,150 | 14,061,993 | ||||||
| 43,272,898 | ||||||||
| Distillers & Vintners–0.43% | ||||||||
Brown-Forman Corp.–Class B | 302,329 | 16,035,530 | ||||||
Constellation Brands, Inc.–Class A | 82,112 | 16,430,611 | ||||||
| 32,466,141 | ||||||||
| Distributors–0.39% | ||||||||
Genuine Parts Co. | 162,236 | 13,438,008 | ||||||
See accompanying Notes to Financial Statements which are an integral part of the financial statements.
10 Invesco Equally-Weighted S&P 500 Fund
| Shares | Value | |||||||
| Distributors–(continued) | ||||||||
LKQ Corp.(b) | 464,888 | $ | 16,108,369 | |||||
| 29,546,377 | ||||||||
| Diversified Banks–1.00% | ||||||||
Bank of America Corp. | 627,904 | 15,000,627 | ||||||
Citigroup Inc. | 230,604 | 15,687,990 | ||||||
JPMorgan Chase & Co. | 170,911 | 15,534,101 | ||||||
U.S. Bancorp | 281,006 | 14,401,557 | ||||||
Wells Fargo & Co. | 276,253 | 14,108,241 | ||||||
| 74,732,516 | ||||||||
| Diversified Chemicals–0.41% | ||||||||
Dow Chemical Co. (The) | 229,571 | 15,300,907 | ||||||
Eastman Chemical Co. | 180,020 | 15,517,724 | ||||||
| 30,818,631 | ||||||||
| Diversified Support Services–0.22% | ||||||||
Cintas Corp. | 120,148 | 16,221,181 | ||||||
| Drug Retail–0.39% | ||||||||
CVS Health Corp. | 186,456 | 14,420,507 | ||||||
Walgreens Boots Alliance, Inc. | 183,510 | 14,956,065 | ||||||
| 29,376,572 | ||||||||
| Electric Utilities–2.85% | ||||||||
Alliant Energy Corp. | 360,215 | 15,395,589 | ||||||
American Electric Power Co., Inc. | 206,825 | 15,228,525 | ||||||
Duke Energy Corp. | 173,384 | 15,136,423 | ||||||
Edison International | 182,832 | 14,659,470 | ||||||
Entergy Corp. | 187,468 | 14,841,841 | ||||||
Eversource Energy | 238,562 | 15,029,406 | ||||||
Exelon Corp. | 405,856 | 15,369,767 | ||||||
FirstEnergy Corp. | 510,562 | 16,634,110 | ||||||
NextEra Energy, Inc. | 105,978 | 15,950,749 | ||||||
PG&E Corp. | 217,255 | 15,290,407 | ||||||
Pinnacle West Capital Corp. | 168,911 | 15,196,923 | ||||||
PPL Corp. | 379,144 | 14,877,610 | ||||||
Southern Co. (The) | 293,260 | 14,152,728 | ||||||
Xcel Energy, Inc. | 313,885 | 15,537,307 | ||||||
| 213,300,855 | ||||||||
| Electrical Components & Equipment–0.98% | ||||||||
Acuity Brands, Inc. | 83,883 | 14,829,676 | ||||||
AMETEK, Inc. | 238,256 | 15,069,692 | ||||||
Eaton Corp. PLC | 196,230 | 14,081,465 | ||||||
Emerson Electric Co. | 244,810 | 14,453,582 | ||||||
Rockwell Automation, Inc. | 91,669 | 15,039,216 | ||||||
| 73,473,631 | ||||||||
| Electronic Components–0.41% | ||||||||
Amphenol Corp.–Class A | 196,178 | 15,878,647 | ||||||
Corning Inc. | 513,384 | 14,764,924 | ||||||
| 30,643,571 | ||||||||
| Electronic Equipment & Instruments–0.20% | ||||||||
FLIR Systems, Inc. | 403,323 | 15,326,274 | ||||||
| Shares | Value | |||||||
| Electronic Manufacturing Services–0.20% | ||||||||
TE Connectivity Ltd. | 186,737 | $ | 14,864,265 | |||||
| Environmental & Facilities Services–0.59% | ||||||||
Republic Services, Inc. | 232,443 | 15,164,581 | ||||||
Stericycle, Inc.(b) | 188,108 | 13,523,084 | ||||||
Waste Management, Inc. | 204,576 | 15,774,856 | ||||||
| 44,462,521 | ||||||||
| Fertilizers & Agricultural Chemicals–0.80% | ||||||||
CF Industries Holdings, Inc. | 545,412 | 15,811,494 | ||||||
FMC Corp. | 193,976 | 16,724,611 | ||||||
Monsanto Co. | 126,466 | 14,821,815 | ||||||
Mosaic Co. (The) | 632,177 | 12,630,896 | ||||||
| 59,988,816 | ||||||||
| Financial Exchanges & Data–1.27% | ||||||||
CBOE Holdings Inc. | 165,598 | 16,707,182 | ||||||
CME Group Inc.–Class A | 119,482 | 15,030,836 | ||||||
Intercontinental Exchange, Inc. | 232,334 | 15,025,040 | ||||||
Moody’s Corp. | 127,224 | 17,051,833 | ||||||
Nasdaq, Inc. | 210,695 | 15,882,189 | ||||||
S&P Global Inc. | 101,235 | 15,623,597 | ||||||
| 95,320,677 | ||||||||
| Food Distributors–0.19% | ||||||||
Sysco Corp. | 269,296 | 14,183,820 | ||||||
| Food Retail–0.14% | ||||||||
Kroger Co. (The) | 482,861 | 10,560,170 | ||||||
| Footwear–0.20% | ||||||||
NIKE, Inc.–Class B | 278,010 | 14,681,708 | ||||||
| General Merchandise Stores–0.59% | ||||||||
Dollar General Corp. | 197,586 | 14,336,840 | ||||||
Dollar Tree, Inc.(b) | 197,167 | 15,702,380 | ||||||
Target Corp. | 261,203 | 14,243,400 | ||||||
| 44,282,620 | ||||||||
| Gold–0.22% | ||||||||
Newmont Mining Corp. | 433,308 | 16,613,029 | ||||||
| Health Care Distributors–0.88% | ||||||||
AmerisourceBergen Corp. | 161,373 | 12,950,183 | ||||||
Cardinal Health, Inc. | 197,639 | 13,332,727 | ||||||
Henry Schein, Inc.(b) | 80,012 | 13,896,484 | ||||||
McKesson Corp. | 90,962 | 13,581,536 | ||||||
Patterson Cos. Inc. | 322,187 | 12,404,200 | ||||||
| 66,165,130 | ||||||||
| Health Care Equipment–3.00% | ||||||||
Abbott Laboratories | 314,284 | 16,009,627 | ||||||
Baxter International Inc. | 252,290 | 15,652,072 | ||||||
Becton, Dickinson and Co. | 77,408 | 15,438,252 | ||||||
Boston Scientific Corp.(b) | 534,237 | 14,718,229 | ||||||
C.R. Bard, Inc. | 47,294 | 15,172,388 | ||||||
Danaher Corp. | 175,908 | 14,674,245 | ||||||
Edwards Lifesciences Corp.(b) | 127,991 | 14,547,457 | ||||||
See accompanying Notes to Financial Statements which are an integral part of the financial statements.
11 Invesco Equally-Weighted S&P 500 Fund
| Shares | Value | |||||||
| Health Care Equipment–(continued) | ||||||||
Hologic, Inc.(b) | 332,717 | $ | 12,842,876 | |||||
IDEXX Laboratories, Inc.(b) | 90,315 | 14,037,661 | ||||||
Intuitive Surgical, Inc.(b) | 16,219 | 16,294,743 | ||||||
Medtronic PLC | 171,800 | 13,850,516 | ||||||
ResMed Inc. | 225,188 | 17,470,085 | ||||||
Stryker Corp. | 104,760 | 14,809,921 | ||||||
Varian Medical Systems, Inc.(b) | 145,325 | 15,440,781 | ||||||
Zimmer Biomet Holdings, Inc. | 118,889 | 13,585,446 | ||||||
| 224,544,299 | ||||||||
| Health Care Facilities–0.38% | ||||||||
HCA Healthcare, Inc.(b) | 177,844 | 13,989,209 | ||||||
Universal Health Services, Inc.–Class B | 131,027 | 14,167,950 | ||||||
| 28,157,159 | ||||||||
| Health Care REIT’s–0.59% | ||||||||
HCP, Inc. | 476,667 | 14,209,443 | ||||||
Ventas, Inc. | 222,259 | 15,211,406 | ||||||
Welltower Inc. | 202,348 | 14,815,921 | ||||||
| 44,236,770 | ||||||||
| Health Care Services–0.99% | ||||||||
DaVita Inc.(b) | 230,532 | 13,499,954 | ||||||
Envision Healthcare Corp.(b) | 264,691 | 13,872,455 | ||||||
Express Scripts Holding Co.(b) | 242,020 | 15,203,697 | ||||||
Laboratory Corp. of America Holdings(b) | 105,699 | 16,581,002 | ||||||
Quest Diagnostics Inc. | 137,094 | 14,854,135 | ||||||
| 74,011,243 | ||||||||
| Health Care Supplies–0.62% | ||||||||
Align Technology, Inc.(b) | 99,848 | 17,647,135 | ||||||
Cooper Cos., Inc. (The) | 62,596 | 15,700,955 | ||||||
DENTSPLY SIRONA Inc. | 234,645 | 13,273,868 | ||||||
| 46,621,958 | ||||||||
| Health Care Technology–0.20% | ||||||||
Cerner Corp.(b) | 224,237 | 15,198,784 | ||||||
| Home Entertainment Software–0.44% | ||||||||
Activision Blizzard, Inc. | 256,116 | 16,790,965 | ||||||
Electronic Arts Inc.(b) | 134,550 | 16,347,825 | ||||||
| 33,138,790 | ||||||||
| Home Furnishings–0.38% | ||||||||
Leggett & Platt, Inc. | 284,884 | 13,096,118 | ||||||
Mohawk Industries, Inc.(b) | 61,885 | 15,664,331 | ||||||
| 28,760,449 | ||||||||
| Home Improvement Retail–0.38% | ||||||||
Home Depot, Inc. (The) | 97,165 | 14,562,119 | ||||||
Lowe’s Cos., Inc. | 188,969 | 13,962,919 | ||||||
| 28,525,038 | ||||||||
| Homebuilding–0.63% | ||||||||
D.R. Horton, Inc. | 442,072 | 15,980,903 | ||||||
Lennar Corp.–Class A | 285,816 | 14,793,836 | ||||||
| Shares | Value | |||||||
| Homebuilding–(continued) | ||||||||
PulteGroup Inc. | 634,065 | $ | 16,371,558 | |||||
| 47,146,297 | ||||||||
| Hotel and Resort REIT’s–0.20% | ||||||||
Host Hotels & Resorts Inc. | 808,622 | 14,652,231 | ||||||
| Hotels, Resorts & Cruise Lines–1.04% | ||||||||
Carnival Corp. | 234,645 | 16,303,134 | ||||||
Hilton Worldwide Holdings Inc. | 229,536 | 14,766,051 | ||||||
Marriott International Inc.–Class A | 145,112 | 15,030,701 | ||||||
Royal Caribbean Cruises Ltd. | 135,334 | 16,843,670 | ||||||
Wyndham Worldwide Corp. | 150,278 | 14,979,711 | ||||||
| 77,923,267 | ||||||||
| Household Appliances–0.18% | ||||||||
Whirlpool Corp. | 77,821 | 13,355,640 | ||||||
| Household Products–0.97% | ||||||||
Church & Dwight Co., Inc. | 280,423 | 14,068,822 | ||||||
Clorox Co. (The) | 108,373 | 15,012,912 | ||||||
Colgate-Palmolive Co. | 196,152 | 14,052,329 | ||||||
Kimberly-Clark Corp. | 115,418 | 14,229,885 | ||||||
Procter & Gamble Co. (The) | 168,585 | 15,555,338 | ||||||
| 72,919,286 | ||||||||
| Housewares & Specialties–0.18% | ||||||||
Newell Brands, Inc. | 279,159 | 13,477,797 | ||||||
| Human Resource & Employment Services–0.19% | ||||||||
Robert Half International, Inc. | 314,550 | 14,249,115 | ||||||
| Hypermarkets & Super Centers–0.37% | ||||||||
Costco Wholesale Corp. | 82,394 | 12,914,435 | ||||||
Wal-Mart Stores, Inc. | 187,137 | 14,609,786 | ||||||
| 27,524,221 | ||||||||
| Independent Power Producers & Energy Traders–0.48% | ||||||||
AES Corp. (The) | 1,268,130 | 14,000,155 | ||||||
NRG Energy, Inc. | 890,502 | 22,182,405 | ||||||
| 36,182,560 | ||||||||
| Industrial Conglomerates–0.78% | ||||||||
3M Co. | 71,823 | 14,674,875 | ||||||
General Electric Co. | 531,942 | 13,059,176 | ||||||
Honeywell International Inc. | 111,087 | 15,360,000 | ||||||
Roper Technologies, Inc. | 64,946 | 14,980,444 | ||||||
| 58,074,495 | ||||||||
| Industrial Gases–0.39% | ||||||||
Air Products and Chemicals, Inc. | 101,901 | 14,813,348 | ||||||
Praxair, Inc. | 109,129 | 14,354,829 | ||||||
| 29,168,177 | ||||||||
| Industrial Machinery–1.96% | ||||||||
Dover Corp. | 179,022 | 15,195,387 | ||||||
Flowserve Corp. | 314,217 | 12,342,444 | ||||||
Fortive Corp. | 235,575 | 15,305,308 | ||||||
Illinois Tool Works Inc. | 102,640 | 14,114,026 | ||||||
See accompanying Notes to Financial Statements which are an integral part of the financial statements.
12 Invesco Equally-Weighted S&P 500 Fund
| Shares | Value | |||||||
| Industrial Machinery–(continued) | ||||||||
Ingersoll-Rand PLC | 168,681 | $ | 14,403,671 | |||||
Parker-Hannifin Corp. | 94,640 | 15,226,630 | ||||||
Pentair PLC (United Kingdom) | 224,305 | 13,918,125 | ||||||
Snap-on Inc. | 94,358 | 13,924,410 | ||||||
Stanley Black & Decker Inc. | 106,167 | 15,288,048 | ||||||
Xylem, Inc. | 275,383 | 17,093,023 | ||||||
| 146,811,072 | ||||||||
| Industrial REIT’s–0.43% | ||||||||
Duke Realty Corp. | 533,537 | 15,856,720 | ||||||
Prologis, Inc. | 260,151 | 16,483,167 | ||||||
| 32,339,887 | ||||||||
| Insurance Brokers–0.81% | ||||||||
Aon PLC | 112,050 | 15,592,878 | ||||||
Arthur J. Gallagher & Co. | 256,780 | 14,867,562 | ||||||
Marsh & McLennan Cos., Inc. | 189,984 | 14,833,951 | ||||||
Willis Towers Watson PLC | 102,034 | 15,148,988 | ||||||
| 60,443,379 | ||||||||
| Integrated Oil & Gas–0.58% | ||||||||
Chevron Corp. | 139,684 | 15,032,792 | ||||||
Exxon Mobil Corp. | 180,962 | 13,812,830 | ||||||
Occidental Petroleum Corp. | 243,606 | 14,543,278 | ||||||
| 43,388,900 | ||||||||
| Integrated Telecommunication Services–0.55% | ||||||||
AT&T Inc. | 383,152 | 14,352,874 | ||||||
CenturyLink Inc. | 569,225 | 11,225,117 | ||||||
Verizon Communications Inc. | 318,118 | 15,260,120 | ||||||
| 40,838,111 | ||||||||
| Internet & Direct Marketing Retail–1.05% | ||||||||
Amazon.com, Inc.(b)(d) | 15,191 | 14,896,295 | ||||||
Expedia, Inc. | 103,505 | 15,356,002 | ||||||
Netflix Inc.(b) | 94,047 | 16,430,951 | ||||||
Priceline Group Inc. (The)(b) | 8,068 | 14,942,581 | ||||||
TripAdvisor Inc.(b) | 396,544 | 16,944,325 | ||||||
| 78,570,154 | ||||||||
| Internet Software & Services–1.05% | ||||||||
Akamai Technologies, Inc.(b) | 308,798 | 14,559,826 | ||||||
Alphabet Inc.–Class A(b) | 7,761 | 7,413,618 | ||||||
Alphabet Inc.–Class C(b)(d) | 7,719 | 7,250,688 | ||||||
eBay Inc.(b) | 425,371 | 15,368,654 | ||||||
Facebook, Inc.–Class A(b) | 99,347 | 17,084,704 | ||||||
VeriSign, Inc.(b) | 160,971 | 16,700,741 | ||||||
| 78,378,231 | ||||||||
| Investment Banking & Brokerage–1.01% | ||||||||
Charles Schwab Corp. (The) | 359,953 | 14,362,125 | ||||||
E*TRADE Financial Corp.(b) | 402,340 | 16,499,963 | ||||||
Goldman Sachs Group, Inc. (The) | 66,815 | 14,949,188 | ||||||
Morgan Stanley | 330,939 | 15,057,725 | ||||||
Raymond James Financial, Inc. | 189,838 | 14,868,112 | ||||||
| 75,737,113 | ||||||||
| Shares | Value | |||||||
| IT Consulting & Other Services–1.23% | ||||||||
Accenture PLC–Class A | 118,124 | $ | 15,445,894 | |||||
Cognizant Technology Solutions Corp.–Class A | 224,136 | 15,862,105 | ||||||
CSRA Inc. | 472,575 | 14,890,838 | ||||||
DXC Technology Co. | 197,902 | 16,821,670 | ||||||
Gartner, Inc.(b) | 125,199 | 15,097,748 | ||||||
International Business Machines Corp. | 96,446 | 13,794,671 | ||||||
| 91,912,926 | ||||||||
| Leisure Products–0.33% | ||||||||
Hasbro, Inc. | 137,742 | 13,533,151 | ||||||
Mattel, Inc. | 667,377 | 10,824,855 | ||||||
| 24,358,006 | ||||||||
| Life & Health Insurance–1.57% | ||||||||
Aflac, Inc. | 190,544 | 15,729,407 | ||||||
Brighthouse Financial, Inc.(b) | 238,968 | 13,637,930 | ||||||
Lincoln National Corp. | 217,765 | 14,777,533 | ||||||
MetLife, Inc. | 313,793 | 14,694,926 | ||||||
Principal Financial Group, Inc. | 228,970 | 14,315,204 | ||||||
Prudential Financial, Inc. | 137,934 | 14,080,303 | ||||||
Torchmark Corp. | 193,622 | 14,903,085 | ||||||
Unum Group | 319,692 | 15,402,761 | ||||||
| 117,541,149 | ||||||||
| Life Sciences Tools & Services–1.50% | ||||||||
Agilent Technologies, Inc. | 251,012 | 16,245,497 | ||||||
Illumina, Inc.(b) | 85,376 | 17,455,977 | ||||||
Mettler-Toledo International Inc.(b) | 25,022 | 15,140,562 | ||||||
PerkinElmer, Inc. | 232,552 | 15,578,658 | ||||||
Quintiles IMS Holdings, Inc.(b) | 180,425 | 17,326,213 | ||||||
Thermo Fisher Scientific, Inc. | 84,961 | 15,899,601 | ||||||
Waters Corp.(b) | 80,341 | 14,740,967 | ||||||
| 112,387,475 | ||||||||
| Managed Health Care–1.30% | ||||||||
Aetna Inc. | 99,221 | 15,647,152 | ||||||
Anthem, Inc. | 79,512 | 15,587,532 | ||||||
Centene Corp.(b) | 191,773 | 17,039,031 | ||||||
Cigna Corp. | 89,135 | 16,227,918 | ||||||
Humana Inc. | 64,706 | 16,669,560 | ||||||
UnitedHealth Group Inc. | 81,904 | 16,290,706 | ||||||
| 97,461,899 | ||||||||
| Metal & Glass Containers–0.20% | ||||||||
Ball Corp. | 368,979 | 14,755,470 | ||||||
| Motorcycle Manufacturers–0.17% | ||||||||
Harley-Davidson, Inc. | 278,949 | 13,113,392 | ||||||
| Movies & Entertainment–0.75% | ||||||||
Time Warner Inc. | 149,838 | 15,148,622 | ||||||
Twenty-First Century Fox, Inc.–Class A | 362,660 | 10,005,789 | ||||||
Twenty-First Century Fox, Inc.–Class B | 167,869 | 4,549,250 | ||||||
Viacom Inc.–Class B | 419,843 | 12,007,510 | ||||||
See accompanying Notes to Financial Statements which are an integral part of the financial statements.
13 Invesco Equally-Weighted S&P 500 Fund
| Shares | Value | |||||||
| Movies & Entertainment–(continued) | ||||||||
Walt Disney Co. (The) | 140,715 | $ | 14,240,358 | |||||
| 55,951,529 | ||||||||
| Multi-Line Insurance–0.77% | ||||||||
American International Group, Inc. | 231,574 | 14,005,596 | ||||||
Assurant, Inc. | 146,168 | 13,840,648 | ||||||
Hartford Financial Services Group, Inc. (The) | 288,535 | 15,601,087 | ||||||
Loews Corp. | 313,092 | 14,583,825 | ||||||
| 58,031,156 | ||||||||
| Multi-Sector Holdings–0.40% | ||||||||
Berkshire Hathaway Inc.–Class B(b) | 87,425 | 15,837,913 | ||||||
Leucadia National Corp. | 587,914 | 13,921,804 | ||||||
| 29,759,717 | ||||||||
| Multi-Utilities–2.23% | ||||||||
Ameren Corp. | 264,033 | 15,839,340 | ||||||
CenterPoint Energy, Inc. | 526,291 | 15,588,739 | ||||||
CMS Energy Corp. | 316,357 | 15,355,969 | ||||||
Consolidated Edison, Inc. | 178,528 | 15,044,555 | ||||||
Dominion Energy, Inc. | 187,468 | 14,766,854 | ||||||
DTE Energy Co. | 136,377 | 15,317,865 | ||||||
NiSource Inc. | 576,735 | 15,496,869 | ||||||
Public Service Enterprise Group Inc. | 335,269 | 15,704,000 | ||||||
SCANA Corp. | 218,405 | 13,187,294 | ||||||
Sempra Energy | 129,238 | 15,241,037 | ||||||
WEC Energy Group, Inc. | 235,426 | 15,354,484 | ||||||
| 166,897,006 | ||||||||
| Office REIT’s–0.77% | ||||||||
Alexandria Real Estate Equities, Inc. | 125,283 | 15,198,081 | ||||||
Boston Properties, Inc. | 118,671 | 14,311,722 | ||||||
SL Green Realty Corp. | 139,973 | 13,490,598 | ||||||
Vornado Realty Trust | 196,787 | 14,658,664 | ||||||
| 57,659,065 | ||||||||
| Oil & Gas Drilling–0.16% | ||||||||
Helmerich & Payne, Inc. | 279,002 | 11,812,945 | ||||||
| Oil & Gas Equipment & Services–0.83% | ||||||||
Baker Hughes, a GE Co. | 267,647 | 9,073,233 | ||||||
Halliburton Co. | 331,382 | 12,913,957 | ||||||
National Oilwell Varco Inc. | 434,447 | 13,324,489 | ||||||
Schlumberger Ltd. | 213,296 | 13,546,429 | ||||||
TechnipFMC PLC (United Kingdom)(b) | 520,759 | 13,451,205 | ||||||
| 62,309,313 | ||||||||
| Oil & Gas Exploration & Production–2.84% | ||||||||
Anadarko Petroleum Corp. | 309,764 | 12,678,641 | ||||||
Apache Corp. | 307,457 | 11,941,630 | ||||||
Cabot Oil & Gas Corp. | 649,584 | 16,596,871 | ||||||
Chesapeake Energy Corp.(b) | 2,990,441 | 10,885,205 | ||||||
Cimarex Energy Co. | 148,788 | 14,832,676 | ||||||
Concho Resources Inc.(b) | 119,974 | 13,313,515 | ||||||
ConocoPhillips | 331,603 | 14,477,787 | ||||||
| Shares | Value | |||||||
| Oil & Gas Exploration & Production–(continued) | ||||||||
Devon Energy Corp. | 456,184 | $ | 14,324,178 | |||||
EOG Resources, Inc. | 164,992 | 14,022,670 | ||||||
EQT Corp. | 263,098 | 16,401,529 | ||||||
Hess Corp. | 326,719 | 12,709,369 | ||||||
Marathon Oil Corp. | 1,185,206 | 13,179,491 | ||||||
Newfield Exploration Co.(b) | 494,427 | 12,919,377 | ||||||
Noble Energy, Inc. | 510,387 | 12,131,899 | ||||||
Pioneer Natural Resources Co. | 87,709 | 11,371,472 | ||||||
Range Resources Corp. | 641,454 | 11,135,641 | ||||||
| 212,921,951 | ||||||||
| Oil & Gas Refining & Marketing–0.82% | ||||||||
Andeavor | 161,936 | 16,217,891 | ||||||
Marathon Petroleum Corp. | 271,658 | 14,248,462 | ||||||
Phillips 66 | 186,784 | 15,654,367 | ||||||
Valero Energy Corp. | 227,742 | 15,509,230 | ||||||
| 61,629,950 | ||||||||
| Oil & Gas Storage & Transportation–0.62% | ||||||||
Kinder Morgan, Inc. | 778,956 | 15,057,219 | ||||||
ONEOK, Inc. | 300,556 | 16,278,113 | ||||||
Williams Cos., Inc. (The) | 505,698 | 15,034,402 | ||||||
| 46,369,734 | ||||||||
| Packaged Foods & Meats–1.95% | ||||||||
Campbell Soup Co. | 262,866 | 12,144,409 | ||||||
Conagra Brands, Inc. | 383,448 | 12,446,722 | ||||||
General Mills, Inc. | 260,333 | 13,865,335 | ||||||
Hershey Co. (The) | 130,349 | 13,676,217 | ||||||
Hormel Foods Corp. | 427,450 | 13,139,813 | ||||||
JM Smucker Co. (The) | 116,879 | 12,244,244 | ||||||
Kellogg Co. | 204,548 | 13,389,712 | ||||||
Kraft Heinz Co. (The) | 163,629 | 13,213,042 | ||||||
McCormick & Co., Inc. | 142,360 | 13,542,707 | ||||||
Mondelez International, Inc.–Class A | 325,788 | 13,246,540 | ||||||
Tyson Foods, Inc.–Class A | 244,649 | 15,486,282 | ||||||
| �� | 146,395,023 | |||||||
| Paper Packaging–1.02% | ||||||||
Avery Dennison Corp. | 176,744 | 16,659,889 | ||||||
International Paper Co. | 270,767 | 14,586,218 | ||||||
Packaging Corp. of America | 139,648 | 15,697,832 | ||||||
Sealed Air Corp. | 336,712 | 14,943,279 | ||||||
WestRock Co. | 259,379 | 14,761,259 | ||||||
| 76,648,477 | ||||||||
| Personal Products–0.40% | ||||||||
Coty, Inc.–Class A | 793,089 | 13,149,416 | ||||||
Estee Lauder Cos. Inc. (The)–Class A | 154,255 | 16,503,742 | ||||||
| 29,653,158 | ||||||||
| Pharmaceuticals–1.79% | ||||||||
Allergan PLC | 63,962 | 14,678,000 | ||||||
Bristol-Myers Squibb Co. | 276,510 | 16,723,325 | ||||||
Eli Lilly and Co. | 183,396 | 14,908,261 | ||||||
See accompanying Notes to Financial Statements which are an integral part of the financial statements.
14 Invesco Equally-Weighted S&P 500 Fund
| Shares | Value | |||||||
| Pharmaceuticals–(continued) | ||||||||
Johnson & Johnson | 112,996 | $ | 14,957,280 | |||||
Merck & Co., Inc. | 230,819 | 14,740,101 | ||||||
Mylan N.V.(b) | 370,727 | 11,670,486 | ||||||
Perrigo Co. PLC | 207,808 | 16,408,520 | ||||||
Pfizer Inc. | 453,539 | 15,384,043 | ||||||
Zoetis Inc. | 237,457 | 14,888,554 | ||||||
| 134,358,570 | ||||||||
| Property & Casualty Insurance–1.20% | ||||||||
Allstate Corp. (The) | 170,109 | 15,394,865 | ||||||
Chubb Ltd. | 101,408 | 14,341,119 | ||||||
Cincinnati Financial Corp. | 207,055 | 15,910,106 | ||||||
Progressive Corp. (The) | 341,823 | 15,887,933 | ||||||
Travelers Cos., Inc. (The) | 118,680 | 14,381,642 | ||||||
XL Group Ltd. (Bermuda) | 349,130 | 14,300,365 | ||||||
| 90,216,030 | ||||||||
| Publishing–0.19% | ||||||||
News Corp.–Class A | 822,281 | 10,993,897 | ||||||
News Corp.–Class B | 258,037 | 3,535,107 | ||||||
| 14,529,004 | ||||||||
| Railroads–0.78% | ||||||||
CSX Corp. | 280,159 | 14,063,982 | ||||||
Kansas City Southern | 149,236 | 15,435,479 | ||||||
Norfolk Southern Corp. | 124,978 | 15,062,349 | ||||||
Union Pacific Corp. | 135,420 | 14,259,726 | ||||||
| 58,821,536 | ||||||||
| Real Estate Services–0.20% | ||||||||
CBRE Group, Inc.–Class A(b) | 425,371 | 15,347,386 | ||||||
| Regional Banks–2.31% | ||||||||
BB&T Corp. | 336,941 | 15,529,611 | ||||||
Citizens Financial Group, Inc. | 408,983 | 13,549,607 | ||||||
Comerica Inc. | 204,520 | 13,958,490 | ||||||
Fifth Third Bancorp | 593,075 | 15,497,050 | ||||||
Huntington Bancshares Inc. | 1,118,321 | 14,079,661 | ||||||
KeyCorp | 798,200 | 13,737,022 | ||||||
M&T Bank Corp. | 90,979 | 13,452,155 | ||||||
People’s United Financial, Inc. | 841,114 | 14,046,604 | ||||||
PNC Financial Services Group, Inc. (The) | 120,665 | 15,132,597 | ||||||
Regions Financial Corp. | 1,032,116 | 14,563,157 | ||||||
SunTrust Banks, Inc. | 262,819 | 14,481,327 | ||||||
Zions Bancorp. | 351,026 | 15,325,795 | ||||||
| 173,353,076 | ||||||||
| Reinsurance–0.20% | ||||||||
Everest Re Group, Ltd. | 58,153 | 14,682,469 | ||||||
| Research & Consulting Services–0.81% | ||||||||
Equifax Inc. | 109,669 | 15,624,542 | ||||||
IHS Markit Ltd.(b) | 320,865 | 15,029,317 | ||||||
Nielsen Holdings PLC | 394,543 | 15,327,995 | ||||||
Verisk Analytics, Inc.–Class A(b) | 185,618 | 15,044,339 | ||||||
| 61,026,193 | ||||||||
| Shares | Value | |||||||
| Residential REIT’s–1.18% | ||||||||
Apartment Investment & Management Co.–Class A | 335,042 | $ | 15,187,454 | |||||
AvalonBay Communities, Inc. | 76,221 | 14,308,968 | ||||||
Equity Residential | 219,761 | 14,756,951 | ||||||
Essex Property Trust, Inc. | 55,825 | 14,847,775 | ||||||
Mid-America Apartment Communities, Inc. | 138,641 | 14,759,721 | ||||||
UDR, Inc. | 369,529 | 14,345,116 | ||||||
| 88,205,985 | ||||||||
| Restaurants–0.91% | ||||||||
Chipotle Mexican Grill, Inc.(b) | 32,249 | 10,213,581 | ||||||
Darden Restaurants, Inc. | 161,338 | 13,244,236 | ||||||
McDonald’s Corp. | 98,114 | 15,695,297 | ||||||
Starbucks Corp. | 238,984 | 13,110,662 | ||||||
Yum! Brands, Inc. | 203,316 | 15,618,735 | ||||||
| 67,882,511 | ||||||||
| Retail REIT’s–1.38% | ||||||||
Federal Realty Investment Trust | 119,204 | 15,130,564 | ||||||
GGP Inc. | 637,328 | 13,224,556 | ||||||
Kimco Realty Corp. | 801,212 | 15,719,780 | ||||||
Macerich Co. (The) | 254,712 | 13,441,152 | ||||||
Realty Income Corp. | 268,711 | 15,467,005 | ||||||
Regency Centers Corp. | 238,295 | 15,327,134 | ||||||
Simon Property Group, Inc. | 95,516 | 14,981,685 | ||||||
| 103,291,876 | ||||||||
| Semiconductor Equipment–0.59% | ||||||||
Applied Materials, Inc. | 332,196 | 14,988,684 | ||||||
KLA-Tencor Corp. | 145,738 | 13,654,193 | ||||||
Lam Research Corp. | 94,196 | 15,634,652 | ||||||
| 44,277,529 | ||||||||
| Semiconductors–2.43% | ||||||||
Advanced Micro Devices, Inc.(b) | 1,210,300 | 15,733,900 | ||||||
Analog Devices, Inc. | 189,090 | 15,821,160 | ||||||
Broadcom Ltd. | 61,076 | 15,395,427 | ||||||
Intel Corp. | 416,199 | 14,596,099 | ||||||
Microchip Technology Inc. | 178,036 | 15,453,525 | ||||||
Micron Technology, Inc.(b) | 485,702 | 15,527,893 | ||||||
NVIDIA Corp. | 99,347 | 16,833,356 | ||||||
Qorvo, Inc.(b) | 197,455 | 14,457,655 | ||||||
QUALCOMM Inc. | 260,516 | 13,617,171 | ||||||
Skyworks Solutions, Inc. | 138,887 | 14,633,134 | ||||||
Texas Instruments Inc. | 183,714 | 15,215,194 | ||||||
Xilinx, Inc. | 227,254 | 15,012,399 | ||||||
| 182,296,913 | ||||||||
| Soft Drinks–0.82% | ||||||||
Coca-Cola Co. (The) | 327,945 | 14,937,895 | ||||||
Dr Pepper Snapple Group, Inc. | 162,609 | 14,805,549 | ||||||
Monster Beverage Corp.(b) | 296,951 | 16,575,805 | ||||||
PepsiCo, Inc. | 128,190 | 14,835,429 | ||||||
| 61,154,678 | ||||||||
| Specialized Consumer Services–0.20% | ||||||||
H&R Block, Inc. | 567,486 | 15,174,576 | ||||||
See accompanying Notes to Financial Statements which are an integral part of the financial statements.
15 Invesco Equally-Weighted S&P 500 Fund
| Shares | Value | |||||||
| Specialized REIT’s–1.89% | ||||||||
American Tower Corp.–Class A | 114,080 | $ | 16,889,544 | |||||
Crown Castle International Corp. | 145,624 | 15,791,467 | ||||||
Digital Realty Trust, Inc. | 131,154 | 15,520,764 | ||||||
Equinix, Inc. | 33,838 | 15,850,058 | ||||||
Extra Space Storage Inc. | 199,442 | 15,482,682 | ||||||
Iron Mountain Inc. | 446,187 | 17,588,692 | ||||||
Public Storage | 71,605 | 14,703,371 | ||||||
SBA Communications Corp.–Class A(b) | 97,879 | 15,029,320 | ||||||
Weyerhaeuser Co. | 447,261 | 14,585,181 | ||||||
| 141,441,079 | ||||||||
| Specialty Chemicals–0.97% | ||||||||
Albemarle Corp. | 128,790 | 14,973,125 | ||||||
Ecolab Inc. | 111,070 | 14,805,631 | ||||||
International Flavors & Fragrances Inc. | 108,326 | 14,824,413 | ||||||
PPG Industries, Inc. | 135,198 | 14,103,855 | ||||||
Sherwin-Williams Co. (The) | 42,113 | 14,287,678 | ||||||
| 72,994,702 | ||||||||
| Specialty Stores–0.97% | ||||||||
Signet Jewelers Ltd. | 249,831 | 15,756,841 | ||||||
Staples, Inc. | 1,606,755 | 16,413,002 | ||||||
Tiffany & Co. | 156,959 | 14,346,053 | ||||||
Tractor Supply Co. | 260,653 | 15,511,460 | ||||||
Ulta Beauty, Inc.(b) | 48,274 | 10,669,037 | ||||||
| 72,696,393 | ||||||||
| Steel–0.18% | ||||||||
Nucor Corp. | 248,577 | 13,699,078 | ||||||
| Systems Software–1.08% | ||||||||
CA, Inc. | 468,700 | 15,551,466 | ||||||
Microsoft Corp. | 211,354 | 15,802,938 | ||||||
Oracle Corp. | 330,057 | 16,611,769 | ||||||
Red Hat, Inc.(b) | 167,276 | 17,982,170 | ||||||
Symantec Corp. | 500,251 | 14,997,525 | ||||||
| 80,945,868 | ||||||||
| Technology Hardware, Storage & Peripherals–1.42% | ||||||||
Apple Inc. | 99,761 | 16,360,804 | ||||||
Hewlett Packard Enterprise Co. | 874,778 | 15,798,491 | ||||||
| Shares | Value | |||||||
| Technology Hardware, Storage & Peripherals–(continued) | ||||||||
HP Inc. | 834,971 | $ | 15,931,247 | |||||
NetApp, Inc. | 376,074 | 14,539,021 | ||||||
Seagate Technology PLC | 350,778 | 11,060,030 | ||||||
Western Digital Corp. | 172,799 | 15,252,968 | ||||||
Xerox Corp. | 535,391 | 17,277,067 | ||||||
| 106,219,628 | ||||||||
| Tires & Rubber–0.17% | ||||||||
Goodyear Tire & Rubber Co. (The) | 419,251 | 12,703,305 | ||||||
| Tobacco–0.36% | ||||||||
Altria Group, Inc. | 196,958 | 12,487,137 | ||||||
Philip Morris International Inc. | 123,729 | 14,467,632 | ||||||
| 26,954,769 | ||||||||
| Trading Companies & Distributors–0.59% | ||||||||
Fastenal Co. | 341,509 | 14,572,189 | ||||||
United Rentals, Inc.(b) | 134,843 | 15,919,564 | ||||||
W.W. Grainger, Inc. | 84,287 | 13,702,538 | ||||||
| 44,194,291 | ||||||||
| Trucking–0.22% | ||||||||
J.B. Hunt Transport Services, Inc. | 168,013 | 16,614,806 | ||||||
| Water Utilities–0.20% | ||||||||
American Water Works Co., Inc. | 187,515 | 15,169,963 | ||||||
Total Common Stocks & Other Equity Interests |
| 7,450,865,298 | ||||||
Money Market Funds–0.37% |
| |||||||
Government & Agency Portfolio–Institutional Class, 0.93%(e) | 16,680,279 | 16,680,279 | ||||||
Treasury Portfolio–Institutional Class, 0.90%(e) | 11,120,186 | 11,120,186 | ||||||
Total Money Market Funds |
| 27,800,465 | ||||||
TOTAL INVESTMENTS IN SECURITIES–99.82% |
| 7,478,665,763 | ||||||
OTHER ASSETS LESS LIABILITIES–0.18% |
| 13,139,370 | ||||||
NET ASSETS–100.00% |
| $ | 7,491,805,133 | |||||
Investment Abbreviations:
| REIT | – Real Estate Investment Trust |
Notes to Schedule of Investments:
| (a) | Industry and/or sector classifications used in this report are generally according to the Global Industry Classification Standard, which was developed by and is the exclusive property and a service mark of MSCI Inc. and Standard & Poor’s. |
| (b) | Non-income producing security. |
| (c) | The Fund’s Adviser is a subsidiary of Invesco Ltd. and therefore, Invesco Ltd. is considered to be affiliated with the Fund. See Note 5. |
| (d) | All or a portion of the value was pledged as collateral to cover margin requirements for open futures contracts. See Note 1I and Note 4. |
| (e) | The money market fund and the Fund are affiliated by having the same investment adviser. The rate shown is the 7-day SEC standardized yield as of August 31, 2017. |
| Open Futures Contracts — Equity Risk | ||||||||||||||||||||
| Number of Contracts | Expiration Month | Notional Value | Value | Unrealized Appreciation | ||||||||||||||||
Long Futures Contracts | ||||||||||||||||||||
E-Mini S&P 500 Index | 335 | September-2017 | $ | 41,374,175 | $ | 270,357 | $ | 270,357 | ||||||||||||
See accompanying Notes to Financial Statements which are an integral part of the financial statements.
16 Invesco Equally-Weighted S&P 500 Fund
Statement of Assets and Liabilities
August 31, 2017
Assets: | ||||
Investments in securities, at value (Cost $5,446,128,245) | $ | 7,436,669,755 | ||
Investments in affiliates, at value (Cost $40,452,235) | 41,996,008 | |||
Other investments: | ||||
Variation margin receivable — futures | 242,307 | |||
Cash | 307,571 | |||
Receivable for: | ||||
Investments sold | 15,046,791 | |||
Fund shares sold | 11,438,274 | |||
Dividends | 14,610,598 | |||
Fund expenses absorbed | 11,755 | |||
Investment for trustee deferred compensation and retirement plans | 145,051 | |||
Other assets | 175,255 | |||
Total assets | 7,520,643,365 | |||
Liabilities: |
| |||
Payable for: | ||||
Investments purchased | 15,026,384 | |||
Fund shares reacquired | 8,825,208 | |||
Accrued fees to affiliates | 3,982,031 | |||
Accrued trustees’ and officers’ fees and benefits | 22,759 | |||
Accrued other operating expenses | 752,627 | |||
Trustee deferred compensation and retirement plans | 229,223 | |||
Total liabilities | 28,838,232 | |||
Net assets applicable to shares outstanding | $ | 7,491,805,133 | ||
Net assets consist of: |
| |||
Shares of beneficial interest | $ | 5,442,549,274 | ||
Undistributed net investment income | 79,252,651 | |||
Undistributed net realized gain (loss) | (22,352,432 | ) | ||
Net unrealized appreciation | 1,992,355,640 | |||
| $ | 7,491,805,133 | |||
Net Assets: |
| |||
Class A | $ | 2,103,145,891 | ||
Class B | $ | 2,971,207 | ||
Class C | $ | 1,126,360,793 | ||
Class R | $ | 132,316,027 | ||
Class Y | $ | 3,318,342,800 | ||
Class R6 | $ | 808,668,415 | ||
Shares outstanding, no par value, |
| |||
Class A | 37,232,679 | |||
Class B | 53,097 | |||
Class C | 20,839,922 | |||
Class R | 2,356,282 | |||
Class Y | 58,159,518 | |||
Class R6 | 14,150,555 | |||
Class A: | ||||
Net asset value per share | $ | 56.49 | ||
Maximum offering price per share | ||||
(Net asset value of $56.49 ¸ 94.50%) | $ | 59.78 | ||
Class B: | ||||
Net asset value and offering price per share | $ | 55.96 | ||
Class C: | ||||
Net asset value and offering price per share | $ | 54.05 | ||
Class R: | ||||
Net asset value and offering price per share | $ | 56.15 | ||
Class Y: | ||||
Net asset value and offering price per share | $ | 57.06 | ||
Class R6: | ||||
Net asset value and offering price per share | $ | 57.15 | ||
See accompanying Notes to Financial Statements which are an integral part of the financial statements.
17 Invesco Equally-Weighted S&P 500 Fund
Statement of Operations
For the year ended August 31, 2017
Investment income: |
| |||
Dividends (net of foreign withholding taxes of $25,914) | $ | 129,367,655 | ||
Dividends from affiliates | 802,547 | |||
Total investment income | 130,170,202 | |||
Expenses: | ||||
Advisory fees | 7,267,961 | |||
Administrative services fees | 681,039 | |||
Custodian fees | 128,946 | |||
Distribution fees: | ||||
Class A | 5,228,663 | |||
Class B | 42,538 | |||
Class C | 10,560,078 | |||
Class R | 632,105 | |||
Transfer agent fees — A, B, C, R and Y | 7,540,283 | |||
Transfer agent fees — R6 | 10,704 | |||
Trustees’ and officers’ fees and benefits | 122,683 | |||
Registration and filing fees | 276,122 | |||
Licensing Fees | 1,372,052 | |||
Reports to shareholders | 727,387 | |||
Professional services fees | 69,582 | |||
Other | 74,505 | |||
Total expenses | 34,734,648 | |||
Less: Fees waived and expense offset arrangement(s) | (97,949 | ) | ||
Net expenses | 34,636,699 | |||
Net investment income | 95,533,503 | |||
Realized and unrealized gain from: | ||||
Net realized gain from: | ||||
Investment securities | 61,282,776 | |||
Futures contracts | 9,339,035 | |||
| 70,621,811 | ||||
Change in net unrealized appreciation (depreciation) of: | ||||
Investment securities | 625,957,326 | |||
Futures contracts | (358,847 | ) | ||
| 625,598,479 | ||||
Net realized and unrealized gain | 696,220,290 | |||
Net increase in net assets resulting from operations | $ | 791,753,793 | ||
See accompanying Notes to Financial Statements which are an integral part of the financial statements.
18 Invesco Equally-Weighted S&P 500 Fund
Statement of Changes in Net Assets
For the years ended August 31, 2017 and 2016
| 2017 | 2016 | |||||||
Operations: | ||||||||
Net investment income | $ | 95,533,503 | $ | 78,041,885 | ||||
Net realized gain | 70,621,811 | 80,929,232 | ||||||
Change in net unrealized appreciation | 625,598,479 | 400,607,065 | ||||||
Net increase in net assets resulting from operations | 791,753,793 | 559,578,182 | ||||||
Distributions to shareholders from net investment income: | ||||||||
Class A | (20,999,805 | ) | (25,882,056 | ) | ||||
Class B | (17,426 | ) | (68,005 | ) | ||||
Class C | (4,661,267 | ) | (7,024,603 | ) | ||||
Class R | (982,859 | ) | (1,158,685 | ) | ||||
Class Y | (30,728,607 | ) | (32,793,334 | ) | ||||
Class R6 | (9,489,449 | ) | (607,413 | ) | ||||
Total distributions from net investment income | (66,879,413 | ) | (67,534,096 | ) | ||||
Distributions to shareholders from net realized gains: | ||||||||
Class A | (6,137,516 | ) | (23,879,186 | ) | ||||
Class B | (14,620 | ) | (107,081 | ) | ||||
Class C | (3,083,934 | ) | (11,061,008 | ) | ||||
Class R | (362,361 | ) | (1,242,285 | ) | ||||
Class Y | (7,372,985 | ) | (26,041,641 | ) | ||||
Class R6 | (2,093,339 | ) | (449,730 | ) | ||||
Total distributions from net realized gains | (19,064,755 | ) | (62,780,931 | ) | ||||
Share transactions–net: | ||||||||
Class A | (74,416,480 | ) | 10,681,087 | |||||
Class B | (3,001,676 | ) | (3,860,004 | ) | ||||
Class C | 78,514,976 | 118,995,185 | ||||||
Class R | 7,998,736 | 13,093,576 | ||||||
Class Y | 911,342,045 | 21,075,608 | ||||||
Class R6 | 52,009,981 | 460,763,193 | ||||||
Net increase in net assets resulting from share transactions | 972,447,582 | 620,748,645 | ||||||
Net increase in net assets | 1,678,257,207 | 1,050,011,800 | ||||||
Net assets: | ||||||||
Beginning of year | 5,813,547,926 | 4,763,536,126 | ||||||
End of year (includes undistributed net investment income of $79,252,651 and $47,005,520, respectively) | $ | 7,491,805,133 | $ | 5,813,547,926 | ||||
Notes to Financial Statements
August 31, 2017
NOTE 1—Significant Accounting Policies
Invesco Equally-Weighted S&P 500 Fund (the “Fund”) is a series portfolio of AIM Counselor Series Trust (Invesco Counselor Series Trust) (the “Trust”). The Trust is a Delaware statutory trust registered under the Investment Company Act of 1940, as amended (the “1940 Act”), as an open-end series management investment company consisting of fourteen separate portfolios, each authorized to issue an unlimited number of shares of beneficial interest. The assets, liabilities and operations of each portfolio are accounted for separately. Information presented in these financial statements pertains only to the Fund. Matters affecting each portfolio or class will be voted on exclusively by the shareholders of such portfolio or class.
The Fund’s investment objective is total return through growth of capital and current income.
The Fund currently consists of six different classes of shares: Class A, Class B, Class C, Class R, Class Y and Class R6. Class Y shares are available only to certain investors. Class A shares are sold with a front-end sales charge unless certain waiver criteria are met and under certain circumstances load waived shares may be subject to contingent deferred sales charges (“CDSC”). Class C shares are sold with a CDSC. Class R, Class Y and Class R6 shares are sold at net asset value. Effective November 30, 2010, new or additional investments in Class B shares are no longer permitted. Existing shareholders of Class B shares may continue to reinvest dividends and capital gains distributions in Class B shares until they convert to Class A shares. Also, shareholders in Class B shares will be able to exchange those shares for Class B shares of other Invesco Funds offering such shares until they
19 Invesco Equally-Weighted S&P 500 Fund
convert to Class A shares. Generally, Class B shares will automatically convert to Class A shares on or about the month-end, which is at least eight years after the date of purchase. Redemption of Class B shares prior to the conversion date will be subject to a CDSC.
The Fund is an investment company and accordingly follows the investment company accounting and reporting guidance in accordance with Financial Accounting Standards Board Accounting Standards Codification Topic 946, Financial Services — Investment Companies.
The following is a summary of the significant accounting policies followed by the Fund in the preparation of its financial statements.
| A. | Security Valuations — Securities, including restricted securities, are valued according to the following policy. |
A security listed or traded on an exchange (except convertible securities) is valued at its last sales price or official closing price as of the close of the customary trading session on the exchange where the security is principally traded, or lacking any sales or official closing price on a particular day, the security may be valued at the closing bid price on that day. Securities traded in the over-the-counter market are valued based on prices furnished by independent pricing services or market makers. When such securities are valued by an independent pricing service they may be considered fair valued. Futures contracts are valued at the final settlement price set by an exchange on which they are principally traded. Listed options are valued at the mean between the last bid and asked prices from the exchange on which they are principally traded. Options not listed on an exchange are valued by an independent source at the mean between the last bid and asked prices. For purposes of determining net asset value (“NAV”) per share, futures and option contracts generally are valued 15 minutes after the close of the customary trading session of the New York Stock Exchange (“NYSE”).
Investments in open-end and closed-end registered investment companies that do not trade on an exchange are valued at the end-of-day net asset value per share. Investments in open-end and closed-end registered investment companies that trade on an exchange are valued at the last sales price or official closing price as of the close of the customary trading session on the exchange where the security is principally traded.
Debt obligations (including convertible securities) and unlisted equities are fair valued using an evaluated quote provided by an independent pricing service. Evaluated quotes provided by the pricing service may be determined without exclusive reliance on quoted prices, and may reflect appropriate factors such as institution-size trading in similar groups of securities, developments related to specific securities, dividend rate (for unlisted equities), yield (for debt obligations), quality, type of issue, coupon rate (for debt obligations), maturity (for debt obligations), individual trading characteristics and other market data. Pricing services generally value debt obligations assuming orderly transactions of institutional round lot size, but a Fund may hold or transact in the same securities in smaller, odd lot sizes. Odd lots often trade at lower prices than institutional round lots. Debt obligations are subject to interest rate and credit risks. In addition, all debt obligations involve some risk of default with respect to interest and/or principal payments.
Foreign securities’ (including foreign exchange contracts) prices are converted into U.S. dollar amounts using the applicable exchange rates as of the close of the NYSE. If market quotations are available and reliable for foreign exchange-traded equity securities, the securities will be valued at the market quotations. Because trading hours for certain foreign securities end before the close of the NYSE, closing market quotations may become unreliable. If between the time trading ends on a particular security and the close of the customary trading session on the NYSE, events occur that the investment adviser determines are significant and make the closing price unreliable, the Fund may fair value the security. If the event is likely to have affected the closing price of the security, the security will be valued at fair value in good faith using procedures approved by the Board of Trustees. Adjustments to closing prices to reflect fair value may also be based on a screening process of an independent pricing service to indicate the degree of certainty, based on historical data, that the closing price in the principal market where a foreign security trades is not the current value as of the close of the NYSE. Foreign securities’ prices meeting the approved degree of certainty that the price is not reflective of current value will be priced at the indication of fair value from the independent pricing service. Multiple factors may be considered by the independent pricing service in determining adjustments to reflect fair value and may include information relating to sector indices, American Depositary Receipts and domestic and foreign index futures. Foreign securities may have additional risks including exchange rate changes, potential for sharply devalued currencies and high inflation, political and economic upheaval, the relative lack of issuer information, relatively low market liquidity and the potential lack of strict financial and accounting controls and standards.
Securities for which market prices are not provided by any of the above methods may be valued based upon quotes furnished by independent sources. The last bid price may be used to value equity securities. The mean between the last bid and asked prices is used to value debt obligations, including corporate loans.
Securities for which market quotations are not readily available or became unreliable are valued at fair value as determined in good faith by or under the supervision of the Trust’s officers following procedures approved by the Board of Trustees. Issuer specific events, market trends, bid/asked quotes of brokers and information providers and other market data may be reviewed in the course of making a good faith determination of a security’s fair value.
The Fund may invest in securities that are subject to interest rate risk, meaning the risk that the prices will generally fall as interest rates rise and, conversely, the prices will generally rise as interest rates fall. Specific securities differ in their sensitivity to changes in interest rates depending on their individual characteristics. Changes in interest rates may result in increased market volatility, which may affect the value and/or liquidity of certain Fund investments.
Valuations change in response to many factors including the historical and prospective earnings of the issuer, the value of the issuer’s assets, general economic conditions, interest rates, investor perceptions and market liquidity. Because of the inherent uncertainties of valuation, the values reflected in the financial statements may materially differ from the value received upon actual sale of those investments.
| B. | Securities Transactions and Investment Income — Securities transactions are accounted for on a trade date basis. Realized gains or losses on sales are computed on the basis of specific identification of the securities sold. Interest income (net of withholding tax, if any) is recorded on the accrual basis from settlement date. Dividend income (net of withholding tax, if any) is recorded on the ex-dividend date. |
The Fund may periodically participate in litigation related to Fund investments. As such, the Fund may receive proceeds from litigation settlements. Any proceeds received are included in the Statement of Operations as realized gain (loss) for investments no longer held and as unrealized gain (loss) for investments still held.
Brokerage commissions and mark ups are considered transaction costs and are recorded as an increase to the cost basis of securities purchased and/or a reduction of proceeds on a sale of securities. Such transaction costs are included in the determination of net realized and unrealized gain (loss) from investment securities reported in the Statement of Operations and the Statement of Changes in Net Assets and the net realized and unrealized gains (losses) on securities per share in the Financial Highlights. Transaction costs are included in the calculation of the Fund’s net asset value and, accordingly, they reduce the Fund’s total returns. These transaction costs are not considered operating expenses and are not reflected in net investment income reported in the Statement of Operations and the Statement of Changes in Net Assets, or the net
20 Invesco Equally-Weighted S&P 500 Fund
investment income per share and the ratios of expenses and net investment income reported in the Financial Highlights, nor are they limited by any expense limitation arrangements between the Fund and the investment adviser.
The Fund allocates income and realized and unrealized capital gains and losses to a class based on the relative net assets of each class.
| C. | Country Determination — For the purposes of making investment selection decisions and presentation in the Schedule of Investments, the investment adviser may determine the country in which an issuer is located and/or credit risk exposure based on various factors. These factors include the laws of the country under which the issuer is organized, where the issuer maintains a principal office, the country in which the issuer derives 50% or more of its total revenues and the country that has the primary market for the issuer’s securities, as well as other criteria. Among the other criteria that may be evaluated for making this determination are the country in which the issuer maintains 50% or more of its assets, the type of security, financial guarantees and enhancements, the nature of the collateral and the sponsor organization. Country of issuer and/or credit risk exposure has been determined to be the United States of America, unless otherwise noted. |
| D. | Distributions — Distributions from net investment income and net realized capital gain, if any, are generally declared and paid annually and recorded on the ex-dividend date. The Fund may elect to treat a portion of the proceeds from redemptions as distributions for federal income tax purposes. |
| E. | Federal Income Taxes — The Fund intends to comply with the requirements of Subchapter M of the Internal Revenue Code of 1986, as amended (the “Internal Revenue Code”), necessary to qualify as a regulated investment company and to distribute substantially all of the Fund’s taxable earnings to shareholders. As such, the Fund will not be subject to federal income taxes on otherwise taxable income (including net realized capital gain) that is distributed to shareholders. Therefore, no provision for federal income taxes is recorded in the financial statements. |
The Fund recognizes the tax benefits of uncertain tax positions only when the position is more likely than not to be sustained. Management has analyzed the Fund’s uncertain tax positions and concluded that no liability for unrecognized tax benefits should be recorded related to uncertain tax positions. Management is not aware of any tax positions for which it is reasonably possible that the total amounts of unrecognized tax benefits will change materially in the next 12 months.
The Fund files tax returns in the U.S. Federal jurisdiction and certain other jurisdictions. Generally, the Fund is subject to examinations by such taxing authorities for up to three years after the filing of the return for the tax period.
| F. | Expenses — Fees provided for under the Rule 12b-1 plan of a particular class of the Fund are charged to the operations of such class. Transfer agency fees and expenses and other shareholder recordkeeping fees and expenses attributable to Class R6 are charged to such class. Transfer agency fees and expenses and other shareholder recordkeeping fees and expenses relating to all other classes are allocated among those classes based on relative net assets. All other expenses are allocated among the classes based on relative net assets. |
| G. | Accounting Estimates — The preparation of financial statements in conformity with accounting principles generally accepted in the United States of America (“GAAP”) requires management to make estimates and assumptions that affect the reported amounts of assets and liabilities at the date of the financial statements and the reported amounts of revenues and expenses during the reporting period including estimates and assumptions related to taxation. Actual results could differ from those estimates by a significant amount. In addition, the Fund monitors for material events or transactions that may occur or become known after the period-end date and before the date the financial statements are released to print. |
| H. | Indemnifications — Under the Trust’s organizational documents, each Trustee, officer, employee or other agent of the Trust is indemnified against certain liabilities that may arise out of the performance of their duties to the Fund. Additionally, in the normal course of business, the Fund enters into contracts, including the Fund’s servicing agreements, that contain a variety of indemnification clauses. The Fund’s maximum exposure under these arrangements is unknown as this would involve future claims that may be made against the Fund that have not yet occurred. The risk of material loss as a result of such indemnification claims is considered remote. |
| I. | Futures Contracts — The Fund may enter into futures contracts to manage exposure to interest rate, equity and market price movements and/or currency risks. A futures contract is an agreement between two parties (“Counterparties”) to purchase or sell a specified underlying security, currency or commodity (or delivery of a cash settlement price, in the case of an index future) for a fixed price at a future date. The Fund currently invests only in exchange-traded futures and they are standardized as to maturity date and underlying financial instrument. Initial margin deposits required upon entering into futures contracts are satisfied by the segregation of specific securities or cash as collateral at the futures commission merchant (broker). During the period the futures contracts are open, changes in the value of the contracts are recognized as unrealized gains or losses by recalculating the value of the contracts on a daily basis. Subsequent or variation margin payments are received or made depending upon whether unrealized gains or losses are incurred. These amounts are reflected as receivables or payables on the Statement of Assets and Liabilities. When the contracts are closed or expire, the Fund recognizes a realized gain or loss equal to the difference between the proceeds from, or cost of, the closing transaction and the Fund’s basis in the contract. The net realized gain (loss) and the change in unrealized gain (loss) on futures contracts held during the period is included on the Statement of Operations. The primary risks associated with futures contracts are market risk and the absence of a liquid secondary market. If the Fund were unable to liquidate a futures contract and/or enter into an offsetting closing transaction, the Fund would continue to be subject to market risk with respect to the value of the contracts and continue to be required to maintain the margin deposits on the futures contracts. Futures contracts have minimal Counterparty risk since the exchange’s clearinghouse, as Counterparty to all exchange-traded futures, guarantees the futures against default. Risks may exceed amounts recognized in the Statement of Assets and Liabilities. |
| J. | Collateral — To the extent the Fund has designated or segregated a security as collateral and that security is subsequently sold, it is the Fund’s practice to replace such collateral no later than the next business day. |
21 Invesco Equally-Weighted S&P 500 Fund
NOTE 2—Advisory Fees and Other Fees Paid to Affiliates
The Trust has entered into a master investment advisory agreement with Invesco Advisers, Inc. (the “Adviser” or “Invesco”). Under the terms of the investment advisory agreement, the Fund accrues daily and pays monthly an advisory fee to the Adviser based on the annual rate of the Fund’s average daily net assets as follows:
| Average Daily Net Assets | Rate | |||
First $2 billion | 0.12% | |||
Over $2 billion | 0.10% | |||
For the year ended August 31, 2017, the effective advisory fees incurred by the Fund was 0.11%.
Under the terms of a master sub-advisory agreement between the Adviser and each of Invesco Asset Management Deutschland GmbH, Invesco Asset Management Limited, Invesco Asset Management (Japan) Limited, Invesco Hong Kong Limited, Invesco Senior Secured Management, Inc. and Invesco Canada Ltd. and a separate sub-advisory agreement with Invesco PowerShares Capital Management LLC (collectively, the “Affiliated Sub-Advisers”) the Adviser, not the Fund, will pay 40% of the fees paid to the Adviser to any such Affiliated Sub-Adviser(s) that provide(s) discretionary investment management services to the Fund based on the percentage of assets allocated to such Affiliated Sub-Adviser(s).
The Adviser has contractually agreed, through at least June 30, 2018, to waive advisory fees and/or reimburse expenses to the extent necessary to limit total annual fund operating expenses and/or reimbursement (excluding certain items discussed below) of Class A, Class B, Class C, Class R, Class Y and Class R6 shares to 2.00%, 2.75%, 2.75%, 2.25%, 1.75% and 1.75%, respectively, of the Fund’s average daily net assets (the “expense limits”). In determining the Adviser’s obligation to waive advisory fees and/or reimburse expenses, the following expenses are not taken into account, and could cause the net annual fund operating expenses and/or reimbursement to exceed the numbers reflected above: (1) interest; (2) taxes; (3) dividend expense on short sales; (4) extraordinary or non-routine items, including litigation expenses; and (5) expenses that the Fund has incurred but did not actually pay because of an expense offset arrangement. Unless Invesco continues the fee waiver agreement, it will terminate on June 30, 2018. During its term, the fee waiver agreement cannot be terminated or amended to increase the expense limits or reduce the advisory fee waivers without approval of the Board of Trustees. The Adviser did not waive fees and/or reimburse expenses during the period under this expense limit.
Further, the Adviser has contractually agreed, through at least June 30, 2019, to waive the advisory fee payable by the Fund in an amount equal to 100% of the net advisory fees the Adviser receives from the affiliated money market funds on investments by the Fund of uninvested cash in such affiliated money market funds.
For the year ended August 31, 2017, the Adviser waived advisory fees of $86,707.
The Trust has entered into a master administrative services agreement with Invesco pursuant to which the Fund has agreed to pay Invesco for certain administrative costs incurred in providing accounting services to the Fund. For the year ended August 31, 2017, expenses incurred under the agreement are shown in the Statement of Operations as Administrative services fees.
The Trust has entered into a transfer agency and service agreement with Invesco Investment Services, Inc. (“IIS”) pursuant to which the Fund has agreed to pay IIS a fee for providing transfer agency and shareholder services to the Fund and reimburse IIS for certain expenses incurred by IIS in the course of providing such services. IIS may make payments to intermediaries that provide omnibus account services, sub-accounting services and/or networking services. All fees payable by IIS to intermediaries that provide omnibus account services or sub-accounting services are charged back to the Fund, subject to certain limitations approved by the Trust’s Board of Trustees. For the year ended August 31, 2017, expenses incurred under the agreement are shown in the Statement of Operations as Transfer agent fees.
Shares of the Fund are distributed by Invesco Distributors, Inc. (“IDI”), an affiliate of the Adviser. The Fund has adopted a Plan of Distribution (the “Plan”) pursuant to Rule 12b-1 under the 1940 Act. The Plan provides that the Fund will reimburse IDI for distribution related expenses that IDI incurs up to a maximum of the following annual rates: (1) Class A — up to 0.25% of the average daily net assets of Class A shares; (2) Class B — up to 1.00% of the average daily net assets of Class B shares; (3) Class C — up to 1.00% of the average daily net assets of Class C shares; and (4) Class R — up to 0.50% of the average daily net assets of Class R shares. The fees are accrued daily and paid monthly.
In the case of Class B shares, provided that the Plan continues in effect, any cumulative expenses incurred by IDI, but not yet reimbursed to IDI, may be recovered through the payment of future distribution fees from the Fund pursuant to the Plan and contingent deferred sales charges paid by investors upon redemption of Class B shares.
For the year ended August 31, 2017, expenses incurred under these agreements are shown in the Statement of Operations as Distribution fees.
Front-end sales commissions and CDSC (collectively, the “sales charges”) are not recorded as expenses of the Fund. Front-end sales commissions are deducted from proceeds from the sales of Fund shares prior to investment in Class A shares of the Fund. CDSC are deducted from redemption proceeds prior to remittance to the shareholder. During the year ended August 31, 2017, IDI advised the Fund that IDI retained $659,441 in front-end sales commissions from the sale of Class A shares and $46,849, $142 and $134,152 from Class A, Class B and Class C shares, respectively, for CDSC imposed on redemptions by shareholders.
Certain officers and trustees of the Trust are officers and directors of the Adviser, IIS and/or IDI.
NOTE 3—Additional Valuation Information
GAAP defines fair value as the price that would be received to sell an asset or paid to transfer a liability in an orderly transaction between market participants at the measurement date, under current market conditions. GAAP establishes a hierarchy that prioritizes the inputs to valuation methods, giving the highest priority to readily available unadjusted quoted prices in an active market for identical assets (Level 1) and the lowest priority to significant unobservable inputs (Level 3), generally when market prices are not readily available or are unreliable. Based on the valuation inputs, the securities or other investments are tiered into one of three levels. Changes in valuation methods may result in transfers in or out of an investment’s assigned level:
| Level 1 — | Prices are determined using quoted prices in an active market for identical assets. |
22 Invesco Equally-Weighted S&P 500 Fund
| Level 2 — | Prices are determined using other significant observable inputs. Observable inputs are inputs that other market participants may use in pricing a security. These may include quoted prices for similar securities, interest rates, prepayment speeds, credit risk, yield curves, loss severities, default rates, discount rates, volatilities and others. |
| Level 3 — | Prices are determined using significant unobservable inputs. In situations where quoted prices or observable inputs are unavailable (for example, when there is little or no market activity for an investment at the end of the period), unobservable inputs may be used. Unobservable inputs reflect the Fund’s own assumptions about the factors market participants would use in determining fair value of the securities or instruments and would be based on the best available information. |
The following is a summary of the tiered valuation input levels, as of August 31, 2017. The level assigned to the securities valuations may not be an indication of the risk or liquidity associated with investing in those securities. Because of the inherent uncertainties of valuation, the values reflected in the financial statements may materially differ from the value received upon actual sale of those investments.
The Fund’s policy is to recognize transfers in and out of the valuation levels as of the end of the reporting period. During the year ended August 31, 2017, there were no transfers between valuation levels.
| Level 1 | Level 2 | Level 3 | Total | |||||||||||||
Common Stocks & Other Equity Interests | $ | 7,450,865,298 | $ | — | $ | — | $ | 7,450,865,298 | ||||||||
Money Market Funds | 27,800,465 | — | — | 27,800,465 | ||||||||||||
| 7,478,665,763 | — | — | 7,478,665,763 | |||||||||||||
Futures Contracts* | 270,357 | — | — | 270,357 | ||||||||||||
Total Investments | $ | 7,478,936,120 | $ | — | $ | — | $ | 7,478,936,120 | ||||||||
| * | Unrealized appreciation. |
NOTE 4—Derivative Investments
The Fund may enter into an International Swaps and Derivatives Association Master Agreement (“ISDA Master Agreement”) under which a Fund may trade OTC derivatives. An OTC transaction entered into under an ISDA Master Agreement typically involves a collateral posting arrangement, payment netting provisions and close-out netting provisions. These netting provisions allow for reduction of credit risk through netting of contractual obligations. The enforceability of the netting provisions of the ISDA Master Agreement depends on the governing law of the ISDA Master Agreement, among other factors.
For financial reporting purposes, the Fund does not offset OTC derivative assets or liabilities that are subject to ISDA Master Agreements in the Statement of Assets and Liabilities.
Value of Derivative Investments at Period-End
The table below summarizes the value of the Fund’s derivative investments, detailed by primary risk exposure, held as of August 31, 2017:
| Value | ||||
| Derivative Assets | Equity Risk | |||
Unrealized appreciation on futures contracts — Exchange-Traded(a) | $ | 270,357 | ||
Derivatives not subject to master netting agreements | (270,357 | ) | ||
Total Derivative Assets subject to master netting agreements | $ | — | ||
| (a) | Only current day’s variation margin receivable is reported within the Statement of Assets and Liabilities. |
Effect of Derivative Investments for the year ended August 31, 2017
The table below summarizes the gains (losses) on derivative investments, detailed by primary risk exposure, recognized in earnings during the period:
| Location of Gain (Loss) on Statement of Operations | ||||
| Equity Risk | ||||
Realized Gain: | ||||
Futures contracts | $ | 9,339,035 | ||
Change in Net Unrealized Appreciation (Depreciation): | ||||
Futures contracts | (358,847 | ) | ||
Total | $ | 8,980,188 | ||
The table below summarizes the average notional value of futures contracts outstanding during the period.
| Futures Contracts | ||||
Average notional value | $ | 52,181,685 | ||
23 Invesco Equally-Weighted S&P 500 Fund
NOTE 5—Investments in Affiliates
The Fund’s Adviser is a subsidiary of Invesco Ltd. and therefore, Invesco Ltd. is considered to be affiliated with the Fund. The following is a summary of the transactions in, and earnings from, investments in Invesco Ltd. for the year ended August 31, 2017.
Value 08/31/16 | Purchases at Cost | Proceeds from Sales | Change in Unrealized Appreciation | Realized Gain (Loss) | Value 08/31/17 | Dividend Income | ||||||||||||||||||||||
Invesco Ltd. | $ | 12,022,123 | $ | 3,033,688 | $ | (1,591,899 | ) | $ | 1,114,367 | $ | (382,736 | ) | $ | 14,195,543 | $ | 479,062 | ||||||||||||
NOTE 6—Expense Offset Arrangement(s)
The expense offset arrangement is comprised of transfer agency credits which result from balances in demand deposit accounts used by the transfer agent for clearing shareholder transactions. For the year ended August 31, 2017, the Fund received credits from this arrangement, which resulted in the reduction of the Fund’s total expenses of $11,242.
NOTE 7—Trustees’ and Officers’ Fees and Benefits
Trustees’ and Officers’ Fees and Benefits include amounts accrued by the Fund to pay remuneration to certain Trustees and Officers of the Fund. Trustees have the option to defer compensation payable by the Fund, and Trustees’ and Officers’ Fees and Benefits also include amounts accrued by the Fund to fund such deferred compensation amounts. Those Trustees who defer compensation have the option to select various Invesco Funds in which their deferral accounts shall be deemed to be invested. Finally, certain current Trustees were eligible to participate in a retirement plan that provided for benefits to be paid upon retirement to Trustees over a period of time based on the number of years of service. The Fund may have certain former Trustees who also participate in a retirement plan and receive benefits under such plan. Trustees’ and Officers’ Fees and Benefits include amounts accrued by the Fund to fund such retirement benefits. Obligations under the deferred compensation and retirement plans represent unsecured claims against the general assets of the Fund.
NOTE 8—Cash Balances
The Fund is permitted to temporarily carry a negative or overdrawn balance in its account with State Street Bank and Trust Company, the custodian bank. Such balances, if any at period-end, are shown in the Statement of Assets and Liabilities under the payable caption Amount due custodian. To compensate the custodian bank for such overdrafts, the overdrawn Fund may either (1) leave funds as a compensating balance in the account so the custodian bank can be compensated by earning the additional interest; or (2) compensate by paying the custodian bank at a rate agreed upon by the custodian bank and Invesco, not to exceed the contractually agreed upon rate.
NOTE 9—Distributions to Shareholders and Tax Components of Net Assets
Tax Character of Distributions to Shareholders Paid During the Fiscal Years Ended August 31, 2017 and 2016:
| 2017 | 2016 | |||||||
Ordinary income | $ | 75,986,459 | $ | 95,138,354 | ||||
Long-term capital gain | 9,957,709 | 35,176,673 | ||||||
Total distributions | $ | 85,944,168 | $ | 130,315,027 | ||||
Tax Components of Net Assets at Period-End:
| 2017 | ||||
Undistributed ordinary income | $ | 124,873,771 | ||
Undistributed long-term gain | 19,335,705 | |||
Net unrealized appreciation — investments | 1,905,266,313 | |||
Temporary book/tax differences | (219,930 | ) | ||
Shares of beneficial interest | 5,442,549,274 | |||
Total net assets | $ | 7,491,805,133 | ||
The difference between book-basis and tax-basis unrealized appreciation (depreciation) is due to differences in the timing of recognition of gains and losses on investments for tax and book purposes. The Fund’s net unrealized appreciation difference is attributable primarily to wash sales.
The temporary book/tax differences are a result of timing differences between book and tax recognition of income and/or expenses. The Fund’s temporary book/tax differences are the result of the trustee deferral of compensation and retirement plan benefits.
Capital loss carryforward is calculated and reported as of a specific date. Results of transactions and other activity after that date may affect the amount of capital loss carryforward actually available for the Fund to utilize. Capital losses generated in years beginning after December 22, 2010 can be carried forward for an unlimited period, whereas previous losses expire in eight tax years. Capital losses with an expiration period may not be used to offset capital gains until all net capital losses without an expiration date have been utilized. Capital loss carryforwards with no expiration date will retain their character as either short-term or long-term capital losses instead of as short-term capital losses as under prior law. The ability to utilize capital loss carryforwards in the future may be limited under the Internal Revenue Code and related regulations based on the results of future transactions.
The Fund does not have a capital loss carryforward as of August 31, 2017.
24 Invesco Equally-Weighted S&P 500 Fund
NOTE 10—Investment Transactions
The aggregate amount of investment securities (other than short-term securities, U.S. Treasury obligations and money market funds, if any) purchased and sold by the Fund during the year ended August 31, 2017 was $2,683,314,231 and $1,602,420,240, respectively. Cost of investments, including any derivatives, on a tax basis includes the adjustments for financial reporting purposes as of the most recently completed federal income tax reporting period-end.
| Unrealized Appreciation (Depreciation) of Investments on a Tax Basis | ||||
Aggregate unrealized appreciation of investments | $ | 2,088,762,581 | ||
Aggregate unrealized (depreciation) of investments | (183,496,268 | ) | ||
Net unrealized appreciation of investments | $ | 1,905,266,313 | ||
Cost of investments for tax purposes is $5,573,669,807.
NOTE 11—Reclassification of Permanent Differences
Primarily as a result of differing book/tax treatment of real estate investment trusts, on August 31, 2017, undistributed net investment income was increased by $3,593,041, undistributed net realized gain (loss) was decreased by $3,779,427 and shares of beneficial interest was increased by $186,386. This reclassification had no effect on the net assets of the Fund.
NOTE 12—Share Information
| Summary of Share Activity | ||||||||||||||||
| Years ended August 31, | ||||||||||||||||
| 2017(a) | 2016 | |||||||||||||||
| Shares | Amount | Shares | Amount | |||||||||||||
Sold: | ||||||||||||||||
Class A | 11,602,529 | $ | 619,572,878 | 10,197,085 | $ | 480,374,178 | ||||||||||
Class B | 7,610 | 403,684 | 14,964 | 710,438 | ||||||||||||
Class C | 6,231,866 | 320,330,692 | 6,525,395 | 295,986,771 | ||||||||||||
Class R | 1,065,624 | 56,866,286 | 968,737 | 45,385,789 | ||||||||||||
Class Y | 32,362,754 | 1,755,369,328 | 20,703,234 | 986,688,097 | ||||||||||||
Class R6 | 3,249,024 | 179,790,971 | 13,179,412 | 641,949,654 | ||||||||||||
Issued as reinvestment of dividends: | ||||||||||||||||
Class A | 462,800 | 24,593,197 | 970,969 | 44,120,853 | ||||||||||||
Class B | 557 | 29,469 | 3,471 | 157,254 | ||||||||||||
Class C | 137,723 | 7,041,797 | 379,367 | 16,608,691 | ||||||||||||
Class R | 25,394 | 1,343,848 | 52,982 | 2,399,007 | ||||||||||||
Class Y | 574,240 | 30,767,792 | 1,087,004 | 49,784,798 | ||||||||||||
Class R6 | 216,012 | 11,582,541 | �� | 23,058 | 1,056,728 | |||||||||||
Automatic conversion of Class B shares to Class A shares: | ||||||||||||||||
Class A | 43,921 | 2,363,578 | 61,680 | 2,910,819 | ||||||||||||
Class B | (44,235 | ) | (2,363,578 | ) | (62,060 | ) | (2,910,819 | ) | ||||||||
Reacquired: | ||||||||||||||||
Class A | (13,326,283 | ) | (720,946,133 | ) | (10,956,351 | ) | (516,724,763 | ) | ||||||||
Class B | (20,206 | ) | (1,071,251 | ) | (39,223 | ) | (1,816,877 | ) | ||||||||
Class C | (4,821,440 | ) | (248,857,513 | ) | (4,289,496 | ) | (193,600,277 | ) | ||||||||
Class R | (929,224 | ) | (50,211,398 | ) | (747,680 | ) | (34,691,220 | ) | ||||||||
Class Y | (15,958,395 | ) | (874,795,075 | ) | (21,746,471 | ) | (1,015,397,287 | ) | ||||||||
Class R6 | (2,545,180 | ) | (139,363,531 | ) | (3,745,034 | ) | (182,243,189 | ) | ||||||||
Net increase in share activity | 18,335,091 | $ | 972,447,582 | 12,581,043 | $ | 620,748,645 | ||||||||||
| (a) | There are entities that are record owners of more than 5% of the outstanding shares of the Fund and in the aggregate own 42% of the outstanding shares of the Fund. IDI has an agreement with these entities to sell Fund shares. The Fund, Invesco and/or Invesco affiliates may make payments to these entities, which are considered to be related to the Fund, for providing services to the Fund, Invesco and/or Invesco affiliates including but not limited to services such as securities brokerage, distribution, third party record keeping and account servicing. The Fund has no knowledge as to whether all or any portion of the shares owned of record by these entities are also owned beneficially. |
25 Invesco Equally-Weighted S&P 500 Fund
NOTE 13—Financial Highlights
The following schedule presents financial highlights for a share of the Fund outstanding throughout the periods indicated.
| Net asset value, beginning of period | Net investment income(a) | Net gains (losses) on securities (both realized and unrealized) | Total from investment operations | Dividends from net investment income | Distributions from net realized gains | Total distributions | Net asset value, end | Total return(b) | Net assets, end of period (000’s omitted) | Ratio of expenses to average net assets with fee waivers and/or expenses absorbed | Ratio of expenses to average net assets without fee waivers and/or expenses absorbed | Ratio of net investment income to average net assets | Portfolio turnover(c) | |||||||||||||||||||||||||||||||||||||||||||
Class A | ||||||||||||||||||||||||||||||||||||||||||||||||||||||||
Year ended 08/31/17 | $ | 50.91 | $ | 0.74 | $ | 5.54 | $ | 6.28 | $ | (0.54 | ) | $ | (0.16 | ) | $ | (0.70 | ) | $ | 56.49 | 12.41 | % | $ | 2,103,146 | 0.53 | %(d) | 0.53 | %(d) | 1.37 | %(d) | 24 | % | |||||||||||||||||||||||||
Year ended 08/31/16 | 46.87 | 0.75 | 4.57 | 5.32 | (0.66 | ) | (0.62 | ) | (1.28 | ) | 50.91 | 11.69 | 1,957,456 | 0.54 | 0.54 | 1.58 | 29 | |||||||||||||||||||||||||||||||||||||||
Year ended 08/31/15 | 48.54 | 0.67 | (1.18 | ) | (0.51 | ) | (0.49 | ) | (0.67 | ) | (1.16 | ) | 46.87 | (1.07 | ) | 1,789,491 | 0.54 | 0.54 | 1.36 | 21 | ||||||||||||||||||||||||||||||||||||
Year ended 08/31/14 | 40.07 | 0.59 | 9.45 | 10.04 | (0.48 | ) | (1.09 | ) | (1.57 | ) | 48.54 | 25.64 | 1,506,665 | 0.56 | 0.56 | 1.31 | 17 | |||||||||||||||||||||||||||||||||||||||
Year ended 08/31/13 | 33.40 | 0.55 | 7.47 | 8.02 | (0.51 | ) | (0.84 | ) | (1.35 | ) | 40.07 | 24.83 | 999,730 | 0.57 | 0.57 | 1.48 | 18 | |||||||||||||||||||||||||||||||||||||||
Class B | ||||||||||||||||||||||||||||||||||||||||||||||||||||||||
Year ended 08/31/17 | 50.49 | 0.33 | 5.49 | 5.82 | (0.19 | ) | (0.16 | ) | (0.35 | ) | 55.96 | 11.56 | 2,971 | 1.28 | (d) | 1.28 | (d) | 0.62 | (d) | 24 | ||||||||||||||||||||||||||||||||||||
Year ended 08/31/16 | 46.56 | 0.39 | 4.55 | 4.94 | (0.39 | ) | (0.62 | ) | (1.01 | ) | 50.49 | 10.85 | 5,522 | 1.29 | 1.29 | 0.83 | 29 | |||||||||||||||||||||||||||||||||||||||
Year ended 08/31/15 | 48.35 | 0.30 | (1.16 | ) | (0.86 | ) | (0.26 | ) | (0.67 | ) | (0.93 | ) | 46.56 | (1.81 | ) | 8,950 | 1.29 | 1.29 | 0.61 | 21 | ||||||||||||||||||||||||||||||||||||
Year ended 08/31/14 | 40.01 | 0.25 | 9.44 | 9.69 | (0.26 | ) | (1.09 | ) | (1.35 | ) | 48.35 | 24.70 | 15,851 | 1.31 | 1.31 | 0.56 | 17 | |||||||||||||||||||||||||||||||||||||||
Year ended 08/31/13 | 33.34 | 0.27 | 7.49 | 7.76 | (0.25 | ) | (0.84 | ) | (1.09 | ) | 40.01 | 23.90 | 22,925 | 1.32 | 1.32 | 0.73 | 18 | |||||||||||||||||||||||||||||||||||||||
Class C | ||||||||||||||||||||||||||||||||||||||||||||||||||||||||
Year ended 08/31/17 | 48.82 | 0.32 | 5.30 | 5.62 | (0.23 | ) | (0.16 | ) | (0.39 | ) | 54.05 | 11.56 | 1,126,361 | 1.28 | (d) | 1.28 | (d) | 0.62 | (d) | 24 | ||||||||||||||||||||||||||||||||||||
Year ended 08/31/16 | 45.03 | 0.41 | 4.39 | 4.80 | (0.39 | ) | (0.62 | ) | (1.01 | ) | 48.82 | 10.90 | (e) | 941,775 | 1.23 | (e) | 1.23 | (e) | 0.89 | (e) | 29 | |||||||||||||||||||||||||||||||||||
Year ended 08/31/15 | 46.79 | 0.29 | (1.12 | ) | (0.83 | ) | (0.26 | ) | (0.67 | ) | (0.93 | ) | 45.03 | (1.81 | ) | 750,898 | 1.29 | 1.29 | 0.61 | 21 | ||||||||||||||||||||||||||||||||||||
Year ended 08/31/14 | 38.75 | 0.25 | 9.14 | 9.39 | (0.26 | ) | (1.09 | ) | (1.35 | ) | 46.79 | 24.73 | 349,739 | 1.31 | 1.31 | 0.56 | 17 | |||||||||||||||||||||||||||||||||||||||
Year ended 08/31/13 | 32.33 | 0.26 | 7.24 | 7.50 | (0.24 | ) | (0.84 | ) | (1.08 | ) | 38.75 | 23.88 | 141,986 | 1.32 | 1.32 | 0.73 | 18 | |||||||||||||||||||||||||||||||||||||||
Class R | ||||||||||||||||||||||||||||||||||||||||||||||||||||||||
Year ended 08/31/17 | 50.63 | 0.60 | 5.50 | 6.10 | (0.42 | ) | (0.16 | ) | (0.58 | ) | 56.15 | 12.13 | 132,316 | 0.78 | (d) | 0.78 | (d) | 1.12 | (d) | 24 | ||||||||||||||||||||||||||||||||||||
Year ended 08/31/16 | 46.65 | 0.63 | 4.54 | 5.17 | (0.57 | ) | (0.62 | ) | (1.19 | ) | 50.63 | 11.38 | 111,116 | 0.79 | 0.79 | 1.33 | 29 | |||||||||||||||||||||||||||||||||||||||
Year ended 08/31/15 | 48.36 | 0.54 | (1.17 | ) | (0.63 | ) | (0.41 | ) | (0.67 | ) | (1.08 | ) | 46.65 | (1.33 | ) | 89,588 | 0.79 | 0.79 | 1.11 | 21 | ||||||||||||||||||||||||||||||||||||
Year ended 08/31/14 | 39.95 | 0.48 | 9.43 | 9.91 | (0.41 | ) | (1.09 | ) | (1.50 | ) | 48.36 | 25.35 | 65,777 | 0.81 | 0.81 | 1.06 | 17 | |||||||||||||||||||||||||||||||||||||||
Year ended 08/31/13 | 33.31 | 0.46 | 7.44 | 7.90 | (0.42 | ) | (0.84 | ) | (1.26 | ) | 39.95 | 24.48 | 29,320 | 0.82 | 0.82 | 1.23 | 18 | |||||||||||||||||||||||||||||||||||||||
Class Y | ||||||||||||||||||||||||||||||||||||||||||||||||||||||||
Year ended 08/31/17 | 51.40 | 0.88 | 5.59 | 6.47 | (0.65 | ) | (0.16 | ) | (0.81 | ) | 57.06 | 12.69 | 3,318,343 | 0.28 | (d) | 0.28 | (d) | 1.62 | (d) | 24 | ||||||||||||||||||||||||||||||||||||
Year ended 08/31/16 | 47.30 | 0.88 | 4.61 | 5.49 | (0.77 | ) | (0.62 | ) | (1.39 | ) | 51.40 | 11.97 | 2,116,654 | 0.29 | 0.29 | 1.83 | 29 | |||||||||||||||||||||||||||||||||||||||
Year ended 08/31/15 | 48.95 | 0.80 | (1.19 | ) | (0.39 | ) | (0.59 | ) | (0.67 | ) | (1.26 | ) | 47.30 | (0.83 | ) | 1,945,879 | 0.29 | 0.29 | 1.61 | 21 | ||||||||||||||||||||||||||||||||||||
Year ended 08/31/14 | 40.38 | 0.71 | 9.52 | 10.23 | (0.57 | ) | (1.09 | ) | (1.66 | ) | 48.95 | 25.95 | 1,021,247 | 0.31 | 0.31 | 1.56 | 17 | |||||||||||||||||||||||||||||||||||||||
Year ended 08/31/13 | 33.64 | 0.65 | 7.52 | 8.17 | (0.59 | ) | (0.84 | ) | (1.43 | ) | 40.38 | 25.16 | 481,948 | 0.32 | 0.32 | 1.73 | 18 | |||||||||||||||||||||||||||||||||||||||
Class R6 | ||||||||||||||||||||||||||||||||||||||||||||||||||||||||
Year ended 08/31/17 | 51.47 | 0.95 | 5.60 | 6.55 | (0.71 | ) | (0.16 | ) | (0.87 | ) | 57.15 | 12.84 | 808,668 | 0.16 | (d) | 0.16 | (d) | 1.74 | (d) | 24 | ||||||||||||||||||||||||||||||||||||
Year ended 08/31/16 | 47.37 | 0.97 | 4.58 | 5.55 | (0.83 | ) | (0.62 | ) | (1.45 | ) | 51.47 | 12.08 | 681,025 | 0.16 | 0.16 | 1.96 | 29 | |||||||||||||||||||||||||||||||||||||||
Year ended 08/31/15 | 48.99 | 0.87 | (1.20 | ) | (0.33 | ) | (0.62 | ) | (0.67 | ) | (1.29 | ) | 47.37 | (0.70 | ) | 178,731 | 0.16 | 0.16 | 1.74 | 21 | ||||||||||||||||||||||||||||||||||||
Year ended 08/31/14 | 40.39 | 0.78 | 9.49 | 10.27 | (0.58 | ) | (1.09 | ) | (1.67 | ) | 48.99 | 26.05 | 1,253 | 0.22 | 0.22 | 1.65 | 17 | |||||||||||||||||||||||||||||||||||||||
Year ended 08/31/13(f) | 34.93 | 0.62 | 6.27 | 6.89 | (0.59 | ) | (0.84 | ) | (1.43 | ) | 40.39 | 20.58 | 12 | 0.27 | (g) | 0.27 | (g) | 1.78 | (g) | 18 | ||||||||||||||||||||||||||||||||||||
| (a) | Calculated using average shares outstanding. |
| (b) | Includes adjustments in accordance with accounting principles generally accepted in the United States of America and as such, the net asset value for financial reporting purposes and the returns based upon those net asset values may differ from the net asset value and returns for shareholder transactions. Does not include sales charges and is not annualized for periods less than one year, if applicable. |
| (c) | Portfolio turnover is calculated at the fund level and is not annualized for periods less than one year, if applicable. |
| (d) | Ratios are based on average daily net assets (000’s omitted) of $2,091,465, $4,254, $1,056,008, $126,421, $2,865,909 and $723,905 for Class A, Class B, Class C, Class R, Class Y, and Class R6 shares, respectively. |
| (e) | The total return, ratio of expenses to average net assets and ratio of net investment income to average net assets reflect actual 12b-1 fees of 0.94% for the year ended August 31, 2016. |
| (f) | Commencement date of September 24, 2012. |
| (g) | Annualized. |
26 Invesco Equally-Weighted S&P 500 Fund
Report of Independent Registered Public Accounting Firm
To the Board of Trustees of AIM Counselor Series Trust (Invesco Counselor Series Trust)
and Shareholders of Invesco Equally-Weighted S&P 500 Fund:
In our opinion, the accompanying statement of assets and liabilities, including the schedule of investments, and the related statements of operations and of changes in net assets and the financial highlights present fairly, in all material respects, the financial position of Invesco Equally-Weighted S&P 500 Fund (one of the portfolios constituting AIM Counselor Series Trust (Invesco Counselor Series Trust), hereafter referred to as the “Fund”) as of August 31, 2017, the results of its operations for the year then ended, the changes in its net assets for each of the two years in the period then ended and the financial highlights for each of the periods indicated therein, in conformity with accounting principles generally accepted in the United States of America. These financial statements and financial highlights (hereafter referred to as “financial statements”) are the responsibility of the Fund’s management. Our responsibility is to express an opinion on these financial statements based on our audits. We conducted our audits of these financial statements in accordance with the standards of the Public Company Accounting Oversight Board (United States). Those standards require that we plan and perform the audit to obtain reasonable assurance about whether the financial statements are free of material misstatement. An audit includes examining, on a test basis, evidence supporting the amounts and disclosures in the financial statements, assessing the accounting principles used and significant estimates made by management, and evaluating the overall financial statement presentation. We believe that our audits, which included confirmation of securities as of August 31, 2017 by correspondence with the custodian, transfer agent and brokers, and when replies were not received from brokers, we performed other auditing procedures, provide a reasonable basis for our opinion.
PricewaterhouseCoopers LLP
Houston, Texas
October 30, 2017
27 Invesco Equally-Weighted S&P 500 Fund
Calculating your ongoing Fund expenses
Example
As a shareholder of the Fund, you incur two types of costs: (1) transaction costs, which may include sales charges (loads) on purchase payments or contingent deferred sales charges on redemptions, if any; and (2) ongoing costs, including management fees, distribution and/or service (12b-1) fees, and other Fund expenses. This example is intended to help you understand your ongoing costs (in dollars) of investing in the Fund and to compare these costs with ongoing costs of investing in other mutual funds. The example is based on an investment of $1,000 invested at the beginning of the period and held for the entire period March 1, 2017 through August 31, 2017.
Actual expenses
The table below provides information about actual account values and actual expenses. You may use the information in this table, together with the amount you invested, to estimate the expenses that you paid over the period. Simply divide your account value by $1,000 (for example, an $8,600 account value divided by $1,000 = 8.6), then multiply the result by the number in the table under the heading entitled “Actual Expenses Paid During Period” to estimate the expenses you paid on your account during this period.
Hypothetical example for comparison purposes
The table below also provides information about hypothetical account values and hypothetical expenses based on the Fund’s actual expense ratio and an assumed rate of return of 5% per year before expenses, which is not the Fund’s actual return.
The hypothetical account values and expenses may not be used to estimate the actual ending account balance or expenses you paid for the period. You may use this information to compare the ongoing costs of investing in the Fund and other funds. To do so, compare this 5% hypothetical example with the 5% hypothetical examples that appear in the shareholder reports of the other funds.
Please note that the expenses shown in the table are meant to highlight your ongoing costs only and do not reflect any transaction costs, such as sales charges (loads) on purchase payments or contingent deferred sales charges on redemptions, if any. Therefore, the hypothetical information is useful in comparing ongoing costs only, and will not help you determine the relative total costs of owning different funds. In addition, if these transaction costs were included, your costs would have been higher.
| Class | Beginning Account Value (03/01/17) | ACTUAL | HYPOTHETICAL (5% annual return before expenses) | Annualized Expense Ratio | ||||||||||||||||||||
| Ending Account Value (08/31/17)1 | Expenses Paid During Period2 | Ending Account Value (08/31/17) | Expenses Paid During Period2 | |||||||||||||||||||||
A | $ | 1,000.00 | $ | 1,029.40 | $ | 2.66 | $ | 1,022.58 | $ | 2.65 | 0.52 | % | ||||||||||||
B | 1,000.00 | 1,025.50 | 6.48 | 1,018.80 | 6.46 | 1.27 | ||||||||||||||||||
C | 1,000.00 | 1,025.40 | 6.48 | 1,018.80 | 6.46 | 1.27 | ||||||||||||||||||
R | 1,000.00 | 1,027.80 | 3.94 | 1,021.32 | 3.92 | 0.77 | ||||||||||||||||||
Y | 1,000.00 | 1,030.70 | 1.38 | 1,023.84 | 1.38 | 0.27 | ||||||||||||||||||
R6 | 1,000.00 | 1,031.20 | 0.77 | 1,024.45 | 0.77 | 0.15 | ||||||||||||||||||
| 1 | The actual ending account value is based on the actual total return of the Fund for the period March 1, 2017 through August 31, 2017, after actual expenses and will differ from the hypothetical ending account value which is based on the Fund’s expense ratio and a hypothetical annual return of 5% before expenses. |
| 2 | Expenses are equal to the Fund’s annualized expense ratio as indicated above multiplied by the average account value over the period, multiplied by 184/365 to reflect the most recent fiscal half year. |
28 Invesco Equally-Weighted S&P 500 Fund
Approval of Investment Advisory and Sub-Advisory Contracts
The Board of Trustees (the Board) of AIM Counselor Series Trust (Invesco Counselor Series Trust) is required under the Investment Company Act of 1940, as amended, to approve annually the renewal of Invesco Equally-Weighted S&P 500 Fund’s (the Fund) investment advisory agreements. During contract renewal meetings held on June 12-13, 2017, the Board as a whole, and the disinterested or “independent” Trustees, who comprise over 75% of the Board, voting separately, approved the continuance for the Fund of the Master Investment Advisory Agreement with Invesco Advisers, Inc. (Invesco Advisers and the investment advisory agreement) and the Master Intergroup Sub-Advisory Contract for Mutual Funds with Invesco Asset Management Deutschland GmbH, Invesco Asset Management Limited, Invesco Asset Management (Japan) Limited, Invesco Hong Kong Limited, Invesco Senior Secured Management, Inc. and Invesco Canada Ltd. and a separate Sub-Advisory Contract with Invesco PowerShares Capital Management LLC (collectively, the Affiliated Sub-Advisers and the sub-advisory contracts) for another year, effective July 1, 2017.
In evaluating the fairness and reasonableness of compensation under the Fund’s investment advisory agreement and sub-advisory contracts, the Board considered, among other things, the factors discussed below. The Board determined that continuation of the Fund’s investment advisory agreement and the sub-advisory contracts is in the best interest of the Fund and its shareholders and that the compensation payable to Invesco Advisers and the Affiliated Sub-Advisers under the agreements is fair and reasonable.
The Board’s Fund Evaluation Process
The Board’s Investments Committee has established three Sub-Committees, which meet throughout the year to review the performance of funds advised by Invesco Advisers (the Invesco Funds). Over the course of each year, the Sub-Committees meet with portfolio managers for their assigned Invesco Funds and other members of management to review the performance, investment objective(s), policies, strategies, limitations and investment risks of these funds. The Board had the benefit of reports from the Sub-Committees and Investments Committee throughout the year in considering approval of the continuance of each Invesco Fund’s investment advisory agreement and sub-advisory contracts for another year.
During the contract renewal process, the Board receives comparative performance and fee data regarding the Invesco Funds prepared by Invesco Advisers and Broadridge Financial Solutions, Inc. (Broadridge), an independent provider of investment company data. The Board also receives an independent written evaluation from the Senior Officer, an officer of
the Invesco Funds who reports directly to the independent Trustees. The Senior Officer’s evaluation is prepared as part of his responsibility to manage the process by which the Invesco Funds’ proposed management fees are negotiated during the annual contract renewal process to ensure they are negotiated in a manner that is at arms’ length and reasonable. In addition to meetings with Invesco Advisers and fund counsel, the independent Trustees also discuss the continuance of the investment advisory agreement and sub-advisory contracts in separate sessions with the Senior Officer and with independent legal counsel.
The Trustees recognized that the advisory fee rates for the Invesco Funds are, in most cases, the result of years of review and negotiation. The Trustees’ deliberations and conclusions in a particular year may be based in part on their deliberations and conclusions regarding these arrangements throughout the year and in prior years. The Trustees’ review and conclusions are based on the comprehensive consideration of all information presented to them and are not the result of any single determinative factor. Moreover, one Trustee may have weighed a particular piece of information or factor differently than another Trustee.
The discussion below is a summary of the Senior Officer’s independent written evaluation with respect to the Fund’s investment advisory agreement as well as a discussion of the material factors and related conclusions that formed the basis for the Board’s approval of the Fund’s investment advisory agreement and sub-advisory contracts. This information is current as of June 13, 2017, and does not reflect consideration of factors that became known to the Board after that date.
Factors and Conclusions and Summary of Independent Written Fee Evaluation
| A. | Nature, Extent and Quality of Services Provided by Invesco Advisers and the Affiliated Sub-Advisers |
The Board reviewed the advisory services provided to the Fund by Invesco Advisers under the Fund’s investment advisory agreement, the performance of Invesco Advisers in providing these services, and the credentials and experience of the officers and employees of Invesco Advisers who provide these services, including the Fund’s portfolio manager or managers. The Board’s review included consideration of Invesco Advisers’ investment process oversight, credit analysis and investment risk management. The Board also considered non-advisory services that Invesco Advisers and its affiliates provide to the Invesco Funds such as various back office support functions, trading operations, internal audit, valuation and legal and compliance.
In determining whether to continue the Fund’s investment advisory agreement, the Board considered the benefits of reapproving an existing relationship as contrasted with the greater uncertainty that may be associated with entering into a new relationship. The Board concluded that the nature, extent and quality of the services provided to the Fund by Invesco Advisers are appropriate and satisfactory.
The Board reviewed the services that may be provided by the Affiliated Sub-Advisers under the sub-advisory contracts and the credentials and experience of the officers and employees of the Affiliated Sub-Advisers who provide these services. The Board noted that the Affiliated Sub-Advisers have offices and personnel that are located in financial centers around the world. As a result, the Board noted that the Affiliated Sub-Advisers can provide research and investment analysis on the markets and economies of various countries in which the Fund may invest, make recommendations regarding securities and assist with security trades. The Board concluded that the sub-advisory contracts may benefit the Fund and its shareholders by permitting Invesco Advisers to use the resources and talents of the Affiliated Sub-Advisers in managing the Fund. The Board concluded that the nature, extent and quality of the services that may be provided by the Affiliated Sub-Advisers are appropriate and satisfactory.
| B. | Fund Investment Performance |
The Board considered Fund investment performance as a relevant factor in considering whether to approve the investment advisory agreement. The Board did not view Fund performance as a relevant factor in considering whether to approve the sub-advisory contracts for the Fund, as no Affiliated Sub-Adviser currently manages assets of the Fund.
The Board compared the Fund’s investment performance over multiple time periods ending December 31, 2016 to the performance of funds in the Broadridge performance universe and against the Lipper Multi-Cap Core Funds Index. The Board noted that performance of Class A shares of the Fund was in the first quintile of its performance universe for the one, three and five year periods (the first quintile being the best performing funds and the fifth quintile being the worst performing funds). The Board noted that performance of Class A shares of the Fund was above the performance of the Index for the one, three and five year periods. The Trustees also reviewed more recent Fund performance and this review did not change their conclusions.
| C. | Advisory and Sub-Advisory Fees |
The Board compared the Fund’s contractual management fee rate to the contractual management fee rates of funds in the Fund’s Broadridge expense group at a common asset level. The Board noted that the contractual
29 Invesco Equally-Weighted S&P 500 Fund
management fee rate for Class A shares of the Fund was below the median contractual management fee rate of funds in its expense group. The Board noted that the term “contractual management fee” for funds in the expense group may include both advisory and certain administrative services fees, but that Broadridge does not provide information on a fund by fund basis as to what is included. The Board noted that Invesco Advisers does not separately charge the Invesco Funds for the administrative services included in the term as defined by Broadridge. The Board also reviewed the methodology used by Broadridge in providing expense group information, which includes using each fund’s contractual management fee schedule (including any applicable breakpoints) as reported in the most recent prospectus or statement of additional information for each fund in the expense group.
The Board also compared the Fund’s effective advisory fee rate (the advisory fee rate after advisory fee waivers and before other expense limitations/waivers) to the effective advisory fee rates of other mutual funds advised by Invesco Advisers and its affiliates with investment strategies comparable to those of the Fund, based on asset balances as of December 31, 2016. The Board noted that the Fund’s rate was below the rate of one such mutual fund.
The Board noted that Invesco Advisers and the Affiliated Sub-Advisers do not manage other client accounts with investment strategies comparable to those of the Fund.
The Board also considered the services that may be provided by the Affiliated Sub-Advisers pursuant to the sub-advisory contracts, as well as the fees payable by Invesco Advisers to the Affiliated Sub-Advisers pursuant to the sub-advisory contracts. The Board also noted that the sub-advisory fees are not paid directly by the Fund, but rather, are payable by Invesco Advisers to the Affiliated Sub-Advisers.
| D. | Economies of Scale and Breakpoints |
The Board considered the extent to which there are economies of scale in the provision of advisory services to the Fund. The Board also considered that the Fund benefits from economies of scale through contractual breakpoints in the Fund’s advisory fee schedule. The Board noted that the Fund shares directly in economies of scale through lower fees charged by third party service providers based on the combined size of the Invesco Funds advised by Invesco Advisers.
| E. | Profitability and Financial Resources |
The Board reviewed information from Invesco Advisers concerning the costs of the advisory and other services that Invesco Advisers and its affiliates provide to the Fund and the Invesco Funds and the profitability of Invesco Advisers and its affiliates in providing these services. The Board noted that Invesco Advisers continues to operate at a net profit from services Invesco Advisers and its affiliates provide to the Invesco Funds. Invesco Advisers and its subsidiaries did not make a profit from managing the Fund. The Board received and accepted information from
Invesco Advisers demonstrating that Invesco Advisers and each Affiliated Sub-Adviser are financially sound and have the resources necessary to perform their obligations under the investment advisory agreement and sub-advisory contracts.
| F. | Collateral Benefits to Invesco Advisers and its Affiliates |
The Board considered various other benefits received by Invesco Advisers and its affiliates from the relationship with the Fund, including the fees received for providing transfer agency and distribution services to the Fund. The Board considered comparative information regarding fees charged for these services, including information provided by Broadridge and other independent sources. The Board considered the performance of Invesco Advisers and its affiliates in providing these services and the organizational structure employed to provide these services. The Board also considered that these services are provided to the Fund pursuant to written contracts that are reviewed and approved on an annual basis by the Board; and that the services are required for the operation of the Fund.
The Board considered the benefits realized by Invesco Advisers and the Affiliated Sub-Advisers as a result of portfolio brokerage transactions executed through “soft dollar” arrangements. The Board noted that soft dollar arrangements may result in the Fund bearing costs to purchase research that may be used by Invesco Advisers or the Affiliated Sub-Advisers with other clients and may reduce Invesco Adviser’s or the Affiliated Sub-Adviser’s expenses. The Board also considered that it receives periodic reports from the Chief Compliance Officer of the Invesco Funds demonstrating that these arrangements are consistent with regulatory requirements. The Board did not deem the soft dollar arrangements to be inappropriate.
The Board considered that the Fund’s uninvested cash and cash collateral from any securities lending arrangements may be invested in money market funds advised by Invesco Advisers pursuant to procedures approved by the Board. The Board noted that Invesco Advisers receives advisory fees from these affiliated money market funds attributable to such investments, although Invesco Advisers has contractually agreed to waive through varying periods the advisory fees payable by the Invesco Funds with respect to certain investments in the affiliated money market funds. The waiver is in an amount equal to 100% of the net advisory fee Invesco Advisers receives from the affiliated money market funds with respect to the Fund’s investment in the affiliated money market funds of uninvested cash, but not cash collateral. The Board concluded that the amount of advisory fees received by Invesco Advisers from the Fund’s investment of cash collateral from any securities lending arrangements in the affiliated money market funds is fair and reasonable.
The Board also considered that the Fund may use an affiliated broker to execute certain
trades for the Fund to, among other things, control information leakage, and was advised that such trades would be executed in compliance with rules under the federal securities laws and consistent with best execution obligations.
30 Invesco Equally-Weighted S&P 500 Fund
Tax Information
Form 1099-DIV, Form 1042-S and other year-end tax information provide shareholders with actual calendar year amounts that should be included in their tax returns. Shareholders should consult their tax advisors.
The following distribution information is being provided as required by the Internal Revenue Code or to meet a specific state’s requirement.
The Fund designates the following amounts or, if subsequently determined to be different, the maximum amount allowable for its fiscal year ended August 31, 2017:
Federal and State Income Tax | ||||
Long-Term Capital Gain Distributions | $ | 9,957,709 | ||
Qualified Dividend Income* | 92.21 | % | ||
Corporate Dividends Received Deduction* | 87.44 | % | ||
U.S. Treasury Obligations* | 0.00 | % | ||
| * | The above percentages are based on ordinary income dividends paid to shareholders during the Fund’s fiscal year. |
Non-Resident Alien Shareholders | ||||
Qualified Short-Term Gains | $ | 9,107,046 | ||
31 Invesco Equally-Weighted S&P 500 Fund
Proxy Results
A Special Joint Meeting (“Meeting”) of Shareholders of Invesco Equally-Weighted S&P 500 Fund, an investment portfolio of AIM Counselor Series Trust (Invesco Counselor Series Trust), a Delaware statutory trust (“Trust”), was held on March 9, 2017. The Meeting was held for the following purposes:
| (1) | Elect 15 trustees to the Board, each of whom will serve until his or her successor is elected and qualified. |
| (2) | Approve an amendment to the Trust’s Agreement and Declaration of Trust that would permit fund mergers and other significant transactions upon the Board’s approval but without shareholder approval of such transactions. |
The results of the voting on the above matters were as follows:
| Matters | Votes For | Votes Withheld | ||||||||||||||||
| (1)* | David C. Arch | 1,425,647,604 | 36,521,875 | |||||||||||||||
| James T. Bunch | 1,425,181,099 | 36,988,380 | ||||||||||||||||
| Bruce L. Crockett | 1,425,174,694 | 36,994,785 | ||||||||||||||||
| Jack M. Fields | 1,426,060,874 | 36,108,605 | ||||||||||||||||
| Martin L. Flanagan | 1,426,481,477 | 35,688,002 | ||||||||||||||||
| Cynthia Hostetler | 1,426,489,972 | 35,679,505 | ||||||||||||||||
| Dr. Eli Jones | 1,426,255,832 | 35,913,647 | ||||||||||||||||
| Dr. Prema Mathai-Davis | 1,425,363,789 | 36,805,689 | ||||||||||||||||
| Teresa M. Ressel | 1,426,514,880 | 35,654,598 | ||||||||||||||||
| Dr. Larry Soll | 1,424,932,245 | 37,237,234 | ||||||||||||||||
| Ann Barnett Stern | 1,426,260,049 | 35,909,429 | ||||||||||||||||
| Raymond Stickel, Jr. | 1,425,391,657 | 36,777,822 | ||||||||||||||||
| Philip A. Taylor | 1,426,285,212 | 35,884,267 | ||||||||||||||||
| Robert C. Troccoli | 1,426,075,097 | 36,094,382 | ||||||||||||||||
| Christopher L. Wilson | 1,426,594,956 | 35,574,523 | ||||||||||||||||
| Votes For | Votes Against | Votes Abstain | Broker Non-Votes | |||||||||||||||
| (2)* | Approve an amendment to the Trust’s Agreement and Declaration of Trust that would permit fund mergers and other significant transactions upon the Board’s approval but without shareholder approval of such transactions | 751,302,707 | 79,810,344 | 41,561,890 | 589,495,482 | |||||||||||||
The Meeting was adjourned until April 11, 2017, with respect to the following proposals:
| (3) | Approve changing the fundamental investment restriction regarding the purchase or sale of physical commodities. |
| 4(a) | Approve an amendment to the current Master Intergroup Sub-Advisory Contract to add Invesco PowerShares Capital Management LLC. |
| 4(b) | Approve an amendment to the current Master Intergroup Sub-Advisory Contract to add Invesco Asset Management (India) Private Limited. |
Invesco Equally-Weighted S&P 500 Fund did not receive sufficient shareholder votes to pass Proposals 3 and 4(b).
The results of the voting on the above matters were as follows:
| Matters | Votes For | Votes Against | Votes Abstain | Broker Non-Votes | ||||||||||||||
| (3) | Approve changing the fundamental investment restriction regarding the purchase or sale of physical commodities | 39,899,213 | 2,567,702 | 1,784,086 | 16,974,336 | |||||||||||||
| 4(a) | Approve an amendment to the current Master Intergroup Sub-Advisory Contract to add Invesco PowerShares Capital Management LLC | 41,187,598 | 1,348,665 | 1,730,192 | 16,958,882 | |||||||||||||
| 4(b) | Approve an amendment to the current Master Intergroup Sub-Advisory Contract to add Invesco Asset Management (India) Private Limited | 40,830,165 | 1,675,179 | 1,745,668 | 16,974,325 | |||||||||||||
| * | Each of proposal 1 and 2 required approval by a combined vote of all of the portfolios of AIM Counselor Series Trust (Invesco Counselor Series Trust). |
32 Invesco Equally-Weighted S&P 500 Fund
Trustees and Officers
The address of each trustee and officer is AIM Counselor Series Trust (Invesco Counselor Series Trust) (the “Trust”), 11 Greenway Plaza, Suite 1000, Houston, Texas 77046-1173. The trustees serve for the life of the Trust, subject to their earlier death, incapacitation, resignation, retirement or removal as more specifically provided in the Trust’s organizational documents. Each officer serves for a one year term or until their successors are elected and qualified. Column two below includes length of time served with predecessor entities, if any.
| Name, Year of Birth and Position(s) Held with the Trust | Trustee and/ or Officer Since | Principal Occupation(s) During Past 5 Years | Number of Overseen by | Other Directorship(s) Held by Trustee During Past 5 Years | ||||
| Interested Persons | ||||||||
| Martin L. Flanagan1 — 1960 Trustee | 2007 | Executive Director, Chief Executive Officer and President, Invesco Ltd. (ultimate parent of Invesco and a global investment management firm); Trustee, The Invesco Funds; Vice Chair, Investment Company Institute; and Member of Executive Board, SMU Cox School of Business
Formerly: Advisor to the Board, Invesco Advisers, Inc. (formerly known as Invesco Institutional (N.A.), Inc.); Chairman and Chief Executive Officer, Invesco Advisers, Inc. (registered investment adviser); Director, Chairman, Chief Executive Officer and President, Invesco Holding Company (US), Inc. (formerly IVZ Inc.) (holding company), Invesco Group Services, Inc. (service provider) and Invesco North American Holdings, Inc. (holding company); Director, Chief Executive Officer and President, Invesco Holding Company Limited (parent of Invesco and a global investment management firm); Director, Invesco Ltd.; Chairman, Investment Company Institute and President, Co-Chief Executive Officer, Co-President, Chief Operating Officer and Chief Financial Officer, Franklin Resources, Inc. (global investment management organization) | 144 | None | ||||
Philip A. Taylor2 — 1954 Trustee and Senior Vice President | 2006 | Head of the Americas and Senior Managing Director, Invesco Ltd.; Director, Invesco Advisers, Inc. (formerly known as Invesco Institutional (N.A.), Inc.) (registered investment adviser); Director, Chairman, Chief Executive Officer and President, Invesco Management Group, Inc. (formerly known as Invesco Aim Management Group, Inc.) (financial services holding company); Director and Chairman, Invesco Investment Services, Inc. (formerly known as Invesco Aim Investment Services, Inc.) (registered transfer agent); Chief Executive Officer, Invesco Corporate Class Inc. (corporate mutual fund company); Director, Chairman and Chief Executive Officer, Invesco Canada Ltd. (formerly known as Invesco Trimark Ltd./Invesco Trimark Ltèe) (registered investment adviser and registered transfer agent); Trustee and Senior Vice President, The Invesco Funds; Director, Invesco Investment Advisers LLC (formerly known as Van Kampen Asset Management).
Formerly: Co-Chairman, Co-President and Co-Chief Executive Officer, Invesco Advisers, Inc. (formerly known as Invesco Institutional (N.A.), Inc.) (registered investment adviser); Director, Chief Executive Officer and President, Van Kampen Exchange Corp; President and Principal Executive Officer, The Invesco Funds (other than AIM Treasurer’s Series Trust (Invesco Treasurer’s Series Trust), Short-Term Investments Trust and Invesco Management Trust); Executive Vice President, The Invesco Funds (AIM Treasurer’s Series Trust (Invesco Treasurer’s Series Trust), Short-Term Investments Trust and Invesco Management Trust only); Director and President, INVESCO Funds Group, Inc. (registered investment adviser and registered transfer agent); Director and Chairman, IVZ Distributors, Inc. (formerly known as INVESCO Distributors, Inc.) (registered broker dealer); Director, President and Chairman, Invesco Inc. (holding company), Invesco Canada Holdings Inc. (holding company), Trimark Investments Ltd./Placements Trimark Ltèe and Invesco Financial Services Ltd/Services Financiers Invesco Ltèe; Chief Executive Officer, Invesco Canada Fund Inc. (corporate mutual fund company); Director and Chairman, Van Kampen Investor Services Inc.; Director, Chief Executive Officer and President, 1371 Preferred Inc. (holding company) and Van Kampen Investments Inc.; Director and President, AIM GP Canada Inc. (general partner for limited partnerships) and Van Kampen Advisors, Inc.; Director and Chief Executive Officer, Invesco Trimark Dealer Inc. (registered broker dealer); Director, Invesco Distributors, Inc. (formerly known as Invesco Aim Distributors, Inc.) (registered broker dealer); Manager, Invesco PowerShares Capital Management LLC; Director, Chief Executive Officer and President, Invesco Advisers, Inc.; Director, Chairman, Chief Executive Officer and President, Invesco Aim Capital Management, Inc.; President, Invesco Trimark Dealer Inc. and Invesco Trimark Ltd./Invesco Trimark Ltèe; Director and President, AIM Trimark Corporate Class Inc. and AIM Trimark Canada Fund Inc.; Senior Managing Director, Invesco Holding Company Limited; Director and Chairman, Fund Management Company (former registered broker dealer); President and Principal Executive Officer, The Invesco Funds (AIM Treasurer’s Series Trust (Invesco Treasurer’s Series Trust), and Short-Term Investments Trust only); President, AIM Trimark Global Fund Inc. and AIM Trimark Canada Fund Inc. | 144 | None |
| 1 | Mr. Flanagan is considered an interested person (within the meaning of Section 2(a)(19) of the 1940 Act) of the Trust because he is an officer of the Adviser to the Trust, and an officer and a director of Invesco Ltd., ultimate parent of the Adviser. |
| 2 | Mr. Taylor is considered an interested person (within the meaning of Section 2(a)(19) of the 1940 Act) of the Trust because he is an officer and a director of the Adviser. |
T-1 Invesco Equally-Weighted S&P 500 Fund
Trustees and Officers—(continued)
| Name, Year of Birth and Position(s) Held with the Trust | Trustee and/ or Officer Since | Principal Occupation(s) During Past 5 Years | Number of Complex Overseen by Trustee | Other Directorship(s) Held by Trustee During | ||||
| Independent Trustees | ||||||||
Bruce L. Crockett — 1944 Trustee and Chair | 2003 | Chairman, Crockett Technologies Associates (technology consulting company)
Formerly: Director, Captaris (unified messaging provider); Director, President and Chief Executive Officer, COMSAT Corporation; Chairman, Board of Governors of INTELSAT (international communications company); ACE Limited (insurance company); Independent Directors Council and Investment Company Institute: Member of the Audit Committee, Investment Company Institute; Member of the Executive Committee and Chair of the Governance Committee, Independent Directors Council | 144 | Director and Chairman of the Audit Committee, ALPS (Attorneys Liability Protection Society) (insurance company); Director and Member of the Audit Committee, Ferroglobe PLC (metallurgical company) | ||||
David C. Arch — 1945 Trustee | 2010 | Chairman of Blistex Inc. (consumer health care products manufacturer); Member, World Presidents’ Organization | 144 | Board member of the Illinois Manufacturers’ Association | ||||
James T. Bunch — 1942 Trustee | 2000 | Managing Member, Grumman Hill Group LLC (family office/private equity investments)
Formerly: Chairman of the Board, Denver Film Society; Chairman of the Board of Trustees, Evans Scholarship Foundation; Chairman, Board of Governors, Western Golf Association | 144 | Trustee, Evans Scholarship Foundation | ||||
Jack M. Fields — 1952 Trustee | 2003 | Chief Executive Officer, Twenty First Century Group, Inc. (government affairs company); and Discovery Learning Alliance (non-profit)
Formerly: Owner and Chief Executive Officer, Dos Angeles Ranch L.P. (cattle, hunting, corporate entertainment); Director, Insperity, Inc. (formerly known as Administaff); Chief Executive Officer, Texana Timber LP (sustainable forestry company); Director of Cross Timbers Quail Research Ranch (non-profit); and member of the U.S. House of Representatives | 144 | None | ||||
Cynthia Hostetler — 1962 Trustee | 2017 | Non-Executive Director and Trustee of a number of public and private business corporations
Formerly: Head of Investment Funds and Private Equity, Overseas Private Investment Corporation; President, First Manhattan Bancorporation, Inc.; Attorney, Simpson Thacher & Bartlett LLP | 144 | Vulcan Materials Company (construction materials company); Trilinc Global Impact Fund; Aberdeen Investment Funds (4 portfolios); Artio Global Investment LLC (mutual fund complex); Edgen Group, Inc. (specialized energy and infrastructure products distributor) | ||||
Eli Jones — 1961 Trustee | 2016 | Professor and Dean, Mays Business School — Texas A&M University
Formerly: Professor and Dean, Walton College of Business, University of Arkansas and E.J. Ourso College of Business, Louisiana State University; Director, Arvest Bank | 144 | Insperity, Inc. (formerly known as Administaff) (human resources provider) | ||||
Prema Mathai-Davis — 1950 Trustee | 2003 | Retired.
Formerly: Chief Executive Officer, YWCA of the U.S.A. | 144 | None | ||||
Teresa M. Ressel — 1962 Trustee | 2017 | Non-executive director and trustee of a number of public and private business corporations
Formerly: Chief Financial Officer, Olayan America, The Olayan Group (international investor/commercial/industrial); Chief Executive Officer, UBS Securities LLC; Group Chief Operating Officer, Americas, UBS AG; Assistant Secretary for Management & Budget and CFO, US Department of the Treasury; Chief Compliance Officer, Kaiser Permanente; Program Manager, Hewlett-Packard; Nuclear Engineering, General Dynamics Corporation | 144 | Atlantic Power Corporation (power generation company); ON Semiconductor Corp. (semiconductor supplier) | ||||
Larry Soll — 1942 Trustee | 1997 | Retired.
Formerly: Chairman, Chief Executive Officer and President, Synergen Corp. (a biotechnology company) | 144 | None | ||||
Ann Barnett Stern — 1957 Trustee | 2017 | President and Chief Executive Officer, Houston Endowment Inc. (private philanthropic institution)
Formerly: Executive Vice President and General Counsel, Texas Children’s Hospital; Attorney, Beck, Redden and Secrest, LLP; Business Law Instructor, University of St. Thomas; Attorney, Andrews & Kurth LLP | 144 | Federal Reserve Bank of Dallas | ||||
Raymond Stickel, Jr. — 1944 Trustee | 2005 | Retired.
Formerly: Director, Mainstay VP Series Funds, Inc. (25 portfolios); Partner, Deloitte & Touche | 144 | None | ||||
Robert C. Troccoli — 1949 Trustee | 2016 | Adjunct Professor, University of Denver — Daniels College of Business
Formerly: Senior Partner, KPMG LLP | 144 | None | ||||
Christopher L. Wilson — 1957 Trustee | 2017 | Managing Partner, CT2, LLC (investing and consulting firm)
Formerly: President/Chief Executive Officer, Columbia Funds, Bank of America Corporation; President/Chief Executive Officer, CDC IXIS Asset Management Services, Inc.; Principal & Director of Operations, Scudder Funds, Scudder, Stevens & Clark, Inc.; Assistant Vice President, Fidelity Investments | 144 | TD Asset Management USA Inc. (mutual fund complex) (22 portfolios); ISO New England, Inc. (non-profit organization managing regional electricity market) |
T-2 Invesco Equally-Weighted S&P 500 Fund
Trustees and Officers—(continued)
| Name, Year of Birth and Position(s) Held with the Trust | Trustee and/ or Officer Since | Principal Occupation(s) During Past 5 Years | Number of Complex Overseen by Trustee | Other Directorship(s) Held by Trustee During | ||||
| Other Officers | ||||||||
Sheri Morris — 1964 President, Principal Executive Officer and Treasurer | 2003 | President, Principal Executive Officer and Treasurer, The Invesco Funds; Vice President, Invesco Advisers, Inc. (formerly known as Invesco Institutional (N.A.), Inc.) (registered investment adviser); and Vice President, PowerShares Exchange-Traded Fund Trust, PowerShares Exchange-Traded Fund Trust II, PowerShares India Exchange-Traded Fund Trust, PowerShares Actively Managed Exchange-Traded Fund Trust and PowerShares Actively Managed Exchange-Traded Commodity Fund Trust
Formerly: Vice President and Principal Financial Officer, The Invesco Funds; Vice President, Invesco Aim Advisers, Inc., Invesco Aim Capital Management, Inc. and Invesco Aim Private Asset Management, Inc.; Assistant Vice President and Assistant Treasurer, The Invesco Funds and Assistant Vice President, Invesco Advisers, Inc., Invesco Aim Capital Management, Inc. and Invesco Aim Private Asset Management, Inc.; and Treasurer, PowerShares Exchange-Traded Fund Trust, PowerShares Exchange-Traded Fund Trust II, PowerShares India Exchange-Traded Fund Trust and PowerShares Actively Managed Exchange-Traded Fund Trust | N/A | N/A | ||||
Russell C. Burk — 1958 Senior Vice President and Senior Officer | 2005 | Senior Vice President and Senior Officer, The Invesco Funds | N/A | N/A | ||||
John M. Zerr — 1962 Senior Vice President, Chief Legal Officer and Secretary | 2006 | Director, Senior Vice President, Secretary and General Counsel, Invesco Management Group, Inc. (formerly known as Invesco AIM Management Group, Inc.); Senior Vice President, Invesco Advisers, Inc. (formerly known as Invesco Institutional (N.A.), Inc.) (registered investment adviser); Senior Vice President and Secretary, Invesco Distributors, Inc. (formerly known as Invesco AIM Distributors, Inc.); Director, Vice President and Secretary, Invesco Investment Services, Inc. (formerly known as Invesco AIM Investment Services, Inc.) Senior Vice President, Chief Legal Officer and Secretary, The Invesco Funds; Managing Director, Invesco PowerShares Capital Management LLC; Director, Secretary and General Counsel, Invesco Investment Advisers LLC (formerly known as Van Kampen Asset Management); Secretary and General Counsel, Invesco Capital Markets, Inc. (formerly known as Van Kampen Funds Inc.) and Chief Legal Officer, PowerShares Exchange-Traded Fund Trust, PowerShares Exchange-Traded Fund Trust II, PowerShares India Exchange-Traded Fund Trust, PowerShares Actively Managed Exchange-Traded Fund Trust and PowerShares Actively Managed Exchange-Traded Commodity Fund Trust; Manager and Secretary, Invesco Indexing LLC
Formerly: Director, Secretary, General Counsel and Senior Vice President, Van Kampen Exchange Corp.; Director, Vice President and Secretary, IVZ Distributors, Inc. (formerly known as INVESCO Distributors, Inc.); Director and Vice President, INVESCO Funds Group, Inc.; Director and Vice President, Van Kampen Advisors Inc.; Director, Vice President, Secretary and General Counsel, Van Kampen Investor Services Inc.; Director, Invesco Distributors, Inc. (formerly known as Invesco AIM Distributors, Inc.); Director, Senior Vice President, General Counsel and Secretary, Invesco AIM Advisers, Inc. and Van Kampen Investments Inc.; Director, Vice President and Secretary, Fund Management Company; Director, Senior Vice President, Secretary, General Counsel and Vice President, Invesco AIM Capital Management, Inc.; Chief Operating Officer and General Counsel, Liberty Ridge Capital, Inc. (an investment adviser); Vice President and Secretary, PBHG Funds (an investment company) and PBHG Insurance Series Fund (an investment company); Chief Operating Officer, General Counsel and Secretary, Old Mutual Investment Partners (a broker-dealer); General Counsel and Secretary, Old Mutual Fund Services (an administrator) and Old Mutual Shareholder Services (a shareholder servicing center); Executive Vice President, General Counsel and Secretary, Old Mutual Capital, Inc. (an investment adviser); and Vice President and Secretary, Old Mutual Advisors Funds (an investment company) | N/A | N/A | ||||
Gregory G. McGreevey — 1962 Senior Vice President | 2012 | Senior Managing Director, Invesco Ltd.; Director, Chairman, President, and Chief Executive Officer, Invesco Advisers, Inc. (formerly known as Invesco Institutional (N.A.), Inc.) (registered investment adviser); Director, Invesco Mortgage Capital, Inc. and Invesco Senior Secured Management, Inc.; and Senior Vice President, The Invesco Funds
Formerly: Assistant Vice President, The Invesco Funds | N/A | N/A | ||||
Kelli Gallegos — 1970 Vice President, Principal Financial Officer and Assistant Treasurer | 2008 | Vice President, Principal Financial Officer and Assistant Treasurer, The Invesco Funds; Assistant Treasurer, Invesco PowerShares Capital Management LLC, PowerShares Exchange-Traded Fund Trust, PowerShares Exchange-Traded Fund Trust II, PowerShares India Exchange-Traded Fund Trust, PowerShares Actively Managed Exchange-Traded Fund Trust and PowerShares Actively Managed Exchange-Traded Commodity Fund Trust
Formerly: Assistant Vice President, The Invesco Funds | N/A | N/A |
T-3 Invesco Equally-Weighted S&P 500 Fund
Trustees and Officers—(continued)
| Name, Year of Birth and Position(s) Held with the Trust | Trustee and/ or Officer Since | Principal Occupation(s) During Past 5 Years | Number of Complex Overseen by Trustee | Other Directorship(s) Held by Trustee During | ||||
| Other Officers—(continued) | ||||||||
Tracy Sullivan — 1962 Vice President, Chief Tax Officer and Assistant Treasurer | 2008 | Vice President, Chief Tax Officer and Assistant Treasurer, The Invesco Funds; Assistant Treasurer, Invesco PowerShares Capital Management LLC, PowerShares Exchange-Traded Fund Trust, PowerShares Exchange-Traded Fund Trust II, PowerShares India Exchange-Traded Fund Trust, PowerShares Actively Managed Exchange-Traded Fund Trust and PowerShares Actively Managed Exchange-Traded Commodity Fund Trust
Formerly: Assistant Vice President, The Invesco Funds | N/A | N/A | ||||
Crissie M. Wisdom — 1969 Anti-Money Laundering Compliance Officer | 2013 | Anti-Money Laundering Compliance Officer, Invesco Advisers, Inc. (formerly known as Invesco Institutional (N.A.), Inc.) (registered investment adviser), Invesco Capital Markets, Inc. (formerly known as Van Kampen Funds Inc.), Invesco Distributors, Inc., Invesco Investment Services, Inc., Invesco Management Group, Inc., The Invesco Funds, and PowerShares Exchange-Traded Fund Trust, PowerShares Exchange-Traded Fund Trust II, PowerShares India Exchange-Traded Fund Trust, PowerShares Actively Managed Exchange-Traded Fund Trust and PowerShares Actively Managed Exchange-Traded Commodity Fund Trust; Anti-Money Laundering Compliance Officer and Bank Secrecy Act Officer, INVESCO National Trust Company and Invesco Trust Company; and Fraud Prevention Manager and Controls and Risk Analysis Manager for Invesco Investment Services, Inc.
Formerly: Anti-Money Laundering Compliance Officer, Van Kampen Exchange Corp. | N/A | N/A | ||||
Robert R. Leveille — 1969 Chief Compliance Officer | 2016 | Chief Compliance Officer, Invesco Advisers, Inc. (registered investment adviser); and Chief Compliance Officer, The Invesco Funds
Formerly: Chief Compliance Officer, Putnam Investments and the Putnam Funds | N/A | N/A |
The Statement of Additional Information of the Trust includes additional information about the Fund’s Trustees and is available upon request, without charge, by calling 1.800.959.4246. Please refer to the Fund’s Statement of Additional Information for information on the Fund’s sub-advisers.
Office of the Fund 11 Greenway Plaza, Suite 1000 Houston, TX 77046-1173 | Investment Adviser Invesco Advisers, Inc. 1555 Peachtree Street, N.E. Atlanta, GA 30309 | Distributor Invesco Distributors, Inc. 11 Greenway Plaza, Suite 1000 Houston, TX 77046-1173 | Auditors PricewaterhouseCoopers LLP 1000 Louisiana Street, Suite 5800 Houston, TX 77002-5678 | |||
Counsel to the Fund Stradley Ronon Stevens & Young, LLP 2005 Market Street, Suite 2600 Philadelphia, PA 19103-7018 | Counsel to the Independent Trustees Goodwin Procter LLP 901 New York Avenue, N.W. Washington, D.C. 20001 | Transfer Agent Invesco Investment Services, Inc. 11 Greenway Plaza, Suite 1000 Houston, TX 77046-1173 | Custodian State Street Bank and Trust Company 225 Franklin Street Boston, MA 02110-2801 | |||
T-4 Invesco Equally-Weighted S&P 500 Fund
Explore High-Conviction Investing with Invesco

Go paperless with eDelivery
Visit invesco.com/edelivery to enjoy the convenience and security of anytime electronic access to your investment documents.
With eDelivery, you can elect to have any or all of the following materials delivered straight to your inbox to download, save and print from your own computer:
| ∎ | Fund reports and prospectuses |
| ∎ | Quarterly statements |
| ∎ | Daily confirmations |
| ∎ | Tax forms |
Invesco mailing information
Send general correspondence to Invesco Investment Services, Inc., P.O. Box 219078, Kansas City, MO 64121-9078.
Important notice regarding delivery of security holder documents
To reduce Fund expenses, only one copy of most shareholder documents may be mailed to shareholders with multiple accounts at the same address (Householding). Mailing of your shareholder documents may be householded indefinitely unless you instruct us otherwise. If you do not want the mailing of these documents to be combined with those for other members of your household, please contact Invesco Investment Services, Inc. at 800 959 4246 or contact your financial institution. We will begin sending you individual copies for each account within 30 days after receiving your request.
Fund holdings and proxy voting information
The Fund provides a complete list of its holdings four times in each fiscal year, at the quarter ends. For the second and fourth quarters, the lists appear in the Fund’s semiannual and annual reports to shareholders. For the first and third quarters, the Fund files the lists with the Securities and Exchange Commission (SEC) on Form N-Q. The most recent list of portfolio holdings is available at invesco.com/completeqtrholdings. Shareholders can also look up the Fund’s Forms N-Q on the SEC website at sec.gov. Copies of the Fund’s Forms N-Q may be reviewed and copied at the SEC Public Reference Room in Washington, D.C. You can obtain information on the operation of the Public Reference Room, including information about duplicating fee charges, by calling 202 551 8090 or 800 732 0330, or by electronic request at the following email address: publicinfo@sec.gov. The SEC file numbers for the Fund are shown below.
A description of the policies and procedures that the Fund uses to determine how to vote proxies relating to portfolio securities is available without charge, upon request, from our Client Services department at 800 959 4246 or at invesco.com/proxyguidelines. The information is also available on the SEC website, sec.gov.
Information regarding how the Fund voted proxies related to its portfolio securities during the most recent 12-month period ended June 30 is available at invesco.com/proxysearch. The information is also available on the SEC website, sec.gov. Invesco Advisers, Inc. is an investment adviser; it provides investment advisory services to individual and institutional clients and does not sell securities. Invesco Distributors, Inc. is the US distributor for Invesco Ltd.’s retail mutual funds, exchange-traded funds and institutional money market funds. Both are wholly owned, indirect subsidiaries of Invesco Ltd. |  |
| SEC file numbers: 811-09913 and 333-36074 | Invesco Distributors, Inc. | MS-EWSP-AR-1 10122017 1213 | ||||
| ||||
 | Annual Report to Shareholders
| August 31, 2017
| ||
| ||||
Invesco Equity and Income Fund
Nasdaq: A: ACEIX ◾ B: ACEQX ◾ C: ACERX ◾ R: ACESX ◾ Y: ACETX ◾ R5: ACEKX ◾ R6: IEIFX | ||||

Letters to Shareholders
Philip Taylor | Dear Shareholders: This annual report includes information about your Fund, including performance data and a complete list of its investments as of the close of the reporting period. Inside is a discussion of how your Fund was managed and the factors that affected its performance during the reporting period. The reporting period began with stock market volatility in the US and abroad, largely the result of uncertainty about global economic growth and monetary policy. While economic data in the US were generally positive, news overseas was less upbeat. The European Central Bank and central banks in China and Japan – as well as other countries – maintained extraordinarily accommodative monetary policies in response to economic weakness. Citing generally positive economic data – specifically, realized and expected labor market conditions and inflation – the US Federal Reserve raised interest rates three times during the reporting period: in December |

2016, and in March and June 2017. The major US stock market rally that began in November 2016 continued through the end of the reporting period, with major stock market indexes repeatedly hitting new record highs.
Short-term market volatility can prompt some investors to abandon their investment plans – and can cause others to settle for whatever returns the market has to offer. The investment professionals at Invesco, in contrast, invest with high conviction. This means that, no matter the asset class or the strategy, each investment team has a passion to exceed. We want to help investors achieve better outcomes, such as seeking higher returns, helping mitigate risk and generating income. Of course, investing with high conviction can’t guarantee a profit or ensure success; no investment strategy can. To learn more about how we invest with high conviction, visit invesco.com/HighConviction.
You, too, can invest with high conviction by maintaining a long-term investment perspective and by working with your financial adviser on a regular basis. During periods of short-term market volatility or uncertainty, your financial adviser can keep you focused on your long-term investment goals – a new home, a child’s college education or a secure retirement. He or she also can share research about the economy, the markets and individual investment options.
Visit our website for more information on your investments
Our website, invesco.com/us, offers a wide range of market insights and investment perspectives. On the website, you’ll find detailed information about our funds, including performance, holdings and portfolio manager commentaries. You can access information about your account by completing a simple, secure online registration. To do so, select “Log In” on the right side of the homepage, and then select “Register for Individual Account Access.”
In addition to the resources accessible on our website and through our mobile app, you can obtain timely updates to help you stay informed about the markets and the economy by connecting with Invesco on Twitter, LinkedIn or Facebook. You can access our blog at blog.invesco.us.com. Our goal is to provide you the information you want, when and where you want it.
Finally, I’m pleased to share with you Invesco’s commitment to both the Principles for Responsible Investment and to considering environmental, social and governance issues in our robust investment process. I invite you to learn more at invesco.com/esg.
Have questions?
For questions about your account, contact an Invesco client services representative at 800 959 4246. For Invesco-related questions or comments, please email me directly at phil@invesco.com.
All of us at Invesco look forward to serving your investment management needs. Thank you for investing with us.
Sincerely,

Philip Taylor
Senior Managing Director, Invesco Ltd.
2 Invesco Equity and Income Fund
Bruce Crockett | Dear Fellow Shareholders: Among the many important lessons I’ve learned in more than 40 years in a variety of business endeavors is the value of a trusted advocate. As independent chair of the Invesco Funds Board, I can assure you that the members of the Board are strong advocates for the interests of investors in Invesco’s mutual funds. We work hard to represent your interests through oversight of the quality of the investment management services your funds receive and other matters important to your investment, including but not limited to: ∎ Ensuring that Invesco offers a diverse lineup of mutual funds that your financial adviser can use to strive to meet your financial needs as your investment goals change over time. ∎ Monitoring how the portfolio management teams of the Invesco funds are performing in light of changing economic and market conditions. |

∎ Assessing each portfolio management team’s investment performance within the context of the investment strategy described in the fund’s prospectus.
∎ Monitoring for potential conflicts of interests that may impact the nature of the services that your funds receive.
We believe one of the most important services we provide our fund shareholders is the annual review of the funds’ advisory and sub-advisory contracts with Invesco Advisers and its affiliates. This review is required by the Investment Company Act of 1940 and focuses on the nature and quality of the services Invesco provides as the adviser to the Invesco funds and the reasonableness of the fees that it charges for those services. Each year, we spend months carefully reviewing information received from Invesco and a variety of independent sources, such as performance and fee data prepared by Lipper, Inc. (a subsidiary of Broadridge Financial Solutions, Inc.), an independent, third-party firm widely recognized as a leader in its field. We also meet with our independent legal counsel and other independent advisers to review and help us assess the information that we have received. Our goal is to assure that you receive quality investment management services for a reasonable fee.
I trust the measures outlined above provide assurance that you have a worthy advocate when it comes to choosing the Invesco Funds.
As always, please contact me at bruce@brucecrockett.com with any questions or concerns you may have. On behalf of the Board, we look forward to continuing to represent your interests and serving your needs.
Sincerely,

Bruce L. Crockett
Independent Chair
Invesco Funds Board of Trustees
3 Invesco Equity and Income Fund
Management’s Discussion of Fund Performance
Performance summary
For the fiscal year ended August 31, 2017, Class A Shares of Invesco Equity and Income Fund (the Fund), at net asset value (NAV), outperformed the Russell 1000 Value Index.
Your Fund’s long-term performance appears later in this report.
Fund vs. Indexes
Total returns, 8/31/16 to 8/31/17, at net asset value (NAV). Performance shown does not include applicable contingent deferred sales charges (CDSC) or front-end sales charges, which would have reduced performance.
Class A Shares | 12.04 | % | ||
Class B Shares | 11.24 | |||
Class C Shares | 11.21 | |||
Class R Shares | 11.71 | |||
Class Y Shares | 12.32 | |||
Class R5 Shares | 12.28 | |||
Class R6 Shares | 12.50 | |||
Russell 1000 Value Indexq (Broad Market Index) | 11.58 | |||
Bloomberg Barclays U.S. Government/Credit Indexq (Style-Specific Index) | 0.37 | |||
| Lipper Mixed-Asset Target Allocation Growth Funds Index∎ (Peer Group Index) | 12.07 |
Source(s): qFactSet Research Systems Inc.; ∎Lipper Inc.
Market conditions and your Fund
The fiscal year began with major US stock market indexes posting gains, with most hitting record highs following the US presidential election. Investors seemed to believe that the new administration’s plans to reduce tax rates, scale back regulations and increase infrastructure spending had the potential to stimulate economic growth. However, that was called into question in the first quarter of 2017, when headlines out of Washing-ton, DC, suggested that enacting significant regulatory and tax reforms might be more difficult than previously anticipated. Signs of an improving economy prompted the US Federal Reserve (the Fed) to raise interest rates three times during the reporting period: in December of 2016 and in March and June of 2017. In the first quarter of 2017, the US economy grew at an anemic rate, with gross domestic product rising at an annualized rate of just 1.2%.1 However, the economy picked up steam during the second
quarter. Unemployment continued its years-long decline, hitting a 16-year low of 4.3% in the summer of 2017.2 US equities were strong throughout the reporting period, and major US equity market indexes hit new record highs during the summer.
While US stock market indexes rose for the reporting period ended August 31, 2017, individual market sectors performed very differently from one another. Information technology (IT), financials and industrials were the strongest-performing sectors, while energy, telecommunication services and real estate were the weakest-performing sectors.
For the reporting period as a whole, financials and consumer discretionary were the strongest-performing sectors for the Fund. Energy and materials were the weakest-performing sectors for the Fund, posting negative returns.
The financials sector was the largest contributor to the Fund’s performance versus the Russell 1000 Value Index due
to strong stock selection in and overweight exposure to the sector. Banks and diversified financial stocks – specifically, Citigroup, Bank of America, JP Morgan Chase, Comerica, Morgan Stanley and Citizens Financial Group – were the Fund’s top contributors. These companies benefited from the strong post-presidential election rally in financial stocks, as investor optimism about future interest rates and the economy fueled returns. Financials got another boost in June when the Fed’s Comprehensive Capital Analysis and Review (CCAR) was better than expected, providing a favorable view of the financial strength of US banks.
Stock selection in the consumer discretionary sector also benefited the Fund’s relative performance, and Carnival was a key contributor. The stock performed well throughout the fiscal year, returning almost 50% for the reporting period when the cruise operator raised its outlook and reported better pricing and strong forward booking volumes for 2017. Charter Communications also contributed to relative results.
Having no exposure to the real estate sector and an underweight allocation to the telecommunication services sector also benefited the Fund’s performance versus the Russell 1000 Value Index. Both sectors posted negative returns for the fiscal year and were bottom-performing sectors within the Russell 1000 Value Index. The Fund has remained materially underweight these sectors because we believe they are overvalued, as investors have driven up stock prices in a quest for yield in a low-interest rate environment.
Stock selection within the industrials sector contributed to the Fund’s relative performance. CSX, a rail-based transportation services firm, was the top contributor within the sector, as the stock returned 80% for the reporting period. The company announced the arrival of a new chief executive officer who is highly
Portfolio Composition |
| |||
By security type | % of total net assets | |||
| Common Stocks and Other Equity Interests | 64.9 | % | ||
| Bonds and Notes | 19.3 | |||
| U.S. Treasury Securities | 10.0 | |||
| Security Types Each Less Than 1% of Portfolio | 1.0 | |||
Money Market Funds Plus Other Assets Less Liabilities | 4.8 | |||
| Top 10 Equity Holdings* | ||||||
| % of total net assets | ||||||
1. | Citigroup Inc. | 3.8 | % | |||
2. | Bank of America Corp. | 2.8 | ||||
3. | JPMorgan Chase & Co. | 2.5 | ||||
4. | Morgan Stanley | 2.0 | ||||
5. | Oracle Corp. | 1.6 | ||||
6. | Citizens Financial Group, Inc. | 1.5 | ||||
7. | Carnival Corp. | 1.4 | ||||
8. | Royal Dutch Shell PLC-Class A | 1.3 | ||||
9. | Walgreens Boots Alliance, Inc. | 1.3 | ||||
10. | PNC Financial Services Group, Inc. (The) | 1.2 | ||||
Total Net Assets | $ | 14.4 billion | ||
Total Number of Holdings* | 396 | |||
The Fund’s holdings are subject to change, and there is no assurance that the Fund will continue to hold any particular security.
*Excluding money market fund holdings.
Data presented here are as of August 31, 2017.
4 Invesco Equity and Income Fund
respected within the industry, and the stock rallied on investors’ expectations of improved profitability.
Although the Fund’s cash levels averaged below 5% during the reporting period, the cash position was a detractor in a strong equity market, as would be expected.
Stock selection in the materials sector detracted from the Fund’s performance versus the Russell 1000 Value Index. Within the sector, the largest detractor was The Mosaic Company, a phosphate and potash supplier. During the second quarter of 2017, the stock price fell after the company reported sales and profits that were down sharply from the year before. Operating earnings were down due to lower phosphate and potash prices.
Stock selection in the energy sector also detracted from the Fund’s relative results. The Fund’s largest detractors included Apache and Devon Energy. After oil prices traded above $50 per barrel for much of the reporting period, higher inventories and a worsening outlook caused oil prices and many energy stocks to decline during the first half of 2017.
The Fund’s underweight allocation to the utilities sector also detracted from relative performance, as this sector was a top-performing sector within the Russell 1000 Value Index. The Fund remained materially underweight in this sector because we believe it to be overvalued.
The Fund uses high grade bonds as a source of income and to dampen return volatility. This detracted from relative performance in the reporting period as rising interest rates caused bond prices to decline. Similarly, the Fund’s allocation to convertible securities posted double-digit returns on an absolute basis but detracted from relative performance as convertibles underperformed the Russell 1000 Value Index.
We used currency forward contracts for the purpose of hedging currency exposure of non-US-based companies held in the portfolio. Currency forward contracts were used solely for the purpose of hedging and not for speculative purposes or leverage. The use of currency forward contracts had a negative impact on the Fund’s performance, largely due to the strength of the US dollar compared to the foreign currencies in which the Fund’s non-US holdings were denominated.
At the end of the reporting period, the Fund’s largest overweight exposures relative to the Russell 1000 Value Index were in the financials and consumer
discretionary sectors, while the Fund’s largest underweight exposures were in the real estate and utilities sectors.
Although equity markets posted strong returns during the reporting period, macroeconomic events generally overshadowed company fundamentals in investors’ minds. We believe that market volatility creates opportunities to invest in companies with attractive valuations and strong fundamentals. We believe patiently investing in these opportunities may lead to strong performance over time.
Thank you for your investment in Invesco Equity and Income Fund and for sharing our long-term investment horizon.
| 1 | Source: Bureau of Economic Analysis |
| 2 | Sources: Bureau of Labor Statistics, Bloomberg |
The views and opinions expressed in management’s discussion of Fund performance are those of Invesco Advisers, Inc. These views and opinions are subject to change at any time based on factors such as market and economic conditions. These views and opinions may not be relied upon as investment advice or recommendations, or as an offer for a particular security. The information is not a complete analysis of every aspect of any market, country, industry, security or the Fund. Statements of fact are from sources considered reliable, but Invesco Advisers, Inc. makes no representation or warranty as to their completeness or accuracy. Although historical performance is no guarantee of future results, these insights may help you understand our investment management philosophy.
See important Fund and, if applicable, index disclosures later in this report.
 | Thomas Bastian Chartered Financial Analyst, Portfolio Manager, is lead manager of Invesco Equity and Income |
Fund. He joined Invesco in 2010. Mr. Bastian earned a BA in accounting from St. John’s University and an MBA in finance from the University of Michigan.
 | Chuck Burge Portfolio Manager, is manager of Invesco Equity and Income Fund. He joined Invesco in 2002. Mr. Burge |
earned a BS in economics from Texas A&M University and an MBA in finance and accounting from Rice University.
 | Brian Jurkash Portfolio Manager, is manager of Invesco Equity and Income Fund. He joined Invesco in 2000. |
Mr. Jurkash earned a BBA degree in finance from Stephen F. Austin State University and an MBA in finance from the University of Houston.
 | Sergio Marcheli Portfolio Manager, is manager of Invesco Equity and Income Fund. He joined Invesco in 2010. |
Mr. Marcheli earned a BBA from the University of Houston and an MBA from the University of St. Thomas.
 | Matthew Titus Chartered Financial Analyst, Portfolio Manager, is manager of Invesco Equity and Income Fund. |
He joined Invesco in 2016. Mr. Titus earned a bachelor’s degree in accounting and economics from Luther College in Decorah, Iowa, and an MBA from Ohio State University.
5 Invesco Equity and Income Fund
Your Fund’s Long-Term Performance
Results of a $10,000 Investment – Oldest Share Class(es)
Fund and index data from 8/31/07
| 1 | Source: FactSet Research Systems Inc. |
| 2 | Source: Lipper Inc. |
Past performance cannot guarantee comparable future results.
The data shown in the chart include reinvested distributions, applicable sales charges and Fund expenses including
management fees. Index results include reinvested dividends, but they do not reflect sales charges. Performance of the peer group, if applicable, reflects fund expenses and management fees; performance
of a market index does not. Performance shown in the chart and table(s) does not reflect deduction of taxes a shareholder would pay on Fund distributions or sale of Fund shares.
6 Invesco Equity and Income Fund
Average Annual Total Returns As of 8/31/17, including maximum applicable sales charges
|
| |||
Class A Shares | ||||
Inception (8/3/60) | 10.11 | % | ||
10 Years | 5.78 | |||
5 Years | 9.20 | |||
1 Year | 5.92 | |||
Class B Shares | ||||
Inception (5/1/92) | 9.43 | % | ||
10 Years | 6.09 | |||
5 Years | 9.35 | |||
1 Year | 6.24 | |||
Class C Shares | ||||
Inception (7/6/93) | 8.67 | % | ||
10 Years | 5.60 | |||
5 Years | 9.64 | |||
1 Year | 10.21 | |||
Class R Shares | ||||
Inception (10/1/02) | 8.08 | % | ||
10 Years | 6.10 | |||
5 Years | 10.18 | |||
1 Year | 11.71 | |||
Class Y Shares | ||||
Inception (12/22/04) | 7.20 | % | ||
10 Years | 6.63 | |||
5 Years | 10.72 | |||
1 Year | 12.32 | |||
Class R5 Shares | ||||
10 Years | 6.63 | % | ||
5 Years | 10.80 | |||
1 Year | 12.28 | |||
Class R6 Shares | ||||
10 Years | 6.59 | % | ||
5 Years | 10.88 | |||
1 Year | 12.50 | |||
Effective June 1, 2010, Class A, Class B, Class C, Class I and Class R shares of the predecessor fund, Van Kampen Equity and Income Fund, advised by Van Kampen Asset Management were reorganized into Class A, Class B, Class C, Class Y and Class R shares, respectively, of Invesco Van Kampen Equity and Income Fund (renamed Invesco Equity and Income Fund). Returns shown above, prior to June 1, 2010, for Class A, Class B, Class C, Class R and Class Y shares are blended
returns of the predecessor fund and Invesco Equity and Income Fund. Share class returns will differ from the predecessor fund because of different expenses.
Class R5 shares incepted on June 1, 2010. Performance shown prior to that date is that of the predecessor fund’s Class A shares and includes the 12b-1
Average Annual Total Returns As of 6/30/17, the most recent calendar quarter end, including maximum applicable sales charges
|
| |||
Class A Shares | ||||
Inception (8/3/60) | 10.14 | % | ||
10 Years | 5.52 | |||
5 Years | 9.74 | |||
1 Year | 10.98 | |||
Class B Shares | ||||
Inception (5/1/92) | 9.48 | % | ||
10 Years | 5.84 | |||
5 Years | 9.90 | |||
1 Year | 11.54 | |||
Class C Shares | ||||
Inception (7/6/93) | 8.73 | % | ||
10 Years | 5.33 | |||
5 Years | 10.18 | |||
1 Year | 15.59 | |||
Class R Shares | ||||
Inception (10/1/02) | 8.16 | % | ||
10 Years | 5.85 | |||
5 Years | 10.71 | |||
1 Year | 17.22 | |||
Class Y Shares | ||||
Inception (12/22/04) | 7.27 | % | ||
10 Years | 6.38 | |||
5 Years | 11.26 | |||
1 Year | 17.79 | |||
Class R5 Shares | ||||
10 Years | 6.37 | % | ||
5 Years | 11.34 | |||
1 Year | 17.86 | |||
Class R6 Shares | ||||
10 Years | 6.32 | % | ||
5 Years | 11.43 | |||
1 Year | 17.98 | |||
fees applicable to Class A shares. Class R6 shares incepted on September 24, 2012. Performance shown prior to that date is that of the Fund’s and the predecessor fund’s Class A shares and includes the 12b-1 fees applicable to Class A shares.
The performance data quoted represent past performance and cannot guarantee comparable future results; current performance may be lower or higher. Please visit invesco.com/performance for the most recent month-end performance. Performance figures reflect reinvested distributions, changes in net asset value and the effect of the maximum sales charge unless otherwise stated. Investment return and principal value will fluctuate so that you may have a gain or loss when you sell shares.
The net annual Fund operating expense ratio set forth in the most recent Fund prospectus as of the date of this report for Class A, Class B, Class C, Class R, Class Y, Class R5 and Class R6 shares was 0.80%, 1.55%, 1.53%, 1.05%, 0.55%, 0.48% and 0.38%, respectively.1 The total annual Fund operating expense ratio set forth in the most recent Fund prospectus as of the date of this report for Class A, Class B, Class C, Class R, Class Y, Class R5 and Class R6 shares was 0.81%, 1.56%, 1.54%, 1.06%, 0.56%, 0.49% and 0.39%, respectively. The expense ratios presented above may vary from the expense ratios presented in other sections of this report that are based on expenses incurred during the period covered by this report.
Class A share performance reflects the maximum 5.50% sales charge, and Class B and Class C share performance reflects the applicable contingent deferred sales charge (CDSC) for the period involved. For shares purchased prior to June 1, 2010, the CDSC on Class B shares declines from 5% at the time of purchase to 0% at the beginning of the sixth year. For shares purchased on or after June 1, 2010, the CDSC on Class B shares declines from 5% at the time of purchase to 0% at the beginning of the seventh year. The CDSC on Class C shares is 1% for the first year after purchase. Class R, Class Y, Class R5 and Class R6 shares do not have a front-end sales charge or a CDSC; therefore, performance is at net asset value.
The performance of the Fund’s share classes will differ primarily due to different sales charge structures and class expenses.
Fund performance reflects any applicable fee waivers and/or expense reimbursements. Had the adviser not waived fees and/or reimbursed expenses currently or in the past, returns would have been lower. See current prospectus for more information.
| 1 | Total annual Fund operating expenses after any contractual fee waivers and/or expense reimbursements by the adviser in effect through at least June 30, 2019. See current prospectus for more information. |
7 Invesco Equity and Income Fund
Invesco Equity and Income Fund’s investment objective is current income and, secondarily, capital appreciation.
| ∎ | Unless otherwise stated, information presented in this report is as of August 31, 2017, and is based on total net assets. |
| ∎ | Unless otherwise noted, all data provided by Invesco. |
| ∎ | To access your Fund’s reports/prospectus, visit invesco.com/fundreports. |
About share classes
| ∎ | Class B shares may not be purchased for new or additional investments. Please see the prospectus for more information. |
| ∎ | Class R shares are generally available only to employer sponsored retirement and benefit plans. Please see the prospectus for more information. |
| ∎ | Class Y shares are available only to certain investors. Please see the prospectus for more information. |
| ∎ | Class R5 shares and Class R6 shares are available for use by retirement plans that meet certain standards and for institutional investors. Class R6 shares are also available through intermediaries that have established an agreement with Invesco Distributors, Inc. to make such shares available for use in retail omnibus accounts. Please see the prospectus for more information. |
Principal risks of investing in the Fund
| ∎ | Changing fixed income market conditions risk. The current low interest rate environment was created in part by the Federal Reserve Board (FRB) and certain foreign central banks keeping the federal funds and equivalent foreign rates near, at or below zero. Increases in the federal funds and equivalent foreign rates may expose fixed income markets to heightened volatility and reduced liquidity for certain fixed income investments, particularly those with longer maturities. In addition, decreases in fixed income dealer market-making capacity may also potentially lead to heightened volatility and reduced liquidity in the fixed income markets. As a result, the value of the Fund’s investments and share price may decline. Changes in central bank policies could also result in higher than normal shareholder redemptions, which could potentially increase portfolio turnover and the Fund’s transaction costs. |
| ∎ | Convertible securities risk. The market values of convertible securities are affected by market interest rates, the risk of actual issuer default on interest or principal payments and the value of the underlying common stock into which the convertible security may be converted. Additionally, a convertible security is subject to the same types of market and issuer risks as apply to the underlying common stock. In addition, certain convertible securities are subject to involuntary conversions and may undergo principal write-downs upon the occurrence of certain triggering events, and, as a result, are subject to an increased risk of loss. Convertible securities may be rated below investment grade. |
| ∎ | Debt securities risk. The prices of debt securities held by the Fund will be affected by changes in interest rates, the creditworthiness of the issuer and other factors. An increase in prevailing interest rates typically causes the value of existing debt securities to fall and often has a greater impact on longer-duration debt securities and higher quality debt securities. Falling interest rates will cause the Fund to reinvest the proceeds of debt securities that have been repaid by the issuer at lower interest rates. Falling interest rates may also reduce the Fund’s distributable income because interest payments on floating rate debt instruments held by the Fund will decline. The Fund could lose money on investments in debt securities if the issuer or borrower fails to meet its obligations to make interest payments and/or to repay principal in a timely manner. Changes in an issuer’s financial strength, the market’s perception of such strength or in the credit rating of the issuer or the security may affect the value of debt securities. The Adviser’s credit analysis may fail to anticipate such changes, which could result in buying a debt security at an inopportune time or failing to sell a debt security in advance of a price decline or other credit event. |
This report must be accompanied or preceded by a currently effective Fund prospectus, which contains more complete information, including sales charges and expenses. Investors should read it carefully before investing. | ||||
| NOT FDIC INSURED | MAY LOSE VALUE | NO BANK GUARANTEE |
| ∎ | Depositary receipts risk. Investing in depositary receipts involves the same risks as direct investments in foreign securities. In addition, the underlying issuers of certain depositary receipts are under no obligation to distribute shareholder communications or pass through any voting rights with respect to the deposited securities to the holders of such receipts. The Fund may therefore receive less timely information or have less control than if it invested directly in the foreign issuer. |
| ∎ | Derivatives risk. The value of a derivative instrument depends largely on (and is derived from) the value of an underlying security, currency, commodity, interest rate, index or other asset (each referred to as an underlying asset). In addition to risks relating to the underlying assets, the use of derivatives may include other, possibly greater, risks, including counterparty, leverage and liquidity risks. Counterparty risk is the risk that the counterparty to the derivative contract will default on its obligation to pay the Fund the amount owed or otherwise perform under the derivative contract. Derivatives create leverage risk because they do not require payment up front equal to the economic exposure created by owning the derivative. As a result, an adverse change in the value of the underlying asset could result in the Fund sustaining a loss that is substantially greater than the amount invested in the derivative, which may make the Fund’s returns more volatile and increase the risk of loss. Derivative instruments may also be less liquid than more traditional investments and the Fund may be unable to sell or close out its derivative positions at a desirable time or price. This risk may be more acute under adverse market conditions, during which the Fund may be most in need of liquidating its derivative positions. Derivatives may also be harder to value, less tax efficient and subject to changing government regulation that could impact the Fund’s ability to use certain derivatives or their cost. Also, derivatives used for hedging or to gain or limit exposure to a particular market segment may not provide the expected benefits, particularly during adverse market conditions. |
8 Invesco Equity and Income Fund
| ∎ | Foreign securities risk. The Fund’s foreign investments may be adversely affected by political and social instability, changes in economic or taxation policies, difficulty in enforcing obligations, decreased liquidity or increased volatility. Foreign investments also involve the risk of the possible seizure, nationalization or expropriation of the issuer or foreign deposits (in which the Fund could lose its entire investments in a certain market) and the possible adoption of foreign governmental restrictions such as exchange controls. Unless the Fund has hedged its foreign securities risk, foreign securities risk also involves the risk of negative foreign currency rate fluctuations, which may cause the value of securities denominated in such foreign currency (or other instruments through which the Fund has exposure to foreign currencies) to decline in value. Currency exchange rates may fluctuate significantly over short periods of time. Currency hedging strategies, if used, are not always successful. |
| ∎ | Management risk. The Fund is actively managed and depends heavily on the Adviser’s judgment about markets, interest rates or the attractiveness, relative values, liquidity, or potential appreciation of particular investments made for the Fund’s portfolio. The Fund could experience losses if these judgments prove to be incorrect. Additionally, legislative, regulatory, or tax developments may adversely affect management of the Fund and, therefore, the ability of the Fund to achieve its investment objective. |
| ∎ | Market risk. The market values of the Fund’s investments, and therefore the value of the Fund’s shares, will go up and down, sometimes rapidly or unpredictably. Market risk may affect a single issuer, industry or section of the economy, or it may affect the market as a whole. Individual stock prices tend to go up and down more dramatically than those of certain other types of investments, such as bonds. During a general downturn in the financial markets, multiple asset classes may decline in value. When markets perform well, there can be no assurance that specific investments held by the Fund will rise in value. |
| ∎ | Preferred securities risk. Preferred securities are subject to issuer-specific and market risks applicable generally to equity securities. Preferred securities also may be subordinated to bonds or other debt instruments, subjecting them to a greater risk of non-payment, |
may be less liquid than many other securities, such as common stocks, and generally offer no voting rights with respect to the issuer.
| ∎ | Real estate investment trust (REIT) risk/real estate risk. Investments in real estate related instruments may be affected by economic, legal, cultural, environmental or technological factors that affect property values, rents or occupancies of real estate related to the Fund’s holdings. Shares of real estate related companies, which tend to be small- and mid-cap companies, may be more volatile and less liquid. |
| ∎ | Small- and mid-capitalization companies risks. Small- and mid-capitalization companies tend to be more vulnerable to changing market conditions, may have little or no operating history or track record of success, and may have more limited product lines and markets, less experienced management and fewer financial resources than larger companies. These companies’ securities may be more volatile and less liquid than those of more established companies, and their returns may vary, sometimes significantly, from the overall securities market. |
| ∎ | Value investing style risk. A value investing style subjects the Fund to the risk that the valuations never improve or that the returns on value equity securities are less than returns on other styles of investing or the overall stock market. |
| ∎ | Warrants risk. Warrants may be significantly less valuable or worth lesson their expiration date and may also be postponed or terminated early, resulting in a partial or total loss. Warrants may also be illiquid. |
| ∎ | Zero coupon or pay-in-kind securities risk. The value, interest rates, and liquidity of non-cash paying instruments, such as zero coupon and pay-in-kind securities, are subject to greater fluctuation than other types of securities. The higher yields and interest rates on pay-in-kind securities reflect the payment deferral and increased credit risk associated with such instruments and that such investments may represent a higher credit risk than loans that periodically pay interest. |
About indexes used in this report
| ∎ | The Russell 1000® Value Index is an unmanaged index considered representative of large-cap value stocks. The Russell 1000 Value Index is a trademark/service mark of the Frank Russell Co. Russell® is a trademark of the Frank Russell Co. |
| ∎ | The Bloomberg Barclays U.S. Government/Credit Index is a broad-based benchmark that includes investment grade, US dollar-denominated, fixed-rate Treasuries and government-related and corporate securities. |
| ∎ | The Lipper Mixed-Asset Target Allocation Growth Funds Index is an unmanaged index considered representative of mixed-asset target allocation growth funds tracked by Lipper. |
| ∎ | The Fund is not managed to track the performance of any particular index, including the index(es) described here, and consequently, the performance of the Fund may deviate significantly from the performance of the index(es). |
| ∎ | A direct investment cannot be made in an index. Unless otherwise indicated, index results include reinvested dividends, and they do not reflect sales charges. Performance of the peer group, if applicable, reflects fund expenses; performance of a market index does not. |
Other information
| ∎ | The returns shown in management’s discussion of Fund performance are based on net asset values (NAVs) calculated for shareholder transactions. Generally accepted accounting principles require adjustments to be made to the net assets of the Fund at period end for financial reporting purposes, and as such, the NAVs for shareholder transactions and the returns based on those NAVs may differ from the NAVs and returns reported in the Financial Highlights. |
| ∎ | Industry classifications used in this report are generally according to the Global Industry Classification Standard, which was developed by and is the exclusive property and a service mark of MSCI Inc. and Standard & Poor’s. |
9 Invesco Equity and Income Fund
Schedule of Investments(a)
August 31, 2017
| Shares | Value | |||||||
Common Stocks & Other Equity Interests–64.89% |
| |||||||
| Aerospace & Defense–1.09% | ||||||||
General Dynamics Corp. | 785,663 | $ | 158,193,245 | |||||
| Apparel, Accessories & Luxury Goods–0.61% | ||||||||
Michael Kors Holdings Ltd.(b) | 2,104,337 | 88,845,108 | ||||||
| Asset Management & Custody Banks–1.91% | ||||||||
Northern Trust Corp. | 1,166,088 | 103,198,788 | ||||||
State Street Corp. | 1,864,804 | 172,475,722 | ||||||
| 275,674,510 | ||||||||
| Automobile Manufacturers–1.03% | ||||||||
General Motors Co. | 4,080,142 | 149,088,389 | ||||||
| Biotechnology–0.50% | ||||||||
Amgen Inc. | 407,967 | 72,524,294 | ||||||
| Broadcasting–0.21% | ||||||||
CBS Corp.–Class B | 479,954 | 30,745,853 | ||||||
| Building Products–1.03% | ||||||||
Johnson Controls International PLC | 3,761,546 | 148,919,606 | ||||||
| Cable & Satellite–1.73% | ||||||||
Charter Communications, Inc.–Class A(b) | 267,683 | 106,682,383 | ||||||
Comcast Corp.–Class A | 3,528,844 | 143,306,355 | ||||||
| 249,988,738 | ||||||||
| Communications Equipment–1.94% | ||||||||
Cisco Systems, Inc. | 4,927,687 | 158,720,798 | ||||||
Juniper Networks, Inc. | 4,384,160 | 121,572,757 | ||||||
| 280,293,555 | ||||||||
| Construction Machinery & Heavy Trucks–0.14% | ||||||||
Caterpillar Inc. | 166,723 | 19,588,285 | ||||||
| Data Processing & Outsourced Services–0.61% | ||||||||
PayPal Holdings, Inc.(b) | 1,424,484 | 87,862,173 | ||||||
| Diversified Banks–9.11% | ||||||||
Bank of America Corp. | 16,965,378 | 405,302,880 | ||||||
Citigroup Inc. | 7,999,992 | 544,239,456 | ||||||
JPMorgan Chase & Co. | 4,024,399 | 365,777,625 | ||||||
| 1,315,319,961 | ||||||||
| Diversified Metals & Mining–0.59% | ||||||||
BHP Billiton Ltd. (Australia) | 3,887,371 | 84,595,506 | ||||||
| Drug Retail–2.10% | ||||||||
CVS Health Corp. | 1,536,493 | 118,832,369 | ||||||
Walgreens Boots Alliance, Inc. | 2,265,402 | 184,630,263 | ||||||
| 303,462,632 | ||||||||
| Electric Utilities–0.91% | ||||||||
FirstEnergy Corp. | 1,413,211 | 46,042,414 | ||||||
PG&E Corp. | 1,208,352 | 85,043,814 | ||||||
| 131,086,228 | ||||||||
| Shares | Value | |||||||
| Fertilizers & Agricultural Chemicals–0.94% | ||||||||
Agrium Inc. (Canada) | 699,746 | $ | 68,603,098 | |||||
Mosaic Co. (The) | 3,335,804 | 66,649,364 | ||||||
| 135,252,462 | ||||||||
| Health Care Distributors–0.67% | ||||||||
Cardinal Health, Inc. | 1,427,546 | 96,302,253 | ||||||
| Health Care Equipment–1.48% | ||||||||
Baxter International Inc. | 1,522,127 | 94,432,759 | ||||||
Medtronic PLC | 1,476,729 | 119,053,892 | ||||||
| 213,486,651 | ||||||||
| Home Improvement Retail–0.59% | ||||||||
Kingfisher PLC (United Kingdom) | 21,910,553 | 84,692,499 | ||||||
| Hotels, Resorts & Cruise Lines–1.41% | ||||||||
Carnival Corp. | 2,937,186 | 204,075,683 | ||||||
| Industrial Conglomerates–0.36% | ||||||||
General Electric Co. | 2,136,832 | 52,459,226 | ||||||
| Industrial Machinery–0.85% | ||||||||
Ingersoll-Rand PLC | 1,436,757 | 122,684,680 | ||||||
| Insurance Brokers–2.12% | ||||||||
Aon PLC | 1,007,223 | 140,165,153 | ||||||
Marsh & McLennan Cos., Inc. | 911,431 | 71,164,532 | ||||||
Willis Towers Watson PLC | 635,316 | 94,325,367 | ||||||
| 305,655,052 | ||||||||
| Integrated Oil & Gas–3.68% | ||||||||
Exxon Mobil Corp. | 918,075 | 70,076,665 | ||||||
Occidental Petroleum Corp. | 2,786,188 | 166,335,423 | ||||||
Royal Dutch Shell PLC–Class A (United Kingdom) | 6,915,454 | 190,218,995 | ||||||
TOTAL S.A. (France) | 2,020,934 | 104,525,278 | ||||||
| 531,156,361 | ||||||||
| Integrated Telecommunication Services–0.65% | ||||||||
Orange S.A. (France) | 1,386,054 | 23,576,927 | ||||||
Verizon Communications Inc. | 1,453,686 | 69,733,318 | ||||||
| 93,310,245 | ||||||||
| Internet Software & Services–0.97% | ||||||||
eBay Inc.(b) | 3,866,219 | 139,686,493 | ||||||
| Investment Banking & Brokerage–3.61% | ||||||||
Charles Schwab Corp. (The) | 2,719,347 | 108,501,945 | ||||||
Goldman Sachs Group, Inc. (The) | 539,620 | 120,734,579 | ||||||
Morgan Stanley | 6,438,334 | 292,944,197 | ||||||
| 522,180,721 | ||||||||
| IT Consulting & Other Services–0.94% | ||||||||
Cognizant Technology Solutions | 1,929,636 | 136,560,340 | ||||||
See accompanying Notes to Financial Statements which are an integral part of the financial statements.
10 Invesco Equity and Income Fund
| Shares | Value | |||||||
| Managed Health Care–0.64% | ||||||||
Anthem, Inc. | 474,184 | $ | 92,959,031 | |||||
| Movies & Entertainment–0.53% | ||||||||
Time Warner Inc. | 759,194 | 76,754,513 | ||||||
| Multi-Line Insurance–0.62% | ||||||||
American International Group, Inc. | 1,481,266 | 89,586,968 | ||||||
| Oil & Gas Equipment & Services–1.59% | ||||||||
Baker Hughes, a GE Co. | 2,431,114 | 82,414,765 | ||||||
TechnipFMC PLC (United Kingdom)(b) | 5,680,987 | 146,739,894 | ||||||
| 229,154,659 | ||||||||
| Oil & Gas Exploration & Production–3.05% | ||||||||
Apache Corp. | 4,003,989 | 155,514,933 | ||||||
Canadian Natural Resources Ltd. (Canada) | 4,644,359 | 143,083,600 | ||||||
Devon Energy Corp. | 4,518,063 | 141,867,178 | ||||||
| 440,465,711 | ||||||||
| Other Diversified Financial Services–0.47% | ||||||||
Voya Financial, Inc. | 1,767,151 | 67,558,183 | ||||||
| Packaged Foods & Meats–0.77% | ||||||||
Mondelez International, Inc.–Class A | 2,727,007 | 110,880,105 | ||||||
| Pharmaceuticals–4.30% | ||||||||
Bristol-Myers Squibb Co. | 1,310,488 | 79,258,314 | ||||||
Merck & Co., Inc. | 2,328,618 | 148,705,546 | ||||||
Novartis AG (Switzerland) | 1,364,898 | 115,165,048 | ||||||
Pfizer Inc. | 4,921,959 | 166,952,849 | ||||||
Sanofi (France) | 1,137,185 | 111,038,276 | ||||||
| 621,120,033 | ||||||||
| Railroads–0.78% | ||||||||
CSX Corp. | 2,237,527 | 112,323,855 | ||||||
| Regional Banks–5.75% | ||||||||
BB&T Corp. | 919,772 | 42,392,291 | ||||||
Citizens Financial Group, Inc. | 6,540,246 | 216,678,350 | ||||||
Comerica Inc. | 1,541,599 | 105,214,132 | ||||||
Fifth Third Bancorp | 6,146,046 | 160,596,182 | ||||||
First Horizon National Corp. | 4,274,582 | 73,565,556 | ||||||
KeyCorp | 3,030,701 | 52,158,364 | ||||||
PNC Financial Services Group, Inc. (The) | 1,433,375 | 179,759,559 | ||||||
| 830,364,434 | ||||||||
| Semiconductors–1.51% | ||||||||
Intel Corp. | 2,886,944 | 101,245,126 | ||||||
QUALCOMM Inc. | 2,246,802 | 117,440,341 | ||||||
| 218,685,467 | ||||||||
| Systems Software–1.64% | ||||||||
Oracle Corp. | 4,708,646 | 236,986,153 | ||||||
| Tobacco–0.96% | ||||||||
Philip Morris International Inc. | 1,186,265 | 138,709,966 | ||||||
| Shares | Value | |||||||
| Wireless Telecommunication Services–0.50% | ||||||||
Vodafone Group PLC–ADR (United Kingdom) | 2,484,843 | $ | 72,134,992 | |||||
Total Common Stocks & Other Equity Interests (Cost $6,934,392,042) |
| 9,371,374,819 | ||||||
| Principal Amount | ||||||||
Bonds & Notes–19.28% |
| |||||||
| Advertising–0.03% | ||||||||
Interpublic Group of Cos., Inc. (The), Sr. Unsec. Global Notes, 2.25%, 11/15/2017 | $ | 4,145,000 | 4,150,277 | |||||
| Aerospace & Defense–0.25% | ||||||||
BAE Systems Holdings Inc. (United Kingdom), Sr. Unsec. Gtd. Notes, 2.85%, 12/15/2020(c) | 3,091,000 | 3,150,525 | ||||||
Northrop Grumman Corp., Sr. Unsec. Global Notes, 1.75%, 06/01/2018 | 17,995,000 | 18,011,510 | ||||||
Precision Castparts Corp., Sr. Unsec. Global Notes, 1.25%, 01/15/2018 | 6,465,000 | 6,463,381 | ||||||
2.50%, 01/15/2023 | 4,150,000 | 4,159,906 | ||||||
United Technologies Corp., Sr. Unsec. Global Notes, 4.05%, 05/04/2047 | 4,280,000 | 4,353,254 | ||||||
| 36,138,576 | ||||||||
| Agricultural & Farm Machinery–0.10% | ||||||||
Deere & Co., Sr. Unsec. Notes, 2.60%, 06/08/2022 | 14,645,000 | 14,939,914 | ||||||
| Agricultural Products–0.04% | ||||||||
Ingredion Inc., Sr. Unsec. Notes, 6.63%, 04/15/2037 | 3,940,000 | 5,052,254 | ||||||
| Air Freight & Logistics–0.25% | ||||||||
FedEx Corp., | ||||||||
Sr. Unsec. Gtd. Bonds, | ||||||||
4.90%, 01/15/2034 | 4,310,000 | 4,871,438 | ||||||
Sr. Unsec. Gtd. Notes, | ||||||||
5.10%, 01/15/2044 | 8,875,000 | 10,077,008 | ||||||
United Parcel Service, Inc., | ||||||||
Sr. Unsec. Global Notes, 1.13%, 10/01/2017 | 18,840,000 | 18,835,356 | ||||||
Sr. Unsec. Notes, 3.40%, 11/15/2046 | 2,608,000 | 2,531,952 | ||||||
| 36,315,754 | ||||||||
| Airlines–0.15% | ||||||||
American Airlines Pass Through Trust, Series 2014-1, Class A, Sr. Sec. First Lien Pass Through Ctfs., 3.70%, 04/01/2028 | 3,877,391 | 3,964,336 | ||||||
Continental Airlines Pass Through Trust, | ||||||||
Series 2010-1, Class A, Sr. Sec. First Lien Pass Through Ctfs., 4.75%, 01/12/2021 | 2,959,044 | 3,135,934 | ||||||
Series 2012-1, Class A, Sr. Sec. First Lien Pass Through Ctfs., 4.15%, 04/11/2024 | 4,617,970 | 4,875,313 | ||||||
See accompanying Notes to Financial Statements which are an integral part of the financial statements.
11 Invesco Equity and Income Fund
| Principal Amount | Value | |||||||
| Airlines–(continued) | ||||||||
Delta Air Lines Pass Through Trust, Series 2010-1, Class A, Sr. Sec. First Lien Pass Through Ctfs., 6.20%, 01/02/2020 | $ | 1,293,476 | $ | 1,336,842 | ||||
United Airlines Pass Through Trust, Series 2014-2, Class A, Sr. Sec. First Lien Pass Through Ctfs., 3.75%, 09/03/2026 | 4,984,706 | 5,119,602 | ||||||
Virgin Australia Pass Through Trust (Australia), Series 2013-1, Class A, Sec. Gtd. Pass Through Ctfs., 5.00%, 04/23/2025(c) | 3,435,943 | 3,581,970 | ||||||
| 22,013,997 | ||||||||
| Apparel Retail–0.01% | ||||||||
Ross Stores, Inc., Sr. Unsec. Notes, 3.38%, 09/15/2024 | 1,678,000 | 1,723,242 | ||||||
| Application Software–0.43% | ||||||||
Citrix Systems, Inc., Sr. Unsec. Conv. Bonds, 0.50%, 04/15/2019 | 21,913,000 | 25,829,949 | ||||||
Nuance Communications, Inc., Sr. Unsec. Conv. Bonds, 1.00%, 12/15/2022(d) | 29,489,000 | 28,217,287 | ||||||
RealPage, Inc., Sr. Unsec. Conv. Notes, 1.50%, 11/15/2022(c) | 6,658,000 | 8,126,921 | ||||||
| 62,174,157 | ||||||||
| Asset Management & Custody Banks–0.15% | ||||||||
Apollo Management Holdings L.P., Sr. Unsec. Gtd. Notes, 4.00%, 05/30/2024(c) | 4,260,000 | 4,379,067 | ||||||
Blackstone Holdings Finance Co. LLC, Sr. Unsec. Gtd. Notes, 5.00%, 06/15/2044(c) | 3,975,000 | 4,552,063 | ||||||
Brookfield Asset Management Inc. (Canada), Sr. Unsec. Notes, 4.00%, 01/15/2025 | 4,515,000 | 4,675,842 | ||||||
Carlyle Holdings Finance LLC, Sr. Unsec. Gtd. Notes, 3.88%, 02/01/2023(c) | 3,855,000 | 4,008,949 | ||||||
KKR Group Finance Co. III LLC, Sr. Unsec. Gtd. Bonds, 5.13%, 06/01/2044(c) | 3,217,000 | 3,536,844 | ||||||
| 21,152,765 | ||||||||
| Automobile Manufacturers–0.31% | ||||||||
Daimler Finance North America LLC (Germany), Sr. Unsec. Gtd. Notes, 1.88%, 01/11/2018(c) | 5,220,000 | 5,226,264 | ||||||
Ford Motor Credit Co. LLC, Sr. Unsec. Global Notes, 1.72%, 12/06/2017 | 14,510,000 | 14,510,058 | ||||||
3.10%, 05/04/2023 | 2,847,000 | 2,833,158 | ||||||
3.81%, 01/09/2024 | 4,473,000 | 4,575,266 | ||||||
4.13%, 08/04/2025 | 7,006,000 | 7,199,530 | ||||||
General Motors Co., Sr. Unsec. Global Notes, 6.60%, 04/01/2036 | 4,317,000 | 5,025,534 | ||||||
| Principal Amount | Value | |||||||
| Automobile Manufacturers–(continued) | ||||||||
General Motors Financial Co., Inc., Sr. Unsec. Gtd. Global Notes, 5.25%, 03/01/2026 | $ | 5,467,000 | $ | 5,963,997 | ||||
| 45,333,807 | ||||||||
| Automotive Retail–0.10% | ||||||||
Advance Auto Parts, Inc., Sr. Unsec. Gtd. Notes, 4.50%, 12/01/2023 | 6,415,000 | 6,803,842 | ||||||
5.75%, 05/01/2020 | 7,393,000 | 8,026,695 | ||||||
| 14,830,537 | ||||||||
| Biotechnology–0.56% | ||||||||
AbbVie Inc., Sr. Unsec. Global Notes, 4.50%, 05/14/2035 | 7,233,000 | 7,724,793 | ||||||
BioMarin Pharmaceutical Inc., Sr. Unsec. Sub. Conv. Notes, 1.50%, 10/15/2020 | 23,901,000 | 28,367,499 | ||||||
Celgene Corp., Sr. Unsec. Global Notes, | ||||||||
4.00%, 08/15/2023 | 4,735,000 | 5,116,184 | ||||||
4.63%, 05/15/2044 | 13,875,000 | 14,975,718 | ||||||
Gilead Sciences, Inc., Sr. Unsec. Global Notes, 4.40%, 12/01/2021 | 4,988,000 | 5,428,997 | ||||||
Neurocrine Biosciences, Inc., Sr. Unsec. Conv. Notes, 2.25%, 05/15/2024(c) | 17,930,000 | 19,599,731 | ||||||
| 81,212,922 | ||||||||
| Brewers–0.40% | ||||||||
Anheuser-Busch InBev Finance, Inc. (Belgium), Sr. Unsec. Gtd. Global Notes, | 6,754,000 | 6,897,235 | ||||||
3.30%, 02/01/2023 | 6,427,000 | 6,678,023 | ||||||
4.70%, 02/01/2036 | 10,870,000 | 12,093,136 | ||||||
4.90%, 02/01/2046 | 12,141,000 | 13,914,764 | ||||||
Heineken NV (Netherlands), Sr. Unsec. Notes, 3.50%, 01/29/2028(c) | 9,734,000 | 10,027,582 | ||||||
Molson Coors Brewing Co., Sr. Unsec. Gtd. Global Notes, | ||||||||
1.45%, 07/15/2019 | 3,501,000 | 3,472,687 | ||||||
4.20%, 07/15/2046 | 4,057,000 | 4,049,223 | ||||||
| 57,132,650 | ||||||||
| Broadcasting–0.68% | ||||||||
Liberty Media Corp., | ||||||||
1.00%, 01/30/2023(c) | 5,397,000 | 6,543,863 | ||||||
1.38%, 10/15/2023 | 61,171,000 | 75,546,185 | ||||||
Sr. Unsec. Conv. Deb., 2.25%, 10/05/2021(d) | 14,987,000 | 16,017,356 | ||||||
| 98,107,404 | ||||||||
| Cable & Satellite–0.49% | ||||||||
Charter Communications Operating, LLC/Charter Communications Operating Capital Corp., Sr. Sec. Gtd. First Lien Global Notes, 4.46%, 07/23/2022 | 10,845,000 | 11,448,546 | ||||||
See accompanying Notes to Financial Statements which are an integral part of the financial statements.
12 Invesco Equity and Income Fund
| Principal Amount | Value | |||||||
| Cable & Satellite–(continued) | ||||||||
Comcast Corp., | ||||||||
Sr. Unsec. Gtd. Global Notes, 5.70%, 05/15/2018 | $ | 4,735,000 | $ | 4,870,449 | ||||
Sr. Unsec. Gtd. Notes, 6.45%, 03/15/2037 | 2,465,000 | 3,265,471 | ||||||
DISH Network Corp., Sr. Unsec. Conv. Bonds, 3.38%, 08/15/2026 | 36,577,000 | 42,566,484 | ||||||
NBCUniversal Media LLC, Sr. Unsec. Gtd. Global Notes, | ||||||||
5.15%, 04/30/2020 | 3,320,000 | 3,604,277 | ||||||
5.95%, 04/01/2041 | 3,365,000 | 4,299,100 | ||||||
| 70,054,327 | ||||||||
| Commodity Chemicals–0.07% | ||||||||
Basell Finance Co. B.V. (Netherlands), Sr. Unsec. Gtd. Deb., 8.10%, 03/15/2027(c) | 7,384,000 | 9,936,885 | ||||||
| Communications Equipment–0.60% | ||||||||
Ciena Corp., Sr. Unsec. Conv. Bonds, 4.00%, 12/15/2020 | 14,876,000 | 19,627,022 | ||||||
Finisar Corp., Sr. Unsec. Conv. Notes, 0.50%, 12/15/2021(c)(d) | 10,562,000 | 10,179,128 | ||||||
Viavi Solutions Inc., | ||||||||
Sr. Unsec. Conv. Deb., 0.63%, 08/15/2018(d) | 34,079,000 | 36,869,218 | ||||||
Sr. Unsec. Conv. Notes, 1.00%, 03/01/2024(c) | 19,034,000 | 19,712,086 | ||||||
| 86,387,454 | ||||||||
| Construction & Engineering–0.12% | ||||||||
Valmont Industries, Inc., Sr. Unsec. Gtd. Global Notes, | ||||||||
5.00%, 10/01/2044 | 4,195,000 | 4,269,227 | ||||||
5.25%, 10/01/2054 | 13,347,000 | 13,235,946 | ||||||
| 17,505,173 | ||||||||
| Consumer Finance–0.02% | ||||||||
American Express Co., Unsec. Sub. Global Notes, 3.63%, 12/05/2024 | 3,423,000 | 3,571,728 | ||||||
| Data Processing & Outsourced Services–0.31% | ||||||||
Blackhawk Network Holdings, Inc., Sr. Unsec. Conv. Bonds, 1.50%, 01/15/2022 | 32,533,000 | 37,026,621 | ||||||
Visa Inc., Sr. Unsec. Global Notes, 4.15%, 12/14/2035 | 7,245,000 | 7,926,530 | ||||||
| 44,953,151 | ||||||||
| Diversified Banks–1.40% | ||||||||
ANZ New Zealand (Int’l) Ltd. (New Zealand), Sr. Unsec. Gtd. Notes, 2.88%, 01/25/2022(c) | 3,545,000 | 3,604,003 | ||||||
Australia and New Zealand Banking Group Ltd. (Australia), Sr. Unsec. Medium-Term Global Notes, 2.30%, 06/01/2021 | 7,448,000 | 7,477,952 | ||||||
| Principal Amount | Value | |||||||
| Diversified Banks–(continued) | ||||||||
Bank of America Corp., | ||||||||
Sr. Unsec. Global Notes, 5.75%, 12/01/2017 | $ | 2,825,000 | $ | 2,852,720 | ||||
Sr. Unsec. Medium-Term Global Notes, 3.50%, 04/19/2026 | 6,710,000 | 6,836,477 | ||||||
5.65%, 05/01/2018 | 8,680,000 | 8,897,677 | ||||||
Sr. Unsec. Medium-Term Notes, 3.25%, 10/21/2027 | 5,705,000 | 5,603,625 | ||||||
BBVA Bancomer S.A. (Mexico), Sr. Unsec. Notes, | 6,875,000 | 7,235,755 | ||||||
Citigroup Inc., | ||||||||
Sr. Unsec. Global Notes, | ||||||||
3.67%, 07/24/2028 | 5,405,000 | 5,481,432 | ||||||
Unsec. Sub. Global Notes, | ||||||||
5.30%, 05/06/2044 | 2,765,000 | 3,218,318 | ||||||
6.68%, 09/13/2043 | 8,000,000 | 10,904,236 | ||||||
Unsec. Sub. Notes, | ||||||||
4.75%, 05/18/2046 | 4,145,000 | 4,490,552 | ||||||
Commonwealth Bank of Australia (Australia), Sr. Unsec. Notes, 2.25%, 03/10/2020(c) | 10,540,000 | 10,614,676 | ||||||
HBOS PLC (United Kingdom), Unsec. Sub. Medium-Term Global Notes, 6.75%, 05/21/2018(c) | 8,535,000 | 8,812,669 | ||||||
JPMorgan Chase & Co., | ||||||||
Sr. Unsec. Global Notes, | ||||||||
3.20%, 06/15/2026 | 4,365,000 | 4,369,116 | ||||||
4.26%, 02/22/2048 | 5,355,000 | 5,676,771 | ||||||
Unsec. Sub. Global Notes, | ||||||||
4.25%, 10/01/2027 | 3,640,000 | 3,867,640 | ||||||
Series V, Jr. Unsec. Sub. Global Notes, 5.00%(e) | 6,410,000 | 6,522,175 | ||||||
Mizuho Financial Group Cayman 3 Ltd. (Japan), Unsec. Gtd. Sub. Notes, 4.60%, 03/27/2024(c) | 545,000 | 584,564 | ||||||
National Australia Bank Ltd. (Australia), | ||||||||
Sr. Unsec. Medium-Term Global Notes, | ||||||||
2.00%, 01/14/2019 | 10,015,000 | 10,055,065 | ||||||
Sr. Unsec. Notes, | ||||||||
1.88%, 07/12/2021 | 9,725,000 | 9,592,225 | ||||||
3.50%, 01/10/2027(c) | 10,625,000 | 11,035,295 | ||||||
Société Générale S.A. (France), | ||||||||
Sr. Unsec. Notes, | ||||||||
2.63%, 09/16/2020(c) | 8,565,000 | 8,692,576 | ||||||
Unsec. Sub. Notes, | ||||||||
5.00%, 01/17/2024(c) | 7,365,000 | 7,939,002 | ||||||
Standard Chartered PLC (United Kingdom), Sr. Unsec. Notes, 3.05%, 01/15/2021(c) | 7,250,000 | 7,388,849 | ||||||
Sumitomo Mitsui Banking Corp. (Japan), Sr. Unsec. Gtd. Medium-Term Global Notes, 2.65%, 07/23/2020 | 7,235,000 | 7,354,833 | ||||||
See accompanying Notes to Financial Statements which are an integral part of the financial statements.
13 Invesco Equity and Income Fund
| Principal Amount | Value | |||||||
| Diversified Banks–(continued) | ||||||||
U.S. Bancorp, Series W, Unsec. Sub. Medium-Term Notes, 3.10%, 04/27/2026 | $ | 3,245,000 | $ | 3,270,157 | ||||
Wells Fargo & Co., | ||||||||
Sr. Unsec. Medium-Term Global Notes, | ||||||||
1.50%, 01/16/2018 | 2,070,000 | 2,070,052 | ||||||
Sr. Unsec. Medium-Term Notes, | ||||||||
3.55%, 09/29/2025 | 6,840,000 | 7,094,069 | ||||||
Unsec. Sub. Medium-Term Notes, | ||||||||
4.10%, 06/03/2026 | 4,515,000 | 4,749,572 | ||||||
4.65%, 11/04/2044 | 14,430,000 | 15,403,152 | ||||||
| 201,695,205 | ||||||||
| Diversified Capital Markets–0.55% | ||||||||
Credit Suisse AG (Switzerland), | ||||||||
Sr. Unsec. Conv. Medium-Term Notes, 0.50%, 06/24/2024(c) | 75,750,000 | 72,417,000 | ||||||
Unsec. Sub. Notes, 6.50%, 08/08/2023(c) | 6,536,000 | 7,403,834 | ||||||
| 79,820,834 | ||||||||
| Diversified Chemicals–0.06% | ||||||||
Eastman Chemical Co., Sr. Unsec. Global Notes, 2.70%, 01/15/2020 | 8,092,000 | 8,198,466 | ||||||
| Diversified Metals & Mining–0.02% | ||||||||
Rio Tinto Finance USA Ltd. (United Kingdom), Sr. Unsec. Gtd. Global Notes, 7.13%, 07/15/2028 | 2,175,000 | 2,941,474 | ||||||
| Diversified Support Services–0.04% | ||||||||
Cintas Corp. No. 2, Sr. Unsec. Gtd. Notes, 6.13%, 12/01/2017 | 6,115,000 | 6,180,116 | ||||||
| Drug Retail–0.17% | ||||||||
CVS Health Corp., Sr. Unsec. Global Bonds, 3.38%, 08/12/2024 | 3,740,000 | 3,846,723 | ||||||
CVS Pass Through Trust, Sr. Sec. First Lien Global Pass Through Ctfs., 6.04%, 12/10/2028 | 8,005,636 | 9,162,198 | ||||||
Walgreens Boots Alliance Inc., Sr. Unsec. Global Notes, | ||||||||
3.30%, 11/18/2021 | 6,129,000 | 6,359,965 | ||||||
4.50%, 11/18/2034 | 4,519,000 | 4,779,705 | ||||||
| 24,148,591 | ||||||||
| Electric Utilities–0.31% | ||||||||
Duke Energy Corp., Sr. Unsec. Global Notes, 2.10%, 06/15/2018 | 19,000,000 | 19,053,675 | ||||||
Electricite de France S.A. (France), | ||||||||
Jr. Unsec. Sub. Notes, 5.63%(c)(e) | 6,390,000 | 6,629,625 | ||||||
Sr. Unsec. Notes, | ||||||||
4.60%, 01/27/2020(c) | 2,150,000 | 2,280,679 | ||||||
4.88%, 01/22/2044(c) | 9,110,000 | 10,014,486 | ||||||
NextEra Energy Capital Holdings Inc., Sr. Unsec. Gtd. Deb., 3.55%, 05/01/2027 | 5,572,000 | 5,799,867 | ||||||
| Principal Amount | Value | |||||||
| Electric Utilities–(continued) | ||||||||
Ohio Power Co., Series M, Sr. Unsec. Notes, 5.38%, 10/01/2021 | $ | 1,050,000 | $ | 1,175,161 | ||||
PPL Electric Utilities Corp., Sr. Sec. First Mortgage Bonds, 6.25%, 05/15/2039 | 355,000 | 483,365 | ||||||
| 45,436,858 | ||||||||
| Electrical Components & Equipment–0.18% | ||||||||
Eaton Corp., Sr. Unsec. Gtd. Global Notes, 1.50%, 11/02/2017 | 25,825,000 | 25,821,746 | ||||||
| Environmental & Facilities Services–0.03% | ||||||||
Waste Management, Inc., Sr. Unsec. Gtd. Global Notes, 3.90%, 03/01/2035 | 4,786,000 | 5,033,943 | ||||||
| Fertilizers & Agricultural Chemicals–0.02% | ||||||||
Monsanto Co., Sr. Unsec. Global Notes, 2.13%, 07/15/2019 | 3,055,000 | 3,070,555 | ||||||
| Financial Exchanges & Data–0.07% | ||||||||
Moody’s Corp., Sr. Unsec. Global Notes, 4.50%, 09/01/2022 | 9,185,000 | 9,995,305 | ||||||
| Food Retail–0.01% | ||||||||
Alimentation Couche-Tard Inc. (Canada), Sr. Unsec. Gtd. Notes, 4.50%, 07/26/2047(c) | 1,188,000 | 1,245,678 | ||||||
| Gas Utilities–0.04% | ||||||||
NiSource Finance Corp., Sr. Unsec. Gtd. Global Notes, 4.38%, 05/15/2047 | 6,015,000 | 6,448,694 | ||||||
| General Merchandise Stores–0.03% | ||||||||
Dollar General Corp., Sr. Unsec. Global Notes, 3.25%, 04/15/2023 | 3,650,000 | 3,738,093 | ||||||
| Health Care Distributors–0.08% | ||||||||
McKesson Corp., Sr. Unsec. Global Notes, 2.28%, 03/15/2019 | 11,085,000 | 11,154,569 | ||||||
| Health Care Equipment–0.88% | ||||||||
Becton, Dickinson and Co., | ||||||||
Sr. Unsec. Global Notes, 4.88%, 05/15/2044 | 7,465,000 | 7,835,753 | ||||||
Sr. Unsec. Notes, 2.68%, 12/15/2019 | 2,786,000 | 2,830,407 | ||||||
DexCom, Inc., Sr. Unsec. Conv. Notes, 0.75%, 05/15/2022(c) | 22,012,000 | 22,782,420 | ||||||
Edwards Lifesciences Corp., Sr. Unsec. Global Notes, 2.88%, 10/15/2018 | 7,055,000 | 7,131,557 | ||||||
Medtronic, Inc., Sr. Unsec. Gtd. Global Notes, | ||||||||
3.15%, 03/15/2022 | 10,944,000 | 11,374,148 | ||||||
4.38%, 03/15/2035 | 3,635,000 | 4,028,156 | ||||||
4.63%, 03/15/2044 | 5,490,000 | 6,231,493 | ||||||
NuVasive, Inc., Sr. Unsec. Conv. Bonds, 2.25%, 03/15/2021 | 20,477,000 | 24,828,363 | ||||||
See accompanying Notes to Financial Statements which are an integral part of the financial statements.
14 Invesco Equity and Income Fund
| Principal Amount | Value | |||||||
| Health Care Equipment–(continued) | ||||||||
Wright Medical Group N.V., Sr. Unsec. Conv. Bonds, 2.25%, 11/15/2021 | $ | 9,978,000 | $ | 14,904,638 | ||||
Wright Medical Group, Inc., Sr. Unsec. Conv. Bonds, 2.00%, 02/15/2020 | 22,224,000 | 25,793,730 | ||||||
| 127,740,665 | ||||||||
| Health Care Facilities–0.18% | ||||||||
Brookdale Senior Living Inc., Sr. Unsec. Conv. Notes, 2.75%, 06/15/2018 | 26,567,000 | 26,533,791 | ||||||
| Health Care REIT’s–0.09% | ||||||||
HCP, Inc., Sr. Unsec. Global Notes, | ||||||||
3.88%, 08/15/2024 | 5,085,000 | 5,288,319 | ||||||
4.20%, 03/01/2024 | 4,690,000 | 4,969,156 | ||||||
Ventas Realty L.P., Sr. Unsec. Gtd. Notes, 5.70%, 09/30/2043 | 2,080,000 | 2,496,375 | ||||||
| 12,753,850 | ||||||||
| Health Care Services–0.10% | ||||||||
Express Scripts Holding Co., Sr. Unsec. Gtd. Global Notes, 2.25%, 06/15/2019 | 5,685,000 | 5,713,098 | ||||||
Laboratory Corp. of America Holdings, Sr. Unsec. Notes, | ||||||||
3.20%, 02/01/2022 | 6,132,000 | 6,301,581 | ||||||
4.70%, 02/01/2045 | 2,694,000 | 2,852,357 | ||||||
| 14,867,036 | ||||||||
| Home Improvement Retail–0.05% | ||||||||
Home Depot, Inc. (The), Sr. Unsec. Global Notes, 2.00%, 04/01/2021 | 6,883,000 | 6,918,024 | ||||||
| Homebuilding–0.07% | ||||||||
MDC Holdings, Inc., Sr. Unsec. Gtd. Notes, 6.00%, 01/15/2043 | 10,130,000 | 9,750,125 | ||||||
| Hotel and Resort REIT’s–0.03% | ||||||||
Hospitality Properties Trust, Sr. Unsec. Notes, | ||||||||
4.50%, 06/15/2023 | 2,765,000 | 2,934,778 | ||||||
5.00%, 08/15/2022 | 1,310,000 | 1,413,739 | ||||||
| 4,348,517 | ||||||||
| Housewares & Specialties–0.04% | ||||||||
Tupperware Brands Corp., Sr. Unsec. Gtd. Global Notes, 4.75%, 06/01/2021 | 5,638,000 | 6,023,583 | ||||||
| Insurance Brokers–0.02% | ||||||||
Willis North America, Inc., Sr. Unsec. Gtd. Global Notes, 3.60%, 05/15/2024 | 2,470,000 | 2,553,530 | ||||||
| Integrated Oil & Gas–0.39% | ||||||||
Cenovus Energy Inc. (Canada), Sr. Unsec. Notes, | 6,895,000 | 6,510,604 | ||||||
| Principal Amount | Value | |||||||
| Integrated Oil & Gas–(continued) | ||||||||
Chevron Corp., Sr. Unsec. Global Notes, | ||||||||
1.37%, 03/02/2018 | $ | 14,553,000 | $ | 14,555,605 | ||||
1.72%, 06/24/2018 | 5,275,000 | 5,287,090 | ||||||
Husky Energy Inc. (Canada), Sr. Unsec. Global Notes, 3.95%, 04/15/2022 | 3,630,000 | 3,800,205 | ||||||
Occidental Petroleum Corp., Sr. Unsec. Global Notes, 3.40%, 04/15/2026 | 4,005,000 | 4,105,085 | ||||||
Petróleos Mexicanos (Mexico), Sr. Unsec. Gtd. Global Notes, 4.88%, 01/24/2022 | 7,430,000 | 7,851,883 | ||||||
Shell International Finance B.V. (Netherlands), Sr. Unsec. Gtd. Global Notes, 4.00%, 05/10/2046 | 9,844,000 | 9,999,422 | ||||||
Suncor Energy Inc. (Canada), Sr. Unsec. Notes, 3.60%, 12/01/2024 | 3,379,000 | 3,493,651 | ||||||
| 55,603,545 | ||||||||
| Integrated Telecommunication Services–0.69% | ||||||||
AT&T Inc., Sr. Unsec. Global Notes, | ||||||||
3.00%, 06/30/2022 | 5,334,000 | 5,400,422 | ||||||
3.40%, 05/15/2025 | 2,967,000 | 2,961,483 | ||||||
3.80%, 03/15/2022 | 3,340,000 | 3,495,218 | ||||||
4.50%, 05/15/2035 | 4,755,000 | 4,668,609 | ||||||
4.80%, 06/15/2044 | 10,275,000 | 10,015,304 | ||||||
4.90%, 08/14/2037 | 19,570,000 | 19,865,507 | ||||||
5.15%, 03/15/2042 | 1,370,000 | 1,398,588 | ||||||
5.35%, 09/01/2040 | 2,077,000 | 2,198,736 | ||||||
6.15%, 09/15/2034 | 3,675,000 | 4,223,738 | ||||||
Telefónica Emisiones, S.A.U. (Spain), Sr. Unsec. Gtd. Global Notes, | ||||||||
5.21%, 03/08/2047 | 6,725,000 | 7,500,745 | ||||||
7.05%, 06/20/2036 | 3,600,000 | 4,772,531 | ||||||
Verizon Communications Inc., Sr. Unsec. Global Notes, | ||||||||
4.13%, 08/15/2046 | 857,000 | 763,163 | ||||||
4.40%, 11/01/2034 | 3,285,000 | 3,300,080 | ||||||
4.52%, 09/15/2048 | 19,069,000 | 17,863,992 | ||||||
4.81%, 03/15/2039 | 5,062,000 | 5,151,015 | ||||||
5.01%, 08/21/2054 | 6,727,000 | 6,616,425 | ||||||
| 100,195,556 | ||||||||
| Internet & Direct Marketing Retail–0.60% | ||||||||
Ctrip.com International, Ltd. (China), Sr. Unsec. Conv. Notes, 1.25%, 09/15/2019(c)(d) | 30,912,000 | 33,133,800 | ||||||
Liberty Expedia Holdings, Inc., Sr. Unsec. Conv. Deb., 1.00%, 07/05/2022(c)(d) | 15,152,000 | 16,174,760 | ||||||
Liberty Interactive LLC, Sr. Unsec. Conv. Deb., 1.75%, 10/05/2023(c)(d) | 22,928,000 | 29,118,560 | ||||||
See accompanying Notes to Financial Statements which are an integral part of the financial statements.
15 Invesco Equity and Income Fund
| Principal Amount | Value | |||||||
| Internet & Direct Marketing Retail–(continued) | ||||||||
QVC, Inc., Sr. Sec. Gtd. First Lien Global Notes, 5.45%, 08/15/2034 | $ | 8,810,000 | $ | 8,683,964 | ||||
| 87,111,084 | ||||||||
| Internet Software & Services–0.20% | ||||||||
eBay Inc., Sr. Unsec. Global Notes, 2.50%, 03/09/2018 | 18,235,000 | 18,317,449 | ||||||
WebMD Health Corp., Unsec. Conv. Bonds, 2.63%, 06/15/2023 | 9,845,000 | 9,874,043 | ||||||
| 28,191,492 | ||||||||
| Investment Banking & Brokerage–1.32% | ||||||||
Goldman Sachs Group, Inc. (The), | ||||||||
Sr. Unsec. Global Notes, 5.25%, 07/27/2021 | 5,510,000 | 6,075,976 | ||||||
Unsec. Sub. Notes, 4.25%, 10/21/2025 | 5,807,000 | 6,084,345 | ||||||
Series 0000, Sr. Unsec. Exchangeable Basket-Linked Conv. Medium-Term Notes, 1.00%, 09/28/2020(c)(f) | 59,890,000 | 81,919,339 | ||||||
GS Finance Corp., Series 0001, Sr. Unsec. Conv. Medium-Term Notes, 0.25%, 07/08/2024 | 56,790,000 | 55,827,409 | ||||||
Jefferies Group LLC, Sr. Unsec. Conv. Deb., 3.88%, 11/01/2017(d) | 33,155,000 | 33,279,331 | ||||||
Morgan Stanley, Sr. Unsec. Medium-Term Global Notes, 4.00%, 07/23/2025 | 6,870,000 | 7,241,530 | ||||||
| 190,427,930 | ||||||||
| IT Consulting & Other Services–0.04% | ||||||||
DXC Technology Co., Sr. Unsec. Global Notes, 4.45%, 09/18/2022 | 4,954,000 | 5,296,336 | ||||||
| Life & Health Insurance–0.57% | ||||||||
Athene Global Funding, Sec. Notes, | ||||||||
2.88%, 10/23/2018(c) | 6,568,000 | 6,635,187 | ||||||
4.00%, 01/25/2022(c) | 12,280,000 | 12,831,329 | ||||||
Jackson National Life Global Funding, Sr. Sec. Notes, | ||||||||
2.10%, 10/25/2021(c) | 5,295,000 | 5,226,184 | ||||||
3.25%, 01/30/2024(c) | 4,885,000 | 5,000,105 | ||||||
Metropolitan Life Global Funding I, Sec. Notes, 2.05%, 06/12/2020(c) | 5,740,000 | 5,741,553 | ||||||
Nationwide Financial Services Inc., Sr. Unsec. Notes, 5.30%, 11/18/2044(c) | 9,220,000 | 10,852,424 | ||||||
Prudential Financial, Inc., | ||||||||
Sr. Unsec. Medium-Term Notes, 5.10%, 08/15/2043 | 4,010,000 | 4,720,768 | ||||||
Series D, Sr. Unsec. Medium-Term Notes, | ||||||||
6.00%, 12/01/2017 | 15,764,000 | 15,931,540 | ||||||
6.63%, 12/01/2037 | 3,475,000 | 4,701,844 | ||||||
| Principal Amount | Value | |||||||
| Life & Health Insurance–(continued) | ||||||||
Reliance Standard Life Global Funding II, Sr. Sec. First Lien Notes, 3.05%, 01/20/2021(c) | $ | 4,985,000 | $ | 5,088,165 | ||||
Teachers Insurance and Annuity Association of America, Unsec. Sub. Notes, 4.27%, 05/15/2047(c) | 4,869,000 | 5,073,169 | ||||||
| 81,802,268 | ||||||||
| Movies & Entertainment–0.10% | ||||||||
Live Nation Entertainment, Inc., Sr. Unsec. Conv. Bonds, 2.50%, 05/15/2019 | 12,111,000 | 15,017,640 | ||||||
| Multi-Line Insurance–0.12% | ||||||||
American Financial Group, Inc., Sr. Unsec. Notes, 4.50%, 06/15/2047 | 5,075,000 | 5,366,528 | ||||||
American International Group, Inc., Sr. Unsec. Global Notes, | ||||||||
2.30%, 07/16/2019 | 3,855,000 | 3,885,601 | ||||||
4.38%, 01/15/2055 | 7,405,000 | 7,403,293 | ||||||
| 16,655,422 | ||||||||
| Office REIT’s–0.06% | ||||||||
Government Properties Income Trust, Sr. Unsec. Global Notes, 4.00%, 07/15/2022 | 7,200,000 | 7,240,281 | ||||||
Highwoods Realty L.P., Sr. Unsec. Notes, 3.20%, 06/15/2021 | 1,650,000 | 1,681,051 | ||||||
| 8,921,332 | ||||||||
| Office Services & Supplies–0.04% | ||||||||
Pitney Bowes Inc., Sr. Unsec. Global Notes, 4.63%, 03/15/2024 | 5,065,000 | 5,190,409 | ||||||
| Oil & Gas Drilling–0.16% | ||||||||
Ensco Jersey Finance Ltd., Sr. Unsec. Gtd. Conv. Notes, | 19,995,000 | 14,754,410 | ||||||
Nabors Industries Inc., Sr. Unsec. Gtd. Conv. Notes, 0.75%, 01/15/2024(c) | 10,882,000 | 7,916,655 | ||||||
| 22,671,065 | ||||||||
| Oil & Gas Equipment & Services–0.28% | ||||||||
Helix Energy Solutions Group, Inc., Sr. Unsec. Conv. Notes, 4.25%, 05/01/2022 | 10,666,000 | 10,319,355 | ||||||
Weatherford International Ltd., Sr. Unsec. Gtd. Conv. Notes, 5.88%, 07/01/2021 | 30,170,000 | 30,207,712 | ||||||
| 40,527,067 | ||||||||
| Oil & Gas Exploration & Production–0.28% | ||||||||
Anadarko Petroleum Corp., Sr. Unsec. Notes, 6.60%, 03/15/2046 | 4,830,000 | 5,861,589 | ||||||
Chesapeake Energy Corp., Sr. Unsec. Gtd. Conv. Notes, | 10,145,000 | 8,515,459 | ||||||
See accompanying Notes to Financial Statements which are an integral part of the financial statements.
16 Invesco Equity and Income Fund
| Principal Amount | Value | |||||||
| Oil & Gas Exploration & Production–(continued) | ||||||||
ConocoPhillips Co., Sr. Unsec. Gtd. Global Notes, | ||||||||
2.88%, 11/15/2021 | $ | 8,738,000 | $ | 8,978,776 | ||||
4.15%, 11/15/2034 | 9,367,000 | 9,579,425 | ||||||
Noble Energy, Inc., Sr. Unsec. Global Notes, 5.25%, 11/15/2043 | 7,940,000 | 8,198,876 | ||||||
| 41,134,125 | ||||||||
| Oil & Gas Storage & Transportation–0.67% | ||||||||
Enable Midstream Partners, LP, Sr. Unsec. Global Notes, 2.40%, 05/15/2019 | 4,395,000 | 4,370,770 | ||||||
Enbridge Inc. (Canada), Sr. Unsec. Global Notes, 5.50%, 12/01/2046 | 4,308,000 | 5,010,088 | ||||||
Energy Transfer, LP, Sr. Unsec. Notes, 4.90%, 03/15/2035 | 3,640,000 | 3,651,215 | ||||||
Enterprise Products Operating LLC, | ||||||||
Sr. Unsec. Gtd. Global Bonds, 6.45%, 09/01/2040 | 555,000 | 706,542 | ||||||
Sr. Unsec. Gtd. Global Notes, 5.25%, 01/31/2020 | 2,889,000 | 3,116,561 | ||||||
Sr. Unsec. Gtd. Notes, 2.55%, 10/15/2019 | 3,770,000 | 3,821,321 | ||||||
Series N, Sr. Unsec. Gtd. Notes, 6.50%, 01/31/2019 | 4,420,000 | 4,691,958 | ||||||
Kinder Morgan Inc., Sr. Unsec. Gtd. Notes, 5.30%, 12/01/2034 | 4,203,000 | 4,411,996 | ||||||
MPLX LP, | ||||||||
Sr. Unsec. Global Bonds, 4.50%, 07/15/2023 | 18,525,000 | 19,712,536 | ||||||
Sr. Unsec. Global Notes, 5.50%, 02/15/2023 | 7,610,000 | 7,829,415 | ||||||
Plains All American Pipeline L.P./ PAA Finance Corp., Sr. Unsec. Global Notes, 3.65%, 06/01/2022 | 4,275,000 | 4,325,082 | ||||||
Spectra Energy Partners, L.P., Sr. Unsec. Global Notes, 4.50%, 03/15/2045 | 5,468,000 | 5,554,988 | ||||||
Sunoco Logistics Partners Operations L.P., Sr. Unsec. Gtd. Notes, | ||||||||
5.30%, 04/01/2044 | 8,165,000 | 8,061,206 | ||||||
5.50%, 02/15/2020 | 5,405,000 | 5,812,440 | ||||||
Texas Eastern Transmission L.P., Sr. Unsec. Notes, 7.00%, 07/15/2032 | 3,835,000 | 5,021,710 | ||||||
Western Gas Partners, LP, Sr. Unsec. Notes, 5.45%, 04/01/2044 | 9,710,000 | 10,010,656 | ||||||
| 96,108,484 | ||||||||
| Other Diversified Financial Services–0.33% | ||||||||
ERAC USA Finance LLC, Sr. Unsec. Gtd. Notes, 2.35%, 10/15/2019(c) | 9,335,000 | 9,385,764 | ||||||
MassMutual Global Funding II, | ||||||||
Sec. Notes, 2.00%, 04/15/2021(c) | 10,205,000 | 10,163,685 | ||||||
Sr. Sec. Notes, 2.10%, 08/02/2018(c) | 25,000,000 | 25,116,387 | ||||||
| Principal Amount | Value | |||||||
| Other Diversified Financial Services–(continued) | ||||||||
SMBC Aviation Capital Finance DAC (Ireland), Sr. Unsec. Gtd. Notes, 2.65%, 07/15/2021(c) | $ | 3,225,000 | $ | 3,214,164 | ||||
| 47,880,000 | ||||||||
| Packaged Foods & Meats–0.06% | ||||||||
General Mills, Inc., Sr. Unsec. Global Notes, 2.20%, 10/21/2019 | 8,595,000 | 8,652,926 | ||||||
Mead Johnson Nutrition Co. (United Kingdom), Sr. Unsec. Gtd. Global Notes, 4.13%, 11/15/2025 | 648,000 | 706,120 | ||||||
| 9,359,046 | ||||||||
| Paper Packaging–0.11% | ||||||||
International Paper Co., Sr. Unsec. Global Notes, 6.00%, 11/15/2041 | 2,855,000 | 3,491,165 | ||||||
Packaging Corp. of America, Sr. Unsec. Global Notes, 4.50%, 11/01/2023 | 11,003,000 | 12,019,375 | ||||||
| 15,510,540 | ||||||||
| Pharmaceuticals–0.68% | ||||||||
Allergan Funding SCS, Sr. Unsec. Gtd. Global Notes, 4.85%, 06/15/2044 | 9,265,000 | 10,266,500 | ||||||
Bayer US Finance LLC (Germany), Sr. Unsec. Gtd. Notes, 3.00%, 10/08/2021(c) | 6,079,000 | 6,238,230 | ||||||
Jazz Investments I Ltd., Sr. Unsec. Gtd. Conv. Bonds, 1.88%, 08/15/2021 | 14,556,000 | 15,511,238 | ||||||
Medicines Co. (The), Sr. Unsec. Conv. Bonds, 2.75%, 07/15/2023 | 9,593,000 | 10,078,646 | ||||||
Mylan N.V., Sr. Unsec. Gtd. Global Notes, | ||||||||
3.15%, 06/15/2021 | 4,535,000 | 4,581,316 | ||||||
5.25%, 06/15/2046 | 6,205,000 | 6,696,014 | ||||||
Pacira Pharmaceuticals, Inc., Sr. Unsec. Conv. Notes, 2.38%, 04/01/2022(c) | 7,610,000 | 7,500,606 | ||||||
Perrigo Finance Unlimited Co., Sr. Unsec. Gtd. Global Notes, 3.50%, 03/15/2021 | 520,000 | 535,631 | ||||||
Roche Holdings, Inc. (Switzerland), Sr. Unsec. Gtd. Notes, 1.35%, 09/29/2017(c) | 28,640,000 | 28,639,427 | ||||||
Teva Pharmaceutical Finance Netherlands III B.V. (Israel), Sr. Unsec. Gtd. Global Notes, 2.80%, 07/21/2023 | 3,755,000 | 3,539,538 | ||||||
Zoetis Inc., Sr. Unsec. Global Notes, 4.70%, 02/01/2043 | 4,101,000 | 4,479,237 | ||||||
| 98,066,383 | ||||||||
| Property & Casualty Insurance–0.34% | ||||||||
Allstate Corp. (The), Sr. Unsec. Bonds, 3.28%, 12/15/2026 | 3,260,000 | 3,358,089 | ||||||
See accompanying Notes to Financial Statements which are an integral part of the financial statements.
17 Invesco Equity and Income Fund
| Principal Amount | Value | |||||||
| Property & Casualty Insurance–(continued) | ||||||||
CNA Financial Corp., | ||||||||
Sr. Unsec. Global Bonds, 5.88%, 08/15/2020 | $ | 4,915,000 | $ | 5,407,608 | ||||
Sr. Unsec. Notes, 7.35%, 11/15/2019 | 425,000 | 474,991 | ||||||
Liberty Mutual Group Inc., Sr. Unsec. Gtd. Bonds, 4.85%, 08/01/2044(c) | 9,030,000 | 9,960,939 | ||||||
Markel Corp., Sr. Unsec. Notes, 5.00%, 03/30/2043 | 4,185,000 | 4,709,353 | ||||||
Old Republic International Corp., Sr. Unsec. Conv. Notes, 3.75%, 03/15/2018 | 9,510,000 | 11,911,275 | ||||||
Travelers Cos., Inc. (The), Sr. Unsec. Global Notes, 4.60%, 08/01/2043 | 6,455,000 | 7,469,348 | ||||||
WR Berkley Corp., Sr. Unsec. Global Notes, 4.63%, 03/15/2022 | 5,040,000 | 5,500,734 | ||||||
| 48,792,337 | ||||||||
| Railroads–0.17% | ||||||||
Burlington Northern Santa Fe, LLC, Sr. Unsec. Deb., 5.15%, 09/01/2043 | 9,530,000 | 11,497,888 | ||||||
CSX Corp., Sr. Unsec. Notes, 5.50%, 04/15/2041 | 1,660,000 | 2,020,371 | ||||||
Union Pacific Corp., Sr. Unsec. Notes, | ||||||||
4.15%, 01/15/2045 | 4,410,000 | 4,662,243 | ||||||
4.85%, 06/15/2044 | 5,560,000 | 6,523,579 | ||||||
| 24,704,081 | ||||||||
| Regional Banks–0.06% | ||||||||
Citizens Financial Group, Inc., Sr. Unsec. Global Notes, 2.38%, 07/28/2021 | 4,700,000 | 4,685,188 | ||||||
SunTrust Banks, Inc., Unsec. Sub. Global Notes, 3.30%, 05/15/2026 | 4,670,000 | 4,677,853 | ||||||
| 9,363,041 | ||||||||
| Reinsurance–0.06% | ||||||||
Reinsurance Group of America, Inc., Sr. Unsec. Medium-Term Notes, 4.70%, 09/15/2023 | 7,510,000 | 8,201,596 | ||||||
| Renewable Electricity–0.04% | ||||||||
Oglethorpe Power Corp., Sr. Sec. First Mortgage Bonds, 4.55%, 06/01/2044 | 5,806,000 | 5,979,097 | ||||||
| Retail REIT’s–0.00% | ||||||||
Brixmor Operating Partnership LP, Sr. Unsec. Notes, 3.88%, 08/15/2022 | 435,000 | 449,889 | ||||||
| Semiconductors–0.74% | ||||||||
Broadcom Corp./Broadcom Cayman Finance Ltd., Sr. Unsec. Gtd. Notes, 3.63%, 01/15/2024(c) | 14,575,000 | 15,025,914 | ||||||
| Principal Amount | Value | |||||||
| Semiconductors–(continued) | ||||||||
Intel Corp., Sr. Unsec. Global Notes, 1.35%, 12/15/2017 | $ | 8,126,000 | $ | 8,128,076 | ||||
Microchip Technology Inc., Sr. Unsec. Sub. Conv. Notes, 1.63%, 02/15/2027(c) | 25,511,000 | 30,485,645 | ||||||
Micron Technology, Inc., Series G, Sr. Unsec. Conv. Global Bonds, 3.00%, 11/15/2028(d) | 18,381,000 | 21,632,140 | ||||||
ON Semiconductor Corp., Sr. Unsec. Gtd. Conv. Bonds, 1.00%, 12/01/2020 | 20,246,000 | 23,282,900 | ||||||
Silicon Laboratories Inc., Sr. Unsec. Conv. Notes, 1.38%, 03/01/2022(c) | 5,936,000 | 6,466,530 | ||||||
Texas Instruments Inc., Sr. Unsec. Notes, 2.63%, 05/15/2024 | 2,275,000 | 2,291,364 | ||||||
| 107,312,569 | ||||||||
| Specialized Finance–0.43% | ||||||||
AerCap Ireland Capital DAC/AerCap Global Aviation Trust (Netherlands), Sr. Unsec. Gtd. Global Notes, 3.95%, 02/01/2022 | 4,189,000 | 4,387,978 | ||||||
Air Lease Corp., Sr. Unsec. Global Notes, | ||||||||
2.63%, 09/04/2018 | 11,615,000 | 11,698,181 | ||||||
3.00%, 09/15/2023 | 6,731,000 | 6,741,346 | ||||||
4.25%, 09/15/2024 | 4,355,000 | 4,618,889 | ||||||
Aviation Capital Group Corp., Sr. Unsec. Notes, | ||||||||
2.88%, 09/17/2018(c) | 12,280,000 | 12,389,703 | ||||||
2.88%, 01/20/2022(c) | 13,901,000 | 13,987,937 | ||||||
4.88%, 10/01/2025(c) | 7,745,000 | 8,518,028 | ||||||
| 62,342,062 | ||||||||
| Specialized REIT’s–0.28% | ||||||||
Crown Castle International Corp., Sr. Unsec. Global Notes, 4.75%, 05/15/2047 | 470,000 | 486,652 | ||||||
Crown Castle Towers LLC, Sr. Sec. Gtd. First Lien Notes, | ||||||||
4.88%, 08/15/2020(c) | 5,425,000 | 5,775,084 | ||||||
6.11%, 01/15/2020(c) | 6,300,000 | 6,776,072 | ||||||
EPR Properties, Sr. Unsec. Gtd. Global Notes, 4.75%, 12/15/2026 | 21,780,000 | 22,678,850 | ||||||
Life Storage, Inc., Sr. Unsec. Gtd. Global Notes, 3.50%, 07/01/2026 | 4,667,000 | 4,509,260 | ||||||
| 40,225,918 | ||||||||
| Specialty Chemicals–0.01% | ||||||||
Sherwin-Williams Co. (The), Sr. Unsec. Global Notes, 4.50%, 06/01/2047 | 1,665,000 | 1,748,877 | ||||||
See accompanying Notes to Financial Statements which are an integral part of the financial statements.
18 Invesco Equity and Income Fund
| Principal Amount | Value | |||||||
| Systems Software–0.32% | ||||||||
FireEye, Inc., | ||||||||
Series A, Sr. Unsec. Conv. Bonds, 1.00%, 06/01/2020(d) | $ | 11,739,000 | $ | 11,034,660 | ||||
Series B, Sr. Unsec. Conv. Bonds, 1.63%, 06/01/2022(d) | 11,739,000 | 10,748,522 | ||||||
Microsoft Corp., Sr. Unsec. Global Notes, 3.50%, 02/12/2035 | 4,259,000 | 4,364,704 | ||||||
Oracle Corp., Sr. Unsec. Global Notes, | ||||||||
1.90%, 09/15/2021 | 13,245,000 | 13,218,503 | ||||||
4.30%, 07/08/2034 | 6,045,000 | 6,610,619 | ||||||
| 45,977,008 | ||||||||
| Technology Distributors–0.06% | ||||||||
Avnet, Inc., Sr. Unsec. Global Notes, 4.63%, 04/15/2026 | 7,645,000 | 7,997,056 | ||||||
| Technology Hardware, Storage & Peripherals–0.32% | ||||||||
Apple Inc., Sr. Unsec. Global Notes, | ||||||||
2.15%, 02/09/2022 | 7,303,000 | 7,330,032 | ||||||
3.35%, 02/09/2027 | 3,495,000 | 3,617,346 | ||||||
Dell International LLC/ EMC Corp., Sr. Sec. Gtd. First Lien Notes, | ||||||||
5.45%, 06/15/2023(c) | 7,237,000 | 7,928,575 | ||||||
8.35%, 07/15/2046(c) | 278,000 | 360,956 | ||||||
SanDisk Corp., Sr. Unsec. Gtd. Conv. Bonds, 0.50%, 10/15/2020 | 24,327,000 | 23,517,398 | ||||||
Seagate HDD Cayman, Sr. Unsec. Gtd. Global Bonds, 5.75%, 12/01/2034 | 3,007,000 | 2,811,545 | ||||||
| 45,565,852 | ||||||||
| Tobacco–0.12% | ||||||||
Philip Morris International Inc., Sr. Unsec. Global Notes, | ||||||||
3.60%, 11/15/2023 | 3,940,000 | 4,149,606 | ||||||
4.88%, 11/15/2043 | 11,740,000 | 13,270,943 | ||||||
| 17,420,549 | ||||||||
| Wireless Telecommunication Services–0.09% | ||||||||
América Móvil, S.A.B. de C.V. (Mexico), Sr. Unsec. Global Notes, 4.38%, 07/16/2042 | 6,610,000 | 6,952,689 | ||||||
Rogers Communications Inc. (Canada), Sr. Unsec. Gtd. Global Notes, 4.50%, 03/15/2043 | 6,080,000 | 6,611,848 | ||||||
| 13,564,537 | ||||||||
Total Bonds & Notes | 2,784,420,415 | |||||||
U.S. Treasury Securities–10.05% |
| |||||||
| U.S. Treasury Bills–0.01% | ||||||||
1.11%, 02/01/2018(g)(h) | 1,140,000 | 1,134,967 | ||||||
| Principal Amount | Value | |||||||
| U.S. Treasury Notes–9.49% | ||||||||
1.88%, 07/31/2022 | $ | 407,255,600 | $ | 410,341,824 | ||||
2.13%, 07/31/2024 | 64,918,200 | 65,690,370 | ||||||
1.25%, 01/31/2019 | 184,665,000 | 184,603,691 | ||||||
1.38%, 07/31/2019 | 386,861,000 | 387,261,479 | ||||||
3.63%, 08/15/2019 | 58,350,000 | 60,940,419 | ||||||
3.38%, 11/15/2019 | 10,000,000 | 10,441,602 | ||||||
1.50%, 08/15/2020 | 107,550,000 | 107,766,358 | ||||||
2.25%, 08/15/2027 | 141,976,500 | 143,609,783 | ||||||
| 1,370,655,526 | ||||||||
| U.S. Treasury Bonds–0.55% | ||||||||
4.50%, 02/15/2036 | 5,000,000 | 6,582,324 | ||||||
3.00%, 05/15/2047 | 68,997,400 | 72,856,942 | ||||||
| 79,439,266 | ||||||||
Total U.S. Treasury Securities |
| 1,451,229,759 | ||||||
| Shares | ||||||||
Preferred Stocks–0.53% |
| |||||||
| Asset Management & Custody Banks–0.20% | ||||||||
AMG Capital Trust II, $2.58 Conv. Pfd. | 483,000 | 29,432,812 | ||||||
| Diversified Banks–0.03% | ||||||||
Wells Fargo & Co., Series Q, 5.85% Pfd. | 142,800 | 3,882,732 | ||||||
| Oil & Gas Storage & Transportation–0.30% | ||||||||
El Paso Energy Capital Trust I, $2.38 Conv. Pfd. | 875,900 | 42,919,100 | ||||||
Total Preferred Stocks |
| 76,234,644 | ||||||
| Principal Amount | ||||||||
U.S. Government Sponsored Agency |
| |||||||
| Federal Home Loan Mortgage Corp. (FHLMC)–0.31% | ||||||||
Unsec. Global Notes, 4.88%, 06/13/2018 | $ | 33,680,000 | 34,632,908 | |||||
6.75%, 03/15/2031 | 7,000,000 | 10,320,338 | ||||||
| 44,953,246 | ||||||||
| Federal National Mortgage Association (FNMA)–0.06% | ||||||||
Unsec. Global Notes, 6.63%, 11/15/2030 | 6,315,000 | 9,163,375 | ||||||
Total U.S. Government Sponsored Agency Securities (Cost $55,447,058) |
| 54,116,621 | ||||||
Municipal Obligations–0.07% |
| |||||||
Georgia (State of) Municipal Electric Authority (Plant Vogtle Units 3 & 4 Project J); Series 2010 A, Taxable Build America RB, 6.64%, 04/01/2057 | 2,600,000 | 3,350,750 | ||||||
Georgia (State of) Municipal Electric Authority (Plant Vogtle Units 3 & 4 Project M); Series 2010 A, Taxable Build America RB, 6.66%, 04/01/2057 | 4,980,000 | 6,297,011 | ||||||
Total Municipal Obligations |
| 9,647,761 | ||||||
See accompanying Notes to Financial Statements which are an integral part of the financial statements.
19 Invesco Equity and Income Fund
| Principal Amount | Value | |||||||
U.S. Government Sponsored Agency Mortgage-Backed Securities–0.00% |
| |||||||
| Federal Home Loan Mortgage Corp. (FHLMC)–0.00% | ||||||||
Pass Through Ctfs., 6.50%, 05/01/2029 | $ | 1 | $ | 2 | ||||
5.50%, 02/01/2037 | 25 | 28 | ||||||
| 30 | ||||||||
Federal National Mortgage Association (FNMA)–0.00% |
| |||||||
Pass Through Ctfs., 7.00%, 07/01/2018 to 07/01/2032 | 20,150 | 21,009 | ||||||
5.50%, 03/01/2021 | 47 | 49 | ||||||
8.00%, 08/01/2021 | 426 | 429 | ||||||
| 21,487 | ||||||||
Government National Mortgage Association |
| |||||||
Pass Through Ctfs., 8.00%, 06/15/2026 to 01/20/2031 | 25,034 | 26,872 | ||||||
7.50%, 12/20/2030 | 1,519 | 1,849 | ||||||
| 28,721 | ||||||||
Total U.S. Government Sponsored Agency Mortgage-Backed Securities (Cost $48,243) |
| 50,238 | ||||||
| Shares | Value | |||||||
Money Market Funds–4.02% |
| |||||||
Government & Agency | 348,746,409 | $ | 348,746,409 | |||||
Treasury Portfolio–Institutional Class, 0.90%(i) | 232,497,608 | 232,497,608 | ||||||
Total Money Market Funds |
| 581,244,017 | ||||||
TOTAL INVESTMENTS IN SECURITIES–99.21% (Cost $11,706,611,305) |
| 14,328,318,274 | ||||||
OTHER ASSETS LESS LIABILITIES–0.79% |
| 114,276,906 | ||||||
NET ASSETS–100.00% |
| $ | 14,442,595,180 | |||||
Investment Abbreviations:
| ADR | – American Depositary Receipt | |
| Conv. | – Convertible | |
| Ctfs. | – Certificates | |
| Deb. | – Debentures | |
| Gtd. | – Guaranteed | |
| Jr. | – Junior | |
| Pfd. | – Preferred | |
| RB | – Revenue Bonds | |
| REIT | – Real Estate Investment Trust | |
| Sec. | – Secured | |
| Sr. | – Senior | |
| Sub. | – Subordinated | |
| Unsec. | – Unsecured |
Notes to Schedule of Investments:
| (a) | Industry and/or sector classifications used in this report are generally according to the Global Industry Classification Standard, which was developed by and is the exclusive property and a service mark of MSCI Inc. and Standard & Poor’s. |
| (b) | Non-income producing security. |
| (c) | Security purchased or received in a transaction exempt from registration under the Securities Act of 1933, as amended (the “1933 Act”). The security may be resold pursuant to an exemption from registration under the 1933 Act, typically to qualified institutional buyers. The aggregate value of these securities at August 31, 2017 was $763,668,338, which represented 5.29% of the Fund’s Net Assets. |
| (d) | Security has an irrevocable call by the issuer or mandatory put by the holder. Maturity date reflects such call or put. |
| (e) | Perpetual bond with no specified maturity date. |
| (f) | Exchangeable for a basket of five common shares. |
| (g) | Security traded on a discount basis. The interest rate shown represents the discount rate at the time of purchase by the Fund. |
| (h) | All or a portion of the value was pledged as collateral to cover margin requirements for open futures contracts. See Note 1K and Note 4. |
| (i) | The money market fund and the Fund are affiliated by having the same investment adviser. The rate shown is the 7-day SEC standardized yield as of August 31, 2017. |
See accompanying Notes to Financial Statements which are an integral part of the financial statements.
20 Invesco Equity and Income Fund
| Open Futures Contracts | ||||||||||||||||||||
| Number of Contracts | Expiration Month | Notional Value | Value | Unrealized Appreciation (Depreciation) | ||||||||||||||||
Short Futures Contracts | ||||||||||||||||||||
U.S. Treasury 5 Year Notes | 373 | December-2017 | $ | (44,200,500 | ) | $ | (41,633 | ) | $ | (41,633 | ) | |||||||||
U.S. Treasury 10 Year Notes | 707 | December-2017 | (89,777,953 | ) | (167,257 | ) | (167,257 | ) | ||||||||||||
Total Futures Contracts — Interest Rate Risk | $ | (208,890 | ) | $ | (208,890 | ) | ||||||||||||||
| Open Forward Foreign Currency Contracts | ||||||||||||||||||||||
Settlement | Counterparty | Contract to | Unrealized Appreciation (Depreciation) | |||||||||||||||||||
| Deliver | Receive | |||||||||||||||||||||
09/01/2017 | Bank of New York Mellon (The) | AUD | 35,788,546 | USD | 28,459,052 | $ | 14,703 | |||||||||||||||
09/01/2017 | Bank of New York Mellon (The) | CHF | 40,709,095 | USD | 43,085,247 | 624,117 | ||||||||||||||||
09/01/2017 | Bank of New York Mellon (The) | GBP | 98,846,305 | USD | 129,286,518 | 1,454,165 | ||||||||||||||||
09/01/2017 | State Street Bank and Trust Co. | AUD | 35,816,827 | USD | 28,507,207 | 35,381 | ||||||||||||||||
09/01/2017 | State Street Bank and Trust Co. | CAD | 64,958,140 | USD | 52,029,572 | 8,474 | ||||||||||||||||
09/01/2017 | State Street Bank and Trust Co. | CHF | 40,724,132 | USD | 43,113,938 | 637,124 | ||||||||||||||||
09/01/2017 | State Street Bank and Trust Co. | GBP | 98,833,386 | USD | 129,334,357 | 1,518,710 | ||||||||||||||||
10/06/2017 | Bank of New York Mellon (The) | AUD | 39,199,278 | USD | 31,247,312 | 107,014 | ||||||||||||||||
10/06/2017 | Bank of New York Mellon (The) | CAD | 67,296,762 | USD | 53,951,787 | 40,014 | ||||||||||||||||
10/06/2017 | Bank of New York Mellon (The) | CHF | 41,049,307 | USD | 43,562,886 | 649,301 | ||||||||||||||||
10/06/2017 | Bank of New York Mellon (The) | EUR | 75,199,694 | USD | 90,774,599 | 1,041,005 | ||||||||||||||||
10/06/2017 | Bank of New York Mellon (The) | GBP | 100,524,576 | USD | 130,227,075 | 70,950 | ||||||||||||||||
10/06/2017 | State Street Bank and Trust Co. | AUD | 39,199,278 | USD | 31,348,371 | 108,072 | ||||||||||||||||
10/06/2017 | State Street Bank and Trust Co. | CAD | 67,296,762 | USD | 53,965,416 | 53,642 | ||||||||||||||||
10/06/2017 | State Street Bank and Trust Co. | CHF | 41,049,308 | USD | 43,557,663 | 644,078 | ||||||||||||||||
10/06/2017 | State Street Bank and Trust Co. | EUR | 75,199,694 | USD | 90,786,335 | 1,082,740 | ||||||||||||||||
10/06/2017 | State Street Bank and Trust Co. | GBP | 100,524,576 | USD | 130,280,051 | 123,927 | ||||||||||||||||
Subtotal | 8,213,417 | |||||||||||||||||||||
09/01/2017 | Bank of New York Mellon (The) | CAD | 64,967,803 | USD | 52,018,770 | (10,066 | ) | |||||||||||||||
09/01/2017 | Bank of New York Mellon (The) | EUR | 74,624,795 | USD | 87,345,338 | (1,500,396 | ) | |||||||||||||||
09/01/2017 | Bank of New York Mellon (The) | USD | 31,264,387 | AUD | 39,203,484 | (105,882 | ) | |||||||||||||||
09/01/2017 | Bank of New York Mellon (The) | USD | 53,935,615 | CAD | 67,304,097 | (35,781 | ) | |||||||||||||||
09/01/2017 | Bank of New York Mellon (The) | USD | 43,466,583 | CHF | 41,051,145 | (648,683 | ) | |||||||||||||||
09/01/2017 | Bank of New York Mellon (The) | USD | 90,590,842 | EUR | 75,212,827 | (1,045,017 | ) | |||||||||||||||
09/01/2017 | Bank of New York Mellon (The) | USD | 130,091,713 | GBP | 100,538,439 | (71,017 | ) | |||||||||||||||
09/01/2017 | State Street Bank and Trust Co. | EUR | 74,638,607 | USD | 87,436,547 | (1,425,631 | ) | |||||||||||||||
09/01/2017 | State Street Bank and Trust Co. | USD | 25,840,507 | AUD | 32,401,889 | (87,836 | ) | |||||||||||||||
09/01/2017 | State Street Bank and Trust Co. | USD | 50,195,056 | CAD | 62,621,846 | (44,957 | ) | |||||||||||||||
09/01/2017 | State Street Bank and Trust Co. | USD | 42,749,055 | CHF | 40,382,082 | (629,012 | ) | |||||||||||||||
09/01/2017 | State Street Bank and Trust Co. | USD | 89,228,721 | EUR | 74,050,575 | (1,066,634 | ) | |||||||||||||||
09/01/2017 | State Street Bank and Trust Co. | USD | 125,739,636 | GBP | 97,141,251 | (112,331 | ) | |||||||||||||||
Subtotal | (6,783,243 | ) | ||||||||||||||||||||
Total Forward Foreign Currency Contracts — Currency Risk | $ | 1,430,174 | ||||||||||||||||||||
Currency Abbreviations:
| AUD | – Australian Dollar | |
| EUR | – Euro | |
| CAD | – Canadian Dollar | |
| GBP | – British Pound Sterling | |
| CHF | – Swiss Franc | |
| USD | – U.S. Dollar |
See accompanying Notes to Financial Statements which are an integral part of the financial statements.
21 Invesco Equity and Income Fund
Statement of Assets and Liabilities
August 31, 2017
Assets: |
| |||
Investments in securities, at value | $ | 13,747,074,257 | ||
Investments in affiliated money market funds, at value and cost | 581,244,017 | |||
Other investments: | ||||
Unrealized appreciation on forward foreign currency contracts outstanding | 8,213,417 | |||
Foreign currencies, at value (Cost $1,397,402) | 1,408,198 | |||
Receivable for: | ||||
Investments sold | 111,687,725 | |||
Fund shares sold | 14,323,324 | |||
Dividends and interest | 40,773,675 | |||
Fund expenses absorbed | 40,327 | |||
Investment for trustee deferred compensation and retirement plans | 1,325,094 | |||
Other assets | 202,052 | |||
Total assets | 14,506,292,086 | |||
Liabilities: | ||||
Other investments: | ||||
Variation margin payable — futures contracts | 147,742 | |||
Unrealized depreciation on forward foreign currency contracts outstanding | 6,783,243 | |||
Payable for: | ||||
Investments purchased | 24,167,971 | |||
Fund shares reacquired | 19,748,070 | |||
Accrued fees to affiliates | 10,405,823 | |||
Accrued trustees’ and officers’ fees and benefits | 29,827 | |||
Accrued other operating expenses | 902,459 | |||
Trustee deferred compensation and retirement plans | 1,511,771 | |||
Total liabilities | 63,696,906 | |||
Net assets applicable to shares outstanding | $ | 14,442,595,180 | ||
Net assets consist of: | ||||
Shares of beneficial interest | $ | 11,253,633,559 | ||
Undistributed net investment income | 75,105,981 | |||
Undistributed net realized gain | 490,827,285 | |||
Net unrealized appreciation | 2,623,028,355 | |||
| $ | 14,442,595,180 | |||
Net Assets: |
| |||
Class A | $ | 10,072,836,193 | ||
Class B | $ | 93,616,648 | ||
Class C | $ | 1,559,156,416 | ||
Class R | $ | 214,107,462 | ||
Class Y | $ | 1,202,149,322 | ||
Class R5 | $ | 457,500,224 | ||
Class R6 | $ | 843,228,915 | ||
Shares outstanding, no par value, |
| |||
Class A | 919,183,650 | |||
Class B | 8,751,544 | |||
Class C | 144,952,116 | |||
Class R | 19,443,729 | |||
Class Y | 109,659,309 | |||
Class R5 | 41,726,783 | |||
Class R6 | 76,933,927 | |||
Class A: | ||||
Net asset value per share | $ | 10.96 | ||
Maximum offering price per share | ||||
(Net asset value of $10.96 ¸ 94.50%) | $ | 11.60 | ||
Class B: | ||||
Net asset value and offering price per share | $ | 10.70 | ||
Class C: | ||||
Net asset value and offering price per share | $ | 10.76 | ||
Class R: | ||||
Net asset value and offering price per share | $ | 11.01 | ||
Class Y: | ||||
Net asset value and offering price per share | $ | 10.96 | ||
Class R5: | ||||
Net asset value and offering price per share | $ | 10.96 | ||
Class R6: | ||||
Net asset value and offering price per share | $ | 10.96 | ||
See accompanying Notes to Financial Statements which are an integral part of the financial statements.
22 Invesco Equity and Income Fund
Statement of Operations
For the year ended August 31, 2017
Investment income: |
| |||
Dividends (net of foreign withholding taxes of $5,393,259) | $ | 261,925,551 | ||
Dividends from affiliated money market funds | 4,062,654 | |||
Interest | 103,239,545 | |||
Total investment income | 369,227,750 | |||
Expenses: | ||||
Advisory fees | 50,296,351 | |||
Administrative services fees | 907,897 | |||
Custodian fees | 360,653 | |||
Distribution fees: | ||||
Class A | 25,532,925 | |||
Class B | 1,387,117 | |||
Class C | 16,364,336 | |||
Class R | 1,101,434 | |||
Transfer agent fees — A, B, C, R and Y | 21,450,888 | |||
Transfer agent fees — R5 | 465,336 | |||
Transfer agent fees — R6 | 16,483 | |||
Trustees’ and officers’ fees and benefits | 251,085 | |||
Registration and filing fees | 383,763 | |||
Reports to shareholders | 2,945,353 | |||
Professional services fees | 155,463 | |||
Other | 261,804 | |||
Total expenses | 121,880,888 | |||
Less: Fees waived and expense offset arrangements | (846,073 | ) | ||
Net expenses | 121,034,815 | |||
Net investment income | 248,192,935 | |||
Realized and unrealized gain (loss) from: | ||||
Net realized gain (loss) from: | ||||
Investment securities | 775,366,102 | |||
Foreign currencies | 81,037 | |||
Forward foreign currency contracts | (14,844,914 | ) | ||
Futures contracts | 2,621,286 | |||
| 763,223,511 | ||||
Change in net unrealized appreciation (depreciation) of: | ||||
Investment securities | 573,891,878 | |||
Foreign currencies | 164,945 | |||
Forward foreign currency contracts | 622,280 | |||
Futures contracts | (107,808 | ) | ||
| 574,571,295 | ||||
Net realized and unrealized gain | 1,337,794,806 | |||
Net increase in net assets resulting from operations | $ | 1,585,987,741 | ||
See accompanying Notes to Financial Statements which are an integral part of the financial statements.
23 Invesco Equity and Income Fund
Statement of Changes in Net Assets
For the years ended August 31, 2017 and 2016
| 2017 | 2016 | |||||||
Operations: | ||||||||
Net investment income | $ | 248,192,935 | $ | 197,072,644 | ||||
Net realized gain | 763,223,511 | 252,814,425 | ||||||
Change in net unrealized appreciation | 574,571,295 | 494,926,481 | ||||||
Net increase in net assets resulting from operations | 1,585,987,741 | 944,813,550 | ||||||
Distributions to shareholders from net investment income: | ||||||||
Class A | (169,498,459 | ) | (222,853,216 | ) | ||||
Class B | (1,359,803 | ) | (3,554,960 | ) | ||||
Class C | (15,380,179 | ) | (25,203,954 | ) | ||||
Class R | (3,101,312 | ) | (4,452,755 | ) | ||||
Class Y | (21,448,254 | ) | (19,670,021 | ) | ||||
Class R5 | (9,190,623 | ) | (10,976,207 | ) | ||||
Class R6 | (7,406,037 | ) | (5,588,890 | ) | ||||
Total distributions from net investment income | (227,384,667 | ) | (292,300,003 | ) | ||||
Distributions to shareholders from net realized gains: | ||||||||
Class A | (281,349,739 | ) | (266,959,798 | ) | ||||
Class B | (4,439,637 | ) | (6,706,307 | ) | ||||
Class C | (45,908,574 | ) | (45,979,734 | ) | ||||
Class R | (6,061,572 | ) | (5,987,733 | ) | ||||
Class Y | (26,547,489 | ) | (21,242,026 | ) | ||||
Class R5 | (12,633,277 | ) | (11,414,804 | ) | ||||
Class R6 | (8,532,886 | ) | (5,223,400 | ) | ||||
Total distributions from net realized gains | (385,473,174 | ) | (363,513,802 | ) | ||||
Share transactions–net: | ||||||||
Class A | (693,182,487 | ) | (40,076,603 | ) | ||||
Class B | (90,341,086 | ) | (97,900,446 | ) | ||||
Class C | (189,427,218 | ) | (63,183,954 | ) | ||||
Class R | (17,470,628 | ) | (9,951,615 | ) | ||||
Class Y | 308,959,319 | 19,381,690 | ||||||
Class R5 | (12,693,984 | ) | 17,236,654 | |||||
Class R6 | 540,221,341 | 81,852,496 | ||||||
Net increase (decrease) in net assets resulting from share transactions | (153,934,743 | ) | (92,641,778 | ) | ||||
Net increase in net assets | 819,195,157 | 196,357,967 | ||||||
Net assets: | ||||||||
Beginning of year | 13,623,400,023 | 13,427,042,056 | ||||||
End of year (includes undistributed net investment income of $75,105,981 and $(12,637,529), respectively) | $ | 14,442,595,180 | $ | 13,623,400,023 | ||||
Notes to Financial Statements
August 31, 2017
NOTE 1—Significant Accounting Policies
Invesco Equity and Income Fund (the “Fund”) is a series portfolio of AIM Counselor Series Trust (Invesco Counselor Series Trust) (the “Trust”). The Trust is a Delaware statutory trust registered under the Investment Company Act of 1940, as amended (the “1940 Act”), as an open-end series management investment company consisting of fourteen separate portfolios, each authorized to issue an unlimited number of shares of beneficial interest. The assets, liabilities and operations of each portfolio are accounted for separately. Information presented in these financial statements pertains only to the Fund. Matters affecting each portfolio or class will be voted on exclusively by the shareholders of such portfolio or class.
The Fund’s investment objective is current income and, secondarily, capital appreciation.
The Fund currently consists of seven different classes of shares: Class A, Class B, Class C, Class R, Class Y, Class R5 and Class R6. Class Y shares are available only to certain investors. Class A shares are sold with a front-end sales charge unless certain waiver criteria are met and under certain
24 Invesco Equity and Income Fund
circumstances load waived shares may be subject to contingent deferred sales charges (“CDSC”). Class C shares are sold with a CDSC. Class R, Class Y, Class R5 and Class R6 shares are sold at net asset value. Effective November 30, 2010, new or additional investments in Class B shares are no longer permitted. Existing shareholders of Class B shares may continue to reinvest dividends and capital gains distributions in Class B shares until they convert to Class A shares. Also, shareholders in Class B shares will be able to exchange those shares for Class B shares of other Invesco Funds offering such shares until they convert to Class A shares. Generally, Class B shares will automatically convert to Class A shares on or about the month-end, which is at least eight years after the date of purchase. Redemption of Class B shares prior to the conversion date will be subject to a CDSC.
The Fund is an investment company and accordingly follows the investment company accounting and reporting guidance in accordance with Financial Accounting Standards Board Accounting Standards Codification Topic 946, Financial Services — Investment Companies.
The following is a summary of the significant accounting policies followed by the Fund in the preparation of its financial statements.
| A. | Security Valuations — Securities, including restricted securities, are valued according to the following policy. |
Debt obligations (including convertible securities) and unlisted equities are fair valued using an evaluated quote provided by an independent pricing service. Evaluated quotes provided by the pricing service may be determined without exclusive reliance on quoted prices, and may reflect appropriate factors such as institution-size trading in similar groups of securities, developments related to specific securities, dividend rate (for unlisted equities), yield (for debt obligations), quality, type of issue, coupon rate (for debt obligations), maturity (for debt obligations), individual trading characteristics and other market data. Pricing services generally value debt obligations assuming orderly transactions of institutional round lot size, but a Fund may hold or transact in the same securities in smaller, odd lot sizes. Odd lots often trade at lower prices than institutional round lots. Debt obligations are subject to interest rate and credit risks. In addition, all debt obligations involve some risk of default with respect to interest and/or principal payments.
A security listed or traded on an exchange (except convertible securities) is valued at its last sales price or official closing price as of the close of the customary trading session on the exchange where the security is principally traded, or lacking any sales or official closing price on a particular day, the security may be valued at the closing bid price on that day. Securities traded in the over-the-counter market are valued based on prices furnished by independent pricing services or market makers. When such securities are valued by an independent pricing service they may be considered fair valued. Futures contracts are valued at the final settlement price set by an exchange on which they are principally traded. Listed options are valued at the mean between the last bid and asked prices from the exchange on which they are principally traded. Options not listed on an exchange are valued by an independent source at the mean between the last bid and asked prices. For purposes of determining net asset value (“NAV”) per share, futures and option contracts generally are valued 15 minutes after the close of the customary trading session of the New York Stock Exchange (“NYSE”).
Investments in open-end and closed-end registered investment companies that do not trade on an exchange are valued at the end-of-day net asset value per share. Investments in open-end and closed-end registered investment companies that trade on an exchange are valued at the last sales price or official closing price as of the close of the customary trading session on the exchange where the security is principally traded.
Foreign securities’ (including foreign exchange contracts) prices are converted into U.S. dollar amounts using the applicable exchange rates as of the close of the NYSE. If market quotations are available and reliable for foreign exchange-traded equity securities, the securities will be valued at the market quotations. Because trading hours for certain foreign securities end before the close of the NYSE, closing market quotations may become unreliable. If between the time trading ends on a particular security and the close of the customary trading session on the NYSE, events occur that the investment adviser determines are significant and make the closing price unreliable, the Fund may fair value the security. If the event is likely to have affected the closing price of the security, the security will be valued at fair value in good faith using procedures approved by the Board of Trustees. Adjustments to closing prices to reflect fair value may also be based on a screening process of an independent pricing service to indicate the degree of certainty, based on historical data, that the closing price in the principal market where a foreign security trades is not the current value as of the close of the NYSE. Foreign securities’ prices meeting the approved degree of certainty that the price is not reflective of current value will be priced at the indication of fair value from the independent pricing service. Multiple factors may be considered by the independent pricing service in determining adjustments to reflect fair value and may include information relating to sector indices, American Depositary Receipts and domestic and foreign index futures. Foreign securities may have additional risks including exchange rate changes, potential for sharply devalued currencies and high inflation, political and economic upheaval, the relative lack of issuer information, relatively low market liquidity and the potential lack of strict financial and accounting controls and standards.
Securities for which market prices are not provided by any of the above methods may be valued based upon quotes furnished by independent sources. The last bid price may be used to value equity securities. The mean between the last bid and asked prices is used to value debt obligations, including corporate loans.
Securities for which market quotations are not readily available or became unreliable are valued at fair value as determined in good faith by or under the supervision of the Trust’s officers following procedures approved by the Board of Trustees. Issuer specific events, market trends, bid/asked quotes of brokers and information providers and other market data may be reviewed in the course of making a good faith determination of a security’s fair value.
The Fund may invest in securities that are subject to interest rate risk, meaning the risk that the prices will generally fall as interest rates rise and, conversely, the prices will generally rise as interest rates fall. Specific securities differ in their sensitivity to changes in interest rates depending on their individual characteristics. Changes in interest rates may result in increased market volatility, which may affect the value and/or liquidity of certain Fund investments.
Valuations change in response to many factors including the historical and prospective earnings of the issuer, the value of the issuer’s assets, general economic conditions, interest rates, investor perceptions and market liquidity. Because of the inherent uncertainties of valuation, the values reflected in the financial statements may materially differ from the value received upon actual sale of those investments.
| B. | Securities Transactions and Investment Income — Securities transactions are accounted for on a trade date basis. Realized gains or losses on sales are computed on the basis of specific identification of the securities sold. Interest income (net of withholding tax, if any) is recorded on the accrual basis from settlement date. Bond premiums and discounts are amortized and/or accreted over the lives of the respective securities. Pay-in-kind income received in the form of securities in-lieu of cash is recorded as interest income. Paydown gains and losses on mortgage and asset-backed securities are recorded as adjustments to interest income. Dividend income (net of withholding tax, if any) is recorded on the ex-dividend date. |
25 Invesco Equity and Income Fund
The Fund may periodically participate in litigation related to Fund investments. As such, the Fund may receive proceeds from litigation settlements. Any proceeds received are included in the Statement of Operations as realized gain (loss) for investments no longer held and as unrealized gain (loss) for investments still held.
Brokerage commissions and mark ups are considered transaction costs and are recorded as an increase to the cost basis of securities purchased and/or a reduction of proceeds on a sale of securities. Such transaction costs are included in the determination of net realized and unrealized gain (loss) from investment securities reported in the Statement of Operations and the Statement of Changes in Net Assets and the net realized and unrealized gains (losses) on securities per share in the Financial Highlights. Transaction costs are included in the calculation of the Fund’s net asset value and, accordingly, they reduce the Fund’s total returns. These transaction costs are not considered operating expenses and are not reflected in net investment income reported in the Statement of Operations and the Statement of Changes in Net Assets, or the net investment income per share and the ratios of expenses and net investment income reported in the Financial Highlights, nor are they limited by any expense limitation arrangements between the Fund and the investment adviser.
The Fund allocates income and realized and unrealized capital gains and losses to a class based on the relative net assets of each class.
| C. | Country Determination — For the purposes of making investment selection decisions and presentation in the Schedule of Investments, the investment adviser may determine the country in which an issuer is located and/or credit risk exposure based on various factors. These factors include the laws of the country under which the issuer is organized, where the issuer maintains a principal office, the country in which the issuer derives 50% or more of its total revenues and the country that has the primary market for the issuer’s securities, as well as other criteria. Among the other criteria that may be evaluated for making this determination are the country in which the issuer maintains 50% or more of its assets, the type of security, financial guarantees and enhancements, the nature of the collateral and the sponsor organization. Country of issuer and/or credit risk exposure has been determined to be the United States of America, unless otherwise noted. |
| D. | Distributions — Distributions from net investment income, if any, are declared and paid quarterly and are recorded on the ex-dividend date. Distributions from net realized capital gain, if any, are generally declared and paid annually and recorded on the ex-dividend date. The Fund may elect to treat a portion of the proceeds from redemptions as distributions for federal income tax purposes. |
| E. | Federal Income Taxes — The Fund intends to comply with the requirements of Subchapter M of the Internal Revenue Code of 1986, as amended (the “Internal Revenue Code”), necessary to qualify as a regulated investment company and to distribute substantially all of the Fund’s taxable earnings to shareholders. As such, the Fund will not be subject to federal income taxes on otherwise taxable income (including net realized capital gain) that is distributed to shareholders. Therefore, no provision for federal income taxes is recorded in the financial statements. |
The Fund recognizes the tax benefits of uncertain tax positions only when the position is more likely than not to be sustained. Management has analyzed the Fund’s uncertain tax positions and concluded that no liability for unrecognized tax benefits should be recorded related to uncertain tax positions. Management is not aware of any tax positions for which it is reasonably possible that the total amounts of unrecognized tax benefits will change materially in the next 12 months.
The Fund files tax returns in the U.S. Federal jurisdiction and certain other jurisdictions. Generally, the Fund is subject to examinations by such taxing authorities for up to three years after the filing of the return for the tax period.
| F. | Expenses — Fees provided for under the Rule 12b-1 plan of a particular class of the Fund are charged to the operations of such class. Transfer agency fees and expenses and other shareholder recordkeeping fees and expenses attributable to Class R5 and Class R6 are allocated to each share class based on relative net assets. Sub-accounting fees attributable to Class R5 are charged to the operations of the class. Transfer agency fees and expenses and other shareholder recordkeeping fees and expenses relating to all other classes are allocated among those classes based on relative net assets. All other expenses are allocated among the classes based on relative net assets. |
| G. | Accounting Estimates — The preparation of financial statements in conformity with accounting principles generally accepted in the United States of America (“GAAP”) requires management to make estimates and assumptions that affect the reported amounts of assets and liabilities at the date of the financial statements and the reported amounts of revenues and expenses during the reporting period including estimates and assumptions related to taxation. Actual results could differ from those estimates by a significant amount. In addition, the Fund monitors for material events or transactions that may occur or become known after the period-end date and before the date the financial statements are released to print. |
| H. | Indemnifications — Under the Trust’s organizational documents, each Trustee, officer, employee or other agent of the Trust is indemnified against certain liabilities that may arise out of the performance of their duties to the Fund. Additionally, in the normal course of business, the Fund enters into contracts, including the Fund’s servicing agreements, that contain a variety of indemnification clauses. The Fund’s maximum exposure under these arrangements is unknown as this would involve future claims that may be made against the Fund that have not yet occurred. The risk of material loss as a result of such indemnification claims is considered remote. |
| I. | Foreign Currency Translations — Foreign currency is valued at the close of the NYSE based on quotations posted by banks and major currency dealers. Portfolio securities and other assets and liabilities denominated in foreign currencies are translated into U.S. dollar amounts at date of valuation. Purchases and sales of portfolio securities (net of foreign taxes withheld on disposition) and income items denominated in foreign currencies are translated into U.S. dollar amounts on the respective dates of such transactions. The Fund does not separately account for the portion of the results of operations resulting from changes in foreign exchange rates on investments and the fluctuations arising from changes in market prices of securities held. The combined results of changes in foreign exchange rates and the fluctuation of market prices on investments (net of estimated foreign tax withholding) are included with the net realized and unrealized gain or loss from investments in the Statement of Operations. Reported net realized foreign currency gains or losses arise from (1) sales of foreign currencies, (2) currency gains or losses realized between the trade and settlement dates on securities transactions, and (3) the difference between the amounts of dividends, interest, and foreign withholding taxes recorded on the Fund’s books and the U.S. dollar equivalent of the amounts actually received or paid. Net unrealized foreign currency gains and losses arise from changes in the fair values of assets and liabilities, other than investments in securities at fiscal period end, resulting from changes in exchange rates. |
The Fund may invest in foreign securities, which may be subject to foreign taxes on income, gains on investments or currency repatriation, a portion of which may be recoverable. Foreign taxes, if any, are recorded based on the tax regulations and rates that exist in the foreign markets in which the Fund invests and are shown in the Statement of Operations.
26 Invesco Equity and Income Fund
| J. | Forward Foreign Currency Contracts — The Fund may engage in foreign currency transactions either on a spot (i.e. for prompt delivery and settlement) basis, or through forward foreign currency contracts, to manage or minimize currency or exchange rate risk. |
The Fund may also enter into forward foreign currency contracts for the purchase or sale of a security denominated in a foreign currency in order to “lock in” the U.S. dollar price of that security, or the Fund may also enter into forward foreign currency contracts that do not provide for physical settlement of the two currencies, but instead are settled by a single cash payment calculated as the difference between the agreed upon exchange rate and the spot rate at settlement based upon an agreed upon notional amount (non-deliverable forwards). The Fund will set aside liquid assets in an amount equal to the daily mark-to-market obligation for forward foreign currency contracts.
A forward foreign currency contract is an obligation between two parties (“Counterparties”) to purchase or sell a specific currency for an agreed-upon price at a future date. The use of forward foreign currency contracts does not eliminate fluctuations in the price of the underlying securities the Fund owns or intends to acquire but establishes a rate of exchange in advance. Fluctuations in the value of these contracts are measured by the difference in the contract date and reporting date exchange rates and are recorded as unrealized appreciation (depreciation) until the contracts are closed. When the contracts are closed, realized gains (losses) are recorded. Realized and unrealized gains (losses) on the contracts are included in the Statement of Operations. The primary risks associated with forward foreign currency contracts include failure of the Counterparty to meet the terms of the contract and the value of the foreign currency changing unfavorably. These risks may be in excess of the amounts reflected in the Statement of Assets and Liabilities.
| K. | Futures Contracts — The Fund may enter into futures contracts to manage exposure to interest rate, equity and market price movements and/or currency risks. A futures contract is an agreement between Counterparties to purchase or sell a specified underlying security, currency or commodity (or delivery of a cash settlement price, in the case of an index future) for a fixed price at a future date. The Fund currently invests only in exchange-traded futures and they are standardized as to maturity date and underlying financial instrument. Initial margin deposits required upon entering into futures contracts are satisfied by the segregation of specific securities or cash as collateral at the futures commission merchant (broker). During the period the futures contracts are open, changes in the value of the contracts are recognized as unrealized gains or losses by recalculating the value of the contracts on a daily basis. Subsequent or variation margin payments are received or made depending upon whether unrealized gains or losses are incurred. These amounts are reflected as receivables or payables on the Statement of Assets and Liabilities. When the contracts are closed or expire, the Fund recognizes a realized gain or loss equal to the difference between the proceeds from, or cost of, the closing transaction and the Fund’s basis in the contract. The net realized gain (loss) and the change in unrealized gain (loss) on futures contracts held during the period is included on the Statement of Operations. The primary risks associated with futures contracts are market risk and the absence of a liquid secondary market. If the Fund were unable to liquidate a futures contract and/or enter into an offsetting closing transaction, the Fund would continue to be subject to market risk with respect to the value of the contracts and continue to be required to maintain the margin deposits on the futures contracts. Futures contracts have minimal Counterparty risk since the exchange’s clearinghouse, as Counterparty to all exchange-traded futures, guarantees the futures against default. Risks may exceed amounts recognized in the Statement of Assets and Liabilities. |
| L. | Collateral — To the extent the Fund has designated or segregated a security as collateral and that security is subsequently sold, it is the Fund’s practice to replace such collateral no later than the next business day. |
NOTE 2—Advisory Fees and Other Fees Paid to Affiliates
The Trust has entered into a master investment advisory agreement with Invesco Advisers, Inc. (the “Adviser” or “Invesco”). Under the terms of the investment advisory agreement, the Fund accrues daily and pays monthly an advisory fee to the Adviser based on the annual rate of the Fund’s average daily net assets as follows:
| Average Daily Net Assets | Rate | |||||||
First $150 million | 0.50% | |||||||
Next $100 million | 0.45% | |||||||
Next $100 million | 0.40% | |||||||
Over $350 million | 0.35% | |||||||
For the year ended August 31, 2017, the effective advisory fees incurred by the Fund was 0.35%.
Under the terms of a master sub-advisory agreement between the Adviser and each of Invesco Asset Management Deutschland GmbH, Invesco Asset Management Limited, Invesco Asset Management (Japan) Limited, Invesco Hong Kong Limited, Invesco Senior Secured Management, Inc. and Invesco Canada Ltd. (collectively, the “Affiliated Sub-Advisers”) the Adviser, not the Fund, will pay 40% of the fees paid to the Adviser to any such Affiliated Sub-Adviser(s) that provide(s) discretionary investment management services to the Fund based on the percentage of assets allocated to such Affiliated Sub-Adviser(s).
The Adviser has contractually agreed, through at least June 30, 2018, to waive advisory fees and/or reimburse expenses to the extent necessary to limit total annual fund operating expenses after fee waiver and/or expense reimbursement (excluding certain items discussed below) of Class A, Class B, Class C, Class R, Class Y, Class R5 and Class R6 shares to 1.50%, 2.25%, 2.25%, 1.75%, 1.25%, 1.25% and 1.25%, respectively, of the Fund’s average daily net assets (the “expense limits”). In determining the Adviser’s obligation to waive advisory fees and/or reimburse expenses, the following expenses are not taken into account, and could cause total annual fund operating expenses after fee waiver and/or expense reimbursement to exceed the numbers reflected above: (1) interest; (2) taxes; (3) dividend expense on short sales; (4) extraordinary or non-routine items, including litigation expenses; and (5) expenses that the Fund has incurred but did not actually pay because of an expense offset arrangement. Unless Invesco continues the fee waiver agreement, it will terminate on June 30, 2018. During its term, the fee waiver agreement cannot be terminated or amended to increase the expense limits or reduce the advisory fee waivers without approval of the Board of Trustees. The Adviser did not waive fees and/or reimburse expenses during the period under this expense limit.
Further, the Adviser has contractually agreed, through at least June 30, 2019, to waive the advisory fee payable by the Fund in an amount equal to 100% of the net advisory fees the Adviser receives from the affiliated money market funds on investments by the Fund of uninvested cash in such affiliated money market funds.
27 Invesco Equity and Income Fund
For the year ended August 31, 2017, the Adviser waived advisory fees of $788,859.
The Trust has entered into a master administrative services agreement with Invesco pursuant to which the Fund has agreed to pay Invesco for certain administrative costs incurred in providing accounting services to the Fund. For the year ended August 31, 2017, expenses incurred under the agreement are shown in the Statement of Operations as Administrative services fees.
The Trust has entered into a transfer agency and service agreement with Invesco Investment Services, Inc. (“IIS”) pursuant to which the Fund has agreed to pay IIS a fee for providing transfer agency and shareholder services to the Fund and reimburse IIS for certain expenses incurred by IIS in the course of providing such services. IIS may make payments to intermediaries that provide omnibus account services, sub-accounting services and/or networking services. All fees payable by IIS to intermediaries that provide omnibus account services or sub-accounting services are charged back to the Fund, subject to certain limitations approved by the Trust’s Board of Trustees. For the year ended August 31, 2017, expenses incurred under the agreement are shown in the Statement of Operations as Transfer agent fees.
Shares of the Fund are distributed by Invesco Distributors, Inc. (“IDI”). The Fund has adopted a distribution plan pursuant to Rule 12b-1 under the 1940 Act, and a service plan (collectively, the “Plans”) for Class A shares, Class B shares, Class C shares and Class R shares to compensate IDI for the sale, distribution, shareholder servicing and maintenance of shareholder accounts for these shares. Under the Plans, the Fund will incur annual fees of up to 0.25% of Class A average daily net assets, up to 1.00% each of Class B and Class C average daily net assets and up to 0.50% of Class R average daily net assets. The fees are accrued daily and paid monthly.
With respect to Class B and Class C shares, the Fund is authorized to reimburse in future years any distribution related expenses that exceed the maximum annual reimbursement rate for such class, so long as such reimbursement does not cause the Fund to exceed the Class B and Class C maximum annual reimbursement rate, respectively. With respect to Class A shares, distribution related expenses that exceed the maximum annual reimbursement rate for such class are not carried forward to future years and the Fund will not reimburse IDI for any such expenses.
For the year ended August 31, 2017, expenses incurred under these agreements are shown in the Statement of Operations as Distribution fees.
Front-end sales commissions and CDSC (collectively, the “sales charges”) are not recorded as expenses of the Fund. Front-end sales commissions are deducted from proceeds from the sales of Fund shares prior to investment in Class A shares of the Fund. CDSC are deducted from redemption proceeds prior to remittance to the shareholder. During the year ended August 31, 2017, IDI advised the Fund that IDI retained $2,960,663 in front-end sales commissions from the sale of Class A shares and $88,502, $407 and $87,529 from Class A, Class B and Class C shares, respectively, for CDSC imposed on redemptions by shareholders.
For the year ended August 31, 2017, the Fund incurred $32,564 in brokerage commissions with Invesco Capital Markets, Inc., an affiliate of the Adviser and IDI, for portfolio transactions executed on behalf of the Fund.
Certain officers and trustees of the Trust are officers and directors of the Adviser, IIS and/or IDI.
NOTE 3—Additional Valuation Information
GAAP defines fair value as the price that would be received to sell an asset or paid to transfer a liability in an orderly transaction between market participants at the measurement date, under current market conditions. GAAP establishes a hierarchy that prioritizes the inputs to valuation methods, giving the highest priority to readily available unadjusted quoted prices in an active market for identical assets (Level 1) and the lowest priority to significant unobservable inputs (Level 3), generally when market prices are not readily available or are unreliable. Based on the valuation inputs, the securities or other investments are tiered into one of three levels. Changes in valuation methods may result in transfers in or out of an investment’s assigned level:
| Level 1 — | Prices are determined using quoted prices in an active market for identical assets. |
| Level 2 — | Prices are determined using other significant observable inputs. Observable inputs are inputs that other market participants may use in pricing a security. These may include quoted prices for similar securities, interest rates, prepayment speeds, credit risk, yield curves, loss severities, default rates, discount rates, volatilities and others. |
| Level 3 — | Prices are determined using significant unobservable inputs. In situations where quoted prices or observable inputs are unavailable (for example, when there is little or no market activity for an investment at the end of the period), unobservable inputs may be used. Unobservable inputs reflect the Fund’s own assumptions about the factors market participants would use in determining fair value of the securities or instruments and would be based on the best available information. |
The following is a summary of the tiered valuation input levels, as of August 31, 2017. The level assigned to the securities valuations may not be an indication of the risk or liquidity associated with investing in those securities. Because of the inherent uncertainties of valuation, the values reflected in the financial statements may materially differ from the value received upon actual sale of those investments.
The Fund’s policy is to recognize transfers in and out of the valuation levels as of the end of the reporting period. During the year ended August 31, 2017, there were no significant transfers between valuation levels.
| Level 1 | Level 2 | Level 3 | Total | |||||||||||||
Common Stocks & Other Equity Interests | $ | 9,236,759,616 | $ | 134,615,203 | $ | — | $ | 9,371,374,819 | ||||||||
Bonds & Notes | — | 2,784,420,415 | — | 2,784,420,415 | ||||||||||||
U.S. Treasury Securities | — | 1,451,229,759 | — | 1,451,229,759 | ||||||||||||
Preferred Stocks | 46,801,832 | 29,432,812 | — | 76,234,644 | ||||||||||||
U.S. Government Sponsored Agency Securities | — | 54,116,621 | — | 54,116,621 | ||||||||||||
Municipal Obligations | — | 9,647,761 | — | 9,647,761 | ||||||||||||
U.S. Government Sponsored Agency Mortgage-Backed Securities | — | 50,238 | — | 50,238 | ||||||||||||
Money Market Funds | 581,244,017 | — | — | 581,244,017 | ||||||||||||
| 9,864,805,465 | 4,463,512,809 | — | 14,328,318,274 | |||||||||||||
Futures Contracts* | (208,890 | ) | — | — | (208,890 | ) | ||||||||||
Forward Foreign Currency Contracts* | — | 1,430,174 | — | 1,430,174 | ||||||||||||
Total Investments | $ | 9,864,596,575 | $ | 4,464,942,983 | $ | — | $ | 14,329,539,558 | ||||||||
| * | Unrealized appreciation (depreciation). |
28 Invesco Equity and Income Fund
NOTE 4—Derivative Investments
The Fund may enter into an International Swaps and Derivatives Association Master Agreement (“ISDA Master Agreement”) under which a fund may trade OTC derivatives. An OTC transaction entered into under an ISDA Master Agreement typically involves a collateral posting arrangement, payment netting provisions and close-out netting provisions. These netting provisions allow for reduction of credit risk through netting of contractual obligations. The enforceability of the netting provisions of the ISDA Master Agreement depends on the governing law of the ISDA Master Agreement, among other factors.
For financial reporting purposes, the Fund does not offset OTC derivative assets or liabilities that are subject to ISDA Master Agreements in the Statement of Assets and Liabilities.
Value of Derivative Investments at Period-End
The table below summarizes the value of the Fund’s derivative investments, detailed by primary risk exposure, held as of August 31, 2017:
| Value | ||||||||||||
| Derivative Assets | Currency Risk | Interest Rate Risk | Total | |||||||||
Unrealized appreciation on forward foreign currency contracts outstanding | $ | 8,213,417 | $ | — | $ | 8,213,417 | ||||||
Derivatives not subject to master netting agreements | — | — | — | |||||||||
Total Derivative Assets subject to master netting agreements | $ | 8,213,417 | $ | — | $ | 8,213,417 | ||||||
| Value | ||||||||||||
| Derivative Liabilities | Currency Risk | Interest Rate Risk | Total | |||||||||
Unrealized depreciation on futures contracts — Exchange-Traded(a) | $ | — | $ | (208,890 | ) | $ | (208,890 | ) | ||||
Unrealized depreciation on forward foreign currency contracts outstanding | (6,783,243 | ) | — | (6,783,243 | ) | |||||||
Total Derivative Liabilities | (6,783,243 | ) | (208,890 | ) | (6,992,133 | ) | ||||||
Derivatives not subject to master netting agreements | — | 208,890 | 208,890 | |||||||||
Total Derivative Liabilities subject to master netting agreements | $ | (6,783,243 | ) | $ | — | $ | (6,783,243 | ) | ||||
| (a) | The daily variation margin receivable (payable) at period end is recorded in the Statement of Assets and Liabilities. |
Offsetting Assets and Liabilities
The table below reflects the Fund’s exposure to Counterparties subject to either an ISDA Master Agreement or other agreement for OTC derivative transactions as of August 31, 2017.
| Financial Derivative Assets | Financial Derivative Liabilities | |||||||||||||||||||||||
| Forward Foreign Currency | Forward Foreign Currency | Net Value of | Collateral (Received)/Pledged | Net | ||||||||||||||||||||
| Counterparty | Contracts | Contracts | Derivatives | Non-Cash | Cash | Amount | ||||||||||||||||||
Bank of New York Mellon (The) | $ | 4,001,269 | $ | (3,416,842 | ) | $ | 584,427 | $ | — | $ | — | $ | 584,427 | |||||||||||
State Street Bank and Trust Co. | 4,212,148 | (3,366,401 | ) | 845,747 | — | — | 845,747 | |||||||||||||||||
Total | $ | 8,213,417 | $ | (6,783,243 | ) | $ | 1,430,174 | $ | — | $ | — | $ | 1,430,174 | |||||||||||
Effect of Derivative Investments for the year ended August 31, 2017
The table below summarizes the gains (losses) on derivative investments, detailed by primary risk exposure, recognized in earnings during the period:
| Location of Gain (Loss) on Statement of Operations | ||||||||||||
| Currency Risk | Interest Rate Risk | Total | ||||||||||
Realized Gain (Loss): | ||||||||||||
Forward foreign currency contracts | $ | (14,844,914 | ) | $ | — | $ | (14,844,914 | ) | ||||
Futures contracts | — | 2,621,286 | 2,621,286 | |||||||||
Change in Net Unrealized Appreciation (Depreciation): | ||||||||||||
Forward foreign currency contracts | 622,280 | — | 622,280 | |||||||||
Futures contracts | — | (107,808 | ) | (107,808 | ) | |||||||
Total | $ | (14,222,634 | ) | $ | 2,513,478 | $ | (11,709,156 | ) | ||||
29 Invesco Equity and Income Fund
The table below summarizes the average notional value of forward foreign currency contracts and futures contracts outstanding during the period.
| Forward Foreign Currency Contracts | Futures Contracts | |||||||
Average notional value | $ | 782,603,001 | $ | 145,728,742 | ||||
NOTE 5—Security Transactions with Affiliated Funds
The Fund is permitted to purchase or sell securities from or to certain other Invesco Funds under specified conditions outlined in procedures adopted by the Board of Trustees of the Trust. The procedures have been designed to ensure that any purchase or sale of securities by the Fund from or to another fund or portfolio that is or could be considered an affiliate by virtue of having a common investment adviser (or affiliated investment advisers), common Trustees and/or common officers complies with Rule 17a-7 of the 1940 Act. Further, as defined under the procedures, each transaction is effected at the current market price. Pursuant to these procedures, for the year ended August 31, 2017, the Fund engaged in securities purchases of $79,507,680.
NOTE 6—Expense Offset Arrangement(s)
The expense offset arrangement is comprised of transfer agency credits which result from balances in demand deposit accounts used by the transfer agent for clearing shareholder transactions. For the year ended August 31, 2017, the Fund received credits from this arrangement, which resulted in the reduction of the Fund’s total expenses of $57,214.
NOTE 7—Trustees’ and Officers’ Fees and Benefits
Trustees’ and Officers’ Fees and Benefits include amounts accrued by the Fund to pay remuneration to certain Trustees and Officers of the Fund. Trustees have the option to defer compensation payable by the Fund, and Trustees’ and Officers’ Fees and Benefits also include amounts accrued by the Fund to fund such deferred compensation amounts. Those Trustees who defer compensation have the option to select various Invesco Funds in which their deferral accounts shall be deemed to be invested. Finally, certain current Trustees were eligible to participate in a retirement plan that provided for benefits to be paid upon retirement to Trustees over a period of time based on the number of years of service. The Fund may have certain former Trustees who also participate in a retirement plan and receive benefits under such plan. Trustees’ and Officers’ Fees and Benefits include amounts accrued by the Fund to fund such retirement benefits. Obligations under the deferred compensation and retirement plans represent unsecured claims against the general assets of the Fund.
NOTE 8—Cash Balances
The Fund is permitted to temporarily carry a negative or overdrawn balance in its account with State Street Bank and Trust Company, the custodian bank. Such balances, if any at period-end, are shown in the Statement of Assets and Liabilities under the payable caption Amount due custodian. To compensate the custodian bank for such overdrafts, the overdrawn Fund may either (1) leave funds as a compensating balance in the account so the custodian bank can be compensated by earning the additional interest; or (2) compensate by paying the custodian bank at a rate agreed upon by the custodian bank and Invesco, not to exceed the contractually agreed upon rate.
NOTE 9—Distributions to Shareholders and Tax Components of Net Assets
Tax Character of Distributions to Shareholders Paid During the Fiscal Years Ended August 31, 2017 and 2016:
| 2017 | 2016 | |||||||
Ordinary income | $ | 241,011,145 | $ | 295,522,871 | ||||
Long-term capital gain | 371,846,696 | 360,290,934 | ||||||
Total distributions | $ | 612,857,841 | $ | 655,813,805 | ||||
Tax Components of Net Assets at Period-End:
| 2017 | ||||
Undistributed ordinary income | $ | 114,983,410 | ||
Undistributed long-term gain | 518,239,068 | |||
Net unrealized appreciation — investments | 2,557,069,215 | |||
Net unrealized appreciation — foreign currencies | 100,101 | |||
Temporary book/tax differences | (1,430,173 | ) | ||
Shares of beneficial interest | 11,253,633,559 | |||
Total net assets | $ | 14,442,595,180 | ||
The difference between book-basis and tax-basis unrealized appreciation (depreciation) is due to differences in the timing of recognition of gains and losses on investments for tax and book purposes. The Fund’s net unrealized appreciation difference is attributable primarily to wash sales, book to tax accretion and amortization differences and contingent payment debt instruments.
The temporary book/tax differences are a result of timing differences between book and tax recognition of income and/or expenses. The Fund’s temporary book/tax differences are the result of the trustee deferral of compensation and retirement plan benefits.
30 Invesco Equity and Income Fund
Capital loss carryforward is calculated and reported as of a specific date. Results of transactions and other activity after that date may affect the amount of capital loss carryforward actually available for the Fund to utilize. Capital losses generated in years beginning after December 22, 2010 can be carried forward for an unlimited period, whereas previous losses expire in eight tax years. Capital losses with an expiration period may not be used to offset capital gains until all net capital losses without an expiration date have been utilized. Capital loss carryforwards with no expiration date will retain their character as either short-term or long-term capital losses instead of as short-term capital losses as under prior law. The ability to utilize capital loss carryforwards in the future may be limited under the Internal Revenue Code and related regulations based on the results of future transactions.
The Fund does not have a capital loss carryforward as of August 31, 2017.
NOTE 10—Investment Transactions
The aggregate amount of investment securities (other than short-term securities, U.S. Treasury obligations and money market funds, if any) purchased and sold by the Fund during the year ended August 31, 2017 was $2,473,333,265 and $3,395,340,937, respectively. During the same period, purchases and sales of U.S. Treasury obligations were $10,228,504,544 and $10,041,999,445, respectively. Cost of investments, including any derivatives, on a tax basis includes the adjustments for financial reporting purposes as of the most recently completed federal income tax reporting period-end.
| Unrealized Appreciation (Depreciation) of Investments on a Tax Basis | ||||
Aggregate unrealized appreciation of investments | $ | 2,964,841,954 | ||
Aggregate unrealized (depreciation) of investments | (407,772,739 | ) | ||
Net unrealized appreciation of investments | $ | 2,557,069,215 | ||
Cost of investments for tax purposes is $11,772,470,343.
NOTE 11—Reclassification of Permanent Differences
Primarily as a result of differing book/tax treatment of over distributions and contingent payment debt instruments, on August 31, 2017, undistributed net investment income was increased by $66,935,242 and undistributed net realized gain was decreased by $66,935,242. This reclassification had no effect on the net assets of the Fund.
31 Invesco Equity and Income Fund
NOTE 12—Share Information
| Summary of Share Activity | ||||||||||||||||
| Years ended August 31, | ||||||||||||||||
| 2017(a) | 2016 | |||||||||||||||
| Shares | Amount | Shares | Amount | |||||||||||||
Sold: | ||||||||||||||||
Class A | 115,669,742 | $ | 1,239,277,625 | 111,224,375 | $ | 1,077,574,671 | ||||||||||
Class B | 172,357 | 1,790,154 | 266,906 | 2,512,112 | ||||||||||||
Class C | 20,750,460 | 218,745,272 | 20,339,360 | 193,944,860 | ||||||||||||
Class R | 3,909,237 | 41,993,529 | 5,254,094 | 51,048,813 | ||||||||||||
Class Y | 98,848,260 | 1,062,003,096 | 27,221,545 | 265,627,927 | ||||||||||||
Class R5 | 8,673,316 | 92,759,051 | 10,878,710 | 107,029,434 | ||||||||||||
Class R6 | 56,055,001 | 613,972,350 | 14,951,823 | 143,651,914 | ||||||||||||
Issued as reinvestment of dividends: | ||||||||||||||||
Class A | 40,002,989 | 425,418,381 | 47,677,788 | 456,569,037 | ||||||||||||
Class B | 542,476 | 5,637,412 | 1,061,005 | 9,926,321 | ||||||||||||
Class C | 5,380,101 | 56,266,159 | 6,872,075 | 64,680,416 | ||||||||||||
Class R | 850,972 | 9,098,921 | 1,084,319 | 10,434,409 | ||||||||||||
Class Y | 4,057,437 | 43,198,828 | 3,921,859 | 37,571,227 | ||||||||||||
Class R5 | 2,024,646 | 21,551,486 | 2,335,066 | 22,371,350 | ||||||||||||
Class R6 | 1,475,642 | 15,720,136 | 1,129,212 | 10,812,290 | ||||||||||||
Automatic conversion of Class B shares to Class A shares: | ||||||||||||||||
Class A | 6,568,778 | 70,361,377 | 7,891,731 | 76,446,956 | ||||||||||||
Class B | (6,723,611 | ) | (70,361,377 | ) | (8,072,253 | ) | (76,446,956 | ) | ||||||||
Reacquired: | ||||||||||||||||
Class A | (226,831,869 | ) | (2,428,239,870 | ) | (170,100,243 | ) | (1,650,667,267 | ) | ||||||||
Class B | (2,634,938 | ) | (27,407,275 | ) | (3,578,084 | ) | (33,891,923 | ) | ||||||||
Class C | (44,176,496 | ) | (464,438,649 | ) | (33,805,022 | ) | (321,809,230 | ) | ||||||||
Class R | (6,378,498 | ) | (68,563,078 | ) | (7,355,599 | ) | (71,434,837 | ) | ||||||||
Class Y | (73,419,782 | ) | (796,242,605 | ) | (29,300,405 | ) | (283,817,464 | ) | ||||||||
Class R5 | (11,851,117 | ) | (127,004,521 | ) | (11,427,947 | ) | (112,164,130 | ) | ||||||||
Class R6 | (8,337,287 | ) | (89,471,145 | ) | (7,448,665 | ) | (72,611,708 | ) | ||||||||
Net increase (decrease) in share activity | (15,372,184 | ) | $ | (153,934,743 | ) | (8,978,350 | ) | $ | (92,641,778 | ) | ||||||
| (a) | There are entities that are record owners of more than 5% of the outstanding shares of the Fund and in the aggregate own 38% of the outstanding shares of the Fund. IDI has an agreement with these entities to sell Fund shares. The Fund, Invesco and/or Invesco affiliates may make payments to these entities, which are considered to be related to the Fund, for providing services to the Fund, Invesco and/or Invesco affiliates including but not limited to services such as securities brokerage, distribution, third party record keeping and account servicing. The Fund has no knowledge as to whether all or any portion of the shares owned of record by these entities are also owned beneficially. |
32 Invesco Equity and Income Fund
NOTE 13—Financial Highlights
The following schedule presents financial highlights for a share of the Fund outstanding throughout the periods indicated.
| Net asset value, beginning of period | Net investment income(a) | Net gains (losses) on securities (both realized and unrealized) | Total from investment operations | Dividends from net investment income | Distributions from net realized gains | Total distributions | Net asset value, end of period | Total return(b) | Net assets, end of period (000’s omitted) | Ratio of expenses to average net assets with fee waivers and/or expenses absorbed | Ratio of expenses to average net assets without fee waivers and/or expenses absorbed | Ratio of net investment income to average net assets | Portfolio turnover(c) | |||||||||||||||||||||||||||||||||||||||||||
Class A |
| |||||||||||||||||||||||||||||||||||||||||||||||||||||||
Year ended 08/31/17 | $ | 10.22 | $ | 0.19 | $ | 1.02 | $ | 1.21 | $ | (0.18 | ) | $ | (0.29 | ) | $ | (0.47 | ) | $ | 10.96 | 12.04 | % | $ | 10,072,836 | 0.79 | %(d) | 0.80 | %(d) | 1.79 | %(d) | 94 | % | |||||||||||||||||||||||||
Year ended 08/31/16 | 10.01 | 0.15 | 0.55 | 0.70 | (0.22 | ) | (0.27 | ) | (0.49 | ) | 10.22 | 7.43 | 10,054,983 | 0.79 | 0.80 | 1.57 | 93 | |||||||||||||||||||||||||||||||||||||||
Year ended 08/31/15 | 11.42 | 0.15 | (0.33 | ) | (0.18 | ) | (0.28 | ) | (0.95 | ) | (1.23 | ) | 10.01 | (1.65 | ) | 9,879,022 | 0.79 | 0.80 | 1.38 | 69 | ||||||||||||||||||||||||||||||||||||
Year ended 08/31/14 | 10.43 | 0.22 | (f) | 1.56 | 1.78 | (0.20 | ) | (0.59 | ) | (0.79 | ) | 11.42 | 17.86 | 10,181,796 | 0.79 | 0.80 | 1.99 | (f) | 60 | |||||||||||||||||||||||||||||||||||||
Year ended 08/31/13 | 9.05 | 0.17 | 1.42 | 1.59 | (0.21 | ) | — | (0.21 | ) | 10.43 | 17.80 | 8,752,700 | 0.78 | 0.79 | 1.74 | 26 | ||||||||||||||||||||||||||||||||||||||||
Class B |
| |||||||||||||||||||||||||||||||||||||||||||||||||||||||
Year ended 08/31/17 | 9.98 | 0.11 | 1.00 | 1.11 | (0.10 | ) | (0.29 | ) | (0.39 | ) | 10.70 | 11.24 | 93,617 | 1.54 | (d) | 1.55 | (d) | 1.04 | (d) | 94 | ||||||||||||||||||||||||||||||||||||
Year ended 08/31/16 | 9.78 | 0.08 | 0.54 | 0.62 | (0.15 | ) | (0.27 | ) | (0.42 | ) | 9.98 | 6.63 | 173,664 | 1.54 | 1.55 | 0.82 | 93 | |||||||||||||||||||||||||||||||||||||||
Year ended 08/31/15 | 11.18 | 0.07 | (0.32 | ) | (0.25 | ) | (0.20 | ) | (0.95 | ) | (1.15 | ) | 9.78 | (2.41 | ) | 271,120 | 1.54 | 1.55 | 0.63 | 69 | ||||||||||||||||||||||||||||||||||||
Year ended 08/31/14 | 10.22 | 0.13 | (f) | 1.54 | 1.67 | (0.12 | ) | (0.59 | ) | (0.71 | ) | 11.18 | 17.01 | 442,318 | 1.54 | 1.55 | 1.24 | (f) | 60 | |||||||||||||||||||||||||||||||||||||
Year ended 08/31/13 | 8.87 | 0.09 | 1.39 | 1.48 | (0.13 | ) | — | (0.13 | ) | 10.22 | 16.90 | 570,146 | 1.53 | 1.54 | 0.99 | 26 | ||||||||||||||||||||||||||||||||||||||||
Class C |
| |||||||||||||||||||||||||||||||||||||||||||||||||||||||
Year ended 08/31/17 | 10.04 | 0.11 | 1.00 | 1.11 | (0.10 | ) | (0.29 | ) | (0.39 | ) | 10.76 | 11.21 | 1,559,156 | 1.54 | (d) | 1.55 | (d) | 1.04 | (d) | 94 | ||||||||||||||||||||||||||||||||||||
Year ended 08/31/16 | 9.83 | 0.08 | 0.55 | 0.63 | (0.15 | ) | (0.27 | ) | (0.42 | ) | 10.04 | 6.71 | (e) | 1,636,583 | 1.52 | (e) | 1.53 | (e) | 0.84 | (e) | 93 | |||||||||||||||||||||||||||||||||||
Year ended 08/31/15 | 11.24 | 0.07 | (0.33 | ) | (0.26 | ) | (0.20 | ) | (0.95 | ) | (1.15 | ) | 9.83 | (2.48 | ) | 1,667,769 | 1.54 | 1.55 | 0.63 | 69 | ||||||||||||||||||||||||||||||||||||
Year ended 08/31/14 | 10.27 | 0.13 | (f) | 1.55 | 1.68 | (0.12 | ) | (0.59 | ) | (0.71 | ) | 11.24 | 17.03 | 1,624,965 | 1.54 | 1.55 | 1.24 | (f) | 60 | |||||||||||||||||||||||||||||||||||||
Year ended 08/31/13 | 8.91 | 0.10 | 1.40 | 1.50 | (0.14 | ) | — | (0.14 | ) | 10.27 | 16.95 | 1,284,225 | 1.53 | 1.54 | 0.99 | 26 | ||||||||||||||||||||||||||||||||||||||||
Class R |
| |||||||||||||||||||||||||||||||||||||||||||||||||||||||
Year ended 08/31/17 | 10.27 | 0.17 | 1.02 | 1.19 | (0.16 | ) | (0.29 | ) | (0.45 | ) | 11.01 | 11.71 | 214,107 | 1.04 | (d) | 1.05 | (d) | 1.54 | (d) | 94 | ||||||||||||||||||||||||||||||||||||
Year ended 08/31/16 | 10.05 | 0.13 | 0.56 | 0.69 | (0.20 | ) | (0.27 | ) | (0.47 | ) | 10.27 | 7.24 | 216,293 | 1.04 | 1.05 | 1.32 | 93 | |||||||||||||||||||||||||||||||||||||||
Year ended 08/31/15 | 11.47 | 0.13 | (0.34 | ) | (0.21 | ) | (0.26 | ) | (0.95 | ) | (1.21 | ) | 10.05 | (1.98 | ) | 221,987 | 1.04 | 1.05 | 1.13 | 69 | ||||||||||||||||||||||||||||||||||||
Year ended 08/31/14 | 10.47 | 0.19 | (f) | 1.58 | 1.77 | (0.18 | ) | (0.59 | ) | (0.77 | ) | 11.47 | 17.60 | 232,455 | 1.04 | 1.05 | 1.74 | (f) | 60 | |||||||||||||||||||||||||||||||||||||
Year ended 08/31/13 | 9.08 | 0.15 | 1.43 | 1.58 | (0.19 | ) | — | (0.19 | ) | 10.47 | 17.57 | 193,610 | 1.03 | 1.04 | 1.49 | 26 | ||||||||||||||||||||||||||||||||||||||||
Class Y |
| |||||||||||||||||||||||||||||||||||||||||||||||||||||||
Year ended 08/31/17 | 10.22 | 0.22 | 1.01 | 1.23 | (0.20 | ) | (0.29 | ) | (0.49 | ) | 10.96 | 12.32 | 1,202,149 | 0.54 | (d) | 0.55 | (d) | 2.04 | (d) | 94 | ||||||||||||||||||||||||||||||||||||
Year ended 08/31/16 | 10.01 | 0.18 | 0.55 | 0.73 | (0.25 | ) | (0.27 | ) | (0.52 | ) | 10.22 | 7.70 | 819,708 | 0.54 | 0.55 | 1.82 | 93 | |||||||||||||||||||||||||||||||||||||||
Year ended 08/31/15 | 11.43 | 0.17 | (0.33 | ) | (0.16 | ) | (0.31 | ) | (0.95 | ) | (1.26 | ) | 10.01 | (1.49 | ) | 784,238 | 0.54 | 0.55 | 1.63 | 69 | ||||||||||||||||||||||||||||||||||||
Year ended 08/31/14 | 10.43 | 0.24 | (f) | 1.58 | 1.82 | (0.23 | ) | (0.59 | ) | (0.82 | ) | 11.43 | 18.25 | 719,931 | 0.54 | 0.55 | 2.24 | (f) | 60 | |||||||||||||||||||||||||||||||||||||
Year ended 08/31/13 | 9.05 | 0.20 | 1.41 | 1.61 | (0.23 | ) | — | (0.23 | ) | 10.43 | 18.10 | 477,207 | 0.53 | 0.54 | 1.99 | 26 | ||||||||||||||||||||||||||||||||||||||||
Class R5 |
| |||||||||||||||||||||||||||||||||||||||||||||||||||||||
Year ended 08/31/17 | 10.23 | 0.22 | 1.01 | 1.23 | (0.21 | ) | (0.29 | ) | (0.50 | ) | 10.96 | 12.28 | 457,500 | 0.48 | (d) | 0.49 | (d) | 2.10 | (d) | 94 | ||||||||||||||||||||||||||||||||||||
Year ended 08/31/16 | 10.02 | 0.18 | 0.56 | 0.74 | (0.26 | ) | (0.27 | ) | (0.53 | ) | 10.23 | 7.78 | 438,538 | 0.47 | 0.48 | 1.89 | 93 | |||||||||||||||||||||||||||||||||||||||
Year ended 08/31/15 | 11.43 | 0.18 | (0.32 | ) | (0.14 | ) | (0.32 | ) | (0.95 | ) | (1.27 | ) | 10.02 | (1.32 | ) | 411,579 | 0.47 | 0.48 | 1.70 | 69 | ||||||||||||||||||||||||||||||||||||
Year ended 08/31/14 | 10.43 | 0.25 | (f) | 1.58 | 1.83 | (0.24 | ) | (0.59 | ) | (0.83 | ) | 11.43 | 18.33 | 402,366 | 0.48 | 0.49 | 2.30 | (f) | 60 | |||||||||||||||||||||||||||||||||||||
Year ended 08/31/13 | 9.05 | 0.20 | 1.42 | 1.62 | (0.24 | ) | — | (0.24 | ) | 10.43 | 18.17 | 241,540 | 0.47 | 0.48 | 2.05 | 26 | ||||||||||||||||||||||||||||||||||||||||
Class R6 |
| |||||||||||||||||||||||||||||||||||||||||||||||||||||||
Year ended 08/31/17 | 10.22 | 0.24 | 1.01 | 1.25 | (0.22 | ) | (0.29 | ) | (0.51 | ) | 10.96 | 12.50 | 843,229 | 0.38 | (d) | 0.39 | (d) | 2.20 | (d) | 94 | ||||||||||||||||||||||||||||||||||||
Year ended 08/31/16 | 10.01 | 0.19 | 0.56 | 0.75 | (0.27 | ) | (0.27 | ) | (0.54 | ) | 10.22 | 7.89 | 283,631 | 0.37 | 0.38 | 1.99 | 93 | |||||||||||||||||||||||||||||||||||||||
Year ended 08/31/15 | 11.43 | 0.19 | (0.33 | ) | (0.14 | ) | (0.33 | ) | (0.95 | ) | (1.28 | ) | 10.01 | (1.33 | ) | 191,328 | 0.37 | 0.38 | 1.80 | 69 | ||||||||||||||||||||||||||||||||||||
Year ended 08/31/14 | 10.43 | 0.26 | (f) | 1.58 | 1.84 | (0.25 | ) | (0.59 | ) | (0.84 | ) | 11.43 | 18.44 | 149,346 | 0.39 | 0.40 | 2.39 | (f) | 60 | |||||||||||||||||||||||||||||||||||||
Year ended 08/31/13(g) | 9.27 | 0.21 | 1.14 | 1.35 | (0.19 | ) | — | (0.19 | ) | 10.43 | 14.81 | 37,884 | 0.37 | (h) | 0.38 | (h) | 2.15 | (h) | 26 | |||||||||||||||||||||||||||||||||||||
| (a) | Calculated using average shares outstanding. |
| (b) | Includes adjustments in accordance with accounting principles generally accepted in the United States of America and as such, the net asset value for financial reporting purposes and the returns based upon those net asset values may differ from the net asset value and returns for shareholder transactions. Does not include sales charges and is not annualized for periods less than one year, if applicable. |
| (c) | Portfolio turnover is calculated at the fund level and is not annualized for periods less than one year, if applicable. |
| (d) | Ratios are based on average daily net assets (000’s omitted) of $10,221,347, $138,712, $1,636,434, $220,287, $1,174,866, $465,436 and $406,161 for Class A, Class B, Class C, Class R, Class Y, Class R5 and Class R6 shares, respectively. |
| (e) | The total return, ratio of expenses to average net assets and ratio of net investment income (loss) to average net assets reflect actual 12b-1 fees of 0.98% for the year ended August 31, 2016. |
| (f) | Net investment income per share and the ratio of net investment income to average net assets includes significant dividends received during the period. Net investment income per share and the ratio of net investment income to average net assets excluding the significant dividends are $0.16 and 1.47%, $0.07 and 0.72%, $0.07 and 0.72%, $0.13 and 1.22%, $0.18 and 1.72%, $0.19 and 1.78% and $0.20 and 1.87% for Class A, Class B, Class C, Class R, Class Y, Class R5 and Class R6 shares, respectively. |
| (g) | Commencement date of September 24, 2012. |
| (h) | Annualized. |
33 Invesco Equity and Income Fund
Report of Independent Registered Public Accounting Firm
To the Board of Trustees of AIM Counselor Series Trust (Invesco Counselor Series Trust)
and Shareholders of Invesco Equity and Income Fund:
In our opinion, the accompanying statement of assets and liabilities, including the schedule of investments, and the related statements of operations and of changes in net assets and the financial highlights present fairly, in all material respects, the financial position of Invesco Equity and Income Fund (one of the portfolios constituting AIM Counselor Series Trust (Invesco Counselor Series Trust), hereafter referred to as the “Fund”) as of August 31, 2017, the results of its operations for the year then ended, the changes in its net assets for each of the two years in the period then ended and the financial highlights for each of the periods indicated therein, in conformity with accounting principles generally accepted in the United States of America. These financial statements and financial highlights (hereafter referred to as “financial statements”) are the responsibility of the Fund’s management. Our responsibility is to express an opinion on these financial statements based on our audits. We conducted our audits of these financial statements in accordance with the standards of the Public Company Accounting Oversight Board (United States). Those standards require that we plan and perform the audit to obtain reasonable assurance about whether the financial statements are free of material misstatement. An audit includes examining, on a test basis, evidence supporting the amounts and disclosures in the financial statements, assessing the accounting principles used and significant estimates made by management, and evaluating the overall financial statement presentation. We believe that our audits, which included confirmation of securities as of August 31, 2017 by correspondence with the custodian, transfer agent and brokers, and when replies were not received from brokers, we performed other auditing procedures, provide a reasonable basis for our opinion.
PricewaterhouseCoopers LLP
Houston, Texas
October 30, 2017
34 Invesco Equity and Income Fund
Calculating your ongoing Fund expenses
Example
As a shareholder of the Fund, you incur two types of costs: (1) transaction costs, which may include sales charges (loads) on purchase payments or contingent deferred sales charges on redemptions, if any; and (2) ongoing costs, including management fees, distribution and/or service (12b-1) fees, and other Fund expenses. This example is intended to help you understand your ongoing costs (in dollars) of investing in the Fund and to compare these costs with ongoing costs of investing in other mutual funds. The example is based on an investment of $1,000 invested at the beginning of the period and held for the entire period March 1, 2017 through August 31, 2017.
Actual expenses
The table below provides information about actual account values and actual expenses. You may use the information in this table, together with the amount you invested, to estimate the expenses that you paid over the period. Simply divide your account value by $1,000 (for example, an $8,600 account value divided by $1,000 = 8.6), then multiply the result by the number in the table under the heading entitled “Actual Expenses Paid During Period” to estimate the expenses you paid on your account during this period.
Hypothetical example for comparison purposes
The table below also provides information about hypothetical account values and hypothetical expenses based on the Fund’s actual expense ratio and an assumed rate of return of 5% per year before expenses, which is not the Fund’s actual return.
The hypothetical account values and expenses may not be used to estimate the actual ending account balance or expenses you paid for the period. You may use this information to compare the ongoing costs of investing in the Fund and other funds. To do so, compare this 5% hypothetical example with the 5% hypothetical examples that appear in the shareholder reports of the other funds.
Please note that the expenses shown in the table are meant to highlight your ongoing costs only and do not reflect any transaction costs, such as sales charges (loads) on purchase payments or contingent deferred sales charges on redemptions, if any. Therefore, the hypothetical information is useful in comparing ongoing costs only, and will not help you determine the relative total costs of owning different funds. In addition, if these transaction costs were included, your costs would have been higher.
| Class | Beginning Account Value (03/01/17) | ACTUAL | HYPOTHETICAL (5% annual return before expenses) | Annualized Expense Ratio | ||||||||||||||||||||
| Ending Account Value (08/31/17)1 | Expenses Paid During Period2 | Ending Account Value (08/31/17) | Expenses Paid During Period2 | |||||||||||||||||||||
| A | $ | 1,000.00 | $ | 1,013.60 | $ | 4.16 | $ | 1,021.07 | $ | 4.18 | 0.82 | % | ||||||||||||
| B | 1,000.00 | 1,010.00 | 7.14 | 1,018.10 | 7.17 | 1.41 | ||||||||||||||||||
| C | 1,000.00 | 1,010.10 | 7.90 | 1,017.34 | 7.93 | 1.56 | ||||||||||||||||||
| R | 1,000.00 | 1,012.40 | 5.43 | 1,019.81 | 5.45 | 1.07 | ||||||||||||||||||
| Y | 1,000.00 | 1,014.90 | 2.89 | 1,022.33 | 2.91 | 0.57 | ||||||||||||||||||
| R5 | 1,000.00 | 1,014.30 | 2.54 | 1,022.68 | 2.55 | 0.50 | ||||||||||||||||||
| R6 | 1,000.00 | 1,015.70 | 2.08 | 1,023.14 | 2.09 | 0.41 | ||||||||||||||||||
| 1 | The actual ending account value is based on the actual total return of the Fund for the period March 1, 2017 through August 31, 2017, after actual expenses and will differ from the hypothetical ending account value which is based on the Fund’s expense ratio and a hypothetical annual return of 5% before expenses. |
| 2 | Expenses are equal to the Fund’s annualized expense ratio as indicated above multiplied by the average account value over the period, multiplied by 184/365 to reflect the most recent fiscal half year. |
35 Invesco Equity and Income Fund
Approval of Investment Advisory and Sub-Advisory Contracts
The Board of Trustees (the Board) of AIM Counselor Series Trust (Invesco Counselor Series Trust) is required under the Investment Company Act of 1940, as amended, to approve annually the renewal of Invesco Equity and Income Fund’s (the Fund) investment advisory agreements. During contract renewal meetings held on June 12-13, 2017, the Board as a whole, and the disinterested or “independent” Trustees, who comprise over 75% of the Board, voting separately, approved the continuance for the Fund of the Master Investment Advisory Agreement with Invesco Advisers, Inc. (Invesco Advisers and the investment advisory agreement) and the Master Intergroup Sub-Advisory Contract for Mutual Funds with Invesco Asset Management Deutschland GmbH, Invesco Asset Management Limited, Invesco Asset Management (Japan) Limited, Invesco Hong Kong Limited, Invesco Senior Secured Management, Inc. and Invesco Canada Ltd. (collectively, the Affiliated Sub-Advisers and the sub-advisory contracts) for another year, effective July 1, 2017.
In evaluating the fairness and reasonableness of compensation under the Fund’s investment advisory agreement and sub-advisory contracts, the Board considered, among other things, the factors discussed below. The Board determined that continuation of the Fund’s investment advisory agreement and the sub-advisory contracts is in the best interest of the Fund and its shareholders and that the compensation payable to Invesco Advisers and the Affiliated Sub-Advisers under the agreements is fair and reasonable.
The Board’s Fund Evaluation Process
The Board’s Investments Committee has established three Sub-Committees, which meet throughout the year to review the performance of funds advised by Invesco Advisers (the Invesco Funds). Over the course of each year, the Sub-Committees meet with portfolio managers for their assigned Invesco Funds and other members of management to review the performance, investment objective(s), policies, strategies, limitations and investment risks of these funds. The Board had the benefit of reports from the Sub-Committees and Investments Committee throughout the year in considering approval of the continuance of each Invesco Fund’s investment advisory agreement and sub-advisory contracts for another year.
During the contract renewal process, the Board receives comparative performance and fee data regarding the Invesco Funds prepared by Invesco Advisers and Broadridge Financial Solutions, Inc. (Broadridge), an independent provider of investment company data. The Board also receives an independent written evaluation from the Senior Officer, an officer of the Invesco Funds who reports directly to the independent Trustees. The Senior Officer’s
evaluation is prepared as part of his responsibility to manage the process by which the Invesco Funds’ proposed management fees are negotiated during the annual contract renewal process to ensure they are negotiated in a manner that is at arms’ length and reasonable. In addition to meetings with Invesco Advisers and fund counsel, the independent Trustees also discuss the continuance of the investment advisory agreement and sub-advisory contracts in separate sessions with the Senior Officer and with independent legal counsel.
The Trustees recognized that the advisory fee rates for the Invesco Funds are, in most cases, the result of years of review and negotiation. The Trustees’ deliberations and conclusions in a particular year may be based in part on their deliberations and conclusions regarding these arrangements throughout the year and in prior years. The Trustees’ review and conclusions are based on the comprehensive consideration of all information presented to them and are not the result of any single determinative factor. Moreover, one Trustee may have weighed a particular piece of information or factor differently than another Trustee.
The discussion below is a summary of the Senior Officer’s independent written evaluation with respect to the Fund’s investment advisory agreement as well as a discussion of the material factors and related conclusions that formed the basis for the Board’s approval of the Fund’s investment advisory agreement and sub-advisory contracts. This information is current as of June 13, 2017, and does not reflect consideration of factors that became known to the Board after that date.
Factors and Conclusions and Summary of Independent Written Fee Evaluation
| A. | Nature, Extent and Quality of Services Provided by Invesco Advisers and the Affiliated Sub-Advisers |
The Board reviewed the advisory services provided to the Fund by Invesco Advisers under the Fund’s investment advisory agreement, the performance of Invesco Advisers in providing these services, and the credentials and experience of the officers and employees of Invesco Advisers who provide these services, including the Fund’s portfolio manager or managers. The Board’s review included consideration of Invesco Advisers’ investment process oversight, credit analysis and investment risk management. The Board also considered non-advisory services that Invesco Advisers and its affiliates provide to the Invesco Funds such as various back office support functions, trading operations, internal audit, valuation and legal and compliance.
In determining whether to continue the Fund’s investment advisory agreement, the Board considered the benefits of reapproving an
existing relationship as contrasted with the greater uncertainty that may be associated with entering into a new relationship. The Board concluded that the nature, extent and quality of the services provided to the Fund by Invesco Advisers are appropriate and satisfactory.
The Board reviewed the services that may be provided by the Affiliated Sub-Advisers under the sub-advisory contracts and the credentials and experience of the officers and employees of the Affiliated Sub-Advisers who provide these services. The Board noted that the Affiliated Sub-Advisers have offices and personnel that are located in financial centers around the world. As a result, the Board noted that the Affiliated Sub-Advisers can provide research and investment analysis on the markets and economies of various countries in which the Fund may invest, make recommendations regarding securities and assist with security trades. The Board concluded that the sub-advisory contracts may benefit the Fund and its shareholders by permitting Invesco Advisers to use the resources and talents of the Affiliated Sub-Advisers in managing the Fund. The Board concluded that the nature, extent and quality of the services that may be provided by the Affiliated Sub-Advisers are appropriate and satisfactory.
| B. | Fund Investment Performance |
The Board considered Fund investment performance as a relevant factor in considering whether to approve the investment advisory agreement. The Board did not view Fund performance as a relevant factor in considering whether to approve the sub-advisory contracts for the Fund, as no Affiliated Sub-Adviser currently manages assets of the Fund.
The Board compared the Fund’s investment performance over multiple time periods ending December 31, 2016 to the performance of funds in the Broadridge performance universe and against the Lipper Mixed-Asset Target Allocation Growth Funds Index. The Board noted that performance of Class A shares of the Fund was in the first quintile of its performance universe for the one, three and five year periods (the first quintile being the best performing funds and the fifth quintile being the worst performing funds). The Board noted that performance of Class A shares of the Fund was above the performance of the Index for the one, three and five year periods. The Trustees also reviewed more recent Fund performance and this review did not change their conclusions.
| C. | Advisory and Sub-Advisory Fees |
The Board compared the Fund’s contractual management fee rate to the contractual management fee rates of funds in the Fund’s Broadridge expense group at a common asset level. The Board noted that the contractual management fee rate for Class A shares of the Fund was below the median contractual management fee rate of funds in its expense
36 Invesco Equity and Income Fund
group. The Board noted that the term “contractual management fee” for funds in the expense group may include both advisory and certain administrative services fees, but that Broadridge does not provide information on a fund by fund basis as to what is included. The Board noted that Invesco Advisers does not separately charge the Invesco Funds for the administrative services included in the term as defined by Broadridge. The Board also reviewed the methodology used by Broadridge in providing expense group information, which includes using each fund’s contractual management fee schedule (including any applicable breakpoints) as reported in the most recent prospectus or statement of additional information for each fund in the expense group.
The Board also compared the Fund’s effective advisory fee rate (the advisory fee rate after advisory fee waivers and before other expense limitations/waivers) to the effective advisory fee rates of other mutual funds advised by Invesco Advisers and its affiliates with investment strategies comparable to those of the Fund, based on asset balances as of December 31, 2016. The Board noted that the Fund’s rate was below the rate of two mutual funds advised by Invesco Advisers and below the rate of one fund and above the rate of one fund sub-advised by Invesco Advisers. The Board noted that Invesco Advisers and the Affiliated Sub-Advisers do not advise other client accounts using an investment process substantially similar to the investment process used for the Fund.
The Board also considered the services that may be provided by the Affiliated Sub-Advisers pursuant to the sub-advisory contracts, as well as the fees payable by Invesco Advisers to the Affiliated Sub-Advisers pursuant to the sub-advisory contracts. The Board also noted that the sub-advisory fees are not paid directly by the Fund, but rather, are payable by Invesco Advisers to the Affiliated Sub-Advisers.
| D. | Economies of Scale and Breakpoints |
The Board considered the extent to which there are economies of scale in the provision of advisory services to the Fund. The Board also considered that the Fund benefits from economies of scale through contractual breakpoints in the Fund’s advisory fee schedule. The Board noted that the Fund shares directly in economies of scale through lower fees charged by third party service providers based on the combined size of the Invesco Funds advised by Invesco Advisers.
| E. | Profitability and Financial Resources |
The Board reviewed information from Invesco Advisers concerning the costs of the advisory and other services that Invesco Advisers and its affiliates provide to the Fund and the Invesco Funds and the profitability of Invesco Advisers and its affiliates in providing these services. The Board noted that Invesco Advisers continues to operate at a net profit from services Invesco Advisers and its affiliates provide to the Invesco Funds and the Fund. The Board did not deem the level of profits realized by Invesco Advisers and its affiliates from providing services to the Fund
to be excessive given the nature, quality and extent of the services provided. The Board received and accepted information from Invesco Advisers demonstrating that Invesco Advisers and each Affiliated Sub-Adviser are financially sound and have the resources necessary to perform their obligations under the investment advisory agreement and sub-advisory contracts.
| F. | Collateral Benefits to Invesco Advisers and its Affiliates |
The Board considered various other benefits received by Invesco Advisers and its affiliates from the relationship with the Fund, including the fees received for providing transfer agency and distribution services to the Fund. The Board considered comparative information regarding fees charged for these services, including information provided by Broadridge and other independent sources. The Board considered the performance of Invesco Advisers and its affiliates in providing these services and the organizational structure employed to provide these services. The Board also considered that these services are provided to the Fund pursuant to written contracts that are reviewed and approved on an annual basis by the Board; and that the services are required for the operation of the Fund.
The Board considered the benefits realized by Invesco Advisers and the Affiliated Sub-Advisers as a result of portfolio brokerage transactions executed through “soft dollar” arrangements. The Board noted that soft dollar arrangements may result in the Fund bearing costs to purchase research that may be used by Invesco Advisers or the Affiliated Sub-Advisers with other clients and may reduce Invesco Advisers’ or the Affiliated Sub-Advisers’ expenses. The Board also considered that it receives periodic reports from the Chief Compliance Officer of the Invesco Funds demonstrating that these arrangements are consistent with regulatory requirements. The Board did not deem the soft dollar arrangements to be inappropriate.
The Board considered that the Fund’s uninvested cash and cash collateral from any securities lending arrangements may be invested in money market funds advised by Invesco Advisers pursuant to procedures approved by the Board. The Board noted that Invesco Advisers receives advisory fees from these affiliated money market funds attributable to such investments, although Invesco Advisers has contractually agreed to waive through varying periods the advisory fees payable by the Invesco Funds with respect to certain investments in the affiliated money market funds. The waiver is in an amount equal to 100% of the net advisory fee Invesco Advisers receives from the affiliated money market funds with respect to the Fund’s investment in the affiliated money market funds of uninvested cash, but not cash collateral. The Board concluded that the amount of advisory fees received by Invesco Advisers from the Fund’s investment of cash collateral from any securities lending arrangements in the affiliated money market funds is fair and reasonable.
The Board also considered that the Fund may use an affiliated broker to execute certain trades for the Fund to, among other things, control information leakage, and was advised that such trades would be executed in compliance with rules under the federal securities laws and consistent with best execution obligations.
37 Invesco Equity and Income Fund
Tax Information
Form 1099-DIV, Form 1042-S and other year-end tax information provide shareholders with actual calendar year amounts that should be included in their tax returns. Shareholders should consult their tax advisors.
The following distribution information is being provided as required by the Internal Revenue Code or to meet a specific state’s requirement.
The Fund designates the following amounts or, if subsequently determined to be different, the maximum amount allowable for its fiscal year ended August 31, 2017:
Federal and State Income Tax | ||||
Long-Term Capital Gain Distributions | $ | 371,846,696 | ||
Qualified Dividend Income* | 89.33 | % | ||
Corporate Dividends Received Deduction* | 68.26 | % | ||
U.S. Treasury Obligations* | 5.65 | % | ||
| * | The above percentages are based on ordinary income dividends paid to shareholders during the Fund’s fiscal year. |
Non-Resident Alien Shareholders | ||||
Qualified Short-Term Gains | $5,471,680 | |||
38 Invesco Equity and Income Fund
Proxy Results
A Special Joint Meeting (“Meeting”) of Shareholders of Invesco Equity and Income Fund, an investment portfolio of AIM Counselor Series Trust (Invesco Counselor Series Trust), a Delaware statutory trust (“Trust”), was held on March 9, 2017. The Meeting was held for the following purposes:
| (1) | Elect 15 trustees to the Board, each of whom will serve until his or her successor is elected and qualified. |
| (2) | Approve an amendment to the Trust’s Agreement and Declaration of Trust that would permit fund mergers and other significant transactions upon the Board’s approval but without shareholder approval of such transactions. |
The results of the voting on the above matters were as follows:
| Matters | Votes For | Votes Withheld | ||||||||||||||||
| (1)* | David C. Arch | 1,425,647,604 | 36,521,875 | |||||||||||||||
| James T. Bunch | 1,425,181,099 | 36,988,380 | ||||||||||||||||
| Bruce L. Crockett | 1,425,174,694 | 36,994,785 | ||||||||||||||||
| Jack M. Fields | 1,426,060,874 | 36,108,605 | ||||||||||||||||
| Martin L. Flanagan | 1,426,481,477 | 35,688,002 | ||||||||||||||||
| Cynthia Hostetler | 1,426,489,972 | 35,679,505 | ||||||||||||||||
| Dr. Eli Jones | 1,426,255,832 | 35,913,647 | ||||||||||||||||
| Dr. Prema Mathai-Davis | 1,425,363,789 | 36,805,689 | ||||||||||||||||
| Teresa M. Ressel | 1,426,514,880 | 35,654,598 | ||||||||||||||||
| Dr. Larry Soll | 1,424,932,245 | 37,237,234 | ||||||||||||||||
| Ann Barnett Stern | 1,426,260,049 | 35,909,429 | ||||||||||||||||
| Raymond Stickel, Jr. | 1,425,391,657 | 36,777,822 | ||||||||||||||||
| Philip A. Taylor | 1,426,285,212 | 35,884,267 | ||||||||||||||||
| Robert C. Troccoli | 1,426,075,097 | 36,094,382 | ||||||||||||||||
| Christopher L. Wilson | 1,426,594,956 | 35,574,523 | ||||||||||||||||
| Votes For | Votes Against | Votes Abstain | Broker Non-Votes | |||||||||||||||
| (2)* | Approve an amendment to the Trust’s Agreement and Declaration of Trust that would permit fund mergers and other significant transactions upon the Board’s approval but without shareholder approval of such transactions | 751,302,707 | 79,810,344 | 41,561,890 | 589,495,482 | |||||||||||||
The Meeting was adjourned until April 11, 2017, with respect to the following proposals:
| (3) | Approve changing the fundamental investment restriction regarding the purchase or sale of physical commodities. |
| 4(a) | Approve an amendment to the current Master Intergroup Sub-Advisory Contract to add Invesco PowerShares Capital Management LLC. |
| 4(b) | Approve an amendment to the current Master Intergroup Sub-Advisory Contract to add Invesco Asset Management (India) Private Limited. |
Invesco Equity and Income Fund did not receive sufficient shareholder votes to pass Proposals 3 and 4(a) - (b).
The results of the voting on the above matters were as follows:
| Matters | Votes For | Votes Against | Votes Abstain | Broker Non-Votes | ||||||||||||||
| (3) | Approve changing the fundamental investment restriction regarding the purchase or sale of physical commodities | 373,364,995 | 29,972,923 | 26,711,546 | 265,915,974 | |||||||||||||
| 4(a) | Approve an amendment to the current Master Intergroup Sub-Advisory Contract to add Invesco PowerShares Capital Management LLC | 386,855,636 | 16,975,060 | 26,228,226 | 265,906,516 | |||||||||||||
| 4(b) | Approve an amendment to the current Master Intergroup Sub-Advisory Contract to add Invesco Asset Management (India) Private Limited | 379,432,902 | 23,553,004 | 27,073,000 | 265,906,532 | |||||||||||||
| * | Each of proposal 1 and 2 required approval by a combined vote of all of the portfolios of AIM Counselor Series Trust (Invesco Counselor Series Trust). |
39 Invesco Equity and Income Fund
Trustees and Officers
The address of each trustee and officer is AIM Counselor Series Trust (Invesco Counselor Series Trust) (the “Trust”), 11 Greenway Plaza, Suite 1000, Houston, Texas 77046-1173. The trustees serve for the life of the Trust, subject to their earlier death, incapacitation, resignation, retirement or removal as more specifically provided in the Trust’s organizational documents. Each officer serves for a one year term or until their successors are elected and qualified. Column two below includes length of time served with predecessor entities, if any.
| Name, Year of Birth and Position(s) Held with the Trust | Trustee and/ or Officer Since | Principal Occupation(s) During Past 5 Years | Number of Overseen by | Other Directorship(s) Held by Trustee During Past 5 Years | ||||
| Interested Persons | ||||||||
| Martin L. Flanagan1 — 1960 Trustee | 2007 | Executive Director, Chief Executive Officer and President, Invesco Ltd. (ultimate parent of Invesco and a global investment management firm); Trustee, The Invesco Funds; Vice Chair, Investment Company Institute; and Member of Executive Board, SMU Cox School of Business
Formerly: Advisor to the Board, Invesco Advisers, Inc. (formerly known as Invesco Institutional (N.A.), Inc.); Chairman and Chief Executive Officer, Invesco Advisers, Inc. (registered investment adviser); Director, Chairman, Chief Executive Officer and President, Invesco Holding Company (US), Inc. (formerly IVZ Inc.) (holding company), Invesco Group Services, Inc. (service provider) and Invesco North American Holdings, Inc. (holding company); Director, Chief Executive Officer and President, Invesco Holding Company Limited (parent of Invesco and a global investment management firm); Director, Invesco Ltd.; Chairman, Investment Company Institute and President, Co-Chief Executive Officer, Co-President, Chief Operating Officer and Chief Financial Officer, Franklin Resources, Inc. (global investment management organization) | 144 | None | ||||
Philip A. Taylor2 — 1954 Trustee and Senior Vice President | 2006 | Head of the Americas and Senior Managing Director, Invesco Ltd.; Director, Invesco Advisers, Inc. (formerly known as Invesco Institutional (N.A.), Inc.) (registered investment adviser); Director, Chairman, Chief Executive Officer and President, Invesco Management Group, Inc. (formerly known as Invesco Aim Management Group, Inc.) (financial services holding company); Director and Chairman, Invesco Investment Services, Inc. (formerly known as Invesco Aim Investment Services, Inc.) (registered transfer agent); Chief Executive Officer, Invesco Corporate Class Inc. (corporate mutual fund company); Director, Chairman and Chief Executive Officer, Invesco Canada Ltd. (formerly known as Invesco Trimark Ltd./Invesco Trimark Ltèe) (registered investment adviser and registered transfer agent); Trustee and Senior Vice President, The Invesco Funds; Director, Invesco Investment Advisers LLC (formerly known as Van Kampen Asset Management).
Formerly: Co-Chairman, Co-President and Co-Chief Executive Officer, Invesco Advisers, Inc. (formerly known as Invesco Institutional (N.A.), Inc.) (registered investment adviser); Director, Chief Executive Officer and President, Van Kampen Exchange Corp; President and Principal Executive Officer, The Invesco Funds (other than AIM Treasurer’s Series Trust (Invesco Treasurer’s Series Trust), Short-Term Investments Trust and Invesco Management Trust); Executive Vice President, The Invesco Funds (AIM Treasurer’s Series Trust (Invesco Treasurer’s Series Trust), Short-Term Investments Trust and Invesco Management Trust only); Director and President, INVESCO Funds Group, Inc. (registered investment adviser and registered transfer agent); Director and Chairman, IVZ Distributors, Inc. (formerly known as INVESCO Distributors, Inc.) (registered broker dealer); Director, President and Chairman, Invesco Inc. (holding company), Invesco Canada Holdings Inc. (holding company), Trimark Investments Ltd./Placements Trimark Ltèe and Invesco Financial Services Ltd/Services Financiers Invesco Ltèe; Chief Executive Officer, Invesco Canada Fund Inc. (corporate mutual fund company); Director and Chairman, Van Kampen Investor Services Inc.; Director, Chief Executive Officer and President, 1371 Preferred Inc. (holding company) and Van Kampen Investments Inc.; Director and President, AIM GP Canada Inc. (general partner for limited partnerships) and Van Kampen Advisors, Inc.; Director and Chief Executive Officer, Invesco Trimark Dealer Inc. (registered broker dealer); Director, Invesco Distributors, Inc. (formerly known as Invesco Aim Distributors, Inc.) (registered broker dealer); Manager, Invesco PowerShares Capital Management LLC; Director, Chief Executive Officer and President, Invesco Advisers, Inc.; Director, Chairman, Chief Executive Officer and President, Invesco Aim Capital Management, Inc.; President, Invesco Trimark Dealer Inc. and Invesco Trimark Ltd./Invesco Trimark Ltèe; Director and President, AIM Trimark Corporate Class Inc. and AIM Trimark Canada Fund Inc.; Senior Managing Director, Invesco Holding Company Limited; Director and Chairman, Fund Management Company (former registered broker dealer); President and Principal Executive Officer, The Invesco Funds (AIM Treasurer’s Series Trust (Invesco Treasurer’s Series Trust), and Short-Term Investments Trust only); President, AIM Trimark Global Fund Inc. and AIM Trimark Canada Fund Inc. | 144 | None |
| 1 | Mr. Flanagan is considered an interested person (within the meaning of Section 2(a)(19) of the 1940 Act) of the Trust because he is an officer of the Adviser to the Trust, and an officer and a director of Invesco Ltd., ultimate parent of the Adviser. |
| 2 | Mr. Taylor is considered an interested person (within the meaning of Section 2(a)(19) of the 1940 Act) of the Trust because he is an officer and a director of the Adviser. |
T-1 Invesco Equity and Income Fund
Trustees and Officers—(continued)
| Name, Year of Birth and Position(s) Held with the Trust | Trustee and/ or Officer Since | Principal Occupation(s) During Past 5 Years | Number of Complex Overseen by Trustee | Other Directorship(s) Held by Trustee During | ||||
| Independent Trustees | ||||||||
Bruce L. Crockett — 1944 Trustee and Chair | 2003 | Chairman, Crockett Technologies Associates (technology consulting company)
Formerly: Director, Captaris (unified messaging provider); Director, President and Chief Executive Officer, COMSAT Corporation; Chairman, Board of Governors of INTELSAT (international communications company); ACE Limited (insurance company); Independent Directors Council and Investment Company Institute: Member of the Audit Committee, Investment Company Institute; Member of the Executive Committee and Chair of the Governance Committee, Independent Directors Council | 144 | Director and Chairman of the Audit Committee, ALPS (Attorneys Liability Protection Society) (insurance company); Director and Member of the Audit Committee, Ferroglobe PLC (metallurgical company) | ||||
David C. Arch — 1945 Trustee | 2010 | Chairman of Blistex Inc. (consumer health care products manufacturer); Member, World Presidents’ Organization | 144 | Board member of the Illinois Manufacturers’ Association | ||||
James T. Bunch — 1942 Trustee | 2000 | Managing Member, Grumman Hill Group LLC (family office/private equity investments)
Formerly: Chairman of the Board, Denver Film Society; Chairman of the Board of Trustees, Evans Scholarship Foundation; Chairman, Board of Governors, Western Golf Association | 144 | Trustee, Evans Scholarship Foundation | ||||
Jack M. Fields — 1952 Trustee | 2003 | Chief Executive Officer, Twenty First Century Group, Inc. (government affairs company); and Discovery Learning Alliance (non-profit)
Formerly: Owner and Chief Executive Officer, Dos Angeles Ranch L.P. (cattle, hunting, corporate entertainment); Director, Insperity, Inc. (formerly known as Administaff); Chief Executive Officer, Texana Timber LP (sustainable forestry company); Director of Cross Timbers Quail Research Ranch (non-profit); and member of the U.S. House of Representatives | 144 | None | ||||
Cynthia Hostetler — 1962 Trustee | 2017 | Non-Executive Director and Trustee of a number of public and private business corporations
Formerly: Head of Investment Funds and Private Equity, Overseas Private Investment Corporation; President, First Manhattan Bancorporation, Inc.; Attorney, Simpson Thacher & Bartlett LLP | 144 | Vulcan Materials Company (construction materials company); Trilinc Global Impact Fund; Aberdeen Investment Funds (4 portfolios); Artio Global Investment LLC (mutual fund complex); Edgen Group, Inc. (specialized energy and infrastructure products distributor) | ||||
Eli Jones — 1961 Trustee | 2016 | Professor and Dean, Mays Business School — Texas A&M University
Formerly: Professor and Dean, Walton College of Business, University of Arkansas and E.J. Ourso College of Business, Louisiana State University; Director, Arvest Bank | 144 | Insperity, Inc. (formerly known as Administaff) (human resources provider) | ||||
Prema Mathai-Davis — 1950 Trustee | 2003 | Retired.
Formerly: Chief Executive Officer, YWCA of the U.S.A. | 144 | None | ||||
Teresa M. Ressel — 1962 Trustee | 2017 | Non-executive director and trustee of a number of public and private business corporations
Formerly: Chief Financial Officer, Olayan America, The Olayan Group (international investor/commercial/industrial); Chief Executive Officer, UBS Securities LLC; Group Chief Operating Officer, Americas, UBS AG; Assistant Secretary for Management & Budget and CFO, US Department of the Treasury; Chief Compliance Officer, Kaiser Permanente; Program Manager, Hewlett-Packard; Nuclear Engineering, General Dynamics Corporation | 144 | Atlantic Power Corporation (power generation company); ON Semiconductor Corp. (semiconductor supplier) | ||||
Larry Soll — 1942 Trustee | 1997 | Retired.
Formerly: Chairman, Chief Executive Officer and President, Synergen Corp. (a biotechnology company) | 144 | None | ||||
Ann Barnett Stern — 1957 Trustee | 2017 | President and Chief Executive Officer, Houston Endowment Inc. (private philanthropic institution)
Formerly: Executive Vice President and General Counsel, Texas Children’s Hospital; Attorney, Beck, Redden and Secrest, LLP; Business Law Instructor, University of St. Thomas; Attorney, Andrews & Kurth LLP | 144 | Federal Reserve Bank of Dallas | ||||
Raymond Stickel, Jr. — 1944 Trustee | 2005 | Retired.
Formerly: Director, Mainstay VP Series Funds, Inc. (25 portfolios); Partner, Deloitte & Touche | 144 | None | ||||
Robert C. Troccoli — 1949 Trustee | 2016 | Adjunct Professor, University of Denver — Daniels College of Business
Formerly: Senior Partner, KPMG LLP | 144 | None | ||||
Christopher L. Wilson — 1957 Trustee | 2017 | Managing Partner, CT2, LLC (investing and consulting firm)
Formerly: President/Chief Executive Officer, Columbia Funds, Bank of America Corporation; President/Chief Executive Officer, CDC IXIS Asset Management Services, Inc.; Principal & Director of Operations, Scudder Funds, Scudder, Stevens & Clark, Inc.; Assistant Vice President, Fidelity Investments | 144 | TD Asset Management USA Inc. (mutual fund complex) (22 portfolios); ISO New England, Inc. (non-profit organization managing regional electricity market) |
T-2 Invesco Equity and Income Fund
Trustees and Officers—(continued)
| Name, Year of Birth and Position(s) Held with the Trust | Trustee and/ or Officer Since | Principal Occupation(s) During Past 5 Years | Number of Complex Overseen by Trustee | Other Directorship(s) Held by Trustee During | ||||
| Other Officers | ||||||||
Sheri Morris — 1964 President, Principal Executive Officer and Treasurer | 2003 | President, Principal Executive Officer and Treasurer, The Invesco Funds; Vice President, Invesco Advisers, Inc. (formerly known as Invesco Institutional (N.A.), Inc.) (registered investment adviser); and Vice President, PowerShares Exchange-Traded Fund Trust, PowerShares Exchange-Traded Fund Trust II, PowerShares India Exchange-Traded Fund Trust, PowerShares Actively Managed Exchange-Traded Fund Trust and PowerShares Actively Managed Exchange-Traded Commodity Fund Trust
Formerly: Vice President and Principal Financial Officer, The Invesco Funds; Vice President, Invesco Aim Advisers, Inc., Invesco Aim Capital Management, Inc. and Invesco Aim Private Asset Management, Inc.; Assistant Vice President and Assistant Treasurer, The Invesco Funds and Assistant Vice President, Invesco Advisers, Inc., Invesco Aim Capital Management, Inc. and Invesco Aim Private Asset Management, Inc.; and Treasurer, PowerShares Exchange-Traded Fund Trust, PowerShares Exchange-Traded Fund Trust II, PowerShares India Exchange-Traded Fund Trust and PowerShares Actively Managed Exchange-Traded Fund Trust | N/A | N/A | ||||
Russell C. Burk — 1958 Senior Vice President and Senior Officer | 2005 | Senior Vice President and Senior Officer, The Invesco Funds | N/A | N/A | ||||
John M. Zerr — 1962 Senior Vice President, Chief Legal Officer and Secretary | 2006 | Director, Senior Vice President, Secretary and General Counsel, Invesco Management Group, Inc. (formerly known as Invesco AIM Management Group, Inc.); Senior Vice President, Invesco Advisers, Inc. (formerly known as Invesco Institutional (N.A.), Inc.) (registered investment adviser); Senior Vice President and Secretary, Invesco Distributors, Inc. (formerly known as Invesco AIM Distributors, Inc.); Director, Vice President and Secretary, Invesco Investment Services, Inc. (formerly known as Invesco AIM Investment Services, Inc.) Senior Vice President, Chief Legal Officer and Secretary, The Invesco Funds; Managing Director, Invesco PowerShares Capital Management LLC; Director, Secretary and General Counsel, Invesco Investment Advisers LLC (formerly known as Van Kampen Asset Management); Secretary and General Counsel, Invesco Capital Markets, Inc. (formerly known as Van Kampen Funds Inc.) and Chief Legal Officer, PowerShares Exchange-Traded Fund Trust, PowerShares Exchange-Traded Fund Trust II, PowerShares India Exchange-Traded Fund Trust, PowerShares Actively Managed Exchange-Traded Fund Trust and PowerShares Actively Managed Exchange-Traded Commodity Fund Trust; Manager and Secretary, Invesco Indexing LLC
Formerly: Director, Secretary, General Counsel and Senior Vice President, Van Kampen Exchange Corp.; Director, Vice President and Secretary, IVZ Distributors, Inc. (formerly known as INVESCO Distributors, Inc.); Director and Vice President, INVESCO Funds Group, Inc.; Director and Vice President, Van Kampen Advisors Inc.; Director, Vice President, Secretary and General Counsel, Van Kampen Investor Services Inc.; Director, Invesco Distributors, Inc. (formerly known as Invesco AIM Distributors, Inc.); Director, Senior Vice President, General Counsel and Secretary, Invesco AIM Advisers, Inc. and Van Kampen Investments Inc.; Director, Vice President and Secretary, Fund Management Company; Director, Senior Vice President, Secretary, General Counsel and Vice President, Invesco AIM Capital Management, Inc.; Chief Operating Officer and General Counsel, Liberty Ridge Capital, Inc. (an investment adviser); Vice President and Secretary, PBHG Funds (an investment company) and PBHG Insurance Series Fund (an investment company); Chief Operating Officer, General Counsel and Secretary, Old Mutual Investment Partners (a broker-dealer); General Counsel and Secretary, Old Mutual Fund Services (an administrator) and Old Mutual Shareholder Services (a shareholder servicing center); Executive Vice President, General Counsel and Secretary, Old Mutual Capital, Inc. (an investment adviser); and Vice President and Secretary, Old Mutual Advisors Funds (an investment company) | N/A | N/A | ||||
Gregory G. McGreevey — 1962 Senior Vice President | 2012 | Senior Managing Director, Invesco Ltd.; Director, Chairman, President, and Chief Executive Officer, Invesco Advisers, Inc. (formerly known as Invesco Institutional (N.A.), Inc.) (registered investment adviser); Director, Invesco Mortgage Capital, Inc. and Invesco Senior Secured Management, Inc.; and Senior Vice President, The Invesco Funds
Formerly: Assistant Vice President, The Invesco Funds | N/A | N/A | ||||
Kelli Gallegos — 1970 Vice President, Principal Financial Officer and Assistant Treasurer | 2008 | Vice President, Principal Financial Officer and Assistant Treasurer, The Invesco Funds; Assistant Treasurer, Invesco PowerShares Capital Management LLC, PowerShares Exchange-Traded Fund Trust, PowerShares Exchange-Traded Fund Trust II, PowerShares India Exchange-Traded Fund Trust, PowerShares Actively Managed Exchange-Traded Fund Trust and PowerShares Actively Managed Exchange-Traded Commodity Fund Trust
Formerly: Assistant Vice President, The Invesco Funds | N/A | N/A |
T-3 Invesco Equity and Income Fund
Trustees and Officers—(continued)
| Name, Year of Birth and Position(s) Held with the Trust | Trustee and/ or Officer Since | Principal Occupation(s) During Past 5 Years | Number of Complex Overseen by Trustee | Other Directorship(s) Held by Trustee During | ||||
| Other Officers—(continued) | ||||||||
Tracy Sullivan — 1962 Vice President, Chief Tax Officer and Assistant Treasurer | 2008 | Vice President, Chief Tax Officer and Assistant Treasurer, The Invesco Funds; Assistant Treasurer, Invesco PowerShares Capital Management LLC, PowerShares Exchange-Traded Fund Trust, PowerShares Exchange-Traded Fund Trust II, PowerShares India Exchange-Traded Fund Trust, PowerShares Actively Managed Exchange-Traded Fund Trust and PowerShares Actively Managed Exchange-Traded Commodity Fund Trust
Formerly: Assistant Vice President, The Invesco Funds | N/A | N/A | ||||
Crissie M. Wisdom — 1969 Anti-Money Laundering Compliance Officer | 2013 | Anti-Money Laundering Compliance Officer, Invesco Advisers, Inc. (formerly known as Invesco Institutional (N.A.), Inc.) (registered investment adviser), Invesco Capital Markets, Inc. (formerly known as Van Kampen Funds Inc.), Invesco Distributors, Inc., Invesco Investment Services, Inc., Invesco Management Group, Inc., The Invesco Funds, and PowerShares Exchange-Traded Fund Trust, PowerShares Exchange-Traded Fund Trust II, PowerShares India Exchange-Traded Fund Trust, PowerShares Actively Managed Exchange-Traded Fund Trust and PowerShares Actively Managed Exchange-Traded Commodity Fund Trust; Anti-Money Laundering Compliance Officer and Bank Secrecy Act Officer, INVESCO National Trust Company and Invesco Trust Company; and Fraud Prevention Manager and Controls and Risk Analysis Manager for Invesco Investment Services, Inc.
Formerly: Anti-Money Laundering Compliance Officer, Van Kampen Exchange Corp. | N/A | N/A | ||||
Robert R. Leveille — 1969 Chief Compliance Officer | 2016 | Chief Compliance Officer, Invesco Advisers, Inc. (registered investment adviser); and Chief Compliance Officer, The Invesco Funds
Formerly: Chief Compliance Officer, Putnam Investments and the Putnam Funds | N/A | N/A |
The Statement of Additional Information of the Trust includes additional information about the Fund’s Trustees and is available upon request, without charge, by calling 1.800.959.4246. Please refer to the Fund’s Statement of Additional Information for information on the Fund’s sub-advisers.
Office of the Fund 11 Greenway Plaza, Suite 1000 Houston, TX 77046-1173 | Investment Adviser Invesco Advisers, Inc. 1555 Peachtree Street, N.E. Atlanta, GA 30309 | Distributor Invesco Distributors, Inc. 11 Greenway Plaza, Suite 1000 Houston, TX 77046-1173 | Auditors PricewaterhouseCoopers LLP 1000 Louisiana Street, Suite 5800 Houston, TX 77002-5678 | |||
Counsel to the Fund Stradley Ronon Stevens & Young, LLP 2005 Market Street, Suite 2600 Philadelphia, PA 19103-7018 | Counsel to the Independent Trustees Goodwin Procter LLP 901 New York Avenue, N.W. Washington, D.C. 20001 | Transfer Agent Invesco Investment Services, Inc. 11 Greenway Plaza, Suite 1000 Houston, TX 77046-1173 | Custodian State Street Bank and Trust Company 225 Franklin Street Boston, MA 02110-2801 | |||
T-4 Invesco Equity and Income Fund
Explore High-Conviction Investing with Invesco

Go paperless with eDelivery
Visit invesco.com/edelivery to enjoy the convenience and security of anytime electronic access to your investment documents.
With eDelivery, you can elect to have any or all of the following materials delivered straight to your inbox to download, save and print from your own computer:
| ∎ | Fund reports and prospectuses |
| ∎ | Quarterly statements |
| ∎ | Daily confirmations |
| ∎ | Tax forms |
Invesco mailing information
Send general correspondence to Invesco Investment Services, Inc., P.O. Box 219078, Kansas City, MO 64121-9078.
Important notice regarding delivery of security holder documents
To reduce Fund expenses, only one copy of most shareholder documents may be mailed to shareholders with multiple accounts at the same address (Householding). Mailing of your shareholder documents may be householded indefinitely unless you instruct us otherwise. If you do not want the mailing of these documents to be combined with those for other members of your household, please contact Invesco Investment Services, Inc. at 800 959 4246 or contact your financial institution. We will begin sending you individual copies for each account within 30 days after receiving your request.
Fund holdings and proxy voting information
The Fund provides a complete list of its holdings four times in each fiscal year, at the quarter ends. For the second and fourth quarters, the lists appear in the Fund’s semiannual and annual reports to shareholders. For the first and third quarters, the Fund files the lists with the Securities and Exchange Commission (SEC) on Form N-Q. The most recent list of portfolio holdings is available at invesco.com/completeqtrholdings. Shareholders can also look up the Fund’s Forms N-Q on the SEC website at sec.gov. Copies of the Fund’s Forms N-Q may be reviewed and copied at the SEC Public Reference Room in Washington, D.C. You can obtain information on the operation of the Public Reference Room, including information about duplicating fee charges, by calling 202 551 8090 or 800 732 0330, or by electronic request at the following email address: publicinfo@sec.gov. The SEC file numbers for the Fund are shown below.
A description of the policies and procedures that the Fund uses to determine how to vote proxies relating to portfolio securities is available without charge, upon request, from our Client Services department at 800 959 4246 or at invesco.com/proxyguidelines. The information is also available on the SEC website, sec.gov.
Information regarding how the Fund voted proxies related to its portfolio securities during the most recent 12-month period ended June 30 is available at invesco.com/proxysearch. The information is also available on the SEC website, sec.gov. Invesco Advisers, Inc. is an investment adviser; it provides investment advisory services to individual and institutional clients and does not sell securities. Invesco Distributors, Inc. is the US distributor for Invesco Ltd.’s retail mutual funds, exchange-traded funds and institutional money market funds. Both are wholly owned, indirect subsidiaries of Invesco Ltd. |  |
SEC file numbers: 811-09913 and 333-36074 Invesco Distributors, Inc. VK-EQI-AR-1 10172017 1052
| ||||
 | Annual Report to Shareholders
| August 31, 2017
| ||
| ||||
Invesco Floating Rate Fund
Nasdaq: A: AFRAX ◾ C: AFRCX ◾ R: AFRRX ◾ Y: AFRYX ◾ R5: AFRIX ◾ R6: AFRFX | ||||

Letters to Shareholders
Philip Taylor | Dear Shareholders: This annual report includes information about your Fund, including performance data and a complete list of its investments as of the close of the reporting period. Inside is a discussion of how your Fund was managed and the factors that affected its performance during the reporting period. The reporting period began with stock market volatility in the US and abroad, largely the result of uncertainty about global economic growth and monetary policy. While economic data in the US were generally positive, news overseas was less upbeat. The European Central Bank and central banks in China and Japan – as well as other countries – maintained extraordinarily accommodative monetary policies in response to economic weakness. Citing generally positive economic data – specifically, realized and expected labor market conditions and inflation – the US Federal Reserve raised interest rates three times during the reporting period: in December 2016, and in March and June 2017. The major US stock market rally |

that began in November 2016 continued through the end of the reporting period, with major stock market indexes repeatedly hitting new record highs.
Short-term market volatility can prompt some investors to abandon their investment plans – and can cause others to settle for whatever returns the market has to offer. The investment professionals at Invesco, in contrast, invest with high conviction. This means that, no matter the asset class or the strategy, each investment team has a passion to exceed. We want to help investors achieve better outcomes, such as seeking higher returns, helping mitigate risk and generating income. Of course, investing with high conviction can’t guarantee a profit or ensure success; no investment strategy can. To learn more about how we invest with high conviction, visit invesco.com/HighConviction.
You, too, can invest with high conviction by maintaining a long-term investment perspective and by working with your financial adviser on a regular basis. During periods of short-term market volatility or uncertainty, your financial adviser can keep you focused on your long-term investment goals – a new home, a child’s college education or a secure retirement. He or she also can share research about the economy, the markets and individual investment options.
Visit our website for more information on your investments
Our website, invesco.com/us, offers a wide range of market insights and investment perspectives. On the website, you’ll find detailed information about our funds, including performance, holdings and portfolio manager commentaries. You can access information about your account by completing a simple, secure online registration. To do so, select “Log In” on the right side of the homepage, and then select “Register for Individual Account Access.”
In addition to the resources accessible on our website and through our mobile app, you can obtain timely updates to help you stay informed about the markets and the economy by connecting with Invesco on Twitter, LinkedIn or Facebook. You can access our blog at blog.invesco.us.com. Our goal is to provide you the information you want, when and where you want it.
Finally, I’m pleased to share with you Invesco’s commitment to both the Principles for Responsible Investment and to considering environmental, social and governance issues in our robust investment process. I invite you to learn more at invesco.com/esg.
Have questions?
For questions about your account, contact an Invesco client services representative at 800 959 4246. For Invesco-related questions or comments, please email me directly at phil@invesco.com.
All of us at Invesco look forward to serving your investment management needs. Thank you for investing with us.
Sincerely,

Philip Taylor
Senior Managing Director, Invesco Ltd.
2 Invesco Floating Rate Fund
Bruce Crockett | Dear Fellow Shareholders: Among the many important lessons I’ve learned in more than 40 years in a variety of business endeavors is the value of a trusted advocate. As independent chair of the Invesco Funds Board, I can assure you that the members of the Board are strong advocates for the interests of investors in Invesco’s mutual funds. We work hard to represent your interests through oversight of the quality of the investment management services your funds receive and other matters important to your investment, including but not limited to: ∎ Ensuring that Invesco offers a diverse lineup of mutual funds that your financial adviser can use to strive to meet your financial needs as your investment goals change over time. ∎ Monitoring how the portfolio management teams of the Invesco funds are performing in light of changing economic and market conditions. |

∎ Assessing each portfolio management team’s investment performance within the context of the investment strategy described in the fund’s prospectus.
∎ Monitoring for potential conflicts of interests that may impact the nature of the services that your funds receive.
We believe one of the most important services we provide our fund shareholders is the annual review of the funds’ advisory and sub-advisory contracts with Invesco Advisers and its affiliates. This review is required by the Investment Company Act of 1940 and focuses on the nature and quality of the services Invesco provides as the adviser to the Invesco funds and the reasonableness of the fees that it charges for those services. Each year, we spend months carefully reviewing information received from Invesco and a variety of independent sources, such as performance and fee data prepared by Lipper, Inc. (a subsidiary of Broadridge Financial Solutions, Inc.), an independent, third-party firm widely recognized as a leader in its field. We also meet with our independent legal counsel and other independent advisers to review and help us assess the information that we have received. Our goal is to assure that you receive quality investment management services for a reasonable fee.
I trust the measures outlined above provide assurance that you have a worthy advocate when it comes to choosing the Invesco Funds.
As always, please contact me at bruce@brucecrockett.com with any questions or concerns you may have. On behalf of the Board, we look forward to continuing to represent your interests and serving your needs.
Sincerely,

Bruce L. Crockett
Independent Chair
Invesco Funds Board of Trustees
3 Invesco Floating Rate Fund
Management’s Discussion of Fund Performance
Performance summary
For the fiscal year ended August 31, 2017, Class A shares of Invesco Floating Rate Fund (the Fund), at net asset value (NAV), outperformed the Fund’s style-specific index, the Credit Suisse Leveraged Loan Index.
Your Fund’s long-term performance appears later in this report.
Fund vs. Indexes
Total returns, 8/31/16 to 8/31/17, at net asset value (NAV). Performance shown does not include applicable contingent deferred sales charges (CDSC) or front-end sales charges, which would have reduced performance.
Class A Shares | 6.03 | % | ||
Class C Shares | 5.51 | |||
Class R Shares | 5.62 | |||
Class Y Shares | 6.29 | |||
Class R5 Shares | 6.29 | |||
Class R6 Shares | 6.39 | |||
Bloomberg Barclays U.S. Aggregate Indexq (Broad Market Index) | 0.49 | |||
Credit Suisse Leveraged Loan Index∎ (Style-Specific Index) | 5.85 | |||
Lipper Loan Participation Funds Classification Average◆ (Peer Group) | 4.99 | |||
Source(s): qFactSet Research Systems, Inc.; ∎Bloomberg L.P.; ◆Lipper Inc. | ||||
Market conditions and your Fund
The senior loan market was characterized by solid returns for much of the reporting period covered by this report. In the latter part of 2016, investor interest in loans gained momentum as a result of the outlook for higher interest rates following the outcome of the US presidential election, indications of expansionary fiscal policy from the new administration and the subsequent interest rate increase by the US Federal Reserve (the Fed) in December. Through the end of the reporting period, the senior loan market continued to provide stable, positive returns reflective of the coupon as average loan prices remained close to par.
Fundamentals remained supportive with a trailing 12-month default rate of
1.36%1 as of August 31, 2017. We believe slow but positive growth in the US economy may continue to support fundamentals. During the reporting period, corporate revenue and earnings growth remained positive outside of a few pockets of weakness concentrated in commodity-related and retail sectors. Senior loans’ exposure to these sectors remained relatively low with only 3.17% in energy, 0.84% in metals and mining and 4.67% in retail.1 Strong technicals pushed loan prices higher as demand outstripped supply for most of the fiscal year. Demand from institutional investors was robust as longer-term investors continued to view senior loans as a strategic allocation due to their defensive nature, high coupon and potential diversification benefits. Both collateralized loan obligation (CLO)
issuance (which is representative of institutional demand) as well as inflows into retail senior loan mutual funds remained robust during the Fund’s fiscal year. New issuance struggled to keep pace with strong demand, leading many issuers to opportunistically refinance and re-price transactions in an effort to extend maturities and reduce interest expenses.
The average price in the senior loan market was $97.962 as of August 31, 2017, with 62%3 of the market trading at or above par and a small percentage of distressed outliers weighing on the broader average. Given the price of senior loans at the end of the Fund’s fiscal year, they were providing a 5.70% yield.2
We managed the Fund with a view toward taking advantage of what appeared to be an expanding (albeit slowly) economy, an absence of corporate restructurings and strong demand for floating rate assets from investors concerned about how rising interest rates might impact the market value of longer-dated fixed income investments.
As part of the Fund’s investment strategy, we seek to take advantage of market opportunities by decreasing risk in the Fund when we believe senior loans are overbought and increasing risk when we believe they are oversold. The Fund benefited from some newer primary institutional loans, which exhibited low volatility during the reporting period and which were sold at prices that offered, in our opinion, the potential for above-market returns for the associated risk.
We seek to efficiently allocate risk within the portfolio in order to maximize risk-adjusted returns through five
| Portfolio Composition*† | ||
By credit quality | % of total investments | |
BBB | 0.1 % | |
| BBB- | 7.3 | |
| BB+ | 7.0 | |
BB | 16.3 | |
BB- | 16.4 | |
B+ | 16.0 | |
B | 18.7 | |
B- | 5.5 | |
CCC+ | 3.6 | |
CCC | 0.7 | |
CCC- | 0.3 | |
CC | 1.4 | |
| D | 0.4 | |
| Non-Rated | 4.9 | |
| Equity | 1.4 | |
| Top Five Debt Issuers* | ||||
| % of total investments | ||||
| 1. | NRG Energy Inc. | 1.9% | ||
| 2. | Asurion LLC | 1.4 | ||
| 3. | iHeart Communications, Inc. | 1.3 | ||
| 4. | First Data Corporation | 1.3 | ||
| 5. | Transdigm Inc. | 1.3 | ||
Total Net Assets | $2.7 billion | |
Total Number of Holdings* | 667 | |
The Fund’s holdings are subject to change, and there is no assurance that the Fund will continue to hold any particular security.
*Excluding money market fund holdings.
Data presented here are as of August 31, 2017.
†Source: Standard & Poor’s. A credit rating is an assessment provided by a nationally recognized statistical rating organization (NRSRO) of the creditworthiness of an issuer with respect to debt obligations, including specific securities, money market instruments or other debts. Ratings are measured on a scale that generally ranges from AAA (highest) to D (lowest); ratings are subject to change without notice. “Non-Rated” indicates the debtor was not rated, and should not be interpreted as indicating low quality. For more information on Standard & Poor’s rating methodology, please visit standardandpoors.com and select “Understanding Ratings” under Rating Resources on the homepage.
4 Invesco Floating Rate Fund
different considerations consisting of credit selection, sector migration, risk positioning, asset selection and trading. The most significant detractor from Fund performance during the fiscal year was Adria Group Holding. Two other detractors were New Look and Transtar Holding. We eliminated New Look from the portfolio before the close of the reporting period. The top three contributors to Fund performance were Arch Coal, iHeart Communications and Seadrill.
The Fund’s allocations to energy, information technology and service were the three leading contributors to Fund performance. The Fund’s allocation to structured products, although small, added to relative performance versus the Fund’s style-specific index, the Credit Suisse Leveraged Loan Index. The Fund’s allocation to recent primary deals, broadly speaking, also contributed to relative Fund performance. The Fund’s allocation to the food sector was the only detractor from Fund performance on an absolute sector basis.
The senior loan asset class behaves differently from many traditional fixed income investments. The interest income generated by a portfolio of senior loans is usually determined by a fixed credit spread over the London Interbank Offered Rate (Libor). Because senior loans generally have a very short duration and the coupons, or interest rates, are usually adjusted every 30 to 90 days as Libor changes, the yield on the portfolio adjusts. Interest rate risk refers to the tendency for traditional fixed income prices to decline when interest rates rise. For senior loans, however, interest rates and income are variable, and the prices of loans are therefore less sensitive to interest rate changes than traditional fixed income bonds. As a result, senior loans can provide a natural hedge against rising interest rates.
We are monitoring interest rates, the market and economic and geopolitical factors that may impact the direction, speed and magnitude of changes to interest rates across the maturity spectrum, including the potential impact of monetary policy changes by the Fed and other central banks. If interest rates rise, markets may experience increased volatility, which may affect the value and/or liquidity of certain of the Fund’s investments and the market price of the Fund’s shares.
As always, we appreciate your continued participation in Invesco Floating Rate Fund.
| 1 | Source: CS Leveraged Loan Index, August 31, 2017 |
| 2 | Source: S&P LCD, August 31, 2017 |
| 3 | Source: J.P. Morgan, August 31, 2017 |
The views and opinions expressed in management’s discussion of Fund performance are those of Invesco Advisers, Inc. These views and opinions are subject to change at any time based on factors such as market and economic conditions. These views and opinions may not be relied upon as investment advice or recommendations, or as an offer for a particular security. The information is not a complete analysis of every aspect of any market, country, industry, security or the Fund. Statements of fact are from sources considered reliable, but Invesco Advisers, Inc. makes no representation or warranty as to their completeness or accuracy. Although historical performance is no guarantee of future results, these insights may help you understand our investment management philosophy.
See important Fund and, if applicable, index disclosures later in this report.
| Tom Ewald Portfolio Manager, is lead manager of Invesco Floating Rate Fund. He joined | |
| Invesco or its investment advisory affiliates in 2000. Mr. Ewald earned a BA from Harvard College and an MBA from the Darden School of Business at the University of Virginia. | ||

| Scott Baskind Portfolio Manager, is manager of Invesco Floating Rate Fund. He joined Invesco or its | |
| investment advisory affiliates in 1999. Mr. Baskind earned a BS in business administration, with majors in finance and management information systems, from the University at Albany, State University of New York. | ||

 | Philip Yarrow Chartered Financial Analyst, Portfolio Manager, is manager of Invesco Floating Rate Fund. He | |
| joined Invesco in 2010. Mr. Yarrow earned a BS in mathematics and economics from The University of Nottingham and a master of management degree in finance from Northwestern University. | ||
5 Invesco Floating Rate Fund
Your Fund’s Long-Term Performance
Results of a $10,000 Investment – Oldest Share Class(es)
Fund and index data from 8/31/07
| 1 | Source: Bloomberg L.P. |
| 2 | Source: FactSet Research Systems Inc. |
| 3 | Source: Lipper Inc. |
Past performance cannot guarantee comparable future results.
The data shown in the chart include reinvested distributions, applicable sales charges and Fund expenses including
management fees. Index results include reinvested dividends, but they do not reflect sales charges. Performance of the peer group, if applicable, reflects fund expenses and management fees; performance of a market index does not.
Performance shown in the chart and table(s) does not reflect deduction of taxes a shareholder would pay on Fund distributions or sale of Fund shares.
continued from page 9
About indexes used in this report
| ∎ | The Bloomberg Barclays U.S. Aggregate Index is an unmanaged index considered representative of the US investment grade, fixed-rate bond market. |
| ∎ | The Credit Suisse Leveraged Loan Index represents tradable, senior-secured, US dollar-denominated, non-investment grade loans. |
| ∎ | The Lipper Loan Participation Funds Classification Average represents an average of all of the funds in the Lipper Loan Participation Funds classification. |
| ∎ | The Fund is not managed to track the performance of any particular index, including the index(es) described here, and consequently, the performance of the Fund may deviate significantly from the performance of the index(es). |
| ∎ | A direct investment cannot be made in an index. Unless otherwise indicated, index results include reinvested dividends, and they do not reflect sales charges. Performance of the peer group, if applicable, reflects fund expenses; performance of a market index does not. |
Other information
| ∎ | The returns shown in management’s discussion of Fund performance are based on net asset values (NAVs) calculated for shareholder transactions. Generally accepted accounting principles require adjustments to be made to the net assets of the Fund at period end for financial reporting purposes, and as such, the NAVs for shareholder transactions and the returns based on those NAVs may differ from the NAVs and returns reported in the Financial Highlights. |
| ∎ | Industry classifications used in this report are generally according to the Global Industry Classification Standard, which was developed by and is the exclusive property and a service mark of MSCI Inc. and Standard & Poor’s. |
6 Invesco Floating Rate Fund
Average Annual Total Returns |
| |||
| As of 8/31/17, including maximum applicable sales charges | ||||
Class A Shares | ||||
Inception (5/1/97) | 4.01 | % | ||
10 Years | 3.47 | |||
5 Years | 3.44 | |||
1 Year | 3.38 | |||
Class C Shares | ||||
Inception (3/31/00) | 3.39 | % | ||
10 Years | 3.18 | |||
5 Years | 3.47 | |||
1 Year | 4.51 | |||
Class R Shares | ||||
Inception (4/13/06) | 3.39 | % | ||
10 Years | 3.48 | |||
5 Years | 3.68 | |||
1 Year | 5.62 | |||
Class Y Shares | ||||
10 Years | 3.94 | % | ||
5 Years | 4.22 | |||
1 Year | 6.29 | |||
Class R5 Shares | ||||
Inception (4/13/06) | 3.96 | % | ||
10 Years | 4.04 | |||
5 Years | 4.26 | |||
1 Year | 6.29 | |||
Class R6 Shares | ||||
10 Years | 3.89 | % | ||
5 Years | 4.29 | |||
1 Year | 6.39 | |||
Class Y shares incepted on October 3, 2008. Performance shown prior to that date is that of Class A shares and includes the 12b-1 fees applicable to Class A shares.
Class R6 shares incepted on September 24, 2012. Performance shown prior to that date is that of Class A shares and includes the 12b-1 fees applicable to Class A shares.
The performance data quoted represent past performance and cannot guarantee comparable future results; current performance may be lower or higher. Please visit invesco.com/performance for the most recent month-end performance. Performance figures reflect reinvested distributions, changes in net asset value and the effect of the maximum sales charge unless otherwise stated. Investment return and principal value will fluctuate so that you may have a gain or loss when you sell shares.
The net annual Fund operating expense ratio set forth in the most recent Fund prospectus as of the date of this
Average Annual Total Returns | ||||
| As of 6/30/17, the most recent calendar quarter end, including maximum applicable sales charges | ||||
Class A Shares | ||||
Inception (5/1/97) | 4.02 | % | ||
10 Years | 3.04 | |||
5 Years | 3.75 | |||
1 Year | 5.29 | |||
Class C Shares | ||||
Inception (3/31/00) | 3.39 | % | ||
10 Years | 2.77 | |||
5 Years | 3.77 | |||
1 Year | 6.66 | |||
Class R Shares | ||||
Inception (4/13/06) | 3.39 | % | ||
10 Years | 3.06 | |||
5 Years | 4.00 | |||
1 Year | 7.76 | |||
Class Y Shares | ||||
10 Years | 3.50 | % | ||
5 Years | 4.55 | |||
1 Year | 8.45 | |||
Class R5 Shares | ||||
Inception (4/13/06) | 3.96 | % | ||
10 Years | 3.62 | |||
5 Years | 4.59 | |||
1 Year | 8.44 | |||
Class R6 Shares | ||||
10 Years | 3.45 | % | ||
5 Years | 4.60 | |||
1 Year | 8.41 | |||
report for Class A, Class C, Class R, Class Y, Class R5 and Class R6 shares was 1.11%, 1.61%, 1.36%, 0.86%, 0.85% and 0.76%, respectively.1 The total annual Fund operating expense ratio set forth in the most recent Fund prospectus as of the date of this report for Class A, Class C, Class R, Class Y, Class R5 and Class R6 shares was 1.12%, 1.62%, 1.37%, 0.87%, 0.86% and 0.77%, respectively. The expense ratios presented above may vary from the expense ratios presented in other sections of this report that are based on expenses incurred during the period covered by this report.
Class A share performance reflects the maximum 2.50% sales charge and Class C share performance reflects the applicable contingent deferred sales charge (CDSC) for the period involved. The CDSC on Class C shares is 1% for the first year after purchase. Class R, Class Y, Class R5 and Class R6 shares do not have a front-end sales charge or a CDSC; therefore, performance is at net asset value.
The performance of the Fund’s share classes will differ primarily due to different sales charge structures and class expenses.
Fund performance reflects any applicable fee waivers and/or expense reimbursements. Had the adviser not waived fees and/or reimbursed expenses currently or in the past, returns would have been lower. See current prospectus for more information.
| 1 | Total annual Fund operating expenses after any contractual fee waivers and/or expense reimbursements by the adviser in effect through at least June 30, 2019. See current prospectus for more information. |
7 Invesco Floating Rate Fund
Invesco Floating Rate Fund’s investment objective is total return, comprised of current income and capital appreciation.
| ∎ | Unless otherwise stated, information presented in this report is as of August 31, 2017, and is based on total net assets. |
| ∎ | Unless otherwise noted, all data provided by Invesco. |
| ∎ | To access your Fund’s reports/prospectus, visit invesco.com/fundreports. |
About share classes
| ∎ | As of the close of business on April 13, 2006, Invesco Floating Rate Fund reorganized from a closed-end fund to an open-end fund. Information presented for Class A shares prior to the reorganization includes financial data for Class B shares of the closed-end fund. Information presented for Class C shares prior to the reorganization includes financial data for Class C shares of the closed-end fund. |
| ∎ | On July 27, 2006, all Class B1 shares converted into Class A shares. |
| ∎ | Class R shares are generally available only to employer sponsored retirement and benefit plans. Please see the prospectus for more information. |
| ∎ | Class Y shares are available only to certain investors. Please see the prospectus for more information. |
| ∎ | Class R5 shares and Class R6 shares are available for use by retirement plans that meet certain standards and for institutional investors. Class R6 shares are also available through intermediaries that have established an agreement with Invesco Distributors, Inc. to make such shares available for use in retail omnibus accounts. Please see the prospectus for more information. |
Principal risks of investing in the Fund
| ∎ | Bank loan risk. There are a number of risks associated with an investment in bank loans including credit risk, interest rate risk, liquidity risk and prepayment risk. Lack of an active trading market, restrictions on resale, irregular trading activity, wide bid/ask spreads and extended trade settlement periods may impair the Fund’s ability to sell bank loans within its desired time frame or at an acceptable price and its ability to accurately value existing and prospective investments. Extended trade settlement periods may result in cash not being immediately available to the Fund. As a result, the Fund may have to sell other investments or engage in borrowing transactions to raise cash to meet its obligations. The risk of holding bank loans is also |
directly tied to the risk of insolvency or bankruptcy of the issuing banks. These risks could cause the Fund to lose income or principal on a particular investment, which in turn could affect the Fund’s returns. The value of bank loans can be affected by and sensitive to changes in government regulation and to economic downturns in the United States and abroad. Bank loans generally are floating rate loans, which are subject to interest rate risk as the interest paid on the floating rate loans adjusts periodically based on changes in widely accepted reference rates. |
| ∎ | Borrowing risk. Borrowing money to buy securities exposes the Fund to leverage and will cause the Fund’s share price to be more volatile because leverage will exaggerate the effect of any increase or decrease in the value of the Fund’s portfolio securities. Borrowing money may also require the Fund to liquidate positions when it may not be advantageous to do so. In addition, the Fund will incur interest expenses and other fees on borrowed money. There can be no assurance that the Fund’s borrowing strategy will enhance and not reduce the Fund’s returns. |
| ∎ | Changing fixed income market conditions risk. The current low interest rate environment was created in part by the Federal Reserve Board (FRB) and certain foreign central banks keeping the federal funds and equivalent foreign rates near, at or below zero. Increases in the federal funds and equivalent foreign rates may expose fixed income markets to heightened volatility and reduced liquidity for certain fixed income investments, particularly those with longer maturities. In addition, decreases in fixed income dealer market-making capacity may also potentially lead to heightened volatility and reduced liquidity in the fixed income markets. As a result, the value of the Fund’s investments and share price may decline. Changes in central bank policies could also result in higher than normal shareholder redemptions, which could potentially increase portfolio turnover and the Fund’s transaction costs. |
| ∎ | Collateralized loan obligations risk. CLOs are subject to the risks of substantial losses due to actual defaults by underlying borrowers, which will be greater during periods of economic or financial stress. CLOs may also lose value due to collateral defaults and disappearance of subordinate tranches, market anticipation of defaults, and investor aversion to CLO securities as a class. The risks of CLOs will be greater if the Fund invests in CLOs that hold loans of uncreditworthy borrowers or if the Fund holds subordinate tranches of the CLO that absorbs losses from the defaults before senior tranches. In addition, CLOs are subject to interest rate risk and credit risk. |
| ∎ | Credit linked notes risk. Risks of credit linked notes include those risks associated with the underlying reference obligation including but not limited to market risk, interest rate risk, credit risk, default risk and, in some cases, foreign currency risk. An investor in a credit linked note bears counterparty risk or the risk that the issuer of the credit linked note will default or become bankrupt and not make timely payment of principal and interest of the structured security. Credit linked notes may be less liquid than other investments and therefore harder to dispose of at the desired time and price. In addition, credit linked notes may be leveraged and, as a result, small changes in the value of the underlying reference obligation may produce disproportionate losses to the Fund. |
| ∎ | Debt securities risk. The prices of debt securities held by the Fund will be affected by changes in interest rates, the creditworthiness of the issuer and other factors. An increase in prevailing interest rates typically causes the value of existing debt securities to fall and often has a greater impact on longer-duration debt securities and higher quality debt securities. Falling interest rates will cause the Fund to reinvest the proceeds of debt securities that have been |
This report must be accompanied or preceded by a currently effective Fund prospectus, which contains more complete information, including sales charges and expenses. Investors should read it carefully before investing. |
| NOT FDIC INSURED | MAY LOSE VALUE | NO BANK GUARANTEE |
8 Invesco Floating Rate Fund
repaid by the issuer at lower interest rates. Falling interest rates may also reduce the Fund’s distributable income because interest payments on floating rate debt instruments held by the Fund will decline. The Fund could lose money on investments in debt securities if the issuer or borrower fails to meet its obligations to make interest payments and/or to repay principal in a timely manner. Changes in an issuer’s financial strength, the market’s perception of such strength or in the credit rating of the issuer or the security may affect the value of debt securities. The Adviser’s credit analysis may fail to anticipate such changes, which could result in buying a debt security at an inopportune time or failing to sell a debt security in advance of a price decline or other credit event.
| ∎ | Defaulted securities risk. Defaulted securities pose a greater risk that principal will not be repaid than non-defaulted securities. Defaulted securities and any securities received in an exchange for such securities may be subject to restrictions on resale. |
| ∎ | Derivatives risk. The value of a derivative instrument depends largely on (and is derived from) the value of an underlying security, currency, commodity, interest rate, index or other asset (each referred to as an underlying asset). In addition to risks relating to the underlying assets, the use of derivatives may include other, possibly greater, risks, including counterparty, leverage and liquidity risks. Counterparty risk is the risk that the counterparty to the derivative contract will default on its obligation to pay the Fund the amount owed or otherwise perform under the derivative contract. Derivatives create leverage risk because they do not require payment up front equal to the economic exposure created by owning the derivative. As a result, an adverse change in the value of the underlying asset could result in the Fund sustaining a loss that is substantially greater than the amount invested in the derivative, which may make the Fund’s returns more volatile and increase the risk of loss. Derivative instruments may also be less liquid than more traditional investments and the Fund may be unable to sell or close out its derivative positions at a desirable time or price. This risk may be more acute under adverse market conditions, during which the Fund may be most in need of liquidating its derivative positions. Derivatives may also be |
harder to value, less tax efficient and subject to changing government regulation that could impact the Fund’s ability to use certain derivatives or their cost. Also, derivatives used for hedging or to gain or limit exposure to a particular market segment may not provide the expected benefits, particularly during adverse market conditions. |
| ∎ | Financial services sector risk. The Fund may be susceptible to adverse economic or regulatory occurrences affecting the financial services sector. Financial services companies are subject to extensive government regulation and are disproportionately affected by unstable interest rates, each of which could adversely affect the profitability of such companies. Financial services companies may also have concentrated portfolios, which makes them especially vulnerable to unstable economic conditions. |
| ∎ | Foreign securities risk. The Fund’s foreign investments may be adversely affected by political and social instability, changes in economic or taxation policies, difficulty in enforcing obligations, decreased liquidity or increased volatility. Foreign investments also involve the risk of the possible seizure, nationalization or expropriation of the issuer or foreign deposits (in which the Fund could lose its entire investments in a certain market) and the possible adoption of foreign governmental restrictions such as exchange controls. Unless the Fund has hedged its foreign securities risk, foreign securities risk also involves the risk of negative foreign currency rate fluctuations, which may cause the value of securities denominated in such foreign currency (or other instruments through which the Fund has exposure to foreign currencies) to decline in value. Currency exchange rates may fluctuate significantly over short periods of time. Currency hedging strategies, if used, are not always successful. |
| ∎ | High yield debt securities (junk bond) risk. Investments in high yield debt securities (“junk bonds”) and other lower-rated securities will subject the Fund to substantial risk of loss. These securities are considered to be speculative with respect to the issuer’s ability to pay interest and principal when due, are more susceptible to default or decline in market value and are less liquid than investment grade debt securities. Prices of high yield debt securities tend to be very volatile. |
| ∎ | Liquidity risk. The Fund may be unable to sell illiquid investments at the time or price it desires and, as a result, could lose its entire investment in such investments. Liquid securities can become illiquid during periods of market stress. If a significant amount of the Fund’s securities become illiquid, the Fund may not be able to timely pay redemption proceeds and may need to sell securities at significantly reduced prices. |
| ∎ | Management risk. The Fund is actively managed and depends heavily on the Adviser’s judgment about markets, interest rates or the attractiveness, relative values, liquidity, or potential appreciation of particular investments made for the Fund’s portfolio. The Fund could experience losses if these judgments prove to be incorrect. Additionally, legislative, regulatory, or tax developments may adversely affect management of the Fund and, therefore, the ability of the Fund to achieve its investment objective. |
| ∎ | Market risk. The market values of the Fund’s investments, and therefore the value of the Fund’s shares, will go up and down, sometimes rapidly or unpredictably. Market risk may affect a single issuer, industry or section of the economy, or it may affect the market as a whole. Individual stock prices tend to go up and down more dramatically than those of certain other types of investments, such as bonds. During a general downturn in the financial markets, multiple asset classes may decline in value. When markets perform well, there can be no assurance that specific investments held by the Fund will rise in value. |
| ∎ | Risk of subordinated debt. Perpetual subordinated debt is a type of hybrid instrument that has no maturity date for the return of principal and does not need to be redeemed by the issuer. These investments typically have lower credit ratings and lower priority than other obligations of an issuer during bankruptcy, presenting a greater risk for nonpayment. This risk increases as the priority of the obligation becomes lower. Payments on these securities may be subordinated to all existing and future liabilities and obligations of subsidiaries and associated companies of an issuer. Additionally, some perpetual subordinated debt does not restrict the ability of an issuer’s subsidiaries to in- cur further unsecured indebtedness. |
continued on page 6
9 Invesco Floating Rate Fund
Schedule of Investments
August 31, 2017
| Interest Rate | Maturity Date | Principal Amount (000)(a) | Value | |||||||||||||
Variable Rate Senior Loan Interests–90.57%(b)(c) | ||||||||||||||||
| Aerospace & Defense–2.33% | ||||||||||||||||
Booz Allen Hamilton Inc., Term Loan B (1 mo. USD LIBOR + 2.25%) | 3.48 | % | 06/30/2023 | $ | 1,388 | $ | 1,395,531 | |||||||||
Cadence Aerospace, LLC, | ||||||||||||||||
Term Loan (1 mo. USD LIBOR + 6.25%) | 7.50 | % | 05/09/2018 | 9 | 8,518 | |||||||||||
Term Loan (3 mo. USD LIBOR + 6.25%) | 7.56 | % | 05/09/2018 | 3,350 | 3,230,276 | |||||||||||
Consolidated Aerospace Manufacturing, LLC, Term Loan (1 mo. USD LIBOR + 3.75%)(d) | 4.98 | % | 08/11/2022 | 3,157 | 3,109,290 | |||||||||||
DAE Aviation Holdings, Inc., Incremental Term Loan(e) | — | 07/07/2022 | 860 | 863,756 | ||||||||||||
Greenrock Finance, Inc., Term Loan B (2 mo. USD LIBOR + 3.50%) | 4.75 | % | 06/28/2024 | 3,858 | 3,906,375 | |||||||||||
IAP Worldwide Services, | ||||||||||||||||
Revolver Loan(Acquired 07/22/2014; Cost $789,017)(d)(f) | 0.00 | % | 07/18/2018 | 789 | 773,237 | |||||||||||
Revolver Loan (3 mo. USD LIBOR + 5.50%) (Acquired 07/22/2014; Cost $87,669)(d) | 7.00 | % | 07/18/2018 | 88 | 85,915 | |||||||||||
Second Lien Term Loan (3 mo. USD LIBOR + 6.50%)(d) | 8.00 | % | 07/18/2019 | 1,005 | 996,929 | |||||||||||
Leidos Innovations Corp., Term Loan B (1 mo. USD LIBOR + 2.00%) | 3.50 | % | 08/16/2023 | 5,485 | 5,505,336 | |||||||||||
MacDonald, Dettwiler & Associates Ltd. (Canada), Term Loan B(e) | — | 07/06/2024 | 4,768 | 4,755,305 | ||||||||||||
MHVC Acquisition Corp., Term Loan (1 mo. USD LIBOR + 5.25%) (Acquired 04/25/2017; Cost $2,134,236)(d) | 6.49 | % | 04/29/2024 | 2,145 | 2,176,765 | |||||||||||
TransDigm Inc., | ||||||||||||||||
Term Loan D (1 mo. USD LIBOR + 3.00%) | 4.24 | % | 06/04/2021 | 431 | 432,569 | |||||||||||
Term Loan D (3 mo. USD LIBOR + 3.00%) | 4.30 | % | 06/04/2021 | 6,436 | 6,456,256 | |||||||||||
Term Loan E (1 mo. USD LIBOR + 3.00%) | 4.24 | % | 05/16/2022 | 6,246 | 6,264,177 | |||||||||||
Term Loan E (3 mo. USD LIBOR + 3.00%) | 4.30 | % | 05/16/2022 | 3,101 | 3,110,267 | |||||||||||
Term Loan F (1 mo. USD LIBOR + 3.00%) | 4.23 | % | 06/09/2023 | 18,128 | 18,179,736 | |||||||||||
Term Loan G (1 mo. USD LIBOR + 3.00%)(e) | — | 08/16/2024 | 1,169 | 1,172,592 | ||||||||||||
| 62,422,830 | ||||||||||||||||
| Air Transport–1.31% | ||||||||||||||||
American Airlines, Inc., | ||||||||||||||||
Term Loan (1 mo. USD LIBOR + 2.00%) | 3.23 | % | 06/27/2020 | 991 | 992,329 | |||||||||||
Term Loan B (1 mo. USD LIBOR + 2.50%) | 3.73 | % | 12/14/2023 | 5,131 | 5,152,409 | |||||||||||
Avolon TLB Borrower 1 (US) LLC, | ||||||||||||||||
Term Loan B-1 (1 mo. USD LIBOR + 2.25%) | 3.48 | % | 09/16/2020 | 2,214 | 2,226,254 | |||||||||||
Term Loan B-2 (1 mo. USD LIBOR + 2.75%) | 3.98 | % | 03/21/2022 | 15,914 | 15,980,906 | |||||||||||
Delta Air Lines, Inc., Revolver Loan(f) | 0.00 | % | 10/18/2017 | 3,812 | 3,783,262 | |||||||||||
Gol LuxCo S.A. (Luxembourg), Term Loan | 6.50 | % | 08/31/2020 | 5,842 | 6,009,601 | |||||||||||
United Airlines, Inc., Term Loan B (3 mo. USD LIBOR + 2.25%) | 3.56 | % | 04/01/2024 | 1,107 | 1,113,642 | |||||||||||
| 35,258,403 | ||||||||||||||||
| Automotive–1.34% | ||||||||||||||||
Allison Transmission, Inc., Term Loan (1 mo. USD LIBOR + 2.00%) | 3.24 | % | 09/23/2022 | 1,655 | 1,663,590 | |||||||||||
American Axle & Manufacturing, Inc., Term Loan B (1 mo. USD LIBOR + 2.25%) | 3.49 | % | 04/06/2024 | 4,670 | 4,646,819 | |||||||||||
Britax US Holdings Inc., Term Loan (3 mo. USD LIBOR + 3.50%) | 4.80 | % | 10/15/2020 | 1,734 | 1,481,085 | |||||||||||
CH Hold Corp., | ||||||||||||||||
Second Lien Term Loan (1 mo. USD LIBOR + 7.25%) | 8.48 | % | 02/03/2025 | 264 | 270,557 | |||||||||||
Term Loan (1 mo. USD LIBOR + 3.00%) | 4.23 | % | 02/01/2024 | 2,074 | 2,085,793 | |||||||||||
Dayco Products, LLC, Term Loan (3 mo. USD LIBOR + 5.00%)(d) | 6.23 | % | 05/19/2023 | 1,886 | 1,897,975 | |||||||||||
Dealer Tire, LLC, Term Loan (3 mo. USD LIBOR + 3.75%) | 5.06 | % | 12/22/2021 | 53 | 53,186 | |||||||||||
FCA US, LLC, Term Loan B (1 mo. USD LIBOR + 2.00%) | 3.23 | % | 12/31/2018 | 273 | 274,271 | |||||||||||
Key Safety Systems, Inc., Term Loan (3 mo. USD LIBOR + 4.50%) | 5.82 | % | 08/29/2021 | 2,829 | 2,849,263 | |||||||||||
Midas Intermediate Holdco II, LLC, Term Loan (3 mo. USD LIBOR + 2.75%) | 4.05 | % | 08/18/2021 | 4,129 | 4,130,264 | |||||||||||
Superior Industries International, Inc., Term Loan B (3 mo. USD LIBOR + 4.50%)(d) | 5.79 | % | 03/22/2024 | 2,526 | 2,494,145 | |||||||||||
See accompanying Notes to Financial Statements which are an integral part of the financial statements.
10 Invesco Floating Rate Fund
| Interest Rate | Maturity Date | Principal Amount (000)(a) | Value | |||||||||||||
| Automotive–(continued) | ||||||||||||||||
ThermaSys Corp., | ||||||||||||||||
Term Loan (3 mo. USD LIBOR + 4.00%) | 5.31 | % | 05/03/2019 | $ | 4,097 | $ | 3,675,230 | |||||||||
Term Loan (Prime Rate + 3.00%) | 7.25 | % | 05/03/2019 | 29 | 25,701 | |||||||||||
Tower Automotive Holdings USA, LLC, Term Loan (1 mo. USD LIBOR + 2.75%) | 4.00 | % | 03/07/2024 | 4,917 | 4,930,405 | |||||||||||
Transtar Holding Co., | ||||||||||||||||
Exit Term Loan (3 mo. USD LIBOR + 4.25%) | 5.55 | % | 04/11/2022 | 991 | 992,582 | |||||||||||
Exit Term Loan(f) | 0.00 | % | 04/11/2022 | 243 | 242,828 | |||||||||||
First Lien Term Loan (3 mo. USD LIBOR + 4.25%) (Acquired 03/19/2013-06/13/2016; Cost $2,297,162) | 5.56 | % | 04/11/2022 | 2,289 | 2,117,304 | |||||||||||
PIK Term Loan, 7.75% PIK Rate, 1.00% Cash Rate (Acquired 04/11/2017; Cost $651,335)(d)(g) | 7.75 | % | 04/11/2022 | 695 | 592,079 | |||||||||||
Wand Intermediate I L.P., Second Lien Term Loan (3 mo. USD LIBOR + 7.25%) | 8.55 | % | 09/17/2022 | 1,406 | 1,414,249 | |||||||||||
| 35,837,326 | ||||||||||||||||
| Beverage and Tobacco–0.36% | ||||||||||||||||
AI Aqua Merger Sub, Inc., | ||||||||||||||||
First Lien Term Loan B-1 (1 mo. USD LIBOR + 3.25%) | 5.23 | % | 12/13/2023 | 3,814 | 3,856,203 | |||||||||||
Term Loan(e) | — | 12/13/2023 | 1,777 | 1,783,877 | ||||||||||||
Arctic Glacier U.S.A. Inc., Term Loan (1 mo. USD LIBOR + 4.25%) | 5.48 | % | 03/20/2024 | 1,393 | 1,401,347 | |||||||||||
Constellation Brands Canada, Inc. (Canada), Term Loan B-2 (3 mo. USD LIBOR + 2.75%) | 4.06 | % | 12/15/2023 | 1,099 | 1,106,931 | |||||||||||
Winebow Holdings, Inc., Second Lien Term Loan (1 mo. USD LIBOR + 7.50%) (Acquired 07/02/2014; Cost $1,501,624)(d) | 8.73 | % | 12/31/2021 | 1,508 | 1,410,148 | |||||||||||
| 9,558,506 | ||||||||||||||||
| Building & Development–2.30% | ||||||||||||||||
American Builders & Contractors Supply Co., Inc., Term Loan B-1 (1 mo. USD LIBOR + 2.50%) | 3.73 | % | 10/31/2023 | 2,206 | 2,212,563 | |||||||||||
Beacon Roofing Supply, Inc., Term Loan (1 mo. USD LIBOR + 2.75%) | 3.98 | % | 10/01/2022 | 1,149 | 1,154,139 | |||||||||||
Capital Automotive L.P., | ||||||||||||||||
Second Lien Term Loan B (1 mo. USD LIBOR + 6.00%) | 7.24 | % | 03/24/2025 | 4,151 | 4,211,733 | |||||||||||
Term Loan B-2 (1 mo. USD LIBOR + 3.00%) | 4.24 | % | 03/25/2024 | 7,372 | 7,424,675 | |||||||||||
DiversiTech Holdings, Inc., | ||||||||||||||||
Second Lien Term Loan (3 mo. USD LIBOR + 7.50%) (Acquired 05/18/2017; Cost $569,472) | 8.70 | % | 06/01/2025 | 575 | 588,823 | |||||||||||
Term Loan (3 mo. USD LIBOR + 3.50%) | 4.70 | % | 06/01/2024 | 1,385 | 1,386,808 | |||||||||||
Forterra Finance, LLC, Second Lien Term Loan (1 mo. USD LIBOR + 3.00%) | 4.23 | % | 10/25/2023 | 4,164 | 3,497,870 | |||||||||||
HD Supply Waterworks, Ltd., Term Loan B (3 mo. USD LIBOR + 3.00%) | 4.46 | % | 07/31/2024 | 2,821 | 2,831,624 | |||||||||||
HD Supply, Inc., | ||||||||||||||||
Term Loan B-1 (1 mo. USD LIBOR + 2.25%) | 4.05 | % | 08/13/2021 | 473 | 474,251 | |||||||||||
Term Loan B-4 (1 mo. USD LIBOR + 2.50%) | 3.74 | % | 10/17/2023 | 3,819 | 3,832,204 | |||||||||||
Mueller Water Products, Inc., | ||||||||||||||||
Term Loan B (1 mo. USD LIBOR + 2.50%) | 3.74 | % | 11/25/2021 | 382 | 384,378 | |||||||||||
Term Loan B (3 mo. USD LIBOR + 2.50%) | 3.80 | % | 11/25/2021 | 170 | 170,809 | |||||||||||
Quikrete Holdings, Inc., First Lien Term Loan (1 mo. USD LIBOR + 2.75%) | 3.98 | % | 11/15/2023 | 14,728 | 14,675,667 | |||||||||||
Re/Max LLC, Term Loan (3 mo. USD LIBOR + 2.75%)(d) | 4.05 | % | 12/15/2023 | 4,867 | 4,897,539 | |||||||||||
Realogy Group LLC, Term Loan (1 mo. USD LIBOR + 2.25%) | 3.48 | % | 07/20/2022 | 11,768 | 11,831,027 | |||||||||||
Werner FinCo L.P., Term Loan (3 mo. USD LIBOR + 4.00%) | 5.26 | % | 07/24/2024 | 2,022 | 2,028,373 | |||||||||||
| 61,602,483 | ||||||||||||||||
| Business Equipment & Services–9.78% | ||||||||||||||||
Acosta, Inc., Term Loan B-1 (1 mo. USD LIBOR + 3.25%) | 4.48 | % | 09/26/2021 | 4,126 | 3,713,507 | |||||||||||
Allied Universal Holdco LLC | ||||||||||||||||
First Lien Term Loan (3 mo. USD LIBOR + 3.75%) | 5.05 | % | 07/28/2022 | 5,624 | 5,631,596 | |||||||||||
Incremental Delayed Draw Term Loan(f) | 0.00 | % | 07/28/2022 | 1,173 | 1,173,400 | |||||||||||
Alorica Inc., Term Loan B (1 mo. USD LIBOR + 3.75%) | 4.98 | % | 06/30/2022 | 2,323 | 2,339,992 | |||||||||||
See accompanying Notes to Financial Statements which are an integral part of the financial statements.
11 Invesco Floating Rate Fund
| Interest Rate | Maturity Date | Principal Amount (000)(a) | Value | |||||||||||||
| Business Equipment & Services–(continued) | ||||||||||||||||
Asurion LLC, | ||||||||||||||||
Second Lien Term Loan B-2(e) | — | 08/04/2025 | $ | 14,719 | $ | 15,071,213 | ||||||||||
Term Loan B-4 (1 mo. USD LIBOR + 2.75%) | 3.98 | % | 08/04/2022 | 413 | 414,760 | |||||||||||
Term Loan B-5 (1 mo. USD LIBOR + 3.00%) | 4.23 | % | 11/03/2023 | 22,002 | 22,124,232 | |||||||||||
Blucora, Inc., Term Loan (3 mo. USD LIBOR + 3.75%) (Acquired 04/21/2017; Cost $3,033,097) | 5.04 | % | 05/22/2024 | 3,048 | 3,085,939 | |||||||||||
Brand Energy & Infrastructure Services, Inc., | ||||||||||||||||
Term Loan (1 mo. USD LIBOR + 4.25%) | 5.48 | % | 06/21/2024 | 35 | 35,107 | |||||||||||
Term Loan (2 mo. USD LIBOR + 4.25%) | 5.51 | % | 06/01/2024 | 5,842 | 5,867,919 | |||||||||||
Term Loan (3 mo. USD LIBOR + 4.25%) | 5.56 | % | 06/21/2024 | 1,114 | 1,118,468 | |||||||||||
Brickman Group Ltd. LLC, | ||||||||||||||||
Revolver Loan (Acquired 10/14/2016; Cost $942,677)(d)(f) | 0.00 | % | 12/18/2018 | 992 | 917,917 | |||||||||||
First Lien Term Loan (1 mo. USD LIBOR + 3.00%) | 4.23 | % | 12/18/2020 | 5,012 | 5,036,642 | |||||||||||
Second Lien Term Loan (1 mo. USD LIBOR + 6.50%) | 7.73 | % | 12/17/2021 | 519 | 522,867 | |||||||||||
Caraustar Industries, Inc., Term Loan (3 mo. USD LIBOR + 5.50%) | 6.80 | % | 03/09/2022 | 3,079 | 3,058,188 | |||||||||||
Change Healthcare Holdings, Inc., Term Loan (1 mo. USD LIBOR + 2.75%) | 3.98 | % | 03/01/2024 | 7,821 | 7,831,649 | |||||||||||
Checkout Holding Corp., Term Loan B (1 mo. USD LIBOR + 3.50%) | 4.73 | % | 04/09/2021 | 5,982 | 5,135,273 | |||||||||||
Cotiviti Corp., | ||||||||||||||||
First Lien Term Loan B (3 mo. USD LIBOR + 2.50%) | 3.80 | % | 09/28/2023 | 3,712 | 3,729,375 | |||||||||||
Term Loan A (3 mo. USD LIBOR + 2.25%)(d) | 3.55 | % | 09/28/2021 | 1,571 | 1,571,006 | |||||||||||
CRCI Holdings, Inc., Term Loan (3 mo. USD LIBOR + 5.50%) | 6.80 | % | 08/31/2023 | 2,271 | 2,286,813 | |||||||||||
Crossmark Holdings, Inc., | ||||||||||||||||
First Lien Term Loan (3 mo. USD LIBOR + 3.50%) | 4.80 | % | 12/20/2019 | 4,496 | 3,239,197 | |||||||||||
Second Lien Term Loan (3 mo. USD LIBOR + 7.50%) | 8.80 | % | 12/21/2020 | 576 | 269,000 | |||||||||||
DigitalGlobe, Inc., Term Loan (1 mo. USD LIBOR + 2.75%) | 3.98 | % | 01/15/2024 | 6,143 | 6,150,225 | |||||||||||
Equinix, Inc., Term Loan B-1 (1 mo. USD LIBOR + 2.00%) | 3.73 | % | 01/08/2023 | 701 | 703,309 | |||||||||||
First Data Corp., | ||||||||||||||||
Term Loan (1 mo. USD LIBOR + 2.50%) | 3.74 | % | 04/26/2024 | 32,169 | 32,222,962 | |||||||||||
Term Loan D (1 mo. USD LIBOR + 2.25%) | 3.49 | % | 07/08/2022 | 3,835 | 3,836,210 | |||||||||||
FleetCor Technologies Operating Co., LLC, Term Loan B-3 (1 mo. USD LIBOR + 2.00%) | 3.23 | % | 08/02/2024 | 652 | 654,531 | |||||||||||
Gartner, Inc., Term Loan A (1 mo. USD LIBOR + 2.00%)(d) | 3.23 | % | 03/16/2022 | 469 | 469,891 | |||||||||||
Genesys Telecom Holdings, U.S., Inc., | ||||||||||||||||
Term Loan B-2 (2 mo. USD LIBOR + 3.75%) | 5.01 | % | 12/01/2023 | 2,481 | 2,499,508 | |||||||||||
Term Loan B-2 (3 mo. USD LIBOR + 3.75%) | 5.01 | % | 12/01/2023 | 5,790 | 5,832,186 | |||||||||||
Global Payments, Inc., Term Loan B-2 (1 mo. USD LIBOR + 2.00%) | 3.23 | % | 04/21/2023 | 4,835 | 4,847,463 | |||||||||||
Hillman Group, Inc., Term Loan (3 mo. USD LIBOR + 3.50%) | 4.80 | % | 06/30/2021 | 3,804 | 3,819,406 | |||||||||||
IndigoCyan Midco Ltd. (Jersey), Term Loan B(d)(e) | — | 06/23/2024 | GBP | 1,769 | 2,264,770 | |||||||||||
Information Resources, Inc., First Lien Term Loan (1 mo. USD LIBOR + 4.25%) | 5.49 | % | 01/18/2024 | 6,305 | 6,363,708 | |||||||||||
KAR Auction Services, Inc., | ||||||||||||||||
Term Loan B-4 (3 mo. USD LIBOR + 2.25%) | 3.56 | % | 03/11/2021 | 233 | 233,847 | |||||||||||
Term Loan B-5 (3 mo. USD LIBOR + 2.50%) | 3.81 | % | 03/09/2023 | 4,462 | 4,488,079 | |||||||||||
Karman Buyer Corp., | ||||||||||||||||
Second Lien Term Loan (3 mo. USD LIBOR + 6.50%) | 7.80 | % | 07/25/2022 | 2,649 | 2,442,581 | |||||||||||
Term Loan (3 mo. USD LIBOR + 3.25%) | 4.55 | % | 07/23/2021 | 10,324 | 9,963,617 | |||||||||||
Learning Care Group (US) No. 2 Inc., | ||||||||||||||||
Term Loan (1 mo. USD LIBOR + 4.00%) | 5.23 | % | 05/05/2021 | 2,263 | 2,288,688 | |||||||||||
Term Loan (2 mo. USD LIBOR + 4.00%) | 5.26 | % | 05/05/2021 | 62 | 63,066 | |||||||||||
Term Loan (3 mo. USD LIBOR + 4.00%) | 5.30 | % | 05/05/2021 | 754 | 762,896 | |||||||||||
Outfront Media Capital LLC, Term Loan (1 mo. USD LIBOR + 2.25%) | 3.48 | % | 03/18/2024 | 258 | 259,156 | |||||||||||
Peak 10, Inc., First Lien Term Loan (3 mo. USD LIBOR + 3.50%) | 4.81 | % | 08/01/2024 | 3,443 | 3,439,888 | |||||||||||
Prime Security Services Borrower, LLC, | ||||||||||||||||
First Lien Term Loan B-1 (1 mo. USD LIBOR + 2.75%) | 3.98 | % | 05/02/2022 | 6,987 | 7,031,440 | |||||||||||
Revolver Loan(d)(f) | 0.00 | % | 05/02/2022 | 3,829 | 3,821,898 | |||||||||||
See accompanying Notes to Financial Statements which are an integral part of the financial statements.
12 Invesco Floating Rate Fund
| Interest Rate | Maturity Date | Principal Amount (000)(a) | Value | |||||||||||||
| Business Equipment & Services–(continued) | ||||||||||||||||
Servicemaster Co., (The), Term Loan C (1 mo. USD LIBOR + 2.50%) | 3.73 | % | 11/08/2023 | $ | 2,768 | $ | 2,775,290 | |||||||||
Spin Holdco Inc., Term Loan B-1 (2 mo. USD LIBOR + 3.75%) | 5.01 | % | 11/14/2022 | 14,636 | 14,699,828 | |||||||||||
Synchronoss Technologies, Inc., Term Loan (2 mo. USD LIBOR + 4.50%) | 5.76 | % | 01/19/2024 | 1,971 | 1,950,478 | |||||||||||
Tempo Acquisition LLC, Term Loan (1 mo. USD LIBOR + 3.00%) | 4.23 | % | 05/01/2024 | 6,825 | 6,855,936 | |||||||||||
TNS Inc., Second Lien Term Loan (1 mo. USD LIBOR + 8.00%) | 9.24 | % | 08/14/2020 | 231 | 231,354 | |||||||||||
Trans Union LLC, Term Loan B-3 (1 mo. USD LIBOR + 2.00%) | 3.23 | % | 04/09/2023 | 3,539 | 3,547,400 | |||||||||||
Travelport Finance S.a.r.l. (Luxembourg), Term Loan D (3 mo. USD LIBOR + 2.75%) | 4.06 | % | 09/02/2021 | 2,451 | 2,451,232 | |||||||||||
U.S. Security Associates Holdings, Inc., Term Loan (3 mo. USD LIBOR + 4.00%) | 5.30 | % | 07/14/2023 | 2,586 | 2,605,091 | |||||||||||
Ventia Deco LLC, Term Loan B (3 mo. USD LIBOR + 3.50%)(d) | 4.80 | % | 05/21/2022 | 2,943 | 2,957,248 | |||||||||||
Wash MultiFamily Acquisition Inc., | ||||||||||||||||
First Lien Term Loan (1 mo. USD LIBOR + 3.25%) | 4.48 | % | 05/13/2022 | 888 | 887,887 | |||||||||||
First Lien Term Loan (1 mo. USD LIBOR + 3.25%) | 4.48 | % | 05/16/2022 | 5,378 | 5,374,468 | |||||||||||
Second Lien Term Loan (1 mo. USD LIBOR + 7.00%) (Acquired 05/04/2015; Cost $221,137)(d) | 8.23 | % | 05/12/2023 | 222 | 222,436 | |||||||||||
Second Lien Term Loan (1 mo. USD LIBOR + 7.00%) (Acquired 05/04/2015; Cost $38,731)(d) | 8.23 | % | 05/14/2023 | 39 | 38,959 | |||||||||||
West Corp., | ||||||||||||||||
Term Loan A-2 (1 mo. USD LIBOR + 2.25%)(d) | 3.48 | % | 06/17/2021 | 10,709 | 10,709,285 | |||||||||||
Term Loan B-14 (1 mo. USD LIBOR + 2.50%) | 3.73 | % | 06/17/2021 | 3,851 | 3,856,031 | |||||||||||
WEX Inc., Term Loan B-2 (1 mo. USD LIBOR + 2.75%) | 3.98 | % | 06/30/2023 | 4,526 | 4,566,828 | |||||||||||
| 262,363,136 | ||||||||||||||||
| Cable & Satellite Television–5.62% | ||||||||||||||||
Altice Financing S.A. (Luxembourg), Term Loan (3 mo. USD LIBOR + 2.75%) | 4.05 | % | 07/15/2025 | 2,878 | 2,881,230 | |||||||||||
Altice US Finance I Corp., Term Loan (1 mo. USD LIBOR + 2.25%) | 3.48 | % | 07/15/2025 | 8,693 | 8,646,632 | |||||||||||
Atlantic Broadband Finance, LLC, Term Loan B(e) | — | 08/11/2024 | 9,113 | 9,067,931 | ||||||||||||
Cable One, Inc., Incremental Term Loan B-1 (3 mo. USD LIBOR + 2.25%)(d) | 3.57 | % | 05/01/2024 | 1,028 | 1,033,333 | |||||||||||
Charter Communications Operating LLC, Term Loan I-1 (1 mo. USD LIBOR + 2.25%) | 3.48 | % | 01/15/2024 | 14,010 | 14,090,979 | |||||||||||
CSC Holdings, LLC, Term Loan (1 mo. USD LIBOR + 2.25%) | 3.48 | % | 07/17/2025 | 17,729 | 17,646,025 | |||||||||||
ION Media Networks, Inc., Term Loan B-3 (2 mo. USD LIBOR + 3.00%) | 4.26 | % | 12/18/2020 | 9,025 | 9,059,283 | |||||||||||
MCC Iowa, Term Loan H (1 wk. USD LIBOR + 2.50%) | 3.70 | % | 01/29/2021 | 3,178 | 3,199,767 | |||||||||||
Mediacom Illinois LLC, Term Loan K (1 wk. USD LIBOR + 2.25%) | 3.45 | % | 02/15/2024 | 4,596 | 4,616,865 | |||||||||||
Numericable-SFR S.A. (France), Term Loan B-10 (3 mo. USD LIBOR + 3.25%) | 4.56 | % | 01/14/2025 | 8,591 | 8,635,190 | |||||||||||
Quebecor Media Inc. (Canada), Term Loan B-1 (3 mo. USD LIBOR + 2.25%) | 3.57 | % | 08/17/2020 | 5,065 | 5,097,409 | |||||||||||
Telenet Financing USD LLC, Term Loan A-I (1 mo. USD LIBOR + 2.75%) | 3.98 | % | 06/30/2025 | 9,794 | 9,825,576 | |||||||||||
Unitymedia GmbH (Germany), Term Loan B(e) | — | 09/25/2025 | 4,616 | 4,601,342 | ||||||||||||
UPC Financing Partnership, Term Loan AP (1 mo. USD LIBOR + 2.75%) | 3.98 | % | 04/15/2025 | 18,504 | 18,568,085 | |||||||||||
Virgin Media Investment Holdings Ltd. (United Kingdom), Term Loan I (1 mo. USD LIBOR + 2.75%) | 3.98 | % | 01/31/2025 | 18,385 | 18,447,463 | |||||||||||
WaveDivision Holdings, LLC, | ||||||||||||||||
Term Loan (1 mo. USD LIBOR + 2.75%) | 3.99 | % | 10/15/2019 | 2 | 1,777 | |||||||||||
Term Loan (2 mo. USD LIBOR + 2.75%) | 4.03 | % | 10/15/2019 | 680 | 681,930 | |||||||||||
WideOpenWest Finance, LLC, Term Loan B (1 mo. USD LIBOR + 3.25%) | 4.48 | % | 08/18/2023 | 7,733 | 7,730,358 | |||||||||||
Ziggo Secured Finance Partnership, Term Loan E (1 mo. USD LIBOR + 2.50%) | 3.73 | % | 04/15/2025 | 6,919 | 6,909,699 | |||||||||||
| 150,740,874 | ||||||||||||||||
| Chemicals & Plastics–1.99% | ||||||||||||||||
Alpha US Bidco, Inc., Term Loan B-1 (3 mo. USD LIBOR + 3.00%) | 4.30 | % | 01/31/2024 | 2,007 | 2,012,094 | |||||||||||
Ashland LLC, | ||||||||||||||||
Term Loan B (1 mo. USD LIBOR + 2.00%) | 3.23 | % | 05/17/2024 | 226 | 227,351 | |||||||||||
Term Loan B (3 mo. USD LIBOR + 2.00%) | 3.24 | % | 05/17/2024 | 453 | 454,703 | |||||||||||
Charter NEX US, Inc., First Lien Term Loan (1 mo. USD LIBOR + 3.25%) | 4.48 | % | 05/16/2024 | 918 | 921,301 | |||||||||||
Chemours Co., (The), Term Loan B-1 (1 mo. USD LIBOR + 2.50%) | 3.74 | % | 05/12/2022 | 1,104 | 1,108,390 | |||||||||||
See accompanying Notes to Financial Statements which are an integral part of the financial statements.
13 Invesco Floating Rate Fund
| Interest Rate | Maturity Date | Principal Amount (000)(a) | Value | |||||||||||||
| Chemicals & Plastics–(continued) | ||||||||||||||||
Colouroz Investment LLC, (Germany) | ||||||||||||||||
First Lien Term Loan B-2 (2 mo. USD LIBOR + 3.00%) | 4.27 | % | 09/07/2021 | $ | 10 | $ | 10,217 | |||||||||
First Lien Term Loan B-2 (3 mo. USD LIBOR + 3.00%) | 4.31 | % | 09/07/2021 | 4,053 | 3,964,296 | |||||||||||
Second Lien Term Loan B-2 (3 mo. USD LIBOR + 7.25%) | 8.56 | % | 09/05/2022 | 2,916 | 2,854,871 | |||||||||||
Term Loan C (2 mo. USD LIBOR + 3.00%) | 4.27 | % | 09/07/2021 | 2 | 1,689 | |||||||||||
Term Loan C (3 mo. USD LIBOR + 3.00%) | 4.31 | % | 09/07/2021 | 670 | 655,344 | |||||||||||
Constantia Flexibles Holding GmbH (Austria), Term Loan B-2-A (3 mo. USD LIBOR + 3.00%) (Acquired 09/22/2016 Cost $466,236)(d) | 4.30 | % | 04/30/2022 | 467 | 468,984 | |||||||||||
Diamond (BC) B.V. (Netherlands), Term Loan B(e) | — | 07/25/2024 | 2,963 | 2,948,956 | ||||||||||||
Gemini HDPE LLC, Term Loan (3 mo. USD LIBOR + 3.00%) | 4.31 | % | 08/06/2021 | 3,386 | 3,403,034 | |||||||||||
HII Holding Corp., | ||||||||||||||||
First Lien Term Loan (3 mo. USD LIBOR + 3.25%) | 4.55 | % | 12/20/2019 | 1,983 | 1,994,573 | |||||||||||
Second Lien Term Loan (3 mo. USD LIBOR + 8.50%) (Acquired 07/13/2014; Cost $2,329,452)(d) | 9.80 | % | 12/21/2020 | 2,278 | 2,318,061 | |||||||||||
Ineos US Finance LLC, | ||||||||||||||||
Euro Term Loan (2 mo. EURIBOR + 2.50%) | 3.25 | % | 02/28/2024 | EUR | 1,276 | 1,526,652 | ||||||||||
Term Loan (2 mo. USD LIBOR + 2.75%) | 4.01 | % | 03/31/2022 | 2,419 | 2,429,455 | |||||||||||
KMG Chemicals, Inc., Term Loan (1 mo. USD LIBOR + 4.25%) | 5.48 | % | 06/15/2024 | 1,647 | 1,671,804 | |||||||||||
MacDermid, Inc., | ||||||||||||||||
First Lien Revolver Loan(d)(f) | 0.00 | % | 06/07/2018 | 403 | 402,522 | |||||||||||
First Lien Revolver Loan(d) | 3.00 | % | 06/07/2018 | 164 | 163,425 | |||||||||||
First Lien Revolver Loan (Prime Rate + 2.00%)(d) | 6.25 | % | 06/07/2018 | 174 | 174,138 | |||||||||||
First Lien Revolver Loan (1 mo. USD LIBOR + 3.00%)(d) | 4.23 | % | 06/07/2018 | 1,439 | 1,436,634 | |||||||||||
First Lien Multi-Currency Revolver Loan (Prime Rate + 2.00%)(d) | 6.25 | % | 06/07/2018 | 698 | 696,550 | |||||||||||
First Lien Multi-Currency Revolver Loan(d)(f) | 0.00 | % | 06/07/2018 | 1,483 | 1,480,169 | |||||||||||
Term Loan B-5 (1 mo. USD LIBOR + 3.50%) | 4.73 | % | 06/07/2020 | 142 | 142,758 | |||||||||||
Term Loan B-6 (1 mo. USD LIBOR + 3.00%) | 4.23 | % | 06/07/2023 | 1,706 | 1,715,058 | |||||||||||
Oxea Finance LLC, First Lien Term Loan B-2 (1 mo. USD LIBOR + 3.25%) | 4.48 | % | 01/15/2020 | 8,840 | 8,829,262 | |||||||||||
Proampac PG Borrower LLC, | ||||||||||||||||
First Lien Term Loan (1 mo. USD LIBOR + 4.00%) | 5.23 | % | 11/20/2023 | 1,118 | 1,132,597 | |||||||||||
First Lien Term Loan (3 mo. USD LIBOR + 4.00%) | 5.31 | % | 11/20/2023 | 1,271 | 1,287,668 | |||||||||||
Royal Holdings, Inc., | ||||||||||||||||
Second Lien Term Loan (3 mo. USD LIBOR + 7.50%) (Acquired 06/15/2015; Cost $362,215) | 8.80 | % | 06/19/2023 | 364 | 363,917 | |||||||||||
Term Loan (3 mo. USD LIBOR + 3.25%) | 4.55 | % | 06/17/2022 | 562 | 565,829 | |||||||||||
Tata Chemicals North America Inc., Term Loan (3 mo. USD LIBOR + 2.75%) | 4.06 | % | 08/07/2020 | 1,804 | 1,811,809 | |||||||||||
Trinseo Materials Finance, Inc., Term Loan B(e) | — | 09/04/2024 | 1,038 | 1,043,758 | ||||||||||||
Venator Finance S.a.r.l., Term Loan (3 mo. USD LIBOR + 3.00%) | 4.31 | % | 08/08/2024 | 1,326 | 1,335,012 | |||||||||||
Versum Materials, Term Loan (3 mo. USD LIBOR + 2.50%) | 3.80 | % | 09/30/2023 | 1,910 | 1,923,031 | |||||||||||
| 53,475,912 | ||||||||||||||||
| Clothing & Textiles–0.73% | ||||||||||||||||
ABG Intermediate Holdings 2 LLC, | ||||||||||||||||
First Lien Term Loan B-1 (3 mo. USD LIBOR + 4.00%) | 5.30 | % | 05/27/2021 | 5,185 | 5,223,753 | |||||||||||
Second Lien Term Loan (3 mo. USD LIBOR + 8.50%) | 9.80 | % | 05/27/2022 | 2,955 | 2,995,489 | |||||||||||
Ascena Retail Group, Inc., Term Loan B (1 mo. USD LIBOR + 4.50%) | 5.75 | % | 08/21/2022 | 4,086 | 3,175,659 | |||||||||||
Oak Parent, Inc., Term Loan (1 mo. USD LIBOR + 4.50%) | 5.73 | % | 10/26/2023 | 2,909 | 2,879,747 | |||||||||||
Varsity Brands Holding Co., Inc., First Lien Term Loan (1 mo. USD LIBOR + 3.50%) | 4.73 | % | 12/10/2021 | 5,171 | 5,209,741 | |||||||||||
| 19,484,389 | ||||||||||||||||
| Conglomerates–0.15% | ||||||||||||||||
Penn Engineering & Manufacturing Corp., Term Loan B (1 mo. USD LIBOR + 2.75%) | 3.98 | % | 06/27/2024 | 1,895 | 1,902,190 | |||||||||||
RGIS Services, LLC, Term Loan (3 mo. USD LIBOR + 7.50%) | 8.80 | % | 03/31/2023 | 2,281 | 2,108,370 | |||||||||||
| 4,010,560 | ||||||||||||||||
See accompanying Notes to Financial Statements which are an integral part of the financial statements.
14 Invesco Floating Rate Fund
| Interest Rate | Maturity Date | Principal Amount (000)(a) | Value | |||||||||||||
| Containers & Glass Products–2.42% | ||||||||||||||||
Berlin Packaging, LLC, | ||||||||||||||||
Second Lien Term Loan (1 mo. USD LIBOR + 6.75%) | 7.99 | % | 09/30/2022 | $ | 760 | $ | 766,184 | |||||||||
Term Loan (1 mo. USD LIBOR + 3.25%) | 4.49 | % | 10/01/2021 | 3,995 | 4,014,042 | |||||||||||
Term Loan (3 mo. USD LIBOR + 3.25%) | 4.55 | % | 10/01/2021 | 2,405 | 2,416,985 | |||||||||||
Berry Plastics Corp., | ||||||||||||||||
Term Loan L (1 mo. USD LIBOR + 2.25%) | 3.48 | % | 01/06/2021 | 1,916 | 1,918,535 | |||||||||||
Term Loan M (1 mo. USD LIBOR + 2.25%) | 3.48 | % | 10/01/2022 | 2,227 | 2,230,346 | |||||||||||
Term Loan N (1 mo. USD LIBOR + 2.25%) | 3.48 | % | 01/19/2024 | 1,393 | 1,394,531 | |||||||||||
BWAY Holding Co., Term Loan (1 mo. USD LIBOR + 3.25%) | 4.48 | % | 04/03/2024 | 1,026 | 1,028,383 | |||||||||||
Consolidated Container Co. LLC, Term Loan (1 mo. USD LIBOR + 3.50%) | 4.73 | % | 05/22/2024 | 2,249 | 2,266,255 | |||||||||||
Duran Group (Germany), Term Loan B-2 (3 mo. USD LIBOR + 4.00%) (Acquired 03/24/2017-05/22/2017; Cost $10,463,447) | 5.30 | % | 03/21/2024 | 10,553 | 10,605,446 | |||||||||||
Fort Dearborn Holding Co., Inc., | ||||||||||||||||
First Lien Term Loan (2 mo. USD LIBOR + 4.00%) | 5.25 | % | 10/19/2023 | 81 | 82,092 | |||||||||||
First Lien Term Loan (3 mo. USD LIBOR + 4.00%) | 5.30 | % | 10/19/2023 | 5,039 | 5,076,726 | |||||||||||
Second Lien Term Loan (3 mo. USD LIBOR + 8.50%) (Acquired 10/10/2016; Cost $387,870)(d) | 9.80 | % | 10/19/2024 | 393 | 392,408 | |||||||||||
Hoffmaster Group, Inc., First Lien Term Loan (3 mo. USD LIBOR + 4.50%) | 5.80 | % | 11/21/2023 | 3,845 | 3,885,453 | |||||||||||
ICSH Parent, Inc., | ||||||||||||||||
Delayed Draw Term Loan(f) | 0.00 | % | 04/29/2024 | 354 | 355,025 | |||||||||||
Delayed Draw Term Loan (3 mo. USD LIBOR + 4.00%) | 5.32 | % | 04/29/2024 | 154 | 154,393 | |||||||||||
First Lien Term Loan (3 mo. USD LIBOR + 4.00%) | 5.32 | % | 04/29/2024 | 2,811 | 2,821,394 | |||||||||||
Klockner Pentaplast of America, Inc., Term Loan (3 mo. USD LIBOR + 4.25%) | 5.55 | % | 06/30/2022 | 3,389 | 3,395,916 | |||||||||||
Libbey Glass, Inc., Term Loan (1 mo. USD LIBOR + 3.00%) | 4.23 | % | 04/09/2021 | 606 | 553,853 | |||||||||||
Ranpak Corp., | ||||||||||||||||
Second Lien Term Loan (1 mo. USD LIBOR + 7.25%)(d) | 8.48 | % | 10/03/2022 | 255 | 253,750 | |||||||||||
Term Loan B-1 (1 mo. USD LIBOR + 3.25%) | 4.48 | % | 10/01/2021 | 824 | 827,186 | |||||||||||
Reynolds Group Holdings Inc., Incremental Term Loan (1 mo. USD LIBOR + 3.00%) | 4.23 | % | 02/05/2023 | 15,780 | 15,812,360 | |||||||||||
SIG Combibloc US Acquisition Inc, Term Loan (1 mo. EURIBOR + 3.75%) | 3.75 | % | 03/11/2022 | EUR | 203 | 244,602 | ||||||||||
Tekni-Plex Inc., | ||||||||||||||||
Second Lien Term Loan (3 mo. USD LIBOR + 7.75%) (Acquired 04/15/2015; Cost $460,055)(d) | 9.06 | % | 06/01/2023 | 463 | 463,939 | |||||||||||
Term Loan B-1 (2 mo. USD LIBOR + 3.50%) | 4.76 | % | 06/01/2022 | 1 | 1,393 | |||||||||||
Term Loan B-1 (3 mo. USD LIBOR + 3.50%) | 4.81 | % | 06/01/2022 | 541 | 544,796 | |||||||||||
TricorBraun Inc., | ||||||||||||||||
First Lien Delayed Draw Term Loan(f) | 0.00 | % | 11/30/2023 | 311 | 310,771 | |||||||||||
Term Loan (3 mo. USD LIBOR + 3.75%) | 5.05 | % | 11/30/2023 | 3,065 | 3,092,166 | |||||||||||
| 64,908,930 | ||||||||||||||||
| Cosmetics & Toiletries–1.17% | ||||||||||||||||
Alphabet Holding Co., Inc., Term Loan(e) | — | 08/15/2024 | 3,312 | 3,294,368 | ||||||||||||
Coty Inc., | ||||||||||||||||
Incremental Term Loan B (1 mo. USD LIBOR + 2.50%) | 3.73 | % | 10/27/2022 | 4,676 | 4,679,527 | |||||||||||
Term Loan A (1 mo. USD LIBOR + 1.75%) | 2.98 | % | 10/27/2020 | 3,538 | 3,527,404 | |||||||||||
Galleria Co., Term Loan B (1 mo. USD LIBOR + 3.00%) | 4.25 | % | 09/29/2023 | 6,278 | 6,289,553 | |||||||||||
Prestige Brands, Inc., Term Loan B-4 (1 mo. USD LIBOR + 2.75%) | 3.98 | % | 01/26/2024 | 6,988 | 7,011,934 | |||||||||||
Sundial Group Holdings, LLC, Term Loan (1 mo. USD LIBOR + 4.75%)(d) | 5.98 | % | 08/15/2024 | 2,600 | 2,586,536 | |||||||||||
Wellness Merger Sub, Inc., First Lien Term Loan (3 mo. USD LIBOR + 4.75%) | 6.05 | % | 06/30/2024 | 3,992 | 4,016,834 | |||||||||||
| 31,406,156 | ||||||||||||||||
| Drugs–1.46% | ||||||||||||||||
Alpha BidCo SAS,(France) | ||||||||||||||||
Term Loan B-1 (3 mo. EURIBOR + 3.50%) | 3.50 | % | 01/30/2023 | EUR | 544 | 655,375 | ||||||||||
Term Loan B-2 (3 mo. EURIBOR + 3.50%) | 3.50 | % | 01/30/2023 | EUR | 233 | 281,043 | ||||||||||
See accompanying Notes to Financial Statements which are an integral part of the financial statements.
15 Invesco Floating Rate Fund
| Interest Rate | Maturity Date | Principal Amount (000)(a) | Value | |||||||||||||
| Drugs–(continued) | ||||||||||||||||
BPA Laboratories, | ||||||||||||||||
First Lien Term Loan (3 mo. USD LIBOR + 2.50%) | 3.81 | % | 04/29/2020 | $ | 1,202 | $ | 1,172,111 | |||||||||
Second Lien Term Loan (3 mo. USD LIBOR + 2.50%)(d) | 3.81 | % | 04/29/2020 | 1,045 | 1,045,282 | |||||||||||
Catalent Pharma Solutions, Inc., Term Loan (1 mo. USD LIBOR + 2.75%) | 3.98 | % | 05/20/2021 | 6,610 | 6,655,194 | |||||||||||
Endo LLC, Term Loan (1 mo. USD LIBOR + 4.25%) | 5.50 | % | 04/27/2024 | 9,414 | 9,506,489 | |||||||||||
Grifols Worldwide Operations USA, Inc., Term Loan B (1 wk. USD LIBOR + 2.25%) | 3.45 | % | 01/31/2025 | 12,881 | 12,917,444 | |||||||||||
Valeant Pharmaceuticals International, Inc. (Canada), Term Loan B (1 mo. USD LIBOR + 4.75%) | 5.99 | % | 04/01/2022 | 6,759 | 6,882,170 | |||||||||||
| 39,115,108 | ||||||||||||||||
| Ecological Services & Equipment–0.78% | ||||||||||||||||
Advanced Disposal Services, Inc., Term Loan (1 wk. USD LIBOR + 2.75%) | 3.95 | % | 11/10/2023 | 7,636 | 7,683,911 | |||||||||||
Casella Waste Systems, Inc., Term Loan B-1 (1 mo. USD LIBOR + 2.75%) | 3.98 | % | 10/17/2023 | 1,101 | 1,105,626 | |||||||||||
PSSI Holdings LLC, Term Loan (3 mo. USD LIBOR + 3.50%)(d) | 4.73 | % | 12/02/2021 | 2,485 | 2,509,507 | |||||||||||
Waste Industries USA, Inc., Term Loan B (1 mo. USD LIBOR + 2.75%) | 3.98 | % | 02/27/2020 | 6,952 | 6,972,442 | |||||||||||
WCA Waste Systems Inc., Term Loan (1 mo. USD LIBOR + 2.75%) | 3.98 | % | 08/11/2023 | 2,576 | 2,581,861 | |||||||||||
| 20,853,347 | ||||||||||||||||
| Electronics & Electrical–11.18% | ||||||||||||||||
4L Technologies Inc., Term Loan (1 mo. USD LIBOR + 4.50%) | 5.73 | % | 05/08/2020 | 9,234 | 8,233,663 | |||||||||||
Almonde, Inc.,(United Kingdom) | ||||||||||||||||
First Lien Term Loan (3 mo. EURIBOR + 3.25%) | 4.25 | % | 06/13/2024 | EUR | 2,153 | 2,598,932 | ||||||||||
First Lien Term Loan (3 mo. USD LIBOR + 3.50%) | 4.74 | % | 06/13/2024 | 15,376 | 15,470,472 | |||||||||||
Blackboard Inc., Term Loan B-4 (3 mo. USD LIBOR + 5.00%) | 6.30 | % | 06/30/2021 | 7,110 | 7,026,809 | |||||||||||
Canyon Valor Companies, Inc., Term Loan(e) | — | 06/16/2023 | 4,287 | 4,329,543 | ||||||||||||
Cavium, Inc., Term Loan B-1 (1 mo. USD LIBOR + 2.25%)(d) | 3.48 | % | 08/16/2022 | 4,447 | 4,461,195 | |||||||||||
CommScope, Inc., Term Loan 5 (3 mo. USD LIBOR + 2.00%) | 3.30 | % | 12/29/2022 | 1,764 | 1,773,619 | |||||||||||
Compuware Corp., Term Loan B-3 (3 mo. USD LIBOR + 4.25%) | 5.55 | % | 12/15/2021 | 3,695 | 3,741,268 | |||||||||||
CPI International, Inc., First Lien Term Loan(e) | — | 07/26/2024 | 1,528 | 1,527,764 | ||||||||||||
Dell International LLC, | ||||||||||||||||
Term Loan A-2 (1 mo. USD LIBOR + 2.25%) | 3.49 | % | 09/07/2021 | 2,257 | 2,263,319 | |||||||||||
Term Loan B (1 mo. USD LIBOR + 2.50%) | 3.74 | % | 09/07/2023 | 2,752 | 2,766,615 | |||||||||||
Diamond US Holding LLC, Term Loan B (3 mo. USD LIBOR + 3.25%) | 4.55 | % | 04/06/2024 | 4,107 | 4,119,938 | |||||||||||
Diebold Nixdorf, Inc., Term Loan B (1 mo. USD LIBOR + 2.75%) | 4.00 | % | 11/06/2023 | 3,785 | 3,792,118 | |||||||||||
Go Daddy Operating Co., LLC, Term Loan (1 mo. USD LIBOR + 2.50%) | 3.73 | % | 02/15/2024 | EUR | 14,847 | 14,901,345 | ||||||||||
Hyland Software, Inc., | ||||||||||||||||
Second Lien Term Loan (1 mo. USD LIBOR + 7.00%) | 8.23 | % | 07/07/2025 | 238 | 242,708 | |||||||||||
Term Loan (1 mo. USD LIBOR + 3.25%) | 4.48 | % | 07/01/2022 | 1,596 | 1,613,154 | |||||||||||
IGT Holding IV AB (Sweden), Term Loan B(e) | — | 07/24/2024 | 2,944 | 2,958,893 | ||||||||||||
Integrated Device Technology, Inc., Term Loan B (1 mo. USD LIBOR + 3.00%)(d) | 4.23 | % | 04/04/2024 | 1,939 | 1,944,819 | |||||||||||
Kemet Corp., Term Loan (1 mo. USD LIBOR + 6.00%)(d) | 7.23 | % | 04/26/2024 | 3,143 | 3,162,895 | |||||||||||
Lattice Semiconductor Corp., Term Loan (1 mo. USD LIBOR + 4.25%)(d) | 5.48 | % | 03/10/2021 | 4,221 | 4,231,280 | |||||||||||
Lully Finance LLC, | ||||||||||||||||
First Lien Term Loan B-3 (1 mo. USD LIBOR + 3.50%) | 4.73 | % | 10/14/2022 | 1,481 | 1,468,242 | |||||||||||
First Lien Term Loan B-4 (1 mo. EURIBOR + 3.75%) | 3.75 | % | 10/14/2022 | EUR | 1,193 | 1,421,294 | ||||||||||
Second Lien Term Loan B-1 (1 mo. USD LIBOR + 8.50%)(d) | 9.73 | % | 10/16/2023 | 1,614 | 1,557,265 | |||||||||||
Second Lien Term Loan B-2 (1 mo. EURIBOR + 7.25%) (Acquired 11/30/2016; Cost $587,965)(d) | 7.25 | % | 10/16/2023 | EUR | 555 | 660,418 | ||||||||||
MA Finance Co., LLC, | ||||||||||||||||
Term Loan B-2 (3 mo. USD LIBOR + 2.50%) | 3.81 | % | 11/19/2021 | 10,174 | 10,174,938 | |||||||||||
Term Loan B-3 (1 mo. USD LIBOR + 2.75%) | 3.98 | % | 04/26/2024 | 2,362 | 2,364,513 | |||||||||||
MACOM Technology Solutions Holdings, Inc., Term Loan (1 mo. USD LIBOR + 2.25%) | 3.48 | % | 05/17/2024 | 4,281 | 4,281,256 | |||||||||||
Mediaocean LLC, First Lien Term Loan (1 mo. USD LIBOR + 4.25%) | 5.49 | % | 08/15/2022 | 3,834 | 3,851,769 | |||||||||||
See accompanying Notes to Financial Statements which are an integral part of the financial statements.
16 Invesco Floating Rate Fund
| Interest Rate | Maturity Date | Principal Amount (000)(a) | Value | |||||||||||||
| Electronics & Electrical–(continued) | ||||||||||||||||
Meter Reading Holding, LLC, Term Loan (3 mo. USD LIBOR + 5.75%)(d) | 6.95 | % | 08/29/2023 | $ | 4,613 | $ | 4,704,762 | |||||||||
Micro Holding, L.P., Term Loan(e) | — | 08/16/2024 | 3,381 | 3,371,412 | ||||||||||||
Micron Technology, Inc., Term Loan (3 mo. USD LIBOR + 2.50%) | 3.80 | % | 04/26/2022 | 837 | 844,155 | |||||||||||
Microsemi Corp., Term Loan B (3 mo. USD LIBOR + 2.25%) | 3.55 | % | 01/15/2023 | 6,514 | 6,537,760 | |||||||||||
Mirion Technologies, Inc., Term Loan (3 mo. USD LIBOR + 4.75%) | 6.05 | % | 03/31/2022 | 2,579 | 2,579,813 | |||||||||||
MTS Systems, Term Loan B (1 mo. USD LIBOR + 3.25%) | 4.49 | % | 07/05/2023 | 2,259 | 2,279,989 | |||||||||||
NeuStar, Inc., | ||||||||||||||||
Term Loan B-1(e) | — | 09/02/2019 | 1,226 | 1,235,210 | ||||||||||||
Term Loan B-2(e) | — | 03/01/2024 | 4,633 | 4,682,730 | ||||||||||||
Oberthur Technologies of America Corp., | ||||||||||||||||
Term Loan B-1 (3 mo. EURIBOR + 3.75%) | 3.75 | % | 01/10/2024 | EUR | 3,402 | 4,004,736 | ||||||||||
Term Loan B-1 (3 mo. USD LIBOR + 3.75%) | 5.05 | % | 01/10/2024 | 4,515 | 4,460,283 | |||||||||||
Term Loan B-2 (3 mo. EURIBOR + 3.75%) | 3.75 | % | 01/10/2024 | EUR | 3,449 | 4,060,257 | ||||||||||
Omnitracs, Inc., | ||||||||||||||||
Second Lien Term Loan (3 mo. USD LIBOR + 7.75%) | 9.05 | % | 05/25/2021 | 311 | 311,734 | |||||||||||
Term Loan (3 mo. USD LIBOR + 3.75%) | 5.05 | % | 11/25/2020 | 5,444 | 5,482,243 | |||||||||||
ON Semiconductor Corp., Term Loan (1 mo. USD LIBOR + 2.25%) | 3.48 | % | 03/31/2023 | 9,555 | 9,599,253 | |||||||||||
Optiv Inc., | ||||||||||||||||
Second Lien Term Loan (3 mo. USD LIBOR + 7.25%) | 8.56 | % | 01/31/2025 | 654 | 591,780 | |||||||||||
Term Loan (3 mo. USD LIBOR + 3.25%) | 4.56 | % | 02/01/2024 | 4,829 | 4,418,649 | |||||||||||
Project Leopard Holdings, Inc., Term Loan (3 mo. USD LIBOR + 5.50%) | 6.76 | % | 07/07/2023 | 2,059 | 2,074,420 | |||||||||||
Quest Software US Holdings Inc., Term Loan (2 mo. USD LIBOR + 6.00%) | 7.26 | % | 10/31/2022 | 8,999 | 9,153,018 | |||||||||||
Ramundsen Holdings, LLC, | ||||||||||||||||
Second Lien Term Loan (3 mo. USD LIBOR + 8.50%) | 9.80 | % | 01/31/2025 | 261 | 264,424 | |||||||||||
Term Loan (3 mo. USD LIBOR + 4.25%) | 5.55 | % | 02/01/2024 | 642 | 646,596 | |||||||||||
Riverbed Technology, Inc., Term Loan (1 mo. USD LIBOR + 3.25%) | 4.49 | % | 04/24/2022 | 817 | 795,484 | |||||||||||
Rocket Software, Inc., | ||||||||||||||||
Second Lien Term Loan (3 mo. USD LIBOR + 9.50%) | 10.80 | % | 10/14/2024 | 978 | 981,303 | |||||||||||
Term Loan (3 mo. USD LIBOR + 4.25%) | 5.55 | % | 10/14/2023 | 6,931 | 7,017,154 | |||||||||||
RP Crown Parent, LLC, Term Loan (1 mo. USD LIBOR + 3.50%) | 4.73 | % | 10/12/2023 | 1,514 | 1,527,982 | |||||||||||
Sandvine Corp., Term Loan B(d)(e) | — | 08/25/2022 | 3,599 | 3,454,881 | ||||||||||||
Seattle Spinco, Inc., Term Loan (3 mo. USD LIBOR + 2.75%) | 4.03 | % | 06/21/2024 | 15,952 | 15,968,139 | |||||||||||
Sparta Systems, Inc., Term Loan B(e) | — | 08/21/2024 | 675 | 677,872 | ||||||||||||
Sybil Software LLC, | ||||||||||||||||
Term Loan (3 mo. USD LIBOR + 3.25%) | 4.50 | % | 09/30/2023 | 11,108 | 11,191,689 | |||||||||||
Term Loan (3 mo. EURIBOR + 3.50%)(e) | — | 09/30/2023 | EUR | 3,919 | 4,716,442 | |||||||||||
Symantec Corp., Term Loan A-5 (2 mo. USD LIBOR + 1.75%) | 3.01 | % | 08/01/2021 | 3,167 | 3,162,298 | |||||||||||
Tempe Holdco Corp., Term Loan B (1 mo. USD LIBOR + 3.25%) | 4.48 | % | 12/01/2023 | 4,519 | 4,578,393 | |||||||||||
TIBCO Software, Inc., Term Loan B-1(e) | — | 12/04/2020 | 1,337 | 1,343,076 | ||||||||||||
TTM Technologies, Inc., Term Loan B (1 mo. USD LIBOR + 4.25%) | 5.48 | % | 05/31/2021 | 4,176 | 4,231,077 | |||||||||||
Vantiv, LLC, Term Loan B (1 mo. USD LIBOR + 2.50%) | 3.73 | % | 10/14/2023 | 237 | 238,273 | |||||||||||
Verifone, Inc., Term Loan B (1 mo. USD LIBOR + 2.75%) | 3.99 | % | 07/08/2021 | 3,591 | 3,606,964 | |||||||||||
Verint Systems Inc., Term Loan B (3 mo. USD LIBOR + 2.25%) | 3.56 | % | 06/29/2024 | 2,243 | 2,251,221 | |||||||||||
Veritas US Inc., | ||||||||||||||||
Euro Term Loan (3 mo. EURIBOR + 4.50%) | 5.50 | % | 01/27/2023 | EUR | 11,347 | 13,641,384 | ||||||||||
Term Loan B (3 mo. USD LIBOR + 4.50%) | 5.80 | % | 01/27/2023 | 3,761 | 3,797,713 | |||||||||||
VF Holding Corp., Term Loan B-1 (3 mo. USD LIBOR + 3.25%) | 4.55 | % | 06/30/2023 | 2,636 | 2,649,898 | |||||||||||
Viewpoint, Inc., Term Loan (3 mo. USD LIBOR + 4.25%) | 5.70 | % | 07/19/2024 | 1,423 | 1,430,389 | |||||||||||
Western Digital Corp., Term Loan B-2 (1 mo. USD LIBOR + 2.75%) | 3.98 | % | 04/29/2023 | 20,742 | 20,890,696 | |||||||||||
Zebra Technologies Corp., Term Loan B (3 mo. USD LIBOR + 2.00%) | 3.31 | % | 10/27/2021 | 3,487 | 3,489,819 | |||||||||||
| 299,885,415 | ||||||||||||||||
See accompanying Notes to Financial Statements which are an integral part of the financial statements.
17 Invesco Floating Rate Fund
| Interest Rate | Maturity Date | Principal Amount (000)(a) | Value | |||||||||||||
| Financial Intermediaries–1.44% | ||||||||||||||||
Black Knight InfoServ, LLC, Term Loan B (1 mo. USD LIBOR + 2.25%)(d) | 3.50 | % | 05/27/2022 | $ | 670 | $ | 672,903 | |||||||||
GEO Group, Inc., Term Loan (1 mo. USD LIBOR + 2.25%) | 3.49 | % | 03/23/2024 | 2,138 | 2,145,236 | |||||||||||
iPayment Inc., Term Loan (3 mo. USD LIBOR + 6.00%)(d) | 7.31 | % | 04/11/2023 | 2,943 | 2,972,665 | |||||||||||
LPL Holdings, Inc., Term Loan (3 mo. USD LIBOR + 2.50%) | 3.82 | % | 03/10/2024 | 1,285 | 1,291,365 | |||||||||||
MoneyGram International, Inc., Term Loan (3 mo. USD LIBOR + 3.25%) | 4.55 | % | 03/27/2020 | 9,098 | 9,099,465 | |||||||||||
RJO Holdings Corp., | ||||||||||||||||
Term Loan (1 mo. USD LIBOR + 12.00%) (Acquired 04/12/2017; Cost $1,252,813)(d) | 13.23 | % | 05/05/2022 | 1,265 | 1,271,164 | |||||||||||
Term Loan (1 mo. USD LIBOR + 8.02%) (Acquired 04/12/2017; Cost $3,523,537)(d) | 9.25 | % | 05/05/2022 | 3,557 | 3,575,147 | |||||||||||
RPI Finance Trust, Term Loan B-6 (3 mo. USD LIBOR + 2.00%) | 3.30 | % | 03/27/2023 | 11,273 | 11,333,065 | |||||||||||
SAM Finance Lux S.a.r.l. (Luxembourg), Term Loan (3 mo. USD LIBOR + 3.25%) | 4.50 | % | 12/17/2020 | 474 | 476,616 | |||||||||||
Stiphout Finance LLC, | ||||||||||||||||
Second Lien Term Loan (1 mo. USD LIBOR + 8.00%) (Acquired 07/21/2015; Cost $90,820)(d) | 9.23 | % | 10/26/2023 | 91 | 90,969 | |||||||||||
Term Loan (1 mo. USD LIBOR + 3.75%) (Acquired 07/21/2015-07/11/2016; Cost $2,939,329)(d) | 4.98 | % | 10/26/2022 | 2,944 | 2,962,696 | |||||||||||
Walter Investment Management Corp., Term Loan B (1 mo. USD LIBOR + 3.75%) | 4.98 | % | 12/18/2020 | 2,872 | 2,667,544 | |||||||||||
| 38,558,835 | ||||||||||||||||
| Food & Drug Retailers–1.38% | ||||||||||||||||
Adria Group Holding B.V. (Netherlands), Term Loan (Acquired 05/19/2016-02/07/2017; Cost $7,044,255)(h) | 0.00 | % | 06/04/2018 | EUR | 8,076 | 193,475 | ||||||||||
Albertsons, LLC, | ||||||||||||||||
Term Loan B-4 (1 mo. USD LIBOR + 2.75%) | 3.98 | % | 08/25/2021 | 11,860 | 11,544,852 | |||||||||||
Term Loan B-5 (3 mo. USD LIBOR + 3.00%) | 4.29 | % | 12/21/2022 | 7,586 | 7,387,099 | |||||||||||
Term Loan B-6 (3 mo. USD LIBOR + 3.00%) | 4.25 | % | 06/22/2023 | 5,534 | 5,394,793 | |||||||||||
Pret A Manger (United Kingdom), Term Loan B-2 (3 mo. GBP LIBOR + 4.00%) | 4.29 | % | 06/20/2022 | GBP | 2,115 | 2,757,160 | ||||||||||
Rite Aid Corp., | ||||||||||||||||
Second Lien Term Loan 1 (1 mo. USD LIBOR + 4.75%) | 5.99 | % | 08/21/2020 | 2,637 | 2,663,370 | |||||||||||
Second Lien Term Loan 2 (1 mo. USD LIBOR + 3.88%) | 5.12 | % | 06/21/2021 | 2,911 | 2,931,011 | |||||||||||
Supervalu Inc., | ||||||||||||||||
Delayed Draw Term Loan B (1 mo. USD LIBOR + 3.50%) | 4.73 | % | 06/08/2024 | 1,655 | 1,604,334 | |||||||||||
Term Loan (1 mo. USD LIBOR + 3.50%) | 4.73 | % | 06/08/2024 | 2,759 | 2,673,890 | |||||||||||
| 37,149,984 | ||||||||||||||||
| Food Products–2.45% | ||||||||||||||||
Candy Intermediate Holdings, Inc., Term Loan (3 mo. USD LIBOR + 4.50%) | 5.80 | % | 06/15/2023 | 5,595 | 5,441,117 | |||||||||||
Chefs’ Warehouse Parent, LLC, Term Loan (1 mo. USD LIBOR + 4.75%) | 6.98 | % | 06/22/2022 | 1,675 | 1,697,962 | |||||||||||
CSM Bakery Supplies LLC, First Lien Term Loan (3 mo. USD LIBOR + 4.00%) | 5.30 | % | 07/03/2020 | 2,061 | 1,970,729 | |||||||||||
Dole Food Co., Inc., | ||||||||||||||||
Term Loan B (2 mo. USD LIBOR + 2.75%) | 4.01 | % | 04/06/2024 | 8,130 | 8,161,549 | |||||||||||
Term Loan B (3 mo. USD LIBOR + 2.75%) | 4.05 | % | 04/06/2024 | 452 | 453,419 | |||||||||||
Hearthside Group Holdings, LLC, | ||||||||||||||||
Revolver Loan(d)(f) | 0.00 | % | 06/02/2019 | 2,701 | 2,692,434 | |||||||||||
Term Loan (1 mo. USD LIBOR + 3.00%) | 4.23 | % | 06/02/2021 | 1,107 | 1,112,169 | |||||||||||
Hostess Brands, LLC, Term Loan B (1 mo. USD LIBOR + 2.50%) | 3.73 | % | 08/03/2022 | 19 | 18,890 | |||||||||||
Jacobs Douwe Egberts International B.V., Term Loan B-5 (3 mo. USD LIBOR + 2.25%) | 3.56 | % | 07/04/2022 | 9,426 | 9,481,463 | |||||||||||
JBS USA Lux S.A., | ||||||||||||||||
Term Loan (2 mo. USD LIBOR + 2.50%) | 3.76 | % | 10/30/2022 | 55 | 54,148 | |||||||||||
Term Loan (3 mo. USD LIBOR + 2.50%) | 3.80 | % | 10/30/2022 | 21,769 | 21,550,998 | |||||||||||
Nomad Foods US LLC (United Kingdom), Term Loan B-2 (1 mo. USD LIBOR + 2.75%) | 3.98 | % | 05/15/2024 | 2,761 | 2,780,183 | |||||||||||
Pinnacle Foods Finance LLC, Term Loan (1 mo. USD LIBOR + 2.00%) | 3.23 | % | 02/02/2024 | 637 | 639,439 | |||||||||||
Post Holdings, Inc., | ||||||||||||||||
Incremental Term Loan (1 mo. USD LIBOR + 2.25%) | 3.49 | % | 05/24/2024 | 5,092 | 5,107,791 | |||||||||||
Revolver Loan(d)(f) | 0.00 | % | 01/29/2019 | 3,566 | 3,561,755 | |||||||||||
See accompanying Notes to Financial Statements which are an integral part of the financial statements.
18 Invesco Floating Rate Fund
| Interest Rate | Maturity Date | Principal Amount (000)(a) | Value | |||||||||||||
| Food Products–(continued) | ||||||||||||||||
QCE LLC, PIK Term Loan, 10.00% PIK Rate(g) | 10.00 | % | 06/30/2019 | $ | 6 | $ | 614 | |||||||||
Shearer’s Foods, LLC, | ||||||||||||||||
First Lien Term Loan (3 mo. USD LIBOR + 3.94%) | 5.23 | % | 06/30/2021 | 499 | 500,187 | |||||||||||
Second Lien Term Loan (3 mo. USD LIBOR + 6.75%)(d) | 8.05 | % | 06/30/2022 | 457 | 438,457 | |||||||||||
| 65,663,304 | ||||||||||||||||
| Food Service–2.10% | ||||||||||||||||
Landry’s, Inc., | ||||||||||||||||
Term Loan B (2 mo. USD LIBOR + 2.75%) | 4.01 | % | 10/04/2023 | 1,233 | 1,224,927 | |||||||||||
Term Loan B (3 mo. USD LIBOR + 2.75%) | 3.97 | % | 10/04/2023 | 1,765 | 1,753,384 | |||||||||||
New Red Finance, Inc., | ||||||||||||||||
Term Loan B-3 (1 mo. USD LIBOR + 2.25%) | 3.49 | % | 02/16/2024 | 10,346 | 10,327,747 | |||||||||||
Term Loan B-3 (3 mo. USD LIBOR + 2.25%) | 3.55 | % | 02/16/2024 | 6,596 | 6,584,938 | |||||||||||
NPC International, Inc., | ||||||||||||||||
First Lien Term Loan (1 mo. USD LIBOR + 3.50%) | 4.74 | % | 04/19/2024 | 3,067 | 3,089,800 | |||||||||||
Second Lien Term Loan (1 mo. USD LIBOR + 7.50%) | 8.74 | % | 04/18/2025 | 965 | 979,603 | |||||||||||
Pizza Hut Holdings, LLC, Term Loan B (1 mo. USD LIBOR + 2.00%) | 3.23 | % | 06/16/2023 | 266 | 267,859 | |||||||||||
Red Lobster Management, LLC, Term Loan (1 mo. USD LIBOR + 5.25%) | 6.48 | % | 07/28/2021 | 3,464 | 3,503,351 | |||||||||||
Restaurant Holding Co., LLC, First Lien Term Loan (1 mo. USD LIBOR + 7.75%) | 8.99 | % | 02/28/2019 | 1,688 | 1,656,202 | |||||||||||
Steak ‘n Shake Inc., Term Loan (1 mo. USD LIBOR + 3.75%) | 4.99 | % | 03/19/2021 | 2,378 | 2,330,772 | |||||||||||
TKC Holdings, Inc., First Lien Term Loan (1 mo. USD LIBOR + 4.25%) | 5.48 | % | 02/01/2023 | 4,254 | 4,277,679 | |||||||||||
US Foods, Inc., Second Lien Incremental Term Loan (1 mo. USD LIBOR + 2.75%) | 3.99 | % | 06/27/2023 | 20,243 | 20,354,910 | |||||||||||
| 56,351,172 | ||||||||||||||||
| Health Care–3.75% | ||||||||||||||||
Acadia Healthcare Co., Inc., | ||||||||||||||||
Term Loan B-1 (1 mo. USD LIBOR + 2.75%) | 3.97 | % | 02/11/2022 | 1,344 | 1,353,885 | |||||||||||
Term Loan B-2 (1 mo. USD LIBOR + 2.75%) | 3.98 | % | 02/16/2023 | 5,252 | 5,288,050 | |||||||||||
ATI Holdings, Inc., First Lien Term Loan(e) | — | 05/10/2023 | 1,591 | 1,600,105 | ||||||||||||
CareCore National, LLC, Term Loan (1 mo. USD LIBOR + 4.00%)(d) | 5.23 | % | 03/05/2021 | 8,410 | 8,536,440 | |||||||||||
Community Health Systems, Inc., | ||||||||||||||||
Incremental Term Loan G (3 mo. USD LIBOR + 2.75%) | 3.96 | % | 12/31/2019 | 2,505 | 2,501,915 | |||||||||||
Revolver Loan(d)(f) | 0.00 | % | 01/27/2019 | 1,974 | 1,953,135 | |||||||||||
Convatec Inc., Term Loan B (3 mo. USD LIBOR + 2.50%) | 3.80 | % | 10/31/2023 | 634 | 637,082 | |||||||||||
DJO Finance LLC, Term Loan (1 mo. USD LIBOR + 3.25%) | 4.48 | % | 06/07/2020 | 7,978 | 7,956,802 | |||||||||||
Elsan Groupe S.A.S. (France), Term Loan B-2 (1 mo. EURIBOR + 3.75%) | 3.75 | % | 07/21/2022 | EUR | 1,347 | 1,619,908 | ||||||||||
Envision Healthcare Corp., Term Loan (3 mo. USD LIBOR + 3.00%) | 4.30 | % | 12/01/2023 | 2,959 | 2,985,200 | |||||||||||
Explorer Holdings, Inc., Term Loan (3 mo. USD LIBOR + 3.75%) | 5.06 | % | 05/02/2023 | 3,380 | 3,400,420 | |||||||||||
Global Healthcare Exchange, LLC, Term Loan (3 mo. USD LIBOR + 3.25%) | 4.55 | % | 06/30/2024 | 2,403 | 2,406,445 | |||||||||||
Greatbatch, Ltd., Term Loan B (1 mo. USD LIBOR + 3.50%) | 4.73 | % | 10/27/2022 | 3,004 | 3,022,009 | |||||||||||
HC Group Holdings III, Inc., Term Loan (3 mo. USD LIBOR + 5.00%)(d) | 6.23 | % | 04/07/2022 | 4,992 | 5,036,008 | |||||||||||
HCA, Inc., Term Loan B-9 (1 mo. USD LIBOR + 2.00%) | 3.23 | % | 03/17/2023 | 4,111 | 4,130,380 | |||||||||||
INC Research Holdings, Inc., Term Loan B (1 mo. USD LIBOR + 2.25%) | 3.48 | % | 08/01/2024 | 479 | 480,176 | |||||||||||
Kinetic Concepts, Inc., Term Loan (3 mo. USD LIBOR + 3.25%) | 4.55 | % | 02/03/2024 | 8,608 | 8,541,348 | |||||||||||
MPH Acquisition Holdings LLC, Term Loan (3 mo. USD LIBOR + 3.00%) | 4.30 | % | 06/07/2023 | 15,327 | 15,411,663 | |||||||||||
Ortho-Clinical Diagnostics, Inc., Term Loan (3 mo. USD LIBOR + 3.75%) | 5.05 | % | 06/30/2021 | 1,602 | 1,608,485 | |||||||||||
PAREXEL International Corp., Term Loan(e) | — | 08/11/2024 | 8,759 | 8,790,750 | ||||||||||||
Surgery Center Holdings, Inc., Term Loan(e) | — | 06/20/2024 | 2,104 | 2,089,129 | ||||||||||||
Team Health Holdings, Inc., Term Loan (1 mo. USD LIBOR + 2.75%) | 3.98 | % | 02/06/2024 | 7,598 | 7,521,925 | |||||||||||
Unilabs Diagnostics AB (Sweden), Revolver Loan(d)(f) | 0.00 | % | 03/12/2021 | EUR | 1,850 | 2,168,437 | ||||||||||
WP CityMD Bidco LLC, Term Loan (3 mo. USD LIBOR + 4.00%) | 5.30 | % | 06/07/2024 | 1,674 | 1,682,746 | |||||||||||
| 100,722,443 | ||||||||||||||||
See accompanying Notes to Financial Statements which are an integral part of the financial statements.
19 Invesco Floating Rate Fund
| Interest Rate | Maturity Date | Principal Amount (000)(a) | Value | |||||||||||||
| Home Furnishings–0.48% | ||||||||||||||||
Comfort Holding, LLC, | ||||||||||||||||
First Lien Term Loan (1 mo. USD LIBOR + 4.75%) | 5.98 | % | 02/05/2024 | $ | 4,490 | $ | 4,186,879 | |||||||||
Second Lien Term Loan (1 mo. USD LIBOR + 10.00%) | 11.23 | % | 02/03/2025 | 537 | 459,601 | |||||||||||
Hayward Industries, Inc., First Lien Term Loan (1 mo. USD LIBOR + 3.50%) | 4.73 | % | 08/04/2024 | 1,635 | 1,645,598 | |||||||||||
Serta Simmons Bedding, LLC, First Lien Term Loan (3 mo. USD LIBOR + 3.50%) | 4.80 | % | 11/08/2023 | 6,893 | 6,719,423 | |||||||||||
| 13,011,501 | ||||||||||||||||
| Industrial Equipment–2.28% | ||||||||||||||||
| Accudyne Industries LLC, | ||||||||||||||||
Term Loan(e) | — | 08/15/2024 | 4,145 | 4,152,309 | ||||||||||||
Clark Equipment Co., Term Loan B (1 mo. USD LIBOR + 2.75%) | 4.01 | % | 05/18/2024 | 7,028 | 7,058,985 | |||||||||||
Columbus McKinnon Corp., Term Loan (3 mo. USD LIBOR + 3.00%) | 4.30 | % | 01/31/2024 | 950 | 954,993 | |||||||||||
Crosby US Acquisition Corp., First Lien Term Loan (3 mo. USD LIBOR + 3.00%) | 4.31 | % | 11/23/2020 | 4,634 | 4,286,804 | |||||||||||
DXP Enterprises, Inc., Term Loan(d)(e) | — | 09/01/2023 | 1,449 | 1,443,377 | ||||||||||||
Engineered Machinery Holdings, Inc., | ||||||||||||||||
First Lien Delayed Draw Term Loan(f) | 0.00 | % | 07/25/2024 | 145 | 145,221 | |||||||||||
First Lien Term Loan(e) | — | 07/25/2024 | 1,116 | 1,117,085 | ||||||||||||
Second Lien Delayed Draw Term Loan(f) | 0.00 | % | 07/25/2025 | 86 | 86,289 | |||||||||||
Second Lien Delayed Draw Term Loan | 8.49 | % | 07/25/2025 | 12 | 11,767 | |||||||||||
Second Lien Term Loan(e) | — | 07/25/2025 | 817 | 823,666 | ||||||||||||
Filtration Group Corp., First Lien Term Loan (2 mo. USD LIBOR + 3.00%) | 4.26 | % | 11/23/2020 | 5,440 | 5,473,726 | |||||||||||
Gardner Denver, Inc., | ||||||||||||||||
Term Loan B-1(e) | — | 07/30/2024 | EUR | 1,045 | 1,242,066 | |||||||||||
Term Loan B-1(e) | — | 07/30/2024 | 5,072 | 5,076,659 | ||||||||||||
Generac Power System, Inc., Term Loan (3 mo. USD LIBOR + 2.25%) | 3.55 | % | 05/31/2023 | 2,282 | 2,292,731 | |||||||||||
Milacron LLC, Term Loan B (1 mo. USD LIBOR + 3.00%) | 4.23 | % | 09/25/2023 | 7,203 | 7,247,543 | |||||||||||
MX Holdings US, Inc., Term Loan B-1-B (1 mo. USD LIBOR + 2.75%) | 3.98 | % | 08/16/2023 | 2,786 | 2,799,546 | |||||||||||
North American Lifting Holdings, Inc., First Lien Term Loan (3 mo. USD LIBOR + 4.50%) | 5.80 | % | 11/27/2020 | 3,451 | 3,238,489 | |||||||||||
Rexnord LLC/ RBS Global, Inc., | ||||||||||||||||
Term Loan B (1 mo. USD LIBOR + 2.75%) | 4.01 | % | 08/21/2023 | 776 | 778,609 | |||||||||||
Term Loan B (3 mo. USD LIBOR + 2.75%) | 4.05 | % | 08/21/2023 | 7,583 | 7,610,617 | |||||||||||
Robertshaw US Holding Corp., | ||||||||||||||||
First Lien Term Loan (3 mo. USD LIBOR + 4.50%) | 5.75 | % | 08/15/2024 | 2,039 | 2,055,168 | |||||||||||
Second Lien Term Loan(e) | — | 02/15/2025 | 684 | 679,781 | ||||||||||||
Tank Holding Corp., Term Loan (3 mo. USD LIBOR + 4.25%) | 5.55 | % | 03/16/2022 | 1,091 | 1,096,007 | |||||||||||
Terex Corp., Incremental Term Loan (3 mo. USD LIBOR + 2.25%) | 3.51 | % | 01/31/2024 | 1,372 | 1,372,249 | |||||||||||
| 61,043,687 | ||||||||||||||||
| Insurance–0.64% | ||||||||||||||||
Alliant Holdings I, L.P., Term Loan (3 mo. USD LIBOR + 3.25%) | 4.56 | % | 08/14/2022 | 669 | 669,531 | |||||||||||
AmWINS Group, LLC, | ||||||||||||||||
First Lien Term Loan (1 mo. USD LIBOR + 2.75%) | 4.18 | % | 01/25/2024 | 5,028 | 5,041,831 | |||||||||||
Second Lien Term Loan (1 mo. USD LIBOR + 6.75%) | 7.98 | % | 01/25/2025 | 374 | 382,906 | |||||||||||
Hub International Ltd., | ||||||||||||||||
Term Loan (2 mo. USD LIBOR + 3.00%) | 4.26 | % | 10/02/2020 | 7 | 6,805 | |||||||||||
Term Loan (3 mo. USD LIBOR + 3.00%) | 4.31 | % | 10/02/2020 | 2,613 | 2,626,822 | |||||||||||
USI Inc., | ||||||||||||||||
Incremental Term Loan(e) | — | 05/16/2024 | 4,027 | 4,006,391 | ||||||||||||
Term Loan (6 mo. USD LIBOR + 3.00%) | 4.31 | % | 05/16/2024 | 4,371 | 4,354,985 | |||||||||||
| 17,089,271 | ||||||||||||||||
| Leisure Goods, Activities & Movies–3.05% | ||||||||||||||||
Alpha Topco Ltd. (United Kingdom), Term Loan B-3 (1 mo. USD LIBOR + 3.25%) | 4.50 | % | 02/01/2024 | 17,088 | 17,219,533 | |||||||||||
See accompanying Notes to Financial Statements which are an integral part of the financial statements.
20 Invesco Floating Rate Fund
| Interest Rate | Maturity Date | Principal Amount (000)(a) | Value | |||||||||||||
| Leisure Goods, Activities & Movies–(continued) | ||||||||||||||||
AMC Entertainment Inc., |
| |||||||||||||||
Incremental Term Loan (1 mo. USD LIBOR + 2.25%) | 3.48 | % | 12/15/2023 | $ | 4,397 | $ | 4,386,916 | |||||||||
Term Loan (1 mo. USD LIBOR + 2.25%) | 3.48 | % | 12/15/2022 | 3,594 | 3,583,484 | |||||||||||
Ancestry.com Operations Inc., First Lien Term Loan (1 mo. USD LIBOR + 3.25%) | 4.48 | % | 10/19/2023 | 510 | 513,933 | |||||||||||
Bright Horizons Family Solutions, Inc., Term Loan B (1 mo. USD LIBOR + 2.25%) | 3.48 | % | 11/07/2023 | 4,425 | 4,454,637 | |||||||||||
Cinemark USA, Inc., |
| |||||||||||||||
Term Loan (2 mo. USD LIBOR + 2.00%) | 3.27 | % | 05/09/2022 | 1,728 | 1,735,098 | |||||||||||
Term Loan (3 mo. USD LIBOR + 2.00%) | 3.23 | % | 05/09/2022 | 4 | 3,747 | |||||||||||
CWGS Group, LLC, Term Loan (1 mo. USD LIBOR + 3.75%) | 4.98 | % | 11/08/2023 | 6,880 | 6,941,397 | |||||||||||
Cyan Blue Holdco 3 Ltd. (Jersey), Term Loan B-2(e) | — | 07/30/2024 | 3,003 | 3,026,425 | ||||||||||||
Dorna Sports, S.L. (Spain), Term Loan B-2 (3 mo. USD LIBOR + 3.50%) | 5.02 | % | 04/12/2024 | 2,475 | 2,463,991 | |||||||||||
Equinox Holdings Inc., |
| |||||||||||||||
First Lien Term Loan (1 mo. USD LIBOR + 3.25%) | 4.48 | % | 03/08/2024 | 3,499 | 3,508,998 | |||||||||||
Second Lien Term Loan (1 mo. USD LIBOR + 7.00%) | 8.23 | % | 09/08/2024 | 362 | 369,711 | |||||||||||
Fitness International, LLC, Term Loan B (1 mo. USD LIBOR + 4.25%) | 5.48 | % | 07/01/2020 | 4,954 | 5,012,065 | |||||||||||
Fugue Finance B.V., Term Loan(e) | — | 06/30/2024 | EUR | 1,597 | 1,909,898 | |||||||||||
Intrawest Resorts Holdings, Inc., |
| |||||||||||||||
Term Loan B-1 (1 mo. USD LIBOR + 3.25%) | 4.48 | % | 07/31/2024 | 1,677 | 1,680,463 | |||||||||||
Term Loan B-2 (1 mo. USD LIBOR + 3.25%) | 4.48 | % | 07/31/2024 | 883 | 884,686 | |||||||||||
Lions Gate Entertainment Corp. (Canada), Term Loan B (1 mo. USD LIBOR + 3.00%) | 4.23 | % | 12/08/2023 | 505 | 510,226 | |||||||||||
Live Nation Entertainment, Inc., Term Loan B-3 (1 mo. USD LIBOR + 2.25%) | 3.50 | % | 10/31/2023 | 459 | 460,430 | |||||||||||
MTL Publishing LLC, Term Loan B-5 (1 mo. USD LIBOR + 2.50%) | 3.73 | % | 08/21/2023 | 4,557 | 4,574,880 | |||||||||||
Orbiter International S.a.r.l. (Luxembourg), Term Loan B-2(e) | — | 07/07/2024 | CHF | 1,039 | 1,104,691 | |||||||||||
Regal Cinemas Corp., Term Loan (1 mo. USD LIBOR + 2.00%) | 3.23 | % | 04/01/2022 | 5,172 | 5,136,924 | |||||||||||
Sabre GLBL Inc., Incremental Term Loan B-1(e) | — | 02/22/2024 | 626 | 628,984 | ||||||||||||
Shutterfly, Inc., Delayed Draw Term Loan B(f) | 0.00 | % | 08/17/2024 | 1,298 | 1,292,215 | |||||||||||
UFC Holdings, LLC, |
| |||||||||||||||
First Lien Term Loan (1 mo. USD LIBOR + 3.25%) | 4.48 | % | 08/18/2023 | 7,891 | 7,928,641 | |||||||||||
Second Lien Term Loan (1 mo. USD LIBOR + 7.50%) | 8.74 | % | 08/18/2024 | 2,441 | 2,497,730 | |||||||||||
| 81,829,703 | ||||||||||||||||
| Lodging & Casinos–3.14% | ||||||||||||||||
B&B Hotels S.A.S. (France), Term Loan B (3 mo. EURIBOR + 4.00%) | 4.25 | % | 03/14/2023 | EUR | 3,000 | 3,620,458 | ||||||||||
Belmond Interfin Ltd. (Bermuda), Term Loan (1 mo. USD LIBOR + 2.75%) | 3.98 | % | 07/03/2024 | 3,946 | 3,955,916 | |||||||||||
Boyd Gaming Corp., Term Loan B (1 wk. USD LIBOR + 2.50%) | 3.70 | % | 09/15/2023 | 2,140 | 2,147,208 | |||||||||||
Caesars Growth Properties Holdings, LLC, First Lien Term Loan (1 mo. USD LIBOR + 3.00%) | 4.23 | % | 05/08/2021 | 3,796 | 3,813,494 | |||||||||||
CityCenter Holdings, LLC, Term Loan B (1 mo. USD LIBOR + 2.50%) | 3.73 | % | 04/18/2024 | 2,121 | 2,128,885 | |||||||||||
Four Seasons Hotels Ltd. (Canada), Term Loan (1 mo. USD LIBOR + 2.50%) | 3.73 | % | 11/30/2023 | 5,116 | 5,145,881 | |||||||||||
Harrah’s Operating Co., Inc., Term Loan B-6 (1 mo. USD LIBOR + 1.50%)(i) | 1.50 | % | — | 10,785 | 13,035,968 | |||||||||||
Hilton Worldwide Finance, LLC, Term Loan B-2 (1 mo. USD LIBOR + 2.00%) | 3.23 | % | 10/25/2023 | 5,096 | 5,118,618 | |||||||||||
La Quinta Intermediate Holdings LLC, Term Loan (3 mo. USD LIBOR + 2.75%) | 4.05 | % | 04/14/2021 | 11,768 | 11,819,455 | |||||||||||
Las Vegas Sands, LLC/Venetian Casino Resort, LLC, Term Loan B (1 mo. USD LIBOR + 2.00%) | 3.23 | % | 03/29/2024 | 32 | 32,008 | |||||||||||
RHP Hotel Properties, LP, Term Loan B (3 mo. USD LIBOR + 2.25%) | 3.56 | % | 05/11/2024 | 1,683 | 1,693,172 | |||||||||||
Scientific Games International, Inc., |
| |||||||||||||||
Multicurrency Revolver Loan(f) | 0.00 | % | 10/18/2018 | 4,575 | 4,506,705 | |||||||||||
Term Loan B-4(e) | — | 08/14/2024 | 13,180 | 13,302,747 | ||||||||||||
Station Casinos LLC, Term Loan B (1 mo. USD LIBOR + 2.50%) | 3.74 | % | 06/08/2023 | 7,915 | 7,919,386 | |||||||||||
Twin River Management Group, Inc., Term Loan (3 mo. USD LIBOR + 3.50%) | 4.80 | % | 07/10/2020 | 6,076 | 6,132,576 | |||||||||||
| 84,372,477 | ||||||||||||||||
See accompanying Notes to Financial Statements which are an integral part of the financial statements.
21 Invesco Floating Rate Fund
| Interest Rate | Maturity Date | Principal Amount (000)(a) | Value | |||||||||||||
| Nonferrous Metals & Minerals–0.20% | ||||||||||||||||
American Rock Salt Co. LLC, |
| |||||||||||||||
First Lien Term Loan (1 mo. USD LIBOR + 3.75%) | 4.98 | % | 05/20/2021 | $ | 2,510 | $ | 2,515,168 | |||||||||
First Lien Term Loan (1 mo. USD LIBOR + 3.75%) | 4.98 | % | 05/20/2021 | 342 | 342,301 | |||||||||||
Dynacast International LLC, |
| |||||||||||||||
First Lien Term Loan B-2 (3 mo. USD LIBOR + 3.25%) | 4.55 | % | 01/28/2022 | 2,480 | 2,488,308 | |||||||||||
Second Lien Term Loan (3 mo. USD LIBOR + 8.50%)(d) | 9.80 | % | 01/30/2023 | 25 | 25,484 | |||||||||||
| 5,371,261 | ||||||||||||||||
| Oil & Gas–4.06% | ||||||||||||||||
Ascent Resources — Marcellus, LLC, First Lien Term Loan (1 mo. USD LIBOR + 4.25%) | 5.48 | % | 08/04/2020 | 5,196 | 3,494,382 | |||||||||||
BCP Raptor, LLC, Term Loan (2 mo. USD LIBOR + 4.25%) | 5.51 | % | 06/24/2024 | 4,132 | 4,171,145 | |||||||||||
Bronco Midstream Funding, LLC, Term Loan (3 mo. USD LIBOR + 4.00%) | 5.32 | % | 08/17/2020 | 4,936 | 5,000,640 | |||||||||||
California Resources Corp., Term Loan (1 mo. USD LIBOR + 10.38%) | 11.60 | % | 12/31/2021 | 4,004 | 4,257,508 | |||||||||||
Citgo Holdings, Inc., Term Loan (3 mo. USD LIBOR + 8.50%) | 9.80 | % | 05/12/2018 | 8,761 | 8,853,059 | |||||||||||
Citgo Petroleum Corp., Term Loan B (3 mo. USD LIBOR + 3.50%) | 4.80 | % | 07/29/2021 | 3,806 | 3,818,314 | |||||||||||
Crestwood Holdings LLC, Term Loan B-1 (1 mo. USD LIBOR + 8.00%) | 9.23 | % | 06/19/2019 | 5,353 | 5,346,094 | |||||||||||
Drillships Financing Holding Inc., Term Loan B-1(h)(i) | 0.00 | % | 03/31/2021 | 11,813 | 7,560,145 | |||||||||||
Fieldwood Energy LLC, |
| |||||||||||||||
Term Loan (3 mo. USD LIBOR + 2.88%) | 4.17 | % | 09/28/2018 | 366 | 344,204 | |||||||||||
Term Loan (3 mo. USD LIBOR + 7.00%) | 8.30 | % | 08/31/2020 | 8,364 | 7,778,909 | |||||||||||
Floatel International Ltd., Term Loan (3 mo. USD LIBOR + 5.00%) | 6.30 | % | 06/27/2020 | 7,465 | 5,542,558 | |||||||||||
Gulf Finance, LLC, Term Loan B (3 mo. USD LIBOR + 5.25%) | 6.55 | % | 08/25/2023 | 8,869 | 8,114,717 | |||||||||||
HGIM Corp., Term Loan B (3 mo. USD LIBOR + 4.50%) | 5.75 | % | 06/18/2020 | 8,460 | 3,553,354 | |||||||||||
Jonah Energy LLC, Second Lien Term Loan (1 mo. USD LIBOR + 6.50%) | 7.73 | % | 05/12/2021 | 3,533 | 3,483,946 | |||||||||||
Osum Production Corp. (Canada), Term Loan (3 mo. USD LIBOR + 5.50%) (Acquired 08/04/2014-05/04/2017; Cost $4,265,732)(d) | 6.80 | % | 07/31/2020 | 4,710 | 3,767,964 | |||||||||||
Pacific Drilling S.A. (Luxembourg), Term Loan (3 mo. USD LIBOR + 3.50%) | 4.75 | % | 06/03/2018 | 2,480 | 856,898 | |||||||||||
Paragon Offshore Finance Co.,(Cayman Islands) |
| |||||||||||||||
Term Loan (3 mo. USD LIBOR + 6.00%)(i) | 7.30 | % | 07/18/2022 | 156 | 131,115 | |||||||||||
Term Loan (Prime rate + 1.75%)(i) | 6.00 | % | 07/16/2021 | 26 | 9,852 | |||||||||||
Petroleum GEO-Services ASA, Term Loan (3 mo. USD LIBOR + 2.50%) | 3.80 | % | 03/19/2021 | 10,363 | 8,502,349 | |||||||||||
Seadrill Operating L.P., Term Loan (3 mo. USD LIBOR + 3.00%) | 4.30 | % | 02/21/2021 | 21,736 | 14,135,098 | |||||||||||
Southcross Energy Partners, L.P., Term Loan (3 mo. USD LIBOR + 4.25%) | 5.55 | % | 08/04/2021 | 1,841 | 1,628,127 | |||||||||||
Veresen Midstream US LLC, Term Loan B-2 (1 mo. USD LIBOR + 3.50%) | 4.73 | % | 03/31/2022 | 2,682 | 2,700,008 | |||||||||||
Weatherford International Ltd. (Bermuda), Term Loan (1 mo. USD LIBOR + 2.30%) | 3.54 | % | 07/13/2020 | 6,158 | 5,911,590 | |||||||||||
| 108,961,976 | ||||||||||||||||
| Publishing–1.59% | ||||||||||||||||
Ascend Learning, LLC, Term Loan (3 mo. USD LIBOR + 3.25%) | 4.53 | % | 07/12/2024 | 2,882 | 2,902,015 | |||||||||||
Getty Images, Inc., Revolver Loan(d)(f) | 0.00 | % | 10/18/2017 | 6,893 | 6,755,422 | |||||||||||
Merrill Communications LLC, Term Loan (3 mo. USD LIBOR + 5.25%) | 6.56 | % | 06/01/2022 | 81 | 81,949 | |||||||||||
Nielsen Finance LLC, Term Loan B-4 (1 mo. USD LIBOR + 2.00%) | 3.23 | % | 10/04/2023 | 19,225 | 19,264,361 | |||||||||||
ProQuest LLC, Term Loan (1 mo. USD LIBOR + 3.75%) | 4.98 | % | 10/24/2021 | 3,145 | 3,181,433 | |||||||||||
Tribune Media Co., Term Loan C (1 mo. USD LIBOR + 3.00%) | 4.23 | % | 01/27/2024 | 10,454 | 10,495,078 | |||||||||||
| 42,680,258 | ||||||||||||||||
| Radio & Television–1.87% | ||||||||||||||||
E.W. Scripps Co., Term Loan(e) | — | 10/04/2024 | 1,243 | 1,247,638 | ||||||||||||
Gray Television, Inc., Term Loan B-2 (1 mo. USD LIBOR + 2.50%) | 3.73 | % | 02/07/2024 | 618 | 619,726 | |||||||||||
iHeartCommunications, Inc., |
| |||||||||||||||
Term Loan D (1 mo. USD LIBOR + 6.75%) | 7.98 | % | 01/30/2019 | 15,666 | 12,616,604 | |||||||||||
Term Loan E (1 mo. USD LIBOR + 7.50%) | 8.73 | % | 07/31/2019 | 29,570 | 23,785,401 | |||||||||||
See accompanying Notes to Financial Statements which are an integral part of the financial statements.
22 Invesco Floating Rate Fund
| Interest Rate | Maturity Date | Principal Amount (000)(a) | Value | |||||||||||||
| Radio & Television–(continued) | ||||||||||||||||
Mission Broadcasting, Inc., Term Loan B-2 (1 mo. USD LIBOR + 2.50%)(e) | — | 01/17/2024 | $ | 27 | $ | 27,455 | ||||||||||
Nexstar Broadcasting, Inc., Term Loan B-2 (1 mo. USD LIBOR + 2.50%)(e) | — | 01/17/2024 | 219 | 219,303 | ||||||||||||
Raycom TV Broadcasting, LLC, Term Loan B(e) | — | 08/30/2024 | 3,590 | 3,617,124 | ||||||||||||
Sinclair Television Group, Inc., Term Loan B (1 mo. USD LIBOR + 2.25%) | 3.49 | % | 01/03/2024 | 8,135 | 8,157,084 | |||||||||||
| 50,290,335 | ||||||||||||||||
| Retailers (except Food & Drug)–4.15% | ||||||||||||||||
Action Holding B.V. (Netherlands), Term Loan B (3 mo. EURIBOR + 3.50%) | 3.50 | % | 02/25/2022 | EUR | 975 | 1,176,474 | ||||||||||
Bass Pro Group, LLC, | ||||||||||||||||
Term Loan (1 mo. USD LIBOR + 3.25%) | 4.48 | % | 06/05/2020 | 616 | 613,921 | |||||||||||
Term Loan (3 mo. USD LIBOR + 5.00%) | 6.30 | % | 12/16/2023 | 12,651 | 12,034,538 | |||||||||||
BJ’s Wholesale Club, Inc., Term Loan B (3 mo. USD LIBOR + 3.75%) | 4.97 | % | 02/03/2024 | 1,216 | 1,176,093 | |||||||||||
Burlington Coat Factory Warehouse Corp., Term Loan B-4 (1 mo. USD LIBOR + 2.75%) | 3.98 | % | 08/13/2021 | 1,950 | 1,959,750 | |||||||||||
CDW LLC, Term Loan (3 mo. USD LIBOR + 2.00%) | 3.30 | % | 08/17/2023 | 2,238 | 2,247,768 | |||||||||||
Cortefiel, S.A.,(Spain) | ||||||||||||||||
PIK Term Loan B-1, 1.00% PIK Rate, 4.25% Cash Rate(g) | 1.00 | % | 03/21/2018 | EUR | 1,055 | 1,258,969 | ||||||||||
PIK Term Loan B-2, 1.00% PIK Rate, 4.25% Cash Rate(g) | 1.00 | % | 03/21/2018 | EUR | 1,151 | 1,373,304 | ||||||||||
PIK Term Loan B-3, 1.00% PIK Rate, 4.25% Cash Rate(g) | 1.00 | % | 03/21/2018 | EUR | 534 | 637,336 | ||||||||||
PIK Term Loan B-3, 1.00% PIK Rate, 5.25% Cash Rate(g) | 1.00 | % | 03/21/2018 | EUR | 6,288 | 7,503,056 | ||||||||||
David’s Bridal, Inc., Term Loan (3 mo. USD LIBOR + 4.00%) | 5.30 | % | 10/11/2019 | 2,370 | 1,873,960 | |||||||||||
Fullbeauty Brands Holdings Corp., Term Loan (1 mo. USD LIBOR + 4.75%) | 5.98 | % | 10/14/2022 | 5,500 | 3,893,626 | |||||||||||
J. Crew Group, Inc., | ||||||||||||||||
Term Loan (1 mo. USD LIBOR + 3.22%) | 4.45 | % | 03/05/2021 | 281 | 165,229 | |||||||||||
Term Loan (3 mo. USD LIBOR + 3.22%) | 4.52 | % | 03/05/2021 | 419 | 246,632 | |||||||||||
Jill Acquisition LLC, Term Loan (3 mo. USD LIBOR + 5.00%) | 6.32 | % | 05/08/2022 | 854 | 840,767 | |||||||||||
Lands’ End, Inc., Term Loan B (1 mo. USD LIBOR + 3.25%) | 4.48 | % | 04/02/2021 | 5,258 | 4,311,841 | |||||||||||
Michaels Stores, Inc., Term Loan B-1 (1 mo. USD LIBOR + 2.75%) | 3.98 | % | 01/28/2023 | 737 | 736,263 | |||||||||||
Moran Foods LLC, Term Loan (1 mo. USD LIBOR + 6.00%) | 7.23 | % | 12/05/2023 | 3,373 | 3,221,426 | |||||||||||
National Vision, Inc., | ||||||||||||||||
First Lien Term Loan (1 mo. USD LIBOR + 3.00%) | 4.23 | % | 03/12/2021 | 1,857 | 1,864,727 | |||||||||||
First Lien Revolver Loan(d)(f) | 0.00 | % | 03/13/2019 | 3,004 | 2,763,997 | |||||||||||
Second Lien Term Loan (1 mo. USD LIBOR + 5.75%) | 6.98 | % | 03/13/2022 | 148 | 147,872 | |||||||||||
Party City Holdings Inc., Term Loan (3 mo. USD LIBOR + 3.00%) | 4.32 | % | 08/19/2022 | 1,914 | 1,919,576 | |||||||||||
Payless Inc., | ||||||||||||||||
DIP Term Loan (1 mo. USD LIBOR + 8.00%) (Acquired 05/17/2017; Cost $1,550,335) | 11.49 | % | 10/31/2017 | 1,550 | 1,552,195 | |||||||||||
Term Loan A-2 (1 mo. USD LIBOR + 9.00%)(d) | 10.23 | % | 08/10/2022 | 2,910 | 2,926,391 | |||||||||||
Petco Animal Supplies, Inc., Term Loan (3 mo. USD LIBOR + 3.00%) | 4.31 | % | 01/26/2023 | 5,318 | 4,501,891 | |||||||||||
Pier 1 Imports (U.S.), Inc., Term Loan (3 mo. USD LIBOR + 3.50%) | 4.80 | % | 04/30/2021 | 1,513 | 1,458,003 | |||||||||||
Sally Holdings, Inc., Term Loan B (1 mo. USD LIBOR + 2.50%) | 3.75 | % | 07/05/2024 | 1,637 | 1,649,243 | |||||||||||
Savers Inc., | ||||||||||||||||
Term Loan (2 mo. USD LIBOR + 3.75%) | 5.01 | % | 07/09/2019 | 13 | 12,283 | |||||||||||
Term Loan (3 mo. USD LIBOR + 3.75%) | 5.06 | % | 07/09/2019 | 4,987 | 4,667,489 | |||||||||||
Sears Roebuck Acceptance Corp., Term Loan (1 mo. USD LIBOR + 4.50%) | 5.73 | % | 06/30/2018 | 18,126 | 17,982,587 | |||||||||||
Staples, Inc., Term Loan(e) | — | 08/14/2024 | 7,185 | 7,157,947 | ||||||||||||
Toys ‘R’ US Property Co. I, LLC, Term Loan (1 mo. USD LIBOR + 5.00%) | 6.23 | % | 08/21/2019 | 12,695 | 11,869,445 | |||||||||||
Toys ‘R’ Us-Delaware, Inc., | ||||||||||||||||
Term Loan A-1 (3 mo. USD LIBOR + 7.25%) (Acquired 10/14/2014; | 8.56 | % | 10/24/2019 | 1,745 | 1,753,568 | |||||||||||
Term Loan A-1 (3 mo. USD LIBOR + 7.25%) (Acquired 10/14/2014; | 8.56 | % | 10/24/2019 | 2,164 | 2,174,424 | |||||||||||
Term Loan B-2 (3 mo. USD LIBOR + 3.75%) | 5.25 | % | 05/25/2018 | 89 | 85,398 | |||||||||||
Term Loan B-3 (3 mo. USD LIBOR + 3.75%) | 5.25 | % | 05/25/2018 | 25 | 24,499 | |||||||||||
See accompanying Notes to Financial Statements which are an integral part of the financial statements.
23 Invesco Floating Rate Fund
| Interest Rate | Maturity Date | Principal Amount (000)(a) | Value | |||||||||||||
| Retailers (except Food & Drug)–(continued) | ||||||||||||||||
Vivarte (France), PIK Term Loan (6 mo. EURIBOR + 4.00%) 7.00% PIK Rate, 4.00% Cash Rate(g) | 7.00 | % | 10/29/2019 | EUR | 1,488 | $ | 1,456,005 | |||||||||
| 111,238,493 | ||||||||||||||||
| Steel–0.04% | ||||||||||||||||
Atkore International, Inc., Incremental Term Loan (3 mo. USD LIBOR + 3.00%) | 4.30 | % | 12/22/2023 | $ | 1,093 | 1,098,798 | ||||||||||
| Surface Transport–0.95% | ||||||||||||||||
Kenan Advantage Group, Inc., | ||||||||||||||||
Term Loan (1 mo. USD LIBOR + 3.00%) | 4.23 | % | 07/29/2022 | 7,305 | 7,314,179 | |||||||||||
Term Loan (1 mo. USD LIBOR + 3.00%) | 4.23 | % | 07/29/2022 | 1,933 | 1,935,673 | |||||||||||
PODS LLC, Term Loan B-2 (1 mo. USD LIBOR + 3.25%) | 4.48 | % | 02/02/2022 | 6,205 | 6,253,711 | |||||||||||
Stena International S.A. (Luxembourg), Term Loan (3 mo. USD LIBOR + 3.00%) | 4.30 | % | 03/03/2021 | 4,545 | 4,009,069 | |||||||||||
U.S. Shipping Corp., Term Loan B-2 (1 mo. USD LIBOR + 4.25%) | 5.48 | % | 06/26/2021 | 3,264 | 2,855,981 | |||||||||||
XPO Logistics, Inc., Term Loan B (3 mo. USD LIBOR + 2.25%) | 3.55 | % | 11/01/2021 | 3,147 | 3,156,250 | |||||||||||
| 25,524,863 | ||||||||||||||||
| Telecommunications–6.75% | ||||||||||||||||
Avaya Inc., DIP Term Loan (1 mo. USD LIBOR + 7.50%) | 8.73 | % | 01/24/2018 | 1,995 | 2,032,770 | |||||||||||
CenturyLink, Inc., Term Loan B (1 mo. USD LIBOR + 2.75%) | 2.75 | % | 01/31/2025 | 20,906 | 20,500,488 | |||||||||||
Colorado Buyer Inc., Term Loan (3 mo. USD LIBOR + 3.00%) | 4.31 | % | 05/01/2024 | 3,657 | 3,680,235 | |||||||||||
Communications Sales & Leasing, Inc., Term Loan B (1 mo. USD LIBOR + 3.00%) | 4.23 | % | 10/24/2022 | 12,397 | 12,014,686 | |||||||||||
Consolidated Communications, Inc., Term Loan (1 mo. USD LIBOR + 3.00%) | 4.24 | % | 10/05/2023 | 17,435 | 17,165,121 | |||||||||||
Frontier Communications Corp., | ||||||||||||||||
Term Loan (1 mo. USD LIBOR + 2.75%) | 3.99 | % | 03/31/2021 | 5,359 | 5,151,506 | |||||||||||
Term Loan B-1 (1 mo. USD LIBOR + 3.75%) | 4.99 | % | 06/15/2024 | 1,832 | 1,758,235 | |||||||||||
GTT Communications, Inc., Term Loan B (1 mo. USD LIBOR + 3.25%) | 4.50 | % | 01/09/2024 | 4,148 | 4,175,825 | |||||||||||
Intelsat Jackson Holdings S.A., Term Loan B-2 (3 mo. USD LIBOR + 2.75%) | 4.00 | % | 06/30/2019 | 5,021 | 5,009,077 | |||||||||||
Level 3 Financing, Inc., Term Loan B (1 mo. USD LIBOR + 2.25%) | 3.49 | % | 02/22/2024 | 21,107 | 21,131,921 | |||||||||||
LTS Buyer LLC, First Lien Term Loan B (3 mo. USD LIBOR + 3.25%) | 4.55 | % | 04/13/2020 | 2,690 | 2,699,967 | |||||||||||
Radiate Holdco, LLC, Term Loan (1 mo. USD LIBOR + 3.00%) | 4.23 | % | 02/01/2024 | 5,720 | 5,653,455 | |||||||||||
SBA Senior Finance II LLC, | ||||||||||||||||
Incremental Term Loan B-1-A (1 mo. USD LIBOR + 2.25%) | 3.49 | % | 03/24/2021 | 582 | 584,318 | |||||||||||
Incremental Term Loan B-2 (1 mo. USD LIBOR + 2.25%) | 3.49 | % | 06/10/2022 | 3,798 | 3,809,919 | |||||||||||
Sprint Communications Inc., Term Loan (1 mo. USD LIBOR + 2.50%) | 3.75 | % | 02/02/2024 | 16,949 | 16,978,085 | |||||||||||
Syniverse Holdings, Inc., | ||||||||||||||||
Term Loan (3 mo. USD LIBOR + 3.00%) | 4.31 | % | 04/23/2019 | 6,285 | 6,060,195 | |||||||||||
Term Loan B (3 mo. USD LIBOR + 3.00%) | 4.30 | % | 04/23/2019 | 6,367 | 6,138,780 | |||||||||||
Telesat LLC, Term Loan B-4 (3 mo. USD LIBOR + 3.00%) | 4.30 | % | 11/17/2023 | 15,992 | 16,146,133 | |||||||||||
U.S. Telepacific Corp., Term Loan (3 mo. USD LIBOR + 5.00%) | 6.23 | % | 05/02/2023 | 6,896 | 6,741,267 | |||||||||||
Windstream Services, LLC, | ||||||||||||||||
Term Loan B-6 (1 mo. USD LIBOR + 4.00%) | 5.23 | % | 03/29/2021 | 13,318 | 12,252,147 | |||||||||||
Term Loan B-6 (2 mo. USD LIBOR + 4.00%) | 5.27 | % | 03/29/2021 | 34 | 30,942 | |||||||||||
Term Loan B-7 (2 mo. USD LIBOR + 3.25%) | 4.48 | % | 02/17/2024 | 2,644 | 2,330,068 | |||||||||||
Term Loan B-7 (2 mo. USD LIBOR + 3.25%) | 4.52 | % | 02/17/2024 | 7 | 5,869 | |||||||||||
Zayo Group, LLC, | ||||||||||||||||
Incremental Term Loan B-1 (1 mo. USD LIBOR + 2.00%) | 3.23 | % | 01/19/2021 | 1,782 | 1,784,624 | |||||||||||
Term Loan B-2 (1 mo. USD LIBOR + 2.25%) | 3.48 | % | 01/19/2024 | 7,228 | 7,245,070 | |||||||||||
| 181,080,703 | ||||||||||||||||
| Utilities–7.33% | ||||||||||||||||
AES Corp., (The), Term Loan (3 mo. USD LIBOR + 2.00%) | 3.32 | % | 05/24/2022 | 2,837 | 2,842,098 | |||||||||||
APLP Holdings L.P. (Canada), Term Loan (1 mo. USD LIBOR + 4.25%) | 5.48 | % | 04/13/2023 | 5,429 | 5,510,077 | |||||||||||
Aria Energy Operating LLC, Term Loan (1 mo. USD LIBOR + 4.50%) | 5.73 | % | 05/27/2022 | 1,305 | 1,312,806 | |||||||||||
See accompanying Notes to Financial Statements which are an integral part of the financial statements.
24 Invesco Floating Rate Fund
| Interest Rate | Maturity Date | Principal Amount (000)(a) | Value | |||||||||||||
| Utilities–(continued) | ||||||||||||||||
Calpine Construction Finance Co., L.P., | ||||||||||||||||
Term Loan B-1 (1 mo. USD LIBOR + 2.25%) | 3.49 | % | 05/03/2020 | $ | 776 | $ | 775,513 | |||||||||
Term Loan B-2 (1 mo. USD LIBOR + 2.50%) | 3.74 | % | 01/31/2022 | 12,017 | 12,004,211 | |||||||||||
Calpine Corp., | ||||||||||||||||
Term Loan (1 mo. USD LIBOR + 1.75%) | 2.99 | % | 11/30/2017 | 5,734 | 5,734,703 | |||||||||||
Term Loan (1 mo. USD LIBOR + 1.75%) | 2.99 | % | 12/31/2019 | 3,137 | 3,132,694 | |||||||||||
Term Loan (3 mo. USD LIBOR + 2.75%) | 4.05 | % | 01/15/2024 | 6,110 | 6,099,596 | |||||||||||
Term Loan (3 mo. USD LIBOR + 2.75%) | 4.05 | % | 01/15/2024 | 8,401 | 8,392,595 | |||||||||||
Term Loan B-7 (3 mo. USD LIBOR + 2.75%) | 4.05 | % | 05/31/2023 | 3,372 | 3,368,187 | |||||||||||
Dynegy Inc., Term Loan C-1 (1 mo. USD LIBOR + 3.25%) | 4.48 | % | 02/07/2024 | 17,651 | 17,704,150 | |||||||||||
Eastern Power, LLC, Term Loan (1 mo. USD LIBOR + 3.75%) | 5.23 | % | 10/02/2023 | 7,692 | 7,718,534 | |||||||||||
Energy Future Intermediate Holding Co. LLC, DIP Term Loan (1 mo. USD LIBOR + 3.00%) | 4.23 | % | 06/30/2018 | 15,292 | 15,379,878 | |||||||||||
Granite Acquisition, Inc., | ||||||||||||||||
First Lien Term Loan B (3 mo. USD LIBOR + 4.00%) | 5.30 | % | 12/17/2021 | 5,437 | 5,485,943 | |||||||||||
First Lien Term Loan C (3 mo. USD LIBOR + 4.00%) | 5.30 | % | 12/17/2021 | 243 | 245,309 | |||||||||||
Second Lien Term Loan B (3 mo. USD LIBOR + 7.25%) | 8.55 | % | 12/19/2022 | 1,019 | 1,023,061 | |||||||||||
Lightstone Holdco LLC, | ||||||||||||||||
Term Loan B (1 mo. USD LIBOR + 4.50%) | 5.73 | % | 01/30/2024 | 8,986 | 8,950,503 | |||||||||||
Term Loan C (1 mo. USD LIBOR + 4.50%) | 5.73 | % | 01/30/2024 | 560 | 557,707 | |||||||||||
Nautilus Power, LLC, Term Loan (1 mo. USD LIBOR + 4.50%) | 5.73 | % | 05/16/2024 | 3,802 | 3,833,262 | |||||||||||
NRG Energy Inc., | ||||||||||||||||
Revolver Loan A(d)(f) | 0.00 | % | 07/01/2018 | 41,372 | 41,040,557 | |||||||||||
Term Loan (3 mo. USD LIBOR + 2.25%) | 3.55 | % | 06/30/2023 | 12,700 | 12,702,662 | |||||||||||
Pike Corp., | ||||||||||||||||
Second Lien Term Loan (1 mo. USD LIBOR + 8.00%) | 9.24 | % | 09/10/2024 | 246 | 250,040 | |||||||||||
Term Loan (1 mo. USD LIBOR + 3.75%) | 4.99 | % | 03/10/2024 | 1,261 | 1,275,490 | |||||||||||
Southeast PowerGen LLC, Term Loan B (3 mo. USD LIBOR + 3.50%) | 4.80 | % | 12/02/2021 | 1,311 | 1,259,833 | |||||||||||
Talen Energy Supply, LLC, Term Loan B-1 (1 mo. USD LIBOR + 4.00%) | 5.23 | % | 07/15/2023 | 257 | 253,690 | |||||||||||
USIC Holding, Inc., Term Loan B (3 mo. USD LIBOR + 3.50%) | 4.92 | % | 12/08/2023 | 5,984 | 6,015,973 | |||||||||||
Vistra Operations Co. LLC, | ||||||||||||||||
Incremental Term Loan (1 mo. USD LIBOR + 2.75%) | 3.98 | % | 12/14/2023 | 1,934 | 1,939,093 | |||||||||||
Term Loan (1 mo. USD LIBOR + 2.75%) | 3.98 | % | 08/04/2023 | 17,859 | 17,886,623 | |||||||||||
Term Loan C (1 mo. USD LIBOR + 2.75%) | 3.98 | % | 08/04/2023 | 4,094 | 4,099,905 | |||||||||||
| 196,794,693 | ||||||||||||||||
Total Variable Rate Senior Loan Interests | 2,429,757,132 | |||||||||||||||
Bonds & Notes–4.54% | ||||||||||||||||
| Air Transport–0.24% | ||||||||||||||||
LATAM Airlines Group S.A. (Chile) | 4.50 | % | 08/15/2025 | 867 | 864,203 | |||||||||||
Mesa Airlines, Inc. (Acquired 11/25/2015; Cost $5,538,861)(j) | 5.75 | % | 07/15/2025 | 5,539 | 5,663,485 | |||||||||||
| 6,527,688 | ||||||||||||||||
| Automotive–0.30% | ||||||||||||||||
Federal-Mogul Holdings Corp.(j) | 5.00 | % | 07/15/2024 | EUR | 892 | 1,020,575 | ||||||||||
Federal-Mogul Holdings Corp. (3 mo. EURIBOR + 4.88%)(j)(k) | 4.88 | % | 04/15/2024 | EUR | 2,000 | 2,351,616 | ||||||||||
Schaeffler AG (Germany)(j) | 4.13 | % | 09/15/2021 | 1,066 | 1,080,128 | |||||||||||
Schaeffler AG (Germany)(j) | 4.50 | % | 09/15/2023 | 1,066 | 1,087,320 | |||||||||||
Schaeffler AG (Germany)(j) | 4.75 | % | 09/15/2026 | 1,965 | 1,987,106 | |||||||||||
Superior Industries International, Inc.(j) | 6.00 | % | 06/15/2025 | EUR | 535 | 590,780 | ||||||||||
| 8,117,525 | ||||||||||||||||
| Business Equipment & Services–0.32% | ||||||||||||||||
Dream Secured Bondco AB (Sweden) (3 mo. EURIBOR + 7.25%)(j)(k) | 8.25 | % | 10/21/2023 | EUR | 2,775 | 3,336,403 | ||||||||||
See accompanying Notes to Financial Statements which are an integral part of the financial statements.
25 Invesco Floating Rate Fund
| Interest Rate | Maturity Date | Principal Amount (000)(a) | Value | |||||||||||||
| Business Equipment & Services–(continued) | ||||||||||||||||
Dream Secured Bondco AB (Sweden) (3 mo. STIBOR + 7.25%)(j)(k) | 8.25 | % | 10/21/2023 | SEK | 2,112 | $ | 267,696 | |||||||||
ICBPI (United Kingdom) (6 mo. EURIBOR + 8.00%)(j)(k) | 8.00 | % | 05/30/2021 | EUR | 2,250 | 2,725,115 | ||||||||||
West Corp.(j) | 4.75 | % | 07/15/2021 | $ | 2,140 | 2,182,800 | ||||||||||
| 8,512,014 | ||||||||||||||||
| Cable & Satellite Television–1.03% | ||||||||||||||||
Altice Financing S.A. (Luxembourg)(j) | 6.63 | % | 02/15/2023 | 851 | 899,933 | |||||||||||
Altice Financing S.A. (Luxembourg)(j) | 7.50 | % | 05/15/2026 | 10,469 | 11,463,555 | |||||||||||
Altice US Finance I Corp.(j) | 5.50 | % | 05/15/2026 | 10,933 | 11,561,647 | |||||||||||
Numericable-SFR S.A. (France)(j) | 6.00 | % | 05/15/2022 | 555 | 584,138 | |||||||||||
Numericable-SFR S.A. (France)(j) | 7.38 | % | 05/01/2026 | 1,889 | 2,040,120 | |||||||||||
Virgin Media Investment Holdings Ltd. (United Kingdom)(j) | 5.50 | % | 08/15/2026 | 1,027 | 1,086,052 | |||||||||||
| 27,635,445 | ||||||||||||||||
| Chemicals & Plastics–0.14% | ||||||||||||||||
Hexion Specialty Chemicals, Inc. | 6.63 | % | 04/15/2020 | 3,966 | 3,628,890 | |||||||||||
| Containers & Glass Products–0.29% | ||||||||||||||||
Ardagh Glass Finance PLC(j) | 4.25 | % | 09/15/2022 | 1,695 | 1,739,494 | |||||||||||
Ardagh Glass Finance PLC(j) | 4.63 | % | 05/15/2023 | 1,643 | 1,690,236 | |||||||||||
Horizon Holdings III (France)(j) | 8.25 | % | 02/15/2022 | EUR | 1,532 | 1,953,710 | ||||||||||
Reynolds Group Holdings Inc. | 5.75 | % | 10/15/2020 | 634 | 645,888 | |||||||||||
Reynolds Group Holdings Inc. (3 mo. USD LIBOR + 3.50%)(j)(k) | 4.80 | % | 07/15/2021 | 1,868 | 1,905,360 | |||||||||||
| 7,934,688 | ||||||||||||||||
| Electronics & Electrical–0.24% | ||||||||||||||||
Blackboard Inc.(j) | 9.75 | % | 10/15/2021 | 4,356 | 3,963,960 | |||||||||||
Dell International LLC(j) | 5.45 | % | 06/15/2023 | 1,385 | 1,517,352 | |||||||||||
Micron Technology, Inc. | 7.50 | % | 09/15/2023 | 940 | 1,044,575 | |||||||||||
| 6,525,887 | ||||||||||||||||
| Financial Intermediaries–0.62% | ||||||||||||||||
Cabot Financial S.A. (Luxembourg)(j) | 6.50 | % | 04/01/2021 | GBP | 2,000 | 2,672,930 | ||||||||||
Garfunkelux Holdco 3 S.A. (Luxembourg)(j) | 7.50 | % | 08/01/2022 | EUR | 2,221 | 2,834,490 | ||||||||||
Garfunkelux Holdco 3 S.A. (Luxembourg)(j) | 11.00 | % | 11/01/2023 | GBP | 2,132 | 2,992,864 | ||||||||||
Garfunkelux Holdco 3 S.A. (Luxembourg) (3 mo. EURIBOR + 5.50%)(j)(k) | 5.50 | % | 10/01/2021 | EUR | 2,415 | 2,928,843 | ||||||||||
Nemean Bondco PLC (United Kingdom)(j) | 7.38 | % | 02/01/2024 | GBP | 1,361 | 1,693,998 | ||||||||||
Nemean Bondco PLC (United Kingdom) (3 mo. GBP LIBOR + 6.50%)(j)(k) | 6.79 | % | 02/01/2023 | GBP | 2,042 | 2,564,333 | ||||||||||
Promontoria MCS (France) (3 mo. EURIBOR + 5.75%)(j)(k) | 5.75 | % | 09/30/2021 | EUR | 707 | 896,348 | ||||||||||
| 16,583,806 | ||||||||||||||||
| Health Care–0.45% | ||||||||||||||||
Care UK Health & Social Care PLC (United Kingdom) (3 mo. GBP LIBOR + 5.00%)(j)(k) | 5.29 | % | 07/15/2019 | GBP | 2,954 | 3,801,790 | ||||||||||
DJO Finance LLC(j) | 8.13 | % | 06/15/2021 | 1,973 | 1,879,283 | |||||||||||
DJO Finance LLC | 10.75 | % | 04/15/2020 | 5,087 | 4,444,766 | |||||||||||
IDH Finance PLC (United Kingdom) (3 mo. GBP LIBOR + 6.00%)(j)(k) | 6.28 | % | 08/15/2022 | GBP | 1,500 | 1,832,970 | ||||||||||
| 11,958,809 | ||||||||||||||||
| Insurance–0.12% | ||||||||||||||||
Domestic & General Group Ltd. (United Kingdom) (3 mo. GBP LIBOR + 5.00%)(j)(k) | 5.28 | % | 11/15/2019 | GBP | 2,450 | 3,183,937 | ||||||||||
| Lodging & Casinos–0.12% | ||||||||||||||||
ESH Hospitality, Inc.(j) | 5.25 | % | 05/01/2025 | 1,390 | 1,440,388 | |||||||||||
Travelodge Hotels Ltd. (United Kingdom) (3 mo. GBP LIBOR + 4.88%)(j)(k) | 5.15 | % | 05/15/2023 | GBP | 1,400 | 1,835,975 | ||||||||||
| 3,276,363 | ||||||||||||||||
See accompanying Notes to Financial Statements which are an integral part of the financial statements.
26 Invesco Floating Rate Fund
| Interest Rate | Maturity Date | Principal Amount (000)(a) | Value | |||||||||||||
| Nonferrous Metals & Minerals–0.15% | ||||||||||||||||
TiZir Ltd. (United Kingdom)(d)(j) | 9.50 | % | 07/19/2022 | $ | 4,107 | $ | 4,112,134 | |||||||||
| Oil & Gas–0.04% | ||||||||||||||||
Pacific Drilling S.A. (Luxembourg)(j) | 5.38 | % | 06/01/2020 | 2,798 | 993,290 | |||||||||||
| Radio & Television–0.20% | ||||||||||||||||
Clear Channel International B.V.(j) | 8.75 | % | 12/15/2020 | 5,141 | 5,385,197 | |||||||||||
| Retailers (except Food & Drug)–0.07% | ||||||||||||||||
Claire’s Stores Inc.(j) | 6.13 | % | 03/15/2020 | 1,210 | 553,575 | |||||||||||
TWIN SET — Simona Barbieri S.p.A. (Italy) (3 mo. EURIBOR + 5.88%)(j)(k) | 5.54 | % | 07/15/2019 | EUR | 1,092 | 1,297,494 | ||||||||||
| 1,851,069 | ||||||||||||||||
| Steel–0.00% | ||||||||||||||||
ERP Iron Ore, LLC, 8.00% PIK Rate (Acquired 01/30/2017-03/31/2017; Cost $20,804)(d)(g)(j)(k) | 8.00 | % | 12/31/2019 | 78 | 5,463 | |||||||||||
| Telecommunications–0.21% | ||||||||||||||||
Communications Sales & Leasing, Inc.(j) | 6.00 | % | 04/15/2023 | 1,200 | 1,203,000 | |||||||||||
Communications Sales & Leasing, Inc.(j) | 7.13 | % | 12/15/2024 | 371 | 346,421 | |||||||||||
Goodman Networks Inc. | 8.00 | % | 05/11/2022 | 2,668 | 2,254,589 | |||||||||||
Wind Telecomunicazioni S.p.A. (Italy)(j) | 6.50 | % | 04/30/2020 | 256 | 265,600 | |||||||||||
Wind Telecomunicazioni S.p.A. (Italy)(j) | 7.38 | % | 04/23/2021 | 1,422 | 1,480,658 | |||||||||||
Windstream Services, LLC | 6.38 | % | 08/01/2023 | 17 | 13,218 | |||||||||||
| 5,563,486 | ||||||||||||||||
Total Bonds & Notes | 121,795,691 | |||||||||||||||
Structured Products–1.06% | ||||||||||||||||
Apidos CLO X, Series 2012-10A, Class E (3 mo. USD LIBOR + 6.25%)(j)(k) | 7.56 | % | 10/30/2022 | 918 | 920,892 | |||||||||||
Apidos CLO X, Series 2012-10X, Class E, REGS (3 mo. USD LIBOR + 6.25%)(j)(k) | 7.42 | % | 10/30/2022 | 2,190 | 2,196,900 | |||||||||||
Atrium X LLC (3 mo. USD LIBOR + 4.50%)(j)(k) | 5.80 | % | 07/16/2025 | 600 | 601,670 | |||||||||||
Clontarf Park CLO (Ireland) (3 mo. EURIBOR + 5.10%)(j)(k) | 5.10 | % | 08/05/2030 | EUR | 387 | 454,894 | ||||||||||
Gallatin Funding CLO VII, Ltd. (3 mo. USD LIBOR + 5.67%)(j)(k) | 6.97 | % | 07/15/2023 | 3,068 | 3,085,310 | |||||||||||
Highbridge Loan Management, Ltd. (3 mo. USD LIBOR + 5.45%)(j)(k) | 6.76 | % | 05/05/2027 | 500 | 489,521 | |||||||||||
ING Investment Management CLO IV, Ltd. (3 mo. USD LIBOR + 4.25%)(j)(k) | 5.56 | % | 06/14/2022 | 293 | 295,041 | |||||||||||
ING Investment Management CLO, Ltd., Series 2013-1A, Class D (3 mo. USD LIBOR + 5.00%)(j)(k) | 6.30 | % | 04/15/2024 | 1,455 | 1,461,703 | |||||||||||
ING Investment Management CLO, Ltd., Series 2013-3A, Class D (3 mo. USD LIBOR + 4.50%)(j)(k) | 5.80 | % | 01/18/2026 | 2,501 | 2,460,916 | |||||||||||
KKR Financial CLO, Ltd. (3 mo. USD LIBOR + 5.50%)(j)(k) | 6.75 | % | 12/15/2024 | 1,359 | 1,365,896 | |||||||||||
Madison Park Funding XIV, Ltd. (3 mo. USD LIBOR + 5.40%)(j)(k) | 6.71 | % | 07/20/2026 | 1,915 | 1,821,154 | |||||||||||
NewStar Berkeley Fund CLO LLC (3 mo. USD LIBOR + 5.10%)(j)(k) | 6.41 | % | 10/25/2028 | 2,899 | 2,925,692 | |||||||||||
NewStar Commercial Loan Funding (3 mo. USD LIBOR + 5.50%)(j)(k) | 6.66 | % | 01/20/2027 | 1,000 | 1,005,095 | |||||||||||
Octagon Investment Partners XIX, Ltd. (3 mo. USD LIBOR + 4.85%)(j)(k) | 6.15 | % | 04/15/2026 | 2,920 | 2,861,730 | |||||||||||
Octagon Investment Partners XVII Ltd. (3 mo. USD LIBOR + 4.50%)(j)(k) | 5.66 | % | 10/25/2025 | 1,975 | 1,965,153 | |||||||||||
Octagon Investment Partners XVIII, Ltd. (3 mo. USD LIBOR + 5.25%)(j)(k) | 6.56 | % | 12/16/2024 | 2,359 | 2,370,663 | |||||||||||
Regatta IV Funding Ltd. (3 mo. USD LIBOR + 4.95%)(j)(k) | 6.26 | % | 07/25/2026 | 1,153 | 1,129,950 | |||||||||||
Symphony CLO VIII, Ltd. (3 mo. USD LIBOR + 6.00%)(j)(k) | 7.30 | % | 01/09/2023 | 1,156 | 1,162,056 | |||||||||||
Total Structured Products | 28,574,236 | |||||||||||||||
| Shares | ||||||||||||||||
Common Stocks & Other Equity Interests–1.35%(l) | ||||||||||||||||
| Aerospace & Defense–0.09% | ||||||||||||||||
IAP Worldwide Services (Acquired 07/18/2014-08/18/2014; Cost $145,528)(d)(j)(m) | 134 | 2,467,412 | ||||||||||||||
See accompanying Notes to Financial Statements which are an integral part of the financial statements.
27 Invesco Floating Rate Fund
| Shares | Value | |||||||||||||||
| Automotive–0.01% | ||||||||||||||||
Dayco Products, LLC (Acquired 06/16/2006-02/18/2014; Cost $1,275,974)(j)(m) | 3,266 | $ | 98,797 | |||||||||||||
Dayco Products, LLC(j)(m) | 3,261 | 98,645 | ||||||||||||||
Transtar Holding Co. , Class A (j)(m) | 3,149,478 | 173,221 | ||||||||||||||
| 370,663 | ||||||||||||||||
| Building & Development–0.00% | ||||||||||||||||
Lake at Las Vegas Joint Venture, LLC , Class A (Acquired 04/28/2010-07/15/2010; | 518 | 0 | ||||||||||||||
Lake at Las Vegas Joint Venture, LLC , Class B (Acquired 06/30/2010; Cost $3,408,940)(d)(j)(m) | 4 | 0 | ||||||||||||||
| 0 | ||||||||||||||||
| Building Products–0.07% | ||||||||||||||||
Masonite International Corp. (Canada)(m) | 27,093 | 1,714,987 | ||||||||||||||
| Business Equipment & Services–0.01% | ||||||||||||||||
EmployBridge Holding Co.(j)(m) | 43,971 | 329,782 | ||||||||||||||
| Cable & Satellite Television–0.12% | ||||||||||||||||
ION Media Networks, Inc.(d) | 4,471 | 3,128,538 | ||||||||||||||
| Chemicals & Plastics–0.00% | ||||||||||||||||
Lyondell Chemical Co. , Class A | 218 | 19,749 | ||||||||||||||
| Drugs–0.00% | ||||||||||||||||
BPA Laboratories , Class A, Wts. expiring 04/29/2024 (Acquired 04/29/2014; Cost $0)(d)(j)(m) | 3,490 | 0 | ||||||||||||||
BPA Laboratories , Class B, Wts. expiring 04/29/2024 (Acquired 04/29/2014; Cost $0)(d)(j)(m) | 5,595 | 0 | ||||||||||||||
| 0 | ||||||||||||||||
| Food Products–0.00% | ||||||||||||||||
QCE LLC (Acquired 06/30/2014; Cost $52)(d)(j)(m) | 17 | 0 | ||||||||||||||
| Forest Products–0.02% | ||||||||||||||||
Verso Corp. , Class A(m) | 113,805 | 605,443 | ||||||||||||||
Xerium Technologies, Inc.(m) | 1,766 | 10,684 | ||||||||||||||
| 616,127 | ||||||||||||||||
| Health Care–0.01% | ||||||||||||||||
New Millennium Holdco(j)(m) | 259,087 | 275,409 | ||||||||||||||
| Leisure Goods, Activities & Movies–0.00% | ||||||||||||||||
AMF Bowling Centers, Inc.(d)(m) | 1,665 | 85,748 | ||||||||||||||
| Lodging & Casinos–0.07% | ||||||||||||||||
Twin River Management Group, Inc.(j)(m) | 18,663 | 1,726,327 | ||||||||||||||
| Nonferrous Metals & Minerals–0.14% | ||||||||||||||||
Arch Coal, Inc. | 46,749 | 3,733,843 | ||||||||||||||
| Oil & Gas–0.28% | ||||||||||||||||
Ameriforge Group Inc.(j)(m) | 1,051 | 28,377 | ||||||||||||||
CJ Holding Co.(m) | 47,780 | 1,206,923 | ||||||||||||||
Paragon Offshore Finance Co. (Cayman Islands)(i)(j)(m) | 4,595 | 67,202 | ||||||||||||||
Paragon Offshore Finance Co. (Cayman Islands) , Class A(i)(j)(m) | 4,595 | 3,561 | ||||||||||||||
Paragon Offshore Finance Co. (Cayman Islands) , Class B(i)(j)(m) | 2,298 | 39,066 | ||||||||||||||
Samson Investment Co.(j)(m) | 261,209 | 6,073,109 | ||||||||||||||
| 7,418,238 | ||||||||||||||||
See accompanying Notes to Financial Statements which are an integral part of the financial statements.
28 Invesco Floating Rate Fund
| Shares | Value | |||||||||||||||
| Publishing–0.05% | ||||||||||||||||
F&W Publications, Inc. (Acquired 09/17/2007-11/19/2009; Cost $357,143)(d)(j)(m) | 288 | $ | 29 | |||||||||||||
Merrill Communications LLC , Class A(j)(m) | 133,776 | 1,237,428 | ||||||||||||||
Tronc, Inc.(m) | 2,262 | 32,821 | ||||||||||||||
| 1,270,278 | ||||||||||||||||
| Retailers (except Food & Drug)–0.17% | ||||||||||||||||
Payless Inc.(j)(m) | 146,073 | 4,448,618 | ||||||||||||||
| Surface Transport–0.00% | ||||||||||||||||
U.S. Shipping Corp. (Acquired 09/28/2007-09/30/2009; Cost $87,805)(d)(j)(m) | 87,805 | 74,634 | ||||||||||||||
U.S. Shipping Corp. (Acquired 09/28/2007-09/30/2009; Cost $0)(d)(j)(m) | 6,189 | 62 | ||||||||||||||
| 74,696 | ||||||||||||||||
| Telecommunications–0.02% | ||||||||||||||||
Consolidated Communications, Inc. | 32,797 | 605,105 | ||||||||||||||
Goodman Networks Inc.(d)(m) | 159,473 | 0 | ||||||||||||||
| 605,105 | ||||||||||||||||
| Utilities–0.29% | ||||||||||||||||
Bicent Power, LLC , Series A, Wts. expiring 08/21/2022 (Acquired 08/21/2012; Cost $0)(d)(j)(m) | 101 | 0 | ||||||||||||||
Bicent Power, LLC , Series B, Wts. expiring 08/21/2022 (Acquired 08/21/2012; Cost $0)(d)(j)(m) | 164 | 0 | ||||||||||||||
Vistra Operations Co. LLC | 410,978 | 7,274,310 | ||||||||||||||
Vistra Operations Co. LLC (Acquired 10/03/2016; Cost $316,284)(d)(j)(m) | 672,945 | 100,942 | ||||||||||||||
Vistra Operations Co. LLC, Rts.(j)(m) | 410,978 | 431,527 | ||||||||||||||
| 7,806,779 | ||||||||||||||||
Total Common Stocks & Other Equity Interests | 36,092,299 | |||||||||||||||
Preferred Stocks–0.01%(l) | ||||||||||||||||
| Retailers (except Food & Drug)–0.00% | ||||||||||||||||
Vivarte (Acquired 01/06/2016-02/16/2017; Cost $0) (France)(d)(j)(m) | 1,297 | 0 | ||||||||||||||
| Telecommunications–0.01% | ||||||||||||||||
Goodman Networks Inc. (Acquired 05/31/2017; Cost $1,897)(d)(j)(m) | 189,735 | 284,602 | ||||||||||||||
Total Preferred Stocks | 284,602 | |||||||||||||||
Money Market Funds–6.09% | ||||||||||||||||
Government & Agency Portfolio–Institutional Class, 0.93%(n) | 98,046,176 | 98,046,176 | ||||||||||||||
Treasury Portfolio–Institutional Class, 0.90%(n) | 65,364,117 | 65,364,117 | ||||||||||||||
Total Money Market Funds | 163,410,293 | |||||||||||||||
TOTAL INVESTMENTS IN SECURITIES–103.62% (Cost $2,824,634,763) | 2,779,914,253 | |||||||||||||||
OTHER ASSETS LESS LIABILITIES–(3.77)% | (97,208,693 | ) | ||||||||||||||
NET ASSETS–100.00% | $ | 2,682,705,560 | ||||||||||||||
Investment Abbreviations:
| CLO | – Collateralized Loan Obligation | |
| DIP | – Debtor-in-possession | |
| EUR | – Euro | |
| EURIBOR | – Euro Interbank Offered Rate | |
| GBP | – British Pound Sterling | |
| LIBOR | – London Interbank Offered Rate | |
| PIK | – Pay-in-Kind | |
| REGS | – Regulation S | |
| Rts. | – Rights | |
| SEK | – Swedish Krona | |
| USD | – United States Dollar | |
| Wts. | – Warrants |
See accompanying Notes to Financial Statements which are an integral part of the financial statements.
29 Invesco Floating Rate Fund
Notes to Schedule of Investments:
| (a) | Principal amount are denominated in U.S. Dollars unless otherwise noted. |
| (b) | Variable rate senior loan interests are, at present, not readily marketable, not registered under the Securities Act of 1933, as amended (the “1933 Act”), and may be subject to contractual and legal restrictions on sale. Variable rate senior loan interests in the Fund’s portfolio generally have variable rates which adjust to a base, such as the London Interbank Offered Rate (“LIBOR”), on set dates, typically every 30 days but not greater than one year; and/or have interest rates that float at a margin above a widely recognized base lending rate such as the Prime Rate of a designated U.S. bank. |
| (c) | Variable rate senior loan interests often require prepayments from excess cash flow or permit the borrower to repay at its election. The degree to which borrowers repay, whether as a contractual requirement or at their election, cannot be predicted with accuracy. As a result, the actual remaining maturity may be substantially less than the stated maturities shown. However, it is anticipated that the variable rate senior loan interests will have an expected average life of three to five years. |
| (d) | Security valued using significant unobservable inputs (Level 3). See Note 3. |
| (e) | This variable rate interest will settle after August 31, 2017, at which time the interest rate will be determined. |
| (f) | All or a portion of this holding is subject to unfunded loan commitments. Interest rate will be determined at the time of funding. See Note 8. |
| (g) | All or a portion of this security is Pay-in-Kind. Pay-in-Kind securities pay interest income in the form of securities. |
| (h) | Defaulted security. Currently, the issuer is in default with respect to principal and/or interest payments. The aggregate value of these securities at August 31, 2017 was $7,753,620, which represented less than 1% of the Fund’s Net Assets. |
| (i) | The borrower has filed for protection in federal bankruptcy court. |
| (j) | Security purchased or received in a transaction exempt from registration under the 1933 Act. The security may be resold pursuant to an exemption from registration under the 1933 Act, typically to qualified institutional buyers. The aggregate value of these securities at August 31, 2017 was $155,432,548, which represented 5.79% of the Fund’s Net Assets. |
| (k) | Interest or dividend rate is redetermined periodically. Rate shown is the rate in effect on August 31, 2017. |
| (l) | Acquired through the restructuring of senior loans. |
| (m) | Non-income producing security. |
| (n) | The money market fund and the Fund are affiliated by having the same investment adviser. The rate shown is the 7-day SEC standardized yield as of August 31, 2017. |
| Open Forward Foreign Currency Contracts | ||||||||||||||||||||||
Settlement Date
| Contract to | Unrealized Appreciation (Depreciation) | ||||||||||||||||||||
| Counterparty | Deliver | Receive | ||||||||||||||||||||
09/15/2017 | Canadian Imperial Bank of Commerce | USD | 35,725,730 | EUR | 30,404,877 | $ | 488,303 | |||||||||||||||
09/15/2017 | Citigroup Global Markets Inc. | USD | 35,771,338 | EUR | 30,404,877 | 442,696 | ||||||||||||||||
09/15/2017 | Citigroup Global Markets Inc. | USD | 9,280,898 | GBP | 7,211,826 | 47,762 | ||||||||||||||||
09/15/2017 | Citigroup Global Markets Inc. | USD | 797,119 | SEK | 6,543,663 | 26,876 | ||||||||||||||||
09/15/2017 | JPMorgan Chase Bank, N.A. | USD | 1,160,939 | CHF | 1,114,720 | 2,245 | ||||||||||||||||
09/15/2017 | JPMorgan Chase Bank, N.A. | USD | 36,632,413 | EUR | 31,200,420 | 529,160 | ||||||||||||||||
09/15/2017 | JPMorgan Chase Bank, N.A. | USD | 13,229,766 | GBP | 10,236,778 | 11,738 | ||||||||||||||||
09/15/2017 | RBC Capital Markets Corp. | USD | 9,287,858 | GBP | 7,211,826 | 40,802 | ||||||||||||||||
10/16/2017 | Barclays Bank PLC | USD | 12,814,587 | EUR | 10,748,464 | 9,052 | ||||||||||||||||
10/16/2017 | Citigroup Global Markets Inc. | USD | 10,182 | SEK | 80,806 | 12 | ||||||||||||||||
10/16/2017 | Goldman Sachs International | USD | 2,598,559 | GBP | 2,007,175 | 560 | ||||||||||||||||
Subtotal | 1,599,206 | |||||||||||||||||||||
09/15/2017 | Barclays Bank PLC | EUR | 30,324,783 | USD | 34,753,839 | (1,364,798 | ) | |||||||||||||||
09/15/2017 | Barclays Bank PLC | GBP | 7,958,929 | USD | 10,278,281 | (16,775 | ) | |||||||||||||||
09/15/2017 | Citigroup Global Markets Inc. | EUR | 1,035,825 | USD | 1,211,501 | (22,229 | ) | |||||||||||||||
09/15/2017 | Citigroup Global Markets Inc. | GBP | 8,742,571 | USD | 11,301,090 | (7,624 | ) | |||||||||||||||
09/15/2017 | Citigroup Global Markets Inc. | SEK | 6,543,663 | USD | 780,608 | (43,388 | ) | |||||||||||||||
09/15/2017 | Goldman Sachs International | CHF | 1,114,720 | USD | 1,159,006 | (4,179 | ) | |||||||||||||||
09/15/2017 | Goldman Sachs International | EUR | 30,324,783 | USD | 34,730,368 | (1,388,269 | ) | |||||||||||||||
09/15/2017 | JPMorgan Chase Bank, N.A. | GBP | 7,958,929 | USD | 10,277,882 | (17,173 | ) | |||||||||||||||
09/15/2017 | RBC Capital Markets Corp. | EUR | 30,324,783 | USD | 34,735,068 | (1,383,569 | ) | |||||||||||||||
10/16/2017 | Canadian Imperial Bank of Commerce | EUR | 30,688,288 | USD | 36,120,115 | (493,073 | ) | |||||||||||||||
10/16/2017 | Citigroup Global Markets Inc. | EUR | 30,688,288 | USD | 36,165,380 | (447,808 | ) | |||||||||||||||
10/16/2017 | Citigroup Global Markets Inc. | GBP | 7,237,499 | USD | 9,323,781 | (48,157 | ) | |||||||||||||||
10/16/2017 | Citigroup Global Markets Inc. | SEK | 2,202,061 | USD | 271,886 | (5,891 | ) | |||||||||||||||
10/16/2017 | JPMorgan Chase Bank, N.A. | CHF | 1,113,341 | USD | 1,161,875 | (2,249 | ) | |||||||||||||||
10/16/2017 | JPMorgan Chase Bank, N.A. | EUR | 31,585,052 | USD | 37,147,811 | (535,276 | ) | |||||||||||||||
10/16/2017 | JPMorgan Chase Bank, N.A. | GBP | 7,237,341 | USD | 9,324,873 | (46,861 | ) | |||||||||||||||
10/16/2017 | RBC Capital Markets Corp. | GBP | 7,237,499 | USD | 9,330,838 | (41,100 | ) | |||||||||||||||
Subtotal | (5,868,419 | ) | ||||||||||||||||||||
Total Forward Foreign Currency Contracts — Currency Risk |
| $ | (4,269,213 | ) | ||||||||||||||||||
Currency Abbreviations:
| CHF | – Swiss Franc | |
| GBP | – British Pound Sterling |
| USD | – U.S. Dollar | |
| EUR | – Euro |
| SEK | – Swedish Krona |
See accompanying Notes to Financial Statements which are an integral part of the financial statements.
30 Invesco Floating Rate Fund
Statement of Assets and Liabilities
August 31, 2017
Assets: |
| |||
Investments in securities, at value (Cost $2,661,224,470) | $ | 2,616,503,960 | ||
Investments in affiliated money market funds, at value and cost | 163,410,293 | |||
Other investments: | ||||
Unrealized appreciation on forward foreign currency contracts outstanding | 1,599,206 | |||
Cash | 19,656,735 | |||
Foreign currencies, at value (Cost $36,891,685) | 37,040,165 | |||
Receivable for: | ||||
Investments sold | 88,796,932 | |||
Interest and fees | 10,767,129 | |||
Fund shares sold | 4,313,926 | |||
Investments matured (Cost $334,144) | 76,857 | |||
Fund expenses absorbed | 14,137 | |||
Investment for trustee deferred compensation and retirement plans | 174,486 | |||
Other assets | 174,585 | |||
Total assets | 2,942,528,411 | |||
Liabilities: |
| |||
Other investments: | ||||
Unrealized depreciation on forward foreign currency contracts outstanding | 5,868,419 | |||
Payable for: | ||||
Investments purchased | 165,000,596 | |||
Fund shares repurchased | 4,895,808 | |||
Income distributions | 2,446,176 | |||
Accrued fees to affiliates | 1,001,341 | |||
Accrued trustees’ and officers’ fees and benefits | 8,084 | |||
Accrued other operating expenses | 177,867 | |||
Trustee deferred compensation and retirement plans | 197,365 | |||
Unfunded loan commitments | 80,227,195 | |||
Total liabilities | 259,822,851 | |||
Net assets applicable to common shares | $ | 2,682,705,560 | ||
Net assets consist of: |
| |||
Shares of beneficial interest | $ | 2,826,888,943 | ||
Undistributed net investment income | 2,303,732 | |||
Undistributed net realized gain (loss) | (97,025,884 | ) | ||
Net unrealized appreciation (depreciation) | (49,461,231 | ) | ||
| $ | 2,682,705,560 | |||
Net Assets: |
| |||
Class A | $ | 630,740,056 | ||
Class C | $ | 448,408,211 | ||
Class R | $ | 6,344,757 | ||
Class Y | $ | 977,034,261 | ||
Class R5 | $ | 2,829,570 | ||
Class R6 | $ | 617,348,705 | ||
Shares outstanding, no par value |
| |||
Class A | 83,439,869 | |||
Class C | 59,586,702 | |||
Class R | 838,066 | |||
Class Y | 129,425,307 | |||
Class R5 | 373,995 | |||
Class R6 | 81,784,606 | |||
Class A: | ||||
Net asset value per share | $ | 7.56 | ||
Maximum offering price per share | ||||
(Net asset value of $7.56 ¸ 97.50%) | $ | 7.75 | ||
Class C: | ||||
Net asset value and offering price per share | $ | 7.53 | ||
Class R: | ||||
Net asset value and offering price per share | $ | 7.57 | ||
Class Y: | ||||
Net asset value and offering price per share | $ | 7.55 | ||
Class R5: | ||||
Net asset value and offering price per share | $ | 7.57 | ||
Class R6: | ||||
Net asset value and offering price per share | $ | 7.55 | ||
See accompanying Notes to Financial Statements which are an integral part of the financial statements.
31 Invesco Floating Rate Fund
Statement of Operations
For the year ended August 31, 2017
Investment income: |
| |||
Interest | $ | 125,104,197 | ||
Dividends | 2,233,695 | |||
Dividends from affiliated money market funds | 1,141,721 | |||
Other income | 4,522,493 | |||
Total investment income | 133,002,106 | |||
Expenses: | ||||
Advisory fees | 15,869,189 | |||
Administrative services fees | 513,416 | |||
Custodian fees | 520,371 | |||
Distribution fees: | ||||
Class A | 1,680,350 | |||
Class C | 3,483,549 | |||
Class R | 31,955 | |||
Interest, facilities and maintenance fees | 1,265,000 | |||
Transfer agent fees — A, C, R & Y | 1,910,867 | |||
Transfer agent fees — R5 | 2,268 | |||
Transfer agent fees — R6 | 5,711 | |||
Trustees’ and officers’ fees and benefits | 57,692 | |||
Registration and filing fees | 168,539 | |||
Reports to shareholders | 339,371 | |||
Professional services fees | 121,991 | |||
Other | 115,445 | |||
Total expenses | 26,085,714 | |||
Less: Fees waived and expense offset arrangement(s) | (290,764 | ) | ||
Net expenses | 25,794,950 | |||
Net investment income | 107,207,156 | |||
Realized and unrealized gain (loss): | ||||
Net realized gain (loss) from: | ||||
Investment securities | (11,183,190 | ) | ||
Foreign currencies | 5,215,342 | |||
Forward foreign currency contracts | (7,528,379 | ) | ||
| (13,496,227 | ) | |||
Change in net unrealized appreciation (depreciation) of: | ||||
Investment securities | 61,150,560 | |||
Foreign currencies | (191,030 | ) | ||
Forward foreign currency contracts | (3,930,483 | ) | ||
| 57,029,047 | ||||
Net realized and unrealized gain | 43,532,820 | |||
Net increase in net assets resulting from operations | $ | 150,739,976 | ||
See accompanying Notes to Financial Statements which are an integral part of the financial statements.
32 Invesco Floating Rate Fund
Statement of Changes in Net Assets
For the years ended August 31, 2017 and 2016
| 2017 | 2016 | |||||||
Operations: |
| |||||||
Net investment income | $ | 107,207,156 | $ | 100,423,191 | ||||
Net realized gain (loss) | (13,496,227 | ) | (58,736,860 | ) | ||||
Change in net unrealized appreciation | 57,029,047 | 7,086,275 | ||||||
Net increase in net assets resulting from operations | 150,739,976 | 48,772,606 | ||||||
Distributions to shareholders from net investment income: | ||||||||
Class A | (27,737,345 | ) | (35,012,324 | ) | ||||
Class C | (16,826,364 | ) | (21,796,463 | ) | ||||
Class R | (247,214 | ) | (450,487 | ) | ||||
Class Y | (38,225,858 | ) | (33,862,982 | ) | ||||
Class R5 | (98,540 | ) | (151,599 | ) | ||||
Class R6 | (25,504,368 | ) | (9,532,850 | ) | ||||
Total distributions to shareholders from net investment income | (108,639,689 | ) | (100,806,705 | ) | ||||
Share transactions–net: | ||||||||
Class A | (43,392,863 | ) | (169,750,741 | ) | ||||
Class C | (18,228,070 | ) | (98,187,058 | ) | ||||
Class R | 45,256 | (5,472,147 | ) | |||||
Class Y | 317,204,901 | (135,895,729 | ) | |||||
Class R5 | 941,260 | (1,498,437 | ) | |||||
Class R6 | 52,459,670 | 454,477,973 | ||||||
Net increase in net assets resulting from share transactions | 309,030,154 | 43,673,861 | ||||||
Net increase (decrease) in net assets | 351,130,441 | (8,360,238 | ) | |||||
Net assets applicable to common shares: | ||||||||
Beginning of period | 2,331,575,119 | 2,339,935,357 | ||||||
End of period (includes undistributed net investment income of $2,303,732 and $(462,456), respectively) | $ | 2,682,705,560 | $ | 2,331,575,119 | ||||
See accompanying Notes to Financial Statements which are an integral part of the financial statements.
33 Invesco Floating Rate Fund
Statement of Cash Flows
For the year ended August 31, 2017
Cash provided by operating activities: | ||||
Net increase in net assets resulting from operations applicable to common shares | $ | 150,739,976 | ||
Adjustments to reconcile net increase in net assets to net cash provided by (used in) operating activities: |
| |||
Purchases of investments | (2,132,856,049 | ) | ||
Proceeds from sales of investments | 1,698,060,179 | |||
Net change in unfunded loan commitments | 51,963,642 | |||
Net change in transactions in foreign currency contracts | 3,930,483 | |||
Increase in interest receivables and other assets | 2,681,368 | |||
Amortization of premium and accretion of discount on investment securities | (9,465,911 | ) | ||
Decrease in accrued expenses and other payables | (20,403 | ) | ||
Net realized loss from investment securities | 11,183,190 | |||
Net change in unrealized appreciation on investment securities | (61,150,560 | ) | ||
Net cash provided by (used in) operating activities | (284,934,085 | ) | ||
Cash provided by financing activities: | ||||
Dividends paid to shareholders | (24,835,902 | ) | ||
Proceeds from shares of beneficial interest sold | 1,195,435,484 | |||
Disbursements from shares of beneficial interest reacquired | (964,602,027 | ) | ||
Net cash provided by financing activities | 205,997,555 | |||
Net increase (decrease) in cash and cash equivalents | (78,936,530 | ) | ||
Cash and cash equivalents at beginning of period | 299,043,723 | |||
Cash and cash equivalents at end of period | $ | 220,107,193 | ||
Non-cash financing activities: | ||||
Value of shares of beneficial interest issued in reinvestment of dividends paid to shareholders | 83,248,046 | |||
Supplemental disclosure of cash flow information: | ||||
Cash paid during the period for interest, facilities and maintenance fees | $ | 1,265,000 | ||
Notes to Financial Statements
August 31, 2017
NOTE 1—Significant Accounting Policies
Invesco Floating Rate Fund (the “Fund”) is a series portfolio of AIM Counselor Series Trust (Invesco Counselor Series Trust) (the “Trust”). The Trust is a Delaware statutory trust registered under the Investment Company Act of 1940, as amended (the “1940 Act”), as an open-end series management investment company consisting of fourteen separate portfolios, each authorized to issue an unlimited number of shares of beneficial interest. The assets, liabilities and operations of each portfolio are accounted for separately. Information presented in these financial statements pertains only to the Fund. Matters affecting each portfolio or class will be voted on exclusively by the shareholders of such portfolio or class.
The Fund’s investment objective is total return, comprised of current income and capital appreciation.
The Fund currently consists of six different classes of shares: Class A, Class C, Class R, Class Y, Class R5 and Class R6. Class Y shares are available only to certain investors. Class A shares are sold with a front-end sales charge unless certain waiver criteria are met and under certain circumstances load waived shares may be subject to contingent deferred sales charges (“CDSC”). Class C shares are sold with a CDSC. Class R, Class Y, Class R5 and Class R6 shares are sold at net asset value.
The Fund is an investment company and accordingly follows the investment company accounting and reporting guidance in accordance with Financial Accounting Standards Board Accounting Standards Codification Topic 946, Financial Services — Investment Companies.
The following is a summary of the significant accounting policies followed by the Fund in the preparation of its financial statements.
| A. | Security Valuations — Variable rate senior loan interests are fair valued using quotes provided by an independent pricing service. Quotes provided by the pricing service may reflect appropriate factors such as ratings, tranche type, industry, company performance, spread, individual trading characteristics, institution-size trading in similar groups of securities and other market data. |
Securities, including restricted securities, are valued according to the following policy. A security listed or traded on an exchange (except convertible securities) is valued at its last sales price as of the close of the customary trading session on the exchange where the security is principally traded, or lacking any sales on a particular day, the security may be valued at the closing bid price on that day. Securities traded in the over-the-counter market (but not securities reported on the NASDAQ Stock Exchange) are valued based on the prices furnished by independent pricing services, in which case the securities may be considered fair valued, or by market makers. Each security reported on the NASDAQ Stock Exchange is valued at the NASDAQ Official Closing Price (“NOCP”) as of the close of the customary trading session on the valuation date or absent a NOCP, at the closing bid price.
34 Invesco Floating Rate Fund
Futures contracts are valued at the final settlement price set by an exchange on which they are principally traded. Listed options are valued at the mean between the last bid and the asked prices from the exchange on which they are principally traded. Options not listed on an exchange are valued by an independent source at the mean between the last bid and asked prices. For purposes of determining net asset value (“NAV”) per share, futures and option contracts generally are valued 15 minutes after the close of the customary trading session of the New York Stock Exchange (“NYSE”).
Investments in open-end and closed-end registered investment companies that do not trade on an exchange are valued at the end-of-day net asset value per share. Investments in open-end and closed-end registered investment companies that trade on an exchange are valued at the last sales price or official closing price as of the close of the customary trading session on the exchange where the security is principally traded.
Debt obligations (including convertible securities) and unlisted equities are fair valued using an evaluated quote provided by an independent pricing service. Evaluated quotes provided by the pricing service may be determined without exclusive reliance on quoted prices, and may reflect appropriate factors such as institution-size trading in similar groups of securities, developments related to specific securities, dividend rate (for unlisted equities), yield (for debt obligations), quality, type of issue, coupon rate (for debt obligations), maturity (for debt obligations), individual trading characteristics and other market data. Pricing services generally value debt obligations assuming orderly transactions of institutional round lot size, but a Fund may hold or transact in the same securities in smaller, odd lot sizes. Odd lots often trade at lower prices than institutional round lots. Debt obligations are subject to interest rate and credit risks. In addition, all debt obligations involve some risk of default with respect to interest and/or principal payments.
Swap agreements are fair valued using an evaluated quote, if available, provided by an independent pricing service. Evaluated quotes provided by the pricing service are valued based on a model which may include end-of-day net present values, spreads, ratings, industry, company performance and returns of referenced assets. Centrally cleared swap agreements are valued at the daily settlement price determined by the relevant exchange or clearinghouse.
Foreign securities’ (including foreign exchange contracts) prices are converted into U.S. dollar amounts using the applicable exchange rates as of the close of the NYSE. If market quotations are available and reliable for foreign exchange-traded equity securities, the securities will be valued at the market quotations. Because trading hours for certain foreign securities end before the close of the NYSE, closing market quotations may become unreliable. If between the time trading ends on a particular security and the close of the customary trading session on the NYSE, events occur that the investment adviser determines are significant and make the closing price unreliable, the Fund may fair value the security. If the event is likely to have affected the closing price of the security, the security will be valued at fair value in good faith using procedures approved by the Board of Trustees. Adjustments to closing prices to reflect fair value may also be based on a screening process of an independent pricing service to indicate the degree of certainty, based on historical data, that the closing price in the principal market where a foreign security trades is not the current value as of the close of the NYSE. Foreign securities’ prices meeting the approved degree of certainty that the price is not reflective of current value will be priced at the indication of fair value from the independent pricing service. Multiple factors may be considered by the independent pricing service in determining adjustments to reflect fair value and may include information relating to sector indices, American Depositary Receipts and domestic and foreign index futures. Foreign securities may have additional risks including exchange rate changes, potential for sharply devalued currencies and high inflation, political and economic upheaval, the relative lack of issuer information, relatively low market liquidity and the potential lack of strict financial and accounting controls and standards.
Securities for which market prices are not provided by any of the above methods may be valued based upon quotes furnished by independent sources. The last bid price may be used to value equity securities. The mean between the last bid and asked prices is used to value debt obligations, including corporate loans.
Securities for which market quotations are not readily available or became unreliable are valued at fair value as determined in good faith by or under the supervision of the Trust’s officers following procedures approved by the Board of Trustees. Issuer specific events, market trends, bid/asked quotes of brokers and information providers and other market data may be reviewed in the course of making a good faith determination of a security’s fair value.
The Fund may invest in securities that are subject to interest rate risk, meaning the risk that the prices will generally fall as interest rates rise and, conversely, the prices will generally rise as interest rates fall. Specific securities differ in their sensitivity to changes in interest rates depending on their individual characteristics. Changes in interest rates may result in increased market volatility, which may affect the value and/or liquidity of certain Fund investments.
Valuations change in response to many factors including the historical and prospective earnings of the issuer, the value of the issuer’s assets, general economic conditions, interest rates, investor perceptions and market liquidity. Because of the inherent uncertainties of valuation, the values reflected in the financial statements may materially differ from the value received upon actual sale of those investments.
| B. | Securities Transactions and Investment Income — Securities transactions are accounted for on a trade date basis. Realized gains or losses on sales are computed on the basis of specific identification of the securities sold. Interest income (net of withholding tax, if any) is recorded on the accrual basis from the settlement date. Bond premiums and discounts are amortized and/or accreted over the lives of the respective securities. Pay-in-kind income received in the form of securities in-lieu of cash is recorded as interest income. Facility fees received may be amortized over the life of the loan. Dividend income (net of withholding tax, if any) is recorded on the ex-dividend date. |
The Fund may periodically participate in litigation related to Fund investments. As such, the Fund may receive proceeds from litigation settlements. Any proceeds received are included in the Statement of Operations as realized gain (loss) for investments no longer held and as unrealized gain (loss) for investments still held.
Other income is comprised primarily of amendment fees which are recorded when received. Amendment fees are received in return for changes in the terms of the loan or note.
Brokerage commissions and mark ups are considered transaction costs and are recorded as an increase to the cost basis of securities purchased and/or a reduction of proceeds on a sale of securities. Such transaction costs are included in the determination of net realized and unrealized gain (loss) from investment securities reported in the Statement of Operations and the Statement of Changes in Net Assets and the net realized and unrealized gains (losses) on securities per share in the Financial Highlights. Transaction costs are included in the calculation of the Fund’s net asset value and, accordingly, they reduce the Fund’s total returns. These transaction costs are not considered operating expenses and are not reflected in net investment income reported in the Statement of Operations and the Statement of Changes in Net Assets, or the net
35 Invesco Floating Rate Fund
investment income per share and the ratios of expenses and net investment income reported in the Financial Highlights, nor are they limited by any expense limitation arrangements between the Fund and the investment adviser.
The Fund allocates realized and unrealized capital gains and losses to a class based on the relative net assets of each class. The Fund allocates income to a class based on the relative value of the settled shares of each class.
| C. | Country Determination — For the purposes of making investment selection decisions and presentation in the Schedule of Investments, the investment adviser may determine the country in which an issuer is located and/or credit risk exposure based on various factors. These factors include the laws of the country under which the issuer is organized, where the issuer maintains a principal office, the country in which the issuer derives 50% or more of its total revenues and the country that has the primary market for the issuer’s securities, as well as other criteria. Among the other criteria that may be evaluated for making this determination are the country in which the issuer maintains 50% or more of its assets, the type of security, financial guarantees and enhancements, the nature of the collateral and the sponsor organization. Country of issuer and/or credit risk exposure has been determined to be the United States of America, unless otherwise noted. |
| D. | Distributions — Distributions from net investment income, if any, are declared daily and paid monthly. Distributions from net realized capital gain, if any, are generally declared and paid annually and recorded on the ex-dividend date. The Fund may elect to treat a portion of the proceeds from redemptions as distributions for federal income tax purposes. |
| E. | Federal Income Taxes — The Fund intends to comply with the requirements of Subchapter M of the Internal Revenue Code of 1986, as amended (the “Internal Revenue Code”), necessary to qualify as a regulated investment company and to distribute substantially all of the Fund’s taxable earnings to shareholders. As such, the Fund will not be subject to federal income taxes on otherwise taxable income (including net realized capital gain) that is distributed to shareholders. Therefore, no provision for federal income taxes is recorded in the financial statements. |
The Fund recognizes the tax benefits of uncertain tax positions only when the position is more likely than not to be sustained. Management has analyzed the Fund’s uncertain tax positions and concluded that no liability for unrecognized tax benefits should be recorded related to uncertain tax positions. Management is not aware of any tax positions for which it is reasonably possible that the total amounts of unrecognized tax benefits will change materially in the next 12 months.
The Fund files tax returns in the U.S. Federal jurisdiction and certain other jurisdictions. Generally, the Fund is subject to examinations by such taxing authorities for up to three years after the filing of the return for the tax period.
| F. | Expenses — Fees provided for under the Rule 12b-1 plan of a particular class of the Fund are charged to the operations of such class. Transfer agency fees and expenses and other shareholder recordkeeping fees and expenses attributable to Class R5 and Class R6 are allocated to each share class based on relative net assets. Sub-accounting fees attributable to Class R5 are charged to the operations of the class. Transfer agency fees and expenses and other shareholder recordkeeping fees and expenses relating to all other classes are allocated among those classes based on relative net assets. All other expenses are allocated among the classes based on relative net assets. |
| G. | Interest, Facilities and Maintenance Fees — Interest, Facilities and Maintenance Fees include interest and related borrowing costs such as commitment fees and other expenses associated with lines of credit and interest and administrative expenses related to establishing and maintaining the credit agreement. |
| H. | Accounting Estimates — The preparation of financial statements in conformity with accounting principles generally accepted in the United States of America (“GAAP”) requires management to make estimates and assumptions that affect the reported amounts of assets and liabilities at the date of the financial statements and the reported amounts of revenues and expenses during the reporting period including estimates and assumptions related to taxation. Actual results could differ from those estimates by a significant amount. In addition, the Fund monitors for material events or transactions that may occur or become known after the period-end date and before the date the financial statements are released to print. |
| I. | Indemnifications — Under the Trust’s organizational documents, each Trustee, officer, employee or other agent of the Trust is indemnified against certain liabilities that may arise out of the performance of their duties to the Fund. Additionally, in the normal course of business, the Fund enters into contracts, including the Fund’s servicing agreements, that contain a variety of indemnification clauses. The Fund’s maximum exposure under these arrangements is unknown as this would involve future claims that may be made against the Fund that have not yet occurred. The risk of material loss as a result of such indemnification claims is considered remote. |
| J. | Cash and Cash Equivalents — For the purposes of the Statement of Cash Flows, the Fund defines Cash and Cash Equivalents as cash (including foreign currency), money market funds and other investments held in lieu of cash and excludes investments made with cash collateral received. |
| K. | Securities Purchased on a When-Issued and Delayed Delivery Basis — The Fund may purchase and sell interests in corporate loans and corporate debt securities and other portfolio securities on a when-issued and delayed delivery basis, with payment and delivery scheduled for a future date. No income accrues to the Fund on such interests or securities in connection with such transactions prior to the date the Fund actually takes delivery of such interests or securities. These transactions are subject to market fluctuations and are subject to the risk that the value at delivery may be more or less than the trade date purchase price. Although the Fund will generally purchase these securities with the intention of acquiring such securities, they may sell such securities prior to the settlement date. |
| L. | Foreign Currency Translations — Foreign currency is valued at the close of the NYSE based on quotations posted by banks and major currency dealers. Portfolio securities and other assets and liabilities denominated in foreign currencies are translated into U.S. dollar amounts at date of valuation. Purchases and sales of portfolio securities (net of foreign taxes withheld on disposition) and income items denominated in foreign currencies are translated into U.S. dollar amounts on the respective dates of such transactions. The Fund does not separately account for the portion of the results of operations resulting from changes in foreign exchange rates on investments and the fluctuations arising from changes in market prices of securities held. The combined results of changes in foreign exchange rates and the fluctuation of market prices on investments (net of estimated foreign tax withholding) are included with the net realized and unrealized gain or loss from investments in the Statement of Operations. Reported net realized foreign currency gains or losses arise from (1) sales of foreign currencies, (2) currency gains or losses realized between the trade and settlement dates on securities transactions, and (3) the difference between the amounts of dividends, interest, and foreign withholding taxes recorded on the Fund’s books and the U.S. dollar equivalent of the amounts actually received or paid. Net unrealized foreign currency gains and losses arise from changes in the fair values of assets and liabilities, other than investments in securities at fiscal period end, resulting from changes in exchange rates. |
36 Invesco Floating Rate Fund
The Fund may invest in foreign securities, which may be subject to foreign taxes on income, gains on investments or currency repatriation, a portion of which may be recoverable. Foreign taxes, if any, are recorded based on the tax regulations and rates that exist in the foreign markets in which the Fund invests and are shown in the Statement of Operations.
| M. | Forward Foreign Currency Contracts — The Fund may engage in foreign currency transactions either on a spot (i.e. for prompt delivery and settlement) basis, or through forward foreign currency contracts, to manage or minimize currency or exchange rate risk. |
The Fund may also enter into forward foreign currency contracts for the purchase or sale of a security denominated in a foreign currency in order to “lock in” the U.S. dollar price of that security, or the Fund may also enter into forward foreign currency contracts that do not provide for physical settlement of the two currencies, but instead are settled by a single cash payment calculated as the difference between the agreed upon exchange rate and the spot rate at settlement based upon an agreed upon notional amount (non-deliverable forwards). The Fund will set aside liquid assets in an amount equal to the daily mark-to-market obligation for forward foreign currency contracts.
A forward foreign currency contract is an obligation between two parties (“Counterparties”) to purchase or sell a specific currency for an agreed-upon price at a future date. The use of forward foreign currency contracts does not eliminate fluctuations in the price of the underlying securities the Fund owns or intends to acquire but establishes a rate of exchange in advance. Fluctuations in the value of these contracts are measured by the difference in the contract date and reporting date exchange rates and are recorded as unrealized appreciation (depreciation) until the contracts are closed. When the contracts are closed, realized gains (losses) are recorded. Realized and unrealized gains (losses) on the contracts are included in the Statement of Operations. The primary risks associated with forward foreign currency contracts include failure of the Counterparty to meet the terms of the contract and the value of the foreign currency changing unfavorably. These risks may be in excess of the amounts reflected in the Statement of Assets and Liabilities.
| N. | Industry Focus — To the extent that the Fund invests a greater amount of its assets in securities of issuers in the banking and financial services industries, the Fund’s performance will depend to a greater extent on the overall condition of those industries. The value of these securities can be sensitive to changes in government regulation, interest rates and economic downturns in the U.S. and abroad. |
| O. | Bank Loan Risk — Although the resale, or secondary market for floating rate loans has grown substantially over the past decade, both in overall size and number of market participants, there is no organized exchange or board of trade on which floating rate loans are traded. Instead, the secondary market for floating rate loans is a private, unregulated interdealer or interbank resale market. Such a market may therefore be subject to irregular trading activity, wide bid/ask spreads, and extended trade settlement periods, which may impair the Fund’s ability to sell bank loans within its desired time frame or at an acceptable price and its ability to accurately value existing and prospective investments. Extended trade settlement periods may result in cash not being immediately available to the Fund. As a result, the Fund may have to sell other investments or engage in borrowing transactions to raise cash to meet its obligations. Similar to other asset classes, bank loan funds may be exposed to counterparty credit risk, or the risk than an entity with which the Fund has unsettled or open transactions may fail to or be unable to perform on its commitments. The Fund seeks to manage counterparty credit risk by entering into transactions only with counterparties that it believes have the financial resources to honor their obligations and by monitoring the financial stability of those counterparties. |
| P. | Other Risks — The Fund may invest all or substantially all of its assets in senior secured floating rate loans and senior secured debt securities that are determined to be rated below investment grade. These securities are generally considered to have speculative characteristics and are subject to greater risk of loss of principal and interest than higher rated securities. The value of lower quality debt securities and floating rate loans can be more volatile due to increased sensitivity to adverse issuer, political, regulatory, market or economic developments. |
The Fund invests in corporate loans from U.S. or non-U.S. companies (the “Borrowers”). The investment of the Fund in a corporate loan may take the form of participation interests or assignments. If the Fund purchases a participation interest from a syndicate of lenders (“Lenders”) or one of the participants in the syndicate (“Participant”), one or more of which administers the loan on behalf of all the Lenders (the “Agent Bank”), the Fund would be required to rely on the Lender that sold the participation interest not only for the enforcement of the Fund’s rights against the Borrower but also for the receipt and processing of payments due to the Fund under the corporate loans. As such, the Fund is subject to the credit risk of the Borrower and the Participant. Lenders and Participants interposed between the Fund and a Borrower, together with Agent Banks, are referred to as “Intermediate Participants”.
| Q. | Leverage Risk — The Fund may utilize leverage to seek to enhance the yield of the Fund by borrowing. There are risks associated with borrowing in an effort to increase the yield and distributions on the shares, including that the costs of the financial leverage may exceed the income from investments made with such leverage, the higher volatility of the net asset value of the shares, and that fluctuations in the interest rates on the borrowing may affect the yield and distributions to the shareholders. There can be no assurance that the Fund’s leverage strategy will be successful. |
NOTE 2—Advisory Fees and Other Fees Paid to Affiliates
The Trust has entered into a master investment advisory agreement with Invesco Advisers, Inc. (the “Adviser” or “Invesco”). Under the terms of the investment advisory agreement, the Fund accrues daily and pays monthly an advisory fee to the Adviser based on the annual rate of the Fund’s average daily net assets as follows:
| Average Daily Net Assets | Rate | |||||||
First $500 million | 0 | .65% | ||||||
Next $4.5 billion | 0 | .60% | ||||||
Next $5 billion | 0 | .575% | ||||||
Over $10 billion | 0 | .55% | ||||||
For the year ended August 31, 2017, the effective advisory fees incurred by the Fund was 0.61%.
Under the terms of a master sub-advisory agreement between the Adviser and each of Invesco Asset Management Deutschland GmbH, Invesco Asset Management Limited, Invesco Asset Management (Japan) Limited, Invesco Hong Kong Limited, Invesco Senior Secured Management, Inc. and Invesco Canada Ltd. and separate sub-advisory agreements with Invesco PowerShares Capital Management LLC and Invesco Asset Management (India) Private Limited (collectively, the “Affiliated Sub-Advisers”) the Adviser, not the Fund, will pay 40% of the fees paid to the Adviser to any such
37 Invesco Floating Rate Fund
Affiliated Sub-Adviser(s) that provide(s) discretionary investment management services to the Fund based on the percentage of assets allocated to such Affiliated Sub-Adviser(s).
The Adviser has contractually agreed, through at least June 30, 2018, to waive advisory fees and/or reimburse expenses of all shares to the extent necessary to limit total annual fund operating expenses after fee waiver and/or reimbursement (excluding certain items discussed below) of Class A, Class C, Class R, Class Y, Class R5 and Class R6 shares to 1.50%, 2.00%, 1.75%, 1.25%, 1.25% and 1.25%, respectively, of the Fund’s average daily net assets (the “expense limits”). In determining the Adviser’s obligation to waive advisory fees and/or reimburse expenses, the following expenses are not taken into account, and could cause the total annual fund operating expenses after fee waiver and/or reimbursement to exceed the numbers reflected above: (1) interest, facilities and maintenance fees; (2) taxes; (3) dividend expense on short sales; (4) extraordinary or non-routine items, including litigation expenses; and (5) expenses that the Fund has incurred but did not actually pay because of an expense offset arrangement. Unless Invesco continues the fee waiver agreement, it will terminate on June 30, 2018. During its term, the fee waiver agreement cannot be terminated or amended to increase the expense limits or reduce the advisory fee waivers without approval of the Board of Trustees. The Adviser did not waive fees and/or reimburse expenses during the period under this expense limit.
Further, the Adviser has contractually agreed, through at least June 30, 2019, to waive the advisory fee payable by the Fund in an amount equal to 100% of the net advisory fees the Adviser receives from the affiliated money market funds on investments by the Fund of uninvested cash in such affiliated money market funds.
For the year ended August 31, 2017, the Adviser waived advisory fees of $287,118.
The Trust has entered into a master administrative services agreement with Invesco pursuant to which the Fund has agreed to pay Invesco for certain administrative costs incurred in providing accounting services to the Fund. For the year ended August 31, 2017, expenses incurred under the agreement are shown in the Statement of Operations as Administrative services fees.
Also, Invesco has entered into service agreements whereby State Street Bank and Trust Company (“SSB”) serves as the custodian, fund accountant and provides certain administrative services to the Fund.
The Trust has entered into a transfer agency and service agreement with Invesco Investment Services, Inc. (“IIS”) pursuant to which the Fund has agreed to pay IIS a fee for providing transfer agency and shareholder services to the Fund and reimburse IIS for certain expenses incurred by IIS in the course of providing such services. IIS may make payments to intermediaries that provide omnibus account services, sub-accounting services and/or networking services. All fees payable by IIS to intermediaries that provide omnibus account services or sub-accounting services are charged back to the Fund, subject to certain limitations approved by the Trust’s Board of Trustees. For the year ended August 31, 2017, expenses incurred under the agreement are shown in the Statement of Operations as Transfer agent fees.
The Trust has entered into master distribution agreements with Invesco Distributors, Inc. (“IDI”) to serve as the distributor for the Class A, Class C, Class R, Class Y, Class R5 and Class R6 shares of the Fund. The Trust has adopted plans pursuant to Rule 12b-1 under the 1940 Act with respect to the Fund’s Class A, Class C and Class R shares (collectively, the “Plans”). The Fund, pursuant to the Plans, pays IDI compensation at the annual rate of 0.25% of the Fund’s average daily net assets of Class A shares, 0.75% of the average daily net assets of Class C shares and 0.50% of the average daily net assets of Class R shares. The fees are accrued daily and paid monthly. Of the Plan payments, up to 0.25% of the average daily net assets of each class of shares may be paid to furnish continuing personal shareholder services to customers who purchase and own shares of such classes. Any amounts not paid as a service fee under the Plans would constitute an asset-based sales charge. Rules of the Financial Industry Regulatory Authority (“FINRA”) impose a cap on the total sales charges, including asset-based sales charges, that may be paid by any class of shares of the Fund. For the year ended August 31, 2017, expenses incurred under the Plans are shown in the Statement of Operations as Distribution fees.
Front-end sales commissions and CDSC (collectively, the “sales charges”) are not recorded as expenses of the Fund. Front-end sales commissions are deducted from proceeds from the sales of Fund shares prior to investment in Class A shares of the Fund. CDSC are deducted from redemption proceeds prior to remittance to the shareholder. During the year ended August 31, 2017, IDI advised the Fund that IDI retained $119,986 in front-end sales commissions from the sale of Class A shares and $67,366 and $24,616 from Class A and Class C shares, respectively, for CDSC imposed upon redemptions by shareholders.
Certain officers and trustees of the Trust are officers and directors of the Adviser, IIS and/or IDI.
NOTE 3—Additional Valuation Information
GAAP defines fair value as the price that would be received to sell an asset or paid to transfer a liability in an orderly transaction between market participants at the measurement date, under current market conditions. GAAP establishes a hierarchy that prioritizes the inputs to valuation methods, giving the highest priority to readily available unadjusted quoted prices in an active market for identical assets (Level 1) and the lowest priority to significant unobservable inputs (Level 3), generally when market prices are not readily available or are unreliable. Based on the valuation inputs, the securities or other investments are tiered into one of three levels. Changes in valuation methods may result in transfers in or out of an investment’s assigned level:
| Level 1 — | Prices are determined using quoted prices in an active market for identical assets. |
| Level 2 — | Prices are determined using other significant observable inputs. Observable inputs are inputs that other market participants may use in pricing a security. These may include quoted prices for similar securities, interest rates, prepayment speeds, credit risk, yield curves, loss severities, default rates, discount rates, volatilities and others. |
| Level 3 — | Prices are determined using significant unobservable inputs. In situations where quoted prices or observable inputs are unavailable (for example, when there is little or no market activity for an investment at the end of the period), unobservable inputs may be used. Unobservable inputs reflect the Fund’s own assumptions about the factors market participants would use in determining fair value of the securities or instruments and would be based on the best available information. |
The following is a summary of the tiered valuation input levels, as of August 31, 2017. The level assigned to the securities valuations may not be an indication of the risk or liquidity associated with investing in those securities. Because of the inherent uncertainties of valuation, the values reflected in the financial statements may materially differ from the value received upon actual sale of those investments.
The Fund’s policy is to recognize transfers in and out of the valuation levels as of the end of the reporting period.
38 Invesco Floating Rate Fund
During the year ended August 31, 2017, there were transfers from Level 3 to Level 2 of $36,454,472, due to third-party vendor quotations utilizing more than one market quote and from Level 2 to Level 3 of $19,630,038, due to third party vendor quotations utilizing single market quotes.
| Level 1 | Level 2 | Level 3 | Total | |||||||||||||
Variable Rate Senior Loan Interests | $ | — | $ | 2,250,163,552 | $ | 179,593,580 | $ | 2,429,757,132 | ||||||||
Bonds & Notes | — | 117,678,095 | 4,117,596 | 121,795,691 | ||||||||||||
Structured Products | — | 28,574,236 | — | 28,574,236 | ||||||||||||
Common Stocks & Other Equity Interests | 15,203,864 | 15,031,071 | 5,857,364 | 36,092,299 | ||||||||||||
Preferred Stocks | — | — | 284,602 | 284,602 | ||||||||||||
Money Market Funds | 163,410,293 | — | — | 163,410,293 | ||||||||||||
Matured Holdings | — | — | 76,857 | 76,857 | ||||||||||||
| 178,614,157 | 2,411,446,954 | 189,929,999 | 2,779,991,110 | |||||||||||||
Forward Foreign Currency Contracts* | — | (4,269,213 | ) | — | (4,269,213 | ) | ||||||||||
Total Investments | $ | 178,614,157 | $ | 2,407,177,741 | $ | 189,929,999 | $ | 2,775,721,897 | ||||||||
| * | Unrealized appreciation (depreciation). |
A reconciliation of Level 3 investments is presented when the Fund had a significant amount of Level 3 investments at the beginning and/or end of the reporting period in relation to net assets.
The following is a reconciliation of the fair valuations using significant unobservable inputs (Level 3) during the year ended August 31, 2017:
| Value August 31, 2016 | Purchases at Cost | Proceeds from Sales | Accrued Discounts/ Premiums | Realized Gain (Loss) | Change in Unrealized Appreciation (Depreciation) | Transfers into Level 3 | Transfers out of Level 3 | Value August 31, 2017 | ||||||||||||||||||||||||||||
Variable Rate Senior Loan Interests | $ | 117,101,789 | $ | 126,908,876 | $ | (52,432,682 | ) | $ | 1,749,348 | $ | 298,943 | $ | 1,640,059 | $ | 19,544,291 | $ | (35,217,044 | ) | $ | 179,593,580 | ||||||||||||||||
Bonds & Notes | — | 4,114,882 | (7,517 | ) | 15,220 | 5,929 | (10,918 | ) | — | — | 4,117,596 | |||||||||||||||||||||||||
Common Stocks & Other Equity Interests | 4,676,287 | 317,879 | (964,293 | ) | — | 964,293 | 2,014,879 | 85,747 | (1,237,428 | ) | 5,857,364 | |||||||||||||||||||||||||
Preferred Stocks | 121,012 | 1,897 | (145,214 | ) | — | 145,214 | 161,693 | — | — | 284,602 | ||||||||||||||||||||||||||
Matured Holdings | 39,414 | 181,885 | — | — | (382,838 | ) | 238,396 | — | — | 76,857 | ||||||||||||||||||||||||||
Total | $ | 121,938,502 | $ | 131,525,419 | $ | (53,549,706 | ) | $ | 1,764,568 | $ | 1,031,541 | $ | 4,044,109 | $ | 19,630,038 | $ | (36,454,472 | ) | $ | 189,929,999 | ||||||||||||||||
Securities determined to be Level 3 at the end of the reporting period were valued primarily by utilizing quotes from a third-party vendor pricing service. A significant change in third-party pricing information could result in a significantly lower or higher value in Level 3 investments.
NOTE 4—Derivative Investments
The Fund may enter into an International Swaps and Derivatives Association Master Agreement (“ISDA Master Agreement”) under which a Fund may trade OTC derivatives. An OTC transaction entered into under an ISDA Master Agreement typically involves a collateral posting arrangement, payment netting provisions and close-out netting provisions. These netting provisions allow for reduction of credit risk through netting of contractual obligations. The enforceability of the netting provisions of the ISDA Master Agreement depends on the governing law of the ISDA Master Agreement, among other factors.
For financial reporting purposes, the Fund does not offset OTC derivative assets or liabilities that are subject to ISDA Master Agreements in the Statement of Assets and Liabilities.
Value of Derivative Investments at Period-End
The table below summarizes the value of the Fund’s derivative investments, detailed by primary risk exposure, held as of August 31, 2017:
| Value | ||||
| Derivative Assets | Currency Risk | |||
Unrealized appreciation on forward foreign currency contracts outstanding | $ | 1,599,206 | ||
Derivatives not subject to master netting agreements | — | |||
Total Derivative Assets subject to master netting agreements | $ | 1,599,206 | ||
| Value | ||||
| Derivative Liabilities | Currency Risk | |||
Unrealized depreciation on forward foreign currency contracts outstanding | $ | (5,868,419 | ) | |
Derivatives not subject to master netting agreements | — | |||
Total Derivative Liabilities subject to master netting agreements | $ | (5,868,419 | ) | |
39 Invesco Floating Rate Fund
Offsetting Assets and Liabilities
The table below reflects the Fund’s exposure to Counterparties subject to either an ISDA Master Agreement or other agreement for OTC derivative transactions as of August 31, 2017.
| Financial Derivative Assets | Financial Derivative Liabilities | Collateral (Received)/Pledged | ||||||||||||||||||||||
| Counterparty | Forward Foreign Currency Contracts | Forward Foreign Currency Contracts | Net Value of Derivatives | Non-Cash | Cash | Net Amount | ||||||||||||||||||
Barclays Bank PLC | $ | 9,052 | $ | (1,381,573 | ) | $ | (1,372,521 | ) | $ | — | $ | — | $ | (1,372,521 | ) | |||||||||
Canadian Imperial Bank of Commerce | 488,303 | (493,073 | ) | (4,770 | ) | — | — | (4,770 | ) | |||||||||||||||
Citigroup Global Markets Inc. | 517,346 | (575,097 | ) | (57,751 | ) | — | — | (57,751 | ) | |||||||||||||||
Goldman Sachs International | 560 | (1,392,448 | ) | (1,391,888 | ) | — | — | (1,391,888 | ) | |||||||||||||||
JPMorgan Chase Bank, N.A. | 543,143 | (601,559 | ) | (58,416 | ) | — | — | (58,416 | ) | |||||||||||||||
RBC Capital Markets Corp. | 40,802 | (1,424,669 | ) | (1,383,867 | ) | — | — | (1,383,867 | ) | |||||||||||||||
Total | $ | 1,599,206 | $ | (5,868,419 | ) | $ | (4,269,213 | ) | $ | — | $ | — | $ | (4,269,213 | ) | |||||||||
Effect of Derivative Investments for the year ended August 31, 2017
The table below summarizes the gains (losses) on derivative investments, detailed by primary risk exposure, recognized in earnings during the period:
| Location of Gain (Loss) on Statement of Operations | ||||
| Currency Risk | ||||
Realized Gain (Loss): | ||||
Forward foreign currency contracts | $ | (7,528,379 | ) | |
Change in Net Unrealized Appreciation (Depreciation): | ||||
Forward foreign currency contracts | (3,930,483 | ) | ||
Total | $ | (11,458,862 | ) | |
The table below summarizes the average notional value of forward foreign currency contracts outstanding during the period.
| Forward Foreign Currency Contracts | ||||
Average notional value | $ | 341,419,563 | ||
NOTE 5—Expense Offset Arrangement(s)
The expense offset arrangement is comprised of transfer agency credits which result from balances in demand deposit accounts used by the transfer agent for clearing shareholder transactions. For the year ended August 31, 2017, the Fund received credits from this arrangement, which resulted in the reduction of the Fund’s total expenses of $3,646.
NOTE 6—Trustees’ and Officers’ Fees and Benefits
Trustees’ and Officers’ Fees and Benefits include amounts accrued by the Fund to pay remuneration to certain Trustees and Officers of the Fund. Trustees have the option to defer compensation payable by the Fund, and Trustees’ and Officers’ Fees and Benefits also include amounts accrued by the Fund to fund such deferred compensation amounts. Those Trustees who defer compensation have the option to select various Invesco Funds in which their deferral accounts shall be deemed to be invested. Finally, certain current Trustees were eligible to participate in a retirement plan that provided for benefits to be paid upon retirement to Trustees over a period of time based on the number of years of service. The Fund may have certain former Trustees who also participate in a retirement plan and receive benefits under such plan. Trustees’ and Officers’ Fees and Benefits include amounts accrued by the Fund to fund such retirement benefits. Obligations under the deferred compensation and retirement plans represent unsecured claims against the general assets of the Fund.
NOTE 7—Borrowings
The Board of Trustees of the Fund approved a revolving line of credit agreement with SSB in which the Fund may borrow up to the lesser of (1) $500,000,000 or (2) the limits set by its prospectus for borrowings. During the year ended August 31, 2017, the Fund did not draw on the revolving line of credit. This agreement will expire on July 18, 2018.
Additionally, the Fund is permitted to temporarily carry a negative or overdrawn balance in its account with State Street Bank and Trust Company, the custodian bank. Such balances, if any at period-end, are shown in the Statement of Assets and Liabilities under the payable caption Amount due custodian. To compensate the custodian bank for such overdrafts, the overdrawn Fund may either (1) leave funds as a compensating balance in the account so the custodian bank can be compensated by earning the additional interest; or (2) compensate by paying the custodian bank at a rate agreed upon by the custodian bank and Invesco, not to exceed the contractually agreed upon rate.
40 Invesco Floating Rate Fund
NOTE 8—Unfunded Loan Commitments
As of August 31, 2017, the Fund had unfunded loan commitments, which could be extended at the option of the borrower, pursuant to the following loan agreements with the following borrowers:
| Borrower | Type | Principal Amount(a) | Value | |||||||
Allied Universal Holdco LLC | Incremental Delayed Draw Term Loan | $ | 1,173,400 | $ | 1,173,400 | |||||
Brickman Group Ltd. LLC | Revolver Loan | 992,343 | 917,917 | |||||||
Community Health Systems, Inc. | Revolver Loan | 1,973,971 | 1,953,135 | |||||||
Delta Air Lines, Inc. | Revolver Loan | 3,811,851 | 3,783,262 | |||||||
Engineered Machinery Holdings, Inc. | First Lien Delayed Draw Term Loan | 145,221 | 145,221 | |||||||
Engineered Machinery Holdings, Inc. | Second Lien Delayed Draw Term Loan | 86,289 | 86,289 | |||||||
Getty Images, Inc. | Revolver Loan | 6,893,288 | 6,755,422 | |||||||
Hearthside Group Holdings, LLC | Revolver Loan | 2,701,077 | 2,692,434 | |||||||
IAP Worldwide Services | Revolver Loan | 789,017 | 773,237 | |||||||
ICSH Parent, Inc. | Delayed Draw Term Loan | 355,025 | 355,025 | |||||||
MacDermid, Inc. | First Lien Revolver Loan | 1,482,771 | 1,480,169 | |||||||
MacDermid, Inc. | First Lien Multicurrency Revolver Loan | 403,230 | 402,522 | |||||||
National Vision, Inc. | First Lien Revolver Loan | 3,004,345 | 2,763,997 | |||||||
NRG Energy Inc. | Revolver Loan A | 41,372,155 | 41,040,557 | |||||||
Post Holdings, Inc. | Revolver Loan | 3,566,087 | 3,561,755 | |||||||
Prime Security Services Borrower, LLC | Revolver Loan | 3,829,058 | 3,821,898 | |||||||
Scientific Games International, Inc. | Multicurrency Revolver Loan | 4,575,335 | 4,506,705 | |||||||
Shutterfly Inc. | Delayed Draw Term Loan B | 1,297,886 | 1,292,215 | |||||||
Transtar Holding Co. | Exit Term Loan | 242,828 | 242,828 | |||||||
TricorBraun Inc. | First Lien Delayed Draw Term Loan | 310,770 | 310,770 | |||||||
Unilabs Diagnostics AB | Revolver Loan | EUR | 1,849,988 | 2,168,437 | ||||||
| $ | 80,227,195 | |||||||||
| (a) | Principal amounts are denominated in U.S. Dollars unless otherwise noted. |
NOTE 9—Distributions to Shareholders and Tax Components of Net Assets
Tax Character of Distributions to Shareholders Paid During the Fiscal Years Ended August 31, 2017 and 2016:
| 2017 | 2016 | |||||||
Ordinary income | $ | 108,639,689 | $ | 100,806,705 | ||||
Tax Components of Net Assets at Period-End:
| 2017 | ||||
Undistributed ordinary income | $ | 599,213 | ||
Net unrealized appreciation (depreciation) — investments | (47,480,809 | ) | ||
Net unrealized appreciation (depreciation) — foreign currencies | (214,222 | ) | ||
Temporary book/tax differences | (186,157 | ) | ||
Capital loss carryforward | (95,743,377 | ) | ||
Late-year ordinary loss deferral | (1,158,031 | ) | ||
Shares of beneficial interest | 2,826,888,943 | |||
Total net assets | $ | 2,682,705,560 | ||
The difference between book-basis and tax-basis unrealized appreciation (depreciation) is due to differences in the timing of recognition of gains and losses on investments for tax and book purposes. The Fund’s net unrealized appreciation (depreciation) difference is attributable primarily to wash sales and book to tax accretion and amortization differences.
The temporary book/tax differences are a result of timing differences between book and tax recognition of income and/or expenses. The Fund’s temporary book/tax differences are the result of the trustee deferral of compensation and retirement plan benefits.
Capital loss carryforward is calculated and reported as of a specific date. Results of transactions and other activity after that date may affect the amount of capital loss carryforward actually available for the Fund to utilize. Capital losses generated in years beginning after December 22, 2010 can be carried forward for an unlimited period, whereas previous losses expire in eight tax years. Capital losses with an expiration period may not be used to offset capital gains until all net capital losses without an expiration date have been utilized. Capital loss carryforwards with no expiration date will retain their character as either short-term or long-term capital losses instead of as short-term capital losses as under prior law. The ability to utilize capital loss carryforwards in the future may be limited under the Internal Revenue Code and related regulations based on the results of future transactions.
41 Invesco Floating Rate Fund
The Fund has a capital loss carryforward as of August 31, 2017 as follows:
| Capital Loss Carryforward* | ||||||||||||
| Expiration | Short-Term | Long-Term | Total | |||||||||
Not subject to expiration | $ | — | $ | 95,743,377 | $ | 95,743,377 | ||||||
| * | Capital loss carryforward as of the date listed above is reduced for limitations, if any, to the extent required by the Internal Revenue Code and may be further limited depending upon a variety of factors, including the realization of net unrealized gains or losses as of the date of any reorganization. |
NOTE 10–Investment Transactions
The aggregate amount of investment securities (other than short-term securities, U.S. Treasury obligations and money market funds, if any) purchased and sold by the Fund during the year ended August 31, 2017 was $2,102,570,684 and $1,755,344,435, respectively. Cost of investments, including any derivatives, on a tax basis includes the adjustments for financial reporting purposes as of the most recently completed federal income tax reporting period-end.
| Unrealized Appreciation (Depreciation) of Investments on a Tax Basis | ||||
Aggregate unrealized appreciation of investments | $ | 36,887,267 | ||
Aggregate unrealized (depreciation) of investments | (84,368,076 | ) | ||
Net unrealized appreciation (depreciation) of investments | $ | (47,480,809 | ) | |
Cost of investments for tax purposes is $2,823,202,706.
NOTE 11—Reclassification of Permanent Differences
Primarily as a result of differing book/tax treatment of expired capital loss carryforward, sale of bonds with amortization and foreign currency transactions on August 31, 2017, undistributed net investment income was increased by $4,198,721, undistributed net realized gain (loss) was decreased by $1,160,301 and shares of beneficial interest was decreased by $3,038,420. This reclassification had no effect on the net assets of the Fund.
42 Invesco Floating Rate Fund
NOTE 12—Share Information
| Summary of Share Activity | ||||||||||||||||
| Years ended August 31, | ||||||||||||||||
| 2017(a) | 2016 | |||||||||||||||
| Shares | Amount | Shares | Amount | |||||||||||||
Sold: | ||||||||||||||||
Class A | 36,272,998 | $ | 274,197,789 | 18,305,635 | $ | 133,356,343 | ||||||||||
Class C | 14,569,784 | 109,661,810 | 10,247,500 | 74,451,098 | ||||||||||||
Class R | 380,350 | 2,876,904 | 148,449 | 1,082,447 | ||||||||||||
Class Y | 93,414,196 | 706,062,216 | 46,131,160 | 334,570,973 | ||||||||||||
Class R5 | 157,469 | 1,193,677 | 90,521 | 660,421 | ||||||||||||
Class R6(b) | 12,895,369 | 97,525,775 | 71,831,902 | 525,955,676 | ||||||||||||
Issued as reinvestment of dividends: | ||||||||||||||||
Class A | 2,632,191 | 19,909,446 | 3,330,762 | 24,151,169 | ||||||||||||
Class C | 1,654,760 | 12,455,642 | 2,222,042 | 16,036,285 | ||||||||||||
Class R | 28,597 | 216,579 | 58,306 | 422,486 | ||||||||||||
Class Y | 3,319,127 | 25,090,029 | 3,024,878 | 21,914,259 | ||||||||||||
Class R5 | 11,142 | 84,348 | 17,233 | 124,645 | ||||||||||||
Class R6 | 3,375,132 | 25,492,002 | 1,241,226 | 9,044,426 | ||||||||||||
Reacquired: | ||||||||||||||||
Class A | (44,554,602 | ) | (337,500,098 | ) | (45,162,725 | ) | (327,258,253 | ) | ||||||||
Class C | (18,651,427 | ) | (140,345,522 | ) | (26,245,612 | ) | (188,674,441 | ) | ||||||||
Class R | (403,466 | ) | (3,048,227 | ) | (955,433 | ) | (6,977,080 | ) | ||||||||
Class Y | (54,792,015 | ) | (413,947,344 | ) | (68,461,342 | ) | (492,380,961 | ) | ||||||||
Class R5 | (44,654 | ) | (336,765 | ) | (316,058 | ) | (2,283,503 | ) | ||||||||
Class R6 | (9,369,118 | ) | (70,558,107 | ) | (11,146,079 | ) | (80,522,129 | ) | ||||||||
Net increase in share activity | 40,895,833 | $ | 309,030,154 | 4,362,365 | $ | 43,673,861 | ||||||||||
| (a) | There are entities that are record owners of more than 5% of the outstanding shares of the Fund and in the aggregate own 67% of the outstanding shares of the Fund. IDI has an agreement with these entities to sell Fund shares. The Fund, Invesco and/or Invesco affiliates may make payments to these entities, which are considered to be related to the Fund, for providing services to the Fund, Invesco and/or Invesco affiliates including but not limited to services such as securities brokerage, distribution, third party record keeping and account servicing. The Fund has no knowledge as to whether all or any portion of the shares owned of record by these entities are also owned beneficially. |
| (b) | During the year ended August 31, 2016, Class R6 Shares valued at $428,616,988 were issued to investors in the CollegeBound 529 program. The program and the Fund are affiliated by having the same investment adviser. |
NOTE 13—Senior Loan Participation Commitments
The Fund invests in participations, assignments, or acts as a party to the primary lending syndicate of a Senior Loan interest to corporations, partnerships, and other entities. When the Fund purchases a participation of a Senior Loan interest, the Fund typically enters into a contractual agreement with the lender or other third party selling the participation, but not with the borrower directly. As such, the Fund assumes the credit risk of the borrower, selling participant or other persons interpositioned between the Fund and the borrower.
At the year ended August 31, 2017, the following sets forth the selling participants with respect to interest in Senior Loans purchased by the Fund on a participation basis.
| Selling Participant | Principal Amount | Value | ||||||
Barclays Bank PLC | $ | 6,893,288 | $ | 6,755,422 | ||||
Goldman Sachs Lending Partners LLC | 6,570,432 | 6,325,752 | ||||||
Mizuho Bank, Ltd. | 41,372,155 | 41,040,557 | ||||||
Total | $ | 54,121,731 | ||||||
43 Invesco Floating Rate Fund
NOTE 14—Financial Highlights
The following schedule presents financial highlights for a share of the Fund outstanding throughout the periods indicated.
| Net asset value, beginning of period | Net investment income(a) | Net gains (losses) on securities (both realized and unrealized) | Total from investment operations | Dividends from net investment income | Net asset value, end of period | Total return(b) | Net assets, end of period (000’s omitted) | Ratio of expenses to average net assets with fee waivers and/or expenses absorbed | Ratio of expenses to average net assets without fee waivers and/or expenses absorbed | Ratio of net investment income to average net assets | Portfolio turnover(c) | |||||||||||||||||||||||||||||||||||||
Class A | ||||||||||||||||||||||||||||||||||||||||||||||||
Year ended 08/31/17 | $ | 7.42 | $ | 0.31 | $ | 0.14 | $ | 0.45 | $ | (0.31 | ) | $ | 7.56 | 6.17 | % | $ | 630,740 | 1.06 | %(d)(e) | 1.07 | %(d)(e) | 4.05 | %(e) | 68 | % | |||||||||||||||||||||||
Year ended 08/31/16 | 7.56 | 0.36 | (0.14 | ) | 0.22 | (0.36 | ) | 7.42 | 3.12 | 661,442 | 1.10 | (d) | 1.11 | (d) | 4.93 | 70 | ||||||||||||||||||||||||||||||||
Year ended 08/31/15 | 7.95 | 0.35 | (0.38 | ) | (0.03 | ) | (0.36 | ) | 7.56 | (0.42 | ) | 850,891 | 1.06 | (d) | 1.06 | (d) | 4.51 | 59 | ||||||||||||||||||||||||||||||
Year ended 08/31/14 | 7.93 | 0.32 | 0.03 | 0.35 | (0.33 | ) | 7.95 | 4.33 | 1,025,092 | 1.03 | (d) | 1.04 | (d) | 4.01 | 82 | |||||||||||||||||||||||||||||||||
Year ended 08/31/13 | 7.77 | 0.35 | 0.17 | 0.52 | (0.36 | ) | 7.93 | 6.83 | 957,442 | 1.08 | (d) | 1.09 | (d) | 4.36 | 97 | |||||||||||||||||||||||||||||||||
Class C | ||||||||||||||||||||||||||||||||||||||||||||||||
Year ended 08/31/17 | 7.39 | 0.27 | 0.14 | 0.41 | (0.27 | ) | 7.53 | 5.65 | 448,408 | 1.56 | (d)(e) | 1.57 | (d)(e) | 3.55 | (e) | 68 | ||||||||||||||||||||||||||||||||
Year ended 08/31/16 | 7.52 | 0.32 | (0.13 | ) | 0.19 | (0.32 | ) | 7.39 | 2.74 | 458,340 | 1.60 | (d) | 1.61 | (d) | 4.43 | 70 | ||||||||||||||||||||||||||||||||
Year ended 08/31/15 | 7.92 | 0.31 | (0.39 | ) | (0.08 | ) | (0.32 | ) | 7.52 | (1.07 | ) | 570,097 | 1.56 | (d) | 1.56 | (d) | 4.01 | 59 | ||||||||||||||||||||||||||||||
Year ended 08/31/14 | 7.90 | 0.28 | 0.03 | 0.31 | (0.29 | ) | 7.92 | 3.91 | 691,152 | 1.53 | (d) | 1.54 | (d) | 3.51 | 82 | |||||||||||||||||||||||||||||||||
Year ended 08/31/13 | 7.73 | 0.31 | 0.18 | 0.49 | (0.32 | ) | 7.90 | 6.45 | 518,948 | 1.58 | (d) | 1.59 | (d) | 3.86 | 97 | |||||||||||||||||||||||||||||||||
Class R | ||||||||||||||||||||||||||||||||||||||||||||||||
Year ended 08/31/17 | 7.44 | 0.29 | 0.13 | 0.42 | (0.29 | ) | 7.57 | 5.76 | 6,345 | 1.31 | (d)(e) | 1.32 | (d)(e) | 3.80 | (e) | 68 | ||||||||||||||||||||||||||||||||
Year ended 08/31/16 | 7.57 | 0.34 | (0.13 | ) | 0.21 | (0.34 | ) | 7.44 | 3.00 | 6,191 | 1.35 | (d) | 1.36 | (d) | 4.68 | 70 | ||||||||||||||||||||||||||||||||
Year ended 08/31/15 | 7.97 | 0.33 | (0.39 | ) | (0.06 | ) | (0.34 | ) | 7.57 | (0.79 | ) | 11,969 | 1.31 | (d) | 1.31 | (d) | 4.26 | 59 | ||||||||||||||||||||||||||||||
Year ended 08/31/14 | 7.95 | 0.30 | 0.03 | 0.33 | (0.31 | ) | 7.97 | 4.18 | 11,152 | 1.28 | (d) | 1.29 | (d) | 3.76 | 82 | |||||||||||||||||||||||||||||||||
Year ended 08/31/13 | 7.79 | 0.33 | 0.17 | 0.50 | (0.34 | ) | 7.95 | 6.57 | 3,559 | 1.33 | (d) | 1.34 | (d) | 4.11 | 97 | |||||||||||||||||||||||||||||||||
Class Y | ||||||||||||||||||||||||||||||||||||||||||||||||
Year ended 08/31/17 | 7.41 | 0.32 | 0.15 | 0.47 | (0.33 | ) | 7.55 | 6.43 | 977,034 | 0.81 | (d)(e) | 0.82 | (d)(e) | 4.30 | (e) | 68 | ||||||||||||||||||||||||||||||||
Year ended 08/31/16 | 7.54 | 0.38 | (0.13 | ) | 0.25 | (0.38 | ) | 7.41 | 3.51 | 648,603 | 0.85 | (d) | 0.86 | (d) | 5.18 | 70 | ||||||||||||||||||||||||||||||||
Year ended 08/31/15 | 7.94 | 0.37 | (0.39 | ) | (0.02 | ) | (0.38 | ) | 7.54 | (0.31 | ) | 805,611 | 0.81 | (d) | 0.81 | (d) | 4.76 | 59 | ||||||||||||||||||||||||||||||
Year ended 08/31/14 | 7.92 | 0.34 | 0.03 | 0.37 | (0.35 | ) | 7.94 | 4.69 | 802,508 | 0.78 | (d) | 0.79 | (d) | 4.26 | 82 | |||||||||||||||||||||||||||||||||
Year ended 08/31/13 | 7.76 | 0.37 | 0.17 | 0.54 | (0.38 | ) | 7.92 | 7.10 | 550,974 | 0.83 | (d) | 0.84 | (d) | 4.61 | 97 | |||||||||||||||||||||||||||||||||
Class R5 | ||||||||||||||||||||||||||||||||||||||||||||||||
Year ended 08/31/17 | 7.43 | 0.32 | 0.15 | 0.47 | (0.33 | ) | 7.57 | 6.43 | 2,830 | 0.82 | (d)(e) | 0.83 | (d)(e) | 4.29 | (e) | 68 | ||||||||||||||||||||||||||||||||
Year ended 08/31/16 | 7.56 | 0.38 | (0.13 | ) | 0.25 | (0.38 | ) | 7.43 | 3.52 | 1,858 | 0.84 | (d) | 0.85 | (d) | 5.19 | 70 | ||||||||||||||||||||||||||||||||
Year ended 08/31/15 | 7.96 | 0.37 | (0.39 | ) | (0.02 | ) | (0.38 | ) | 7.56 | (0.29 | ) | 3,466 | 0.80 | (d) | 0.80 | (d) | 4.77 | 59 | ||||||||||||||||||||||||||||||
Year ended 08/31/14 | 7.94 | 0.34 | 0.03 | 0.37 | (0.35 | ) | 7.96 | 4.72 | 8,087 | 0.76 | (d) | 0.77 | (d) | 4.28 | 82 | |||||||||||||||||||||||||||||||||
Year ended 08/31/13 | 7.77 | 0.37 | 0.18 | 0.55 | (0.38 | ) | 7.94 | 7.26 | 9,260 | 0.81 | (d) | 0.82 | (d) | 4.63 | 97 | |||||||||||||||||||||||||||||||||
Class R6 | ||||||||||||||||||||||||||||||||||||||||||||||||
Year ended 08/31/17 | 7.41 | 0.33 | 0.15 | 0.48 | (0.34 | ) | 7.55 | 6.53 | 617,349 | 0.72 | (d)(e) | 0.73 | (d)(e) | 4.39 | (e) | 68 | ||||||||||||||||||||||||||||||||
Year ended 08/31/16 | 7.56 | 0.39 | (0.16 | ) | 0.23 | (0.38 | ) | 7.41 | 3.34 | 555,172 | 0.75 | (d) | 0.76 | (d) | 5.28 | 70 | ||||||||||||||||||||||||||||||||
Year ended 08/31/15 | 7.95 | 0.38 | (0.38 | ) | 0.00 | (0.39 | ) | 7.56 | (0.06 | ) | 97,902 | 0.70 | (d) | 0.70 | (d) | 4.87 | 59 | |||||||||||||||||||||||||||||||
Year ended 08/31/14 | 7.94 | 0.35 | 0.01 | 0.36 | (0.35 | ) | 7.95 | 4.66 | 83,025 | 0.69 | (d) | 0.70 | (d) | 4.35 | 82 | |||||||||||||||||||||||||||||||||
Year ended 08/31/13(f) | 7.84 | 0.35 | 0.11 | 0.46 | (0.36 | ) | 7.94 | 6.01 | 63,032 | 0.76 | (d)(g) | 0.77 | (d)(g) | 4.68 | (g) | 97 | ||||||||||||||||||||||||||||||||
| (a) | Calculated using average shares outstanding. |
| (b) | Includes adjustments in accordance with accounting principles generally accepted in the United States of America and as such, the net asset value for financial reporting purposes and the returns based upon those net asset values may differ from the net asset value and returns for shareholder transactions. Does not include sales charges and is not annualized for periods less than one year, if applicable. |
| (c) | Portfolio turnover is calculated at the fund level and is not annualized for periods less than one year, if applicable. |
| (d) | Ratio includes line of credit expense of 0.05%, 0.05%, 0.03%, 0.02% and 0.02% for the years ended August 31, 2017, August 31, 2016, August 31, 2015, August 31, 2014 and August 31, 2013, respectively. |
| (e) | Ratios are based on average daily net assets (000’s omitted) of $672,140, $464,473, $6,391, $886,868, $2,268 and $571,059 for Class A, Class C, Class R, Class Y, Class R5 and Class R6 shares, respectively. |
| (f) | Commencement date of September 24, 2012. |
| (g) | Annualized. |
44 Invesco Floating Rate Fund
Report of Independent Registered Public Accounting Firm
To the Board of Trustees of AIM Counselor Series Trust (Invesco Counselor Series Trust)
and Shareholders of Invesco Floating Rate Fund:
In our opinion, the accompanying statement of assets and liabilities, including the schedule of investments, and the related statements of operations, of changes in net assets, of cash flows and the financial highlights present fairly, in all material respects, the financial position of Invesco Floating Rate Fund (one of the portfolios constituting AIM Counselor Series Trust (Invesco Counselor Series Trust), hereafter referred to as the “Fund”) as of August 31, 2017, the results of its operations and its cash flows for the year then ended, the changes in its net assets for each of the two years in the period then ended and the financial highlights for each of the periods indicated therein, in conformity with accounting principles generally accepted in the United States of America. These financial statements and financial highlights (hereafter referred to as “financial statements”) are the responsibility of the Fund’s management. Our responsibility is to express an opinion on these financial statements based on our audits. We conducted our audits of these financial statements in accordance with the standards of the Public Company Accounting Oversight Board (United States). Those standards require that we plan and perform the audit to obtain reasonable assurance about whether the financial statements are free of material misstatement. An audit includes examining, on a test basis, evidence supporting the amounts and disclosures in the financial statements, assessing the accounting principles used and significant estimates made by management, and evaluating the overall financial statement presentation. We believe that our audits, which included confirmation of securities as of August 31, 2017 by correspondence with the custodian, transfer agent and brokers, and when replies were not received from brokers, we performed other auditing procedures, provide a reasonable basis for our opinion.
PricewaterhouseCoopers LLP
Houston, Texas
October 30, 2017
45 Invesco Floating Rate Fund
Calculating your ongoing Fund expenses
Example
As a shareholder of the Fund, you incur two types of costs: (1) transaction costs, which may include sales charges (loads) on purchase payments or contingent deferred sales charges on redemptions, if any; and (2) ongoing costs, including management fees, distribution and/or service (12b-1) fees, and other Fund expenses. This example is intended to help you understand your ongoing costs (in dollars) of investing in the Fund and to compare these costs with ongoing costs of investing in other mutual funds. The example is based on an investment of $1,000 invested at the beginning of the period and held for the entire period March 1, 2017 through August 31, 2017.
Actual expenses
The table below provides information about actual account values and actual expenses. You may use the information in this table, together with the amount you invested, to estimate the expenses that you paid over the period. Simply divide your account value by $1,000 (for example, an $8,600 account value divided by $1,000 = 8.6), then multiply the result by the number in the table under the heading entitled “Actual Expenses Paid During Period” to estimate the expenses you paid on your account during this period.
Hypothetical example for comparison purposes
The table below also provides information about hypothetical account values and hypothetical expenses based on the Fund’s actual expense ratio and an assumed rate of return of 5% per year before expenses, which is not the Fund’s actual return.
The hypothetical account values and expenses may not be used to estimate the actual ending account balance or expenses you paid for the period. You may use this information to compare the ongoing costs of investing in the Fund and other funds. To do so, compare this 5% hypothetical example with the 5% hypothetical examples that appear in the shareholder reports of the other funds.
Please note that the expenses shown in the table are meant to highlight your ongoing costs only and do not reflect any transaction costs, such as sales charges (loads) on purchase payments or contingent deferred sales charges on redemptions, if any. Therefore, the hypothetical information is useful in comparing ongoing costs only, and will not help you determine the relative total costs of owning different funds. In addition, if these transaction costs were included, your costs would have been higher.
| Class | Beginning Account Value (03/01/17) | ACTUAL | HYPOTHETICAL (5% annual return before expenses) | Annualized Expense Ratio | ||||||||||||||||||||
| Ending Account Value (08/31/17)1 | Expenses Paid During Period2 | Ending Account Value (08/31/17) | Expenses Paid During Period2 | |||||||||||||||||||||
| A | $ | 1,000.00 | $ | 1,010.10 | $ | 5.27 | $ | 1,019.96 | $ | 5.30 | 1.04 | % | ||||||||||||
| C | 1,000.00 | 1,007.50 | 7.79 | 1,017.44 | 7.83 | 1.54 | ||||||||||||||||||
| R | 1,000.00 | 1,008.80 | 6.53 | 1,018.70 | 6.56 | 1.29 | ||||||||||||||||||
| Y | 1,000.00 | 1,011.30 | 4.00 | 1,021.22 | 4.02 | 0.79 | ||||||||||||||||||
| R5 | 1,000.00 | 1,011.30 | 4.11 | 1,021.12 | 4.13 | 0.81 | ||||||||||||||||||
| R6 | 1,000.00 | 1,011.80 | 3.60 | 1,021.63 | 3.62 | 0.71 | ||||||||||||||||||
| 1 | The actual ending account value is based on the actual total return of the Fund for the period March 1, 2017 through August 31, 2017, after actual expenses and will differ from the hypothetical ending account value which is based on the Fund’s expense ratio and a hypothetical annual return of 5% before expenses. |
| 2 | Expenses are equal to the Fund’s annualized expense ratio as indicated above multiplied by the average account value over the period, multiplied by 184/365 to reflect the most recent fiscal half year. |
46 Invesco Floating Rate Fund
Approval of Investment Advisory and Sub-Advisory Contracts
The Board of Trustees (the Board) of AIM Counselor Series Trust (Invesco Counselor Series Trust) is required under the Investment Company Act of 1940, as amended, to approve annually the renewal of Invesco Floating Rate Fund’s (the Fund) investment advisory agreements. During contract renewal meetings held on June 12-13, 2017, the Board as a whole, and the disinterested or “independent” Trustees, who comprise over 75% of the Board, voting separately, approved the continuance for the Fund of the Master Investment Advisory Agreement with Invesco Advisers, Inc. (Invesco Advisers and the investment advisory agreement) and the Master Intergroup Sub-Advisory Contract for Mutual Funds with Invesco Asset Management Deutschland GmbH, Invesco Asset Management Limited, Invesco Asset Management (Japan) Limited, Invesco Hong Kong Limited, Invesco Senior Secured Management, Inc. and Invesco Canada Ltd. and separate Sub-Advisory Contracts with Invesco PowerShares Capital Management LLC and Invesco Asset Management (India) Private Limited (collectively, the Affiliated Sub-Advisers and the sub-advisory contracts) for another year, effective July 1, 2017.
In evaluating the fairness and reasonableness of compensation under the Fund’s investment advisory agreement and sub-advisory contracts, the Board considered, among other things, the factors discussed below. The Board determined that continuation of the Fund’s investment advisory agreement and the sub-advisory contracts is in the best interest of the Fund and its shareholders and that the compensation payable to Invesco Advisers and the Affiliated Sub-Advisers under the agreements is fair and reasonable.
The Board’s Fund Evaluation Process
The Board’s Investments Committee has established three Sub-Committees, which meet throughout the year to review the performance of funds advised by Invesco Advisers (the Invesco Funds). Over the course of each year, the Sub-Committees meet with portfolio managers for their assigned Invesco Funds and other members of management to review the performance, investment objective(s), policies, strategies, limitations and investment risks of these funds. The Board had the benefit of reports from the Sub-Committees and Investments Committee throughout the year in considering approval of the continuance of each Invesco Fund’s investment advisory agreement and sub-advisory contracts for another year.
During the contract renewal process, the Board receives comparative performance and fee data regarding the Invesco Funds prepared by Invesco Advisers and Broadridge Financial Solutions, Inc. (Broadridge), an independent provider of investment company data. The Board also receives an independent written
evaluation from the Senior Officer, an officer of the Invesco Funds who reports directly to the independent Trustees. The Senior Officer’s evaluation is prepared as part of his responsibility to manage the process by which the Invesco Funds’ proposed management fees are negotiated during the annual contract renewal process to ensure they are negotiated in a manner that is at arms’ length and reasonable. In addition to meetings with Invesco Advisers and fund counsel, the independent Trustees also discuss the continuance of the investment advisory agreement and sub-advisory contracts in separate sessions with the Senior Officer and with independent legal counsel.
The Trustees recognized that the advisory fee rates for the Invesco Funds are, in most cases, the result of years of review and negotiation. The Trustees’ deliberations and conclusions in a particular year may be based in part on their deliberations and conclusions regarding these arrangements throughout the year and in prior years. The Trustees’ review and conclusions are based on the comprehensive consideration of all information presented to them and are not the result of any single determinative factor. Moreover, one Trustee may have weighed a particular piece of information or factor differently than another Trustee.
The discussion below is a summary of the Senior Officer’s independent written evaluation with respect to the Fund’s investment advisory agreement as well as a discussion of the material factors and related conclusions that formed the basis for the Board’s approval of the Fund’s investment advisory agreement and sub-advisory contracts. This information is current as of June 13, 2017, and does not reflect consideration of factors that became known to the Board after that date.
Factors and Conclusions and Summary of Independent Written Fee Evaluation
| A. | Nature, Extent and Quality of Services Provided by Invesco Advisers and the Affiliated Sub-Advisers |
The Board reviewed the advisory services provided to the Fund by Invesco Advisers under the Fund’s investment advisory agreement, the performance of Invesco Advisers in providing these services, and the credentials and experience of the officers and employees of Invesco Advisers who provide these services, including the Fund’s portfolio manager or managers. The Board’s review included consideration of Invesco Advisers’ investment process oversight, credit analysis and investment risk management. The Board also considered non-advisory services that Invesco Advisers and its affiliates provide to the Invesco Funds such as various back office support functions, trading operations, internal audit, valuation and legal and compliance.
In determining whether to continue the Fund’s investment advisory agreement, the Board considered the benefits of reapproving an existing relationship as contrasted with the greater uncertainty that may be associated with entering into a new relationship. The Board concluded that the nature, extent and quality of the services provided to the Fund by Invesco Advisers are appropriate and satisfactory.
The Board reviewed the services that may be provided by the Affiliated Sub-Advisers under the sub-advisory contracts and the credentials and experience of the officers and employees of the Affiliated Sub-Advisers who provide these services. The Board noted that the Affiliated Sub-Advisers have offices and personnel that are located in financial centers around the world. As a result, the Board noted that the Affiliated Sub-Advisers can provide research and investment analysis on the markets and economies of various countries in which the Fund may invest, make recommendations regarding securities and assist with security trades. The Board concluded that the sub-advisory contracts may benefit the Fund and its shareholders by permitting Invesco Advisers to use the resources and talents of the Affiliated Sub-Advisers in managing the Fund. The Board concluded that the nature, extent and quality of the services that may be provided by the Affiliated Sub-Advisers are appropriate and satisfactory.
| B. | Fund Investment Performance |
The Board considered Fund investment performance as a relevant factor in considering whether to approve the investment advisory agreement as well as the sub-advisory contracts for the Fund, as Invesco Senior Secured Management, Inc. currently manages assets of the Fund.
The Board compared the Fund’s investment performance over multiple time periods ending December 31, 2016 to the performance of funds in the Broadridge performance universe and against the Lipper Loan Participation Funds Index. The Board noted that performance of Class A shares of the Fund was in the second quintile of its performance universe for the one and five year periods and the third quintile for the three year period (the first quintile being the best performing funds and the fifth quintile being the worst performing funds). The Board noted that performance of Class A shares of the Fund was above the performance of the Index for the one, three and five year periods. The Trustees also reviewed more recent Fund performance and this review did not change their conclusions.
| C. | Advisory and Sub-Advisory Fees |
The Board compared the Fund’s contractual management fee rate to the contractual management fee rates of funds in the Fund’s Broadridge expense group at a common asset
47 Invesco Floating Rate Fund
level. The Board noted that the contractual management fee rate for Class A shares of the Fund was below the median contractual management fee rate of funds in its expense group. The Board noted that the term “contractual management fee” for funds in the expense group may include both advisory and certain administrative services fees, but that Broadridge does not provide information on a fund by fund basis as to what is included. The Board noted that Invesco Advisers does not separately charge the Invesco Funds for the administrative services included in the term as defined by Broadridge. The Board also reviewed the methodology used by Broadridge in providing expense group information, which includes using each fund’s contractual management fee schedule (including any applicable breakpoints) as reported in the most recent prospectus or statement of additional information for each fund in the expense group.
The Board also compared the Fund’s effective advisory fee rate (the advisory fee rate after advisory fee waivers and before other expense limitations/waivers) to the effective advisory fee rates of other funds advised by Invesco Advisers and its affiliates with investment strategies comparable to those of the Fund, based on asset balances as of December 31, 2016. The Board noted that the Fund’s rate was below the rate of one closed-end fund. The Board also noted how the Fund’s rate compared to the fee rate of cross border funds advised by Invesco Advisers and its affiliates.
The Board also considered the fees charged by Invesco Advisers and the Affiliated Sub-Advisers to other client accounts with investment strategies comparable to those of the Fund. The Board noted that Invesco Advisers or the Affiliated Sub-Advisers may charge lower fees to large institutional clients. Invesco Advisers reviewed with the Board the significantly greater scope of services it provides to the Invesco Funds relative to certain other types of client accounts. These additional services include provision of administrative services, officers and office space, oversight of service providers, preparation of annual registration statement updates and financial information and regulatory compliance under the Investment Company Act of 1940, as amended.
Invesco Advisers also reviewed generally the higher frequency of shareholder purchases and redemptions in the Invesco Funds relative to the flow of assets for other client accounts. Invesco Advisers advised the Board that advance notice of redemptions is often provided to Invesco Advisers by institutional clients. The Board did note that sub-advisory fee rates charged by the Affiliated Sub-Advisers to manage the Invesco Funds and to manage other client accounts tended to be more comparable, reflecting a similar scope of services.
The Board also considered the services that may be provided by the Affiliated Sub-Advisers pursuant to the sub-advisory contracts, as well
as the fees payable by Invesco Advisers to the Affiliated Sub-Advisers pursuant to the sub-advisory contracts. The Board noted that Invesco Advisers retains overall responsibility for, and provides services to, sub-advised Invesco Funds, including oversight of the Affiliated Sub-Advisers as well as the additional services described herein other than day-to-day portfolio management. The Board also noted that the sub-advisory fees are not paid directly by the Fund, but rather, are payable by Invesco Advisers to the Affiliated Sub-Advisers.
| D. | Economies of Scale and Breakpoints |
The Board considered the extent to which there are economies of scale in the provision of advisory services to the Fund. The Board also considered that the Fund benefits from economies of scale through contractual breakpoints in the Fund’s advisory fee schedule. The Board noted that the Fund shares directly in economies of scale through lower fees charged by third party service providers based on the combined size of the Invesco Funds advised by Invesco Advisers.
| E. | Profitability and Financial Resources |
The Board reviewed information from Invesco Advisers concerning the costs of the advisory and other services that Invesco Advisers and its affiliates provide to the Fund and the Invesco Funds and the profitability of Invesco Advisers and its affiliates in providing these services. The Board noted that Invesco Advisers continues to operate at a net profit from services Invesco Advisers and its affiliates provide to the Invesco Funds and the Fund. The Board did not deem the level of profits realized by Invesco Advisers and its affiliates from providing services to the Fund to be excessive given the nature, quality and extent of the services provided. The Board received and accepted information from Invesco Advisers demonstrating that Invesco Advisers and each Affiliated Sub-Adviser are financially sound and have the resources necessary to perform their obligations under the investment advisory agreement and sub-advisory contracts.
| F. | Collateral Benefits to Invesco Advisers and its Affiliates |
The Board considered various other benefits received by Invesco Advisers and its affiliates from the relationship with the Fund, including the fees received for providing transfer agency and distribution services to the Fund. The Board considered comparative information regarding fees charged for these services, including information provided by Broadridge and other independent sources. The Board considered the performance of Invesco Advisers and its affiliates in providing these services and the organizational structure employed to provide these services. The Board also considered that these services are provided to the Fund pursuant to written contracts that are reviewed and approved on an annual basis by the Board; and that the services are required for the operation of the Fund.
The Board considered the benefits realized by Invesco Advisers and the Affiliated Sub-Advisers
as a result of portfolio brokerage transactions executed through “soft dollar” arrangements. Invesco Advisers noted that the Fund does not execute brokerage transactions through “soft dollar” arrangements to any significant degree.
The Board considered that the Fund’s uninvested cash and cash collateral from any securities lending arrangements may be invested in money market funds advised by Invesco Advisers pursuant to procedures approved by the Board. The Board noted that Invesco Advisers receives advisory fees from these affiliated money market funds attributable to such investments, although Invesco Advisers has contractually agreed to waive through varying periods the advisory fees payable by the Invesco Funds with respect to certain investments in the affiliated money market funds. The waiver is in an amount equal to 100% of the net advisory fee Invesco Advisers receives from the affiliated money market funds with respect to the Fund’s investment in the affiliated money market funds of uninvested cash, but not cash collateral. The Board concluded that the amount of advisory fees received by Invesco Advisers from the Fund’s investment of cash collateral from any securities lending arrangements in the affiliated money market funds is fair and reasonable.
48 Invesco Floating Rate Fund
Tax Information
Form 1099-DIV, Form 1042-S and other year-end tax information provide shareholders with actual calendar year amounts that should be included in their tax returns. Shareholders should consult their tax advisors.
The following distribution information is being provided as required by the Internal Revenue Code or to meet a specific state’s requirement.
The Fund designates the following amounts or, if subsequently determined to be different, the maximum amount allowable for its fiscal year ended August 31, 2017:
Federal and State Income Tax | ||||
Qualified Dividend Income* | 2.01 | % | ||
Corporate Dividends Received Deduction* | 2.01 | % | ||
U.S. Treasury Obligations* | 0.00 | % | ||
| * | The above percentages are based on ordinary income dividends paid to shareholders during the Fund’s fiscal year. |
49 Invesco Floating Rate Fund
Proxy Results
A Special Joint Meeting (“Meeting”) of Shareholders of Invesco Floating Rate Fund, an investment portfolio of AIM Counselor Series Trust (Invesco Counselor Series Trust), a Delaware statutory trust (“Trust”), was held on March 9, 2017. The Meeting was held for the following purposes:
| (1) | Elect 15 trustees to the Board, each of whom will serve until his or her successor is elected and qualified. |
| (2) | Approve an amendment to the Trust’s Agreement and Declaration of Trust that would permit fund mergers and other significant transactions upon the Board’s approval but without shareholder approval of such transactions. |
The results of the voting on the above matters were as follows:
| Matters | Votes For | Votes Withheld | ||||||||||||||||
| (1)* | David C. Arch | 1,425,647,604 | 36,521,875 | |||||||||||||||
| James T. Bunch | 1,425,181,099 | 36,988,380 | ||||||||||||||||
| Bruce L. Crockett | 1,425,174,694 | 36,994,785 | ||||||||||||||||
| Jack M. Fields | 1,426,060,874 | 36,108,605 | ||||||||||||||||
| Martin L. Flanagan | 1,426,481,477 | 35,688,002 | ||||||||||||||||
| Cynthia Hostetler | 1,426,489,972 | 35,679,505 | ||||||||||||||||
| Dr. Eli Jones | 1,426,255,832 | 35,913,647 | ||||||||||||||||
| Dr. Prema Mathai-Davis | 1,425,363,789 | 36,805,689 | ||||||||||||||||
| Teresa M. Ressel | 1,426,514,880 | 35,654,598 | ||||||||||||||||
| Dr. Larry Soll | 1,424,932,245 | 37,237,234 | ||||||||||||||||
| Ann Barnett Stern | 1,426,260,049 | 35,909,429 | ||||||||||||||||
| Raymond Stickel, Jr. | 1,425,391,657 | 36,777,822 | ||||||||||||||||
| Philip A. Taylor | 1,426,285,212 | 35,884,267 | ||||||||||||||||
| Robert C. Troccoli | 1,426,075,097 | 36,094,382 | ||||||||||||||||
| Christopher L. Wilson | 1,426,594,956 | 35,574,523 | ||||||||||||||||
| Votes For | Votes Against | Votes Abstain | Broker Non-Votes | |||||||||||||||
| (2)* | Approve an amendment to the Trust’s Agreement and Declaration of Trust that would permit fund mergers and other significant transactions upon the Board’s approval but without shareholder approval of such transactions | 751,302,707 | 79,810,344 | 41,561,890 | 589,495,482 | |||||||||||||
The Meeting was adjourned until April 11, 2017, with respect to the following proposals:
| (3) | Approve changing the fundamental investment restriction regarding the purchase or sale of physical commodities. |
| 4(a) | Approve an amendment to the current Master Intergroup Sub-Advisory Contract to add Invesco PowerShares Capital Management LLC. |
| 4(b) | Approve an amendment to the current Master Intergroup Sub-Advisory Contract to add Invesco Asset Management (India) Private Limited. |
The results of the voting on the above matters were as follows:
| Matters | Votes For | Votes Against | Votes Abstain | Broker Non-Votes | ||||||||||||||
| (3) | Approve changing the fundamental investment restriction regarding the purchase or sale of physical commodities | 117,146,957 | 5,629,648 | 7,100,513 | 40,787,095 | |||||||||||||
| 4(a) | Approve an amendment to the current Master Intergroup Sub-Advisory Contract to add Invesco PowerShares Capital Management LLC | 119,134,154 | 3,567,676 | 7,175,315 | 40,787,068 | |||||||||||||
| 4(b) | Approve an amendment to the current Master Intergroup Sub-Advisory Contract to add Invesco Asset Management (India) Private Limited | 118,378,116 | 4,248,850 | 7,250,170 | 40,787,077 | |||||||||||||
| * | Each of proposal 1 and 2 required approval by a combined vote of all of the portfolios of AIM Counselor Series Trust (Invesco Counselor Series Trust). |
50 Invesco Floating Rate Fund
Trustees and Officers
The address of each trustee and officer is AIM Counselor Series Trust (Invesco Counselor Series Trust) (the “Trust”), 11 Greenway Plaza, Suite 1000, Houston, Texas 77046-1173. The trustees serve for the life of the Trust, subject to their earlier death, incapacitation, resignation, retirement or removal as more specifically provided in the Trust’s organizational documents. Each officer serves for a one year term or until their successors are elected and qualified. Column two below includes length of time served with predecessor entities, if any.
| Name, Year of Birth and Position(s) Held with the Trust | Trustee and/ or Officer Since | Principal Occupation(s) During Past 5 Years | Number of Overseen by | Other Directorship(s) Held by Trustee During Past 5 Years | ||||
| Interested Persons | ||||||||
| Martin L. Flanagan1 — 1960 Trustee | 2007 | Executive Director, Chief Executive Officer and President, Invesco Ltd. (ultimate parent of Invesco and a global investment management firm); Trustee, The Invesco Funds; Vice Chair, Investment Company Institute; and Member of Executive Board, SMU Cox School of Business
Formerly: Advisor to the Board, Invesco Advisers, Inc. (formerly known as Invesco Institutional (N.A.), Inc.); Chairman and Chief Executive Officer, Invesco Advisers, Inc. (registered investment adviser); Director, Chairman, Chief Executive Officer and President, Invesco Holding Company (US), Inc. (formerly IVZ Inc.) (holding company), Invesco Group Services, Inc. (service provider) and Invesco North American Holdings, Inc. (holding company); Director, Chief Executive Officer and President, Invesco Holding Company Limited (parent of Invesco and a global investment management firm); Director, Invesco Ltd.; Chairman, Investment Company Institute and President, Co-Chief Executive Officer, Co-President, Chief Operating Officer and Chief Financial Officer, Franklin Resources, Inc. (global investment management organization) | 144 | None | ||||
Philip A. Taylor2 — 1954 Trustee and Senior Vice President | 2006 | Head of the Americas and Senior Managing Director, Invesco Ltd.; Director, Invesco Advisers, Inc. (formerly known as Invesco Institutional (N.A.), Inc.) (registered investment adviser); Director, Chairman, Chief Executive Officer and President, Invesco Management Group, Inc. (formerly known as Invesco Aim Management Group, Inc.) (financial services holding company); Director and Chairman, Invesco Investment Services, Inc. (formerly known as Invesco Aim Investment Services, Inc.) (registered transfer agent); Chief Executive Officer, Invesco Corporate Class Inc. (corporate mutual fund company); Director, Chairman and Chief Executive Officer, Invesco Canada Ltd. (formerly known as Invesco Trimark Ltd./Invesco Trimark Ltèe) (registered investment adviser and registered transfer agent); Trustee and Senior Vice President, The Invesco Funds; Director, Invesco Investment Advisers LLC (formerly known as Van Kampen Asset Management).
Formerly: Co-Chairman, Co-President and Co-Chief Executive Officer, Invesco Advisers, Inc. (formerly known as Invesco Institutional (N.A.), Inc.) (registered investment adviser); Director, Chief Executive Officer and President, Van Kampen Exchange Corp; President and Principal Executive Officer, The Invesco Funds (other than AIM Treasurer’s Series Trust (Invesco Treasurer’s Series Trust), Short-Term Investments Trust and Invesco Management Trust); Executive Vice President, The Invesco Funds (AIM Treasurer’s Series Trust (Invesco Treasurer’s Series Trust), Short-Term Investments Trust and Invesco Management Trust only); Director and President, INVESCO Funds Group, Inc. (registered investment adviser and registered transfer agent); Director and Chairman, IVZ Distributors, Inc. (formerly known as INVESCO Distributors, Inc.) (registered broker dealer); Director, President and Chairman, Invesco Inc. (holding company), Invesco Canada Holdings Inc. (holding company), Trimark Investments Ltd./Placements Trimark Ltèe and Invesco Financial Services Ltd/Services Financiers Invesco Ltèe; Chief Executive Officer, Invesco Canada Fund Inc. (corporate mutual fund company); Director and Chairman, Van Kampen Investor Services Inc.; Director, Chief Executive Officer and President, 1371 Preferred Inc. (holding company) and Van Kampen Investments Inc.; Director and President, AIM GP Canada Inc. (general partner for limited partnerships) and Van Kampen Advisors, Inc.; Director and Chief Executive Officer, Invesco Trimark Dealer Inc. (registered broker dealer); Director, Invesco Distributors, Inc. (formerly known as Invesco Aim Distributors, Inc.) (registered broker dealer); Manager, Invesco PowerShares Capital Management LLC; Director, Chief Executive Officer and President, Invesco Advisers, Inc.; Director, Chairman, Chief Executive Officer and President, Invesco Aim Capital Management, Inc.; President, Invesco Trimark Dealer Inc. and Invesco Trimark Ltd./Invesco Trimark Ltèe; Director and President, AIM Trimark Corporate Class Inc. and AIM Trimark Canada Fund Inc.; Senior Managing Director, Invesco Holding Company Limited; Director and Chairman, Fund Management Company (former registered broker dealer); President and Principal Executive Officer, The Invesco Funds (AIM Treasurer’s Series Trust (Invesco Treasurer’s Series Trust), and Short-Term Investments Trust only); President, AIM Trimark Global Fund Inc. and AIM Trimark Canada Fund Inc. | 144 | None |
| 1 | Mr. Flanagan is considered an interested person (within the meaning of Section 2(a)(19) of the 1940 Act) of the Trust because he is an officer of the Adviser to the Trust, and an officer and a director of Invesco Ltd., ultimate parent of the Adviser. |
| 2 | Mr. Taylor is considered an interested person (within the meaning of Section 2(a)(19) of the 1940 Act) of the Trust because he is an officer and a director of the Adviser. |
T-1 Invesco Floating Rate Fund
Trustees and Officers—(continued)
| Name, Year of Birth and Position(s) Held with the Trust | Trustee and/ or Officer Since | Principal Occupation(s) During Past 5 Years | Number of Complex Overseen by Trustee | Other Directorship(s) Held by Trustee During | ||||
| Independent Trustees | ||||||||
Bruce L. Crockett — 1944 Trustee and Chair | 2003 | Chairman, Crockett Technologies Associates (technology consulting company)
Formerly: Director, Captaris (unified messaging provider); Director, President and Chief Executive Officer, COMSAT Corporation; Chairman, Board of Governors of INTELSAT (international communications company); ACE Limited (insurance company); Independent Directors Council and Investment Company Institute: Member of the Audit Committee, Investment Company Institute; Member of the Executive Committee and Chair of the Governance Committee, Independent Directors Council | 144 | Director and Chairman of the Audit Committee, ALPS (Attorneys Liability Protection Society) (insurance company); Director and Member of the Audit Committee, Ferroglobe PLC (metallurgical company) | ||||
David C. Arch — 1945 Trustee | 2010 | Chairman of Blistex Inc. (consumer health care products manufacturer); Member, World Presidents’ Organization | 144 | Board member of the Illinois Manufacturers’ Association | ||||
James T. Bunch — 1942 Trustee | 2000 | Managing Member, Grumman Hill Group LLC (family office/private equity investments)
Formerly: Chairman of the Board, Denver Film Society; Chairman of the Board of Trustees, Evans Scholarship Foundation; Chairman, Board of Governors, Western Golf Association | 144 | Trustee, Evans Scholarship Foundation | ||||
Jack M. Fields — 1952 Trustee | 2003 | Chief Executive Officer, Twenty First Century Group, Inc. (government affairs company); and Discovery Learning Alliance (non-profit)
Formerly: Owner and Chief Executive Officer, Dos Angeles Ranch L.P. (cattle, hunting, corporate entertainment); Director, Insperity, Inc. (formerly known as Administaff); Chief Executive Officer, Texana Timber LP (sustainable forestry company); Director of Cross Timbers Quail Research Ranch (non-profit); and member of the U.S. House of Representatives | 144 | None | ||||
Cynthia Hostetler — 1962 Trustee | 2017 | Non-Executive Director and Trustee of a number of public and private business corporations
Formerly: Head of Investment Funds and Private Equity, Overseas Private Investment Corporation; President, First Manhattan Bancorporation, Inc.; Attorney, Simpson Thacher & Bartlett LLP | 144 | Vulcan Materials Company (construction materials company); Trilinc Global Impact Fund; Aberdeen Investment Funds (4 portfolios); Artio Global Investment LLC (mutual fund complex); Edgen Group, Inc. (specialized energy and infrastructure products distributor) | ||||
Eli Jones — 1961 Trustee | 2016 | Professor and Dean, Mays Business School — Texas A&M University
Formerly: Professor and Dean, Walton College of Business, University of Arkansas and E.J. Ourso College of Business, Louisiana State University; Director, Arvest Bank | 144 | Insperity, Inc. (formerly known as Administaff) (human resources provider) | ||||
Prema Mathai-Davis — 1950 Trustee | 2003 | Retired.
Formerly: Chief Executive Officer, YWCA of the U.S.A. | 144 | None | ||||
Teresa M. Ressel — 1962 Trustee | 2017 | Non-executive director and trustee of a number of public and private business corporations
Formerly: Chief Financial Officer, Olayan America, The Olayan Group (international investor/commercial/industrial); Chief Executive Officer, UBS Securities LLC; Group Chief Operating Officer, Americas, UBS AG; Assistant Secretary for Management & Budget and CFO, US Department of the Treasury; Chief Compliance Officer, Kaiser Permanente; Program Manager, Hewlett-Packard; Nuclear Engineering, General Dynamics Corporation | 144 | Atlantic Power Corporation (power generation company); ON Semiconductor Corp. (semiconductor supplier) | ||||
Larry Soll — 1942 Trustee | 1997 | Retired.
Formerly: Chairman, Chief Executive Officer and President, Synergen Corp. (a biotechnology company) | 144 | None | ||||
Ann Barnett Stern — 1957 Trustee | 2017 | President and Chief Executive Officer, Houston Endowment Inc. (private philanthropic institution)
Formerly: Executive Vice President and General Counsel, Texas Children’s Hospital; Attorney, Beck, Redden and Secrest, LLP; Business Law Instructor, University of St. Thomas; Attorney, Andrews & Kurth LLP | 144 | Federal Reserve Bank of Dallas | ||||
Raymond Stickel, Jr. — 1944 Trustee | 2005 | Retired.
Formerly: Director, Mainstay VP Series Funds, Inc. (25 portfolios); Partner, Deloitte & Touche | 144 | None | ||||
Robert C. Troccoli — 1949 Trustee | 2016 | Adjunct Professor, University of Denver — Daniels College of Business
Formerly: Senior Partner, KPMG LLP | 144 | None | ||||
Christopher L. Wilson — 1957 Trustee | 2017 | Managing Partner, CT2, LLC (investing and consulting firm)
Formerly: President/Chief Executive Officer, Columbia Funds, Bank of America Corporation; President/Chief Executive Officer, CDC IXIS Asset Management Services, Inc.; Principal & Director of Operations, Scudder Funds, Scudder, Stevens & Clark, Inc.; Assistant Vice President, Fidelity Investments | 144 | TD Asset Management USA Inc. (mutual fund complex) (22 portfolios); ISO New England, Inc. (non-profit organization managing regional electricity market) |
T-2 Invesco Floating Rate Fund
Trustees and Officers—(continued)
| Name, Year of Birth and Position(s) Held with the Trust | Trustee and/ or Officer Since | Principal Occupation(s) During Past 5 Years | Number of Complex Overseen by Trustee | Other Directorship(s) Held by Trustee During | ||||
| Other Officers | ||||||||
Sheri Morris — 1964 President, Principal Executive Officer and Treasurer | 2003 | President, Principal Executive Officer and Treasurer, The Invesco Funds; Vice President, Invesco Advisers, Inc. (formerly known as Invesco Institutional (N.A.), Inc.) (registered investment adviser); and Vice President, PowerShares Exchange-Traded Fund Trust, PowerShares Exchange-Traded Fund Trust II, PowerShares India Exchange-Traded Fund Trust, PowerShares Actively Managed Exchange-Traded Fund Trust and PowerShares Actively Managed Exchange-Traded Commodity Fund Trust
Formerly: Vice President and Principal Financial Officer, The Invesco Funds; Vice President, Invesco Aim Advisers, Inc., Invesco Aim Capital Management, Inc. and Invesco Aim Private Asset Management, Inc.; Assistant Vice President and Assistant Treasurer, The Invesco Funds and Assistant Vice President, Invesco Advisers, Inc., Invesco Aim Capital Management, Inc. and Invesco Aim Private Asset Management, Inc.; and Treasurer, PowerShares Exchange-Traded Fund Trust, PowerShares Exchange-Traded Fund Trust II, PowerShares India Exchange-Traded Fund Trust and PowerShares Actively Managed Exchange-Traded Fund Trust | N/A | N/A | ||||
Russell C. Burk — 1958 Senior Vice President and Senior Officer | 2005 | Senior Vice President and Senior Officer, The Invesco Funds | N/A | N/A | ||||
John M. Zerr — 1962 Senior Vice President, Chief Legal Officer and Secretary | 2006 | Director, Senior Vice President, Secretary and General Counsel, Invesco Management Group, Inc. (formerly known as Invesco AIM Management Group, Inc.); Senior Vice President, Invesco Advisers, Inc. (formerly known as Invesco Institutional (N.A.), Inc.) (registered investment adviser); Senior Vice President and Secretary, Invesco Distributors, Inc. (formerly known as Invesco AIM Distributors, Inc.); Director, Vice President and Secretary, Invesco Investment Services, Inc. (formerly known as Invesco AIM Investment Services, Inc.) Senior Vice President, Chief Legal Officer and Secretary, The Invesco Funds; Managing Director, Invesco PowerShares Capital Management LLC; Director, Secretary and General Counsel, Invesco Investment Advisers LLC (formerly known as Van Kampen Asset Management); Secretary and General Counsel, Invesco Capital Markets, Inc. (formerly known as Van Kampen Funds Inc.) and Chief Legal Officer, PowerShares Exchange-Traded Fund Trust, PowerShares Exchange-Traded Fund Trust II, PowerShares India Exchange-Traded Fund Trust, PowerShares Actively Managed Exchange-Traded Fund Trust and PowerShares Actively Managed Exchange-Traded Commodity Fund Trust; Manager and Secretary, Invesco Indexing LLC
Formerly: Director, Secretary, General Counsel and Senior Vice President, Van Kampen Exchange Corp.; Director, Vice President and Secretary, IVZ Distributors, Inc. (formerly known as INVESCO Distributors, Inc.); Director and Vice President, INVESCO Funds Group, Inc.; Director and Vice President, Van Kampen Advisors Inc.; Director, Vice President, Secretary and General Counsel, Van Kampen Investor Services Inc.; Director, Invesco Distributors, Inc. (formerly known as Invesco AIM Distributors, Inc.); Director, Senior Vice President, General Counsel and Secretary, Invesco AIM Advisers, Inc. and Van Kampen Investments Inc.; Director, Vice President and Secretary, Fund Management Company; Director, Senior Vice President, Secretary, General Counsel and Vice President, Invesco AIM Capital Management, Inc.; Chief Operating Officer and General Counsel, Liberty Ridge Capital, Inc. (an investment adviser); Vice President and Secretary, PBHG Funds (an investment company) and PBHG Insurance Series Fund (an investment company); Chief Operating Officer, General Counsel and Secretary, Old Mutual Investment Partners (a broker-dealer); General Counsel and Secretary, Old Mutual Fund Services (an administrator) and Old Mutual Shareholder Services (a shareholder servicing center); Executive Vice President, General Counsel and Secretary, Old Mutual Capital, Inc. (an investment adviser); and Vice President and Secretary, Old Mutual Advisors Funds (an investment company) | N/A | N/A | ||||
Gregory G. McGreevey — 1962 Senior Vice President | 2012 | Senior Managing Director, Invesco Ltd.; Director, Chairman, President, and Chief Executive Officer, Invesco Advisers, Inc. (formerly known as Invesco Institutional (N.A.), Inc.) (registered investment adviser); Director, Invesco Mortgage Capital, Inc. and Invesco Senior Secured Management, Inc.; and Senior Vice President, The Invesco Funds
Formerly: Assistant Vice President, The Invesco Funds | N/A | N/A | ||||
Kelli Gallegos — 1970 Vice President, Principal Financial Officer and Assistant Treasurer | 2008 | Vice President, Principal Financial Officer and Assistant Treasurer, The Invesco Funds; Assistant Treasurer, Invesco PowerShares Capital Management LLC, PowerShares Exchange-Traded Fund Trust, PowerShares Exchange-Traded Fund Trust II, PowerShares India Exchange-Traded Fund Trust, PowerShares Actively Managed Exchange-Traded Fund Trust and PowerShares Actively Managed Exchange-Traded Commodity Fund Trust
Formerly: Assistant Vice President, The Invesco Funds | N/A | N/A |
T-3 Invesco Floating Rate Fund
Trustees and Officers—(continued)
| Name, Year of Birth and Position(s) Held with the Trust | Trustee and/ or Officer Since | Principal Occupation(s) During Past 5 Years | Number of Complex Overseen by Trustee | Other Directorship(s) Held by Trustee During | ||||
| Other Officers—(continued) | ||||||||
Tracy Sullivan — 1962 Vice President, Chief Tax Officer and Assistant Treasurer | 2008 | Vice President, Chief Tax Officer and Assistant Treasurer, The Invesco Funds; Assistant Treasurer, Invesco PowerShares Capital Management LLC, PowerShares Exchange-Traded Fund Trust, PowerShares Exchange-Traded Fund Trust II, PowerShares India Exchange-Traded Fund Trust, PowerShares Actively Managed Exchange-Traded Fund Trust and PowerShares Actively Managed Exchange-Traded Commodity Fund Trust
Formerly: Assistant Vice President, The Invesco Funds | N/A | N/A | ||||
Crissie M. Wisdom — 1969 Anti-Money Laundering Compliance Officer | 2013 | Anti-Money Laundering Compliance Officer, Invesco Advisers, Inc. (formerly known as Invesco Institutional (N.A.), Inc.) (registered investment adviser), Invesco Capital Markets, Inc. (formerly known as Van Kampen Funds Inc.), Invesco Distributors, Inc., Invesco Investment Services, Inc., Invesco Management Group, Inc., The Invesco Funds, and PowerShares Exchange-Traded Fund Trust, PowerShares Exchange-Traded Fund Trust II, PowerShares India Exchange-Traded Fund Trust, PowerShares Actively Managed Exchange-Traded Fund Trust and PowerShares Actively Managed Exchange-Traded Commodity Fund Trust; Anti-Money Laundering Compliance Officer and Bank Secrecy Act Officer, INVESCO National Trust Company and Invesco Trust Company; and Fraud Prevention Manager and Controls and Risk Analysis Manager for Invesco Investment Services, Inc.
Formerly: Anti-Money Laundering Compliance Officer, Van Kampen Exchange Corp. | N/A | N/A | ||||
Robert R. Leveille — 1969 Chief Compliance Officer | 2016 | Chief Compliance Officer, Invesco Advisers, Inc. (registered investment adviser); and Chief Compliance Officer, The Invesco Funds
Formerly: Chief Compliance Officer, Putnam Investments and the Putnam Funds | N/A | N/A |
The Statement of Additional Information of the Trust includes additional information about the Fund’s Trustees and is available upon request, without charge, by calling 1.800.959.4246. Please refer to the Fund’s Statement of Additional Information for information on the Fund’s sub-advisers.
Office of the Fund 11 Greenway Plaza, Suite 1000 Houston, TX 77046-1173 | Investment Adviser Invesco Advisers, Inc. 1555 Peachtree Street, N.E. Atlanta, GA 30309 | Distributor Invesco Distributors, Inc. 11 Greenway Plaza, Suite 1000 Houston, TX 77046-1173 | Auditors PricewaterhouseCoopers LLP 1000 Louisiana Street, Suite 5800 Houston, TX 77002-5678 | |||
Counsel to the Fund Stradley Ronon Stevens & Young, LLP 2005 Market Street, Suite 2600 Philadelphia, PA 19103-7018 | Counsel to the Independent Trustees Goodwin Procter LLP 901 New York Avenue, N.W. Washington, D.C. 20001 | Transfer Agent Invesco Investment Services, Inc. 11 Greenway Plaza, Suite 1000 Houston, TX 77046-1173 | Custodian State Street Bank and Trust Company 225 Franklin Street Boston, MA 02110-2801 | |||
T-4 Invesco Floating Rate Fund
Explore High-Conviction Investing with Invesco

Go paperless with eDelivery
Visit invesco.com/edelivery to enjoy the convenience and security of anytime electronic access to your investment documents.
With eDelivery, you can elect to have any or all of the following materials delivered straight to your inbox to download, save and print from your own computer:
| ∎ | Fund reports and prospectuses |
| ∎ | Quarterly statements |
| ∎ | Daily confirmations |
| ∎ | Tax forms |
Invesco mailing information
Send general correspondence to Invesco Investment Services, Inc., P.O. Box 219078, Kansas City, MO 64121-9078.
Important notice regarding delivery of security holder documents
To reduce Fund expenses, only one copy of most shareholder documents may be mailed to shareholders with multiple accounts at the same address (Householding). Mailing of your shareholder documents may be householded indefinitely unless you instruct us otherwise. If you do not want the mailing of these documents to be combined with those for other members of your household, please contact Invesco Investment Services, Inc. at 800 959 4246 or contact your financial institution. We will begin sending you individual copies for each account within 30 days after receiving your request.
Fund holdings and proxy voting information
The Fund provides a complete list of its holdings four times in each fiscal year, at the quarter ends. For the second and fourth quarters, the lists appear in the Fund’s semiannual and annual reports to shareholders. For the first and third quarters, the Fund files the lists with the Securities and Exchange Commission (SEC) on Form N-Q. The most recent list of portfolio holdings is available at invesco.com/completeqtrholdings. Shareholders can also look up the Fund’s Forms N-Q on the SEC website at sec.gov. Copies of the Fund’s Forms N-Q may be reviewed and copied at the SEC Public Reference Room in Washington, D.C. You can obtain information on the operation of the Public Reference Room, including information about duplicating fee charges, by calling 202 551 8090 or 800 732 0330, or by electronic request at the following email address: publicinfo@sec.gov. The SEC file numbers for the Fund are shown below.
A description of the policies and procedures that the Fund uses to determine how to vote proxies relating to portfolio securities is available without charge, upon request, from our Client Services department at 800 959 4246 or at invesco.com/proxyguidelines. The information is also available on the SEC website, sec.gov. Information regarding how the Fund voted proxies related to its portfolio securities during the most recent 12-month period ended June 30 is available at invesco.com/proxysearch. The information is also available on the SEC website, sec.gov. Invesco Advisers, Inc. is an investment adviser; it provides investment advisory services to individual and institutional clients and does not sell securities. Invesco Distributors, Inc. is the US distributor for Invesco Ltd.’s retail mutual funds, exchange-traded funds and institutional money market funds. Both are wholly owned, indirect subsidiaries of Invesco Ltd. |  |
| SEC file numbers: 811-09913 and 333-36074 | Invesco Distributors, Inc. | FLR-AR-1 | 10192017 | 1408 |
| ||||
 | Annual Report to Shareholders
| August 31, 2017
| ||
| ||||
Invesco Global Real Estate Income Fund
Nasdaq: A: ASRAX § B: SARBX § C: ASRCX § Y: ASRYX § R5: ASRIX § R6: ASRFX | ||||

Letters to Shareholders
Philip Taylor | Dear Shareholders: This annual report includes information about your Fund, including performance data and a complete list of its investments as of the close of the reporting period. Inside is a discussion of how your Fund was managed and the factors that affected its performance during the reporting period. The reporting period began with stock market volatility in the US and abroad, largely the result of uncertainty about global economic growth and monetary policy. While economic data in the US were generally positive, news overseas was less upbeat. The European Central Bank and central banks in China and Japan – as well as other countries – maintained extraordinarily accommodative monetary policies in response to economic weakness. Citing generally positive economic data – specifically, realized and expected labor market conditions and inflation – the US Federal Reserve raised interest rates three times during the reporting period: in December 2016, and in March and June 2017. The |

major US stock market rally that began in November 2016 continued through the end of the reporting period, with major stock market indexes repeatedly hitting new record highs.
Short-term market volatility can prompt some investors to abandon their investment plans – and can cause others to settle for whatever returns the market has to offer. The investment professionals at Invesco, in contrast, invest with high conviction. This means that, no matter the asset class or the strategy, each investment team has a passion to exceed. We want to help investors achieve better outcomes, such as seeking higher returns, helping mitigate risk and generating income. Of course, investing with high conviction can’t guarantee a profit or ensure success; no investment strategy can. To learn more about how we invest with high conviction, visit invesco.com/HighConviction.
You, too, can invest with high conviction by maintaining a long-term investment perspective and by working with your financial adviser on a regular basis. During periods of short-term market volatility or uncertainty, your financial adviser can keep you focused on your long-term investment goals – a new home, a child’s college education or a secure retirement. He or she also can share research about the economy, the markets and individual investment options.
Visit our website for more information on your investments
Our website, invesco.com/us, offers a wide range of market insights and investment perspectives. On the website, you’ll find detailed information about our funds, including performance, holdings and portfolio manager commentaries. You can access information about your account by completing a simple, secure online registration. To do so, select “Log In” on the right side of the homepage, and then select “Register for Individual Account Access.”
In addition to the resources accessible on our website and through our mobile app, you can obtain timely updates to help you stay informed about the markets and the economy by connecting with Invesco on Twitter, LinkedIn or Facebook. You can access our blog at blog.invesco.us.com. Our goal is to provide you the information you want, when and where you want it.
Finally, I’m pleased to share with you Invesco’s commitment to both the Principles for Responsible Investment and to considering environmental, social and governance issues in our robust investment process. I invite you to learn more at invesco.com/esg.
Have questions?
For questions about your account, contact an Invesco client services representative at 800 959 4246. For Invesco-related questions or comments, please email me directly at phil@invesco.com.
All of us at Invesco look forward to serving your investment management needs. Thank you for investing with us.
Sincerely,

Philip Taylor
Senior Managing Director, Invesco Ltd.
2 Invesco Global Real Estate Income Fund
Bruce Crockett | Dear Fellow Shareholders: Among the many important lessons I’ve learned in more than 40 years in a variety of business endeavors is the value of a trusted advocate. As independent chair of the Invesco Funds Board, I can assure you that the members of the Board are strong advocates for the interests of investors in Invesco’s mutual funds. We work hard to represent your interests through oversight of the quality of the investment management services your funds receive and other matters important to your investment, including but not limited to: ∎ Ensuring that Invesco offers a diverse lineup of mutual funds that your financial adviser can use to strive to meet your financial needs as your investment goals change over time. ∎ Monitoring how the portfolio management teams of the Invesco funds are performing in light of changing economic and market conditions. |

| ∎ | Assessing each portfolio management team’s investment performance within the context of the investment strategy described in the fund’s prospectus. |
| ∎ | Monitoring for potential conflicts of interests that may impact the nature of the services that your funds receive. |
We believe one of the most important services we provide our fund shareholders is the annual review of the funds’ advisory and sub-advisory contracts with Invesco Advisers and its affiliates. This review is required by the Investment Company Act of 1940 and focuses on the nature and quality of the services Invesco provides as the adviser to the Invesco funds and the reasonableness of the fees that it charges for those services. Each year, we spend months carefully reviewing information received from Invesco and a variety of independent sources, such as performance and fee data prepared by Lipper, Inc. (a subsidiary of Broadridge Financial Solutions, Inc.), an independent, third-party firm widely recognized as a leader in its field. We also meet with our independent legal counsel and other independent advisers to review and help us assess the information that we have received. Our goal is to assure that you receive quality investment management services for a reasonable fee.
I trust the measures outlined above provide assurance that you have a worthy advocate when it comes to choosing the Invesco Funds.
As always, please contact me at bruce@brucecrockett.com with any questions or concerns you may have. On behalf of the Board, we look forward to continuing to represent your interests and serving your needs.
Sincerely,

Bruce L. Crockett
Independent Chair
Invesco Funds Board of Trustees
3 Invesco Global Real Estate Income Fund
Management’s Discussion of Fund Performance
Performance summary
For the fiscal year ended August 31, 2017, Class A shares of Invesco Global Real Estate Income Fund (the Fund), at net asset value (NAV), outperformed the Fund’s style-specific benchmark, the Custom Invesco Global Real Estate Income Index.
Your Fund’s long-term performance appears later in this report.
Fund vs. Indexes
Total returns, 8/31/16 to 8/31/17, at net asset value (NAV). Performance shown does not include applicable contingent deferred sales charges (CDSC) or front-end sales charges, which would have reduced performance.
Class A Shares | 2.76 | % | ||
Class B Shares | 1.99 | |||
Class C Shares | 1.99 | |||
Class Y Shares | 2.91 | |||
Class R5 Shares | 3.10 | |||
Class R6 Shares | 3.09 | |||
MSCI World Indexq (Broad Market Index) | 16.19 | |||
Custom Invesco Global Real Estate Income Index∎ (Style-Specific Index) | –0.10 | |||
Lipper Global Real Estate Funds Classification Averaget (Peer Group) | 1.15 |
Source(s): qFactSet Research Systems Inc.; ∎Invesco, FactSet Research Systems Inc.; tLipper Inc.
Market conditions and your Fund
The fiscal year began with major stock market indexes posting gains, with most US-specific indexes hitting record highs following the US presidential election. Investors seemed to believe that the new administration’s plans to reduce tax rates, scale back regulations and increase infrastructure spending had the potential to stimulate economic growth. However, that was called into question in the first quarter of 2017, when headlines out of Washington, DC, suggested that enacting significant regulatory and tax reform might be more difficult than previously anticipated. Signs of an improving economy prompted the US Federal Reserve to raise interest rates three times during the reporting period: in December 2016 and in March and June 2017.
Outside the US, the decision by UK voters to leave the European Union continued to add political and economic uncertainty, while materially improved economic data and confidence surveys raised the prospect of quantitative easing
tapering in continental Europe. In Asia, export activity led to some sustained Japanese growth, while the Chinese economy continued to stabilize.
In most key real estate markets around the world, supply of newly developed buildings has been low since the global financial crisis, and vacancy levels have declined since 2009. This has resulted in many real estate markets, particularly those in the US, to experience rental growth as improved trade, employment and consumer spending is reflected in demand for space. However as the investment cycle matures, sectors with added supply could see a moderation in earnings growth. As such, the global real estate market was flat during the reporting period, underperforming most other areas of the market except for the energy sector.
We evaluate securities for the Fund based primarily on the relative attractiveness of income with a secondary consideration for the potential for capital appreciation. The qualified investment
universe includes global public real estate equity and debt securities, including common stock, preferred securities, corporate debt and commercial mortgage- backed securities (CMBS). When constructing the portfolio, we first set a strategic equity versus debt asset allocation and then apply a fundamentals-driven investment process in an effort to identify securities with certain characteristics, including: attractive relative yields, favorable property market outlook, and attractive valuations relative to peer investment alternatives.
On an absolute basis, convertible preferred securities, CMBS and corporate bonds had the greatest contribution to Fund performance. No security types detracted from the Fund’s absolute performance. Relative to the Fund’s style-specific benchmark, out-of-index exposure to CMBS and security selection among common stocks were beneficial. Ancillary cash was a relative detractor from performance.
From a country standpoint, the US was the largest absolute and relative contributor to Fund performance. Although Japan was the largest absolute detractor from Fund performance, underweight exposure to Japan was beneficial relative to the style-specific index. Security selection in Australia also helped relative performance. A combination of security selection and market allocation in Hong Kong, Germany, Singapore and Canada detracted from the Fund’s relative performance.
Top individual contributors to the Fund’s absolute performance included
American Tower and CyrusOne — both non-traditional real estate investment trusts (REITs). In general, non-traditional REITs such as wireless infrastructure and data centers exhibited favorable fundamental characteristics during the fiscal year. American Tower is an owner/operator of wireless infrastructure. We believed
Portfolio Composition |
| |||
By country | % of total net assets | |||
United States | 65.2 | % | ||
Japan | 6.8 | |||
Australia | 6.0 | |||
Hong Kong | 5.0 | |||
United Kingdom | 3.7 | |||
France | 3.0 | |||
Canada | 2.3 | |||
| Countries each less than 2.0% of portfolio | 6.3 | |||
| Money Market Funds Plus Other Assets Less Liabilities | 1.7 | |||
Top 10 Equity Holdings* | ||
| % of total net assets | ||
1. Simon Property Group, Inc. | 2.4% | |
2. AvalonBay Communities, Inc. | 2.2 | |
3. American Tower Corp.–Class A | 2.2 | |
4. Welltower Inc. | 1.8 | |
5. Unibail-Rodamco S.E. | 1.8 | |
6. Essex Property Trust, Inc. | 1.7 | |
7. Sun Hung Kai Properties Ltd. | 1.7 | |
8. Crown Castle International Corp. Series A, 6.88% Pfd. | 1.7 | |
9. Hudson Pacific Properties Inc. | 1.6 | |
10. Land Securities Group PLC | 1.5 |
Total Net Assets | $ | 927.8 million | ||
Total Number of Holdings* | 158 | |||
The Fund’s holdings are subject to change, and there is no assurance that the Fund will continue to hold any particular security.
*Excluding money market fund holdings.
Data presented here are as of August 31, 2017.
4 Invesco Global Real Estate Income Fund
tower companies were favorably positioned from a fundamental standpoint, with positive cash flow growth supported by continued adoption of smartphones. CyrusOne continued to benefit from strengthening conditions in the data center sector. Further, the company possessed an attractive relative value, trading at a discount when compared to its major data center peers.
Top individual detractors from the Fund’s absolute performance included Simon Property and Brixmor Property. Headlines relating to retail store closures and bankruptcy announcements increasingly gained investor attention during the fiscal year, resulting in underperformance for the regional mall and shopping center sectors. The store closure activity has generally been concentrated in lower-productivity malls as retailers continue to rationalize store counts in response to the changing retail landscape. Retailers are increasingly concentrating their store lineups in the highest-quality locations with the strongest shopper demographics, which we believe could favor the higher-quality mall and shopping center companies. Simon Property is the largest mall owner in the US, with a deep management team and strong execution track record. Further, we believe the company tends to trade at an attractive valuation versus its peers with above-average growth potential. We believe Brixmor Property, an owner of US shopping center assets, tends to trade at an attractive valuation relative to its peers with above-average cash flow and earnings growth potential. Recent management changes may improve current vacancy, select redevelopment of assets and mark-to-market of expiring leases.
Portfolio changes to the equity portion of the Fund reflected a desire to capture value opportunities within individual countries. Additionally, the Fund continued to focus on companies we believed may be able to grow their underlying cash flows and increase their dividends.
The fixed income portion of the Fund sought to minimize interest rate risk while maximizing return potential. Thus, we maintained a short duration on fixed income investments, as we believed interest rates could rise. Furthermore, a portion of fixed income investments were floating rate securities, which have yields that increase if interest rates rise.
For the preferred securities allocation, the Fund remained focused on higher-paying coupons with shorter-dated call schedules, which we believed may be less
volatile compared with those that have lower coupons and longer-dated call schedules.
The Fund has the flexibility to invest across equities and fixed income securities on a global basis, in an effort to take advantage of market dislocations driven by capital market influences rather than underlying commercial real estate fundamentals. We remain committed to owning quality real estate companies that we believe may benefit from sector trends. We continue to seek to manage risk by holding a portfolio that is diversified by property type and geographic location. We also continue to favor lower-leveraged companies with above-average levels of dividend coverage in the portfolio.
We thank you for your continued investment in Invesco Global Real Estate Income Fund.
The views and opinions expressed in management’s discussion of Fund performance are those of Invesco Advisers, Inc. These views and opinions are subject to change at any time based on factors such as market and economic conditions. These views and opinions may not be relied upon as investment advice or recommendations, or as an offer for a particular security. The information is not a complete analysis of every aspect of any market, country, industry, security or the Fund. Statements of fact are from sources considered reliable, but Invesco Advisers, Inc. makes no representation or warranty as to their completeness or accuracy. Although historical performance is no guarantee of future results, these insights may help you understand our investment management philosophy.
See important Fund and, if applicable, index disclosures later in this report.
 | Joe Rodriguez, Jr. Portfolio Manager, is lead manager of Invesco Global Real Estate Income Fund. He is Head of Global Securities with |
Invesco Real Estate, where he oversees all phases of the unit, including securities research and administration. Mr. Rodriguez joined Invesco in 1990. He earned a BBA in economics and finance and an MBA in finance from Baylor University.
 | Mark Blackburn Chartered Financial |
joined Invesco in 1998. Mr. Blackburn earned a BS in accounting from Louisiana State University and an MBA from Southern Methodist University. He is also a Certified Public Accountant.
 | James Cowen Portfolio Manager, is |
Mr. Cowen earned a Master of Town and Country Planning degree from the University of Manchester and a Master of Philosophy degree in land economy from Cambridge University.
 | Paul Curbo Chartered Financial |
joined Invesco in 1998. Mr. Curbo earned a BBA in finance from The University of Texas at Austin.
 | Darin Turner Portfolio Manager, is |
Mr. Turner earned a BBA in finance from Baylor University, an MS in real estate from The University of Texas at Arlington and an MBA specializing in investments from Southern Methodist University.
 | Ping-Ying Wang Chartered Financial |
She joined Invesco in 1998. Ms. Wang earned a BS in international finance from the People’s University of China and a PhD in finance from The University of Texas at Dallas.
5 Invesco Global Real Estate Income Fund
Your Fund’s Long-Term Performance
Results of a $10,000 Investment – Oldest Share Class(es)
Fund and index data from 8/31/07
| 1 | Source: FactSet Research Systems Inc. |
| 2 | Source(s): Invesco, FactSet Research Systems Inc. |
| 3 | Source: Lipper Inc. |
Past performance cannot guarantee comparable future results
The data shown in the chart include reinvested distributions, applicable sales charges and Fund expenses including
management fees. Index results include reinvested dividends, but they do not reflect sales charges. Performance of the peer group, if applicable, reflects fund expenses and management fees;
performance of a market index does not. Performance shown in the chart and table(s) does not reflect deduction of taxes a shareholder would pay on Fund distributions or sale of Fund shares.
continued from page 9
About indexes used in this report
| ∎ | The MSCI World IndexSM is an unmanaged index considered representative of stocks of developed countries. The index is computed using the net return, which withholds applicable taxes for non-resident investors. |
| ∎ | The Custom Invesco Global Real Estate Income Index is an index composed of FTSE NAREIT All Equity REITs Index through August 31, 2011, and FTSE EPRA/NAREIT Developed Index, which is computed using the net return by withholding applicable taxes, thereafter. |
| ∎ | The Lipper Global Real Estate Funds Classification Average represents an average of all funds in the Lipper Global Real Estate Funds classification. |
| ∎ | The FTSE NAREIT All Equity REITs Index is an unmanaged index considered representative of US REITs. |
| ∎ | The FTSE EPRA/NAREIT Developed Index is an unmanaged index considered representative of listed real estate companies and REITs worldwide. |
| ∎ | The Fund is not managed to track the performance of any particular index, including the index(es) described here, and consequently, the performance of the Fund may deviate significantly from the performance of the index(es). |
| ∎ | A direct investment cannot be made in an index. Unless otherwise indicated, index results include reinvested dividends, and they do not reflect sales charges. Performance of the peer group, if applicable, reflects fund expenses; performance of a market index does not. |
Other information
| ∎ | CPA® and Certified Public Accountant® are trademarks owned by the American Institute of Certified Public Accountants. |
| ∎ | The returns shown in management’s discussion of Fund performance are based on net asset values (NAVs) calculated for shareholder transactions. Generally accepted accounting principles require adjustments to be made to the net assets of the Fund at period end for financial reporting purposes, and as |
such, the NAVs for shareholder transactions and the returns based on those NAVs may differ from the NAVs and returns reported in the Financial Highlights.
| ∎ | Industry classifications used in this report are generally according to the Global Industry Classification Standard, which was developed by and is the exclusive property and a service mark of MSCI Inc. and Standard & Poor’s. |
6 Invesco Global Real Estate Income Fund
Average Annual Total Returns As of 8/31/17, including maximum applicable sales charges
|
| |||
Class A Shares | ||||
Inception (5/31/02) | 8.23 | % | ||
10 Years | 3.88 | |||
5 Years | 4.49 | |||
1 Year | -2.88 | |||
Class B Shares | ||||
Inception (3/9/07) | 3.19 | % | ||
10 Years | 3.85 | |||
5 Years | 4.55 | |||
1 Year | -2.95 | |||
Class C Shares | ||||
Inception (3/9/07) | 3.01 | % | ||
10 Years | 3.69 | |||
5 Years | 4.88 | |||
1 Year | 1.00 | |||
Class Y Shares | ||||
10 Years | 4.67 | % | ||
5 Years | 5.93 | |||
1 Year | 2.91 | |||
Class R5 Shares | ||||
Inception (3/9/07) | 4.19 | % | ||
10 Years | 4.88 | |||
5 Years | 6.04 | |||
1 Year | 3.10 | |||
Class R6 Shares | ||||
10 Years | 4.69 | % | ||
5 Years | 6.11 | |||
1 Year | 3.09 | |||
Average Annual Total Returns As of 6/30/17, the most recent calendar quarter end, including maximum applicable sales charges
|
| |||
Class A Shares | ||||
Inception (5/31/02) | 8.15 | % | ||
10 Years | 3.34 | |||
5 Years | 4.70 | |||
1 Year | -3.44 | |||
Class B Shares | ||||
Inception (3/9/07) | 3.01 | % | ||
10 Years | 3.32 | |||
5 Years | 4.73 | |||
1 Year | -3.51 | |||
Class C Shares | ||||
Inception (3/9/07) | 2.83 | % | ||
10 Years | 3.15 | |||
5 Years | 5.09 | |||
1 Year | 0.42 | |||
Class Y Shares | ||||
10 Years | 4.12 | % | ||
5 Years | 6.13 | |||
1 Year | 2.42 | |||
Class R5 Shares | ||||
Inception (3/9/07) | 4.00 | % | ||
10 Years | 4.33 | |||
5 Years | 6.22 | |||
1 Year | 2.50 | |||
Class R6 Shares | ||||
10 Years | 4.14 | % | ||
5 Years | 6.32 | |||
1 Year | 2.60 | |||
period involved. The CDSC on Class B shares declines from 5% beginning at the time of purchase to 0% at the beginning of the seventh year. The CDSC on Class C shares is 1% for the first year after purchase. Class Y, Class R5 and Class R6 shares do not have a front-end sales charge or a CDSC; therefore, performance is at net asset value
The performance of the Fund’s share classes will differ primarily due to different sales charge structures and class expenses
Fund performance reflects any applicable fee waivers and/or expense reimbursements. Had the adviser not waived fees and/or reimbursed expenses currently or in the past, returns would have been lower. See current prospectus for more information
Fund performance was positively impacted by a temporary 2% fee on redemptions that was in effect from March 12, 2007 to March 12, 2008. Without income from this temporary fee, returns would have been lower.
On March 12, 2007, the Fund reorganized from a Closed-End Fund to an Open-End Fund. Performance shown prior to that date is that of the Closed-End Fund’s Common shares and includes the fees applicable to Common shares.
Class Y shares incepted on October 3, 2008. Performance shown prior to that date is that of Class A shares and includes the 12b-1 fees applicable to Class A shares.
Class R6 shares incepted on September 24, 2012. Performance shown prior to that date is that of Class A shares and includes the 12b-1 fees applicable to Class A shares.
The performance data quoted represent past performance and cannot guarantee comparable future results; current performance may be lower or higher. Please visit invesco.com/performance for the most recent month-end performance. Performance figures reflect reinvested distributions (reinvested at net asset value, except for periods prior to
March 12, 2007 where reinvestments were made at the lower of the Closed-End Fund’s net asset value or market price), changes in net asset value and the effect of the maximum sales charge unless otherwise stated. Investment return and principal value will fluctuate so that you may have a gain or loss when you sell shares.
The total annual Fund operating expense ratio set forth in the most recent Fund prospectus as of the date of this report for Class A, Class B, Class C, Class Y, Class R5 and Class R6 shares was 1.24%, 1.99%, 1.99%, 0.99%, 0.90% and 0.82%, respectively. The expense ratios presented above may vary from the expense ratios presented in other sections of this report that are based on expenses incurred during the period covered by this report.
Class A share performance reflects the maximum 5.50% sales charge, and Class B and Class C share performance reflects the applicable contingent deferred sales charge (CDSC) for the
7 Invesco Global Real Estate Income Fund
Invesco Global Real Estate Income Fund’s investment objective is current income and, secondarily, capital appreciation.
| ∎ | Unless otherwise stated, information presented in this report is as of August 31, 2017, and is based on total net assets. |
| ∎ | Unless otherwise noted, all data provided by Invesco. |
| ∎ | To access your Fund’s reports/prospectus, visit invesco.com/fundreports. |
About share classes
| ∎ | On March 12, 2007, Invesco Select Real Estate Income Fund was reorganized from a Closed-End Fund to an Open-End Fund. Information presented for Class A shares prior to the reorganization included financial data for the Closed-End Fund’s Common Shares |
| ∎ | Class B shares may not be purchased for new or additional investments. Please see the prospectus for more information. |
| ∎ | Class Y shares are available only to certain investors. Please see the prospectus for more information. |
| ∎ | Class R5 shares and Class R6 shares are available for use by retirement plans that meet certain standards and for institutional investors. Class R6 shares are also available through intermediaries that have established an agreement with Invesco Distributors, Inc. to make such shares available for use in retail omnibus accounts. Please see the prospectus for more information. |
Principal risks of investing
in the Fund
| ∎ | Changing fixed income market conditions risk. The current low interest rate environment was created in part by the Federal Reserve Board (FRB) and certain foreign central banks keeping the federal funds and equivalent foreign rates near, at or below zero. Increases in the federal funds and equivalent foreign rates may expose fixed income markets to heightened volatility and reduced liquidity for certain fixed income investments, particularly those with longer maturities. In addition, decreases in fixed income dealer market-making capacity may also potentially lead to heightened volatility and reduced liquidity in the fixed income markets. As a result, the value of the Fund’s investments and share price may decline. Changes in central bank policies could also result in higher than normal shareholder redemptions, which could |
potentially increase portfolio turnover and the Fund’s transaction costs. |
| ∎ | Convertible securities risk. The market values of convertible securities are affected by market interest rates, the risk of actual issuer default on interest or principal payments and the value of the underlying common stock into which the convertible security may be converted. Additionally, a convertible security is subject to the same types of market and issuer risks as apply to the underlying common stock. In addition, certain convertible securities are subject to involuntary conversions and may undergo principal write-downs upon the occurrence of certain triggering events, and, as a result, are subject to an increased risk of loss. Convertible securities may be rated below investment grade. |
| ∎ | Debt securities risk. The prices of debt securities held by the Fund will be affected by changes in interest rates, the creditworthiness of the issuer and other factors. An increase in prevailing interest rates typically causes the value of existing debt securities to fall and often has a greater impact on longer-duration debt securities and higher quality debt securities. Falling interest rates will cause the Fund to reinvest the proceeds of debt securities that have been repaid by the issuer at lower interest rates. Falling interest rates may also reduce the Fund’s distributable income because interest payments on floating rate debt instruments held by the Fund will decline. The Fund could lose money on investments in debt securities if the issuer or borrower fails to meet its obligations to make interest payments and/or to repay principal in a timely manner. Changes in an issuer’s financial strength, the market’s perception of such strength or in the credit rating of the issuer or the security may affect the value of debt securities. The Adviser’s credit analysis may fail to anticipate such changes, which could result in buying a debt security at an |
inopportune time or failing to sell a debt security in advance of a price decline or other credit event. |
| ∎ | Depositary receipts risk. Investing in depositary receipts involves the same risks as direct investments in foreign securities. In addition, the underlying issuers of certain depositary receipts are under no obligation to distribute shareholder communications or pass through any voting rights with respect to the deposited securities to the holders of such receipts. The Fund may therefore receive less timely information or have less control than if it invested directly in the foreign issuer. |
| ∎ | Derivatives risk. The value of a derivative instrument depends largely on (and is derived from) the value of an underlying security, currency, commodity, interest rate, index or other asset (each referred to as an underlying asset). In addition to risks relating to the underlying assets, the use of derivatives may include other, possibly greater, risks, including counterparty, leverage and liquidity risks. Counterparty risk is the risk that the counterparty to the derivative contract will default on its obligation to pay the Fund the amount owed or otherwise perform under the derivative contract. Derivatives create leverage risk because they do not require payment up front equal to the economic exposure created by owning the derivative. As a result, an adverse change in the value of the underlying asset could result in the Fund sustaining a loss that is substantially greater than the amount invested in the derivative, which may make the Fund’s returns more volatile and increase the risk of loss. Derivative instruments may also be less liquid than more traditional investments and the Fund may be unable to sell or close out its derivative positions at a desirable time or price. This risk may be more acute under adverse market conditions, during which the Fund may be most in need of liquidating its derivative positions. Derivatives may also be harder to value, less tax efficient and subject to changing government regulation that could impact the Fund’s ability to use certain derivatives or their cost. Also, derivatives used for hedging or to gain or limit exposure to a particular market segment may not provide |
| This report must be accompanied or preceded by a currently effective Fund prospectus, which contains more complete information, including sales charges and expenses. Investors should read it carefully before investing. |
NOT FDIC INSURED | MAY LOSE VALUE | NO BANK GUARANTEE |
8 Invesco Global Real Estate Income Fund
| the expected benefits, particularly during adverse market conditions. |
| ∎ | Emerging markets securities risk. Emerging markets (also referred to as developing markets) are generally subject to greater market volatility, political, social and economic instability, uncertain trading markets and more governmental limitations on foreign investment than more developed markets. In addition, companies operating in emerging markets may be subject to lower trading volume and greater price fluctuations than companies in more developed markets. Securities law and the enforcement of systems of taxation in many emerging market countries may change quickly and unpredictably. In addition, investments in emerging markets securities may also be subject to additional transaction costs, delays in settlement procedures, and lack of timely information. |
| ∎ | Foreign securities risk. The Fund’s foreign investments may be adversely affected by political and social instability, changes in economic or taxation policies, difficulty in enforcing obligations, decreased liquidity or increased volatility. Foreign investments also involve the risk of the possible seizure, nationalization or expropriation of the issuer or foreign deposits (in which the Fund could lose its entire investments in a certain market) and the possible adoption of foreign governmental restrictions such as exchange controls. Unless the Fund has hedged its foreign securities risk, foreign securities risk also involves the risk of negative foreign currency rate fluctuations, which may cause the value of securities denominated in such foreign currency (or other instruments through which the Fund has exposure to foreign currencies) to decline in value. Currency exchange rates may fluctuate significantly over short periods of time. Currency hedging strategies, if used, are not always successful. |
| ∎ | Geographic focus risk. The Fund may from time to time invest a substantial amount of its assets in securities of issuers located in a single country or a limited number of countries. Adverse economic, political or social conditions in those countries may therefore have a significant negative impact on the Fund’s investment performance. |
| ∎ | High yield debt securities (junk bond) risk. Investments in high yield debt securities (“junk bonds”) and other lower-rated securities will subject the Fund to substantial risk of loss. These securities are considered to be speculative with |
| respect to the issuer’s ability to pay interest and principal when due, are more susceptible to default or decline in market value and are less liquid than investment grade debt securities. Prices of high yield debt securities tend to be very volatile. |
| ∎ | Management risk. The Fund is actively managed and depends heavily on the Adviser’s judgment about markets, interest rates or the attractiveness, relative values, liquidity, or potential appreciation of particular investments made for the Fund’s portfolio. The Fund could experience losses if these judgments prove to be incorrect. Additionally, legislative, regulatory, or tax developments may adversely affect management of the Fund and, therefore, the ability of the Fund to achieve its investment objective. |
| ∎ | Market risk. The market values of the Fund’s investments, and therefore the value of the Fund’s shares, will go up and down, sometimes rapidly or unpredictably. Market risk may affect a single issuer, industry or section of the economy, or it may affect the market as a whole. Individual stock prices tend to go up and down more dramatically than those of certain other types of investments, such as bonds. During a general downturn in the financial markets, multiple asset classes may decline in value. When markets perform well, there can be no assurance that specific investments held by the Fund will rise in value. |
| ∎ | Mortgage- and asset-backed securities risk. Mortgage- and asset-backed securities, including collateralized debt obligations and collateralized mortgage obligations, are subject to prepayment or call risk, which is the risk that a borrower’s payments may be received earlier or later than expected due to changes in prepayment rates on underlying loans. This could result in the Fund reinvesting these early payments at lower interest rates, thereby reducing the Fund’s income. Mortgage- and asset-backed securities also are subject to extension risk, which is the risk that an unexpected rise in interest rates could reduce the rate of prepayments, causing the price of the mortgage- and asset-backed securities and the Fund’s share price to fall. An unexpectedly high rate of defaults on the mortgages held by a mortgage pool may adversely affect the value of mortgage-backed securities and could result in losses to the Fund. Privately issued mortgage-related securities are not subject to the same underwriting requirements as those with government or government- |
| sponsored entity guarantees and, therefore, mortgage loans underlying privately issued mortgage-related securities may have less favorable collateral, credit risk or other underwriting characteristics, and wider variances in interest rate, term, size, purpose and borrower characteristics. |
| ∎ | Preferred securities risk. Preferred securities are subject to issuer-specific and market risks applicable generally to equity securities. Preferred securities also may be subordinated to bonds or other debt instruments, subjecting them to a greater risk of non-payment, may be less liquid than many other securities, such as common stocks, and generally offer no voting rights with respect to the issuer. |
| ∎ | REIT risk/real estate risk. The Fund concentrates its investments in the securities of real estate and real estate related companies. Investments in real estate related instruments may be affected by economic, legal, cultural, environmental or technological factors that affect property values, rents or occupancies of real estate related to the Fund’s holdings. Shares of real estate related companies, which tend to be small- and mid-cap companies, may be more volatile and less liquid than larger companies. If a real estate related company defaults on certain types of debt obligations, the Fund may own real estate directly, which involves additional risks such as environmental liabilities; difficulty in valuing and selling the real estate; and economic or regulatory changes. |
| ∎ | Small- and mid-capitalization companies risks. Small- and mid-capitalization companies tend to be more vulnerable to changing market conditions, may have little or no operating history or track record of success, and may have more limited product lines and markets, less experienced management and fewer financial resources than larger companies. These companies’ securities may be more volatile and less liquid than those of more established companies, and their returns may vary, sometimes significantly, from the overall securities market. |
continued on page 6
9 Invesco Global Real Estate Income Fund
Schedule of Investments
August 31, 2017
| Shares | Value | |||||||
Real Estate Investment Trusts, Common Stocks & Other Equity Interests–64.18% |
| |||||||
| Australia–5.20% | ||||||||
Dexus | 857,549 | $ | 6,546,424 | |||||
Goodman Group | 1,301,843 | 8,592,954 | ||||||
GPT Group (The) | 1,580,771 | 6,315,699 | ||||||
Mirvac Group | 2,080,198 | 3,858,214 | ||||||
Scentre Group | 707,485 | 2,180,799 | ||||||
Stockland | 2,156,773 | 7,604,742 | ||||||
Westfield Corp. | 2,213,564 | 13,126,437 | ||||||
| 48,225,269 | ||||||||
| Canada–2.30% | ||||||||
H&R REIT | 656,500 | 11,229,951 | ||||||
Killam Apartment REIT | 46,533 | 485,192 | ||||||
Pembina Pipeline Corp. | 161,214 | 5,196,495 | ||||||
RioCan REIT | 135,700 | 2,586,418 | ||||||
Smart REIT | 73,700 | 1,796,021 | ||||||
| 21,294,077 | ||||||||
| China–0.38% | ||||||||
Shenzhen Investment Ltd. | 2,944,000 | 1,343,021 | ||||||
Shimao Property Holdings Ltd. | 1,035,000 | 2,139,403 | ||||||
| 3,482,424 | ||||||||
| France–2.97% | ||||||||
ICADE | 51,270 | 4,557,018 | ||||||
Klepierre S.A. | 163,714 | 6,597,416 | ||||||
Unibail-Rodamco S.E. | 64,383 | 16,392,119 | ||||||
| 27,546,553 | ||||||||
| Germany–1.18% | ||||||||
Deutsche Euroshop AG | 44,821 | 1,770,198 | ||||||
Grand City Properties S.A. | 153,354 | 3,340,993 | ||||||
LEG Immobilien AG | 26,520 | 2,680,468 | ||||||
Vonovia SE | 75,659 | 3,198,008 | ||||||
| 10,989,667 | ||||||||
| Hong Kong–5.06% | ||||||||
Hang Lung Properties Ltd. | 2,518,000 | 6,135,868 | ||||||
Hongkong Land Holdings Ltd. | 315,800 | 2,341,805 | ||||||
i-CABLE Communications Ltd.(a) | 255,841 | 9,507 | ||||||
Link REIT | 570,500 | 4,719,759 | ||||||
New World Development Co. Ltd. | 4,521,000 | 6,200,321 | ||||||
Sun Hung Kai Properties Ltd. | 959,000 | 16,004,370 | ||||||
Swire Properties Ltd. | 1,884,200 | 6,534,389 | ||||||
Wharf (Holdings) Ltd. (The) | 523,000 | 4,995,734 | ||||||
| 46,941,753 | ||||||||
| Japan–6.81% | ||||||||
Activia Properties, Inc. | 483 | 2,123,789 | ||||||
Advance Residence Investment Corp. | 784 | 2,009,811 | ||||||
AEON REIT Investment Corp. | 1,735 | 1,879,076 | ||||||
| Shares | Value | |||||||
| Japan–(continued) | ||||||||
GLP J-REIT | 5,476 | $ | 5,847,043 | |||||
Hulic Reit, Inc. | 2,092 | 3,167,967 | ||||||
Japan Excellent, Inc. | 1,541 | 1,851,442 | ||||||
Japan Logistics Fund Inc. | 912 | 1,858,838 | ||||||
Japan Real Estate Investment Corp. | 348 | 1,804,093 | ||||||
Japan Retail Fund Investment Corp. | 1,120 | 2,060,719 | ||||||
Kenedix Office Investment Corp. | 1,044 | 5,964,929 | ||||||
Kenedix Retail REIT Corp. | 838 | 1,847,792 | ||||||
Mitsubishi Estate Co., Ltd. | 424,000 | 7,315,968 | ||||||
Mitsui Fudosan Co., Ltd. | 590,000 | 12,790,872 | ||||||
Nippon Prologis REIT Inc. | 1,836 | 3,987,602 | ||||||
ORIX JREIT Inc. | 1,492 | 2,155,150 | ||||||
Tokyo Tatemono Co., Ltd. | 102,500 | 1,266,354 | ||||||
United Urban Investment Corp. | 3,455 | 5,219,503 | ||||||
| 63,150,948 | ||||||||
| Netherlands–0.74% | ||||||||
Wereldhave N.V. | 140,537 | 6,886,411 | ||||||
| Singapore–1.55% | ||||||||
Ascendas REIT | 2,052,700 | 4,032,143 | ||||||
CapitaLand Mall Trust | 796,700 | 1,275,049 | ||||||
Mapletree Commercial Trust | 2,264,400 | 2,563,503 | ||||||
Mapletree Industrial Trust | 4,774,200 | 6,531,559 | ||||||
| 14,402,254 | ||||||||
| South Africa–0.24% | ||||||||
SA Corporate Real Estate Ltd. | 5,423,479 | 2,255,301 | ||||||
| Spain–0.55% | ||||||||
Ferrovial, S.A. | 125,074 | 2,852,746 | ||||||
Inmobiliaria Colonial S.A. | 225,107 | 2,200,660 | ||||||
| 5,053,406 | ||||||||
| Sweden–0.83% | ||||||||
Castellum AB | 174,620 | 2,734,173 | ||||||
Wihlborgs Fastigheter AB | 206,096 | 5,003,955 | ||||||
| 7,738,128 | ||||||||
| Switzerland–0.53% | ||||||||
Swiss Prime Site AG(a) | 54,152 | 4,902,371 | ||||||
| United Kingdom–2.64% | ||||||||
Hansteen Holdings PLC | 1,105,229 | 1,893,799 | ||||||
Land Securities Group PLC | 1,027,469 | 13,420,102 | ||||||
SEGRO PLC | 866,317 | 6,027,328 | ||||||
UNITE Group PLC (The) | 353,449 | 3,167,566 | ||||||
| 24,508,795 | ||||||||
| United States–33.20% | ||||||||
American Campus Communities, Inc. | 214,730 | 10,219,001 | ||||||
American Tower Corp.–Class A | 137,052 | 20,290,549 | ||||||
Apple Hospitality REIT, Inc. | 657,545 | 11,954,168 | ||||||
See accompanying Notes to Financial Statements which are an integral part of the financial statements.
10 Invesco Global Real Estate Income Fund
| Shares | Value | |||||||
| United States–(continued) | ||||||||
AvalonBay Communities, Inc. | 109,805 | $ | 20,613,693 | |||||
Boston Properties, Inc. | 70,011 | 8,443,327 | ||||||
Brixmor Property Group, Inc. | 380,672 | 7,126,180 | ||||||
Crown Castle International Corp. | 99,753 | 10,817,215 | ||||||
CyrusOne Inc. | 158,714 | 10,003,743 | ||||||
DCT Industrial Trust Inc. | 55,345 | 3,229,381 | ||||||
EastGroup Properties, Inc. | 27,981 | 2,486,392 | ||||||
EnLink Midstream LLC | 270,607 | 4,613,849 | ||||||
Essex Property Trust, Inc. | 60,471 | 16,083,472 | ||||||
Extra Space Storage Inc. | 104,940 | 8,146,492 | ||||||
Federal Realty Investment Trust | 70,751 | 8,980,424 | ||||||
Host Hotels & Resorts Inc. | 427,464 | 7,745,648 | ||||||
Hudson Pacific Properties Inc. | 438,303 | 14,463,999 | ||||||
InfraREIT, Inc. | 330,331 | 7,429,144 | ||||||
Lamar Advertising Co.–Class A | 78,864 | 5,249,188 | ||||||
Liberty Property Trust | 270,914 | 11,540,936 | ||||||
Life Storage, Inc. | 61,595 | 4,532,776 | ||||||
Macquarie Infrastructure Corp. | 58,714 | 4,373,019 | ||||||
Mid-America Apartment Communities, Inc. | 8,940 | 951,752 | ||||||
National Retail Properties, Inc. | 159,980 | 6,691,963 | ||||||
Pattern Energy Group Inc. | 251,408 | 6,315,369 | ||||||
Pebblebrook Hotel Trust | 306,407 | 10,292,211 | ||||||
Public Storage | 31,485 | 6,465,130 | ||||||
QTS Realty Trust, Inc.–Class A | 97,775 | 5,297,450 | ||||||
Realty Income Corp. | 71,624 | 4,122,677 | ||||||
Retail Opportunity Investments Corp. | 240,239 | 4,766,342 | ||||||
RLJ Lodging Trust | 183,602 | 3,705,088 | ||||||
Simon Property Group, Inc. | 143,841 | 22,561,461 | ||||||
Terreno Realty Corp. | 140,020 | 5,075,725 | ||||||
Ventas, Inc. | 177,417 | 12,142,419 | ||||||
Vornado Realty Trust | 58,482 | 4,356,324 | ||||||
Welltower Inc. | 231,046 | 16,917,188 | ||||||
| 308,003,695 | ||||||||
Total Real Estate Investment Trusts, Common Stocks & Other Equity Interests |
| 595,381,052 | ||||||
| Principal Amount | ||||||||
Mortgage-Backed Securities–18.74% |
| |||||||
| Ireland–0.30% | ||||||||
Taurus Ltd., REGS, Series 2015-DE2, Class E, Floating Rate Pass Through Ctfs., 3.40% (3 mo. EURIBOR + 3.50%), 02/1/2026(b)(c)(d) | EUR | 2,300,000 | 2,787,023 | |||||
| United Kingdom–1.05% | ||||||||
Logistics UK PLC, Series 2015-1A, Class E, Floating Rate Pass Through Ctfs., 3.68% (3 mo. GBP LIBOR + 3.40%), 08/20/2025(b)(c)(d) | GBP | 7,500,000 | 9,748,736 | |||||
| Principal Amount | Value | |||||||
| United States–17.39% | ||||||||
Banc of America Merrill Lynch Commercial Mortgage Inc., Series 2005-5, Class F, Variable Rate Pass Through Ctfs., 5.62%, 10/10/2045(c)(e) | $ | 5,800,000 | $ | 5,928,523 | ||||
Banc of America Merrill Lynch Large Loan Inc., | 6,650,000 | 5,740,779 | ||||||
Series 2014-ICTS, Class E, Floating Rate Pass Through Ctfs., 4.18% (1 mo. USD LIBOR + 2.95%), 06/15/2028(b)(c) | 11,750,000 | 11,698,403 | ||||||
Series 2015-ASHF, Class E, Floating Rate Pass Through Ctfs., 5.23% (1 mo. USD LIBOR + 4.00%), 01/15/2028(b)(c) | 1,400,000 | 1,401,869 | ||||||
Series 2016-FR13, Class A, Variable Rate Pass Through Ctfs., 1.71%, 08/27/2045(c)(e) | 5,000,000 | 4,546,120 | ||||||
Series 2016-FR13, Class B, Variable Rate Pass Through Ctfs., 1.99%, 08/27/2045(c)(e) | 10,308,000 | 8,063,485 | ||||||
Bear Stearns Commercial Mortgage Securities Trust, | 4,801 | 4,798 | ||||||
CGBAM Commercial Mortgage Trust, Series 2015-SMRT, Class E, Variable Rate Pass Through Ctfs., 3.91%, 04/10/2028(c)(e) | 9,800,000 | 9,885,789 | ||||||
Commercial Mortgage Trust, Series 2014-UBS4, Class D, Variable Rate Pass Through Ctfs., 4.84%, 08/10/2047(c)(e) | 14,500,000 | 13,117,064 | ||||||
GS Mortgage Securities Trust, Series 2011-GC3, Class E, Variable Rate Pass Through Ctfs., 5.00%, 03/10/2044(c)(e) | 8,605,000 | 7,923,402 | ||||||
Series 2011-GC3, Class F, Variable Rate Pass Through Ctfs., 5.00%, 03/10/2044(c)(e) | 4,900,000 | 4,528,458 | ||||||
JP Morgan Chase Commercial Mortgage Securities Trust, Series 2011-C4, Class TAC1, Pass Through Ctfs., 7.99%, 07/15/2046(c) | 1,762,326 | 1,778,460 | ||||||
Series 2012-C8, Class E, Variable Rate Pass Through Ctfs., 4.81%, 10/15/2045(c)(e) | 7,805,000 | 7,566,179 | ||||||
Series 2013-LC11, Class D, Variable Rate Pass Through Ctfs., 4.40%, 04/15/2046(e) | 12,749,000 | 11,869,729 | ||||||
Series 2015-FRR2, Class AK36, Variable Rate Pass Through Ctfs., 2.30%, 12/27/2046(c)(e) | 9,890,000 | 9,011,979 | ||||||
JPMBB Commercial Mortgage Securities Trust, | 10,000,000 | 9,448,069 | ||||||
See accompanying Notes to Financial Statements which are an integral part of the financial statements.
11 Invesco Global Real Estate Income Fund
| Principal Amount | Value | |||||||
| United States–(continued) | ||||||||
Morgan Stanley Bank of America Merrill Lynch Trust, | $ | 13,590,000 | $ | 12,722,867 | ||||
Series 2013-C12, Class D, Variable Rate Pass Through Ctfs., 4.92%, 10/15/2046(c)(e) | 13,510,000 | 13,034,752 | ||||||
Morgan Stanley Capital I Trust, | 208,975 | 208,846 | ||||||
Series 2006-IQ11, Class B, Variable Rate Pass Through Ctfs., 6.38%, 10/15/2042(e) | 270,000 | 267,974 | ||||||
Starwood Retail Property Trust, Series 2014-STAR, Class E, Floating Rate Pass Through Ctfs., 5.38% (1 mo. USD LIBOR + 4.15%), 11/15/2027(b)(c) | 12,200,000 | 11,744,684 | ||||||
Wachovia Bank Commercial Mortgage Trust, Series 2005-C16, Class H, Variable Rate Pass Through Ctfs., 5.39%, 10/15/2041(c)(e) | 131,185 | 131,349 | ||||||
WFRBS Commercial Mortgage Trust, Series 2013-C12, Class D, Variable Rate Pass Through Ctfs., 4.49%, 03/15/2048(c)(e) | 11,279,000 | 10,725,600 | ||||||
| 161,349,178 | ||||||||
Total Mortgage-Backed Securities (Cost $170,365,053) | 173,884,937 | |||||||
| Shares | ||||||||
Preferred Stocks–14.29% |
| |||||||
| Australia–0.52% | ||||||||
Goodman PLUS Trust, REGS, | 60,179 | 4,845,206 | ||||||
| United States–13.77% | ||||||||
American Homes 4 Rent, Series D, 6.50% Pfd. | 34,873 | 941,571 | ||||||
American Homes 4 Rent, Series E, 6.35% Pfd. | 98,232 | 2,611,989 | ||||||
American Homes 4 Rent, Series G, 5.88% Pfd. | 80,000 | 2,026,400 | ||||||
American Homes 4 Rent, Series F, 5.88% Pfd. | 96,000 | 2,470,080 | ||||||
American Tower Corp., Series B, $5.50 Conv. Pfd. | 90,100 | 11,753,545 | ||||||
CoreSite Realty Corp., Series A, 7.25% Pfd. | 408,585 | 10,427,089 | ||||||
Crown Castle International Corp., Series A, $0.12 Conv. Pfd. | 13,936 | 15,461,992 | ||||||
DDR Corp., Series J, 6.50% Pfd. | 25,000 | 636,500 | ||||||
DDR Corp., Series K, 6.25% Pfd. | 92,654 | 2,362,677 | ||||||
Digital Realty Trust, Inc., Series H, 7.38% Pfd. | 72,477 | 1,968,475 | ||||||
| Shares | Value | |||||||
| United States–(continued) | ||||||||
Digital Realty Trust, Inc., Series I, 6.35% Pfd. | 170,000 | $ | 4,593,400 | |||||
Dominion Energy, Inc., Series A, $3.38 Conv. Investment Units | 71,900 | 3,697,817 | ||||||
Eagle Hospitality Properties Trust Inc., Series A, 8.25% Pfd. | 195,800 | 12,257 | ||||||
EPR Properties, Series F, 6.63% Pfd. | 30,000 | 762,600 | ||||||
Equity LifeStyle Properties, Inc., Series C, 6.75% Pfd. | 50,000 | 1,268,000 | ||||||
GGP Inc., Series A, 6.38% Pfd. | 146,796 | 3,713,939 | ||||||
Kinder Morgan, Inc., Series A, $4.88 Conv. Pfd. | 216,900 | 9,146,673 | ||||||
LaSalle Hotel Properties, Series I, 6.38% Pfd. | 127,800 | 3,239,730 | ||||||
National Retail Properties, Inc., Series E, 5.70% Pfd. | 67,500 | 1,721,925 | ||||||
NextEra Energy, Inc., Series H, $3.19 Conv. Investment Units | 61,800 | 4,180,770 | ||||||
NuStar Logistics L.P., 7.63% Pfd. | 187,900 | 4,806,482 | ||||||
Pebblebrook Hotel Trust, Series C, 6.50% Pfd. | 177,670 | 4,514,595 | ||||||
Public Storage, Series C, 5.13% Pfd. | 45,000 | 1,154,250 | ||||||
Public Storage, Series T, 5.75% Pfd. | 50,000 | 1,265,500 | ||||||
Public Storage, Series U, 5.63% Pfd. | 61,604 | 1,559,967 | ||||||
Public Storage, Series Y, 6.38% Pfd. | 374,114 | 10,138,490 | ||||||
Public Storage, Series Z, 6.00% Pfd. | 70,540 | 1,890,472 | ||||||
Saul Centers, Inc., Series C, 6.88% Pfd. | 121,236 | 3,091,518 | ||||||
Summit Hotel Properties, Inc., Series B, 7.88% Pfd. | 161,156 | 4,098,197 | ||||||
Summit Hotel Properties, Inc., Series C, 7.13% Pfd. | 63,000 | 1,600,200 | ||||||
Sun Communities, Inc., Series A, 7.13% Pfd. | 18,969 | 484,089 | ||||||
Sunstone Hotel Investors, Inc., Series E, 6.95% Pfd. | 103,500 | 2,780,010 | ||||||
Targa Resources Partners L.P., Series A, 9.00% Pfd. | 277,500 | 7,337,100 | ||||||
| 127,718,299 | ||||||||
Total Preferred Stocks |
| 132,563,505 | ||||||
| Principal Amount | ||||||||
U.S. Dollar Denominated Bonds & Notes–0.83% |
| |||||||
| United States–0.83% | ||||||||
Equinix Inc., Sr. Unsec. Notes, 5.38%, 01/1/2022 | $ | 4,975,000 | 5,236,187 | |||||
Targa Resources Partners L.P./Targa Resouces Partners Finance Corp., Sr. Unsec. Gtd. Global Notes, 4.25%, 11/15/2023 | 2,500,000 | 2,487,500 | ||||||
Total U.S. Dollar Denominated Bonds & Notes |
| 7,723,687 | ||||||
See accompanying Notes to Financial Statements which are an integral part of the financial statements.
12 Invesco Global Real Estate Income Fund
| Principal Amount | Value | |||||||
Non U.S. Dollar Denominated Bonds & |
| |||||||
| Australia–0.27% | ||||||||
General Property Trust, Sr. Unsec. Gtd. Medium-Term Notes, 6.75%, 01/24/2019 | AUD | 2,980,000 | $ | 2,499,369 | ||||
| Shares | ||||||||
Money Market Funds–1.45% |
| |||||||
Government & Agency Portfolio– Institutional Class, 0.93%(g) | 8,070,930 | 8,070,930 | ||||||
Treasury Portfolio–Institutional Class, 0.90%(g) | 5,380,621 | 5,380,621 | ||||||
Total Money Market Funds (Cost $13,451,551) | 13,451,551 | |||||||
TOTAL INVESTMENTS IN SECURITIES–99.76% |
| 925,504,101 | ||||||
OTHER ASSETS LESS LIABILITIES–0.24% |
| 2,247,594 | ||||||
NET ASSETS–100.00% | $ | 927,751,695 | ||||||
Investment Abbreviations:
| AUD | – Australian Dollar | |
| BBSW | – Australian Bank Bill Swap Rate | |
| Conv. | – Convertible | |
| Ctfs. | – Certificates | |
| EUR | – Euro | |
| EURIBOR | – Euro Interbank Offered Rate | |
| GBP | – British Pound Sterling | |
| Gtd. | – Guaranteed | |
| LIBOR | – London Interbank Offered Rate | |
| Pfd. | – Preferred | |
| REGS | – Regulation S | |
| REIT | – Real Estate Investment Trust | |
| Sr. | – Senior | |
| Unsec. | – Unsecured | |
| USD | – U.S. Dollar | |
| LIBOR | – London Interbank Offered Rate |
| Notes | to Schedule of Investments: |
| (a) | Non-income producing security. |
| (b) | Interest or dividend rate is redetermined periodically. Rate shown is the rate in effect on August 31, 2017. |
| (c) | Security purchased or received in a transaction exempt from registration under the Securities Act of 1933, as amended (the “1933 Act”). The security may be resold pursuant to an exemption from registration under the 1933 Act, typically to qualified institutional buyers. The aggregate value of these securities at August 31, 2017 was $166,592,440, which represented 17.96% of the Fund’s Net Assets. |
| (d) | Foreign denominated security. Principal amount is denominated in the currency indicated. |
| (e) | Interest rate is redetermined periodically based on the cash flows generated by the pool of assets backing the security, less any applicable fees. The rate shown is the rate in effect August 31, 2017. |
| (f) | Zero coupon bond issued at a discount. |
| (g) | The money market fund and the Fund are affiliated by having the same investment adviser. The rate shown is the 7-day SEC standardized yield as of August 31, 2017. |
See accompanying Notes to Financial Statements which are an integral part of the financial statements.
13 Invesco Global Real Estate Income Fund
Statement of Assets and Liabilities
August 31, 2017
Assets: |
| |||
Investments in securities, at value (Cost $868,276,016) | $ | 912,052,550 | ||
Investments in affiliated money market funds, at value and cost | 13,451,551 | |||
Cash | 18,993 | |||
Foreign currencies, at value (Cost $1,481,466) | 1,479,962 | |||
Receivable for: | ||||
Investments sold | 2,330,669 | |||
Fund shares sold | 948,891 | |||
Dividends and interest | 2,013,552 | |||
Investment for trustee deferred compensation and retirement plans | 136,698 | |||
Other assets | 43,462 | |||
Total assets | 932,476,328 | |||
Liabilities: |
| |||
Payable for: | ||||
Investments purchased | 2,298,127 | |||
Fund shares reacquired | 1,611,400 | |||
Accrued fees to affiliates | 530,228 | |||
Accrued trustees’ and officers’ fees and benefits | 4,835 | |||
Accrued other operating expenses | 127,976 | |||
Trustee deferred compensation and retirement plans | 152,067 | |||
Total liabilities | 4,724,633 | |||
Net assets applicable to shares outstanding | $ | 927,751,695 | ||
Net assets consist of: |
| |||
Shares of beneficial interest | $ | 886,240,328 | ||
Undistributed net investment income | (1,309,416 | ) | ||
Undistributed net realized gain (loss) | (948,403 | ) | ||
Net unrealized appreciation | 43,769,186 | |||
| $ | 927,751,695 | |||
Net Assets: |
| |||
Class A | $ | 244,128,944 | ||
Class B | $ | 476,778 | ||
Class C | $ | 70,536,772 | ||
Class Y | $ | 453,478,679 | ||
Class R5 | $ | 7,557,077 | ||
Class R6 | $ | 151,573,445 | ||
Shares outstanding, no par value, |
| |||
Class A | 26,602,266 | |||
Class B | 52,052 | |||
Class C | 7,701,032 | |||
Class Y | 49,557,479 | |||
Class R5 | 823,656 | |||
Class R6 | 16,521,054 | |||
Class A: | ||||
Net asset value per share | $ | 9.18 | ||
Maximum offering price per share | ||||
(Net asset value of $9.18 ¸ 94.50%) | $ | 9.71 | ||
Class B: | ||||
Net asset value and offering price per share | $ | 9.16 | ||
Class C: | ||||
Net asset value and offering price per share | $ | 9.16 | ||
Class Y: | ||||
Net asset value and offering price per share | $ | 9.15 | ||
Class R5: | ||||
Net asset value and offering price per share | $ | 9.18 | ||
Class R6: | ||||
Net asset value and offering price per share | $ | 9.17 | ||
See accompanying Notes to Financial Statements which are an integral part of the financial statements.
14 Invesco Global Real Estate Income Fund
Statement of Operations
For the year ended August 31, 2017
Investment income: |
| |||
Dividends (net of foreign withholding taxes of $1,207,003) | $ | 29,987,416 | ||
Dividends from affiliated money market funds | 131,812 | |||
Interest (net of foreign withholding taxes of $508) | 9,668,616 | |||
Total investment income | 39,787,844 | |||
Expenses: | ||||
Advisory fees | 7,107,257 | |||
Administrative services fees | 246,564 | |||
Custodian fees | 121,421 | |||
Distribution fees: | ||||
Class A | 756,687 | |||
Class B | 5,828 | |||
Class C | 802,573 | |||
Transfer agent Fees — A, B, C and Y | 1,379,334 | |||
Transfer agent fees — R5 | 8,940 | |||
Transfer agent fees — R6 | 7,673 | |||
Trustees’ and officers’ fees and benefits | 37,226 | |||
Registration and filing fees | 101,059 | |||
Reports to shareholders | 320,249 | |||
Professional services fees | 53,927 | |||
Other | 22,792 | |||
Total expenses | 10,971,530 | |||
Less: Fees waived and expense offset arrangement(s) | (35,517 | ) | ||
Net expenses | 10,936,013 | |||
Net investment income | 28,851,831 | |||
Realized and unrealized gain (loss) from: | ||||
Net realized gain from: | ||||
Investment securities | 8,965,621 | |||
Foreign currencies | 127,788 | |||
| 9,093,409 | ||||
Change in net unrealized appreciation (depreciation) of: | ||||
Investment securities | (14,868,962 | ) | ||
Foreign currencies | 21,421 | |||
| (14,847,541 | ) | |||
Net realized and unrealized gain (loss) | (5,754,132 | ) | ||
Net increase in net assets resulting from operations | $ | 23,097,699 | ||
See accompanying Notes to Financial Statements which are an integral part of the financial statements.
15 Invesco Global Real Estate Income Fund
Statement of Changes in Net Assets
For the years ended August 31, 2017 and 2016
| 2017 | 2016 | |||||||
Operations: |
| |||||||
Net investment income | $ | 28,851,831 | $ | 33,035,008 | ||||
Net realized gain | 9,093,409 | 2,312,376 | ||||||
Change in net unrealized appreciation (depreciation) | (14,847,541 | ) | 72,373,878 | |||||
Net increase in net assets resulting from operations | 23,097,699 | 107,721,262 | ||||||
Distributions to shareholders from net investment income: | ||||||||
Class A | (13,165,056 | ) | (13,587,464 | ) | ||||
Class B | (20,451 | ) | (22,340 | ) | ||||
Class C | (2,755,090 | ) | (2,395,083 | ) | ||||
Class Y | (17,525,407 | ) | (13,000,393 | ) | ||||
Class R5 | (462,200 | ) | (452,823 | ) | ||||
Class R6 | (6,616,660 | ) | (1,554,186 | ) | ||||
Total distributions from net investment income | (40,544,864 | ) | (31,012,289 | ) | ||||
Distributions to shareholders from net realized gains: | ||||||||
Class A | — | (9,628,157 | ) | |||||
Class B | — | (21,631 | ) | |||||
Class C | — | (2,248,413 | ) | |||||
Class Y | — | (8,688,128 | ) | |||||
Class R5 | — | (291,961 | ) | |||||
Class R6 | — | (36,308 | ) | |||||
Total distributions from net realized gains | — | (20,914,598 | ) | |||||
Share transactions–net: | ||||||||
Class A | (131,703,678 | ) | (135,211,872 | ) | ||||
Class B | (217,393 | ) | (393,474 | ) | ||||
Class C | (22,611,409 | ) | (14,025,104 | ) | ||||
Class Y | 59,567,892 | (21,498,414 | ) | |||||
Class R5 | (4,921,549 | ) | (1,989,813 | ) | ||||
Class R6 | (2,474,477 | ) | 146,096,174 | |||||
Net increase (decrease) in net assets resulting from share transactions | (102,360,614 | ) | (27,022,503 | ) | ||||
Net increase (decrease) in net assets | (119,807,779 | ) | 28,771,872 | |||||
Net assets: | ||||||||
Beginning of year | 1,047,559,474 | 1,018,787,602 | ||||||
End of year (includes undistributed net investment income of $(1,309,416) and $5,900,795, respectively) | $ | 927,751,695 | $ | 1,047,559,474 | ||||
Notes to Financial Statements
August 31, 2017
NOTE 1—Significant Accounting Policies
Invesco Global Real Estate Income Fund (the “Fund”) is a series portfolio of AIM Counselor Series Trust (Invesco Counselor Series Trust) (the “Trust”). The Trust is a Delaware statutory trust registered under the Investment Company Act of 1940, as amended (the “1940 Act”), as an open-end series management investment company consisting of fourteen separate portfolios, each authorized to issue an unlimited number of shares of beneficial interest. The assets, liabilities and operations of each portfolio are accounted for separately. Information presented in these financial statements pertains only to the Fund. Matters affecting each portfolio or class will be voted on exclusively by the shareholders of such portfolio or class.
The Fund’s investment objective is current income and, secondarily, capital appreciation.
The Fund currently consists of six different classes of shares: Class A, Class B, Class C, Class Y, Class R5 and Class R6. Class Y shares are available only to certain investors. Class A shares are sold with a front-end sales charge unless certain waiver criteria are met and under certain circumstances load waived shares may be subject to contingent deferred sales charges (“CDSC”). Class C shares are sold with a CDSC. Class Y, Class R5 and Class R6 shares are sold at net asset value. Effective November 30, 2010, new or additional investments in Class B shares are no longer permitted. Existing shareholders of Class B shares may continue to reinvest dividends and capital gains distributions in Class B shares until they convert to Class A shares. Also, shareholders in Class B shares will be able to exchange those shares for Class B shares of other Invesco Funds offering such shares until they
16 Invesco Global Real Estate Income Fund
convert to Class A shares. Generally, Class B shares will automatically convert to Class A shares on or about the month-end, which is at least eight years after the date of purchase. Redemption of Class B shares prior to the conversion date will be subject to a CDSC.
The Fund is an investment company and accordingly follows the investment company accounting and reporting guidance in accordance with Financial Accounting Standards Board Accounting Standards Codification Topic 946, Financial Services — Investment Companies.
The following is a summary of the significant accounting policies followed by the Fund in the preparation of its financial statements.
| A. | Security Valuations — Securities, including restricted securities, are valued according to the following policy. |
A security listed or traded on an exchange (except convertible securities) is valued at its last sales price or official closing price as of the close of the customary trading session on the exchange where the security is principally traded, or lacking any sales or official closing price on a particular day, the security may be valued at the closing bid price on that day. Securities traded in the over-the-counter market are valued based on prices furnished by independent pricing services or market makers. When such securities are valued by an independent pricing service they may be considered fair valued. Futures contracts are valued at the final settlement price set by an exchange on which they are principally traded. Listed options are valued at the mean between the last bid and asked prices from the exchange on which they are principally traded. Options not listed on an exchange are valued by an independent source at the mean between the last bid and asked prices. For purposes of determining net asset value (“NAV”) per share, futures and option contracts generally are valued 15 minutes after the close of the customary trading session of the New York Stock Exchange (“NYSE”).
Investments in open-end and closed-end registered investment companies that do not trade on an exchange are valued at the end-of-day net asset value per share. Investments in open-end and closed-end registered investment companies that trade on an exchange are valued at the last sales price or official closing price as of the close of the customary trading session on the exchange where the security is principally traded.
Debt obligations (including convertible securities) and unlisted equities are fair valued using an evaluated quote provided by an independent pricing service. Evaluated quotes provided by the pricing service may be determined without exclusive reliance on quoted prices, and may reflect appropriate factors such as institution-size trading in similar groups of securities, developments related to specific securities, dividend rate (for unlisted equities), yield (for debt obligations), quality, type of issue, coupon rate (for debt obligations), maturity (for debt obligations), individual trading characteristics and other market data. Pricing services generally value debt obligations assuming orderly transactions of institutional round lot size, but a Fund may hold or transact in the same securities in smaller, odd lot sizes. Odd lots often trade at lower prices than institutional round lots. Debt obligations are subject to interest rate and credit risks. In addition, all debt obligations involve some risk of default with respect to interest and/or principal payments.
Foreign securities’ (including foreign exchange contracts) prices are converted into U.S. dollar amounts using the applicable exchange rates as of the close of the NYSE. If market quotations are available and reliable for foreign exchange-traded equity securities, the securities will be valued at the market quotations. Because trading hours for certain foreign securities end before the close of the NYSE, closing market quotations may become unreliable. If between the time trading ends on a particular security and the close of the customary trading session on the NYSE, events occur that the investment adviser determines are significant and make the closing price unreliable, the Fund may fair value the security. If the event is likely to have affected the closing price of the security, the security will be valued at fair value in good faith using procedures approved by the Board of Trustees. Adjustments to closing prices to reflect fair value may also be based on a screening process of an independent pricing service to indicate the degree of certainty, based on historical data, that the closing price in the principal market where a foreign security trades is not the current value as of the close of the NYSE. Foreign securities’ prices meeting the approved degree of certainty that the price is not reflective of current value will be priced at the indication of fair value from the independent pricing service. Multiple factors may be considered by the independent pricing service in determining adjustments to reflect fair value and may include information relating to sector indices, American Depositary Receipts and domestic and foreign index futures. Foreign securities may have additional risks including exchange rate changes, potential for sharply devalued currencies and high inflation, political and economic upheaval, the relative lack of issuer information, relatively low market liquidity and the potential lack of strict financial and accounting controls and standards.
Securities for which market prices are not provided by any of the above methods may be valued based upon quotes furnished by independent sources. The last bid price may be used to value equity securities. The mean between the last bid and asked prices will be used to value debt obligations and corporate loans.
Securities for which market quotations are not readily available or became unreliable are valued at fair value as determined in good faith by or under the supervision of the Trust’s officers following procedures approved by the Board of Trustees. Issuer specific events, market trends, bid/asked quotes of brokers and information providers and other market data may be reviewed in the course of making a good faith determination of a security’s fair value.
The Fund may invest in securities that are subject to interest rate risk, meaning the risk that the prices will generally fall as interest rates rise and, conversely, the prices will generally rise as interest rates fall. Specific securities differ in their sensitivity to changes in interest rates depending on their individual characteristics. Changes in interest rates may result in increased market volatility, which may affect the value and/or liquidity of certain Fund investments.
Valuations change in response to many factors including the historical and prospective earnings of the issuer, the value of the issuer’s assets, general economic conditions, interest rates, investor perceptions and market liquidity. Because of the inherent uncertainties of valuation, the values reflected in the financial statements may materially differ from the value received upon actual sale of those investments.
| B. | Securities Transactions and Investment Income — Securities transactions are accounted for on a trade date basis. Realized gains or losses on sales are computed on the basis of specific identification of the securities sold. Interest income (net of withholding tax, if any) is recorded on the accrual basis from settlement date.Bond premiums and discounts are amortized and/or accreted over the lives of the respective securities. Paydown gains and losses on mortgage and asset-backed securities are recorded as adjustments to interest income. Dividend income (net of withholding tax, if any) is recorded on the ex-dividend date. |
The Fund may periodically participate in litigation related to Fund investments. As such, the Fund may receive proceeds from litigation settlements. Any proceeds received are included in the Statement of Operations as realized gain (loss) for investments no longer held and as unrealized gain (loss) for investments still held.
Brokerage commissions and mark ups are considered transaction costs and are recorded as an increase to the cost basis of securities purchased and/or a reduction of proceeds on a sale of securities. Such transaction costs are included in the determination of net realized and unrealized gain (loss) from investment securities reported in the Statement of Operations and the Statement of Changes in Net Assets and the net
17 Invesco Global Real Estate Income Fund
realized and unrealized gains (losses) on securities per share in the Financial Highlights. Transaction costs are included in the calculation of the Fund’s net asset value and, accordingly, they reduce the Fund’s total returns. These transaction costs are not considered operating expenses and are not reflected in net investment income reported in the Statement of Operations and the Statement of Changes in Net Assets, or the net investment income per share and the ratios of expenses and net investment income reported in the Financial Highlights, nor are they limited by any expense limitation arrangements between the Fund and the investment adviser.
The Fund recharacterizes distributions received from REIT investments based on information provided by the REIT into the following categories: ordinary income, long-term and short-term capital gains, and return of capital. If information is not available on a timely basis from the REIT, the recharacterization will be based on available information which may include the previous year’s allocation. If new or additional information becomes available from the REIT at a later date, a recharacterization will be made in the following year. The Fund records as dividend income the amount recharacterized as ordinary income and as realized gain the amount recharacterized as capital gain in the Statement of Operations, and the amount recharacterized as return of capital as a reduction of the cost of the related investment. These recharacterizations are reflected in the accompanying financial statements.
| C. | Country Determination — For the purposes of making investment selection decisions and presentation in the Schedule of Investments, the investment adviser may determine the country in which an issuer is located and/or credit risk exposure based on various factors. These factors include the laws of the country under which the issuer is organized, where the issuer maintains a principal office, the country in which the issuer derives 50% or more of its total revenues and the country that has the primary market for the issuer’s securities, as well as other criteria. Among the other criteria that may be evaluated for making this determination are the country in which the issuer maintains 50% or more of its assets, the type of security, financial guarantees and enhancements, the nature of the collateral and the sponsor organization. Country of issuer and/or credit risk exposure has been determined to be the United States of America, unless otherwise noted. |
| D. | Distributions — Distributions from net investment income, if any, are declared and paid quarterly and are recorded on the ex-dividend date. Distributions from net realized capital gain, if any, are generally declared and paid annually and recorded on the ex-dividend date. The Fund may elect to treat a portion of the proceeds from redemptions as distributions for federal income tax purposes. |
| E. | Federal Income Taxes — The Fund intends to comply with the requirements of Subchapter M of the Internal Revenue Code of 1986, as amended (the “Internal Revenue Code”), necessary to qualify as a regulated investment company and to distribute substantially all of the Fund’s taxable earnings to shareholders. As such, the Fund will not be subject to federal income taxes on otherwise taxable income (including net realized capital gain) that is distributed to shareholders. Therefore, no provision for federal income taxes is recorded in the financial statements. |
The Fund recognizes the tax benefits of uncertain tax positions only when the position is more likely than not to be sustained. Management has analyzed the Fund’s uncertain tax positions and concluded that no liability for unrecognized tax benefits should be recorded related to uncertain tax positions. Management is not aware of any tax positions for which it is reasonably possible that the total amounts of unrecognized tax benefits will change materially in the next 12 months.
The Fund files tax returns in the U.S. Federal jurisdiction and certain other jurisdictions. Generally, the Fund is subject to examinations by such taxing authorities for up to three years after the filing of the return for the tax period.
| F. | Expenses — Fees provided for under the Rule 12b-1 plan of a particular class of the Fund are charged to the operations of such class. Transfer agency fees and expenses and other shareholder recordkeeping fees and expenses attributable to Class R5 and Class R6 are allocated to each share class based on relative net assets. Sub-accounting fees attributable to Class R5 are charged to the operations of the class. Transfer agency fees and expenses and other shareholder recordkeeping fees and expenses relating to all other classes are allocated among those classes based on relative net assets. All other expenses are allocated among the classes based on relative net assets. |
| G. | Accounting Estimates — The preparation of financial statements in conformity with accounting principles generally accepted in the United States of America (“GAAP”) requires management to make estimates and assumptions that affect the reported amounts of assets and liabilities at the date of the financial statements and the reported amounts of revenues and expenses during the reporting period including estimates and assumptions related to taxation. Actual results could differ from those estimates by a significant amount. In addition, the Fund monitors for material events or transactions that may occur or become known after the period-end date and before the date the financial statements are released to print. |
| H. | Indemnifications — Under the Trust’s organizational documents, each Trustee, officer, employee or other agent of the Trust is indemnified against certain liabilities that may arise out of the performance of their duties to the Fund. Additionally, in the normal course of business, the Fund enters into contracts, including the Fund’s servicing agreements, that contain a variety of indemnification clauses. The Fund’s maximum exposure under these arrangements is unknown as this would involve future claims that may be made against the Fund that have not yet occurred. The risk of material loss as a result of such indemnification claims is considered remote. |
| I. | Foreign Currency Translations — Foreign currency is valued at the close of the NYSE based on quotations posted by banks and major currency dealers. Portfolio securities and other assets and liabilities denominated in foreign currencies are translated into U.S. dollar amounts at date of valuation. Purchases and sales of portfolio securities (net of foreign taxes withheld on disposition) and income items denominated in foreign currencies are translated into U.S. dollar amounts on the respective dates of such transactions. The Fund does not separately account for the portion of the results of operations resulting from changes in foreign exchange rates on investments and the fluctuations arising from changes in market prices of securities held. The combined results of changes in foreign exchange rates and the fluctuation of market prices on investments (net of estimated foreign tax withholding) are included with the net realized and unrealized gain or loss from investments in the Statement of Operations. Reported net realized foreign currency gains or losses arise from (1) sales of foreign currencies, (2) currency gains or losses realized between the trade and settlement dates on securities transactions, and (3) the difference between the amounts of dividends, interest, and foreign withholding taxes recorded on the Fund’s books and the U.S. dollar equivalent of the amounts actually received or paid. Net unrealized foreign currency gains and losses arise from changes in the fair values of assets and liabilities, other than investments in securities at fiscal period end, resulting from changes in exchange rates. |
The Fund may invest in foreign securities, which may be subject to foreign taxes on income, gains on investments or currency repatriation, a portion of which may be recoverable. Foreign taxes, if any, are recorded based on the tax regulations and rates that exist in the foreign markets in which the Fund invests and are shown in the Statement of Operations.
| J. | Forward Foreign Currency Contracts — The Fund may engage in foreign currency transactions either on a spot (i.e. for prompt delivery and settlement) basis, or through forward foreign currency contracts, to manage or minimize currency or exchange rate risk. |
18 Invesco Global Real Estate Income Fund
The Fund may also enter into forward foreign currency contracts for the purchase or sale of a security denominated in a foreign currency in order to “lock in” the U.S. dollar price of that security, or the Fund may also enter into forward foreign currency contracts that do not provide for physical settlement of the two currencies, but instead are settled by a single cash payment calculated as the difference between the agreed upon exchange rate and the spot rate at settlement based upon an agreed upon notional amount (non-deliverable forwards). The Fund will set aside liquid assets in an amount equal to the daily mark-to-market obligation for forward foreign currency contracts.
A forward foreign currency contract is an obligation between two parties (“Counterparties”) to purchase or sell a specific currency for an agreed-upon price at a future date. The use of forward foreign currency contracts does not eliminate fluctuations in the price of the underlying securities the Fund owns or intends to acquire but establishes a rate of exchange in advance. Fluctuations in the value of these contracts are measured by the difference in the contract date and reporting date exchange rates and are recorded as unrealized appreciation (depreciation) until the contracts are closed. When the contracts are closed, realized gains (losses) are recorded. Realized and unrealized gains (losses) on the contracts are included in the Statement of Operations. The primary risks associated with forward foreign currency contracts include failure of the Counterparty to meet the terms of the contract and the value of the foreign currency changing unfavorably. These risks may be in excess of the amounts reflected in the Statement of Assets and Liabilities.
| K. | Other Risks — The Fund’s investments are concentrated in a comparatively narrow segment of the economy. Consequently, the Fund may tend to be more volatile than other mutual funds, and the value of the Fund’s investments may tend to rise and fall more rapidly. |
Because the Fund concentrates its assets in the real estate industry, an investment in the Fund will be closely linked to the performance of the real estate markets. Property values may fall due to increasing vacancies or declining rents resulting from economic, legal, cultural or technological developments.
NOTE 2—Advisory Fees and Other Fees Paid to Affiliates
The Trust has entered into a master investment advisory agreement with Invesco Advisers, Inc. (the “Adviser” or “Invesco”). Under the terms of the investment advisory agreement, the Fund accrues daily and pays monthly an advisory fee to the Adviser based on the annual rate of the Fund’s average daily net assets as follows:
| Average Daily Net Assets | Rate | |||
First $250 million | 0.75% | |||
Next $250 million | 0.74% | |||
Next $500 million | 0.73% | |||
Next $1.5 billion | 0.72% | |||
Next $2.5 billion | 0.71% | |||
Next $2.5 billion | 0.70% | |||
Next $2.5 billion | 0.69% | |||
Over $10 billion | 0.68% | |||
For the year ended August 31, 2017, the effective advisory fees incurred by the Fund was 0.74%.
Under the terms of a master sub-advisory agreement between the Adviser and each of Invesco Asset Management Deutschland GmbH, Invesco Asset Management Limited, Invesco Asset Management (Japan) Limited, Invesco Hong Kong Limited, Invesco Senior Secured Management, Inc. and Invesco Canada Ltd. (collectively, the “Affiliated Sub-Advisers”) the Adviser, not the Fund, will pay 40% of the fees paid to the Adviser to any such Affiliated Sub-Adviser(s) that provide(s) discretionary investment management services to the Fund based on the percentage of assets allocated to such Affiliated Sub-Adviser(s).
The Adviser has contractually agreed, through at least June 30, 2018, to waive advisory fees and/or reimburse expenses of all shares to the extent necessary to limit total annual fund operating expenses after fee waiver and/or expense reimbursemnt (excluding certain items discussed below) of Class A, Class B, Class C, Class Y, Class R5 and Class R6 shares to 2.00%, 2.75%, 2.75%, 1.75%, 1.75% and 1.75%, respectively, of the Fund’s average daily net assets (the “expense limits”). In determining the Adviser’s obligation to waive advisory fees and/or reimburse expenses, the following expenses are not taken into account, and could cause the total annual fund operating expenses after fee waiver and/or expense reimbursemnt to exceed the numbers reflected above: (1) interest; (2) taxes; (3) dividend expense on short sales; (4) extraordinary or non-routine items, including litigation expenses; and (5) expenses that the Fund has incurred but did not actually pay because of an expense offset arrangement. Unless Invesco continues the fee waiver agreement, it will terminate on June 30, 2018. During its term, the fee waiver agreement cannot be terminated or amended to increase the expense limits or reduce the advisory fee waivers without approval of the Board of Trustees. The Adviser did not waive fees and/or reimburse expenses during the period under these expense limits.
Further, the Adviser has contractually agreed, through at least June 30, 2019, to waive the advisory fee payable by the Fund in an amount equal to 100% of the net advisory fees the Adviser receives from the affiliated money market funds on investments by the Fund of uninvested cash in such affiliated money market funds.
For the year ended August 31, 2017, the Adviser waived advisory fees of $33,577.
The Trust has entered into a master administrative services agreement with Invesco pursuant to which the Fund has agreed to pay Invesco for certain administrative costs incurred in providing accounting services to the Fund. For the year ended August 31, 2017, expenses incurred under the agreement are shown in the Statement of Operations as Administrative services fees.
The Trust has entered into a transfer agency and service agreement with Invesco Investment Services, Inc. (“IIS”) pursuant to which the Fund has agreed to pay IIS a fee for providing transfer agency and shareholder services to the Fund and reimburse IIS for certain expenses incurred by IIS in the course of providing such services. IIS may make payments to intermediaries that provide omnibus account services, sub-accounting services and/or networking services. All fees payable by IIS to intermediaries that provide omnibus account services or sub-accounting services are charged back to the Fund, subject to certain limitations approved by the Trust’s Board of Trustees. For the year ended August 31, 2017, expenses incurred under the agreement are shown in the Statement of Operations as Transfer agent fees.
19 Invesco Global Real Estate Income Fund
The Trust has entered into master distribution agreements with Invesco Distributors, Inc. (“IDI”) to serve as the distributor for the Class A, Class B, Class C, Class Y, Class R5 and Class R6 shares of the Fund. The Trust has adopted plans pursuant to Rule 12b-1 under the 1940 Act with respect to the Fund’s Class A, Class B and Class C shares (collectively, the “Plans”). The Fund, pursuant to the Plans, pays IDI compensation at the annual rate of 0.25% of the Fund’s average daily net assets of Class A shares and 1.00% of the average daily net assets of Class B and Class C shares. The fees are accrued daily and paid monthly. Of the Plan payments, up to 0.25% of the average daily net assets of each class of shares may be paid to furnish continuing personal shareholder services to customers who purchase and own shares of such classes. Any amounts not paid as a service fee under the Plans would constitute an asset-based sales charge. Rules of the Financial Industry Regulatory Authority (“FINRA”) impose a cap on the total sales charges, including asset-based sales charges, that may be paid by any class of shares of the Fund. For the year ended August 31, 2017, expenses incurred under the Plans are shown in the Statement of Operations as Distribution fees.
Front-end sales commissions and CDSC (collectively, the “sales charges”) are not recorded as expenses of the Fund. Front-end sales commissions are deducted from proceeds from the sales of Fund shares prior to investment in Class A shares of the Fund. CDSC are deducted from redemption proceeds prior to remittance to the shareholder. During the year ended August 31, 2017, IDI advised the Fund that IDI retained $31,937 in front-end sales commissions from the sale of Class A shares and $3,156, $0 and $2,799 from Class A, Class B and Class C shares, respectively, for CDSC imposed on redemptions by shareholders.
Certain officers and trustees of the Trust are officers and directors of the Adviser, IIS and/or IDI.
NOTE 3—Additional Valuation Information
GAAP defines fair value as the price that would be received to sell an asset or paid to transfer a liability in an orderly transaction between market participants at the measurement date, under current market conditions. GAAP establishes a hierarchy that prioritizes the inputs to valuation methods, giving the highest priority to readily available unadjusted quoted prices in an active market for identical assets (Level 1) and the lowest priority to significant unobservable inputs (Level 3), generally when market prices are not readily available or are unreliable. Based on the valuation inputs, the securities or other investments are tiered into one of three levels. Changes in valuation methods may result in transfers in or out of an investment’s assigned level:
| Level 1 — | Prices are determined using quoted prices in an active market for identical assets. |
| Level 2 — | Prices are determined using other significant observable inputs. Observable inputs are inputs that other market participants may use in pricing a security. These may include quoted prices for similar securities, interest rates, prepayment speeds, credit risk, yield curves, loss severities, default rates, discount rates, volatilities and others. |
| Level 3 — | Prices are determined using significant unobservable inputs. In situations where quoted prices or observable inputs are unavailable (for example, when there is little or no market activity for an investment at the end of the period), unobservable inputs may be used. Unobservable inputs reflect the Fund’s own assumptions about the factors market participants would use in determining fair value of the securities or instruments and would be based on the best available information. |
The following is a summary of the tiered valuation input levels, as of August 31, 2017. The level assigned to the securities valuations may not be an indication of the risk or liquidity associated with investing in those securities. Because of the inherent uncertainties of valuation, the values reflected in the financial statements may materially differ from the value received upon actual sale of those investments.
The Fund’s policy is to recognize transfers in and out of the valuation levels as of the end of the reporting period.
During the year ended August 31, 2017, there were transfers from Level 1 to Level 2 of $52,512,053 and from Level 2 to Level 1 of $35,451,792, due to foreign fair value adjustments.
| Level 1 | Level 2 | Level 3 | Total | |||||||||||||
Australia | $ | 4,845,206 | $ | 50,724,638 | $ | — | $ | 55,569,844 | ||||||||
Canada | 21,294,077 | — | — | 21,294,077 | ||||||||||||
China | 1,343,021 | 2,139,403 | — | 3,482,424 | ||||||||||||
France | 11,154,434 | 16,392,119 | — | 27,546,553 | ||||||||||||
Germany | 10,989,667 | — | — | 10,989,667 | ||||||||||||
Hong Kong | 16,004,370 | 30,937,383 | — | 46,941,753 | ||||||||||||
Ireland | — | 2,787,023 | — | 2,787,023 | ||||||||||||
Japan | 20,577,704 | 42,573,244 | — | 63,150,948 | ||||||||||||
Netherlands | — | 6,886,411 | — | 6,886,411 | ||||||||||||
Singapore | 10,370,111 | 4,032,143 | — | 14,402,254 | ||||||||||||
South Africa | 2,255,301 | — | — | 2,255,301 | ||||||||||||
Spain | — | 5,053,406 | — | 5,053,406 | ||||||||||||
Sweden | 7,738,128 | — | — | 7,738,128 | ||||||||||||
Switzerland | 4,902,371 | — | — | 4,902,371 | ||||||||||||
United Kingdom | 24,508,795 | 9,748,736 | — | 34,257,531 | ||||||||||||
United States | 430,451,953 | 174,342,906 | — | 604,794,859 | ||||||||||||
Money Market Funds | 13,451,551 | — | — | 13,451,551 | ||||||||||||
Total Investments | $ | 579,886,689 | $ | 345,617,412 | $ | — | $ | 925,504,101 | ||||||||
20 Invesco Global Real Estate Income Fund
NOTE 4—Expense Offset Arrangement(s)
The expense offset arrangement is comprised of transfer agency credits which result from balances in demand deposit accounts used by the transfer agent for clearing shareholder transactions. For the year ended August 31, 2017, the Fund received credits from this arrangement, which resulted in the reduction of the Fund’s total expenses of $1,940.
NOTE 5—Trustees’ and Officers’ Fees and Benefits
Trustees’ and Officers’ Fees and Benefits include amounts accrued by the Fund to pay remuneration to certain Trustees and Officers of the Fund. Trustees have the option to defer compensation payable by the Fund, and Trustees’ and Officers’ Fees and Benefits also include amounts accrued by the Fund to fund such deferred compensation amounts. Those Trustees who defer compensation have the option to select various Invesco Funds in which their deferral accounts shall be deemed to be invested. Finally, certain current Trustees were eligible to participate in a retirement plan that provided for benefits to be paid upon retirement to Trustees over a period of time based on the number of years of service. The Fund may have certain former Trustees who also participate in a retirement plan and receive benefits under such plan. Trustees’ and Officers’ Fees and Benefits include amounts accrued by the Fund to fund such retirement benefits. Obligations under the deferred compensation and retirement plans represent unsecured claims against the general assets of the Fund.
NOTE 6—Cash Balances
The Fund is permitted to temporarily carry a negative or overdrawn balance in its account with State Street Bank and Trust Company, the custodian bank. Such balances, if any at period-end, are shown in the Statement of Assets and Liabilities under the payable caption Amount due custodian. To compensate the custodian bank for such overdrafts, the overdrawn Fund may either (1) leave funds as a compensating balance in the account so the custodian bank can be compensated by earning the additional interest; or (2) compensate by paying the custodian bank at a rate agreed upon by the custodian bank and Invesco, not to exceed the contractually agreed upon rate.
NOTE 7—Distributions to Shareholders and Tax Components of Net Assets
Tax Character of Distributions to Shareholders Paid During the Fiscal Years Ended August 31, 2017 and 2016:
| 2017 | 2016 | |||||||
Ordinary income | $ | 40,544,864 | $ | 31,012,320 | ||||
Long-term capital gain | — | 20,914,567 | ||||||
Total distributions | $ | 40,544,864 | $ | 51,926,887 | ||||
Tax Components of Net Assets at Period-End:
| 2017 | ||||
Undistributed ordinary income | $ | 10,738,584 | ||
Net unrealized appreciation — investments | 31,385,880 | |||
Net unrealized appreciation (depreciation) — foreign currencies | (7,349 | ) | ||
Temporary book/tax differences | (143,230 | ) | ||
Capital loss carryforward | (462,518 | ) | ||
Shares of beneficial interest | 886,240,328 | |||
Total net assets | $ | 927,751,695 | ||
The difference between book-basis and tax-basis unrealized appreciation (depreciation) is due to differences in the timing of recognition of gains and losses on investments for tax and book purposes. The Fund’s net unrealized appreciation difference is attributable primarily to passive foreign investment companies and wash sales.
The temporary book/tax differences are a result of timing differences between book and tax recognition of income and/or expenses. The Fund’s temporary book/tax differences are the result of the trustee deferral of compensation and retirement plan benefits.
Capital loss carryforward is calculated and reported as of a specific date. Results of transactions and other activity after that date may affect the amount of capital loss carryforward actually available for the Fund to utilize. Capital losses generated in years beginning after December 22, 2010 can be carried forward for an unlimited period, whereas previous losses expire in eight tax years. Capital losses with an expiration period may not be used to offset capital gains until all net capital losses without an expiration date have been utilized. Capital loss carryforwards with no expiration date will retain their character as either short-term or long-term capital losses instead of as short-term capital losses as under prior law. The ability to utilize capital loss carryforwards in the future may be limited under the Internal Revenue Code and related regulations based on the results of future transactions.
The Fund has a capital loss carryforward as of August 31, 2017, as follows:
| Capital Loss Carryforward* | ||||||||||||
| Expiration | Short-Term | Long-Term | Total | |||||||||
Not subject to expiration | $ | 462,518 | $ | — | $ | 462,518 | ||||||
| * | Capital loss carryforward as of the date listed above is reduced for limitations, if any, to the extent required by the Internal Revenue Code and may be further limited depending upon a variety of factors, including the realization of net unrealized gains or losses as of the date of any reorganization. |
21 Invesco Global Real Estate Income Fund
NOTE 8—Investment Transactions
The aggregate amount of investment securities (other than short-term securities, U.S. Treasury obligations and money market funds, if any) purchased and sold by the Fund during the year ended August 31, 2017 was $407,846,603 and $500,544,717, respectively. Cost of investments, including any derivatives, on a tax basis includes the adjustments for financial reporting purposes as of the most recently completed federal income tax reporting period-end.
| Unrealized Appreciation (Depreciation) of Investments on a Tax Basis | ||||
Aggregate unrealized appreciation of investments | $ | 63,880,063 | ||
Aggregate unrealized (depreciation) of investments | (32,494,183 | ) | ||
Net unrealized appreciation of investments | $ | 31,385,880 | ||
Cost of investments for tax purposes is $894,118,221.
NOTE 9—Reclassification of Permanent Differences
Primarily as a result of differing book/tax treatment of passive foreign investment companies, on August 31, 2017, undistributed net investment income was increased by $4,482,822 and undistributed net realized gain (loss) was decreased by $4,482,822. This reclassification had no effect on the net assets of the Fund.
NOTE 10—Share Information
| Summary of Share Activity | ||||||||||||||||
| Years ended August 31, | ||||||||||||||||
| 2017(a) | 2016 | |||||||||||||||
| Shares | Amount | Shares | Amount | |||||||||||||
Sold: | ||||||||||||||||
Class A | 3,882,803 | $ | 34,431,739 | 6,003,077 | $ | 52,782,040 | ||||||||||
Class B | 161 | 1,377 | 1,493 | 13,353 | ||||||||||||
Class C | 711,063 | 6,320,622 | 631,655 | 5,603,735 | ||||||||||||
Class Y | 23,536,267 | 207,699,985 | 13,141,894 | 116,381,172 | ||||||||||||
Class R5 | 320,577 | 2,835,380 | 176,484 | 1,575,410 | ||||||||||||
Class R6 | 1,505,920 | 13,271,068 | 16,972,317 | 149,555,587 | ||||||||||||
Issued as reinvestment of dividends: | ||||||||||||||||
Class A | 1,203,361 | 10,632,466 | 2,100,834 | 18,121,821 | ||||||||||||
Class B | 2,090 | 18,430 | 4,587 | 39,475 | ||||||||||||
Class C | 238,325 | 2,102,950 | 437,021 | 3,759,986 | ||||||||||||
Class Y | 1,424,580 | 12,548,995 | 2,012,635 | 17,313,889 | ||||||||||||
Class R5 | 46,583 | 410,606 | 81,337 | 701,839 | ||||||||||||
Class R6 | 749,684 | 6,616,251 | 178,842 | 1,589,958 | ||||||||||||
Automatic conversion of Class B shares to Class A shares: | ||||||||||||||||
Class A | 15,597 | 138,646 | 26,714 | 237,281 | ||||||||||||
Class B | (15,619 | ) | (138,646 | ) | (26,744 | ) | (237,281 | ) | ||||||||
Reacquired: | ||||||||||||||||
Class A | (19,975,937 | ) | (176,906,529 | ) | (23,377,769 | ) | (206,353,014 | ) | ||||||||
Class B | (11,165 | ) | (98,554 | ) | (23,712 | ) | (209,021 | ) | ||||||||
Class C | (3,507,269 | ) | (31,034,981 | ) | (2,636,088 | ) | (23,388,825 | ) | ||||||||
Class Y | (18,189,560 | ) | (160,681,088 | ) | (17,697,872 | ) | (155,193,475 | ) | ||||||||
Class R5 | (930,839 | ) | (8,167,535 | ) | (483,594 | ) | (4,267,062 | ) | ||||||||
Class R6 | (2,497,384 | ) | (22,361,796 | ) | (552,776 | ) | (5,049,371 | ) | ||||||||
Net increase (decrease) in share activity | (11,490,762 | ) | $ | (102,360,614 | ) | (3,029,665 | ) | $ | (27,022,503 | ) | ||||||
| (a) | There are entities that are record owners of more than 5% of the outstanding shares of the Fund and in the aggregate own 55% of the outstanding shares of the Fund. IDI has an agreement with these entities to sell Fund shares. The Fund, Invesco and/or Invesco affiliates may make payments to these entities, which are considered to be related to the Fund, for providing services to the Fund, Invesco and/or Invesco affiliates including but not limited to services such as securities brokerage, distribution, third party record keeping and account servicing. The Fund has no knowledge as to whether all or any portion of the shares owned of record by these entities are also owned beneficially. |
| In addition, 10% of the outstanding shares of the Fund are owned by the Adviser or an affiliate of the Adviser. |
22 Invesco Global Real Estate Income Fund
NOTE 11—Financial Highlights
The following schedule presents financial highlights for a share of the Fund outstanding throughout the periods indicated.
| Net asset value, beginning of period | Net investment income(a) | Net gains (losses) on securities (both realized and unrealized) | Total from investment operations | Dividends from net investment income | Distributions from net realized gains | Total distributions | Net asset value, end of period | Total return(b) | Net assets, end of period (000’s omitted) | Ratio of expenses to average net assets with fee waivers and/or expenses absorbed | Ratio of expenses to average net assets without fee waivers and/or expenses absorbed | Ratio of net investment income to average net assets | Portfolio turnover(c) | |||||||||||||||||||||||||||||||||||||||||||
Class A |
| |||||||||||||||||||||||||||||||||||||||||||||||||||||||
Year ended 08/31/17 | $ | 9.30 | $ | 0.26 | $ | (0.02 | ) | $ | 0.24 | $ | (0.36 | ) | $ | — | $ | (0.36 | ) | $ | 9.18 | 2.76 | % | $ | 244,129 | 1.25 | %(d) | 1.25 | %(d) | 2.88 | %(d) | 43 | % | |||||||||||||||||||||||||
Year ended 08/31/16 | 8.81 | 0.30 | 0.67 | 0.97 | (0.28 | ) | (0.20 | ) | (0.48 | ) | 9.30 | 11.54 | 385,887 | 1.24 | 1.24 | 3.37 | 60 | |||||||||||||||||||||||||||||||||||||||
Year ended 08/31/15 | 9.48 | 0.29 | (0.57 | ) | (0.28 | ) | (0.38 | ) | (0.01 | ) | (0.39 | ) | 8.81 | (3.08 | ) | 499,799 | 1.22 | 1.22 | 3.12 | 60 | ||||||||||||||||||||||||||||||||||||
Year ended 08/31/14 | 8.52 | 0.29 | 1.19 | 1.48 | (0.42 | ) | (0.10 | ) | (0.52 | ) | 9.48 | 18.13 | 609,824 | 1.27 | 1.27 | 3.26 | 61 | |||||||||||||||||||||||||||||||||||||||
Year ended 08/31/13 | 8.97 | 0.36 | (0.31 | ) | 0.05 | (0.50 | ) | — | (0.50 | ) | 8.52 | 0.43 | 615,876 | 1.26 | 1.27 | 4.00 | 63 | |||||||||||||||||||||||||||||||||||||||
Class B | ||||||||||||||||||||||||||||||||||||||||||||||||||||||||
Year ended 08/31/17 | 9.28 | 0.19 | (0.02 | ) | 0.17 | (0.29 | ) | — | (0.29 | ) | 9.16 | 1.99 | 477 | 2.00 | (d) | 2.00 | (d) | 2.13 | (d) | 43 | ||||||||||||||||||||||||||||||||||||
Year ended 08/31/16 | 8.79 | 0.23 | 0.67 | 0.90 | (0.21 | ) | (0.20 | ) | (0.41 | ) | 9.28 | 10.72 | 711 | 1.99 | 1.99 | 2.62 | 60 | |||||||||||||||||||||||||||||||||||||||
Year ended 08/31/15 | 9.46 | 0.22 | (0.57 | ) | (0.35 | ) | (0.31 | ) | (0.01 | ) | (0.32 | ) | 8.79 | (3.83 | ) | 1,064 | 1.97 | 1.97 | 2.37 | 60 | ||||||||||||||||||||||||||||||||||||
Year ended 08/31/14 | 8.51 | 0.23 | 1.18 | 1.41 | (0.36 | ) | (0.10 | ) | (0.46 | ) | 9.46 | 17.13 | 1,647 | 2.02 | 2.02 | 2.51 | 61 | |||||||||||||||||||||||||||||||||||||||
Year ended 08/31/13 | 8.95 | 0.29 | (0.30 | ) | (0.01 | ) | (0.43 | ) | — | (0.43 | ) | 8.51 | (0.23 | ) | 1,822 | 2.01 | 2.02 | 3.25 | 63 | |||||||||||||||||||||||||||||||||||||
Class C | ||||||||||||||||||||||||||||||||||||||||||||||||||||||||
Year ended 08/31/17 | 9.28 | 0.19 | (0.02 | ) | 0.17 | (0.29 | ) | — | (0.29 | ) | 9.16 | 1.99 | 70,537 | 2.00 | (d) | 2.00 | (d) | 2.13 | (d) | 43 | ||||||||||||||||||||||||||||||||||||
Year ended 08/31/16 | 8.79 | 0.23 | 0.67 | 0.90 | (0.21 | ) | (0.20 | ) | (0.41 | ) | 9.28 | 10.72 | 95,245 | 1.99 | 1.99 | 2.62 | 60 | |||||||||||||||||||||||||||||||||||||||
Year ended 08/31/15 | 9.46 | 0.22 | (0.57 | ) | (0.35 | ) | (0.31 | ) | (0.01 | ) | (0.32 | ) | 8.79 | (3.83 | ) | 103,988 | 1.97 | 1.97 | 2.37 | 60 | ||||||||||||||||||||||||||||||||||||
Year ended 08/31/14 | 8.51 | 0.23 | 1.18 | 1.41 | (0.36 | ) | (0.10 | ) | (0.46 | ) | 9.46 | 17.14 | 118,319 | 2.02 | 2.02 | 2.51 | 61 | |||||||||||||||||||||||||||||||||||||||
Year ended 08/31/13 | 8.95 | 0.29 | (0.30 | ) | (0.01 | ) | (0.43 | ) | — | (0.43 | ) | 8.51 | (0.23 | ) | 108,878 | 2.01 | 2.02 | 3.25 | 63 | |||||||||||||||||||||||||||||||||||||
Class Y | ||||||||||||||||||||||||||||||||||||||||||||||||||||||||
Year ended 08/31/17 | 9.28 | 0.28 | (0.03 | ) | 0.25 | (0.38 | ) | — | (0.38 | ) | 9.15 | 2.91 | 453,479 | 1.00 | (d) | 1.00 | (d) | 3.13 | (d) | 43 | ||||||||||||||||||||||||||||||||||||
Year ended 08/31/16 | 8.79 | 0.32 | 0.67 | 0.99 | (0.30 | ) | (0.20 | ) | (0.50 | ) | 9.28 | 11.84 | 396,910 | 0.99 | 0.99 | 3.62 | 60 | |||||||||||||||||||||||||||||||||||||||
Year ended 08/31/15 | 9.45 | 0.31 | (0.55 | ) | (0.24 | ) | (0.41 | ) | (0.01 | ) | (0.42 | ) | 8.79 | (2.75 | ) | 398,283 | 0.97 | 0.97 | 3.37 | 60 | ||||||||||||||||||||||||||||||||||||
Year ended 08/31/14 | 8.50 | 0.32 | 1.17 | 1.49 | (0.44 | ) | (0.10 | ) | (0.54 | ) | 9.45 | 18.33 | 428,854 | 1.02 | 1.02 | 3.51 | 61 | |||||||||||||||||||||||||||||||||||||||
Year ended 08/31/13 | 8.95 | 0.39 | (0.32 | ) | 0.07 | (0.52 | ) | — | (0.52 | ) | 8.50 | 0.68 | 270,196 | 1.01 | 1.02 | 4.25 | 63 | |||||||||||||||||||||||||||||||||||||||
Class R5 | ||||||||||||||||||||||||||||||||||||||||||||||||||||||||
Year ended 08/31/17 | 9.30 | 0.29 | (0.02 | ) | 0.27 | (0.39 | ) | — | (0.39 | ) | 9.18 | 3.10 | 7,557 | 0.93 | (d) | 0.93 | (d) | 3.20 | (d) | 43 | ||||||||||||||||||||||||||||||||||||
Year ended 08/31/16 | 8.81 | 0.33 | 0.67 | 1.00 | (0.31 | ) | (0.20 | ) | (0.51 | ) | 9.30 | 11.91 | 12,898 | 0.90 | 0.90 | 3.71 | 60 | |||||||||||||||||||||||||||||||||||||||
Year ended 08/31/15 | 9.47 | 0.32 | (0.56 | ) | (0.24 | ) | (0.41 | ) | (0.01 | ) | (0.42 | ) | 8.81 | (2.68 | ) | 14,204 | 0.91 | 0.91 | 3.43 | 60 | ||||||||||||||||||||||||||||||||||||
Year ended 08/31/14 | 8.52 | 0.32 | 1.18 | 1.50 | (0.45 | ) | (0.10 | ) | (0.55 | ) | 9.47 | 18.40 | 24,749 | 0.91 | 0.91 | 3.62 | 61 | |||||||||||||||||||||||||||||||||||||||
Year ended 08/31/13 | 8.96 | 0.39 | (0.30 | ) | 0.09 | (0.53 | ) | — | (0.53 | ) | 8.52 | 0.85 | 23,565 | 0.94 | 0.95 | 4.32 | 63 | |||||||||||||||||||||||||||||||||||||||
Class R6 | ||||||||||||||||||||||||||||||||||||||||||||||||||||||||
Year ended 08/31/17 | 9.30 | 0.29 | (0.02 | ) | 0.27 | (0.40 | ) | — | (0.40 | ) | 9.17 | 3.09 | 151,573 | 0.84 | (d) | 0.84 | (d) | 3.29 | (d) | 43 | ||||||||||||||||||||||||||||||||||||
Year ended 08/31/16 | 8.81 | 0.34 | 0.67 | 1.01 | (0.32 | ) | (0.20 | ) | (0.52 | ) | 9.30 | 12.00 | 155,908 | 0.82 | 0.82 | 3.79 | 60 | |||||||||||||||||||||||||||||||||||||||
Year ended 08/31/15 | 9.48 | 0.33 | (0.57 | ) | (0.24 | ) | (0.42 | ) | (0.01 | ) | (0.43 | ) | 8.81 | (2.70 | ) | 1,449 | 0.84 | 0.84 | 3.50 | 60 | ||||||||||||||||||||||||||||||||||||
Year ended 08/31/14 | 8.52 | 0.34 | 1.18 | 1.52 | (0.46 | ) | (0.10 | ) | (0.56 | ) | 9.48 | 18.62 | 1,420 | 0.87 | 0.87 | 3.66 | 61 | |||||||||||||||||||||||||||||||||||||||
Year ended 08/31/13(e) | 8.98 | 0.38 | (0.41 | ) | (0.03 | ) | (0.43 | ) | — | (0.43 | ) | 8.52 | (0.49 | ) | 60 | 0.86 | (f) | 0.87 | (f) | 4.40 | (f) | 63 | ||||||||||||||||||||||||||||||||||
| (a) | Calculated using average shares outstanding. |
| (b) | Includes adjustments in accordance with accounting principles generally accepted in the United States of America and as such, the net asset value for financial reporting purposes and the returns based upon those net asset values may differ from the net asset value and returns for shareholder transactions. Does not include sales charges and is not annualized for periods less than one year, if applicable. |
| (c) | Portfolio turnover is calculated at the fund level and is not annualized for periods less than one year, if applicable. |
| (d) | Ratios are based on average daily net assets (000’s omitted) of $302,675, $583, $80,257, $421,759, $9,131 and $148,918 for Class A, Class B, Class C, Class Y, Class R5 and Class R6 shares, respectively. |
| (e) | Commencement date of September 24, 2012. |
| (f) | Annualized. |
23 Invesco Global Real Estate Income Fund
Report of Independent Registered Public Accounting Firm
To the Board of Trustees of AIM Counselor Series Trust (Invesco Counselor Series Trust)
and Shareholders of Invesco Global Real Estate Income Fund:
In our opinion, the accompanying statement of assets and liabilities, including the schedule of investments, and the related statements of operations and of changes in net assets and the financial highlights present fairly, in all material respects, the financial position of Invesco Global Real Estate Income Fund (one of the portfolios constituting AIM Counselor Series Trust (Invesco Counselor Series Trust, hereafter referred to as the “Fund”) as of August 31, 2017, the results of its operations for the year then ended, the changes in its net assets for each of the two years in the period then ended and the financial highlights for each of the periods indicated therein, in conformity with accounting principles generally accepted in the United States of America. These financial statements and financial highlights (hereafter referred to as “financial statements”) are the responsibility of the Fund’s management. Our responsibility is to express an opinion on these financial statements based on our audits. We conducted our audits of these financial statements in accordance with the standards of the Public Company Accounting Oversight Board (United States). Those standards require that we plan and perform the audit to obtain reasonable assurance about whether the financial statements are free of material misstatement. An audit includes examining, on a test basis, evidence supporting the amounts and disclosures in the financial statements, assessing the accounting principles used and significant estimates made by management, and evaluating the overall financial statement presentation. We believe that our audits, which included confirmation of securities as of August 31, 2017 by correspondence with the custodian, transfer agent and brokers, and when replies were not received from brokers, we performed other auditing procedures, provide a reasonable basis for our opinion.
PricewaterhouseCoopers LLP
Houston, Texas
October 30, 2017
24 Invesco Global Real Estate Income Fund
Calculating your ongoing Fund expenses
Example
As a shareholder of the Fund, you incur two types of costs: (1) transaction costs, which may include sales charges (loads) on purchase payments or contingent deferred sales charges on redemptions, if any; and (2) ongoing costs, including management fees, distribution and/or service (12b-1) fees, and other Fund expenses. This example is intended to help you understand your ongoing costs (in dollars) of investing in the Fund and to compare these costs with ongoing costs of investing in other mutual funds. The example is based on an investment of $1,000 invested at the beginning of the period and held for the entire period March 1, 2017 through August 31, 2017.
Actual expenses
The table below provides information about actual account values and actual expenses. You may use the information in this table, together with the amount you invested, to estimate the expenses that you paid over the period. Simply divide your account value by $1,000 (for example, an $8,600 account value divided by $1,000 = 8.6), then multiply the result by the number in the table under the heading entitled “Actual Expenses Paid During Period” to estimate the expenses you paid on your account during this period.
Hypothetical example for comparison purposes
The table below also provides information about hypothetical account values and hypothetical expenses based on the Fund’s actual expense ratio and an assumed rate of return of 5% per year before expenses, which is not the Fund’s actual return.
The hypothetical account values and expenses may not be used to estimate the actual ending account balance or expenses you paid for the period. You may use this information to compare the ongoing costs of investing in the Fund and other funds. To do so, compare this 5% hypothetical example with the 5% hypothetical examples that appear in the shareholder reports of the other funds.
Please note that the expenses shown in the table are meant to highlight your ongoing costs only and do not reflect any transaction costs, such as sales charges (loads) on purchase payments or contingent deferred sales charges on redemptions, if any. Therefore, the hypothetical information is useful in comparing ongoing costs only, and will not help you determine the relative total costs of owning different funds. In addition, if these transaction costs were included, your costs would have been higher.
| Class | Beginning Account Value (03/01/17) | ACTUAL | HYPOTHETICAL (5% annual return before | Annualized Expense Ratio | ||||||||||||||||||||
| Ending Account Value (08/31/17)1 | Expenses Paid During Period2 | Ending Account Value (08/31/17) | Expenses Paid During Period2 | |||||||||||||||||||||
| A | $ | 1,000.00 | $ | 1,042.00 | $ | 6.59 | $ | 1,018.75 | $ | 6.51 | 1.28 | % | ||||||||||||
| B | 1,000.00 | 1,038.20 | 10.43 | 1,014.97 | 10.31 | 2.03 | ||||||||||||||||||
| C | 1,000.00 | 1,038.20 | 10.43 | 1,014.97 | 10.31 | 2.03 | ||||||||||||||||||
| Y | 1,000.00 | 1,043.40 | 5.31 | 1,020.01 | 5.24 | 1.03 | ||||||||||||||||||
| R5 | 1,000.00 | 1,043.70 | 4.84 | 1,020.47 | 4.79 | 0.94 | ||||||||||||||||||
| R6 | 1,000.00 | 1,043.10 | 4.38 | 1,020.92 | 4.33 | 0.85 | ||||||||||||||||||
| 1 | The actual ending account value is based on the actual total return of the Fund for the period March 1, 2017 through August 31, 2017, after actual expenses and will differ from the hypothetical ending account value which is based on the Fund’s expense ratio and a hypothetical annual return of 5% before expenses. |
| 2 | Expenses are equal to the Fund’s annualized expense ratio as indicated above multiplied by the average account value over the period, multiplied by 184/365 to reflect the most recent fiscal half year. |
25 Invesco Global Real Estate Income Fund
Approval of Investment Advisory and Sub-Advisory Contracts
The Board of Trustees (the Board) of AIM Counselor Series Trust (Invesco Counselor Series Trust) is required under the Investment Company Act of 1940, as amended, to approve annually the renewal of Invesco Global Real Estate Income Fund’s (the Fund) investment advisory agreements. During contract renewal meetings held on June 12-13, 2017, the Board as a whole, and the disinterested or “independent” Trustees, who comprise over 75% of the Board, voting separately, approved the continuance for the Fund of the Master Investment Advisory Agreement with Invesco Advisers, Inc. (Invesco Advisers and the investment advisory agreement) and the Master Intergroup Sub-Advisory Contract for Mutual Funds with Invesco Asset Management Deutschland GmbH, Invesco Asset Management Limited, Invesco Asset Management (Japan) Limited, Invesco Hong Kong Limited, Invesco Senior Secured Management, Inc. and Invesco Canada Ltd. (collectively, the Affiliated Sub-Advisers and the sub-advisory contracts) for another year, effective July 1, 2017.
In evaluating the fairness and reasonableness of compensation under the Fund’s investment advisory agreement and sub-advisory contracts, the Board considered, among other things, the factors discussed below. The Board determined that continuation of the Fund’s investment advisory agreement and the sub-advisory contracts is in the best interest of the Fund and its shareholders and that the compensation payable to Invesco Advisers and the Affiliated Sub-Advisers under the agreements is fair and reasonable.
The Board’s Fund Evaluation Process
The Board’s Investments Committee has established three Sub-Committees, which meet throughout the year to review the performance of funds advised by Invesco Advisers (the Invesco Funds). Over the course of each year, the Sub-Committees meet with portfolio managers for their assigned Invesco Funds and other members of management to review the performance, investment objective(s), policies, strategies, limitations and investment risks of these funds. The Board had the benefit of reports from the Sub-Committees and Investments Committee throughout the year in considering approval of the continuance of each Invesco Fund’s investment advisory agreement and sub-advisory contracts for another year.
During the contract renewal process, the Board receives comparative performance and fee data regarding the Invesco Funds prepared by Invesco Advisers and Broadridge Financial Solutions, Inc. (Broadridge), an independent provider of investment company data. The Board also receives an independent written evaluation from the Senior Officer, an officer of the Invesco Funds who reports directly to the independent Trustees. The Senior Officer’s
evaluation is prepared as part of his responsibility to manage the process by which the Invesco Funds’ proposed management fees are negotiated during the annual contract renewal process to ensure they are negotiated in a manner that is at arms’ length and reasonable. In addition to meetings with Invesco Advisers and fund counsel, the independent Trustees also discuss the continuance of the investment advisory agreement and sub-advisory contracts in separate sessions with the Senior Officer and with independent legal counsel.
The Trustees recognized that the advisory fee rates for the Invesco Funds are, in most cases, the result of years of review and negotiation. The Trustees’ deliberations and conclusions in a particular year may be based in part on their deliberations and conclusions regarding these arrangements throughout the year and in prior years. The Trustees’ review and conclusions are based on the comprehensive consideration of all information presented to them and are not the result of any single determinative factor. Moreover, one Trustee may have weighed a particular piece of information or factor differently than another Trustee.
The discussion below is a summary of the Senior Officer’s independent written evaluation with respect to the Fund’s investment advisory agreement as well as a discussion of the material factors and related conclusions that formed the basis for the Board’s approval of the Fund’s investment advisory agreement and sub-advisory contracts. This information is current as of June 13, 2017, and does not reflect consideration of factors that became known to the Board after that date.
Factors and Conclusions and Summary of Independent Written Fee Evaluation
| A. | Nature, Extent and Quality of Services Provided by Invesco Advisers and the Affiliated Sub-Advisers |
The Board reviewed the advisory services provided to the Fund by Invesco Advisers under the Fund’s investment advisory agreement, the performance of Invesco Advisers in providing these services, and the credentials and experience of the officers and employees of Invesco Advisers who provide these services, including the Fund’s portfolio manager or managers. The Board’s review included consideration of Invesco Advisers’ investment process oversight, credit analysis and investment risk management. The Board also considered non-advisory services that Invesco Advisers and its affiliates provide to the Invesco Funds such as various back office support functions, trading operations, internal audit, valuation and legal and compliance.
In determining whether to continue the Fund’s investment advisory agreement, the Board considered the benefits of reapproving an
existing relationship as contrasted with the greater uncertainty that may be associated with entering into a new relationship. The Board concluded that the nature, extent and quality of the services provided to the Fund by Invesco Advisers are appropriate and satisfactory.
The Board reviewed the services that may be provided by the Affiliated Sub-Advisers under the sub-advisory contracts and the credentials and experience of the officers and employees of the Affiliated Sub-Advisers who provide these services. The Board noted that the Affiliated Sub-Advisers have offices and personnel that are located in financial centers around the world. As a result, the Board noted that the Affiliated Sub-Advisers can provide research and investment analysis on the markets and economies of various countries in which the Fund may invest, make recommendations regarding securities and assist with security trades. The Board concluded that the sub-advisory contracts may benefit the Fund and its shareholders by permitting Invesco Advisers to use the resources and talents of the Affiliated Sub-Advisers in managing the Fund. The Board concluded that the nature, extent and quality of the services that may be provided by the Affiliated Sub-Advisers are appropriate and satisfactory.
| B. | Fund Investment Performance |
The Board considered Fund investment performance as a relevant factor in considering whether to approve the investment advisory agreement as well as the sub-advisory contracts for the Fund, as Invesco Asset Management Limited currently manages assets of the Fund.
The Board compared the Fund’s investment performance over multiple time periods ending December 31, 2016 to the performance of funds in the Broadridge performance universe and against the Lipper Global Real Estate Funds Index. The Board noted that performance of Class A shares of the Fund was in the second quintile of the Broadridge performance universe for the one and three year periods and the fifth quintile for the five year period (the first quintile being the best performing funds and the fifth quintile being the worst performing funds). The Board noted that performance of Class A shares of the Fund was above the performance of the Index for the one year period and below the performance of the Index for the three and five year periods. The Trustees also reviewed more recent Fund performance and this review did not change their conclusions.
| C. | Advisory and Sub-Advisory Fees |
The Board compared the Fund’s contractual management fee rate to the contractual management fee rates of funds in the Fund’s Broadridge expense group at a common asset level. The Board noted that the contractual management fee rate for Class A shares of the Fund was below the median contractual management fee rate of funds in its expense
26 Invesco Global Real Estate Income Fund
group. The Board noted that the term “contractual management fee” for funds in the expense group may include both advisory and certain administrative services fees, but that Broadridge does not provide information on a fund by fund basis as to what is included. The Board noted that Invesco Advisers does not separately charge the Invesco Funds for the administrative services included in the term as defined by Broadridge. The Board also reviewed the methodology used by Broadridge in providing expense group information, which includes using each fund’s contractual management fee schedule (including any applicable breakpoints) as reported in the most recent prospectus or statement of additional information for each fund in the expense group.
The Board noted that Invesco Advisers and the Affiliated Sub-Advisers do not manage other mutual funds or client accounts with investment strategies comparable to those of the Fund.
The Board also considered the services that may be provided by the Affiliated Sub-Advisers pursuant to the sub-advisory contracts, as well as the fees payable by Invesco Advisers to the Affiliated Sub-Advisers pursuant to the sub-advisory contracts. The Board noted that Invesco Advisers retains overall responsibility for, and provides services to, sub-advised Invesco Funds, including oversight of the Affiliated Sub-Advisers as well as the additional services described herein other than day-to-day portfolio management. The Board also noted that the sub-advisory fees are not paid directly by the Fund, but rather, are payable by Invesco Advisers to the Affiliated Sub-Advisers.
| D. | Economies of Scale and Breakpoints |
The Board considered the extent to which there are economies of scale in the provision of advisory services to the Fund. The Board also considered that the Fund benefits from economies of scale through contractual breakpoints in the Fund’s advisory fee schedule. The Board noted that the Fund shares directly in economies of scale through lower fees charged by third party service providers based on the combined size of the Invesco Funds advised by Invesco Advisers.
| E. | Profitability and Financial Resources |
The Board reviewed information from Invesco Advisers concerning the costs of the advisory and other services that Invesco Advisers and its affiliates provide to the Fund and the Invesco Funds and the profitability of Invesco Advisers and its affiliates in providing these services. The Board noted that Invesco Advisers continues to operate at a net profit from services Invesco Advisers and its affiliates provide to the Invesco Funds and the Fund. The Board did not deem the level of profits realized by Invesco Advisers and its affiliates from providing services to the Fund to be excessive given the nature, quality and extent of the services provided. The Board received and accepted information from Invesco Advisers demonstrating that Invesco Advisers and each Affiliated Sub-Adviser are financially sound and have the resources necessary to
perform their obligations under the investment advisory agreement and sub-advisory contracts.
| F. | Collateral Benefits to Invesco Advisers and its Affiliates |
The Board considered various other benefits received by Invesco Advisers and its affiliates from the relationship with the Fund, including the fees received for providing transfer agency and distribution services to the Fund. The Board considered comparative information regarding fees charged for these services, including information provided by Broadridge and other independent sources. The Board considered the performance of Invesco Advisers and its affiliates in providing these services and the organizational structure employed to provide these services. The Board also considered that these services are provided to the Fund pursuant to written contracts that are reviewed and approved on an annual basis by the Board; and that the services are required for the operation of the Fund.
The Board considered the benefits realized by Invesco Advisers and the Affiliated Sub-Advisers as a result of portfolio brokerage transactions executed through “soft dollar” arrangements. The Board noted that soft dollar arrangements may result in the Fund bearing costs to purchase research that may be used by Invesco Advisers or the Affiliated Sub-Advisers with other clients and may reduce Invesco Adviser’s or the Affiliated Sub-Adviser’s expenses. The Board also considered that it receives periodic reports from the Chief Compliance Officer of the Invesco Funds demonstrating that these arrangements are consistent with regulatory requirements. The Board did not deem the soft dollar arrangements to be inappropriate.
The Board considered that the Fund’s uninvested cash and cash collateral from any securities lending arrangements may be invested in money market funds advised by Invesco Advisers pursuant to procedures approved by the Board. The Board noted that Invesco Advisers receives advisory fees from these affiliated money market funds attributable to such investments, although Invesco Advisers has contractually agreed to waive through varying periods the advisory fees payable by the Invesco Funds with respect to certain investments in the affiliated money market funds. The waiver is in an amount equal to 100% of the net advisory fee Invesco Advisers receives from the affiliated money market funds with respect to the Fund’s investment in the affiliated money market funds of uninvested cash, but not cash collateral. The Board concluded that the amount of advisory fees received by Invesco Advisers from the Fund’s investment of cash collateral from any securities lending arrangements in the affiliated money market funds is fair and reasonable.
The Board also considered that the Fund may use an affiliated broker to execute certain trades for the Fund to, among other things, control information leakage, and was advised that such trades would be executed in compliance with rules under the federal
securities laws and consistent with best execution obligations.
27 Invesco Global Real Estate Income Fund
Tax Information
Form 1099-DIV, Form 1042-S and other year-end tax information provide shareholders with actual calendar year amounts that should be included in their tax returns. Shareholders should consult their tax advisors.
The following distribution information is being provided as required by the Internal Revenue Code or to meet a specific state’s requirement.
The Fund designates the following amounts or, if subsequently determined to be different, the maximum amount allowable for its fiscal year ended August 31, 2017:
Federal and State Income Tax | ||||
Qualified Dividend Income* | 3.44 | % | ||
Corporate Dividends Received Deduction* | 0.00 | % | ||
U.S. Treasury Obligations* | 0.00 | % | ||
| * | The above percentages are based on ordinary income dividends paid to shareholders during the Fund’s fiscal year. |
28 Invesco Global Real Estate Income Fund
Proxy Results
A Special Joint Meeting (“Meeting”) of Shareholders of Invesco Global Real Estate Income Fund, an investment portfolio of AIM Counselor Series Trust (Invesco Counselor Series Trust), a Delaware statutory trust (“Trust”), was held on March 9, 2017. The Meeting was held for the following purposes:
| (1) | Elect 15 trustees to the Board, each of whom will serve until his or her successor is elected and qualified. |
| (2) | Approve an amendment to the Trust’s Agreement and Declaration of Trust that would permit fund mergers and other significant transactions upon the Board’s approval but without shareholder approval of such transactions. |
The results of the voting on the above matters were as follows:
| Matters | Votes For | Votes Withheld | ||||||||||||||||
| (1)* | David C. Arch | 1,425,647,604 | 36,521,875 | |||||||||||||||
| James T. Bunch | 1,425,181,099 | 36,988,380 | ||||||||||||||||
| Bruce L. Crockett | 1,425,174,694 | 36,994,785 | ||||||||||||||||
| Jack M. Fields | 1,426,060,874 | 36,108,605 | ||||||||||||||||
| Martin L. Flanagan | 1,426,481,477 | 35,688,002 | ||||||||||||||||
| Cynthia Hostetler | 1,426,489,972 | 35,679,505 | ||||||||||||||||
| Dr. Eli Jones | 1,426,255,832 | 35,913,647 | ||||||||||||||||
| Dr. Prema Mathai-Davis | 1,425,363,789 | 36,805,689 | ||||||||||||||||
| Teresa M. Ressel | 1,426,514,880 | 35,654,598 | ||||||||||||||||
| Dr. Larry Soll | 1,424,932,245 | 37,237,234 | ||||||||||||||||
| Ann Barnett Stern | 1,426,260,049 | 35,909,429 | ||||||||||||||||
| Raymond Stickel, Jr. | 1,425,391,657 | 36,777,822 | ||||||||||||||||
| Philip A. Taylor | 1,426,285,212 | 35,884,267 | ||||||||||||||||
| Robert C. Troccoli | 1,426,075,097 | 36,094,382 | ||||||||||||||||
| Christopher L. Wilson | 1,426,594,956 | 35,574,523 | ||||||||||||||||
| Votes For | Votes Against | Votes Abstain | Broker Non-Votes | |||||||||||||||
| (2)* | Approve an amendment to the Trust’s Agreement and Declaration of Trust that would permit fund mergers and other significant transactions upon the Board’s approval but without shareholder approval of such transactions | 751,302,707 | 79,810,344 | 41,561,890 | 589,495,482 | |||||||||||||
The Meeting was adjourned until April 11, 2017, with respect to the following proposals:
| (3) | Approve changing the fundamental investment restriction regarding the purchase or sale of physical commodities. |
| 4(a) | Approve an amendment to the current Master Intergroup Sub-Advisory Contract to add Invesco PowerShares Capital Management LLC. |
| 4(b) | Approve an amendment to the current Master Intergroup Sub-Advisory Contract to add Invesco Asset Management (India) Private Limited. |
Invesco Global Real Estate Income Fund did not receive sufficient shareholder votes to pass Proposals 3 and 4(a) - (b).
The results of the voting on the above matters were as follows:
| Matters | Votes For | Votes Against | Votes Abstain | Broker Non-Votes | ||||||||||||||
| (3) | Approve changing the fundamental investment restriction regarding the purchase or sale of physical commodities | 46,924,304 | 3,117,815 | 2,358,079 | 19,628,074 | |||||||||||||
| 4(a) | Approve an amendment to the current Master Intergroup Sub-Advisory Contract to add Invesco PowerShares Capital Management LLC | 48,180,704 | 1,912,944 | 2,306,578 | 19,628,046 | |||||||||||||
| 4(b) | Approve an amendment to the current Master Intergroup Sub-Advisory Contract to add Invesco Asset Management (India) Private Limited | 47,779,376 | 2,308,866 | 2,311,975 | 19,628,055 | |||||||||||||
| * | Each of proposal 1 and 2 required approval by a combined vote of all of the portfolios of AIM Counselor Series Trust (Invesco Counselor Series Trust). |
29 Invesco Global Real Estate Income Fund
Trustees and Officers
The address of each trustee and officer is AIM Counselor Series Trust (Invesco Counselor Series Trust) (the “Trust”), 11 Greenway Plaza, Suite 1000, Houston, Texas 77046-1173. The trustees serve for the life of the Trust, subject to their earlier death, incapacitation, resignation, retirement or removal as more specifically provided in the Trust’s organizational documents. Each officer serves for a one year term or until their successors are elected and qualified. Column two below includes length of time served with predecessor entities, if any.
| Name, Year of Birth and Position(s) Held with the Trust | Trustee and/ or Officer Since | Principal Occupation(s) During Past 5 Years | Number of Overseen by | Other Directorship(s) Held by Trustee During Past 5 Years | ||||
| Interested Persons | ||||||||
| Martin L. Flanagan1 — 1960 Trustee | 2007 | Executive Director, Chief Executive Officer and President, Invesco Ltd. (ultimate parent of Invesco and a global investment management firm); Trustee, The Invesco Funds; Vice Chair, Investment Company Institute; and Member of Executive Board, SMU Cox School of Business
Formerly: Advisor to the Board, Invesco Advisers, Inc. (formerly known as Invesco Institutional (N.A.), Inc.); Chairman and Chief Executive Officer, Invesco Advisers, Inc. (registered investment adviser); Director, Chairman, Chief Executive Officer and President, Invesco Holding Company (US), Inc. (formerly IVZ Inc.) (holding company), Invesco Group Services, Inc. (service provider) and Invesco North American Holdings, Inc. (holding company); Director, Chief Executive Officer and President, Invesco Holding Company Limited (parent of Invesco and a global investment management firm); Director, Invesco Ltd.; Chairman, Investment Company Institute and President, Co-Chief Executive Officer, Co-President, Chief Operating Officer and Chief Financial Officer, Franklin Resources, Inc. (global investment management organization) | 144 | None | ||||
Philip A. Taylor2 — 1954 Trustee and Senior Vice President | 2006 | Head of the Americas and Senior Managing Director, Invesco Ltd.; Director, Invesco Advisers, Inc. (formerly known as Invesco Institutional (N.A.), Inc.) (registered investment adviser); Director, Chairman, Chief Executive Officer and President, Invesco Management Group, Inc. (formerly known as Invesco Aim Management Group, Inc.) (financial services holding company); Director and Chairman, Invesco Investment Services, Inc. (formerly known as Invesco Aim Investment Services, Inc.) (registered transfer agent); Chief Executive Officer, Invesco Corporate Class Inc. (corporate mutual fund company); Director, Chairman and Chief Executive Officer, Invesco Canada Ltd. (formerly known as Invesco Trimark Ltd./Invesco Trimark Ltèe) (registered investment adviser and registered transfer agent); Trustee and Senior Vice President, The Invesco Funds; Director, Invesco Investment Advisers LLC (formerly known as Van Kampen Asset Management).
Formerly: Co-Chairman, Co-President and Co-Chief Executive Officer, Invesco Advisers, Inc. (formerly known as Invesco Institutional (N.A.), Inc.) (registered investment adviser); Director, Chief Executive Officer and President, Van Kampen Exchange Corp; President and Principal Executive Officer, The Invesco Funds (other than AIM Treasurer’s Series Trust (Invesco Treasurer’s Series Trust), Short-Term Investments Trust and Invesco Management Trust); Executive Vice President, The Invesco Funds (AIM Treasurer’s Series Trust (Invesco Treasurer’s Series Trust), Short-Term Investments Trust and Invesco Management Trust only); Director and President, INVESCO Funds Group, Inc. (registered investment adviser and registered transfer agent); Director and Chairman, IVZ Distributors, Inc. (formerly known as INVESCO Distributors, Inc.) (registered broker dealer); Director, President and Chairman, Invesco Inc. (holding company), Invesco Canada Holdings Inc. (holding company), Trimark Investments Ltd./Placements Trimark Ltèe and Invesco Financial Services Ltd/Services Financiers Invesco Ltèe; Chief Executive Officer, Invesco Canada Fund Inc. (corporate mutual fund company); Director and Chairman, Van Kampen Investor Services Inc.; Director, Chief Executive Officer and President, 1371 Preferred Inc. (holding company) and Van Kampen Investments Inc.; Director and President, AIM GP Canada Inc. (general partner for limited partnerships) and Van Kampen Advisors, Inc.; Director and Chief Executive Officer, Invesco Trimark Dealer Inc. (registered broker dealer); Director, Invesco Distributors, Inc. (formerly known as Invesco Aim Distributors, Inc.) (registered broker dealer); Manager, Invesco PowerShares Capital Management LLC; Director, Chief Executive Officer and President, Invesco Advisers, Inc.; Director, Chairman, Chief Executive Officer and President, Invesco Aim Capital Management, Inc.; President, Invesco Trimark Dealer Inc. and Invesco Trimark Ltd./Invesco Trimark Ltèe; Director and President, AIM Trimark Corporate Class Inc. and AIM Trimark Canada Fund Inc.; Senior Managing Director, Invesco Holding Company Limited; Director and Chairman, Fund Management Company (former registered broker dealer); President and Principal Executive Officer, The Invesco Funds (AIM Treasurer’s Series Trust (Invesco Treasurer’s Series Trust), and Short-Term Investments Trust only); President, AIM Trimark Global Fund Inc. and AIM Trimark Canada Fund Inc. | 144 | None |
| 1 | Mr. Flanagan is considered an interested person (within the meaning of Section 2(a)(19) of the 1940 Act) of the Trust because he is an officer of the Adviser to the Trust, and an officer and a director of Invesco Ltd., ultimate parent of the Adviser. |
| 2 | Mr. Taylor is considered an interested person (within the meaning of Section 2(a)(19) of the 1940 Act) of the Trust because he is an officer and a director of the Adviser. |
T-1 Invesco Global Real Estate Income Fund
Trustees and Officers—(continued)
| Name, Year of Birth and Position(s) Held with the Trust | Trustee and/ or Officer Since | Principal Occupation(s) During Past 5 Years | Number of Complex Overseen by Trustee | Other Directorship(s) Held by Trustee During | ||||
| Independent Trustees | ||||||||
Bruce L. Crockett — 1944 Trustee and Chair | 2003 | Chairman, Crockett Technologies Associates (technology consulting company)
Formerly: Director, Captaris (unified messaging provider); Director, President and Chief Executive Officer, COMSAT Corporation; Chairman, Board of Governors of INTELSAT (international communications company); ACE Limited (insurance company); Independent Directors Council and Investment Company Institute: Member of the Audit Committee, Investment Company Institute; Member of the Executive Committee and Chair of the Governance Committee, Independent Directors Council | 144 | Director and Chairman of the Audit Committee, ALPS (Attorneys Liability Protection Society) (insurance company); Director and Member of the Audit Committee, Ferroglobe PLC (metallurgical company) | ||||
David C. Arch — 1945 Trustee | 2010 | Chairman of Blistex Inc. (consumer health care products manufacturer); Member, World Presidents’ Organization | 144 | Board member of the Illinois Manufacturers’ Association | ||||
James T. Bunch — 1942 Trustee | 2000 | Managing Member, Grumman Hill Group LLC (family office/private equity investments)
Formerly: Chairman of the Board, Denver Film Society; Chairman of the Board of Trustees, Evans Scholarship Foundation; Chairman, Board of Governors, Western Golf Association | 144 | Trustee, Evans Scholarship Foundation | ||||
Jack M. Fields — 1952 Trustee | 2003 | Chief Executive Officer, Twenty First Century Group, Inc. (government affairs company); and Discovery Learning Alliance (non-profit)
Formerly: Owner and Chief Executive Officer, Dos Angeles Ranch L.P. (cattle, hunting, corporate entertainment); Director, Insperity, Inc. (formerly known as Administaff); Chief Executive Officer, Texana Timber LP (sustainable forestry company); Director of Cross Timbers Quail Research Ranch (non-profit); and member of the U.S. House of Representatives | 144 | None | ||||
Cynthia Hostetler — 1962 Trustee | 2017 | Non-Executive Director and Trustee of a number of public and private business corporations
Formerly: Head of Investment Funds and Private Equity, Overseas Private Investment Corporation; President, First Manhattan Bancorporation, Inc.; Attorney, Simpson Thacher & Bartlett LLP | 144 | Vulcan Materials Company (construction materials company); Trilinc Global Impact Fund; Aberdeen Investment Funds (4 portfolios); Artio Global Investment LLC (mutual fund complex); Edgen Group, Inc. (specialized energy and infrastructure products distributor) | ||||
Eli Jones — 1961 Trustee | 2016 | Professor and Dean, Mays Business School — Texas A&M University
Formerly: Professor and Dean, Walton College of Business, University of Arkansas and E.J. Ourso College of Business, Louisiana State University; Director, Arvest Bank | 144 | Insperity, Inc. (formerly known as Administaff) (human resources provider) | ||||
Prema Mathai-Davis — 1950 Trustee | 2003 | Retired.
Formerly: Chief Executive Officer, YWCA of the U.S.A. | 144 | None | ||||
Teresa M. Ressel — 1962 Trustee | 2017 | Non-executive director and trustee of a number of public and private business corporations
Formerly: Chief Financial Officer, Olayan America, The Olayan Group (international investor/commercial/industrial); Chief Executive Officer, UBS Securities LLC; Group Chief Operating Officer, Americas, UBS AG; Assistant Secretary for Management & Budget and CFO, US Department of the Treasury; Chief Compliance Officer, Kaiser Permanente; Program Manager, Hewlett-Packard; Nuclear Engineering, General Dynamics Corporation | 144 | Atlantic Power Corporation (power generation company); ON Semiconductor Corp. (semiconductor supplier) | ||||
Larry Soll — 1942 Trustee | 1997 | Retired.
Formerly: Chairman, Chief Executive Officer and President, Synergen Corp. (a biotechnology company) | 144 | None | ||||
Ann Barnett Stern — 1957 Trustee | 2017 | President and Chief Executive Officer, Houston Endowment Inc. (private philanthropic institution)
Formerly: Executive Vice President and General Counsel, Texas Children’s Hospital; Attorney, Beck, Redden and Secrest, LLP; Business Law Instructor, University of St. Thomas; Attorney, Andrews & Kurth LLP | 144 | Federal Reserve Bank of Dallas | ||||
Raymond Stickel, Jr. — 1944 Trustee | 2005 | Retired.
Formerly: Director, Mainstay VP Series Funds, Inc. (25 portfolios); Partner, Deloitte & Touche | 144 | None | ||||
Robert C. Troccoli — 1949 Trustee | 2016 | Adjunct Professor, University of Denver — Daniels College of Business
Formerly: Senior Partner, KPMG LLP | 144 | None | ||||
Christopher L. Wilson — 1957 Trustee | 2017 | Managing Partner, CT2, LLC (investing and consulting firm)
Formerly: President/Chief Executive Officer, Columbia Funds, Bank of America Corporation; President/Chief Executive Officer, CDC IXIS Asset Management Services, Inc.; Principal & Director of Operations, Scudder Funds, Scudder, Stevens & Clark, Inc.; Assistant Vice President, Fidelity Investments | 144 | TD Asset Management USA Inc. (mutual fund complex) (22 portfolios); ISO New England, Inc. (non-profit organization managing regional electricity market) |
T-2 Invesco Global Real Estate Income Fund
Trustees and Officers—(continued)
| Name, Year of Birth and Position(s) Held with the Trust | Trustee and/ or Officer Since | Principal Occupation(s) During Past 5 Years | Number of Complex Overseen by Trustee | Other Directorship(s) Held by Trustee During | ||||
| Other Officers | ||||||||
Sheri Morris — 1964 President, Principal Executive Officer and Treasurer | 2003 | President, Principal Executive Officer and Treasurer, The Invesco Funds; Vice President, Invesco Advisers, Inc. (formerly known as Invesco Institutional (N.A.), Inc.) (registered investment adviser); and Vice President, PowerShares Exchange-Traded Fund Trust, PowerShares Exchange-Traded Fund Trust II, PowerShares India Exchange-Traded Fund Trust, PowerShares Actively Managed Exchange-Traded Fund Trust and PowerShares Actively Managed Exchange-Traded Commodity Fund Trust
Formerly: Vice President and Principal Financial Officer, The Invesco Funds; Vice President, Invesco Aim Advisers, Inc., Invesco Aim Capital Management, Inc. and Invesco Aim Private Asset Management, Inc.; Assistant Vice President and Assistant Treasurer, The Invesco Funds and Assistant Vice President, Invesco Advisers, Inc., Invesco Aim Capital Management, Inc. and Invesco Aim Private Asset Management, Inc.; and Treasurer, PowerShares Exchange-Traded Fund Trust, PowerShares Exchange-Traded Fund Trust II, PowerShares India Exchange-Traded Fund Trust and PowerShares Actively Managed Exchange-Traded Fund Trust | N/A | N/A | ||||
Russell C. Burk — 1958 Senior Vice President and Senior Officer | 2005 | Senior Vice President and Senior Officer, The Invesco Funds | N/A | N/A | ||||
John M. Zerr — 1962 Senior Vice President, Chief Legal Officer and Secretary | 2006 | Director, Senior Vice President, Secretary and General Counsel, Invesco Management Group, Inc. (formerly known as Invesco AIM Management Group, Inc.); Senior Vice President, Invesco Advisers, Inc. (formerly known as Invesco Institutional (N.A.), Inc.) (registered investment adviser); Senior Vice President and Secretary, Invesco Distributors, Inc. (formerly known as Invesco AIM Distributors, Inc.); Director, Vice President and Secretary, Invesco Investment Services, Inc. (formerly known as Invesco AIM Investment Services, Inc.) Senior Vice President, Chief Legal Officer and Secretary, The Invesco Funds; Managing Director, Invesco PowerShares Capital Management LLC; Director, Secretary and General Counsel, Invesco Investment Advisers LLC (formerly known as Van Kampen Asset Management); Secretary and General Counsel, Invesco Capital Markets, Inc. (formerly known as Van Kampen Funds Inc.) and Chief Legal Officer, PowerShares Exchange-Traded Fund Trust, PowerShares Exchange-Traded Fund Trust II, PowerShares India Exchange-Traded Fund Trust, PowerShares Actively Managed Exchange-Traded Fund Trust and PowerShares Actively Managed Exchange-Traded Commodity Fund Trust; Manager and Secretary, Invesco Indexing LLC
Formerly: Director, Secretary, General Counsel and Senior Vice President, Van Kampen Exchange Corp.; Director, Vice President and Secretary, IVZ Distributors, Inc. (formerly known as INVESCO Distributors, Inc.); Director and Vice President, INVESCO Funds Group, Inc.; Director and Vice President, Van Kampen Advisors Inc.; Director, Vice President, Secretary and General Counsel, Van Kampen Investor Services Inc.; Director, Invesco Distributors, Inc. (formerly known as Invesco AIM Distributors, Inc.); Director, Senior Vice President, General Counsel and Secretary, Invesco AIM Advisers, Inc. and Van Kampen Investments Inc.; Director, Vice President and Secretary, Fund Management Company; Director, Senior Vice President, Secretary, General Counsel and Vice President, Invesco AIM Capital Management, Inc.; Chief Operating Officer and General Counsel, Liberty Ridge Capital, Inc. (an investment adviser); Vice President and Secretary, PBHG Funds (an investment company) and PBHG Insurance Series Fund (an investment company); Chief Operating Officer, General Counsel and Secretary, Old Mutual Investment Partners (a broker-dealer); General Counsel and Secretary, Old Mutual Fund Services (an administrator) and Old Mutual Shareholder Services (a shareholder servicing center); Executive Vice President, General Counsel and Secretary, Old Mutual Capital, Inc. (an investment adviser); and Vice President and Secretary, Old Mutual Advisors Funds (an investment company) | N/A | N/A | ||||
Gregory G. McGreevey — 1962 Senior Vice President | 2012 | Senior Managing Director, Invesco Ltd.; Director, Chairman, President, and Chief Executive Officer, Invesco Advisers, Inc. (formerly known as Invesco Institutional (N.A.), Inc.) (registered investment adviser); Director, Invesco Mortgage Capital, Inc. and Invesco Senior Secured Management, Inc.; and Senior Vice President, The Invesco Funds
Formerly: Assistant Vice President, The Invesco Funds | N/A | N/A | ||||
Kelli Gallegos — 1970 Vice President, Principal Financial Officer and Assistant Treasurer | 2008 | Vice President, Principal Financial Officer and Assistant Treasurer, The Invesco Funds; Assistant Treasurer, Invesco PowerShares Capital Management LLC, PowerShares Exchange-Traded Fund Trust, PowerShares Exchange-Traded Fund Trust II, PowerShares India Exchange-Traded Fund Trust, PowerShares Actively Managed Exchange-Traded Fund Trust and PowerShares Actively Managed Exchange-Traded Commodity Fund Trust
Formerly: Assistant Vice President, The Invesco Funds | N/A | N/A |
T-3 Invesco Global Real Estate Income Fund
Trustees and Officers—(continued)
| Name, Year of Birth and Position(s) Held with the Trust | Trustee and/ or Officer Since | Principal Occupation(s) During Past 5 Years | Number of Complex Overseen by Trustee | Other Directorship(s) Held by Trustee During | ||||
| Other Officers—(continued) | ||||||||
Tracy Sullivan — 1962 Vice President, Chief Tax Officer and Assistant Treasurer | 2008 | Vice President, Chief Tax Officer and Assistant Treasurer, The Invesco Funds; Assistant Treasurer, Invesco PowerShares Capital Management LLC, PowerShares Exchange-Traded Fund Trust, PowerShares Exchange-Traded Fund Trust II, PowerShares India Exchange-Traded Fund Trust, PowerShares Actively Managed Exchange-Traded Fund Trust and PowerShares Actively Managed Exchange-Traded Commodity Fund Trust
Formerly: Assistant Vice President, The Invesco Funds | N/A | N/A | ||||
Crissie M. Wisdom — 1969 Anti-Money Laundering Compliance Officer | 2013 | Anti-Money Laundering Compliance Officer, Invesco Advisers, Inc. (formerly known as Invesco Institutional (N.A.), Inc.) (registered investment adviser), Invesco Capital Markets, Inc. (formerly known as Van Kampen Funds Inc.), Invesco Distributors, Inc., Invesco Investment Services, Inc., Invesco Management Group, Inc., The Invesco Funds, and PowerShares Exchange-Traded Fund Trust, PowerShares Exchange-Traded Fund Trust II, PowerShares India Exchange-Traded Fund Trust, PowerShares Actively Managed Exchange-Traded Fund Trust and PowerShares Actively Managed Exchange-Traded Commodity Fund Trust; Anti-Money Laundering Compliance Officer and Bank Secrecy Act Officer, INVESCO National Trust Company and Invesco Trust Company; and Fraud Prevention Manager and Controls and Risk Analysis Manager for Invesco Investment Services, Inc.
Formerly: Anti-Money Laundering Compliance Officer, Van Kampen Exchange Corp. | N/A | N/A | ||||
Robert R. Leveille — 1969 Chief Compliance Officer | 2016 | Chief Compliance Officer, Invesco Advisers, Inc. (registered investment adviser); and Chief Compliance Officer, The Invesco Funds
Formerly: Chief Compliance Officer, Putnam Investments and the Putnam Funds | N/A | N/A |
The Statement of Additional Information of the Trust includes additional information about the Fund’s Trustees and is available upon request, without charge, by calling 1.800.959.4246. Please refer to the Fund’s Statement of Additional Information for information on the Fund’s sub-advisers.
Office of the Fund 11 Greenway Plaza, Suite 1000 Houston, TX 77046-1173 | Investment Adviser Invesco Advisers, Inc. 1555 Peachtree Street, N.E. Atlanta, GA 30309 | Distributor Invesco Distributors, Inc. 11 Greenway Plaza, Suite 1000 Houston, TX 77046-1173 | Auditors PricewaterhouseCoopers LLP 1000 Louisiana Street, Suite 5800 Houston, TX 77002-5678 | |||
Counsel to the Fund Stradley Ronon Stevens & Young, LLP 2005 Market Street, Suite 2600 Philadelphia, PA 19103-7018 | Counsel to the Independent Trustees Goodwin Procter LLP 901 New York Avenue, N.W. Washington, D.C. 20001 | Transfer Agent Invesco Investment Services, Inc. 11 Greenway Plaza, Suite 1000 Houston, TX 77046-1173 | Custodian State Street Bank and Trust Company 225 Franklin Street Boston, MA 02110-2801 | |||
T-4 Invesco Global Real Estate Income Fund
Explore High-Conviction Investing with Invesco

Go paperless with eDelivery
Visit invesco.com/edelivery to enjoy the convenience and security of anytime electronic access to your investment documents.
With eDelivery, you can elect to have any or all of the following materials delivered straight to your inbox to download, save and print from your own computer:
| ∎ | Fund reports and prospectuses |
| ∎ | Quarterly statements |
| ∎ | Daily confirmations |
| ∎ | Tax forms |
Invesco mailing information
Send general correspondence to Invesco Investment Services, Inc., P.O. Box 219078, Kansas City, MO 64121-9078.
Important notice regarding delivery of security holder documents
To reduce Fund expenses, only one copy of most shareholder documents may be mailed to shareholders with multiple accounts at the same address (Householding). Mailing of your shareholder documents may be householded indefinitely unless you instruct us otherwise. If you do not want the mailing of these documents to be combined with those for other members of your household, please contact Invesco Investment Services, Inc. at 800 959 4246 or contact your financial institution. We will begin sending you individual copies for each account within 30 days after receiving your request.
Fund holdings and proxy voting information
The Fund provides a complete list of its holdings four times in each fiscal year, at the quarter ends. For the second and fourth quarters, the lists appear in the Fund’s semiannual and annual reports to shareholders. For the first and third quarters, the Fund files the lists with the Securities and Exchange Commission (SEC) on Form N-Q. The most recent list of portfolio holdings is available at invesco.com/completeqtrholdings. Shareholders can also look up the Fund’s Forms N-Q on the SEC website at sec.gov. Copies of the Fund’s Forms N-Q may be reviewed and copied at the SEC Public Reference Room in Washington, D.C. You can obtain information on the operation of the Public Reference Room, including information about duplicating fee charges, by calling 202 551 8090 or 800 732 0330, or by electronic request at the following email address: publicinfo@sec.gov. The SEC file numbers for the Fund are shown below.
A description of the policies and procedures that the Fund uses to determine how to vote proxies relating to portfolio securities is available without charge, upon request, from our Client Services department at 800 959 4246 or at invesco.com/proxyguidelines. The information is also available on the SEC website, sec.gov.
Information regarding how the Fund voted proxies related to its portfolio securities during the most recent 12-month period ended June 30 is available at invesco.com/proxysearch. The information is also available on the SEC website, sec.gov. Invesco Advisers, Inc. is an investment adviser; it provides investment advisory services to individual and institutional clients and does not sell securities. Invesco Distributors, Inc. is the US distributor for Invesco Ltd.’s retail mutual funds, exchange-traded funds and institutional money market funds. Both are wholly owned, indirect subsidiaries of Invesco Ltd. |  |
| SEC file numbers: 811-09913 and 333-36074 | Invesco Distributors, Inc. | GREI-AR-1 | 10182017 | 0824 |
| ||||
 | Annual Report to Shareholders
| August 31, 2017
| ||
Invesco Growth and Income Fund | ||||
Nasdaq: A: ACGIX ∎ B: ACGJX ∎ C: ACGKX ∎ R: ACGLX ∎ Y: ACGMX ∎ R5: ACGQX ∎ R6: GIFFX | ||||

Letters to Shareholders
Philip Taylor | Dear Shareholders: This annual report includes information about your Fund, including performance data and a complete list of its investments as of the close of the reporting period. Inside is a discussion of how your Fund was managed and the factors that affected its performance during the reporting period. The reporting period began with stock market volatility in the US and abroad, largely the result of uncertainty about global economic growth and monetary policy. While economic data in the US were generally positive, news overseas was less upbeat. The European Central Bank and central banks in China and Japan – as well as other countries – maintained extraordinarily accommodative monetary policies in response to economic weakness. Citing generally positive economic data – specifically, realized and expected labor market conditions and inflation – the US Federal Reserve raised interest rates three times during the reporting period: in December 2016, and in March and June 2017. The major US stock market rally that began in November 2016 |

continued through the end of the reporting period, with major stock market indexes repeatedly hitting new record highs.
Short-term market volatility can prompt some investors to abandon their investment plans – and can cause others to settle for whatever returns the market has to offer. The investment professionals at Invesco, in contrast, invest with high conviction. This means that, no matter the asset class or the strategy, each investment team has a passion to exceed. We want to help investors achieve better outcomes, such as seeking higher returns, helping mitigate risk and generating income. Of course, investing with high conviction can’t guarantee a profit or ensure success; no investment strategy can. To learn more about how we invest with high conviction, visit invesco.com/HighConviction.
You, too, can invest with high conviction by maintaining a long-term investment perspective and by working with your financial adviser on a regular basis. During periods of short-term market volatility or uncertainty, your financial adviser can keep you focused on your long-term investment goals – a new home, a child’s college education or a secure retirement. He or she also can share research about the economy, the markets and individual investment options.
Visit our website for more information on your investments
Our website, invesco.com/us, offers a wide range of market insights and investment perspectives. On the website, you’ll find detailed information about our funds, including performance, holdings and portfolio manager commentaries. You can access information about your account by completing a simple, secure online registration. To do so, select “Log In” on the right side of the homepage, and then select “Register for Individual Account Access.”
In addition to the resources accessible on our website and through our mobile app, you can obtain timely updates to help you stay informed about the markets and the economy by connecting with Invesco on Twitter, LinkedIn or Facebook. You can access our blog at blog.invesco.us.com. Our goal is to provide you the information you want, when and where you want it.
Finally, I’m pleased to share with you Invesco’s commitment to both the Principles for Responsible Investment and to considering environmental, social and governance issues in our robust investment process. I invite you to learn more at invesco.com/esg.
Have questions?
For questions about your account, contact an Invesco client services representative at 800 959 4246. For Invesco-related questions or comments, please email me directly at phil@invesco.com.
All of us at Invesco look forward to serving your investment management needs. Thank you for investing with us.
| Sincerely, |
 |
| Philip Taylor |
| Senior Managing Director, Invesco Ltd. |
2 Invesco Growth and Income Fund
Bruce Crockett | Dear Fellow Shareholders: Among the many important lessons I’ve learned in more than 40 years in a variety of business endeavors is the value of a trusted advocate. As independent chair of the Invesco Funds Board, I can assure you that the members of the Board are strong advocates for the interests of investors in Invesco’s mutual funds. We work hard to represent your interests through oversight of the quality of the investment management services your funds receive and other matters important to your investment, including but not limited to: ∎ Ensuring that Invesco offers a diverse lineup of mutual funds that your financial adviser can use to strive to meet your financial needs as your investment goals change over time. ∎ Monitoring how the portfolio management teams of the Invesco funds are performing in light of changing economic and market conditions. |

| ∎ | Assessing each portfolio management team’s investment performance within the context of the investment strategy described in the fund’s prospectus. |
| ∎ | Monitoring for potential conflicts of interests that may impact the nature of the services that your funds receive. |
We believe one of the most important services we provide our fund shareholders is the annual review of the funds’ advisory and sub-advisory contracts with Invesco Advisers and its affiliates. This review is required by the Investment Company Act of 1940 and focuses on the nature and quality of the services Invesco provides as the adviser to the Invesco funds and the reasonableness of the fees that it charges for those services. Each year, we spend months carefully reviewing information received from Invesco and a variety of independent sources, such as performance and fee data prepared by Lipper, Inc. (a subsidiary of Broadridge Financial Solutions, Inc.), an independent, third-party firm widely recognized as a leader in its field. We also meet with our independent legal counsel and other independent advisers to review and help us assess the information that we have received. Our goal is to assure that you receive quality investment management services for a reasonable fee.
I trust the measures outlined above provide assurance that you have a worthy advocate when it comes to choosing the Invesco Funds.
As always, please contact me at bruce@brucecrockett.com with any questions or concerns you may have. On behalf of the Board, we look forward to continuing to represent your interests and serving your needs.
Sincerely,

Bruce L. Crockett
Independent Chair
Invesco Funds Board of Trustees
3 Invesco Growth and Income Fund
Management’s Discussion of Fund Performance
| Performance summary |
For the fiscal year ended August 31, 2017, Class A shares of Invesco Growth and Income Fund (the Fund), at net asset value (NAV), outperformed the Russell 1000 Value Index, the Fund’s style-specific benchmark.
Your Fund’s long-term performance appears later in this report.
Fund vs. Indexes
Total returns, 8/31/16 to 8/31/17, at net asset value (NAV). Performance shown does not include applicable contingent deferred sales charges (CDSC) or front-end sales charges, which would have reduced performance.
Class A Shares | 16.90 | % | ||
Class B Shares | 16.86 | |||
Class C Shares | 16.00 | |||
Class R Shares | 16.55 | |||
Class Y Shares | 17.13 | |||
Class R5 Shares | 17.26 | |||
Class R6 Shares | 17.36 | |||
S&P 500 Indexq (Broad Market Index) | 16.23 | |||
Russell 1000 Value Indexq (Style-Specific Index) | 11.58 | |||
Lipper Large-Cap Value Funds Index∎ (Peer Group Index) | 13.66 |
Source(s): qFactSet Research Systems Inc.; ∎Lipper Inc.
Market conditions and your Fund
The fiscal year began with major US stock market indexes posting gains, with most hitting record highs following the US presidential election. Investors seemed to believe that the new administration’s plans to reduce tax rates, scale back regulations and increase infrastructure spending had the potential to stimulate economic growth. However, that was called into question in the first quarter of 2017, when headlines out of Washington, DC, suggested that enacting significant regulatory and tax reforms might be more difficult than previously anticipated. Signs of an improving economy prompted the US Federal Reserve (the Fed) to raise interest rates three times during the reporting period: in December of 2016 and in March and June of 2017. In the first quarter of 2017, the US economy grew at an anemic rate, with gross domestic product rising at an annualized rate of just 1.2%.1 However, the
economy picked up steam during the second quarter. Unemployment continued its years-long decline, hitting a 16-year low of 4.3% in the summer of 2017.2 US equities were strong throughout the reporting period, and major US equity market indexes hit new record highs during the summer.
While US stock market indexes rose for the reporting period ended August 31, 2017, individual market sectors performed very differently from one another. Information technology (IT), financials and industrials were the strongest-performing sectors, while energy, telecommunication services and real estate were the weakest-performing sectors.
For the reporting period as a whole, financials and consumer discretionary were the strongest-performing sectors for the Fund, while energy and materials were the weakest-performing sectors, posting negative returns.
The financials sector was the largest contributor to the Fund’s performance versus the style-specific benchmark due
to strong stock selection in and overweight exposure to the sector. Within the sector, banks and diversified financial stocks – specifically, Citigroup, Bank of America, JP Morgan Chase, Comerica, Morgan Stanley and Citizens Financial Group – were the Fund’s top contributors. These companies benefited from the strong post-presidential election rally in financial stocks, as investor optimism about future interest rates and the economy fueled returns. Financials got another boost in June when the Fed’s Comprehensive Capital Analysis and Review (CCAR) was better than expected, providing a favorable view of the financial strength of US banks.
Stock selection in the consumer discretionary sector also benefited the Fund’s relative performance, and Carnival was a key contributor. The stock performed well throughout the fiscal year, returning almost 50% for the reporting period when the cruise operator raised its outlook and reported better pricing and strong forward booking volumes for 2017. Charter Communications also contributed to the Fund’s relative results.
Having no exposure to the real estate sector and slight underweight exposure to the telecommunication services sector benefited the Fund’s performance versus the style-specific benchmark. Both sectors posted negative returns for the fiscal year and were bottom-performing sectors within the Russell 1000 Value Index. The Fund has remained materially underweight in these sectors because we believe they are overvalued, as investors have driven up stock prices in a quest for yield in a low-interest rate environment.
Stock selection within the industrials sector contributed to the Fund’s relative
| Portfolio Composition | |||||
By sector | % of total net assets | ||||
Financials | 34.2 | % | |||
| Energy | 13.4 | ||||
Health Care | 11.7 | ||||
| Information Technology | 11.5 | ||||
Consumer Discretionary | 9.1 | ||||
Industrials | 6.4 | ||||
Consumer Staples | 5.7 | ||||
Materials | 2.3 | ||||
Telecommunication Services | 1.7 | ||||
| Utilities | 1.4 | ||||
| Money Market Funds | |||||
| Plus Other Assets Less Liabilities | 2.6 | ||||
| Top 10 Equity Holdings* | |||||
| % of total net assets | |||||
1. Citigroup Inc. | 5.6 | % | |||
2. Bank of America Corp. | 4.1 | ||||
3. JPMorgan Chase & Co. | 3.7 | ||||
4. Morgan Stanley | 3.0 | ||||
5. Oracle Corp. | 2.5 | ||||
6. Citizens Financial Group, Inc. | 2.2 | ||||
7. Royal Dutch Shell | 2.1 | ||||
8. Carnival Corp. | 2.1 | ||||
9. Occidental Petroleum Corp. | 2.0 | ||||
10. Walgreens Boots Alliance, Inc. | 1.9 | ||||
Total Net Assets | $ | 8.0 billion | ||
Total Number of Holdings* | 72 | |||
The Fund’s holdings are subject to change, and there is no assurance that the Fund will continue to hold any particular security.
*Excluding money market fund holdings.
Data presented here are as of August 31, 2017.
4 Invesco Growth and Income Fund
performance. CSX, a rail-based transportation services firm, was the top contributor within the sector, as the stock returned 80% for the reporting period. The company announced the arrival of a new chief executive officer who is highly respected within the industry, and the stock rallied on investors’ expectations of improved profitability.
Stock selection in the materials sector detracted from the Fund’s performance versus the style-specific benchmark. Within the sector, the largest detractor was The Mosaic Company, a phosphate and potash supplier. During the second quarter of 2017, the stock price fell after the company reported sales and profits that were down sharply from the year before. Operating earnings were down due to lower phosphate and potash prices.
Stock selection in the energy sector also detracted from the Fund’s relative results. A number of the Fund’s largest detractors were within the sector, including Apache and Devon Energy. After oil prices traded above $50 per barrel for much of the reporting period, higher inventories and a worsening outlook caused oil prices and many energy stocks to decline during the first half of 2017.
The Fund’s underweight allocation to the utilities sector also detracted from relative performance, as this sector was a top-performing sector within the Russell 1000 Value Index. The Fund remained materially underweight in this sector because we believe it to be overvalued.
We used currency forward contracts for the purpose of hedging currency exposure of non-US-based companies held in the portfolio. Currency forward contracts were used solely for the purpose of hedging and not for speculative purposes or leverage. The use of currency forward contracts had a negative impact on the Fund’s performance, largely due to the strength of the US dollar compared to the foreign currencies in which the Fund’s non-US holdings were denominated.
At the end of the reporting period, the Fund’s largest overweight exposures relative to the style-specific benchmark were in the financials and consumer discretionary sectors, while the Fund’s largest underweight exposures were in the real estate and utilities sectors.
Although equity markets posted strong returns during the reporting period, macroeconomic events generally overshadowed company fundamentals in investors’ minds. We believe that market volatility creates opportunities to invest in companies with attractive valuations and strong fundamentals. We believe patiently investing in these opportunities may lead to strong performance over time.
Thank you for your investment in Invesco Growth and Income Fund and for sharing our long-term investment horizon.
1 Source: Bureau of Economic Analysis
2 Sources: Bureau of Labor Statistics, Bloomberg
The views and opinions expressed in management’s discussion of Fund performance are those of Invesco Advisers, Inc. These views and opinions are subject to change at any time based on factors such as market and economic conditions. These views and opinions may not be relied upon as investment advice or recommendations, or as an offer for a particular security. The information is not a complete analysis of every aspect of any market, country, industry, security or the Fund. Statements of fact are from sources considered reliable, but Invesco Advisers, Inc. makes no representation or warranty as to their completeness or accuracy. Although historical performance is no guarantee of future results, these insights may help you understand our investment management philosophy.
See important Fund and, if applicable, index disclosures later in this report.
 | Thomas Bastian Chartered Financial Analyst, Portfolio Manager, is lead manager of Invesco Growth and Income Fund. He joined | |
Invesco in 2010. Mr. Bastian earned a BA in accounting from St. John’s University and an MBA in finance from the University of Michigan.
| ||
 | Brian Jurkash Portfolio Manager, is manager of Invesco Growth and Income Fund. He joined Invesco in 2000. Mr. Jurkash earned a | |
BBA degree in finance from Stephen F. Austin State University and an MBA in finance from the University of Houston.
| ||
 | Sergio Marcheli Portfolio Manager, is manager of Invesco Growth and Income Fund. He joined Invesco in 2010. Mr. Marcheli earned a | |
BBA from the University of Houston and an MBA from the University of St. Thomas.
| ||
 | Matthew Titus Chartered Financial Analyst, Portfolio Manager, is manager of Invesco Growth and Income Fund. He joined Invesco in | |
| 2016. Mr. Titus earned a bachelor’s degree in accounting and economics from Luther College in Decorah, Iowa, and an MBA from Ohio State University. | ||
5 Invesco Growth and Income Fund
Your Fund’s Long-Term Performance
Results of a $10,000 Investment – Oldest Share Class(es)
Fund and index data from 8/31/07
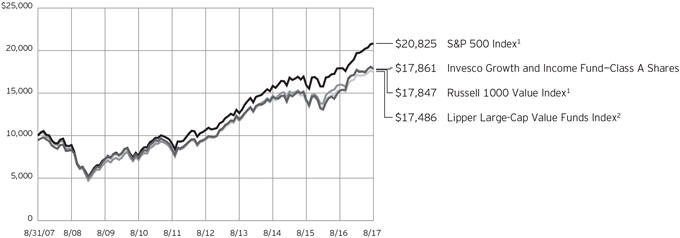
1 Source: FactSet Research Systems Inc.
2 Source: Lipper Inc.
Past performance cannot guarantee comparable future results.
The data shown in the chart include reinvested distributions, applicable sales charges and Fund expenses including management fees. Index
results include reinvested dividends, but they do not reflect sales charges. Performance of the peer group, if applicable, reflects fund expenses and management fees; performance of a market index does not. Performance
shown in the chart and table(s) does not reflect deduction of taxes a shareholder would pay on Fund distributions or sale of Fund shares.
continued from page 8
| ∎ | Real estate investment trust (REIT) risk/real estate risk. Investments in real estate related instruments may be affected by economic, legal, cultural, environmental or technological factors that affect property values, rents or occupancies of real estate related to the Fund’s holdings. Shares of real estate related companies, which tend to be small- and mid-cap companies, may be more volatile and less liquid. |
| ∎ | Sector focus risk. The Fund may from time to time invest a significant amount of its assets (i.e. over 25%) in one market sector or group of related industries. In this event, the Fund’s performance will depend to a greater extent on the overall condition of the sector or group of industries and there is increased risk that the Fund will lose significant value if conditions adversely affect that sector or group of industries. |
| ∎ | Small- and mid-capitalization companies risks. Small- and mid-capitalization companies tend to be more vulnerable to changing market conditions, may have little or no operating history or track record of success, and may have more limited product lines and markets, less experienced management and fewer financial resources than larger |
companies. These companies’ securities may be more volatile and less liquid than those of more established companies, and their returns may vary, sometimes significantly, from the overall securities market. |
| ∎ | Value investing style risk. A value investing style subjects the Fund to the risk that the valuations never improve or that the returns on value equity securities are less than returns on other styles of investing or the overall stock market. |
About indexes used in this report
| ∎ | The S&P 500® Index is an unmanaged index considered representative of the US stock market. |
| ∎ | The Russell 1000® Value Index is an unmanaged index considered representative of large-cap value stocks. The Russell 1000 Value Index is a trademark/service mark of the Frank Russell Co. Russell® is a trademark of the Frank Russell Co. |
| ∎ | The Lipper Large-Cap Value Funds Index is an unmanaged index considered representative of large-cap value funds tracked by Lipper. |
| ∎ | The Fund is not managed to track the performance of any particular index, including the index(es) described here, |
and consequently, the performance of the Fund may deviate significantly from the performance of the index(es). |
| ∎ | A direct investment cannot be made in an index. Unless otherwise indicated, index results include reinvested dividends, and they do not reflect sales charges. Performance of the peer group, if applicable, reflects fund expenses; performance of a market index does not. |
Other information
| ∎ | The returns shown in management’s discussion of Fund performance are based on net asset values (NAVs) calculated for shareholder transactions. Generally accepted accounting principles require adjustments to be made to the net assets of the Fund at period end for financial reporting purposes, and as such, the NAVs for shareholder transactions and the returns based on those NAVs may differ from the NAVs and returns reported in the Financial Highlights. |
| ∎ | Industry classifications used in this report are generally according to the Global Industry Classification Standard, which was developed by and is the exclusive property and a service mark of MSCI Inc. and Standard & Poor’s. |
6 Invesco Growth and Income Fund
| Average Annual Total Returns | ||||||
As of 8/31/17, including maximum applicable sales charges | ||||||
Class A Shares | ||||||
| Inception (8/1/46) | 9.47% | |||||
| 10 Years | 5.97 | |||||
| 5 Years | 11.82 | |||||
| 1 Year | 10.48 | |||||
| Class B Shares | ||||||
| Inception (8/2/93) | 9.61% | |||||
| 10 Years | 6.57 | |||||
| 5 Years | 12.84 | |||||
| 1 Year | 11.86 | |||||
| Class C Shares | ||||||
| Inception (8/2/93) | 9.08% | |||||
| 10 Years | 5.79 | |||||
| 5 Years | 12.25 | |||||
| 1 Year | 15.00 | |||||
| Class R Shares | ||||||
| Inception (10/1/02) | 9.09% | |||||
| 10 Years | 6.31 | |||||
| 5 Years | 12.80 | |||||
| 1 Year | 16.55 | |||||
| Class Y Shares | ||||||
| Inception (10/19/04) | 8.51% | |||||
| 10 Years | 6.84 | |||||
| 5 Years | 13.37 | |||||
| 1 Year | 17.13 | |||||
| Class R5 Shares | ||||||
| 10 Years | 6.86% | |||||
| 5 Years | 13.47 | |||||
| 1 Year | 17.26 | |||||
| Class R6 Shares | ||||||
| 10 Years | 6.80% | |||||
| 5 Years | 13.58 | |||||
| 1 Year | 17.36 | |||||
Effective June 1, 2010, Class A, Class B, Class C, Class R and Class I shares of the predecessor fund, Van Kampen Growth and Income Fund, advised by Van Kampen Asset Management were reorganized into Class A, Class B, Class C, Class R and Class Y shares, respectively, of Invesco Van Kampen Growth and Income Fund (renamed Invesco Growth and Income Fund). Returns shown above, prior to June 1, 2010, for Class A, Class B, Class C, Class R and Class Y shares are blended returns of the predecessor fund and Invesco Growth and Income Fund. Share class returns will differ from the predecessor fund because of different expenses.
Class R5 shares incepted on June 1, 2010. Performance shown prior to that date is that of the predecessor fund’s Class A shares and includes the 12b-1
| Average Annual Total Returns | ||||||
| As of 6/30/17, the most recent calendar quarter end, including maximum applicable sales charges | ||||||
Class A Shares | ||||||
| Inception (8/1/46) | 9.49% | |||||
| 10 Years | 5.57 | |||||
| 5 Years | 12.51 | |||||
| 1 Year | 17.62 | |||||
| Class B Shares | ||||||
| Inception (8/2/93) | 9.68% | |||||
| 10 Years | 6.16 | |||||
| 5 Years | 13.54 | |||||
| 1 Year | 19.43 | |||||
| Class C Shares | ||||||
| Inception (8/2/93) | 9.15% | |||||
| 10 Years | 5.39 | |||||
| 5 Years | 12.94 | |||||
| 1 Year | 22.52 | |||||
| Class R Shares | ||||||
| Inception (10/1/02) | 9.20% | |||||
| 10 Years | 5.90 | |||||
| 5 Years | 13.50 | |||||
| 1 Year | 24.12 | |||||
| Class Y Shares | ||||||
| Inception (10/19/04) | 8.61% | |||||
| 10 Years | 6.43 | |||||
| 5 Years | 14.07 | |||||
| 1 Year | 24.76 | |||||
| Class R5 Shares | ||||||
| 10 Years | 6.45% | |||||
| 5 Years | 14.18 | |||||
| 1 Year | 24.88 | |||||
| Class R6 Shares | ||||||
| 10 Years | 6.39% | |||||
| 5 Years | 14.26 | |||||
| 1 Year | 25.00 | |||||
fees applicable to Class A shares.
Class R6 shares incepted on September 24, 2012. Performance shown prior to that date is that of the Fund’s and the predecessor fund’s Class A shares and includes the 12b-1 fees applicable to Class A shares.
The performance data quoted represent past performance and cannot guarantee comparable future results; current performance may be lower or higher. Please visit invesco.com/performance for the most recent month-end performance. Performance figures reflect reinvested distributions, changes in net asset value and the effect of the maximum sales charge unless otherwise stated. Investment return and principal value will fluctuate so that you may have a gain or loss when you sell shares.
The total annual Fund operating expense ratio set forth in the most recent Fund prospectus as of the date of this report for Class A, Class B, Class C, Class R, Class Y, Class R5 and Class R6 shares was 0.83%, 0.83%, 1.55%, 1.08%, 0.58%, 0.48% and 0.38%, respectively. The expense ratios presented above may vary from the expense ratios presented in other sections of this report that are based on expenses incurred during the period covered by this report.
Class A share performance reflects the maximum 5.50% sales charge, and Class B and Class C share performance reflects the applicable contingent deferred sales charge (CDSC) for the period involved. For shares purchased prior to June 1, 2010, the CDSC on Class B shares declines from 5% at the time of purchase to 0% at the beginning of the sixth year. For shares purchased on or after June 1, 2010, the CDSC on Class B shares declines from 5% at the time of purchase to 0% at the beginning of the seventh year. The CDSC on Class C shares is 1% for the first year after purchase. Class R, Class Y, Class R5 and Class R6 shares do not have a front-end sales charge or a CDSC; therefore, performance is at net asset value.
The performance of the Fund’s share classes will differ primarily due to different sales charge structures and class expenses.
Fund performance reflects any applicable fee waivers and/or expense reimbursements. Had the adviser not waived fees and/or reimbursed expenses currently or in the past, returns would have been lower. See current prospectus for more information.
7 Invesco Growth and Income Fund
Invesco Growth and Income Fund’s investment objective is total return through growth of capital and current income.
| ∎ | Unless otherwise stated, information presented in this report is as of August 31, 2017, and is based on total net assets. |
| ∎ | Unless otherwise noted, all data provided by Invesco. |
| ∎ | To access your Fund’s reports/prospectus, visit invesco.com/fundreports. |
About share classes
| ∎ | Class B shares may not be purchased for new or additional investments. Please see the prospectus for more information. |
| ∎ | Class R shares are generally available only to employer sponsored retirement and benefit plans. Please see the prospectus for more information. |
| ∎ | Class Y shares are available only to certain investors. Please see the prospectus for more information. |
| ∎ | Class R5 shares and Class R6 shares are available for use by retirement plans that meet certain standards and for institutional investors. Class R6 shares are also available through intermediaries that have established an agreement with Invesco Distributors, Inc. to make such shares available for use in retail omnibus accounts. Please see the prospectus for more information. |
Principal risks of investing in the Fund
| ∎ | Convertible securities risk. The market values of convertible securities are affected by market interest rates, the risk of actual issuer default on interest or principal payments and the value of the underlying common stock into which the convertible security may be converted. Additionally, a convertible security is subject to the same types of market and issuer risks as apply to the underlying common stock. In addition, certain convertible securities are subject to involuntary conversions and may undergo principal write-downs upon the occurrence of certain triggering events, and, as a result, are subject to an increased risk of loss. Convertible securities may be rated below investment grade. |
| ∎ | Depositary receipts risk. Investing in depositary receipts involves the same risks as direct investments in foreign securities. In addition, the underlying issuers of certain depositary receipts are under no obligation to distribute shareholder communications or pass through any voting rights with respect to the deposited securities to the holders of such receipts. The Fund |
may therefore receive less timely information or have less control than if it invested directly in the foreign issuer. |
| ∎ | Derivatives risk. The value of a derivative instrument depends largely on (and is derived from) the value of an underlying security, currency, commodity, interest rate, index or other asset (each referred to as an underlying asset). In addition to risks relating to the underlying assets, the use of derivatives may include other, possibly greater, risks, including counterparty, leverage and liquidity risks. Counter-party risk is the risk that the counter-party to the derivative contract will default on its obligation to pay the Fund the amount owed or otherwise perform under the derivative contract. Derivatives create leverage risk because they do not require payment up front equal to the economic exposure created by owning the derivative. As a result, an adverse change in the value of the underlying asset could result in the Fund sustaining a loss that is substantially greater than the amount invested in the derivative, which may make the Fund’s returns more volatile and increase the risk of loss. Derivative instruments may also be less liquid than more traditional investments and the Fund may be unable to sell or close out its derivative positions at a desirable time or price. This risk may be more acute under adverse market conditions, during which the Fund may be most in need of liquidating its derivative positions. Derivatives may also be harder to value, less tax efficient and subject to changing government regulation that could impact the Fund’s ability to use certain derivatives or their cost. Also, derivatives used for hedging or to gain or limit exposure to a particular market segment may not provide the expected benefits, particularly during adverse market conditions. |
| ∎ | Foreign securities risk. The Fund’s foreign investments may be adversely affected by political and social instability, changes in economic or taxation policies, difficulty in enforcing obligations, decreased liquidity or increased |
This report must be accompanied or preceded by a currently effective Fund prospectus, which contains more complete information, including sales charges and expenses. Investors should read it carefully before investing.
| volatility. Foreign investments also involve the risk of the possible seizure, nationalization or expropriation of the issuer or foreign deposits (in which the Fund could lose its entire investments in a certain market) and the possible adoption of foreign governmental restrictions such as exchange controls. Unless the Fund has hedged its foreign securities risk, foreign securities risk also involves the risk of negative foreign currency rate fluctuations, which may cause the value of securities denominated in such foreign currency (or other instruments through which the Fund has exposure to foreign currencies) to decline in value. Currency exchange rates may fluctuate significantly over short periods of time. Currency hedging strategies, if used, are not always successful. |
| ∎ | Management risk. The Fund is actively managed and depends heavily on the Adviser’s judgment about markets, interest rates or the attractiveness, relative values, liquidity, or potential appreciation of particular investments made for the Fund’s portfolio. The Fund could experience losses if these judgments prove to be incorrect. Additionally, legislative, regulatory, or tax developments may adversely affect management of the Fund and, therefore, the ability of the Fund to achieve its investment objective. |
| ∎ | Market risk. The market values of the Fund’s investments, and therefore the value of the Fund’s shares, will go up and down, sometimes rapidly or unpredictably. Market risk may affect a single issuer, industry or section of the economy, or it may affect the market as a whole. Individual stock prices tend to go up and down more dramatically than those of certain other types of investments, such as bonds. During a general downturn in the financial markets, multiple asset classes may decline in value. When markets perform well, there can be no assurance that specific investments held by the Fund will rise in value. |
| NOT FDIC INSURED | MAY LOSE VALUE | NO BANK GUARANTEE | continued on page 6 |
8 Invesco Growth and Income Fund
Schedule of Investments(a)
August 31, 2017
| Shares | Value | |||||||
Common Stocks & Other Equity Interests–97.39% |
| |||||||
| Aerospace & Defense–1.65% | ||||||||
General Dynamics Corp. | 650,720 | $ | 131,022,472 | |||||
| Apparel, Accessories & Luxury Goods–0.95% | ||||||||
Michael Kors Holdings Ltd.(b) | 1,789,340 | 75,545,935 | ||||||
| Asset Management & Custody Banks–2.80% | ||||||||
Northern Trust Corp. | 954,718 | 84,492,543 | ||||||
State Street Corp. | 1,494,159 | 138,194,766 | ||||||
| 222,687,309 | ||||||||
| Automobile Manufacturers–1.56% | ||||||||
General Motors Co. | 3,399,639 | 124,222,809 | ||||||
| Biotechnology–0.79% | ||||||||
Amgen Inc. | 354,153 | 62,957,779 | ||||||
| Broadcasting–0.31% | ||||||||
CBS Corp.–Class B | 389,040 | 24,921,902 | ||||||
| Building Products–1.56% | ||||||||
Johnson Controls International PLC | 3,143,150 | 124,437,308 | ||||||
| Cable & Satellite–2.53% | ||||||||
Charter Communications, Inc.–Class A(b) | 215,741 | 85,981,418 | ||||||
Comcast Corp.–Class A | 2,845,163 | 115,542,070 | ||||||
| 201,523,488 | ||||||||
| Communications Equipment–2.97% | ||||||||
Cisco Systems, Inc. | 4,048,281 | 130,395,131 | ||||||
Juniper Networks, Inc. | 3,814,711 | 105,781,936 | ||||||
| 236,177,067 | ||||||||
| Construction Machinery & Heavy Trucks–0.20% | ||||||||
Caterpillar Inc. | 134,422 | 15,793,241 | ||||||
| Data Processing & Outsourced Services–0.94% | ||||||||
PayPal Holdings, Inc.(b) | 1,214,185 | 74,890,931 | ||||||
| Diversified Banks–13.41% | ||||||||
Bank of America Corp. | 13,777,986 | 329,156,086 | ||||||
Citigroup Inc. | 6,505,445 | 442,565,423 | ||||||
JPMorgan Chase & Co. | 3,244,709 | 294,911,601 | ||||||
| 1,066,633,110 | ||||||||
| Diversified Metals & Mining–0.88% | ||||||||
BHP Billiton Ltd. (Australia) | 3,198,927 | 69,613,847 | ||||||
| Drug Retail–3.10% | ||||||||
CVS Health Corp. | 1,214,937 | 93,963,228 | ||||||
Walgreens Boots Alliance, Inc. | 1,868,767 | 152,304,510 | ||||||
| 246,267,738 | ||||||||
| Electric Utilities–1.43% | ||||||||
FirstEnergy Corp. | 1,151,483 | 37,515,316 | ||||||
PG&E Corp. | 1,082,978 | 76,219,992 | ||||||
| 113,735,308 | ||||||||
| Shares | Value | |||||||
| Fertilizers & Agricultural Chemicals–1.44% | ||||||||
Agrium Inc. (Canada) | 586,259 | $ | 57,476,832 | |||||
Mosaic Co. (The) | 2,873,822 | 57,418,964 | ||||||
| 114,895,796 | ||||||||
| Health Care Distributors–1.00% | ||||||||
Cardinal Health, Inc. | 1,183,658 | 79,849,569 | ||||||
| Health Care Equipment–2.23% | ||||||||
Baxter International Inc. | 1,229,470 | 76,276,319 | ||||||
Medtronic PLC | 1,256,938 | 101,334,341 | ||||||
| 177,610,660 | ||||||||
| Home Improvement Retail–0.87% | ||||||||
Kingfisher PLC (United Kingdom) | 17,867,794 | 69,065,721 | ||||||
| Hotels, Resorts & Cruise Lines–2.10% | ||||||||
Carnival Corp. | 2,404,270 | 167,048,680 | ||||||
| Industrial Conglomerates–0.54% | ||||||||
General Electric Co. | 1,738,468 | 42,679,389 | ||||||
| Industrial Machinery–1.25% | ||||||||
Ingersoll-Rand PLC | 1,164,950 | 99,475,080 | ||||||
| Insurance Brokers–3.12% | ||||||||
Aon PLC | 812,083 | 113,009,470 | ||||||
Marsh & McLennan Cos., Inc. | 734,849 | 57,377,010 | ||||||
Willis Towers Watson PLC | 525,913 | 78,082,303 | ||||||
| 248,468,783 | ||||||||
| Integrated Oil & Gas–6.04% | ||||||||
Exxon Mobil Corp. | 799,964 | 61,061,252 | ||||||
Occidental Petroleum Corp. | 2,632,149 | 157,139,295 | ||||||
Royal Dutch Shell PLC–Class A (United Kingdom) | 6,130,890 | 168,638,492 | ||||||
TOTAL S.A. (France) | 1,805,620 | 93,388,964 | ||||||
| 480,228,003 | ||||||||
| Integrated Telecommunication Services–0.97% | ||||||||
Orange S.A. (France) | 1,148,497 | 19,536,057 | ||||||
Verizon Communications Inc. | 1,198,744 | 57,503,750 | ||||||
| 77,039,807 | ||||||||
| Internet Software & Services–1.41% | ||||||||
eBay Inc.(b) | 3,101,214 | 112,046,862 | ||||||
| Investment Banking & Brokerage–5.30% | ||||||||
Charles Schwab Corp. (The) | 2,189,617 | 87,365,718 | ||||||
Goldman Sachs Group, Inc. (The) | 438,921 | 98,204,185 | ||||||
Morgan Stanley | 5,190,967 | 236,188,998 | ||||||
| 421,758,901 | ||||||||
| IT Consulting & Other Services–1.43% | ||||||||
Cognizant Technology Solutions Corp.–Class A | 1,602,266 | 113,392,365 | ||||||
See accompanying Notes to Financial Statements which are an integral part of the financial statements.
9 Invesco Growth and Income Fund
| Shares | Value | |||||||
| Managed Health Care–0.98% | ||||||||
Anthem, Inc. | 399,450 | $ | 78,308,178 | |||||
| Movies & Entertainment–0.78% | ||||||||
Time Warner Inc. | 613,224 | 61,996,946 | ||||||
| Multi-Line Insurance–0.91% | ||||||||
American International Group, Inc. | 1,194,284 | 72,230,296 | ||||||
| Oil & Gas Equipment & Services–2.46% | ||||||||
Baker Hughes, a GE Co. | 2,235,859 | 75,795,620 | ||||||
TechnipFMC PLC (United Kingdom)(b) | 4,643,662 | 119,945,790 | ||||||
| 195,741,410 | ||||||||
| Oil & Gas Exploration & Production–4.92% | ||||||||
Apache Corp. | 3,573,597 | 138,798,507 | ||||||
Canadian Natural Resources Ltd. (Canada) | 4,494,024 | 138,452,073 | ||||||
Devon Energy Corp. | 3,643,180 | 114,395,852 | ||||||
| 391,646,432 | ||||||||
| Other Diversified Financial Services–0.70% | ||||||||
Voya Financial, Inc. | 1,448,354 | 55,370,573 | ||||||
| Packaged Foods & Meats–1.16% | ||||||||
Mondelez International, Inc.–Class A | 2,261,079 | 91,935,472 | ||||||
| Pharmaceuticals–6.70% | ||||||||
Bristol-Myers Squibb Co. | 1,058,846 | 64,039,006 | ||||||
Merck & Co., Inc. | 1,912,581 | 122,137,423 | ||||||
Novartis AG (Switzerland) | 1,297,985 | 109,519,177 | ||||||
Pfizer Inc. | 4,335,361 | 147,055,445 | ||||||
Sanofi (France) | 927,486 | 90,562,614 | ||||||
| 533,313,665 | ||||||||
| Railroads–1.15% | ||||||||
CSX Corp. | 1,814,303 | 91,078,011 | ||||||
| Regional Banks–7.94% | ||||||||
BB&T Corp. | 753,048 | 34,707,982 | ||||||
| Shares | Value | |||||||
| Regional Banks–(continued) | ||||||||
Citizens Financial Group, Inc. | 5,314,630 | $ | 176,073,692 | |||||
Comerica Inc. | 1,242,928 | 84,829,836 | ||||||
Fifth Third Bancorp | 5,001,305 | 130,684,100 | ||||||
First Horizon National Corp. | 3,499,758 | 60,230,835 | ||||||
PNC Financial Services Group, Inc. (The) | 1,155,672 | 144,932,826 | ||||||
| 631,459,271 | ||||||||
| Semiconductors–2.30% | ||||||||
Intel Corp. | 2,434,397 | 85,374,303 | ||||||
QUALCOMM Inc. | 1,870,668 | 97,779,816 | ||||||
| 183,154,119 | ||||||||
| Systems Software–2.46% | ||||||||
Oracle Corp. | 3,881,658 | 195,363,847 | ||||||
| Tobacco–1.42% | ||||||||
Philip Morris International Inc. | 964,404 | 112,767,760 | ||||||
| Wireless Telecommunication Services–0.73% | ||||||||
Vodafone Group PLC–ADR (United Kingdom) | 2,006,155 | 58,238,680 | ||||||
Total Common Stocks & Other Equity Interests |
| 7,746,594,520 | ||||||
Money Market Funds–1.52% |
| |||||||
Government & Agency Portfolio–Institutional Class, 0.93%(c) | 72,469,169 | 72,469,166 | ||||||
Treasury Portfolio–Institutional Class, 0.90%(c) | 48,312,777 | 48,312,777 | ||||||
Total Money Market Funds |
| 120,781,943 | ||||||
TOTAL INVESTMENTS IN SECURITIES–98.91% |
| 7,867,376,463 | ||||||
OTHER ASSETS LESS LIABILITIES–1.09% | 86,616,082 | |||||||
NET ASSETS–100.00% | $ | 7,953,992,545 | ||||||
Investment Abbreviations:
| ADR | – American Depositary Receipt |
Notes to Schedule of Investments:
| (a) | Industry and/or sector classifications used in this report are generally according to the Global Industry Classification Standard, which was developed by and is the exclusive property and a service mark of MSCI Inc. and Standard & Poor’s. |
| (b) | Non-income producing security. |
| (c) | The money market fund and the Fund are affiliated by having the same investment adviser. The rate shown is the 7-day SEC standardized yield as of August 31, 2017. |
See accompanying Notes to Financial Statements which are an integral part of the financial statements.
10 Invesco Growth and Income Fund
| Open Forward Foreign Currency Contracts | ||||||||||||||||||||||
Settlement Date | Counterparty | Contract to | Unrealized Appreciation (Depreciation) | |||||||||||||||||||
| Deliver | Receive | |||||||||||||||||||||
09/01/2017 | Bank of New York Mellon (The) | AUD | 29,548,760 | USD | 23,497,174 | $ | 12,140 | |||||||||||||||
09/01/2017 | Bank of New York Mellon (The) | CHF | 38,842,540 | USD | 41,109,743 | 595,501 | ||||||||||||||||
09/01/2017 | Bank of New York Mellon (The) | GBP | 84,511,546 | USD | 110,537,299 | 1,243,281 | ||||||||||||||||
09/01/2017 | CIBC World Markets Corp. | USD | 349,781 | CAD | 441,412 | 3,719 | ||||||||||||||||
09/01/2017 | State Street Bank and Trust Co. | AUD | 29,572,110 | USD | 23,532,805 | 29,212 | ||||||||||||||||
09/01/2017 | State Street Bank and Trust Co. | CAD | 63,065,240 | USD | 50,513,414 | 8,227 | ||||||||||||||||
09/01/2017 | State Street Bank and Trust Co. | CHF | 38,856,888 | USD | 41,137,118 | 607,912 | ||||||||||||||||
09/01/2017 | State Street Bank and Trust Co. | GBP | 84,500,501 | USD | 110,578,201 | 1,298,466 | ||||||||||||||||
10/06/2017 | Bank of New York Mellon (The) | AUD | 32,257,180 | USD | 25,713,489 | 88,062 | ||||||||||||||||
10/06/2017 | Bank of New York Mellon (The) | CAD | 65,118,407 | USD | 52,205,401 | 38,719 | ||||||||||||||||
10/06/2017 | Bank of New York Mellon (The) | CHF | 39,036,899 | USD | 41,427,251 | 617,469 | ||||||||||||||||
10/06/2017 | Bank of New York Mellon (The) | EUR | 63,984,870 | USD | 77,211,502 | 885,755 | ||||||||||||||||
10/06/2017 | Bank of New York Mellon (The) | GBP | 85,756,592 | USD | 111,095,521 | 60,527 | ||||||||||||||||
10/06/2017 | State Street Bank and Trust Co. | AUD | 32,257,180 | USD | 25,714,360 | 88,933 | ||||||||||||||||
10/06/2017 | State Street Bank and Trust Co. | CAD | 65,118,408 | USD | 52,218,589 | 51,906 | ||||||||||||||||
10/06/2017 | State Street Bank and Trust Co. | CHF | 39,036,899 | USD | 41,422,284 | 612,502 | ||||||||||||||||
10/06/2017 | State Street Bank and Trust Co. | EUR | 63,984,870 | USD | 77,247,014 | 921,267 | ||||||||||||||||
10/06/2017 | State Street Bank and Trust Co. | GBP | 85,756,592 | USD | 111,140,715 | 105,721 | ||||||||||||||||
Subtotal | 7,269,319 | |||||||||||||||||||||
09/01/2017 | Bank of New York Mellon (The) | CAD | 63,074,622 | USD | 50,502,928 | (9,773 | ) | |||||||||||||||
09/01/2017 | Bank of New York Mellon (The) | EUR | 63,688,306 | USD | 74,544,615 | (1,280,509 | ) | |||||||||||||||
09/01/2017 | Bank of New York Mellon (The) | USD | 25,722,743 | AUD | 32,254,627 | (87,114 | ) | |||||||||||||||
09/01/2017 | Bank of New York Mellon (The) | USD | 52,180,674 | CAD | 65,114,175 | (34,616 | ) | |||||||||||||||
09/01/2017 | Bank of New York Mellon (The) | USD | 41,332,677 | CHF | 39,035,820 | (616,837 | ) | |||||||||||||||
09/01/2017 | Bank of New York Mellon (The) | USD | 77,055,758 | EUR | 63,975,356 | (888,882 | ) | |||||||||||||||
09/01/2017 | Bank of New York Mellon (The) | USD | 110,924,568 | GBP | 85,725,544 | (60,554 | ) | |||||||||||||||
09/01/2017 | State Street Bank and Trust Co. | EUR | 63,700,093 | USD | 74,622,456 | (1,216,700 | ) | |||||||||||||||
09/01/2017 | State Street Bank and Trust Co. | USD | 21,424,355 | AUD | 26,866,242 | (71,357 | ) | |||||||||||||||
09/01/2017 | State Street Bank and Trust Co. | USD | 48,561,824 | CAD | 60,584,274 | (43,494 | ) | |||||||||||||||
09/01/2017 | State Street Bank and Trust Co. | USD | 40,925,199 | CHF | 38,663,608 | (597,591 | ) | |||||||||||||||
09/01/2017 | State Street Bank and Trust Co. | USD | 76,398,199 | EUR | 63,413,043 | (900,795 | ) | |||||||||||||||
09/01/2017 | State Street Bank and Trust Co. | USD | 107,802,919 | GBP | 83,286,503 | (93,179 | ) | |||||||||||||||
Subtotal | (5,901,401 | ) | ||||||||||||||||||||
Total forward foreign currency contracts — currency risk | $ | 1,367,918 | ||||||||||||||||||||
Currency Abbreviations:
| AUD | – Australian Dollar | |
| CAD | – Canadian Dollar | |
| CHF | – Swiss Franc | |
| EUR | – Euro | |
| GBP | – British Pound Sterling | |
| USD | – U.S. Dollar |
See accompanying Notes to Financial Statements which are an integral part of the financial statements.
11 Invesco Growth and Income Fund
Statement of Assets and Liabilities
August 31, 2017
Assets: |
| |||
Investments in securities, at value (Cost $5,491,431,941) | $ | 7,746,594,520 | ||
Investments in affiliated money market funds, at value and cost | 120,781,943 | |||
Other investments: | ||||
Unrealized appreciation on forward foreign currency contracts outstanding | 7,269,319 | |||
Foreign currencies, at value (Cost $1,685,453) | 1,697,579 | |||
Receivable for: | ||||
Investments sold | 90,886,668 | |||
Fund shares sold | 18,059,450 | |||
Dividends | 13,772,411 | |||
Fund expense absorbed | 36,627 | |||
Investment for trustee deferred compensation and retirement plans | 687,433 | |||
Total assets | 7,999,785,950 | |||
Liabilities: |
| |||
Other investments: | ||||
Unrealized depreciation on forward foreign currency contracts outstanding | 5,901,401 | |||
Payable for: | ||||
Investments purchased | 19,517,418 | |||
Fund shares reacquired | 14,443,515 | |||
Accrued fees to affiliates | 4,718,036 | |||
Accrued trustees’ and officers’ fees and benefits | 15,950 | |||
Accrued other operating expenses | 408,734 | |||
Trustee deferred compensation and retirement plans | 788,351 | |||
Total liabilities | 45,793,405 | |||
Net assets applicable to shares outstanding | $ | 7,953,992,545 | ||
Net assets consist of: |
| |||
Shares of beneficial interest | $ | 5,093,185,220 | ||
Undistributed net investment income | 64,100,134 | |||
Undistributed net realized gain | 540,080,535 | |||
Net unrealized appreciation | 2,256,626,656 | |||
| $ | 7,953,992,545 | |||
Net Assets: |
| |||
Class A | $ | 3,972,915,556 | ||
Class B | $ | 17,677,846 | ||
Class C | $ | 253,253,204 | ||
Class R | $ | 119,766,387 | ||
Class Y | $ | 1,152,198,651 | ||
Class R5 | $ | 799,680,904 | ||
Class R6 | $ | 1,638,499,997 | ||
Shares outstanding, no par value, |
| |||
Class A | 144,910,865 | |||
Class B | 650,548 | |||
Class C | 9,349,317 | |||
Class R | 4,366,029 | |||
Class Y | 41,984,850 | |||
Class R5 | 29,111,758 | |||
Class R6 | 59,634,513 | |||
Class A: | ||||
Net asset value per share | $ | 27.42 | ||
Maximum offering price per share | ||||
(Net asset value of $27.42 ¸ 94.50%) | $ | 29.02 | ||
Class B: | ||||
Net asset value and offering price per share | $ | 27.17 | ||
Class C: | ||||
Net asset value and offering price per share | $ | 27.09 | ||
Class R: | ||||
Net asset value and offering price per share | $ | 27.43 | ||
Class Y: | ||||
Net asset value and offering price per share | $ | 27.44 | ||
Class R5: | ||||
Net asset value and offering price per share | $ | 27.47 | ||
Class R6: | ||||
Net asset value and offering price per share | $ | 27.48 | ||
See accompanying Notes to Financial Statements which are an integral part of the financial statements.
12 Invesco Growth and Income Fund
Statement of Operations
For the year ended August 31, 2017
Investment income: |
| |||
Dividends (net of foreign withholding taxes of $4,897,832) | $ | 222,363,843 | ||
Dividends from affiliated money market funds | 975,767 | |||
Total investment income | 223,339,610 | |||
Expenses: | ||||
Advisory fees | 28,478,395 | |||
Administrative services fees | 720,886 | |||
Custodian fees | 298,220 | |||
Distribution fees: | ||||
Class A | 10,287,102 | |||
Class B | 67,565 | |||
Class C | 2,858,983 | |||
Class R | 610,928 | |||
Transfer agent fees — A, B, C, R and Y | 11,209,352 | |||
Transfer agent fees — R5 | 815,435 | |||
Transfer agent fees — R6 | 22,932 | |||
Trustees’ and officers’ fees and benefits | 139,327 | |||
Registration and filing fees | 212,761 | |||
Reports to shareholders | 1,213,517 | |||
Professional services fees | 105,219 | |||
Other | 143,403 | |||
Total expenses | 57,184,025 | |||
Less: Fees waived and expense offset arrangement(s) | (215,502 | ) | ||
Net expenses | 56,968,523 | |||
Net investment income | 166,371,087 | |||
Realized and unrealized gain (loss) from: | ||||
Net realized gain (loss) from: | ||||
Investment securities | 732,133,557 | |||
Foreign currencies | (53,299 | ) | ||
Forward foreign currency contracts | (12,095,701 | ) | ||
| 719,984,557 | ||||
Change in net unrealized appreciation of: | ||||
Investment securities | 365,369,192 | |||
Foreign currencies | 183,395 | |||
Forward foreign currency contracts | 620,332 | |||
| 366,172,919 | ||||
Net realized and unrealized gain | 1,086,157,476 | |||
Net increase in net assets resulting from operations | $ | 1,252,528,563 | ||
See accompanying Notes to Financial Statements which are an integral part of the financial statements.
13 Invesco Growth and Income Fund
Statement of Changes in Net Assets
For the years ended August 31, 2017 and 2016
| 2017 | 2016 | |||||||
Operations: | ||||||||
Net investment income | $ | 166,371,087 | $ | 131,918,611 | ||||
Net realized gain | 719,984,557 | 326,833,543 | ||||||
Change in net unrealized appreciation | 366,172,919 | 121,096,427 | ||||||
Net increase in net assets resulting from operations | 1,252,528,563 | 579,848,581 | ||||||
Distributions to shareholders from net investment income: | ||||||||
Class A | (65,514,878 | ) | (73,319,037 | ) | ||||
Class B | (463,353 | ) | (755,848 | ) | ||||
Class C | (2,488,783 | ) | (3,001,913 | ) | ||||
Class R | (1,636,096 | ) | (1,911,040 | ) | ||||
Class Y | (34,864,957 | ) | (36,070,365 | ) | ||||
Class R5 | (15,467,504 | ) | (15,839,561 | ) | ||||
Class R6 | (15,099,067 | ) | (15,063,080 | ) | ||||
Total distributions from net investment income | (135,534,638 | ) | (145,960,844 | ) | ||||
Distributions to shareholders from net realized gains: | ||||||||
Class A | (221,941,621 | ) | (293,157,703 | ) | ||||
Class B | (1,690,438 | ) | (3,128,396 | ) | ||||
Class C | (16,166,259 | ) | (20,896,404 | ) | ||||
Class R | (6,551,730 | ) | (9,082,838 | ) | ||||
Class Y | (101,587,392 | ) | (123,300,010 | ) | ||||
Class R5 | (41,958,702 | ) | (50,003,257 | ) | ||||
Class R6 | (37,894,451 | ) | (46,577,661 | ) | ||||
Total distributions from net realized gains | (427,790,593 | ) | (546,146,269 | ) | ||||
Share transactions–net: | ||||||||
Class A | (443,812,560 | ) | (323,407,907 | ) | ||||
Class B | (18,650,096 | ) | (15,683,027 | ) | ||||
Class C | (62,101,458 | ) | (14,357,608 | ) | ||||
Class R | (7,511,926 | ) | (19,270,295 | ) | ||||
Class Y | (861,160,982 | ) | (16,021,938 | ) | ||||
Class R5 | (37,143,521 | ) | 29,843,461 | |||||
Class R6 | 897,970,051 | (27,669,107 | ) | |||||
Net increase (decrease) in net assets resulting from share transactions | (532,410,492 | ) | (386,566,421 | ) | ||||
Net increase (decrease) in net assets | 156,792,840 | (498,824,953 | ) | |||||
Net assets: | ||||||||
Beginning of year | 7,797,199,705 | 8,296,024,658 | ||||||
End of year (includes undistributed net investment income of $64,100,134 and $38,197,510, respectively) | $ | 7,953,992,545 | $ | 7,797,199,705 | ||||
Notes to Financial Statements
August 31, 2017
NOTE 1—Significant Accounting Policies
Invesco Growth and Income Fund (the “Fund”) is a series portfolio of AIM Counselor Series Trust (Invesco Counselor Series Trust) (the “Trust”). The Trust is a Delaware statutory trust registered under the Investment Company Act of 1940, as amended (the “1940 Act”), as an open-end series management investment company consisting of fourteen separate portfolios, each authorized to issue an unlimited number of shares of beneficial interest. The assets, liabilities and operations of each portfolio are accounted for separately. Information presented in these financial statements pertains only to the Fund. Matters affecting each portfolio or class will be voted on exclusively by the shareholders of such portfolio or class.
The Fund’s investment objective is total return through growth of capital and current income.
The Fund currently consists of seven different classes of shares: Class A, Class B, Class C, Class R, Class Y, Class R5 and Class R6. Class Y shares are available only to certain investors. Class A shares are sold with a front-end sales charge unless certain waiver criteria are met and under certain
14 Invesco Growth and Income Fund
circumstances load waived shares may be subject to contingent deferred sales charges (“CDSC”). Class C shares are sold with a CDSC. Class R, Class Y, Class R5 and Class R6 shares are sold at net asset value. Effective November 30, 2010, new or additional investments in Class B shares are no longer permitted. Existing shareholders of Class B shares may continue to reinvest dividends and capital gains distributions in Class B shares until they convert to Class A shares. Also, shareholders in Class B shares will be able to exchange those shares for Class B shares of other Invesco Funds offering such shares until they convert to Class A shares. Generally, Class B shares will automatically convert to Class A shares on or about the month-end, which is at least eight years after the date of purchase. Redemption of Class B shares prior to the conversion date will be subject to a CDSC.
The Fund is an investment company and accordingly follows the investment company accounting and reporting guidance in accordance with Financial Accounting Standards Board Accounting Standards Codification Topic 946, Financial Services — Investment Companies.
The following is a summary of the significant accounting policies followed by the Fund in the preparation of its financial statements.
| A. | Security Valuations — Securities, including restricted securities, are valued according to the following policy. |
A security listed or traded on an exchange (except convertible securities) is valued at its last sales price or official closing price as of the close of the customary trading session on the exchange where the security is principally traded, or lacking any sales or official closing price on a particular day, the security may be valued at the closing bid price on that day. Securities traded in the over-the-counter market are valued based on prices furnished by independent pricing services or market makers. When such securities are valued by an independent pricing service they may be considered fair valued. Futures contracts are valued at the final settlement price set by an exchange on which they are principally traded. Listed options are valued at the mean between the last bid and asked prices from the exchange on which they are principally traded. Options not listed on an exchange are valued by an independent source at the mean between the last bid and asked prices. For purposes of determining net asset value (“NAV”) per share, futures and option contracts generally are valued 15 minutes after the close of the customary trading session of the New York Stock Exchange (“NYSE”).
Investments in open-end and closed-end registered investment companies that do not trade on an exchange are valued at the end-of-day net asset value per share. Investments in open-end and closed-end registered investment companies that trade on an exchange are valued at the last sales price or official closing price as of the close of the customary trading session on the exchange where the security is principally traded.
Debt obligations (including convertible securities) and unlisted equities are fair valued using an evaluated quote provided by an independent pricing service. Evaluated quotes provided by the pricing service may be determined without exclusive reliance on quoted prices, and may reflect appropriate factors such as institution-size trading in similar groups of securities, developments related to specific securities, dividend rate (for unlisted equities), yield (for debt obligations), quality, type of issue, coupon rate (for debt obligations), maturity (for debt obligations), individual trading characteristics and other market data. Pricing services generally value debt obligations assuming orderly transactions of institutional round lot size, but a Fund may hold or transact in the same securities in smaller, odd lot sizes. Odd lots often trade at lower prices than institutional round lots. Debt obligations are subject to interest rate and credit risks. In addition, all debt obligations involve some risk of default with respect to interest and/or principal payments.
Foreign securities’ (including foreign exchange contracts) prices are converted into U.S. dollar amounts using the applicable exchange rates as of the close of the NYSE. If market quotations are available and reliable for foreign exchange-traded equity securities, the securities will be valued at the market quotations. Because trading hours for certain foreign securities end before the close of the NYSE, closing market quotations may become unreliable. If between the time trading ends on a particular security and the close of the customary trading session on the NYSE, events occur that the investment adviser determines are significant and make the closing price unreliable, the Fund may fair value the security. If the event is likely to have affected the closing price of the security, the security will be valued at fair value in good faith using procedures approved by the Board of Trustees. Adjustments to closing prices to reflect fair value may also be based on a screening process of an independent pricing service to indicate the degree of certainty, based on historical data, that the closing price in the principal market where a foreign security trades is not the current value as of the close of the NYSE. Foreign securities’ prices meeting the approved degree of certainty that the price is not reflective of current value will be priced at the indication of fair value from the independent pricing service. Multiple factors may be considered by the independent pricing service in determining adjustments to reflect fair value and may include information relating to sector indices, American Depositary Receipts and domestic and foreign index futures. Foreign securities may have additional risks including exchange rate changes, potential for sharply devalued currencies and high inflation, political and economic upheaval, the relative lack of issuer information, relatively low market liquidity and the potential lack of strict financial and accounting controls and standards.
Securities for which market prices are not provided by any of the above methods may be valued based upon quotes furnished by independent sources. The last bid price may be used to value equity securities. The mean between the last bid and asked prices is used to value debt obligations, including corporate loans.
Securities for which market quotations are not readily available or became unreliable are valued at fair value as determined in good faith by or under the supervision of the Trust’s officers following procedures approved by the Board of Trustees. Issuer specific events, market trends, bid/asked quotes of brokers and information providers and other market data may be reviewed in the course of making a good faith determination of a security’s fair value.
The Fund may invest in securities that are subject to interest rate risk, meaning the risk that the prices will generally fall as interest rates rise and, conversely, the prices will generally rise as interest rates fall. Specific securities differ in their sensitivity to changes in interest rates depending on their individual characteristics. Changes in interest rates may result in increased market volatility, which may affect the value and/or liquidity of certain Fund investments.
Valuations change in response to many factors including the historical and prospective earnings of the issuer, the value of the issuer’s assets, general economic conditions, interest rates, investor perceptions and market liquidity. Because of the inherent uncertainties of valuation, the values reflected in the financial statements may materially differ from the value received upon actual sale of those investments.
| B. | Securities Transactions and Investment Income — Securities transactions are accounted for on a trade date basis. Realized gains or losses on sales are computed on the basis of specific identification of the securities sold. Interest income (net of withholding tax, if any) is recorded on the accrual basis from settlement date. Dividend income (net of withholding tax, if any) is recorded on the ex-dividend date. |
The Fund may periodically participate in litigation related to Fund investments. As such, the Fund may receive proceeds from litigation settlements. Any proceeds received are included in the Statement of Operations as realized gain (loss) for investments no longer held and as unrealized gain (loss) for investments still held.
Brokerage commissions and mark ups are considered transaction costs and are recorded as an increase to the cost basis of securities purchased and/or a reduction of proceeds on a sale of securities. Such transaction costs are included in the determination of net realized and
15 Invesco Growth and Income Fund
unrealized gain (loss) from investment securities reported in the Statement of Operations and the Statement of Changes in Net Assets and the net realized and unrealized gains (losses) on securities per share in the Financial Highlights. Transaction costs are included in the calculation of the Fund’s net asset value and, accordingly, they reduce the Fund’s total returns. These transaction costs are not considered operating expenses and are not reflected in net investment income reported in the Statement of Operations and the Statement of Changes in Net Assets, or the net investment income per share and the ratios of expenses and net investment income reported in the Financial Highlights, nor are they limited by any expense limitation arrangements between the Fund and the investment adviser.
The Fund allocates income and realized and unrealized capital gains and losses to a class based on the relative net assets of each class.
| C. | Country Determination — For the purposes of making investment selection decisions and presentation in the Schedule of Investments, the investment adviser may determine the country in which an issuer is located and/or credit risk exposure based on various factors. These factors include the laws of the country under which the issuer is organized, where the issuer maintains a principal office, the country in which the issuer derives 50% or more of its total revenues and the country that has the primary market for the issuer’s securities, as well as other criteria. Among the other criteria that may be evaluated for making this determination are the country in which the issuer maintains 50% or more of its assets, the type of security, financial guarantees and enhancements, the nature of the collateral and the sponsor organization. Country of issuer and/or credit risk exposure has been determined to be the United States of America, unless otherwise noted. |
| D. | Distributions — Distributions from net investment income, if any, are declared and paid quarterly and are recorded on the ex-dividend date. Distributions from net realized capital gain, if any, are generally declared and paid annually and recorded on the ex-dividend date. The Fund may elect to treat a portion of the proceeds from redemptions as distributions for federal income tax purposes. |
| E. | Federal Income Taxes — The Fund intends to comply with the requirements of Subchapter M of the Internal Revenue Code of 1986, as amended (the “Internal Revenue Code”), necessary to qualify as a regulated investment company and to distribute substantially all of the Fund’s taxable earnings to shareholders. As such, the Fund will not be subject to federal income taxes on otherwise taxable income (including net realized capital gain) that is distributed to shareholders. Therefore, no provision for federal income taxes is recorded in the financial statements. |
The Fund recognizes the tax benefits of uncertain tax positions only when the position is more likely than not to be sustained. Management has analyzed the Fund’s uncertain tax positions and concluded that no liability for unrecognized tax benefits should be recorded related to uncertain tax positions. Management is not aware of any tax positions for which it is reasonably possible that the total amounts of unrecognized tax benefits will change materially in the next 12 months.
The Fund files tax returns in the U.S. Federal jurisdiction and certain other jurisdictions. Generally, the Fund is subject to examinations by such taxing authorities for up to three years after the filing of the return for the tax period.
| F. | Expenses — Fees provided for under the Rule 12b-1 plan of a particular class of the Fund are charged to the operations of such class. Transfer agency fees and expenses and other shareholder recordkeeping fees and expenses attributable to Class R5 and Class R6 are allocated to each share class based on relative net assets. Sub-accounting fees attributable to Class R5 are charged to the operations of the class. Transfer agency fees and expenses and other shareholder recordkeeping fees and expenses relating to all other classes are allocated among those classes based on relative net assets. All other expenses are allocated among the classes based on relative net assets. |
| G. | Accounting Estimates — The preparation of financial statements in conformity with accounting principles generally accepted in the United States of America (“GAAP”) requires management to make estimates and assumptions that affect the reported amounts of assets and liabilities at the date of the financial statements and the reported amounts of revenues and expenses during the reporting period including estimates and assumptions related to taxation. Actual results could differ from those estimates by a significant amount. In addition, the Fund monitors for material events or transactions that may occur or become known after the period-end date and before the date the financial statements are released to print. |
| H. | Indemnifications — Under the Trust’s organizational documents, each Trustee, officer, employee or other agent of the Trust is indemnified against certain liabilities that may arise out of the performance of their duties to the Fund. Additionally, in the normal course of business, the Fund enters into contracts, including the Fund’s servicing agreements, that contain a variety of indemnification clauses. The Fund’s maximum exposure under these arrangements is unknown as this would involve future claims that may be made against the Fund that have not yet occurred. The risk of material loss as a result of such indemnification claims is considered remote. |
| I. | Foreign Currency Translations — Foreign currency is valued at the close of the NYSE based on quotations posted by banks and major currency dealers. Portfolio securities and other assets and liabilities denominated in foreign currencies are translated into U.S. dollar amounts at date of valuation. Purchases and sales of portfolio securities (net of foreign taxes withheld on disposition) and income items denominated in foreign currencies are translated into U.S. dollar amounts on the respective dates of such transactions. The Fund does not separately account for the portion of the results of operations resulting from changes in foreign exchange rates on investments and the fluctuations arising from changes in market prices of securities held. The combined results of changes in foreign exchange rates and the fluctuation of market prices on investments (net of estimated foreign tax withholding) are included with the net realized and unrealized gain or loss from investments in the Statement of Operations. Reported net realized foreign currency gains or losses arise from (1) sales of foreign currencies, (2) currency gains or losses realized between the trade and settlement dates on securities transactions, and (3) the difference between the amounts of dividends, interest, and foreign withholding taxes recorded on the Fund’s books and the U.S. dollar equivalent of the amounts actually received or paid. Net unrealized foreign currency gains and losses arise from changes in the fair values of assets and liabilities, other than investments in securities at fiscal period end, resulting from changes in exchange rates. |
The Fund may invest in foreign securities, which may be subject to foreign taxes on income, gains on investments or currency repatriation, a portion of which may be recoverable. Foreign taxes, if any, are recorded based on the tax regulations and rates that exist in the foreign markets in which the Fund invests and are shown in the Statement of Operations.
| J. | Forward Foreign Currency Contracts — The Fund may engage in foreign currency transactions either on a spot (i.e. for prompt delivery and settlement) basis, or through forward foreign currency contracts, to manage or minimize currency or exchange rate risk. |
The Fund may also enter into forward foreign currency contracts for the purchase or sale of a security denominated in a foreign currency in order to “lock in” the U.S. dollar price of that security, or the Fund may also enter into forward foreign currency contracts that do not provide for physical settlement of the two currencies, but instead are settled by a single cash payment calculated as the difference between the agreed upon exchange rate and the spot rate at settlement based upon an agreed upon notional amount (non-deliverable forwards). The Fund will set aside liquid assets in an amount equal to the daily mark-to-market obligation for forward foreign currency contracts.
16 Invesco Growth and Income Fund
A forward foreign currency contract is an obligation between two parties (“Counterparties”) to purchase or sell a specific currency for an agreed-upon price at a future date. The use of forward foreign currency contracts does not eliminate fluctuations in the price of the underlying securities the Fund owns or intends to acquire but establishes a rate of exchange in advance. Fluctuations in the value of these contracts are measured by the difference in the contract date and reporting date exchange rates and are recorded as unrealized appreciation (depreciation) until the contracts are closed. When the contracts are closed, realized gains (losses) are recorded. Realized and unrealized gains (losses) on the contracts are included in the Statement of Operations. The primary risks associated with forward foreign currency contracts include failure of the Counterparty to meet the terms of the contract and the value of the foreign currency changing unfavorably. These risks may be in excess of the amounts reflected in the Statement of Assets and Liabilities.
NOTE 2—Advisory Fees and Other Fees Paid to Affiliates
The Trust has entered into a master investment advisory agreement with Invesco Advisers, Inc. (the “Adviser” or “Invesco”). Under the terms of the investment advisory agreement, the Fund accrues daily and pays monthly an advisory fee to the Adviser based on the annual rate of the Fund’s average daily net assets as follows:
| Average Daily Net Assets | Rate | |||
First $150 million | 0.50% | |||
Next $100 million | 0.45% | |||
Next $100 million | 0.40% | |||
Over $350 million | 0.35% | |||
For the year ended August 31, 2017, the effective advisory fees incurred by the Fund was 0.35%.
Under the terms of a master sub-advisory agreement between the Adviser and each of Invesco Asset Management Deutschland GmbH, Invesco Asset Management Limited, Invesco Asset Management (Japan) Limited, Invesco Hong Kong Limited, Invesco Senior Secured Management, Inc. and Invesco Canada Ltd. (collectively, the “Affiliated Sub-Advisers”) the Adviser, not the Fund, will pay 40% of the fees paid to the Adviser to any such Affiliated Sub-Adviser(s) that provide(s) discretionary investment management services to the Fund based on the percentage of assets allocated to such Affiliated Sub-Adviser(s).
The Adviser has contractually agreed, through at least June 30, 2018, to waive advisory fees and/or reimburse expenses to the extent necessary to limit total annual fund operating expenses after fee waiver and/or expense reimbursement (excluding certain items discussed below) of Class A, Class B, Class C, Class R, Class Y, Class R5 and Class R6 shares to 2.00%, 2.75%, 2.75%, 2.25%, 1.75%, 1.75% and 1.75%, respectively, of the Fund’s average daily net assets (the “expense limits”). In determining the Adviser’s obligation to waive advisory fees and/or reimburse expenses, the following expenses are not taken into account, and could cause total annual fund operating expenses after fee waiver and/or expense reimbursement to exceed the numbers reflected above: (1) interest; (2) taxes; (3) dividend expense on short sales; (4) extraordinary or non-routine items, including litigation expenses; and (5) expenses that the Fund has incurred but did not actually pay because of an expense offset arrangement. Unless Invesco continues the fee waiver agreement, it will terminate on June 30, 2018. During its term, the fee waiver agreement cannot be terminated or amended to increase the expense limits or reduce the advisory fee waivers without approval of the Board of Trustees. The Adviser did not waive fees and/or reimburse expenses during the period under this expense limit.
Further, the Adviser has contractually agreed, through at least June 30, 2019, to waive the advisory fee payable by the Fund in an amount equal to 100% of the net advisory fees the Adviser receives from the affiliated money market funds on investments by the Fund of uninvested cash in such affiliated money market funds.
For the year ended August 31, 2017, the Adviser waived advisory fees of $197,747.
The Trust has entered into a master administrative services agreement with Invesco pursuant to which the Fund has agreed to pay Invesco for certain administrative costs incurred in providing accounting services to the Fund. For the year ended August 31, 2017, expenses incurred under the agreement are shown in the Statement of Operations as Administrative services fees.
The Trust has entered into a transfer agency and service agreement with Invesco Investment Services, Inc. (“IIS”) pursuant to which the Fund has agreed to pay IIS a fee for providing transfer agency and shareholder services to the Fund and reimburse IIS for certain expenses incurred by IIS in the course of providing such services. IIS may make payments to intermediaries that provide omnibus account services, sub-accounting services and/or networking services. All fees payable by IIS to intermediaries that provide omnibus account services or sub-accounting services are charged back to the Fund, subject to certain limitations approved by the Trust’s Board of Trustees. For the year ended August 31, 2017, expenses incurred under the agreement are shown in the Statement of Operations as Transfer agent fees.
Shares of the Fund are distributed by Invesco Distributors, Inc. (“IDI”). The Fund has adopted a distribution plan pursuant to Rule 12b-1 under the 1940 Act, and a service plan (collectively, the “Plans”) for Class A, Class B, Class C and Class R shares to compensate IDI for the sale, distribution, shareholder servicing and maintenance of shareholder accounts for these shares. Under the Plans, the Fund will incur annual fees of up to 0.25% of Class A average daily net assets, up to 1.00% each of Class B and Class C average daily net assets and up to 0.50% of Class R average daily net assets. The fees are accrued daily and paid monthly.
With respect to Class B and Class C shares, the Fund is authorized to reimburse in future years any distribution related expenses that exceed the maximum annual reimbursement rate for such class, so long as such reimbursement does not cause the Fund to exceed the Class B and Class C maximum annual reimbursement rate, respectively. With respect to Class A shares, distribution related expenses that exceed the maximum annual reimbursement rate for such class are not carried forward to future years and the Fund will not reimburse IDI for any such expenses.
For the year ended August 31, 2017, expenses incurred under these agreements are shown in the Statement of Operations as Distribution fees.
Front-end sales commissions and CDSC (collectively, the “sales charges”) are not recorded as expenses of the Fund. Front-end sales commissions are deducted from proceeds from the sales of Fund shares prior to investment in Class A shares of the Fund. CDSC are deducted from redemption proceeds prior to remittance to the shareholder. During the year ended August 31, 2017, IDI advised the Fund that IDI retained $520,324 in front-end sales commissions from the sale of Class A shares and $16,485, $635 and $7,103 from Class A, Class B and Class C shares, respectively, for CDSC imposed on redemptions by shareholders.
17 Invesco Growth and Income Fund
For the year ended August 31, 2017, the Fund incurred $31,566 in brokerage commissions with Invesco Capital Markets, Inc., an affiliate of the Adviser and IDI, for portfolio transactions executed on behalf of the Fund.
Certain officers and trustees of the Trust are officers and directors of the Adviser, IIS and/or IDI.
NOTE 3—Additional Valuation Information
GAAP defines fair value as the price that would be received to sell an asset or paid to transfer a liability in an orderly transaction between market participants at the measurement date, under current market conditions. GAAP establishes a hierarchy that prioritizes the inputs to valuation methods, giving the highest priority to readily available unadjusted quoted prices in an active market for identical assets (Level 1) and the lowest priority to significant unobservable inputs (Level 3), generally when market prices are not readily available or are unreliable. Based on the valuation inputs, the securities or other investments are tiered into one of three levels. Changes in valuation methods may result in transfers in or out of an investment’s assigned level:
| Level 1 — | Prices are determined using quoted prices in an active market for identical assets. |
| Level 2 — | Prices are determined using other significant observable inputs. Observable inputs are inputs that other market participants may use in pricing a security. These may include quoted prices for similar securities, interest rates, prepayment speeds, credit risk, yield curves, loss severities, default rates, discount rates, volatilities and others. |
| Level 3 — | Prices are determined using significant unobservable inputs. In situations where quoted prices or observable inputs are unavailable (for example, when there is little or no market activity for an investment at the end of the period), unobservable inputs may be used. Unobservable inputs reflect the Fund’s own assumptions about the factors market participants would use in determining fair value of the securities or instruments and would be based on the best available information. |
The following is a summary of the tiered valuation input levels, as of August 31, 2017. The level assigned to the securities valuations may not be an indication of the risk or liquidity associated with investing in those securities. Because of the inherent uncertainties of valuation, the values reflected in the financial statements may materially differ from the value received upon actual sale of those investments.
The Fund’s policy is to recognize transfers in and out of the valuation levels as of the end of the reporting period. During the year ended August 31, 2017, there were no significant transfers between valuation levels.
| Level 1 | Level 2 | Level 3 | Total | |||||||||||||
Common Stocks & Other Equity Interests | $ | 7,636,495,848 | $ | 110,098,672 | $ | — | $ | 7,746,594,520 | ||||||||
Money Market Funds | 120,781,943 | — | — | 120,781,943 | ||||||||||||
| 7,757,277,791 | 110,098,672 | — | 7,867,376,463 | |||||||||||||
Forward Foreign Currency Contracts* | — | 1,367,918 | — | 1,367,918 | ||||||||||||
Total Investments | $ | 7,757,277,791 | $ | 111,466,590 | $ | — | $ | 7,868,744,381 | ||||||||
| * | Unrealized appreciation. |
NOTE 4—Derivative Investments
The Fund may enter into an International Swaps and Derivatives Association Master Agreement (“ISDA Master Agreement”) under which a fund may trade OTC derivatives. An OTC transaction entered into under an ISDA Master Agreement typically involves a collateral posting arrangement, payment netting provisions and close-out netting provisions. These netting provisions allow for reduction of credit risk through netting of contractual obligations. The enforceability of the netting provisions of the ISDA Master Agreement depends on the governing law of the ISDA Master Agreement, among other factors.
For financial reporting purposes, the Fund does not offset OTC derivative assets or liabilities that are subject to ISDA Master Agreements in the Statement of Assets and Liabilities.
Value of Derivative Investments at Period-End
The table below summarizes the value of the Fund’s derivative investments, detailed by primary risk exposure, held as of August 31, 2017:
Derivative Assets
| Value | |||
| Currency Risk | ||||
Unrealized appreciation on forward foreign currency contracts outstanding | $ | 7,269,319 | ||
Derivatives not subject to master netting agreements | — | |||
Total Derivative Assets subject to master netting agreements | $ | 7,269,319 | ||
| Derivative Liabilities | ||||
Unrealized depreciation on forward foreign currency contracts outstanding | $ | (5,901,401 | ) | |
Derivatives not subject to master netting agreements | — | |||
Total Derivative Liabilities subject to master netting agreements | $ | (5,901,401 | ) | |
18 Invesco Growth and Income Fund
Offsetting Assets and Liabilities
The table below reflects the Fund’s exposure to Counterparties subject to either an ISDA Master Agreement or other agreement for OTC derivative transactions as of August 31, 2017.
| Financial Derivative Assets | Financial Derivative Liabilities | Collateral (Received)/Pledged | ||||||||||||||||||||||
| Counterparty | Forward Foreign Currency Contracts | Forward Foreign Currency Contracts | Net Value of Derivatives | Non-Cash | Cash | Net Amount | ||||||||||||||||||
Bank of New York Mellon (The) | $ | 3,541,454 | $ | (2,978,285 | ) | $ | 563,169 | $ | — | $ | — | $ | 563,169 | |||||||||||
CIBC World Markets Corp. | 3,719 | — | 3,719 | — | — | 3,719 | ||||||||||||||||||
State Street Bank and Trust Co. | 3,724,146 | (2,923,116 | ) | 801,030 | — | — | 801,030 | |||||||||||||||||
Total | $ | 7,269,319 | $ | (5,901,401 | ) | $ | 1,367,918 | $ | — | $ | — | $ | 1,367,918 | |||||||||||
Effect of Derivative Investments for the year ended August 31, 2017
The table below summarizes the gains (losses) on derivative investments, detailed by primary risk exposure, recognized in earnings during the period:
| Location of Gain (Loss) on Statement of Operations | ||||
| Currency Risk | ||||
Realized Gain (Loss): | ||||
Forward foreign currency contracts | $ | (12,095,701 | ) | |
Change in Net Unrealized Appreciation: | ||||
Forward foreign currency contracts | 620,332 | |||
Total | $ | (11,475,369 | ) | |
The table below summarizes the average notional value of forward foreign currency contracts outstanding during the period.
| Forward Foreign Currency Contracts | ||||
Average notional value | $ | 693,666,286 | ||
NOTE 5—Security Transactions with Affiliated Funds
The Fund is permitted to purchase or sell securities from or to certain other Invesco Funds under specified conditions outlined in procedures adopted by the Board of Trustees of the Trust. The procedures have been designed to ensure that any purchase or sale of securities by the Fund from or to another fund or portfolio that is or could be considered an affiliate by virtue of having a common investment adviser (or affiliated investment advisers), common Trustees and/or common officers complies with Rule 17a-7 of the 1940 Act. Further, as defined under the procedures, each transaction is effected at the current market price. Pursuant to these procedures, for the year ended August 31, 2017, the Fund engaged in securities purchases of $24,782,640.
NOTE 6—Expense Offset Arrangement(s)
The expense offset arrangement is comprised of transfer agency credits which result from balances in demand deposit accounts used by the transfer agent for clearing shareholder transactions. For the year ended August 31, 2017, the Fund received credits from this arrangement, which resulted in the reduction of the Fund’s total expenses of $17,755.
NOTE 7—Trustees’ and Officers’ Fees and Benefits
Trustees’ and Officers’ Fees and Benefits include amounts accrued by the Fund to pay remuneration to certain Trustees and Officers of the Fund. Trustees have the option to defer compensation payable by the Fund, and Trustees’ and Officers’ Fees and Benefits also include amounts accrued by the Fund to fund such deferred compensation amounts. Those Trustees who defer compensation have the option to select various Invesco Funds in which their deferral accounts shall be deemed to be invested. Finally, certain current Trustees were eligible to participate in a retirement plan that provided for benefits to be paid upon retirement to Trustees over a period of time based on the number of years of service. The Fund may have certain former Trustees who also participate in a retirement plan and receive benefits under such plan. Trustees’ and Officers’ Fees and Benefits include amounts accrued by the Fund to fund such retirement benefits. Obligations under the deferred compensation and retirement plans represent unsecured claims against the general assets of the Fund.
NOTE 8—Cash Balances
The Fund is permitted to temporarily carry a negative or overdrawn balance in its account with State Street Bank and Trust Company, the custodian bank. Such balances, if any at period-end, are shown in the Statement of Assets and Liabilities under the payable caption Amount due custodian. To compensate the custodian bank for such overdrafts, the overdrawn Fund may either (1) leave funds as a compensating balance in the account so the custodian bank can be compensated by earning the additional interest; or (2) compensate by paying the custodian bank at a rate agreed upon by the custodian bank and Invesco, not to exceed the contractually agreed upon rate.
19 Invesco Growth and Income Fund
NOTE 9—Distributions to Shareholders and Tax Components of Net Assets
Tax Character of Distributions to Shareholders Paid During the Fiscal Years Ended August 31, 2017 and 2016:
| 2017 | 2016 | |||||||
Ordinary income | $ | 143,861,894 | $ | 149,079,878 | ||||
Long-term capital gain | 419,463,337 | 543,027,235 | ||||||
Total distributions | $ | 563,325,231 | $ | 692,107,113 | ||||
Tax Components of Net Assets at Period-End:
| 2017 | ||||
Undistributed ordinary income | $ | 64,848,684 | ||
Undistributed long-term gain | 583,136,957 | |||
Net unrealized appreciation — investments | 2,213,474,076 | |||
Net unrealized appreciation — foreign currencies | 96,158 | |||
Temporary book/tax differences | (748,550 | ) | ||
Shares of beneficial interest | 5,093,185,220 | |||
Total net assets | $ | 7,953,992,545 | ||
The difference between book-basis and tax-basis unrealized appreciation (depreciation) is due to differences in the timing of recognition of gains and losses on investments for tax and book purposes. The Fund’s net unrealized appreciation difference is attributable primarily to wash sales.
The temporary book/tax differences are a result of timing differences between book and tax recognition of income and/or expenses. The Fund’s temporary book/tax differences are the result of the trustee deferral of compensation and retirement plan benefits.
Capital loss carryforward is calculated and reported as of a specific date. Results of transactions and other activity after that date may affect the amount of capital loss carryforward actually available for the Fund to utilize. Capital losses generated in years beginning after December 22, 2010 can be carried forward for an unlimited period, whereas previous losses expire in eight tax years. Capital losses with an expiration period may not be used to offset capital gains until all net capital losses without an expiration date have been utilized. Capital loss carryforwards with no expiration date will retain their character as either short-term or long-term capital losses instead of as short-term capital losses as under prior law. The ability to utilize capital loss carryforwards in the future may be limited under the Internal Revenue Code and related regulations based on the results of future transactions.
The Fund does not have a capital loss carryforward as of August 31, 2017.
NOTE 10—Investment Transactions
The aggregate amount of investment securities (other than short-term securities, U.S. Treasury obligations and money market funds, if any) purchased and sold by the Fund during the year ended August 31, 2017 was $1,254,753,495 and $2,226,400,598, respectively. Cost of investments, including any derivatives, on a tax basis includes the adjustments for financial reporting purposes as of the most recently completed federal income tax reporting period-end.
| Unrealized Appreciation (Depreciation) of Investments on a Tax Basis | ||||
Aggregate unrealized appreciation of investments | $ | 2,510,041,007 | ||
Aggregate unrealized (depreciation) of investments | (296,566,931 | ) | ||
Net unrealized appreciation of investments | $ | 2,213,474,076 | ||
Cost of investments for tax purposes is $5,655,270,305.
NOTE 11—Reclassification of Permanent Differences
Primarily as a result of differing book/tax treatment of foreign currency transactions and excise taxes on August 31, 2017, undistributed net investment income was decreased by $4,933,825, undistributed net realized gain was increased by $4,946,577 and shares of beneficial interest was decreased by $12,752. This reclassification had no effect on the net assets of the Fund.
20 Invesco Growth and Income Fund
NOTE 12—Share Information
| Summary of Share Activity | ||||||||||||||||
| Years ended August 31, | ||||||||||||||||
| 2017(a) | 2016 | |||||||||||||||
| Shares | Amount | Shares | Amount | |||||||||||||
Sold: | ||||||||||||||||
Class A | 16,318,087 | $ | 436,667,191 | 13,888,230 | $ | 329,831,528 | ||||||||||
Class B | 16,631 | 437,415 | 9,827 | 231,250 | ||||||||||||
Class C | 1,257,745 | 33,502,620 | 929,006 | 22,009,870 | ||||||||||||
Class R | 885,725 | 23,720,468 | 871,827 | 20,756,781 | ||||||||||||
Class Y | 19,924,251 | 535,555,108 | 14,844,058 | 350,033,999 | ||||||||||||
Class R5 | 9,797,691 | 259,813,052 | 8,561,339 | 202,505,618 | ||||||||||||
Class R6 | 37,497,055 | 1,029,281,946 | 11,253,391 | 264,749,098 | ||||||||||||
Issued as reinvestment of dividends: | ||||||||||||||||
Class A | 10,237,423 | 272,829,657 | 14,929,358 | 347,452,762 | ||||||||||||
Class B | 77,139 | 2,036,416 | 160,484 | 3,704,088 | ||||||||||||
Class C | 649,193 | 17,135,616 | 950,040 | 21,853,303 | ||||||||||||
Class R | 306,760 | 8,186,680 | 472,027 | 10,989,746 | ||||||||||||
Class Y | 4,863,858 | 129,642,082 | 6,543,982 | 152,451,677 | ||||||||||||
Class R5 | 2,151,742 | 57,425,474 | 2,823,837 | 65,842,337 | ||||||||||||
Class R6 | 1,935,020 | 51,657,055 | 2,570,990 | 59,975,763 | ||||||||||||
Automatic conversion of Class B shares to Class A shares: | ||||||||||||||||
Class A | 576,870 | 15,437,455 | 594,113 | 14,111,242 | ||||||||||||
Class B | (581,933 | ) | (15,437,455 | ) | (599,113 | ) | (14,111,242 | ) | ||||||||
Reacquired: | ||||||||||||||||
Class A | (43,757,908 | ) | (1,168,746,863 | ) | (42,824,400 | ) | (1,014,803,439 | ) | ||||||||
Class B | (216,421 | ) | (5,686,472 | ) | (234,188 | ) | (5,507,123 | ) | ||||||||
Class C | (4,254,601 | ) | (112,739,694 | ) | (2,481,910 | ) | (58,220,781 | ) | ||||||||
Class R | (1,474,434 | ) | (39,419,074 | ) | (2,161,064 | ) | (51,016,822 | ) | ||||||||
Class Y | (56,428,516 | ) | (1,526,358,172 | ) | (21,869,196 | ) | (518,507,614 | ) | ||||||||
Class R5 | (13,248,623 | ) | (354,382,047 | ) | (9,959,665 | ) | (238,504,494 | ) | ||||||||
Class R6 | (6,821,621 | ) | (182,968,950 | ) | (15,047,543 | ) | (352,393,968 | ) | ||||||||
Net increase (decrease) in share activity | (20,288,867 | ) | $ | (532,410,492 | ) | (15,774,570 | ) | $ | (386,566,421 | ) | ||||||
| (a) | There are entities that are record owners of more than 5% of the outstanding shares of the Fund and in the aggregate own 30% of the outstanding shares of the Fund. IDI has an agreement with these entities to sell Fund shares. The Fund, Invesco and/or Invesco affiliates may make payments to these entities, which are considered to be related to the Fund, for providing services to the Fund, Invesco and/or Invesco affiliates including but not limited to services such as securities brokerage, distribution, third party record keeping and account servicing. The Fund has no knowledge as to whether all or any portion of the shares owned of record by these entities are also owned beneficially. |
21 Invesco Growth and Income Fund
NOTE 13—Financial Highlights
The following schedule presents financial highlights for a share of the Fund outstanding throughout the periods indicated.
| Net asset value, beginning of period | Net investment income(a) | Net gains (losses) on securities (both realized and unrealized) | Total from investment operations | Dividends from net investment income | Distributions from net realized gains | Total distributions | Net asset value, end of period | Total return(b) | Net assets, end of period (000’s omitted) | Ratio of expenses to average net assets with fee waivers and/or expenses absorbed | Ratio of expenses to average net assets without fee waivers and/or expenses absorbed | Ratio of net investment income to average net assets | Portfolio turnover(c) | |||||||||||||||||||||||||||||||||||||||||||
Class A |
| |||||||||||||||||||||||||||||||||||||||||||||||||||||||
Year ended 08/31/17 | $ | 25.12 | $ | 0.53 | (d) | $ | 3.64 | $ | 4.17 | $ | (0.42 | ) | $ | (1.45 | ) | $ | (1.87 | ) | $ | 27.42 | 16.90 | % | $ | 3,972,916 | 0.82 | %(e) | 0.82 | %(e) | 1.96 | %(d)(e) | 16 | % | ||||||||||||||||||||||||
Year ended 08/31/16 | 25.44 | 0.38 | 1.44 | 1.82 | (0.42 | ) | (1.72 | ) | (2.14 | ) | 25.12 | 7.93 | 4,058,588 | 0.83 | 0.83 | 1.59 | 18 | |||||||||||||||||||||||||||||||||||||||
Year ended 08/31/15 | 29.30 | 0.35 | (1.09 | ) | (0.74 | ) | (0.54 | ) | (2.58 | ) | (3.12 | ) | 25.44 | (2.61 | ) | 4,450,596 | 0.84 | 0.84 | 1.29 | 23 | ||||||||||||||||||||||||||||||||||||
Year ended 08/31/14 | 24.92 | 0.55 | (d) | 4.78 | 5.33 | (0.33 | ) | (0.62 | ) | (0.95 | ) | 29.30 | 21.84 | 5,302,375 | 0.83 | 0.84 | 2.03 | (d) | 31 | |||||||||||||||||||||||||||||||||||||
Year ended 08/31/13 | 20.48 | 0.31 | 4.47 | 4.78 | (0.34 | ) | — | (0.34 | ) | 24.92 | 23.57 | 4,766,860 | 0.81 | 0.82 | 1.37 | 29 | ||||||||||||||||||||||||||||||||||||||||
Class B |
| |||||||||||||||||||||||||||||||||||||||||||||||||||||||
Year ended 08/31/17 | 24.91 | 0.52 | (d) | 3.61 | 4.13 | (0.42 | ) | (1.45 | ) | (1.87 | ) | 27.17 | 16.86 | (f) | 17,678 | 0.82 | (e)(f) | 0.82 | (e)(f) | 1.96 | (d)(e)(f) | 16 | ||||||||||||||||||||||||||||||||||
Year ended 08/31/16 | 25.24 | 0.38 | 1.43 | 1.81 | (0.42 | ) | (1.72 | ) | (2.14 | ) | 24.91 | 7.94 | (f) | 33,762 | 0.83 | (f) | 0.83 | (f) | 1.59 | (f) | 18 | |||||||||||||||||||||||||||||||||||
Year ended 08/31/15 | 29.10 | 0.35 | (1.09 | ) | (0.74 | ) | (0.54 | ) | (2.58 | ) | (3.12 | ) | 25.24 | (2.65 | )(f) | 50,939 | 0.84 | (f) | 0.84 | (f) | 1.29 | (f) | 23 | |||||||||||||||||||||||||||||||||
Year ended 08/31/14 | 24.75 | 0.54 | (d) | 4.75 | 5.29 | (0.32 | ) | (0.62 | ) | (0.94 | ) | 29.10 | 21.86 | (f) | 82,970 | 0.83 | (f) | 0.84 | (f) | 2.03 | (d)(f) | 31 | ||||||||||||||||||||||||||||||||||
Year ended 08/31/13 | 20.34 | 0.31 | 4.44 | 4.75 | (0.34 | ) | — | (0.34 | ) | 24.75 | 23.57 | (f) | 101,723 | 0.81 | (f) | 0.82 | (f) | 1.37 | (f) | 29 | ||||||||||||||||||||||||||||||||||||
Class C |
| |||||||||||||||||||||||||||||||||||||||||||||||||||||||
Year ended 08/31/17 | 24.84 | 0.32 | (d) | 3.60 | 3.92 | (0.22 | ) | (1.45 | ) | (1.67 | ) | 27.09 | 16.00 | 253,253 | 1.57 | (e) | 1.57 | (e) | 1.21 | (d)(e) | 16 | |||||||||||||||||||||||||||||||||||
Year ended 08/31/16 | 25.17 | 0.20 | 1.43 | 1.63 | (0.24 | ) | (1.72 | ) | (1.96 | ) | 24.84 | 7.14 | (g) | 290,579 | 1.55 | (g) | 1.55 | (g) | 0.87 | (g) | 18 | |||||||||||||||||||||||||||||||||||
Year ended 08/31/15 | 29.01 | 0.15 | (1.08 | ) | (0.93 | ) | (0.33 | ) | (2.58 | ) | (2.91 | ) | 25.17 | (3.33 | ) | 309,526 | 1.59 | 1.59 | 0.54 | 23 | ||||||||||||||||||||||||||||||||||||
Year ended 08/31/14 | 24.68 | 0.34 | (d) | 4.73 | 5.07 | (0.12 | ) | (0.62 | ) | (0.74 | ) | 29.01 | 20.94 | 334,902 | 1.58 | 1.59 | 1.28 | (d) | 31 | |||||||||||||||||||||||||||||||||||||
Year ended 08/31/13 | 20.29 | 0.14 | 4.42 | 4.56 | (0.17 | ) | — | (0.17 | ) | 24.68 | 22.63 | 289,458 | 1.56 | 1.57 | 0.62 | 29 | ||||||||||||||||||||||||||||||||||||||||
Class R |
| |||||||||||||||||||||||||||||||||||||||||||||||||||||||
Year ended 08/31/17 | 25.14 | 0.46 | (d) | 3.64 | 4.10 | (0.36 | ) | (1.45 | ) | (1.81 | ) | 27.43 | 16.55 | 119,766 | 1.07 | (e) | 1.07 | (e) | 1.71 | (d)(e) | 16 | |||||||||||||||||||||||||||||||||||
Year ended 08/31/16 | 25.45 | 0.32 | 1.45 | 1.77 | (0.36 | ) | (1.72 | ) | (2.08 | ) | 25.14 | 7.69 | 116,837 | 1.08 | 1.08 | 1.34 | 18 | |||||||||||||||||||||||||||||||||||||||
Year ended 08/31/15 | 29.31 | 0.29 | (1.10 | ) | (0.81 | ) | (0.47 | ) | (2.58 | ) | (3.05 | ) | 25.45 | (2.86 | ) | 139,084 | 1.09 | 1.09 | 1.04 | 23 | ||||||||||||||||||||||||||||||||||||
Year ended 08/31/14 | 24.93 | 0.48 | (d) | 4.78 | 5.26 | (0.26 | ) | (0.62 | ) | (0.88 | ) | 29.31 | 21.53 | 181,301 | 1.08 | 1.09 | 1.78 | (d) | 31 | |||||||||||||||||||||||||||||||||||||
Year ended 08/31/13 | 20.49 | 0.25 | 4.47 | 4.72 | (0.28 | ) | — | (0.28 | ) | 24.93 | 23.26 | 170,691 | 1.06 | 1.07 | 1.12 | 29 | ||||||||||||||||||||||||||||||||||||||||
Class Y |
| |||||||||||||||||||||||||||||||||||||||||||||||||||||||
Year ended 08/31/17 | 25.15 | 0.59 | (d) | 3.64 | 4.23 | (0.49 | ) | (1.45 | ) | (1.94 | ) | 27.44 | 17.13 | 1,152,199 | 0.57 | (e) | 0.57 | (e) | 2.21 | (d)(e) | 16 | |||||||||||||||||||||||||||||||||||
Year ended 08/31/16 | 25.46 | 0.44 | 1.46 | 1.90 | (0.49 | ) | (1.72 | ) | (2.21 | ) | 25.15 | 8.24 | 1,851,513 | 0.58 | 0.58 | 1.84 | 18 | |||||||||||||||||||||||||||||||||||||||
Year ended 08/31/15 | 29.33 | 0.42 | (1.10 | ) | (0.68 | ) | (0.61 | ) | (2.58 | ) | (3.19 | ) | 25.46 | (2.39 | ) | 1,886,928 | 0.59 | 0.59 | 1.54 | 23 | ||||||||||||||||||||||||||||||||||||
Year ended 08/31/14 | 24.94 | 0.62 | (d) | 4.78 | 5.40 | (0.39 | ) | (0.62 | ) | (1.01 | ) | 29.33 | 22.17 | 2,186,472 | 0.58 | 0.59 | 2.28 | (d) | 31 | |||||||||||||||||||||||||||||||||||||
Year ended 08/31/13 | 20.50 | 0.37 | 4.47 | 4.84 | (0.40 | ) | — | (0.40 | ) | 24.94 | 23.86 | 1,826,646 | 0.56 | 0.57 | 1.62 | 29 | ||||||||||||||||||||||||||||||||||||||||
Class R5 |
| |||||||||||||||||||||||||||||||||||||||||||||||||||||||
Year ended 08/31/17 | 25.17 | 0.61 | (d) | 3.65 | 4.26 | (0.51 | ) | (1.45 | ) | (1.96 | ) | 27.47 | 17.26 | 799,681 | 0.49 | (e) | 0.49 | (e) | 2.29 | (d)(e) | 16 | |||||||||||||||||||||||||||||||||||
Year ended 08/31/16 | 25.49 | 0.46 | 1.45 | 1.91 | (0.51 | ) | (1.72 | ) | (2.23 | ) | 25.17 | 8.31 | 765,516 | 0.48 | 0.48 | 1.94 | 18 | |||||||||||||||||||||||||||||||||||||||
Year ended 08/31/15 | 29.36 | 0.45 | (1.10 | ) | (0.65 | ) | (0.64 | ) | (2.58 | ) | (3.22 | ) | 25.49 | (2.29 | ) | 738,797 | 0.48 | 0.48 | 1.65 | 23 | ||||||||||||||||||||||||||||||||||||
Year ended 08/31/14 | 24.97 | 0.65 | (d) | 4.78 | 5.43 | (0.42 | ) | (0.62 | ) | (1.04 | ) | 29.36 | 22.27 | 880,275 | 0.47 | 0.48 | 2.39 | (d) | 31 | |||||||||||||||||||||||||||||||||||||
Year ended 08/31/13 | 20.53 | 0.39 | 4.47 | 4.86 | (0.42 | ) | — | (0.42 | ) | 24.97 | 23.96 | 718,816 | 0.47 | 0.48 | 1.71 | 29 | ||||||||||||||||||||||||||||||||||||||||
Class R6 |
| |||||||||||||||||||||||||||||||||||||||||||||||||||||||
Year ended 08/31/17 | 25.18 | 0.64 | (d) | 3.65 | 4.29 | (0.54 | ) | (1.45 | ) | (1.99 | ) | 27.48 | 17.36 | 1,638,500 | 0.39 | (e) | 0.39 | (e) | 2.39 | (d)(e) | 16 | |||||||||||||||||||||||||||||||||||
Year ended 08/31/16 | 25.49 | 0.49 | 1.46 | 1.95 | (0.54 | ) | (1.72 | ) | (2.26 | ) | 25.18 | 8.46 | 680,404 | 0.38 | 0.38 | 2.04 | 18 | |||||||||||||||||||||||||||||||||||||||
Year ended 08/31/15 | 29.36 | 0.48 | (1.10 | ) | (0.62 | ) | (0.67 | ) | (2.58 | ) | (3.25 | ) | 25.49 | (2.19 | ) | 720,155 | 0.38 | 0.38 | 1.75 | 23 | ||||||||||||||||||||||||||||||||||||
Year ended 08/31/14 | 24.97 | 0.68 | (d) | 4.78 | 5.46 | (0.45 | ) | (0.62 | ) | (1.07 | ) | 29.36 | 22.38 | 647,350 | 0.38 | 0.39 | 2.48 | (d) | 31 | |||||||||||||||||||||||||||||||||||||
Year ended 08/31/13(h) | 21.23 | 0.43 | 3.66 | 4.09 | (0.35 | ) | — | (0.35 | ) | 24.97 | 19.45 | 335,549 | 0.38 | (i) | 0.38 | (i) | 1.80 | (i) | 29 | |||||||||||||||||||||||||||||||||||||
| (a) | Calculated using average shares outstanding. |
| (b) | Includes adjustments in accordance with accounting principles generally accepted in the United States of America and as such, the net asset value for financial reporting purposes and the returns based upon those net asset values may differ from the net asset value and returns for shareholder transactions. Does not include sales charges and is not annualized for periods less than one year, if applicable. |
| (c) | Portfolio turnover is calculated at the fund level and is not annualized for periods less than one year, if applicable. |
| (d) | Net investment income per share and the ratio of net investment income to average net assets includes significant dividends received during the year ended August 31, 2017. Net investment income per share and the ratio of net investment income to average net assets excluding the significant dividends are $0.40 and 1.47%, $0.39 and 1.47%, $0.19 and 0.72%, $0.33 and 1.22%, $0.46 and 1.72%, $0.48 and 1.80% and $0.51 and 1.90% for Class A, Class B, Class C, Class R, Class Y, Class R5 and Class R6 shares, respectively. |
| Net investment income per share and the ratio of net investment income to average net assets includes significant dividends received during the year ended August 31, 2014. Net investment income per share and the ratio of net investment income to average net assets excluding the significant dividends are $0.34 and 1.24%, $0.33 and 1.24%, $0.13 and 0.49%, $0.27 and 0.99%, $0.41 and 1.49%, $0.44 and 1.60% and $0.47 and 1.69% for Class A, Class B, Class C, Class R, Class Y, Class R5 and Class R6 shares, respectively. |
| (e) | Ratios are based on average daily net assets (000’s omitted) of $4,118,135, $27,026, $285,898, $122,186, $1,793,507, $815,620 and $867,169 for Class A, Class B, Class C, Class R, Class Y, Class R5 and Class R6 shares, respectively. |
| (f) | The total return, ratio of expenses to average net assets and ratio of net investment income to average net assets reflect actual 12b-1 fees of 0.25% for the years ended August 31, 2017, 2016, 2015, 2014 and 2013, respectively. |
| (g) | The total return, ratio of expenses to average net assets and ratio of net investment income to average net assets reflect actual 12b-1 fees of 0.98% for the year ended August 31, 2016, respectively. |
| (h) | Commencement date of September 24, 2012. |
| (i) | Annualized. |
22 Invesco Growth and Income Fund
Report of Independent Registered Public Accounting Firm
To the Board of Trustees of AIM Counselor Series Trust (Invesco Counselor Series Trust)
and Shareholders of Invesco Growth and Income Fund:
In our opinion, the accompanying statement of assets and liabilities, including the schedule of investments, and the related statements of operations and of changes in net assets and the financial highlights present fairly, in all material respects, the financial position of Invesco Growth and Income Fund (one of the funds constituting AIM Counselor Series Trust (Invesco Counselor Series Trust), hereafter referred to as the “Fund”) as of August 31, 2017, the results of its operations for the year then ended, the changes in its net assets for each of the two years in the period then ended and the financial highlights for each of the periods indicated therein, in conformity with accounting principles generally accepted in the United States of America. These financial statements and financial highlights (hereafter referred to as “financial statements”) are the responsibility of the Fund’s management. Our responsibility is to express an opinion on these financial statements based on our audits. We conducted our audits of these financial statements in accordance with the standards of the Public Company Accounting Oversight Board (United States). Those standards require that we plan and perform the audit to obtain reasonable assurance about whether the financial statements are free of material misstatement. An audit includes examining, on a test basis, evidence supporting the amounts and disclosures in the financial statements, assessing the accounting principles used and significant estimates made by management, and evaluating the overall financial statement presentation. We believe that our audits, which included confirmation of securities as of August 31, 2017 by correspondence with the custodian, transfer agent and brokers, and when replies were not received from brokers, we performed other auditing procedures, provide a reasonable basis for our opinion.
PricewaterhouseCoopers LLP
Houston, Texas
October 30, 2017
23 Invesco Growth and Income Fund
Calculating your ongoing Fund expenses
Example
As a shareholder of the Fund, you incur two types of costs: (1) transaction costs, which may include sales charges (loads) on purchase payments or contingent deferred sales charges on redemptions, if any; and (2) ongoing costs, including management fees, distribution and/or service (12b-1) fees, and other Fund expenses. This example is intended to help you understand your ongoing costs (in dollars) of investing in the Fund and to compare these costs with ongoing costs of investing in other mutual funds. The example is based on an investment of $1,000 invested at the beginning of the period and held for the entire period March 1, 2017 through August 31, 2017.
Actual expenses
The table below provides information about actual account values and actual expenses. You may use the information in this table, together with the amount you invested, to estimate the expenses that you paid over the period. Simply divide your account value by $1,000 (for example, an $8,600 account value divided by $1,000 = 8.6), then multiply the result by the number in the table under the heading entitled “Actual Expenses Paid During Period” to estimate the expenses you paid on your account during this period.
Hypothetical example for comparison purposes
The table below also provides information about hypothetical account values and hypothetical expenses based on the Fund’s actual expense ratio and an assumed rate of return of 5% per year before expenses, which is not the Fund’s actual return.
The hypothetical account values and expenses may not be used to estimate the actual ending account balance or expenses you paid for the period. You may use this information to compare the ongoing costs of investing in the Fund and other funds. To do so, compare this 5% hypothetical example with the 5% hypothetical examples that appear in the shareholder reports of the other funds.
Please note that the expenses shown in the table are meant to highlight your ongoing costs only and do not reflect any transaction costs, such as sales charges (loads) on purchase payments or contingent deferred sales charges on redemptions, if any. Therefore, the hypothetical information is useful in comparing ongoing costs only, and will not help you determine the relative total costs of owning different funds. In addition, if these transaction costs were included, your costs would have been higher.
| Class | Beginning Account Value (03/01/17) | ACTUAL | HYPOTHETICAL (5% annual return before | Annualized Expense Ratio | ||||||||||||||||||||
| Ending Account Value (08/31/17)1 | Expenses Paid During Period2 | Ending Account Value (08/31/17) | Expenses Paid During Period2 | |||||||||||||||||||||
| A | $ | 1,000.00 | $ | 1,011.00 | $ | 4.11 | $ | 1,021.12 | $ | 4.13 | 0.81 | % | ||||||||||||
| B | 1,000.00 | 1,010.70 | 4.11 | 1,021.12 | 4.13 | 0.81 | ||||||||||||||||||
| C | 1,000.00 | 1,007.00 | 7.89 | 1,017.34 | 7.93 | 1.56 | ||||||||||||||||||
| R | 1,000.00 | 1,009.40 | 5.37 | 1,019.86 | 5.40 | 1.06 | ||||||||||||||||||
| Y | 1,000.00 | 1,011.90 | 2.84 | 1,022.38 | 2.85 | 0.56 | ||||||||||||||||||
| R5 | 1,000.00 | 1,012.30 | 2.54 | 1,022.68 | 2.55 | 0.50 | ||||||||||||||||||
| R6 | 1,000.00 | 1,013.10 | 2.03 | 1,023.19 | 2.04 | 0.40 | ||||||||||||||||||
| 1 | The actual ending account value is based on the actual total return of the Fund for the period March 1, 2017 through August 31, 2017, after actual expenses and will differ from the hypothetical ending account value which is based on the Fund’s expense ratio and a hypothetical annual return of 5% before expenses. |
| 2 | Expenses are equal to the Fund’s annualized expense ratio as indicated above multiplied by the average account value over the period, multiplied by 184/365 to reflect the most recent fiscal half year. |
24 Invesco Growth and Income Fund
Approval of Investment Advisory and Sub-Advisory Contracts
The Board of Trustees (the Board) of AIM Counselor Series Trust (Invesco Counselor Series Trust) is required under the Investment Company Act of 1940, as amended, to approve annually the renewal of Invesco Growth and Income Fund’s (the Fund) investment advisory agreements. During contract renewal meetings held on June 12-13, 2017, the Board as a whole, and the disinterested or “independent” Trustees, who comprise over 75% of the Board, voting separately, approved the continuance for the Fund of the Master Investment Advisory Agreement with Invesco Advisers, Inc. (Invesco Advisers and the investment advisory agreement) and the Master Intergroup Sub-Advisory Contract for Mutual Funds with Invesco Asset Management Deutschland GmbH, Invesco Asset Management Limited, Invesco Asset Management (Japan) Limited, Invesco Hong Kong Limited, Invesco Senior Secured Management, Inc. and Invesco Canada Ltd. (collectively, the Affiliated Sub-Advisers and the sub-advisory contracts) for another year, effective July 1, 2017.
In evaluating the fairness and reasonableness of compensation under the Fund’s investment advisory agreement and sub-advisory contracts, the Board considered, among other things, the factors discussed below. The Board determined that continuation of the Fund’s investment advisory agreement and the sub-advisory contracts is in the best interest of the Fund and its shareholders and that the compensation payable to Invesco Advisers and the Affiliated Sub-Advisers under the agreements is fair and reasonable.
The Board’s Fund Evaluation Process
The Board’s Investments Committee has established three Sub-Committees, which meet throughout the year to review the performance of funds advised by Invesco Advisers (the Invesco Funds). Over the course of each year, the Sub-Committees meet with portfolio managers for their assigned Invesco Funds and other members of management to review the performance, investment objective(s), policies, strategies, limitations and investment risks of these funds. The Board had the benefit of reports from the Sub-Committees and Investments Committee throughout the year in considering approval of the continuance of each Invesco Fund’s investment advisory agreement and sub-advisory contracts for another year.
During the contract renewal process, the Board receives comparative performance and fee data regarding the Invesco Funds prepared by Invesco Advisers and Broadridge Financial Solutions, Inc. (Broadridge), an independent provider of investment company data. The Board also receives an independent written evaluation from the Senior Officer, an officer of the Invesco Funds who reports directly to the independent Trustees. The Senior Officer’s
evaluation is prepared as part of his responsibility to manage the process by which the Invesco Funds’ proposed management fees are negotiated during the annual contract renewal process to ensure they are negotiated in a manner that is at arms’ length and reasonable. In addition to meetings with Invesco Advisers and fund counsel, the independent Trustees also discuss the continuance of the investment advisory agreement and sub-advisory contracts in separate sessions with the Senior Officer and with independent legal counsel.
The Trustees recognized that the advisory fee rates for the Invesco Funds are, in most cases, the result of years of review and negotiation. The Trustees’ deliberations and conclusions in a particular year may be based in part on their deliberations and conclusions regarding these arrangements throughout the year and in prior years. The Trustees’ review and conclusions are based on the comprehensive consideration of all information presented to them and are not the result of any single determinative factor. Moreover, one Trustee may have weighed a particular piece of information or factor differently than another Trustee.
The discussion below is a summary of the Senior Officer’s independent written evaluation with respect to the Fund’s investment advisory agreement as well as a discussion of the material factors and related conclusions that formed the basis for the Board’s approval of the Fund’s investment advisory agreement and sub-advisory contracts. This information is current as of June 13, 2017 and does not reflect consideration of factors that became known to the Board after that date.
Factors and Conclusions and Summary of Independent Written Fee Evaluation
| A. | Nature, Extent and Quality of Services Provided by Invesco Advisers and the Affiliated Sub-Advisers |
The Board reviewed the advisory services provided to the Fund by Invesco Advisers under the Fund’s investment advisory agreement, the performance of Invesco Advisers in providing these services, and the credentials and experience of the officers and employees of Invesco Advisers who provide these services, including the Fund’s portfolio manager or managers. The Board’s review included consideration of Invesco Advisers’ investment process oversight, credit analysis and investment risk management. The Board also considered non-advisory services that Invesco Advisers and its affiliates provide to the Invesco Funds such as various back office support functions, trading operations, internal audit, valuation and legal and compliance.
In determining whether to continue the Fund’s investment advisory agreement, the Board considered the benefits of reapproving an
existing relationship as contrasted with the greater uncertainty that may be associated with entering into a new relationship. The Board concluded that the nature, extent and quality of the services provided to the Fund by Invesco Advisers are appropriate and satisfactory.
The Board reviewed the services that may be provided by the Affiliated Sub-Advisers under the sub-advisory contracts and the credentials and experience of the officers and employees of the Affiliated Sub-Advisers who provide these services. The Board noted that the Affiliated Sub-Advisers have offices and personnel that are located in financial centers around the world. As a result, the Board noted that the Affiliated Sub-Advisers can provide research and investment analysis on the markets and economies of various countries in which the Fund may invest, make recommendations regarding securities and assist with security trades. The Board concluded that the sub-advisory contracts may benefit the Fund and its shareholders by permitting Invesco Advisers to use the resources and talents of the Affiliated Sub-Advisers in managing the Fund. The Board concluded that the nature, extent and quality of the services that may be provided by the Affiliated Sub-Advisers are appropriate and satisfactory.
| B. | Fund Investment Performance |
The Board considered Fund investment performance as a relevant factor in considering whether to approve the investment advisory agreement. The Board did not view Fund performance as a relevant factor in considering whether to approve the sub-advisory contracts for the Fund, as no Affiliated Sub-Adviser currently manages assets of the Fund.
The Board compared the Fund’s investment performance over multiple time periods ending December 31, 2016 to the performance of funds in the Broadridge performance universe and against the Lipper Large-Cap Value Funds Index. The Board noted that performance of Class A shares of the Fund was in the first quintile of its performance universe for the one and three year periods and the second quintile for the five year period (the first quintile being the best performing funds and the fifth quintile being the worst performing funds). The Board noted that performance of Class A shares of the Fund was above the performance of the Index for the one, three and five year periods. The Trustees also reviewed more recent Fund performance and this review did not change their conclusions.
| C. | Advisory and Sub-Advisory Fees |
The Board compared the Fund’s contractual management fee rate to the contractual management fee rates of funds in the Fund’s Broadridge expense group at a common asset level. The Board noted that the contractual management fee rate for Class A shares of the Fund was below the median contractual
25 Invesco Growth and Income Fund
management fee rate of funds in its expense group. The Board noted that the term “contractual management fee” for funds in the expense group may include both advisory and certain administrative services fees, but that Broadridge does not provide information on a fund by fund basis as to what is included. The Board noted that Invesco Advisers does not separately charge the Invesco Funds for the administrative services included in the term as defined by Broadridge. The Board also reviewed the methodology used by Broadridge in providing expense group information, which includes using each fund’s contractual management fee schedule (including any applicable breakpoints) as reported in the most recent prospectus or statement of additional information for each fund in the expense group.
The Board also compared the Fund’s effective advisory fee rate (the advisory fee rate after advisory fee waivers and before other expense limitations/waivers) to the effective advisory fee rates of other mutual funds advised by Invesco Advisers and its affiliates with investment strategies comparable to those of the Fund, based on asset balances as of December 31, 2016. The Board noted that the Fund’s rate was below the rate of one mutual fund. The Board also noted how the Fund’s rate compared to the effective sub-adviser fee rate of one fund sub-advised by Invesco Advisers.
The Board also considered the fees charged by Invesco Advisers and the Affiliated Sub-Advisers to other client accounts with investment strategies comparable to those of the Fund. The Board noted that Invesco Advisers or the Affiliated Sub-Advisers may charge lower fees to large institutional clients. Invesco Advisers reviewed with the Board the significantly greater scope of services it provides to the Invesco Funds relative to certain other types of client accounts. These additional services include provision of administrative services, officers and office space, oversight of service providers, preparation of annual registration statement updates and financial information and regulatory compliance under the Investment Company Act of 1940, as amended.
Invesco Advisers also reviewed generally the higher frequency of shareholder purchases and redemptions in the Invesco Funds relative to the flow of assets for other client accounts. Invesco Advisers advised the Board that advance notice of redemptions is often provided to Invesco Advisers by institutional clients. The Board did note that sub-advisory fee rates charged by the Affiliated Sub-Advisers to manage the Invesco Funds and to manage other client accounts tended to be more comparable, reflecting a similar scope of services.
The Board also considered the services that may be provided by the Affiliated Sub-Advisers pursuant to the sub-advisory contracts, as well as the fees payable by Invesco Advisers to the Affiliated Sub-Advisers pursuant to the sub-advisory contracts. The Board also noted
that the sub-advisory fees are not paid directly by the Fund, but rather, are payable by Invesco Advisers to the Affiliated Sub-Advisers.
| D. | Economies of Scale and Breakpoints |
The Board considered the extent to which there are economies of scale in the provision of advisory services to the Fund. The Board also considered that the Fund benefits from economies of scale through contractual breakpoints in the Fund’s advisory fee schedule. The Board noted that the Fund shares directly in economies of scale through lower fees charged by third party service providers based on the combined size of the Invesco Funds advised by Invesco Advisers.
| E. | Profitability and Financial Resources |
The Board reviewed information from Invesco Advisers concerning the costs of the advisory and other services that Invesco Advisers and its affiliates provide to the Fund and the Invesco Funds and the profitability of Invesco Advisers and its affiliates in providing these services. The Board noted that Invesco Advisers continues to operate at a net profit from services Invesco Advisers and its affiliates provide to the Invesco Funds and the Fund. The Board did not deem the level of profits realized by Invesco Advisers and its affiliates from providing services to the Fund to be excessive given the nature, quality and extent of the services provided. The Board received and accepted information from Invesco Advisers demonstrating that Invesco Advisers and each Affiliated Sub-Adviser are financially sound and have the resources necessary to perform their obligations under the investment advisory agreement and sub-advisory contracts.
| F. | Collateral Benefits to Invesco Advisers and its Affiliates |
The Board considered various other benefits received by Invesco Advisers and its affiliates from the relationship with the Fund, including the fees received for providing transfer agency and distribution services to the Fund. The Board considered comparative information regarding fees charged for these services, including information provided by Broadridge and other independent sources. The Board considered the performance of Invesco Advisers and its affiliates in providing these services and the organizational structure employed to provide these services. The Board also considered that these services are provided to the Fund pursuant to written contracts that are reviewed and approved on an annual basis by the Board; and that the services are required for the operation of the Fund.
The Board considered the benefits realized by Invesco Advisers and the Affiliated Sub-Advisers as a result of portfolio brokerage transactions executed through “soft dollar” arrangements. The Board noted that soft dollar arrangements may result in the Fund bearing costs to purchase research that may be used by Invesco Advisers or the Affiliated Sub-Advisers with other clients and may reduce Invesco Advisers’ or the Affiliated Sub-Advisers’ expenses. The Board also considered that it receives periodic
reports from the Chief Compliance Officer of the Invesco Funds demonstrating that these arrangements are consistent with regulatory requirements. The Board did not deem the soft dollar arrangements to be inappropriate.
The Board considered that the Fund’s uninvested cash and cash collateral from any securities lending arrangements may be invested in money market funds advised by Invesco Advisers pursuant to procedures approved by the Board. The Board noted that Invesco Advisers receives advisory fees from these affiliated money market funds attributable to such investments, although Invesco Advisers has contractually agreed to waive through varying periods the advisory fees payable by the Invesco Funds with respect to certain investments in the affiliated money market funds. The waiver is in an amount equal to 100% of the net advisory fee Invesco Advisers receives from the affiliated money market funds with respect to the Fund’s investment in the affiliated money market funds of uninvested cash, but not cash collateral. The Board concluded that the amount of advisory fees received by Invesco Advisers from the Fund’s investment of cash collateral from any securities lending arrangements in the affiliated money market funds is fair and reasonable.
The Board also considered that the Fund may use an affiliated broker to execute certain trades for the Fund to, among other things, control information leakage, and was advised that such trades would be executed in compliance with rules under the federal securities laws and consistent with best execution obligations.
26 Invesco Growth and Income Fund
Tax Information
Form 1099-DIV, Form 1042-S and other year-end tax information provide shareholders with actual calendar year amounts that should be included in their tax returns. Shareholders should consult their tax advisors.
The following distribution information is being provided as required by the Internal Revenue Code or to meet a specific state’s requirement.
The Fund designates the following amounts or, if subsequently determined to be different, the maximum amount allowable for its fiscal year ended August 31, 2017:
Federal and State Income Tax | ||||
Long-Term Capital Gain Distributions | $ | 419,463,337 | ||
Qualified Dividend Income* | 100.00 | % | ||
Corporate Dividends Received Deduction* | 100.00 | % | ||
U.S. Treasury Obligations* | 0.00 | % | ||
| * | The above percentages are based on ordinary income dividends paid to shareholders during the Fund’s fiscal year. |
Non-Resident Alien Shareholders | |||||
Qualified Short-Term Gains | $ | 8,327,256 | |||
27 Invesco Growth and Income Fund
Proxy Results
A Special Joint Meeting (“Meeting”) of Shareholders of Invesco Growth and Income Fund, an investment portfolio of AIM Counselor Series Trust (Invesco Counselor Series Trust), a Delaware statutory trust (“Trust”), was held on March 9, 2017. The Meeting was held for the following purposes:
| (1) | Elect 15 trustees to the Board, each of whom will serve until his or her successor is elected and qualified. |
| (2) | Approve an amendment to the Trust’s Agreement and Declaration of Trust that would permit fund mergers and other significant transactions upon the Board’s approval but without shareholder approval of such transactions. |
The results of the voting on the above matters were as follows:
| Matters | Votes For | Votes Withheld | ||||||||||||||||
| (1)* | David C. Arch | 1,425,647,604 | 36,521,875 | |||||||||||||||
| James T. Bunch | 1,425,181,099 | 36,988,380 | ||||||||||||||||
| Bruce L. Crockett | 1,425,174,694 | 36,994,785 | ||||||||||||||||
| Jack M. Fields | 1,426,060,874 | 36,108,605 | ||||||||||||||||
| Martin L. Flanagan | 1,426,481,477 | 35,688,002 | ||||||||||||||||
| Cynthia Hostetler | 1,426,489,972 | 35,679,505 | ||||||||||||||||
| Dr. Eli Jones | 1,426,255,832 | 35,913,647 | ||||||||||||||||
| Dr. Prema Mathai-Davis | 1,425,363,789 | 36,805,689 | ||||||||||||||||
| Teresa M. Ressel | 1,426,514,880 | 35,654,598 | ||||||||||||||||
| Dr. Larry Soll | 1,424,932,245 | 37,237,234 | ||||||||||||||||
| Ann Barnett Stern | 1,426,260,049 | 35,909,429 | ||||||||||||||||
| Raymond Stickel, Jr. | 1,425,391,657 | 36,777,822 | ||||||||||||||||
| Philip A. Taylor | 1,426,285,212 | 35,884,267 | ||||||||||||||||
| Robert C. Troccoli | 1,426,075,097 | 36,094,382 | ||||||||||||||||
| Christopher L. Wilson | 1,426,594,956 | 35,574,523 | ||||||||||||||||
| Votes For | Votes Against | Votes Abstain | Broker Non-Votes | |||||||||||||||
| (2)* | Approve an amendment to the Trust’s Agreement and Declaration of Trust that would permit fund mergers and other significant transactions upon the Board’s approval but without shareholder approval of such transactions | 751,302,707 | 79,810,344 | 41,561,890 | 589,495,482 | |||||||||||||
The Meeting was adjourned until April 11, 2017, with respect to the following proposals:
| (3) | Approve changing the fundamental investment restriction regarding the purchase or sale of physical commodities. |
| 4(a) | Approve an amendment to the current Master Intergroup Sub-Advisory Contract to add Invesco PowerShares Capital Management LLC. |
| 4(b) | Approve an amendment to the current Master Intergroup Sub-Advisory Contract to add Invesco Asset Management (India) Private Limited. |
Invesco Growth and Income Fund did not receive sufficient shareholder votes to pass Proposals 3 and 4(a) - (b).
The results of the voting on the above matters were as follows:
| Matters | Votes For | Votes Against | Votes Abstain | Broker Non-Votes | ||||||||||||||
| (3) | Approve changing the fundamental investment restriction regarding the purchase or sale of physical commodities | 95,348,654 | 9,795,692 | 5,397,348 | 28,568,617 | |||||||||||||
| 4(a) | Approve an amendment to the current Master Intergroup Sub-Advisory Contract to add Invesco PowerShares Capital Management LLC | 98,439,191 | 6,989,399 | 5,115,540 | 28,566,181 | |||||||||||||
| 4(b) | Approve an amendment to the current Master Intergroup Sub-Advisory Contract to add Invesco Asset Management (India) Private Limited | 97,057,534 | 8,135,161 | 5,351,406 | 28,566,210 | |||||||||||||
| * | Each of proposal 1 and 2 required approval by a combined vote of all of the portfolios of AIM Counselor Series Trust (Invesco Counselor Series Trust). |
28 Invesco Growth and Income Fund
Trustees and Officers
The address of each trustee and officer is AIM Counselor Series Trust (Invesco Counselor Series Trust) (the “Trust”), 11 Greenway Plaza, Suite 1000, Houston, Texas 77046-1173. The trustees serve for the life of the Trust, subject to their earlier death, incapacitation, resignation, retirement or removal as more specifically provided in the Trust’s organizational documents. Each officer serves for a one year term or until their successors are elected and qualified. Column two below includes length of time served with predecessor entities, if any.
| Name, Year of Birth and Position(s) Held with the Trust | Trustee and/ or Officer Since | Principal Occupation(s) During Past 5 Years | Number of Overseen by | Other Directorship(s) Held by Trustee During Past 5 Years | ||||
| Interested Persons | ||||||||
| Martin L. Flanagan1 — 1960 Trustee | 2007 | Executive Director, Chief Executive Officer and President, Invesco Ltd. (ultimate parent of Invesco and a global investment management firm); Trustee, The Invesco Funds; Vice Chair, Investment Company Institute; and Member of Executive Board, SMU Cox School of Business
Formerly: Advisor to the Board, Invesco Advisers, Inc. (formerly known as Invesco Institutional (N.A.), Inc.); Chairman and Chief Executive Officer, Invesco Advisers, Inc. (registered investment adviser); Director, Chairman, Chief Executive Officer and President, Invesco Holding Company (US), Inc. (formerly IVZ Inc.) (holding company), Invesco Group Services, Inc. (service provider) and Invesco North American Holdings, Inc. (holding company); Director, Chief Executive Officer and President, Invesco Holding Company Limited (parent of Invesco and a global investment management firm); Director, Invesco Ltd.; Chairman, Investment Company Institute and President, Co-Chief Executive Officer, Co-President, Chief Operating Officer and Chief Financial Officer, Franklin Resources, Inc. (global investment management organization) | 144 | None | ||||
Philip A. Taylor2 — 1954 Trustee and Senior Vice President | 2006 | Head of the Americas and Senior Managing Director, Invesco Ltd.; Director, Invesco Advisers, Inc. (formerly known as Invesco Institutional (N.A.), Inc.) (registered investment adviser); Director, Chairman, Chief Executive Officer and President, Invesco Management Group, Inc. (formerly known as Invesco Aim Management Group, Inc.) (financial services holding company); Director and Chairman, Invesco Investment Services, Inc. (formerly known as Invesco Aim Investment Services, Inc.) (registered transfer agent); Chief Executive Officer, Invesco Corporate Class Inc. (corporate mutual fund company); Director, Chairman and Chief Executive Officer, Invesco Canada Ltd. (formerly known as Invesco Trimark Ltd./Invesco Trimark Ltèe) (registered investment adviser and registered transfer agent); Trustee and Senior Vice President, The Invesco Funds; Director, Invesco Investment Advisers LLC (formerly known as Van Kampen Asset Management).
Formerly: Co-Chairman, Co-President and Co-Chief Executive Officer, Invesco Advisers, Inc. (formerly known as Invesco Institutional (N.A.), Inc.) (registered investment adviser); Director, Chief Executive Officer and President, Van Kampen Exchange Corp; President and Principal Executive Officer, The Invesco Funds (other than AIM Treasurer’s Series Trust (Invesco Treasurer’s Series Trust), Short-Term Investments Trust and Invesco Management Trust); Executive Vice President, The Invesco Funds (AIM Treasurer’s Series Trust (Invesco Treasurer’s Series Trust), Short-Term Investments Trust and Invesco Management Trust only); Director and President, INVESCO Funds Group, Inc. (registered investment adviser and registered transfer agent); Director and Chairman, IVZ Distributors, Inc. (formerly known as INVESCO Distributors, Inc.) (registered broker dealer); Director, President and Chairman, Invesco Inc. (holding company), Invesco Canada Holdings Inc. (holding company), Trimark Investments Ltd./Placements Trimark Ltèe and Invesco Financial Services Ltd/Services Financiers Invesco Ltèe; Chief Executive Officer, Invesco Canada Fund Inc. (corporate mutual fund company); Director and Chairman, Van Kampen Investor Services Inc.; Director, Chief Executive Officer and President, 1371 Preferred Inc. (holding company) and Van Kampen Investments Inc.; Director and President, AIM GP Canada Inc. (general partner for limited partnerships) and Van Kampen Advisors, Inc.; Director and Chief Executive Officer, Invesco Trimark Dealer Inc. (registered broker dealer); Director, Invesco Distributors, Inc. (formerly known as Invesco Aim Distributors, Inc.) (registered broker dealer); Manager, Invesco PowerShares Capital Management LLC; Director, Chief Executive Officer and President, Invesco Advisers, Inc.; Director, Chairman, Chief Executive Officer and President, Invesco Aim Capital Management, Inc.; President, Invesco Trimark Dealer Inc. and Invesco Trimark Ltd./Invesco Trimark Ltèe; Director and President, AIM Trimark Corporate Class Inc. and AIM Trimark Canada Fund Inc.; Senior Managing Director, Invesco Holding Company Limited; Director and Chairman, Fund Management Company (former registered broker dealer); President and Principal Executive Officer, The Invesco Funds (AIM Treasurer’s Series Trust (Invesco Treasurer’s Series Trust), and Short-Term Investments Trust only); President, AIM Trimark Global Fund Inc. and AIM Trimark Canada Fund Inc. | 144 | None |
| 1 | Mr. Flanagan is considered an interested person (within the meaning of Section 2(a)(19) of the 1940 Act) of the Trust because he is an officer of the Adviser to the Trust, and an officer and a director of Invesco Ltd., ultimate parent of the Adviser. |
| 2 | Mr. Taylor is considered an interested person (within the meaning of Section 2(a)(19) of the 1940 Act) of the Trust because he is an officer and a director of the Adviser. |
T-1 Invesco Growth and Income Fund
Trustees and Officers—(continued)
| Name, Year of Birth and Position(s) Held with the Trust | Trustee and/ or Officer Since | Principal Occupation(s) During Past 5 Years | Number of Complex Overseen by Trustee | Other Directorship(s) Held by Trustee During | ||||
| Independent Trustees | ||||||||
Bruce L. Crockett — 1944 Trustee and Chair | 2003 | Chairman, Crockett Technologies Associates (technology consulting company)
Formerly: Director, Captaris (unified messaging provider); Director, President and Chief Executive Officer, COMSAT Corporation; Chairman, Board of Governors of INTELSAT (international communications company); ACE Limited (insurance company); Independent Directors Council and Investment Company Institute: Member of the Audit Committee, Investment Company Institute; Member of the Executive Committee and Chair of the Governance Committee, Independent Directors Council | 144 | Director and Chairman of the Audit Committee, ALPS (Attorneys Liability Protection Society) (insurance company); Director and Member of the Audit Committee, Ferroglobe PLC (metallurgical company) | ||||
David C. Arch — 1945 Trustee | 2010 | Chairman of Blistex Inc. (consumer health care products manufacturer); Member, World Presidents’ Organization | 144 | Board member of the Illinois Manufacturers’ Association | ||||
James T. Bunch — 1942 Trustee | 2000 | Managing Member, Grumman Hill Group LLC (family office/private equity investments)
Formerly: Chairman of the Board, Denver Film Society; Chairman of the Board of Trustees, Evans Scholarship Foundation; Chairman, Board of Governors, Western Golf Association | 144 | Trustee, Evans Scholarship Foundation | ||||
Jack M. Fields — 1952 Trustee | 2003 | Chief Executive Officer, Twenty First Century Group, Inc. (government affairs company); and Discovery Learning Alliance (non-profit)
Formerly: Owner and Chief Executive Officer, Dos Angeles Ranch L.P. (cattle, hunting, corporate entertainment); Director, Insperity, Inc. (formerly known as Administaff); Chief Executive Officer, Texana Timber LP (sustainable forestry company); Director of Cross Timbers Quail Research Ranch (non-profit); and member of the U.S. House of Representatives | 144 | None | ||||
Cynthia Hostetler — 1962 Trustee | 2017 | Non-Executive Director and Trustee of a number of public and private business corporations
Formerly: Head of Investment Funds and Private Equity, Overseas Private Investment Corporation; President, First Manhattan Bancorporation, Inc.; Attorney, Simpson Thacher & Bartlett LLP | 144 | Vulcan Materials Company (construction materials company); Trilinc Global Impact Fund; Aberdeen Investment Funds (4 portfolios); Artio Global Investment LLC (mutual fund complex); Edgen Group, Inc. (specialized energy and infrastructure products distributor) | ||||
Eli Jones — 1961 Trustee | 2016 | Professor and Dean, Mays Business School — Texas A&M University
Formerly: Professor and Dean, Walton College of Business, University of Arkansas and E.J. Ourso College of Business, Louisiana State University; Director, Arvest Bank | 144 | Insperity, Inc. (formerly known as Administaff) (human resources provider) | ||||
Prema Mathai-Davis — 1950 Trustee | 2003 | Retired.
Formerly: Chief Executive Officer, YWCA of the U.S.A. | 144 | None | ||||
Teresa M. Ressel — 1962 Trustee | 2017 | Non-executive director and trustee of a number of public and private business corporations
Formerly: Chief Financial Officer, Olayan America, The Olayan Group (international investor/commercial/industrial); Chief Executive Officer, UBS Securities LLC; Group Chief Operating Officer, Americas, UBS AG; Assistant Secretary for Management & Budget and CFO, US Department of the Treasury; Chief Compliance Officer, Kaiser Permanente; Program Manager, Hewlett-Packard; Nuclear Engineering, General Dynamics Corporation | 144 | Atlantic Power Corporation (power generation company); ON Semiconductor Corp. (semiconductor supplier) | ||||
Larry Soll — 1942 Trustee | 1997 | Retired.
Formerly: Chairman, Chief Executive Officer and President, Synergen Corp. (a biotechnology company) | 144 | None | ||||
Ann Barnett Stern — 1957 Trustee | 2017 | President and Chief Executive Officer, Houston Endowment Inc. (private philanthropic institution)
Formerly: Executive Vice President and General Counsel, Texas Children’s Hospital; Attorney, Beck, Redden and Secrest, LLP; Business Law Instructor, University of St. Thomas; Attorney, Andrews & Kurth LLP | 144 | Federal Reserve Bank of Dallas | ||||
Raymond Stickel, Jr. — 1944 Trustee | 2005 | Retired.
Formerly: Director, Mainstay VP Series Funds, Inc. (25 portfolios); Partner, Deloitte & Touche | 144 | None | ||||
Robert C. Troccoli — 1949 Trustee | 2016 | Adjunct Professor, University of Denver — Daniels College of Business
Formerly: Senior Partner, KPMG LLP | 144 | None | ||||
Christopher L. Wilson — 1957 Trustee | 2017 | Managing Partner, CT2, LLC (investing and consulting firm)
Formerly: President/Chief Executive Officer, Columbia Funds, Bank of America Corporation; President/Chief Executive Officer, CDC IXIS Asset Management Services, Inc.; Principal & Director of Operations, Scudder Funds, Scudder, Stevens & Clark, Inc.; Assistant Vice President, Fidelity Investments | 144 | TD Asset Management USA Inc. (mutual fund complex) (22 portfolios); ISO New England, Inc. (non-profit organization managing regional electricity market) |
T-2 Invesco Growth and Income Fund
Trustees and Officers—(continued)
| Name, Year of Birth and Position(s) Held with the Trust | Trustee and/ or Officer Since | Principal Occupation(s) During Past 5 Years | Number of Complex Overseen by Trustee | Other Directorship(s) Held by Trustee During | ||||
| Other Officers | ||||||||
Sheri Morris — 1964 President, Principal Executive Officer and Treasurer | 2003 | President, Principal Executive Officer and Treasurer, The Invesco Funds; Vice President, Invesco Advisers, Inc. (formerly known as Invesco Institutional (N.A.), Inc.) (registered investment adviser); and Vice President, PowerShares Exchange-Traded Fund Trust, PowerShares Exchange-Traded Fund Trust II, PowerShares India Exchange-Traded Fund Trust, PowerShares Actively Managed Exchange-Traded Fund Trust and PowerShares Actively Managed Exchange-Traded Commodity Fund Trust
Formerly: Vice President and Principal Financial Officer, The Invesco Funds; Vice President, Invesco Aim Advisers, Inc., Invesco Aim Capital Management, Inc. and Invesco Aim Private Asset Management, Inc.; Assistant Vice President and Assistant Treasurer, The Invesco Funds and Assistant Vice President, Invesco Advisers, Inc., Invesco Aim Capital Management, Inc. and Invesco Aim Private Asset Management, Inc.; and Treasurer, PowerShares Exchange-Traded Fund Trust, PowerShares Exchange-Traded Fund Trust II, PowerShares India Exchange-Traded Fund Trust and PowerShares Actively Managed Exchange-Traded Fund Trust | N/A | N/A | ||||
Russell C. Burk — 1958 Senior Vice President and Senior Officer | 2005 | Senior Vice President and Senior Officer, The Invesco Funds | N/A | N/A | ||||
John M. Zerr — 1962 Senior Vice President, Chief Legal Officer and Secretary | 2006 | Director, Senior Vice President, Secretary and General Counsel, Invesco Management Group, Inc. (formerly known as Invesco AIM Management Group, Inc.); Senior Vice President, Invesco Advisers, Inc. (formerly known as Invesco Institutional (N.A.), Inc.) (registered investment adviser); Senior Vice President and Secretary, Invesco Distributors, Inc. (formerly known as Invesco AIM Distributors, Inc.); Director, Vice President and Secretary, Invesco Investment Services, Inc. (formerly known as Invesco AIM Investment Services, Inc.) Senior Vice President, Chief Legal Officer and Secretary, The Invesco Funds; Managing Director, Invesco PowerShares Capital Management LLC; Director, Secretary and General Counsel, Invesco Investment Advisers LLC (formerly known as Van Kampen Asset Management); Secretary and General Counsel, Invesco Capital Markets, Inc. (formerly known as Van Kampen Funds Inc.) and Chief Legal Officer, PowerShares Exchange-Traded Fund Trust, PowerShares Exchange-Traded Fund Trust II, PowerShares India Exchange-Traded Fund Trust, PowerShares Actively Managed Exchange-Traded Fund Trust and PowerShares Actively Managed Exchange-Traded Commodity Fund Trust; Manager and Secretary, Invesco Indexing LLC
Formerly: Director, Secretary, General Counsel and Senior Vice President, Van Kampen Exchange Corp.; Director, Vice President and Secretary, IVZ Distributors, Inc. (formerly known as INVESCO Distributors, Inc.); Director and Vice President, INVESCO Funds Group, Inc.; Director and Vice President, Van Kampen Advisors Inc.; Director, Vice President, Secretary and General Counsel, Van Kampen Investor Services Inc.; Director, Invesco Distributors, Inc. (formerly known as Invesco AIM Distributors, Inc.); Director, Senior Vice President, General Counsel and Secretary, Invesco AIM Advisers, Inc. and Van Kampen Investments Inc.; Director, Vice President and Secretary, Fund Management Company; Director, Senior Vice President, Secretary, General Counsel and Vice President, Invesco AIM Capital Management, Inc.; Chief Operating Officer and General Counsel, Liberty Ridge Capital, Inc. (an investment adviser); Vice President and Secretary, PBHG Funds (an investment company) and PBHG Insurance Series Fund (an investment company); Chief Operating Officer, General Counsel and Secretary, Old Mutual Investment Partners (a broker-dealer); General Counsel and Secretary, Old Mutual Fund Services (an administrator) and Old Mutual Shareholder Services (a shareholder servicing center); Executive Vice President, General Counsel and Secretary, Old Mutual Capital, Inc. (an investment adviser); and Vice President and Secretary, Old Mutual Advisors Funds (an investment company) | N/A | N/A | ||||
Gregory G. McGreevey — 1962 Senior Vice President | 2012 | Senior Managing Director, Invesco Ltd.; Director, Chairman, President, and Chief Executive Officer, Invesco Advisers, Inc. (formerly known as Invesco Institutional (N.A.), Inc.) (registered investment adviser); Director, Invesco Mortgage Capital, Inc. and Invesco Senior Secured Management, Inc.; and Senior Vice President, The Invesco Funds
Formerly: Assistant Vice President, The Invesco Funds | N/A | N/A | ||||
Kelli Gallegos — 1970 Vice President, Principal Financial Officer and Assistant Treasurer | 2008 | Vice President, Principal Financial Officer and Assistant Treasurer, The Invesco Funds; Assistant Treasurer, Invesco PowerShares Capital Management LLC, PowerShares Exchange-Traded Fund Trust, PowerShares Exchange-Traded Fund Trust II, PowerShares India Exchange-Traded Fund Trust, PowerShares Actively Managed Exchange-Traded Fund Trust and PowerShares Actively Managed Exchange-Traded Commodity Fund Trust
Formerly: Assistant Vice President, The Invesco Funds | N/A | N/A |
T-3 Invesco Growth and Income Fund
Trustees and Officers—(continued)
| Name, Year of Birth and Position(s) Held with the Trust | Trustee and/ or Officer Since | Principal Occupation(s) During Past 5 Years | Number of Complex Overseen by Trustee | Other Directorship(s) Held by Trustee During | ||||
| Other Officers—(continued) | ||||||||
Tracy Sullivan — 1962 Vice President, Chief Tax Officer and Assistant Treasurer | 2008 | Vice President, Chief Tax Officer and Assistant Treasurer, The Invesco Funds; Assistant Treasurer, Invesco PowerShares Capital Management LLC, PowerShares Exchange-Traded Fund Trust, PowerShares Exchange-Traded Fund Trust II, PowerShares India Exchange-Traded Fund Trust, PowerShares Actively Managed Exchange-Traded Fund Trust and PowerShares Actively Managed Exchange-Traded Commodity Fund Trust
Formerly: Assistant Vice President, The Invesco Funds | N/A | N/A | ||||
Crissie M. Wisdom — 1969 Anti-Money Laundering Compliance Officer | 2013 | Anti-Money Laundering Compliance Officer, Invesco Advisers, Inc. (formerly known as Invesco Institutional (N.A.), Inc.) (registered investment adviser), Invesco Capital Markets, Inc. (formerly known as Van Kampen Funds Inc.), Invesco Distributors, Inc., Invesco Investment Services, Inc., Invesco Management Group, Inc., The Invesco Funds, and PowerShares Exchange-Traded Fund Trust, PowerShares Exchange-Traded Fund Trust II, PowerShares India Exchange-Traded Fund Trust, PowerShares Actively Managed Exchange-Traded Fund Trust and PowerShares Actively Managed Exchange-Traded Commodity Fund Trust; Anti-Money Laundering Compliance Officer and Bank Secrecy Act Officer, INVESCO National Trust Company and Invesco Trust Company; and Fraud Prevention Manager and Controls and Risk Analysis Manager for Invesco Investment Services, Inc.
Formerly: Anti-Money Laundering Compliance Officer, Van Kampen Exchange Corp. | N/A | N/A | ||||
Robert R. Leveille — 1969 Chief Compliance Officer | 2016 | Chief Compliance Officer, Invesco Advisers, Inc. (registered investment adviser); and Chief Compliance Officer, The Invesco Funds
Formerly: Chief Compliance Officer, Putnam Investments and the Putnam Funds | N/A | N/A |
The Statement of Additional Information of the Trust includes additional information about the Fund’s Trustees and is available upon request, without charge, by calling 1.800.959.4246. Please refer to the Fund’s Statement of Additional Information for information on the Fund’s sub-advisers.
Office of the Fund 11 Greenway Plaza, Suite 1000 Houston, TX 77046-1173 | Investment Adviser Invesco Advisers, Inc. 1555 Peachtree Street, N.E. Atlanta, GA 30309 | Distributor Invesco Distributors, Inc. 11 Greenway Plaza, Suite 1000 Houston, TX 77046-1173 | Auditors PricewaterhouseCoopers LLP 1000 Louisiana Street, Suite 5800 Houston, TX 77002-5678 | |||
Counsel to the Fund Stradley Ronon Stevens & Young, LLP 2005 Market Street, Suite 2600 Philadelphia, PA 19103-7018 | Counsel to the Independent Trustees Goodwin Procter LLP 901 New York Avenue, N.W. Washington, D.C. 20001 | Transfer Agent Invesco Investment Services, Inc. 11 Greenway Plaza, Suite 1000 Houston, TX 77046-1173 | Custodian State Street Bank and Trust Company 225 Franklin Street Boston, MA 02110-2801 | |||
T-4 Invesco Growth and Income Fund
Explore High-Conviction Investing with Invesco

Go paperless with eDelivery
Visit invesco.com/edelivery to enjoy the convenience and security of anytime electronic access to your investment documents.
With eDelivery, you can elect to have any or all of the following materials delivered straight to your inbox to download, save and print from your own computer:
∎ Fund reports and prospectuses
∎ Quarterly statements
∎ Daily confirmations
∎ Tax forms
Invesco mailing information
Send general correspondence to Invesco Investment Services, Inc., P.O. Box 219078, Kansas City, MO 64121-9078.
Important notice regarding delivery of security holder documents
To reduce Fund expenses, only one copy of most shareholder documents may be mailed to shareholders with multiple accounts at the same address (Householding). Mailing of your shareholder documents may be householded indefinitely unless you instruct us otherwise. If you do not want the mailing of these documents to be combined with those for other members of your household, please contact Invesco Investment Services, Inc. at 800 959 4246 or contact your financial institution. We will begin sending you individual copies for each account within 30 days after receiving your request.
Fund holdings and proxy voting information
The Fund provides a complete list of its holdings four times in each fiscal year, at the quarter ends. For the second and fourth quarters, the lists appear in the Fund’s semiannual and annual reports to shareholders. For the first and third quarters, the Fund files the lists with the Securities and Exchange Commission (SEC) on Form N-Q. The most recent list of portfolio holdings is available at invesco.com/completeqtrholdings. Shareholders can also look up the Fund’s Forms N-Q on the SEC website at sec.gov. Copies of the Fund’s Forms N-Q may be reviewed and copied at the SEC Public Reference Room in Washington, D.C. You can obtain information on the operation of the Public Reference Room, including information about duplicating fee charges, by calling 202 551 8090 or 800 732 0330, or by electronic request at the following email address: publicinfo@sec.gov. The SEC file numbers for the Fund are shown below.
A description of the policies and procedures that the Fund uses to determine how to vote proxies relating to portfolio securities is available without charge, upon request, from our Client Services department at 800 959 4246 or at invesco.com/proxyguidelines. The information is also available on the SEC website, sec.gov.
| Information regarding how the Fund voted proxies related to its portfolio securities during the most recent 12-month period ended June 30 is available at invesco.com/proxysearch. The information is also available on the SEC website, sec.gov. |  | |
| Invesco Advisers, Inc. is an investment adviser; it provides investment advisory services to individual and institutional clients and does not sell securities. Invesco Distributors, Inc. is the US distributor for Invesco Ltd.’s retail mutual funds, exchange-traded funds and institutional money market funds. Both are wholly owned, indirect subsidiaries of Invesco Ltd. |
| SEC file numbers: 811-09913 and 333-36074 | Invesco Distributors, Inc. | VK-GRI-AR-1 | 10102017 | 1412 |
| ||||
 |
Annual Report to Shareholders
|
August 31, 2017 | ||
| ||||
Invesco Low Volatility Equity Yield Fund
| ||||
| Nasdaq: | ||||
A: SCAUX ∎ B: SBCUX ∎ C: SCCUX ∎ R: SCRUX ∎ Y: SCAYX ∎ Investor: SCNUX R5: SCIUX ∎ R6: SLESX | ||||

Letters to Shareholders
Philip Taylor | Dear Shareholders: This annual report includes information about your Fund, including performance data and a complete list of its investments as of the close of the reporting period. Inside is a discussion of how your Fund was managed and the factors that affected its performance during the reporting period. The reporting period began with stock market volatility in the US and abroad, largely the result of uncertainty about global economic growth and monetary policy. While economic data in the US were generally positive, news overseas was less upbeat. The European Central Bank and central banks in China and Japan – as well as other countries – maintained extraordinarily accommodative monetary policies in response to economic weakness. Citing generally positive economic data – specifically, realized and expected labor market conditions and inflation – the US Federal Reserve raised interest rates three times during the reporting period: in December 2016, and in March and June 2017. The major US stock market rally that began in November 2016 continued through the end of the reporting period, with major stock market indexes repeatedly hitting new record highs. |

Short-term market volatility can prompt some investors to abandon their investment plans – and can cause others to settle for whatever returns the market has to offer. The investment professionals at Invesco, in contrast, invest with high conviction. This means that, no matter the asset class or the strategy, each investment team has a passion to exceed. We want to help investors achieve better outcomes, such as seeking higher returns, helping mitigate risk and generating income. Of course, investing with high conviction can’t guarantee a profit or ensure success; no investment strategy can. To learn more about how we invest with high conviction, visit invesco.com/HighConviction.
You, too, can invest with high conviction by maintaining a long-term investment perspective and by working with your financial adviser on a regular basis. During periods of short-term market volatility or uncertainty, your financial adviser can keep you focused on your long-term investment goals – a new home, a child’s college education or a secure retirement. He or she also can share research about the economy, the markets and individual investment options.
Visit our website for more information on your investments
Our website, invesco.com/us, offers a wide range of market insights and investment perspectives. On the website, you’ll find detailed information about our funds, including performance, holdings and portfolio manager commentaries. You can access information about your account by completing a simple, secure online registration. To do so, select “Log In” on the right side of the homepage, and then select “Register for Individual Account Access.”
In addition to the resources accessible on our website and through our mobile app, you can obtain timely updates to help you stay informed about the markets and the economy by connecting with Invesco on Twitter, LinkedIn or Facebook. You can access our blog at blog.invesco.us.com. Our goal is to provide you the information you want, when and where you want it.
Finally, I’m pleased to share with you Invesco’s commitment to both the Principles for Responsible Investment and to considering environmental, social and governance issues in our robust investment process. I invite you to learn more at invesco.com/esg.
Have questions?
For questions about your account, contact an Invesco client services representative at 800 959 4246. For Invesco-related questions or comments, please email me directly at phil@invesco.com.
All of us at Invesco look forward to serving your investment management needs. Thank you for investing with us.
Sincerely,

Philip Taylor
Senior Managing Director, Invesco Ltd.
| 2 | Invesco Low Volatility Equity Yield Fund |
Bruce Crockett | Dear Fellow Shareholders: Among the many important lessons I’ve learned in more than 40 years in a variety of business endeavors is the value of a trusted advocate. As independent chair of the Invesco Funds Board, I can assure you that the members of the Board are strong advocates for the interests of investors in Invesco’s mutual funds. We work hard to represent your interests through oversight of the quality of the investment management services your funds receive and other matters important to your investment, including but not limited to: ∎ Ensuring that Invesco offers a diverse lineup of mutual funds that your financial adviser can use to strive to meet your financial needs as your investment goals change over time. ∎ Monitoring how the portfolio management teams of the Invesco funds are performing in light of changing economic and market conditions. |

| ∎ | Assessing each portfolio management team’s investment performance within the context of the investment strategy described in the fund’s prospectus. |
| ∎ | Monitoring for potential conflicts of interests that may impact the nature of the services that your funds receive. |
We believe one of the most important services we provide our fund shareholders is the annual review of the funds’ advisory and sub-advisory contracts with Invesco Advisers and its affiliates. This review is required by the Investment Company Act of 1940 and focuses on the nature and quality of the services Invesco provides as the adviser to the Invesco funds and the reasonableness of the fees that it charges for those services. Each year, we spend months carefully reviewing information received from Invesco and a variety of independent sources, such as performance and fee data prepared by Lipper, Inc. (a subsidiary of Broadridge Financial Solutions, Inc.), an independent, third-party firm widely recognized as a leader in its field. We also meet with our independent legal counsel and other independent advisers to review and help us assess the information that we have received. Our goal is to assure that you receive quality investment management services for a reasonable fee.
I trust the measures outlined above provide assurance that you have a worthy advocate when it comes to choosing the Invesco Funds.
As always, please contact me at bruce@brucecrockett.com with any questions or concerns you may have. On behalf of the Board, we look forward to continuing to represent your interests and serving your needs.
Sincerely,

Bruce L. Crockett
Independent Chair
Invesco Funds Board of Trustees
| 3 | Invesco Low Volatility Equity Yield Fund |
Management’s Discussion of Fund Performance
Performance summary For the fiscal year ended August 31, 2017, Class A shares of Invesco Low Volatility Equity Yield Fund (the Fund), at net asset value (NAV), underperformed the Russell 1000 Index, the Fund’s style-specific benchmark. Your Fund’s long-term performance appears later in this report.
|
| |||
Fund vs. Indexes |
| |||
Total returns, 8/31/16 to 8/31/17, at net asset value (NAV). Performance shown does not include applicable contingent deferred sales charges (CDSC) or front-end sales charges, which would have reduced performance.
|
| |||
Class A Shares | 11.65 | % | ||
Class B Shares | 10.85 | |||
Class C Shares | 10.87 | |||
Class R Shares | 11.42 | |||
Class Y Shares | 11.89 | |||
Investor Class Shares | 11.73 | |||
Class R5 Shares | 12.20 | |||
Class R6 Shares* | 11.87 | |||
S&P 500 Indexq (Broad Market Index) | 16.23 | |||
Russell 1000 Indexq (Style-Specific Index) | 16.16 | |||
Lipper Equity Income Funds Index∎ (Peer Group Index) | 12.26 | |||
Source(s): qFactSet Research Systems Inc.; ∎Lipper Inc. *Class R6 shares incepted on April 4, 2017. See page 7 for more information.
| ||||
Market conditions and your Fund
The fiscal year began with major US stock market indexes posting gains, with most hitting record highs following the US presidential election. Investors seemed to believe that the new administration’s plans to reduce tax rates, scale back regulations and increase infrastructure spending had the potential to stimulate economic growth. However, that was called into question in the first quarter of 2017, when headlines out of Washing-ton, DC, suggested that enacting signifi-cant regulatory and tax reform might be more difficult than previously anticipated. Signs of an improving economy prompted the US Federal Reserve (the Fed) to raise interest rates three times during the reporting period: in December 2016 and in March and June 2017. In the first
quarter of 2017, the US economy grew at an anemic rate, with gross domestic product rising at an annualized rate of just 1.2%.1 However, the economy picked up steam during the second quarter. Unemployment continued its years-long decline, hitting a 16-year low of 4.3% in the summer of 2017.2 US equities were strong throughout the reporting period, and major US equity market indexes hit new record highs during the summer.
While US stock market indexes rose for the reporting period ended August 31, 2017, individual market sectors performed very differently from one another. Information technology (IT), financials and industrials were the strongest-performing sectors, while energy, telecommunication services and real estate were the weakest-performing sectors.
The Fund seeks a higher return and income potential than the Russell 1000 Index with potentially less volatile stocks. The Fund attempts to do this through its stock selection process, in which we systematically evaluate fundamental and behavioral factors to forecast individual security returns and rank these securities based on their attractiveness relative to industry peers.
During the fiscal year, performance was mixed across sectors of the Fund and its style-specific benchmark. The IT, consumer discretionary, financials and telecommunication services sectors detracted from Fund performance, while the energy, industrials and utilities sectors contributed to Fund performance. In addition, the Fund’s underweight allocation in the IT sector was a drag on Fund performance compared to the style-spe-cific index. The Fund ended the reporting period with overweight allocations in the consumer staples, financials, real estate and utilities sectors, and underweight allocations in the energy, health care, industrials and IT sectors.
The top contributor to Fund performance for the reporting period was Boeing. The company’s stock price appreciated due to an increase in new plane orders, particularly in the Chinese market. Two additional contributors were Best Buy and HP. Retailer Best Buy performed well due to solid earnings growth and the continuation of its four-year streak of not missing an earnings target. HP announced during the quarter that it plans to buy Samsung’s (not a Fund holding) printing business for over $1 billion.
The largest detractor from Fund performance was retailer Macy’s, whose share price slid when the company’s chief finan-cial officer warned that profit margins could end 2017 much lower due to grow-
| Portfolio Composition |
| By sector | % of total net assets |
Health Care | 17.0 | % | ||
Utilities | 14.4 | |||
Consumer Discretionary | 14.3 | |||
Financials | 12.8 | |||
Real Estate | 12.5 | |||
Consumer Staples | 12.3 | |||
Information Technology | 4.5 | |||
Energy | 4.3 | |||
Industrials | 4.3 | |||
Materials | 1.0 | |||
Telecommunication Services | 0.3 | |||
U.S. Treasury Bills, Money Market Funds Plus Other Assets Less Liabilities
|
| 2.3
|
| |
| Top 10 Equity Holdings* | ||
| % of total net assets | ||
1. CenterPoint Energy, Inc. | 2.0 | % | ||
2. Boeing Co. (The) | 2.0 | |||
3. Entergy Corp. | 2.0 | |||
4. WellCare Health Plans Inc. | 1.9 | |||
5. Gilead Sciences, Inc. | 1.9 | |||
6. Valero Energy Corp. | 1.8 | |||
7. Best Buy Co., Inc. | 1.7 | |||
8. Wal-Mart Stores, Inc. | 1.7 | |||
9. Humana Inc. | 1.6 | |||
10. Procter & Gamble Co. (The)
|
| 1.6
|
| |
Total Net Assets | $ | 270.1 million |
Total Number of Holdings*
|
| 111
|
| |
The Fund’s holdings are subject to change, and there is no assurance that the Fund will continue to hold any particular security.
*Excluding money market fund holdings.
Data presented here are as of August 31, 2017.
| 4 | Invesco Low Volatility Equity Yield Fund |
ing competition from online retailers. Increased competition is forcing bricks-and-mortar chains to close stores and cut costs. Two additional detractors were Yamana Gold and Teck Resources.
Mining company Yamana Gold struggled during the reporting period as anticipated production from the company’s six producing mines fell below expectations. A combination of sales disruptions and Teck Resources’ lowering of its forecast for the average realized price for its steelmaking coal hurt the company’s stock.
The 2016 presidential election moved capital markets dramatically toward the end of calendar year 2016 and into the first quarter of 2017. Prospects for a pro-growth economic environment caused bond yields to soar and the yield curve to steepen, which greatly benefited banks and various other financials sector constituents. Higher bond yields reduced the relative appeal of yield-oriented sectors such as consumer staples, real estate investment trusts and utilities, which are large components of the Fund’s holdings. Higher bond yields also increased the opportunity cost of holding gold; as a result, shares of many mining companies were pressured.
The Fund uses a balanced multi-factor approach to forecast returns focusing on four investment concepts: Earnings Expectations, Market Sentiment, Management and Quality, and Value. In addition, it also focuses on delivering total return with high income and low volatility. As the market resumed its rally toward the end of the fiscal year, the Fund only slightly underperformed its style-specific benchmark despite the Fund’s underweight exposure to technology stocks and its emphasis on Value as well as Management and Quality.
Please note that the Fund’s strategy is principally implemented through equity investments, but the Fund also may use derivative instruments, including S&P 500 futures
contracts, to gain exposure to the equity market. During the reporting period, the Fund invested in S&P 500 futures contracts, which were a slight detractor from Fund performance. Derivatives can be a cost-effective way to gain exposure to asset classes. However, derivatives may amplify traditional investment risks through the creation of leverage and may be less liquid than traditional securities.
Thank you for investing in Invesco Low Volatility Equity Yield Fund.
The views and opinions expressed in management’s discussion of Fund performance are those of Invesco Advisers, Inc. These views and opinions are subject to change at any time based on factors such as market and economic conditions. These views and opinions may not be relied upon as investment advice or recommendations, or as an offer for a particular security. The information is not a complete analysis of every aspect of any market, country, industry, security or the Fund. Statements of fact are from sources considered reliable, but Invesco Advisers, Inc. makes no representation or warranty as to their completeness or accuracy. Although historical performance is no guarantee of future results, these insights may help you understand our investment management philosophy.
See important Fund and, if applicable, index disclosures later in this report.
| Michael Abata Chartered Financial Analyst, Portfolio Manager, is manager of Invesco Low Volatility Equity Yield Fund. He joined Invesco in 2011. | |
| Mr. Abata earned a BA in economics from Binghamton University. | ||

| Anthony Munchak Chartered Financial Analyst, Portfolio Manager, is manager of Invesco Low Volatility Equity Yield Fund. He joined Invesco in 2000. | |
| Mr. Munchak earned a BS and an MS in finance from Boston College and an MBA from Bentley College. | ||

| Glen Murphy Chartered Financial Analyst, Portfolio Manager, is manager of Invesco Low Volatility Equity Yield Fund. He joined Invesco in 1995. | |
| Mr. Murphy earned a BA from the University of Massachusetts at Amherst and an MS in finance from Boston College. | ||

| Francis Orlando Chartered Financial Analyst, Portfolio Manager, is manager of Invesco Low Volatility Equity Yield Fund. He joined Invesco in 1987. | |
| Mr. Orlando earned a BA in business administration from Merrimack College and an MBA from Boston University. | ||

| Donna Chapman Wilson Portfolio Manager and Director of Portfolio Management, is manager of Invesco Low Volatility Equity | |
| Yield Fund. She joined Invesco in 1997. Ms. Chapman Wilson earned a BA in economics from Hampton University and an MBA in finance from the Wharton School of the University of Pennsylvania. | ||

| 1 | Bureau of Economic Analysis |
| 2 | Bureau of Labor Statistics, Bloomberg |
| 5 | Invesco Low Volatility Equity Yield Fund |
Your Fund’s Long-Term Performance
Results of a $10,000 Investment – Oldest Share Class(es)
Fund and index data from 8/31/07
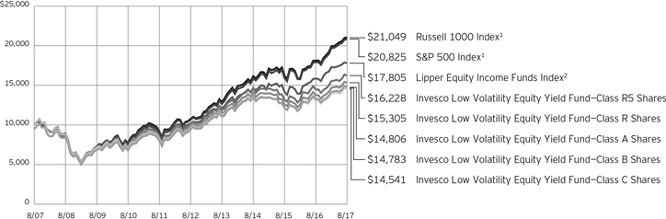
1 Source: FactSet Research Systems Inc.
2 Source: Lipper Inc.
Past performance cannot guarantee comparable future results.
The data shown in the chart include reinvested distributions, applicable sales charges and Fund expenses including management fees. Results for Class B shares are calculated as if a hypotheti-
cal shareholder had liquidated his entire investment in the Fund at the close of the reporting period and paid the contingent deferred sales charges, if applicable. Index results include reinvested dividends, but they do not reflect sales charges. Performance of the peer
group, if applicable, reflects fund expenses and management fees; performance of a market index does not. Performance shown in the chart and table(s) does not reflect deduction of taxes a shareholder would pay on Fund distributions or sale of Fund shares.
continued from page 8
About indexes used in this report
| ∎ | The S&P 500® Index is an unmanaged index considered representative of the US stock market. |
| ∎ | The Russell 1000® Index is an unmanaged index considered representative of large-cap stocks. The Russell 1000 Index is a trademark/service mark of the Frank Russell Co. Russell® is a trademark of the Frank Russell Co. |
| ∎ | The Lipper Equity Income Funds Index is an unmanaged Index considered representative of equity income funds tracked by Lipper. |
| ∎ | The Fund is not managed to track the performance of any particular index, including the index(es) described here, and consequently, the performance of the Fund may deviate significantly from the performance of the index(es). |
| ∎ | A direct investment cannot be made in an index. Unless otherwise indicated, index results include reinvested dividends, and they do not reflect sales charges. Performance of the peer group, if applicable, reflects fund expenses; performance of a market index does not. |
Other information
| ∎ | The returns shown in management’s discussion of Fund performance are based on net asset values (NAVs) calculated for shareholder transactions. Generally accepted accounting principles require adjustments to be made to the net assets of the Fund at period end for financial reporting purposes, and as such, the NAVs for shareholder transactions and the returns based on those NAVs may differ from the NAVs and returns reported in the Financial Highlights. |
| ∎ | Industry classifications used in this report are generally according to the Global Industry Classification Standard, which was developed by and is the exclusive property and a service mark of MSCI Inc. and Standard & Poor’s. |
| 6 | Invesco Low Volatility Equity Yield Fund |
Average Annual Total Returns | ||
As of 8/31/17, including maximum applicable sales charges | ||
Class A Shares | ||||
Inception (3/31/06) | 4.67% | |||
10 Years | 4.00 | |||
5 Years | 8.14 | |||
1 Year | 5.52 | |||
Class B Shares | ||||
Inception (3/31/06) | 4.65% | |||
10 Years | 3.99 | |||
5 Years | 8.24 | |||
1 Year | 5.85 | |||
Class C Shares | ||||
Inception (3/31/06) | 4.40% | |||
10 Years | 3.82 | |||
5 Years | 8.55 | |||
1 Year | 9.87 | |||
Class R Shares | ||||
Inception (3/31/06) | 4.94% | |||
10 Years | 4.35 | |||
5 Years | 9.10 | |||
1 Year | 11.42 | |||
Class Y Shares | ||||
10 Years | 4.84% | |||
5 Years | 9.62 | |||
1 Year | 11.89 | |||
Investor Class Shares | ||||
10 Years | 4.61% | |||
5 Years | 9.36 | |||
1 Year | 11.73 | |||
Class R5 Shares | ||||
Inception (3/31/06) | 5.54% | |||
10 Years | 4.96 | |||
5 Years | 9.82 | |||
1 Year | 12.20 | |||
Class R6 Shares | ||||
10 Years | 4.61% | |||
5 Years | 9.40 | |||
1 Year | 11.87 | |||
Class Y shares incepted on October 3, 2008. Performance shown prior to that date is that of Class A shares and includes the 12b-1 fees applicable to Class A shares.
Investor Class shares incepted on April 25, 2008. Performance shown prior to that date is that of Class A shares and includes the 12b-1 fees applicable to Class A shares.
Class R6 shares incepted on April 4, 2017. Performance shown prior to that date is that of Class A shares and includes the 12b-1 fees applicable to Class A shares.
Average Annual Total Returns | ||
As of 6/30/17, the most recent calendar quarter end, including maximum applicable sales charges | ||
Class A Shares | ||||
Inception (3/31/06) | 4.53% | |||
10 Years | 3.47 | |||
5 Years | 8.72 | |||
1 Year | 3.09 | |||
Class B Shares | ||||
Inception (3/31/06) | 4.52% | |||
10 Years | 3.46 | |||
5 Years | 8.85 | |||
1 Year | 3.25 | |||
Class C Shares | ||||
Inception (3/31/06) | 4.27% | |||
10 Years | 3.28 | |||
5 Years | 9.15 | |||
1 Year | 7.26 | |||
Class R Shares | ||||
Inception (3/31/06) | 4.81% | |||
10 Years | 3.81 | |||
5 Years | 9.70 | |||
1 Year | 8.84 | |||
Class Y Shares | ||||
10 Years | 4.30% | |||
5 Years | 10.23 | |||
1 Year | 9.33 | |||
Investor Class Shares | ||||
10 Years | 4.06% | |||
5 Years | 9.96 | |||
1 Year | 9.05 | |||
Class R5 Shares | ||||
Inception (3/31/06) | 5.40% | |||
10 Years | 4.40 | |||
5 Years | 10.43 | |||
1 Year | 9.53 | |||
Class R6 Shares | ||||
10 Years | 4.06% | |||
5 Years | 9.97 | |||
1 Year | 9.10 | |||
The performance data quoted represent past performance and cannot guarantee comparable future results; current performance may be lower or higher. Please visit invesco.com/performance for the most recent month-end performance. Performance figures reflect reinvested distributions, changes in net asset value and the effect of the maximum sales charge unless otherwise stated. Investment return and principal value will fluctuate so that you may have a gain or loss when you sell shares.
The total annual Fund operating expense ratio set forth in the most recent Fund prospectus as of the date of this report for Class A, Class B, Class C, Class R, Class Y, Investor Class, Class R5 and Class R6 shares was 1.20%, 1.95%, 1.95%, 1.45%, 0.95%, 1.20%, 0.77% and 0.77%, respectively. The expense ratios presented above may vary from the expense ratios presented in other sections of this report that are based on expenses incurred during the period covered by this report.
Class A share performance reflects the maximum 5.50% sales charge, and Class B and Class C share performance reflects the applicable contingent deferred sales charge (CDSC) for the period involved. The CDSC on Class B shares declines from 5% beginning at the time of purchase to 0% at the beginning of the seventh year. The CDSC on Class C shares is 1% for the first year after purchase. Class R, Class Y, Investor Class, Class R5 and Class R6 shares do not have a front-end sales charge or a CDSC; therefore, performance is at net asset value.
The performance of the Fund’s share classes will differ primarily due to different sales charge structures and class expenses.
Fund performance reflects any applicable fee waivers and/or expense reimbursements. Had the adviser not waived fees and/or reimbursed expenses currently or in the past, returns would have been lower. See current prospectus for more information.
| 7 | Invesco Low Volatility Equity Yield Fund |
Invesco Low Volatility Equity Yield Fund’s investment objective is income and long-term growth of capital.
| ∎ | Unless otherwise stated, information presented in this report is as of August 31, 2017, and is based on total net assets. |
| ∎ | Unless otherwise noted, all data provided by Invesco. |
| ∎ | To access your Fund’s reports/prospectus, visit invesco.com/fundreports. |
About share classes ∎ Class B shares may not be purchased for new or additional investments. Please see the prospectus for more information. ∎ Class R shares are generally available only to employer sponsored retirement and benefit plans. Please see the prospectus for more information. ∎ Class Y shares and Investor Class shares are available only to certain investors. Please see the prospectus for more information. ∎ Class R5 shares and Class R6 shares are available for use by retirement plans that meet certain standards and for institutional investors. Class R6 shares are also available through intermediaries that have established an agreement with Invesco Distributors, Inc. to make such shares available for use in retail omnibus accounts. Please see the prospectus for more information.
Principal risks of investing in the Fund ∎ Active trading risk. Active trading of portfolio securities may result in added expenses, a lower return and increased tax liability. ∎ Depositary receipts risk. Investing in depositary receipts involves the same risks as direct investments in foreign securities. In addition, the underlying issuers of certain depositary receipts are under no obligation to distribute shareholder communications or pass through any voting rights with respect to the deposited securities to the holders of such receipts. The Fund may therefore receive less timely information or have less control than if it invested directly in the foreign issuer. ∎ Derivatives risk. The value of a derivative instrument depends largely on (and is derived from) the value of an underlying security, currency, commodity, interest rate, index or other asset (each referred to as an underlying asset). In addition to risks relating to the underlying assets, the use of derivatives may include other, possibly greater, risks, including counterparty, leverage and liquidity | risks. Counterparty risk is the risk that the counterparty to the derivative contract will default on its obligation to pay the Fund the amount owed or otherwise perform under the derivative contract. Derivatives create leverage risk because they do not require payment up front equal to the economic exposure created by owning the derivative. As a result, an adverse change in the value of the underlying asset could result in the Fund sustaining a loss that is substantially greater than the amount invested in the derivative, which may make the Fund’s returns more volatile and increase the risk of loss. Derivative instruments may also be less liquid than more traditional investments and the Fund may be unable to sell or close out its derivative positions at a desirable time or price. This risk may be more acute under adverse market conditions, during which the Fund may be most in need of liquidating its derivative positions. Derivatives may also be harder to value, less tax efficient and subject to changing government regulation that could impact the Fund’s ability to use certain derivatives or their cost. Also, derivatives used for hedging or to gain or limit exposure to a particular market segment may not provide the expected benefits, particularly during adverse market conditions. ∎ Foreign securities risk. The Fund’s foreign investments may be adversely affected by political and social instability, changes in economic or taxation policies, difficulty in enforcing obligations, decreased liquidity or increased volatility. Foreign investments also involve the risk of the possible seizure, nationalization or expropriation of the issuer or foreign deposits (in which the Fund could lose its entire investments in a certain market) and the possible adoption of foreign governmental restrictions such as exchange controls. Unless the Fund has hedged its foreign securities risk, foreign securities risk also involves | the risk of negative foreign currency rate fluctuations, which may cause the value of securities denominated in such foreign currency (or other instruments through which the Fund has exposure to foreign currencies) to decline in value. Currency exchange rates may fluctuate significantly over short periods of time. Currency hedging strategies, if used, are not always successful. ∎ Management risk. The Fund is actively managed and depends heavily on the Adviser’s judgment about markets, interest rates or the attractiveness, relative values, liquidity, or potential appreciation of particular investments made for the Fund’s portfolio. The Fund could experience losses if these judgments prove to be incorrect. Additionally, legislative, regulatory, or tax developments may adversely affect management of the Fund and, therefore, the ability of the Fund to achieve its investment objective. ∎ Market risk. The market values of the Fund’s investments, and therefore the value of the Fund’s shares, will go up and down, sometimes rapidly or unpredictably. Market risk may affect a single issuer, industry or section of the economy, or it may affect the market as a whole. Individual stock prices tend to go up and down more dramatically than those of certain other types of investments, such as bonds. During a general downturn in the financial markets, multiple asset classes may decline in value. When markets perform well, there can be no assurance that specific investments held by the Fund will rise in value. ∎ Real estate investment trust (REIT) risk/real estate risk. Investments in real estate related instruments may be affected by economic, legal, cultural, environmental or technological factors that affect property values, rents or occupancies of real estate related to the Fund’s holdings. Shares of real estate related companies, which tend to be small- and mid-cap companies, may be more volatile and less liquid. | ||
This report must be accompanied or preceded by a currently effective Fund prospectus, which contains more complete information, including sales charges and expenses. Investors should read it carefully before investing.
| ||||
| continued on page 6 | ||||
| NOT FDIC INSURED | MAY LOSE VALUE | NO BANK GUARANTEE | ||||
| 8 | Invesco Low Volatility Equity Yield Fund |
Schedule of Investments(a)
August 31, 2017
| Shares | Value | |||||||
Common Stocks & Other Equity Interests–97.71% |
| |||||||
| Aerospace & Defense–1.97% | ||||||||
Boeing Co. (The) | 22,200 | $ | 5,320,452 | |||||
| Agricultural & Farm Machinery–1.35% | ||||||||
Deere & Co. | 31,500 | 3,651,795 | ||||||
| Agricultural Products–0.66% | ||||||||
Archer-Daniels-Midland Co. | 40,000 | 1,652,800 | ||||||
Bunge Ltd. | 1,900 | 141,797 | ||||||
| 1,794,597 | ||||||||
| Apparel Retail–0.21% | ||||||||
Gap, Inc. (The) | 23,400 | 552,708 | ||||||
| Asset Management & Custody Banks–0.54% | ||||||||
Waddell & Reed Financial, Inc.–Class A(b) | 77,800 | 1,447,858 | ||||||
| Biotechnology–5.47% | ||||||||
AbbVie Inc. | 56,900 | 4,284,570 | ||||||
Amgen Inc. | 24,300 | 4,319,811 | ||||||
Bioverativ Inc.(c) | 7,700 | 436,513 | ||||||
Gilead Sciences, Inc. | 60,000 | 5,022,600 | ||||||
Vertex Pharmaceuticals Inc.(c) | 4,450 | 714,403 | ||||||
| 14,777,897 | ||||||||
| Casinos & Gaming–1.50% | ||||||||
Las Vegas Sands Corp. | 65,200 | 4,056,092 | ||||||
| Communications Equipment–1.42% | ||||||||
Juniper Networks, Inc. | 138,600 | 3,843,378 | ||||||
| Computer & Electronics Retail–2.41% | ||||||||
Best Buy Co., Inc. | 86,600 | 4,698,916 | ||||||
GameStop Corp.–Class A | 97,200 | 1,798,200 | ||||||
| 6,497,116 | ||||||||
| Construction Machinery & Heavy Trucks–1.03% | ||||||||
Cummins Inc. | 17,500 | 2,789,150 | ||||||
| Department Stores–2.89% | ||||||||
Kohl’s Corp.(b) | 104,700 | 4,164,966 | ||||||
Macy’s, Inc. | 174,700 | 3,628,519 | ||||||
| 7,793,485 | ||||||||
| Diversified Banks–4.17% | ||||||||
Bank of Montreal (Canada) | 29,700 | 2,132,163 | ||||||
Bank of Nova Scotia (The) (Canada) | 56,400 | 3,504,696 | ||||||
Canadian Imperial Bank of Commerce (Canada) | 47,200 | 3,962,912 | ||||||
Toronto-Dominion Bank (The) (Canada) | 31,200 | 1,672,632 | ||||||
| 11,272,403 | ||||||||
| Diversified REIT’s–0.90% | ||||||||
Lexington Realty Trust | 66,300 | 653,718 | ||||||
PS Business Parks, Inc. | 2,200 | 297,242 | ||||||
| Shares | Value | |||||||
| Diversified REIT’s–(continued) | ||||||||
Select Income REIT | 17,000 | $ | 394,570 | |||||
Spirit Realty Capital, Inc. | 124,600 | 1,084,020 | ||||||
| 2,429,550 | ||||||||
| Electric Utilities–11.39% | ||||||||
American Electric Power Co., Inc. | 3,500 | 257,705 | ||||||
Duke Energy Corp. | 47,600 | 4,155,480 | ||||||
Entergy Corp. | 66,500 | 5,264,805 | ||||||
Eversource Energy | 4,400 | 277,200 | ||||||
Exelon Corp. | 110,500 | 4,184,635 | ||||||
FirstEnergy Corp. | 132,500 | 4,316,850 | ||||||
Hawaiian Electric Industries, Inc. | 8,300 | 277,386 | ||||||
PG&E Corp. | 31,200 | 2,195,856 | ||||||
PPL Corp. | 106,700 | 4,186,908 | ||||||
Southern Co. (The) | 84,300 | 4,068,318 | ||||||
Xcel Energy, Inc. | 31,900 | 1,579,050 | ||||||
| 30,764,193 | ||||||||
| General Merchandise Stores–0.85% | ||||||||
Target Corp. | 42,100 | 2,295,713 | ||||||
| Gold–1.00% | ||||||||
Barrick Gold Corp. (Canada) | 149,600 | 2,691,304 | ||||||
| Health Care Equipment–1.68% | ||||||||
Baxter International Inc. | 67,300 | 4,175,292 | ||||||
Varex Imaging Corp.(c) | 12,200 | 372,466 | ||||||
| 4,547,758 | ||||||||
| Health Care REIT’s–1.54% | ||||||||
Senior Housing Properties Trust | 210,500 | 4,151,060 | ||||||
| Health Care Services–1.46% | ||||||||
Quest Diagnostics Inc. | 36,500 | 3,954,775 | ||||||
| Homefurnishing Retail–0.77% | ||||||||
Aaron’s, Inc. | 47,200 | 2,089,544 | ||||||
| Hotel and Resort REIT’s–2.10% | ||||||||
Hospitality Properties Trust | 39,200 | 1,072,512 | ||||||
Host Hotels & Resorts Inc. | 215,800 | 3,910,296 | ||||||
Sunstone Hotel Investors, Inc. | 43,700 | 690,460 | ||||||
| 5,673,268 | ||||||||
| Hotels, Resorts & Cruise Lines–2.32% | ||||||||
Extended Stay America, Inc.(d) | 202,700 | 3,970,893 | ||||||
Royal Caribbean Cruises Ltd. | 18,500 | 2,302,510 | ||||||
| 6,273,403 | ||||||||
| Household Products–1.75% | ||||||||
HRG Group, Inc.(c) | 25,600 | 404,224 | ||||||
Procter & Gamble Co. (The) | 46,900 | 4,327,463 | ||||||
| 4,731,687 | ||||||||
See accompanying Notes to Financial Statements which are an integral part of the financial statements.
9 Invesco Low Volatility Equity Yield Fund
| Shares | Value | |||||||
| Housewares & Specialties–0.23% | ||||||||
Tupperware Brands Corp. | 10,800 | $ | 624,996 | |||||
| Hypermarkets & Super Centers–1.68% | ||||||||
Wal-Mart Stores, Inc. | 58,100 | 4,535,867 | ||||||
| Industrial REIT’s–1.63% | ||||||||
EastGroup Properties, Inc. | 3,700 | 328,782 | ||||||
Prologis, Inc. | 64,400 | 4,080,384 | ||||||
| 4,409,166 | ||||||||
| Integrated Oil & Gas–0.90% | ||||||||
Chevron Corp. | 22,500 | 2,421,450 | ||||||
| Integrated Telecommunication Services–0.21% | ||||||||
Frontier Communications Corp.(b) | 41,700 | 561,699 | ||||||
| IT Consulting & Other Services–0.39% | ||||||||
International Business Machines Corp. | 7,300 | 1,044,119 | ||||||
| Leisure Products–0.39% | ||||||||
Hasbro, Inc. | 10,800 | 1,061,100 | ||||||
| Life & Health Insurance–1.18% | ||||||||
Principal Financial Group, Inc. | 19,400 | 1,212,888 | ||||||
Prudential Financial, Inc. | 19,300 | 1,970,144 | ||||||
| 3,183,032 | ||||||||
| Managed Health Care–6.58% | ||||||||
Anthem, Inc. | 21,200 | 4,156,048 | ||||||
Cigna Corp. | 22,700 | 4,132,762 | ||||||
Humana Inc. | 17,200 | 4,431,064 | ||||||
WellCare Health Plans Inc.(c) | 28,850 | 5,039,518 | ||||||
| 17,759,392 | ||||||||
| Mortgage REIT’s–6.35% | ||||||||
AGNC Investment Corp. | 92,200 | 1,985,988 | ||||||
Annaly Capital Management, Inc. | 161,600 | 2,020,000 | ||||||
Blackstone Mortgage Trust, Inc.–Class A(b) | 51,500 | 1,614,525 | ||||||
Chimera Investment Corp. | 99,800 | 1,903,186 | ||||||
CYS Investments, Inc. | 208,600 | 1,833,594 | ||||||
MFA Financial, Inc. | 214,900 | 1,886,822 | ||||||
New Residential Investment Corp. | 119,900 | 1,975,952 | ||||||
Starwood Property Trust, Inc. | 90,000 | 1,998,900 | ||||||
Two Harbors Investment Corp. | 189,000 | 1,933,470 | ||||||
| 17,152,437 | ||||||||
| Multi-Utilities–3.01% | ||||||||
CenterPoint Energy, Inc. | 182,300 | 5,399,726 | ||||||
Consolidated Edison, Inc. | 18,300 | 1,542,141 | ||||||
DTE Energy Co. | 10,600 | 1,190,592 | ||||||
| 8,132,459 | ||||||||
| Office REIT’s–0.83% | ||||||||
JBG SMITH Properties(c) | 11,900 | 389,487 | ||||||
Piedmont Office Realty Trust Inc.–Class A | 91,700 | 1,856,925 | ||||||
| 2,246,412 | ||||||||
| Shares | Value | |||||||
| Oil & Gas Exploration & Production–0.11% | ||||||||
Vermilion Energy, Inc. (Canada) | 9,200 | $ | 300,012 | |||||
| Oil & Gas Refining & Marketing–1.77% | ||||||||
Valero Energy Corp. | 70,300 | 4,787,430 | ||||||
| Oil & Gas Storage & Transportation–1.50% | ||||||||
Williams Cos., Inc. (The) | 136,300 | 4,052,199 | ||||||
| Packaged Foods & Meats–2.01% | ||||||||
Conagra Brands, Inc. | 118,700 | 3,853,002 | ||||||
Flowers Foods, Inc. | 15,200 | 264,024 | ||||||
Hershey Co. (The) | 12,600 | 1,321,992 | ||||||
| 5,439,018 | ||||||||
| Personal Products–1.50% | ||||||||
Nu Skin Enterprises, Inc.–Class A | 66,500 | 4,045,195 | ||||||
| Pharmaceuticals–1.79% | ||||||||
Johnson & Johnson | 5,300 | 701,561 | ||||||
Pfizer Inc. | 121,800 | 4,131,456 | ||||||
| 4,833,017 | ||||||||
| Property & Casualty Insurance–0.38% | ||||||||
Assured Guaranty Ltd. | 24,400 | 1,037,976 | ||||||
| Reinsurance–0.16% | ||||||||
Everest Re Group, Ltd. | 1,750 | 441,840 | ||||||
| Residential REIT’s–1.46% | ||||||||
Camden Property Trust | 17,500 | 1,565,900 | ||||||
Equity Lifestyle Properties, Inc. | 14,000 | 1,248,100 | ||||||
Essex Property Trust, Inc. | 4,250 | 1,130,372 | ||||||
| 3,944,372 | ||||||||
| Restaurants–0.38% | ||||||||
Darden Restaurants, Inc. | 12,400 | 1,017,916 | ||||||
| Retail REIT’s–0.50% | ||||||||
Washington Prime Group Inc. | 162,600 | 1,357,710 | ||||||
| Semiconductor Equipment–0.55% | ||||||||
KLA-Tencor Corp. | 15,800 | 1,480,302 | ||||||
| Soft Drinks–2.99% | ||||||||
Coca-Cola Co. (The) | 89,200 | 4,063,060 | ||||||
PepsiCo, Inc. | 34,700 | 4,015,831 | ||||||
| 8,078,891 | ||||||||
| Specialized Consumer Services–1.40% | ||||||||
H&R Block, Inc. | 141,000 | 3,770,340 | ||||||
| Specialized REIT’s–3.55% | ||||||||
American Tower Corp.–Class A | 18,400 | 2,724,120 | ||||||
CoreCivic, Inc. | 125,800 | 3,371,440 | ||||||
OUTFRONT Media Inc. | 9,800 | 215,600 | ||||||
Potlatch Corp. | 30,100 | 1,438,780 | ||||||
Uniti Group Inc. | 95,100 | 1,831,626 | ||||||
| 9,581,566 | ||||||||
See accompanying Notes to Financial Statements which are an integral part of the financial statements.
10 Invesco Low Volatility Equity Yield Fund
| Shares | Value | |||||||
| Specialty Stores–0.95% | ||||||||
Office Depot, Inc. | 594,800 | $ | 2,551,692 | |||||
| Technology Hardware, Storage & Peripherals–2.11% | ||||||||
HP Inc. | 206,200 | 3,934,296 | ||||||
Xerox Corp. | 54,800 | 1,768,396 | ||||||
| 5,702,692 | ||||||||
| Tobacco–1.74% | ||||||||
Altria Group, Inc. | 9,700 | 614,980 | ||||||
Philip Morris International Inc. | 34,900 | 4,080,857 | ||||||
| 4,695,837 | ||||||||
| Wireless Telecommunication Services–0.10% | ||||||||
Rogers Communications, Inc.–Class B (Canada) | 5,400 | 281,718 | ||||||
Total Common Stocks & Other Equity Interests (Cost $245,624,140) |
| 263,931,038 | ||||||
| Principal Amount | ||||||||
U.S. Treasury Bills–0.21% |
| |||||||
0.89%, 09/14/2017(e)(f) (Cost $569,816) | $ | 570,000 | 569,819 | |||||
| Shares | Value | |||||||
Money Market Funds–2.27% |
| |||||||
Government & Agency Portfolio–Institutional Class, 0.93%(g) | 3,689,438 | $ | 3,689,438 | |||||
Treasury Portfolio–Institutional Class, 0.90%(g) | 2,459,625 | 2,459,625 | ||||||
Total Money Market Funds (Cost $6,149,063) | 6,149,063 | |||||||
TOTAL INVESTMENTS IN SECURITIES (excluding investments purchased with cash collateral from securities on loan)–100.19% |
| 270,649,920 | ||||||
Investments Purchased with Cash Collateral from Securities on Loan |
| |||||||
Money Market Funds–2.14% |
| |||||||
Government & Agency Portfolio–Institutional Class, 0.93% (Cost $5,774,419)(g)(h) | 5,774,419 | 5,774,419 | ||||||
TOTAL INVESTMENTS IN SECURITIES–102.33% (Cost $258,117,438) |
| 276,424,339 | ||||||
OTHER ASSETS LESS LIABILITIES–(2.33)% |
| (6,304,388 | ) | |||||
NET ASSETS–100.00% |
| $ | 270,119,951 | |||||
Investment Abbreviations:
| REIT | – Real Estate Investment Trust |
Notes to Schedule of Investments:
| (a) | Industry and/or sector classifications used in this report are generally according to the Global Industry Classification Standard, which was developed by and is the exclusive property and a service mark of MSCI Inc. and Standard & Poor’s. |
| (b) | All or a portion of this security was out on loan at August 31, 2017. |
| (c) | Non-income producing security. |
| (d) | Each share is comprised of one share of common stock of Extended Stay America, Inc. and one share of Class B common stock of ESH Hospitality, Inc. |
| (e) | Securities are traded on a discount basis. The interest rate shown represents the discount rate at the time of purchase by the Fund. |
| (f) | All or a portion of the value was pledged as collateral to cover margin requirements for open futures contracts. See Note 1J and Note 4. |
| (g) | The money market fund and the Fund are affiliated by having the same investment adviser. The rate shown is the 7-day SEC standardized yield as of August 31, 2017. |
| (h) | The security has been segregated to satisfy the commitment to return the cash collateral received in securities lending transactions upon the borrower’s return of the securities loaned. See Note 1I. |
| Open Futures Contracts — Equity Risk(a) | ||||||||||||||||||||||||
| Futures Contracts | Type of Contract | Number of Contracts | Expiration Month | Notional Value | Value | Unrealized Appreciation | ||||||||||||||||||
E-Mini S&P 500 | Long | 52 | September–2017 | $ | 6,422,260 | $ | 18,505 | $ | 18,505 | |||||||||||||||
| (a) | Futures contracts collateralized by $23,706 cash held with Bank of America Merrill Lynch, the futures commission merchant. |
11 Invesco Low Volatility Equity Yield Fund
See accompanying Notes to Financial Statements which are an integral part of the financial statements.
Statement of Assets and Liabilities
August 31, 2017
Assets: | ||||
Investments, at value (Cost $246,193,956)* | $ | 264,500,857 | ||
Investments in affiliated money market funds, at value and cost | 11,923,482 | |||
Other investments: | ||||
Variation margin receivable — futures | 37,180 | |||
Deposits with brokers: | ||||
Collateral — exchange-traded futures | 23,706 | |||
Receivable for: | ||||
Fund shares sold | 55,898 | |||
Dividends | 815,188 | |||
Investment for trustee deferred compensation and retirement plans | 215,437 | |||
Other assets | 58,658 | |||
Total assets | 277,630,406 | |||
Liabilities: | ||||
Collateral upon return of securities loaned | 5,774,419 | |||
Payable for: | ||||
Fund shares reacquired | 1,264,102 | |||
Accrued fees to affiliates | 198,470 | |||
Accrued trustees’ and officers’ fees and benefits | 3,441 | |||
Accrued other operating expenses | 39,380 | |||
Trustee deferred compensation and retirement plans | 230,643 | |||
Total liabilities | 7,510,455 | |||
Net assets applicable to shares outstanding | $ | 270,119,951 | ||
Net assets consist of: | ||||
Shares of beneficial interest | $ | 265,764,973 | ||
Undistributed net investment income | 912,483 | |||
Undistributed net realized gain (loss) | (14,882,911 | ) | ||
Net unrealized appreciation | 18,325,406 | |||
| $ | 270,119,951 | |||
Net Assets: | ||||
Class A | $ | 170,628,268 | ||
Class B | $ | 1,295,421 | ||
Class C | $ | 25,022,037 | ||
Class R | $ | 376,151 | ||
Class Y | $ | 12,670,799 | ||
Investor Class | $ | 46,259,297 | ||
Class R5 | $ | 13,857,629 | ||
Class R6 | $ | 10,349 | ||
Shares outstanding, no par value, |
| |||
Class A | 15,711,607 | |||
Class B | 121,039 | |||
Class C | 2,343,964 | |||
Class R | 34,801 | |||
Class Y | 1,161,244 | |||
Investor Class | 4,245,176 | |||
Class R5 | 1,268,101 | |||
Class R6 | 947 | |||
Class A: | ||||
Net asset value per share | $ | 10.86 | ||
Maximum offering price per share | ||||
(Net asset value of $10.86 ¸ 94.50%) | $ | 11.49 | ||
Class B: | ||||
Net asset value and offering price per share | $ | 10.70 | ||
Class C: | ||||
Net asset value and offering price per share | $ | 10.68 | ||
Class R: | ||||
Net asset value and offering price per share | $ | 10.81 | ||
Class Y: | ||||
Net asset value and offering price per share | $ | 10.91 | ||
Investor Class: | ||||
Net asset value and offering price per share | $ | 10.90 | ||
Class R5: | ||||
Net asset value and offering price per share | $ | 10.93 | ||
Class R6: | ||||
Net asset value and offering price per share | $ | 10.93 | ||
| * | At August 31, 2017, securities with an aggregate value of $5,653,686 were on loan to brokers. |
See accompanying Notes to Financial Statements which are an integral part of the financial statements.
12 Invesco Low Volatility Equity Yield Fund
Statement of Operations
For the year ended August 31, 2017
Investment income: | ||||
Dividends (net of foreign withholding taxes of $90,725) | $ | 9,597,470 | ||
Dividends from affiliated money market funds (includes securities lending income of $26,218) | 59,708 | |||
Total investment income | 9,657,178 | |||
Expenses: | ||||
Advisory fees | 1,633,285 | |||
Administrative services fees | 94,886 | |||
Custodian fees | 7,117 | |||
Distribution fees: | ||||
Class A | 428,017 | |||
Class B | 19,670 | |||
Class C | 268,697 | |||
Class R | 1,437 | |||
Investor Class | 122,937 | |||
Transfer agent fees — A, B, C, R, Y and Investor | 592,629 | |||
Transfer agent fees — R5 | 4,712 | |||
Trustees’ and officers’ fees and benefits | 27,526 | |||
Registration and filing fees | 103,870 | |||
Reports to shareholders | 94,831 | |||
Professional services fees | 31,815 | |||
Other | 18,188 | |||
Total expenses | 3,449,617 | |||
Less: Fees waived and expense offset arrangement(s) | (15,081 | ) | ||
Net expenses | 3,434,536 | |||
Net investment income | 6,222,642 | |||
Realized and unrealized gain (loss) from: | ||||
Net realized gain from: | ||||
Investment securities | 20,444,904 | |||
Futures contracts | 833,577 | |||
| 21,278,481 | ||||
Change in net unrealized appreciation (depreciation) of: | ||||
Investment securities | 2,394,201 | |||
Futures contracts | (108,306 | ) | ||
| 2,285,895 | ||||
Net realized and unrealized gain | 23,564,376 | |||
Net increase in net assets resulting from operations | $ | 29,787,018 | ||
See accompanying Notes to Financial Statements which are an integral part of the financial statements.
13 Invesco Low Volatility Equity Yield Fund
Statement of Changes in Net Assets
For the years ended August 31, 2017 and 2016
| 2017 | 2016 | |||||||
Operations: | ||||||||
Net investment income | $ | 6,222,642 | $ | 7,020,109 | ||||
Net realized gain (loss) | 21,278,481 | (10,325,307 | ) | |||||
Change in net unrealized appreciation | 2,285,895 | 27,581,174 | ||||||
Net increase in net assets resulting from operations | 29,787,018 | 24,275,976 | ||||||
Distributions to shareholders from net investment income: | ||||||||
Class A | (4,239,519 | ) | (5,380,077 | ) | ||||
Class B | (36,572 | ) | (96,347 | ) | ||||
Class C | (469,050 | ) | (680,503 | ) | ||||
Class R | (6,145 | ) | (5,308 | ) | ||||
Class Y | (277,960 | ) | (191,530 | ) | ||||
Investor Class | (1,234,685 | ) | (1,580,332 | ) | ||||
Class R5 | (387,700 | ) | (485,092 | ) | ||||
Class R6 | (72 | ) | — | |||||
Total distributions from net investment income | (6,651,703 | ) | (8,419,189 | ) | ||||
Share transactions–net: | ||||||||
Class A | (18,082,497 | ) | (13,847,486 | ) | ||||
Class B | (1,529,635 | ) | (2,772,731 | ) | ||||
Class C | (5,674,294 | ) | (3,095,697 | ) | ||||
Class R | 83,217 | 87,098 | ||||||
Class Y | 3,675,269 | 2,883,079 | ||||||
Investor Class | (11,307,479 | ) | (2,122,095 | ) | ||||
Class R5 | (476,385 | ) | (1,444,211 | ) | ||||
Class R6 | 10,000 | — | ||||||
Net increase (decrease) in net assets resulting from share transactions | (33,301,804 | ) | (20,312,043 | ) | ||||
Net increase (decrease) in net assets | (10,166,489 | ) | (4,455,256 | ) | ||||
Net assets: | ||||||||
Beginning of year | 280,286,440 | 284,741,696 | ||||||
End of year (includes undistributed net investment income of $912,483 and $1,340,597, respectively) | $ | 270,119,951 | $ | 280,286,440 | ||||
Notes to Financial Statements
August 31, 2017
NOTE 1—Significant Accounting Policies
Invesco Low Volatility Equity Yield Fund (the “Fund”) is a series portfolio of AIM Counselor Series Trust (Invesco Counselor Series Trust) (the “Trust”). The Trust is a Delaware statutory trust registered under the Investment Company Act of 1940, as amended (the “1940 Act”), as an open-end series management investment company consisting of fourteen separate portfolios, each authorized to issue an unlimited number of shares of beneficial interest. The assets, liabilities and operations of each portfolio are accounted for separately. Information presented in these financial statements pertains only to the Fund. Matters affecting each portfolio or class will be voted on exclusively by the shareholders of such portfolio or class.
The Fund’s investment objective is income and long-term growth of capital.
The Fund currently consists of eight different classes of shares: Class A, Class B, Class C, Class R, Class Y, Investor Class, Class R5 and Class R6. On April 4, 2017, the Fund began offering Class R6 shares. Class Y and Investor Class shares are available only to certain investors. Class A shares are sold with a front-end sales charge unless certain waiver criteria are met and under certain circumstances load waived shares may be subject to contingent deferred sales charges (“CDSC”). Class C shares are sold with a CDSC. Class R, Class Y, Investor Class, Class R5 and Class R6 shares are sold at net asset value. Effective November 30, 2010, new or additional investments in Class B shares are no longer permitted. Existing shareholders of Class B shares may continue to reinvest dividends and capital gains distributions in Class B shares until they convert to Class A shares. Also, shareholders in Class B shares will be able to exchange those shares for Class B shares of other Invesco Funds offering such shares until they convert to Class A shares. Generally, Class B shares will automatically convert to Class A shares on or about the month-end, which is at least eight years after the date of purchase. Redemption of Class B shares prior to the conversion date will be subject to a CDSC.
The Fund is an investment company and accordingly follows the investment company accounting and reporting guidance in accordance with Financial Accounting Standards Board Accounting Standards Codification Topic 946, Financial Services — Investment Companies.
14 Invesco Low Volatility Equity Yield Fund
The following is a summary of the significant accounting policies followed by the Fund in the preparation of its financial statements.
| A. | Security Valuations — Securities, including restricted securities, are valued according to the following policy. |
A security listed or traded on an exchange (except convertible securities) is valued at its last sales price or official closing price as of the close of the customary trading session on the exchange where the security is principally traded, or lacking any sales or official closing price on a particular day, the security may be valued at the closing bid price on that day. Securities traded in the over-the-counter market are valued based on prices furnished by independent pricing services or market makers. When such securities are valued by an independent pricing service they may be considered fair valued. Futures contracts are valued at the final settlement price set by an exchange on which they are principally traded. Listed options are valued at the mean between the last bid and asked prices from the exchange on which they are principally traded. Options not listed on an exchange are valued by an independent source at the mean between the last bid and asked prices. For purposes of determining net asset value (“NAV”) per share, futures and option contracts generally are valued 15 minutes after the close of the customary trading session of the New York Stock Exchange (“NYSE”).
Investments in open-end and closed-end registered investment companies that do not trade on an exchange are valued at the end-of-day net asset value per share. Investments in open-end and closed-end registered investment companies that trade on an exchange are valued at the last sales price or official closing price as of the close of the customary trading session on the exchange where the security is principally traded.
Debt obligations (including convertible securities) and unlisted equities are fair valued using an evaluated quote provided by an independent pricing service. Evaluated quotes provided by the pricing service may be determined without exclusive reliance on quoted prices, and may reflect appropriate factors such as institution-size trading in similar groups of securities, developments related to specific securities, dividend rate (for unlisted equities), yield (for debt obligations), quality, type of issue, coupon rate (for debt obligations), maturity (for debt obligations), individual trading characteristics and other market data. Pricing services generally value debt obligations assuming orderly transactions of institutional round lot size, but a Fund may hold or transact in the same securities in smaller, odd lot sizes. Odd lots often trade at lower prices than institutional round lots. Debt obligations are subject to interest rate and credit risks. In addition, all debt obligations involve some risk of default with respect to interest and/or principal payments.
Foreign securities’ (including foreign exchange contracts) prices are converted into U.S. dollar amounts using the applicable exchange rates as of the close of the NYSE. If market quotations are available and reliable for foreign exchange-traded equity securities, the securities will be valued at the market quotations. Because trading hours for certain foreign securities end before the close of the NYSE, closing market quotations may become unreliable. If between the time trading ends on a particular security and the close of the customary trading session on the NYSE, events occur that the investment adviser determines are significant and make the closing price unreliable, the Fund may fair value the security. If the event is likely to have affected the closing price of the security, the security will be valued at fair value in good faith using procedures approved by the Board of Trustees. Adjustments to closing prices to reflect fair value may also be based on a screening process of an independent pricing service to indicate the degree of certainty, based on historical data, that the closing price in the principal market where a foreign security trades is not the current value as of the close of the NYSE. Foreign securities’ prices meeting the approved degree of certainty that the price is not reflective of current value will be priced at the indication of fair value from the independent pricing service. Multiple factors may be considered by the independent pricing service in determining adjustments to reflect fair value and may include information relating to sector indices, American Depositary Receipts and domestic and foreign index futures. Foreign securities may have additional risks including exchange rate changes, potential for sharply devalued currencies and high inflation, political and economic upheaval, the relative lack of issuer information, relatively low market liquidity and the potential lack of strict financial and accounting controls and standards.
Securities for which market prices are not provided by any of the above methods may be valued based upon quotes furnished by independent sources. The last bid price may be used to value equity securities. The mean between the last bid and asked prices is used to value debt obligations, including corporate loans.
Securities for which market quotations are not readily available or became unreliable are valued at fair value as determined in good faith by or under the supervision of the Trust’s officers following procedures approved by the Board of Trustees. Issuer specific events, market trends, bid/asked quotes of brokers and information providers and other market data may be reviewed in the course of making a good faith determination of a security’s fair value.
The Fund may invest in securities that are subject to interest rate risk, meaning the risk that the prices will generally fall as interest rates rise and, conversely, the prices will generally rise as interest rates fall. Specific securities differ in their sensitivity to changes in interest rates depending on their individual characteristics. Changes in interest rates may result in increased market volatility, which may affect the value and/or liquidity of certain Fund investments.
Valuations change in response to many factors including the historical and prospective earnings of the issuer, the value of the issuer’s assets, general economic conditions, interest rates, investor perceptions and market liquidity. Because of the inherent uncertainties of valuation, the values reflected in the financial statements may materially differ from the value received upon actual sale of those investments.
| B. | Securities Transactions and Investment Income — Securities transactions are accounted for on a trade date basis. Realized gains or losses on sales are computed on the basis of specific identification of the securities sold. Interest income (net of withholding tax, if any) is recorded on the accrual basis from settlement date and includes income from pay-in-kind securities, if any. Dividend income (net of withholding tax, if any) is recorded on the ex-dividend date. Bond premiums and discounts are amortized and/or accreted for financial reporting purposes. |
The Fund may periodically participate in litigation related to Fund investments. As such, the Fund may receive proceeds from litigation settlements. Any proceeds received are included in the Statement of Operations as realized gain (loss) for investments no longer held and as unrealized gain (loss) for investments still held.
Brokerage commissions and mark ups are considered transaction costs and are recorded as an increase to the cost basis of securities purchased and/or a reduction of proceeds on a sale of securities. Such transaction costs are included in the determination of net realized and unrealized gain (loss) from investment securities reported in the Statement of Operations and the Statement of Changes in Net Assets and the net realized and unrealized gains (losses) on securities per share in the Financial Highlights. Transaction costs are included in the calculation of the Fund’s net asset value and, accordingly, they reduce the Fund’s total returns. These transaction costs are not considered operating expenses and are not reflected in net investment income reported in the Statement of Operations and the Statement of Changes in Net Assets, or the net investment income per share and the ratios of expenses and net investment income reported in the Financial Highlights, nor are they limited by any expense limitation arrangements between the Fund and the investment adviser.
15 Invesco Low Volatility Equity Yield Fund
The Fund recharacterizes distributions received from REIT investments based on information provided by the REIT into the following categories: ordinary income, long-term and short-term capital gains, and return of capital. If information is not available timely from the REIT, the recharacterization will be based on available information which may include the previous year’s allocation. If new or additional information becomes available from the REIT at a later date, a recharacterization will be made in the following year. The Fund records as dividend income the amount recharacterized as ordinary income and as realized gain the amount recharacterized as capital gain in the Statement of Operations, and the amount recharacterized as return of capital as a reduction of the cost of the related investment. These recharacterizations are reflected in the accompanying financial statements.
The Fund allocates income and realized and unrealized capital gains and losses to a class based on the relative net assets of each class.
| C. | Country Determination — For the purposes of making investment selection decisions and presentation in the Schedule of Investments, the investment adviser may determine the country in which an issuer is located and/or credit risk exposure based on various factors. These factors include the laws of the country under which the issuer is organized, where the issuer maintains a principal office, the country in which the issuer derives 50% or more of its total revenues and the country that has the primary market for the issuer’s securities, as well as other criteria. Among the other criteria that may be evaluated for making this determination are the country in which the issuer maintains 50% or more of its assets, the type of security, financial guarantees and enhancements, the nature of the collateral and the sponsor organization. Country of issuer and/or credit risk exposure has been determined to be the United States of America, unless otherwise noted. |
| D. | Distributions — Distributions from net investment income, if any, are declared and paid quarterly and are recorded on the ex-dividend date. Distributions from net realized capital gain, if any, are generally declared and paid annually and recorded on the ex-dividend date. The Fund may elect to treat a portion of the proceeds from redemptions as distributions for federal income tax purposes. |
| E. | Federal Income Taxes — The Fund intends to comply with the requirements of Subchapter M of the Internal Revenue Code of 1986, as amended (the “Internal Revenue Code”), necessary to qualify as a regulated investment company and to distribute substantially all of the Fund’s taxable earnings to shareholders. As such, the Fund will not be subject to federal income taxes on otherwise taxable income (including net realized capital gain) that is distributed to shareholders. Therefore, no provision for federal income taxes is recorded in the financial statements. |
The Fund recognizes the tax benefits of uncertain tax positions only when the position is more likely than not to be sustained. Management has analyzed the Fund’s uncertain tax positions and concluded that no liability for unrecognized tax benefits should be recorded related to uncertain tax positions. Management is not aware of any tax positions for which it is reasonably possible that the total amounts of unrecognized tax benefits will change materially in the next 12 months.
The Fund files tax returns in the U.S. Federal jurisdiction and certain other jurisdictions. Generally, the Fund is subject to examinations by such taxing authorities for up to three years after the filing of the return for the tax period.
| F. | Expenses — Fees provided for under the Rule 12b-1 plan of a particular class of the Fund are charged to the operations of such class. Transfer agency fees and expenses and other shareholder recordkeeping fees and expenses attributable to Class R5 are charged to such class. Transfer agency fees and expenses and other shareholder recordkeeping fees and expenses relating to all other classes are allocated among those classes based on relative net assets. All other expenses are allocated among the classes based on relative net assets. |
| G. | Accounting Estimates — The preparation of financial statements in conformity with accounting principles generally accepted in the United States of America (“GAAP”) requires management to make estimates and assumptions that affect the reported amounts of assets and liabilities at the date of the financial statements and the reported amounts of revenues and expenses during the reporting period including estimates and assumptions related to taxation. Actual results could differ from those estimates by a significant amount. In addition, the Fund monitors for material events or transactions that may occur or become known after the period-end date and before the date the financial statements are released to print. |
| H. | Indemnifications — Under the Trust’s organizational documents, each Trustee, officer, employee or other agent of the Trust is indemnified against certain liabilities that may arise out of the performance of their duties to the Fund. Additionally, in the normal course of business, the Fund enters into contracts, including the Fund’s servicing agreements, that contain a variety of indemnification clauses. The Fund’s maximum exposure under these arrangements is unknown as this would involve future claims that may be made against the Fund that have not yet occurred. The risk of material loss as a result of such indemnification claims is considered remote. |
| I. | Securities Lending — The Fund may lend portfolio securities having a market value up to one-third of the Fund’s total assets. Such loans are secured by collateral equal to no less than the market value of the loaned securities determined daily by the securities lending provider. Such collateral will be cash or debt securities issued or guaranteed by the U.S. Government or any of its sponsored agencies. Cash collateral received in connection with these loans is invested in short-term money market instruments or affiliated money market funds and is shown as such on the Schedule of Investments. The Fund bears the risk of loss with respect to the investment of collateral. It is the Fund’s policy to obtain additional collateral from or return excess collateral to the borrower by the end of the next business day, following the valuation date of the securities loaned. Therefore, the value of the collateral held may be temporarily less than the value of the securities on loan. When loaning securities, the Fund retains certain benefits of owning the securities, including the economic equivalent of dividends or interest generated by the security. Lending securities entails a risk of loss to the Fund if, and to the extent that, the market value of the securities loaned were to increase and the borrower did not increase the collateral accordingly, and the borrower failed to return the securities. The securities loaned are subject to termination at the option of the borrower or the Fund. Upon termination, the borrower will return to the Fund the securities loaned and the Fund will return the collateral. Upon the failure of the borrower to return the securities, collateral may be liquidated and the securities may be purchased on the open market to replace the loaned securities. The Fund could experience delays and costs in gaining access to the collateral and the securities may lose value during the delay which could result in potential losses to the Fund. Some of these losses may be indemnified by the lending agent. The Fund bears the risk of any deficiency in the amount of the collateral available for return to the borrower due to any loss on the collateral invested. Dividends received on cash collateral investments for securities lending transactions, which are net of compensation to counterparties, are included in Dividends from affiliated money market funds on the Statement of Operations. The aggregate value of securities out on loan, if any, is shown as a footnote on the Statement of Assets and Liabilities. |
| J. | Futures Contracts — The Fund may enter into futures contracts to manage exposure to interest rate, equity and market price movements and/or currency risks. A futures contract is an agreement between two parties (“Counterparties”) to purchase or sell a specified underlying security, currency or commodity (or delivery of a cash settlement price, in the case of an index future) for a fixed price at a future date. The Fund |
16 Invesco Low Volatility Equity Yield Fund
| currently invests only in exchange-traded futures and they are standardized as to maturity date and underlying financial instrument. Initial margin deposits required upon entering into futures contracts are satisfied by the segregation of specific securities or cash as collateral at the futures commission merchant (broker). During the period the futures contracts are open, changes in the value of the contracts are recognized as unrealized gains or losses by recalculating the value of the contracts on a daily basis. Subsequent or variation margin payments are received or made depending upon whether unrealized gains or losses are incurred. These amounts are reflected as receivables or payables on the Statement of Assets and Liabilities. When the contracts are closed or expire, the Fund recognizes a realized gain or loss equal to the difference between the proceeds from, or cost of, the closing transaction and the Fund’s basis in the contract. The net realized gain (loss) and the change in unrealized gain (loss) on futures contracts held during the period is included on the Statement of Operations. The primary risks associated with futures contracts are market risk and the absence of a liquid secondary market. If the Fund were unable to liquidate a futures contract and/or enter into an offsetting closing transaction, the Fund would continue to be subject to market risk with respect to the value of the contracts and continue to be required to maintain the margin deposits on the futures contracts. Futures contracts have minimal Counterparty risk since the exchange’s clearinghouse, as Counterparty to all exchange-traded futures, guarantees the futures against default. Risks may exceed amounts recognized in the Statement of Assets and Liabilities. |
| K. | Collateral — To the extent the Fund has pledged or segregated a security as collateral and that security is subsequently sold, it is the Fund’s practice to replace such collateral no later than the next business day. This practice does not apply to securities pledged as collateral for securities lending transactions. |
NOTE 2—Advisory Fees and Other Fees Paid to Affiliates
The Trust has entered into a master investment advisory agreement with Invesco Advisers, Inc. (the “Adviser” or “Invesco”). Under the terms of the investment advisory agreement, the Fund accrues daily and pays monthly, an advisory fee to the Adviser based on the annual rate of the Fund’s average daily net assets as follows:
| Average Daily Net Assets | Rate | |||||||
First $250 million | 0 | .60% | ||||||
Next $250 million | 0 | .575% | ||||||
Next $500 million | 0 | .55% | ||||||
Next $1.5 billion | 0 | .525% | ||||||
Next $2.5 billion | 0 | .50% | ||||||
Next $2.5 billion | 0 | .475% | ||||||
Next $2.5 billion | 0 | .45% | ||||||
Over $10 billion | 0 | .425% | ||||||
For the year ended August 31, 2017, the effective advisory fees incurred by the Fund was 0.60%.
Under the terms of a master sub-advisory agreement between the Adviser and each of Invesco Asset Management Deutschland GmbH, Invesco Asset Management Limited, Invesco Asset Management (Japan) Limited, Invesco Hong Kong Limited, Invesco Senior Secured Management, Inc. and Invesco Canada Ltd. (collectively, the “Affiliated Sub-Advisers”) the Adviser, not the Fund, will pay 40% of the fees paid to the Adviser to any such Affiliated Sub-Adviser(s) that provide(s) discretionary investment management services to the Fund based on the percentage of assets allocated to such Affiliated Sub-Adviser(s).
The Adviser has contractually agreed, through at least June 30, 2018, to waive advisory fees and/or reimburse expenses to the extent necessary to limit total annual fund operating expenses after fee waiver and/or reimbursement (excluding certain items discussed below) of Class A, Class B, Class C, Class R, Class Y, Investor Class, Class R5 and Class R6 shares to 2.00%, 2.75%, 2.75%, 2.25%, 1.75%, 2.00%, 1.75% and 1.75%, respectively, of the Fund’s average daily net assets (the “expense limits”). In determining the Adviser’s obligation to waive advisory fees and/or reimburse expenses, the following expenses are not taken into account, and could cause the total annual fund operating expenses after fee waiver and/or reimbursement to exceed the numbers reflected above: (1) interest; (2) taxes; (3) dividend expense on short sales; (4) extraordinary or non-routine items, including litigation expenses; and (5) expenses that the Fund has incurred but did not actually pay because of an expense offset arrangement. Unless Invesco continues the fee waiver agreement, it will terminate on June 30, 2018. During its term, the fee waiver agreement cannot be terminated or amended to increase the expense limits or reduce the advisory fee waivers without approval of the Board of Trustees. The Adviser did not waive fees and/or reimburse expenses during the period under this expense limit.
Further, the Adviser has contractually agreed, through at least June 30, 2019, to waive the advisory fee payable by the Fund in an amount equal to 100% of the net advisory fees the Adviser receives from the affiliated money market funds on investments by the Fund of uninvested cash (excluding investments of cash collateral from securities lending) in such affiliated money market funds.
For the year ended August 31, 2017, the Adviser waived advisory fees of $7,295.
The Trust has entered into a master administrative services agreement with Invesco pursuant to which the Fund has agreed to pay Invesco for certain administrative costs incurred in providing accounting services to the Fund. For the year ended August 31, 2017, expenses incurred under the agreement are shown in the Statement of Operations as Administrative services fees.
The Trust has entered into a transfer agency and service agreement with Invesco Investment Services, Inc. (“IIS”) pursuant to which the Fund has agreed to pay IIS a fee for providing transfer agency and shareholder services to the Fund and reimburse IIS for certain expenses incurred by IIS in the course of providing such services. IIS may make payments to intermediaries that provide omnibus account services, sub-accounting services and/or networking services. All fees payable by IIS to intermediaries that provide omnibus account services or sub-accounting services are charged back to the Fund, subject to certain limitations approved by the Trust’s Board of Trustees. For the year ended August 31, 2017, expenses incurred under the agreement are shown in the Statement of Operations as Transfer agent fees.
The Trust has entered into master distribution agreements with Invesco Distributors, Inc. (“IDI”) to serve as the distributor for the Class A, Class B, Class C, Class R, Class Y, Investor Class, Class R5 and Class R6 shares of the Fund. The Trust has adopted plans pursuant to Rule 12b-1 under the
17 Invesco Low Volatility Equity Yield Fund
1940 Act with respect to the Fund’s Class A, Class B, Class C, Class R and Investor Class shares (collectively, the “Plans”). The Fund, pursuant to the Plans, pays IDI compensation at the annual rate of 0.25% of the Fund’s average daily net assets of Class A shares, 1.00% of the average daily net assets of Class B and Class C shares and 0.50% of the average daily net assets of Class R shares. The Fund, pursuant to the Investor Class Plan, reimburses IDI for its allocated share of expenses incurred pursuant to the Investor Class Plan for the period, up to a maximum annual rate of 0.25% of the average daily net assets of Investor Class shares. The fees are accrued daily and paid monthly. Of the Plan payments, up to 0.25% of the average daily net assets of each class of shares may be paid to furnish continuing personal shareholder services to customers who purchase and own shares of such classes. Any amounts not paid as a service fee under the Plans would constitute an asset-based sales charge. Rules of the Financial Industry Regulatory Authority (“FINRA”) impose a cap on the total sales charges, including asset-based sales charges, that may be paid by any class of shares of the Fund. For the year ended August 31, 2017, expenses incurred under the Plans are shown in the Statement of Operations as Distribution fees.
Front-end sales commissions and CDSC (collectively, the “sales charges”) are not recorded as expenses of the Fund. Front-end sales commissions are deducted from proceeds from the sales of Fund shares prior to investment in Class A shares of the Fund. CDSC are deducted from redemption proceeds prior to remittance to the shareholder. During the year ended August 31, 2017, IDI advised the Fund that IDI retained $8,868 in front-end sales commissions from the sale of Class A shares and $690, $8 and $1,360 from Class A, Class B and Class C shares, respectively, for CDSC imposed on redemptions by shareholders.
Certain officers and trustees of the Trust are officers and directors of the Adviser, IIS and/or IDI.
NOTE 3—Additional Valuation Information
GAAP defines fair value as the price that would be received to sell an asset or paid to transfer a liability in an orderly transaction between market participants at the measurement date, under current market conditions. GAAP establishes a hierarchy that prioritizes the inputs to valuation methods, giving the highest priority to readily available unadjusted quoted prices in an active market for identical assets (Level 1) and the lowest priority to significant unobservable inputs (Level 3), generally when market prices are not readily available or are unreliable. Based on the valuation inputs, the securities or other investments are tiered into one of three levels. Changes in valuation methods may result in transfers in or out of an investment’s assigned level:
| Level 1 — | Prices are determined using quoted prices in an active market for identical assets. |
| Level 2 — | Prices are determined using other significant observable inputs. Observable inputs are inputs that other market participants may use in pricing a security. These may include quoted prices for similar securities, interest rates, prepayment speeds, credit risk, yield curves, loss severities, default rates, discount rates, volatilities and others. |
| Level 3 — | Prices are determined using significant unobservable inputs. In situations where quoted prices or observable inputs are unavailable (for example, when there is little or no market activity for an investment at the end of the period), unobservable inputs may be used. Unobservable inputs reflect the Fund’s own assumptions about the factors market participants would use in determining fair value of the securities or instruments and would be based on the best available information. |
The following is a summary of the tiered valuation input levels, as of August 31, 2017. The level assigned to the securities valuations may not be an indication of the risk or liquidity associated with investing in those securities. Because of the inherent uncertainties of valuation, the values reflected in the financial statements may materially differ from the value received upon actual sale of those investments.
The Fund’s policy is to recognize transfers in and out of the valuation levels as of the end of the period. During the year ended August 31, 2017, there were no transfers between valuation levels.
| Level 1 | Level 2 | Level 3 | Total | |||||||||||||
Common Stocks & Other Equity Interests | $ | 263,931,038 | $ | — | $ | — | $ | 263,931,038 | ||||||||
U.S. Treasury Securities | — | 569,819 | — | 569,819 | ||||||||||||
Money Market Funds | 11,923,482 | — | — | 11,923,482 | ||||||||||||
| 275,854,520 | 569,819 | — | 276,424,339 | |||||||||||||
Futures Contracts* | 18,505 | — | — | 18,505 | ||||||||||||
Total Investments | $ | 275,873,025 | $ | 569,819 | $ | — | $ | 276,442,844 | ||||||||
| * | Unrealized appreciation |
NOTE 4—Derivative Investments
The Fund may enter into an International Swaps and Derivatives Association Master Agreement (“ISDA Master Agreement”) under which a Fund may trade OTC derivatives. An OTC transaction entered into under an ISDA Master Agreement typically involves a collateral posting arrangement, payment netting provisions and close-out netting provisions. These netting provisions allow for reduction of credit risk through netting of contractual obligations. The enforceability of the netting provisions of the ISDA Master Agreement depends on the governing law of the ISDA Master Agreement, among other factors.
For financial reporting purposes, the Fund does not offset OTC derivative assets or liabilities that are subject to ISDA Master Agreements in the Statement of Assets and Liabilities.
Value of Derivative Investments at Period-End
The table below summarizes the value of the Fund’s derivative investments, detailed by primary risk exposure, held as of August 31, 2017:
| Value | ||||
| Derivative Assets | Equity Risk | |||
Unrealized appreciation on futures contracts — Exchange-Traded(a) | $ | 18,505 | ||
Derivatives not subject to master netting agreements | (18,505 | ) | ||
Total Derivatives Asset subject to master netting agreements | — | |||
| (a) | The daily variation margin receivable (payable) at period-end is recorded in the Statement of Assets and Liabilities. |
18 Invesco Low Volatility Equity Yield Fund
Effect of Derivative Investments for the year August 31, 2017
The table below summarizes the gains (losses) on derivative investments, detailed by primary risk exposure, recognized in earnings during the period:
| Location of Gain (Loss) on Statement of Operations | ||||
| Equity Risk | ||||
Realized Gain: | ||||
Futures contracts | $ | 833,577 | ||
Change in Net Unrealized Appreciation (Depreciation): | ||||
Futures contracts | (108,306 | ) | ||
Total | $ | 725,271 | ||
The table below summarizes the average notional value of futures contracts outstanding during the period.
Futures Contracts | ||||
Average notional value | $ | 6,364,890 | ||
NOTE 5—Expense Offset Arrangement(s)
The expense offset arrangement is comprised of transfer agency credits which result from balances in demand deposit accounts used by the transfer agent for clearing shareholder transactions. For the year ended August 31, 2017, the Fund received credits from this arrangement, which resulted in the reduction of the Fund’s total expenses of $7,786.
NOTE 6—Trustees’ and Officers’ Fees and Benefits
Trustees’ and Officers’ Fees and Benefits include amounts accrued by the Fund to pay remuneration to certain Trustees and Officers of the Fund. Trustees have the option to defer compensation payable by the Fund, and Trustees’ and Officers’ Fees and Benefits also include amounts accrued by the Fund to fund such deferred compensation amounts. Those Trustees who defer compensation have the option to select various Invesco Funds in which their deferral accounts shall be deemed to be invested. Finally, certain current Trustees were eligible to participate in a retirement plan that provided for benefits to be paid upon retirement to Trustees over a period of time based on the number of years of service. The Fund may have certain former Trustees who also participate in a retirement plan and receive benefits under such plan. Trustees’ and Officers’ Fees and Benefits include amounts accrued by the Fund to fund such retirement benefits. Obligations under the deferred compensation and retirement plans represent unsecured claims against the general assets of the Fund.
NOTE 7—Cash Balances
The Fund is permitted to temporarily carry a negative or overdrawn balance in its account with State Street Bank and Trust Company, the custodian bank. Such balances, if any at period-end, are shown in the Statement of Assets and Liabilities under the payable caption Amount due custodian. To compensate the custodian bank for such overdrafts, the overdrawn Fund may either (1) leave funds as a compensating balance in the account so the custodian bank can be compensated by earning the additional interest; or (2) compensate by paying the custodian bank at a rate agreed upon by the custodian bank and Invesco, not to exceed the contractually agreed upon rate.
NOTE 8—Distributions to Shareholders and Tax Components of Net Assets
Tax Character of Distributions to Shareholders Paid During the Fiscal Years Ended August 31, 2017 and 2016:
| 2017 | 2016 | |||||||
Ordinary income | $ | 6,651,703 | $ | 8,419,189 | ||||
Tax Components of Net Assets at Period-End:
| 2017 | ||||
Undistributed ordinary income | $ | 1,127,879 | ||
Net unrealized appreciation — investments | 18,257,720 | |||
Temporary book/tax differences | (215,397 | ) | ||
Capital Loss Carryforward | (14,815,224 | ) | ||
Shares of beneficial interest | 265,764,973 | |||
Total net assets | $ | 270,119,951 | ||
19 Invesco Low Volatility Equity Yield Fund
The difference between book-basis and tax-basis unrealized appreciation (depreciation) is due to differences in the timing of recognition of gains and losses on investments for tax and book purposes. The Fund’s net unrealized appreciation difference is attributable primarily to wash sales.
The temporary book/tax differences are a result of timing differences between book and tax recognition of income and/or expenses. The Fund’s temporary book/tax differences are the result of the trustee deferral of compensation and retirement plan benefits.
Capital loss carryforward is calculated and reported as of a specific date. Results of transactions and other activity after that date may affect the amount of capital loss carryforward actually available for the Fund to utilize. Capital losses generated in years beginning after December 22, 2010 can be carried forward for an unlimited period, whereas previous losses expire in eight tax years. Capital losses with an expiration period may not be used to offset capital gains until all net capital losses without an expiration date have been utilized. Capital loss carryforwards with no expiration date will retain their character as either short-term or long-term capital losses instead of as short-term capital losses as under prior law. The ability to utilize capital loss carryforwards in the future may be limited under the Internal Revenue Code and related regulations based on the results of future transactions.
The Fund has a capital loss carryforward as of August 31, 2017, which expires as follows:
| Capital Loss Carryforward* | ||||||||||||
| Expiration | Short-Term | Long-Term | Total | |||||||||
August 31, 2018 | $ | 14,815,224 | $ | — | $ | 14,815,224 | ||||||
| * | Capital loss carryforward as of the date listed above is reduced for limitations, if any, to the extent required by the Internal Revenue Code and may be further limited depending upon a variety of factors, including the realization of net unrealized gains or losses as of the date of any reorganization. |
NOTE 9—Investment Transactions
The aggregate amount of investment securities (other than short-term securities, U.S. Treasury obligations and money market funds, if any) purchased and sold by the Fund during the year ended August 31, 2017 was $287,871,766 and $316,930,820, respectively. Cost of investments, including any derivatives, on a tax basis includes the adjustments for financial reporting purposes as of the most recently completed federal income tax reporting period-end.
| Unrealized Appreciation (Depreciation) of Investments on a Tax Basis | ||||
Aggregate unrealized appreciation of investments | $ | 24,766,794 | ||
Aggregate unrealized (depreciation) of investments | (6,509,074 | ) | ||
Net unrealized appreciation of investments | $ | 18,257,720 | ||
Cost of investments for tax purposes is $258,185,124.
NOTE 10—Reclassification of Permanent Differences
Primarily as a result of differing book/tax treatment of Fair Fund settlements, on August 31, 2017, undistributed net investment income was increased by $947 and undistributed net realized gain (loss) was decreased by $947. This reclassification had no effect on the net assets of the Fund.
20 Invesco Low Volatility Equity Yield Fund
NOTE 11—Share Information
| Summary of Share Activity | ||||||||||||||||
| Years ended August 31, | ||||||||||||||||
| 2017(a) | 2016 | |||||||||||||||
| Shares | Amount | Shares | Amount | |||||||||||||
Sold: | ||||||||||||||||
Class A | 703,288 | $ | 7,236,109 | 666,467 | $ | 6,392,002 | ||||||||||
Class B | 7,772 | 76,959 | 12,621 | 115,778 | ||||||||||||
Class C | 138,767 | 1,395,334 | 187,858 | 1,790,677 | ||||||||||||
Class R | 17,393 | 180,224 | 10,763 | 105,189 | ||||||||||||
Class Y | 993,363 | 10,369,480 | 415,400 | 4,021,398 | ||||||||||||
Investor Class | 133,426 | 1,370,271 | 583,771 | 5,850,110 | ||||||||||||
Class R5 | 106,659 | 1,096,390 | 288,796 | 2,820,348 | ||||||||||||
Class R6(b) | 947 | 10,000 | — | — | ||||||||||||
Issued as reinvestment of dividends: | ||||||||||||||||
Class A | 380,834 | 3,889,388 | 516,429 | 4,910,181 | ||||||||||||
Class B | 3,582 | 35,902 | 9,828 | 91,978 | ||||||||||||
Class C | 38,299 | 384,774 | 59,945 | 560,852 | ||||||||||||
Class R | 570 | 5,805 | 517 | 4,903 | ||||||||||||
Class Y | 20,467 | 211,283 | 15,170 | 145,128 | ||||||||||||
Investor Class | 116,590 | 1,193,878 | 160,202 | 1,528,502 | ||||||||||||
Class R5 | 37,671 | 387,189 | 46,483 | 444,681 | ||||||||||||
Automatic conversion of Class B shares to Class A shares: | ||||||||||||||||
Class A | 127,700 | 1,314,981 | 229,981 | 2,186,988 | ||||||||||||
Class B | (129,467 | ) | (1,314,981 | ) | (233,221 | ) | (2,186,988 | ) | ||||||||
Reacquired: | ||||||||||||||||
Class A | (2,951,326 | ) | (30,522,975 | ) | (2,867,915 | ) | (27,336,657 | ) | ||||||||
Class B | (32,563 | ) | (327,515 | ) | (84,469 | ) | (793,499 | ) | ||||||||
Class C | (735,323 | ) | (7,454,402 | ) | (587,380 | ) | (5,447,226 | ) | ||||||||
Class R | (10,206 | ) | (102,812 | ) | (2,458 | ) | (22,994 | ) | ||||||||
Class Y | (666,493 | ) | (6,905,494 | ) | (131,252 | ) | (1,283,447 | ) | ||||||||
Investor Class | (1,365,938 | ) | (13,871,628 | ) | (988,430 | ) | (9,500,707 | ) | ||||||||
Class R5 | (191,639 | ) | (1,959,964 | ) | (487,185 | ) | (4,709,240 | ) | ||||||||
Net increase (decrease) in share activity | (3,255,627 | ) | $ | (33,301,804 | ) | (2,178,079 | ) | $ | (20,312,043 | ) | ||||||
| (a) | There are entities that are record owners of more than 5% of the outstanding shares of the Fund and in the aggregate own 11% of the outstanding shares of the Fund. IDI has an agreement with these entities to sell Fund shares. The Fund, Invesco and/or Invesco affiliates may make payments to these entities, which are considered to be related to the Fund, for providing services to the Fund, Invesco and/or Invesco affiliates including but not limited to services such as securities brokerage, distribution, third party record keeping and account servicing. The Fund has no knowledge as to whether all or any portion of the shares owned of record by these entities are also owned beneficially. |
| (b) | Commencement date of April 4, 2017. |
21 Invesco Low Volatility Equity Yield Fund
NOTE 12—Financial Highlights
The following schedule presents financial highlights for a share of the Fund outstanding throughout the periods indicated.
| Net asset value, beginning of period | Net investment income(a) | Net gains (losses) on securities (both realized and unrealized) | Total from investment operations | Dividends from net investment income | Distributions from net realized gains | Total distributions | Net asset value, end of period | Total return(b) | Net assets, end of period (000’s omitted) | Ratio of expenses to average net assets with fee waivers and/or expenses absorbed | Ratio of expenses to average net assets without fee waivers and/or expenses absorbed | Ratio of net investment income to average net assets | Portfolio turnover(c) | |||||||||||||||||||||||||||||||||||||||||||
Class A | ||||||||||||||||||||||||||||||||||||||||||||||||||||||||
Year ended 08/31/17 | $ | 9.97 | $ | 0.24 | $ | 0.90 | $ | 1.14 | $ | (0.25 | ) | $ | — | $ | (0.25 | ) | $ | 10.86 | 11.65 | % | $ | 170,628 | 1.21 | %(d) | 1.21 | %(d) | 2.33 | %(d) | 108 | % | ||||||||||||||||||||||||||
Year ended 08/31/16 | 9.40 | 0.25 | 0.62 | 0.87 | (0.30 | ) | — | (0.30 | ) | 9.97 | 9.40 | 173,949 | 1.20 | 1.20 | 2.59 | 107 | ||||||||||||||||||||||||||||||||||||||||
Year ended 08/31/15 | 11.75 | 0.26 | (1.43 | ) | (1.17 | ) | (0.31 | ) | (0.87 | ) | (1.18 | ) | 9.40 | (10.72 | ) | 177,739 | 1.15 | 1.15 | 2.49 | 101 | ||||||||||||||||||||||||||||||||||||
Year ended 08/31/14 | 9.98 | 0.31 | 1.92 | 2.23 | (0.29 | ) | (0.17 | ) | (0.46 | ) | 11.75 | 22.91 | 224,786 | 1.14 | 1.14 | 2.80 | 109 | |||||||||||||||||||||||||||||||||||||||
Year ended 08/31/13 | 8.66 | 0.12 | 1.31 | 1.43 | (0.11 | ) | — | (0.11 | ) | 9.98 | 16.71 | 199,636 | 1.18 | 1.18 | 1.31 | 107 | ||||||||||||||||||||||||||||||||||||||||
Class B | ||||||||||||||||||||||||||||||||||||||||||||||||||||||||
Year ended 08/31/17 | 9.82 | 0.16 | 0.89 | 1.05 | (0.17 | ) | — | (0.17 | ) | 10.70 | 10.85 | 1,295 | 1.96 | (d) | 1.96 | (d) | 1.58 | (d) | 108 | |||||||||||||||||||||||||||||||||||||
Year ended 08/31/16 | 9.26 | 0.17 | 0.61 | 0.78 | (0.22 | ) | — | (0.22 | ) | 9.82 | 8.57 | 2,669 | 1.95 | 1.95 | 1.84 | 107 | ||||||||||||||||||||||||||||||||||||||||
Year ended 08/31/15 | 11.59 | 0.18 | (1.42 | ) | (1.24 | ) | (0.22 | ) | (0.87 | ) | (1.09 | ) | 9.26 | (11.42 | ) | 5,253 | 1.90 | 1.90 | 1.74 | 101 | ||||||||||||||||||||||||||||||||||||
Year ended 08/31/14 | 9.84 | 0.22 | 1.90 | 2.12 | (0.20 | ) | (0.17 | ) | (0.37 | ) | 11.59 | 22.08 | 11,962 | 1.89 | 1.89 | 2.05 | 109 | |||||||||||||||||||||||||||||||||||||||
Year ended 08/31/13 | 8.53 | 0.05 | 1.29 | 1.34 | (0.03 | ) | — | (0.03 | ) | 9.84 | 15.72 | 13,288 | 1.93 | 1.93 | 0.56 | 107 | ||||||||||||||||||||||||||||||||||||||||
Class C | ||||||||||||||||||||||||||||||||||||||||||||||||||||||||
Year ended 08/31/17 | 9.80 | 0.16 | 0.89 | 1.05 | (0.17 | ) | — | (0.17 | ) | 10.68 | 10.87 | 25,022 | 1.96 | (d) | 1.96 | (d) | 1.58 | (d) | 108 | |||||||||||||||||||||||||||||||||||||
Year ended 08/31/16 | 9.24 | 0.17 | 0.61 | 0.78 | (0.22 | ) | — | (0.22 | ) | 9.80 | 8.59 | 28,435 | 1.95 | 1.95 | 1.84 | 107 | ||||||||||||||||||||||||||||||||||||||||
Year ended 08/31/15 | 11.56 | 0.18 | (1.41 | ) | (1.23 | ) | (0.22 | ) | (0.87 | ) | (1.09 | ) | 9.24 | (11.37 | ) | 29,959 | 1.90 | 1.90 | 1.74 | 101 | ||||||||||||||||||||||||||||||||||||
Year ended 08/31/14 | 9.82 | 0.22 | 1.89 | 2.11 | (0.20 | ) | (0.17 | ) | (0.37 | ) | 11.56 | 22.01 | 40,119 | 1.89 | 1.89 | 2.05 | 109 | |||||||||||||||||||||||||||||||||||||||
Year ended 08/31/13 | 8.51 | 0.05 | 1.29 | 1.34 | (0.03 | ) | — | (0.03 | ) | 9.82 | 15.75 | 37,335 | 1.93 | 1.93 | 0.56 | 107 | ||||||||||||||||||||||||||||||||||||||||
Class R | ||||||||||||||||||||||||||||||||||||||||||||||||||||||||
Year ended 08/31/17 | 9.92 | 0.21 | 0.91 | 1.12 | (0.23 | ) | — | (0.23 | ) | 10.81 | 11.42 | 376 | 1.46 | (d) | 1.46 | (d) | 2.08 | (d) | 108 | |||||||||||||||||||||||||||||||||||||
Year ended 08/31/16 | 9.35 | 0.22 | 0.62 | 0.84 | (0.27 | ) | — | (0.27 | ) | 9.92 | 9.16 | 268 | 1.45 | 1.45 | 2.34 | 107 | ||||||||||||||||||||||||||||||||||||||||
Year ended 08/31/15 | 11.69 | 0.24 | (1.43 | ) | (1.19 | ) | (0.28 | ) | (0.87 | ) | (1.15 | ) | 9.35 | (10.93 | ) | 170 | 1.40 | 1.40 | 2.24 | 101 | ||||||||||||||||||||||||||||||||||||
Year ended 08/31/14 | 9.93 | �� | 0.28 | 1.91 | 2.19 | (0.26 | ) | (0.17 | ) | (0.43 | ) | 11.69 | 22.60 | 206 | 1.39 | 1.39 | 2.55 | 109 | ||||||||||||||||||||||||||||||||||||||
Year ended 08/31/13 | 8.61 | 0.10 | 1.30 | 1.40 | (0.08 | ) | — | (0.08 | ) | 9.93 | 16.37 | 200 | 1.43 | 1.43 | 1.06 | 107 | ||||||||||||||||||||||||||||||||||||||||
Class Y | ||||||||||||||||||||||||||||||||||||||||||||||||||||||||
Year ended 08/31/17 | 10.02 | 0.27 | 0.90 | 1.17 | (0.28 | ) | — | (0.28 | ) | 10.91 | 11.89 | 12,671 | 0.96 | (d) | 0.96 | (d) | 2.58 | (d) | 108 | |||||||||||||||||||||||||||||||||||||
Year ended 08/31/16 | 9.45 | 0.27 | 0.62 | 0.89 | (0.32 | ) | — | (0.32 | ) | 10.02 | 9.64 | 8,152 | 0.95 | 0.95 | 2.84 | 107 | ||||||||||||||||||||||||||||||||||||||||
Year ended 08/31/15 | 11.80 | 0.29 | (1.43 | ) | (1.14 | ) | (0.34 | ) | (0.87 | ) | (1.21 | ) | 9.45 | (10.43 | ) | 4,861 | 0.90 | 0.90 | 2.74 | 101 | ||||||||||||||||||||||||||||||||||||
Year ended 08/31/14 | 10.02 | 0.33 | 1.94 | 2.27 | (0.32 | ) | (0.17 | ) | (0.49 | ) | 11.80 | 23.24 | 5,383 | 0.89 | 0.89 | 3.05 | 109 | |||||||||||||||||||||||||||||||||||||||
Year ended 08/31/13 | 8.71 | 0.15 | 1.30 | 1.45 | (0.14 | ) | — | (0.14 | ) | 10.02 | 16.90 | 4,189 | 0.93 | 0.93 | 1.56 | 107 | ||||||||||||||||||||||||||||||||||||||||
Investor Class | ||||||||||||||||||||||||||||||||||||||||||||||||||||||||
Year ended 08/31/17 | 10.00 | 0.24 | 0.91 | 1.15 | (0.25 | ) | — | (0.25 | ) | 10.90 | 11.73 | 46,259 | 1.21 | (d) | 1.21 | (d) | 2.33 | (d) | 108 | |||||||||||||||||||||||||||||||||||||
Year ended 08/31/16 | 9.43 | 0.25 | 0.62 | 0.87 | (0.30 | ) | — | (0.30 | ) | 10.00 | 9.38 | 53,620 | 1.20 | 1.20 | 2.59 | 107 | ||||||||||||||||||||||||||||||||||||||||
Year ended 08/31/15 | 11.78 | 0.27 | (1.44 | ) | (1.17 | ) | (0.31 | ) | (0.87 | ) | (1.18 | ) | 9.43 | (10.68 | ) | 52,880 | 1.15 | 1.15 | 2.49 | 101 | ||||||||||||||||||||||||||||||||||||
Year ended 08/31/14 | 10.01 | 0.31 | 1.92 | 2.23 | (0.29 | ) | (0.17 | ) | (0.46 | ) | 11.78 | 22.85 | 65,428 | 1.14 | 1.14 | 2.80 | 109 | |||||||||||||||||||||||||||||||||||||||
Year ended 08/31/13 | 8.69 | 0.12 | 1.31 | 1.43 | (0.11 | ) | — | (0.11 | ) | 10.01 | 16.65 | 64,369 | 1.18 | 1.18 | 1.31 | 107 | ||||||||||||||||||||||||||||||||||||||||
Class R5 | ||||||||||||||||||||||||||||||||||||||||||||||||||||||||
Year ended 08/31/17 | 10.03 | 0.29 | 0.91 | 1.20 | (0.30 | ) | — | (0.30 | ) | 10.93 | 12.20 | 13,858 | 0.77 | (d) | 0.77 | (d) | 2.77 | (d) | 108 | |||||||||||||||||||||||||||||||||||||
Year ended 08/31/16 | 9.46 | 0.29 | 0.62 | 0.91 | (0.34 | ) | — | (0.34 | ) | 10.03 | 9.82 | 13,194 | 0.77 | 0.77 | 3.02 | 107 | ||||||||||||||||||||||||||||||||||||||||
Year ended 08/31/15 | 11.82 | 0.31 | (1.44 | ) | (1.13 | ) | (0.36 | ) | (0.87 | ) | (1.23 | ) | 9.46 | (10.35 | ) | 13,881 | 0.75 | 0.75 | 2.89 | 101 | ||||||||||||||||||||||||||||||||||||
Year ended 08/31/14 | 10.03 | 0.35 | 1.94 | 2.29 | (0.33 | ) | (0.17 | ) | (0.50 | ) | 11.82 | 23.48 | 16,272 | 0.75 | 0.75 | 3.19 | 109 | |||||||||||||||||||||||||||||||||||||||
Year ended 08/31/13 | 8.71 | 0.16 | 1.31 | 1.47 | (0.15 | ) | — | (0.15 | ) | 10.03 | 17.12 | 13,000 | 0.76 | 0.76 | 1.73 | 107 | ||||||||||||||||||||||||||||||||||||||||
Class R6 | ||||||||||||||||||||||||||||||||||||||||||||||||||||||||
Year ended 08/31/17(e) | 10.58 | 0.12 | 0.31 | 0.43 | (0.08 | ) | — | (0.08 | ) | 10.93 | 4.05 | 10 | 0.75 | (d)(f) | 0.75 | (d)(f) | 2.79 | (d)(f) | 108 | |||||||||||||||||||||||||||||||||||||
| (a) | Calculated using average shares outstanding. |
| (b) | Includes adjustments in accordance with accounting principles generally accepted in the United States of America and as such, the net asset value for financial reporting purposes and the returns based upon those net asset values may differ from the net asset value and returns for shareholder transactions. Does not include sales charges and is not annualized for periods less than one year, if applicable. |
| (c) | Portfolio turnover is calculated at the fund level and is not annualized for periods less than one year, if applicable. |
| (d) | Ratios are based on average daily net assets (000’s omitted) of $171,207, $1,967, $26,870, $287, $10,454, $49,175, $13,216 and $10 for Class A, Class B, Class C, Class R, Class Y, Investor Class, Class R5 and Class R6 shares, respectively. |
| (e) | Commencement date of April 4, 2017. |
| (f) | Annualized. |
22 Invesco Low Volatility Equity Yield Fund
Report of Independent Registered Public Accounting Firm
To the Board of Trustees of AIM Counselor Series Trust (Invesco Counselor Series Trust)
and Shareholders of Invesco Low Volatility Equity Yield Fund:
In our opinion, the accompanying statement of assets and liabilities, including the schedule of investments, and the related statements of operations and of changes in net assets and the financial highlights present fairly, in all material respects, the financial position of Invesco Low Volatility Equity Yield Fund (one of the funds constituting AIM Counselor Series Trust (Invesco Counselor Series Trust), hereafter referred to as the “Fund”) as of August 31, 2017, the results of its operations for the year then ended, the changes in its net assets for each of the two years in the period then ended and the financial highlights for each of the periods indicated therein, in conformity with accounting principles generally accepted in the United States of America. These financial statements and financial highlights (hereafter referred to as “financial statements”) are the responsibility of the Fund’s management. Our responsibility is to express an opinion on these financial statements based on our audits. We conducted our audits of these financial statements in accordance with the standards of the Public Company Accounting Oversight Board (United States). Those standards require that we plan and perform the audit to obtain reasonable assurance about whether the financial statements are free of material misstatement. An audit includes examining, on a test basis, evidence supporting the amounts and disclosures in the financial statements, assessing the accounting principles used and significant estimates made by management, and evaluating the overall financial statement presentation. We believe that our audits, which included confirmation of securities as of August 31, 2017 by correspondence with the custodian, transfer agent and brokers, and when replies were not received from brokers, we performed other auditing procedures, provide a reasonable basis for our opinion.
PricewaterhouseCoopers LLP
Houston, Texas
October 30, 2017
23 Invesco Low Volatility Equity Yield Fund
Calculating your ongoing Fund expenses
Example
As a shareholder of the Fund, you incur two types of costs: (1) transaction costs, which may include sales charges (loads) on purchase payments or contingent deferred sales charges on redemptions, if any; and (2) ongoing costs, including management fees, distribution and/or service (12b-1) fees, and other Fund expenses. This example is intended to help you understand your ongoing costs (in dollars) of investing in the Fund and to compare these costs with ongoing costs of investing in other mutual funds. With the exception of the actual ending account value and expenses of the Class R6 shares, the example is based on an investment of $1,000 invested at the beginning of the period and held for the entire period March 1, 2017 through August 31, 2017. The actual ending account value and expenses of the Class R6 shares in the example below are based on an investment of $1,000 invested as of close of business April 4, 2017 (commencement date) and held through August 31, 2017.
Actual expenses
The table below provides information about actual account values and actual expenses. You may use the information in this table, together with the amount you invested, to estimate the expenses that you paid over the period. Simply divide your account value by $1,000 (for example, an $8,600 account value divided by $1,000 = 8.6), then multiply the result by the number in the table under the heading entitled “Actual Expenses Paid During Period” to estimate the expenses you paid on your account during this period (as of close of business April 4, 2017 through August 31, 2017 for the Class R6 shares). Because the actual ending account value and expense information in the example is not based upon a six month period for the Class R6 shares, the ending account value and expense information may not provide a meaningful comparison to mutual funds that provide such information for a full six month period.
Hypothetical example for comparison purposes
The table below also provides information about hypothetical account values and hypothetical expenses based on the Fund’s actual expense ratio and an assumed rate of return of 5% per year before expenses, which is not the Fund’s actual return.
The hypothetical account values and expenses may not be used to estimate the actual ending account balance or expenses you paid for the period. You may use this information to compare the ongoing costs of investing in the Fund and other funds. To do so, compare this 5% hypothetical example with the 5% hypothetical examples that appear in the shareholder reports of the other funds.
Please note that the expenses shown in the table are meant to highlight your ongoing costs only and do not reflect any transaction costs, such as sales charges (loads) on purchase payments or contingent deferred sales charges on redemptions, if any. Therefore, the hypothetical information is useful in comparing ongoing costs only, and will not help you determine the relative total costs of owning different funds. In addition, if these transaction costs were included, your costs would have been higher.
| Class | Beginning Account Value (03/01/17) | ACTUAL | HYPOTHETICAL (5% annual return before expenses) | Annualized Expense Ratio | ||||||||||||||||||||
| Ending Account Value (08/31/17)1 | Expenses Paid During Period2 | Ending Account Value (08/31/17) | Expenses Paid During Period3 | |||||||||||||||||||||
| A | $ | 1,000.00 | $ | 1,041.90 | $ | 6.28 | $ | 1,019.06 | $ | 6.21 | 1.22 | % | ||||||||||||
| B | 1,000.00 | 1,037.40 | 10.12 | 1,015.27 | 10.01 | 1.97 | ||||||||||||||||||
| C | 1,000.00 | 1,038.50 | 10.12 | 1,015.27 | 10.01 | 1.97 | ||||||||||||||||||
| R | 1,000.00 | 1,040.70 | 7.56 | 1,017.80 | 7.48 | 1.47 | ||||||||||||||||||
| Y | 1,000.00 | 1,043.00 | 4.99 | 1,020.32 | 4.94 | 0.97 | ||||||||||||||||||
| Investor | 1,000.00 | 1,041.80 | 6.28 | 1,019.06 | 6.21 | 1.22 | ||||||||||||||||||
| R5 | 1,000.00 | 1,044.00 | 4.02 | 1,021.27 | 3.97 | 0.78 | ||||||||||||||||||
| R6 | 1,000.00 | 1,040.50 | 3.14 | 1,021.42 | 3.82 | 0.75 | ||||||||||||||||||
| 1 | The actual ending account value is based on the actual total return of the Fund for the period March 1, 2017 through August 31, 2017 (as of close of business April 4, 2017 through August 31, 2017 for the Class R6 shares), after actual expenses and will differ from the hypothetical ending account value which is based on the Fund’s expense ratio and a hypothetical annual return of 5% before expenses. |
| 2 | Actual expenses are equal to the Fund’s annualized expense ratio as indicated above multiplied by the average account value over the period, multiplied by 184/365 to reflect the most recent fiscal half year. For the Class R6 shares actual expenses are equal to the annualized expense ratio indicated above multiplied by the average account value over the period, multiplied by 150 (as of close of business April 4, 2017 through August 31, 2017)/365. Because the Class R6 shares have not been in existence for a full six month period, the actual ending account value and expense information shown may not provide a meaningful comparison to fund expense information of classes that show such data for a full six month period and, because the actual ending account value and expense information in the expense example covers a short time period, return and expense data may not be indicative of return and expense data for longer time periods. |
| 3 | Hypothetical expenses are equal to the annualized expense ratio indicated above multiplied by the average account value over the period, multiplied by 184/365 to reflect a one-half year period. The hypothetical ending account value and expenses may be used to compare ongoing costs of investing in Class R6 shares of the Fund and other funds because such data is based on a full six month period. |
24 Invesco Low Volatility Equity Yield Fund
Approval of Investment Advisory and Sub-Advisory Contracts
The Board of Trustees (the Board) of AIM Counselor Series Trust (Invesco Counselor Series Trust) is required under the Investment Company Act of 1940, as amended, to approve annually the renewal of Invesco Low Volatility Equity Yield Fund’s (the Fund) investment advisory agreements. During contract renewal meetings held on June 12-13, 2017, the Board as a whole, and the disinterested or “independent” Trustees, who comprise over 75% of the Board, voting separately, approved the continuance for the Fund of the Master Investment Advisory Agreement with Invesco Advisers, Inc. (Invesco Advisers and the investment advisory agreement) and the Master Intergroup Sub-Advisory Contract for Mutual Funds with Invesco Asset Management Deutschland GmbH, Invesco Asset Management Limited, Invesco Asset Management (Japan) Limited, Invesco Hong Kong Limited, Invesco Senior Secured Management, Inc. and Invesco Canada Ltd. (collectively, the Affiliated Sub-Advisers and the sub-advisory contracts) for another year, effective July 1, 2017.
In evaluating the fairness and reasonableness of compensation under the Fund’s investment advisory agreement and sub-advisory contracts, the Board considered, among other things, the factors discussed below. The Board determined that continuation of the Fund’s investment advisory agreement and the sub-advisory contracts is in the best interest of the Fund and its shareholders and that the compensation payable to Invesco Advisers and the Affiliated Sub-Advisers under the agreements is fair and reasonable.
The Board’s Fund Evaluation Process
The Board’s Investments Committee has established three Sub-Committees, which meet throughout the year to review the performance of funds advised by Invesco Advisers (the Invesco Funds). Over the course of each year, the Sub-Committees meet with portfolio managers for their assigned Invesco Funds and other members of management to review the performance, investment objective(s), policies, strategies, limitations and investment risks of these funds. The Board had the benefit of reports from the Sub-Committees and Investments Committee throughout the year in considering approval of the continuance of each Invesco Fund’s investment advisory agreement and sub-advisory contracts for another year.
During the contract renewal process, the Board receives comparative performance and fee data regarding the Invesco Funds prepared by Invesco Advisers and Broadridge Financial Solutions, Inc. (Broadridge), an independent provider of investment company data. The Board also receives an independent written evaluation from the Senior Officer, an officer of the Invesco Funds who reports directly to the independent Trustees. The Senior Officer’s
evaluation is prepared as part of his responsibility to manage the process by which the Invesco Funds’ proposed management fees are negotiated during the annual contract renewal process to ensure they are negotiated in a manner that is at arms’ length and reasonable. In addition to meetings with Invesco Advisers and fund counsel, the independent Trustees also discuss the continuance of the investment advisory agreement and sub-advisory contracts in separate sessions with the Senior Officer and with independent legal counsel.
The Trustees recognized that the advisory fee rates for the Invesco Funds are, in most cases, the result of years of review and negotiation. The Trustees’ deliberations and conclusions in a particular year may be based in part on their deliberations and conclusions regarding these arrangements throughout the year and in prior years. The Trustees’ review and conclusions are based on the comprehensive consideration of all information presented to them and are not the result of any single determinative factor. Moreover, one Trustee may have weighed a particular piece of information or factor differently than another Trustee.
The discussion below is a summary of the Senior Officer’s independent written evaluation with respect to the Fund’s investment advisory agreement as well as a discussion of the material factors and related conclusions that formed the basis for the Board’s approval of the Fund’s investment advisory agreement and sub-advisory contracts. This information is current as of June 13, 2017, and does not reflect consideration of factors that became known to the Board after that date.
Factors and Conclusions and Summary of Independent Written Fee Evaluation
| A. | Nature, Extent and Quality of Services Provided by Invesco Advisers and the Affiliated Sub-Advisers |
The Board reviewed the advisory services provided to the Fund by Invesco Advisers under the Fund’s investment advisory agreement, the performance of Invesco Advisers in providing these services, and the credentials and experience of the officers and employees of Invesco Advisers who provide these services, including the Fund’s portfolio manager or managers. The Board’s review included consideration of Invesco Advisers’ investment process oversight, credit analysis and investment risk management. The Board also considered non-advisory services that Invesco Advisers and its affiliates provide to the Invesco Funds such as various back office support functions, trading operations, internal audit, valuation and legal and compliance.
In determining whether to continue the Fund’s investment advisory agreement, the Board considered the benefits of reapproving an
existing relationship as contrasted with the greater uncertainty that may be associated with entering into a new relationship. The Board concluded that the nature, extent and quality of the services provided to the Fund by Invesco Advisers are appropriate and satisfactory.
The Board reviewed the services that may be provided by the Affiliated Sub-Advisers under the sub-advisory contracts and the credentials and experience of the officers and employees of the Affiliated Sub-Advisers who provide these services. The Board noted that the Affiliated Sub-Advisers have offices and personnel that are located in financial centers around the world. As a result, the Board noted that the Affiliated Sub-Advisers can provide research and investment analysis on the markets and economies of various countries in which the Fund may invest, make recommendations regarding securities and assist with security trades. The Board concluded that the sub-advisory contracts may benefit the Fund and its shareholders by permitting Invesco Advisers to use the resources and talents of the Affiliated Sub-Advisers in managing the Fund. The Board concluded that the nature, extent and quality of the services that may be provided by the Affiliated Sub-Advisers are appropriate and satisfactory.
| B. | Fund Investment Performance |
The Board considered Fund investment performance as a relevant factor in considering whether to approve the investment advisory agreement. The Board did not view Fund performance as a relevant factor in considering whether to approve the sub-advisory contracts for the Fund, as no Affiliated Sub-Adviser currently manages assets of the Fund.
The Board compared the Fund’s investment performance over multiple time periods ending December 31, 2016 to the performance of funds in the Broadridge performance universe and against the Lipper Equity Income Funds Index. The Board noted that performance of Class A shares of the Fund was in the fifth quintile of its performance universe for the one and three year periods and the fourth quintile for the five year period (the first quintile being the best performing funds and the fifth quintile being the worst performing funds). The Board noted that performance of Class A shares of the Fund was below the performance of the Index for the one, three and five year periods. The Trustees also reviewed more recent Fund performance and this review did not change their conclusions.
| C. | Advisory and Sub-Advisory Fees |
The Board compared the Fund’s contractual management fee rate to the contractual management fee rates of funds in the Fund’s Broadridge expense group at a common asset level. The Board noted that the contractual management fee rate for Class A shares of the
25 Invesco Low Volatility Equity Yield Fund
Fund was below the median contractual management fee rate of funds in its expense group. The Board noted that the term “contractual management fee” for funds in the expense group may include both advisory and certain administrative services fees, but that Broadridge does not provide information on a fund by fund basis as to what is included. The Board noted that Invesco Advisers does not separately charge the Invesco Funds for the administrative services included in the term as defined by Broadridge. The Board also reviewed the methodology used by Broadridge in providing expense group information, which includes using each fund’s contractual management fee schedule (including any applicable breakpoints) as reported in the most recent prospectus or statement of additional information for each fund in the expense group.
The Board also compared the Fund’s effective advisory fee rate (the advisory fee rate after advisory fee waivers and before other expense limitations/waivers) to the effective advisory fee rates of other mutual funds advised by Invesco Advisers and its affiliates with investment strategies comparable to those of the Fund, based on asset balances as of December 31, 2016. The Board noted that the Fund’s rate was above the rate of one such mutual fund. The Board noted that Invesco Advisers and the Affiliated Sub-Advisers do not manage other client accounts with investment strategies comparable to those of the Fund.
The Board also considered the services that may be provided by the Affiliated Sub-Advisers pursuant to the sub-advisory contracts, as well as the fees payable by Invesco Advisers to the Affiliated Sub-Advisers pursuant to the sub-advisory contracts. The Board also noted that the sub-advisory fees are not paid directly by the Fund, but rather, are payable by Invesco Advisers to the Affiliated Sub-Advisers.
| D. | Economies of Scale and Breakpoints |
The Board considered the extent to which there are economies of scale in the provision of advisory services to the Fund. The Board also considered that the Fund benefits from economies of scale through contractual breakpoints in the Fund’s advisory fee schedule. The Board noted that the Fund shares directly in economies of scale through lower fees charged by third party service providers based on the combined size of the Invesco Funds advised by Invesco Advisers.
| E. | Profitability and Financial Resources |
The Board reviewed information from Invesco Advisers concerning the costs of the advisory and other services that Invesco Advisers and its affiliates provide to the Fund and the Invesco Funds and the profitability of Invesco Advisers and its affiliates in providing these services. The Board noted that Invesco Advisers continues to operate at a net profit from services Invesco Advisers and its affiliates provide to the Invesco Funds and the Fund. The Board did not deem the level of profits realized by Invesco Advisers and its affiliates from providing services to the Fund to be excessive given the nature, quality and
extent of the services provided. The Board received and accepted information from Invesco Advisers demonstrating that Invesco Advisers and each Affiliated Sub-Adviser are financially sound and have the resources necessary to perform their obligations under the investment advisory agreement and sub-advisory contracts.
| F. | Collateral Benefits to Invesco Advisers and its Affiliates |
The Board considered various other benefits received by Invesco Advisers and its affiliates from the relationship with the Fund, including the fees received for providing transfer agency and distribution services to the Fund. The Board considered comparative information regarding fees charged for these services, including information provided by Broadridge and other independent sources. The Board considered the performance of Invesco Advisers and its affiliates in providing these services and the organizational structure employed to provide these services. The Board also considered that these services are provided to the Fund pursuant to written contracts that are reviewed and approved on an annual basis by the Board; and that the services are required for the operation of the Fund.
The Board considered the benefits realized by Invesco Advisers and the Affiliated Sub-Advisers as a result of portfolio brokerage transactions executed through “soft dollar” arrangements. The Board noted that soft dollar arrangements may result in the Fund bearing costs to purchase research that may be used by Invesco Advisers or the Affiliated Sub-Advisers with other clients and may reduce Invesco Adviser’s or the Affiliated Sub-Adviser’s expenses. The Board also considered that it receives periodic reports from the Chief Compliance Officer of the Invesco Funds demonstrating that these arrangements are consistent with regulatory requirements. The Board did not deem the soft dollar arrangements to be inappropriate.
The Board considered that the Fund’s uninvested cash and cash collateral from any securities lending arrangements may be invested in money market funds advised by Invesco Advisers pursuant to procedures approved by the Board. The Board noted that Invesco Advisers receives advisory fees from these affiliated money market funds attributable to such investments, although Invesco Advisers has contractually agreed to waive through varying periods the advisory fees payable by the Invesco Funds with respect to certain investments in the affiliated money market funds. The waiver is in an amount equal to 100% of the net advisory fee Invesco Advisers receives from the affiliated money market funds with respect to the Fund’s investment in the affiliated money market funds of uninvested cash, but not cash collateral. The Board concluded that the amount of advisory fees received by Invesco Advisers from the Fund’s investment of cash collateral from any securities lending arrangements in the affiliated money market funds is fair and reasonable.
The Board also considered that the Fund may use an affiliated broker to execute certain trades for the Fund to, among other things, control information leakage, and was advised that such trades would be executed in compliance with rules under the federal securities laws and consistent with best execution obligations.
26 Invesco Low Volatility Equity Yield Fund
Tax Information
Form 1099-DIV, Form 1042-S and other year-end tax information provide shareholders with actual calendar year amounts that should be included in their tax returns. Shareholders should consult their tax advisors.
The following distribution information is being provided as required by the Internal Revenue Code or to meet a specific state’s requirement.
The Fund designates the following amounts or, if subsequently determined to be different, the maximum amount allowable for its fiscal year ended August 31, 2017:
Federal and State Income Tax | ||||
Long-Term Capital Gain Distributions | $ | 0 | ||
Qualified Dividend Income* | 78.85 | % | ||
Corporate Dividends Received Deduction* | 70.96 | % | ||
U.S. Treasury Obligations* | 0.04 | % | ||
Tax-Exempt Interest Dividends* | 0 | % | ||
| * | The above percentages are based on ordinary income dividends paid to shareholders during the Fund’s fiscal year. |
27 Invesco Low Volatility Equity Yield Fund
Proxy Results
A Special Joint Meeting (“Meeting”) of Shareholders of Invesco Low Volatility Equity Yield Fund, an investment portfolio of AIM Counselor Series Trust (Invesco Counselor Series Trust), a Delaware statutory trust (“Trust”), was held on March 9, 2017. The Meeting was held for the following purposes:
| (1) | Elect 15 trustees to the Board, each of whom will serve until his or her successor is elected and qualified. |
| (2) | Approve an amendment to the Trust’s Agreement and Declaration of Trust that would permit fund mergers and other significant transactions upon the Board’s approval but without shareholder approval of such transactions. |
The results of the voting on the above matters were as follows:
| Matters | Votes For | Votes Withheld | ||||||||||||||||
| (1)* | David C. Arch | 1,425,647,604 | 36,521,875 | |||||||||||||||
| James T. Bunch | 1,425,181,099 | 36,988,380 | ||||||||||||||||
| Bruce L. Crockett | 1,425,174,694 | 36,994,785 | ||||||||||||||||
| Jack M. Fields | 1,426,060,874 | 36,108,605 | ||||||||||||||||
| Martin L. Flanagan | 1,426,481,477 | 35,688,002 | ||||||||||||||||
| Cynthia Hostetler | 1,426,489,972 | 35,679,505 | ||||||||||||||||
| Dr. Eli Jones | 1,426,255,832 | 35,913,647 | ||||||||||||||||
| Dr. Prema Mathai-Davis | 1,425,363,789 | 36,805,689 | ||||||||||||||||
| Teresa M. Ressel | 1,426,514,880 | 35,654,598 | ||||||||||||||||
| Dr. Larry Soll | 1,424,932,245 | 37,237,234 | ||||||||||||||||
| Ann Barnett Stern | 1,426,260,049 | 35,909,429 | ||||||||||||||||
| Raymond Stickel, Jr. | 1,425,391,657 | 36,777,822 | ||||||||||||||||
| Philip A. Taylor | 1,426,285,212 | 35,884,267 | ||||||||||||||||
| Robert C. Troccoli | 1,426,075,097 | 36,094,382 | ||||||||||||||||
| Christopher L. Wilson | 1,426,594,956 | 35,574,523 | ||||||||||||||||
| Votes For | Votes Against | Votes Abstain | Broker Non-Votes | |||||||||||||||
| (2)* | Approve an amendment to the Trust’s Agreement and Declaration of Trust that would permit fund mergers and other significant transactions upon the Board’s approval but without shareholder approval of such transactions | 751,302,707 | 79,810,344 | 41,561,890 | 589,495,482 | |||||||||||||
The Meeting was adjourned until April 11, 2017, with respect to the following proposals:
| (3) | Approve changing the fundamental investment restriction regarding the purchase or sale of physical commodities. |
| 4(a) | Approve an amendment to the current Master Intergroup Sub-Advisory Contract to add Invesco PowerShares Capital Management LLC. |
| 4(b) | Approve an amendment to the current Master Intergroup Sub-Advisory Contract to add Invesco Asset Management (India) Private Limited. |
Invesco Low Volatility Equity Yield Fund did not receive sufficient shareholder votes to pass Proposals 3 and 4(a) - (b).
The results of the voting on the above matters were as follows:
| Matters | Votes For | Votes Against | Votes Abstain | Broker Non-Votes | ||||||||||||||
| (3) | Approve changing the fundamental investment restriction regarding the purchase or sale of physical commodities | 8,026,770 | 855,331 | 631,463 | 4,104,083 | |||||||||||||
| 4(a) | Approve an amendment to the current Master Intergroup Sub-Advisory Contract to add Invesco PowerShares Capital Management LLC | 8,467,978 | 464,442 | 581,151 | 4,104,076 | |||||||||||||
| 4(b) | Approve an amendment to the current Master Intergroup Sub-Advisory Contract to add Invesco Asset Management (India) Private Limited | 8,248,751 | 625,350 | 639,468 | 4,104,078 | |||||||||||||
| * | Each of proposal 1 and 2 required approval by a combined vote of all of the portfolios of AIM Counselor Series Trust (Invesco Counselor Series Trust). |
28 Invesco Low Volatility Equity Yield Fund
Trustees and Officers
The address of each trustee and officer is AIM Counselor Series Trust (Invesco Counselor Series Trust) (the “Trust”), 11 Greenway Plaza, Suite 1000, Houston, Texas 77046-1173. The trustees serve for the life of the Trust, subject to their earlier death, incapacitation, resignation, retirement or removal as more specifically provided in the Trust’s organizational documents. Each officer serves for a one year term or until their successors are elected and qualified. Column two below includes length of time served with predecessor entities, if any.
| Name, Year of Birth and Position(s) Held with the Trust | Trustee and/ or Officer Since | Principal Occupation(s) During Past 5 Years | Number of Overseen by | Other Directorship(s) Held by Trustee During Past 5 Years | ||||
| Interested Persons | ||||||||
| Martin L. Flanagan1 — 1960 Trustee | 2007 | Executive Director, Chief Executive Officer and President, Invesco Ltd. (ultimate parent of Invesco and a global investment management firm); Trustee, The Invesco Funds; Vice Chair, Investment Company Institute; and Member of Executive Board, SMU Cox School of Business
Formerly: Advisor to the Board, Invesco Advisers, Inc. (formerly known as Invesco Institutional (N.A.), Inc.); Chairman and Chief Executive Officer, Invesco Advisers, Inc. (registered investment adviser); Director, Chairman, Chief Executive Officer and President, Invesco Holding Company (US), Inc. (formerly IVZ Inc.) (holding company), Invesco Group Services, Inc. (service provider) and Invesco North American Holdings, Inc. (holding company); Director, Chief Executive Officer and President, Invesco Holding Company Limited (parent of Invesco and a global investment management firm); Director, Invesco Ltd.; Chairman, Investment Company Institute and President, Co-Chief Executive Officer, Co-President, Chief Operating Officer and Chief Financial Officer, Franklin Resources, Inc. (global investment management organization) | 144 | None | ||||
Philip A. Taylor2 — 1954 Trustee and Senior Vice President | 2006 | Head of the Americas and Senior Managing Director, Invesco Ltd.; Director, Invesco Advisers, Inc. (formerly known as Invesco Institutional (N.A.), Inc.) (registered investment adviser); Director, Chairman, Chief Executive Officer and President, Invesco Management Group, Inc. (formerly known as Invesco Aim Management Group, Inc.) (financial services holding company); Director and Chairman, Invesco Investment Services, Inc. (formerly known as Invesco Aim Investment Services, Inc.) (registered transfer agent); Chief Executive Officer, Invesco Corporate Class Inc. (corporate mutual fund company); Director, Chairman and Chief Executive Officer, Invesco Canada Ltd. (formerly known as Invesco Trimark Ltd./Invesco Trimark Ltèe) (registered investment adviser and registered transfer agent); Trustee and Senior Vice President, The Invesco Funds; Director, Invesco Investment Advisers LLC (formerly known as Van Kampen Asset Management).
Formerly: Co-Chairman, Co-President and Co-Chief Executive Officer, Invesco Advisers, Inc. (formerly known as Invesco Institutional (N.A.), Inc.) (registered investment adviser); Director, Chief Executive Officer and President, Van Kampen Exchange Corp; President and Principal Executive Officer, The Invesco Funds (other than AIM Treasurer’s Series Trust (Invesco Treasurer’s Series Trust), Short-Term Investments Trust and Invesco Management Trust); Executive Vice President, The Invesco Funds (AIM Treasurer’s Series Trust (Invesco Treasurer’s Series Trust), Short-Term Investments Trust and Invesco Management Trust only); Director and President, INVESCO Funds Group, Inc. (registered investment adviser and registered transfer agent); Director and Chairman, IVZ Distributors, Inc. (formerly known as INVESCO Distributors, Inc.) (registered broker dealer); Director, President and Chairman, Invesco Inc. (holding company), Invesco Canada Holdings Inc. (holding company), Trimark Investments Ltd./Placements Trimark Ltèe and Invesco Financial Services Ltd/Services Financiers Invesco Ltèe; Chief Executive Officer, Invesco Canada Fund Inc. (corporate mutual fund company); Director and Chairman, Van Kampen Investor Services Inc.; Director, Chief Executive Officer and President, 1371 Preferred Inc. (holding company) and Van Kampen Investments Inc.; Director and President, AIM GP Canada Inc. (general partner for limited partnerships) and Van Kampen Advisors, Inc.; Director and Chief Executive Officer, Invesco Trimark Dealer Inc. (registered broker dealer); Director, Invesco Distributors, Inc. (formerly known as Invesco Aim Distributors, Inc.) (registered broker dealer); Manager, Invesco PowerShares Capital Management LLC; Director, Chief Executive Officer and President, Invesco Advisers, Inc.; Director, Chairman, Chief Executive Officer and President, Invesco Aim Capital Management, Inc.; President, Invesco Trimark Dealer Inc. and Invesco Trimark Ltd./Invesco Trimark Ltèe; Director and President, AIM Trimark Corporate Class Inc. and AIM Trimark Canada Fund Inc.; Senior Managing Director, Invesco Holding Company Limited; Director and Chairman, Fund Management Company (former registered broker dealer); President and Principal Executive Officer, The Invesco Funds (AIM Treasurer’s Series Trust (Invesco Treasurer’s Series Trust), and Short-Term Investments Trust only); President, AIM Trimark Global Fund Inc. and AIM Trimark Canada Fund Inc. | 144 | None |
| 1 | Mr. Flanagan is considered an interested person (within the meaning of Section 2(a)(19) of the 1940 Act) of the Trust because he is an officer of the Adviser to the Trust, and an officer and a director of Invesco Ltd., ultimate parent of the Adviser. |
| 2 | Mr. Taylor is considered an interested person (within the meaning of Section 2(a)(19) of the 1940 Act) of the Trust because he is an officer and a director of the Adviser. |
T-1 Invesco Low Volatility Equity Yield Fund
Trustees and Officers—(continued)
| Name, Year of Birth and Position(s) Held with the Trust | Trustee and/ or Officer Since | Principal Occupation(s) During Past 5 Years | Number of Complex Overseen by Trustee | Other Directorship(s) Held by Trustee During | ||||
| Independent Trustees | ||||||||
Bruce L. Crockett — 1944 Trustee and Chair | 2003 | Chairman, Crockett Technologies Associates (technology consulting company)
Formerly: Director, Captaris (unified messaging provider); Director, President and Chief Executive Officer, COMSAT Corporation; Chairman, Board of Governors of INTELSAT (international communications company); ACE Limited (insurance company); Independent Directors Council and Investment Company Institute: Member of the Audit Committee, Investment Company Institute; Member of the Executive Committee and Chair of the Governance Committee, Independent Directors Council | 144 | Director and Chairman of the Audit Committee, ALPS (Attorneys Liability Protection Society) (insurance company); Director and Member of the Audit Committee, Ferroglobe PLC (metallurgical company) | ||||
David C. Arch — 1945 Trustee | 2010 | Chairman of Blistex Inc. (consumer health care products manufacturer); Member, World Presidents’ Organization | 144 | Board member of the Illinois Manufacturers’ Association | ||||
James T. Bunch — 1942 Trustee | 2000 | Managing Member, Grumman Hill Group LLC (family office/private equity investments)
Formerly: Chairman of the Board, Denver Film Society; Chairman of the Board of Trustees, Evans Scholarship Foundation; Chairman, Board of Governors, Western Golf Association | 144 | Trustee, Evans Scholarship Foundation | ||||
Jack M. Fields — 1952 Trustee | 2003 | Chief Executive Officer, Twenty First Century Group, Inc. (government affairs company); and Discovery Learning Alliance (non-profit)
Formerly: Owner and Chief Executive Officer, Dos Angeles Ranch L.P. (cattle, hunting, corporate entertainment); Director, Insperity, Inc. (formerly known as Administaff); Chief Executive Officer, Texana Timber LP (sustainable forestry company); Director of Cross Timbers Quail Research Ranch (non-profit); and member of the U.S. House of Representatives | 144 | None | ||||
Cynthia Hostetler — 1962 Trustee | 2017 | Non-Executive Director and Trustee of a number of public and private business corporations
Formerly: Head of Investment Funds and Private Equity, Overseas Private Investment Corporation; President, First Manhattan Bancorporation, Inc.; Attorney, Simpson Thacher & Bartlett LLP | 144 | Vulcan Materials Company (construction materials company); Trilinc Global Impact Fund; Aberdeen Investment Funds (4 portfolios); Artio Global Investment LLC (mutual fund complex); Edgen Group, Inc. (specialized energy and infrastructure products distributor) | ||||
Eli Jones — 1961 Trustee | 2016 | Professor and Dean, Mays Business School — Texas A&M University
Formerly: Professor and Dean, Walton College of Business, University of Arkansas and E.J. Ourso College of Business, Louisiana State University; Director, Arvest Bank | 144 | Insperity, Inc. (formerly known as Administaff) (human resources provider) | ||||
Prema Mathai-Davis — 1950 Trustee | 2003 | Retired.
Formerly: Chief Executive Officer, YWCA of the U.S.A. | 144 | None | ||||
Teresa M. Ressel — 1962 Trustee | 2017 | Non-executive director and trustee of a number of public and private business corporations
Formerly: Chief Financial Officer, Olayan America, The Olayan Group (international investor/commercial/industrial); Chief Executive Officer, UBS Securities LLC; Group Chief Operating Officer, Americas, UBS AG; Assistant Secretary for Management & Budget and CFO, US Department of the Treasury; Chief Compliance Officer, Kaiser Permanente; Program Manager, Hewlett-Packard; Nuclear Engineering, General Dynamics Corporation | 144 | Atlantic Power Corporation (power generation company); ON Semiconductor Corp. (semiconductor supplier) | ||||
Larry Soll — 1942 Trustee | 1997 | Retired.
Formerly: Chairman, Chief Executive Officer and President, Synergen Corp. (a biotechnology company) | 144 | None | ||||
Ann Barnett Stern — 1957 Trustee | 2017 | President and Chief Executive Officer, Houston Endowment Inc. (private philanthropic institution)
Formerly: Executive Vice President and General Counsel, Texas Children’s Hospital; Attorney, Beck, Redden and Secrest, LLP; Business Law Instructor, University of St. Thomas; Attorney, Andrews & Kurth LLP | 144 | Federal Reserve Bank of Dallas | ||||
Raymond Stickel, Jr. — 1944 Trustee | 2005 | Retired.
Formerly: Director, Mainstay VP Series Funds, Inc. (25 portfolios); Partner, Deloitte & Touche | 144 | None | ||||
Robert C. Troccoli — 1949 Trustee | 2016 | Adjunct Professor, University of Denver — Daniels College of Business
Formerly: Senior Partner, KPMG LLP | 144 | None | ||||
Christopher L. Wilson — 1957 Trustee | 2017 | Managing Partner, CT2, LLC (investing and consulting firm)
Formerly: President/Chief Executive Officer, Columbia Funds, Bank of America Corporation; President/Chief Executive Officer, CDC IXIS Asset Management Services, Inc.; Principal & Director of Operations, Scudder Funds, Scudder, Stevens & Clark, Inc.; Assistant Vice President, Fidelity Investments | 144 | TD Asset Management USA Inc. (mutual fund complex) (22 portfolios); ISO New England, Inc. (non-profit organization managing regional electricity market) |
T-2 Invesco Low Volatility Equity Yield Fund
Trustees and Officers—(continued)
| Name, Year of Birth and Position(s) Held with the Trust | Trustee and/ or Officer Since | Principal Occupation(s) During Past 5 Years | Number of Complex Overseen by Trustee | Other Directorship(s) Held by Trustee During | ||||
| Other Officers | ||||||||
Sheri Morris — 1964 President, Principal Executive Officer and Treasurer | 2003 | President, Principal Executive Officer and Treasurer, The Invesco Funds; Vice President, Invesco Advisers, Inc. (formerly known as Invesco Institutional (N.A.), Inc.) (registered investment adviser); and Vice President, PowerShares Exchange-Traded Fund Trust, PowerShares Exchange-Traded Fund Trust II, PowerShares India Exchange-Traded Fund Trust, PowerShares Actively Managed Exchange-Traded Fund Trust and PowerShares Actively Managed Exchange-Traded Commodity Fund Trust
Formerly: Vice President and Principal Financial Officer, The Invesco Funds; Vice President, Invesco Aim Advisers, Inc., Invesco Aim Capital Management, Inc. and Invesco Aim Private Asset Management, Inc.; Assistant Vice President and Assistant Treasurer, The Invesco Funds and Assistant Vice President, Invesco Advisers, Inc., Invesco Aim Capital Management, Inc. and Invesco Aim Private Asset Management, Inc.; and Treasurer, PowerShares Exchange-Traded Fund Trust, PowerShares Exchange-Traded Fund Trust II, PowerShares India Exchange-Traded Fund Trust and PowerShares Actively Managed Exchange-Traded Fund Trust | N/A | N/A | ||||
Russell C. Burk — 1958 Senior Vice President and Senior Officer | 2005 | Senior Vice President and Senior Officer, The Invesco Funds | N/A | N/A | ||||
John M. Zerr — 1962 Senior Vice President, Chief Legal Officer and Secretary | 2006 | Director, Senior Vice President, Secretary and General Counsel, Invesco Management Group, Inc. (formerly known as Invesco AIM Management Group, Inc.); Senior Vice President, Invesco Advisers, Inc. (formerly known as Invesco Institutional (N.A.), Inc.) (registered investment adviser); Senior Vice President and Secretary, Invesco Distributors, Inc. (formerly known as Invesco AIM Distributors, Inc.); Director, Vice President and Secretary, Invesco Investment Services, Inc. (formerly known as Invesco AIM Investment Services, Inc.) Senior Vice President, Chief Legal Officer and Secretary, The Invesco Funds; Managing Director, Invesco PowerShares Capital Management LLC; Director, Secretary and General Counsel, Invesco Investment Advisers LLC (formerly known as Van Kampen Asset Management); Secretary and General Counsel, Invesco Capital Markets, Inc. (formerly known as Van Kampen Funds Inc.) and Chief Legal Officer, PowerShares Exchange-Traded Fund Trust, PowerShares Exchange-Traded Fund Trust II, PowerShares India Exchange-Traded Fund Trust, PowerShares Actively Managed Exchange-Traded Fund Trust and PowerShares Actively Managed Exchange-Traded Commodity Fund Trust; Manager and Secretary, Invesco Indexing LLC
Formerly: Director, Secretary, General Counsel and Senior Vice President, Van Kampen Exchange Corp.; Director, Vice President and Secretary, IVZ Distributors, Inc. (formerly known as INVESCO Distributors, Inc.); Director and Vice President, INVESCO Funds Group, Inc.; Director and Vice President, Van Kampen Advisors Inc.; Director, Vice President, Secretary and General Counsel, Van Kampen Investor Services Inc.; Director, Invesco Distributors, Inc. (formerly known as Invesco AIM Distributors, Inc.); Director, Senior Vice President, General Counsel and Secretary, Invesco AIM Advisers, Inc. and Van Kampen Investments Inc.; Director, Vice President and Secretary, Fund Management Company; Director, Senior Vice President, Secretary, General Counsel and Vice President, Invesco AIM Capital Management, Inc.; Chief Operating Officer and General Counsel, Liberty Ridge Capital, Inc. (an investment adviser); Vice President and Secretary, PBHG Funds (an investment company) and PBHG Insurance Series Fund (an investment company); Chief Operating Officer, General Counsel and Secretary, Old Mutual Investment Partners (a broker-dealer); General Counsel and Secretary, Old Mutual Fund Services (an administrator) and Old Mutual Shareholder Services (a shareholder servicing center); Executive Vice President, General Counsel and Secretary, Old Mutual Capital, Inc. (an investment adviser); and Vice President and Secretary, Old Mutual Advisors Funds (an investment company) | N/A | N/A | ||||
Gregory G. McGreevey — 1962 Senior Vice President | 2012 | Senior Managing Director, Invesco Ltd.; Director, Chairman, President, and Chief Executive Officer, Invesco Advisers, Inc. (formerly known as Invesco Institutional (N.A.), Inc.) (registered investment adviser); Director, Invesco Mortgage Capital, Inc. and Invesco Senior Secured Management, Inc.; and Senior Vice President, The Invesco Funds
Formerly: Assistant Vice President, The Invesco Funds | N/A | N/A | ||||
Kelli Gallegos — 1970 Vice President, Principal Financial Officer and Assistant Treasurer | 2008 | Vice President, Principal Financial Officer and Assistant Treasurer, The Invesco Funds; Assistant Treasurer, Invesco PowerShares Capital Management LLC, PowerShares Exchange-Traded Fund Trust, PowerShares Exchange-Traded Fund Trust II, PowerShares India Exchange-Traded Fund Trust, PowerShares Actively Managed Exchange-Traded Fund Trust and PowerShares Actively Managed Exchange-Traded Commodity Fund Trust
Formerly: Assistant Vice President, The Invesco Funds | N/A | N/A |
T-3 Invesco Low Volatility Equity Yield Fund
Trustees and Officers—(continued)
| Name, Year of Birth and Position(s) Held with the Trust | Trustee and/ or Officer Since | Principal Occupation(s) During Past 5 Years | Number of Complex Overseen by Trustee | Other Directorship(s) Held by Trustee During | ||||
| Other Officers—(continued) | ||||||||
Tracy Sullivan — 1962 Vice President, Chief Tax Officer and Assistant Treasurer | 2008 | Vice President, Chief Tax Officer and Assistant Treasurer, The Invesco Funds; Assistant Treasurer, Invesco PowerShares Capital Management LLC, PowerShares Exchange-Traded Fund Trust, PowerShares Exchange-Traded Fund Trust II, PowerShares India Exchange-Traded Fund Trust, PowerShares Actively Managed Exchange-Traded Fund Trust and PowerShares Actively Managed Exchange-Traded Commodity Fund Trust
Formerly: Assistant Vice President, The Invesco Funds | N/A | N/A | ||||
Crissie M. Wisdom — 1969 Anti-Money Laundering Compliance Officer | 2013 | Anti-Money Laundering Compliance Officer, Invesco Advisers, Inc. (formerly known as Invesco Institutional (N.A.), Inc.) (registered investment adviser), Invesco Capital Markets, Inc. (formerly known as Van Kampen Funds Inc.), Invesco Distributors, Inc., Invesco Investment Services, Inc., Invesco Management Group, Inc., The Invesco Funds, and PowerShares Exchange-Traded Fund Trust, PowerShares Exchange-Traded Fund Trust II, PowerShares India Exchange-Traded Fund Trust, PowerShares Actively Managed Exchange-Traded Fund Trust and PowerShares Actively Managed Exchange-Traded Commodity Fund Trust; Anti-Money Laundering Compliance Officer and Bank Secrecy Act Officer, INVESCO National Trust Company and Invesco Trust Company; and Fraud Prevention Manager and Controls and Risk Analysis Manager for Invesco Investment Services, Inc.
Formerly: Anti-Money Laundering Compliance Officer, Van Kampen Exchange Corp. | N/A | N/A | ||||
Robert R. Leveille — 1969 Chief Compliance Officer | 2016 | Chief Compliance Officer, Invesco Advisers, Inc. (registered investment adviser); and Chief Compliance Officer, The Invesco Funds
Formerly: Chief Compliance Officer, Putnam Investments and the Putnam Funds | N/A | N/A |
The Statement of Additional Information of the Trust includes additional information about the Fund’s Trustees and is available upon request, without charge, by calling 1.800.959.4246. Please refer to the Fund’s Statement of Additional Information for information on the Fund’s sub-advisers.
Office of the Fund 11 Greenway Plaza, Suite 1000 Houston, TX 77046-1173 | Investment Adviser Invesco Advisers, Inc. 1555 Peachtree Street, N.E. Atlanta, GA 30309 | Distributor Invesco Distributors, Inc. 11 Greenway Plaza, Suite 1000 Houston, TX 77046-1173 | Auditors PricewaterhouseCoopers LLP 1000 Louisiana Street, Suite 5800 Houston, TX 77002-5678 | |||
Counsel to the Fund Stradley Ronon Stevens & Young, LLP 2005 Market Street, Suite 2600 Philadelphia, PA 19103-7018 | Counsel to the Independent Trustees Goodwin Procter LLP 901 New York Avenue, N.W. Washington, D.C. 20001 | Transfer Agent Invesco Investment Services, Inc. 11 Greenway Plaza, Suite 1000 Houston, TX 77046-1173 | Custodian State Street Bank and Trust Company 225 Franklin Street Boston, MA 02110-2801 | |||
T-4 Invesco Low Volatility Equity Yield Fund
Explore High-Conviction Investing with Invesco

Go paperless with eDelivery
Visit invesco.com/edelivery to enjoy the convenience and security of anytime electronic access to your investment documents.
With eDelivery, you can elect to have any or all of the following materials delivered straight to your inbox to download, save and print from your own computer:
| ∎ | Fund reports and prospectuses |
| ∎ | Quarterly statements |
| ∎ | Daily confirmations |
| ∎ | Tax forms |
Invesco mailing information
Send general correspondence to Invesco Investment Services, Inc., P.O. Box 219078, Kansas City, MO 64121-9078.
Important notice regarding delivery of security holder documents
To reduce Fund expenses, only one copy of most shareholder documents may be mailed to shareholders with multiple accounts at the same address (Householding). Mailing of your shareholder documents may be householded indefinitely unless you instruct us otherwise. If you do not want the mailing of these documents to be combined with those for other members of your household, please contact Invesco Investment Services, Inc. at 800 959 4246 or contact your financial institution. We will begin sending you individual copies for each account within 30 days after receiving your request.
Fund holdings and proxy voting information
The Fund provides a complete list of its holdings four times in each fiscal year, at the quarter ends. For the second and fourth quarters, the lists appear in the Fund’s semiannual and annual reports to shareholders. For the first and third quarters, the Fund files the lists with the Securities and Exchange Commission (SEC) on Form N-Q. The most recent list of portfolio holdings is available at invesco.com/completeqtrholdings. Shareholders can also look up the Fund’s Forms N-Q on the SEC website at sec.gov. Copies of the Fund’s Forms N-Q may be reviewed and copied at the SEC Public Reference Room in Washington, D.C. You can obtain information on the operation of the Public Reference Room, including information about duplicating fee charges, by calling 202 551 8090 or 800 732 0330, or by electronic request at the following email address: publicinfo@sec.gov. The SEC file numbers for the Fund are shown below.
A description of the policies and procedures that the Fund uses to determine how to vote proxies relating to portfolio securities is available without charge, upon request, from our Client Services department at 800 959 4246 or at invesco.com/proxyguidelines. The information is also available on the SEC website, sec.gov.
Information regarding how the Fund voted proxies related to its portfolio securities during the most recent 12-month period ended June 30 is available at invesco.com/proxysearch. The information is also available on the SEC website, sec.gov. Invesco Advisers, Inc. is an investment adviser; it provides investment advisory services to individual and institutional clients and does not sell securities. Invesco Distributors, Inc. is the US distributor for Invesco Ltd.’s retail mutual funds, exchange-traded funds and institutional money market funds. Both are wholly owned, indirect subsidiaries of Invesco Ltd. |  |
| SEC file numbers: 811-09913 and 333-36074 Invesco Distributors, Inc. | LVEY-AR-1 10202017 0924 |
| ||||
 | Annual Report to Shareholders
| August 31, 2017
| ||
| ||||
Invesco Pennsylvania Tax Free Income Fund
Nasdaq: A: VKMPX ◾ B: VKPAX ◾ C: VKPCX ◾ Y: VKPYX ◾ R6: VKPSX | ||||
| ||||

Letters to Shareholders
Philip Taylor | Dear Shareholders: This annual report includes information about your Fund, including performance data and a complete list of its investments as of the close of the reporting period. Inside is a discussion of how your Fund was managed and the factors that affected its performance during the reporting period. The reporting period began with stock market volatility in the US and abroad, largely the result of uncertainty about global economic growth and monetary policy. While economic data in the US were generally positive, news overseas was less upbeat. The European Central Bank and central banks in China and Japan – as well as other countries – maintained extraordinarily accommodative monetary policies in response to economic weakness. Citing generally positive economic data – specifically, realized and expected labor market conditions and inflation – the US Federal Reserve raised interest rates three times during the reporting period: in December 2016, and in March and June 2017. The major US stock market rally that began in |

November 2016 continued through the end of the reporting period, with major stock market indexes repeatedly hitting new record highs.
Short-term market volatility can prompt some investors to abandon their investment plans – and can cause others to settle for whatever returns the market has to offer. The investment professionals at Invesco, in contrast, invest with high conviction. This means that, no matter the asset class or the strategy, each investment team has a passion to exceed. We want to help investors achieve better outcomes, such as seeking higher returns, helping mitigate risk and generating income. Of course, investing with high conviction can’t guarantee a profit or ensure success; no investment strategy can. To learn more about how we invest with high conviction, visit invesco.com/HighConviction.
You, too, can invest with high conviction by maintaining a long-term investment perspective and by working with your financial adviser on a regular basis. During periods of short-term market volatility or uncertainty, your financial adviser can keep you focused on your long-term investment goals – a new home, a child’s college education or a secure retirement. He or she also can share research about the economy, the markets and individual investment options.
Visit our website for more information on your investments
Our website, invesco.com/us, offers a wide range of market insights and investment perspectives. On the website, you’ll find detailed information about our funds, including performance, holdings and portfolio manager commentaries. You can access information about your account by completing a simple, secure online registration. To do so, select “Log In” on the right side of the homepage, and then select “Register for Individual Account Access.”
In addition to the resources accessible on our website and through our mobile app, you can obtain timely updates to help you stay informed about the markets and the economy by connecting with Invesco on Twitter, LinkedIn or Facebook. You can access our blog at blog.invesco.us.com. Our goal is to provide you the information you want, when and where you want it.
Finally, I’m pleased to share with you Invesco’s commitment to both the Principles for Responsible Investment and to considering environmental, social and governance issues in our robust investment process. I invite you to learn more at invesco.com/esg.
Have questions?
For questions about your account, contact an Invesco client services representative at 800 959 4246. For Invesco-related questions or comments, please email me directly at phil@invesco.com.
All of us at Invesco look forward to serving your investment management needs. Thank you for investing with us.
Sincerely,

Philip Taylor
Senior Managing Director, Invesco Ltd.
2 Invesco Pennsylvania Tax Free Income Fund
Bruce Crockett | Dear Fellow Shareholders: Among the many important lessons I’ve learned in more than 40 years in a variety of business endeavors is the value of a trusted advocate. As independent chair of the Invesco Funds Board, I can assure you that the members of the Board are strong advocates for the interests of investors in Invesco’s mutual funds. We work hard to represent your interests through oversight of the quality of the investment management services your funds receive and other matters important to your investment, including but not limited to: ∎ Ensuring that Invesco offers a diverse lineup of mutual funds that your financial adviser can use to strive to meet your financial needs as your investment goals change over time. ∎ Monitoring how the portfolio management teams of the Invesco funds are performing in light of changing economic and market conditions. |

∎ Assessing each portfolio management team’s investment performance within the context of the investment strategy described in the fund’s prospectus.
∎ Monitoring for potential conflicts of interests that may impact the nature of the services that your funds receive.
We believe one of the most important services we provide our fund shareholders is the annual review of the funds’ advisory and sub-advisory contracts with Invesco Advisers and its affiliates. This review is required by the Investment Company Act of 1940 and focuses on the nature and quality of the services Invesco provides as the adviser to the Invesco funds and the reasonableness of the fees that it charges for those services. Each year, we spend months carefully reviewing information received from Invesco and a variety of independent sources, such as performance and fee data prepared by Lipper, Inc. (a subsidiary of Broadridge Financial Solutions, Inc.), an independent, third-party firm widely recognized as a leader in its field. We also meet with our independent legal counsel and other independent advisers to review and help us assess the information that we have received. Our goal is to assure that you receive quality investment management services for a reasonable fee.
I trust the measures outlined above provide assurance that you have a worthy advocate when it comes to choosing the Invesco Funds.
As always, please contact me at bruce@brucecrockett.com with any questions or concerns you may have. On behalf of the Board, we look forward to continuing to represent your interests and serving your needs.
Sincerely,

Bruce L. Crockett
Independent Chair
Invesco Funds Board of Trustees
3 Invesco Pennsylvania Tax Free Income Fund
Management’s Discussion of Fund Performance
Performance summary For the fiscal year ended August 31, 2017, Class A shares of Invesco Pennsylvania Tax Free Income Fund (the Fund), at net asset value (NAV), underperformed the S&P Municipal Bond Pennsylvania 5+ Year Investment Grade Index, the Fund’s style-specific benchmark. Your Fund’s long-term performance appears later in this report.
| ||
Fund vs. Indexes Total returns, 8/31/16 to 8/31/17, at net asset value (NAV). Performance shown does not include applicable contingent deferred sales charges (CDSC) or front-end sales charges, which would have reduced performance. | ||
Class A Shares | 0.18 | % | ||
Class B Shares | 0.19 | |||
Class C Shares | -0.57 | |||
Class Y Shares | 0.44 | |||
Class R6 Shares* | 0.26 | |||
S&P Municipal Bond Indexq (Broad Market Index) | 0.92 | |||
S&P Municipal Bond Pennsylvania 5+ Year Investment Grade Indexq (Style-Specific Index) | 1.17 | |||
Lipper Pennsylvania Municipal Debt Funds Index∎ (Peer Group Index) | 0.57 | |||
Source(s): qFactSet Research Systems Inc.; ∎Lipper Inc.
|
| |||
*Class R6 shares incepted on April 4, 2017. See page 7 for more information.
|
| |||
Market conditions and your Fund
Pennsylvania benefits from a highly diversified economy in terms of industries and different employment sectors. Its economy tends to track the national economy but with less volatility. The state’s economic performance is largely dependent on job growth. Pennsylvania is expected to add jobs at an average annual rate of 0.8% over the next several years based upon the state’s slow population growth as well as net migration.1 Pennsylvania’s population grew an estimated 0.6% between 2010 and 2016 to 12.8 million, lagging the country as a whole, which expanded 4.7%. The state ranks as the sixth most-populous state in the nation, just behind Illinois.2 Pennsylvania’s unemployment rate of 5.0% in July 2017 versus 4.3% for the US represented
a significant improvement over the past seven years from the 8.7% peak seen in April 2010.3 As of the close of the reporting period, the state’s general obligation bonds were rated AA- by Standard & Poor’s (S&P) and Fitch Ratings – and Aa3 by Moody’s. Moody’s and Fitch have assigned stable outlooks, while S&P has assigned a negative outlook.4
For the reporting period, investment grade municipal bonds, as measured by the S&P Municipal Bond Index, returned 0.92%. Investment grade Pennsylvania municipal bonds, as measured by the S&P Municipal Bond Pennsylvania 5+ Year Investment Grade Index, returned 1.17%. Both non-Pennsylvania and Pennsylvania investment grade municipal bonds managed to produce positive returns despite the sell-off following the presidential election in November 2016.
Positive investor sentiment regarding the future of the economy resulted in a risk on trade that led to a Treasury market sell-off, with municipals following closely behind. During the majority of the fiscal year, the municipal market benefited from a number of favorable technical factors, including a flattening yield curve, strong demand and an overall lower-than-expected supply of municipal securities.
Beginning in August 2016, issuance rose significantly; indeed, October issuance was the largest in municipal history, totaling $53.4 billion.5 A great deal of this issuance was a result of issuers anticipating potential year-end volatility related to the US presidential election and the December US Federal Reserve (the Fed) meeting. In September, the market posted its first negative monthly performance since June 2015.6 Overall, demand for municipals remained solid in the third quarter of 2016 and flows into the asset class were strong across all sectors of the municipal market. The close of the third quarter marked the 52nd consecutive week of positive flows into municipal bond mutual funds.7
Following the victory of President Trump, market sentiment shifted to the potential impact that comprehensive tax reform might have on municipal demand, contributing to the Treasury sell-off. As a result, municipals retraced most of 2016’s positive performance. However, in the first two months of 2017, municipals regained much of the ground they lost in the post-election sell-off, and fund flows turned positive once again.
Over the fiscal year, the Fed raised interest rates by a quarter point three times, initially in December 2016, and then again in March and June of 2017.8
| Portfolio Composition | ||||
By credit sector, based on total investments |
| |||
Revenue Bonds | 77.3 | % | ||
| Pre-refunded Bonds | 16.5 | |||
| General Obligation Bonds | 5.0 | |||
| Other | 1.2 | |||
| Top Five Debt Holdings | ||||||
| % of total net assets | ||||||
| 1. | Southcentral (Region of) General Authority (Wellspan Health Obligated Group); Series 2014 | 2.7 | % | |||
| 2. | Pennsylvania (Commonwealth of); First Series 2014 | 2.6 | ||||
| 3. | Pennsylvania (State of) Turnpike Commission; Series 2009 C | 2.0 | ||||
4. | Pennsylvania State University; Series 2016 A | 2.0 | ||||
| 5. | Geisinger Authority (Geisinger Health System); Series 2017 A-1 | 1.9 | ||||
Total Net Assets | $ | 130.0 million | ||
Total Number of Holdings | 154 | |||
The Fund’s holdings are subject to change, and there is no assurance that the Fund will continue to hold any particular security.
Data presented here are as of August 31, 2017.
4 Invesco Pennsylvania Tax Free Income Fund
Because the hikes were widely anticipated, the market reaction to these announcements was muted. Dominating municipal headlines were the budget impasse in Illinois, Chicago’s unfunded pension liabilities and Puerto Rico’s downward fiscal spiral. While worrisome, these developments were not enough to outweigh the positive impact of US economic performance during the reporting period, and in July, after over two years Illinois passed a budget which was supportive to municipal performance.
At the close of the reporting period, we believed the municipal bond market remained strong. Defaults and downgrades were muted, but it will take time to decipher the priorities and policies of the new administration, some of which may likely affect the municipal market.
Over the reporting period, the Fund’s security selection in non-rated bonds contributed to the Fund’s performance versus its style-specific benchmark. An overweight allocation to and security selection in higher education bonds also added to the Fund’s relative performance. Security selection in the life care sector aided the Fund’s relative performance, as did overweight exposure to short duration bonds (0.00-1.99 years). The Fund’s overweight exposure to prerefunded bonds detracted from performance versus its style-specific benchmark. Security selection in the dedicated tax sector and among industrial development revenue/pollution control revenue issues also detracted from the Fund’s relative performance over the fiscal year.
During the reporting period, leverage contributed to Fund performance. The Fund achieved a leveraged position through the use of inverse floating rate securities. The Fund uses leverage because we believe that, over time, leveraging provides opportunities for additional income and total return for shareholders. However, the use of leverage also can expose shareholders to additional volatility.
We wish to remind you that the Fund is subject to interest rate risk, meaning when interest rates rise, the value of fixed income securities tends to fall. This risk may be greater in the current market environment because interest rates are at or near historic lows. The degree to which the value of fixed income securities may decline due to rising interest rates may vary depending on the speed and magnitude of the increase in interest rates, as well as individual security characteristics such as price, maturity, duration and coupon and market forces such
as supply and demand for similar securities. We are monitoring interest rates, as well as the market, economic and geopolitical factors that may impact the direction, speed and magnitude of changes to interest rates across the maturity spectrum, including the potential impact of monetary policy changes by the Fed and certain foreign central banks. If interest rates rise, markets may experience increased volatility, which may affect the value and/or liquidity of certain of the Fund’s investments.
Thank you for investing in Invesco Pennsylvania Tax Free Income Fund and for sharing our long-term investment horizon.
| 1 | Source: Commonwealth of Pennsylvania |
| 2 | Source: US Census Bureau |
| 3 | Source: Bureau of Labor Statistics |
| 4 | Sources: Standard & Poor’s, Fitch Ratings, Moody’s. A credit rating is an assessment provided by a nationally recognized statistical rating organization (NRSRO) of the creditworthiness of an issuer with respect to debt obligations, including specific securities, money market instruments or other debts. Ratings are measured on a scale that generally ranges from AAA (highest) to D (lowest); ratings are subject to change without notice. “Non-Rated” indicates the debtor was not rated, and should not be interpreted as indicating low quality. For more information on rating methodology, please visit www.standardandpoors.com and select “Understanding Ratings” under Rating Resources on the homepage; www.fitchratings. com and select “Ratings Definitions” on the homepage; and www.moodys.com and select “Rating Methodologies” under Research and Ratings on the homepage. |
| 5 | Source: The Bond Buyer |
| 6 | Source: Standard & Poor’s |
| 7 | Source: Barclays |
| 8 | Source: US Federal Reserve |
The views and opinions expressed in management’s discussion of Fund performance are those of Invesco Advisers, Inc. These views and opinions are subject to change at any time based on factors such as market and economic conditions. These views and opinions may not be relied upon as investment advice or recommendations, or as an offer for a particular security. The information is not a complete analysis of every aspect of any market, country, industry, security or the Fund. Statements of fact are from sources considered reliable, but Invesco Advisers, Inc. makes no representation or warranty as to their completeness or accuracy. Although historical performance is no guarantee of future results, these insights may help you understand our investment management philosophy.
See important Fund and, if applicable, index disclosures later in this report.

Mark Paris
Portfolio Manager and Head of Portfolio Management and Trading for Invesco’s Municipal Bond Team, is manager of Invesco Pennsylvania Tax Free Income Fund. He joined Invesco in 2010. Mr. Paris earned a BBA in finance from Baruch College – The City University of New York.

Jack Connelly
Portfolio Manager, is manager of Invesco Pennsylvania Tax Free Income Fund. He joined Invesco in 2016. Mr. Connelly earned a BA in philosophy from Wheaton College and masters degrees from the University of Rhode Island and Yale University.

Tim O’Reilly
Portfolio Manager, is manager of Invesco Pennsylvania Tax Free Income Fund. He joined Invesco in 2010. Mr. O’Reilly earned a BS in finance from Eastern Illinois University and an MBA in finance from the University of Illinois at Chicago.

James Phillips
Portfolio Manager, is manager of Invesco Pennsylvania Tax Free Income Fund. He joined Invesco in 2010. Mr. Phillips earned a BA in American literature from Empire State College, the independent study division of the State University of New York, and an MBA in finance from the University at Albany, State University of New York.

Robert Stryker
Chartered Financial Analyst, Portfolio Manager, is manager of Invesco Pennsylvania Tax Free Income Fund. He joined Invesco in 2010. Mr. Stryker earned a BS in finance from the University of Illinois, Chicago.

Julius Williams
Portfolio Manager, is manager of Invesco Pennsylvania Tax Free Income Fund. He joined Invesco in 2010. Mr. Williams earned a BA in economics and sociology and a Master of Education degree in educational psychology from the University of Virginia.
5 Invesco Pennsylvania Tax Free Income Fund
Your Fund’s Long-Term Performance
Results of a $10,000 Investment – Oldest Share Class(es)
Fund and index data from 8/31/07
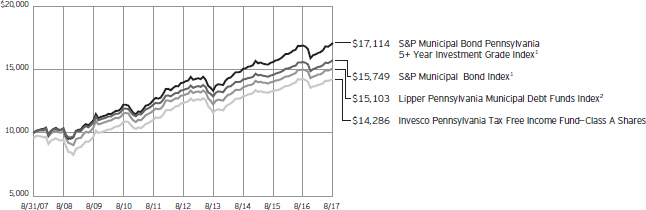
| 1 | Source: FactSet Research Systems Inc. |
| 2 | Source: Lipper Inc. |
Past performance cannot guarantee comparable future results.
The data shown in the chart include reinvested distributions, applicable sales charges and Fund expenses including
management fees. Index results include reinvested dividends, but they do not reflect sales charges. Performance of the peer group, if applicable, reflects fund expenses and management fees; performance
of a market index does not. Performance shown in the chart and table(s) does not reflect deduction of taxes a shareholder would pay on Fund distributions or sale of Fund shares.
continued from page 9
| ∎ | The Lipper Pennsylvania Municipal Debt Funds Index is an unmanaged index considered representative of funds that limit assets to those securities that are exempt from taxation in Pennsylvania. |
∎ The Fund is not managed to track the performance of any particular index, including the index(es) described here, and consequently, the performance of the Fund may deviate significantly from the performance of the index(es).
∎ A direct investment cannot be made in an index. Unless otherwise indicated, index results include reinvested dividends, and they do not reflect sales charges. Performance of the peer group, if applicable, reflects fund expenses; performance of a market index does not.
Other information
| ∎ | The returns shown in management’s discussion of Fund performance are based on net asset values (NAVs) calculated for shareholder transactions. Generally accepted accounting principles require adjustments to be made to the net assets of the Fund at period end for financial reporting purposes, and as such, the NAVs for shareholder transactions and the returns based on those NAVs may differ from the NAVs and returns reported in the Financial Highlights. |
6 Invesco Pennsylvania Tax Free Income Fund
Average Annual Total Returns |
| |||
As of 8/31/17, including maximum applicable sales charges |
| |||
Class A Shares | ||||
Inception (5/1/87) | 5.52 | % | ||
10 Years | 3.63 | |||
5 Years | 2.04 | |||
1 Year | -4.10 | |||
Class B Shares | ||||
Inception (5/3/93) | 4.16 | % | ||
10 Years | 3.97 | |||
5 Years | 2.58 | |||
1 Year | -4.66 | |||
Class C Shares | ||||
Inception (8/13/93) | 3.54 | % | ||
10 Years | 3.31 | |||
5 Years | 2.17 | |||
1 Year | -1.53 | |||
Class Y Shares | ||||
10 Years | 4.28 | % | ||
5 Years | 3.18 | |||
1 Year | 0.44 | |||
Class R6 Shares | ||||
10 Years | 4.09 | % | ||
5 Years | 2.95 | |||
1 Year | 0.26 | |||
Effective June 1, 2010, Class A, Class B and Class C shares of the predecessor fund, Van Kampen Pennsylvania Tax Free Income Fund, advised by Van Kampen Asset Management were reorganized into Class A, Class B and Class C shares, respectively, of Invesco Van Kampen Pennsylvania Tax Free Income Fund (renamed Invesco Pennsylvania Tax Free Income Fund). Returns shown above, prior to June 1, 2010, for Class A, Class B and Class C shares are blended returns of the predecessor fund and Invesco Pennsylvania Tax Free Income Fund. Share class returns will differ from the predecessor fund because of different expenses.
Class Y shares incepted on June 1, 2010. Performance shown prior to that date is that of the predecessor fund’s Class A shares and includes the 12b-1 fees applicable to Class A shares.
Class R6 shares incepted on April 4, 2017. Performance shown prior to that date is that of the Fund’s and the predecessor fund’s Class A shares and includes the 12b-1 fees applicable to Class A shares.
Average Annual Total Returns | ||
As of 6/30/17, the most recent calendar quarter end,including maximum applicable sales charges | ||
Class A Shares | ||
Inception (5/1/87) | 5.51% | |
10 Years | 3.29 | |
5 Years | 2.22 | |
1 Year | -5.19 | |
Class B Shares | ||
Inception (5/3/93) | 4.13% | |
10 Years | 3.61 | |
5 Years | 2.77 | |
1 Year | -5.82 | |
Class C Shares | ||
Inception (8/13/93) | 3.52% | |
10 Years | 2.98 | |
5 Years | 2.36 | |
1 Year | -2.67 | |
Class Y Shares | ||
10 Years | 3.94% | |
5 Years | 3.38 | |
1 Year | -0.78 | |
Class R6 Shares | ||
10 Years | 3.75% | |
5 Years | 3.12 | |
1 Year | -0.94 | |
The performance data quoted represent past performance and cannot guarantee comparable future results; current performance may be lower or higher. Please visit invesco.com/performance for the most recent month-end performance. Performance figures reflect reinvested distributions, changes in net asset value and the effect of the maximum sales charge unless otherwise stated. Investment return and principal value will fluctuate so that you may have a gain or loss when you sell shares.
The total annual Fund operating expense ratio set forth in the most recent Fund prospectus as of the date of this report for Class A, Class B, Class C, Class Y and Class R6 shares was 1.08%, 1.08%, 1.83%, 0.83% and 0.80%, respectively. The expense ratios presented above may vary from the expense ratios presented in other sections of this report that are based on expenses incurred during the period covered by this report.
Class A share performance reflects the maximum 4.25% sales charge, and Class B and Class C share performance reflects the applicable contingent deferred sales charge (CDSC) for the period involved. For shares purchased prior to June 1, 2010, the CDSC on Class B shares declines from 4% at the time of purchase to 0% at the beginning of the seventh year. For shares purchased on or after June 1, 2010, the CDSC on Class B shares declines from 5% at the time of purchase to 0% at the beginning of the seventh year. The CDSC on Class C shares is 1% for the first year after purchase. Class Y and Class R6 shares do not have a front-end sales charge or a CDSC; therefore, performance is at net asset value.
The performance of the Fund’s share classes will differ primarily due to different sales charge structures and class expenses.
Fund performance reflects any applicable fee waivers and/or expense reimbursements. Had the adviser not waived fees and/or reimbursed expenses currently or in the past, returns would have been lower. See current prospectus for more information.
7 Invesco Pennsylvania Tax Free Income Fund
Invesco Pennsylvania Tax Free Income Fund’s investment objective is to provide only Pennsylvania investors with a high level of current income exempt from federal and Pennsylvania state income taxes and, where possible under local law, local income and personal property taxes, through investment in a varied portfolio of medium- and lower-grade municipal securities.
| ∎ | Unless otherwise stated, information presented in this report is as of August 31, 2017, and is based on total net assets. |
| ∎ | Unless otherwise noted, all data provided by Invesco. |
| ∎ | To access your Fund’s reports/prospectus, visit invesco.com/fundreports. |
About share classes
| ∎ | Class B shares may not be purchased for new or additional investments. Please see the prospectus for more information. |
| ∎ | Class Y shares are available to only certain investors. Please see the prospectus for more information. |
| ∎ | Class R6 shares are available for use by retirement plans that meet certain standards and for institutional investors. Class R6 shares are also available through intermediaries that have established an agreement with Invesco Distributors, Inc. to make such shares availale for use in retail omnibus accounts. Please see the prospectus for more information. |
Principal risks of investing
in the Fund
| ∎ | Alternative minimum tax risk. A portion of the Fund’s otherwise tax-exempt income may be taxable to those shareholders subject to the federal alternative minimum tax. |
| ∎ | Changing fixed income market conditions risk. The current low interest rate environment was created in part by the Federal Reserve Board (FRB) and certain foreign central banks keeping the federal funds and equivalent foreign rates near, at or below zero. Increases in the federal funds and equivalent foreign rates may expose fixed income markets to heightened volatility and reduced liquidity for certain fixed income investments, particularly those with longer maturities. In addition, decreases in fixed income dealer market-making capacity may also potentially lead to heightened volatility and reduced liquidity in the fixed income markets. As a result, the value of the Fund’s investments and share price may decline. Changes in central bank policies could also result in higher than normal shareholder redemptions, which could potentially increase portfolio turnover and the Fund’s transaction costs. |
| ∎ | Debt securities risk. The prices of debt securities held by the Fund will be affected by changes in interest rates, the creditworthiness of the issuer and other factors. An increase in prevailing interest rates typically causes the value of existing debt securities to fall and often has a greater impact on longer duration debt securities and higher quality debt securities. Falling interest rates will cause the Fund to reinvest the proceeds of debt securities that have been repaid by the issuer at lower interest rates. Falling interest rates may also reduce the Fund’s distributable income because interest payments on floating rate debt instruments held by the Fund will decline. The Fund could lose money on investments in debt securities if the issuer or borrower fails to meet its obligations to make interest payments and/or to repay principal in a timely manner. Changes in an issuer’s financial strength, the market’s perception of such strength or in the credit rating of the issuer or the security may affect the value of debt securities. The Adviser’s credit analysis may fail to anticipate such changes, which could result in buying a debt security at an inopportune time or failing to sell a debt security in advance of a price decline or other credit event. |
| ∎ | Derivatives risk. The value of a derivative instrument depends largely on (and is derived from) the value of an underlying security, currency, commodity, interest rate, index or other asset (each referred to as an underlying asset). In addition to risks relating to the underlying assets, the use of derivatives may include other, possibly greater, risks, including counterparty, leverage and liquidity risks. Counterparty risk is the risk that the counterparty to the derivative contract will default on its obligation to pay the Fund the amount owed or otherwise perform under the derivative contract. Derivatives create leverage risk because they do not require payment up front equal to the economic exposure created by |
owning the derivative. As a result, an adverse change in the value of the underlying asset could result in the Fund sustaining a loss that is substantially greater than the amount invested in the derivative, which may make the Fund’s returns more volatile and increase the risk of loss. Derivative instruments may also be less liquid than more traditional investments and the Fund may be unable to sell or close out its derivative positions at a desirable time or price. This risk may be more acute under adverse market conditions, during which the Fund may be most in need of liquidating its derivative positions. Derivatives may also be harder to value, less tax efficient and subject to changing government regulation that could impact the Fund’s ability to use certain derivatives or their cost. Also, derivatives used for hedging or to gain or limit exposure to a particular market segment may not provide the expected benefits, particularly during adverse market conditions. |
| ∎ | High yield debt securities (junk bond) risk. Investments in high yield debt securities (“junk bonds”) and other lower-rated securities will subject the Fund to substantial risk of loss. These securities are considered to be speculative with respect to the issuer’s ability to pay interest and principal when due, are more susceptible to default or decline in market value and are less liquid than investment grade debt securities. Prices of high yield debt securities tend to be very volatile. |
| ∎ | Inverse floating rate obligations risk. The price of inverse floating rate obligations (inverse floaters) is expected to decline when interest rates rise, and generally will decline further than the price of a bond with a similar maturity. The price of inverse floaters is typically more volatile than the price of bonds with similar maturities. These risks can be particularly high if leverage is used in the formula that determines the |
This report must be accompanied or preceded by a currently effective Fund prospectus, which contains more complete information, including sales charges and expenses. Investors should read it carefully before investing.
|
| NOT FDIC INSURED | MAY LOSE VALUE | NO BANK GUARANTEE |
8 Invesco Pennsylvania Tax Free Income Fund
| interest payable by the inverse floater, which may make the Fund’s returns more volatile and increase the risk of loss. Additionally, these securities may lose some or all of their principal and, in some cases, the Fund could lose money in excess of its investment. |
| ∎ | Liquidity risk. The Fund may be unable to sell illiquid investments at the time or price it desires and, as a result, could lose its entire investment in such investments. Liquid securities can become illiquid during periods of market stress. If a significant amount of the Fund’s securities become illiquid, the Fund may not be able to timely pay redemption proceeds and may need to sell securities at significantly reduced prices. |
| ∎ | Management risk. The Fund is actively managed and depends heavily on the Adviser’s judgment about markets, interest rates or the attractiveness, relative values, liquidity, or potential appreciation of particular investments made for the Fund’s portfolio. The Fund could experience losses if these judgments prove to be incorrect. Additionally, legislative, regulatory, or tax developments may adversely affect management of the Fund and, therefore, the ability of the Fund to achieve its investment objective. |
| ∎ | Market risk. The market values of the Fund’s investments, and therefore the value of the Fund’s shares, will go up and down, sometimes rapidly or unpredictably. Market risk may affect a single issuer, industry or section of the economy, or it may affect the market as a whole. Individual stock prices tend to go up and down more dramatically than those of certain other types of investments, such as bonds. During a general downturn in the financial markets, multiple asset classes may decline in value. When markets perform well, there can be no assurance that specific investments held by the Fund will rise in value. |
| ∎ | Medium- and lower-grade municipal securities risk. Medium- and lower-grade municipal securities generally involve more volatility and greater risks, including credit, market, liquidity and management risks, than higher-grade securities. Furthermore, many issuers of medium- and lower-grade securities choose not to have a rating assigned to their obligations. As such, the Fund’s portfolio may consist of a higher portion of unrated securities than an investment company investing solely in higher-grade securities. Unrated securities may not be as |
attractive to as many buyers as are rated securities, which may have the effect of limiting the Fund’s ability to sell such securities at their fair value. |
| ∎ | Money market fund risk. Although money market funds generally seek to preserve the value of an investment at $1.00 per share, the Fund may lose money by investing in money market funds. A money market fund’s sponsor has no legal obligation to provide financial support to the money market fund. The credit quality of a money market fund’s holdings can change rapidly in certain markets, and the default of a single holding could have an adverse impact on the money market fund’s share price. A money market fund’s share price can also be negatively affected during periods of high redemption pressures, illiquid markets and/or significant market volatility. Furthermore, amendments to money market fund regulations could impact a money market fund’s operations and possibly negatively impact its return. |
| ∎ | Municipal issuer focus risk. The municipal issuers in which the Fund invests may be located in the same geographic area or may pay their interest obligations from revenue of similar projects, such as hospitals, airports, utility systems and housing finance agencies. This may make the Fund’s investments more susceptible to similar social, economic, political or regulatory occurrences, making the Fund more susceptible to experience a drop in its share price than if the Fund had been more diversified across issuers that did not have similar characteristics. |
| ∎ | Municipal securities risk. The risk of a municipal obligation generally depends on the financial and credit status of the issuer. Constitutional amendments, legislative enactments, executive orders, administrative regulations, voter initiatives, and the issuer’s regional economic conditions may affect the municipal security’s value, interest payments, repayment of principal and the Fund’s ability to sell the security. Failure of a municipal security issuer to comply with applicable tax requirements may make income paid thereon taxable, resulting in a decline in the security’s value. In addition, there could be changes in applicable tax laws or tax treatments that reduce or eliminate the current federal income tax exemption on municipal securities or otherwise adversely affect the current federal or state tax status of municipal securities. |
| ∎ | Pennsylvania and US territories municipal securities risk. The Fund is more susceptible to political, economic, regulatory or other factors affecting issuers of Pennsylvania municipal securities than a fund that does not focus its investments in such issuers. As with Pennsylvania municipal securities, events in any of the territories where the Fund is invested may affect the Fund’s investments and its performance. |
| ∎ | Variable-rate demand notes risk. The absence of an active secondary market for certain variable and floating rate notes could make it difficult to dispose of these instruments, which could result in a loss. |
| ∎ | When-issued, delayed delivery and forward commitment risks. When-issued and delayed delivery transactions subject the Fund to market risk because the value or yield of a security at delivery may be more or less than the purchase price or yield generally available when delivery occurs, and counterparty risk because the Fund relies on the buyer or seller, as the case may be, to consummate the transaction. These transactions also have a leveraging effect on the Fund because the Fund commits to purchase securities that it does not have to pay for until a later date, which increases the Fund’s overall investment exposure and, as a result, its volatility. |
| ∎ | Zero coupon or pay-in-kind securities risk. The value, interest rates, and liquidity of non-cash paying instruments, such as zero coupon and pay-in-kind securities, are subject to greater fluctuation than other types of securities. The higher yields and interest rates on pay-in-kind securities reflect the payment deferral and increased credit risk associated with such instruments and that such investments may represent a higher credit risk than loans that periodically pay interest. |
About indexes used in this report
| ∎ | The S&P Municipal Bond Index is a broad, market value-weighted index that seeks to measure the performance of the US municipal bond market. |
| ∎ | The S&P Municipal Bond Pennsylvania 5+ Year Investment Grade Index is a sub-set of the broad S&P Municipal Bond Index. This index of market value-weighted investment grade US municipal bonds seeks to measure the performance of Pennsylvania-issued US municipals whose maturities are equal to or greater than five years. |
continued on page 6
9 Invesco Pennsylvania Tax Free Income Fund
Schedule of Investments
August 31, 2017
| Interest Rate | Maturity Date | Principal Amount (000) | Value | |||||||||||||
Municipal Obligations–108.28% |
| |||||||||||||||
| Pennsylvania–103.17% | ||||||||||||||||
Allegheny (County of) Higher Education Building Authority (Chatham University); Series 2012 A, University RB | 5.00 | % | 09/01/2035 | $ | 1,000 | $ | 1,073,000 | |||||||||
Allegheny (County of) Higher Education Building Authority (Duquesne University); |
| |||||||||||||||
Series 1998, Ref. University RB (INS–AMBAC)(a) | 5.50 | % | 03/01/2020 | 1,420 | 1,516,077 | |||||||||||
Series 2011 A, University RB(b)(c) | 5.50 | % | 03/01/2021 | 550 | 635,135 | |||||||||||
Allegheny (County of) Higher Education Building Authority (Robert Morris University); Series 2008 A, University RB(b)(c) | 6.00 | % | 10/15/2018 | 1,000 | 1,058,300 | |||||||||||
Allegheny (County of) Hospital Development Authority (University of Pittsburgh Medical Center); Series 2009, RB | 5.63 | % | 08/15/2039 | 1,250 | 1,344,462 | |||||||||||
Allegheny (County of) Industrial Development Authority (Residential Resources, Inc.); Series 2006, Lease RB | 5.10 | % | 09/01/2026 | 980 | 981,078 | |||||||||||
Allegheny (County of) Sanitary Authority; Series 2015, Ref. RB(d) | 5.00 | % | 12/01/2045 | 2,120 | 2,404,546 | |||||||||||
Allegheny (County of); Series 2008 C-61, Unlimited Tax GO Bonds(b)(c) | 5.00 | % | 12/01/2018 | 500 | 526,080 | |||||||||||
Allentown Neighborhood Improvement Zone Development Authority (City Center); Series 2017, Tax RB(e) | 5.00 | % | 05/01/2022 | 325 | 359,661 | |||||||||||
Beaver (County of) Industrial Development Authority (FirstEnergy Generation); Series 2008 B, Ref. PCR(b) | 4.25 | % | 04/01/2021 | 545 | 536,449 | |||||||||||
Beaver (County of) Industrial Development Authority; Series 2008 A, Ref. PCR(b) | 2.70 | % | 04/02/2018 | 230 | 112,672 | |||||||||||
Beaver (County of); | ||||||||||||||||
Series 2009, Unlimited Tax GO Notes(b)(c) | 5.55 | % | 11/15/2017 | 1,325 | 1,338,210 | |||||||||||
Series 2009, Unlimited Tax GO Notes(b)(c) | 5.55 | % | 11/15/2017 | 65 | 65,648 | |||||||||||
Berks (County of) Industrial Development Authority (One Douglassville); Series 2007 A, Ref. RB(f) | 6.13 | % | 11/01/2034 | 415 | 422,756 | |||||||||||
Berks (County of) Municipal Authority (Reading Hospital Medical Center); Series 2012 A, RB | 5.00 | % | 11/01/2040 | 1,000 | 1,089,630 | |||||||||||
Bethlehem (City of); | ||||||||||||||||
Series 2014, Gtd. Ref. Water RB (INS–BAM)(a) | 5.00 | % | 11/15/2030 | 425 | 482,014 | |||||||||||
Series 2014, Gtd. Ref. Water RB (INS–BAM)(a) | 5.00 | % | 11/15/2031 | 425 | 480,981 | |||||||||||
Bethlehem Area School District; Series 2010, Unlimited Tax GO Bonds(b)(c) | 5.25 | % | 01/15/2020 | 1,000 | 1,101,080 | |||||||||||
Central Bradford Progress Authority (Guthrie Healthcare System); Series 2011, RB | 5.38 | % | 12/01/2041 | 1,100 | 1,236,169 | |||||||||||
Centre (County of) Hospital Authority (Mt. Nittany Medical Center); | ||||||||||||||||
Series 2011, RB(b)(c) | 6.25 | % | 11/15/2021 | 500 | 605,765 | |||||||||||
Series 2016 A, Ref. RB | 5.00 | % | 11/15/2046 | 500 | 559,500 | |||||||||||
Chartiers Valley Industrial & Commercial Development Authority (Asbury Health Center); Series 2006, Ref. First Mortgage RB | 5.75 | % | 12/01/2022 | 900 | 901,863 | |||||||||||
Chester (County of) Industrial Development Authority (Avon Grove Charter School); Series 2017 A, Ref. RB | 5.00 | % | 12/15/2051 | 770 | 816,362 | |||||||||||
Chester (County of) Industrial Development Authority (Renaissance Academy Charter School); Series 2014, RB | 5.00 | % | 10/01/2044 | 1,000 | 1,069,390 | |||||||||||
Chester (County of) Industrial Development Authority (University Student Housing, LLC at West Chester University of Pennsylvania); Series 2013, Student Housing RB | 5.00 | % | 08/01/2045 | 750 | 796,043 | |||||||||||
Cumberland (County of) Municipal Authority (Asbury Pennsylvania Obligated Group); Series 2010, RB | 6.00 | % | 01/01/2040 | 870 | 905,783 | |||||||||||
Cumberland (County of) Municipal Authority (Association of Independent Colleges & Universities of Pennsylvania Financing Program-Dickinson College); Series 2009, RB | 5.00 | % | 11/01/2039 | 750 | 794,340 | |||||||||||
Cumberland (County of) Municipal Authority (Diakon Lutheran Ministries); Series 2015, Ref. RB | 5.00 | % | 01/01/2038 | 1,270 | 1,381,087 | |||||||||||
Cumberland (County of) Municipal Authority (Messiah Village); Series 2008 A, RB | 5.63 | % | 07/01/2028 | 1,000 | 1,025,200 | |||||||||||
Dauphin (County of) General Authority (Pinnacle Health System); |
| |||||||||||||||
Series 2009, Health System RB | 6.00 | % | 06/01/2036 | 340 | 367,863 | |||||||||||
Series 2009, Ref. Health System RB(b)(c) | 6.00 | % | 06/01/2019 | 1,875 | 2,041,556 | |||||||||||
Series 2016 A, Ref. Health System RB | 5.00 | % | 06/01/2034 | 510 | 582,899 | |||||||||||
Delaware (County of) Authority (Haverford College); Series 2017 A, Ref. RB | 5.00 | % | 10/01/2042 | 655 | 759,839 | |||||||||||
Delaware (County of) Authority (Neumann College); Series 2008, College RB(b)(c) | 6.25 | % | 10/01/2018 | 110 | 116,446 | |||||||||||
See accompanying Notes to Financial Statements which are an integral part of the financial statements.
10 Invesco Pennsylvania Tax Free Income Fund
| Interest Rate | Maturity Date | Principal Amount (000) | Value | |||||||||||||
| Pennsylvania–(continued) | ||||||||||||||||
Delaware (County of) Authority (Villanova University); Series 2015, RB | 5.00 | % | 08/01/2045 | $ | 215 | $ | 243,477 | |||||||||
Delaware (County of) Industrial Development Authority (Covanta); Series 2015, Ref. RB | 5.00 | % | 07/01/2043 | 425 | 428,642 | |||||||||||
Delaware River Port Authority (Port District); | ||||||||||||||||
Series 2012, Ref. RB | 5.00 | % | 01/01/2025 | 540 | 599,162 | |||||||||||
Series 2012, Ref. RB | 5.00 | % | 01/01/2027 | 535 | 590,822 | |||||||||||
Delaware River Port Authority; Series 2010 D, RB | 5.00 | % | 01/01/2040 | 1,000 | 1,081,140 | |||||||||||
Delaware Valley Regional Financial Authority; Series 2002, RB | 5.75 | % | 07/01/2032 | 1,000 | 1,292,340 | |||||||||||
Doylestown (City of) Hospital Authority; Series 2013 A, RB (INS–AGM)(a) | 5.00 | % | 07/01/2024 | 1,000 | 1,156,040 | |||||||||||
East Hempfield (Township of) Industrial Development Authority (Student Services Inc. Student Housing); | ||||||||||||||||
Series 2013, RB | 5.00 | % | 07/01/2035 | 500 | 535,425 | |||||||||||
Series 2014, RB | 5.00 | % | 07/01/2039 | 250 | 267,273 | |||||||||||
East Hempfield (Township of) Industrial Development Authority (Willow Valley Communities); | ||||||||||||||||
Series 2016, Ref. RB | 5.00 | % | 12/01/2030 | 210 | 241,049 | |||||||||||
Series 2016, Ref. RB | 5.00 | % | 12/01/2039 | 370 | 413,105 | |||||||||||
Erie (City of) Higher Education Building Authority (Mercyhurst College); Series 2008, | 5.50 | % | 09/15/2018 | 500 | 523,875 | |||||||||||
Franklin (County of) Industrial Development Authority (Chambersburg Hospital); Series 2010, RB | 5.38 | % | 07/01/2042 | 1,000 | 1,086,430 | |||||||||||
Fulton (County of) Industrial Development Authority (The Fulton County Medical Center); Series 2016, Ref. Hospital RB | 5.00 | % | 07/01/2040 | 1,515 | 1,560,708 | |||||||||||
Geisinger Authority (Geisinger Health System); | ||||||||||||||||
Series 2011 A-1, Health System RB | 5.13 | % | 06/01/2041 | 500 | 542,945 | |||||||||||
Series 2017 A-1, Ref. Health System RB(d) | 5.00 | % | 02/15/2045 | 2,190 | 2,524,851 | |||||||||||
Lancaster (County of) Hospital Authority (Brethren Village); Series 2017, Ref. RB | 5.13 | % | 07/01/2037 | 1,135 | 1,251,984 | |||||||||||
Lancaster (County of) Hospital Authority (Landis Homes Retirement Community); Series 2015, Ref. Health Center RB | 5.00 | % | 07/01/2045 | 625 | 668,813 | |||||||||||
Lancaster (County of) Hospital Authority (Masonic Villages); Series 2015, Ref. RB | 5.00 | % | 11/01/2035 | 210 | 236,573 | |||||||||||
Lancaster (County of) Hospital Authority (University of Pennsylvania); Series 2016 A, Ref. Health System RB | 5.00 | % | 08/15/2042 | 535 | 616,662 | |||||||||||
Lehigh (County of) General Purpose Authority (Bible Fellowship Church Homes, Inc.); Series 2013, RB | 5.25 | % | 07/01/2042 | 825 | 853,727 | |||||||||||
Lehigh (County of) General Purpose Authority (Kidspeace Obligation Group); | ||||||||||||||||
Series 2014 A, RB | 7.50 | % | 02/01/2044 | 668 | 677,160 | |||||||||||
Series 2014 B, Conv. CAB RB(g) | 7.50 | % | 02/01/2044 | 172 | 66,231 | |||||||||||
Series 2014 C, RB(h) | 0.00 | % | 02/01/2044 | 516 | 5 | |||||||||||
Luzerne (County of) Convention Center Authority; Series 1998 A, VRD Hotel Room Rental Tax RB (LOC–PNC Bank, N.A.)(i)(j) | 0.78 | % | 09/01/2028 | 950 | 950,000 | |||||||||||
Lycoming (County of) Authority (Pennsylvania College of Technology); Series 2011, RB | 5.00 | % | 07/01/2030 | 750 | 828,383 | |||||||||||
Lycoming (County of) Authority (Susquehanna Health System); Series 2009 A, Heath System RB | 5.75 | % | 07/01/2039 | 1,250 | 1,350,187 | |||||||||||
Montgomery (County of) Higher Education & Health Authority (Abington Memorial Hospital Obligated Group); Series 2012, RB | 5.00 | % | 06/01/2031 | 1,400 | 1,549,828 | |||||||||||
Montgomery (County of) Higher Education & Health Authority (Holy Redeemer Health System); Series 2014, Ref. RB | 5.00 | % | 10/01/2027 | 390 | 441,492 | |||||||||||
Montgomery (County of) Industrial Development Authority (ACTS Retirement-Life Communities, Inc.); | ||||||||||||||||
Series 2009 A-1, RB(b)(c) | 6.25 | % | 11/15/2019 | 1,000 | 1,115,680 | |||||||||||
Series 2012, Ref. RB | 5.00 | % | 11/15/2028 | 900 | 991,233 | |||||||||||
Montgomery (County of) Industrial Development Authority (Albert Einstein Healthcare); Series 2015, Ref. Health System RB | 5.25 | % | 01/15/2045 | 850 | 917,218 | |||||||||||
Montgomery (County of) Industrial Development Authority (Philadelphia Presbytery Homes, Inc.); Series 2010, RB | 6.63 | % | 12/01/2030 | 1,500 | 1,719,495 | |||||||||||
Montgomery (County of) Industrial Development Authority (Whitemarsh Community); Series 2008, Mortgage RB(b)(c) | 7.00 | % | 02/01/2018 | 500 | 512,815 | |||||||||||
Northampton (County of) General Purpose Authority (LaFayette College); Series 2017, Ref. Hospital Facilities RB(d) | 5.00 | % | 11/01/2047 | 1,635 | 1,910,269 | |||||||||||
Northampton (County of) General Purpose Authority (Lehigh University); Series 2009, Higher Education RB(b)(c) | 5.50 | % | 05/15/2019 | 1,000 | 1,078,740 | |||||||||||
See accompanying Notes to Financial Statements which are an integral part of the financial statements.
11 Invesco Pennsylvania Tax Free Income Fund
| Interest Rate | Maturity Date | Principal Amount (000) | Value | |||||||||||||
| Pennsylvania–(continued) | ||||||||||||||||
Northampton (County of) General Purpose Authority (St. Luke’s Hospital); Series 2008 A, Hospital RB(b)(c) | 5.50 | % | 08/15/2018 | $ | 1,000 | $ | 1,044,670 | |||||||||
Northampton (County of) General Purpose Authority (St. Luke’s University Health Network); Series 2016, Ref. Hospital RB | 5.00 | % | 08/15/2036 | 330 | 372,639 | |||||||||||
Northampton (County of) Industrial Development Authority (Morningstar Senior Living, Inc.); Series 2012, RB | 5.00 | % | 07/01/2032 | 920 | 948,594 | |||||||||||
Pennsylvania (Commonwealth of); First Series 2014, Unlimited Tax GO Bonds(d) | 5.00 | % | 06/15/2034 | 3,000 | 3,407,340 | |||||||||||
Pennsylvania (State of) Economic Development Financing Agency (Forum Place); Series 2012, Governmental Lease RB | 5.00 | % | 03/01/2034 | 500 | 553,340 | |||||||||||
Pennsylvania (State of) Economic Development Financing Authority (Amtrak); Series 2012 A, Ref. Exempt Facilities RB(f) | 5.00 | % | 11/01/2041 | 1,200 | 1,316,436 | |||||||||||
Pennsylvania (State of) Economic Development Financing Authority (Capital Region Parking System); Series 2013, Jr. Parking System RB | 6.00 | % | 07/01/2053 | 920 | 1,093,806 | |||||||||||
Pennsylvania (State of) Economic Development Financing Authority (National Gypson Co.); Series 2014, Ref. Exempt Facilities RB(f) | 5.50 | % | 11/01/2044 | 635 | 683,355 | |||||||||||
Pennsylvania (State of) Economic Development Financing Authority (PA Bridges Finco L.P.); Series 2015, RB(f) | 5.00 | % | 12/31/2034 | 1,235 | 1,403,812 | |||||||||||
Pennsylvania (State of) Economic Development Financing Authority (Philadelphia Biosolids Facility); Series 2009, Sewage Sludge Disposal RB | 6.25 | % | 01/01/2032 | 1,000 | 1,061,510 | |||||||||||
Pennsylvania (State of) Economic Development Financing Authority (Waste Management, Inc.); Series 2004 A, Solid Waste Disposal RB(b) | 1.50 | % | 05/01/2018 | 1,500 | 1,503,435 | |||||||||||
Pennsylvania (State of) Higher Educational Facilities Authority (AICUP Financing Program-Del Valley College); Series 2012, RB | 5.00 | % | 11/01/2042 | 535 | 528,173 | |||||||||||
Pennsylvania (State of) Higher Educational Facilities Authority (Edinboro University Foundation); |
| |||||||||||||||
Series 2008, RB(b)(c) | 5.88 | % | 07/01/2018 | 750 | 781,800 | |||||||||||
Series 2010, RB(b)(c) | 6.00 | % | 07/01/2020 | 500 | 569,055 | |||||||||||
Pennsylvania (State of) Higher Educational Facilities Authority (La Salle University); Series 2012, RB | 5.00 | % | 05/01/2042 | 1,180 | 1,259,485 | |||||||||||
Pennsylvania (State of) Higher Educational Facilities Authority (Shippensburg University Student Services); Series 2012, RB | 5.00 | % | 10/01/2035 | 1,300 | 1,373,307 | |||||||||||
Pennsylvania (State of) Higher Educational Facilities Authority (St. Joseph’s University); Series 2010 A, RB | 5.00 | % | 11/01/2034 | 500 | 548,640 | |||||||||||
Pennsylvania (State of) Higher Educational Facilities Authority (Temple University); First Series 2012, RB | 5.00 | % | 04/01/2042 | 570 | 632,900 | |||||||||||
Pennsylvania (State of) Higher Educational Facilities Authority (Thomas Jefferson University); Series 2015, Ref. RB | 5.25 | % | 09/01/2050 | 845 | 951,293 | |||||||||||
Pennsylvania (State of) Turnpike Commission; |
| |||||||||||||||
Series 2008 B-1, Sub. RB(b)(c) | 5.50 | % | 06/01/2018 | 1,000 | 1,035,320 | |||||||||||
Series 2009 C, Sub. RB (INS–AGM)(a) | 6.25 | % | 06/01/2033 | 2,000 | 2,600,700 | |||||||||||
Series 2009 E, Sub. Conv. CAB RB(g) | 6.38 | % | 12/01/2038 | 1,435 | 1,792,372 | |||||||||||
Series 2010 A-1, Motor License Fund Special RB | 5.00 | % | 12/01/2038 | 500 | 537,190 | |||||||||||
Subseries 2010 A-2, Motor License Fund Special RB | 5.50 | % | 12/01/2034 | 820 | 917,219 | |||||||||||
Subseries 2010 A-2, Sub. Motor License Fund Special RB(b)(c) | 5.50 | % | 12/01/2020 | 180 | 206,158 | |||||||||||
Subseries 2010 B-2, Motor License Fund Special RB(b)(c) | 5.00 | % | 12/01/2020 | 235 | 265,397 | |||||||||||
Subseries 2010 B-2, Sub. RB | 5.13 | % | 12/01/2035 | 500 | 548,220 | |||||||||||
Subseries 2010 B-2, Sub. Special Turnpike RB(b)(c) | 5.00 | % | 12/01/2020 | 125 | 141,040 | |||||||||||
Subseries 2010 B-2, Sub. Special Turnpike RB | 5.00 | % | 12/01/2030 | 265 | 289,420 | |||||||||||
Subseries 2017 B-1, Turnpike RB | 5.25 | % | 06/01/2047 | 1,000 | 1,161,390 | |||||||||||
Pennsylvania State University; |
| |||||||||||||||
Series 2016 A, RB(d) | 5.00 | % | 09/01/2041 | 2,195 | 2,578,730 | |||||||||||
Series 2016 A, RB | 5.00 | % | 09/01/2041 | 970 | 1,139,575 | |||||||||||
Philadelphia (City of) (1998 General Ordinance); Fifteenth Series 2017, Ref. Gas Works RB | 5.00 | % | 08/01/2047 | 750 | 862,545 | |||||||||||
Philadelphia (City of) Authority for Industrial Development (The Children’s Hospital of Philadelphia); Series 2014 A, Hospital RB(d) | 5.00 | % | 07/01/2042 | 1,500 | 1,736,205 | |||||||||||
Philadelphia (City of) Authority for Industrial Development (Wesley Enhanced Living Obligated Group); Series 2017, Ref. Sr. Living Facilities RB | 5.00 | % | 07/01/2042 | 1,000 | 1,050,680 | |||||||||||
See accompanying Notes to Financial Statements which are an integral part of the financial statements.
12 Invesco Pennsylvania Tax Free Income Fund
| Interest Rate | Maturity Date | Principal Amount (000) | Value | |||||||||||||
| Pennsylvania–(continued) | ||||||||||||||||
Philadelphia (City of) Hospitals & Higher Education Facilities Authority (Jefferson Health System); Series 2010 B, RB(b)(c) | 5.00 | % | 05/15/2020 | $ | 1,500 | $ | 1,659,105 | |||||||||
Philadelphia (City of) Industrial Development Authority (Architecture & Design Charter High School); Series 2013, RB | 6.13 | % | 03/15/2043 | 585 | 616,198 | |||||||||||
Philadelphia (City of) Industrial Development Authority (Discovery Charter School); Series 2012, RB | 6.25 | % | 04/01/2042 | 1,000 | 1,045,800 | |||||||||||
Philadelphia (City of) Industrial Development Authority (First Philadelphia Preparatory Charter School); Series 2014 A, RB | 7.00 | % | 06/15/2033 | 875 | 1,012,751 | |||||||||||
Philadelphia (City of) Industrial Development Authority (Independence Charter School); Series 2007 A, RB | 5.50 | % | 09/15/2037 | 1,235 | 1,236,680 | |||||||||||
Philadelphia (City of) Industrial Development Authority (Kipp Philadelphia Charter School); Series 2016 B, RB | 5.00 | % | 04/01/2046 | 640 | 652,557 | |||||||||||
Philadelphia (City of) Industrial Development Authority (MaST Charter School); Series 2010, RB(b)(c) | 6.00 | % | 08/01/2020 | 700 | 800,534 | |||||||||||
Philadelphia (City of) Industrial Development Authority (Mast I Charter School); Series 2016 A, Ref. RB | 5.25 | % | 08/01/2046 | 1,500 | 1,547,655 | |||||||||||
Philadelphia (City of) Industrial Development Authority (New Foundations Charter School); Series 2012, RB | 6.63 | % | 12/15/2041 | 750 | 851,753 | |||||||||||
Philadelphia (City of) Industrial Development Authority (Performing Arts Charter School); Series 2013, RB(e) | 6.50 | % | 06/15/2033 | 945 | 1,011,074 | |||||||||||
Philadelphia (City of); | ||||||||||||||||
Ninth Series 2010, Gas Works RB(b)(c) | 5.25 | % | 08/01/2020 | 390 | 437,865 | |||||||||||
Ninth Series 2010, Gas Works RB | 5.25 | % | 08/01/2040 | 610 | 669,194 | |||||||||||
Series 2009 A, Ref. Unlimited Tax GO Bonds(b)(c) | 5.50 | % | 08/01/2019 | 110 | 119,618 | |||||||||||
Series 2009 A, Ref. Unlimited Tax GO Bonds (INS–AGC)(a) | 5.50 | % | 08/01/2024 | 890 | 966,175 | |||||||||||
Series 2010 C, Water & Wastewater RB(b)(c) | 5.00 | % | 08/01/2020 | 970 | 1,082,093 | |||||||||||
Series 2010 C, Water & Wastewater RB (INS–AGM)(a) | 5.00 | % | 08/01/2035 | 280 | 305,858 | |||||||||||
Series 2011, Unlimited Tax GO Bonds(b)(c) | 6.00 | % | 08/01/2020 | 500 | 572,120 | |||||||||||
Series 2017, Ref. Unlimited Tax GO Bonds | 5.00 | % | 08/01/2041 | 880 | 1,005,629 | |||||||||||
Series 2017 A, Ref. Unlimited Tax GO Bonds | 5.00 | % | 08/01/2036 | 700 | 805,042 | |||||||||||
Series 2017 A, Water & Wastewater RB(d) | 5.25 | % | 10/01/2052 | 2,070 | 2,450,756 | |||||||||||
Philadelphia (State of) Authority for Industrial Development (Cultural and Commercials Corridors); Series 2016, Ref. City Agreement RB | 5.00 | % | 12/01/2031 | 840 | 963,976 | |||||||||||
Philadelphia (State of) Authority for Industrial Development (Temple University); First Series 2015, Ref. RB | 5.00 | % | 04/01/2045 | 530 | 600,252 | |||||||||||
Philadelphia School District; | ||||||||||||||||
Series 2007 A, Ref. Unlimited Tax GO Bonds (INS–NATL)(a) | 5.00 | % | 06/01/2025 | 535 | 617,754 | |||||||||||
Series 2008 E, Limited Tax GO Bonds(b)(c) | 5.13 | % | 09/01/2018 | 1,230 | 1,282,496 | |||||||||||
Series 2008 E, Limited Tax GO Bonds (INS–BHAC)(a) | 5.13 | % | 09/01/2023 | 270 | 281,321 | |||||||||||
Pittsburgh (City of) & Allegheny (County of) Sports & Exhibition Authority (Regional Asset District); Series 2010, Ref. Sales Tax RB (INS–AGM)(a) | 5.00 | % | 02/01/2031 | 1,000 | 1,094,200 | |||||||||||
Pittsburgh (City of) Water & Sewer Authority; Series 2013 A, Ref. First Lien RB | 5.00 | % | 09/01/2031 | 500 | 576,770 | |||||||||||
Southcentral (Region of) General Authority (Wellspan Health Obligated Group); Series 2014, Ref. RB(d) | 5.00 | % | 06/01/2044 | 3,180 | 3,537,123 | |||||||||||
State Public School Building Authority (Harrisburg School District); | ||||||||||||||||
Series 2009, RB(b)(c) | 5.00 | % | 05/15/2019 | 165 | 176,510 | |||||||||||
Series 2009, RB(b)(c) | 5.00 | % | 05/15/2019 | 670 | 716,739 | |||||||||||
Series 2009, RB(b)(c) | 5.00 | % | 05/15/2019 | 165 | 176,570 | |||||||||||
Series 2016 A, Ref. RB (INS–AGM)(a) | 5.00 | % | 12/01/2030 | 1,055 | 1,255,650 | |||||||||||
Susquehanna Area Regional Airport Authority; Series 2012 A, Airport System RB(f) | 5.00 | % | 01/01/2027 | 1,185 | 1,276,719 | |||||||||||
Union (County of) Hospital Authority (Evangelical Community Hospital); Series 2011, Ref. & Improvement RB | 7.00 | % | 08/01/2041 | 1,000 | 1,142,770 | |||||||||||
Washington (County of) Industrial Development Authority (Washington Jefferson College); Series 2010, College RB | 5.25 | % | 11/01/2030 | 500 | 544,480 | |||||||||||
Washington (County of) Redevelopment Authority (Victory Centre Tanger Outlet Development); Series 2006 A, Tax Allocation RB | 5.45 | % | 07/01/2035 | 1,295 | 1,295,311 | |||||||||||
Westmoreland (County of) Industrial Development Authority (Excela Health); Series 2005 A, VRD Health System RB (LOC–PNC Bank, N.A.)(i)(j) | 0.78 | % | 07/01/2027 | 715 | 715,000 | |||||||||||
See accompanying Notes to Financial Statements which are an integral part of the financial statements.
13 Invesco Pennsylvania Tax Free Income Fund
| Interest Rate | Maturity Date | Principal Amount (000) | Value | |||||||||||||
| Pennsylvania–(continued) | ||||||||||||||||
Westmoreland (County of) Municipal Authority; Series 2013, RB | 5.00 | % | 08/15/2031 | $ | 750 | $ | 853,590 | |||||||||
Wilkes-Barre (City of) Finance Authority (University of Scranton); Series 2010, RB | 5.00 | % | 11/01/2040 | 850 | 931,039 | |||||||||||
| 134,094,141 | ||||||||||||||||
| Guam–3.94% | ||||||||||||||||
Guam (Territory of) (Section 30); |
| |||||||||||||||
Series 2009 A, Limited Obligation RB(b)(c) | 5.75 | % | 12/01/2019 | 1,250 | 1,384,663 | |||||||||||
Series 2016 A, Ref. Limited Obligation RB | 5.00 | % | 12/01/2046 | 500 | 550,495 | |||||||||||
Guam (Territory of) Power Authority; | ||||||||||||||||
Series 2010 A, RB | 5.50 | % | 10/01/2040 | 410 | 433,878 | |||||||||||
Series 2012 A, Ref. RB | 5.00 | % | 10/01/2034 | 520 | 553,280 | |||||||||||
Guam (Territory of) Waterworks Authority; | ||||||||||||||||
Series 2010, Water & Wastewater System RB | 5.63 | % | 07/01/2040 | 1,000 | 1,067,100 | |||||||||||
Series 2014 A, Ref. Water & Wastewater System RB | 5.00 | % | 07/01/2029 | 285 | 315,794 | |||||||||||
Guam (Territory of); Series 2011 A, Business Privilege Tax RB | 5.13 | % | 01/01/2042 | 785 | 823,120 | |||||||||||
| 5,128,330 | ||||||||||||||||
| Virgin Islands–1.17% | ||||||||||||||||
Virgin Islands (Government of) Port Authority; Series 2014 A, Ref. Marine RB(f) | 5.00 | % | 09/01/2029 | 575 | 611,788 | |||||||||||
Virgin Islands (Government of) Public Finance Authority (Matching Fund Loan Note �� Diageo); Series 2009 A, Sub. RB | 6.63 | % | 10/01/2029 | 640 | 500,077 | |||||||||||
Virgin Islands (Government of) Public Finance Authority (Matching Fund Loan Note); | 5.00 | % | 10/01/2025 | 500 | 411,886 | |||||||||||
| 1,523,751 | ||||||||||||||||
TOTAL INVESTMENTS IN SECURITIES (k)–108.28% (Cost $132,419,665) | 140,746,222 | |||||||||||||||
FLOATING RATE NOTE OBLIGATIONS–(9.25)% | ||||||||||||||||
Notes with interest and fee rates ranging from 1.31% to 1.34% at 08/31/2017 and maturities of collateral ranging from 06/15/2034 to 10/01/2052 (See Note 1J)(l) | (12,030,000 | ) | ||||||||||||||
OTHER ASSETS LESS LIABILITIES–0.97% | 1,262,074 | |||||||||||||||
NET ASSETS–100.00% | $ | 129,978,296 | ||||||||||||||
Investment Abbreviations:
| AGC | – Assured Guaranty Corp. | |
| AGM | – Assured Guaranty Municipal Corp. | |
| AMBAC | – American Municipal Bond Assurance Corp. | |
| BAM | – Build America Mutual Assurance Co. | |
| BHAC | – Berkshire Hathaway Assurance Corp. | |
| CAB | – Capital Appreciation Bonds | |
| Conv. | – Convertible |
| GO | – General Obligation | |
| Gtd. | – Guaranteed | |
| INS | – Insurer | |
| Jr. | – Junior | |
| LOC | – Letter of Credit | |
| NATL | – National Public Finance Guarantee Corp. | |
| PCR | – Pollution Control Revenue Bonds |
| RB | – Revenue Bonds | |
| Ref. | – Refunding | |
| Sr. | – Senior | |
| Sub. | – Subordinated | |
| VRD | – Variable Rate Demand |
Notes to Schedule of Investments:
| (a) | Principal and/or interest payments are secured by the bond insurance company listed. |
| (b) | Security has an irrevocable call by the issuer or mandatory put by the holder. Maturity date reflects such call or put. |
| (c) | Advance refunded; secured by an escrow fund of U.S. Government obligations or other highly rated collateral. |
| (d) | Underlying security related to TOB Trusts entered into by the Fund. See Note 1J. |
| (e) | Security purchased or received in a transaction exempt from registration under the Securities Act of 1933, as amended (the “1933 Act”). The security may be resold pursuant to an exemption from registration under the 1933 Act, typically to qualified institutional buyers. The aggregate value of these securities at August 31, 2017 was $1,370,735, which represented 1.05% of the Fund’s Net Assets. |
| (f) | Security subject to the alternative minimum tax. |
| (g) | Convertible CAB. The interest rate shown represents the coupon rate at which the bond will accrue at a specified future date. |
| (h) | Zero coupon bond issued at a discount. |
| (i) | Demand security payable upon demand by the Fund at specified time intervals no greater than thirteen months. Interest rate is redetermined periodically based on current market interest rates. Rate shown is the rate in effect on August 31, 2017. |
| (j) | Principal and interest payments are fully enhanced by a letter of credit from the bank listed or a predecessor bank, branch or subsidiary. |
| (k) | Entities may either issue, guarantee, back or otherwise enhance the credit quality of a security. The entities are not primarily responsible for the issuer’s obligation but may be called upon to satisfy issuers obligations. No concentration of any single entity was greater than 5% each. |
| (l) | Floating rate note obligations related to securities held. The interest and fee rates shown reflect the rates in effect at August 31, 2017. At August 31, 2017, the Fund’s investments with a value of $20,549,811 are held by TOB Trusts and serve as collateral for the $12,030,000 in the floating rate note obligations outstanding at that date. |
See accompanying Notes to Financial Statements which are an integral part of the financial statements.
14 Invesco Pennsylvania Tax Free Income Fund
Statement of Assets and Liabilities
August 31, 2017
Assets: |
| |||
Investments in securities, at value (Cost $132,419,665) | $ | 140,746,222 | ||
Receivable for: | ||||
Investments sold | 50,000 | |||
Fund shares sold | 40,647 | |||
Interest | 1,558,962 | |||
Investment for trustee deferred compensation and retirement plans | 37,511 | |||
Other assets | 51,355 | |||
Total assets | 142,484,697 | |||
Liabilities: |
| |||
Floating rate note obligations | 12,030,000 | |||
Payable for: | ||||
Dividends | 115,750 | |||
Fund shares reacquired | 20,941 | |||
Amount due custodian | 204,244 | |||
Accrued fees to affiliates | 56,871 | |||
Accrued trustees’ and officers’ fees and benefits | 2,933 | |||
Accrued other operating expenses | 34,727 | |||
Trustee deferred compensation and retirement plans | 40,935 | |||
Total liabilities | 12,506,401 | |||
Net assets applicable to shares outstanding | $ | 129,978,296 | ||
Net assets consist of: |
| |||
Shares of beneficial interest | $ | 126,361,599 | ||
Undistributed net investment income | 493,449 | |||
Undistributed net realized gain (loss) | (5,203,309 | ) | ||
Net unrealized appreciation | 8,326,557 | |||
| $ | 129,978,296 | |||
Net Assets: |
| |||
Class A | $ | 112,323,977 | ||
Class B | $ | 414,032 | ||
Class C | $ | 10,325,005 | ||
Class Y | $ | 6,905,104 | ||
Class R6 | $ | 10,178 | ||
Shares outstanding, no par value, |
| |||
Class A | 6,813,538 | |||
Class B | 25,065 | |||
Class C | 625,595 | |||
Class Y | 418,436 | |||
Class R6 | 617 | |||
Class A: | ||||
Net asset value per share | $ | 16.49 | ||
Maximum offering price per share | ||||
(Net asset value of $16.49 ¸ 95.75%) | $ | 17.22 | ||
Class B: | ||||
Net asset value and offering price per share | $ | 16.52 | ||
Class C: | ||||
Net asset value and offering price per share | $ | 16.50 | ||
Class Y: | ||||
Net asset value and offering price per share | $ | 16.50 | ||
Class R6: | ||||
Net asset value and offering price per share | $ | 16.50 | ||
See accompanying Notes to Financial Statements which are an integral part of the financial statements.
15 Invesco Pennsylvania Tax Free Income Fund
Statement of Operations
For the year ended August 31, 2017
Investment income: |
| |||
Interest | $ | 6,119,075 | ||
Expenses: | ||||
Advisory fees | 651,831 | |||
Administrative services fees | 50,000 | |||
Custodian fees | 4,908 | |||
Distribution fees: | ||||
Class A | 281,834 | |||
Class B | 1,567 | |||
Class C | 109,905 | |||
Interest, facilities and maintenance fees | 201,601 | |||
Transfer agent fees — A, B, C and Y | 104,038 | |||
Transfer agent fees — R6 | 4 | |||
Trustees’ and officers’ fees and benefits | 23,006 | |||
Registration and filing fees | 62,313 | |||
Reports to shareholders | 37,553 | |||
Professional services fees | 62,071 | |||
Other | 33,098 | |||
Total expenses | 1,623,729 | |||
Less: Expense offset arrangement(s) | (607 | ) | ||
Net expenses | 1,623,122 | |||
Net investment income | 4,495,953 | |||
Realized and unrealized gain (loss) from: | ||||
Net realized gain (loss) from investment securities | (490,985 | ) | ||
Change in net unrealized appreciation (depreciation) of investment securities | (4,007,934 | ) | ||
Net realized and unrealized gain (loss) | (4,498,919 | ) | ||
Net increase (decrease) in net assets resulting from operations | $ | (2,966 | ) | |
See accompanying Notes to Financial Statements which are an integral part of the financial statements.
16 Invesco Pennsylvania Tax Free Income Fund
Statement of Changes in Net Assets
For the years ended August 31, 2017 and 2016
| 2017 | 2016 | |||||||
Operations: | ||||||||
Net investment income | $ | 4,495,953 | $ | 4,348,697 | ||||
Net realized gain (loss) | (490,985 | ) | (50,928 | ) | ||||
Change in net unrealized appreciation (depreciation) | (4,007,934 | ) | 4,641,602 | |||||
Net increase (decrease) in net assets resulting from operations | (2,966 | ) | 8,939,371 | |||||
Distributions to shareholders from net investment income: | ||||||||
Class A | (3,712,913 | ) | (4,085,069 | ) | ||||
Class B | (20,705 | ) | (42,461 | ) | ||||
Class C | (278,434 | ) | (286,482 | ) | ||||
Class Y | (205,077 | ) | (139,754 | ) | ||||
Class R6 | (147 | ) | — | |||||
Total distributions from net investment income | (4,217,276 | ) | (4,553,766 | ) | ||||
Share transactions–net: | ||||||||
Class A | (2,860,960 | ) | 2,612,797 | |||||
Class B | (641,536 | ) | (193,642 | ) | ||||
Class C | (720,873 | ) | 1,576,180 | |||||
Class Y | 2,654,589 | 908,445 | ||||||
Class R6 | 10,000 | — | ||||||
Net increase (decrease) in net assets resulting from share transactions | (1,558,780 | ) | 4,903,780 | |||||
Net increase (decrease) in net assets | (5,779,022 | ) | 9,289,385 | |||||
Net assets: | ||||||||
Beginning of year | 135,757,318 | 126,467,933 | ||||||
End of year (includes undistributed net investment income of $493,449 and $363,542, respectively) | $ | 129,978,296 | $ | 135,757,318 | ||||
Notes to Financial Statements
August 31, 2017
NOTE 1—Significant Accounting Policies
Invesco Pennsylvania Tax Free Income Fund (the “Fund”) is a series portfolio of AIM Counselor Series Trust (Invesco Counselor Series Trust) (the “Trust”). The Trust is a Delaware statutory trust registered under the Investment Company Act of 1940, as amended (the “1940 Act”), as an open-end series management investment company consisting of fourteen separate portfolios, each authorized to issue an unlimited number of shares of beneficial interest. The assets, liabilities and operations of each portfolio are accounted for separately. Information presented in these financial statements pertains only to the Fund. Matters affecting each portfolio or class will be voted on exclusively by the shareholders of such portfolio or class.
The Fund’s investment objective is to provide only Pennsylvania investors with a high level of current income exempt from federal and Pennsylvania state income taxes and, where possible under local law, local income and personal property taxes, through investment in a varied portfolio of medium- and lower-grade municipal securities.
The Fund currently consists of five different classes of shares: Class A, Class B, Class C, Class Y and Class R6. On April 4, 2017, the Fund began offering Class R6 shares. Class Y shares are available only to certain investors. Class A shares are sold with a front-end sales charge unless certain waiver criteria are met and under certain circumstances load waived shares may be subject to contingent deferred sales charges (“CDSC”). Class C shares are sold with a CDSC. Class Y and Class R6 shares are sold at net asset value. Effective November 30, 2010, new or additional investments in Class B shares are no longer permitted. Existing shareholders of Class B shares may continue to reinvest dividends and capital gains distributions in Class B shares until they convert to Class A shares. Also, shareholders in Class B shares will be able to exchange those shares for Class B shares of other Invesco Funds offering such shares until they convert to Class A shares. Generally, Class B shares will automatically convert to Class A shares on or about the month-end, which is at least eight years after the date of purchase. Redemption of Class B shares prior to the conversion date will be subject to a CDSC.
The Fund is an investment company and accordingly follows the investment company accounting and reporting guidance in accordance with Financial Accounting Standards Board Accounting Standards Codification Topic 946, Financial Services — Investment Companies.
The following is a summary of the significant accounting policies followed by the Fund in the preparation of its financial statements.
| A. | Security Valuations — Securities, including restricted securities, are valued according to the following policy. |
Securities are fair valued using an evaluated quote provided by an independent pricing service approved by the Board of Trustees. Evaluated quotes provided by the pricing service may be determined without exclusive reliance on quoted prices, and may reflect appropriate factors such as institution-size trading in similar groups of securities, developments related to specific securities, dividend rate (for unlisted equities), yield
17 Invesco Pennsylvania Tax Free Income Fund
(for debt obligations), quality, type of issue, coupon rate (for debt obligations), maturity (for debt obligations), individual trading characteristics and other market data. Pricing services generally value debt obligations assuming orderly transactions of institutional round lot size, but a Fund may hold or transact in the same securities in smaller, odd lot sizes. Odd lots often trade at lower prices than institutional round lots. Debt obligations are subject to interest rate and credit risks. In addition, all debt obligations involve some risk of default with respect to interest and/or principal payments.
Securities for which market quotations either are not readily available or became unreliable are valued at fair value as determined in good faith by or under the supervision of the Trust’s officers following procedures approved by the Board of Trustees. Some of the factors which may be considered in determining fair value are fundamental analytical data relating to the investment; the nature and duration of any restrictions on transferability or disposition; trading in similar securities by the same issuer or comparable companies; relevant political, economic or issuer specific news; and other relevant factors under the circumstances.
The Fund may invest in securities that are subject to interest rate risk, meaning the risk that the prices will generally fall as interest rates rise and, conversely, the prices will generally rise as interest rates fall. Specific securities differ in their sensitivity to changes in interest rates depending on their individual characteristics. Changes in interest rates may result in increased market volatility, which may affect the value and/or liquidity of certain Fund investments.
Valuations change in response to many factors including the historical and prospective earnings of the issuer, the value of the issuer’s assets, general economic conditions, interest rates, investor perceptions and market liquidity. Because of the inherent uncertainties of valuation, the values reflected in the financial statements may materially differ from the value received upon actual sale of those investments.
| B. | Securities Transactions and Investment Income — Securities transactions are accounted for on a trade date basis. Realized gains or losses on sales are computed on the basis of specific identification of the securities sold. Interest income (net of withholding tax, if any) is recorded on the accrual basis from settlement date. Bond premiums and discounts are amortized and/or accreted over the lives of the respective securities. Pay-in-kind income received in the form of securities in-lieu of cash is recorded as interest income. Dividend income (net of withholding tax, if any) is recorded on the ex-dividend date. |
The Fund may periodically participate in litigation related to Fund investments. As such, the Fund may receive proceeds from litigation settlements. Any proceeds received are included in the Statement of Operations as realized gain (loss) for investments no longer held and as unrealized gain (loss) for investments still held.
Brokerage commissions and mark ups are considered transaction costs and are recorded as an increase to the cost basis of securities purchased and/or a reduction of proceeds on a sale of securities. Such transaction costs are included in the determination of net realized and unrealized gain (loss) from investment securities reported in the Statement of Operations and the Statement of Changes in Net Assets and the net realized and unrealized gains (losses) on securities per share in the Financial Highlights. Transaction costs are included in the calculation of the Fund’s net asset value and, accordingly, they reduce the Fund’s total returns. These transaction costs are not considered operating expenses and are not reflected in net investment income reported in the Statement of Operations and the Statement of Changes in Net Assets, or the net investment income per share and the ratios of expenses and net investment income reported in the Financial Highlights, nor are they limited by any expense limitation arrangements between the Fund and the investment adviser.
The Fund allocates realized and unrealized capital gains and losses to a class based on the relative net assets of each class. The Fund allocates income to a class based on the relative value of the settled shares of each class.
| C. | Country Determination — For the purposes of making investment selection decisions and presentation in the Schedule of Investments, the investment adviser may determine the country in which an issuer is located and/or credit risk exposure based on various factors. These factors include the laws of the country under which the issuer is organized, where the issuer maintains a principal office, the country in which the issuer derives 50% or more of its total revenues and the country that has the primary market for the issuer’s securities, as well as other criteria. Among the other criteria that may be evaluated for making this determination are the country in which the issuer maintains 50% or more of its assets, the type of security, financial guarantees and enhancements, the nature of the collateral and the sponsor organization. Country of issuer and/or credit risk exposure has been determined to be the United States of America, unless otherwise noted. |
| D. | Distributions — Distributions from net investment income, if any, are declared daily and paid monthly. Distributions from net realized capital gain, if any, are generally declared and paid annually and recorded on the ex-dividend date. The Fund may elect to treat a portion of the proceeds from redemptions as distributions for federal income tax purposes. |
| E. | Federal Income Taxes — The Fund intends to comply with the requirements of Subchapter M of the Internal Revenue Code of 1986, as amended (the “Internal Revenue Code”), necessary to qualify as a regulated investment company and to distribute substantially all of the Fund’s taxable and tax-exempt earnings to shareholders. As such, the Fund will not be subject to federal income taxes on otherwise taxable income (including net realized capital gain) that is distributed to shareholders. Therefore, no provision for federal income taxes is recorded in the financial statements. |
The Fund recognizes the tax benefits of uncertain tax positions only when the position is more likely than not to be sustained. Management has analyzed the Fund’s uncertain tax positions and concluded that no liability for unrecognized tax benefits should be recorded related to uncertain tax positions. Management is not aware of any tax positions for which it is reasonably possible that the total amounts of unrecognized tax benefits will change materially in the next 12 months.
In addition, the Fund intends to invest in such municipal securities to allow it to qualify to pay shareholders “exempt-interest dividends”, as defined in the Internal Revenue Code.
The Fund files tax returns in the U.S. Federal jurisdiction and certain other jurisdictions. Generally, the Fund is subject to examinations by such taxing authorities for up to three years after the filing of the return for the tax period.
| F. | Expenses — Fees provided for under the Rule 12b-1 plan of a particular class of the Fund and which are directly attributable to that class are charged to the operations of such class. Transfer agency fees and expenses and other shareholder recordkeeping fees and expenses attributable to Class R6 are charged to such class. Transfer agency fees and expenses and other shareholder recordkeeping fees and expenses relating to all other classes are allocated among those classes based on relative net assets. All other expenses are allocated among the classes based on relative net assets. |
| G. | Interest, Facilities and Maintenance Fees — Interest, Facilities and Maintenance Fees include interest and related borrowing costs such as commitment fees and other expenses associated with lines of credit and interest and administrative expenses related to establishing and maintaining floating rate note obligations, if any. |
18 Invesco Pennsylvania Tax Free Income Fund
| H. | Accounting Estimates — The preparation of financial statements in conformity with accounting principles generally accepted in the United States of America (“GAAP”) requires management to make estimates and assumptions that affect the reported amounts of assets and liabilities at the date of the financial statements and the reported amounts of revenues and expenses during the reporting period including estimates and assumptions related to taxation. Actual results could differ from those estimates by a significant amount. In addition, the Fund monitors for material events or transactions that may occur or become known after the period-end date and before the date the financial statements are released to print. |
| I. | Indemnifications — Under the Trust’s organizational documents, each Trustee, officer, employee or other agent of the Trust is indemnified against certain liabilities that may arise out of the performance of their duties to the Fund. Additionally, in the normal course of business, the Fund enters into contracts, including the Fund’s servicing agreements, that contain a variety of indemnification clauses. The Fund’s maximum exposure under these arrangements is unknown as this would involve future claims that may be made against the Fund that have not yet occurred. The risk of material loss as a result of such indemnification claims is considered remote. |
| J. | Floating Rate Note Obligations — The Fund invests in inverse floating rate securities, such as Tender Option Bonds (“TOBs”), for investment purposes and to enhance the yield of the Fund. Such securities may be purchased in the secondary market without first owning an underlying bond but generally are created through the sale of fixed rate bonds by the Fund to special purpose trusts established by a broker dealer or by the Fund (“TOB Trusts”) in exchange for cash and residual interests in the TOB Trusts’ assets and cash flows, which are in the form of inverse floating rate securities. The TOB Trusts finance the purchases of the fixed rate bonds by issuing floating rate notes to third parties and allowing the Fund to retain residual interests in the bonds. The floating rate notes issued by the TOB Trusts have interest rates that reset weekly and the floating rate note holders have the option to tender their notes to the TOB Trusts for redemption at par at each reset date. The residual interests held by the Fund (inverse floating rate securities) include the right of the Fund (1) to cause the holders of the floating rate notes to tender their notes at par at the next interest rate reset date, and (2) to transfer the municipal bond from the TOB Trust to the Fund, thereby collapsing the TOB Trust. Inverse floating rate securities tend to underperform the market for fixed rate bonds in a rising interest rate environment, but tend to outperform the market for fixed rate bonds when interest rates decline or remain relatively stable. |
The Fund generally invests in inverse floating rate securities that include embedded leverage, thus exposing the Fund to greater risks and increased costs. The primary risks associated with inverse floating rate securities are varying degrees of liquidity and decreases in the value of such securities in response to changes in interest rates to a greater extent than fixed rate securities having similar credit quality, redemption provisions and maturity, which may cause the Fund’s net asset value to be more volatile than if it had not invested in inverse floating rate securities. In certain instances, the short-term floating rate notes created by the TOB Trust may not be able to be sold to third parties or, in the case of holders tendering (or putting) such notes for repayment of principal, may not be able to be remarketed to third parties. In such cases, the TOB Trust holding the fixed rate bonds may be collapsed with the entity that contributed the fixed rate bonds to the TOB Trust. In the case where a TOB Trust is collapsed with the Fund, the Fund will be required to repay the principal amount of the tendered securities, which may require the Fund to sell other portfolio holdings to raise cash to meet that obligation. The Fund could therefore be required to sell other portfolio holdings at a disadvantageous time or price to raise cash to meet this obligation, which risk will be heightened during times of market volatility, illiquidity or uncertainty. The embedded leverage in the TOB Trust could cause the Fund to lose more money than the value of the asset it has contributed to the TOB Trust and greater levels of leverage create the potential for greater losses. In addition, a Fund may enter into reimbursement agreements with the liquidity provider of certain TOB transactions in connection with certain residuals held by the Fund. These agreements commit a Fund to reimburse the liquidity provider to the extent that the liquidity provider must provide cash to a TOB Trust, including following the termination of a TOB Trust resulting from a mandatory tender event (“liquidity shortfall”). The reimbursement agreement will effectively make the Fund liable for the amount of the negative difference, if any, between the liquidation value of the underlying security and the purchase price of the floating rate notes issued by the TOB Trust.
The Fund accounts for the transfer of fixed rate bonds to the TOB Trusts as secured borrowings, with the securities transferred remaining in the Fund’s investment assets, and the related floating rate notes reflected as Fund liabilities under the caption Floating rate note obligations on the Statement of Assets and Liabilities. The carrying amount of the Fund’s Floating rate note obligations as reported on the Statement of Assets and Liabilities approximates its fair value. The Fund records the interest income from the fixed rate bonds under the caption Interest and records the expenses related to floating rate obligations and any administrative expenses of the TOB Trusts as a component of Interest, facilities and maintenance fees on the Statement of Operations.
Final rules implementing section 619 of the Dodd-Frank Wall Street Reform and Consumer Protection Act (the “Volcker Rule”) prohibit banking entities from engaging in proprietary trading of certain instruments and limit such entities’ investments in, and relationships with, “covered funds”, as defined in the rules. These rules preclude banking entities and their affiliates from sponsoring and/or providing services for existing TOB Trusts. A new TOB structure is being utilized by the Fund wherein the Fund, as holder of the residuals, will perform certain duties previously performed by banking entities as “sponsors” of TOB Trusts. These duties may be performed by a third-party service provider. The Fund’s expanded role under the new TOB structure may increase its operational and regulatory risk. The new structure is substantially similar to the previous structure; however, pursuant to the Volcker Rule, the remarketing agent would not be able to repurchase tendered floaters for its own account upon a failed remarketing. In the event of a failed remarketing, a banking entity serving as liquidity provider may loan the necessary funds to the TOB Trust to purchase the tendered floaters. The TOB Trust, not the Fund, would be the borrower and the loan from the liquidity provider will be secured by the purchased floaters now held by the TOB Trust. However, as previously described, the Fund would bear the risk of loss with respect to any liquidity shortfall to the extent it entered into a reimbursement agreement with the liquidity provider.
Further, the SEC and various banking agencies recently adopted rules implementing credit risk retention requirements for asset-backed securities (the “Risk Retention Rules”). The Risk Retention Rules require the sponsor of a TOB Trust to retain at least 5% of the credit risk of the underlying assets supporting the TOB Trust’s municipal bonds. The Fund has adopted policies intended to comply with the Risk Retention Rules. The Risk Retention Rules may adversely affect the Fund’s ability to engage in TOB Trust transactions or increase the costs of such transactions in certain circumstances.
There can be no assurances that the new TOB structure will continue to be a viable form of leverage. Further, there can be no assurances that alternative forms of leverage will be available to the Fund in order to maintain current levels of leverage. Any alternative forms of leverage may
19 Invesco Pennsylvania Tax Free Income Fund
be less advantageous to the Fund, and may adversely affect the Fund’s net asset value, distribution rate and ability to achieve its investment objective.
TOBs are presently classified as private placement securities. Private placement securities are subject to restrictions on resale because they have not been registered under the Securities Act of 1933, as amended (the “1933 Act”), or are otherwise not readily marketable. As a result of the absence of a public trading market for these securities, they may be less liquid than publicly traded securities. Although atypical, these securities may be resold in privately negotiated transactions, the prices realized from these sales could be less than those originally paid by the Fund or less than what may be considered the fair value of such securities.
| K. | Other Risks — The value of, payment of interest on, repayment of principal for and the ability to sell a municipal security may be affected by constitutional amendments, legislative enactments, executive orders, administrative regulations, voter initiatives and the economics of the regions in which the issuers are located. |
Since many municipal securities are issued to finance similar projects, especially those relating to education, health care, transportation and utilities, conditions in those sectors can affect the overall municipal securities market and the Fund’s investments in municipal securities.
There is some risk that a portion or all of the interest received from certain tax-free municipal securities could become taxable as a result of determinations by the Internal Revenue Service.
NOTE 2—Advisory Fees and Other Fees Paid to Affiliates
The Trust has entered into a master investment advisory agreement with Invesco Advisers, Inc. (the “Adviser” or “Invesco”). Under the terms of the investment advisory agreement, the Fund accrues daily and pays monthly an advisory fee to the Adviser based on the annual rate of the Fund’s average daily net assets as follows:
| Average Daily Net Assets | Rate | |||
First $500 million | 0.50% | |||
Over $500 million | 0.40% | |||
For the year ended August 31, 2017, the effective advisory fees incurred by the Fund was 0.50%.
Under the terms of a master sub-advisory agreement between the Adviser and each of Invesco Asset Management Deutschland GmbH, Invesco Asset Management Limited, Invesco Asset Management (Japan) Limited, Invesco Hong Kong Limited, Invesco Senior Secured Management, Inc. and Invesco Canada Ltd. and separate sub-advisory agreements with Invesco PowerShares Capital Management LLC and Invesco Asset Management (India) Private Limited (collectively, the “Affiliated Sub-Advisers”) the Adviser, not the Fund, will pay 40% of the fees paid to the Adviser to any such Affiliated Sub-Adviser(s) that provide(s) discretionary investment management services to the Fund based on the percentage of assets allocated to such Affiliated Sub-Adviser(s).
The Adviser has contractually agreed, through at least June 30, 2018, to waive advisory fees and/or reimburse expenses to the extent necessary to limit total annual fund operating expenses after fee waiver and/or expense reimbursement (excluding certain items discussed below) of Class A, Class B, Class C, Class Y and Class R6 shares to 1.50%, 2.25%, 2.25%, 1.25% and 1.25%, respectively, of the Fund’s average daily net assets (the “expense limits”). In determining the Adviser’s obligation to waive advisory fees and/or reimburse expenses, the following expenses are not taken into account, and could cause total annual fund operating expenses after fee waiver and/or reimbursement to exceed the numbers reflected above: (1) interest, facilities and maintenance fees; (2) taxes; (3) dividend expense on short sales; (4) extraordinary or non-routine items, including litigation expenses; and (5) expenses that the Fund has incurred but did not actually pay because of an expense offset arrangement. Unless Invesco continues the fee waiver agreement, it will terminate on June 30, 2018. During its term, the fee waiver agreement cannot be terminated or amended to increase the expense limits or reduce the advisory fee waivers without approval of the Board of Trustees. The Adviser did not waive fees and/or reimburse expenses during the period under this expense limit.
The Trust has entered into a master administrative services agreement with Invesco pursuant to which the Fund has agreed to pay Invesco for certain administrative costs incurred in providing accounting services to the Fund. For the year ended August 31, 2017, expenses incurred under the agreement are shown in the Statement of Operations as Administrative services fees.
The Trust has entered into a transfer agency and service agreement with Invesco Investment Services, Inc. (“IIS”) pursuant to which the Fund has agreed to pay IIS a fee for providing transfer agency and shareholder services to the Fund and reimburse IIS for certain expenses incurred by IIS in the course of providing such services. IIS may make payments to intermediaries that provide omnibus account services, sub-accounting services and/or networking services. All fees payable by IIS to intermediaries that provide omnibus account services or sub-accounting services are charged back to the Fund, subject to certain limitations approved by the Trust’s Board of Trustees. For the year ended August 31, 2017, the expenses incurred under the agreement are shown in the Statement of Operations as Transfer agent fees.
Shares of the Fund are distributed by Invesco Distributors, Inc. (“IDI”). The Fund has adopted a distribution plan pursuant to Rule 12b-1 under the 1940 Act, and a service plan (collectively, the “Plans”) for Class A shares, Class B shares and Class C shares to compensate IDI for the sale, distribution, shareholder servicing and maintenance of shareholder accounts for these shares. Under the Plans, the Fund will incur annual fees of up to 0.25% of Class A average daily net assets and up to 1.00% each of Class B and Class C average daily net assets. The fees are accrued daily and paid monthly.
With respect to Class B and Class C shares, the Fund is authorized to reimburse in future years any distribution related expenses that exceed the maximum annual reimbursement rate for such class, so long as such reimbursement does not cause the Fund to exceed the Class B and Class C maximum annual reimbursement rate, respectively. With respect to Class A shares, distribution related expenses that exceed the maximum annual reimbursement rate for such class are not carried forward to future years and the Fund will not reimburse IDI for any such expenses.
For the year ended August 31, 2017, expenses incurred under these agreements are shown in the Statement of Operations as Distribution fees.
Front-end sales commissions and CDSC (collectively, the “sales charges”) are not recorded as expenses of the Fund. Front-end sales commissions are deducted from proceeds from the sales of Fund shares prior to investment in Class A shares of the Fund. CDSC are deducted from redemption proceeds prior to remittance to the shareholder. During the year ended August 31, 2017, IDI advised the Fund that IDI retained $12,579 in
20 Invesco Pennsylvania Tax Free Income Fund
front-end sales commissions from the sale of Class A shares and $102 and $103 from Class A and Class C shares, respectively, for CDSC imposed on redemptions by shareholders.
Certain officers and trustees of the Trust are officers and directors of the Adviser, IIS and/or IDI.
NOTE 3—Additional Valuation Information
GAAP defines fair value as the price that would be received to sell an asset or paid to transfer a liability in an orderly transaction between market participants at the measurement date, under current market conditions. GAAP establishes a hierarchy that prioritizes the inputs to valuation methods, giving the highest priority to readily available unadjusted quoted prices in an active market for identical assets (Level 1) and the lowest priority to significant unobservable inputs (Level 3), generally when market prices are not readily available or are unreliable. Based on the valuation inputs, the securities or other investments are tiered into one of three levels. Changes in valuation methods may result in transfers in or out of an investment’s assigned level:
| Level 1 — | Prices are determined using quoted prices in an active market for identical assets. |
| Level 2 — | Prices are determined using other significant observable inputs. Observable inputs are inputs that other market participants may use in pricing a security. These may include quoted prices for similar securities, interest rates, prepayment speeds, credit risk, yield curves, loss severities, default rates, discount rates, volatilities and others. |
| Level 3 — | Prices are determined using significant unobservable inputs. In situations where quoted prices or observable inputs are unavailable (for example, when there is little or no market activity for an investment at the end of the period), unobservable inputs may be used. Unobservable inputs reflect the Fund’s own assumptions about the factors market participants would use in determining fair value of the securities or instruments and would be based on the best available information. |
As of August 31, 2017, all of the securities in this Fund were valued based on Level 2 inputs (see the Schedule of Investments for security categories). The level assigned to the securities valuations may not be an indication of the risk or liquidity associated with investing in those securities. Because of the inherent uncertainties of valuation, the values reflected in the financial statements may materially differ from the value received upon actual sale of those investments.
The Fund’s policy is to recognize transfers in and out of the valuation levels as of the end of the reporting period. During the year ended August 31, 2017, there were no transfers between valuation levels.
NOTE 4—Security Transactions with Affiliated Funds
The Fund is permitted to purchase or sell securities from or to certain other Invesco Funds under specified conditions outlined in procedures adopted by the Board of Trustees of the Trust. The procedures have been designed to ensure that any purchase or sale of securities by the Fund from or to another fund or portfolio that is or could be considered an affiliate by virtue of having a common investment adviser (or affiliated investment advisers), common Trustees and/or common officers complies with Rule 17a-7 of the 1940 Act. Further, as defined under the procedures, each transaction is effected at the current market price. Pursuant to these procedures, for the year ended August 31, 2017, the Fund engaged in securities purchases of $10,428,489 and securities sales of $13,692,750, which did not result in any realized gain (loss).
NOTE 5—Expense Offset Arrangement(s)
The expense offset arrangement is comprised of transfer agency credits which result from balances in demand deposit accounts used by the transfer agent for clearing shareholder transactions. For the year ended August 31, 2017, the Fund received credits from this arrangement, which resulted in the reduction of the Fund’s total expenses of $607.
NOTE 6—Trustees’ and Officers’ Fees and Benefits
Trustees’ and Officers’ Fees and Benefits include amounts accrued by the Fund to pay remuneration to certain Trustees and Officers of the Fund. Trustees have the option to defer compensation payable by the Fund, and Trustees’ and Officers’ Fees and Benefits also include amounts accrued by the Fund to fund such deferred compensation amounts. Those Trustees who defer compensation have the option to select various Invesco Funds in which their deferral accounts shall be deemed to be invested. Finally, certain current Trustees were eligible to participate in a retirement plan that provided for benefits to be paid upon retirement to Trustees over a period of time based on the number of years of service. The Fund may have certain former Trustees who also participate in a retirement plan and receive benefits under such plan. Trustees’ and Officers’ Fees and Benefits include amounts accrued by the Fund to fund such retirement benefits. Obligations under the deferred compensation and retirement plans represent unsecured claims against the general assets of the Fund.
NOTE 7—Cash Balances and Borrowings
The Fund is permitted to temporarily carry a negative or overdrawn balance in its account with State Street Bank and Trust Company (“SSB”), the custodian bank. Such balances, if any at period-end, are shown in the Statement of Assets and Liabilities under the payable caption Amount due custodian. To compensate the custodian bank for such overdrafts, the overdrawn Fund may either (1) leave funds as a compensating balance in the account so the custodian bank can be compensated by earning the additional interest; or (2) compensate by paying the custodian bank at a rate agreed upon by the custodian bank and Invesco, not to exceed the contractually agreed upon rate.
Inverse floating rate obligations resulting from the transfer of bonds to TOB Trusts are accounted for as secured borrowings. The average floating rate notes outstanding and average annual interest and fee rate related to inverse floating rate note obligations during the year ended August 31, 2017 were $9,565,000 and 2.08%, respectively.
21 Invesco Pennsylvania Tax Free Income Fund
NOTE 8—Distributions to Shareholders and Tax Components of Net Assets
Tax Character of Distributions to Shareholders Paid During the Fiscal Years Ended August 31, 2017 and 2016:
| 2017 | 2016 | |||||||
Ordinary income | $ | 4,217,276 | $ | 4,553,766 | ||||
Tax Components of Net Assets at Period-End:
| 2017 | ||||
Undistributed ordinary income | $ | 370,939 | ||
Net unrealized appreciation — investments | 8,413,186 | |||
Temporary book/tax differences | (38,001 | ) | ||
Capital loss carryforward | (5,129,427 | ) | ||
Shares of beneficial interest | 126,361,599 | |||
Total net assets | $ | 129,978,296 | ||
The difference between book-basis and tax-basis unrealized appreciation (depreciation) is due to differences in the timing of recognition of gains and losses on investments for tax and book purposes. The Fund’s net unrealized appreciation difference is attributable primarily to TOBs and book to tax accretion and amortization differences.
The temporary book/tax differences are a result of timing differences between book and tax recognition of income and/or expenses. The Fund’s temporary book/tax differences are the result of the trustee deferral of compensation and retirement plan benefits.
Capital loss carryforward is calculated and reported as of a specific date. Results of transactions and other activity after that date may affect the amount of capital loss carryforward actually available for the Fund to utilize. Capital losses generated in years beginning after December 22, 2010 can be carried forward for an unlimited period, whereas previous losses expire in eight tax years. Capital losses with an expiration period may not be used to offset capital gains until all net capital losses without an expiration date have been utilized. Capital loss carryforwards with no expiration date will retain their character as either short-term or long-term capital losses instead of as short-term capital losses as under prior law. The ability to utilize capital loss carryforwards in the future may be limited under the Internal Revenue Code and related regulations based on the results of future transactions.
The Fund has a capital loss carryforward as of August 31, 2017, which expires as follows:
| Capital Loss Carryforward* | ||||||||||||
| Expiration | Short-Term | Long-Term | Total | |||||||||
August 31, 2018 | $ | 1,085,533 | $ | — | $ | 1,085,533 | ||||||
Not subject to expiration | 1,012,472 | 3,031,422 | 4,043,894 | |||||||||
| $ | 2,098,005 | $ | 3,031,422 | $ | 5,129,427 | |||||||
| * | Capital loss carryforward as of the date listed above is reduced for limitations, if any, to the extent required by the Internal Revenue Code and may be further limited depending upon a variety of factors, including the realization of net unrealized gains or losses as of the date of any reorganization. |
NOTE 9—Investments Transactions
The aggregate amount of investment securities (other than short-term securities, U.S. Treasury obligations and money market funds, if any) purchased and sold by the Fund during the year ended August 31, 2017 was $32,726,796 and $30,145,588, respectively. Cost of investments, including any derivatives, on a tax basis includes the adjustments for financial reporting purposes as of the most recently completed federal income tax reporting period-end.
| Unrealized Appreciation (Depreciation) of Investments on a Tax Basis | ||||
Aggregate unrealized appreciation of investments | $ | 10,049,439 | ||
Aggregate unrealized (depreciation) of investments | (1,636,253 | ) | ||
Net unrealized appreciation of investments | $ | 8,413,186 | ||
Cost of investments for tax purposes is $132,333,036.
NOTE 10—Reclassification of Permanent Differences
Primarily as a result of differing book/tax treatment of expired capital loss carryforward, on August 31, 2017, undistributed net investment income was decreased by $148,770, undistributed net realized gain (loss) was increased by $5,651,315 and shares of beneficial interest was decreased by $5,502,545. This reclassification had no effect on the net assets of the Fund.
22 Invesco Pennsylvania Tax Free Income Fund
NOTE 11—Share Information
| Summary of Share Activity | ||||||||||||||||
| Years ended August 31, | ||||||||||||||||
| 2017(a) | 2016 | |||||||||||||||
| Shares | Amount | Shares | Amount | |||||||||||||
Sold: | ||||||||||||||||
Class A | 548,705 | $ | 8,984,210 | 568,174 | $ | 9,498,579 | ||||||||||
Class B | — | — | — | — | ||||||||||||
Class C | 113,894 | 1,874,712 | 143,899 | 2,419,177 | ||||||||||||
Class Y | 319,575 | 5,196,443 | 101,703 | 1,719,284 | ||||||||||||
Class R6(b) | 617 | 10,000 | — | — | ||||||||||||
Issued as reinvestment of dividends: | ||||||||||||||||
Class A | 153,434 | 2,507,530 | 160,623 | 2,687,967 | ||||||||||||
Class B | 533 | 8,729 | 879 | 14,720 | ||||||||||||
Class C | 10,389 | 169,945 | 10,289 | 172,481 | ||||||||||||
Class Y | 5,858 | 95,727 | 3,589 | 60,058 | ||||||||||||
Automatic conversion of Class B shares to Class A shares: | ||||||||||||||||
Class A | 34,121 | 557,930 | 7,910 | 132,347 | ||||||||||||
Class B | (34,057 | ) | (557,930 | ) | (7,893 | ) | (132,347 | ) | ||||||||
Reacquired: | ||||||||||||||||
Class A | (914,199 | ) | (14,910,630 | ) | (582,021 | ) | (9,706,096 | ) | ||||||||
Class B | (5,603 | ) | (92,335 | ) | (4,507 | ) | (76,015 | ) | ||||||||
Class C | (168,612 | ) | (2,765,530 | ) | (60,654 | ) | (1,015,478 | ) | ||||||||
Class Y | (162,593 | ) | (2,637,581 | ) | (51,633 | ) | (870,897 | ) | ||||||||
Net increase (decrease) in share activity | (97,938 | ) | $ | (1,558,780 | ) | 290,358 | $ | 4,903,780 | ||||||||
| (a) | There are entities that are record owners of more than 5% of the outstanding shares of the Fund and in the aggregate own 54% of the outstanding shares of the Fund. IDI has an agreement with these entities to sell Fund shares. The Fund, Invesco and/or Invesco affiliates may make payments to these entities, which are considered to be related to the Fund, for providing services to the Fund, Invesco and/or Invesco affiliates including but not limited to services such as securities brokerage, distribution, third party record keeping and account servicing. The Fund has no knowledge as to whether all or any portion of the shares owned of record by these entities are also owned beneficially. |
| (b) | Commencement date of April 4, 2017. |
23 Invesco Pennsylvania Tax Free Income Fund
NOTE 12—Financial Highlights
The following schedule presents financial highlights for a share of the Fund outstanding throughout the periods indicated.
| Net asset value, beginning of period | Net investment income(a) | Net gains (losses) on securities (both realized and unrealized) | Total from investment operations | Dividends from net investment income | Net asset value, end of period | Total return(b) | Net assets, end of period (000’s omitted) | Ratio of expenses to average net assets with fee waivers and/or expenses absorbed | Supplemental Ratio: to average net interest, facilities and maintenance | Ratio of net investment income to average net assets | Portfolio turnover(c) | |||||||||||||||||||||||||||||||||||||
Class A |
| |||||||||||||||||||||||||||||||||||||||||||||||
Year ended 08/31/17 | $ | 17.01 | $ | 0.57 | $ | (0.55 | ) | $ | 0.02 | $ | (0.54 | ) | $ | 16.49 | 0.18 | % | $ | 112,324 | 1.19 | %(d) | 1.04 | %(d) | 3.50 | %(d) | 22 | % | ||||||||||||||||||||||
Year ended 08/31/16 | 16.44 | 0.57 | 0.60 | 1.17 | (0.60 | ) | 17.01 | 7.21 | 118,906 | 1.08 | 1.02 | 3.41 | 12 | |||||||||||||||||||||||||||||||||||
Year ended 08/31/15 | 16.50 | 0.59 | (0.09 | ) | 0.50 | (0.56 | ) | 16.44 | 3.09 | 112,409 | 1.12 | 1.09 | 3.59 | 13 | ||||||||||||||||||||||||||||||||||
Year ended 08/31/14 | 15.39 | 0.62 | 1.09 | 1.71 | (0.60 | ) | 16.50 | 11.33 | 113,872 | 1.09 | 1.07 | 3.93 | 10 | |||||||||||||||||||||||||||||||||||
Year ended 08/31/13 | 17.05 | 0.63 | (1.65 | ) | (1.02 | ) | (0.64 | ) | 15.39 | (6.24 | ) | 118,936 | 1.03 | 1.01 | 3.72 | 17 | ||||||||||||||||||||||||||||||||
Class B |
| |||||||||||||||||||||||||||||||||||||||||||||||
Year ended 08/31/17 | 17.04 | 0.58 | (0.56 | ) | 0.02 | (0.54 | ) | 16.52 | 0.19 | (e) | 414 | 1.19 | (d)(e) | 1.04 | (d)(e) | 3.50 | (d)(e) | 22 | ||||||||||||||||||||||||||||||
Year ended 08/31/16 | 16.48 | 0.57 | 0.59 | 1.16 | (0.60 | ) | 17.04 | 7.15 | (e) | 1,094 | 1.08 | (e) | 1.02 | (e) | 3.41 | (e) | 12 | |||||||||||||||||||||||||||||||
Year ended 08/31/15 | 16.53 | 0.60 | (0.09 | ) | 0.51 | (0.56 | ) | 16.48 | 3.15 | (e) | 1,247 | 1.12 | (e) | 1.09 | (e) | 3.59 | (e) | 13 | ||||||||||||||||||||||||||||||
Year ended 08/31/14 | 15.42 | 0.63 | 1.08 | 1.71 | (0.60 | ) | 16.53 | 11.32 | (e) | 1,544 | 1.09 | (e) | 1.07 | (e) | 3.93 | (e) | 10 | |||||||||||||||||||||||||||||||
Year ended 08/31/13 | 17.09 | 0.63 | (1.66 | ) | (1.03 | ) | (0.64 | ) | 15.42 | (6.28 | )(e) | 1,717 | 1.03 | (e) | 1.01 | (e) | 3.72 | (e) | 17 | |||||||||||||||||||||||||||||
Class C |
| |||||||||||||||||||||||||||||||||||||||||||||||
Year ended 08/31/17 | 17.03 | 0.45 | (0.56 | ) | (0.11 | ) | (0.42 | ) | 16.50 | (0.63 | ) | 10,325 | 1.94 | (d) | 1.79 | (d) | 2.75 | (d) | 22 | |||||||||||||||||||||||||||||
Year ended 08/31/16 | 16.46 | 0.44 | 0.60 | 1.04 | (0.47 | ) | 17.03 | 6.42 | 11,406 | 1.83 | 1.77 | 2.66 | 12 | |||||||||||||||||||||||||||||||||||
Year ended 08/31/15 | 16.53 | 0.47 | (0.09 | ) | 0.38 | (0.45 | ) | 16.46 | 2.33 | 9,488 | 1.87 | 1.84 | 2.84 | 13 | ||||||||||||||||||||||||||||||||||
Year ended 08/31/14 | 15.41 | 0.51 | 1.09 | 1.60 | (0.48 | ) | 16.53 | 10.56 | (f) | 9,804 | 1.81 | (f) | 1.79 | (f) | 3.21 | (f) | 10 | |||||||||||||||||||||||||||||||
Year ended 08/31/13 | 17.08 | 0.50 | (1.66 | ) | (1.16 | ) | (0.51 | ) | 15.41 | (7.00 | ) | 10,838 | 1.78 | 1.76 | 2.97 | 17 | ||||||||||||||||||||||||||||||||
Class Y |
| |||||||||||||||||||||||||||||||||||||||||||||||
Year ended 08/31/17 | 17.02 | 0.61 | (0.55 | ) | 0.06 | (0.58 | ) | 16.50 | 0.44 | 6,905 | 0.94 | (d) | 0.79 | (d) | 3.75 | (d) | 22 | |||||||||||||||||||||||||||||||
Year ended 08/31/16 | 16.46 | 0.61 | 0.59 | 1.20 | (0.64 | ) | 17.02 | 7.41 | 4,351 | 0.83 | 0.77 | 3.66 | 12 | |||||||||||||||||||||||||||||||||||
Year ended 08/31/15 | 16.51 | 0.64 | (0.08 | ) | 0.56 | (0.61 | ) | 16.46 | 3.41 | 3,323 | 0.87 | 0.84 | 3.84 | 13 | ||||||||||||||||||||||||||||||||||
Year ended 08/31/14 | 15.40 | 0.66 | 1.09 | 1.75 | (0.64 | ) | 16.51 | 11.60 | 2,713 | 0.84 | 0.82 | 4.18 | 10 | |||||||||||||||||||||||||||||||||||
Year ended 08/31/13 | 17.06 | 0.67 | (1.65 | ) | (0.98 | ) | (0.68 | ) | 15.40 | (6.00 | ) | 2,562 | 0.78 | 0.76 | 3.97 | 17 | ||||||||||||||||||||||||||||||||
Class R6 |
| |||||||||||||||||||||||||||||||||||||||||||||||
Year ended 08/31/17(g) | 16.23 | 0.26 | 0.25 | 0.51 | (0.24 | ) | 16.50 | 3.15 | 10 | 0.93 | (d)(h) | 0.78 | (d)(h) | 3.76 | (d)(h) | 22 | ||||||||||||||||||||||||||||||||
| (a) | Calculated using average shares outstanding. |
| (b) | Includes adjustments in accordance with accounting principles generally accepted in the United States of America and as such, the net asset value for financial reporting purposes and the returns based upon those net asset values may differ from the net asset value and returns for shareholder transactions. Does not include sales charges and is not annualized for periods less than one year, if applicable. |
| (c) | Portfolio turnover is calculated at the fund level and is not annualized for periods less than one year, if applicable. |
| (d) | Ratios are based on average daily net assets (000’s omitted) of $112,914, $627, $10,990, $5,830 and $10 for Class A, Class B, Class C, Class Y and Class R6 shares, respectively. |
| (e) | The total return, ratio of expenses to average net assets and ratio of net investment income to average net assets reflect actual 12b-1 fees of 0.25%, 0.25%, 0.25%, 0.25% and 0.25% for the years ended August 31, 2017, August 31, 2016, August 31, 2015, August 31, 2014 and August 31, 2013, respectively. |
| (f) | The total return, ratio of expenses to average net assets and ratio of net investment income to average net assets reflect actual 12b-1 fees of 0.97% for the year ended August 31, 2014. |
| (g) | Commencement date of April 4, 2017 for Class R6 shares. |
| (h) | Annualized. |
24 Invesco Pennsylvania Tax Free Income Fund
Report of Independent Registered Public Accounting Firm
To the Board of Trustees of AIM Counselor Series Trust (Invesco Counselor Series Trust)
and Shareholders of Invesco Pennsylvania Tax Free Income Fund:
In our opinion, the accompanying statement of assets and liabilities, including the schedule of investments, and the related statements of operations and of changes in net assets and the financial highlights present fairly, in all material respects, the financial position of Invesco Pennsylvania Tax Free Income Fund (one of the portfolios constituting AIM Counselor Series Trust (Invesco Counselor Series Trust), hereafter referred to as the “Fund”) as of August 31, 2017, the results of its operations for the year then ended, the changes in its net assets for each of the two years in the period then ended and the financial highlights for each of the periods indicated therein, in conformity with accounting principles generally accepted in the United States of America. These financial statements and financial highlights (hereafter referred to as “financial statements”) are the responsibility of the Fund’s management. Our responsibility is to express an opinion on these financial statements based on our audits. We conducted our audits of these financial statements in accordance with the standards of the Public Company Accounting Oversight Board (United States). Those standards require that we plan and perform the audit to obtain reasonable assurance about whether the financial statements are free of material misstatement. An audit includes examining, on a test basis, evidence supporting the amounts and disclosures in the financial statements, assessing the accounting principles used and significant estimates made by management, and evaluating the overall financial statement presentation. We believe that our audits, which included confirmation of securities as of August 31, 2017 by correspondence with the custodian and brokers, and when replies were not received from brokers, we performed other auditing procedures, provide a reasonable basis for our opinion.
PricewaterhouseCoopers LLP
Houston, Texas
October 30, 2017
25 Invesco Pennsylvania Tax Free Income Fund
Calculating your ongoing Fund expenses
Example
As a shareholder of the Fund, you incur two types of costs: (1) transaction costs, which may include sales charges (loads) on purchase payments or contingent deferred sales charges on redemptions, if any; and (2) ongoing costs, including management fees, distribution and/or service (12b-1) fees, and other Fund expenses. This example is intended to help you understand your ongoing costs (in dollars) of investing in the Fund and to compare these costs with ongoing costs of investing in other mutual funds. With the exception of the actual ending account value and expenses of the Class R6 shares, the example is based on an investment of $1,000 invested at the beginning of the period and held for the entire period March 1, 2017 through August 31, 2017. The actual ending account value and expenses of the Class R6 shares in the example below are based on an investment of $1,000 invested as of close of business April 4, 2017 (commencement date) and held through August 31, 2017.
Actual expenses
The table below provides information about actual account values and actual expenses. You may use the information in this table, together with the amount you invested, to estimate the expenses that you paid over the period. Simply divide your account value by $1,000 (for example, an $8,600 account value divided by $1,000 = 8.6), then multiply the result by the number in the table under the heading entitled “Actual Expenses Paid During Period” to estimate the expenses you paid on your account during this period (as of close of business April 4, 2017 through August 31, 2017 for the Class R6 shares). Because the actual ending account value and expense information in the example is not based upon a six month period for the Class R6 shares, the ending account value and expense information may not provide a meaningful comparison to mutual funds that provide such information for a full six month period.
Hypothetical example for comparison purposes
The table below also provides information about hypothetical account values and hypothetical expenses based on the Fund’s actual expense ratio and an assumed rate of return of 5% per year before expenses, which is not the Fund’s actual return.
The hypothetical account values and expenses may not be used to estimate the actual ending account balance or expenses you paid for the period. You may use this information to compare the ongoing costs of investing in the Fund and other funds. To do so, compare this 5% hypothetical example with the 5% hypothetical examples that appear in the shareholder reports of the other funds.
Please note that the expenses shown in the table are meant to highlight your ongoing costs only and do not reflect any transaction costs, such as sales charges (loads) on purchase payments or contingent deferred sales charges on redemptions, if any. Therefore, the hypothetical information is useful in comparing ongoing costs only, and will not help you determine the relative total costs of owning different funds. In addition, if these transaction costs were included, your costs would have been higher.
| Class | Beginning Account Value (03/01/17) | ACTUAL | HYPOTHETICAL (5% annual return before expenses) | Annualized Expense Ratio | ||||||||||||||||||||
| Ending Account Value (08/31/17)1 | Expenses Paid During Period2 | Ending Account Value (08/31/17) | Expenses Paid During Period3 | |||||||||||||||||||||
| A | $ | 1,000.00 | $ | 1,035.80 | $ | 6.31 | $ | 1,019.00 | $ | 6.26 | 1.23 | % | ||||||||||||
| B | 1,000.00 | 1,035.70 | 6.31 | 1,019.00 | 6.26 | 1.23 | ||||||||||||||||||
| C | 1,000.00 | 1,031.90 | 10.14 | 1,015.22 | 10.06 | 1.98 | ||||||||||||||||||
| Y | 1,000.00 | 1,037.00 | 5.03 | 1,020.27 | 4.99 | 0.98 | ||||||||||||||||||
| R6 | 1,000.00 | 1,031.50 | 3.88 | 1,020.52 | 4.74 | 0.93 | ||||||||||||||||||
| 1 | The actual ending account value is based on the actual total return of the Fund for the period March 1, 2017 through August 31, 2017 (as of close of business April 4, 2017 through August 31, 2017 for the Class R6 shares), after actual expenses and will differ from the hypothetical ending account value which is based on the Fund’s expense ratio and a hypothetical annual return of 5% before expenses. |
| 2 | Actual expenses are equal to the Fund’s annualized expense ratio as indicated above multiplied by the average account value over the period, multiplied by 184/365 to reflect the most recent fiscal half year. For the Class R6 shares actual expenses are equal to the annualized expense ratio indicated above multiplied by the average account value over the period, multiplied by 150 (as of close of business April 4, 2017 through August 31, 2017)/365. Because the Class R6 shares have not been in existence for a full six month period, the actual ending account value and expense information shown may not provide a meaningful comparison to fund expense information of classes that show such data for a full six month period and, because the actual ending account value and expense information in the expense example covers a short time period, return and expense data may not be indicative of return and expense data for longer time periods. |
| 3 | Hypothetical expenses are equal to the annualized expense ratio indicated above multiplied by the average account value over the period, multiplied by 184/365 to reflect a one-half year period. The hypothetical ending account value and expenses may be used to compare ongoing costs of investing in Class R6 shares of the Fund and other funds because such data is based on a full six month period. |
26 Invesco Pennsylvania Tax Free Income Fund
Approval of Investment Advisory and Sub-Advisory Contracts
The Board of Trustees (the Board) of AIM Counselor Series Trust (Invesco Counselor Series Trust) is required under the Investment Company Act of 1940, as amended, to approve annually the renewal of Invesco Pennsylvania Tax Free Income Fund’s (the Fund) investment advisory agreements. During contract renewal meetings held on June 12-13, 2017, the Board as a whole, and the disinterested or “independent” Trustees, who comprise over 75% of the Board, voting separately, approved the continuance for the Fund of the Master Investment Advisory Agreement with Invesco Advisers, Inc. (Invesco Advisers and the investment advisory agreement) and the Master Intergroup Sub-Advisory Contract for Mutual Funds with Invesco Asset Management Deutschland GmbH, Invesco Asset Management Limited, Invesco Asset Management (Japan) Limited, Invesco Hong Kong Limited, Invesco Senior Secured Management, Inc. and Invesco Canada Ltd. and separate Sub-Advisory Contracts with Invesco PowerShares Capital Management LLC and Invesco Asset Management (India) Private Limited (collectively, the Affiliated Sub-Advisers and the sub-advisory contracts) for another year, effective July 1, 2017.
In evaluating the fairness and reasonableness of compensation under the Fund’s investment advisory agreement and sub-advisory contracts, the Board considered, among other things, the factors discussed below. The Board determined that continuation of the Fund’s investment advisory agreement and the sub-advisory contracts is in the best interest of the Fund and its shareholders and that the compensation payable to Invesco Advisers and the Affiliated Sub-Advisers under the agreements is fair and reasonable.
The Board’s Fund Evaluation Process
The Board’s Investments Committee has established three Sub-Committees, which meet throughout the year to review the performance of funds advised by Invesco Advisers (the Invesco Funds). Over the course of each year, the Sub-Committees meet with portfolio managers for their assigned Invesco Funds and other members of management to review the performance, investment objective(s), policies, strategies, limitations and investment risks of these funds. The Board had the benefit of reports from the Sub-Committees and Investments Committee throughout the year in considering approval of the continuance of each Invesco Fund’s investment advisory agreement and sub-advisory contracts for another year.
During the contract renewal process, the Board receives comparative performance and fee data regarding the Invesco Funds prepared by Invesco Advisers and Broadridge Financial Solutions, Inc. (Broadridge), an independent provider of investment company data. The
Board also receives an independent written evaluation from the Senior Officer, an officer of the Invesco Funds who reports directly to the independent Trustees. The Senior Officer’s evaluation is prepared as part of his responsibility to manage the process by which the Invesco Funds’ proposed management fees are negotiated during the annual contract renewal process to ensure they are negotiated in a manner that is at arms’ length and reasonable. In addition to meetings with Invesco Advisers and fund counsel, the independent Trustees also discuss the continuance of the investment advisory agreement and sub-advisory contracts in separate sessions with the Senior Officer and with independent legal counsel.
The Trustees recognized that the advisory fee rates for the Invesco Funds are, in most cases, the result of years of review and negotiation. The Trustees’ deliberations and conclusions in a particular year may be based in part on their deliberations and conclusions regarding these arrangements throughout the year and in prior years. The Trustees’ review and conclusions are based on the comprehensive consideration of all information presented to them and are not the result of any single determinative factor. Moreover, one Trustee may have weighed a particular piece of information or factor differently than another Trustee.
The discussion below is a summary of the Senior Officer’s independent written evaluation with respect to the Fund’s investment advisory agreement as well as a discussion of the material factors and related conclusions that formed the basis for the Board’s approval of the Fund’s investment advisory agreement and sub-advisory contracts. This information is current as of June 13, 2017, and does not reflect consideration of factors that became known to the Board after that date.
Factors and Conclusions and Summary of Independent Written Fee Evaluation
| A. | Nature, Extent and Quality of Services Provided by Invesco Advisers and the Affiliated Sub-Advisers |
The Board reviewed the advisory services provided to the Fund by Invesco Advisers under the Fund’s investment advisory agreement, the performance of Invesco Advisers in providing these services, and the credentials and experience of the officers and employees of Invesco Advisers who provide these services, including the Fund’s portfolio manager or managers. The Board’s review included consideration of Invesco Advisers’ investment process oversight, credit analysis and investment risk management. The Board also considered non-advisory services that Invesco Advisers and its affiliates provide to the Invesco Funds such as various back office support
functions, trading operations, internal audit, valuation and legal and compliance.
In determining whether to continue the Fund’s investment advisory agreement, the Board considered the benefits of reapproving an existing relationship as contrasted with the greater uncertainty that may be associated with entering into a new relationship. The Board concluded that the nature, extent and quality of the services provided to the Fund by Invesco Advisers are appropriate and satisfactory.
The Board reviewed the services that may be provided by the Affiliated Sub-Advisers under the sub-advisory contracts and the credentials and experience of the officers and employees of the Affiliated Sub-Advisers who provide these services. The Board noted that the Affiliated Sub-Advisers have offices and personnel that are located in financial centers around the world. As a result, the Board noted that the Affiliated Sub-Advisers can provide research and investment analysis on the markets and economies of various countries in which the Fund may invest, make recommendations regarding securities and assist with security trades. The Board concluded that the sub-advisory contracts may benefit the Fund and its shareholders by permitting Invesco Advisers to use the resources and talents of the Affiliated Sub-Advisers in managing the Fund. The Board concluded that the nature, extent and quality of the services that may be provided by the Affiliated Sub-Advisers are appropriate and satisfactory.
| B. | Fund Investment Performance |
The Board considered Fund investment performance as a relevant factor in considering whether to approve the investment advisory agreement. The Board did not view Fund performance as a relevant factor in considering whether to approve the sub-advisory contracts for the Fund, as no Affiliated Sub-Adviser currently manages assets of the Fund.
The Board compared the Fund’s investment performance over multiple time periods ending December 31, 2016 to the performance of funds in the Broadridge performance universe and against the Lipper Pennsylvania Municipal Debt Funds Index. The Board noted that performance of Class A shares of the Fund was in the second quintile of its performance universe for the one, three and five year periods (the first quintile being the best performing funds and the fifth quintile being the worst performing funds). The Board noted that performance of Class A shares of the Fund was below the performance of the Index for the one year period and above the performance Index for the three and five year periods. The Trustees also reviewed more recent Fund performance and this review did not change their conclusions.
27 Invesco Pennsylvania Tax Free Income Fund
| C. | Advisory and Sub-Advisory Fees |
The Board compared the Fund’s contractual management fee rate to the contractual management fee rates of funds in the Fund’s Broadridge expense group at a common asset level. The Board noted that the contractual management fee rate for Class A shares of the Fund was at the median contractual management fee rate of funds in its expense group. The Board noted that the term “contractual management fee” for funds in the expense group may include both advisory and certain administrative services fees, but that Broadridge does not provide information on a fund by fund basis as to what is included. The Board noted that Invesco Advisers does not separately charge the Invesco Funds for the administrative services included in the term as defined by Broadridge. The Board also reviewed the methodology used by Broadridge in providing expense group information, which includes using each fund’s contractual management fee schedule (including any applicable breakpoints) as reported in the most recent prospectus or statement of additional information for each fund in the expense group.
The Board also compared the Fund’s effective advisory fee rate (the advisory fee rate after advisory fee waivers and before other expense limitations/waivers) to the effective advisory fee rates of other funds advised by Invesco Advisers and its affiliates with investment strategies comparable to those of the Fund, based on balances as of December 31, 2016. The Board noted that the Fund’s rate was below the rate of one closed-end fund.
The Board noted that Invesco Advisers and the Affiliated Sub-Advisers do not manage other client accounts with investment strategies comparable to those of the Fund.
The Board also considered the services that may be provided by the Affiliated Sub-Advisers pursuant to the sub-advisory contracts, as well as the fees payable by Invesco Advisers to the Affiliated Sub-Advisers pursuant to the sub-advisory contracts. The Board also noted that the sub-advisory fees are not paid directly by the Fund, but rather, are payable by Invesco Advisers to the Affiliated Sub-Advisers.
| D. | Economies of Scale and Breakpoints |
The Board considered the extent to which there are economies of scale in the provision of advisory services to the Fund. The Board also considered that he Fund may benefit from economies of scale through contractual breakpoints in the Fund’s advisory fee schedule. The Board noted that the Fund shares directly in economies of scale through lower fees charged by third party service providers based on the combined size of the Invesco Funds advised by Invesco Advisers.
| E. | Profitability and Financial Resources |
The Board reviewed information from Invesco Advisers concerning the costs of the advisory and other services that Invesco Advisers and its affiliates provide to the Fund and the Invesco Funds and the profitability of Invesco Advisers and its affiliates in providing these services. The
Board noted that Invesco Advisers continues to operate at a net profit from services Invesco Advisers and its affiliates provide to the Invesco Funds and the Fund. The Board did not deem the level of profits realized by Invesco Advisers and its affiliates from providing services to the Fund to be excessive given the nature, quality and extent of the services provided. The Board received and accepted information from Invesco Advisers demonstrating that Invesco Advisers and each Affiliated Sub-Adviser are financially sound and have the resources necessary to perform their obligations under the investment advisory agreement and sub-advisory contracts.
| F. | Collateral Benefits to Invesco Advisers and its Affiliates |
The Board considered various other benefits received by Invesco Advisers and its affiliates from the relationship with the Fund, including the fees received for providing transfer agency and distribution services to the Fund. The Board considered comparative information regarding fees charged for these services, including information provided by Broadridge and other independent sources. The Board considered the performance of Invesco Advisers and its affiliates in providing these services and the organizational structure employed to provide these services. The Board also considered that these services are provided to the Fund pursuant to written contracts that are reviewed and approved on an annual basis by the Board; and that the services are required for the operation of the Fund.
The Board considered the benefits realized by Invesco Advisers and the Affiliated Sub-Advisers as a result of portfolio brokerage transactions executed through “soft dollar” arrangements. Invesco Advisers noted that the Fund does not execute brokerage transactions through “soft dollar” arrangements to any significant degree.
The Board considered that the Fund’s uninvested cash and cash collateral from any securities lending arrangements may be invested in money market funds advised by Invesco Advisers pursuant to procedures approved by the Board. The Board noted that Invesco Advisers receives advisory fees from these affiliated money market funds attributable to such investments, although Invesco Advisers has contractually agreed to waive through varying periods the advisory fees payable by the Invesco Funds with respect to certain investments in the affiliated money market funds. The waiver is in an amount equal to 100% of the net advisory fee Invesco Advisers receives from the affiliated money market funds with respect to the Fund’s investment in the affiliated money market funds of uninvested cash, but not cash collateral. The Board concluded that the amount of advisory fees received by Invesco Advisers from the Fund’s investment of cash collateral from any securities lending arrangements in the affiliated money market funds is fair and reasonable.
28 Invesco Pennsylvania Tax Free Income Fund
Tax Information
Form 1099-DIV, Form 1042-S and other year-end tax information provide shareholders with actual calendar year amounts that should be included in their tax returns. Shareholders should consult their tax advisors.
The following distribution information is being provided as required by the Internal Revenue Code or to meet a specific state’s requirement.
The Fund designates the following amounts or, if subsequently determined to be different, the maximum amount allowable for its fiscal year ended August 31, 2017:
Federal and State Income Tax | ||||
Qualified Dividend Income* | 0 | % | ||
Corporate Dividends Received Deduction* | 0 | % | ||
U.S. Treasury Obligations* | 0 | % | ||
Tax-Exempt Interest Dividends* | 100 | % | ||
| * | The above percentages are based on ordinary income dividends paid to shareholders during the Fund’s fiscal year. |
29 Invesco Pennsylvania Tax Free Income Fund
Proxy Results
A Special Joint Meeting (“Meeting”) of Shareholders of Invesco Pennsylvania Tax Free Income Fund, an investment portfolio of AIM Counselor Series Trust (Invesco Counselor Series Trust), a Delaware statutory trust (“Trust”), was held on March 9, 2017. The Meeting was held for the following purposes:
| (1) | Elect 15 trustees to the Board, each of whom will serve until his or her successor is elected and qualified. |
| (2) | Approve an amendment to the Trust’s Agreement and Declaration of Trust that would permit fund mergers and other significant transactions upon the Board’s approval but without shareholder approval of such transactions. |
The results of the voting on the above matters were as follows:
| Matters | Votes For | Votes Withheld | ||||||||||||||||
| (1)* | David C. Arch | 1,425,647,604 | 36,521,875 | |||||||||||||||
| James T. Bunch | 1,425,181,099 | 36,988,380 | ||||||||||||||||
| Bruce L. Crockett | 1,425,174,694 | 36,994,785 | ||||||||||||||||
| Jack M. Fields | 1,426,060,874 | 36,108,605 | ||||||||||||||||
| Martin L. Flanagan | 1,426,481,477 | 35,688,002 | ||||||||||||||||
| Cynthia Hostetler | 1,426,489,972 | 35,679,505 | ||||||||||||||||
| Dr. Eli Jones | 1,426,255,832 | 35,913,647 | ||||||||||||||||
| Dr. Prema Mathai-Davis | 1,425,363,789 | 36,805,689 | ||||||||||||||||
| Teresa M. Ressel | 1,426,514,880 | 35,654,598 | ||||||||||||||||
| Dr. Larry Soll | 1,424,932,245 | 37,237,234 | ||||||||||||||||
| Ann Barnett Stern | 1,426,260,049 | 35,909,429 | ||||||||||||||||
| Raymond Stickel, Jr. | 1,425,391,657 | 36,777,822 | ||||||||||||||||
| Philip A. Taylor | 1,426,285,212 | 35,884,267 | ||||||||||||||||
| Robert C. Troccoli | 1,426,075,097 | 36,094,382 | ||||||||||||||||
| Christopher L. Wilson | 1,426,594,956 | 35,574,523 | ||||||||||||||||
| Votes For | Votes Against | Votes Abstain | Broker Non-Votes | |||||||||||||||
| (2)* | Approve an amendment to the Trust’s Agreement and Declaration of Trust that would permit fund mergers and other significant transactions upon the Board’s approval but without shareholder approval of such transactions | 751,302,707 | 79,810,344 | 41,561,890 | 589,495,482 | |||||||||||||
The Meeting was adjourned until April 11, 2017, with respect to the following proposals:
| (3) | Approve changing the fundamental investment restriction regarding the purchase or sale of physical commodities. |
| 4(a) | Approve an amendment to the current Master Intergroup Sub-Advisory Contract to add Invesco PowerShares Capital Management LLC. |
| 4(b) | Approve an amendment to the current Master Intergroup Sub-Advisory Contract to add Invesco Asset Management (India) Private Limited. |
The results of the voting on the above matters were as follows:
| Matters | Votes For | Votes Against | Votes Abstain | Broker Non-Votes | ||||||||||||||
| (3) | Approve changing the fundamental investment restriction regarding the purchase or sale of physical commodities | 3,278,824 | 207,144 | 162,562 | 1,127,983 | |||||||||||||
| 4(a) | Approve an amendment to the current Master Intergroup Sub-Advisory Contract to add Invesco PowerShares Capital Management LLC | 3,343,831 | 165,706 | 138,995 | 1,127,981 | |||||||||||||
| 4(b) | Approve an amendment to the current Master Intergroup Sub-Advisory Contract to add Invesco Asset Management (India) Private Limited | 3,244,533 | 219,974 | 184,023 | 1,127,983 | |||||||||||||
| * | Each of proposal 1 and 2 required approval by a combined vote of all of the portfolios of AIM Counselor Series Trust (Invesco Counselor Series Trust). |
30 Invesco Pennsylvania Tax Free Income Fund
Trustees and Officers
The address of each trustee and officer is AIM Counselor Series Trust (Invesco Counselor Series Trust) (the “Trust”), 11 Greenway Plaza, Suite 1000, Houston, Texas 77046-1173. The trustees serve for the life of the Trust, subject to their earlier death, incapacitation, resignation, retirement or removal as more specifically provided in the Trust’s organizational documents. Each officer serves for a one year term or until their successors are elected and qualified. Column two below includes length of time served with predecessor entities, if any.
| Name, Year of Birth and Position(s) Held with the Trust | Trustee and/ or Officer Since | Principal Occupation(s) During Past 5 Years | Number of Overseen by | Other Directorship(s) Held by Trustee During Past 5 Years | ||||
| Interested Persons | ||||||||
| Martin L. Flanagan1 — 1960 Trustee | 2007 | Executive Director, Chief Executive Officer and President, Invesco Ltd. (ultimate parent of Invesco and a global investment management firm); Trustee, The Invesco Funds; Vice Chair, Investment Company Institute; and Member of Executive Board, SMU Cox School of Business
Formerly: Advisor to the Board, Invesco Advisers, Inc. (formerly known as Invesco Institutional (N.A.), Inc.); Chairman and Chief Executive Officer, Invesco Advisers, Inc. (registered investment adviser); Director, Chairman, Chief Executive Officer and President, Invesco Holding Company (US), Inc. (formerly IVZ Inc.) (holding company), Invesco Group Services, Inc. (service provider) and Invesco North American Holdings, Inc. (holding company); Director, Chief Executive Officer and President, Invesco Holding Company Limited (parent of Invesco and a global investment management firm); Director, Invesco Ltd.; Chairman, Investment Company Institute and President, Co-Chief Executive Officer, Co-President, Chief Operating Officer and Chief Financial Officer, Franklin Resources, Inc. (global investment management organization) | 144 | None | ||||
Philip A. Taylor2 — 1954 Trustee and Senior Vice President | 2006 | Head of the Americas and Senior Managing Director, Invesco Ltd.; Director, Invesco Advisers, Inc. (formerly known as Invesco Institutional (N.A.), Inc.) (registered investment adviser); Director, Chairman, Chief Executive Officer and President, Invesco Management Group, Inc. (formerly known as Invesco Aim Management Group, Inc.) (financial services holding company); Director and Chairman, Invesco Investment Services, Inc. (formerly known as Invesco Aim Investment Services, Inc.) (registered transfer agent); Chief Executive Officer, Invesco Corporate Class Inc. (corporate mutual fund company); Director, Chairman and Chief Executive Officer, Invesco Canada Ltd. (formerly known as Invesco Trimark Ltd./Invesco Trimark Ltèe) (registered investment adviser and registered transfer agent); Trustee and Senior Vice President, The Invesco Funds; Director, Invesco Investment Advisers LLC (formerly known as Van Kampen Asset Management).
Formerly: Co-Chairman, Co-President and Co-Chief Executive Officer, Invesco Advisers, Inc. (formerly known as Invesco Institutional (N.A.), Inc.) (registered investment adviser); Director, Chief Executive Officer and President, Van Kampen Exchange Corp; President and Principal Executive Officer, The Invesco Funds (other than AIM Treasurer’s Series Trust (Invesco Treasurer’s Series Trust), Short-Term Investments Trust and Invesco Management Trust); Executive Vice President, The Invesco Funds (AIM Treasurer’s Series Trust (Invesco Treasurer’s Series Trust), Short-Term Investments Trust and Invesco Management Trust only); Director and President, INVESCO Funds Group, Inc. (registered investment adviser and registered transfer agent); Director and Chairman, IVZ Distributors, Inc. (formerly known as INVESCO Distributors, Inc.) (registered broker dealer); Director, President and Chairman, Invesco Inc. (holding company), Invesco Canada Holdings Inc. (holding company), Trimark Investments Ltd./Placements Trimark Ltèe and Invesco Financial Services Ltd/Services Financiers Invesco Ltèe; Chief Executive Officer, Invesco Canada Fund Inc. (corporate mutual fund company); Director and Chairman, Van Kampen Investor Services Inc.; Director, Chief Executive Officer and President, 1371 Preferred Inc. (holding company) and Van Kampen Investments Inc.; Director and President, AIM GP Canada Inc. (general partner for limited partnerships) and Van Kampen Advisors, Inc.; Director and Chief Executive Officer, Invesco Trimark Dealer Inc. (registered broker dealer); Director, Invesco Distributors, Inc. (formerly known as Invesco Aim Distributors, Inc.) (registered broker dealer); Manager, Invesco PowerShares Capital Management LLC; Director, Chief Executive Officer and President, Invesco Advisers, Inc.; Director, Chairman, Chief Executive Officer and President, Invesco Aim Capital Management, Inc.; President, Invesco Trimark Dealer Inc. and Invesco Trimark Ltd./Invesco Trimark Ltèe; Director and President, AIM Trimark Corporate Class Inc. and AIM Trimark Canada Fund Inc.; Senior Managing Director, Invesco Holding Company Limited; Director and Chairman, Fund Management Company (former registered broker dealer); President and Principal Executive Officer, The Invesco Funds (AIM Treasurer’s Series Trust (Invesco Treasurer’s Series Trust), and Short-Term Investments Trust only); President, AIM Trimark Global Fund Inc. and AIM Trimark Canada Fund Inc. | 144 | None |
| 1 | Mr. Flanagan is considered an interested person (within the meaning of Section 2(a)(19) of the 1940 Act) of the Trust because he is an officer of the Adviser to the Trust, and an officer and a director of Invesco Ltd., ultimate parent of the Adviser. |
| 2 | Mr. Taylor is considered an interested person (within the meaning of Section 2(a)(19) of the 1940 Act) of the Trust because he is an officer and a director of the Adviser. |
T-1 Invesco Pennsylvania Tax Free Income Fund
Trustees and Officers—(continued)
| Name, Year of Birth and Position(s) Held with the Trust | Trustee and/ or Officer Since | Principal Occupation(s) During Past 5 Years | Number of Complex Overseen by Trustee | Other Directorship(s) Held by Trustee During | ||||
| Independent Trustees | ||||||||
Bruce L. Crockett — 1944 Trustee and Chair | 2003 | Chairman, Crockett Technologies Associates (technology consulting company)
Formerly: Director, Captaris (unified messaging provider); Director, President and Chief Executive Officer, COMSAT Corporation; Chairman, Board of Governors of INTELSAT (international communications company); ACE Limited (insurance company); Independent Directors Council and Investment Company Institute: Member of the Audit Committee, Investment Company Institute; Member of the Executive Committee and Chair of the Governance Committee, Independent Directors Council | 144 | Director and Chairman of the Audit Committee, ALPS (Attorneys Liability Protection Society) (insurance company); Director and Member of the Audit Committee, Ferroglobe PLC (metallurgical company) | ||||
David C. Arch — 1945 Trustee | 2010 | Chairman of Blistex Inc. (consumer health care products manufacturer); Member, World Presidents’ Organization | 144 | Board member of the Illinois Manufacturers’ Association | ||||
James T. Bunch — 1942 Trustee | 2000 | Managing Member, Grumman Hill Group LLC (family office/private equity investments)
Formerly: Chairman of the Board, Denver Film Society; Chairman of the Board of Trustees, Evans Scholarship Foundation; Chairman, Board of Governors, Western Golf Association | 144 | Trustee, Evans Scholarship Foundation | ||||
Jack M. Fields — 1952 Trustee | 2003 | Chief Executive Officer, Twenty First Century Group, Inc. (government affairs company); and Discovery Learning Alliance (non-profit)
Formerly: Owner and Chief Executive Officer, Dos Angeles Ranch L.P. (cattle, hunting, corporate entertainment); Director, Insperity, Inc. (formerly known as Administaff); Chief Executive Officer, Texana Timber LP (sustainable forestry company); Director of Cross Timbers Quail Research Ranch (non-profit); and member of the U.S. House of Representatives | 144 | None | ||||
Cynthia Hostetler — 1962 Trustee | 2017 | Non-Executive Director and Trustee of a number of public and private business corporations
Formerly: Head of Investment Funds and Private Equity, Overseas Private Investment Corporation; President, First Manhattan Bancorporation, Inc.; Attorney, Simpson Thacher & Bartlett LLP | 144 | Vulcan Materials Company (construction materials company); Trilinc Global Impact Fund; Aberdeen Investment Funds (4 portfolios); Artio Global Investment LLC (mutual fund complex); Edgen Group, Inc. (specialized energy and infrastructure products distributor) | ||||
Eli Jones — 1961 Trustee | 2016 | Professor and Dean, Mays Business School — Texas A&M University
Formerly: Professor and Dean, Walton College of Business, University of Arkansas and E.J. Ourso College of Business, Louisiana State University; Director, Arvest Bank | 144 | Insperity, Inc. (formerly known as Administaff) (human resources provider) | ||||
Prema Mathai-Davis — 1950 Trustee | 2003 | Retired.
Formerly: Chief Executive Officer, YWCA of the U.S.A. | 144 | None | ||||
Teresa M. Ressel — 1962 Trustee | 2017 | Non-executive director and trustee of a number of public and private business corporations
Formerly: Chief Financial Officer, Olayan America, The Olayan Group (international investor/commercial/industrial); Chief Executive Officer, UBS Securities LLC; Group Chief Operating Officer, Americas, UBS AG; Assistant Secretary for Management & Budget and CFO, US Department of the Treasury; Chief Compliance Officer, Kaiser Permanente; Program Manager, Hewlett-Packard; Nuclear Engineering, General Dynamics Corporation | 144 | Atlantic Power Corporation (power generation company); ON Semiconductor Corp. (semiconductor supplier) | ||||
Larry Soll — 1942 Trustee | 1997 | Retired.
Formerly: Chairman, Chief Executive Officer and President, Synergen Corp. (a biotechnology company) | 144 | None | ||||
Ann Barnett Stern — 1957 Trustee | 2017 | President and Chief Executive Officer, Houston Endowment Inc. (private philanthropic institution)
Formerly: Executive Vice President and General Counsel, Texas Children’s Hospital; Attorney, Beck, Redden and Secrest, LLP; Business Law Instructor, University of St. Thomas; Attorney, Andrews & Kurth LLP | 144 | Federal Reserve Bank of Dallas | ||||
Raymond Stickel, Jr. — 1944 Trustee | 2005 | Retired.
Formerly: Director, Mainstay VP Series Funds, Inc. (25 portfolios); Partner, Deloitte & Touche | 144 | None | ||||
Robert C. Troccoli — 1949 Trustee | 2016 | Adjunct Professor, University of Denver — Daniels College of Business
Formerly: Senior Partner, KPMG LLP | 144 | None | ||||
Christopher L. Wilson — 1957 Trustee | 2017 | Managing Partner, CT2, LLC (investing and consulting firm)
Formerly: President/Chief Executive Officer, Columbia Funds, Bank of America Corporation; President/Chief Executive Officer, CDC IXIS Asset Management Services, Inc.; Principal & Director of Operations, Scudder Funds, Scudder, Stevens & Clark, Inc.; Assistant Vice President, Fidelity Investments | 144 | TD Asset Management USA Inc. (mutual fund complex) (22 portfolios); ISO New England, Inc. (non-profit organization managing regional electricity market) |
T-2 Invesco Pennsylvania Tax Free Income Fund
Trustees and Officers—(continued)
| Name, Year of Birth and Position(s) Held with the Trust | Trustee and/ or Officer Since | Principal Occupation(s) During Past 5 Years | Number of Complex Overseen by Trustee | Other Directorship(s) Held by Trustee During | ||||
| Other Officers | ||||||||
Sheri Morris — 1964 President, Principal Executive Officer and Treasurer | 2003 | President, Principal Executive Officer and Treasurer, The Invesco Funds; Vice President, Invesco Advisers, Inc. (formerly known as Invesco Institutional (N.A.), Inc.) (registered investment adviser); and Vice President, PowerShares Exchange-Traded Fund Trust, PowerShares Exchange-Traded Fund Trust II, PowerShares India Exchange-Traded Fund Trust, PowerShares Actively Managed Exchange-Traded Fund Trust and PowerShares Actively Managed Exchange-Traded Commodity Fund Trust
Formerly: Vice President and Principal Financial Officer, The Invesco Funds; Vice President, Invesco Aim Advisers, Inc., Invesco Aim Capital Management, Inc. and Invesco Aim Private Asset Management, Inc.; Assistant Vice President and Assistant Treasurer, The Invesco Funds and Assistant Vice President, Invesco Advisers, Inc., Invesco Aim Capital Management, Inc. and Invesco Aim Private Asset Management, Inc.; and Treasurer, PowerShares Exchange-Traded Fund Trust, PowerShares Exchange-Traded Fund Trust II, PowerShares India Exchange-Traded Fund Trust and PowerShares Actively Managed Exchange-Traded Fund Trust | N/A | N/A | ||||
Russell C. Burk — 1958 Senior Vice President and Senior Officer | 2005 | Senior Vice President and Senior Officer, The Invesco Funds | N/A | N/A | ||||
John M. Zerr — 1962 Senior Vice President, Chief Legal Officer and Secretary | 2006 | Director, Senior Vice President, Secretary and General Counsel, Invesco Management Group, Inc. (formerly known as Invesco AIM Management Group, Inc.); Senior Vice President, Invesco Advisers, Inc. (formerly known as Invesco Institutional (N.A.), Inc.) (registered investment adviser); Senior Vice President and Secretary, Invesco Distributors, Inc. (formerly known as Invesco AIM Distributors, Inc.); Director, Vice President and Secretary, Invesco Investment Services, Inc. (formerly known as Invesco AIM Investment Services, Inc.) Senior Vice President, Chief Legal Officer and Secretary, The Invesco Funds; Managing Director, Invesco PowerShares Capital Management LLC; Director, Secretary and General Counsel, Invesco Investment Advisers LLC (formerly known as Van Kampen Asset Management); Secretary and General Counsel, Invesco Capital Markets, Inc. (formerly known as Van Kampen Funds Inc.) and Chief Legal Officer, PowerShares Exchange-Traded Fund Trust, PowerShares Exchange-Traded Fund Trust II, PowerShares India Exchange-Traded Fund Trust, PowerShares Actively Managed Exchange-Traded Fund Trust and PowerShares Actively Managed Exchange-Traded Commodity Fund Trust; Manager and Secretary, Invesco Indexing LLC
Formerly: Director, Secretary, General Counsel and Senior Vice President, Van Kampen Exchange Corp.; Director, Vice President and Secretary, IVZ Distributors, Inc. (formerly known as INVESCO Distributors, Inc.); Director and Vice President, INVESCO Funds Group, Inc.; Director and Vice President, Van Kampen Advisors Inc.; Director, Vice President, Secretary and General Counsel, Van Kampen Investor Services Inc.; Director, Invesco Distributors, Inc. (formerly known as Invesco AIM Distributors, Inc.); Director, Senior Vice President, General Counsel and Secretary, Invesco AIM Advisers, Inc. and Van Kampen Investments Inc.; Director, Vice President and Secretary, Fund Management Company; Director, Senior Vice President, Secretary, General Counsel and Vice President, Invesco AIM Capital Management, Inc.; Chief Operating Officer and General Counsel, Liberty Ridge Capital, Inc. (an investment adviser); Vice President and Secretary, PBHG Funds (an investment company) and PBHG Insurance Series Fund (an investment company); Chief Operating Officer, General Counsel and Secretary, Old Mutual Investment Partners (a broker-dealer); General Counsel and Secretary, Old Mutual Fund Services (an administrator) and Old Mutual Shareholder Services (a shareholder servicing center); Executive Vice President, General Counsel and Secretary, Old Mutual Capital, Inc. (an investment adviser); and Vice President and Secretary, Old Mutual Advisors Funds (an investment company) | N/A | N/A | ||||
Gregory G. McGreevey — 1962 Senior Vice President | 2012 | Senior Managing Director, Invesco Ltd.; Director, Chairman, President, and Chief Executive Officer, Invesco Advisers, Inc. (formerly known as Invesco Institutional (N.A.), Inc.) (registered investment adviser); Director, Invesco Mortgage Capital, Inc. and Invesco Senior Secured Management, Inc.; and Senior Vice President, The Invesco Funds
Formerly: Assistant Vice President, The Invesco Funds | N/A | N/A | ||||
Kelli Gallegos — 1970 Vice President, Principal Financial Officer and Assistant Treasurer | 2008 | Vice President, Principal Financial Officer and Assistant Treasurer, The Invesco Funds; Assistant Treasurer, Invesco PowerShares Capital Management LLC, PowerShares Exchange-Traded Fund Trust, PowerShares Exchange-Traded Fund Trust II, PowerShares India Exchange-Traded Fund Trust, PowerShares Actively Managed Exchange-Traded Fund Trust and PowerShares Actively Managed Exchange-Traded Commodity Fund Trust
Formerly: Assistant Vice President, The Invesco Funds | N/A | N/A |
T-3 Invesco Pennsylvania Tax Free Income Fund
Trustees and Officers—(continued)
| Name, Year of Birth and Position(s) Held with the Trust | Trustee and/ or Officer Since | Principal Occupation(s) During Past 5 Years | Number of Complex Overseen by Trustee | Other Directorship(s) Held by Trustee During | ||||
| Other Officers—(continued) | ||||||||
Tracy Sullivan — 1962 Vice President, Chief Tax Officer and Assistant Treasurer | 2008 | Vice President, Chief Tax Officer and Assistant Treasurer, The Invesco Funds; Assistant Treasurer, Invesco PowerShares Capital Management LLC, PowerShares Exchange-Traded Fund Trust, PowerShares Exchange-Traded Fund Trust II, PowerShares India Exchange-Traded Fund Trust, PowerShares Actively Managed Exchange-Traded Fund Trust and PowerShares Actively Managed Exchange-Traded Commodity Fund Trust
Formerly: Assistant Vice President, The Invesco Funds | N/A | N/A | ||||
Crissie M. Wisdom — 1969 Anti-Money Laundering Compliance Officer | 2013 | Anti-Money Laundering Compliance Officer, Invesco Advisers, Inc. (formerly known as Invesco Institutional (N.A.), Inc.) (registered investment adviser), Invesco Capital Markets, Inc. (formerly known as Van Kampen Funds Inc.), Invesco Distributors, Inc., Invesco Investment Services, Inc., Invesco Management Group, Inc., The Invesco Funds, and PowerShares Exchange-Traded Fund Trust, PowerShares Exchange-Traded Fund Trust II, PowerShares India Exchange-Traded Fund Trust, PowerShares Actively Managed Exchange-Traded Fund Trust and PowerShares Actively Managed Exchange-Traded Commodity Fund Trust; Anti-Money Laundering Compliance Officer and Bank Secrecy Act Officer, INVESCO National Trust Company and Invesco Trust Company; and Fraud Prevention Manager and Controls and Risk Analysis Manager for Invesco Investment Services, Inc.
Formerly: Anti-Money Laundering Compliance Officer, Van Kampen Exchange Corp. | N/A | N/A | ||||
Robert R. Leveille — 1969 Chief Compliance Officer | 2016 | Chief Compliance Officer, Invesco Advisers, Inc. (registered investment adviser); and Chief Compliance Officer, The Invesco Funds
Formerly: Chief Compliance Officer, Putnam Investments and the Putnam Funds | N/A | N/A |
The Statement of Additional Information of the Trust includes additional information about the Fund’s Trustees and is available upon request, without charge, by calling 1.800.959.4246. Please refer to the Fund’s Statement of Additional Information for information on the Fund’s sub-advisers.
Office of the Fund 11 Greenway Plaza, Suite 1000 Houston, TX 77046-1173 | Investment Adviser Invesco Advisers, Inc. 1555 Peachtree Street, N.E. Atlanta, GA 30309 | Distributor Invesco Distributors, Inc. 11 Greenway Plaza, Suite 1000 Houston, TX 77046-1173 | Auditors PricewaterhouseCoopers LLP 1000 Louisiana Street, Suite 5800 Houston, TX 77002-5678 | |||
Counsel to the Fund Stradley Ronon Stevens & Young, LLP 2005 Market Street, Suite 2600 Philadelphia, PA 19103-7018 | Counsel to the Independent Trustees Goodwin Procter LLP 901 New York Avenue, N.W. Washington, D.C. 20001 | Transfer Agent Invesco Investment Services, Inc. 11 Greenway Plaza, Suite 1000 Houston, TX 77046-1173 | Custodian State Street Bank and Trust Company 225 Franklin Street Boston, MA 02110-2801 | |||
T-4 Invesco Pennsylvania Tax Free Income Fund
Explore High-Conviction Investing with Invesco

Go paperless with eDelivery
Visit invesco.com/edelivery to enjoy the convenience and security of anytime electronic access to your investment documents.
With eDelivery, you can elect to have any or all of the following materials delivered straight to your inbox to download, save and print from your own computer:
∎ Fund reports and prospectuses
∎ Quarterly statements
∎ Daily confirmations
∎ Tax forms
Invesco mailing information
Send general correspondence to Invesco Investment Services, Inc., P.O. Box 219078, Kansas City, MO 64121-9078.
Important notice regarding delivery of security holder documents
To reduce Fund expenses, only one copy of most shareholder documents may be mailed to shareholders with multiple accounts at the same address (Householding). Mailing of your shareholder documents may be householded indefinitely unless you instruct us otherwise. If you do not want the mailing of these documents to be combined with those for other members of your household, please contact Invesco Investment Services, Inc. at 800 959 4246 or contact your financial institution. We will begin sending you individual copies for each account within 30 days after receiving your request.
Fund holdings and proxy voting information
The Fund provides a complete list of its holdings four times in each fiscal year, at the quarter ends. For the second and fourth quarters, the lists appear in the Fund’s semiannual and annual reports to shareholders. For the first and third quarters, the Fund files the lists with the Securities and Exchange Commission (SEC) on Form N-Q. The most recent list of portfolio holdings is available at invesco.com/completeqtrholdings. Shareholders can also look up the Fund’s Forms N-Q on the SEC website at sec.gov. Copies of the Fund’s Forms N-Q may be reviewed and copied at the SEC Public Reference Room in Washington, D.C. You can obtain information on the operation of the Public Reference Room, including information about duplicating fee charges, by calling 202 551 8090 or 800 732 0330, or by electronic request at the following email address: publicinfo@sec.gov.
The SEC file numbers for the Fund are shown below.
A description of the policies and procedures that the Fund uses to determine how to vote proxies relating to portfolio securities is available without charge, upon request, from our Client Services department at 800 959 4246 or at invesco.com/proxyguidelines. The information is also available on the SEC website, sec.gov.
Information regarding how the Fund voted proxies related to its portfolio securities during the most recent 12-month period ended June 30 is available at invesco.com/proxysearch. The information is also available on the SEC website, sec.gov. Invesco Advisers, Inc. is an investment adviser; it provides investment advisory services to individual and institutional clients and does not sell securities. Invesco Distributors, Inc. is the US distributor for Invesco Ltd.’s retail mutual funds, exchange-traded funds and institutional money market funds. Both are wholly owned, indirect subsidiaries of Invesco Ltd. |  |
SEC file numbers: 811-09913 and 333-36074 Invesco Distributors, Inc. VK-PTFI-AR-1 10232017 1439
| ||||
 |
Annual Report to Shareholders
| August 31, 2017 | ||
Invesco S&P 500 Index Fund | ||||
Nasdaq: A: SPIAX ◾ B: SPIBX ◾ C: SPICX ◾ Y: SPIDX ◾ R6: SPISX
| ||||

Letters to Shareholders
Philip Taylor | Dear Shareholders: This annual report includes information about your Fund, including performance data and a complete list of its investments as of the close of the reporting period. Inside is a discussion of how your Fund was managed and the factors that affected its performance during the reporting period. The reporting period began with stock market volatility in the US and abroad, largely the result of uncertainty about global economic growth and monetary policy. While economic data in the US were generally positive, news overseas was less upbeat. The European Central Bank and central banks in China and Japan – as well as other countries – maintained extraordinarily accommodative monetary policies in response to economic weakness. Citing generally positive |

economic data – specifically, realized and expected labor market conditions and inflation – the US Federal Reserve raised interest rates three times during the reporting period: in December 2016, and in March and June 2017. The major US stock market rally that began in November 2016 continued through the end of the reporting period, with major stock market indexes repeatedly hitting new record highs.
Short-term market volatility can prompt some investors to abandon their investment plans – and can cause others to settle for whatever returns the market has to offer. The investment professionals at Invesco, in contrast, invest with high conviction. This means that, no matter the asset class or the strategy, each investment team has a passion to exceed. We want to help investors achieve better outcomes, such as seeking higher returns, helping mitigate risk and generating income. Of course, investing with high conviction can’t guarantee a profit or ensure success; no investment strategy can. To learn more about how we invest with high conviction, visit invesco.com/HighConviction.
You, too, can invest with high conviction by maintaining a long-term investment perspective and by working with your financial adviser on a regular basis. During periods of short-term market volatility or uncertainty, your financial adviser can keep you focused on your long-term investment goals – a new home, a child’s college education or a secure retirement. He or she also can share research about the economy, the markets and individual investment options.
Visit our website for more information on your investments
Our website, invesco.com/us, offers a wide range of market insights and investment perspectives. On the website, you’ll find detailed information about our funds, including performance, holdings and portfolio manager commentaries. You can access information about your account by completing a simple, secure online registration. To do so, select “Log In” on the right side of the homepage, and then select “Register for Individual Account Access.”
In addition to the resources accessible on our website and through our mobile app, you can obtain timely updates to help you stay informed about the markets and the economy by connecting with Invesco on Twitter, LinkedIn or Facebook. You can access our blog at blog.invesco.us.com. Our goal is to provide you the information you want, when and where you want it.
Finally, I’m pleased to share with you Invesco’s commitment to both the Principles for Responsible Investment and to considering environmental, social and governance issues in our robust investment process. I invite you to learn more at invesco.com/esg.
Have questions?
For questions about your account, contact an Invesco client services representative at 800 959 4246. For Invesco-related questions or comments, please email me directly at phil@invesco.com.
All of us at Invesco look forward to serving your investment management needs. Thank you for investing with us.
Sincerely,

Philip Taylor
Senior Managing Director, Invesco Ltd.
2 Invesco S&P 500 Index Fund
Bruce Crockett | Dear Fellow Shareholders: Among the many important lessons I’ve learned in more than 40 years in a variety of business endeavors is the value of a trusted advocate. As independent chair of the Invesco Funds Board, I can assure you that the members of the Board are strong advocates for the interests of investors in Invesco’s mutual funds. We work hard to represent your interests through oversight of the quality of the investment management services your funds receive and other matters important to your investment, including but not limited to: ∎ Ensuring that Invesco offers a diverse lineup of mutual funds that your financial adviser can use to strive to meet your financial needs as your investment goals change over time. ∎ Monitoring how the portfolio management teams of the Invesco funds are performing in light of changing economic and market conditions. |

| ∎ | Assessing each portfolio management team’s investment performance within the context of the investment strategy described in the fund’s prospectus. |
| ∎ | Monitoring for potential conflicts of interests that may impact the nature of the services that your funds receive. |
We believe one of the most important services we provide our fund shareholders is the annual review of the funds’ advisory and sub-advisory contracts with Invesco Advisers and its affiliates. This review is required by the Investment Company Act of 1940 and focuses on the nature and quality of the services Invesco provides as the adviser to the Invesco funds and the reasonableness of the fees that it charges for those services. Each year, we spend months carefully reviewing information received from Invesco and a variety of independent sources, such as performance and fee data prepared by Lipper, Inc. (a subsidiary of Broadridge Financial Solutions, Inc.), an independent, third-party firm widely recognized as a leader in its field. We also meet with our independent legal counsel and other independent advisers to review and help us assess the information that we have received. Our goal is to assure that you receive quality investment management services for a reasonable fee.
I trust the measures outlined above provide assurance that you have a worthy advocate when it comes to choosing the Invesco Funds.
As always, please contact me at bruce@brucecrockett.com with any questions or concerns you may have. On behalf of the Board, we look forward to continuing to represent your interests and serving your needs.
Sincerely,

Bruce L. Crockett
Independent Chair
Invesco Funds Board of Trustees
3 Invesco S&P 500 Index Fund
Management’s Discussion of Fund Performance
| Performance summary |
For the fiscal year ended August 31, 2017, Invesco S&P 500 Index Fund (the Fund) sought to provide investment results that, before expenses, corresponded to the total return of the S&P 500 Index, the Fund’s broad market/style-specific benchmark.
Your Fund’s long-term performance appears later in this report.
Fund vs. Indexes
Total returns, 8/31/16 to 8/31/17, at net asset value (NAV). Performance shown does not include applicable contingent deferred sales charges (CDSC) or front-end sales charges, which would have reduced performance.
Class A Shares | 15.55 | % | ||
Class B Shares | 14.71 | |||
Class C Shares | 14.67 | |||
Class Y Shares | 15.83 | |||
Class R6 Shares* | 15.74 | |||
S&P 500 Indexq (Broad Market/Style-Specific Index) | 16.23 | |||
Lipper S&P 500 Objective Funds Index∎ (Peer Group Index) | 15.92 |
Source(s): qFactSet Research Systems Inc.; ∎Lipper Inc.
*Class R6 shares incepted on April 4, 2017. See page 7 for more information.
Market conditions and your Fund
The fiscal year began with major US stock market indexes posting gains, with most hitting record highs following the US presidential election. Investors seemed to believe that the new administration’s plans to reduce tax rates, scale back regulations and increase infrastructure spending had the potential to stimulate economic growth. However, that was called into question in the first quarter of 2017, when headlines out of Washington, DC, suggested that enacting significant regulatory and tax reform might be more difficult than previously anticipated. Signs of an improving economy prompted the US Federal Reserve (the Fed) to raise interest rates three times during the reporting period: in December 2016 and in March and June 2017. In the first quarter of 2017, the US economy grew at an anemic rate, with gross
domestic product rising at an annualized rate of just 1.2%.1 However, the economy picked up steam during the second quarter. Unemployment continued its years-long decline, hitting a 16-year low of 4.3% in the summer of 2017.2 US equities were strong throughout the reporting period, and major US equity market indexes hit new record highs during the summer.
While US stock market indexes rose for the reporting period ended August 31, 2017, individual market sectors performed very differently from one another. Information technology (IT), financials and industrials were the strongest-performing sectors, while energy, telecommunication services and real estate were the weakest-performing sectors.
Invesco S&P 500 Index Fund invests in stocks in approximately the same proportion as they are represented in the S&P 500 Index.
During the fiscal year, the IT, financials, industrials, health care and consumer discretionary sectors contributed the most to overall Fund performance. All market sectors, except for energy and telecommunication services, generated positive overall returns for the Fund.
IT and financial holdings were some of the largest contributors to the Fund’s performance during the reporting period. Within the IT sector, leading contributors included Apple, Microsoft and Facebook. JP Morgan Chase and Bank of America were top contributors from the financials sector.
Several US-based energy companies, including Schlumberger and Exxon Mobil, detracted from Fund performance due to falling oil prices.
Please note that the Fund’s strategy is principally implemented through equity investments, but the Fund also may use S&P 500 futures contracts, derivative instruments, to gain exposure to the equity market. During the reporting period, the Fund invested in S&P 500 futures contracts, which generated a positive return and were a slight contributor to Fund performance. Derivatives can be a cost-effective way to gain exposure to asset classes. However, derivatives may amplify traditional investment risks through the creation of leverage and may be less liquid than traditional securities.
Thank you for your investment in Invesco S&P 500 Index Fund.
| 1 | Bureau of Economic Analysis |
| 2 | Bureau of Labor Statistics, Bloomberg |
| Portfolio Composition | |||||
| By sector | % of total net assets | ||||
Information Technology | 23.2 | % | |||
Health Care | 14.4 | ||||
Financials | 14.0 | ||||
Consumer Discretionary | 11.9 | ||||
Industrials | 9.9 | ||||
Consumer Staples | 8.4 | ||||
Energy | 5.6 | ||||
Utilities | 3.2 | ||||
Real Estate | 3.0 | ||||
Materials | 2.9 | ||||
Telecommunication Services | 2.1 | ||||
Money Market Funds | |||||
Plus Other Assets Less Liabilities | 1.4 | ||||
Top 10 Equity Holdings* | |||||
| % of total net assets | |||||
1. Apple Inc. | 4.0 | % | |||
2. Microsoft Corp. | 2.7 | ||||
3. Facebook Inc.-Class A | 1.9 | ||||
4. Amazon.com, Inc. | 1.8 | ||||
5. Johnson & Johnson | 1.7 | ||||
6. Berkshire Hathaway Inc.- | 1.6 | ||||
7. Exxon Mobil Corp. | 1.5 | ||||
8. JPMorgan Chase & Co. | 1.5 | ||||
9. Alphabet Inc.-Class A | 1.3 | ||||
10. Alphabet Inc.-Class C | 1.3 | ||||
Total Net Assets | $ | 1.1 million | ||
Total Number of Holdings* | 506 | |||
The Fund’s holdings are subject to change, and there is no assurance that the Fund will continue to hold any particular security.
*Excluding money market fund holdings.
Data presented here are as of August 31, 2017.
4 Invesco S&P 500 Index Fund
The views and opinions expressed in management’s discussion of Fund performance are those of Invesco Advisers, Inc. These views and opinions are subject to change at any time based on factors such as market and economic conditions. These views and opinions may not be relied upon as investment advice or recommendations, or as an offer for a particular security. The information is not a complete analysis of every aspect of any market, country, industry, security or the Fund. Statements of fact are from sources considered reliable, but Invesco Advisers, Inc. makes no representation or warranty as to their completeness or accuracy. Although historical performance is no guarantee of future results, these insights may help you understand our investment management philosophy.
See important Fund and, if applicable, index disclosures later in this report.
Anthony Munchak Chartered Financial Analyst, Portfolio Manager, is manager of Invesco S&P 500 | ||
 | ||
Index Fund. He joined Invesco in 2000. Mr. Munchak earned a BS and an MS in finance from Boston College and an MBA from Bentley College.
| ||
Glen Murphy Chartered Financial Analyst, Portfolio Manager, is manager of Invesco S&P 500 | ||
 | ||
Index Fund. He joined Invesco in 1995. Mr. Murphy earned a BA from the University of Massachusetts at Amherst and an MS in finance from Boston College.
| ||
Francis Orlando Chartered Financial Analyst, Portfolio Manager, is manager of Invesco S&P 500 | ||
 | ||
Index Fund. He joined Invesco in 1987. Mr. Orlando earned a BA in business administration from Merrimack College and an MBA from Boston University.
| ||
Daniel Tsai Chartered Financial Analyst, Portfolio Manager, is manager of Invesco S&P 500 | ||
 | ||
| Index Fund. He joined Invesco in 2000. Mr. Tsai earned a BS in mechanical engineering from National Taiwan University, an MS in mechanical engineering from the University of Michigan and an MS in computer science from Wayne State University. | ||
Anne Unflat Portfolio Manager, is manager of Invesco S&P 500 Index Fund. She joined Invesco in 1988. | ||||
 | ||||
Ms. Unflat earned a BA in economics from Queens College and an MBA in finance from St. John’s University.
| ||||
Donna Chapman Wilson Portfolio Manager and Director of Portfolio Management, is manager of Invesco S&P 500 | ||||
 | ||||
| Index Fund. She joined Invesco in 1997. Ms. Chapman Wilson earned a BA in economics from Hampton University and an MBA in finance from the Wharton School of the University of Pennsylvania. | ||||
5 Invesco S&P 500 Index Fund
Your Fund’s Long-Term Performance
Results of a $10,000 Investment – Oldest Share Class(es)
Fund and index data from 8/31/07
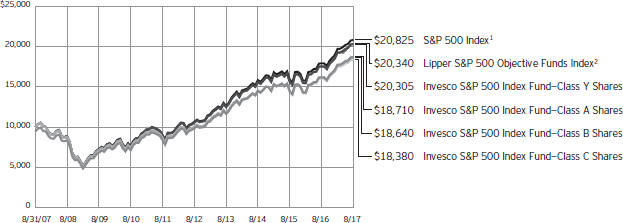
1 Souce: FactSet Research Systems Inc.
2 Source: Lipper Inc.
Past performance cannot guarantee comparable future results.
The data shown in the chart include reinvested distributions, applicable sales charges and Fund expenses including management fees. Results for Class B shares are calculated as if a hypothetical
shareholder had liquidated his entire investment in the Fund at the close of the reporting period and paid the contingent deferred sales charges, if applicable. Index results include reinvested dividends, but they do not reflect sales charges. Performance of the peer group,
if applicable, reflects fund expenses and management fees; performance of a market index does not. Performance shown in the chart and table(s) does not reflect deduction of taxes a shareholder would pay on Fund distributions or sale of Fund shares.
continued from page 8
| ∎ | Market risk. The market values of the Fund’s investments, and therefore the value of the Fund’s shares, will go up and down, sometimes rapidly or unpredictably. Market risk may affect a single issuer, industry or section of the economy, or it may affect the market as a whole. Individual stock prices tend to go up and down more dramatically than those of certain other types of investments, such as bonds. During a general downturn in the financial markets, multiple asset classes may decline in value. When markets perform well, there can be no assurance that specific investments held by the Fund will rise in value. |
About indexes used in this report
| ∎ | The S&P 500® Index is an unmanaged index considered representative of the US stock market. |
| ∎ | The Lipper S&P 500 Objective Funds Index is an unmanaged index considered representative of S&P 500 funds tracked by Lipper. |
| ∎ | A direct investment cannot be made in an index. Unless otherwise indicated, index results include reinvested dividends, and they do not reflect sales charges. Performance of the peer group, if applicable, reflects fund expenses; performance of a market index does not. |
Other information
| ∎ | The returns shown in management’s discussion of Fund performance are based on net asset values (NAVs) calculated for shareholder transactions. Generally accepted accounting principles require adjustments to be made to the net assets of the Fund at period end for financial reporting purposes, and as such, the NAVs for shareholder transactions and the returns based on those NAVs may differ from the NAVs and returns reported in the Financial Highlights. |
| ∎ | Industry classifications used in this report are generally according to the Global Industry Classification Standard, which was developed by and is the exclusive property and a service mark of MSCI Inc. and Standard & Poor’s. |
6 Invesco S&P 500 Index Fund
Average Annual Total Returns |
As of 8/31/17, including maximum applicable sales charges |
Class A Shares | ||||
Inception (9/26/97) | 6.02 | % | ||
10 Years | 6.47 | |||
5 Years | 12.41 | |||
1 Year | 9.21 | |||
Class B Shares | ||||
Inception (9/26/97) | 5.99 | % | ||
10 Years | 6.43 | |||
5 Years | 12.58 | |||
1 Year | 9.71 | |||
Class C Shares | ||||
Inception (9/26/97) | 5.52 | % | ||
10 Years | 6.28 | |||
5 Years | 12.83 | |||
1 Year | 13.67 | |||
Class Y Shares | ||||
Inception (9/26/97) | 6.57 | % | ||
10 Years | 7.34 | |||
5 Years | 13.96 | |||
1 Year | 15.83 | |||
Class R6 Shares | ||||
10 Years | 7.09 | % | ||
5 Years | 13.73 | |||
1 Year | 15.74 | |||
Effective June 1, 2010, Class A, Class B, Class C and Class I shares of the predecessor fund, Morgan Stanley S&P 500 Index Fund, advised by Morgan Stanley Investment Advisors Inc. were reorganized into Class A, Class B, Class C and Class Y shares, respectively, of Invesco S&P 500 Index Fund. Returns shown above, prior to June 1, 2010, for Class A, Class B, Class C and Class Y shares are blended returns of the predecessor fund and Invesco S&P 500 Index Fund. Share class returns will differ from the predecessor fund because of different expenses.
Class R6 shares incepted on April 4, 2017. Performance shown prior to that date is that of the Fund’s and the predecessor fund’s Class A shares and includes the 12b-1 fees applicable to Class A shares.
The performance data quoted represent past performance and cannot guarantee comparable future results; current performance may be lower or higher. Please visit invesco.com/performance for the most recent month-end performance. Performance figures reflect reinvested distributions, changes in net asset value and the effect of the maximum
Average Annual Total Returns | ||
As of 6/30/16, the most recent calendar quarter end, including maximum applicable sales charges | ||
Class A Shares | ||||
Inception (9/26/97) | 5.95 | % | ||
10 Years | 6.05 | |||
5 Years | 12.69 | |||
1 Year | 10.77 | |||
Class B Shares | ||||
Inception (9/26/97) | 5.92 | % | ||
10 Years | 6.01 | |||
5 Years | 12.88 | |||
1 Year | 11.39 | |||
Class C Shares | ||||
Inception (9/26/97) | 5.46 | % | ||
10 Years | 5.86 | |||
5 Years | 13.13 | |||
1 Year | 15.31 | |||
Class Y Shares | ||||
Inception (9/26/97) | 6.51 | % | ||
10 Years | 6.92 | |||
5 Years | 14.26 | |||
1 Year | 17.52 | |||
Class R6 Shares | ||||
10 Years | 6.66 | % | ||
5 Years | 14.00 | |||
1 Year | 17.33 | |||
sales charge unless otherwise stated. Investment return and principal value will fluctuate so that you may have a gain or loss when you sell shares.
The total annual Fund operating expense ratio set forth in the most recent Fund prospectus as of the date of this report for Class A, Class B, Class C, Class Y and Class R6 shares was 0.59%, 1.34%, 1.32%, 0.34% and 0.26%, respectively. The expense ratios presented above may vary from the expense ratios presented in other sections of this report that are based on expenses incurred during the period covered by this report.
Class A share performance reflects the maximum 5.50% sales charge, and Class B and Class C share performance reflects the applicable contingent deferred sales charge (CDSC) for the period involved. The CDSC on Class B shares declines from 5% beginning at the time of purchase to 0% at the beginning of the seventh year. The CDSC on Class C shares is 1% for the first year after purchase. Class Y and Class R6 shares do not have a front-end sales charge or a CDSC; therefore, performance is at net asset value.
The performance of the Fund’s share classes will differ primarily due to different sales charge structures and class expenses.
Fund performance reflects any applicable fee waivers and/or expense reimbursements. Had the adviser not waived fees and/or reimbursed expenses currently or in the past, returns would have been lower. See current prospectus for more information.
7 Invesco S&P 500 Index Fund
Invesco S&P 500 Index Fund’s investment objective is total return through growth of capital and current income.
| ∎ | Unless otherwise stated, information presented in this report is as of August 31, 2017, and is based on total net assets. |
| ∎ | Unless otherwise noted, all data provided by Invesco. |
| ∎ | To access your Fund’s reports/prospectus, visit invesco.com/fundreports. |
About share classes
| ∎ | Class B shares may not be purchased for new or additional investments. Please see the prospectus for more information. |
| ∎ | Class Y shares are available only to certain investors. Please see the prospectus for more information. |
| ∎ | Class R6 shares are available for use by retirement plans that meet certain standards and for institutional investors. Class R6 shares are also available through intermediaries that have established an agreement with Invesco Distributors, Inc. to make such shares available for use in retail omnibus accounts. Please see the prospectus for more information. |
Principal risks of investing in the Fund
| ∎ | Depositary receipts risk. Investing in depositary receipts involves the same risks as direct investments in foreign securities. In addition, the underlying issuers of certain depositary receipts are under no obligation to distribute shareholder communications or pass through any voting rights with respect to the deposited securities to the holders of such receipts. The Fund may therefore receive less timely information or have less control than if it invested directly in the foreign issuer. |
| ∎ | Derivatives risk. The value of a derivative instrument depends largely on (and is derived from) the value of an underlying security, currency, commodity, interest rate, index or other asset (each referred to as an underlying asset). In addition to risks relating to the underlying assets, the use of derivatives may include other, possibly greater, risks, including counterparty, leverage and liquidity risks. Counter-party risk is the risk that the counter-party to the derivative contract will default on its obligation to pay the Fund the amount owed or otherwise perform under the derivative contract. Derivatives |
| create leverage risk because they do not require payment up front equal to the economic exposure created by owning the derivative. As a result, an adverse change in the value of the underlying asset could result in the Fund sustaining a loss that is substantially greater than the amount invested in the derivative, which may make the Fund’s returns more volatile and increase the risk of loss. Derivative instruments may also be less liquid than more traditional investments and the Fund may be unable to sell or close out its derivative positions at a desirable time or price. This risk may be more acute under adverse market conditions, during which the Fund may be most in need of liquidating its derivative positions. Derivatives may also be harder to value, less tax efficient and subject to changing government regulation that could impact the Fund’s ability to use certain derivatives or their cost. Also, derivatives used for hedging or to gain or limit exposure to a particular market segment may not provide the expected benefits, particularly during adverse market conditions. |
| ∎ | Emerging markets securities risk. Emerging markets (also referred to as developing markets) are generally subject to greater market volatility, political, social and economic instability, uncertain trading markets and more governmental limitations on foreign investment than more developed markets. In addition, companies operating in emerging markets may be subject to lower trading volume and greater price fluctuations than companies in more developed markets. Securities law and the enforcement of systems of taxation in many emerging market countries may change quickly and unpredictably. In addition, investments in emerging markets securities may also be subject to additional transaction costs, delays in settlement procedures, and lack of timely information. |
| ∎ | Foreign securities risk. The Fund’s foreign investments may be adversely affected by political and social instability, changes in economic or taxation policies, difficulty in enforcing obligations, decreased liquidity or increased volatility. Foreign investments also involve the risk of the possible seizure, nationalization or expropriation of the issuer or foreign deposits (in which the Fund could lose its entire investments in a certain market) and the possible adoption of foreign governmental restrictions such as exchange controls. Unless the Fund has hedged its foreign securities risk, foreign securities risk also involves the risk of negative foreign currency rate fluctuations, which may cause the value of securities denominated in such foreign currency (or other instruments through which the Fund has exposure to foreign currencies) to decline in value. Currency exchange rates may fluctuate significantly over short periods of time. Currency hedging strategies, if used, are not always successful. |
| ∎ | Indexing risk. The Fund is operated as a passively managed index fund and, therefore, the adverse performance of a particular security necessarily will not result in the elimination of the security from the Fund’s portfolio. Ordinarily, the Adviser will not sell the Fund’s portfolio securities except to reflect additions or deletions of the securities that comprise the Index, or as may be necessary to raise cash to pay Fund shareholders who sell Fund shares. As such, the Fund will be negatively affected by declines in the securities represented by the Index. Also, there is no guarantee that the Adviser will be able to correlate the Fund’s performance with that of the Index. |
continued on page 6
This report must be accompanied or preceded by a currently effective Fund prospectus, which contains more complete information, including sales charges and expenses. Investors should read it carefully before investing. |
| NOT FDIC INSURED | MAY LOSE VALUE | NO BANK GUARANTEE |
8 Invesco S&P 500 Index Fund
Schedule of Investments(a)
August 31, 2017
| Shares | Value | |||||||
Common Stocks & Other Equity Interests–98.55% |
| |||||||
| Advertising–0.12% | ||||||||
Interpublic Group of Cos., Inc. (The) | 19,877 | $ | 400,323 | |||||
Omnicom Group Inc. | 11,708 | 847,425 | ||||||
| 1,247,748 | ||||||||
| Aerospace & Defense–2.47% | ||||||||
Arconic Inc. | 22,174 | 564,772 | ||||||
Boeing Co. (The) | 28,240 | 6,767,998 | ||||||
General Dynamics Corp. | 14,266 | 2,872,459 | ||||||
L3 Technologies, Inc. | 3,917 | 710,857 | ||||||
Lockheed Martin Corp. | 12,522 | 3,824,094 | ||||||
Northrop Grumman Corp. | 8,782 | 2,390,548 | ||||||
Raytheon Co. | 14,643 | 2,665,173 | ||||||
Rockwell Collins, Inc. | 8,168 | 1,070,416 | ||||||
Textron Inc. | 13,466 | 661,046 | ||||||
TransDigm Group, Inc. | 2,459 | 640,963 | ||||||
United Technologies Corp. | 37,488 | 4,488,063 | ||||||
| 26,656,389 | ||||||||
| Agricultural & Farm Machinery–0.16% | ||||||||
Deere & Co. | 14,804 | 1,716,228 | ||||||
| Agricultural Products–0.11% | ||||||||
Archer-Daniels-Midland Co. | 28,710 | 1,186,297 | ||||||
| Air Freight & Logistics–0.71% | ||||||||
C.H. Robinson Worldwide, Inc. | 7,087 | 500,555 | ||||||
Expeditors International of Washington, Inc. | 9,063 | 508,434 | ||||||
FedEx Corp. | 12,374 | 2,652,738 | ||||||
United Parcel Service, Inc.–Class B | 34,652 | 3,962,803 | ||||||
| 7,624,530 | ||||||||
| Airlines–0.53% | ||||||||
Alaska Air Group, Inc. | 6,225 | 464,758 | ||||||
American Airlines Group Inc. | 24,781 | 1,108,702 | ||||||
Delta Air Lines, Inc. | 37,030 | 1,747,446 | ||||||
Southwest Airlines Co. | 30,420 | 1,586,099 | ||||||
United Continental Holdings Inc.(b) | 14,176 | 878,345 | ||||||
| 5,785,350 | ||||||||
| Alternative Carriers–0.07% | ||||||||
Level 3 Communications, Inc.(b) | 14,726 | 801,536 | ||||||
| Apparel Retail–0.41% | ||||||||
Foot Locker, Inc. | 6,623 | 233,328 | ||||||
Gap, Inc. (The) | 11,073 | 261,544 | ||||||
L Brands, Inc. | 12,121 | 439,023 | ||||||
Ross Stores, Inc. | 19,721 | 1,152,693 | ||||||
TJX Cos., Inc. (The) | 32,363 | 2,339,845 | ||||||
| 4,426,433 | ||||||||
| Apparel, Accessories & Luxury Goods–0.31% | ||||||||
Coach, Inc. | 14,143 | 589,763 | ||||||
| Shares | Value | |||||||
| Apparel, Accessories & Luxury Goods–(continued) | ||||||||
Hanesbrands, Inc. | 18,320 | $ | 444,443 | |||||
Michael Kors Holdings Ltd.(b) | 7,839 | 330,963 | ||||||
PVH Corp. | 3,926 | 494,244 | ||||||
Ralph Lauren Corp. | 2,737 | 240,555 | ||||||
Under Armour, Inc.–Class A(b) | 9,290 | 150,034 | ||||||
Under Armour, Inc.–Class C(b) | 9,273 | 140,022 | ||||||
VF Corp. | 16,117 | 1,013,276 | ||||||
| 3,403,300 | ||||||||
| Application Software–1.08% | ||||||||
Adobe Systems Inc.(b) | 24,888 | 3,861,622 | ||||||
ANSYS, Inc.(b) | 4,321 | 556,631 | ||||||
Autodesk, Inc.(b) | 9,756 | 1,116,672 | ||||||
Citrix Systems, Inc.(b) | 7,603 | 594,631 | ||||||
Intuit Inc. | 12,245 | 1,732,055 | ||||||
salesforce.com, inc.(b) | 33,640 | 3,212,283 | ||||||
Synopsys, Inc.(b) | 7,561 | 608,056 | ||||||
| 11,681,950 | ||||||||
| Asset Management & Custody Banks–1.10% | ||||||||
Affiliated Managers Group, Inc. | 2,846 | 502,860 | ||||||
Ameriprise Financial, Inc. | 7,669 | 1,062,233 | ||||||
Bank of New York Mellon Corp. (The) | 52,316 | 2,735,081 | ||||||
BlackRock, Inc. | 6,098 | 2,555,123 | ||||||
Franklin Resources, Inc. | 17,225 | 744,637 | ||||||
Invesco Ltd.(c) | 20,468 | 670,941 | ||||||
Northern Trust Corp. | 10,856 | 960,756 | ||||||
State Street Corp. | 17,792 | 1,645,582 | ||||||
T. Rowe Price Group Inc. | 12,137 | 1,023,877 | ||||||
| 11,901,090 | ||||||||
| Auto Parts & Equipment–0.16% | ||||||||
BorgWarner, Inc. | 10,035 | 465,724 | ||||||
Delphi Automotive PLC | 13,477 | 1,299,183 | ||||||
| 1,764,907 | ||||||||
| Automobile Manufacturers–0.43% | ||||||||
Ford Motor Co. | 196,774 | 2,170,417 | ||||||
General Motors Co. | 69,089 | 2,524,512 | ||||||
| 4,694,929 | ||||||||
| Automotive Retail–0.24% | ||||||||
Advance Auto Parts, Inc. | 3,714 | 363,601 | ||||||
AutoZone, Inc.(b) | 1,415 | 747,743 | ||||||
CarMax, Inc.(b) | 9,317 | 625,636 | ||||||
O’Reilly Automotive, Inc.(b) | 4,577 | 897,687 | ||||||
| 2,634,667 | ||||||||
| Biotechnology–3.12% | ||||||||
AbbVie Inc. | 80,072 | 6,029,422 | ||||||
Alexion Pharmaceuticals, Inc.(b) | 11,296 | 1,608,663 | ||||||
Amgen Inc. | 37,022 | 6,581,401 | ||||||
See accompanying Notes to Financial Statements which are an integral part of the financial statements.
9 Invesco S&P 500 Index Fund
| Shares | Value | |||||||
| Biotechnology–(continued) | ||||||||
Biogen Inc.(b) | 10,746 | $ | 3,401,754 | |||||
Celgene Corp.(b) | 39,283 | 5,457,587 | ||||||
Gilead Sciences, Inc. | 65,742 | 5,503,263 | ||||||
Incyte Corp.(b) | 8,550 | 1,174,855 | ||||||
Regeneron Pharmaceuticals, Inc.(b) | 3,832 | 1,904,121 | ||||||
Vertex Pharmaceuticals Inc.(b) | 12,530 | 2,011,566 | ||||||
| 33,672,632 | ||||||||
| Brewers–0.08% | ||||||||
Molson Coors Brewing Co.–Class B | 9,289 | 833,688 | ||||||
| Broadcasting–0.18% | ||||||||
CBS Corp.–Class B | 18,531 | 1,187,096 | ||||||
Discovery Communications, Inc.–Class A(b) | 7,735 | 171,794 | ||||||
Discovery Communications, Inc.–Class C(b) | 10,606 | 222,832 | ||||||
Scripps Networks Interactive Inc.–Class A | 4,872 | 417,287 | ||||||
| 1,999,009 | ||||||||
| Building Products–0.35% | ||||||||
A.O. Smith Corp. | 7,408 | 412,551 | ||||||
Allegion PLC | 4,794 | 377,336 | ||||||
Fortune Brands Home & Security, Inc. | 7,739 | 483,920 | ||||||
Johnson Controls International PLC | 47,196 | 1,868,489 | ||||||
Masco Corp. | 16,096 | 591,850 | ||||||
| 3,734,146 | ||||||||
| Cable & Satellite–1.36% | ||||||||
Charter Communications, Inc.–Class A(b) | 10,850 | 4,324,159 | ||||||
Comcast Corp.–Class A | 238,109 | 9,669,607 | ||||||
DISH Network Corp.–Class A(b) | 11,443 | 655,569 | ||||||
| 14,649,335 | ||||||||
| Casinos & Gaming–0.13% | ||||||||
MGM Resorts International | 24,284 | 800,401 | ||||||
Wynn Resorts Ltd. | 3,986 | 554,014 | ||||||
| 1,354,415 | ||||||||
| Commodity Chemicals–0.14% | ||||||||
LyondellBasell Industries N.V.–Class A | 16,616 | 1,505,243 | ||||||
| Communications Equipment–0.97% | ||||||||
Cisco Systems, Inc. | 251,559 | 8,102,715 | ||||||
F5 Networks, Inc.(b) | 3,270 | 390,373 | ||||||
Harris Corp. | 6,132 | 753,623 | ||||||
Juniper Networks, Inc. | 19,222 | 533,026 | ||||||
Motorola Solutions, Inc. | 8,223 | 724,611 | ||||||
| 10,504,348 | ||||||||
| Computer & Electronics Retail–0.07% | ||||||||
Best Buy Co., Inc. | 13,347 | 724,208 | ||||||
| Construction & Engineering–0.08% | ||||||||
Fluor Corp. | 7,031 | 271,186 | ||||||
Jacobs Engineering Group, Inc. | 6,057 | 330,046 | ||||||
Quanta Services, Inc.(b) | 7,450 | 267,678 | ||||||
| 868,910 | ||||||||
| Shares | Value | |||||||
| Construction Machinery & Heavy Trucks–0.55% | ||||||||
Caterpillar Inc. | 29,640 | $ | 3,482,403 | |||||
Cummins Inc. | 7,774 | 1,239,020 | ||||||
PACCAR Inc. | 17,672 | 1,172,184 | ||||||
| 5,893,607 | ||||||||
| Construction Materials–0.14% | ||||||||
Martin Marietta Materials, Inc. | 3,155 | 668,829 | ||||||
Vulcan Materials Co. | 6,647 | 806,015 | ||||||
| 1,474,844 | ||||||||
| Consumer Electronics–0.03% | ||||||||
Garmin Ltd. | 5,771 | 297,207 | ||||||
| Consumer Finance–0.71% | ||||||||
American Express Co. | 37,771 | 3,252,083 | ||||||
Capital One Financial Corp. | 24,297 | 1,934,284 | ||||||
Discover Financial Services | 19,127 | 1,127,537 | ||||||
Navient Corp. | 14,334 | 189,209 | ||||||
Synchrony Financial | 38,751 | 1,193,143 | ||||||
| 7,696,256 | ||||||||
| Copper–0.09% | ||||||||
Freeport-McMoRan Inc.(b) | 66,967 | 989,772 | ||||||
| Data Processing & Outsourced Services–2.58% | ||||||||
Alliance Data Systems Corp. | 2,805 | 632,527 | ||||||
Automatic Data Processing, Inc. | 22,508 | 2,396,427 | ||||||
Fidelity National Information Services, Inc. | 16,631 | 1,545,353 | ||||||
Fiserv, Inc.(b) | 10,684 | 1,321,718 | ||||||
Global Payments Inc. | 7,670 | 732,408 | ||||||
Mastercard Inc.–Class A | 47,190 | 6,290,427 | ||||||
Paychex, Inc. | 16,085 | 917,328 | ||||||
PayPal Holdings, Inc.(b) | 56,205 | 3,466,724 | ||||||
Total System Services, Inc. | 8,332 | 575,908 | ||||||
Visa Inc.–Class A | 92,886 | 9,615,559 | ||||||
Western Union Co. (The) | 23,708 | 448,555 | ||||||
| 27,942,934 | ||||||||
| Department Stores–0.08% | ||||||||
Kohl’s Corp. | 8,576 | 341,153 | ||||||
Macy’s, Inc. | 15,319 | 318,176 | ||||||
Nordstrom, Inc. | 5,596 | 249,693 | ||||||
| 909,022 | ||||||||
| Distillers & Vintners–0.20% | ||||||||
Brown-Forman Corp.–Class B | 8,898 | 471,950 | ||||||
Constellation Brands, Inc.–Class A | 8,624 | 1,725,662 | ||||||
| 2,197,612 | ||||||||
| Distributors–0.11% | ||||||||
Genuine Parts Co. | 7,414 | 614,101 | ||||||
LKQ Corp.(b) | 15,509 | 537,387 | ||||||
| 1,151,488 | ||||||||
| Diversified Banks–4.93% | ||||||||
Bank of America Corp. | 500,695 | 11,961,604 | ||||||
Citigroup Inc. | 138,519 | 9,423,448 | ||||||
See accompanying Notes to Financial Statements which are an integral part of the financial statements.
10 Invesco S&P 500 Index Fund
| Shares | Value | |||||||
| Diversified Banks–(continued) | ||||||||
JPMorgan Chase & Co. | 178,746 | $ | 16,246,224 | |||||
U.S. Bancorp | 79,700 | 4,084,625 | ||||||
Wells Fargo & Co. | 226,279 | 11,556,068 | ||||||
| 53,271,969 | ||||||||
| Diversified Chemicals–0.75% | ||||||||
Dow Chemical Co. (The) | 56,770 | 3,783,720 | ||||||
E. I. du Pont de Nemours and Co. | 43,620 | 3,661,027 | ||||||
Eastman Chemical Co. | 7,335 | 632,277 | ||||||
| 8,077,024 | ||||||||
| Diversified Support Services–0.05% | ||||||||
Cintas Corp. | 4,383 | 591,749 | ||||||
| Drug Retail–0.69% | ||||||||
CVS Health Corp. | 51,256 | 3,964,139 | ||||||
Walgreens Boots Alliance, Inc. | 42,962 | 3,501,403 | ||||||
| 7,465,542 | ||||||||
| Electric Utilities–2.02% | ||||||||
Alliant Energy Corp. | 11,461 | 489,843 | ||||||
American Electric Power Co., Inc. | 24,737 | 1,821,385 | ||||||
Duke Energy Corp. | 35,211 | 3,073,920 | ||||||
Edison International | 16,391 | 1,314,230 | ||||||
Entergy Corp. | 9,028 | 714,747 | ||||||
Eversource Energy | 15,942 | 1,004,346 | ||||||
Exelon Corp. | 46,592 | 1,764,439 | ||||||
FirstEnergy Corp. | 22,324 | 727,316 | ||||||
NextEra Energy, Inc. | 23,553 | 3,544,962 | ||||||
PG&E Corp. | 25,688 | 1,807,921 | ||||||
Pinnacle West Capital Corp. | 5,642 | 507,611 | ||||||
PPL Corp. | 34,370 | 1,348,679 | ||||||
Southern Co. (The) | 50,038 | 2,414,834 | ||||||
Xcel Energy, Inc. | 25,545 | 1,264,478 | ||||||
| 21,798,711 | ||||||||
| Electrical Components & Equipment–0.53% | ||||||||
Acuity Brands, Inc. | 2,198 | 388,584 | ||||||
AMETEK, Inc. | 11,576 | 732,182 | ||||||
Eaton Corp. PLC | 22,503 | 1,614,815 | ||||||
Emerson Electric Co. | 32,423 | 1,914,254 | ||||||
Rockwell Automation, Inc. | 6,480 | 1,063,109 | ||||||
| 5,712,944 | ||||||||
| Electronic Components–0.24% | ||||||||
Amphenol Corp.–Class A | 15,375 | 1,244,452 | ||||||
Corning Inc. | 46,297 | 1,331,502 | ||||||
| 2,575,954 | ||||||||
| Electronic Equipment & Instruments–0.02% | ||||||||
FLIR Systems, Inc. | 6,864 | 260,832 | ||||||
| Electronic Manufacturing Services–0.13% | ||||||||
TE Connectivity Ltd. | 17,860 | 1,421,656 | ||||||
| Shares | Value | |||||||
| Environmental & Facilities Services–0.24% | ||||||||
Republic Services, Inc. | 11,565 | $ | 754,501 | |||||
Stericycle, Inc.(b) | 4,288 | 308,264 | ||||||
Waste Management, Inc. | 20,448 | 1,576,745 | ||||||
| 2,639,510 | ||||||||
| Fertilizers & Agricultural Chemicals–0.36% | ||||||||
CF Industries Holdings, Inc. | 11,728 | 339,995 | ||||||
FMC Corp. | 6,750 | 581,985 | ||||||
Monsanto Co. | 22,076 | 2,587,307 | ||||||
Mosaic Co. (The) | 17,659 | 352,827 | ||||||
| 3,862,114 | ||||||||
| Financial Exchanges & Data–0.75% | ||||||||
CBOE Holdings Inc. | 4,585 | 462,581 | ||||||
CME Group Inc.–Class A | 17,094 | 2,150,425 | ||||||
Intercontinental Exchange, Inc. | 29,786 | 1,926,261 | ||||||
Moody’s Corp. | 8,372 | 1,122,099 | ||||||
Nasdaq, Inc. | 5,733 | 432,153 | ||||||
S&P Global Inc. | 12,969 | 2,001,506 | ||||||
| 8,095,025 | ||||||||
| Food Distributors–0.12% | ||||||||
Sysco Corp. | 24,771 | 1,304,689 | ||||||
| Food Retail–0.09% | ||||||||
Kroger Co. (The) | 45,913 | 1,004,117 | ||||||
| Footwear–0.33% | ||||||||
NIKE, Inc.–Class B | 66,673 | 3,521,001 | ||||||
| General Merchandise Stores–0.31% | ||||||||
Dollar General Corp. | 12,691 | 920,859 | ||||||
Dollar Tree, Inc.(b) | 11,907 | 948,273 | ||||||
Target Corp. | 27,756 | 1,513,535 | ||||||
| 3,382,667 | ||||||||
| Gold–0.09% | ||||||||
Newmont Mining Corp. | 26,826 | 1,028,509 | ||||||
| Health Care Distributors–0.39% | ||||||||
AmerisourceBergen Corp. | 8,348 | 669,927 | ||||||
Cardinal Health, Inc. | 15,891 | 1,072,007 | ||||||
Henry Schein, Inc.(b) | 3,990 | 692,983 | ||||||
McKesson Corp. | 10,609 | 1,584,030 | ||||||
Patterson Cos. Inc. | 4,104 | 158,004 | ||||||
| 4,176,951 | ||||||||
| Health Care Equipment–2.60% | ||||||||
Abbott Laboratories | 87,303 | 4,447,215 | ||||||
Baxter International Inc. | 24,539 | 1,522,399 | ||||||
Becton, Dickinson and Co. | 11,437 | 2,280,995 | ||||||
Boston Scientific Corp.(b) | 68,895 | 1,898,057 | ||||||
C.R. Bard, Inc. | 3,642 | 1,168,390 | ||||||
Danaher Corp. | 30,730 | 2,563,497 | ||||||
Edwards Lifesciences Corp.(b) | 10,554 | 1,199,568 | ||||||
Hologic, Inc.(b) | 14,086 | 543,720 | ||||||
See accompanying Notes to Financial Statements which are an integral part of the financial statements.
11 Invesco S&P 500 Index Fund
| Shares | Value | |||||||
| Health Care Equipment–(continued) | ||||||||
IDEXX Laboratories, Inc.(b) | 4,432 | $ | 688,866 | |||||
Intuitive Surgical, Inc.(b) | 1,852 | 1,860,649 | ||||||
Medtronic PLC | 68,869 | 5,552,219 | ||||||
ResMed Inc. | 7,134 | 553,456 | ||||||
Stryker Corp. | 15,606 | 2,206,220 | ||||||
Varian Medical Systems, Inc.(b) | 4,586 | 487,262 | ||||||
Zimmer Biomet Holdings, Inc. | 10,122 | 1,156,641 | ||||||
| 28,129,154 | ||||||||
| Health Care Facilities–0.15% | ||||||||
HCA Healthcare, Inc.(b) | 14,397 | 1,132,468 | ||||||
Universal Health Services, Inc.–Class B | 4,510 | 487,666 | ||||||
| 1,620,134 | ||||||||
| Health Care REIT’s–0.30% | ||||||||
HCP, Inc. | 23,573 | 702,711 | ||||||
Ventas, Inc. | 17,853 | 1,221,859 | ||||||
Welltower Inc. | 18,421 | 1,348,786 | ||||||
| 3,273,356 | ||||||||
| Health Care Services–0.39% | ||||||||
DaVita Inc.(b) | 7,831 | 458,584 | ||||||
Envision Healthcare Corp.(b) | 5,944 | 311,525 | ||||||
Express Scripts Holding Co.(b) | 29,860 | 1,875,805 | ||||||
Laboratory Corp. of America Holdings(b) | 5,145 | 807,096 | ||||||
Quest Diagnostics Inc. | 6,905 | 748,157 | ||||||
| 4,201,167 | ||||||||
| Health Care Supplies–0.18% | ||||||||
Align Technology, Inc.(b) | 3,828 | 676,561 | ||||||
Cooper Cos., Inc. (The) | 2,436 | 611,022 | ||||||
DENTSPLY SIRONA Inc. | 11,531 | 652,308 | ||||||
| 1,939,891 | ||||||||
| Health Care Technology–0.09% | ||||||||
Cerner Corp.(b) | 14,790 | 1,002,466 | ||||||
| Home Entertainment Software–0.39% | ||||||||
Activision Blizzard, Inc. | 34,883 | 2,286,929 | ||||||
Electronic Arts Inc.(b) | 15,597 | 1,895,036 | ||||||
| 4,181,965 | ||||||||
| Home Furnishings–0.10% | ||||||||
Leggett & Platt, Inc. | 6,655 | 305,931 | ||||||
Mohawk Industries, Inc.(b) | 3,185 | 806,187 | ||||||
| 1,112,118 | ||||||||
| Home Improvement Retail–1.13% | ||||||||
Home Depot, Inc. (The) | 60,149 | 9,014,531 | ||||||
Lowe’s Cos., Inc. | 43,169 | 3,189,757 | ||||||
| 12,204,288 | ||||||||
| Homebuilding–0.14% | ||||||||
D.R. Horton, Inc. | 17,194 | 621,563 | ||||||
Lennar Corp.–Class A | 10,221 | 529,039 | ||||||
| Shares | Value | |||||||
| Homebuilding–(continued) | ||||||||
PulteGroup Inc. | 14,285 | $ | 368,839 | |||||
| 1,519,441 | ||||||||
| Hotel and Resort REIT’s–0.06% | ||||||||
Host Hotels & Resorts Inc. | 37,216 | 674,354 | ||||||
| Hotels, Resorts & Cruise Lines–0.49% | ||||||||
Carnival Corp. | 21,057 | 1,463,040 | ||||||
Hilton Worldwide Holdings Inc. | 10,307 | 663,049 | ||||||
Marriott International Inc.–Class A | 15,630 | 1,618,956 | ||||||
Royal Caribbean Cruises Ltd. | 8,439 | 1,050,318 | ||||||
Wyndham Worldwide Corp. | 5,274 | 525,712 | ||||||
| 5,321,075 | ||||||||
| Household Appliances–0.06% | ||||||||
Whirlpool Corp. | 3,720 | 638,426 | ||||||
| Household Products–1.74% | ||||||||
Church & Dwight Co., Inc. | 12,539 | 629,082 | ||||||
Clorox Co. (The) | 6,479 | 897,536 | ||||||
Colgate-Palmolive Co. | 44,438 | 3,183,538 | ||||||
Kimberly-Clark Corp. | 17,856 | 2,201,466 | ||||||
Procter & Gamble Co. (The) | 128,676 | 11,872,935 | ||||||
| 18,784,557 | ||||||||
| Housewares & Specialties–0.11% | ||||||||
Newell Brands, Inc. | 24,304 | 1,173,397 | ||||||
| Human Resource & Employment Services–0.03% | ||||||||
Robert Half International, Inc. | 6,397 | 289,784 | ||||||
| Hypermarkets & Super Centers–0.86% | ||||||||
Costco Wholesale Corp. | 22,065 | 3,458,468 | ||||||
Wal-Mart Stores, Inc. | 74,314 | 5,801,694 | ||||||
| 9,260,162 | ||||||||
| Independent Power Producers & Energy Traders–0.07% | ||||||||
AES Corp. (The) | 33,211 | 366,649 | ||||||
NRG Energy, Inc. | 15,901 | 396,094 | ||||||
| 762,743 | ||||||||
| Industrial Conglomerates–2.16% | ||||||||
3M Co. | 30,065 | 6,142,881 | ||||||
General Electric Co.(d) | 438,148 | 10,756,534 | ||||||
Honeywell International Inc. | 38,353 | 5,303,069 | ||||||
Roper Technologies, Inc. | 5,132 | 1,183,747 | ||||||
| 23,386,231 | ||||||||
| Industrial Gases–0.32% | ||||||||
Air Products and Chemicals, Inc. | 10,953 | 1,592,237 | ||||||
Praxair, Inc. | 14,381 | 1,891,677 | ||||||
| 3,483,914 | ||||||||
| Industrial Machinery–0.82% | ||||||||
Dover Corp. | 7,831 | 664,695 | ||||||
Flowserve Corp. | 6,582 | 258,541 | ||||||
Fortive Corp. | 15,169 | 985,530 | ||||||
See accompanying Notes to Financial Statements which are an integral part of the financial statements.
12 Invesco S&P 500 Index Fund
| Shares | Value | |||||||
| Industrial Machinery–(continued) | ||||||||
Illinois Tool Works Inc. | 15,641 | $ | 2,150,794 | |||||
Ingersoll-Rand PLC | 12,879 | 1,099,738 | ||||||
Parker-Hannifin Corp. | 6,699 | 1,077,802 | ||||||
Pentair PLC (United Kingdom) | 8,434 | 523,329 | ||||||
Snap-on Inc. | 2,914 | 430,019 | ||||||
Stanley Black & Decker Inc. | 7,695 | 1,108,080 | ||||||
Xylem, Inc. | 9,040 | 561,113 | ||||||
| 8,859,641 | ||||||||
| Industrial REIT’s–0.21% | ||||||||
Duke Realty Corp. | 17,887 | 531,601 | ||||||
Prologis, Inc. | 26,680 | 1,690,445 | ||||||
| 2,222,046 | ||||||||
| Insurance Brokers–0.49% | ||||||||
Aon PLC | 13,184 | 1,834,686 | ||||||
Arthur J. Gallagher & Co. | 9,028 | 522,721 | ||||||
Marsh & McLennan Cos., Inc. | 25,926 | 2,024,302 | ||||||
Willis Towers Watson PLC | 6,392 | 949,020 | ||||||
| 5,330,729 | ||||||||
| Integrated Oil & Gas–2.67% | ||||||||
Chevron Corp. | 95,317 | 10,258,016 | ||||||
Exxon Mobil Corp. | 213,182 | 16,272,182 | ||||||
Occidental Petroleum Corp. | 38,466 | 2,296,420 | ||||||
| 28,826,618 | ||||||||
| Integrated Telecommunication Services–2.03% | ||||||||
AT&T Inc. | 309,314 | 11,586,902 | ||||||
CenturyLink Inc. | 27,610 | 544,469 | ||||||
Verizon Communications Inc. | 205,238 | 9,845,267 | ||||||
| 21,976,638 | ||||||||
| Internet & Direct Marketing Retail–2.69% | ||||||||
Amazon.com, Inc.(b) | 19,958 | 19,570,815 | ||||||
Expedia, Inc. | 6,115 | 907,221 | ||||||
Netflix Inc.(b) | 21,683 | 3,788,237 | ||||||
Priceline Group Inc. (The)(b) | 2,472 | 4,578,342 | ||||||
TripAdvisor Inc.(b) | 5,555 | 237,365 | ||||||
| 29,081,980 | ||||||||
| Internet Software & Services–4.77% | ||||||||
Akamai Technologies, Inc.(b) | 8,696 | 410,016 | ||||||
Alphabet Inc.–Class A(b) | 14,973 | 14,302,809 | ||||||
Alphabet Inc.–Class C(b) | 15,011 | 14,100,283 | ||||||
eBay Inc.(b) | 50,641 | 1,829,659 | ||||||
Facebook, Inc.–Class A(b) | 118,922 | 20,451,016 | ||||||
VeriSign, Inc.(b) | 4,446 | 461,273 | ||||||
| 51,555,056 | ||||||||
| Investment Banking & Brokerage–1.01% | ||||||||
Charles Schwab Corp. (The) | 61,217 | 2,442,558 | ||||||
E*TRADE Financial Corp.(b) | 13,818 | 566,676 | ||||||
Goldman Sachs Group, Inc. (The) | 18,416 | 4,120,396 | ||||||
Morgan Stanley | 71,659 | 3,260,485 | ||||||
| Shares | Value | |||||||
| Investment Banking & Brokerage–(continued) | ||||||||
Raymond James Financial, Inc. | 6,447 | $ | 504,929 | |||||
| 10,895,044 | ||||||||
| IT Consulting & Other Services–1.32% | ||||||||
Accenture PLC–Class A | 31,196 | 4,079,189 | ||||||
Cognizant Technology Solutions Corp.–Class A | 29,632 | 2,097,057 | ||||||
CSRA Inc. | 7,308 | 230,275 | ||||||
DXC Technology Co. | 14,245 | 1,210,825 | ||||||
Gartner, Inc.(b) | 4,548 | 548,443 | ||||||
International Business Machines Corp. | 43,012 | 6,152,006 | ||||||
| 14,317,795 | ||||||||
| Leisure Products–0.08% | ||||||||
Hasbro, Inc. | 5,659 | 555,997 | ||||||
Mattel, Inc. | 17,233 | 279,519 | ||||||
| 835,516 | ||||||||
| Life & Health Insurance–0.86% | ||||||||
Aflac, Inc. | 19,965 | 1,648,111 | ||||||
Brighthouse Financial, Inc.(b) | 4,942 | 282,019 | ||||||
Lincoln National Corp. | 11,282 | 765,596 | ||||||
MetLife, Inc. | 54,358 | 2,545,585 | ||||||
Principal Financial Group, Inc. | 13,484 | 843,020 | ||||||
Prudential Financial, Inc. | 21,582 | 2,203,091 | ||||||
Torchmark Corp. | 5,472 | 421,180 | ||||||
Unum Group | 11,480 | 553,106 | ||||||
| 9,261,708 | ||||||||
| Life Sciences Tools & Services–0.81% | ||||||||
Agilent Technologies, Inc. | 16,214 | 1,049,370 | ||||||
Illumina, Inc.(b) | 7,344 | 1,501,554 | ||||||
Mettler-Toledo International Inc.(b) | 1,298 | 785,407 | ||||||
PerkinElmer, Inc. | 5,555 | 372,130 | ||||||
Quintiles IMS Holdings, Inc.(b) | 6,902 | 662,799 | ||||||
Thermo Fisher Scientific, Inc. | 19,681 | 3,683,102 | ||||||
Waters Corp.(b) | 4,025 | 738,507 | ||||||
| 8,792,869 | ||||||||
| Managed Health Care–1.84% | ||||||||
Aetna Inc. | 16,687 | 2,631,540 | ||||||
Anthem, Inc. | 13,330 | 2,613,213 | ||||||
Centene Corp.(b) | 8,666 | 769,974 | ||||||
Cigna Corp. | 12,879 | 2,344,751 | ||||||
Humana Inc. | 7,259 | 1,870,063 | ||||||
UnitedHealth Group Inc. | 48,482 | 9,643,070 | ||||||
| 19,872,611 | ||||||||
| Metal & Glass Containers–0.07% | ||||||||
Ball Corp. | 17,613 | 704,344 | ||||||
| Motorcycle Manufacturers–0.04% | ||||||||
Harley-Davidson, Inc. | 8,805 | 413,923 | ||||||
| Movies & Entertainment–1.29% | ||||||||
Time Warner Inc. | 39,017 | 3,944,619 | ||||||
See accompanying Notes to Financial Statements which are an integral part of the financial statements.
13 Invesco S&P 500 Index Fund
| Shares | Value | |||||||
| Movies & Entertainment–(continued) | ||||||||
Twenty-First Century Fox, Inc.–Class A | 52,943 | $ | 1,460,697 | |||||
Twenty-First Century Fox, Inc.–Class B | 24,505 | 664,085 | ||||||
Viacom Inc.–Class B | 17,723 | 506,878 | ||||||
Walt Disney Co. (The) | 73,189 | 7,406,727 | ||||||
| 13,983,006 | ||||||||
| Multi-Line Insurance–0.42% | ||||||||
American International Group, Inc. | 44,247 | 2,676,058 | ||||||
Assurant, Inc. | 2,739 | 259,356 | ||||||
Hartford Financial Services Group, Inc. (The) | 18,481 | 999,268 | ||||||
Loews Corp. | 13,889 | 646,950 | ||||||
| 4,581,632 | ||||||||
| Multi-Sector Holdings–1.64% | ||||||||
Berkshire Hathaway Inc.–Class B (b) | 95,565 | 17,312,555 | ||||||
Leucadia National Corp. | 16,291 | 385,771 | ||||||
| 17,698,326 | ||||||||
| Multi-Utilities–1.06% | ||||||||
Ameren Corp. | 12,206 | 732,238 | ||||||
CenterPoint Energy, Inc. | 21,681 | 642,191 | ||||||
CMS Energy Corp. | 14,109 | 684,851 | ||||||
Consolidated Edison, Inc. | 15,363 | 1,294,640 | ||||||
Dominion Energy, Inc. | 31,644 | 2,492,598 | ||||||
DTE Energy Co. | 9,024 | 1,013,576 | ||||||
NiSource Inc. | 16,272 | 437,228 | ||||||
Public Service Enterprise Group Inc. | 25,450 | 1,192,078 | ||||||
SCANA Corp. | 7,196 | 434,494 | ||||||
Sempra Energy | 12,618 | 1,488,041 | ||||||
WEC Energy Group, Inc. | 15,876 | 1,035,433 | ||||||
| 11,447,368 | ||||||||
| Office REIT’s–0.24% | ||||||||
Alexandria Real Estate Equities, Inc. | 4,596 | 557,541 | ||||||
Boston Properties, Inc. | 7,739 | 933,323 | ||||||
SL Green Realty Corp. | 5,129 | 494,333 | ||||||
Vornado Realty Trust | 8,665 | 645,456 | ||||||
| 2,630,653 | ||||||||
| Oil & Gas Drilling–0.02% | ||||||||
Helmerich & Payne, Inc. | 5,490 | 232,447 | ||||||
| Oil & Gas Equipment & Services–0.75% | ||||||||
Baker Hughes, a GE Co. | 21,405 | 725,629 | ||||||
Halliburton Co. | 43,662 | 1,701,508 | ||||||
National Oilwell Varco Inc. | 19,119 | 586,380 | ||||||
Schlumberger Ltd. | 69,905 | 4,439,667 | ||||||
TechnipFMC PLC (United Kingdom)(b) | 23,473 | 606,308 | ||||||
| 8,059,492 | ||||||||
| Oil & Gas Exploration & Production–1.26% | ||||||||
Anadarko Petroleum Corp. | 28,190 | 1,153,817 | ||||||
Apache Corp. | 19,136 | 743,242 | ||||||
Cabot Oil & Gas Corp. | 23,420 | 598,381 | ||||||
| Shares | Value | |||||||
| Oil & Gas Exploration & Production–(continued) | ||||||||
Chesapeake Energy Corp.(b) | 38,375 | $ | 139,685 | |||||
Cimarex Energy Co. | 4,784 | 476,917 | ||||||
Concho Resources Inc.(b) | 7,453 | 827,059 | ||||||
ConocoPhillips | 62,239 | 2,717,355 | ||||||
Devon Energy Corp. | 26,447 | 830,436 | ||||||
EOG Resources, Inc. | 29,042 | 2,468,279 | ||||||
EQT Corp. | 8,718 | 543,480 | ||||||
Hess Corp. | 13,594 | 528,807 | ||||||
Marathon Oil Corp. | 42,763 | 475,524 | ||||||
Newfield Exploration Co.(b) | 10,020 | 261,823 | ||||||
Noble Energy, Inc. | 22,900 | 544,333 | ||||||
Pioneer Natural Resources Co. | 8,556 | 1,109,285 | ||||||
Range Resources Corp. | 9,466 | 164,330 | ||||||
| 13,582,753 | ||||||||
| Oil & Gas Refining & Marketing–0.51% | ||||||||
Andeavor | 7,612 | 762,342 | ||||||
Marathon Petroleum Corp. | 26,097 | 1,368,787 | ||||||
Phillips 66 | 22,069 | 1,849,603 | ||||||
Valero Energy Corp. | 22,499 | 1,532,182 | ||||||
| 5,512,914 | ||||||||
| Oil & Gas Storage & Transportation–0.38% | ||||||||
Kinder Morgan, Inc. | 96,592 | 1,867,123 | ||||||
ONEOK, Inc. | 19,110 | 1,034,998 | ||||||
Williams Cos., Inc. (The) | 41,570 | 1,235,876 | ||||||
| 4,137,997 | ||||||||
| Packaged Foods & Meats–1.13% | ||||||||
Campbell Soup Co. | 9,646 | 445,645 | ||||||
Conagra Brands, Inc. | 20,336 | 660,106 | ||||||
General Mills, Inc.(d) | 28,985 | 1,543,741 | ||||||
Hershey Co. (The) | 7,042 | 738,847 | ||||||
Hormel Foods Corp. | 13,570 | 417,142 | ||||||
JM Smucker Co. (The) | 5,856 | 613,475 | ||||||
Kellogg Co. | 12,687 | 830,491 | ||||||
Kraft Heinz Co. (The) | 30,016 | 2,423,792 | ||||||
McCormick & Co., Inc. | 5,731 | 545,190 | ||||||
Mondelez International, Inc.–Class A | 76,335 | 3,103,781 | ||||||
Tyson Foods, Inc.–Class A | 14,498 | 917,723 | ||||||
| 12,239,933 | ||||||||
| Paper Packaging–0.30% | ||||||||
Avery Dennison Corp. | 4,454 | 419,834 | ||||||
International Paper Co. | 20,772 | 1,118,988 | ||||||
Packaging Corp. of America | 4,739 | 532,711 | ||||||
Sealed Air Corp. | 9,850 | 437,143 | ||||||
WestRock Co. | 12,632 | 718,887 | ||||||
| 3,227,563 | ||||||||
| Personal Products–0.15% | ||||||||
Coty, Inc.–Class A | 23,696 | 392,880 | ||||||
Estee Lauder Cos. Inc. (The)–Class A | 11,262 | 1,204,921 | ||||||
| 1,597,801 | ||||||||
See accompanying Notes to Financial Statements which are an integral part of the financial statements.
14 Invesco S&P 500 Index Fund
| Shares | Value | |||||||
| Pharmaceuticals–4.87% | ||||||||
Allergan PLC | 16,897 | $ | 3,877,524 | |||||
Bristol-Myers Squibb Co. | 82,884 | 5,012,824 | ||||||
Eli Lilly and Co. | 48,850 | 3,971,016 | ||||||
Johnson & Johnson | 135,530 | 17,940,106 | ||||||
Merck & Co., Inc. | 137,609 | 8,787,711 | ||||||
Mylan N.V.(b) | 23,189 | 729,990 | ||||||
Perrigo Co. PLC | 7,214 | 569,617 | ||||||
Pfizer Inc. | 300,250 | 10,184,480 | ||||||
Zoetis Inc. | 24,691 | 1,548,126 | ||||||
| 52,621,394 | ||||||||
| Property & Casualty Insurance–0.85% | ||||||||
Allstate Corp. (The) | 18,338 | 1,659,589 | ||||||
Chubb Ltd. | 23,490 | 3,321,956 | ||||||
Cincinnati Financial Corp. | 7,539 | 579,297 | ||||||
Progressive Corp. (The) | 29,225 | 1,358,378 | ||||||
Travelers Cos., Inc. (The) | 14,056 | 1,703,306 | ||||||
XL Group Ltd. (Bermuda) | 13,152 | 538,706 | ||||||
| 9,161,232 | ||||||||
| Publishing–0.03% | ||||||||
News Corp.–Class A | 19,227 | 257,065 | ||||||
News Corp.–Class B | 6,063 | 83,063 | ||||||
| 340,128 | ||||||||
| Railroads–0.83% | ||||||||
CSX Corp. | 46,420 | 2,330,284 | ||||||
Kansas City Southern | 5,386 | 557,074 | ||||||
Norfolk Southern Corp. | 14,578 | 1,756,940 | ||||||
Union Pacific Corp. | 40,622 | 4,277,497 | ||||||
| 8,921,795 | ||||||||
| Real Estate Services–0.05% | ||||||||
CBRE Group, Inc.–Class A(b) | 15,128 | 545,818 | ||||||
| Regional Banks–1.21% | ||||||||
BB&T Corp. | 40,820 | 1,881,394 | ||||||
Citizens Financial Group, Inc. | 25,484 | 844,285 | ||||||
Comerica Inc. | 8,900 | 607,425 | ||||||
Fifth Third Bancorp | 37,746 | 986,303 | ||||||
Huntington Bancshares Inc. | 54,693 | 688,585 | ||||||
KeyCorp | 55,145 | 949,046 | ||||||
M&T Bank Corp. | 7,740 | 1,144,437 | ||||||
People’s United Financial, Inc. | 17,323 | 289,294 | ||||||
PNC Financial Services Group, Inc. (The) | 24,344 | 3,052,981 | ||||||
Regions Financial Corp. | 60,476 | 853,316 | ||||||
SunTrust Banks, Inc. | 24,323 | 1,340,197 | ||||||
Zions Bancorp. | 10,193 | 445,026 | ||||||
| 13,082,289 | ||||||||
| Reinsurance–0.05% | ||||||||
Everest Re Group, Ltd. | 2,077 | 524,401 | ||||||
| Research & Consulting Services–0.27% | ||||||||
Equifax Inc. | 6,047 | 861,516 | ||||||
| Shares | Value | |||||||
| Research & Consulting Services–(continued) | ||||||||
IHS Markit Ltd.(b) | 15,966 | $ | 747,847 | |||||
Nielsen Holdings PLC | 16,896 | 656,410 | ||||||
Verisk Analytics, Inc.–Class A(b) | 7,735 | 626,922 | ||||||
| 2,892,695 | ||||||||
| Residential REIT’s–0.45% | ||||||||
Apartment Investment & Management Co.–Class A | 7,899 | 358,062 | ||||||
AvalonBay Communities, Inc. | 6,931 | 1,301,156 | ||||||
Equity Residential | 18,471 | 1,240,328 | ||||||
Essex Property Trust, Inc. | 3,306 | 879,297 | ||||||
Mid-America Apartment Communities, Inc. | 5,757 | 612,890 | ||||||
UDR, Inc. | 13,451 | 522,168 | ||||||
| 4,913,901 | ||||||||
| Restaurants–1.18% | ||||||||
Chipotle Mexican Grill, Inc.(b) | 1,445 | 457,646 | ||||||
Darden Restaurants, Inc. | 6,254 | 513,391 | ||||||
McDonald’s Corp. | 41,006 | 6,559,730 | ||||||
Starbucks Corp. | 72,855 | 3,996,825 | ||||||
Yum! Brands, Inc. | 16,643 | 1,278,515 | ||||||
| 12,806,107 | ||||||||
| Retail REIT’s–0.51% | ||||||||
Federal Realty Investment Trust | 3,633 | 461,137 | ||||||
GGP Inc. | 29,306 | 608,099 | ||||||
Kimco Realty Corp. | 21,414 | 420,143 | ||||||
Macerich Co. (The) | 5,990 | 316,092 | ||||||
Realty Income Corp. | 13,737 | 790,702 | ||||||
Regency Centers Corp. | 7,357 | 473,202 | ||||||
Simon Property Group, Inc. | 15,705 | 2,463,329 | ||||||
| 5,532,704 | ||||||||
| Semiconductor Equipment–0.42% | ||||||||
Applied Materials, Inc. | 54,065 | 2,439,413 | ||||||
KLA-Tencor Corp. | 7,886 | 738,839 | ||||||
Lam Research Corp. | 8,114 | 1,346,762 | ||||||
| 4,525,014 | ||||||||
| Semiconductors–3.10% | ||||||||
Advanced Micro Devices, Inc.(b) | 38,986 | 506,818 | ||||||
Analog Devices, Inc. | 18,463 | 1,544,799 | ||||||
Broadcom Ltd. | 20,192 | 5,089,797 | ||||||
Intel Corp. | 236,916 | 8,308,644 | ||||||
Microchip Technology Inc. | 11,540 | 1,001,672 | ||||||
Micron Technology, Inc.(b) | 52,319 | 1,672,638 | ||||||
NVIDIA Corp. | 29,934 | 5,072,017 | ||||||
Qorvo, Inc.(b) | 6,393 | 468,096 | ||||||
QUALCOMM Inc. | 74,331 | 3,885,281 | ||||||
Skyworks Solutions, Inc. | 9,282 | 977,952 | ||||||
Texas Instruments Inc. | 50,125 | 4,151,353 | ||||||
Xilinx, Inc. | 12,478 | 824,297 | ||||||
| 33,503,364 | ||||||||
| Soft Drinks–1.77% | ||||||||
Coca-Cola Co. (The) | 193,462 | 8,812,194 | ||||||
See accompanying Notes to Financial Statements which are an integral part of the financial statements.
15 Invesco S&P 500 Index Fund
| Shares | Value | |||||||
| Soft Drinks–(continued) | ||||||||
Dr Pepper Snapple Group, Inc. | 9,247 | $ | 841,939 | |||||
Monster Beverage Corp.(b) | 20,281 | 1,132,086 | ||||||
PepsiCo, Inc. | 71,869 | 8,317,399 | ||||||
| 19,103,618 | ||||||||
| Specialized Consumer Services–0.03% | ||||||||
H&R Block, Inc. | 10,421 | 278,658 | ||||||
| Specialized REIT’s–1.17% | ||||||||
American Tower Corp.–Class A | 21,381 | 3,165,457 | ||||||
Crown Castle International Corp. | 18,418 | 1,997,248 | ||||||
Digital Realty Trust, Inc. | 8,037 | 951,099 | ||||||
Equinix, Inc. | 3,918 | 1,835,230 | ||||||
Extra Space Storage Inc. | 6,358 | 493,572 | ||||||
Iron Mountain Inc. | 12,356 | 487,073 | ||||||
Public Storage | 7,520 | 1,544,157 | ||||||
SBA Communications Corp.–Class A(b) | 6,101 | 936,809 | ||||||
Weyerhaeuser Co. | 37,797 | 1,232,560 | ||||||
| 12,643,205 | ||||||||
| Specialty Chemicals–0.52% | ||||||||
Albemarle Corp. | 5,602 | 651,289 | ||||||
Ecolab Inc. | 13,132 | 1,750,496 | ||||||
International Flavors & Fragrances Inc. | 3,925 | 537,136 | ||||||
PPG Industries, Inc. | 12,888 | 1,344,476 | ||||||
Sherwin-Williams Co. (The) | 4,075 | 1,382,525 | ||||||
| 5,665,922 | ||||||||
| Specialty Stores–0.19% | ||||||||
Signet Jewelers Ltd. | 3,419 | 215,637 | ||||||
Staples, Inc. | 32,860 | 335,665 | ||||||
Tiffany & Co. | 5,392 | 492,829 | ||||||
Tractor Supply Co. | 6,467 | 384,851 | ||||||
Ulta Beauty, Inc.(b) | 2,932 | 648,001 | ||||||
| 2,076,983 | ||||||||
| Steel–0.08% | ||||||||
Nucor Corp. | 16,051 | 884,571 | ||||||
| Systems Software–3.61% | ||||||||
CA, Inc. | 15,764 | 523,050 | ||||||
Microsoft Corp. | 388,430 | 29,042,911 | ||||||
Oracle Corp. | 151,120 | 7,605,870 | ||||||
Red Hat, Inc.(b) | 8,943 | 961,372 | ||||||
| Shares | Value | |||||||
| Systems Software–(continued) | ||||||||
Symantec Corp. | 30,600 | $ | 917,388 | |||||
| 39,050,591 | ||||||||
| Technology Hardware, Storage & Peripherals–4.51% | ||||||||
Apple Inc. | 262,315 | 43,019,660 | ||||||
Hewlett Packard Enterprise Co. | 83,758 | 1,512,669 | ||||||
HP Inc. | 84,690 | 1,615,885 | ||||||
NetApp, Inc. | 13,630 | 526,936 | ||||||
Seagate Technology PLC | 14,941 | 471,090 | ||||||
Western Digital Corp. | 14,651 | 1,293,244 | ||||||
Xerox Corp. | 10,739 | 346,548 | ||||||
| 48,786,032 | ||||||||
| Tires & Rubber–0.04% | ||||||||
Goodyear Tire & Rubber Co. (The) | 12,667 | 383,810 | ||||||
| Tobacco–1.42% | ||||||||
Altria Group, Inc. | 97,183 | 6,161,402 | ||||||
Philip Morris International Inc. | 78,140 | 9,136,910 | ||||||
| 15,298,312 | ||||||||
| Trading Companies & Distributors–0.14% | ||||||||
Fastenal Co. | 14,552 | 620,934 | ||||||
United Rentals, Inc.(b) | 4,218 | 497,977 | ||||||
W.W. Grainger, Inc. | 2,721 | 442,353 | ||||||
| 1,561,264 | ||||||||
| Trucking–0.04% | ||||||||
J.B. Hunt Transport Services, Inc. | 4,315 | 426,710 | ||||||
| Water Utilities–0.07% | ||||||||
American Water Works Co., Inc. | 8,964 | 725,188 | ||||||
Total Common Stocks & Other Equity Interests |
| 1,065,207,726 | ||||||
Money Market Funds–1.52% |
| |||||||
Government & Agency Portfolio–Institutional Class, 0.93%(e) | 9,852,703 | 9,852,703 | ||||||
Treasury Portfolio–Institutional Class, 0.90%(e) | 6,568,468 | 6,568,468 | ||||||
Total Money Market Funds |
| 16,421,171 | ||||||
TOTAL INVESTMENTS IN SECURITIES–100.07% |
| 1,081,628,897 | ||||||
OTHER ASSETS LESS LIABILITIES–(0.07)% |
| (699,192 | ) | |||||
NET ASSETS–100.00% |
| $ | 1,080,929,705 | |||||
Investment Abbreviations:
| REIT | – Real Estate Investment Trust |
Notes to Schedule of Investments:
| (a) | Industry and/or sector classifications used in this report are generally according to the Global Industry Classification Standard, which was developed by and is the exclusive property and a service mark of MSCI Inc. and Standard & Poor’s. |
| (b) | Non-income producing security. |
| (c) | The Fund’s Adviser is a subsidiary of Invesco Ltd. and therefore, Invesco Ltd. is considered to be affiliated with the Fund. The value of this security as of August 31, 2017 represented less than 1% of the Fund`s Net Assets. See Note 5. |
| (d) | All or a portion of the value was pledged as collateral to cover margin requirements for open futures contracts. See Note 1I. |
| (e) | The money market fund and the Fund are affiliated by having the same investment adviser. The rate shown is the 7-day SEC standardized yield as of August 31, 2017. |
| Open Futures Contracts — Equity Risk | ||||||||||||||||||||
| Long Futures Contracts | Number of Contracts | Expiration Month | Notional Value | Value | Unrealized Appreciation | |||||||||||||||
E-Mini S&P 500 | 144 | September-2017 | $ | 17,784,720 | $ | 192,453 | $ | 192,453 | ||||||||||||
See accompanying Notes to Financial Statements which are an integral part of the financial statements.
16 Invesco S&P 500 Index Fund
Statement of Assets and Liabilities
August 31, 2017
Assets: |
| |||
Investments in securities, at value (Cost $526,354,070) | $ | 1,064,536,785 | ||
Investments in affiliates, at value (Cost $16,931,539) | 17,092,112 | |||
Other investments: | ||||
Variation margin receivable — futures | 106,437 | |||
Cash | 64,815 | |||
Receivable for: | ||||
Fund shares sold | 1,154,369 | |||
Dividends | 2,371,357 | |||
Investment for trustee deferred compensation and retirement plans | 73,817 | |||
Other assets | 62,981 | |||
Total assets | 1,085,462,673 | |||
Liabilities: |
| |||
Payable for: | ||||
Investments purchased | 951,488 | |||
Fund shares reacquired | 2,590,608 | |||
Accrued fees to affiliates | 780,508 | |||
Accrued trustees’ and officers’ fees and benefits | 4,962 | |||
Accrued other operating expenses | 120,850 | |||
Trustee deferred compensation and retirement plans | 84,552 | |||
Total liabilities | 4,532,968 | |||
Net assets applicable to shares outstanding | $ | 1,080,929,705 | ||
Net assets consist of: |
| |||
Shares of beneficial interest | $ | 569,700,090 | ||
Undistributed net investment income | 10,779,536 | |||
Undistributed net realized gain (loss) | (38,085,662 | ) | ||
Net unrealized appreciation | 538,535,741 | |||
| $ | 1,080,929,705 | |||
Net Assets: |
| |||
Class A | $ | 661,887,109 | ||
Class B | $ | 1,487,055 | ||
Class C | $ | 274,099,907 | ||
Class Y | $ | 143,171,424 | ||
Class R6 | $ | 284,210 | ||
Shares outstanding, no par value, |
| |||
Class A | 24,581,270 | |||
Class B | 56,643 | |||
Class C | 10,562,995 | |||
Class Y | 5,251,218 | |||
Class R6 | 10,418 | |||
Class A: | ||||
Net asset value per share | $ | 26.93 | ||
Maximum offering price per share | ||||
(Net asset value of $26.93 ¸ 94.50%) | $ | 28.50 | ||
Class B: | ||||
Net asset value and offering price per share | $ | 26.25 | ||
Class C: | ||||
Net asset value and offering price per share | $ | 25.95 | ||
Class Y: | ||||
Net asset value and offering price per share | $ | 27.26 | ||
Class R6: | ||||
Net asset value and offering price per share | $ | 27.28 | ||
See accompanying Notes to Financial Statements which are an integral part of the financial statements.
17 Invesco S&P 500 Index Fund
Statement of Operations
For the year ended August 31, 2017
Investment income: |
| |||
Dividends | $ | 20,794,275 | ||
Dividends from affiliates | 117,185 | |||
Total investment income | 20,911,460 | |||
Expenses: | ||||
Advisory fees | 1,194,799 | |||
Administrative services fees | 246,058 | |||
Custodian fees | 25,819 | |||
Distribution fees: | ||||
Class A | 1,553,283 | |||
Class B | 23,997 | |||
Class C | 2,422,501 | |||
Transfer agent fees — A, B, C and Y | 1,254,593 | |||
Transfer agent fees — R6 | 18 | |||
Trustees’ and officers’ fees and benefits | 36,194 | |||
Registration and filing fees | 96,676 | |||
Licensing Fees | 199,096 | |||
Reports to shareholders | 149,458 | |||
Professional services fees | 42,714 | |||
Other | 24,571 | |||
Total expenses | 7,269,777 | |||
Less: Fees waived and expense offset arrangement(s) | (25,960 | ) | ||
Net expenses | 7,243,817 | |||
Net investment income | 13,667,643 | |||
Realized and unrealized gain (loss) from: | ||||
Net realized gain from: | ||||
Investment securities | 12,707,191 | |||
Futures contracts | 3,192,912 | |||
| 15,900,103 | ||||
Change in net unrealized appreciation (depreciation) of: | ||||
Investment securities | 113,896,479 | |||
Futures contracts | (380,693 | ) | ||
| 113,515,786 | ||||
Net realized and unrealized gain | 129,415,889 | |||
Net increase in net assets resulting from operations | $ | 143,083,532 | ||
See accompanying Notes to Financial Statements which are an integral part of the financial statements.
18 Invesco S&P 500 Index Fund
Statement of Changes in Net Assets
For the years ended August 31, 2017 and 2016
| 2017 | 2016 | |||||||
Operations: |
| |||||||
Net investment income | $ | 13,667,643 | $ | 12,446,382 | ||||
Net realized gain | 15,900,103 | 5,812,107 | ||||||
Change in net unrealized appreciation | 113,515,786 | 74,110,002 | ||||||
Net increase in net assets resulting from operations | 143,083,532 | 92,368,491 | ||||||
Distributions to shareholders from net investment income: | ||||||||
Class A | (7,927,644 | ) | (9,027,890 | ) | ||||
Class B | (18,198 | ) | (44,560 | ) | ||||
Class C | (1,529,984 | ) | (1,800,621 | ) | ||||
Class Y | (1,532,614 | ) | (1,298,508 | ) | ||||
Total distributions from net investment income | (11,008,440 | ) | (12,171,579 | ) | ||||
Share transactions–net: | ||||||||
Class A | (22,465,651 | ) | 11,375,815 | |||||
Class B | (2,266,326 | ) | (2,051,224 | ) | ||||
Class C | 19,365,394 | 38,850,281 | ||||||
Class Y | 39,718,000 | 33,154,392 | ||||||
Class R6 | 281,123 | — | ||||||
Net increase in net assets resulting from share transactions | 34,632,540 | 81,329,264 | ||||||
Net increase in net assets | 166,707,632 | 161,526,176 | ||||||
Net assets: | ||||||||
Beginning of year | 914,222,073 | 752,695,897 | ||||||
End of year (includes undistributed net investment income of $10,779,536 and $8,119,750, respectively) | $ | 1,080,929,705 | $ | 914,222,073 | ||||
Notes to Financial Statements
August 31, 2017
NOTE 1—Significant Accounting Policies
Invesco S&P 500 Index Fund (the “Fund”) is a series portfolio of AIM Counselor Series Trust (Invesco Counselor Series Trust) (the “Trust”). The Trust is a Delaware statutory trust registered under the Investment Company Act of 1940, as amended (the “1940 Act”), as an open-end series management investment company consisting of fourteen separate portfolios, each authorized to issue an unlimited number of shares of beneficial interest. The assets, liabilities and operations of each portfolio are accounted for separately. Information presented in these financial statements pertains only to the Fund. Matters affecting each portfolio or class will be voted on exclusively by the shareholders of such portfolio or class.
The Fund’s investment objective is total return through growth of capital and current income.
The Fund currently consists of five different classes of shares: Class A, Class B, Class C, Class Y and Class R6. On April 4, 2017, the Fund began offering Class R6 shares. Class Y shares are available only to certain investors. Class A shares are sold with a front-end sales charge unless certain waiver criteria are met and under certain circumstances load waived shares may be subject to contingent deferred sales charges (“CDSC”). Class C shares are sold with a CDSC. Class Y and Class R6 shares are sold at net asset value. Effective November 30, 2010, new or additional investments in Class B shares are no longer permitted. Existing shareholders of Class B shares may continue to reinvest dividends and capital gains distributions in Class B shares until they convert to Class A shares. Also, shareholders in Class B shares will be able to exchange those shares for Class B shares of other Invesco Funds offering such shares until they convert to Class A shares. Generally, Class B shares will automatically convert to Class A shares on or about the month-end, which is at least eight years after the date of purchase. Redemption of Class B shares prior to the conversion date will be subject to a CDSC.
The Fund is an investment company and accordingly follows the investment company accounting and reporting guidance in accordance with Financial Accounting Standards Board Accounting Standards Codification Topic 946, Financial Services — Investment Companies.
The following is a summary of the significant accounting policies followed by the Fund in the preparation of its financial statements.
| A. | Security Valuations — Securities, including restricted securities, are valued according to the following policy. |
A security listed or traded on an exchange (except convertible securities) is valued at its last sales price or official closing price as of the close of the customary trading session on the exchange where the security is principally traded, or lacking any sales or official closing price on a particular day, the security may be valued at the closing bid price on that day. Securities traded in the over-the-counter market are valued based on prices furnished by independent pricing services or market makers. When such securities are valued by an independent pricing service they may be considered fair valued. Futures contracts are valued at the final settlement price set by an exchange on which they are principally traded. Listed options are valued at the mean between the last bid and asked prices from the exchange on which they are principally traded. Options not listed on an exchange are valued by an independent source at the mean between the last bid and asked prices. For purposes of determining net
19 Invesco S&P 500 Index Fund
asset value (“NAV”) per share, futures and option contracts generally are valued 15 minutes after the close of the customary trading session of the New York Stock Exchange (“NYSE”).
Investments in open-end and closed-end registered investment companies that do not trade on an exchange are valued at the end-of-day net asset value per share. Investments in open-end and closed-end registered investment companies that trade on an exchange are valued at the last sales price or official closing price as of the close of the customary trading session on the exchange where the security is principally traded.
Debt obligations (including convertible securities) and unlisted equities are fair valued using an evaluated quote provided by an independent pricing service. Evaluated quotes provided by the pricing service may be determined without exclusive reliance on quoted prices, and may reflect appropriate factors such as institution-size trading in similar groups of securities, developments related to specific securities, dividend rate (for unlisted equities), yield (for debt obligations), quality, type of issue, coupon rate (for debt obligations), maturity (for debt obligations), individual trading characteristics and other market data. Pricing services generally value debt obligations assuming orderly transactions of institutional round lot size, but a Fund may hold or transact in the same securities in smaller, odd lot sizes. Odd lots often trade at lower prices than institutional round lots. Debt obligations are subject to interest rate and credit risks. In addition, all debt obligations involve some risk of default with respect to interest and/or principal payments.
Foreign securities’ (including foreign exchange contracts) prices are converted into U.S. dollar amounts using the applicable exchange rates as of the close of the NYSE. If market quotations are available and reliable for foreign exchange-traded equity securities, the securities will be valued at the market quotations. Because trading hours for certain foreign securities end before the close of the NYSE, closing market quotations may become unreliable. If between the time trading ends on a particular security and the close of the customary trading session on the NYSE, events occur that the investment adviser determines are significant and make the closing price unreliable, the Fund may fair value the security. If the event is likely to have affected the closing price of the security, the security will be valued at fair value in good faith using procedures approved by the Board of Trustees. Adjustments to closing prices to reflect fair value may also be based on a screening process of an independent pricing service to indicate the degree of certainty, based on historical data, that the closing price in the principal market where a foreign security trades is not the current value as of the close of the NYSE. Foreign securities’ prices meeting the approved degree of certainty that the price is not reflective of current value will be priced at the indication of fair value from the independent pricing service. Multiple factors may be considered by the independent pricing service in determining adjustments to reflect fair value and may include information relating to sector indices, American Depositary Receipts and domestic and foreign index futures. Foreign securities may have additional risks including exchange rate changes, potential for sharply devalued currencies and high inflation, political and economic upheaval, the relative lack of issuer information, relatively low market liquidity and the potential lack of strict financial and accounting controls and standards.
Securities for which market prices are not provided by any of the above methods may be valued based upon quotes furnished by independent sources. The last bid price may be used to value equity securities. The mean between the last bid and asked prices is used to value debt obligations, including corporate loans.
Securities for which market quotations are not readily available or became unreliable are valued at fair value as determined in good faith by or under the supervision of the Trust’s officers following procedures approved by the Board of Trustees. Issuer specific events, market trends, bid/asked quotes of brokers and information providers and other market data may be reviewed in the course of making a good faith determination of a security’s fair value.
The Fund may invest in securities that are subject to interest rate risk, meaning the risk that the prices will generally fall as interest rates rise and, conversely, the prices will generally rise as interest rates fall. Specific securities differ in their sensitivity to changes in interest rates depending on their individual characteristics. Changes in interest rates may result in increased market volatility, which may affect the value and/or liquidity of certain Fund investments.
Valuations change in response to many factors including the historical and prospective earnings of the issuer, the value of the issuer’s assets, general economic conditions, interest rates, investor perceptions and market liquidity. Because of the inherent uncertainties of valuation, the values reflected in the financial statements may materially differ from the value received upon actual sale of those investments.
| B. | Securities Transactions and Investment Income — Securities transactions are accounted for on a trade date basis. Realized gains or losses on sales are computed on the basis of specific identification of the securities sold. Interest income (net of withholding tax, if any) is recorded on the accrual basis from settlement date. Dividend income (net of withholding tax, if any) is recorded on the ex-dividend date. |
The Fund may periodically participate in litigation related to Fund investments. As such, the Fund may receive proceeds from litigation settlements. Any proceeds received are included in the Statement of Operations as realized gain (loss) for investments no longer held and as unrealized gain (loss) for investments still held.
Brokerage commissions and mark ups are considered transaction costs and are recorded as an increase to the cost basis of securities purchased and/or a reduction of proceeds on a sale of securities. Such transaction costs are included in the determination of net realized and unrealized gain (loss) from investment securities reported in the Statement of Operations and the Statement of Changes in Net Assets and the net realized and unrealized gains (losses) on securities per share in the Financial Highlights. Transaction costs are included in the calculation of the Fund’s net asset value and, accordingly, they reduce the Fund’s total returns. These transaction costs are not considered operating expenses and are not reflected in net investment income reported in the Statement of Operations and the Statement of Changes in Net Assets, or the net investment income per share and the ratios of expenses and net investment income reported in the Financial Highlights, nor are they limited by any expense limitation arrangements between the Fund and the investment adviser.
The Fund allocates income and realized and unrealized capital gains and losses to a class based on the relative net assets of each class.
| C. | Country Determination — For the purposes of making investment selection decisions and presentation in the Schedule of Investments, the investment adviser may determine the country in which an issuer is located and/or credit risk exposure based on various factors. These factors include the laws of the country under which the issuer is organized, where the issuer maintains a principal office, the country in which the issuer derives 50% or more of its total revenues and the country that has the primary market for the issuer’s securities, as well as other criteria. Among the other criteria that may be evaluated for making this determination are the country in which the issuer maintains 50% or more of its assets, the type of security, financial guarantees and enhancements, the nature of the collateral and the sponsor organization. Country of issuer and/or credit risk exposure has been determined to be the United States of America, unless otherwise noted. |
20 Invesco S&P 500 Index Fund
| D. | Distributions — Distributions from net investment income and net realized capital gain, if any, are generally declared and paid annually and recorded on the ex-dividend date. The Fund may elect to treat a portion of the proceeds from redemptions as distributions for federal income tax purposes. |
| E. | Federal Income Taxes — The Fund intends to comply with the requirements of Subchapter M of the Internal Revenue Code of 1986, as amended (the “Internal Revenue Code”), necessary to qualify as a regulated investment company and to distribute substantially all of the Fund’s taxable earnings to shareholders. As such, the Fund will not be subject to federal income taxes on otherwise taxable income (including net realized capital gain) that is distributed to shareholders. Therefore, no provision for federal income taxes is recorded in the financial statements. |
The Fund recognizes the tax benefits of uncertain tax positions only when the position is more likely than not to be sustained. Management has analyzed the Fund’s uncertain tax positions and concluded that no liability for unrecognized tax benefits should be recorded related to uncertain tax positions. Management is not aware of any tax positions for which it is reasonably possible that the total amounts of unrecognized tax benefits will change materially in the next 12 months.
The Fund files tax returns in the U.S. Federal jurisdiction and certain other jurisdictions. Generally, the Fund is subject to examinations by such taxing authorities for up to three years after the filing of the return for the tax period.
| F. | Expenses — Fees provided for under the Rule 12b-1 plan of a particular class of the Fund and which are directly attributable to that class are charged to the operations of such class. All other expenses are allocated among the classes based on relative net assets. |
| G. | Accounting Estimates — The preparation of financial statements in conformity with accounting principles generally accepted in the United States of America (“GAAP”) requires management to make estimates and assumptions that affect the reported amounts of assets and liabilities at the date of the financial statements and the reported amounts of revenues and expenses during the reporting period including estimates and assumptions related to taxation. Actual results could differ from those estimates by a significant amount. In addition, the Fund monitors for material events or transactions that may occur or become known after the period-end date and before the date the financial statements are released to print. |
| H. | Indemnifications — Under the Trust’s organizational documents, each Trustee, officer, employee or other agent of the Trust is indemnified against certain liabilities that may arise out of the performance of their duties to the Fund. Additionally, in the normal course of business, the Fund enters into contracts, including the Fund’s servicing agreements, that contain a variety of indemnification clauses. The Fund’s maximum exposure under these arrangements is unknown as this would involve future claims that may be made against the Fund that have not yet occurred. The risk of material loss as a result of such indemnification claims is considered remote. |
| I. | Futures Contracts — The Fund may enter into futures contracts to manage exposure to interest rate, equity and market price movements and/or currency risks. A futures contract is an agreement between two parties (“Counterparties”) to purchase or sell a specified underlying security, currency or commodity (or delivery of a cash settlement price, in the case of an index future) for a fixed price at a future date. The Fund currently invests only in exchange-traded futures and they are standardized as to maturity date and underlying financial instrument. Initial margin deposits required upon entering into futures contracts are satisfied by the segregation of specific securities or cash as collateral at the futures commission merchant (broker). During the period the futures contracts are open, changes in the value of the contracts are recognized as unrealized gains or losses by recalculating the value of the contracts on a daily basis. Subsequent or variation margin payments are received or made depending upon whether unrealized gains or losses are incurred. These amounts are reflected as receivables or payables on the Statement of Assets and Liabilities. When the contracts are closed or expire, the Fund recognizes a realized gain or loss equal to the difference between the proceeds from, or cost of, the closing transaction and the Fund’s basis in the contract. The net realized gain (loss) and the change in unrealized gain (loss) on futures contracts held during the period is included on the Statement of Operations. The primary risks associated with futures contracts are market risk and the absence of a liquid secondary market. If the Fund were unable to liquidate a futures contract and/or enter into an offsetting closing transaction, the Fund would continue to be subject to market risk with respect to the value of the contracts and continue to be required to maintain the margin deposits on the futures contracts. Futures contracts have minimal Counterparty risk since the exchange’s clearinghouse, as Counterparty to all exchange-traded futures, guarantees the futures against default. Risks may exceed amounts recognized in the Statement of Assets and Liabilities. |
| J. | Collateral — To the extent the Fund has designated or segregated a security as collateral and that security is subsequently sold, it is the Fund’s practice to replace such collateral no later than the next business day. |
NOTE 2—Advisory Fees and Other Fees Paid to Affiliates
The Trust has entered into a master investment advisory agreement with Invesco Advisers, Inc. (the “Adviser” or “Invesco”). Under the terms of the investment advisory agreement, the Fund accrues daily and pays monthly an advisory fee to the Adviser based on the annual rate of the Fund’s average daily net assets as follows:
| Average Daily Net Assets | Rate | |||
First $2 billion | 0.12% | |||
Over $2 billion | 0.10% | |||
For the year ended August 31, 2017, the effective advisory fees incurred by the Fund was 0.12%.
Under the terms of a master sub-advisory agreement between the Adviser and each of Invesco Asset Management Deutschland GmbH, Invesco Asset Management Limited, Invesco Asset Management (Japan) Limited, Invesco Hong Kong Limited, Invesco Senior Secured Management, Inc. and Invesco Canada Ltd. (collectively, the “Affiliated Sub-Advisers”) the Adviser, not the Fund, will pay 40% of the fees paid to the Adviser to any such Affiliated Sub-Adviser(s) that provide(s) discretionary investment management services to the Fund based on the percentage of assets allocated to such Affiliated Sub-Adviser(s).
The Adviser has contractually agreed, through at least June 30, 2018, to waive advisory fees and/or reimburse expenses to the extent necessary to limit total annual fund operating expenses after fee waiver and/or reimbursement (excluding certain items discussed below) of Class A, Class B, Class C, Class Y and Class R6 shares to 2.00%, 2.75%, 2.75%, 1.75% and 1.75%, respectively, of the Fund’s average daily net assets (the “expense limits”). In determining the Adviser’s obligation to waive advisory fees and/or reimburse expenses, the following expenses are not taken into
21 Invesco S&P 500 Index Fund
account, and could cause total annual fund operating expenses after fee waiver and/or reimbursement to exceed the numbers reflected above: (1) interest; (2) taxes; (3) dividend expense on short sales; (4) extraordinary or non-routine items, including litigation expenses; and (5) expenses that the Fund has incurred but did not actually pay because of an expense offset arrangement. Unless Invesco continues the fee waiver agreement, it will terminate on June 30, 2018. During its term, the fee waiver agreement cannot be terminated or amended to increase the expense limits or reduce the advisory fee waivers without approval of the Board of Trustees. The Adviser did not waive fees and/or reimburse expenses during the period under this expense limit.
Further, the Adviser has contractually agreed, through at least June 30, 2019, to waive the advisory fee payable by the Fund in an amount equal to 100% of the net advisory fees the Adviser receives from the affiliated money market funds on investments by the Fund of uninvested cash in such affiliated money market funds.
For the year ended August 31, 2017, the Adviser waived advisory fees of $21,630.
The Trust has entered into a master administrative services agreement with Invesco pursuant to which the Fund has agreed to pay Invesco for certain administrative costs incurred in providing accounting services to the Fund. For the year ended August 31, 2017, expenses incurred under the agreement are shown in the Statement of Operations as Administrative services fees.
The Trust has entered into a transfer agency and service agreement with Invesco Investment Services, Inc. (“IIS”) pursuant to which the Fund has agreed to pay IIS a fee for providing transfer agency and shareholder services to the Fund and reimburse IIS for certain expenses incurred by IIS in the course of providing such services. IIS may make payments to intermediaries that provide omnibus account services, sub-accounting services and/or networking services. All fees payable by IIS to intermediaries that provide omnibus account services or sub-accounting services are charged back to the Fund, subject to certain limitations approved by the Trust’s Board of Trustees. For the year ended August 31, 2017, the expenses incurred under the agreement are shown in the Statement of Operations as Transfer agent fees.
Shares of the Fund are distributed by Invesco Distributors, Inc. (“IDI”), an affiliate of the Adviser. The Fund has adopted a Plan of Distribution (the “Plan”) pursuant to Rule 12b-1 under the 1940 Act. The Plan provides that the Fund will reimburse IDI for distribution related expenses that IDI incurs up to a maximum of the following annual rates: (1) Class A — up to 0.25% of the average daily net assets of Class A shares; (2) Class B — up to 1.00% of the average daily net assets of Class B shares; and (3) Class C — up to 1.00% of the average daily net assets of Class C shares. The fees are accrued daily and paid monthly.
In the case of Class B shares, provided that the Plan continues in effect, any cumulative expenses incurred by IDI, but not yet reimbursed to IDI, may be recovered through the payment of future distribution fees from the Fund pursuant to the Plan and contingent deferred sales charges paid by investors upon redemption of Class B shares.
For the year ended August 31, 2017, expenses incurred under these agreements are shown in the Statement of Operations as Distribution fees.
Front-end sales commissions and CDSC (collectively, the “sales charges”) are not recorded as expenses of the Fund. Front-end sales commissions are deducted from proceeds from the sales of Fund shares prior to investment in Class A shares of the Fund. CDSC are deducted from redemption proceeds prior to remittance to the shareholder. During the year ended August 31, 2017, IDI advised the Fund that IDI retained $89,853 in front-end sales commissions from the sale of Class A shares and $34 and $24,258 from Class B and Class C shares, respectively, for CDSC imposed on redemptions by shareholders.
Certain officers and trustees of the Trust are officers and directors of the Adviser, IIS and/or IDI.
NOTE 3—Additional Valuation Information
GAAP defines fair value as the price that would be received to sell an asset or paid to transfer a liability in an orderly transaction between market participants at the measurement date, under current market conditions. GAAP establishes a hierarchy that prioritizes the inputs to valuation methods, giving the highest priority to readily available unadjusted quoted prices in an active market for identical assets (Level 1) and the lowest priority to significant unobservable inputs (Level 3), generally when market prices are not readily available or are unreliable. Based on the valuation inputs, the securities or other investments are tiered into one of three levels. Changes in valuation methods may result in transfers in or out of an investment’s assigned level:
| Level 1 — | Prices are determined using quoted prices in an active market for identical assets. |
| Level 2 — | Prices are determined using other significant observable inputs. Observable inputs are inputs that other market participants may use in pricing a security. These may include quoted prices for similar securities, interest rates, prepayment speeds, credit risk, yield curves, loss severities, default rates, discount rates, volatilities and others. |
| Level 3 — | Prices are determined using significant unobservable inputs. In situations where quoted prices or observable inputs are unavailable (for example, when there is little or no market activity for an investment at the end of the period), unobservable inputs may be used. Unobservable inputs reflect the Fund’s own assumptions about the factors market participants would use in determining fair value of the securities or instruments and would be based on the best available information. |
The following is a summary of the tiered valuation input levels, as of August 31, 2017. The level assigned to the securities valuations may not be an indication of the risk or liquidity associated with investing in those securities. Because of the inherent uncertainties of valuation, the values reflected in the financial statements may materially differ from the value received upon actual sale of those investments.
The Fund’s policy is to recognize transfers in and out of the valuation levels as of the end of the reporting period. During the year ended August 31, 2017, there were no transfers between valuation levels.
| Level 1 | Level 2 | Level 3 | Total | |||||||||||||
Common Stock & Other Equity Interests | $ | 1,065,207,726 | $ | — | $ | — | $ | 1,065,207,726 | ||||||||
Money Market Funds | 16,421,171 | — | — | 16,421,171 | ||||||||||||
| 1,081,628,897 | — | — | 1,081,628,897 | |||||||||||||
Futures Contracts* | 192,453 | — | — | 192,453 | ||||||||||||
Total Investments | $ | 1,081,821,350 | $ | — | $ | — | $ | 1,081,821,350 | ||||||||
| * | Unrealized appreciation. |
22 Invesco S&P 500 Index Fund
NOTE 4—Derivative Investments
The Fund may enter into an International Swaps and Derivatives Association Master Agreement (“ISDA Master Agreement”) under which a Fund may trade OTC derivatives. An OTC transaction entered into under an ISDA Master Agreement typically involves a collateral posting arrangement, payment netting provisions and close-out netting provisions. These netting provisions allow for reduction of credit risk through netting of contractual obligations. The enforceability of the netting provisions of the ISDA Master Agreement depends on the governing law of the ISDA Master Agreement, among other factors.
For financial reporting purposes, the Fund does not offset OTC derivative assets or liabilities that are subject to ISDA Master Agreements in the Statement of Assets and Liabilities.
Value of Derivative Investments at Period-End
The table below summarizes the value of the Fund’s derivative investments, detailed by primary risk exposure, held as of August 31, 2017:
| Value | ||||
| Derivative Assets | Equity Risk | |||
Unrealized appreciation on futures contracts — Exchange-Traded(a) | $ | 192,453 | ||
Derivatives not subject to master netting agreements | (192,453 | ) | ||
Total Derivative Assets subject to master netting agreements | $ | — | ||
| (a) | The daily variation margin receivable (payable) at period-end is recorded in the Statement of Assets and Liabilities. |
Effect of Derivative Investments for the year ended August 31, 2017
The table below summarizes the gains (losses) on derivative investments, detailed by primary risk exposure, recognized in earnings during the period:
| Location of Gain (Loss) on Statement of Operations | ||||
| Equity Risk | ||||
Realized Gain: | ||||
Futures contracts | $ | 3,192,912 | ||
Change in Net Unrealized Appreciation (Depreciation): | ||||
Futures contracts | (380,693 | ) | ||
Total | $ | 2,812,219 | ||
The table below summarizes the average notional value of futures contracts outstanding during the period.
Futures Contracts | ||||
Average notional value | $ | 18,335,583 | ||
NOTE 5—Investments in Affiliates
The Fund’s Adviser is a subsidiary of Invesco Ltd. and therefore, Invesco Ltd. is considered to be affiliated with the Fund. The following is a summary of the transactions in, and earnings from, investments in Invesco Ltd. for the year ended August 31, 2017.
Value 08/31/16 | Purchases at Cost | Proceeds from Sales | Change in Unrealized Appreciation | Realized Gain (Loss) | Value 08/31/17 | Dividend Income | ||||||||||||||||||||||
Invesco Ltd. | $ | 618,155 | $ | 36,821 | $ | (13,887 | ) | $ | 30,068 | $ | (216 | ) | $ | 670,941 | $ | 22,794 | ||||||||||||
NOTE 6—Expense Offset Arrangement(s)
The expense offset arrangement is comprised of transfer agency credits which result from balances in demand deposit accounts used by the transfer agent for clearing shareholder transactions. For the year ended August 31, 2017, the Fund received credits from this arrangement, which resulted in the reduction of the Fund’s total expenses of $4,330.
NOTE 7—Trustees’ and Officers’ Fees and Benefits
Trustees’ and Officers’ Fees and Benefits include amounts accrued by the Fund to pay remuneration to certain Trustees and Officers of the Fund. Trustees have the option to defer compensation payable by the Fund, and Trustees’ and Officers’ Fees and Benefits also include amounts accrued by the Fund to fund such deferred compensation amounts. Those Trustees who defer compensation have the option to select various Invesco Funds in which their deferral accounts shall be deemed to be invested. Finally, certain current Trustees were eligible to participate in a retirement plan that provided for benefits to be paid upon retirement to Trustees over a period of time based on the number of years of service. The Fund may have certain former Trustees who also participate in a retirement plan and receive benefits under such plan. Trustees’ and Officers’ Fees and Benefits include amounts accrued by the Fund to fund such retirement benefits. Obligations under the deferred compensation and retirement plans represent unsecured claims against the general assets of the Fund.
23 Invesco S&P 500 Index Fund
NOTE 8—Cash Balances
The Fund is permitted to temporarily carry a negative or overdrawn balance in its account with State Street Bank and Trust Company, the custodian bank. Such balances, if any at period-end, are shown in the Statement of Assets and Liabilities under the payable caption Amount due custodian. To compensate the custodian bank for such overdrafts, the overdrawn Fund may either (1) leave funds as a compensating balance in the account so the custodian bank can be compensated by earning the additional interest; or (2) compensate by paying the custodian bank at a rate agreed upon by the custodian bank and Invesco, not to exceed the contractually agreed upon rate.
NOTE 9—Distributions to Shareholders and Tax Components of Net Assets
Tax Character of Distributions to Shareholders Paid During the Fiscal Years Ended August 31, 2017 and 2016:
| 2017 | 2016 | |||||||
Ordinary income | $ | 11,008,440 | $ | 12,171,579 | ||||
Tax Components of Net Assets at Period-End:
| 2017 | ||||
Undistributed ordinary income | $ | 10,859,137 | ||
Net unrealized appreciation — investments | 517,455,302 | |||
Temporary book/tax differences | (79,600 | ) | ||
Capital loss carryforward | (17,005,224 | ) | ||
Shares of beneficial interest | 569,700,090 | |||
Total net assets | $ | 1,080,929,705 | ||
The difference between book-basis and tax-basis unrealized appreciation (depreciation) is due to differences in the timing of recognition of gains and losses on investments for tax and book purposes. The Fund’s net unrealized appreciation difference is attributable primarily to wash sales.
The temporary book/tax differences are a result of timing differences between book and tax recognition of income and/or expenses. The Fund’s temporary book/tax differences are the result of the trustee deferral of compensation and retirement plan benefits.
Capital loss carryforward is calculated and reported as of a specific date. Results of transactions and other activity after that date may affect the amount of capital loss carryforward actually available for the Fund to utilize. Capital losses generated in years beginning after December 22, 2010 can be carried forward for an unlimited period, whereas previous losses expire in eight tax years. Capital losses with an expiration period may not be used to offset capital gains until all net capital losses without an expiration date have been utilized. Capital loss carryforwards with no expiration date will retain their character as either short-term or long-term capital losses instead of as short-term capital losses as under prior law. The ability to utilize capital loss carryforwards in the future may be limited under the Internal Revenue Code and related regulations based on the results of future transactions.
The Fund has a capital loss carryforward as of August 31, 2017, which expires as follows:
| Capital Loss Carryforward* | ||||||||||||
| Expiration | Short-Term | Long-Term | Total | |||||||||
August 31, 2018 | $ | 6,737,498 | $ | — | $ | 6,737,498 | ||||||
August 31, 2019 | 10,267,726 | — | 10,267,726 | |||||||||
| $ | 17,005,224 | $ | — | $ | 17,005,224 | |||||||
| * | Capital loss carryforward as of the date listed above is reduced for limitations, if any, to the extent required by the Internal Revenue Code and may be further limited depending upon a variety of factors, including the realization of net unrealized gains or losses as of the date of any reorganization. |
NOTE 10–Investment Transactions
The aggregate amount of investment securities (other than short-term securities, U.S. Treasury obligations and money market funds, if any) purchased and sold by the Fund during the year ended August 31, 2017 was $82,296,881 and $37,008,000, respectively. Cost of investments, including any derivatives, on a tax basis includes the adjustments for financial reporting purposes as of the most recently completed federal income tax reporting period-end.
| Unrealized Appreciation (Depreciation) of Investments on a Tax Basis | ||||
Aggregate unrealized appreciation of investments | $ | 529,910,105 | ||
Aggregate unrealized (depreciation) of investments | (12,454,803 | ) | ||
Net unrealized appreciation of investments | $ | 517,455,302 | ||
Cost of investments for tax purposes is $564,366,048.
NOTE 11—Reclassification of Permanent Differences
Primarily as a result of differing book/tax treatment of fair fund settlements, on August 31, 2017, undistributed net investment income was increased by $583 and undistributed net realized gain (loss) was decreased by $583. This reclassification had no effect on the net assets of the Fund.
24 Invesco S&P 500 Index Fund
NOTE 12—Share Information
| Summary of Share Activity | ||||||||||||||||
| Years ended August 31, | ||||||||||||||||
| 2017(a) | 2016 | |||||||||||||||
| Shares | Amount | Shares | Amount | |||||||||||||
Sold: | ||||||||||||||||
Class A | 4,607,891 | $ | 115,534,132 | 5,962,653 | $ | 132,452,874 | ||||||||||
Class B | 7,192 | 177,768 | 12,492 | 263,337 | ||||||||||||
Class C | 2,769,529 | 66,994,471 | 3,654,964 | 78,160,320 | ||||||||||||
Class Y | 2,750,084 | 69,516,769 | 3,644,398 | 80,582,204 | ||||||||||||
Class R6(b) | 10,425 | 281,312 | — | — | ||||||||||||
Issued as reinvestment of dividends: | ||||||||||||||||
Class A | 292,493 | 7,163,159 | 376,356 | 8,136,826 | ||||||||||||
Class B | 649 | 15,585 | 1,881 | 39,916 | ||||||||||||
Class C | 56,196 | 1,332,982 | 73,432 | 1,540,596 | ||||||||||||
Class Y | 52,280 | 1,294,456 | 53,253 | 1,163,579 | ||||||||||||
Automatic conversion of Class B shares to Class A shares: | ||||||||||||||||
Class A | 72,923 | 1,820,835 | 78,803 | 1,734,885 | ||||||||||||
Class B | (74,640 | ) | (1,820,835 | ) | (80,520 | ) | (1,734,885 | ) | ||||||||
Reacquired: | ||||||||||||||||
Class A | (5,857,129 | ) | (146,983,777 | ) | (5,915,309 | ) | (130,948,770 | ) | ||||||||
Class B | (26,114 | ) | (638,844 | ) | (28,646 | ) | (619,592 | ) | ||||||||
Class C | (2,022,785 | ) | (48,962,059 | ) | (1,933,880 | ) | (40,850,635 | ) | ||||||||
Class Y | (1,222,717 | ) | (31,093,225 | ) | (2,243,336 | ) | (48,591,391 | ) | ||||||||
Class R6 | (7 | ) | (189 | ) | — | — | ||||||||||
Net increase in share activity | 1,416,270 | $ | 34,632,540 | 3,656,541 | $ | 81,329,264 | ||||||||||
| (a) | There are entities that are record owners of more than 5% of the outstanding shares of the Fund and in the aggregate own 52% of the outstanding shares of the Fund. IDI has an agreement with these entities to sell Fund shares. The Fund, Invesco and/or Invesco affiliates may make payments to these entities, which are considered to be related to the Fund, for providing services to the Fund, Invesco and/or Invesco affiliates including but not limited to services such as securities brokerage, distribution, third party record keeping and account servicing. The Fund has no knowledge as to whether all or any portion of the shares owned of record by these entities are also owned beneficially. |
| (b) | Commencement date of April 4, 2017. |
25 Invesco S&P 500 Index Fund
NOTE 13—Financial Highlights
The following schedule presents financial highlights for a share of the Fund outstanding throughout the periods indicated.
| Net asset value, beginning of period | Net investment income(a) | Net gains (losses) on securities (both realized and unrealized) | Total from investment operations | Dividends from net investment income | Net asset value, end of period | Total return(b) | Net assets, end of period (000’s omitted) | Ratio of expenses to average net assets with fee waivers and/or expenses absorbed | Ratio of expenses to average net assets without fee waivers and/or expenses absorbed | Ratio of net investment income to average net assets | Portfolio turnover(c) | |||||||||||||||||||||||||||||||||||||
Class A | ||||||||||||||||||||||||||||||||||||||||||||||||
Year ended 08/31/17 | $ | 23.60 | $ | 0.38 | $ | 3.26 | $ | 3.64 | $ | (0.31 | ) | $ | 26.93 | 15.55 | % | $ | 661,887 | 0.58 | %(d) | 0.58 | %(d) | 1.52 | %(d) | 4 | % | |||||||||||||||||||||||
Year ended 08/31/16 | 21.42 | 0.36 | 2.16 | 2.52 | (0.34 | ) | 23.60 | 11.89 | 600,869 | 0.59 | 0.59 | 1.62 | 6 | |||||||||||||||||||||||||||||||||||
Year ended 08/31/15 | 21.69 | 0.32 | (0.33 | ) | (0.01 | ) | (0.26 | ) | 21.42 | (0.05 | ) | 534,656 | 0.58 | 0.58 | 1.44 | 4 | ||||||||||||||||||||||||||||||||
Year ended 08/31/14 | 17.67 | 0.29 | 4.01 | 4.30 | (0.28 | ) | 21.69 | 24.54 | (e) | 557,688 | 0.59 | (e) | 0.59 | (e) | 1.45 | (e) | 5 | |||||||||||||||||||||||||||||||
Year ended 08/31/13 | 15.26 | 0.27 | 2.43 | 2.70 | (0.29 | ) | 17.67 | 18.04 | 467,234 | 0.62 | 0.62 | 1.64 | 6 | |||||||||||||||||||||||||||||||||||
Class B | ||||||||||||||||||||||||||||||||||||||||||||||||
Year ended 08/31/17 | 23.03 | 0.19 | 3.18 | 3.37 | (0.15 | ) | 26.25 | 14.71 | 1,487 | 1.33 | (d) | 1.33 | (d) | 0.77 | (d) | 4 | ||||||||||||||||||||||||||||||||
Year ended 08/31/16 | 20.94 | 0.19 | 2.10 | 2.29 | (0.20 | ) | 23.03 | 11.02 | 3,445 | 1.34 | 1.34 | 0.87 | 6 | |||||||||||||||||||||||||||||||||||
Year ended 08/31/15 | 21.24 | 0.15 | (0.33 | ) | (0.18 | ) | (0.12 | ) | 20.94 | (0.85 | ) | 5,117 | 1.33 | 1.33 | 0.69 | 4 | ||||||||||||||||||||||||||||||||
Year ended 08/31/14 | 17.32 | 0.13 | 3.94 | 4.07 | (0.15 | ) | 21.24 | 23.60 | 8,150 | 1.35 | 1.35 | 0.69 | 5 | |||||||||||||||||||||||||||||||||||
Year ended 08/31/13 | 14.96 | 0.14 | 2.40 | 2.54 | (0.18 | ) | 17.32 | 17.14 | 11,045 | 1.37 | 1.37 | 0.89 | 6 | |||||||||||||||||||||||||||||||||||
Class C | ||||||||||||||||||||||||||||||||||||||||||||||||
Year ended 08/31/17 | 22.77 | 0.19 | 3.14 | 3.33 | (0.15 | ) | 25.95 | 14.71 | (f) | 274,100 | 1.31 | (d)(f) | 1.31 | (d)(f) | 0.79 | (d)(f) | 4 | |||||||||||||||||||||||||||||||
Year ended 08/31/16 | 20.70 | 0.19 | 2.08 | 2.27 | (0.20 | ) | 22.77 | 11.05 | (f) | 222,221 | 1.32 | (f) | 1.32 | (f) | 0.89 | (f) | 6 | |||||||||||||||||||||||||||||||
Year ended 08/31/15 | 20.99 | 0.15 | (0.32 | ) | (0.17 | ) | (0.12 | ) | 20.70 | (0.81 | ) | 164,876 | 1.33 | 1.33 | 0.69 | 4 | ||||||||||||||||||||||||||||||||
Year ended 08/31/14 | 17.12 | 0.13 | 3.89 | 4.02 | (0.15 | ) | 20.99 | 23.59 | 124,452 | 1.35 | 1.35 | 0.69 | 5 | |||||||||||||||||||||||||||||||||||
Year ended 08/31/13 | 14.79 | 0.14 | 2.37 | 2.51 | (0.18 | ) | 17.12 | 17.14 | (f) | 91,761 | 1.36 | (f) | 1.36 | (f) | 0.90 | (f) | 6 | |||||||||||||||||||||||||||||||
Class Y | ||||||||||||||||||||||||||||||||||||||||||||||||
Year ended 08/31/17 | 23.88 | 0.45 | 3.29 | 3.74 | (0.36 | ) | 27.26 | 15.83 | 143,171 | 0.33 | (d) | 0.33 | (d) | 1.77 | (d) | 4 | ||||||||||||||||||||||||||||||||
Year ended 08/31/16 | 21.67 | 0.42 | 2.18 | 2.60 | (0.39 | ) | 23.88 | 12.15 | 87,687 | 0.34 | 0.34 | 1.87 | 6 | |||||||||||||||||||||||||||||||||||
Year ended 08/31/15 | 21.94 | 0.38 | (0.34 | ) | 0.04 | (0.31 | ) | 21.67 | 0.17 | 48,047 | 0.33 | 0.33 | 1.69 | 4 | ||||||||||||||||||||||||||||||||||
Year ended 08/31/14 | 17.87 | 0.34 | 4.05 | 4.39 | (0.32 | ) | 21.94 | 24.83 | 24,870 | 0.35 | 0.35 | 1.69 | 5 | |||||||||||||||||||||||||||||||||||
Year ended 08/31/13 | 15.43 | 0.32 | 2.45 | 2.77 | (0.33 | ) | 17.87 | 18.33 | 22,546 | 0.37 | 0.37 | 1.89 | 6 | |||||||||||||||||||||||||||||||||||
Class R6 | ||||||||||||||||||||||||||||||||||||||||||||||||
Year ended 08/31/17(g) | 25.85 | 0.20 | 1.23 | 1.43 | — | 27.28 | 5.53 | 284 | 0.26 | (d)(h) | 0.26 | (d)(h) | 1.84 | (d)(h) | 4 | |||||||||||||||||||||||||||||||||
| (a) | Calculated using average shares outstanding. |
| (b) | Includes adjustments in accordance with accounting principles generally accepted in the United States of America and as such, the net asset value for financial reporting purposes and the returns based upon those net asset values may differ from the net asset value and returns for shareholder transactions. Does not include sales charges and is not annualized for periods less than one year, if applicable. |
| (c) | Portfolio turnover is calculated at the fund level and is not annualized for periods less than one year, if applicable. |
| (d) | Ratios are based on average daily net assets (000’s omitted) of $629,087, $2,400, $248,127, $116,015 and $90 for Class A, Class B, Class C, Class Y and Class R6 shares, respectively. |
| (e) | The total return, ratio of expenses to average net assets and ratio of net investment income to average net assets reflect actual 12b-1 fees of 0.24% for the year ended August 31, 2014. |
| (f) | The total return, ratio of expenses to average net assets and ratio of net investment income to average net assets reflect actual 12b-1 fees of 0.98%, 0.98% and 0.99% for the years ended August 31, 2017, August 31, 2016 and August 31, 2013, respectively. |
| (g) | Commencement date of April 4, 2017. |
| (h) | Annualized. |
26 Invesco S&P 500 Index Fund
Report of Independent Registered Public Accounting Firm
To the Board of Trustees of AIM Counselor Series Trust (Invesco Counselor Series Trust)
and Shareholders of Invesco S&P 500 Index Fund:
In our opinion, the accompanying statement of assets and liabilities, including the schedule of investments, and the related statements of operations and of changes in net assets and the financial highlights present fairly, in all material respects, the financial position of Invesco S&P 500 Index Fund (one of the funds constituting AIM Counselor Series Trust (Invesco Counselor Series Trust), hereafter referred to as the “Fund”) as of August 31, 2017, the results of its operations for the year then ended, the changes in its net assets for each of the two years in the period then ended and the financial highlights for each of the periods indicated therein, in conformity with accounting principles generally accepted in the United States of America. These financial statements and financial highlights (hereafter referred to as “financial statements”) are the responsibility of the Fund’s management. Our responsibility is to express an opinion on these financial statements based on our audits. We conducted our audits of these financial statements in accordance with the standards of the Public Company Accounting Oversight Board (United States). Those standards require that we plan and perform the audit to obtain reasonable assurance about whether the financial statements are free of material misstatement. An audit includes examining, on a test basis, evidence supporting the amounts and disclosures in the financial statements, assessing the accounting principles used and significant estimates made by management, and evaluating the overall financial statement presentation. We believe that our audits, which included confirmation of securities as of August 31, 2017 by correspondence with the custodian, transfer agent and brokers, and when replies were not received from brokers, we performed other auditing procedures, provide a reasonable basis for our opinion.
PricewaterhouseCoopers LLP
Houston, Texas
October 30, 2017
27 Invesco S&P 500 Index Fund
Calculating your ongoing Fund expenses
Example
As a shareholder of the Fund, you incur two types of costs: (1) transaction costs, which may include sales charges (loads) on purchase payments or contingent deferred sales charges on redemptions, if any; and (2) ongoing costs, including management fees, distribution and/or service (12b-1) fees, and other Fund expenses. This example is intended to help you understand your ongoing costs (in dollars) of investing in the Fund and to compare these costs with ongoing costs of investing in other mutual funds. With the exception of the actual ending account value and expenses of the Class R6 shares, the example is based on an investment of $1,000 invested at the beginning of the period and held for the entire period March 1, 2017 through August 31, 2017. The actual ending account value and expenses of the Class R6 shares in the example below are based on an investment of $1,000 invested as of close of business April 4, 2017 (commencement date) and held through August 31, 2017.
Actual expenses
The table below provides information about actual account values and actual expenses. You may use the information in this table, together with the amount you invested, to estimate the expenses that you paid over the period. Simply divide your account value by $1,000 (for example, an $8,600 account value divided by $1,000 = 8.6), then multiply the result by the number in the table under the heading entitled “Actual Expenses Paid During Period” to estimate the expenses you paid on your account during this period (as of close of business April 4, 2017 through August 31, 2017 for the Class R6 shares). Because the actual ending account value and expense information in the example is not based upon a six month period for the Class R6 shares, the ending account value and expense information may not provide a meaningful comparison to mutual funds that provide such information for a full six month period.
Hypothetical example for comparison purposes
The table below also provides information about hypothetical account values and hypothetical expenses based on the Fund’s actual expense ratio and an assumed rate of return of 5% per year before expenses, which is not the Fund’s actual return.
The hypothetical account values and expenses may not be used to estimate the actual ending account balance or expenses you paid for the period. You may use this information to compare the ongoing costs of investing in the Fund and other funds. To do so, compare this 5% hypothetical example with the 5% hypothetical examples that appear in the shareholder reports of the other funds.
Please note that the expenses shown in the table are meant to highlight your ongoing costs only and do not reflect any transaction costs, such as sales charges (loads) on purchase payments or contingent deferred sales charges on redemptions, if any. Therefore, the hypothetical information is useful in comparing ongoing costs only, and will not help you determine the relative total costs of owning different funds. In addition, if these transaction costs were included, your costs would have been higher.
| Class | Beginning Account Value (03/01/17) | ACTUAL | HYPOTHETICAL expenses) | Annualized Expense Ratio | ||||||||||||||||||||
| Ending Account Value (08/31/17)1 | Expenses Paid During Period2 | Ending Account Value (08/31/17) | Expenses Paid During Period3 | |||||||||||||||||||||
A | $ | 1,000.00 | $ | 1,053.60 | $ | 3.00 | $ | 1,022.28 | $ | 2.96 | 0.58 | % | ||||||||||||
B | 1,000.00 | 1,049.20 | 6.87 | 1,018.50 | 6.77 | 1.33 | ||||||||||||||||||
C | 1,000.00 | 1,048.90 | 6.71 | 1,018.65 | 6.61 | 1.30 | ||||||||||||||||||
Y | 1,000.00 | 1,054.60 | 1.71 | 1,023.54 | 1.68 | 0.33 | ||||||||||||||||||
R6 | 1,000.00 | 1,055.30 | 1.10 | 1,023.89 | 1.33 | 0.26 | ||||||||||||||||||
| 1 | The actual ending account value is based on the actual total return of the Fund for the period March 1, 2017 through August 31, 2017 (as of close of business April 4, 2017 through August 31, 2017 for the Class R6 shares), after actual expenses and will differ from the hypothetical ending account value which is based on the Fund’s expense ratio and a hypothetical annual return of 5% before expenses. |
| 2 | Actual expenses are equal to the Fund’s annualized expense ratio as indicated above multiplied by the average account value over the period, multiplied by 184/365 to reflect the most recent fiscal half year. For the Class R6 shares actual expenses are equal to the annualized expense ratio indicated above multiplied by the average account value over the period, multiplied by 150 (as of close of business April 4, 2017 through August 31, 2017)/365. Because the Class R6 shares have not been in existence for a full six month period, the actual ending account value and expense information shown may not provide a meaningful comparison to fund expense information of classes that show such data for a full six month period and, because the actual ending account value and expense information in the expense example covers a short time period, return and expense data may not be indicative of return and expense data for longer time periods. |
| 3 | Hypothetical expenses are equal to the annualized expense ratio indicated above multiplied by the average account value over the period, multiplied by 184/365 to reflect a one-half year period. The hypothetical ending account value and expenses may be used to compare ongoing costs of investing in Class R6 shares of the Fund and other funds because such data is based on a full six month period. |
28 Invesco S&P 500 Index Fund
Approval of Investment Advisory and Sub-Advisory Contracts
The Board of Trustees (the Board) of AIM Counselor Series Trust (Invesco Counselor Series Trust) is required under the Investment Company Act of 1940, as amended, to approve annually the renewal of Invesco S&P 500 Index Fund’s (the Fund) investment advisory agreements. During contract renewal meetings held on June 12-13, 2017, the Board as a whole, and the disinterested or “independent” Trustees, who comprise over 75% of the Board, voting separately, approved the continuance for the Fund of the Master Investment Advisory Agreement with Invesco Advisers, Inc. (Invesco Advisers and the investment advisory agreement) and the Master Intergroup Sub-Advisory Contract for Mutual Funds with Invesco Asset Management Deutschland GmbH, Invesco Asset Management Limited, Invesco Asset Management (Japan) Limited, Invesco Hong Kong Limited, Invesco Senior Secured Management, Inc. and Invesco Canada Ltd. (collectively, the Affiliated Sub-Advisers and the sub-advisory contracts) for another year, effective July 1, 2017.
In evaluating the fairness and reasonableness of compensation under the Fund’s investment advisory agreement and sub-advisory contracts, the Board considered, among other things, the factors discussed below. The Board determined that continuation of the Fund’s investment advisory agreement and the sub-advisory contracts is in the best interest of the Fund and its shareholders and that the compensation payable to Invesco Advisers and the Affiliated Sub-Advisers under the agreements is fair and reasonable.
The Board’s Fund Evaluation Process
The Board’s Investments Committee has established three Sub-Committees, which meet throughout the year to review the performance of funds advised by Invesco Advisers (the Invesco Funds). Over the course of each year, the Sub-Committees meet with portfolio managers for their assigned Invesco Funds and other members of management to review the performance, investment objective(s), policies, strategies, limitations and investment risks of these funds. The Board had the benefit of reports from the Sub-Committees and Investments Committee throughout the year in considering approval of the continuance of each Invesco Fund’s investment advisory agreement and sub-advisory contracts for another year.
During the contract renewal process, the Board receives comparative performance and fee data regarding the Invesco Funds prepared by Invesco Advisers and Broadridge Financial Solutions, Inc. (Broadridge), an independent provider of investment company data. The Board also receives an independent written evaluation from the Senior Officer, an officer of the Invesco Funds who reports directly to the independent Trustees. The Senior Officer’s
evaluation is prepared as part of his responsibility to manage the process by which the Invesco Funds’ proposed management fees are negotiated during the annual contract renewal process to ensure they are negotiated in a manner that is at arms’ length and reasonable. In addition to meetings with Invesco Advisers and fund counsel, the independent Trustees also discuss the continuance of the investment advisory agreement and sub-advisory contracts in separate sessions with the Senior Officer and with independent legal counsel.
The Trustees recognized that the advisory fee rates for the Invesco Funds are, in most cases, the result of years of review and negotiation. The Trustees’ deliberations and conclusions in a particular year may be based in part on their deliberations and conclusions regarding these arrangements throughout the year and in prior years. The Trustees’ review and conclusions are based on the comprehensive consideration of all information presented to them and are not the result of any single determinative factor. Moreover, one Trustee may have weighed a particular piece of information or factor differently than another Trustee.
The discussion below is a summary of the Senior Officer’s independent written evaluation with respect to the Fund’s investment advisory agreement as well as a discussion of the material factors and related conclusions that formed the basis for the Board’s approval of the Fund’s investment advisory agreement and sub-advisory contracts. This information is current as of June 13, 2017, and does not reflect consideration of factors that became known to the Board after that date.
Factors and Conclusions and Summary of Independent Written Fee Evaluation
| A. | Nature, Extent and Quality of Services Provided by Invesco Advisers and the Affiliated Sub-Advisers |
The Board reviewed the advisory services provided to the Fund by Invesco Advisers under the Fund’s investment advisory agreement, the performance of Invesco Advisers in providing these services, and the credentials and experience of the officers and employees of Invesco Advisers who provide these services, including the Fund’s portfolio manager or managers. The Board’s review included consideration of Invesco Advisers’ investment process oversight, credit analysis and investment risk management. The Board also considered non-advisory services that Invesco Advisers and its affiliates provide to the Invesco Funds such as various back office support functions, trading operations, internal audit, valuation and legal and compliance.
In determining whether to continue the Fund’s investment advisory agreement, the Board considered the benefits of reapproving an
existing relationship as contrasted with the greater uncertainty that may be associated with entering into a new relationship. The Board concluded that the nature, extent and quality of the services provided to the Fund by Invesco Advisers are appropriate and satisfactory.
The Board reviewed the services that may be provided by the Affiliated Sub-Advisers under the sub-advisory contracts and the credentials and experience of the officers and employees of the Affiliated Sub-Advisers who provide these services. The Board noted that the Affiliated Sub-Advisers have offices and personnel that are located in financial centers around the world. As a result, the Board noted that the Affiliated Sub-Advisers can provide research and investment analysis on the markets and economies of various countries in which the Fund may invest, make recommendations regarding securities and assist with security trades. The Board concluded that the sub-advisory contracts may benefit the Fund and its shareholders by permitting Invesco Advisers to use the resources and talents of the Affiliated Sub-Advisers in managing the Fund. The Board concluded that the nature, extent and quality of the services that may be provided by the Affiliated Sub-Advisers are appropriate and satisfactory.
| B. | Fund Investment Performance |
The Board considered Fund investment performance as a relevant factor in considering whether to approve the investment advisory agreement. The Board did not view Fund performance as a relevant factor in considering whether to approve the sub-advisory contracts for the Fund, as no Affiliated Sub-Adviser currently manages assets of the Fund.
The Board compared the Fund’s investment performance over multiple time periods ending December 31, 2016 to the performance of funds in the Broadridge performance universe and against the Lipper S&P 500 Funds Index. The Board noted that performance of Class A shares of the Fund was in the fourth quintile of its performance universe for the one, three and five year periods (the first quintile being the best performing funds and the fifth quintile being the worst performing funds). The Board noted that performance of Class A shares of the Fund was below the performance of the Index for the one, three and five year periods. The Trustees also reviewed more recent Fund performance and this review did not change their conclusions.
| C. | Advisory and Sub-Advisory Fees |
The Board compared the Fund’s contractual management fee rate to the contractual management fee rates of funds in the Fund’s Broadridge expense group at a common asset level. The Board noted that the contractual management fee rate for Class A shares of the Fund was below the median contractual management fee rate of funds in its expense
29 Invesco S&P 500 Index Fund
group. The Board noted that the term “contractual management fee” for funds in the expense group may include both advisory and certain administrative services fees, but that Broadridge does not provide information on a fund by fund basis as to what is included. The Board noted that Invesco Advisers does not separately charge the Invesco Funds for the administrative services included in the term as defined by Broadridge. The Board also reviewed the methodology used by Broadridge in providing expense group information, which includes using each fund’s contractual management fee schedule (including any applicable breakpoints) as reported in the most recent prospectus or statement of additional information for each fund in the expense group.
The Board also compared the Fund’s effective advisory fee rate (the advisory fee rate after advisory fee waivers and before other expense limitations/waivers) to the effective advisory fee rates of other mutual funds advised by Invesco Advisers and its affiliates with investment strategies comparable to those of the Fund, based on asset balances as of December 31, 2016. The Board noted that the Fund’s rate was the same as the rate of one such mutual fund.
The Board noted that Invesco Advisers and the Affiliated Sub-Advisers do not manage other client accounts with investment strategies comparable to those of the Fund.
The Board also considered the services that may be provided by the Affiliated Sub-Advisers pursuant to the sub-advisory contracts, as well as the fees payable by Invesco Advisers to the Affiliated Sub-Advisers pursuant to the sub-advisory contracts. The Board also noted that the sub-advisory fees are not paid directly by the Fund, but rather, are payable by Invesco Advisers to the Affiliated Sub-Advisers.
| D. | Economies of Scale and Breakpoints |
The Board considered the extent to which there are economies of scale in the provision of advisory services to the Fund. The Board also considered that the Fund may benefit from economies of scale through contractual breakpoints in the Fund’s advisory fee schedule. The Board noted that the Fund shares directly in economies of scale through lower fees charged by third party service providers based on the combined size of the Invesco Funds advised by Invesco Advisers.
| E. | Profitability and Financial Resources |
The Board reviewed information from Invesco Advisers concerning the costs of the advisory and other services that Invesco Advisers and its affiliates provide to the Fund and the Invesco Funds and the profitability of Invesco Advisers and its affiliates in providing these services. The Board noted that Invesco Advisers continues to operate at a net profit from services Invesco Advisers and its affiliates provide to the Invesco Funds. The Board noted that although Invesco Advisers operated at a profit from advising the Fund, over all Invesco Advisers and its subsidiaries did not make a profit from managing the Fund. The Board received and accepted information from Invesco Advisers
demonstrating that Invesco Advisers and each Affiliated Sub-Adviser are financially sound and have the resources necessary to perform their obligations under the investment advisory agreement and sub-advisory contracts.
| F. | Collateral Benefits to Invesco Advisers and its Affiliates |
The Board considered various other benefits received by Invesco Advisers and its affiliates from the relationship with the Fund, including the fees received for providing transfer agency and distribution services to the Fund. The Board considered comparative information regarding fees charged for these services, including information provided by Broadridge and other independent sources. The Board considered the performance of Invesco Advisers and its affiliates in providing these services and the organizational structure employed to provide these services. The Board also considered that these services are provided to the Fund pursuant to written contracts that are reviewed and approved on an annual basis by the Board; and that the services are required for the operation of the Fund.
The Board considered the benefits realized by Invesco Advisers and the Affiliated Sub-Advisers as a result of portfolio brokerage transactions executed through “soft dollar” arrangements. The Board noted that soft dollar arrangements may result in the Fund bearing costs to purchase research that may be used by Invesco Advisers or the Affiliated Sub-Advisers with other clients and may reduce Invesco Adviser’s or the Affiliated Sub-Adviser’s expenses. The Board also considered that it receives periodic reports from the Chief Compliance Officer of the Invesco Funds demonstrating that these arrangements are consistent with regulatory requirements. The Board did not deem the soft dollar arrangements to be inappropriate.
The Board considered that the Fund’s uninvested cash and cash collateral from any securities lending arrangements may be invested in money market funds advised by Invesco Advisers pursuant to procedures approved by the Board. The Board noted that Invesco Advisers receives advisory fees from these affiliated money market funds attributable to such investments, although Invesco Advisers has contractually agreed to waive through varying periods the advisory fees payable by the Invesco Funds with respect to certain investments in the affiliated money market funds. The waiver is in an amount equal to 100% of the net advisory fee Invesco Advisers receives from the affiliated money market funds with respect to the Fund’s investment in the affiliated money market funds of uninvested cash, but not cash collateral. The Board concluded that the amount of advisory fees received by Invesco Advisers from the Fund’s investment of cash collateral from any securities lending arrangements in the affiliated money market funds is fair and reasonable.
The Board also considered that the Fund may use an affiliated broker to execute certain trades for the Fund to, among other things,
control information leakage, and was advised that such trades would be executed in compliance with rules under the federal securities laws and consistent with best execution obligations.
30 Invesco S&P 500 Index Fund
Tax Information
Form 1099-DIV, Form 1042-S and other year-end tax information provide shareholders with actual calendar year amounts that should be included in their tax returns. Shareholders should consult their tax advisors.
The following distribution information is being provided as required by the Internal Revenue Code or to meet a specific state’s requirement.
The Fund designates the following amounts or, if subsequently determined to be different, the maximum amount allowable for its fiscal year ended August 31, 2017:
Federal and State Income Tax | ||||
Qualified Dividend Income* | 100 | % | ||
Corporate Dividends Received Deduction* | 100 | % | ||
U.S. Treasury Obligations* | 0 | % | ||
| * | The above percentages are based on ordinary income dividends paid to shareholders during the Fund’s fiscal year. |
31 Invesco S&P 500 Index Fund
Proxy Results
A Special Joint Meeting (“Meeting”) of Shareholders of Invesco S&P 500 Index Fund, an investment portfolio of AIM Counselor Series Trust (Invesco Counselor Series Trust), a Delaware statutory trust (“Trust”), was held on March 9, 2017. The Meeting was held for the following purposes:
| (1) | Elect 15 trustees to the Board, each of whom will serve until his or her successor is elected and qualified. |
| (2) | Approve an amendment to the Trust’s Agreement and Declaration of Trust that would permit fund mergers and other significant transactions upon the Board’s approval but without shareholder approval of such transactions. |
The results of the voting on the above matters were as follows:
| Matters | Votes For | Votes Withheld | ||||||||||||||||
| (1)* | David C. Arch | 1,425,647,604 | 36,521,875 | |||||||||||||||
| James T. Bunch | 1,425,181,099 | 36,988,380 | ||||||||||||||||
| Bruce L. Crockett | 1,425,174,694 | 36,994,785 | ||||||||||||||||
| Jack M. Fields | 1,426,060,874 | 36,108,605 | ||||||||||||||||
| Martin L. Flanagan | 1,426,481,477 | 35,688,002 | ||||||||||||||||
| Cynthia Hostetler | 1,426,489,972 | 35,679,505 | ||||||||||||||||
| Dr. Eli Jones | 1,426,255,832 | 35,913,647 | ||||||||||||||||
| Dr. Prema Mathai-Davis | 1,425,363,789 | 36,805,689 | ||||||||||||||||
| Teresa M. Ressel | 1,426,514,880 | 35,654,598 | ||||||||||||||||
| Dr. Larry Soll | 1,424,932,245 | 37,237,234 | ||||||||||||||||
| Ann Barnett Stern | 1,426,260,049 | 35,909,429 | ||||||||||||||||
| Raymond Stickel, Jr. | 1,425,391,657 | 36,777,822 | ||||||||||||||||
| Philip A. Taylor | 1,426,285,212 | 35,884,267 | ||||||||||||||||
| Robert C. Troccoli | 1,426,075,097 | 36,094,382 | ||||||||||||||||
| Christopher L. Wilson | 1,426,594,956 | 35,574,523 | ||||||||||||||||
| Votes For | Votes Against | Votes Abstain | Broker Non-Votes | |||||||||||||||
| (2)* | Approve an amendment to the Trust’s Agreement and Declaration of Trust that would permit fund mergers and other significant transactions upon the Board’s approval but without shareholder approval of such transactions | 751,302,707 | 79,810,344 | 41,561,890 | 589,495,482 | |||||||||||||
The Meeting was adjourned until April 11, 2017, with respect to the following proposals:
| (3) | Approve changing the fundamental investment restriction regarding the purchase or sale of physical commodities. |
| 4(a) | Approve an amendment to the current Master Intergroup Sub-Advisory Contract to add Invesco PowerShares Capital Management LLC. |
| 4(b) | Approve an amendment to the current Master Intergroup Sub-Advisory Contract to add Invesco Asset Management (India) Private Limited. |
Invesco S&P 500 Index Fund did not receive sufficient shareholder votes to pass Proposals 3 and 4(a) - (b).
The results of the voting on the above matters were as follows:
| Matters | Votes For | Votes Against | Votes Abstain | Broker Non-Votes | ||||||||||||||
| (3) | Approve changing the fundamental investment restriction regarding the purchase or sale of physical commodities | 9,610,531 | 959,426 | 634,597 | 7,003,328 | |||||||||||||
| 4(a) | Approve an amendment to the current Master Intergroup Sub-Advisory Contract to add Invesco PowerShares Capital Management LLC | 10,014,288 | 543,895 | 646,383 | 7,003,316 | |||||||||||||
| 4(b) | Approve an amendment to the current Master Intergroup Sub-Advisory Contract to add Invesco Asset Management (India) Private Limited | 9,823,014 | 684,458 | 697,088 | 7,003,322 | |||||||||||||
| * | Each of proposal 1 and 2 required approval by a combined vote of all of the portfolios of AIM Counselor Series Trust (Invesco Counselor Series Trust). |
32 Invesco S&P 500 Index Fund
Trustees and Officers
The address of each trustee and officer is AIM Counselor Series Trust (Invesco Counselor Series Trust) (the “Trust”), 11 Greenway Plaza, Suite 1000, Houston, Texas 77046-1173. The trustees serve for the life of the Trust, subject to their earlier death, incapacitation, resignation, retirement or removal as more specifically provided in the Trust’s organizational documents. Each officer serves for a one year term or until their successors are elected and qualified. Column two below includes length of time served with predecessor entities, if any.
| Name, Year of Birth and Position(s) Held with the Trust | Trustee and/ or Officer Since | Principal Occupation(s) During Past 5 Years | Number of Overseen by | Other Directorship(s) Held by Trustee During Past 5 Years | ||||
| Interested Persons | ||||||||
| Martin L. Flanagan1 — 1960 Trustee | 2007 | Executive Director, Chief Executive Officer and President, Invesco Ltd. (ultimate parent of Invesco and a global investment management firm); Trustee, The Invesco Funds; Vice Chair, Investment Company Institute; and Member of Executive Board, SMU Cox School of Business
Formerly: Advisor to the Board, Invesco Advisers, Inc. (formerly known as Invesco Institutional (N.A.), Inc.); Chairman and Chief Executive Officer, Invesco Advisers, Inc. (registered investment adviser); Director, Chairman, Chief Executive Officer and President, Invesco Holding Company (US), Inc. (formerly IVZ Inc.) (holding company), Invesco Group Services, Inc. (service provider) and Invesco North American Holdings, Inc. (holding company); Director, Chief Executive Officer and President, Invesco Holding Company Limited (parent of Invesco and a global investment management firm); Director, Invesco Ltd.; Chairman, Investment Company Institute and President, Co-Chief Executive Officer, Co-President, Chief Operating Officer and Chief Financial Officer, Franklin Resources, Inc. (global investment management organization) | 144 | None | ||||
Philip A. Taylor2 — 1954 Trustee and Senior Vice President | 2006 | Head of the Americas and Senior Managing Director, Invesco Ltd.; Director, Invesco Advisers, Inc. (formerly known as Invesco Institutional (N.A.), Inc.) (registered investment adviser); Director, Chairman, Chief Executive Officer and President, Invesco Management Group, Inc. (formerly known as Invesco Aim Management Group, Inc.) (financial services holding company); Director and Chairman, Invesco Investment Services, Inc. (formerly known as Invesco Aim Investment Services, Inc.) (registered transfer agent); Chief Executive Officer, Invesco Corporate Class Inc. (corporate mutual fund company); Director, Chairman and Chief Executive Officer, Invesco Canada Ltd. (formerly known as Invesco Trimark Ltd./Invesco Trimark Ltèe) (registered investment adviser and registered transfer agent); Trustee and Senior Vice President, The Invesco Funds; Director, Invesco Investment Advisers LLC (formerly known as Van Kampen Asset Management).
Formerly: Co-Chairman, Co-President and Co-Chief Executive Officer, Invesco Advisers, Inc. (formerly known as Invesco Institutional (N.A.), Inc.) (registered investment adviser); Director, Chief Executive Officer and President, Van Kampen Exchange Corp; President and Principal Executive Officer, The Invesco Funds (other than AIM Treasurer’s Series Trust (Invesco Treasurer’s Series Trust), Short-Term Investments Trust and Invesco Management Trust); Executive Vice President, The Invesco Funds (AIM Treasurer’s Series Trust (Invesco Treasurer’s Series Trust), Short-Term Investments Trust and Invesco Management Trust only); Director and President, INVESCO Funds Group, Inc. (registered investment adviser and registered transfer agent); Director and Chairman, IVZ Distributors, Inc. (formerly known as INVESCO Distributors, Inc.) (registered broker dealer); Director, President and Chairman, Invesco Inc. (holding company), Invesco Canada Holdings Inc. (holding company), Trimark Investments Ltd./Placements Trimark Ltèe and Invesco Financial Services Ltd/Services Financiers Invesco Ltèe; Chief Executive Officer, Invesco Canada Fund Inc. (corporate mutual fund company); Director and Chairman, Van Kampen Investor Services Inc.; Director, Chief Executive Officer and President, 1371 Preferred Inc. (holding company) and Van Kampen Investments Inc.; Director and President, AIM GP Canada Inc. (general partner for limited partnerships) and Van Kampen Advisors, Inc.; Director and Chief Executive Officer, Invesco Trimark Dealer Inc. (registered broker dealer); Director, Invesco Distributors, Inc. (formerly known as Invesco Aim Distributors, Inc.) (registered broker dealer); Manager, Invesco PowerShares Capital Management LLC; Director, Chief Executive Officer and President, Invesco Advisers, Inc.; Director, Chairman, Chief Executive Officer and President, Invesco Aim Capital Management, Inc.; President, Invesco Trimark Dealer Inc. and Invesco Trimark Ltd./Invesco Trimark Ltèe; Director and President, AIM Trimark Corporate Class Inc. and AIM Trimark Canada Fund Inc.; Senior Managing Director, Invesco Holding Company Limited; Director and Chairman, Fund Management Company (former registered broker dealer); President and Principal Executive Officer, The Invesco Funds (AIM Treasurer’s Series Trust (Invesco Treasurer’s Series Trust), and Short-Term Investments Trust only); President, AIM Trimark Global Fund Inc. and AIM Trimark Canada Fund Inc. | 144 | None |
| 1 | Mr. Flanagan is considered an interested person (within the meaning of Section 2(a)(19) of the 1940 Act) of the Trust because he is an officer of the Adviser to the Trust, and an officer and a director of Invesco Ltd., ultimate parent of the Adviser. |
| 2 | Mr. Taylor is considered an interested person (within the meaning of Section 2(a)(19) of the 1940 Act) of the Trust because he is an officer and a director of the Adviser. |
T-1 Invesco S&P 500 Index Fund
Trustees and Officers—(continued)
| Name, Year of Birth and Position(s) Held with the Trust | Trustee and/ or Officer Since | Principal Occupation(s) During Past 5 Years | Number of Complex Overseen by Trustee | Other Directorship(s) Held by Trustee During | ||||
| Independent Trustees | ||||||||
Bruce L. Crockett — 1944 Trustee and Chair | 2003 | Chairman, Crockett Technologies Associates (technology consulting company)
Formerly: Director, Captaris (unified messaging provider); Director, President and Chief Executive Officer, COMSAT Corporation; Chairman, Board of Governors of INTELSAT (international communications company); ACE Limited (insurance company); Independent Directors Council and Investment Company Institute: Member of the Audit Committee, Investment Company Institute; Member of the Executive Committee and Chair of the Governance Committee, Independent Directors Council | 144 | Director and Chairman of the Audit Committee, ALPS (Attorneys Liability Protection Society) (insurance company); Director and Member of the Audit Committee, Ferroglobe PLC (metallurgical company) | ||||
David C. Arch — 1945 Trustee | 2010 | Chairman of Blistex Inc. (consumer health care products manufacturer); Member, World Presidents’ Organization | 144 | Board member of the Illinois Manufacturers’ Association | ||||
James T. Bunch — 1942 Trustee | 2000 | Managing Member, Grumman Hill Group LLC (family office/private equity investments)
Formerly: Chairman of the Board, Denver Film Society; Chairman of the Board of Trustees, Evans Scholarship Foundation; Chairman, Board of Governors, Western Golf Association | 144 | Trustee, Evans Scholarship Foundation | ||||
Jack M. Fields — 1952 Trustee | 2003 | Chief Executive Officer, Twenty First Century Group, Inc. (government affairs company); and Discovery Learning Alliance (non-profit)
Formerly: Owner and Chief Executive Officer, Dos Angeles Ranch L.P. (cattle, hunting, corporate entertainment); Director, Insperity, Inc. (formerly known as Administaff); Chief Executive Officer, Texana Timber LP (sustainable forestry company); Director of Cross Timbers Quail Research Ranch (non-profit); and member of the U.S. House of Representatives | 144 | None | ||||
Cynthia Hostetler — 1962 Trustee | 2017 | Non-Executive Director and Trustee of a number of public and private business corporations
Formerly: Head of Investment Funds and Private Equity, Overseas Private Investment Corporation; President, First Manhattan Bancorporation, Inc.; Attorney, Simpson Thacher & Bartlett LLP | 144 | Vulcan Materials Company (construction materials company); Trilinc Global Impact Fund; Aberdeen Investment Funds (4 portfolios); Artio Global Investment LLC (mutual fund complex); Edgen Group, Inc. (specialized energy and infrastructure products distributor) | ||||
Eli Jones — 1961 Trustee | 2016 | Professor and Dean, Mays Business School — Texas A&M University
Formerly: Professor and Dean, Walton College of Business, University of Arkansas and E.J. Ourso College of Business, Louisiana State University; Director, Arvest Bank | 144 | Insperity, Inc. (formerly known as Administaff) (human resources provider) | ||||
Prema Mathai-Davis — 1950 Trustee | 2003 | Retired.
Formerly: Chief Executive Officer, YWCA of the U.S.A. | 144 | None | ||||
Teresa M. Ressel — 1962 Trustee | 2017 | Non-executive director and trustee of a number of public and private business corporations
Formerly: Chief Financial Officer, Olayan America, The Olayan Group (international investor/commercial/industrial); Chief Executive Officer, UBS Securities LLC; Group Chief Operating Officer, Americas, UBS AG; Assistant Secretary for Management & Budget and CFO, US Department of the Treasury; Chief Compliance Officer, Kaiser Permanente; Program Manager, Hewlett-Packard; Nuclear Engineering, General Dynamics Corporation | 144 | Atlantic Power Corporation (power generation company); ON Semiconductor Corp. (semiconductor supplier) | ||||
Larry Soll — 1942 Trustee | 1997 | Retired.
Formerly: Chairman, Chief Executive Officer and President, Synergen Corp. (a biotechnology company) | 144 | None | ||||
Ann Barnett Stern — 1957 Trustee | 2017 | President and Chief Executive Officer, Houston Endowment Inc. (private philanthropic institution)
Formerly: Executive Vice President and General Counsel, Texas Children’s Hospital; Attorney, Beck, Redden and Secrest, LLP; Business Law Instructor, University of St. Thomas; Attorney, Andrews & Kurth LLP | 144 | Federal Reserve Bank of Dallas | ||||
Raymond Stickel, Jr. — 1944 Trustee | 2005 | Retired.
Formerly: Director, Mainstay VP Series Funds, Inc. (25 portfolios); Partner, Deloitte & Touche | 144 | None | ||||
Robert C. Troccoli — 1949 Trustee | 2016 | Adjunct Professor, University of Denver — Daniels College of Business
Formerly: Senior Partner, KPMG LLP | 144 | None | ||||
Christopher L. Wilson — 1957 Trustee | 2017 | Managing Partner, CT2, LLC (investing and consulting firm)
Formerly: President/Chief Executive Officer, Columbia Funds, Bank of America Corporation; President/Chief Executive Officer, CDC IXIS Asset Management Services, Inc.; Principal & Director of Operations, Scudder Funds, Scudder, Stevens & Clark, Inc.; Assistant Vice President, Fidelity Investments | 144 | TD Asset Management USA Inc. (mutual fund complex) (22 portfolios); ISO New England, Inc. (non-profit organization managing regional electricity market) |
T-2 Invesco S&P 500 Index Fund
Trustees and Officers—(continued)
| Name, Year of Birth and Position(s) Held with the Trust | Trustee and/ or Officer Since | Principal Occupation(s) During Past 5 Years | Number of Complex Overseen by Trustee | Other Directorship(s) Held by Trustee During | ||||
| Other Officers | ||||||||
Sheri Morris — 1964 President, Principal Executive Officer and Treasurer | 2003 | President, Principal Executive Officer and Treasurer, The Invesco Funds; Vice President, Invesco Advisers, Inc. (formerly known as Invesco Institutional (N.A.), Inc.) (registered investment adviser); and Vice President, PowerShares Exchange-Traded Fund Trust, PowerShares Exchange-Traded Fund Trust II, PowerShares India Exchange-Traded Fund Trust, PowerShares Actively Managed Exchange-Traded Fund Trust and PowerShares Actively Managed Exchange-Traded Commodity Fund Trust
Formerly: Vice President and Principal Financial Officer, The Invesco Funds; Vice President, Invesco Aim Advisers, Inc., Invesco Aim Capital Management, Inc. and Invesco Aim Private Asset Management, Inc.; Assistant Vice President and Assistant Treasurer, The Invesco Funds and Assistant Vice President, Invesco Advisers, Inc., Invesco Aim Capital Management, Inc. and Invesco Aim Private Asset Management, Inc.; and Treasurer, PowerShares Exchange-Traded Fund Trust, PowerShares Exchange-Traded Fund Trust II, PowerShares India Exchange-Traded Fund Trust and PowerShares Actively Managed Exchange-Traded Fund Trust | N/A | N/A | ||||
Russell C. Burk — 1958 Senior Vice President and Senior Officer | 2005 | Senior Vice President and Senior Officer, The Invesco Funds | N/A | N/A | ||||
John M. Zerr — 1962 Senior Vice President, Chief Legal Officer and Secretary | 2006 | Director, Senior Vice President, Secretary and General Counsel, Invesco Management Group, Inc. (formerly known as Invesco AIM Management Group, Inc.); Senior Vice President, Invesco Advisers, Inc. (formerly known as Invesco Institutional (N.A.), Inc.) (registered investment adviser); Senior Vice President and Secretary, Invesco Distributors, Inc. (formerly known as Invesco AIM Distributors, Inc.); Director, Vice President and Secretary, Invesco Investment Services, Inc. (formerly known as Invesco AIM Investment Services, Inc.) Senior Vice President, Chief Legal Officer and Secretary, The Invesco Funds; Managing Director, Invesco PowerShares Capital Management LLC; Director, Secretary and General Counsel, Invesco Investment Advisers LLC (formerly known as Van Kampen Asset Management); Secretary and General Counsel, Invesco Capital Markets, Inc. (formerly known as Van Kampen Funds Inc.) and Chief Legal Officer, PowerShares Exchange-Traded Fund Trust, PowerShares Exchange-Traded Fund Trust II, PowerShares India Exchange-Traded Fund Trust, PowerShares Actively Managed Exchange-Traded Fund Trust and PowerShares Actively Managed Exchange-Traded Commodity Fund Trust; Manager and Secretary, Invesco Indexing LLC
Formerly: Director, Secretary, General Counsel and Senior Vice President, Van Kampen Exchange Corp.; Director, Vice President and Secretary, IVZ Distributors, Inc. (formerly known as INVESCO Distributors, Inc.); Director and Vice President, INVESCO Funds Group, Inc.; Director and Vice President, Van Kampen Advisors Inc.; Director, Vice President, Secretary and General Counsel, Van Kampen Investor Services Inc.; Director, Invesco Distributors, Inc. (formerly known as Invesco AIM Distributors, Inc.); Director, Senior Vice President, General Counsel and Secretary, Invesco AIM Advisers, Inc. and Van Kampen Investments Inc.; Director, Vice President and Secretary, Fund Management Company; Director, Senior Vice President, Secretary, General Counsel and Vice President, Invesco AIM Capital Management, Inc.; Chief Operating Officer and General Counsel, Liberty Ridge Capital, Inc. (an investment adviser); Vice President and Secretary, PBHG Funds (an investment company) and PBHG Insurance Series Fund (an investment company); Chief Operating Officer, General Counsel and Secretary, Old Mutual Investment Partners (a broker-dealer); General Counsel and Secretary, Old Mutual Fund Services (an administrator) and Old Mutual Shareholder Services (a shareholder servicing center); Executive Vice President, General Counsel and Secretary, Old Mutual Capital, Inc. (an investment adviser); and Vice President and Secretary, Old Mutual Advisors Funds (an investment company) | N/A | N/A | ||||
Gregory G. McGreevey — 1962 Senior Vice President | 2012 | Senior Managing Director, Invesco Ltd.; Director, Chairman, President, and Chief Executive Officer, Invesco Advisers, Inc. (formerly known as Invesco Institutional (N.A.), Inc.) (registered investment adviser); Director, Invesco Mortgage Capital, Inc. and Invesco Senior Secured Management, Inc.; and Senior Vice President, The Invesco Funds
Formerly: Assistant Vice President, The Invesco Funds | N/A | N/A | ||||
Kelli Gallegos — 1970 Vice President, Principal Financial Officer and Assistant Treasurer | 2008 | Vice President, Principal Financial Officer and Assistant Treasurer, The Invesco Funds; Assistant Treasurer, Invesco PowerShares Capital Management LLC, PowerShares Exchange-Traded Fund Trust, PowerShares Exchange-Traded Fund Trust II, PowerShares India Exchange-Traded Fund Trust, PowerShares Actively Managed Exchange-Traded Fund Trust and PowerShares Actively Managed Exchange-Traded Commodity Fund Trust
Formerly: Assistant Vice President, The Invesco Funds | N/A | N/A |
T-3 Invesco S&P 500 Index Fund
Trustees and Officers—(continued)
| Name, Year of Birth and Position(s) Held with the Trust | Trustee and/ or Officer Since | Principal Occupation(s) During Past 5 Years | Number of Complex Overseen by Trustee | Other Directorship(s) Held by Trustee During | ||||
| Other Officers—(continued) | ||||||||
Tracy Sullivan — 1962 Vice President, Chief Tax Officer and Assistant Treasurer | 2008 | Vice President, Chief Tax Officer and Assistant Treasurer, The Invesco Funds; Assistant Treasurer, Invesco PowerShares Capital Management LLC, PowerShares Exchange-Traded Fund Trust, PowerShares Exchange-Traded Fund Trust II, PowerShares India Exchange-Traded Fund Trust, PowerShares Actively Managed Exchange-Traded Fund Trust and PowerShares Actively Managed Exchange-Traded Commodity Fund Trust
Formerly: Assistant Vice President, The Invesco Funds | N/A | N/A | ||||
Crissie M. Wisdom — 1969 Anti-Money Laundering Compliance Officer | 2013 | Anti-Money Laundering Compliance Officer, Invesco Advisers, Inc. (formerly known as Invesco Institutional (N.A.), Inc.) (registered investment adviser), Invesco Capital Markets, Inc. (formerly known as Van Kampen Funds Inc.), Invesco Distributors, Inc., Invesco Investment Services, Inc., Invesco Management Group, Inc., The Invesco Funds, and PowerShares Exchange-Traded Fund Trust, PowerShares Exchange-Traded Fund Trust II, PowerShares India Exchange-Traded Fund Trust, PowerShares Actively Managed Exchange-Traded Fund Trust and PowerShares Actively Managed Exchange-Traded Commodity Fund Trust; Anti-Money Laundering Compliance Officer and Bank Secrecy Act Officer, INVESCO National Trust Company and Invesco Trust Company; and Fraud Prevention Manager and Controls and Risk Analysis Manager for Invesco Investment Services, Inc.
Formerly: Anti-Money Laundering Compliance Officer, Van Kampen Exchange Corp. | N/A | N/A | ||||
Robert R. Leveille — 1969 Chief Compliance Officer | 2016 | Chief Compliance Officer, Invesco Advisers, Inc. (registered investment adviser); and Chief Compliance Officer, The Invesco Funds
Formerly: Chief Compliance Officer, Putnam Investments and the Putnam Funds | N/A | N/A |
The Statement of Additional Information of the Trust includes additional information about the Fund’s Trustees and is available upon request, without charge, by calling 1.800.959.4246. Please refer to the Fund’s Statement of Additional Information for information on the Fund’s sub-advisers.
Office of the Fund 11 Greenway Plaza, Suite 1000 Houston, TX 77046-1173 | Investment Adviser Invesco Advisers, Inc. 1555 Peachtree Street, N.E. Atlanta, GA 30309 | Distributor Invesco Distributors, Inc. 11 Greenway Plaza, Suite 1000 Houston, TX 77046-1173 | Auditors PricewaterhouseCoopers LLP 1000 Louisiana Street, Suite 5800 Houston, TX 77002-5678 | |||
Counsel to the Fund Stradley Ronon Stevens & Young, LLP 2005 Market Street, Suite 2600 Philadelphia, PA 19103-7018 | Counsel to the Independent Trustees Goodwin Procter LLP 901 New York Avenue, N.W. Washington, D.C. 20001 | Transfer Agent Invesco Investment Services, Inc. 11 Greenway Plaza, Suite 1000 Houston, TX 77046-1173 | Custodian State Street Bank and Trust Company 225 Franklin Street Boston, MA 02110-2801 | |||
T-4 Invesco S&P 500 Index Fund
Explore High-Conviction Investing with Invesco

Go paperless with eDelivery
Visit invesco.com/edelivery to enjoy the convenience and security of anytime electronic access to your investment documents.
With eDelivery, you can elect to have any or all of the following materials delivered straight to your inbox to download, save and print from your own computer:
∎ Fund reports and prospectuses
∎ Quarterly statements
∎ Daily confirmations
∎ Tax forms
Invesco mailing information
Send general correspondence to Invesco Investment Services, Inc., P.O. Box 219078, Kansas City, MO 64121-9078.
Important notice regarding delivery of security holder documents
To reduce Fund expenses, only one copy of most shareholder documents may be mailed to shareholders with multiple accounts at the same address (Householding). Mailing of your shareholder documents may be householded indefinitely unless you instruct us otherwise. If you do not want the mailing of these documents to be combined with those for other members of your household, please contact Invesco Investment Services, Inc. at 800 959 4246 or contact your financial institution. We will begin sending you individual copies for each account within 30 days after receiving your request.
Fund holdings and proxy voting information
The Fund provides a complete list of its holdings four times in each fiscal year, at the quarter ends. For the second and fourth quarters, the lists appear in the Fund’s semiannual and annual reports to shareholders. For the first and third quarters, the Fund files the lists with the Securities and Exchange Commission (SEC) on Form N-Q. The most recent list of portfolio holdings is available at invesco.com/completeqtrholdings. Shareholders can also look up the Fund’s Forms N-Q on the SEC website at sec.gov. Copies of the Fund’s Forms N-Q may be reviewed and copied at the SEC Public Reference Room in Washington, D.C. You can obtain information on the operation of the Public Reference Room, including information about duplicating fee charges, by calling 202 551 8090 or 800 732 0330, or by electronic request at the following email address: publicinfo@sec.gov.
The SEC file numbers for the Fund are shown below.
A description of the policies and procedures that the Fund uses to determine how to vote proxies relating to portfolio securities is available without charge, upon request, from our Client Services department at 800 959 4246 or at invesco.com/proxyguidelines. The information is also available on the SEC website, sec.gov.
Information regarding how the Fund voted proxies related to its portfolio securities during the most recent 12-month period ended June 30 is available at invesco.com/proxysearch. The information is also available on the SEC website, sec.gov. |  | |
Invesco Advisers, Inc. is an investment adviser; it provides investment advisory services to individual and institutional clients and does not sell securities. Invesco Distributors, Inc. is the US distributor for Invesco Ltd.’s retail mutual funds, exchange-traded funds and institutional money market funds. Both are wholly owned, indirect subsidiaries of Invesco Ltd. |
SEC file numbers: 811-09913 and 333-36074 | Invesco Distributors, Inc. | MS-SPI-AR-1 | 10172017 | 1050 |
| ||||||||||
 | Annual Report to Shareholders
| August 31, 2017 | ||||||||
| ||||||||||
Invesco Short Duration High Yield Municipal Fund
Nasdaq: A: ISHAX ∎ C: ISHCX ∎ Y: ISHYX ∎ R5: ISHFX ∎ R6: ISHSX |
| |||||||||

Letters to Shareholders
Philip Taylor | Dear Shareholders: This annual report includes information about your Fund, including performance data and a complete list of its investments as of the close of the reporting period. Inside is a discussion of how your Fund was managed and the factors that affected its performance during the reporting period. The reporting period began with stock market volatility in the US and abroad, largely the result of uncertainty about global economic growth and monetary policy. While economic data in the US were generally positive, news overseas was less upbeat. The European Central Bank and central banks in China and Japan – as well as other countries – maintained extraordinarily accommodative monetary policies in response to economic weakness. Citing generally positive economic data – specifically, realized and expected labor market conditions |

and inflation – the US Federal Reserve raised interest rates three times during the reporting period: in December 2016, and in March and June 2017. The major US stock market rally that began in November 2016 continued through the end of the reporting period, with major stock market indexes repeatedly hitting new record highs.
Short-term market volatility can prompt some investors to abandon their investment plans – and can cause others to settle for whatever returns the market has to offer. The investment professionals at Invesco, in contrast, invest with high conviction. This means that, no matter the asset class or the strategy, each investment team has a passion to exceed. We want to help investors achieve better outcomes, such as seeking higher returns, helping mitigate risk and generating income. Of course, investing with high conviction can’t guarantee a profit or ensure success; no investment strategy can. To learn more about how we invest with high conviction, visit invesco.com/HighConviction.
You, too, can invest with high conviction by maintaining a long-term investment perspective and by working with your financial adviser on a regular basis. During periods of short-term market volatility or uncertainty, your financial adviser can keep you focused on your long-term investment goals – a new home, a child’s college education or a secure retirement. He or she also can share research about the economy, the markets and individual investment options.
Visit our website for more information on your investments
Our website, invesco.com/us, offers a wide range of market insights and investment perspectives. On the website, you’ll find detailed information about our funds, including performance, holdings and portfolio manager commentaries. You can access information about your account by completing a simple, secure online registration. To do so, select “Log In” on the right side of the homepage, and then select “Register for Individual Account Access.”
In addition to the resources accessible on our website and through our mobile app, you can obtain timely updates to help you stay informed about the markets and the economy by connecting with Invesco on Twitter, LinkedIn or Facebook. You can access our blog at blog.invesco.us.com. Our goal is to provide you the information you want, when and where you want it.
Finally, I’m pleased to share with you Invesco’s commitment to both the Principles for Responsible Investment and to considering environmental, social and governance issues in our robust investment process. I invite you to learn more at invesco.com/esg.
Have questions?
For questions about your account, contact an Invesco client services representative at 800 959 4246. For Invesco-related questions or comments, please email me directly at phil@invesco.com.
All of us at Invesco look forward to serving your investment management needs. Thank you for investing with us.
Sincerely,

Philip Taylor
Senior Managing Director, Invesco Ltd.
| 2 Invesco Short Duration High Yield Municipal Fund |
Bruce Crockett | Dear Fellow Shareholders: Among the many important lessons I’ve learned in more than 40 years in a variety of business endeavors is the value of a trusted advocate. As independent chair of the Invesco Funds Board, I can assure you that the members of the Board are strong advocates for the interests of investors in Invesco’s mutual funds. We work hard to represent your interests through oversight of the quality of the investment management services your funds receive and other matters important to your investment, including but not limited to: ∎ Ensuring that Invesco offers a diverse lineup of mutual funds that your financial adviser can use to strive to meet your financial needs as your investment goals change over time. ∎ Monitoring how the portfolio management teams of the Invesco funds are performing in light of changing economic and market conditions. |

∎ Assessing each portfolio management team’s investment performance within the context of the investment strategy described in the fund’s prospectus.
∎ Monitoring for potential conflicts of interests that may impact the nature of the services that your funds receive.
We believe one of the most important services we provide our fund shareholders is the annual review of the funds’ advisory and sub-advisory contracts with Invesco Advisers and its affiliates. This review is required by the Investment Company Act of 1940 and focuses on the nature and quality of the services Invesco provides as the adviser to the Invesco funds and the reasonableness of the fees that it charges for those services. Each year, we spend months carefully reviewing information received from Invesco and a variety of independent sources, such as performance and fee data prepared by Lipper, Inc. (a subsidiary of Broadridge Financial Solutions, Inc.), an independent, third-party firm widely recognized as a leader in its field. We also meet with our independent legal counsel and other independent advisers to review and help us assess the information that we have received. Our goal is to assure that you receive quality investment management services for a reasonable fee.
I trust the measures outlined above provide assurance that you have a worthy advocate when it comes to choosing the Invesco Funds.
As always, please contact me at bruce@brucecrockett.com with any questions or concerns you may have. On behalf of the Board, we look forward to continuing to represent your interests and serving your needs.
Sincerely,

Bruce L. Crockett
Independent Chair
Invesco Funds Board of Trustees
| 3 Invesco Short Duration High Yield Municipal Fund |
Management’s Discussion of Fund Performance
Performance summary | |||||
For the fiscal year ended August 31, 2017, Class A shares of Invesco Short Duration High Yield Municipal Fund (the Fund), at net asset value (NAV), outperformed the Custom Invesco Short Duration High Yield Municipal Index, the Fund’s style-specific benchmark. |
| ||||
Your Fund’s long-term performance appears later in this report.
|
| ||||
Fund vs. Indexes |
| ||||
Total returns, 8/31/16 to 8/31/17, at net asset value (NAV). Performance shown does not include applicable contingent deferred sales charges (CDSC) or front-end sales charges, which would have reduced performance. | |||||
Class A Shares | 2.08% | ||||
Class C Shares | 1.32 | ||||
Class Y Shares | 2.24 | ||||
Class R5 Shares | 2.34 | ||||
Class R6 Shares* | 2.21 | ||||
S&P Municipal Bond High Yield Index▼ (Broad Market Index) | 1.92 | ||||
Custom Invesco Short Duration High Yield Municipal Index⬛ (Style-Specific Index) | 1.56 | ||||
Lipper High Yield Municipal Debt Funds Index◆ (Peer Group Index) | 1.02 | ||||
Source(s): ▼FactSet Research Systems Inc.; ⬛Invesco, FactSet Research Systems Inc.; ◆Lipper Inc. |
| ||||
*Class R6 shares incepted on April 4, 2017. See page 7 for more information. | |||||
Market conditions and your Fund
For the reporting period, high yield municipal bonds and short duration high yield municipal bonds managed to produce positive returns despite the sell-off following the presidential election in November 2016. Positive investor sentiment regarding the future of the economy resulted in a risk on trade that led to a Treasury market sell-off, with municipals following closely behind. During the majority of the fiscal year, the municipal market benefited from a number of favorable technical factors, including a flattening yield curve, strong demand and an overall lower-than-expected supply of municipal securities.
Beginning in August 2016, issuance rose significantly; indeed, October issuance was the largest in municipal history, totaling $53.4 billion.1 A great deal of this issuance was a result of issuers anticipating potential year-end volatility
related the the US presidential election and the December US Federal Reserve (the Fed) meeting. In September, the market posted its first negative monthly performance since June 2015.2 Overall, demand for municipals remained solid in the third quarter of 2016 and flows into the asset class were strong across all sectors of the municipal market. The close of the third quarter marked the 52nd consecutive week of positive flows into municipal bond mutual funds.3
Following the victory of President Trump, market sentiment shifted to the potential impact that comprehensive tax reform might have on municipal demand, contributing to the Treasury sell-off. As a result, municipals retraced most of 2016’s positive performance. However, in the first two months of 2017, municipals regained much of the ground they lost in the post-election sell-off, and fund flows turned positive once again.
Over the fiscal year, the Fed raised interest rates by a quarter point three times, initially in December 2016, and then again in March and June of 2017.4 Because the hikes were widely anticipated, the market reaction to these announcements was muted.
Dominating municipal headlines were the budget impasse in Illinois, Chicago’s unfunded pension liabilities and Puerto Rico’s downward fiscal spiral. While worrisome, these concerns were not enough to outweigh the positive impact of US economic performance during the reporting period, and in July, after over two years Illinois passed a budget which was supportive to performance.
At the close of the reporting period, we believed the municipal bond market remained strong. Defaults and downgrades were muted, but it will take time to decipher the priorities and policies of the new administration, some of which may likely affect the municipal market.
During the reporting period, an underweight exposure to and security selection in mid-coupon bonds (4.5% to 5.5%) contributed to the Fund’s performance relative to its style-specific benchmark. The Fund benefited from an approximately 50% stake in non-rated holdings. At the sector level, the Fund’s security selection in the health care sector, particularly within life care and hospital bonds, contributed to the Fund’s relative performance. Additionally, the Fund had very little exposure to Puerto Rico which significantly added to the Fund’s relative performance, as Puerto Rico defaulted on its debt over the reporting period. At the state level, holdings in Pennsylvania were contributors to the Fund’s performance relative to its style-specific benchmark. Overweight exposure to and security selection in bonds with coupons between 4.00 and 4.49% detracted from
Portfolio Composition | |||||
By credit sector, based on total investments |
| ||||
Revenue Bonds | 92.3% | ||||
General Obligations Bonds | 7.6 | ||||
Pre-refunded Bonds | 0.1 | ||||
Top Five Debt Holdings | ||||||||
| % of total net assets | ||||||||
1. | Salt Lake City (City of); | |||||||
| Series 2017 A | 2.5% | |||||||
2. | Kalispell (City of) (Immanuel | |||||||
| Lutheran Corp.); Series 2017 | 1.8 | |||||||
3. | Gallia (County of) (Holzer Health System Obligated Group); Series 2012 | 1.6 | ||||||
4. | Public Finance Authority | |||||||
| (American Dream at | ||||||||
| Meadowlands); Series 2017 | 1.5 | |||||||
5. | Illinois (State of) Metropolitan | |||||||
| Pier & Exposition Authority | ||||||||
| (McCormick PL); Series 2002 A | 1.4 | |||||||
Total Net Assets | $ | 143.0 million | |||
Total Number of Holdings | 188 | ||||
The Fund’s holdings are subject to change, and there is no assurance that the Fund will continue to hold any particular security.
Data presented here are as of August 31, 2017.
| 4 Invesco Short Duration High Yield Municipal Fund |
relative performance over the reporting period. Security selection in the tobacco settlement sector was also a detractor from relative results.
During the reporting period, leverage contributed to Fund performance relative to its style-specific benchmark. The Fund achieved a leveraged position through the use of inverse floating rate securities or tender option bonds (TOBs). The Fund uses leverage because we believe that, over time, leveraging provides opportunities for additional income and total return for shareholders. However, the use of leverage also can expose shareholders to additional volatility.
We wish to remind you that the Fund is subject to interest rate risk, meaning when interest rates rise, the value of fixed income securities tends to fall. This risk may be greater in the current market environment because interest rates are at or near historic lows. The degree to which the value of fixed income securities may decline due to rising interest rates may vary depending on the speed and magnitude of the increase in interest rates, as well as individual security characteristics such as price, maturity, duration and coupon and market forces such as supply and demand for similar securities. We are monitoring interest rates, and the market, economic and geopolitical factors that may impact the direction, speed and magnitude of changes to interest rates across the maturity spectrum, including the potential impact of monetary policy changes by the Fed and certain foreign central banks. If interest rates rise, markets may experience increased volatility, which may affect the value and/ or liquidity of certain of the Fund’s investments.
Thank you for investing in Invesco Short Duration High Yield Municipal Fund and for sharing our long-term investment horizon.
1 Source: The Bond Buyer
2 Source: Standard & Poor’s
3 Source: Barclays
4 Source: US Federal Reserve
The views and opinions expressed in management’s discussion of Fund performance are those of Invesco Advisers, Inc. These views and opinions are subject to change at any time based on factors such as market and economic conditions. These views and opinions may not be relied upon as investment advice or recommendations, or as an offer for a particular security. The information is not a complete analysis of every aspect of any market, country, industry, security or the Fund. Statements of fact are from sources considered reliable, but Invesco Advisers, Inc. makes no representation or warranty as to their completeness or accuracy. Although historical performance is no guarantee of future results, these insights may help you understand our investment management philosophy.
See important Fund and, if applicable, index disclosures later in this report.
 | Mark Paris Portfolio Manager and Head of Portfolio Management and Trading for Invesco’s Municipal Bond Team, is | |
| manager of Invesco Short Duration High Yield Municipal Fund. He joined Invesco in 2010. Mr. Paris earned a BBA in finance from Baruch College – The City University of New York. | ||
| Jack Connelly | |
| Portfolio Manager, is manager of Invesco Short Duration High Yield Municipal Fund. He joined Invesco in 2016. Mr. Connelly | ||
| earned a BA in philosophy from Wheaton College and masters degrees from the University of Rhode Island and Yale University. | ||
| Tim O’Reilly Portfolio Manager, is manager of Invesco Short Duration High Yield Municipal Fund. He joined Invesco in 2010. Mr. O’Reilly | |
| earned a BS in finance from Eastern Illinois University and an MBA in finance from the University of Illinois at Chicago. | ||
| James Phillips Portfolio Manager, is manager of Invesco Short Duration High Yield Municipal Fund. He joined Invesco in | |
| 2010. Mr. Phillips earned a BA in American literature from Empire State College, the independent study division of the State University of New York, and an MBA in finance from the University at Albany, State University of New York. | ||


 | Robert Stryker | |
| Chartered Financial Analyst, Portfolio Manager, is manager of Invesco Short Duration High Yield | ||
| Municipal Fund. He joined Invesco in 2010. Mr. Stryker earned a BS in finance from the University of Illinois, Chicago. | ||
| Julius Williams | |
| Portfolio Manager, is manager of Invesco Short Duration High Yield Municipal Fund. He joined Invesco in 2010. Mr. Williams | ||
| earned a BA in economics and sociology and a Master of Education degree in educational psychology from the University of Virginia. | ||

| 5 Invesco Short Duration High Yield Municipal Fund |
Your Fund’s Long-Term Performance
Results of a $10,000 Investment – Oldest Share Class(es) since Inception
Fund and index data from 9/30/15
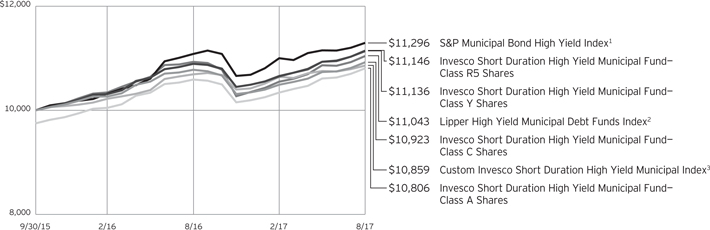
1 Source: FactSet Research Systems Inc.
2 Source: Lipper Inc.
3 Sources: Invesco, FactSet Research Systems Inc.
Past performance cannot guarantee comparable future results.
The data shown in the chart include reinvested distributions, applicable sales charges and Fund expenses including
management fees. Index results include reinvested dividends, but they do not reflect sales charges. Performance of the peer group, if applicable, reflects fund expenses and management fees; performance
of a market index does not. Performance shown in the chart and table(s) does not reflect deduction of taxes a shareholder would pay on Fund distributions or sale of Fund shares.
continued from page 9
| ∎ | A direct investment cannot be made in an index. Unless otherwise indicated, index results include reinvested dividends, and they do not reflect sales charges. Performance of the peer group, if applicable, reflects fund expenses; performance of a market index does not. |
Other information
| ∎ | The returns shown in management’s discussion of Fund performance are based on net asset values (NAVs) calculated for shareholder transactions. Generally accepted accounting principles require adjustments to be made to the net assets of the Fund at period end for financial reporting purposes, and as such, the NAVs for shareholder transactions and the returns based on those NAVs may differ from the NAVs and returns reported in the Financial Highlights. |
| 6 Invesco Short Duration High Yield Municipal Fund |
| Average Annual Total Returns | |||||
As of 8/31/17, including maximum applicable sales charges
|
| ||||
Class A Shares | |||||
Inception (9/30/15) | 4.12 | % | |||
1 Year | -0.45 | ||||
Class C Shares | |||||
Inception (9/30/15) | 4.70 | % | |||
1 Year | 0.33 | ||||
Class Y Shares | |||||
Inception (9/30/15) | 5.76 | % | |||
1 Year | 2.24 | ||||
Class R5 Shares | |||||
Inception (9/30/15) | 5.81 | % | |||
1 Year | 2.34 | ||||
Class R6 Shares | |||||
Inception | 5.59 | % | |||
1 Year | 2.21 | ||||
Class R6 shares incepted on April 4, 2017. Performance shown prior to that date is that of Class A shares and includes the 12b-1 fees applicable to Class A shares.
The performance data quoted represent past performance and cannot guarantee comparable future results; current performance may be lower or higher. Please visit invesco.com/performance for the most recent month-end performance. Performance figures reflect reinvested distributions, changes in net asset value and the effect of the maximum sales charge unless otherwise stated. Investment return and principal value will fluctuate so that you may have a gain or loss when you sell shares.
The net annual Fund operating expense ratio set forth in the most recent Fund prospectus as of the date of this report for Class A, Class C, Class Y, Class R5 and Class R6 shares was 0.79%, 1.54%, 0.54%, 0.54% and 0.54%, respectively.1 The total annual Fund operating expense ratio set forth in the most recent Fund prospectus as of the date of this report for Class A, Class C, Class Y, Class R5 and Class R6 shares was 1.47%, 2.22%, 1.22%, 1.20% and 1.19%, respectively. The expense ratios presented above may vary from the expense ratios presented in other sections of this report that are based on expenses incurred during the period covered by this report.
| Average Annual Total Returns | |||||
As of 6/30/17, the most recent calendar quarter end, including maximum applicable sales charges |
| ||||
Class A Shares | |||||
Inception (9/30/15) | 3.51 | % | |||
1 Year | -1.35 | ||||
Class C Shares | |||||
Inception (9/30/15) | 4.22 | % | |||
1 Year | -0.57 | ||||
Class Y Shares | |||||
Inception (9/30/15) | 5.28 | % | |||
1 Year | 1.43 | ||||
Class R5 Shares | |||||
Inception (9/30/15) | 5.34 | % | |||
1 Year | 1.53 | ||||
Class R6 Shares | |||||
Inception | 5.10 | % | |||
1 Year | 1.26 | ||||
Class A share performance reflects the maximum 2.50% sales charge, and Class C share performance reflects the applicable contingent deferred sales charge (CDSC) for the period involved. The CDSC on Class C shares is 1% for the first year after purchase. Class Y, Class R5 and Class R6 shares do not have a front-end sales charge or a CDSC; therefore, performance is at net asset value.
The performance of the Fund’s share classes will differ primarily due to different sales charge structures and class expenses.
Fund performance reflects any applicable fee waivers and/or expense reimbursements. Had the adviser not waived fees and/or reimbursed expenses currently or in the past, returns would have been lower. See current prospectus for more information.
| 1 | Total annual Fund operating expenses after any contractual fee waivers and/or expense reimbursements by the adviser in effect through at least April 30, 2018. See current prospectus for more information. |
| 7 Invesco Short Duration High Yield Municipal Fund |
Invesco Short Duration High Yield Municipal Fund’s investment objective is to seek federal tax-exempt current income and taxable capital appreciation.
| ∎ | Unless otherwise stated, information presented in this report is as of August 31, 2017, and is based on total net assets. |
| ∎ | Unless otherwise noted, all data provided by Invesco. |
| ∎ | To access your Fund’s reports/prospectus, visit invesco.com/fundreports. |
About share classes
| ∎ | Class Y shares are available only to certain investors. Please see the prospectus for more information. |
| ∎ | Class R5 shares and Class R6 shares are available for use by retirement plans that meet certain standards and for institutional investors. Class R6 shares are also available through intermediaries that have established an agreement with Invesco Distributors, Inc. to make such shares available for use in retail omnibus accounts. Please see the prospectus for more information. |
Principal risks of investing in the Fund
| ∎ | Alternative minimum tax risk. All or a portion of the Fund’s otherwise tax-exempt income may be taxable to those shareholders subject to the federal alternative minimum tax. |
| ∎ | Changing fixed income market conditions risk. The current low interest rate environment was created in part by the Federal Reserve Board (FRB) and certain foreign central banks keeping the federal funds and equivalent foreign rates near, at or below zero. Increases in the federal funds and equivalent foreign rates may expose fixed income markets to heightened volatility and reduced liquidity for certain fixed income investments, particularly those with longer maturities. In addition, decreases in fixed income dealer market-making capacity may also potentially lead to heightened volatility and reduced liquidity in the fixed income markets. As a result, the value of the Fund’s investments and share price may decline. Changes in central bank policies could also result in higher than normal shareholder redemptions, which could potentially increase portfolio turnover and the Fund’s transaction costs. |
| ∎ | Debt securities risk. The prices of debt securities held by the Fund will be affected by changes in interest rates, the creditworthiness of the issuer and |
other factors. An increase in prevailing interest rates typically causes the value of existing debt securities to fall and often has a greater impact on longer-duration debt securities and higher quality debt securities. Falling interest rates will cause the Fund to reinvest the proceeds of debt securities that have been repaid by the issuer at lower interest rates. Falling interest rates may also reduce the Fund’s distributable income because interest payments on floating rate debt instruments held by the Fund will decline. The Fund could lose money on investments in debt securities if the issuer or borrower fails to meet its obligations to make interest payments and/or to repay principal in a timely manner. Changes in an issuer’s financial strength, the market’s perception of such strength or in the credit rating of the issuer or the security may affect the value of debt securities. The Adviser’s credit analysis may fail to anticipate such changes, which could result in buying a debt security at an inopportune time or failing to sell a debt security in advance of a price decline or other credit event. |
| ∎ | Derivatives risk. The value of a derivative instrument depends largely on (and is derived from) the value of an underlying security, currency, commodity, interest rate, index or other asset (each referred to as an underlying asset). In addition to risks relating to the underlying assets, the use of derivatives may include other, possibly greater, risks, including counterparty, leverage and liquidity risks. Counterparty risk is the risk that the counterparty to the derivative contract will default on its obligation to pay the Fund the amount owed or otherwise perform under the derivative contract. Derivatives create leverage risk because they do not require payment up front equal to the economic exposure created by owning the derivative. As a result, an adverse change in the value of the underlying asset could result in the Fund |
This report must be accompanied or preceded by a currently effective Fund prospectus, which contains more complete information, including sales charges and expenses. Investors should read it carefully before investing.
NOT FDIC INSURED | MAY LOSE VALUE | NO BANK GUARANTEE
| sustaining a loss that is substantially greater than the amount invested in the derivative, which may make the Fund’s returns more volatile and increase the risk of loss. Derivative instruments may also be less liquid than more traditional investments and the Fund may be unable to sell or close out its derivative positions at a desirable time or price. This risk may be more acute under adverse market conditions, during which the Fund may be most in need of liquidating its derivative positions. Derivatives may also be harder to value, less tax efficient and subject to changing government regulation that could impact the Fund’s ability to use certain derivatives or their cost. Also, derivatives used for hedging or to gain or limit exposure to a particular market segment may not provide the expected benefits, particularly during adverse market conditions. |
| ∎ | High yield debt securities (junk bond) risk. Investments in high yield debt securities (“junk bonds”) and other lower-rated securities will subject the Fund to substantial risk of loss. These securities are considered to be speculative with respect to the issuer’s ability to pay interest and principal when due, are more susceptible to default or decline in market value and are less liquid than investment grade debt securities. Prices of high yield debt securities tend to be very volatile. |
| ∎ | Inverse floating rate obligations risk. The price of inverse floating rate obligations (inverse floaters) is expected to decline when interest rates rise ,and generally will decline further than the price of a bond with a similar maturity. The price of inverse floaters is typically more volatile than the price of bonds with similar maturities. These risks can be particularly high if leverage is used in the formula that determines the interest payable by the inverse floater, which may make the Fund’s returns more volatile and increase the risk of loss. Additionally, these securities may lose some or all of their principal and, in some cases, the Fund could lose money in excess of its investment. |
| ∎ | Liquidity risk. The Fund may be unable to sell illiquid investments at the time or price it desires and, as a result, could |
| 8 Invesco Short Duration High Yield Municipal Fund |
| lose its entire investment in such investments. Liquid securities can become illiquid during periods of market stress. If a significant amount of the Fund’s securities become illiquid, the Fund may not be able to timely pay redemption proceeds and may need to sell securities at significantly reduced prices. |
| ∎ | Management risk. The Fund is actively managed and depends heavily on the Adviser’s judgment about markets, interest rates or the attractiveness, relative values, liquidity, or potential appreciation of particular investments made for the Fund’s portfolio. The Fund could experience losses if these judgments prove to be incorrect. Additionally, legislative, regulatory, or tax developments may adversely affect management of the Fund and, therefore, the ability of the Fund to achieve its investment objective. |
| ∎ | Market risk. The market values of the Fund’s investments, and therefore the value of the Fund’s shares, will go up and down, sometimes rapidly or unpredictably. Market risk may affect a single issuer, industry or section of the economy, or it may affect the market as a whole. Individual stock prices tend to go up and down more dramatically than those of certain other types of investments, such as bonds. During a general downturn in the financial markets, multiple asset classes may decline in value. When markets perform well, there can be no assurance that specific investments held by the Fund will rise in value. |
| ∎ | Medium- and lower-grade municipal securities risk. Medium- and lower-grade municipal securities generally involve more volatility and greater risks, including credit, market, liquidity and management risks, than higher-grade securities. Furthermore, many issuers of medium- and lower-grade securities choose not to have a rating assigned to their obligations. As such, the Fund’s portfolio may consist of a higher portion of unrated securities than an investment company investing solely in higher-grade securities. Unrated securities may not be as attractive to as many buyers as are rated securities, which may have the effect of limiting the Fund’s ability to sell such securities at their fair value. |
| ∎ | Money market fund risk. Although money market funds generally seek to preserve the value of an investment at $1.00 per share, the Fund may lose money by investing in money market funds. A money market fund’s sponsor has no legal obligation to provide financial |
support to the money market fund. The credit quality of a money market fund’s holdings can change rapidly in certain markets, and the default of a single holding could have an adverse impact on the money market fund’s share price. A money market fund’s share price can also be negatively affected during periods of high redemption pressures, illiquid markets and/or significant market volatility. Furthermore, amendments to money market fund regulations could impact a money market fund’s operations and possibly negatively impact its return. |
| ∎ | Municipal issuer focus risk. The municipal issuers in which the Fund invests may be located in the same geographic area or may pay their interest obligations from revenue of similar projects, such as hospitals, airports, utility systems and housing finance agencies. This may make the Fund’s investments more susceptible to similar social, economic, political or regulatory occurrences, making the Fund more susceptible to experience a drop in its share price than if the Fund had been more diversified across issuers that did not have similar characteristics. |
| ∎ | Municipal securities risk. The risk of a municipal obligation generally depends on the financial and credit status of the issuer. Constitutional amendments, legislative enactments, executive orders, administrative regulations, voter initiatives, and the issuer’s regional economic conditions may affect the municipal security’s value, interest payments, repayment of principal and the Fund’s ability to sell the security. Failure of a municipal security issuer to comply with applicable tax requirements may make income paid thereon taxable, resulting in a decline in the security’s value. In addition, there could be changes in applicable tax laws or tax treatments that reduce or eliminate the current federal income tax exemption on municipal securities or otherwise adversely affect the current federal or state tax status of municipal securities. |
| ∎ | Non-diversification risk. The Fund is non-diversified and can invest a greater portion of its assets in the obligations or securities of a small number of issuers or any single issuer than a diversified fund can. A change in the value of one or a few issuers’ securities will therefore affect the value of the Fund more than if it was a diversified fund. |
| ∎ | Variable-rate demand notes risk. The absence of an active secondary market for certain variable and floating rate |
notes could make it difficult to dispose of these instruments, which could result in a loss. |
| ∎ | When-issued, delayed delivery and forward commitment risks. When-issued and delayed delivery transactions subject the Fund to market risk because the value or yield of a security at delivery may be more or less than the purchase price or yield generally available when delivery occurs, and counterparty risk because the Fund relies on the buyer or seller, as the case may be, to consummate the transaction. These transactions also have a leveraging effect on the Fund because the Fund commits to purchase securities that it does not have to pay for until a later date, which increases the Fund’s overall investment exposure and, as a result, its volatility. |
| ∎ | Zero coupon or pay-in-kind securities risk. The value, interest rates, and liquidity of non-cash paying instruments, such as zero coupon and pay-in-kind securities, are subject to greater fluctuation than other types of securities. The higher yields and interest rates on pay-in-kind securities reflect the payment deferral and increased credit risk associated with such instruments and that such investments may represent a higher credit risk than loans that periodically pay interest. |
About indexes used in this report
| ∎ | The S&P Municipal Bond High Yield Index is an unmanaged index considered representative of municipal bonds that are not rated or are rated below investment grade. |
| ∎ | The Custom Invesco Short Duration High Yield Municipal Index consists of 60% S&P Municipal Bond High Yield Index and 40% S&P Municipal Bond Short Index. |
| ∎ | The Lipper High Yield Municipal Debt Funds Index is an unmanaged index considered representative of high-yield municipal debt funds tracked by Lipper. |
| ∎ | The S&P Municipal Bond Short Index consists of bonds in the S&P Municipal Bond Index with a minimum maturity of six months and a maximum maturity of four years. |
| ∎ | The Fund is not managed to track the performance of any particular index, including the index(es) described here, and consequently, the performance of the Fund may deviate significantly from the performance of the index(es). |
continued on page 6
9 Invesco Short Duration High Yield Municipal Fund |
Schedule of Investments
August 31, 2017
| Interest Rate | Maturity Date | Principal Amount (000) | Value | |||||||||||||
Municipal Obligations–103.87% |
| |||||||||||||||
| Alabama–1.21% | ||||||||||||||||
Birmingham (City of) Special Care Facilities Financing Authority (Methodist Home for the Aging); Series 2016, RB | 5.25 | % | 06/01/2025 | $ | 1,500 | $ | 1,640,880 | |||||||||
Huntsville (City of) Special Care Facilities Financing Authority (Redstone Village); Series 2007, RB | 5.50 | % | 01/01/2028 | 95 | 93,866 | |||||||||||
| 1,734,746 | ||||||||||||||||
| Alaska–1.11% | ||||||||||||||||
Northern Tobacco Securitization Corp.; Series 2006 A, Tobacco Settlement Asset-Backed RB | 4.63 | % | 06/01/2023 | 1,545 | 1,583,470 | |||||||||||
| American Samoa–0.70% | ||||||||||||||||
American Samoa (Territory of) Economic Development Authority; Series 2015 A, Ref. General RB | 6.25 | % | 09/01/2029 | 1,000 | 1,008,130 | |||||||||||
| Arizona–2.57% | ||||||||||||||||
Arizona (State of) Industrial Development Authority (American Charter Schools Foundation); Series 2017, Ref. Education RB(a) | 5.00 | % | 07/01/2022 | 1,500 | 1,604,685 | |||||||||||
Arizona (State of) Industrial Development Authority (Basis Schools); Series 2017 A, Ref. Education RB(a) | 5.00 | % | 07/01/2026 | 500 | 550,555 | |||||||||||
Phoenix (City of) Industrial Development Authority (Basis Schools); Series 2016 A, Ref. | 5.00 | % | 07/01/2035 | 1,000 | 1,048,790 | |||||||||||
Pima (County of) Industrial Development Authority (American Leadership); Series 2015, Ref. | 4.60 | % | 06/15/2025 | 460 | 468,538 | |||||||||||
| 3,672,568 | ||||||||||||||||
| California–3.86% | ||||||||||||||||
Bay Area Toll Authority (San Francisco Bay Area); Series 2017 D, Ref. Floating Rate Toll Bridge RB (3 mo. USD LIBOR + 0.55%)(a)(b)(c) | 1.46 | % | 04/01/2021 | 1,000 | 1,003,700 | |||||||||||
California (State of) Pollution Control Financing Authority (Aemerge Redpack Services LLC); Series 2016, Solid Waste Disposal RB(a)(d) | 7.00 | % | 12/01/2027 | 500 | 491,555 | |||||||||||
California (State of) Statewide Communities Development Authority (Creative Child Care & Team Charter); Series 2015, School Facilities RB (Acquired 11/03/2015; Cost $545,000)(a) | 5.00 | % | 06/01/2022 | 545 | 550,461 | |||||||||||
California (State of) Statewide Communities Development Authority (Lancer Educational Student Housing); | ||||||||||||||||
Series 2016, Ref. RB(a) | 4.00 | % | 06/01/2021 | 500 | 516,870 | |||||||||||
Series 2016, Ref. RB(a) | 4.00 | % | 06/01/2026 | 500 | 517,535 | |||||||||||
California County Tobacco Securitization Agency (The) (Los Angeles County Securitization Corp.); Series 2006, Tobacco Settlement Conv. Asset-Backed RB | 5.60 | % | 06/01/2036 | 1,000 | 1,012,100 | |||||||||||
California County Tobacco Securitization Agency (The) (Sonoma County Securitization Corp.); Series 2005, Ref. Tobacco Settlement Asset-Backed RB | 5.13 | % | 06/01/2038 | 90 | 89,890 | |||||||||||
Golden State Tobacco Securitization Corp.; Series 2007 A-1, Sr. Tobacco Settlement Asset-Backed RB | 5.00 | % | 06/01/2033 | 1,030 | 1,029,073 | |||||||||||
Inland Empire Tobacco Securitization Authority; Series 2007 A, Tobacco Settlement RB | 4.63 | % | 06/01/2021 | 310 | 309,284 | |||||||||||
| 5,520,468 | ||||||||||||||||
| Colorado–4.44% | ||||||||||||||||
Clear Creek Station Metropolitan District No. 2; Series 2017 A, Ref. Limited Tax GO Bonds | 4.38 | % | 12/01/2032 | 790 | 792,663 | |||||||||||
Colorado (State of) Health Facilities Authority (Frasier Meadows Retirement Community); | ||||||||||||||||
Series 2017 A, Ref. Hospital RB | 5.00 | % | 05/15/2025 | 525 | 579,999 | |||||||||||
Series 2017 A, Ref. Hospital RB | 5.00 | % | 05/15/2026 | 475 | 522,058 | |||||||||||
Colorado (State of) Health Facilities Authority (Sunny Vista Living Center); Series 2015 A, Ref. RB(a) | 5.00 | % | 12/01/2025 | 150 | 153,459 | |||||||||||
Copperleaf Metropolitan District No. 2; Series 2015, Ref. Unlimited Tax GO Bonds | 5.25 | % | 12/01/2030 | 500 | 531,395 | |||||||||||
Cornerstar Metropolitan District; Series 2017 A, Ref. Limited Tax GO Bonds | 3.50 | % | 12/01/2021 | 500 | 515,905 | |||||||||||
Gardens on Havana Metropolitan District No. 3 (The); Series 2017 A, Special RB | 3.63 | % | 12/01/2021 | 1,175 | 1,208,464 | |||||||||||
Solaris Metropolitan District No.3 Series 2016 A, Ref. Limited Tax GO Bonds | 5.00 | % | 12/01/2036 | 1,000 | 1,047,960 | |||||||||||
Southglenn Metropolitan District; Series 2016, Ref. Special Limited Tax GO Bonds | 3.00 | % | 12/01/2021 | 1,000 | 996,020 | |||||||||||
| 6,347,923 | ||||||||||||||||
See accompanying Notes to Financial Statements which are an integral part of the financial statements.
10 Invesco Short Duration High Yield Municipal Fund
| Interest Rate | Maturity Date | Principal Amount (000) | Value | |||||||||||||
| Connecticut–1.33% | ||||||||||||||||
Connecticut (State of) Health & Educational Facilities Authority (Church Home of Hartford Inc.); | ||||||||||||||||
Series 2016 B-1, TEMPS-80SM Healthcare Facilities RB(a) | 3.25 | % | 09/01/2021 | $ | 700 | $ | 697,403 | |||||||||
Series 2016 B-2, TEMPS-50SM Healthcare Facilities RB(a) | 2.88 | % | 09/01/2020 | 700 | 697,508 | |||||||||||
Hamden (Town of) (Whitney Center); Series 2009 A, Facility RB | 7.63 | % | 01/01/2030 | 480 | 507,811 | |||||||||||
| 1,902,722 | ||||||||||||||||
| District of Columbia–1.45% | ||||||||||||||||
District of Columbia (Ingleside at Rock Creek); | ||||||||||||||||
Series 2017 A, RB | 4.13 | % | 07/01/2027 | 1,000 | 1,019,660 | |||||||||||
Series 2017 A, RB | 5.00 | % | 07/01/2032 | 1,000 | 1,051,500 | |||||||||||
| 2,071,160 | ||||||||||||||||
| Florida–1.91% | ||||||||||||||||
Alachua (County of) (North Florida Retirement Village, Inc.); Series 2007, IDR | 5.63 | % | 11/15/2022 | 150 | 150,479 | |||||||||||
Cape Coral (City of) Health Facilities Authority (Gulf Care Inc.); Series 2015, Ref. Senior Housing RB(a) | 3.75 | % | 07/01/2019 | 495 | 497,653 | |||||||||||
Florida Development Finance Corp. (Renaissance Charter School, Inc.); Series 2012 A, Educational Facilities RB | 5.50 | % | 06/15/2022 | 1,240 | 1,344,420 | |||||||||||
Lee (County of) Industrial Development Authority (Cypress Cove Healthpark); Series 2012, Ref. RB | 4.75 | % | 10/01/2022 | 315 | 333,349 | |||||||||||
Seminole (County of) Industrial Development Authority (Legacy Pointe at UCF); Series 2016 A, RB(a) | 10.00 | % | 12/28/2021 | 400 | 400,656 | |||||||||||
| 2,726,557 | ||||||||||||||||
| Georgia–1.15% | ||||||||||||||||
Macon-Bibb (County of) Urban Development Authority (Academy for Classical Education, Inc.); Series 2017 A, RB(a) | 5.00 | % | 06/15/2027 | 500 | 525,650 | |||||||||||
Marietta (City of) Developing Authority (Life University, Inc.); Series 2017 A, Ref. University | 5.00 | % | 11/01/2023 | 1,000 | 1,115,970 | |||||||||||
| 1,641,620 | ||||||||||||||||
| Illinois–11.72% | ||||||||||||||||
Bartlett (Village of) (Quarry Redevelopment); Series 2016, Ref. Sr. Lien Tax Increment Allocation RB | 4.00 | % | 01/01/2024 | 1,250 | 1,226,563 | |||||||||||
Chicago (City of) Board of Education; | ||||||||||||||||
Series 2012 A, Unlimited Tax GO Bonds | 5.00 | % | 12/01/2042 | 400 | 390,828 | |||||||||||
Series 2013 A-2, Ref. Unlimited Tax GO Bonds | 9.00 | % | 03/01/2035 | 300 | 303,222 | |||||||||||
Series 2013 A-2, Ref. Unlimited Tax GO Bonds | 9.00 | % | 03/01/2035 | 300 | 303,222 | |||||||||||
Chicago (City of); | ||||||||||||||||
Series 2008 A, Unlimited Tax GO Bonds(e) | 5.00 | % | 01/01/2019 | 150 | 151,173 | |||||||||||
Series 2008 C, Ref. Second Lien Wastewater Transmission RB | 5.00 | % | 01/01/2020 | 200 | 216,516 | |||||||||||
Series 2009 D, Unlimited Tax GO Bonds | 5.00 | % | 01/01/2020 | 100 | 103,055 | |||||||||||
Series 2010 A, Ref. Unlimited Tax GO Bonds | 4.00 | % | 01/01/2022 | 110 | 112,732 | |||||||||||
Series 2017 A, Ref. Unlimited Tax GO Bonds | 5.63 | % | 01/01/2029 | 1,000 | 1,150,710 | |||||||||||
Series 2017 A, Ref. Unlimited Tax GO Bonds | 5.75 | % | 01/01/2034 | 1,500 | 1,697,700 | |||||||||||
Illinois (State of) Finance Authority (Intrinsic Schools — Belmont School); Series 2015, Charter | 5.25 | % | 12/01/2025 | 400 | 408,560 | |||||||||||
Illinois (State of) Finance Authority (Lutheran Home & Services); Series 2012, Ref. RB | 5.00 | % | 05/15/2022 | 400 | 426,340 | |||||||||||
Illinois (State of) Finance Authority (Montgomery Place); Series 2017, Ref. RB | 5.00 | % | 05/15/2024 | 1,115 | 1,193,585 | |||||||||||
Illinois (State of) Finance Authority (Park Place of Elmhurst); | ||||||||||||||||
Series 2016 A, RB | 6.20 | % | 05/15/2030 | 685 | 672,252 | |||||||||||
Series 2016 B, RB | 5.63 | % | 05/15/2020 | 212 | 211,047 | |||||||||||
Illinois (State of) Finance Authority (Peace Village); Series 2013, RB | 5.25 | % | 08/15/2023 | 840 | 880,513 | |||||||||||
Illinois (State of) Finance Authority (Plymouth Place); | ||||||||||||||||
Series 2015, Ref. RB | 2.75 | % | 05/15/2019 | 395 | 397,489 | |||||||||||
Series 2015, Ref. RB | 5.00 | % | 05/15/2025 | 250 | 275,750 | |||||||||||
Illinois (State of) Finance Authority (Three Crowns Park); Series 2017, Ref. RB | 4.00 | % | 02/15/2027 | 780 | 795,163 | |||||||||||
Illinois (State of) Metropolitan Pier & Exposition Authority (McCormick PL); Series 2002 A, Dedicated State CAB Tax RB (INS–NATL)(f)(g) | 0.00 | % | 12/15/2029 | 3,250 | 2,059,493 | |||||||||||
See accompanying Notes to Financial Statements which are an integral part of the financial statements.
11 Invesco Short Duration High Yield Municipal Fund
| Interest Rate | Maturity Date | Principal Amount (000) | Value | |||||||||||||
| Illinois–(continued) | ||||||||||||||||
Illinois (State of); | ||||||||||||||||
Series 2013, Unlimited Tax GO Bonds | 5.00 | % | 07/01/2019 | $ | 700 | $ | 734,363 | |||||||||
Series 2014, Unlimited Tax GO Bonds | 5.00 | % | 02/01/2021 | 1,000 | 1,076,810 | |||||||||||
Series 2014, Unlimited Tax GO Bonds | 5.00 | % | 05/01/2021 | 860 | 929,419 | |||||||||||
Series 2016, Ref. Unlimited Tax GO Bonds | 5.00 | % | 02/01/2023 | 500 | 550,400 | |||||||||||
Manhattan (Village of) Special Service Area No. 2004-1 (Brookstone Springs); Series 2015, Ref. Sr. Lien Special Tax RB | 4.25 | % | 03/01/2024 | 487 | 489,834 | |||||||||||
| 16,756,739 | ||||||||||||||||
| Indiana–1.42% | ||||||||||||||||
Allen (County of) Economic Development (StoryPoint Fort Wayne); Series 2017, RB(a) | 6.63 | % | 01/15/2034 | 500 | 529,830 | |||||||||||
Indiana Bond Bank; Series 2007 B-1, Floating Rate Special Program Gas RB (3 mo. USD LIBOR + 0.97%)(b) | 1.84 | % | 10/15/2022 | 1,500 | 1,504,965 | |||||||||||
| 2,034,795 | ||||||||||||||||
| Iowa–1.44% | ||||||||||||||||
Iowa (State of) Finance Authority (Iowa Fertilizer Co.); | ||||||||||||||||
Series 2013, Midwestern Disaster Area RB | 5.00 | % | 12/01/2019 | 1,540 | 1,573,695 | |||||||||||
Series 2013, Midwestern Disaster Area RB(a) | 5.88 | % | 12/01/2026 | 460 | 481,413 | |||||||||||
| 2,055,108 | ||||||||||||||||
| Kansas–1.20% | ||||||||||||||||
Olathe (City of) (West Village Center); Series 2007, Special Obligation Tax Increment Allocation RB | 5.30 | % | 09/01/2017 | 90 | 90,000 | |||||||||||
Wichita (City of) (Kansas Masonic Home); | ||||||||||||||||
Series 2016 II-A, Health Care Facilities RB | 4.25 | % | 12/01/2024 | 500 | 512,015 | |||||||||||
Series 2016 II-A, Health Care Facilities RB | 5.00 | % | 12/01/2031 | 550 | 578,660 | |||||||||||
Series 2016 II-A, Health Care Facilities RB | 5.25 | % | 12/01/2036 | 500 | 530,025 | |||||||||||
| 1,710,700 | ||||||||||||||||
| Kentucky–4.02% | ||||||||||||||||
Christian (County of) (Jennie Stuart Medical Center, Inc.); Series 2016, Ref. Hospital RB | 5.00 | % | 02/01/2026 | 1,000 | 1,122,920 | |||||||||||
Kentucky (State of) Asset/Liability Commission (General Fund Floating Rate Notes); Series 2007 B, Ref. Floating Rate RB (3 mo. USD LIBOR + 0.55%) (INS–NATL)(b)(g) | 1.43 | % | 11/01/2025 | 735 | 713,060 | |||||||||||
Kentucky (State of) Economic Development Finance Authority (Masonic Home Independent Living II Inc.); Series 2016 A, Ref. RB | 5.00 | % | 05/15/2021 | 1,000 | 1,073,270 | |||||||||||
Kentucky (State of) Economic Development Finance Authority (Next Generation Kentucky Information Highway); Series 2015 A, Sr. RB | 5.00 | % | 07/01/2032 | 1,000 | 1,118,380 | |||||||||||
Kentucky (State of) Economic Development Finance Authority (Owensboro Health, Inc.); Series 2015, Ref. Hospital RB | 5.00 | % | 06/01/2019 | 1,040 | 1,098,469 | |||||||||||
Kentucky (State of) Economic Development Finance Authority (Rosedale Green); Series 2015, Ref. Health Care Facilities RB | 5.00 | % | 11/15/2025 | 600 | 627,690 | |||||||||||
| 5,753,789 | ||||||||||||||||
| Louisiana–0.14% | ||||||||||||||||
East Baton Rouge (Parish of) Industrial Development Board (ExxonMobil); Series 2010 A, VRD RB(h) | 0.72 | % | 08/01/2035 | 200 | 200,000 | |||||||||||
| Maine–0.62% | ||||||||||||||||
Maine (State of) Health & Higher Educational Facilities Authority (Maine General Medical Center); Series 2011, RB | 5.00 | % | 07/01/2019 | 855 | 884,566 | |||||||||||
| Maryland–1.19% | ||||||||||||||||
Baltimore (City of) (East Baltimore Research Park); Series 2017, Ref. Special Obligation RB | 4.00 | % | 09/01/2027 | 425 | 437,367 | |||||||||||
Howard (County of) (Vantage House Facility); | ||||||||||||||||
Series 2016, Ref. Retirement Community RB | 5.00 | % | 04/01/2021 | 325 | 338,241 | |||||||||||
Series 2017, Ref. Retirement Community RB | 5.00 | % | 04/01/2021 | 488 | 510,428 | |||||||||||
Maryland (State of) Health & Higher Educational Facilities Authority (Green Street Academy); Series 2017 A, RB(a) | 5.00 | % | 07/01/2027 | 400 | 423,884 | |||||||||||
| 1,709,920 | ||||||||||||||||
See accompanying Notes to Financial Statements which are an integral part of the financial statements.
12 Invesco Short Duration High Yield Municipal Fund
| Interest Rate | Maturity Date | Principal Amount (000) | Value | |||||||||||||
| Massachusetts–0.41% | ||||||||||||||||
Massachusetts (State of) Development Finance Agency (Evergreen Center Inc.); Series 2005, RB | 5.00 | % | 01/01/2024 | $ | 250 | $ | 250,378 | |||||||||
Massachusetts (State of) Port Authority (Delta Airlines Inc.); | ||||||||||||||||
Series 2001 A, Facilities RB(INS–AMBAC)(d)(g) | 5.20 | % | 01/01/2020 | 195 | 195,745 | |||||||||||
Series 2001 A, Facilities RB(INS–AMBAC)(d)(g) | 5.50 | % | 01/01/2019 | 135 | 135,360 | |||||||||||
| 581,483 | ||||||||||||||||
| Michigan–3.41% | ||||||||||||||||
Michigan (State of) Tobacco Settlement Finance Authority; Series 2007 A, Sr. Asset-Backed RB | 6.00 | % | 06/01/2048 | 1,400 | 1,390,130 | |||||||||||
Summit Academy North; Series 2016, Ref. Public School Academy RB | 4.00 | % | 11/01/2021 | 1,585 | 1,599,487 | |||||||||||
Waterford Township Economic Development Corp. (Canterbury Health Care, Inc.); Series 2016 A, Ref. Limited Obligation RB(a) | 5.00 | % | 07/01/2026 | 1,835 | 1,889,041 | |||||||||||
| 4,878,658 | ||||||||||||||||
| Minnesota–3.54% | ||||||||||||||||
Brooklyn Park (City of) (Athlos Leadership Academy); Series 2015, Charter School Lease RB | 4.00 | % | 07/01/2020 | 225 | 226,309 | |||||||||||
Minnesota (State of) Higher Education Facilities Authority (Bethel University); Series 2017, Ref. RB | 5.00 | % | 05/01/2032 | 500 | 571,175 | |||||||||||
Rochester (City of) (Homestead at Rochester, Inc.); Series 2015, Health Care & Housing RB | 5.00 | % | 12/01/2021 | 470 | 507,337 | |||||||||||
St. Paul (City of) Housing & Redevelopment Authority (High School for Recording Arts); Series 2015, Charter School Lease RB | 5.13 | % | 10/01/2023 | 300 | 304,368 | |||||||||||
St. Paul (City of) Housing & Redevelopment Authority (Hmong College Prep Academy); Series 2016, Ref. Charter School Lease RB | 5.00 | % | 09/01/2026 | 1,000 | 1,059,440 | |||||||||||
St. Paul Park (City of) (Presbyterian Homes Bloomington); | ||||||||||||||||
Series 2017, Ref. Sr. Housing & Health Care RB | 3.80 | % | 09/01/2029 | 350 | 348,166 | |||||||||||
Series 2017, Ref. Sr. Housing & Health Care RB | 3.90 | % | 09/01/2030 | 565 | 564,480 | |||||||||||
Series 2017, Ref. Sr. Housing & Health Care RB | 4.00 | % | 09/01/2031 | 585 | 586,761 | |||||||||||
Series 2017, Ref. Sr. Housing & Health Care RB | 4.00 | % | 09/01/2032 | 400 | 399,816 | |||||||||||
Series 2017, Ref. Sr. Housing & Health Care RB | 4.10 | % | 09/01/2033 | 500 | 499,875 | |||||||||||
| 5,067,727 | ||||||||||||||||
| Missouri–2.17% | ||||||||||||||||
Kansas City (City of) Industrial Development Authority (Ward Parkway Center Community Improvement District); Series 2016 A, Ref. Sr. Sales Tax RB(a) | 5.00 | % | 04/01/2036 | 1,000 | 967,290 | |||||||||||
Kansas City (City of) Industrial Development Authority; Series 2016 A, Ref. Sales Tax RB(a) | 4.25 | % | 04/01/2026 | 500 | 481,160 | |||||||||||
Kirkwood (City of) Industrial Development Authority (Aberdeen Heights); Series 2017, Ref. Retirement Community RB | 5.00 | % | 05/15/2024 | 1,500 | 1,649,355 | |||||||||||
| 3,097,805 | ||||||||||||||||
| Montana–1.76% | ||||||||||||||||
Kalispell (City of) (Immanuel Lutheran Corp.); Series 2017, Ref. Housing & Healthcare Facilities RB | 3.40 | % | 11/15/2022 | 2,500 | 2,514,975 | |||||||||||
| Multiple States–1.33% | ||||||||||||||||
Non-Profit Preferred Funding Trust I; | ||||||||||||||||
Series 2006 A-2A, RB(a) | 4.38 | % | 09/15/2037 | 3,300 | 225,993 | |||||||||||
Series 2007 A-2-G, RB(a) | 4.29 | % | 09/15/2037 | 11,050 | 756,736 | |||||||||||
Series 2007 A-2-T, RB (Acquired 02/08/2016; Cost $3,015,064)(a) | 4.37 | % | 09/15/2037 | 13,470 | 922,464 | |||||||||||
| 1,905,193 | ||||||||||||||||
| Nevada–0.62% | ||||||||||||||||
Nevada (State of) Department of Business & Industry (Doral Academy of Nevada); | ||||||||||||||||
Series 2017 A, RB(a) | 5.00 | % | 07/15/2027 | 335 | 363,127 | |||||||||||
Series 2017 A, RB(a) | 5.00 | % | 07/15/2037 | 500 | 518,625 | |||||||||||
| 881,752 | ||||||||||||||||
| New Jersey–7.46% | ||||||||||||||||
New Jersey (State of) Economic Development Authority (Continental Airlines, Inc.); | ||||||||||||||||
Series 1999, Special Facility RB(d) | 5.25 | % | 09/15/2029 | 800 | 872,104 | |||||||||||
Series 2012, Special Facility RB(d) | 5.75 | % | 09/15/2027 | 200 | 220,718 | |||||||||||
See accompanying Notes to Financial Statements which are an integral part of the financial statements.
13 Invesco Short Duration High Yield Municipal Fund
| Interest Rate | Maturity Date | Principal Amount (000) | Value | |||||||||||||
| New Jersey–(continued) | ||||||||||||||||
New Jersey (State of) Economic Development Authority (Paterson Charter School for Science and Technology Inc.); | ||||||||||||||||
Series 2012 C, RB | 5.00 | % | 07/01/2022 | $ | 470 | $ | 470,169 | |||||||||
Series 2012 C, RB | 5.00 | % | 07/01/2032 | 870 | 802,131 | |||||||||||
New Jersey (State of) Economic Development Authority (School Facilities Construction); Series 2013, Ref. Floating Rate RB (SIFMA Municipal Swap Index + 1.60%)(b) | 2.39 | % | 03/01/2028 | 1,000 | 936,690 | |||||||||||
New Jersey (State of) Economic Development Authority; | ||||||||||||||||
Series 2012, Ref. RB | 5.00 | % | 06/15/2019 | 400 | 420,860 | |||||||||||
Series 2012, Ref. RB | 5.00 | % | 06/15/2025 | 600 | 655,554 | |||||||||||
Series 2017 B, Ref. RB | 5.00 | % | 11/01/2023 | 1,500 | 1,689,405 | |||||||||||
New Jersey (State of) Transportation Trust Fund Authority; | ||||||||||||||||
Series 2006 C, CAB Transportation System RB(INS–AGM)(f)(g) | 0.00 | % | 12/15/2034 | 500 | 249,985 | |||||||||||
Series 2013 AA, Transportation Program RB | 5.25 | % | 06/15/2031 | 1,150 | 1,253,316 | |||||||||||
Subseries 2016 A-2, Federal Highway Reimbursement RN | 5.00 | % | 06/15/2031 | 750 | 767,325 | |||||||||||
Tobacco Settlement Financing Corp.; | ||||||||||||||||
Series 2007 1-A, Asset-Backed RB | 5.00 | % | 06/01/2029 | 750 | 750,045 | |||||||||||
Series 2007 1A, Asset-Backed RB | 4.63 | % | 06/01/2026 | 600 | 600,690 | |||||||||||
Series 2007 1A, Asset-Backed RB | 4.75 | % | 06/01/2034 | 1,000 | 980,460 | |||||||||||
| 10,669,452 | ||||||||||||||||
| New York–1.55% | ||||||||||||||||
Build NYC Resource Corp. (Pratt Paper Inc.); Series 2014, Ref. Waste Disposal RB(a)(d) | 3.75 | % | 01/01/2020 | 345 | 352,987 | |||||||||||
Nassau (County of) Industrial Development Agency (Amsterdam at Harborside); Series 2014 B, Continuing Care Retirement Community RB | 5.50 | % | 07/01/2020 | 335 | 334,882 | |||||||||||
Nassau County Tobacco Settlement Corp.; Series 2006 A-2, Sr. Asset-Backed RB | 5.25 | % | 06/01/2026 | 1,000 | 994,930 | |||||||||||
New York Transportation Development Corp. (American Airlines, Inc.); Series 2016, Ref. Special Facilities RB(d) | 5.00 | % | 08/01/2026 | 500 | 537,830 | |||||||||||
| 2,220,629 | ||||||||||||||||
| North Dakota–0.72% | ||||||||||||||||
Burleigh (County of) (University of Mary); Series 2016, Education Facilities RB | 4.38 | % | 04/15/2026 | 1,000 | 1,024,880 | |||||||||||
| Ohio–5.59% | ||||||||||||||||
Buckeye Tobacco Settlement Financing Authority; | ||||||||||||||||
Series 2007 A-2, Sr. Asset-Backed Turbo RB | 5.13 | % | 06/01/2024 | 2,000 | 1,894,280 | |||||||||||
Series 2007 A-2, Sr. Asset-Backed Turbo RB | 5.38 | % | 06/01/2024 | 1,000 | 975,250 | |||||||||||
Butler (County of) Port Authority (Storypoint Fairfield); Sr. Series 2017 A-1, RB(a) | 6.25 | % | 01/15/2034 | 500 | 519,715 | |||||||||||
Cleveland (City of) (Continental Airlines, Inc.); Series 1998, Airport Special RB(d) | 5.38 | % | 09/15/2027 | 200 | 200,572 | |||||||||||
Cuyahoga (County of) (Metrohealth System); Series 2017, Ref. Hospital RB | 5.00 | % | 02/15/2031 | 1,000 | 1,108,810 | |||||||||||
Gallia (County of) (Holzer Health System Obligated Group); Series 2012, Ref. & Improvement Hospital Facilities RB | 8.00 | % | 07/01/2042 | 1,975 | 2,275,239 | |||||||||||
Muskingum (County of) (Genesis Healthcare System); Series 2013, Hospital Facilities RB | 5.00 | % | 02/15/2021 | 365 | 394,441 | |||||||||||
Ohio (State of) (Portsmouth Bypass); Series 2015, Private Activity RB(d) | 5.00 | % | 12/31/2025 | 340 | 400,119 | |||||||||||
Toledo-Lucas (County of) Port Authority (StoryPoint Waterville); Series 2016 A-1, RB(a) | 6.13 | % | 01/15/2034 | 225 | 230,049 | |||||||||||
| 7,998,475 | ||||||||||||||||
| Oklahoma–2.94% | ||||||||||||||||
Comanche (County of) Hospital Authority; | ||||||||||||||||
Series 2012 A, Ref. RB | 5.00 | % | 07/01/2021 | 475 | 509,043 | |||||||||||
Series 2015, Ref. RB | 5.00 | % | 07/01/2023 | 1,000 | 1,098,400 | |||||||||||
Oklahoma (State of) Development Finance Authority (Inverness Village Community); Series 2012, Ref. Continuing Care Retirement Community RB | 5.25 | % | 01/01/2022 | 375 | 387,878 | |||||||||||
Payne (County of) Economic Development Authority (Epworth Living at the Ranch); Series 2016 B-2, RB | 4.75 | % | 11/01/2023 | 1,860 | 1,837,792 | |||||||||||
Tulsa (City of) Municipal Airport Trust (American Airlines Group, Inc.); Series 2015, Ref. RB(c)(d) | 5.00 | % | 06/01/2025 | 340 | 368,621 | |||||||||||
| 4,201,734 | ||||||||||||||||
See accompanying Notes to Financial Statements which are an integral part of the financial statements.
14 Invesco Short Duration High Yield Municipal Fund
| Interest Rate | Maturity Date | Principal Amount (000) | Value | |||||||||||||
| Pennsylvania–1.54% | ||||||||||||||||
Beaver (County of) Industrial Development Authority (FirstEnergy Nuclear Generation); Series 2006 A, Ref. PCR(c) | 4.38 | % | 07/01/2022 | $ | 1,150 | $ | 1,132,428 | |||||||||
Philadelphia (City of) Authority for Industrial Development (Wesley Enhanced Living Obligated Group); Series 2017, Ref. Sr. Living Facilities RB | 5.00 | % | 07/01/2032 | 1,000 | 1,074,690 | |||||||||||
| 2,207,118 | ||||||||||||||||
| Puerto Rico–1.07% | ||||||||||||||||
Puerto Rico (Commonwealth of) Electric Power Authority; Series 2005 SS, Ref. RB (INS–NATL)(g) | 5.00 | % | 07/01/2024 | 1,500 | 1,527,390 | |||||||||||
| Rhode Island–0.40% | ||||||||||||||||
Tobacco Settlement Financing Corp.; Series 2015 A, Ref. RB | 5.00 | % | 06/01/2026 | 500 | 576,835 | |||||||||||
| Tennessee–1.15% | ||||||||||||||||
Bristol (City of) Industrial Development Board (Pinnacle); | ||||||||||||||||
Series 2016, Tax Increment Allocation RB | 4.25 | % | 06/01/2021 | 760 | 776,614 | |||||||||||
Series 2016 B, CAB Sales Tax RB(a)(f) | 0.00 | % | 12/01/2020 | 750 | 661,207 | |||||||||||
Series 2016 B, CAB Sales Tax RB(a)(f) | 0.00 | % | 12/01/2021 | 250 | 211,065 | |||||||||||
| 1,648,886 | ||||||||||||||||
| Texas–8.55% | ||||||||||||||||
Arlington Higher Education Finance Corp. (Leadership Prep School); Series 2016 A, Education RB | 5.00 | % | 06/15/2036 | 700 | 706,678 | |||||||||||
Guadalupe (County of) & Seguin (City of) Hospital Board of Managers; Series 2015, Ref. Hospital Mortgage RB | 5.00 | % | 12/01/2021 | 450 | 484,672 | |||||||||||
Gulf Coast Industrial Development Authority (ExxonMobil); Series 2012, VRD RB(h) | 0.87 | % | 11/01/2041 | 1,250 | 1,250,000 | |||||||||||
Houston (City of) (United Airlines, Inc. Terminal E); Series 2014, Ref. Airport System RB(d) | 4.75 | % | 07/01/2024 | 200 | 217,744 | |||||||||||
Mission Economic Development Corp. (Natgasoline); | ||||||||||||||||
Series 2016 A, Sr. Lien RB(a)(d) | 5.75 | % | 10/01/2031 | 1,000 | 1,046,570 | |||||||||||
Series 2016 B, Sr. Lien RB(a)(d) | 5.75 | % | 10/01/2031 | 1,000 | 1,046,570 | |||||||||||
New Hope Cultural Education Facilities Corp. (Wesleyan Homes Inc.); Series 2014, Retirement Facilities RB | 4.00 | % | 01/01/2018 | 435 | 436,727 | |||||||||||
New Hope Cultural Education Facilities Finance Corp. (Carillon Lifecare Community); Series 2016, Ref. Retirement Facility RB | 5.00 | % | 07/01/2036 | 500 | 512,530 | |||||||||||
New Hope Cultural Education Facilities Finance Corp. (Jubilee Academic Center); Series 2017 A, Education RB(a) | 3.63 | % | 08/15/2022 | 400 | 403,300 | |||||||||||
New Hope Cultural Education Facilities Finance Corp. (MRC Senior Living-The Langford); | ||||||||||||||||
Series 2016 B-1, TEMPS-80SM RB | 3.25 | % | 11/15/2022 | 500 | 498,740 | |||||||||||
Series 2016 B-2, TEMPS-50SM RB | 3.00 | % | 11/15/2021 | 500 | 498,490 | |||||||||||
Port Beaumont Navigation District (Jefferson Energy Companies); Series 2016, Dock and Wharf Facility RB(a)(c)(d) | 7.25 | % | 02/13/2020 | 1,500 | 1,556,385 | |||||||||||
Red River Health Facilities Development Corp. (MRC Crossing); Series 2014 A, Retirement Facility RB | 6.75 | % | 11/15/2024 | 200 | 225,200 | |||||||||||
Rowlett (City of) (Bayside Public Improvement District North Improvement Area); Series 2016, Special Assessment RB | 4.90 | % | 09/15/2024 | 250 | 248,718 | |||||||||||
Tarrant County Cultural Education Facilities Finance Corp. (Buckner Senior Living—Ventana); | ||||||||||||||||
Series 2017, TEMPS-50SM Retirement Facility RB | 3.88 | % | 11/15/2022 | 750 | 764,190 | |||||||||||
Series 2017, TEMPS-65SM Retirement Facility RB | 4.50 | % | 11/15/2023 | 750 | 766,552 | |||||||||||
Tarrant County Cultural Education Facilities Finance Corp. (C.C. Young Memorial Home); Series 2017 A, Retirement Facility RB | 6.00 | % | 02/15/2031 | 1,000 | 1,049,610 | |||||||||||
Travis County Cultural Education Facilities Finance Corp. (Wayside Schools); Series 2012 A, Education RB | 5.00 | % | 08/15/2027 |
| 500 |
| 520,155 | |||||||||
| 12,232,831 | ||||||||||||||||
| Utah–2.46% | ||||||||||||||||
Salt Lake City (City of); Series 2017 A, Airport RB(d)(i) | 5.00 | % | 07/01/2036 | 3,000 | 3,515,910 | |||||||||||
| Washington–3.69% | ||||||||||||||||
Klickitat (County of) Public Hospital District No. 2 (Skyline Hospital); Series 2017, Ref. Hospital Improvement RB | 4.00 | % | 12/01/2027 | 1,500 | 1,504,935 | |||||||||||
See accompanying Notes to Financial Statements which are an integral part of the financial statements.
15 Invesco Short Duration High Yield Municipal Fund
| Interest Rate | Maturity Date | Principal Amount (000) | Value | |||||||||||||
| Washington–(continued) | ||||||||||||||||
Washington (State of) Housing Finance Commission (Bayview Manor Senior); | ||||||||||||||||
Series 2016 A, Ref. RB(a) | 5.00 | % | 07/01/2031 | $ | 1,000 | $ | 1,059,230 | |||||||||
Series 2016 A, Ref. RB(a) | 5.00 | % | 07/01/2036 | 710 | 737,697 | |||||||||||
Washington (State of) Housing Finance Commission (Heron’s Key Senior Living); | ||||||||||||||||
Series 2015 B-2, TEMPS-65SM RB(a) | 4.88 | % | 01/01/2022 | 500 | 499,870 | |||||||||||
Series 2015 B-3, TEMPS-45SM RB(a) | 4.38 | % | 01/01/2021 | 1,000 | 990,630 | |||||||||||
Washington (State of) Housing Finance Commission (Wesley Homes at Lea Hill); Series 2016, Ref. Non-Profit RB(a) | 3.20 | % | 07/01/2021 | 500 | 486,775 | |||||||||||
| 5,279,137 | ||||||||||||||||
| West Virginia–1.24% | ||||||||||||||||
Harrison (County of) Commission (Charles Pointe No. 2); Series 2008 A, Ref. Tax Increment Allocation RB | 6.50 | % | 06/01/2023 | 795 | 784,363 | |||||||||||
West Virginia (State of) Economic Development Authority (Entsorga West Virginia LLC); Series 2016, Solid Waste Disposal Facilities RB(a)(d) | 6.75 | % | 02/01/2026 | 1,000 | 983,660 | |||||||||||
| 1,768,023 | ||||||||||||||||
| Wisconsin–9.39% | ||||||||||||||||
Public Finance Authority (American Dream at Meadowlands); | ||||||||||||||||
Series 2017, Limited Obligation Grant RB(a) | 6.25 | % | 08/01/2027 | 2,000 | 2,112,580 | |||||||||||
Series 2017, Limited Obligation Grant RB(a) | 6.75 | % | 08/01/2031 | 500 | 529,000 | |||||||||||
Wisconsin (State of) Public Finance Authority (Bancroft Neurohearlth); | ||||||||||||||||
Series 2016 A, RB(a) | 5.00 | % | 06/01/2025 | 650 | 695,299 | |||||||||||
Series 2016 A, RB(a) | 5.00 | % | 06/01/2026 | 1,005 | 1,065,069 | |||||||||||
Wisconsin (State of) Public Finance Authority (Delray Beach Radiation Therapy Center); Series 2017 A, Sr. RB(a) | 5.75 | % | 11/01/2024 | 1,500 | 1,523,610 | |||||||||||
Wisconsin (State of) Public Finance Authority (Glenridge Palmer Ranch); Series 2011 A, Continuing Care Retirement Community RB | 7.00 | % | 06/01/2020 | 65 | 70,275 | |||||||||||
Wisconsin (State of) Public Finance Authority (Mary’s Woods at Marylhurst); Series 2017 A, TEMPS-85SM Ref. Senior Living RB(a) | 3.95 | % | 11/15/2024 | 1,250 | 1,263,112 | |||||||||||
Wisconsin (State of) Public Finance Authority (Million Air Two LLC General Aviation Facilities); Series 2017 B, Ref. Special Facilities RB(a)(d) | 6.00 | % | 06/01/2022 | 1,580 | 1,570,504 | |||||||||||
Wisconsin (State of) Public Finance Authority (North Carolina Charter Educational Foundation); Series 2016 A, Education RB(a) | 4.10 | % | 06/15/2026 | 1,265 | 1,258,473 | |||||||||||
Wisconsin (State of) Public Finance Authority (Wittenberg University); Series 2016, Higher Education Facility RB(a) | 4.00 | % | 12/01/2021 | 1,320 | 1,315,855 | |||||||||||
Wisconsin Health & Educational Facilities Authority (American Baptist Homes of the Midwest Obligated Group); | ||||||||||||||||
Series 2017, Ref. RB | 3.50 | % | 08/01/2022 | 1,500 | 1,502,700 | |||||||||||
Series 2017, Ref. RB | 5.00 | % | 08/01/2027 | 500 | 526,470 | |||||||||||
| 13,432,947 | ||||||||||||||||
| Wyoming–1.40% | ||||||||||||||||
Sublette (County of) (ExxonMobil); Series 2014, Ref. VRD PCR(h) | 0.72 | % | 10/01/2044 | 2,000 | 2,000,000 | |||||||||||
TOTAL INVESTMENTS IN SECURITIES(j)–103.87% (Cost $145,777,745) | 148,546,821 | |||||||||||||||
FLOATING RATE NOTE OBLIGATIONS–(1.40)% | ||||||||||||||||
Note with an interest and fee rate of 1.43% at 08/31/2017 and contractual maturity of collateral of 07/01/2036 (See Note 1J)(k) | (2,000,000 | ) | ||||||||||||||
OTHER ASSETS LESS LIABILITIES–(2.47)% | (3,529,908 | ) | ||||||||||||||
NET ASSETS–100.00% | $ | 143,016,913 | ||||||||||||||
See accompanying Notes to Financial Statements which are an integral part of the financial statements.
16 Invesco Short Duration High Yield Municipal Fund
Investment Abbreviations:
| AGM | — Assured Guaranty Municipal Corp. | |
| AMBAC | — American Municipal Bond Assurance Corp. | |
| CAB | — Capital Appreciation Bonds | |
| Conv. | — Convertible | |
| GO | — General Obligation | |
| IDR | — Industrial Development Revenue Bonds | |
| INS | — Insurer | |
| LIBOR | — London Interbank Offered Rate | |
| NATL | — National Public Finance Guarantee Corp. |
| PCR | — Pollution Control Revenue Bonds | |
| RB | — Revenue Bonds | |
| Ref. | — Refunding | |
| RN | — Revenue Notes | |
| SIFMA | — Securities Industry and Financial Markets Association | |
| Sr. | — Senior | |
| TEMPS | — Tax-Exempt Mandatory Paydown Securities | |
| VRD | — Variable Rate Demand |
Notes to Schedule of Investments:
| (a) | Security purchased or received in a transaction exempt from registration under the Securities Act of 1933, as amended (the “1933 Act”). The security may be resold pursuant to an exemption from registration under the 1933 Act, typically to qualified institutional buyers. The aggregate value of these securities at August 31, 2017 was $40,928,323, which represented 28.62% of the Fund’s Net Assets. |
| (b) | Interest or dividend rate is redetermined periodically. Rate shown is the rate in effect on August 31, 2017. |
| (c) | Security has an irrevocable call by the issuer or mandatory put by the holder. Maturity date reflects such call or put. |
| (d) | Security subject to the alternative minimum tax. |
| (e) | Advance refunded; secured by an escrow fund of U.S. Government obligations or other highly rated collateral. |
| (f) | Zero coupon bond issued at a discount. |
| (g) | Principal and/or interest payments are secured by the bond insurance company listed. |
| (h) | Demand security payable upon demand by the Fund at specified time intervals no greater than thirteen months. Interest rate is redetermined periodically based on current market interest rates. Rate shown is the rate in effect on August 31, 2017. |
| (i) | Underlying security related to TOB Trusts entered into by the Fund. See Note 1J. |
| (j) | Entities may either issue, guarantee, back or otherwise enhance the credit quality of a security. The entities are not primarily responsible for the issuer’s obligation but may be called upon to satisfy issuers obligations. No concentration of any single entity was greater than 5% each. |
| (k) | Floating rate note obligations related to securities held. The interest and fee rates shown reflect the rates in effect at August 31, 2017. At August 31, 2017, the Fund’s investments with a value of $3,515,910 are held by TOB Trusts and serve as collateral for the $2,000,000 in the floating rate note obligations outstanding at that date. |
| Open Futures Contracts(a) | ||||||||||||||||||||
| Short Futures Contracts | Number of Contracts | Expiration Month | Notional Value | Value | Unrealized (Depreciation) | |||||||||||||||
U.S. Treasury 5 Year Notes | 20 | December-2017 | $ | (5,714,297 | ) | $ | (12,060 | ) | $ | (12,060 | ) | |||||||||
U.S. Treasury 10 Year Notes | 45 | December-2017 | (2,370,000 | ) | 421 | 421 | ||||||||||||||
Total Futures Contracts — Interest Rate Risk |
| $ | (11,639 | ) | $ | (11,639 | ) | |||||||||||||
| (a) | Futures contracts collateralized by $52,575 cash held with Goldman Sachs & Co., the futures commission merchant. |
See accompanying Notes to Financial Statements which are an integral part of the financial statements.
17 Invesco Short Duration High Yield Municipal Fund
Statement of Assets and Liabilities
August 31, 2017
Assets: |
| |||
Investments in securities, at value (Cost $145,777,745) | $ | 148,546,821 | ||
Other investments: | ||||
Variation margin receivable — futures | 23,128 | |||
Cash | 104,386 | |||
Deposits with brokers: | ||||
Cash collateral — exchange-traded futures contracts | 52,575 | |||
Receivable for: | ||||
Fund shares sold | 2,443,279 | |||
Interest | 1,643,886 | |||
Fund expenses absorbed | 8,318 | |||
Investments matured, at value (Cost $100,000) | 57,990 | |||
Investment for trustee deferred compensation and retirement plans | 2,250 | |||
Other assets | 67,881 | |||
Total assets | 152,950,514 | |||
Liabilities: |
| |||
Floating rate note obligations | 2,000,000 | |||
Payable for: | ||||
Investments purchased | 7,583,405 | |||
Dividends | 86,044 | |||
Fund shares reacquired | 76,049 | |||
Accrued fees to affiliates | 71,630 | |||
Accrued trustees’ and officers’ fees and benefits | 3,278 | |||
Accrued other operating expenses | 110,946 | |||
Trustee deferred compensation and retirement plans | 2,249 | |||
Total liabilities | 9,933,601 | |||
Net assets applicable to shares outstanding | $ | 143,016,913 | ||
Net assets consist of: |
| |||
Shares of beneficial interest | $ | 140,843,364 | ||
Undistributed net investment income | 593,782 | |||
Undistributed net realized gain (loss) | (1,135,660 | ) | ||
Net unrealized appreciation | 2,715,427 | |||
| $ | 143,016,913 | |||
Net Assets: |
| |||
Class A | $ | 73,383,743 | ||
Class C | $ | 35,114,180 | ||
Class Y | $ | 34,480,340 | ||
Class R5 | $ | 28,415 | ||
Class R6 | $ | 10,235 | ||
Shares outstanding, no par value, |
| |||
Class A | 7,010,952 | |||
Class C | 3,360,851 | |||
Class Y | 3,291,597 | |||
Class R5 | 2,711 | |||
Class R6 | 977 | |||
Class A: | ||||
Net asset value per share | $ | 10.47 | ||
Maximum offering price per share | ||||
(Net asset value of $10.47 ¸ 97.50%) | $ | 10.74 | ||
Class C: | ||||
Net asset value and offering price per share | $ | 10.45 | ||
Class Y: | ||||
Net asset value and offering price per share | $ | 10.48 | ||
Class R5: | ||||
Net asset value and offering price per share | $ | 10.48 | ||
Class R6: | ||||
Net asset value and offering price per share | $ | 10.48 | ||
See accompanying Notes to Financial Statements which are an integral part of the financial statements.
18 Invesco Short Duration High Yield Municipal Fund
Statement of Operations
For the year ended August 31, 2017
Investment income: |
| |||
Interest | $ | 4,391,630 | ||
Expenses: | ||||
Advisory fees | 491,131 | |||
Administrative services fees | 50,000 | |||
Custodian fees | 4,750 | |||
Distribution fees: | ||||
Class A | 133,906 | |||
Class C | 267,553 | |||
Interest, facilities and maintenance fees | 17,458 | |||
Transfer agent fees — A, C and Y | 89,411 | |||
Transfer agent fees — R5 | 32 | |||
Transfer agent fees — R6 | 4 | |||
Trustees’ and officers’ fees and benefits | 22,331 | |||
Registration and filing fees | 91,358 | |||
Reports to shareholders | 36,124 | |||
Professional services fees | 57,640 | |||
Taxes | 14,449 | |||
Other | 22,214 | |||
Total expenses | 1,298,361 | |||
Less: Fees waived, expenses reimbursed and expense offset arrangement(s) | (334,715 | ) | ||
Net expenses | 963,646 | |||
Net investment income | 3,427,984 | |||
Realized and unrealized gain (loss) from: | ||||
Net realized gain (loss) from: | ||||
Investment securities | (1,165,621 | ) | ||
Futures contracts | 62,558 | |||
| (1,103,063 | ) | |||
Change in net unrealized appreciation (depreciation) of: | ||||
Investment securities | 712,090 | |||
Futures contracts | (9,362 | ) | ||
| 702,728 | ||||
Net realized and unrealized gain (loss) | (400,335 | ) | ||
Net increase in net assets resulting from operations | $ | 3,027,649 | ||
See accompanying Notes to Financial Statements which are an integral part of the financial statements.
19 Invesco Short Duration High Yield Municipal Fund
Statement of Changes in Net Assets
For the year ended August 31, 2017 and the period September 30, 2015 (commencement date) through August 31, 2016
| 2017 | September 30, 2015 (commencement date) through August 31, 2016 | |||||||
Operations: |
| |||||||
Net investment income | $ | 3,427,984 | $ | 1,300,229 | ||||
Net realized gain (loss) | (1,103,063 | ) | (35,879 | ) | ||||
Change in net unrealized appreciation | 702,728 | 2,012,699 | ||||||
Net increase in net assets resulting from operations | 3,027,649 | 3,277,049 | ||||||
Distributions to shareholders from net investment income: | ||||||||
Class A | (1,754,327 | ) | (580,606 | ) | ||||
Class C | (675,396 | ) | (166,494 | ) | ||||
Class Y | (624,884 | ) | (284,922 | ) | ||||
Class R5 | (1,139 | ) | (11,795 | ) | ||||
Class R6 | (150 | ) | — | |||||
Total distributions from net investment income | (3,055,896 | ) | (1,043,817 | ) | ||||
Share transactions–net: | ||||||||
Class A | 31,759,587 | 40,363,621 | ||||||
Class C | 14,709,195 | 20,222,207 | ||||||
Class Y | 20,392,698 | 13,345,977 | ||||||
Class R5 | (33,857 | ) | 42,500 | |||||
Class R6 | 10,000 | — | ||||||
Net increase in net assets resulting from share transactions | 66,837,623 | 73,974,305 | ||||||
Net increase in net assets | 66,809,376 | 76,207,537 | ||||||
Net assets: | ||||||||
Beginning of year | 76,207,537 | — | ||||||
End of year (includes undistributed net investment income of $593,782 and $213,034, respectively) | $ | 143,016,913 | $ | 76,207,537 | ||||
Notes to Financial Statements
August 31, 2017
NOTE 1—Significant Accounting Policies
Invesco Short Duration High Yield Municipal Fund (the “Fund”) is a series portfolio of AIM Counselor Series Trust (Invesco Counselor Series Trust) (the “Trust”). The Trust is a Delaware statutory trust registered under the Investment Company Act of 1940, as amended (the “1940 Act”), as an open-end series management investment company consisting of fourteen separate portfolios, each authorized to issue an unlimited number of shares of beneficial interest. The assets, liabilities and operations of each portfolio are accounted for separately. Information presented in these financial statements pertains only to the Fund. Matters affecting each portfolio or class will be voted on exclusively by the shareholders of such portfolio or class.
The Fund’s investment objective is to seek federal tax-exempt current income and taxable capital appreciation.
The Fund currently consists of five different classes of shares: Class A, Class C, Class Y, Class R5 and Class R6. On April 4, 2017, the Fund began offering Class R6 shares. Class Y shares are available only to certain investors. Class A shares are sold with a front-end sales charge unless certain waiver criteria are met and under certain circumstances load waiver shares may be subject to contingent deferred sales charges (“CDSC”). Class C shares are sold with a CDSC. Class Y and Class R5 shares are sold at net asset value.
The Fund is an investment company and accordingly follows the investment company accounting and reporting guidance in accordance with Financial Accounting Standards Board Accounting Standards Codification Topic 946, Financial Services — Investment Companies.
The following is a summary of the significant accounting policies followed by the Fund in the preparation of its financial statements.
| A. | Security Valuations — Securities, including restricted securities, are valued according to the following policy. |
Securities are fair valued using an evaluated quote provided by an independent pricing service approved by the Board of Trustees. Evaluated quotes provided by the pricing service may be determined without exclusive reliance on quoted prices, and may reflect appropriate factors such as institution-size trading in similar groups of securities, developments related to specific securities, dividend rate (for unlisted equities), yield (for debt obligations), quality, type of issue, coupon rate (for debt obligations), maturity (for debt obligations), individual trading characteristics and other market data. Pricing services generally value debt obligations assuming orderly transactions of institutional round lot size, but a Fund may hold or transact in the same securities in smaller, odd lot sizes. Odd lots often trade at lower prices than institutional round lots. Debt obligations are subject to interest rate and credit risks. In addition, all debt obligations involve some risk of default with respect to interest and/or principal payments.
20 Invesco Short Duration High Yield Municipal Fund
Securities for which market quotations either are not readily available or became unreliable are valued at fair value as determined in good faith by or under the supervision of the Trust’s officers following procedures approved by the Board of Trustees. Some of the factors which may be considered in determining fair value are fundamental analytical data relating to the investment; the nature and duration of any restrictions on transferability or disposition; trading in similar securities by the same issuer or comparable companies; relevant political, economic or issuer specific news; and other relevant factors under the circumstances.
The Fund may invest in securities that are subject to interest rate risk, meaning the risk that the prices will generally fall as interest rates rise and, conversely, the prices will generally rise as interest rates fall. Specific securities differ in their sensitivity to changes in interest rates depending on their individual characteristics. Changes in interest rates may result in increased market volatility, which may affect the value and/or liquidity of certain Fund investments.
Valuations change in response to many factors including the historical and prospective earnings of the issuer, the value of the issuer’s assets, general economic conditions, interest rates, investor perceptions and market liquidity. Because of the inherent uncertainties of valuation, the values reflected in the financial statements may materially differ from the value received upon actual sale of those investments.
| B. | Securities Transactions and Investment Income — Securities transactions are accounted for on a trade date basis. Realized gains or losses on sales are computed on the basis of specific identification of the securities sold. Interest income (net of withholding tax, if any) is recorded on the accrual basis from settlement date. Bond premiums and discounts are amortized and/or accreted over the lives of the respective securities. Pay-in-kind income received in the form of securities in-lieu of cash is recorded as interest income. Paydown gains and losses on mortgage and asset-backed securities are recorded as adjustments to interest income. Dividend income (net of withholding tax, if any) is recorded on the ex-dividend date. |
The Fund may periodically participate in litigation related to Fund investments. As such, the Fund may receive proceeds from litigation settlements. Any proceeds received are included in the Statement of Operations as realized gain (loss) for investments no longer held and as unrealized gain (loss) for investments still held.
Brokerage commissions and mark ups are considered transaction costs and are recorded as an increase to the cost basis of securities purchased and/or a reduction of proceeds on a sale of securities. Such transaction costs are included in the determination of net realized and unrealized gain (loss) from investment securities reported in the Statement of Operations and the Statement of Changes in Net Assets and the net realized and unrealized gains (losses) on securities per share in the Financial Highlights. Transaction costs are included in the calculation of the Fund’s net asset value and, accordingly, they reduce the Fund’s total returns. These transaction costs are not considered operating expenses and are not reflected in net investment income reported in the Statement of Operations and the Statement of Changes in Net Assets, or the net investment income per share and the ratios of expenses and net investment income reported in the Financial Highlights, nor are they limited by any expense limitation arrangements between the Fund and the investment adviser.
The Fund allocates realized and unrealized capital gains and losses to a class based on the relative net assets of each class. The Fund allocates income to a class based on the relative value of the settled shares of each class.
| C. | Country Determination — For the purposes of making investment selection decisions and presentation in the Schedule of Investments, the investment adviser may determine the country in which an issuer is located and/or credit risk exposure based on various factors. These factors include the laws of the country under which the issuer is organized, where the issuer maintains a principal office, the country in which the issuer derives 50% or more of its total revenues and the country that has the primary market for the issuer’s securities, as well as other criteria. Among the other criteria that may be evaluated for making this determination are the country in which the issuer maintains 50% or more of its assets, the type of security, financial guarantees and enhancements, the nature of the collateral and the sponsor organization. Country of issuer and/or credit risk exposure has been determined to be the United States of America, unless otherwise noted. |
| D. | Distributions — Distributions from net investment income, if any, are declared daily and paid monthly. Distributions from net realized capital gain, if any, are generally declared and paid annually and recorded on the ex-dividend date. The Fund may elect to treat a portion of the proceeds from redemptions as distributions for federal income tax purposes. |
| E. | Federal Income Taxes — The Fund intends to comply with the requirements of Subchapter M of the Internal Revenue Code of 1986, as amended (the “Internal Revenue Code”), necessary to qualify as a regulated investment company and to distribute substantially all of the Fund’s taxable and tax-exempt earnings to shareholders. As such, the Fund will not be subject to federal income taxes on otherwise taxable income (including net realized capital gain) that is distributed to shareholders. Therefore, no provision for federal income taxes is recorded in the financial statements. |
The Fund recognizes the tax benefits of uncertain tax positions only when the position is more likely than not to be sustained. Management has analyzed the Fund’s uncertain tax positions and concluded that no liability for unrecognized tax benefits should be recorded related to uncertain tax positions. Management is not aware of any tax positions for which it is reasonably possible that the total amounts of unrecognized tax benefits will change materially in the next 12 months.
In addition, the Fund intends to invest in such municipal securities to allow it to qualify to pay shareholders “exempt-interest dividends”, as defined in the Internal Revenue Code.
The Fund files tax returns in the U.S. Federal jurisdiction and certain other jurisdictions. Generally, the Fund is subject to examinations by such taxing authorities for up to three years after the filing of the return for the tax period.
| F. | Expenses — Fees provided for under the Rule 12b-1 plan of a particular class of the Fund are charged to the operations of such class. Transfer agency fees and expenses and other shareholder recordkeeping fees and expenses attributable to Class R5 are charged to such class. Transfer agency fees and expenses and other shareholder recordkeeping fees and expenses relating to all other classes are allocated among those classes based on relative net assets. All other expenses are allocated among the classes based on relative net assets. |
| G. | Interest, Facilities and Maintenance Fees — Interest, Facilities and Maintenance Fees include interest and related borrowing costs such as commitment fees and other expenses associated with lines of credit and interest and administrative expenses related to establishing and maintaining floating rate note obligations, if any. |
| H. | Accounting Estimates — The preparation of financial statements in conformity with accounting principles generally accepted in the United States of America (“GAAP”) requires management to make estimates and assumptions that affect the reported amounts of assets and liabilities at the date of the financial statements and the reported amounts of revenues and expenses during the reporting period including estimates and assumptions related to taxation. Actual results could differ from those estimates by a significant amount. In addition, the Fund monitors for material events or transactions that may occur or become known after the period-end date and before the date the financial statements are released to print. |
21 Invesco Short Duration High Yield Municipal Fund
| I. | Indemnifications — Under the Trust’s organizational documents, each Trustee, officer, employee or other agent of the Trust is indemnified against certain liabilities that may arise out of the performance of their duties to the Fund. Additionally, in the normal course of business, the Fund enters into contracts, including the Fund’s servicing agreements, that contain a variety of indemnification clauses. The Fund’s maximum exposure under these arrangements is unknown as this would involve future claims that may be made against the Fund that have not yet occurred. The risk of material loss as a result of such indemnification claims is considered remote. |
| J. | Floating Rate Note Obligations — The Fund invests in inverse floating rate securities, such as Tender Option Bonds (“TOBs”), for investment purposes and to enhance the yield of the Fund. Such securities may be purchased in the secondary market without first owning an underlying bond but generally are created through the sale of fixed rate bonds by the Fund to special purpose trusts established by a broker dealer or by the Fund (“TOB Trusts”) in exchange for cash and residual interests in the TOB Trusts’ assets and cash flows, which are in the form of inverse floating rate securities. The TOB Trusts finance the purchases of the fixed rate bonds by issuing floating rate notes to third parties and allowing the Fund to retain residual interests in the bonds. The floating rate notes issued by the TOB Trusts have interest rates that reset weekly and the floating rate note holders have the option to tender their notes to the TOB Trusts for redemption at par at each reset date. The residual interests held by the Fund (inverse floating rate securities) include the right of the Fund (1) to cause the holders of the floating rate notes to tender their notes at par at the next interest rate reset date, and (2) to transfer the municipal bond from the TOB Trust to the Fund, thereby collapsing the TOB Trust. Inverse floating rate securities tend to underperform the market for fixed rate bonds in a rising interest rate environment, but tend to outperform the market for fixed rate bonds when interest rates decline or remain relatively stable. |
The Fund generally invests in inverse floating rate securities that include embedded leverage, thus exposing the Fund to greater risks and increased costs. The primary risks associated with inverse floating rate securities are varying degrees of liquidity and decreases in the value of such securities in response to changes in interest rates to a greater extent than fixed rate securities having similar credit quality, redemption provisions and maturity, which may cause the Fund’s net asset value to be more volatile than if it had not invested in inverse floating rate securities. In certain instances, the short-term floating rate notes created by the TOB Trust may not be able to be sold to third parties or, in the case of holders tendering (or putting) such notes for repayment of principal, may not be able to be remarketed to third parties. In such cases, the TOB Trust holding the fixed rate bonds may be collapsed with the entity that contributed the fixed rate bonds to the TOB Trust. In the case where a TOB Trust is collapsed with the Fund, the Fund will be required to repay the principal amount of the tendered securities, which may require the Fund to sell other portfolio holdings to raise cash to meet that obligation. The Fund could therefore be required to sell other portfolio holdings at a disadvantageous time or price to raise cash to meet this obligation, which risk will be heightened during times of market volatility, illiquidity or uncertainty. The embedded leverage in the TOB Trust could cause the Fund to lose more money than the value of the asset it has contributed to the TOB Trust and greater levels of leverage create the potential for greater losses. In addition, a Fund may enter into reimbursement agreements with the liquidity provider of certain TOB transactions in connection with certain residuals held by the Fund. These agreements commit a Fund to reimburse the liquidity provider to the extent that the liquidity provider must provide cash to a TOB Trust, including following the termination of a TOB Trust resulting from a mandatory tender event (“liquidity shortfall”). The reimbursement agreement will effectively make the Fund liable for the amount of the negative difference, if any, between the liquidation value of the underlying security and the purchase price of the floating rate notes issued by the TOB Trust.
The Fund accounts for the transfer of fixed rate bonds to the TOB Trusts as secured borrowings, with the securities transferred remaining in the Fund’s investment assets, and the related floating rate notes reflected as Fund liabilities under the caption Floating rate note obligations on the Statement of Assets and Liabilities. The carrying amount of the Fund’s Floating rate note obligations as reported on the Statement of Assets and Liabilities approximates its fair value. The Fund records the interest income from the fixed rate bonds under the caption Interest and records the expenses related to floating rate obligations and any administrative expenses of the TOB Trusts as a component of Interest, facilities and maintenance fees on the Statement of Operations.
Final rules implementing section 619 of the Dodd-Frank Wall Street Reform and Consumer Protection Act (the “Volcker Rule”) prohibit banking entities from engaging in proprietary trading of certain instruments and limit such entities’ investments in, and relationships with, “covered funds”, as defined in the rules. These rules preclude banking entities and their affiliates from sponsoring and/or providing services for existing TOB Trusts. A new TOB structure is being utilized by the Fund wherein the Fund, as holder of the residuals, will perform certain duties previously performed by banking entities as “sponsors” of TOB Trusts. These duties may be performed by a third-party service provider. The Fund’s expanded role under the new TOB structure may increase its operational and regulatory risk. The new structure is substantially similar to the previous structure; however, pursuant to the Volcker Rule, the remarketing agent would not be able to repurchase tendered floaters for its own account upon a failed remarketing. In the event of a failed remarketing, a banking entity serving as liquidity provider may loan the necessary funds to the TOB Trust to purchase the tendered floaters. The TOB Trust, not the Fund, would be the borrower and the loan from the liquidity provider will be secured by the purchased floaters now held by the TOB Trust. However, as previously described, the Fund would bear the risk of loss with respect to any liquidity shortfall to the extent it entered into a reimbursement agreement with the liquidity provider.
Further, the SEC and various banking agencies recently adopted rules implementing credit risk retention requirements for asset-backed securities (the “Risk Retention Rules”). The Risk Retention Rules require the sponsor of a TOB Trust to retain at least 5% of the credit risk of the underlying assets supporting the TOB Trust’s municipal bonds. The Fund has adopted policies intended to comply with the Risk Retention Rules. The Risk Retention Rules may adversely affect the Fund’s ability to engage in TOB Trust transactions or increase the costs of such transactions in certain circumstances.
There can be no assurances that the new TOB structure will continue to be a viable form of leverage. Further, there can be no assurances that alternative forms of leverage will be available to the Fund in order to maintain current levels of leverage. Any alternative forms of leverage may be less advantageous to the Fund, and may adversely affect the Fund’s net asset value, distribution rate and ability to achieve its investment objective.
TOBs are presently classified as private placement securities. Private placement securities are subject to restrictions on resale because they have not been registered under the Securities Act of 1933, as amended (the “1933 Act”), or are otherwise not readily marketable. As a result of the absence of a public trading market for these securities, they may be less liquid than publicly traded securities. Although atypical, these securities may be resold in privately negotiated transactions, the prices realized from these sales could be less than those originally paid by the Fund or less than what may be considered the fair value of such securities.
| K. | Futures Contracts — The Fund may enter into futures contracts to manage exposure to interest rate, equity and market price movements and/or currency risks. A futures contract is an agreement between two parties (“Counterparties”) to purchase or sell a specified underlying |
22 Invesco Short Duration High Yield Municipal Fund
| security, currency or commodity (or delivery of a cash settlement price, in the case of an index future) for a fixed price at a future date. The Fund currently invests only in exchange-traded futures and they are standardized as to maturity date and underlying financial instrument. Initial margin deposits required upon entering into futures contracts are satisfied by the segregation of specific securities or cash as collateral at the futures commission merchant (broker). During the period the futures contracts are open, changes in the value of the contracts are recognized as unrealized gains or losses by recalculating the value of the contracts on a daily basis. Subsequent or variation margin payments are received or made depending upon whether unrealized gains or losses are incurred. These amounts are reflected as receivables or payables on the Statement of Assets and Liabilities. When the contracts are closed or expire, the Fund recognizes a realized gain or loss equal to the difference between the proceeds from, or cost of, the closing transaction and the Fund’s basis in the contract. The net realized gain (loss) and the change in unrealized gain (loss) on futures contracts held during the period is included on the Statement of Operations. The primary risks associated with futures contracts are market risk and the absence of a liquid secondary market. If the Fund were unable to liquidate a futures contract and/or enter into an offsetting closing transaction, the Fund would continue to be subject to market risk with respect to the value of the contracts and continue to be required to maintain the margin deposits on the futures contracts. Futures contracts have minimal Counterparty risk since the exchange’s clearinghouse, as Counterparty to all exchange-traded futures, guarantees the futures against default. Risks may exceed amounts recognized in the Statement of Assets and Liabilities. |
| L. | Other Risks — The value of, payment of interest on, repayment of principal for and the ability to sell a municipal security may be affected by constitutional amendments, legislative enactments, executive orders, administrative regulations, voter initiatives and the economics of the regions in which the issuers are located. |
Since many municipal securities are issued to finance similar projects, especially those relating to education, health care, transportation and utilities, conditions in those sectors can affect the overall municipal securities market and the Fund’s investments in municipal securities.
There is some risk that a portion or all of the interest received from certain tax-free municipal securities could become taxable as a result of determinations by the Internal Revenue Service.
The Fund is non-diversified and may invest in securities of fewer issuers than if it were diversified. Thus, the value of the Fund’s shares may vary more widely and the Fund may be subject to greater market and credit risk than if the Fund invested more broadly.
| M. | Collateral — To the extent the Fund has designated or segregated a security as collateral and that security is subsequently sold, it is the Fund’s practice to replace such collateral no later than the next business day. |
NOTE 2—Advisory Fees and Other Fees Paid to Affiliates
The Trust has entered into a master investment advisory agreement with Invesco Advisers, Inc. (the “Adviser” or “Invesco”). Under the terms of the investment advisory agreement, the Fund accrues daily and pays monthly an advisory fee to the Adviser based on the annual rate of the Fund’s average daily net assets as follows:
| Average Daily Net Assets | Rate | |||
First $300 million | 0.50% | |||
Next $300 million | 0.46% | |||
Over $600 million | 0.42% | |||
For the year ended August 31, 2017, the effective advisory fees incurred by the Fund was 0.50%.
Under the terms of a master sub-advisory agreement between the Adviser and each of Invesco Asset Management Deutschland GmbH, Invesco Asset Management Limited, Invesco Asset Management (Japan) Limited, Invesco Hong Kong Limited, Invesco Senior Secured Management, Inc. and Invesco Canada Ltd. and separate sub-advisory agreements with Invesco PowerShares Capital Management LLC and Invesco Asset Management (India) Private Limited (collectively, the “Affiliated Sub-Advisers”) the Adviser, not the Fund, will pay 40% of the fees paid to the Adviser to any such Affiliated Sub-Adviser(s) that provide(s) discretionary investment management services to the Fund based on the percentage of assets allocated to such Affiliated Sub-Adviser(s).
The Adviser has contractually agreed, through at least April 30, 2018, to waive advisory fees and/or reimburse expenses to the extent necessary to limit total annual fund operating expenses after fee waiver and/or expense reimbursement (excluding certain items discussed below) of Class A, Class C, Class Y, Class R5 and Class R6 shares to 0.79%, 1.54%, 0.54%, 0.54% and 0.54%, respectively, of average daily net assets (the “expense limits”). In determining the Adviser’s obligation to waive advisory fees and/or reimburse expenses, the following expenses are not taken into account, and could cause total annual fund operating expenses after fee waiver and/or reimbursement to exceed the numbers reflected above: (1) interest, facilities and maintenance fees; (2) taxes; (3) dividend expense on short sales; (4) extraordinary or non-routine items, including litigation expenses; and (5) expenses that the Fund has incurred but did not actually pay because of an expense offset arrangement. Unless Invesco continues the fee waiver agreement, it will terminate on April 30, 2018. During its term, the fee waiver agreement cannot be terminated or amended to increase the expense limits or reduce the advisory fee waivers without approval of the Board of Trustees.
For the year ended August 31, 2017, the Adviser waived advisory fees of $245,267 and reimbursed class level expenses of $48,696, $24,324, $16,248, $32 and $4 of Class A, Class C, Class Y, Class R5 and Class R6 shares, respectively.
23 Invesco Short Duration High Yield Municipal Fund
The Trust has entered into a master administrative services agreement with Invesco pursuant to which the Fund has agreed to pay Invesco for certain administrative costs incurred in providing accounting services to the Fund. For the year ended August 31, 2017, expenses incurred under the agreement are shown in the Statement of Operations as Administrative services fees.
The Trust has entered into a transfer agency and service agreement with Invesco Investment Services, Inc. (“IIS”) pursuant to which the Fund has agreed to pay IIS a fee for providing transfer agency and shareholder services to the Fund and reimburse IIS for certain expenses incurred by IIS in the course of providing such services. IIS may make payments to intermediaries that provide omnibus account services, sub-accounting services and/or networking services. All fees payable by IIS to intermediaries that provide omnibus account services or sub-accounting services are charged back to the Fund, subject to certain limitations approved by the Trust’s Board of Trustees. For the year ended August 31, 2017, the expenses incurred under the agreement are shown in the Statement of Operations as Transfer agent fees.
The Trust has entered into master distribution agreements with Invesco Distributors, Inc. (“IDI”) to serve as the distributor for the Class A, Class C, Class Y, Class R5 and Class R6 shares of the Fund. The Trust has adopted plans pursuant to Rule 12b-1 under the 1940 Act with respect to the Fund’s Class A and Class C shares (collectively, the “Plans”). The Fund, pursuant to the Plans, pays IDI compensation at the annual rate of 0.25% of the Fund’s average daily net assets of Class A shares, 1.00% of the average daily net assets of Class C shares. The fees are accrued daily and paid monthly. Of the Plan payments, up to 0.25% of the average daily net assets of each class of shares may be paid to furnish continuing personal shareholder services to customers who purchase and own shares of such classes. Any amounts not paid as a service fee under the Plans would constitute an asset-based sales charge. Rules of the Financial Industry Regulatory Authority (“FINRA”) impose a cap on the total sales charges, including asset-based sales charges, that may be paid by any class of shares of the Fund. For the year ended August 31, 2017, expenses incurred under the Plans are shown in the Statement of Operations as Distribution fees.
Front-end sales commissions and CDSC (collectively, the “sales charges”) are not recorded as expenses of the Fund. Front-end sales commissions are deducted from proceeds from the sales of Fund shares prior to investment in Class A shares of the Fund. CDSC are deducted from redemption proceeds prior to remittance to the shareholder. During the year ended August 31, 2017, IDI advised the Fund that IDI retained $59,894 in front-end sales commissions from the sale of Class A shares and $27,557 and $920 from Class A and Class C shares, respectively, for CDSC imposed upon redemptions by shareholders.
Certain officers and trustees of the Trust are officers and directors of the Adviser, IIS and/or IDI.
NOTE 3—Additional Valuation Information
GAAP defines fair value as the price that would be received to sell an asset or paid to transfer a liability in an orderly transaction between market participants at the measurement date, under current market conditions. GAAP establishes a hierarchy that prioritizes the inputs to valuation methods, giving the highest priority to readily available unadjusted quoted prices in an active market for identical assets (Level 1) and the lowest priority to significant unobservable inputs (Level 3), generally when market prices are not readily available or are unreliable. Based on the valuation inputs, the securities or other investments are tiered into one of three levels. Changes in valuation methods may result in transfers in or out of an investment’s assigned level:
| Level 1 — | Prices are determined using quoted prices in an active market for identical assets. |
| Level 2 — | Prices are determined using other significant observable inputs. Observable inputs are inputs that other market participants may use in pricing a security. These may include quoted prices for similar securities, interest rates, prepayment speeds, credit risk, yield curves, loss severities, default rates, discount rates, volatilities and others. |
| Level 3 — | Prices are determined using significant unobservable inputs. In situations where quoted prices or observable inputs are unavailable (for example, when there is little or no market activity for an investment at the end of the period), unobservable inputs may be used. Unobservable inputs reflect the Fund’s own assumptions about the factors market participants would use in determining fair value of the securities or instruments and would be based on the best available information. |
The following is a summary of the tiered valuation input levels, as of August 31, 2017. The level assigned to the securities valuations may not be an indication of the risk or liquidity associated with investing in those securities. Because of the inherent uncertainties of valuation, the values reflected in the financial statements may materially differ from the value received upon actual sale of those investments.
The Fund’s policy is to recognize transfers in and out of the valuation levels as of the end of the reporting period. During the year ended August 31, 2017, there were no transfers between valuation levels.
| Level 1 | Level 2 | Level 3 | Total | |||||||||||||
Municipal Obligations | $ | — | $ | 148,546,821 | $ | — | $ | 148,546,821 | ||||||||
Investments Matured | 57,990 | — | 57,990 | |||||||||||||
| — | 148,604,811 | — | 148,604,811 | |||||||||||||
Futures Contracts* | (11,639 | ) | — | — | (11,639 | ) | ||||||||||
Total Investments | $ | (11,639 | ) | $ | 148,604,811 | $ | — | $ | 148,593,172 | |||||||
| * | Unrealized appreciation (depreciation). |
NOTE 4—Derivative Investments
The Fund may enter into an International Swaps and Derivatives Association Master Agreement (“ISDA Master Agreement”) under which a Fund may trade OTC derivatives. An OTC transaction entered into under an ISDA Master Agreement typically involves a collateral posting arrangement, payment netting provisions and close-out netting provisions. These netting provisions allow for reduction of credit risk through netting of contractual obligations. The enforceability of the netting provisions of the ISDA Master Agreement depends on the governing law of the ISDA Master Agreement, among other factors.
For financial reporting purposes, the Fund does not offset OTC derivative assets or liabilities that are subject to ISDA Master Agreements in the Statement of Assets and Liabilities.
24 Invesco Short Duration High Yield Municipal Fund
Value of Derivative Investments at Period-End
The table below summarizes the value of the Fund’s derivative investments, detailed by primary risk exposure, held as of August 31, 2017:
| Value | ||||
| Derivative Assets | Interest Rate Risk | |||
Unrealized appreciation on futures contracts — Exchange-Traded(a) | $ | 421 | ||
Derivatives not subject to master netting agreements | (421 | ) | ||
Total Derivative Assets subject to master netting agreements | $ | — | ||
| Value | ||||
| Derivative Liabilities | Interest Rate Risk | |||
Unrealized depreciation on futures contracts — Exchange-Traded(a) | $ | (12,060 | ) | |
Derivatives not subject to master netting agreements | 12,060 | |||
Total Derivative Liabilities subject to master netting agreements | $ | — | ||
| (a) | The daily variation margin receivable (payable) at period-end is recorded in the Statement of Assets and Liabilities. |
Effect of Derivative Investments for the year ended August 31, 2017
The table below summarizes the gains (losses) on derivative investments, detailed by primary risk exposure, recognized in earnings during the period:
| Location of Gain (Loss) on Statement of Operations | ||||
Interest Rate Risk | ||||
Realized Gain: | ||||
Futures contracts | $ | 62,558 | ||
Change in Net Unrealized Appreciation (Depreciation): | ||||
Futures contracts | (9,362 | ) | ||
Total | $ | 53,196 | ||
The table below summarizes the average notional value of futures contracts outstanding during the period.
Futures Contracts | ||||
Average notional value | $ | 4,386,144 | ||
NOTE 5—Expense Offset Arrangement(s)
The expense offset arrangement is comprised of transfer agency credits which result from balances in demand deposit accounts used by the transfer agent for clearing shareholder transactions. For the year ended August 31, 2017, the Fund received credits from this arrangement, which resulted in the reduction of the Fund’s total expenses of $144.
NOTE 6—Security Transactions with Affiliated Funds
The Fund is permitted to purchase or sell securities from or to certain other Invesco Funds under specified conditions outlined in procedures adopted by the Board of Trustees of the Trust. The procedures have been designed to ensure that any purchase or sale of securities by the Fund from or to another fund or portfolio that is or could be considered an affiliate by virtue of having a common investment adviser (or affiliated investment advisers), common Trustees and/or common officers complies with Rule 17a-7 of the 1940 Act. Further, as defined under the procedures, each transaction is effected at the current market price. Pursuant to these procedures, for the year ended August 31, 2017, the Fund engaged in securities purchases of $36,305,089 and securities sales of $37,033,030, which did not result in any net realized gains (losses).
NOTE 7—Trustees’ and Officers’ Fees and Benefits
Trustees’ and Officers’ Fees and Benefits include amounts accrued by the Fund to pay remuneration to certain Trustees and Officers of the Fund. Trustees have the option to defer compensation payable by the Fund, and Trustees’ and Officers’ Fees and Benefits also include amounts accrued by the Fund to fund such deferred compensation amounts. Those Trustees who defer compensation have the option to select various Invesco Funds in which their deferral accounts shall be deemed to be invested. Obligations under the deferred compensation plan represent unsecured claims against the general assets of the Fund.
25 Invesco Short Duration High Yield Municipal Fund
NOTE 8—Cash Balances and Borrowings
The Fund is permitted to temporarily carry a negative or overdrawn balance in its account with SSB, the custodian bank. Such balances, if any at period-end, are shown in the Statement of Assets and Liabilities under the payable caption Amount due custodian. To compensate the custodian bank for such overdrafts, the overdrawn Fund may either (1) leave funds as a compensating balance in the account so the custodian bank can be compensated by earning the additional interest; or (2) compensate by paying the custodian bank at a rate agreed upon by the custodian bank and Invesco, not to exceed the contractually agreed upon rate.
Inverse floating rate obligations resulting from the transfer of bonds to TOB Trusts are accounted for as secured borrowings. The average floating rate notes outstanding and average annual interest and fee rate related to inverse floating rate note obligations during the year ended August 31, 2017 were $1,166,667 and 1.50%, respectively.
NOTE 9—Distributions to Shareholders and Tax Components of Net Assets
Tax Character of Distributions to Shareholders Paid During the Fiscal Year Ended August 31, 2017 and the period September 30, 2015 (commencement date) through August 31, 2016:
| 2017 | September 30, 2015 (commencement date) through August 31, 2016 | |||||||
Ordinary income | $ | — | $ | 35,381 | ||||
Ordinary income — tax-exempt | 3,055,896 | 1,008,436 | ||||||
Total distributions | $ | 3,055,896 | $ | 1,043,817 | ||||
Tax Components of Net Assets at Period-End:
| 2017 | ||||
Undistributed tax-exempt income | $ | 340,621 | ||
Net unrealized appreciation — investments | 2,967,102 | |||
Temporary book/tax differences | (2,045 | ) | ||
Capital loss carryforward | (1,132,129 | ) | ||
Shares of beneficial interest | 140,843,364 | |||
Total net assets | $ | 143,016,913 | ||
The difference between book-basis and tax-basis unrealized appreciation (depreciation) is due to differences in the timing of recognition of gains and losses on investments for tax and book purposes. The Fund’s net unrealized appreciation difference is attributable primarily to wash sales and amortization differences.
The temporary book/tax differences are a result of timing differences between book and tax recognition of income and/or expenses. The Fund’s temporary book/tax differences are the result of the trustee deferral of compensation and retirement plan benefits.
Capital loss carryforward is calculated and reported as of a specific date. Results of transactions and other activity after that date may affect the amount of capital loss carryforward actually available for the Fund to utilize. The ability to utilize capital loss carryforward in the future may be limited under the Internal Revenue Code and related regulations based on the results of future transactions.
The Fund has a capital loss carryforward as of August 31, 2017, as follows:
| Capital Loss Carryforward* | ||||||||||||
| Expiration | Short-Term | Long-Term | Total | |||||||||
Not subject to expiration | $ | 1,132,129 | $ | — | $ | 1,132,129 | ||||||
| * | Capital loss carryforward as of the date listed above is reduced for limitations, if any, to the extent required by the Internal Revenue Code and may be further limited depending upon a variety of factors, including the realization of net unrealized gains or losses as of the date of any reorganization. |
NOTE 10—Investments Transactions
The aggregate amount of investment securities (other than short-term securities, U.S. Treasury obligations and money market funds, if any) purchased and sold by the Fund during the year ended August 31, 2017 was $111,760,438 and $41,298,301, respectively. Cost of investments, including any derivatives, on a tax basis includes the adjustments for financial reporting purposes as of the most recently completed federal income tax reporting period-end.
| Unrealized Appreciation (Depreciation) of Investments on a Tax Basis | ||||
Aggregate unrealized appreciation of investments | $ | 7,437,098 | ||
Aggregate unrealized (depreciation) of investments | (4,469,996 | ) | ||
Net unrealized appreciation of investments | $ | 2,967,102 | ||
Cost of investments for tax purposes is $145,626,070.
26 Invesco Short Duration High Yield Municipal Fund
NOTE 11—Reclassification of Permanent Differences
Primarily as a result of differing book/tax treatment of taxable income and federal income taxes paid, on August 31, 2017, undistributed net investment income was increased by $8,660, undistributed net realized gain (loss) was increased by $3,282 and shares of beneficial interest was decreased by $11,942. This reclassification had no effect on the net assets of the Fund.
NOTE 12—Share Information
| Summary of Share Activity | ||||||||||||||||
| Year ended August 31, 2017(a) | September 30, 2015 (commencement date) through August 31, 2016 | |||||||||||||||
| Shares | Amount | Shares | Amount | |||||||||||||
Sold: | ||||||||||||||||
Class A | 6,098,649 | $ | 62,554,873 | 4,567,824 | $ | 47,139,410 | ||||||||||
Class C | 2,704,207 | 27,954,467 | 2,167,850 | 22,488,153 | ||||||||||||
Class Y | 3,735,940 | 38,526,666 | 1,531,074 | 15,636,823 | ||||||||||||
Class R5 | — | — | 60,085 | 614,398 | ||||||||||||
Class R6(b) | 977 | 10,000 | — | — | ||||||||||||
Issued as reinvestment of dividends: | ||||||||||||||||
Class A | 140,267 | 1,445,350 | 32,976 | 345,424 | ||||||||||||
Class C | 59,535 | 611,914 | 14,597 | 152,748 | ||||||||||||
Class Y | 33,353 | 345,084 | 6,025 | 63,413 | ||||||||||||
Class R5 | 16 | 149 | 968 | 10,069 | ||||||||||||
Reacquired: | ||||||||||||||||
Class A | (3,148,153 | ) | (32,240,636 | ) | (680,611 | ) | (7,121,213 | ) | ||||||||
Class C | (1,353,267 | ) | (13,857,186 | ) | (232,071 | ) | (2,418,694 | ) | ||||||||
Class Y | (1,791,993 | ) | (18,479,052 | ) | (222,802 | ) | (2,354,259 | ) | ||||||||
Class R5 | (3,246 | ) | (34,006 | ) | (55,112 | ) | (581,967 | ) | ||||||||
Net increase in share activity | 6,476,285 | $ | 66,837,623 | 7,190,803 | $ | 73,974,305 | ||||||||||
| (a) | There are entities that are record owners of more than 5% of the outstanding shares of the Fund and in the aggregate own 71% of the outstanding shares of the Fund. IDI has an agreement with these entities to sell Fund shares. The Fund, Invesco and/or Invesco affiliates may make payments to these entities, which are considered to be related to the Fund, for providing services to the Fund, Invesco and/or Invesco affiliates including but not limited to services such as securities brokerage, distribution, third party record keeping and account servicing. The Fund has no knowledge as to whether all or any portion of the shares owned of record by these entities are also owned beneficially. |
| (b) | Commencement date of April 4, 2017. |
27 Invesco Short Duration High Yield Municipal Fund
NOTE 13—Financial Highlights
The following schedule presents financial highlights for a share of the Fund outstanding throughout the periods indicated.
| Net asset value, beginning of period | Net investment income(a) | Net gains (losses) on securities (both realized and unrealized) | Total from investment operations | Dividends from net investment income | Net asset value, end of period | Total return(b) | Net assets, end of period (000’s omitted) | Ratio of net assets | Ratio of expenses to average net assets without fee waivers and/or expenses absorbed | Supplemental ratio net assets | Ratio of net to average | Portfolio turnover(c) | ||||||||||||||||||||||||||||||||||||||||
Class A |
| |||||||||||||||||||||||||||||||||||||||||||||||||||
Year ended 08/31/17 | $ | 10.60 | $ | 0.37 | $ | (0.16 | ) | $ | 0.21 | $ | (0.34 | ) | $ | 10.47 | 2.08 | % | $ | 73,384 | 0.82 | %(d) | 1.16 | %(d) | 0.80 | %(d) | 3.65 | %(d) | 42 | % | ||||||||||||||||||||||||
Year ended 08/31/16(e) | 10.00 | 0.35 | 0.50 | 0.85 | (0.25 | ) | 10.60 | 8.61 | 41,561 | 0.79 | (f) | 1.47 | (f) | — | 3.64 | (f) | 69 | |||||||||||||||||||||||||||||||||||
Class C |
| |||||||||||||||||||||||||||||||||||||||||||||||||||
Year ended 08/31/17 | 10.58 | 0.30 | (0.17 | ) | 0.13 | (0.26 | ) | 10.45 | 1.32 | 35,114 | 1.57 | (d) | 1.91 | (d) | 1.55 | (d) | 2.90 | (d) | 42 | |||||||||||||||||||||||||||||||||
Year ended 08/31/16(e) | 10.00 | 0.28 | 0.49 | 0.77 | (0.19 | ) | 10.58 | 7.81 | 20,641 | 1.54 | (f) | 2.22 | (f) | — | 2.89 | (f) | 69 | |||||||||||||||||||||||||||||||||||
Class Y |
| |||||||||||||||||||||||||||||||||||||||||||||||||||
Year ended 08/31/17 | 10.61 | 0.40 | (0.16 | ) | 0.24 | (0.37 | ) | 10.48 | 2.34 | 34,480 | 0.57 | (d) | 0.91 | (d) | 0.55 | (d) | 3.90 | (d) | 42 | |||||||||||||||||||||||||||||||||
Year ended 08/31/16(e) | 10.00 | 0.37 | 0.51 | 0.88 | (0.27 | ) | 10.61 | 8.91 | 13,943 | 0.54 | (f) | 1.22 | (f) | — | 3.89 | (f) | 69 | |||||||||||||||||||||||||||||||||||
Class R5 |
| |||||||||||||||||||||||||||||||||||||||||||||||||||
Year ended 08/31/17 | 10.61 | 0.40 | (0.16 | ) | 0.24 | (0.37 | ) | 10.48 | 2.34 | 28 | 0.57 | (d) | 0.92 | (d) | 0.55 | (d) | 3.90 | (d) | 42 | |||||||||||||||||||||||||||||||||
Year ended 08/31/16(e) | 10.00 | 0.37 | 0.51 | 0.88 | (0.27 | ) | 10.61 | 8.91 | 63 | 0.54 | (f) | 1.20 | (f) | — | 3.89 | (f) | 69 | |||||||||||||||||||||||||||||||||||
Class R6 |
| |||||||||||||||||||||||||||||||||||||||||||||||||||
Year ended 08/31/17(e) | 10.24 | 0.17 | 0.22 | 0.39 | (0.15 | ) | 10.48 | 3.87 | 10 | 0.56 | (d)(f) | 0.88 | (d)(f) | 0.54 | (d)(f) | 3.91 | (d)(f) | 42 | ||||||||||||||||||||||||||||||||||
| (a) | Calculated using average shares outstanding. |
| (b) | Includes adjustments in accordance with accounting principles generally accepted in the United States of America and as such, the net asset value for financial reporting purposes and the returns based upon those net asset values may differ from the net asset value and returns for shareholder transactions. Does not include sales charges and is not annualized for periods less than one year, if applicable. |
| (c) | Portfolio turnover is calculated at the fund level and is not annualized for periods less than one year, if applicable. |
| (d) | Ratios are based on average daily net assets (000’s omitted) of $53,562, $26,755, $17,872, $32 and $10 for Class A, Class C, Class Y, Class R5 and Class R6 shares, respectively. |
| (e) | Commencement date of September 30, 2015 for Class A, Class C, Class Y and Class R5 shares and April 4, 2017 for Class R6 shares, respectively. |
| (f) | Annualized. |
28 Invesco Short Duration High Yield Municipal Fund
Report of Independent Registered Public Accounting Firm
To the Board of Trustees of AIM Counselor Series Trust (Invesco Counselor Series Trust)
and Shareholders of Invesco Short Duration High Yield Municipal Fund:
In our opinion, the accompanying statement of assets and liabilities, including the schedule of investments, and the related statements of operations and of changes in net assets and the financial highlights present fairly, in all material respects, the financial position of Invesco Short Duration High Yield Municipal Fund (one of the portfolios constituting AIM Counselor Series Trust (Invesco Counselor Series Trust), hereafter referred to as the “Fund”) as of August 31, 2017, the results of its operations for the year then ended, the changes in its net assets for the year then ended and the period September 30, 2015 (commencement of investment operations) through August 31, 2016 and the financial highlights for each of the periods indicated therein, in conformity with accounting principles generally accepted in the United States of America. These financial statements and financial highlights (hereafter referred to as “financial statements”) are the responsibility of the Fund’s management. Our responsibility is to express an opinion on these financial statements based on our audit. We conducted our audit of these financial statements in accordance with the standards of the Public Company Accounting Oversight Board (United States). Those standards require that we plan and perform the audit to obtain reasonable assurance about whether the financial statements are free of material misstatement. An audit includes examining, on a test basis, evidence supporting the amounts and disclosures in the financial statements, assessing the accounting principles used and significant estimates made by management, and evaluating the overall financial statement presentation. We believe that our audit, which included confirmation of securities as of August 31, 2017 by correspondence with the custodian and brokers, and when replies were not received from brokers, we performed other auditing procedures, provides a reasonable basis for our opinion.
PricewaterhouseCoopers LLP
Houston, Texas
October 30, 2017
29 Invesco Short Duration High Yield Municipal Fund
Calculating your ongoing Fund expenses
Example
As a shareholder of the Fund, you incur two types of costs: (1) transaction costs, which may include sales charges (loads) on purchase payments or contingent deferred sales charges on redemptions, if any; and (2) ongoing costs, including management fees, distribution and/or service (12b-1) fees, and other Fund expenses. This example is intended to help you understand your ongoing costs (in dollars) of investing in the Fund and to compare these costs with ongoing costs of investing in other mutual funds. With the exception of the actual ending account value and expenses of the Class R6 shares, the example is based on an investment of $1,000 invested at the beginning of the period and held for the entire period March 1, 2017 through August 31, 2017. The actual ending account value and expenses of the Class R6 shares in the example below are based on an investment of $1,000 invested as of close of business April 4, 2017 (commencement date) and held through August 31, 2017.
Actual expenses
The table below provides information about actual account values and actual expenses. You may use the information in this table, together with the amount you invested, to estimate the expenses that you paid over the period. Simply divide your account value by $1,000 (for example, an $8,600 account value divided by $1,000 = 8.6), then multiply the result by the number in the table under the heading entitled “Actual Expenses Paid During Period” to estimate the expenses you paid on your account during this period (as of close of business April 4, 2017 through August 31, 2017 for the Class R6 shares). Because the actual ending account value and expense information in the example is not based upon a six month period for the Class R6 shares, the ending account value and expense information may not provide a meaningful comparison to mutual funds that provide such information for a full six month period.
Hypothetical example for comparison purposes
The table below also provides information about hypothetical account values and hypothetical expenses based on the Fund’s actual expense ratio and an assumed rate of return of 5% per year before expenses, which is not the Fund’s actual return.
The hypothetical account values and expenses may not be used to estimate the actual ending account balance or expenses you paid for the period. You may use this information to compare the ongoing costs of investing in the Fund and other funds. To do so, compare this 5% hypothetical example with the 5% hypothetical examples that appear in the shareholder reports of the other funds.
Please note that the expenses shown in the table are meant to highlight your ongoing costs only and do not reflect any transaction costs, such as sales charges (loads) on purchase payments or contingent deferred sales charges on redemptions, if any. Therefore, the hypothetical information is useful in comparing ongoing costs only, and will not help you determine the relative total costs of owning different funds. In addition, if these transaction costs were included, your costs would have been higher.
| Class | Beginning Account Value (03/01/17) | ACTUAL | HYPOTHETICAL (5% annual return before expenses) | Annualized Expense Ratio | ||||||||||||||||||||
| Ending Account Value (08/31/17)1 | Expenses Paid During Period2 | Ending Account Value (08/31/17) | Expenses Paid During Period3 | |||||||||||||||||||||
A | $ | 1,000.00 | $ | 1,045.60 | $ | 4.23 | $ | 1,021.07 | $ | 4.18 | 0.82 | % | ||||||||||||
C | 1,000.00 | 1,040.80 | 8.08 | 1,017.29 | 7.98 | 1.57 | ||||||||||||||||||
Y | 1,000.00 | 1,045.90 | 2.94 | 1,022.33 | 2.91 | 0.57 | ||||||||||||||||||
R5 | 1,000.00 | 1,045.90 | 2.94 | 1,022.33 | 2.91 | 0.57 | ||||||||||||||||||
R6 | 1,000.00 | 1,038.70 | 2.35 | 1,022.38 | 2.85 | 0.56 | ||||||||||||||||||
| 1 | The actual ending account value is based on the actual total return of the Fund for the period March 1, 2017 through August 31, 2017 (as of close of business April 4, 2017 through August 31, 2017 for the Class R6 shares), after actual expenses and will differ from the hypothetical ending account value which is based on the Fund’s expense ratio and a hypothetical annual return of 5% before expenses. |
| 2 | Actual expenses are equal to the Fund’s annualized expense ratio as indicated above multiplied by the average account value over the period, multiplied by 184/365 to reflect the most recent fiscal half year. For the Class R6 shares actual expenses are equal to the annualized expense ratio indicated above multiplied by the average account value over the period, multiplied by 150 (as of close of business April 4, 2017 through August 31, 2017)/365. Because the Class R6 shares have not been in existence for a full six month period, the actual ending account value and expense information shown may not provide a meaningful comparison to fund expense information of classes that show such data for a full six month period and, because the actual ending account value and expense information in the expense example covers a short time period, return and expense data may not be indicative of return and expense data for longer time periods. |
| 3 | Hypothetical expenses are equal to the annualized expense ratio indicated above multiplied by the average account value over the period, multiplied by 184/365 to reflect a one-half year period. The hypothetical ending account value and expenses may be used to compare ongoing costs of investing in Class R6 shares of the Fund and other funds because such data is based on a full six month period. |
30 Invesco Short Duration High Yield Municipal Fund
Approval of Investment Advisory and Sub-Advisory Contracts
The Board of Trustees (the Board) of AIM Counselor Series Trust (Invesco Counselor Series Trust) (the Company) is required under the Investment Company Act of 1940, as amended, to approve the Invesco Short Duration High Yield Municipal Fund’s (the Fund) investment advisory agreements. During contract renewal meetings held on June 12-13, 2017, the Board as a whole, and the disinterested or “independent” Trustees, who comprise over 75% of the Board, voting separately, approved the continuance for the Fund of the Master Investment Advisory Agreement with Invesco Advisers, Inc. (Invesco Advisers and the investment advisory agreement) and the Master Intergroup Sub-Advisory Contract for Mutual Funds with Invesco Asset Management Deutschland GmbH, Invesco Asset Management Limited, Invesco Asset Management (Japan) Limited, Invesco Hong Kong Limited, Invesco Senior Secured Management, Inc. and Invesco Canada Ltd. and separate Sub-Advisory Contracts with Invesco PowerShares Capital Management LLC and Invesco Asset Management (India) Private Limited (collectively, the Affiliated Sub-Advisers and the sub-advisory contracts) for another year, effective July 1, 2017.
In evaluating the fairness and reasonableness of compensation under the Fund’s investment advisory agreement and sub-advisory contracts, the Board considered, among other things, the factors discussed below. The Board determined that continuation of the Fund’s investment advisory agreement and the sub-advisory contracts is in the best interest of the Fund and its shareholders and that the compensation payable to Invesco Advisers and the Affiliated Sub-Advisers under the agreements is fair and reasonable.
The Board’s Fund Evaluation Process
The Board’s Investments Committee has established three Sub-Committees, which meet throughout the year to review the performance of funds advised by Invesco Advisers (the Invesco Funds). Over the course of each year, the Sub-Committees meet with portfolio managers for their assigned Invesco Funds and other members of management to review the performance, investment objective(s), policies, strategies, limitations and investment risks of these funds. The Board had the benefit of reports from the Sub-Committees and Investments Committee throughout the year in considering approval of the continuance of each Invesco Fund’s investment advisory agreement and sub-advisory contracts for another year.
During the contract renewal process, the Board receives comparative performance and fee data regarding the Invesco Funds prepared by Invesco Advisers and Broadridge Financial Solutions, Inc. (Broadridge), an independent provider of investment company data. The
Board also receives an independent written evaluation from the Senior Officer, an officer of the Invesco Funds who reports directly to the independent Trustees. The Senior Officer’s evaluation is prepared as part of his responsibility to manage the process by which the Invesco Funds’ proposed management fees are negotiated during the annual contract renewal process to ensure they are negotiated in a manner that is at arms’ length and reasonable. In addition to meetings with Invesco Advisers and fund counsel, the independent Trustees also discuss the continuance of the investment advisory agreement and sub-advisory contracts in separate sessions with the Senior Officer and with independent legal counsel.
The Trustees recognized that the advisory fee rates for the Invesco Funds are, in most cases, the result of years of review and negotiation. The Trustees’ deliberations and conclusions in a particular year may be based in part on their deliberations and conclusions regarding these arrangements throughout the year and in prior years. The Trustees’ review and conclusions are based on the comprehensive consideration of all information presented to them and are not the result of any single determinative factor. Moreover, one Trustee may have weighed a particular piece of information or factor differently than another Trustee.
The discussion below is a summary of the Senior Officer’s independent written evaluation with respect to the Fund’s investment advisory agreement as well as a discussion of the material factors and related conclusions that formed the basis for the Board’s approval of the Fund’s investment advisory agreement and sub-advisory contracts. This information is current as of June 13, 2017, and does not reflect consideration of factors that became known to the Board after that date.
Factors and Conclusions and Summary of Independent Written Fee Evaluation
| A. | Nature, Extent and Quality of Services Provided by Invesco Advisers and the Affiliated Sub-Advisers |
The Board reviewed the advisory services provided to the Fund by Invesco Advisers under the Fund’s investment advisory agreement, the performance of Invesco Advisers in providing these services, and the credentials and experience of the officers and employees of Invesco Advisers who provide these services, including the Fund’s portfolio manager or managers. The Board’s review included consideration of Invesco Advisers’ investment process oversight, credit analysis and investment risk management. The Board also considered non-advisory services that Invesco Advisers and its affiliates provide to the Invesco Funds such as various back office support
functions, trading operations, internal audit, valuation and legal and compliance.
In determining whether to continue the Fund’s investment advisory agreement, the Board considered the benefits of reapproving an existing relationship as contrasted with the greater uncertainty that may be associated with entering into a new relationship. The Board concluded that the nature, extent and quality of the services provided to the Fund by Invesco Advisers are appropriate and satisfactory.
The Board reviewed the services that may be provided by the Affiliated Sub-Advisers under the sub-advisory contracts and the credentials and experience of the officers and employees of the Affiliated Sub-Advisers who provide these services. The Board noted that the Affiliated Sub-Advisers have offices and personnel that are located in financial centers around the world. As a result, the Board noted that the Affiliated Sub-Advisers can provide research and investment analysis on the markets and economies of various countries in which the Fund may invest, make recommendations regarding securities and assist with security trades. The Board concluded that the sub-advisory contracts may benefit the Fund and its shareholders by permitting Invesco Advisers to use the resources and talents of the Affiliated Sub-Advisers in managing the Fund. The Board concluded that the nature, extent and quality of the services that may be provided by the Affiliated Sub-Advisers are appropriate and satisfactory.
| B. | Fund Investment Performance |
The Board noted that although the Fund had one calendar year of performance as of December 31, 2016, as of its current Prospectus dated December 16, 2016, it still had less than one year of performance. Therefore, materials prepared by Broadridge were not available.
| C. | Advisory and Sub-Advisory Fees and Fee Waivers |
Board compared the Fund’s expense ratio after fee waivers and expense limitations to the industry median expense ratio for funds in the Lipper High Yield Municipal Debt Funds classification as provided by Invesco Advisers. The Board noted that the fee rate for Class A shares of the Fund was below the median contractual management fee rate of funds in the Lipper classification.
The Board noted that Invesco Advisers has contractually agreed to waive fees and/or limit expenses of the Fund through at least April 30, 2018 in an amount necessary to limit total annual operating expenses to a specified percentage of average daily net assets for each class of the Fund.
The Board compared the Fund’s effective advisory fee rate (the advisory fee rate after advisory fee waivers and before other expense limitations/waivers) to the effective advisory fee
31 Invesco Short Duration High Yield Municipal Fund
rates of other funds advised by Invesco Advisers and its affiliates with investment strategies comparable to those of the Fund, based on balances as of December 31, 2016. The Board noted that the Fund’s rate was below the rate of one closed-end fund and of one open-end fund.
The Board noted that Invesco Advisers and the Affiliated Sub-Advisers do not manage other client accounts with investment strategies comparable to those of the Fund.
The Board also considered the services that may be provided by the Affiliated Sub-Advisers pursuant to the sub-advisory contracts, as well as the fees payable by Invesco Advisers to the Affiliated Sub-Advisers pursuant to the sub-advisory contracts. The Board also noted that the sub-advisory fees are not paid directly by the Fund, but rather, are payable by Invesco Advisers to the Affiliated Sub-Advisers.
| D. | Economies of Scale and Breakpoints |
The Board considered the extent to which there are economies of scale in the provision of advisory services to the Fund. The Board also considered that the Fund may benefit from economies of scale through contractual breakpoints in the Fund’s advisory fee schedule. The Board noted that the Fund shares directly in economies of scale through lower fees charged by third party service providers based on the combined size of the Invesco Funds advised by Invesco Advisers.
| E. | Profitability and Financial Resources |
The Board reviewed information from Invesco Advisers concerning the costs of the advisory and other services that Invesco Advisers and its affiliates provide to the Fund and the Invesco Funds and the profitability of Invesco Advisers and its affiliates in providing these services. The Board noted that Invesco Advisers continues to operate at a net profit from services Invesco Advisers and its affiliates provide to the Invesco Funds. The Board noted that although Invesco Advisers made a profit from advising the Fund, the Fund, on the whole, had not yet become profitable. The Board received and accepted information from Invesco Advisers demonstrating that Invesco Advisers and each Affiliated Sub-Adviser are financially sound and have the resources necessary to perform their obligations under the investment advisory agreement and sub-advisory contracts.
| F. | Collateral Benefits to Invesco Advisers and its Affiliates |
The Board considered various other benefits received by Invesco Advisers and its affiliates from the relationship with the Fund, including the fees received for providing transfer agency and distribution services to the Fund. The Board considered comparative information regarding fees charged for these services, including information provided by Broadridge and other independent sources. The Board considered the performance of Invesco Advisers and its affiliates in providing these services and the organizational structure employed to provide these services. The Board also considered that these services are provided to the Fund pursuant to written contracts that are reviewed
and approved on an annual basis by the Board; and that the services are required for the operation of the Fund.
The Board considered the benefits realized by Invesco Advisers and the Affiliated Sub-Advisers as a result of portfolio brokerage transactions executed through “soft dollar” arrangements. Invesco Advisers noted that the Fund does not execute brokerage transactions through “soft dollar” arrangements to any significant degree.
The Board considered that the Fund’s uninvested cash and cash collateral from any securities lending arrangements may be invested in money market funds advised by Invesco Advisers pursuant to procedures approved by the Board. The Board noted that Invesco Advisers receives advisory fees from these affiliated money market funds attributable to such investments, although Invesco Advisers has contractually agreed to waive through varying periods the advisory fees payable by the Invesco Funds with respect to certain investments in the affiliated money market funds. The waiver is in an amount equal to 100% of the net advisory fee Invesco Advisers receives from the affiliated money market funds with respect to the Fund’s investment in the affiliated money market funds of uninvested cash, but not cash collateral. The Board concluded that the amount of advisory fees received by Invesco Advisers from the Fund’s investment of cash collateral from any securities lending arrangements in the affiliated money market funds is fair and reasonable.
32 Invesco Short Duration High Yield Municipal Fund
Tax Information
Form 1099-DIV, Form 1042-S and other year-end tax information provide shareholders with actual calendar year amounts that should be included in their tax returns. Shareholders should consult their tax advisors.
The following distribution information is being provided as required by the Internal Revenue Code or to meet a specific state’s requirement.
The Fund designates the following amounts or, if subsequently determined to be different, the maximum amount allowable for its fiscal year ended August 31, 2017:
Federal and State Income Tax | ||||
Qualified Dividend Income* | 0 | % | ||
Corporate Dividends Received Deduction* | 0 | % | ||
U.S. Treasury Obligations* | 0 | % | ||
Tax-Exempt Interest Dividends* | 100 | % | ||
| * | The above percentages are based on ordinary income dividends paid to shareholders during the Fund’s fiscal year. |
33 Invesco Short Duration High Yield Municipal Fund
Proxy Results
A Special Joint Meeting (“Meeting”) of Shareholders of Invesco Short Duration High Yield Municipal Fund, an investment portfolio of AIM Counselor Series Trust (Invesco Counselor Series Trust), a Delaware statutory trust (“Trust”), was held on March 9, 2017. The Meeting was held for the following purposes:
| (1) | Elect 15 trustees to the Board, each of whom will serve until his or her successor is elected and qualified. |
| (2) | Approve an amendment to the Trust’s Agreement and Declaration of Trust that would permit fund mergers and other significant transactions upon the Board’s approval but without shareholder approval of such transactions. |
The results of the voting on the above matters were as follows:
| Matters | Votes For | Votes Withheld | ||||||||||||||||
| (1)* | David C. Arch | 1,425,647,604 | 36,521,875 | |||||||||||||||
| James T. Bunch | 1,425,181,099 | 36,988,380 | ||||||||||||||||
| Bruce L. Crockett | 1,425,174,694 | 36,994,785 | ||||||||||||||||
| Jack M. Fields | 1,426,060,874 | 36,108,605 | ||||||||||||||||
| Martin L. Flanagan | 1,426,481,477 | 35,688,002 | ||||||||||||||||
| Cynthia Hostetler | 1,426,489,972 | 35,679,505 | ||||||||||||||||
| Dr. Eli Jones | 1,426,255,832 | 35,913,647 | ||||||||||||||||
| Dr. Prema Mathai-Davis | 1,425,363,789 | 36,805,689 | ||||||||||||||||
| Teresa M. Ressel | 1,426,514,880 | 35,654,598 | ||||||||||||||||
| Dr. Larry Soll | 1,424,932,245 | 37,237,234 | ||||||||||||||||
| Ann Barnett Stern | 1,426,260,049 | 35,909,429 | ||||||||||||||||
| Raymond Stickel, Jr. | 1,425,391,657 | 36,777,822 | ||||||||||||||||
| Philip A. Taylor | 1,426,285,212 | 35,884,267 | ||||||||||||||||
| Robert C. Troccoli | 1,426,075,097 | 36,094,382 | ||||||||||||||||
| Christopher L. Wilson | 1,426,594,956 | 35,574,523 | ||||||||||||||||
| Votes For | Votes Against | Votes Abstain | Broker Non-Votes | |||||||||||||||
| (2)* | Approve an amendment to the Trust’s Agreement and Declaration of Trust that would permit fund mergers and other significant transactions upon the Board’s approval but without shareholder approval of such transactions | 751,302,707 | 79,810,344 | 41,561,890 | 589,495,482 | |||||||||||||
The Meeting was adjourned until April 11, 2017, with respect to the following proposals:
| (3) | Approve changing the fundamental investment restriction regarding the purchase or sale of physical commodities. |
| 4(b) | Approve an amendment to the current Master Intergroup Sub-Advisory Contract to add Invesco Asset Management (India) Private Limited. |
The results of the voting on the above matters were as follows:
| Matters | Votes For | Votes Against | Votes Abstain | Broker Non-Votes | ||||||||||||||
| (3) | Approve changing the fundamental investment restriction regarding the purchase or sale of physical commodities | 3,117,014 | 155,295 | 109,431 | 649,552 | |||||||||||||
| 4(b) | Approve an amendment to the current Master Intergroup Sub-Advisory Contract to add Invesco Asset Management (India) Private Limited | 3,149,983 | 124,852 | 106,905 | 649,552 | |||||||||||||
| * | Each of proposal 1 and 2 required approval by a combined vote of all of the portfolios of AIM Counselor Series Trust (Invesco Counselor Series Trust). |
34 Invesco Short Duration High Yield Municipal Fund
Trustees and Officers
The address of each trustee and officer is AIM Counselor Series Trust (Invesco Counselor Series Trust) (the “Trust”), 11 Greenway Plaza, Suite 1000, Houston, Texas 77046-1173. The trustees serve for the life of the Trust, subject to their earlier death, incapacitation, resignation, retirement or removal as more specifically provided in the Trust’s organizational documents. Each officer serves for a one year term or until their successors are elected and qualified. Column two below includes length of time served with predecessor entities, if any.
| Name, Year of Birth and Position(s) Held with the Trust | Trustee and/ or Officer Since | Principal Occupation(s) During Past 5 Years | Number of Overseen by | Other Directorship(s) Held by Trustee During Past 5 Years | ||||
| Interested Persons | ||||||||
| Martin L. Flanagan1 — 1960 Trustee | 2007 | Executive Director, Chief Executive Officer and President, Invesco Ltd. (ultimate parent of Invesco and a global investment management firm); Trustee, The Invesco Funds; Vice Chair, Investment Company Institute; and Member of Executive Board, SMU Cox School of Business
Formerly: Advisor to the Board, Invesco Advisers, Inc. (formerly known as Invesco Institutional (N.A.), Inc.); Chairman and Chief Executive Officer, Invesco Advisers, Inc. (registered investment adviser); Director, Chairman, Chief Executive Officer and President, Invesco Holding Company (US), Inc. (formerly IVZ Inc.) (holding company), Invesco Group Services, Inc. (service provider) and Invesco North American Holdings, Inc. (holding company); Director, Chief Executive Officer and President, Invesco Holding Company Limited (parent of Invesco and a global investment management firm); Director, Invesco Ltd.; Chairman, Investment Company Institute and President, Co-Chief Executive Officer, Co-President, Chief Operating Officer and Chief Financial Officer, Franklin Resources, Inc. (global investment management organization) | 144 | None | ||||
Philip A. Taylor2 — 1954 Trustee and Senior Vice President | 2006 | Head of the Americas and Senior Managing Director, Invesco Ltd.; Director, Invesco Advisers, Inc. (formerly known as Invesco Institutional (N.A.), Inc.) (registered investment adviser); Director, Chairman, Chief Executive Officer and President, Invesco Management Group, Inc. (formerly known as Invesco Aim Management Group, Inc.) (financial services holding company); Director and Chairman, Invesco Investment Services, Inc. (formerly known as Invesco Aim Investment Services, Inc.) (registered transfer agent); Chief Executive Officer, Invesco Corporate Class Inc. (corporate mutual fund company); Director, Chairman and Chief Executive Officer, Invesco Canada Ltd. (formerly known as Invesco Trimark Ltd./Invesco Trimark Ltèe) (registered investment adviser and registered transfer agent); Trustee and Senior Vice President, The Invesco Funds; Director, Invesco Investment Advisers LLC (formerly known as Van Kampen Asset Management).
Formerly: Co-Chairman, Co-President and Co-Chief Executive Officer, Invesco Advisers, Inc. (formerly known as Invesco Institutional (N.A.), Inc.) (registered investment adviser); Director, Chief Executive Officer and President, Van Kampen Exchange Corp; President and Principal Executive Officer, The Invesco Funds (other than AIM Treasurer’s Series Trust (Invesco Treasurer’s Series Trust), Short-Term Investments Trust and Invesco Management Trust); Executive Vice President, The Invesco Funds (AIM Treasurer’s Series Trust (Invesco Treasurer’s Series Trust), Short-Term Investments Trust and Invesco Management Trust only); Director and President, INVESCO Funds Group, Inc. (registered investment adviser and registered transfer agent); Director and Chairman, IVZ Distributors, Inc. (formerly known as INVESCO Distributors, Inc.) (registered broker dealer); Director, President and Chairman, Invesco Inc. (holding company), Invesco Canada Holdings Inc. (holding company), Trimark Investments Ltd./Placements Trimark Ltèe and Invesco Financial Services Ltd/Services Financiers Invesco Ltèe; Chief Executive Officer, Invesco Canada Fund Inc. (corporate mutual fund company); Director and Chairman, Van Kampen Investor Services Inc.; Director, Chief Executive Officer and President, 1371 Preferred Inc. (holding company) and Van Kampen Investments Inc.; Director and President, AIM GP Canada Inc. (general partner for limited partnerships) and Van Kampen Advisors, Inc.; Director and Chief Executive Officer, Invesco Trimark Dealer Inc. (registered broker dealer); Director, Invesco Distributors, Inc. (formerly known as Invesco Aim Distributors, Inc.) (registered broker dealer); Manager, Invesco PowerShares Capital Management LLC; Director, Chief Executive Officer and President, Invesco Advisers, Inc.; Director, Chairman, Chief Executive Officer and President, Invesco Aim Capital Management, Inc.; President, Invesco Trimark Dealer Inc. and Invesco Trimark Ltd./Invesco Trimark Ltèe; Director and President, AIM Trimark Corporate Class Inc. and AIM Trimark Canada Fund Inc.; Senior Managing Director, Invesco Holding Company Limited; Director and Chairman, Fund Management Company (former registered broker dealer); President and Principal Executive Officer, The Invesco Funds (AIM Treasurer’s Series Trust (Invesco Treasurer’s Series Trust), and Short-Term Investments Trust only); President, AIM Trimark Global Fund Inc. and AIM Trimark Canada Fund Inc. | 144 | None |
| 1 | Mr. Flanagan is considered an interested person (within the meaning of Section 2(a)(19) of the 1940 Act) of the Trust because he is an officer of the Adviser to the Trust, and an officer and a director of Invesco Ltd., ultimate parent of the Adviser. |
| 2 | Mr. Taylor is considered an interested person (within the meaning of Section 2(a)(19) of the 1940 Act) of the Trust because he is an officer and a director of the Adviser. |
T-1 Invesco Short Duration High Yield Municipal Fund
Trustees and Officers—(continued)
| Name, Year of Birth and Position(s) Held with the Trust | Trustee and/ or Officer Since | Principal Occupation(s) During Past 5 Years | Number of Complex Overseen by Trustee | Other Directorship(s) Held by Trustee During | ||||
| Independent Trustees | ||||||||
Bruce L. Crockett — 1944 Trustee and Chair | 2003 | Chairman, Crockett Technologies Associates (technology consulting company)
Formerly: Director, Captaris (unified messaging provider); Director, President and Chief Executive Officer, COMSAT Corporation; Chairman, Board of Governors of INTELSAT (international communications company); ACE Limited (insurance company); Independent Directors Council and Investment Company Institute: Member of the Audit Committee, Investment Company Institute; Member of the Executive Committee and Chair of the Governance Committee, Independent Directors Council | 144 | Director and Chairman of the Audit Committee, ALPS (Attorneys Liability Protection Society) (insurance company); Director and Member of the Audit Committee, Ferroglobe PLC (metallurgical company) | ||||
David C. Arch — 1945 Trustee | 2010 | Chairman of Blistex Inc. (consumer health care products manufacturer); Member, World Presidents’ Organization | 144 | Board member of the Illinois Manufacturers’ Association | ||||
James T. Bunch — 1942 Trustee | 2000 | Managing Member, Grumman Hill Group LLC (family office/private equity investments)
Formerly: Chairman of the Board, Denver Film Society; Chairman of the Board of Trustees, Evans Scholarship Foundation; Chairman, Board of Governors, Western Golf Association | 144 | Trustee, Evans Scholarship Foundation | ||||
Jack M. Fields — 1952 Trustee | 2003 | Chief Executive Officer, Twenty First Century Group, Inc. (government affairs company); and Discovery Learning Alliance (non-profit)
Formerly: Owner and Chief Executive Officer, Dos Angeles Ranch L.P. (cattle, hunting, corporate entertainment); Director, Insperity, Inc. (formerly known as Administaff); Chief Executive Officer, Texana Timber LP (sustainable forestry company); Director of Cross Timbers Quail Research Ranch (non-profit); and member of the U.S. House of Representatives | 144 | None | ||||
Cynthia Hostetler — 1962 Trustee | 2017 | Non-Executive Director and Trustee of a number of public and private business corporations
Formerly: Head of Investment Funds and Private Equity, Overseas Private Investment Corporation; President, First Manhattan Bancorporation, Inc.; Attorney, Simpson Thacher & Bartlett LLP | 144 | Vulcan Materials Company (construction materials company); Trilinc Global Impact Fund; Aberdeen Investment Funds (4 portfolios); Artio Global Investment LLC (mutual fund complex); Edgen Group, Inc. (specialized energy and infrastructure products distributor) | ||||
Eli Jones — 1961 Trustee | 2016 | Professor and Dean, Mays Business School — Texas A&M University
Formerly: Professor and Dean, Walton College of Business, University of Arkansas and E.J. Ourso College of Business, Louisiana State University; Director, Arvest Bank | 144 | Insperity, Inc. (formerly known as Administaff) (human resources provider) | ||||
Prema Mathai-Davis — 1950 Trustee | 2003 | Retired.
Formerly: Chief Executive Officer, YWCA of the U.S.A. | 144 | None | ||||
Teresa M. Ressel — 1962 Trustee | 2017 | Non-executive director and trustee of a number of public and private business corporations
Formerly: Chief Financial Officer, Olayan America, The Olayan Group (international investor/commercial/industrial); Chief Executive Officer, UBS Securities LLC; Group Chief Operating Officer, Americas, UBS AG; Assistant Secretary for Management & Budget and CFO, US Department of the Treasury; Chief Compliance Officer, Kaiser Permanente; Program Manager, Hewlett-Packard; Nuclear Engineering, General Dynamics Corporation | 144 | Atlantic Power Corporation (power generation company); ON Semiconductor Corp. (semiconductor supplier) | ||||
Larry Soll — 1942 Trustee | 1997 | Retired.
Formerly: Chairman, Chief Executive Officer and President, Synergen Corp. (a biotechnology company) | 144 | None | ||||
Ann Barnett Stern — 1957 Trustee | 2017 | President and Chief Executive Officer, Houston Endowment Inc. (private philanthropic institution)
Formerly: Executive Vice President and General Counsel, Texas Children’s Hospital; Attorney, Beck, Redden and Secrest, LLP; Business Law Instructor, University of St. Thomas; Attorney, Andrews & Kurth LLP | 144 | Federal Reserve Bank of Dallas | ||||
Raymond Stickel, Jr. — 1944 Trustee | 2005 | Retired.
Formerly: Director, Mainstay VP Series Funds, Inc. (25 portfolios); Partner, Deloitte & Touche | 144 | None | ||||
Robert C. Troccoli — 1949 Trustee | 2016 | Adjunct Professor, University of Denver — Daniels College of Business
Formerly: Senior Partner, KPMG LLP | 144 | None | ||||
Christopher L. Wilson — 1957 Trustee | 2017 | Managing Partner, CT2, LLC (investing and consulting firm)
Formerly: President/Chief Executive Officer, Columbia Funds, Bank of America Corporation; President/Chief Executive Officer, CDC IXIS Asset Management Services, Inc.; Principal & Director of Operations, Scudder Funds, Scudder, Stevens & Clark, Inc.; Assistant Vice President, Fidelity Investments | 144 | TD Asset Management USA Inc. (mutual fund complex) (22 portfolios); ISO New England, Inc. (non-profit organization managing regional electricity market) |
T-2 Invesco Short Duration High Yield Municipal Fund
Trustees and Officers—(continued)
| Name, Year of Birth and Position(s) Held with the Trust | Trustee and/ or Officer Since | Principal Occupation(s) During Past 5 Years | Number of Complex Overseen by Trustee | Other Directorship(s) Held by Trustee During | ||||
| Other Officers | ||||||||
Sheri Morris — 1964 President, Principal Executive Officer and Treasurer | 2003 | President, Principal Executive Officer and Treasurer, The Invesco Funds; Vice President, Invesco Advisers, Inc. (formerly known as Invesco Institutional (N.A.), Inc.) (registered investment adviser); and Vice President, PowerShares Exchange-Traded Fund Trust, PowerShares Exchange-Traded Fund Trust II, PowerShares India Exchange-Traded Fund Trust, PowerShares Actively Managed Exchange-Traded Fund Trust and PowerShares Actively Managed Exchange-Traded Commodity Fund Trust
Formerly: Vice President and Principal Financial Officer, The Invesco Funds; Vice President, Invesco Aim Advisers, Inc., Invesco Aim Capital Management, Inc. and Invesco Aim Private Asset Management, Inc.; Assistant Vice President and Assistant Treasurer, The Invesco Funds and Assistant Vice President, Invesco Advisers, Inc., Invesco Aim Capital Management, Inc. and Invesco Aim Private Asset Management, Inc.; and Treasurer, PowerShares Exchange-Traded Fund Trust, PowerShares Exchange-Traded Fund Trust II, PowerShares India Exchange-Traded Fund Trust and PowerShares Actively Managed Exchange-Traded Fund Trust | N/A | N/A | ||||
Russell C. Burk — 1958 Senior Vice President and Senior Officer | 2005 | Senior Vice President and Senior Officer, The Invesco Funds | N/A | N/A | ||||
John M. Zerr — 1962 Senior Vice President, Chief Legal Officer and Secretary | 2006 | Director, Senior Vice President, Secretary and General Counsel, Invesco Management Group, Inc. (formerly known as Invesco AIM Management Group, Inc.); Senior Vice President, Invesco Advisers, Inc. (formerly known as Invesco Institutional (N.A.), Inc.) (registered investment adviser); Senior Vice President and Secretary, Invesco Distributors, Inc. (formerly known as Invesco AIM Distributors, Inc.); Director, Vice President and Secretary, Invesco Investment Services, Inc. (formerly known as Invesco AIM Investment Services, Inc.) Senior Vice President, Chief Legal Officer and Secretary, The Invesco Funds; Managing Director, Invesco PowerShares Capital Management LLC; Director, Secretary and General Counsel, Invesco Investment Advisers LLC (formerly known as Van Kampen Asset Management); Secretary and General Counsel, Invesco Capital Markets, Inc. (formerly known as Van Kampen Funds Inc.) and Chief Legal Officer, PowerShares Exchange-Traded Fund Trust, PowerShares Exchange-Traded Fund Trust II, PowerShares India Exchange-Traded Fund Trust, PowerShares Actively Managed Exchange-Traded Fund Trust and PowerShares Actively Managed Exchange-Traded Commodity Fund Trust; Manager and Secretary, Invesco Indexing LLC
Formerly: Director, Secretary, General Counsel and Senior Vice President, Van Kampen Exchange Corp.; Director, Vice President and Secretary, IVZ Distributors, Inc. (formerly known as INVESCO Distributors, Inc.); Director and Vice President, INVESCO Funds Group, Inc.; Director and Vice President, Van Kampen Advisors Inc.; Director, Vice President, Secretary and General Counsel, Van Kampen Investor Services Inc.; Director, Invesco Distributors, Inc. (formerly known as Invesco AIM Distributors, Inc.); Director, Senior Vice President, General Counsel and Secretary, Invesco AIM Advisers, Inc. and Van Kampen Investments Inc.; Director, Vice President and Secretary, Fund Management Company; Director, Senior Vice President, Secretary, General Counsel and Vice President, Invesco AIM Capital Management, Inc.; Chief Operating Officer and General Counsel, Liberty Ridge Capital, Inc. (an investment adviser); Vice President and Secretary, PBHG Funds (an investment company) and PBHG Insurance Series Fund (an investment company); Chief Operating Officer, General Counsel and Secretary, Old Mutual Investment Partners (a broker-dealer); General Counsel and Secretary, Old Mutual Fund Services (an administrator) and Old Mutual Shareholder Services (a shareholder servicing center); Executive Vice President, General Counsel and Secretary, Old Mutual Capital, Inc. (an investment adviser); and Vice President and Secretary, Old Mutual Advisors Funds (an investment company) | N/A | N/A | ||||
Gregory G. McGreevey — 1962 Senior Vice President | 2012 | Senior Managing Director, Invesco Ltd.; Director, Chairman, President, and Chief Executive Officer, Invesco Advisers, Inc. (formerly known as Invesco Institutional (N.A.), Inc.) (registered investment adviser); Director, Invesco Mortgage Capital, Inc. and Invesco Senior Secured Management, Inc.; and Senior Vice President, The Invesco Funds
Formerly: Assistant Vice President, The Invesco Funds | N/A | N/A | ||||
Kelli Gallegos — 1970 Vice President, Principal Financial Officer and Assistant Treasurer | 2008 | Vice President, Principal Financial Officer and Assistant Treasurer, The Invesco Funds; Assistant Treasurer, Invesco PowerShares Capital Management LLC, PowerShares Exchange-Traded Fund Trust, PowerShares Exchange-Traded Fund Trust II, PowerShares India Exchange-Traded Fund Trust, PowerShares Actively Managed Exchange-Traded Fund Trust and PowerShares Actively Managed Exchange-Traded Commodity Fund Trust
Formerly: Assistant Vice President, The Invesco Funds | N/A | N/A |
T-3 Invesco Short Duration High Yield Municipal Fund
Trustees and Officers—(continued)
| Name, Year of Birth and Position(s) Held with the Trust | Trustee and/ or Officer Since | Principal Occupation(s) During Past 5 Years | Number of Complex Overseen by Trustee | Other Directorship(s) Held by Trustee During | ||||
| Other Officers—(continued) | ||||||||
Tracy Sullivan — 1962 Vice President, Chief Tax Officer and Assistant Treasurer | 2008 | Vice President, Chief Tax Officer and Assistant Treasurer, The Invesco Funds; Assistant Treasurer, Invesco PowerShares Capital Management LLC, PowerShares Exchange-Traded Fund Trust, PowerShares Exchange-Traded Fund Trust II, PowerShares India Exchange-Traded Fund Trust, PowerShares Actively Managed Exchange-Traded Fund Trust and PowerShares Actively Managed Exchange-Traded Commodity Fund Trust
Formerly: Assistant Vice President, The Invesco Funds | N/A | N/A | ||||
Crissie M. Wisdom — 1969 Anti-Money Laundering Compliance Officer | 2013 | Anti-Money Laundering Compliance Officer, Invesco Advisers, Inc. (formerly known as Invesco Institutional (N.A.), Inc.) (registered investment adviser), Invesco Capital Markets, Inc. (formerly known as Van Kampen Funds Inc.), Invesco Distributors, Inc., Invesco Investment Services, Inc., Invesco Management Group, Inc., The Invesco Funds, and PowerShares Exchange-Traded Fund Trust, PowerShares Exchange-Traded Fund Trust II, PowerShares India Exchange-Traded Fund Trust, PowerShares Actively Managed Exchange-Traded Fund Trust and PowerShares Actively Managed Exchange-Traded Commodity Fund Trust; Anti-Money Laundering Compliance Officer and Bank Secrecy Act Officer, INVESCO National Trust Company and Invesco Trust Company; and Fraud Prevention Manager and Controls and Risk Analysis Manager for Invesco Investment Services, Inc.
Formerly: Anti-Money Laundering Compliance Officer, Van Kampen Exchange Corp. | N/A | N/A | ||||
Robert R. Leveille — 1969 Chief Compliance Officer | 2016 | Chief Compliance Officer, Invesco Advisers, Inc. (registered investment adviser); and Chief Compliance Officer, The Invesco Funds
Formerly: Chief Compliance Officer, Putnam Investments and the Putnam Funds | N/A | N/A |
The Statement of Additional Information of the Trust includes additional information about the Fund’s Trustees and is available upon request, without charge, by calling 1.800.959.4246. Please refer to the Fund’s Statement of Additional Information for information on the Fund’s sub-advisers.
Office of the Fund 11 Greenway Plaza, Suite 1000 Houston, TX 77046-1173 | Investment Adviser Invesco Advisers, Inc. 1555 Peachtree Street, N.E. Atlanta, GA 30309 | Distributor Invesco Distributors, Inc. 11 Greenway Plaza, Suite 1000 Houston, TX 77046-1173 | Auditors PricewaterhouseCoopers LLP 1000 Louisiana Street, Suite 5800 Houston, TX 77002-5678 | |||
Counsel to the Fund Stradley Ronon Stevens & Young, LLP 2005 Market Street, Suite 2600 Philadelphia, PA 19103-7018 | Counsel to the Independent Trustees Goodwin Procter LLP 901 New York Avenue, N.W. Washington, D.C. 20001 | Transfer Agent Invesco Investment Services, Inc. 11 Greenway Plaza, Suite 1000 Houston, TX 77046-1173 | Custodian State Street Bank and Trust Company 225 Franklin Street Boston, MA 02110-2801 | |||
T-4 Invesco Short Duration High Yield Municipal Fund
Explore High-Conviction Investing with Invesco

Go paperless with eDelivery
Visit invesco.com/edelivery to enjoy the convenience and security of anytime electronic access to your investment documents.
With eDelivery, you can elect to have any or all of the following materials delivered straight to your inbox to download, save and print from your own computer:
∎ Fund reports and prospectuses
∎ Quarterly statements
∎ Daily confirmations
∎ Tax forms
Invesco mailing information
Send general correspondence to Invesco Investment Services, Inc., P.O. Box 219078, Kansas City, MO 64121-9078.
Important notice regarding delivery of security holder documents
To reduce Fund expenses, only one copy of most shareholder documents may be mailed to shareholders with multiple accounts at the same address (Householding). Mailing of your shareholder documents may be householded indefinitely unless you instruct us otherwise. If you do not want the mailing of these documents to be combined with those for other members of your household, please contact Invesco Investment Services, Inc. at 800 959 4246 or contact your financial institution. We will begin sending you individual copies for each account within 30 days after receiving your request.
Fund holdings and proxy voting information
The Fund provides a complete list of its holdings four times in each fiscal year, at the quarter ends. For the second and fourth quarters, the lists appear in the Fund’s semiannual and annual reports to shareholders. For the first and third quarters, the Fund files the lists with the Securities and Exchange Commission (SEC) on Form N-Q. The most recent list of portfolio holdings is available at invesco.com/completeqtrholdings. Shareholders can also look up the Fund’s Forms N-Q on the SEC website at sec.gov. Copies of the Fund’s Forms N-Q may be reviewed and copied at the SEC Public Reference Room in Washington, D.C. You can obtain information on the operation of the Public Reference Room, including information about duplicating fee charges, by calling 202 551 8090 or 800 732 0330, or by electronic request at the following email address: publicinfo@sec.gov. The SEC file numbers for the Fund are shown below.
A description of the policies and procedures that the Fund uses to determine how to vote proxies relating to portfolio securities is available without charge, upon request, from our Client Services department at 800 959 4246 or at invesco.com/proxyguidelines. The information is also available on the SEC website, sec.gov.
Information regarding how the Fund voted proxies related to its portfolio securities during the most recent 12-month period ended June 30 is available at invesco.com/proxysearch. The information is also available on the SEC website, sec.gov. Invesco Advisers, Inc. is an investment adviser; it provides investment advisory services to individual and institutional clients and does not sell securities. Invesco Distributors, Inc. is the US distributor for Invesco Ltd.’s retail mutual funds, exchange-traded funds and institutional money market funds. Both are wholly owned, indirect subsidiaries of Invesco Ltd. |
|

| SEC file numbers: 811-09913 and 333-36074 | Invesco Distributors, Inc. | SDHYM-AR-1 | 10162017 | 1000 | |||||||
| ||||
 | Annual Report to Shareholders
| August 31, 2017 | ||
Invesco Small Cap Discovery Fund | ||||
Nasdaq: A: VASCX ◾ B: VBSCX ◾ C: VCSCX ◾ Y: VISCX ◾ R5: VESCX ◾ R6: VFSCX | ||||

Letters to Shareholders
Philip Taylor | Dear Shareholders: This annual report includes information about your Fund, including performance data and a complete list of its investments as of the close of the reporting period. Inside is a discussion of how your Fund was managed and the factors that affected its performance during the reporting period. The reporting period began with stock market volatility in the US and abroad, largely the result of uncertainty about global economic growth and monetary policy. While economic data in the US were generally positive, news overseas was less upbeat. The European Central Bank and central banks in China and Japan – as well as other countries – maintained extraordinarily accommodative monetary policies in response to economic weakness. Citing generally positive economic data – specifically, realized and expected labor market conditions and inflation – the US Federal Reserve raised interest rates three times during the reporting period: in December 2016, and in March and June 2017. The major US stock market rally that began in November 2016 continued through | |
| the end of the reporting period, with major stock market indexes repeatedly hitting new record highs. | ||

Short-term market volatility can prompt some investors to abandon their investment plans – and can cause others to settle for whatever returns the market has to offer. The investment professionals at Invesco, in contrast, invest with high conviction. This means that, no matter the asset class or the strategy, each investment team has a passion to exceed. We want to help investors achieve better outcomes, such as seeking higher returns, helping mitigate risk and generating income. Of course, investing with high conviction can’t guarantee a profit or ensure success; no investment strategy can. To learn more about how we invest with high conviction, visit invesco.com/HighConviction.
You, too, can invest with high conviction by maintaining a long-term investment perspective and by working with your financial adviser on a regular basis. During periods of short-term market volatility or uncertainty, your financial adviser can keep you focused on your long-term investment goals – a new home, a child’s college education or a secure retirement. He or she also can share research about the economy, the markets and individual investment options.
Visit our website for more information on your investments
Our website, invesco.com/us, offers a wide range of market insights and investment perspectives. On the website, you’ll find detailed information about our funds, including performance, holdings and portfolio manager commentaries. You can access information about your account by completing a simple, secure online registration. To do so, select “Log In” on the right side of the homepage, and then select “Register for Individual Account Access.”
In addition to the resources accessible on our website and through our mobile app, you can obtain timely updates to help you stay informed about the markets and the economy by connecting with Invesco on Twitter, LinkedIn or Facebook. You can access our blog at blog.invesco.us.com. Our goal is to provide you the information you want, when and where you want it.
Finally, I’m pleased to share with you Invesco’s commitment to both the Principles for Responsible Investment and to considering environmental, social and governance issues in our robust investment process. I invite you to learn more at invesco.com/esg.
Have questions?
For questions about your account, contact an Invesco client services representative at 800 959 4246. For Invesco-related questions or comments, please email me directly at phil@invesco.com.
All of us at Invesco look forward to serving your investment management needs. Thank you for investing with us.
Sincerely,

Philip Taylor
Senior Managing Director, Invesco Ltd.
2 Invesco Small Cap Discovery Fund
Bruce Crockett | Dear Fellow Shareholders: Among the many important lessons I’ve learned in more than 40 years in a variety of business endeavors is the value of a trusted advocate. As independent chair of the Invesco Funds Board, I can assure you that the members of the Board are strong advocates for the interests of investors in Invesco’s mutual funds. We work hard to represent your interests through oversight of the quality of the investment management services your funds receive and other matters important to your investment, including but not limited to: ∎ Ensuring that Invesco offers a diverse lineup of mutual funds that your financial adviser can use to strive to meet your financial needs as your investment goals change over time. ∎ Monitoring how the portfolio management teams of the Invesco funds are performing in light of changing economic and market conditions. |

∎ Assessing each portfolio management team’s investment performance within the context of the investment strategy described in the fund’s prospectus.
∎ Monitoring for potential conflicts of interests that may impact the nature of the services that your funds receive.
We believe one of the most important services we provide our fund shareholders is the annual review of the funds’ advisory and sub-advisory contracts with Invesco Advisers and its affiliates. This review is required by the Investment Company Act of 1940 and focuses on the nature and quality of the services Invesco provides as the adviser to the Invesco funds and the reasonableness of the fees that it charges for those services. Each year, we spend months carefully reviewing information received from Invesco and a variety of independent sources, such as performance and fee data prepared by Lipper, Inc. (a subsidiary of Broadridge Financial Solutions, Inc.), an independent, third-party firm widely recognized as a leader in its field. We also meet with our independent legal counsel and other independent advisers to review and help us assess the information that we have received. Our goal is to assure that you receive quality investment management services for a reasonable fee.
I trust the measures outlined above provide assurance that you have a worthy advocate when it comes to choosing the Invesco Funds.
As always, please contact me at bruce@brucecrockett.com with any questions or concerns you may have. On behalf of the Board, we look forward to continuing to represent your interests and serving your needs.
Sincerely,

Bruce L. Crockett
Independent Chair
Invesco Funds Board of Trustees
3 Invesco Small Cap Discovery Fund
Management’s Discussion of Fund Performance
| Performance summary |
For the fiscal year ended August 31, 2017, Class A shares of Invesco Small Cap Discovery Fund (the Fund), at net asset value (NAV), outperformed the Russell 2000 Growth Index, the Fund’s style-specific benchmark.
Your Fund’s long-term performance appears later in this report.
Fund vs. Indexes
Total returns, 8/31/16 to 8/31/17, at net asset value (NAV). Performance shown does not include applicable contingent deferred sales charges (CDSC) or front-end sales charges, which would have reduced performance.
Class A Shares | 16.87 | % | ||
Class B Shares | 16.87 | |||
Class C Shares | 16.16 | |||
Class Y Shares | 17.25 | |||
Class R5 Shares | 17.30 | |||
Class R6 Shares | 17.49 | |||
S&P 500 Indexq (Broad Market Index) | 16.23 | |||
Russell 2000 Growth Indexq (Style-Specific Index) | 16.39 | |||
Lipper Small-Cap Growth Funds Index∎ (Peer Group Index) | 14.49 |
Source(s): qFactSet Research Systems Inc.; ∎Lipper Inc.
Market conditions and your Fund
The fiscal year began with major US stock market indexes posting gains, with most hitting record highs following the US presidential election. Investors seemed to believe that the new administration’s plans to reduce tax rates, scale back regulations and increase infrastructure spending had the potential to stimulate economic growth. However, that was called into question in the first quarter of 2017, when headlines out of Washing-ton, DC, suggested that enacting significant regulatory and tax reform might be more difficult than previously anticipated. Signs of an improving economy prompted the US Federal Reserve (Fed) to raise interest rates three times during the reporting period: in December 2016 and in March and June 2017. In the first quarter of 2017, the US economy grew at an anemic rate, with gross domestic product rising at an annualized rate of just 1.2%.1 However, the economy picked up steam during the second
quarter. Unemployment continued its years-long decline, hitting a 16-year low of 4.3% in the summer of 2017.2 US equities were strong throughout the reporting period, and major US equity market indexes hit new record highs during the summer.
While US stock market indexes rose for the reporting period, individual market sectors performed very differently from one another. Information technology (IT), financials and industrials were the strongest-performing sectors, while energy, telecommunication services and real estate were the weakest-performing sectors.
Within this environment, the Fund produced a double-digit return and outperformed its style-specific benchmark. Relative outperformance was led by positive stock selection in the IT, financials, materials and consumer discretionary sectors. On the negative side, the Fund underperformed in the health care, energy and industrials sectors.
The Fund outperformed its style-specific benchmark by the widest margin in the IT sector due to positive stock selection. Take-Two Interactive Software, an entertainment software developer, was the leading contributor to performance. The company benefited from strong financial results, primarily due to continued strong sales performance from Grand Theft Auto (GTA), a key holding in Take-Two’s portfolio. The GTA franchise continues to post healthy financial results with digital trends in both downloadable content and GTA online exceeding results. Real estate information and analytics provider CoStar Group contributed to performance as well. The company benefited not only from stronger-than-expected sales at both the Apartments. com and Loopnet product lines, but also better-than-expected margin trends.
Positive stock selection in the financials sector also contributed to the Fund’s performance relative to its style-specific benchmark. E*TRADE Financial was the leading contributor in the sector during the reporting period. E*TRADE was helped by better-than-expected first quarter 2017 results as the company showed acceleration in both asset gathering and client engagement trends. East West Bancorp also contributed to performance during the reporting period. We sold the holding in the second quarter of 2017 because the stock hit our price target and we saw better risk-reward elsewhere within the financials sector.
In contrast, the health care sector detracted from the Fund’s performance relative to its style-specific benchmark. Within the sector, stock performance varied widely, and the contribution to sector returns was concentrated in a relatively small number of securities. Not owning some of these stronger-performing stocks within the style-specific index led to lower relative performance. In
| Portfolio Composition | |||||
| By sector | % of total net assets | ||||
Information Technology | 29.7 | % | |||
Health Care | 21.8 | ||||
Industrials | 14.1 | ||||
Consumer Discretionary | 10.8 | ||||
Financials | 9.4 | ||||
Materials | 6.5 | ||||
Consumer Staples | 2.4 | ||||
Energy | 2.1 | ||||
Real Estate | 0.7 | ||||
Money Market Funds | |||||
Plus Other Assets Less Liabilities | 2.5 | ||||
| Top 10 Equity Holdings* | |||||
| % of total net assets | |||||
1. InterXion Holding N.V. | 1.9 | % | |||
2. INC Research Holdings, Inc. – Class A . | 1.9 | ||||
3. Take-Two Interactive Software, Inc. | 1.8 | ||||
4. E*TRADE Financial Corp. | 1.8 | ||||
5. MarketAxess Holdings, Inc. | 1.8 | ||||
6. Guidewire Software Inc. | 1.7 | ||||
7. CoStar Group Inc. | 1.6 | ||||
8. CBOE Holdings Inc. | 1.6 | ||||
9. Euronet Worldwide, Inc. | 1.6 | ||||
10. Wright Medical Group N.V. | 1.5 | ||||
Total Net Assets | $ | 587.5 million | ||
Total Number of Holdings* | 102 | |||
The Fund’s holdings are subject to change, and there is no assurance that the Fund will continue to hold any particular security.
*Excluding money market fund holdings.
Data presented here are as of August 31, 2017.
4 Invesco Small Cap Discovery Fund
..particular, Exact Sciences and Kite Pharmaceuticals performed strongly within the style-specific index, and not owning these holdings notably detracted from the Fund’s relative performance. On an absolute basis, Fund holdings within the health care sector produced strong double-digit returns and contributed to Fund performance during the reporting period.
Overweight exposure to the energy sector was also a detractor from the Fund’s performance relative to its style-specific benchmark. The energy sector was the worst-performing sector in the style-specific index as crude prices declined on concerns over increasing US energy supplies and fears that the OPEC cuts enacted in November 2016 would not be continued after June. Fund holdings were not immune to the decline in the sector; specifically Callon Petroleum and Gulfport Energy were notable detractors.
At the close of the reporting period, we anticipated a continuation of recent economic trends. Near-term economic growth could continue, albeit at relatively low rates. With US consumer and business confidence being strong, corporate profits remain healthy, and unemployment rates have fallen to multiyear lows. We expect that the Fed will continue to gradually and prudently raise short-term rates. Given this scenario, we are seeking opportunities in companies that are taking share within their respective industries, and we continue to prudently balance the Fund between dynamic growth opportunities and more durable growth opportunities. Stocks remain volatile, and we caution investors against making investment decisions based on short-term performance.
We thank you for your commitment to Invesco Small Cap Discovery Fund.
| 1 | Bureau of Economic Analysis |
| 2 | Bureau of Labor Statistics, Bloomberg |
The views and opinions expressed in management’s discussion of Fund performance are those of Invesco Advisers, Inc. These views and opinions are subject to change at any time based on factors such as market and economic conditions. These views and opinions may not be relied upon as investment advice or recommendations, or as an offer for a particular security. The information is not a complete analysis of every aspect of any market, country, industry, security or the Fund. Statements of fact are from sources considered reliable, but Invesco Advisers, Inc. makes no representation or warranty as to their completeness or accuracy. Although historical performance is no guarantee of future results, these insights may help you understand our investment management philosophy.
See important Fund and, if applicable, index disclosures later in this report.

Matthew Hart
Chartered Financial Analyst, Portfolio Manager, is lead manager of Invesco Small Cap Discovery Fund. He joined Invesco in 2010. Mr. Hart earned a BBA from Southern Methodist University.

Justin Speer
Portfolio Manager, is manager of Invesco Small Cap Discovery Fund. He joined Invesco in 2010. Mr. Speer earned a BS with an emphasis in finance and accounting from Texas Christian University.
5 Invesco Small Cap Discovery Fund
Your Fund’s Long-Term Performance
Results of a $10,000 Investment – Oldest Share Class(es)
Fund and index data from 8/31/07
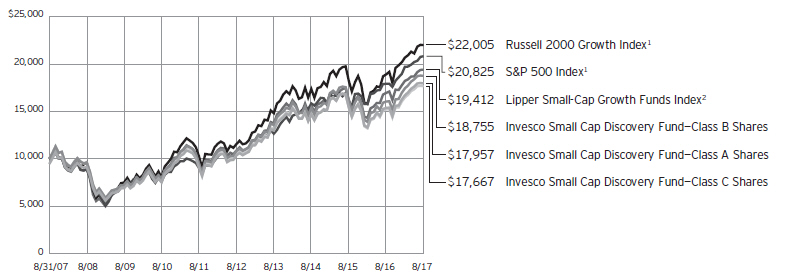
| 1 | Source: FactSet Research Systems Inc. |
| 2 | Source: Lipper Inc. |
Past performance cannot guarantee comparable future results.
The data shown in the chart include reinvested distributions, applicable sales charges and Fund expenses including management fees. Results for Class B shares are calculated as if a hypothetical
shareholder had liquidated his entire investment in the Fund at the close of the reporting period and paid the contingent deferred sales charges, if applicable. Index results include reinvested dividends, but they do not reflect sales charges. Performance of the peer group,
if applicable, reflects fund expenses and management fees; performance of a market index does not. Performance shown in the chart and table(s) does not reflect deduction of taxes a shareholder would pay on Fund distributions or sale of Fund shares.
continued from page 8
| ∎ | A direct investment cannot be made in an index. Unless otherwise indicated, index results include reinvested dividends, and they do not reflect sales charges. Performance of the peer group, if applicable, reflects fund expenses; performance of a market index does not. |
Other information
| ∎ | The returns shown in management’s discussion of Fund performance are based on net asset values (NAVs) calculated for shareholder transactions. Generally accepted accounting principles require adjustments to be made to the net assets of the Fund at period end for financial reporting purposes, and as such, the NAVs for shareholder transactions and the returns based on those NAVs may differ from the NAVs and returns reported in the Financial Highlights. |
| ∎ | Industry classifications used in this report are generally according to the Global Industry Classification Standard, which was developed by and is the exclusive property and a service mark of MSCI Inc. and Standard & Poor’s. |
6 Invesco Small Cap Discovery Fund
| Average Annual Total Returns |
As of 8/31/17, including maximum applicable sales charges
Class A Shares | ||||
Inception (11/27/00) | 4.53 | % | ||
10 Years | 6.03 | |||
5 Years | 10.37 | |||
1 Year | 10.40 | |||
Class B Shares | ||||
Inception (11/27/00) | 4.52 | % | ||
10 Years | 6.49 | |||
5 Years | 11.39 | |||
1 Year | 11.87 | |||
Class C Shares | ||||
Inception (11/27/00) | 4.12 | % | ||
10 Years | 5.86 | |||
5 Years | 10.82 | |||
1 Year | 15.16 | |||
Class Y Shares | ||||
Inception (2/2/06) | 7.43 | % | ||
10 Years | 6.91 | |||
5 Years | 11.93 | |||
1 Year | 17.25 | |||
Class R5 Shares | ||||
10 Years | 6.86 | % | ||
5 Years | 12.10 | |||
1 Year | 17.30 | |||
Class R6 Shares | ||||
10 Years | 6.88 | % | ||
5 Years | 12.15 | |||
1 Year | 17.49 | |||
Effective June 1, 2010, Class A, Class B, Class C and Class I shares of the predecessor fund, Van Kampen Small Cap Growth Fund, advised by Van Kampen Asset Management were reorganized into Class A, Class B, Class C and Class Y shares, respectively, of Invesco Van Kampen Small Cap Growth Fund (renamed Invesco Small Cap Discovery Fund). Returns shown above, prior to June 1, 2010, for Class A, Class B, Class C and Class Y shares are blended returns of the predecessor fund and Invesco Small Cap Discovery Fund. Share class returns will differ from the predecessor fund because of different expenses
Class R5 shares incepted on Septem-ber 24, 2012. Performance shown prior to that date is that of the Fund’s and the predecessor fund’s Class A shares and includes the 12b-1 fees applicable to Class A shares.
Class R6 shares incepted on Septem-ber 24, 2012. Performance shown prior to that date is that of the Fund’s and
| Average Annual Total Returns |
As of 6/30/17, the most recent calendar quarter end, including maximum applicable sales charges
Class A Shares | ||||
Inception (11/27/00) | 4.57 | % | ||
10 Years | 6.05 | |||
5 Years | 11.48 | |||
1 Year | 16.62 | |||
Class B Shares | ||||
Inception (11/27/00) | 4.56 | % | ||
10 Years | 6.50 | |||
5 Years | 12.53 | |||
1 Year | 18.45 | |||
Class C Shares | ||||
Inception (11/27/00) | 4.16 | % | ||
10 Years | 5.88 | |||
5 Years | 11.93 | |||
1 Year | 21.63 | |||
Class Y Shares | ||||
Inception (2/2/06) | 7.53 | % | ||
10 Years | 6.94 | |||
5 Years | 13.05 | |||
1 Year | 23.68 | |||
Class R5 Shares | ||||
10 Years | 6.87 | % | ||
5 Years | 13.21 | |||
1 Year | 23.94 | |||
Class R6 Shares | ||||
10 Years | 6.89 | % | ||
5 Years | 13.24 | |||
1 Year | 24.02 | |||
the predecessor fund’s Class A shares and includes the 12b-1 fees applicable to Class A shares.
The performance data quoted represent past performance and cannot guarantee comparable future results; current performance may be lower or higher. Please visit invesco.com/performance for the most recent month-end performance. Performance figures reflect reinvested distributions, changes in net asset value and the effect of the maximum sales charge unless otherwise stated. Investment return and principal value will fluctuate so that you may have a gain or loss when you sell shares.
The net annual Fund operating expense ratio set forth in the most recent Fund prospectus as of the date of this report for Class A, Class B, Class C, Class Y, Class R5 and Class R6 shares was 1.37%, 1.37%, 2.09%, 1.12%,
0.92% and 0.87%, respectively.1 The total annual Fund operating expense ratio set forth in the most recent Fund prospectus as of the date of this report
for Class A, Class B, Class C, Class Y, Class R5 and Class R6 shares was 1.38%, 1.38%, 2.10%, 1.13%, 0.93% and 0.88%, respectively. The expense ratios presented above may vary from the expense ratios presented in other sections of this report that are based on expenses incurred during the period covered by this report.
Class A share performance reflects the maximum 5.50% sales charge, and Class B and Class C share performance reflects the applicable contingent deferred sales charge (CDSC) for the period involved. For shares purchased prior to June 1, 2010, the CDSC on Class B shares declines from 5% at the time of purchase to 0% at the beginning of the sixth year. For shares purchased on or after June 1, 2010, the CDSC on Class B shares declines from 5% at the time of purchase to 0% at the beginning of the seventh year. The CDSC on Class C shares is 1% for the first year after purchase. Class Y, Class R5 and Class R6 shares do not have a front-end sales charge or a CDSC; therefore, performance is at net asset value.
The performance of the Fund’s share classes will differ primarily due to different sales charge structures and class expenses.
Fund performance reflects any applicable fee waivers and/or expense reimbursements. Had the adviser not waived fees and/or reimbursed expenses currently or in the past, returns would have been lower. See current prospectus for more information.
| 1 | Total annual Fund operating expenses after any contractual fee waivers and/or expense reim- bursements by the adviser in effect through at least June 30, 2019. See current prospectus for more information. |
7 Invesco Small Cap Discovery Fund |
Invesco Small Cap Discovery Fund’s investment objective is to seek capital appreciation.
| ∎ | Unless otherwise stated, information presented in this report is as of August 31, 2017, and is based on total net assets. |
| ∎ | Unless otherwise noted, all data provided by Invesco. |
| ∎ | To access your Fund’s reports/prospectus, visit invesco.com/fundreports. |
About share classes
| ∎ | Class B shares may not be purchased for new or additional investments. Please see the prospectus for more information. |
| ∎ | Class Y shares are available only to certain investors. Please see the prospectus for more information. |
| ∎ | Class R5 shares and Class R6 shares are available for use by retirement plans that meet certain standards and for institutional investors. Class R6 shares are also available through intermediaries that have established an agreement with Invesco Distributors, Inc. to make such shares available for use in retail omnibus accounts. Please see the prospectus for more information. |
Principal risks of investing in the Fund
| ∎ | Foreign securities risk. The Fund’s foreign investments may be adversely affected by political and social instability, changes in economic or taxation policies, difficulty in enforcing obligations, decreased liquidity or increased volatility. Foreign investments also involve the risk of the possible seizure, nationalization or expropriation of the issuer or foreign deposits (in which the Fund could lose its entire investments in a certain market) and the possible adoption of foreign governmental restrictions such as exchange controls. Unless the Fund has hedged its foreign securities risk, foreign securities risk also involves the risk of negative foreign currency rate fluctuations, which may cause the value of securities denominated in such foreign currency (or other instruments through which the Fund has exposure to foreign currencies) to decline in value. Currency exchange rates may fluctuate significantly over short periods of time. Currency hedging strategies, if used, are not always successful. |
| ∎ | Growth investing risk. Growth stocks tend to be more expensive relative to the issuing company’s earnings or |
assets compared with other types of stock. As a result, they tend to be more sensitive to changes in, or investors’ expectations of, the issuing company’s earnings and can be more volatile. |
| ∎ | Initial public offerings (IPO) risk. The prices of IPO securities often fluctuate more than prices of securities of companies with longer trading histories and sometimes experience significant price drops shortly after their initial issuance. In addition, companies offering securities in IPOs may have less experienced management or limited operating histories. |
| ∎ | Management risk. The Fund is actively managed and depends heavily on the Adviser’s judgment about markets, interest rates or the attractiveness, relative values, liquidity, or potential appreciation of particular investments made for the Fund’s portfolio. The Fund could experience losses if these judgments prove to be incorrect. Additionally, legislative, regulatory, or tax developments may adversely affect management of the Fund and, therefore, the ability of the Fund to achieve its investment objective. |
| ∎ | Market risk. The market values of the Fund’s investments, and therefore the value of the Fund’s shares, will go up and down, sometimes rapidly or unpredictably. Market risk may affect a single issuer, industry or section of the economy, or it may affect the market as a whole. Individual stock prices tend to go up and down more dramatically than those of certain other types of investments, such as bonds. During a general downturn in the financial markets, multiple asset classes may decline in value. When markets perform well, there can be no assurance that specific investments held by the Fund will rise in value. |
| ∎ | Real estate investment trust (REIT) risk/real estate risk. Investments in real estate related instruments may be affected by economic, legal, cultural, environmental or technological factors that affect property values, rents or occupancies of real estate related to the |
Fund’s holdings. Shares of real estate related companies, which tend to be small-and mid-cap companies, may be more volatile and less liquid. |
| ∎ | Sector focus risk. The Fund may from time to time invest a significant amount of its assets (i.e. over 25%) in one market sector or group of related industries. In this event, the Fund’s performance will depend to a greater extent on the overall condition of the sector or group of industries and there is increased risk that the Fund will lose significant value if conditions adversely affect that sector or group of industries. |
| ∎ | Small-and mid-capitalization companies risks. Small-and mid-capitalization companies tend to be more vulnerable to changing market conditions, may have little or no operating history or track record of success, and may have more limited product lines and markets, less experienced management and fewer financial resources than larger companies. These companies’ securities may be more volatile and less liquid than those of more established companies, and their returns may vary, sometimes significantly, from the overall securities market. |
About indexes used in this report
| ∎ | The S&P 500® Index is an unmanaged index considered representative of the US stock market. |
| ∎ | The Russell 2000® Growth Index is an unmanaged index considered representative of small-cap growth stocks. The Russell 2000 Growth Index is a trademark/service mark of the Frank Russell Co. Russell® is a trademark of the Frank Russell Co. |
| ∎ | The Lipper Small-Cap Growth Funds Index is an unmanaged index considered representative of small-cap growth funds tracked by Lipper. |
| ∎ | The Fund is not managed to track the performance of any particular index, including the index(es) described here, and consequently, the performance of the Fund may deviate significantly from the performance of the index(es). |
This report must be accompanied or preceded by a currently effective Fund prospectus, which contains more complete information, including sales charges and expenses. Investors should read it carefully before investing.
| continued on page 6 |
| NOT FDIC INSURED | MAY LOSE VALUE | NO BANK GUARANTEE |
8 Invesco Small Cap Discovery Fund
Schedule of Investments(a)
August 31, 2017
| Shares | Value | |||||||
Common Stocks & Other Equity Interests–97.54% |
| |||||||
| Airlines–0.50% | ||||||||
Spirit Airlines Inc.(b) | 85,380 | $ | 2,907,189 | |||||
| Apparel Retail–0.75% | ||||||||
Burlington Stores, Inc.(b) | 50,485 | 4,398,758 | ||||||
| Application Software–9.94% | ||||||||
BroadSoft, Inc.(b) | 167,914 | 8,320,139 | ||||||
Cadence Design Systems, Inc.(b) | 98,183 | 3,857,610 | ||||||
Fair Isaac Corp. | 23,586 | 3,319,965 | ||||||
Globant S.A.(b)(c) | 169,822 | 6,604,378 | ||||||
Guidewire Software Inc.(b) | 131,959 | 9,990,616 | ||||||
HubSpot, Inc.(b) | 101,244 | 7,426,248 | ||||||
SS&C Technologies Holdings, Inc. | 197,309 | 7,637,831 | ||||||
Tyler Technologies, Inc.(b) | 40,730 | 7,038,144 | ||||||
Ultimate Software Group, Inc. (The)(b) | 20,939 | 4,206,645 | ||||||
| 58,401,576 | ||||||||
| Biotechnology–5.89% | ||||||||
Eagle Pharmaceuticals, Inc.(b) | 82,172 | 4,483,304 | ||||||
Neurocrine Biosciences, Inc.(b) | 144,916 | 8,202,246 | ||||||
Repligen Corp.(b) | 126,715 | 5,533,644 | ||||||
Retrophin, Inc.(b) | 222,811 | 5,436,588 | ||||||
Sage Therapeutics, Inc.(b) | 58,243 | 4,790,487 | ||||||
TESARO, Inc.(b) | 47,577 | 6,144,094 | ||||||
| 34,590,363 | ||||||||
| Building Products–3.50% | ||||||||
A.O. Smith Corp. | 58,455 | 3,255,359 | ||||||
Allegion PLC | 36,650 | 2,884,722 | ||||||
American Woodmark Corp.(b) | 53,883 | 4,461,512 | ||||||
Masonite International Corp.(b) | 72,765 | 4,606,024 | ||||||
Owens Corning | 71,930 | 5,332,171 | ||||||
| 20,539,788 | ||||||||
| Commodity Chemicals–1.14% | ||||||||
Methanex Corp. (Canada) | 131,604 | 6,724,964 | ||||||
| Communications Equipment–1.81% | ||||||||
ARRIS International PLC(b) | 159,246 | 4,436,593 | ||||||
Ciena Corp.(b) | 286,172 | 6,184,177 | ||||||
| 10,620,770 | ||||||||
| Construction & Engineering–0.98% | ||||||||
Dycom Industries, Inc.(b)(c) | 71,563 | 5,773,703 | ||||||
| Construction Materials–1.49% | ||||||||
Summit Materials, Inc.–Class A(b) | 297,255 | 8,780,913 | ||||||
| Data Processing & Outsourced Services–3.86% | ||||||||
DST Systems, Inc. | 73,475 | 3,771,472 | ||||||
Euronet Worldwide, Inc.(b) | 93,753 | 9,213,107 | ||||||
ExlService Holdings, Inc.(b) | 53,871 | 3,031,860 | ||||||
| Shares | Value | |||||||
| Data Processing & Outsourced Services–(continued) | ||||||||
WNS Holdings Ltd.–ADR (India)(b) | 190,505 | $ | 6,667,675 | |||||
| 22,684,114 | ||||||||
| Distributors–0.72% | ||||||||
Pool Corp. | 42,195 | 4,206,420 | ||||||
| Diversified Chemicals–1.04% | ||||||||
Chemours Co. (The) | 124,759 | 6,121,924 | ||||||
| Diversified Support Services–0.47% | ||||||||
Mobile Mini, Inc. | 90,249 | 2,730,032 | ||||||
| Education Services–1.08% | ||||||||
Bright Horizons Family Solutions Inc.(b) | 79,282 | 6,337,010 | ||||||
| Electrical Components & Equipment–0.92% | ||||||||
Generac Holdings, Inc.(b) | 133,831 | 5,404,096 | ||||||
| Financial Exchanges & Data–3.39% | ||||||||
CBOE Holdings Inc. | 94,518 | 9,535,921 | ||||||
MarketAxess Holdings, Inc. | 53,817 | 10,383,990 | ||||||
| 19,919,911 | ||||||||
| Health Care Equipment–6.47% | ||||||||
DexCom Inc.(b) | 85,553 | 6,383,109 | ||||||
Inogen, Inc.(b) | 83,960 | 8,043,368 | ||||||
Integra LifeSciences Holdings Corp.(b) | 124,493 | 6,347,898 | ||||||
Penumbra, Inc.(b) | 95,291 | 8,195,026 | ||||||
Wright Medical Group N.V.(b) | 306,452 | 9,070,979 | ||||||
| 38,040,380 | ||||||||
| Health Care Facilities–0.87% | ||||||||
Acadia Healthcare Co., Inc.(b)(c) | 109,422 | 5,136,269 | ||||||
| Health Care REIT’s–0.65% | ||||||||
Physicians Realty Trust | 205,274 | 3,844,782 | ||||||
| Health Care Services–0.84% | ||||||||
Premier, Inc.–Class A(b) | 148,020 | 4,958,670 | ||||||
| Health Care Supplies–0.87% | ||||||||
Align Technology, Inc.(b) | 28,815 | 5,092,763 | ||||||
| Health Care Technology–0.64% | ||||||||
Evolent Health, Inc.–Class A(b) | 226,767 | 3,787,009 | ||||||
| Home Entertainment Software–1.84% | ||||||||
Take-Two Interactive Software, Inc.(b) | 110,484 | 10,804,230 | ||||||
| Homebuilding–0.96% | ||||||||
TopBuild Corp.(b) | 94,577 | 5,613,145 | ||||||
| Household Appliances–1.19% | ||||||||
Helen of Troy Ltd.(b) | 77,674 | 7,013,962 | ||||||
| Housewares & Specialties–0.39% | ||||||||
Newell Brands, Inc. | 47,737 | 2,304,742 | ||||||
See accompanying Notes to Financial Statements which are an integral part of the financial statements.
9 Invesco Small Cap Discovery Fund
| Shares | Value | |||||||
| Human Resource & Employment Services–2.08% | ||||||||
Korn/Ferry International | 78,673 | $ | 2,621,384 | |||||
On Assignment, Inc.(b) | 112,185 | 5,351,225 | ||||||
Robert Half International, Inc. | 94,264 | 4,270,159 | ||||||
| 12,242,768 | ||||||||
| Industrial Machinery–2.03% | ||||||||
EnPro Industries, Inc. | 106,803 | 7,526,407 | ||||||
Woodward, Inc. | 62,728 | 4,404,133 | ||||||
| 11,930,540 | ||||||||
| Internet Software & Services–3.81% | ||||||||
CoStar Group Inc.(b) | 33,728 | 9,667,119 | ||||||
LogMeIn, Inc. | 37,794 | 4,323,634 | ||||||
Q2 Holdings, Inc.(b) | 137,305 | 5,574,583 | ||||||
Web.com Group Inc.(b) | 110,617 | 2,798,610 | ||||||
| 22,363,946 | ||||||||
| Investment Banking & Brokerage–1.82% | ||||||||
E*TRADE Financial Corp.(b) | 260,905 | 10,699,714 | ||||||
| IT Consulting & Other Services–2.97% | ||||||||
EPAM Systems, Inc.(b) | 75,402 | 6,132,445 | ||||||
InterXion Holding N.V. (Netherlands)(b) | 218,018 | 11,304,233 | ||||||
| 17,436,678 | ||||||||
| Leisure Facilities–1.15% | ||||||||
Vail Resorts, Inc. | 29,610 | 6,749,600 | ||||||
| Leisure Products–0.86% | ||||||||
Brunswick Corp. | 96,447 | 5,061,539 | ||||||
| Life Sciences Tools & Services–2.81% | ||||||||
Bio-Techne Corp. | 43,013 | 5,324,149 | ||||||
INC Research Holdings, Inc.–Class A(b) | 190,736 | 11,196,203 | ||||||
| 16,520,352 | ||||||||
| Managed Health Care–1.47% | ||||||||
HealthEquity, Inc.(b) | 202,320 | 8,653,226 | ||||||
| Metal & Glass Containers–0.99% | ||||||||
Berry Global Group, Inc.(b) | 103,457 | 5,818,422 | ||||||
| Movies & Entertainment–1.47% | ||||||||
Cinemark Holdings, Inc. | 150,544 | 5,011,610 | ||||||
Lions Gate Entertainment Corp.–Class A(b) | 62,658 | 1,862,822 | ||||||
Lions Gate Entertainment Corp.–Class B(b) | 62,885 | 1,765,182 | ||||||
| 8,639,614 | ||||||||
| Office Services & Supplies–0.70% | ||||||||
Steelcase Inc.–Class A | 312,365 | 4,123,218 | ||||||
| Oil & Gas Exploration & Production–2.10% | ||||||||
Centennial Resource Development, Inc.–Class A(b)(c) | 351,299 | 6,073,960 | ||||||
Diamondback Energy Inc.(b) | 68,965 | 6,261,332 | ||||||
| 12,335,292 | ||||||||
| Shares | Value | |||||||
| Packaged Foods & Meats–2.44% | ||||||||
B&G Foods Inc.(c) | 77,141 | $ | 2,352,801 | |||||
Hostess Brands, Inc.(b)(c) | 344,568 | 4,596,537 | ||||||
Pinnacle Foods Inc. | 124,148 | 7,363,218 | ||||||
| 14,312,556 | ||||||||
| Pharmaceuticals–1.87% | ||||||||
Impax Laboratories, Inc.(b) | 272,723 | 5,904,453 | ||||||
Pacira Pharmaceuticals, Inc.(b) | 133,022 | 5,068,138 | ||||||
| 10,972,591 | ||||||||
| Property & Casualty Insurance–0.97% | ||||||||
Selective Insurance Group, Inc. | 112,908 | 5,690,563 | ||||||
| Railroads–1.36% | ||||||||
Genesee & Wyoming Inc.–Class A(b) | 116,807 | 8,008,288 | ||||||
| Regional Banks–2.74% | ||||||||
Sterling Bancorp | 261,565 | 5,872,134 | ||||||
Webster Financial Corp. | 92,543 | 4,319,907 | ||||||
Western Alliance Bancorp(b) | 122,889 | 5,926,937 | ||||||
| 16,118,978 | ||||||||
| Restaurants–1.58% | ||||||||
Jack in the Box Inc. | 32,903 | 3,080,379 | ||||||
Texas Roadhouse, Inc. | 82,305 | 3,905,372 | ||||||
Wingstop Inc.(c) | 70,897 | 2,297,772 | ||||||
| 9,283,523 | ||||||||
| Semiconductor Equipment–1.23% | ||||||||
Entegris Inc.(b) | 107,954 | 2,747,429 | ||||||
MKS Instruments, Inc. | 54,062 | 4,452,006 | ||||||
| 7,199,435 | ||||||||
| Semiconductors–4.28% | ||||||||
Cirrus Logic, Inc.(b) | 69,900 | 4,052,802 | ||||||
MACOM Technology Solutions Holdings, Inc.(b) | 119,377 | 5,436,428 | ||||||
Microsemi Corp.(b) | 117,434 | 5,916,325 | ||||||
Qorvo, Inc.(b) | 52,421 | 3,838,266 | ||||||
Silicon Laboratories Inc.(b) | 77,478 | 5,880,580 | ||||||
| 25,124,401 | ||||||||
| Specialty Chemicals–1.82% | ||||||||
PolyOne Corp. | 139,585 | 5,044,602 | ||||||
Venator Materials PLC(b) | 277,063 | 5,624,379 | ||||||
| 10,668,981 | ||||||||
| Specialty Stores–0.69% | ||||||||
Five Below, Inc.(b) | 85,787 | 4,080,888 | ||||||
| Thrifts & Mortgage Finance–0.50% | ||||||||
MGIC Investment Corp.(b) | 254,189 | 2,910,464 | ||||||
| Trading Companies & Distributors–1.60% | ||||||||
BMC Stock Holdings, Inc.(b) | 262,441 | 5,327,552 | ||||||
See accompanying Notes to Financial Statements which are an integral part of the financial statements.
10 Invesco Small Cap Discovery Fund
| Shares | Value | |||||||
| Trading Companies & Distributors–(continued) | ||||||||
WESCO International, Inc.(b) | 81,041 | $ | 4,088,519 | |||||
| 9,416,071 | ||||||||
Total Common Stocks & Other Equity Interests (Cost $431,796,429) |
| 573,099,131 | ||||||
Money Market Funds–2.68% | ||||||||
Government & Agency Portfolio–Institutional Class, 0.93%(d) | 9,458,113 | 9,458,113 | ||||||
Treasury Portfolio–Institutional Class, 0.90%(d) | 6,305,409 | 6,305,409 | ||||||
Total Money Market Funds |
| 15,763,522 | ||||||
TOTAL INVESTMENTS IN SECURITIES (excluding investments purchased with cash collateral from securities on loan)–100.22% |
| 588,862,653 | ||||||
| Shares | Value | |||||||
Investments Purchased with Cash |
| |||||||
Money Market Funds–2.84% |
| |||||||
Government & Agency Portfolio–Institutional Class, 0.93% | 16,673,354 | $ | 16,673,354 | |||||
TOTAL INVESTMENTS IN SECURITIES–103.06% |
| 605,536,007 | ||||||
OTHER ASSETS LESS LIABILITIES–(3.06)% |
| (17,995,636 | ) | |||||
NET ASSETS–100.00% |
| $ | 587,540,371 | |||||
Investment Abbreviations:
| ADR | – American Depositary Receipt | |
| REIT | – Real Estate Investment Trust |
Notes to Schedule of Investments:
| (a) | Industry and/or sector classifications used in this report are generally according to the Global Industry Classification Standard, which was developed by and is the exclusive property and a service mark of MSCI Inc. and Standard & Poor’s. |
| (b) | Non–income producing security. |
| (c) | All or a portion of this security was out on loan at August 31, 2017. |
| (d) | The money market fund and the Fund are affiliated by having the same investment adviser. The rate shown is the 7–day SEC standardized yield as of August 31, 2017. |
| (e) | The security has been segregated to satisfy the commitment to return the cash collateral received in securities lending transactions upon the borrower’s return of the securities loaned. See Note 1I. |
See accompanying Notes to Financial Statements which are an integral part of the financial statements.
11 Invesco Small Cap Discovery Fund
Statement of Assets and Liabilities
August 31, 2017
Assets: | ||||
Investments in securities, at value (Cost $431,796,429)* | $ | 573,099,131 | ||
Investments in affiliated money market funds, at value and cost | 32,436,876 | |||
Receivable for: | ||||
Fund shares sold | 1,921,796 | |||
Dividends | 270,304 | |||
Fund expenses absorbed | 17,427 | |||
Investment for trustee deferred compensation and retirement plans | 116,119 | |||
Other assets | 39,916 | |||
Total assets | 607,901,569 | |||
Liabilities: | ||||
Payable for: | ||||
Investments purchased | 569,966 | |||
Collateral upon return of securities loaned | 16,673,354 | |||
Fund shares reacquired | 2,375,534 | |||
Accrued fees to affiliates | 509,377 | |||
Accrued trustees’ and officers’ fees and benefits | 3,899 | |||
Accrued other operating expenses | 99,416 | |||
Trustee deferred compensation and retirement plans | 129,652 | |||
Total liabilities | 20,361,198 | |||
Net assets applicable to shares outstanding | $ | 587,540,371 | ||
Net assets consist of: | ||||
Shares of beneficial interest | $ | 384,368,120 | ||
Undistributed net investment income (loss) | (3,596,312 | ) | ||
Undistributed net realized gain | 65,465,861 | |||
Net unrealized appreciation | 141,302,702 | |||
| $ | 587,540,371 | |||
Net Assets: | ||||
Class A | $ | 351,214,413 | ||
Class B | $ | 2,259,923 | ||
Class C | $ | 38,678,881 | ||
Class Y | $ | 96,321,012 | ||
Class R5 | $ | 23,136,950 | ||
Class R6 | $ | 75,929,192 | ||
Shares outstanding, no par value, |
| |||
Class A | 33,831,570 | |||
Class B | 249,501 | |||
Class C | 4,730,805 | |||
Class Y | 8,815,644 | |||
Class R5 | 2,095,320 | |||
Class R6 | 6,861,149 | |||
Class A: | ||||
Net asset value per share | $ | 10.38 | ||
Maximum offering price per share | ||||
(Net asset value of $10.38 ¸ 94.50%) | $ | 10.98 | ||
Class B: | ||||
Net asset value and offering price per share | $ | 9.06 | ||
Class C: | ||||
Net asset value and offering price per share | $ | 8.18 | ||
Class Y: | ||||
Net asset value and offering price per share | $ | 10.93 | ||
Class R5: | ||||
Net asset value and offering price per share | $ | 11.04 | ||
Class R6: | ||||
Net asset value and offering price per share | $ | 11.07 | ||
| * | At August 31, 2017, securities with an aggregate value of $16,659,690 were on loan to brokers. |
See accompanying Notes to Financial Statements which are an integral part of the financial statements.
12 Invesco Small Cap Discovery Fund
Statement of Operations
For the year ended August 31, 2017
Investment income: |
| |||
Dividends (net of foreign withholding taxes of $19,991) | $ | 2,935,313 | ||
Dividends from affiliated money market funds (includes securities lending income of $48,701) | 145,146 | |||
Total investment income | 3,080,459 | |||
Expenses: | ||||
Advisory fees | 4,814,361 | |||
Administrative services fees | 164,974 | |||
Custodian fees | 14,300 | |||
Distribution fees: | ||||
Class A | 967,557 | |||
Class B | 8,576 | |||
Class C | 418,858 | |||
Transfer agent fees — A, B, C and Y | 1,299,788 | |||
Transfer agent fees — R5 | 5,447 | |||
Transfer agent fees — R6 | 6,052 | |||
Trustees’ and officers’ fees and benefits | 31,358 | |||
Registration and filing fees | 101,454 | |||
Reports to shareholders | 238,844 | |||
Professional services fees | 39,800 | |||
Other | 18,192 | |||
Total expenses | 8,129,561 | |||
Less: Fees waived and expense offset arrangement(s) | (26,864 | ) | ||
Net expenses | 8,102,697 | |||
Net investment income (loss) | (5,022,238 | ) | ||
Realized and unrealized gain from: | ||||
Net realized gain from investment securities | 93,498,857 | |||
Change in net unrealized appreciation of investment securities | 6,346,476 | |||
Net realized and unrealized gain | 99,845,333 | |||
Net increase in net assets resulting from operations | $ | 94,823,095 | ||
See accompanying Notes to Financial Statements which are an integral part of the financial statements.
13 Invesco Small Cap Discovery Fund
Statement of Changes in Net Assets
For the years ended August 31, 2017 and 2016
| 2017 | 2016 | |||||||
Operations: |
| |||||||
Net investment income (loss) | $ | (5,022,238 | ) | $ | (5,813,896 | ) | ||
Net realized gain | 93,498,857 | 1,370,559 | ||||||
Change in net unrealized appreciation (depreciation) | 6,346,476 | (6,303,232 | ) | |||||
Net increase (decrease) in net assets resulting from operations | 94,823,095 | (10,746,569 | ) | |||||
Distributions to shareholders from net realized gains: | ||||||||
Class A | (7,685,697 | ) | (70,507,209 | ) | ||||
Class B | (83,899 | ) | (1,062,060 | ) | ||||
Class C | (1,025,595 | ) | (10,017,535 | ) | ||||
Class Y | (1,366,323 | ) | (9,673,736 | ) | ||||
Class R5 | (30,682 | ) | (527,087 | ) | ||||
Class R6 | (1,314,143 | ) | (9,777,574 | ) | ||||
Total distributions from net realized gains | (11,506,339 | ) | (101,565,201 | ) | ||||
Share transactions–net: | ||||||||
Class A | (140,510,193 | ) | 4,087,521 | |||||
Class B | (2,775,160 | ) | (1,845,248 | ) | ||||
Class C | (13,962,461 | ) | (3,880,321 | ) | ||||
Class Y | 9,064,509 | (10,803,399 | ) | |||||
Class R5 | 20,028,083 | (4,296,810 | ) | |||||
Class R6 | (8,950,372 | ) | 6,160,310 | |||||
Net increase (decrease) in net assets resulting from share transactions | (137,105,594 | ) | (10,577,947 | ) | ||||
Net increase (decrease) in net assets | (53,788,838 | ) | (122,889,717 | ) | ||||
Net assets: | ||||||||
Beginning of year | 641,329,209 | 764,218,926 | ||||||
End of year (includes undistributed net investment income (loss) of $(3,596,312) and $(3,910,631), respectively) | $ | 587,540,371 | $ | 641,329,209 | ||||
Notes to Financial Statements
August 31, 2017
NOTE 1—Significant Accounting Policies
Invesco Small Cap Discovery Fund (the “Fund”) is a series portfolio of AIM Counselor Series Trust (Invesco Counselor Series Trust) (the “Trust”). The Trust is a Delaware statutory trust registered under the Investment Company Act of 1940, as amended (the “1940 Act”), as an open-end series management investment company consisting of fourteen separate portfolios, each authorized to issue an unlimited number of shares of beneficial interest. The assets, liabilities and operations of each portfolio are accounted for separately. Information presented in these financial statements pertains only to the Fund. Matters affecting each portfolio or class will be voted on exclusively by the shareholders of such portfolio or class.
The Fund’s investment objective is to seek capital appreciation.
The Fund currently consists of six different classes of shares: Class A, Class B, Class C, Class Y, Class R5 and Class R6. Class Y shares are available only to certain investors. Class A shares are sold with a front-end sales charge unless certain waiver criteria are met and under certain circumstances load waived shares may be subject to contingent deferred sales charges (“CDSC”). Class C shares are sold with a CDSC. Class Y, Class R5 and Class R6 shares are sold at net asset value. Effective November 30, 2010, new or additional investments in Class B shares are no longer permitted. Existing shareholders of Class B shares may continue to reinvest dividends and capital gains distributions in Class B shares until they convert to Class A shares. Also, shareholders in Class B shares will be able to exchange those shares for Class B shares of other Invesco Funds offering such shares until they convert to Class A shares. Generally, Class B shares will automatically convert to Class A shares on or about the month-end, which is at least eight years after the date of purchase. Redemption of Class B shares prior to the conversion date will be subject to a CDSC.
The Fund is an investment company and accordingly follows the investment company accounting and reporting guidance in accordance with Financial Accounting Standards Board Accounting Standards Codification Topic 946, Financial Services — Investment Companies.
The following is a summary of the significant accounting policies followed by the Fund in the preparation of its financial statements.
| A. | Security Valuations — Securities, including restricted securities, are valued according to the following policy. |
A security listed or traded on an exchange (except convertible securities) is valued at its last sales price or official closing price as of the close of the customary trading session on the exchange where the security is principally traded, or lacking any sales or official closing price on a particular day, the security may be valued at the closing bid price on that day. Securities traded in the over-the-counter market are valued based on prices furnished by independent pricing services or market makers. When such securities are valued by an independent pricing service they may be considered fair valued. Futures contracts are valued at the final settlement price set by an exchange on which they are principally traded.
14 Invesco Small Cap Discovery Fund
Listed options are valued at the mean between the last bid and asked prices from the exchange on which they are principally traded. Options not listed on an exchange are valued by an independent source at the mean between the last bid and asked prices. For purposes of determining net asset value (“NAV”) per share, futures and option contracts generally are valued 15 minutes after the close of the customary trading session of the New York Stock Exchange (“NYSE”).
Investments in open-end and closed-end registered investment companies that do not trade on an exchange are valued at the end-of-day net asset value per share. Investments in open-end and closed-end registered investment companies that trade on an exchange are valued at the last sales price or official closing price as of the close of the customary trading session on the exchange where the security is principally traded.
Debt obligations (including convertible securities) and unlisted equities are fair valued using an evaluated quote provided by an independent pricing service. Evaluated quotes provided by the pricing service may be determined without exclusive reliance on quoted prices, and may reflect appropriate factors such as institution-size trading in similar groups of securities, developments related to specific securities, dividend rate (for unlisted equities), yield (for debt obligations), quality, type of issue, coupon rate (for debt obligations), maturity (for debt obligations), individual trading characteristics and other market data. Pricing services generally value debt obligations assuming orderly transactions of institutional round lot size, but a Fund may hold or transact in the same securities in smaller, odd lot sizes. Odd lots often trade at lower prices than institutional round lots. Debt obligations are subject to interest rate and credit risks. In addition, all debt obligations involve some risk of default with respect to interest and/or principal payments.
Foreign securities’ (including foreign exchange contracts) prices are converted into U.S. dollar amounts using the applicable exchange rates as of the close of the NYSE. If market quotations are available and reliable for foreign exchange-traded equity securities, the securities will be valued at the market quotations. Because trading hours for certain foreign securities end before the close of the NYSE, closing market quotations may become unreliable. If between the time trading ends on a particular security and the close of the customary trading session on the NYSE, events occur that the investment adviser determines are significant and make the closing price unreliable, the Fund may fair value the security. If the event is likely to have affected the closing price of the security, the security will be valued at fair value in good faith using procedures approved by the Board of Trustees. Adjustments to closing prices to reflect fair value may also be based on a screening process of an independent pricing service to indicate the degree of certainty, based on historical data, that the closing price in the principal market where a foreign security trades is not the current value as of the close of the NYSE. Foreign securities’ prices meeting the approved degree of certainty that the price is not reflective of current value will be priced at the indication of fair value from the independent pricing service. Multiple factors may be considered by the independent pricing service in determining adjustments to reflect fair value and may include information relating to sector indices, American Depositary Receipts and domestic and foreign index futures. Foreign securities may have additional risks including exchange rate changes, potential for sharply devalued currencies and high inflation, political and economic upheaval, the relative lack of issuer information, relatively low market liquidity and the potential lack of strict financial and accounting controls and standards.
Securities for which market prices are not provided by any of the above methods may be valued based upon quotes furnished by independent sources. The last bid price may be used to value equity securities. The mean between the last bid and asked prices is used to value debt obligations, including corporate loans.
Securities for which market quotations are not readily available or became unreliable are valued at fair value as determined in good faith by or under the supervision of the Trust’s officers following procedures approved by the Board of Trustees. Issuer specific events, market trends, bid/asked quotes of brokers and information providers and other market data may be reviewed in the course of making a good faith determination of a security’s fair value.
The Fund may invest in securities that are subject to interest rate risk, meaning the risk that the prices will generally fall as interest rates rise and, conversely, the prices will generally rise as interest rates fall. Specific securities differ in their sensitivity to changes in interest rates depending on their individual characteristics. Changes in interest rates may result in increased market volatility, which may affect the value and/or liquidity of certain Fund investments.
Valuations change in response to many factors including the historical and prospective earnings of the issuer, the value of the issuer’s assets, general economic conditions, interest rates, investor perceptions and market liquidity. Because of the inherent uncertainties of valuation, the values reflected in the financial statements may materially differ from the value received upon actual sale of those investments.
| B. | Securities Transactions and Investment Income — Securities transactions are accounted for on a trade date basis. Realized gains or losses on sales are computed on the basis of specific identification of the securities sold. Interest income (net of withholding tax, if any) is recorded on the accrual basis from settlement date. Dividend income (net of withholding tax, if any) is recorded on the ex-dividend date. |
The Fund may periodically participate in litigation related to Fund investments. As such, the Fund may receive proceeds from litigation settlements. Any proceeds received are included in the Statement of Operations as realized gain (loss) for investments no longer held and as unrealized gain (loss) for investments still held.
Brokerage commissions and mark ups are considered transaction costs and are recorded as an increase to the cost basis of securities purchased and/or a reduction of proceeds on a sale of securities. Such transaction costs are included in the determination of net realized and unrealized gain (loss) from investment securities reported in the Statement of Operations and the Statement of Changes in Net Assets and the net realized and unrealized gains (losses) on securities per share in the Financial Highlights. Transaction costs are included in the calculation of the Fund’s net asset value and, accordingly, they reduce the Fund’s total returns. These transaction costs are not considered operating expenses and are not reflected in net investment income reported in the Statement of Operations and the Statement of Changes in Net Assets, or the net investment income per share and the ratios of expenses and net investment income reported in the Financial Highlights, nor are they limited by any expense limitation arrangements between the Fund and the investment adviser.
The Fund allocates income and realized and unrealized capital gains and losses to a class based on the relative net assets of each class.
| C. | Country Determination — For the purposes of making investment selection decisions and presentation in the Schedule of Investments, the investment adviser may determine the country in which an issuer is located and/or credit risk exposure based on various factors. These factors include the laws of the country under which the issuer is organized, where the issuer maintains a principal office, the country in which the issuer derives 50% or more of its total revenues and the country that has the primary market for the issuer’s securities, as well as other criteria. Among the other criteria that may be evaluated for making this determination are the country in which the issuer maintains 50% or more of its assets, the type of security, financial guarantees and enhancements, the nature of the collateral and the sponsor organization. Country of issuer and/or credit risk exposure has been determined to be the United States of America, unless otherwise noted. |
15 Invesco Small Cap Discovery Fund
| D. | Distributions — Distributions from net investment income and net realized capital gain, if any, are generally declared and paid annually and recorded on the ex-dividend date. The Fund may elect to treat a portion of the proceeds from redemptions as distributions for federal income tax purposes. |
| E. | Federal Income Taxes — The Fund intends to comply with the requirements of Subchapter M of the Internal Revenue Code of 1986, as amended (the “Internal Revenue Code”), necessary to qualify as a regulated investment company and to distribute substantially all of the Fund’s taxable earnings to shareholders. As such, the Fund will not be subject to federal income taxes on otherwise taxable income (including net realized capital gain) that is distributed to shareholders. Therefore, no provision for federal income taxes is recorded in the financial statements. |
The Fund recognizes the tax benefits of uncertain tax positions only when the position is more likely than not to be sustained. Management has analyzed the Fund’s uncertain tax positions and concluded that no liability for unrecognized tax benefits should be recorded related to uncertain tax positions. Management is not aware of any tax positions for which it is reasonably possible that the total amounts of unrecognized tax benefits will change materially in the next 12 months.
The Fund files tax returns in the U.S. Federal jurisdiction and certain other jurisdictions. Generally, the Fund is subject to examinations by such taxing authorities for up to three years after the filing of the return for the tax period.
| F. | Expenses — Fees provided for under the Rule 12b-1 plan of a particular class of the Fund are charged to the operations of such class. Transfer agency fees and expenses and other shareholder recordkeeping fees and expenses attributable to Class R5 and Class R6 are allocated to each share class based on relative net assets. Sub-accounting fees attributable to Class R5 are charged to the operations of the class. Transfer agency fees and expenses and other shareholder recordkeeping fees and expenses relating to all other classes are allocated among those classes based on relative net assets. All other expenses are allocated among the classes based on relative net assets. |
| G. | Accounting Estimates — The preparation of financial statements in conformity with accounting principles generally accepted in the United States of America (“GAAP”) requires management to make estimates and assumptions that affect the reported amounts of assets and liabilities at the date of the financial statements and the reported amounts of revenues and expenses during the reporting period including estimates and assumptions related to taxation. Actual results could differ from those estimates by a significant amount. In addition, the Fund monitors for material events or transactions that may occur or become known after the period-end date and before the date the financial statements are released to print. |
| H. | Indemnifications — Under the Trust’s organizational documents, each Trustee, officer, employee or other agent of the Trust is indemnified against certain liabilities that may arise out of the performance of their duties to the Fund. Additionally, in the normal course of business, the Fund enters into contracts, including the Fund’s servicing agreements, that contain a variety of indemnification clauses. The Fund’s maximum exposure under these arrangements is unknown as this would involve future claims that may be made against the Fund that have not yet occurred. The risk of material loss as a result of such indemnification claims is considered remote. |
| I. | Securities Lending — The Fund may lend portfolio securities having a market value up to one-third of the Fund’s total assets. Such loans are secured by collateral equal to no less than the market value of the loaned securities determined daily by the securities lending provider. Such collateral will be cash or debt securities issued or guaranteed by the U.S. Government or any of its sponsored agencies. Cash collateral received in connection with these loans is invested in short-term money market instruments or affiliated money market funds and is shown as such on the Schedule of Investments. The Fund bears the risk of loss with respect to the investment of collateral. It is the Fund’s policy to obtain additional collateral from or return excess collateral to the borrower by the end of the next business day, following the valuation date of the securities loaned. Therefore, the value of the collateral held may be temporarily less than the value of the securities on loan. When loaning securities, the Fund retains certain benefits of owning the securities, including the economic equivalent of dividends or interest generated by the security. Lending securities entails a risk of loss to the Fund if, and to the extent that, the market value of the securities loaned were to increase and the borrower did not increase the collateral accordingly, and the borrower failed to return the securities. The securities loaned are subject to termination at the option of the borrower or the Fund. Upon termination, the borrower will return to the Fund the securities loaned and the Fund will return the collateral. Upon the failure of the borrower to return the securities, collateral may be liquidated and the securities may be purchased on the open market to replace the loaned securities. The Fund could experience delays and costs in gaining access to the collateral and the securities may lose value during the delay which could result in potential losses to the Fund. Some of these losses may be indemnified by the lending agent. The Fund bears the risk of any deficiency in the amount of the collateral available for return to the borrower due to any loss on the collateral invested. Dividends received on cash collateral investments for securities lending transactions, which are net of compensation to counterparties, are included in Dividends from affiliated money market funds on the Statement of Operations. The aggregate value of securities out on loan, if any, is shown as a footnote on the Statement of Assets and Liabilities. |
NOTE 2—Advisory Fees and Other Fees Paid to Affiliates
The Trust has entered into a master investment advisory agreement with Invesco Advisers, Inc. (the “Adviser” or “Invesco”). Under the terms of the investment advisory agreement, the Fund accrues daily and pays monthly an advisory fee to the Adviser based on the annual rate of the Fund’s average daily net assets as follows:
| Average Daily Net Assets | Rate | |||
First $500 million | 0.80% | |||
Next $500 million | 0.75% | |||
Over $1 billion | 0.70% | |||
For the year ended August 31, 2017, the effective advisory fees incurred by the Fund was 0.79%.
Under the terms of a master sub-advisory agreement between the Adviser and each of Invesco Asset Management Deutschland GmbH, Invesco Asset Management Limited, Invesco Asset Management (Japan) Limited, Invesco Hong Kong Limited, Invesco Senior Secured Management, Inc. and Invesco Canada Ltd. (collectively, the “Affiliated Sub-Advisers”) the Adviser, not the Fund, will pay 40% of the fees paid to the Adviser to any such Affiliated Sub-Adviser(s) that provide(s) discretionary investment management services to the Fund based on the percentage of assets allocated to such Affiliated Sub-Adviser(s).
16 Invesco Small Cap Discovery Fund
The Adviser has contractually agreed, through at least June 30, 2018, to waive advisory fees and/or reimburse expenses to the extent necessary to limit total annual fund operating expenses after fee waiver and/or expense reimbursement (excluding certain items discussed below) of Class A, Class B, Class C, Class Y, Class R5 and Class R6 shares to 2.00%, 2.75%, 2.75%, 1.75%, 1.75% and 1.75%, respectively, of average daily net assets (the “expense limits”). In determining the Adviser’s obligation to waive advisory fees and/or reimburse expenses, the following expenses are not taken into account, and could cause total annual fund operating expenses after fee waiver and/or reimbursement to exceed the numbers reflected above: (1) interest; (2) taxes; (3) dividend expense on short sales; (4) extraordinary or non-routine items, including litigation expenses; and (5) expenses that the Fund has incurred but did not actually pay because of an expense offset arrangement. Unless Invesco continues the fee waiver agreement, it will terminate on June 30, 2018. During its term, the fee waiver agreement cannot be terminated or amended to increase the expense limits or reduce the advisory fee waivers without approval of the Board of Trustees. The Adviser did not waive fees and/or reimburse expenses during the period under this expense limit.
Further, the Adviser has contractually agreed, through at least June 30, 2019, to waive the advisory fee payable by the Fund in an amount equal to 100% of the net advisory fees the Adviser receives from the affiliated money market funds on investments by the Fund of uninvested cash (excluding investments of cash collateral from securities lending) in such affiliated money market funds.
For the year ended August 31, 2017, the Adviser waived advisory fees of $22,301.
The Trust has entered into a master administrative services agreement with Invesco pursuant to which the Fund has agreed to pay Invesco for certain administrative costs incurred in providing accounting services to the Fund. For the year ended August 31, 2017, expenses incurred under the agreement are shown in the Statement of Operations as Administrative services fees.
The Trust has entered into a transfer agency and service agreement with Invesco Investment Services, Inc. (“IIS”) pursuant to which the Fund has agreed to pay IIS a fee for providing transfer agency and shareholder services to the Fund and reimburse IIS for certain expenses incurred by IIS in the course of providing such services. IIS may make payments to intermediaries that provide omnibus account services, sub-accounting services and/or networking services. All fees payable by IIS to intermediaries that provide omnibus account services or sub-accounting services are charged back to the Fund, subject to certain limitations approved by the Trust’s Board of Trustees. For the year ended August 31, 2017, the expenses incurred under the agreement are shown in the Statement of Operations as Transfer agent fees.
Shares of the Fund are distributed by Invesco Distributors, Inc. (“IDI”). The Fund has adopted a distribution plan pursuant to Rule 12b-1 under the 1940 Act, and a service plan (collectively, the “Plans”) for Class A shares, Class B shares and Class C shares to compensate IDI for the sale, distribution, shareholder servicing and maintenance of shareholder accounts for these shares. Under the Plans, the Fund will incur annual fees of up to 0.25% of Class A average daily net assets and up to 1.00% each of Class B and Class C average daily net assets. The fees are accrued daily and paid monthly.
With respect to Class B and Class C shares, the Fund is authorized to reimburse in future years any distribution related expenses that exceed the maximum annual reimbursement rate for such class, so long as such reimbursement does not cause the Fund to exceed the Class B and Class C maximum annual reimbursement rate, respectively. With respect to Class A shares, distribution related expenses that exceed the maximum annual reimbursement rate for such class are not carried forward to future years and the Fund will not reimburse IDI for any such expenses.
For the year ended August 31, 2017, expenses incurred under these agreements are shown in the Statement of Operations as Distribution fees.
Front-end sales commissions and CDSC (collectively, the “sales charges”) are not recorded as expenses of the Fund. Front-end sales commissions are deducted from proceeds from the sales of Fund shares prior to investment in Class A shares of the Fund. CDSC are deducted from redemption proceeds prior to remittance to the shareholder. During the year ended August 31, 2017, IDI advised the Fund that IDI retained $56,027 in front-end sales commissions from the sale of Class A shares and $4,087, $6 and $3,105 from Class A, Class B and Class C shares, respectively, for CDSC imposed on redemptions by shareholders.
For the year ended August 31, 2017, the Fund incurred $11,603 in brokerage commissions with Invesco Capital Markets, Inc., an affiliate of the Adviser and IDI, for portfolio transactions executed on behalf of the Fund.
Certain officers and trustees of the Trust are officers and directors of the Adviser, IIS and/or IDI.
NOTE 3—Additional Valuation Information
GAAP defines fair value as the price that would be received to sell an asset or paid to transfer a liability in an orderly transaction between market participants at the measurement date, under current market conditions. GAAP establishes a hierarchy that prioritizes the inputs to valuation methods, giving the highest priority to readily available unadjusted quoted prices in an active market for identical assets (Level 1) and the lowest priority to significant unobservable inputs (Level 3), generally when market prices are not readily available or are unreliable. Based on the valuation inputs, the securities or other investments are tiered into one of three levels. Changes in valuation methods may result in transfers in or out of an investment’s assigned level:
| Level 1 — | Prices are determined using quoted prices in an active market for identical assets. |
| Level 2 — | Prices are determined using other significant observable inputs. Observable inputs are inputs that other market participants may use in pricing a security. These may include quoted prices for similar securities, interest rates, prepayment speeds, credit risk, yield curves, loss severities, default rates, discount rates, volatilities and others. |
| Level 3 — | Prices are determined using significant unobservable inputs. In situations where quoted prices or observable inputs are unavailable (for example, when there is little or no market activity for an investment at the end of the period), unobservable inputs may be used. Unobservable inputs reflect the Fund’s own assumptions about the factors market participants would use in determining fair value of the securities or instruments and would be based on the best available information. |
As of August 31, 2017, all of the securities in this Fund were valued based on Level 1 inputs (see the Schedule of Investments for security categories). The level assigned to the securities valuations may not be an indication of the risk or liquidity associated with investing in those securities. Because of the inherent uncertainties of valuation, the values reflected in the financial statements may materially differ from the value received upon actual sale of those investments.
The Fund’s policy is to recognize transfers in and out of the valuation levels as of the end of the reporting period. During the year ended August 31, 2017, there were no transfers between valuation levels.
17 Invesco Small Cap Discovery Fund
NOTE 4—Expense Offset Arrangement(s)
The expense offset arrangement is comprised of transfer agency credits which result from balances in demand deposit accounts used by the transfer agent for clearing shareholder transactions. For the year ended August 31, 2017, the Fund received credits from this arrangement, which resulted in the reduction of the Fund’s total expenses of $4,563.
NOTE 5—Trustees’ and Officers’ Fees and Benefits
Trustees’ and Officers’ Fees and Benefits include amounts accrued by the Fund to pay remuneration to certain Trustees and Officers of the Fund. Trustees have the option to defer compensation payable by the Fund, and Trustees’ and Officers’ Fees and Benefits also include amounts accrued by the Fund to fund such deferred compensation amounts. Those Trustees who defer compensation have the option to select various Invesco Funds in which their deferral accounts shall be deemed to be invested. Finally, certain current Trustees were eligible to participate in a retirement plan that provided for benefits to be paid upon retirement to Trustees over a period of time based on the number of years of service. The Fund may have certain former Trustees who also participate in a retirement plan and receive benefits under such plan. Trustees’ and Officers’ Fees and Benefits include amounts accrued by the Fund to fund such retirement benefits. Obligations under the deferred compensation and retirement plans represent unsecured claims against the general assets of the Fund.
NOTE 6—Cash Balances
The Fund is permitted to temporarily carry a negative or overdrawn balance in its account with State Street Bank and Trust Company, the custodian bank. Such balances, if any at period-end, are shown in the Statement of Assets and Liabilities under the payable caption Amount due custodian. To compensate the custodian bank for such overdrafts, the overdrawn Fund may either (1) leave funds as a compensating balance in the account so the custodian bank can be compensated by earning the additional interest; or (2) compensate by paying the custodian bank at a rate agreed upon by the custodian bank and Invesco, not to exceed the contractually agreed upon rate.
NOTE 7—Distributions to Shareholders and Tax Components of Net Assets
Tax Character of Distributions to Shareholders Paid During the Fiscal Years Ended August 31, 2017 and 2016:
| 2017 | 2016 | |||||||
Long-term capital gain | $ | 11,506,339 | $ | 101,565,201 | ||||
Tax Components of Net Assets at Period-End:
| 2017 | ||||
Undistributed long-term gain | $ | 66,845,511 | ||
Net unrealized appreciation — investments | 139,923,050 | |||
Temporary book/tax differences | (122,319 | ) | ||
Late-Year ordinary loss deferral | (3,473,991 | ) | ||
Shares of beneficial interest | 384,368,120 | |||
Total net assets | $ | 587,540,371 | ||
The difference between book-basis and tax-basis unrealized appreciation (depreciation) is due to differences in the timing of recognition of gains and losses on investments for tax and book purposes. The Fund’s net unrealized appreciation difference is attributable primarily to wash sales.
The temporary book/tax differences are a result of timing differences between book and tax recognition of income and/or expenses. The Fund’s temporary book/tax differences are the result of the trustee deferral of compensation and retirement plan benefits.
Capital loss carryforward is calculated and reported as of a specific date. Results of transactions and other activity after that date may affect the amount of capital loss carryforward actually available for the Fund to utilize. Capital losses generated in years beginning after December 22, 2010 can be carried forward for an unlimited period, whereas previous losses expire in eight tax years. Capital losses with an expiration period may not be used to offset capital gains until all net capital losses without an expiration date have been utilized. Capital loss carryforwards with no expiration date will retain their character as either short-term or long-term capital losses instead of as short-term capital losses as under prior law. The ability to utilize capital loss carryforwards in the future may be limited under the Internal Revenue Code and related regulations based on the results of future transactions.
The Fund does not have a capital loss carryforward as of August 31, 2017.
NOTE 8—Investment Transactions
The aggregate amount of investment securities (other than short-term securities, U.S. Treasury obligations and money market funds, if any) purchased and sold by the Fund during the year ended August 31, 2017 was $232,177,642 and $367,177,451, respectively. Cost of investments, including any derivatives, on a tax basis includes the adjustments for financial reporting purposes as of the most recently completed federal income tax reporting period-end.
| Unrealized Appreciation (Depreciation) of Investments on a Tax Basis | ||||
Aggregate unrealized appreciation of investments | $ | 152,551,948 | ||
Aggregate unrealized (depreciation) of investments | (12,628,898 | ) | ||
Net unrealized appreciation of investments | $ | 139,923,050 | ||
Cost of investments for tax purposes is $465,612,956.
18 Invesco Small Cap Discovery Fund
NOTE 9—Reclassification of Permanent Differences
Primarily as a result of differing book/tax treatment of net operating losses, on August 31, 2017, undistributed net investment income (loss) was increased by $5,336,557 and shares of beneficial interest was decreased by $5,336,557. This reclassification had no effect on the net assets of the Fund.
NOTE 10—Share Information
| Summary of Share Activity | ||||||||||||||||
| Years ended August 31, | ||||||||||||||||
| 2017(a) | 2016 | |||||||||||||||
| Shares | Amount | Shares | Amount | |||||||||||||
Sold: | ||||||||||||||||
Class A | 6,225,171 | $ | 59,749,548 | 10,510,102 | $ | 96,144,486 | ||||||||||
Class B | 6,621 | 55,777 | 15,713 | 129,314 | ||||||||||||
Class C | 630,097 | 4,848,036 | 1,047,514 | 7,716,524 | ||||||||||||
Class Y | 6,248,045 | 62,920,404 | 3,258,665 | 30,463,429 | ||||||||||||
Class R5 | 2,228,085 | 23,318,985 | 355,206 | 3,351,740 | ||||||||||||
Class R6 | 2,358,441 | 24,319,898 | 2,772,821 | 25,212,485 | ||||||||||||
Issued as reinvestment of dividends: | ||||||||||||||||
Class A | 813,772 | 7,470,426 | 7,611,829 | 67,364,684 | ||||||||||||
Class B | 10,309 | 82,579 | 132,016 | 1,021,804 | ||||||||||||
Class C | 135,218 | 983,032 | 1,347,333 | 9,552,594 | ||||||||||||
Class Y | 133,242 | 1,284,455 | 963,727 | 8,933,748 | ||||||||||||
Class R5 | 3,138 | 30,531 | 18,773 | 175,147 | ||||||||||||
Class R6 | 134,768 | 1,313,991 | 1,046,714 | 9,776,309 | ||||||||||||
Automatic conversion of Class B shares to Class A shares: | ||||||||||||||||
Class A | 202,667 | 1,968,302 | 195,627 | 1,727,054 | ||||||||||||
Class B | (232,156 | ) | (1,968,302 | ) | (222,666 | ) | (1,727,054 | ) | ||||||||
Reacquired: | ||||||||||||||||
Class A | (21,945,832 | ) | (209,698,469 | ) | (18,163,522 | ) | (161,148,703 | ) | ||||||||
Class B | (114,813 | ) | (945,214 | ) | (161,000 | ) | (1,269,312 | ) | ||||||||
Class C | (2,614,552 | ) | (19,793,529 | ) | (2,941,568 | ) | (21,149,439 | ) | ||||||||
Class Y | (5,488,309 | ) | (55,140,350 | ) | (5,148,089 | ) | (50,200,576 | ) | ||||||||
Class R5 | (313,297 | ) | (3,321,433 | ) | (809,051 | ) | (7,823,697 | ) | ||||||||
Class R6 | (3,279,087 | ) | (34,584,261 | ) | (3,087,219 | ) | (28,828,484 | ) | ||||||||
Net increase (decrease) in share activity | (14,858,472 | ) | $ | (137,105,594 | ) | (1,257,075 | ) | $ | (10,577,947 | ) | ||||||
| (a) | There are entities that are record owners of more than 5% of the outstanding shares of the Fund and in the aggregate own 20% of the outstanding shares of the Fund. IDI has an agreement with these entities to sell Fund shares. The Fund, Invesco and/or Invesco affiliates may make payments to these entities, which are considered to be related to the Fund, for providing services to the Fund, Invesco and/or Invesco affiliates including but not limited to services such as securities brokerage, distribution, third party record keeping and account servicing. The Fund has no knowledge as to whether all or any portion of the shares owned of record by these entities are also owned beneficially. |
19 Invesco Small Cap Discovery Fund
NOTE 11—Financial Highlights
The following schedule presents financial highlights for a share of the Fund outstanding throughout the periods indicated.
| Net asset value, beginning of period | Net investment income (loss)(a) | Net gains (losses) on securities (both realized and unrealized) | Total from investment operations | Distributions from net realized gains | Net asset value, end | Total return(b) | Net assets, end of period (000’s omitted) | Ratio of expenses to average net assets with fee waivers and/or expenses absorbed | Ratio of expenses to average net assets without fee waivers and/or expenses absorbed | Ratio of net investment income (loss) to average net assets | Portfolio turnover(c) | |||||||||||||||||||||||||||||||||||||
Class A | ||||||||||||||||||||||||||||||||||||||||||||||||
Year ended 08/31/17 | $ | 9.05 | $ | (0.08 | ) | $ | 1.58 | $ | 1.50 | $ | (0.17 | ) | $ | 10.38 | 16.87 | % | $ | 351,214 | 1.39 | %(d) | 1.39 | %(d) | (0.88 | )%(d) | 39 | % | ||||||||||||||||||||||
Year ended 08/31/16 | 10.60 | (0.08 | ) | (0.02 | ) | (0.10 | ) | (1.45 | ) | 9.05 | (0.61 | ) | 439,098 | 1.36 | 1.37 | (0.89 | ) | 39 | ||||||||||||||||||||||||||||||
Year ended 08/31/15 | 11.83 | (0.09 | ) | 0.61 | 0.52 | (1.75 | ) | 10.60 | 5.24 | 512,763 | 1.32 | 1.32 | (0.85 | ) | 63 | |||||||||||||||||||||||||||||||||
Year ended 08/31/14 | 12.20 | (0.10 | ) | 1.62 | 1.52 | (1.89 | ) | 11.83 | 13.15 | 527,759 | 1.32 | 1.32 | (0.85 | ) | 79 | |||||||||||||||||||||||||||||||||
Year ended 08/31/13 | 10.85 | (0.08 | ) | 2.56 | 2.48 | (1.13 | ) | 12.20 | 25.31 | 540,979 | 1.32 | 1.33 | (0.72 | ) | 70 | |||||||||||||||||||||||||||||||||
Class B | ||||||||||||||||||||||||||||||||||||||||||||||||
Year ended 08/31/17 | 7.92 | (0.07 | ) | 1.38 | 1.31 | (0.17 | ) | 9.06 | 16.87 | (e) | 2,260 | 1.39 | (d)(e) | 1.39 | (d)(e) | (0.88 | )(d)(e) | 39 | ||||||||||||||||||||||||||||||
Year ended 08/31/16 | 9.46 | (0.07 | ) | (0.02 | ) | (0.09 | ) | (1.45 | ) | 7.92 | (0.57 | )(e) | 4,587 | 1.36 | (e) | 1.37 | (e) | (0.89 | )(e) | 39 | ||||||||||||||||||||||||||||
Year ended 08/31/15 | 10.75 | (0.08 | ) | 0.54 | 0.46 | (1.75 | ) | 9.46 | 5.19 | (e) | 7,715 | 1.32 | (e) | 1.32 | (e) | (0.85 | )(e) | 63 | ||||||||||||||||||||||||||||||
Year ended 08/31/14 | 11.25 | (0.09 | ) | 1.48 | 1.39 | (1.89 | ) | 10.75 | 13.11 | (e) | 10,216 | 1.32 | (e) | 1.32 | (e) | (0.85 | )(e) | 79 | ||||||||||||||||||||||||||||||
Year ended 08/31/13 | 10.09 | (0.07 | ) | 2.36 | 2.29 | (1.13 | ) | 11.25 | 25.34 | (e) | 12,554 | 1.32 | (e) | 1.33 | (e) | (0.72 | )(e) | 70 | ||||||||||||||||||||||||||||||
Class C | ||||||||||||||||||||||||||||||||||||||||||||||||
Year ended 08/31/17 | 7.21 | (0.12 | ) | 1.26 | 1.14 | (0.17 | ) | 8.18 | 16.16 | (f) | 38,679 | 2.13 | (d)(f) | 2.13 | (d)(f) | (1.62 | )(d)(f) | 39 | ||||||||||||||||||||||||||||||
Year ended 08/31/16 | 8.81 | (0.12 | ) | (0.03 | ) | (0.15 | ) | (1.45 | ) | 7.21 | (1.39 | )(f) | 47,459 | 2.08 | (f) | 2.09 | (f) | (1.61 | )(f) | 39 | ||||||||||||||||||||||||||||
Year ended 08/31/15 | 10.19 | (0.15 | ) | 0.52 | 0.37 | (1.75 | ) | 8.81 | 4.50 | 62,773 | 2.07 | 2.07 | (1.60 | ) | 63 | |||||||||||||||||||||||||||||||||
Year ended 08/31/14 | 10.83 | (0.17 | ) | 1.42 | 1.25 | (1.89 | ) | 10.19 | 12.21 | 55,961 | 2.07 | 2.07 | (1.60 | ) | 79 | |||||||||||||||||||||||||||||||||
Year ended 08/31/13 | 9.82 | (0.15 | ) | 2.29 | 2.14 | (1.13 | ) | 10.83 | 24.43 | 53,560 | 2.07 | 2.08 | (1.47 | ) | 70 | |||||||||||||||||||||||||||||||||
Class Y | ||||||||||||||||||||||||||||||||||||||||||||||||
Year ended 08/31/17 | 9.49 | (0.06 | ) | 1.67 | 1.61 | (0.17 | ) | 10.93 | 17.25 | 96,321 | 1.14 | (d) | 1.14 | (d) | (0.63 | )(d) | 39 | |||||||||||||||||||||||||||||||
Year ended 08/31/16 | 11.02 | (0.06 | ) | (0.02 | ) | (0.08 | ) | (1.45 | ) | 9.49 | (0.39 | ) | 75,188 | 1.11 | 1.12 | (0.64 | ) | 39 | ||||||||||||||||||||||||||||||
Year ended 08/31/15 | 12.20 | (0.07 | ) | 0.64 | 0.57 | (1.75 | ) | 11.02 | 5.51 | 97,497 | 1.07 | 1.07 | (0.60 | ) | 63 | |||||||||||||||||||||||||||||||||
Year ended 08/31/14 | 12.50 | (0.07 | ) | 1.66 | 1.59 | (1.89 | ) | 12.20 | 13.42 | 114,973 | 1.07 | 1.07 | (0.60 | ) | 79 | |||||||||||||||||||||||||||||||||
Year ended 08/31/13 | 11.06 | (0.05 | ) | 2.62 | 2.57 | (1.13 | ) | 12.50 | 25.67 | 163,072 | 1.07 | 1.08 | (0.47 | ) | 70 | |||||||||||||||||||||||||||||||||
Class R5 | ||||||||||||||||||||||||||||||||||||||||||||||||
Year ended 08/31/17 | 9.57 | (0.05 | ) | 1.69 | 1.64 | (0.17 | ) | 11.04 | 17.42 | 23,137 | 0.94 | (d) | 0.94 | (d) | (0.43 | )(d) | 39 | |||||||||||||||||||||||||||||||
Year ended 08/31/16 | 11.08 | (0.04 | ) | (0.02 | ) | (0.06 | ) | (1.45 | ) | 9.57 | (0.18 | ) | 1,698 | 0.91 | 0.92 | (0.44 | ) | 39 | ||||||||||||||||||||||||||||||
Year ended 08/31/15 | 12.23 | (0.05 | ) | 0.65 | 0.60 | (1.75 | ) | 11.08 | 5.77 | 6,784 | 0.94 | 0.94 | (0.47 | ) | 63 | |||||||||||||||||||||||||||||||||
Year ended 08/31/14 | 12.52 | (0.05 | ) | 1.65 | 1.60 | (1.89 | ) | 12.23 | 13.49 | 45,126 | 0.94 | 0.94 | (0.47 | ) | 79 | |||||||||||||||||||||||||||||||||
Year ended 08/31/13(g) | 11.48 | (0.04 | ) | 2.21 | 2.17 | (1.13 | ) | 12.52 | 21.25 | 44,037 | 0.93 | (h) | 0.94 | (h) | (0.33 | )(h) | 70 | |||||||||||||||||||||||||||||||
Class R6 | ||||||||||||||||||||||||||||||||||||||||||||||||
Year ended 08/31/17 | 9.59 | (0.04 | ) | 1.69 | 1.65 | (0.17 | ) | 11.07 | 17.49 | 75,929 | 0.90 | (d) | 0.90 | (d) | (0.39 | )(d) | 39 | |||||||||||||||||||||||||||||||
Year ended 08/31/16 | 11.09 | (0.04 | ) | (0.01 | ) | (0.05 | ) | (1.45 | ) | 9.59 | (0.08 | ) | 73,299 | 0.86 | 0.87 | (0.39 | ) | 39 | ||||||||||||||||||||||||||||||
Year ended 08/31/15 | 12.25 | (0.04 | ) | 0.63 | 0.59 | (1.75 | ) | 11.09 | 5.66 | 76,687 | 0.85 | 0.85 | (0.38 | ) | 63 | |||||||||||||||||||||||||||||||||
Year ended 08/31/14 | 12.52 | (0.04 | ) | 1.66 | 1.62 | (1.89 | ) | 12.25 | 13.67 | 109,145 | 0.84 | 0.84 | (0.37 | ) | 79 | |||||||||||||||||||||||||||||||||
Year ended 08/31/13(g) | 11.48 | (0.03 | ) | 2.20 | 2.17 | (1.13 | ) | 12.52 | 21.25 | 68,425 | 0.83 | (h) | 0.84 | (h) | (0.23 | )(h) | 70 | |||||||||||||||||||||||||||||||
| (a) | Calculated using average shares outstanding. |
| (b) | Includes adjustments in accordance with accounting principles generally accepted in the United States of America and as such, the net asset value for financial reporting purposes and the returns based upon those net asset values may differ from the net asset value and returns for shareholder transactions. Does not include sales charges and is not annualized for periods less than one year, if applicable. |
| (c) | Portfolio turnover is calculated at the fund level and is not annualized for periods less than one year, if applicable. |
| (d) | Ratios are based on average daily net assets (000’s omitted) of $387,023, $3,430, $42,437, $88,187, $11,117 and $76,388 for Class A, Class B, Class C, Class Y, Class R5 and Class R6 shares, respectively. |
| (e) | The total return, ratio of expenses to average net assets and ratio of net investment income (loss) to average net assets for, Class B shares, reflect actual 12b-1 fees of 0.25% for each of the years ended August 31, 2017, 2016, 2015, 2014 and 2013, respectively. |
| (f) | The total return, ratio of expenses to average net assets and ratio of net investment income (loss) to average net assets, for Class C shares, reflect actual 12b-1 fees of 0.99% and 0.97% for the years ended August 31, 2017 and 2016, respectively. |
| (g) | Commencement date of September 24, 2012 for Class R5 and Class R6 shares. |
| (h) | Annualized. |
20 Invesco Small Cap Discovery Fund
Report of Independent Registered Public Accounting Firm
To the Board of Trustees of AIM Counselor Series Trust (Invesco Counselor Series Trust)
and Shareholders of Invesco Small Cap Discovery Fund:
In our opinion, the accompanying statement of assets and liabilities, including the schedule of investments, and the related statements of operations and of changes in net assets and the financial highlights present fairly, in all material respects, the financial position of Invesco Small Cap Discovery Fund (one of the funds constituting AIM Counselor Series Trust (Invesco Counselor Series Trust), hereafter referred to as the “Fund”) as of August 31, 2017, the results of its operations for the year then ended, the changes in its net assets for each of the two years in the period then ended and the financial highlights for each of the periods indicated therein, in conformity with accounting principles generally accepted in the United States of America. These financial statements and financial highlights (hereafter referred to as “financial statements”) are the responsibility of the Fund’s management. Our responsibility is to express an opinion on these financial statements based on our audits. We conducted our audits of these financial statements in accordance with the standards of the Public Company Accounting Oversight Board (United States). Those standards require that we plan and perform the audit to obtain reasonable assurance about whether the financial statements are free of material misstatement. An audit includes examining, on a test basis, evidence supporting the amounts and disclosures in the financial statements, assessing the accounting principles used and significant estimates made by management, and evaluating the overall financial statement presentation. We believe that our audits, which included confirmation of securities as of August 31, 2017 by correspondence with the custodian, transfer agent and brokers, and when replies were not received from brokers, we performed other auditing procedures, provide a reasonable basis for our opinion.
PricewaterhouseCoopers LLP
Houston, Texas
October 30, 2017
21 Invesco Small Cap Discovery Fund
Calculating your ongoing Fund expenses
Example
As a shareholder of the Fund, you incur two types of costs: (1) transaction costs, which may include sales charges (loads) on purchase payments or contingent deferred sales charges on redemptions, if any; and (2) ongoing costs, including management fees, distribution and/or service (12b-1) fees, and other Fund expenses. This example is intended to help you understand your ongoing costs (in dollars) of investing in the Fund and to compare these costs with ongoing costs of investing in other mutual funds. The example is based on an investment of $1,000 invested at the beginning of the period and held for the entire period March 1, 2017 through August 31, 2017.
Actual expenses
The table below provides information about actual account values and actual expenses. You may use the information in this table, together with the amount you invested, to estimate the expenses that you paid over the period. Simply divide your account value by $1,000 (for example, an $8,600 account value divided by $1,000 = 8.6), then multiply the result by the number in the table under the heading entitled “Actual Expenses Paid During Period” to estimate the expenses you paid on your account during this period.
Hypothetical example for comparison purposes
The table below also provides information about hypothetical account values and hypothetical expenses based on the Fund’s actual expense ratio and an assumed rate of return of 5% per year before expenses, which is not the Fund’s actual return.
The hypothetical account values and expenses may not be used to estimate the actual ending account balance or expenses you paid for the period. You may use this information to compare the ongoing costs of investing in the Fund and other funds. To do so, compare this 5% hypothetical example with the 5% hypothetical examples that appear in the shareholder reports of the other funds.
Please note that the expenses shown in the table are meant to highlight your ongoing costs only and do not reflect any transaction costs, such as sales charges (loads) on purchase payments or contingent deferred sales charges on redemptions, if any. Therefore, the hypothetical information is useful in comparing ongoing costs only, and will not help you determine the relative total costs of owning different funds. In addition, if these transaction costs were included, your costs would have been higher.
| Class | Beginning Account Value (03/01/17) | ACTUAL | HYPOTHETICAL (5% annual return before expenses) | Annualized Expense Ratio | ||||||||||||||||||||
| Ending Account Value (08/31/17)1 | Expenses Paid During Period2 | Ending Account Value (08/31/17) | Expenses Paid During Period2 | |||||||||||||||||||||
| A | $ | 1,000.00 | $ | 1,075.60 | $ | 7.17 | $ | 1,018.30 | $ | 6.97 | 1.37 | % | ||||||||||||
| B | 1,000.00 | 1,076.00 | 7.17 | 1,018.30 | 6.97 | 1.37 | ||||||||||||||||||
| C | 1,000.00 | 1,072.10 | 11.07 | 1,014.52 | 10.76 | 2.12 | ||||||||||||||||||
| Y | 1,000.00 | 1,076.80 | 5.86 | 1,019.56 | 5.70 | 1.12 | ||||||||||||||||||
| R5 | 1,000.00 | 1,078.10 | 4.77 | 1,020.62 | 4.63 | 0.91 | ||||||||||||||||||
| R6 | 1,000.00 | 1,078.90 | 4.61 | 1,020.77 | 4.48 | 0.88 | ||||||||||||||||||
| 1 | The actual ending account value is based on the actual total return of the Fund for the period March 1, 2017 through August 31, 2017, after actual expenses and will differ from the hypothetical ending account value which is based on the Fund’s expense ratio and a hypothetical annual return of 5% before expenses. |
| 2 | Expenses are equal to the Fund’s annualized expense ratio as indicated above multiplied by the average account value over the period, multiplied by 184/365 to reflect the most recent fiscal half year. |
22 Invesco Small Cap Discovery Fund
Approval of Investment Advisory and Sub-Advisory Contracts
The Board of Trustees (the Board) of AIM Counselor Series Trust (Invesco Counselor Series Trust) is required under the Investment Company Act of 1940, as amended, to approve annually the renewal of Invesco Small Cap Discovery Fund’s (the Fund) investment advisory agreements. During contract renewal meetings held on June 12-13, 2017, the Board as a whole, and the disinterested or “independent” Trustees, who comprise over 75% of the Board, voting separately, approved the continuance for the Fund of the Master Investment Advisory Agreement with Invesco Advisers, Inc. (Invesco Advisers and the investment advisory agreement) and the Master Intergroup Sub-Advisory Contract for Mutual Funds with Invesco Asset Management Deutschland GmbH, Invesco Asset Management Limited, Invesco Asset Management (Japan) Limited, Invesco Hong Kong Limited, Invesco Senior Secured Management, Inc. and Invesco Canada Ltd. (collectively, the Affiliated Sub-Advisers and the sub-advisory contracts) for another year, effective July 1, 2017.
In evaluating the fairness and reasonableness of compensation under the Fund’s investment advisory agreement and sub-advisory contracts, the Board considered, among other things, the factors discussed below. The Board determined that continuation of the Fund’s investment advisory agreement and the sub-advisory contracts is in the best interest of the Fund and its shareholders and that the compensation payable to Invesco Advisers and the Affiliated Sub-Advisers under the agreements is fair and reasonable.
The Board’s Fund Evaluation Process
The Board’s Investments Committee has established three Sub-Committees, which meet throughout the year to review the performance of funds advised by Invesco Advisers (the Invesco Funds). Over the course of each year, the Sub-Committees meet with portfolio managers for their assigned Invesco Funds and other members of management to review the performance, investment objective(s), policies, strategies, limitations and investment risks of these funds. The Board had the benefit of reports from the Sub-Committees and Investments Committee throughout the year in considering approval of the continuance of each Invesco Fund’s investment advisory agreement and sub-advisory contracts for another year.
During the contract renewal process, the Board receives comparative performance and fee data regarding the Invesco Funds prepared by Invesco Advisers and Broadridge Financial Solutions, Inc. (Broadridge), an independent provider of investment company data. The Board also receives an independent written evaluation from the Senior Officer, an officer of the Invesco Funds who reports directly to the independent Trustees. The Senior Officer’s
evaluation is prepared as part of his responsibility to manage the process by which the Invesco Funds’ proposed management fees are negotiated during the annual contract renewal process to ensure they are negotiated in a manner that is at arms’ length and reasonable. In addition to meetings with Invesco Advisers and fund counsel, the independent Trustees also discuss the continuance of the investment advisory agreement and sub-advisory contracts in separate sessions with the Senior Officer and with independent legal counsel.
The Trustees recognized that the advisory fee rates for the Invesco Funds are, in most cases, the result of years of review and negotiation. The Trustees’ deliberations and conclusions in a particular year may be based in part on their deliberations and conclusions regarding these arrangements throughout the year and in prior years. The Trustees’ review and conclusions are based on the comprehensive consideration of all information presented to them and are not the result of any single determinative factor. Moreover, one Trustee may have weighed a particular piece of information or factor differently than another Trustee.
The discussion below is a summary of the Senior Officer’s independent written evaluation with respect to the Fund’s investment advisory agreement as well as a discussion of the material factors and related conclusions that formed the basis for the Board’s approval of the Fund’s investment advisory agreement and sub-advisory contracts. This information is current as of June 13, 2017, and does not reflect consideration of factors that became known to the Board after that date.
Factors and Conclusions and Summary of Independent Written Fee Evaluation
| A. | Nature, Extent and Quality of Services Provided by Invesco Advisers and the Affiliated Sub-Advisers |
The Board reviewed the advisory services provided to the Fund by Invesco Advisers under the Fund’s investment advisory agreement, the performance of Invesco Advisers in providing these services, and the credentials and experience of the officers and employees of Invesco Advisers who provide these services, including the Fund’s portfolio manager or managers. The Board’s review included consideration of Invesco Advisers’ investment process oversight, credit analysis and investment risk management. The Board also considered non-advisory services that Invesco Advisers and its affiliates provide to the Invesco Funds such as various back office support functions, trading operations, internal audit, valuation and legal and compliance.
In determining whether to continue the Fund’s investment advisory agreement, the Board considered the benefits of reapproving an
existing relationship as contrasted with the greater uncertainty that may be associated with entering into a new relationship. The Board concluded that the nature, extent and quality of the services provided to the Fund by Invesco Advisers are appropriate and satisfactory.
The Board reviewed the services that may be provided by the Affiliated Sub-Advisers under the sub-advisory contracts and the credentials and experience of the officers and employees of the Affiliated Sub-Advisers who provide these services. The Board noted that the Affiliated Sub-Advisers have offices and personnel that are located in financial centers around the world. As a result, the Board noted that the Affiliated Sub-Advisers can provide research and investment analysis on the markets and economies of various countries in which the Fund may invest, make recommendations regarding securities and assist with security trades. The Board concluded that the sub-advisory contracts may benefit the Fund and its shareholders by permitting Invesco Advisers to use the resources and talents of the Affiliated Sub-Advisers in managing the Fund. The Board concluded that the nature, extent and quality of the services that may be provided by the Affiliated Sub-Advisers are appropriate and satisfactory.
| B. | Fund Investment Performance |
The Board considered Fund investment performance as a relevant factor in considering whether to approve the investment advisory agreement. The Board did not view Fund performance as a relevant factor in considering whether to approve the sub-advisory contracts for the Fund, as no Affiliated Sub-Adviser currently manages assets of the Fund.
The Board compared the Fund’s investment performance over multiple time periods ending December 31, 2016 to the performance of funds in the Broadridge performance universe and against the Lipper Small-Cap Growth Funds Index. The Board noted that performance of Class A shares of the Fund was in the fifth quintile of its performance universe for the one year period and the fourth quintile for the three and five years periods (the first quintile being the best performing funds and the fifth quintile being the worst performing funds). The Board noted that performance of Class A shares of the Fund was below the performance of the Index for the one, three and five year periods. The Trustees also reviewed more recent Fund performance and this review did not change their conclusions.
| C. | Advisory and Sub-Advisory Fees |
The Board compared the Fund’s contractual management fee rate to the contractual management fee rates of funds in the Fund’s Broadridge expense group at a common asset level. The Board noted that the contractual management fee rate for Class A shares of the Fund was below the median contractual
23 Invesco Small Cap Discovery Fund
management fee rate of funds in its expense group. The Board noted that the term “contractual management fee” for funds in the expense group may include both advisory and certain administrative services fees, but that Broadridge does not provide information on a fund by fund basis as to what is included. The Board noted that Invesco Advisers does not separately charge the Invesco Funds for the administrative services included in the term as defined by Broadridge. The Board also reviewed the methodology used by Broadridge in providing expense group information, which includes using each fund’s contractual management fee schedule (including any applicable breakpoints) as reported in the most recent prospectus or statement of additional information for each fund in the expense group.
The Board also noted how the Fund’s rate compared to the effective sub-adviser fee rate of one other fund sub-advised by Invesco Advisers. The Board noted that Invesco Advisers and the Affiliated Sub-Advisers do not manage other client accounts with investment strategies comparable to those of the Fund.
The Board also considered the services that may be provided by the Affiliated Sub-Advisers pursuant to the sub-advisory contracts, as well as the fees payable by Invesco Advisers to the Affiliated Sub-Advisers pursuant to the sub-advisory contracts. The Board also noted that the sub-advisory fees are not paid directly by the Fund, but rather, are payable by Invesco Advisers to the Affiliated Sub-Advisers.
| D. | Economies of Scale and Breakpoints |
The Board considered the extent to which there are economies of scale in the provision of advisory services to the Fund. The Board also considered that the Fund benefits from economies of scale through contractual breakpoints in the Fund’s advisory fee schedule. The Board noted that the Fund shares directly in economies of scale through lower fees charged by third party service providers based on the combined size of the Invesco Funds advised by Invesco Advisers.
| E. | Profitability and Financial Resources |
The Board reviewed information from Invesco Advisers concerning the costs of the advisory and other services that Invesco Advisers and its affiliates provide to the Fund and the Invesco Funds and the profitability of Invesco Advisers and its affiliates in providing these services. The Board noted that Invesco Advisers continues to operate at a net profit from services Invesco Advisers and its affiliates provide to the Invesco Funds and the Fund. The Board did not deem the level of profits realized by Invesco Advisers and its affiliates from providing services to the Fund to be excessive given the nature, quality and extent of the services provided. The Board received and accepted information from Invesco Advisers demonstrating that Invesco Advisers and each Affiliated Sub-Adviser are financially sound and have the resources necessary to perform their obligations under the investment advisory agreement and sub-advisory contracts.
| F. | Collateral Benefits to Invesco Advisers and its Affiliates |
The Board considered various other benefits received by Invesco Advisers and its affiliates from the relationship with the Fund, including the fees received for providing transfer agency and distribution services to the Fund. The Board considered comparative information regarding fees charged for these services, including information provided by Broadridge and other independent sources. The Board considered the performance of Invesco Advisers and its affiliates in providing these services and the organizational structure employed to provide these services. The Board also considered that these services are provided to the Fund pursuant to written contracts that are reviewed and approved on an annual basis by the Board; and that the services are required for the operation of the Fund.
The Board considered the benefits realized by Invesco Advisers and the Affiliated Sub-Advisers as a result of portfolio brokerage transactions executed through “soft dollar” arrangements. The Board noted that soft dollar arrangements may result in the Fund bearing costs to purchase research that may be used by Invesco Advisers or the Affiliated Sub-Advisers with other clients and may reduce Invesco Adviser’s or the Affiliated Sub-Adviser’s expenses. The Board also considered that it receives periodic reports from the Chief Compliance Officer of the Invesco Funds demonstrating that these arrangements are consistent with regulatory requirements. The Board did not deem the soft dollar arrangements to be inappropriate.
The Board considered that the Fund’s uninvested cash and cash collateral from any securities lending arrangements may be invested in money market funds advised by Invesco Advisers pursuant to procedures approved by the Board. The Board noted that Invesco Advisers receives advisory fees from these affiliated money market funds attributable to such investments, although Invesco Advisers has contractually agreed to waive through varying periods the advisory fees payable by the Invesco Funds with respect to certain investments in the affiliated money market funds. The waiver is in an amount equal to 100% of the net advisory fee Invesco Advisers receives from the affiliated money market funds with respect to the Fund’s investment in the affiliated money market funds of uninvested cash, but not cash collateral. The Board concluded that the amount of advisory fees received by Invesco Advisers from the Fund’s investment of cash collateral from any securities lending arrangements in the affiliated money market funds is fair and reasonable.
The Board also considered that the Fund may use an affiliated broker to execute certain trades for the Fund to, among other things, control information leakage, and was advised that such trades would be executed in compliance with rules under the federal securities laws and consistent with best execution obligations.
24 Invesco Small Cap Discovery Fund
Tax Information
Form 1099-DIV, Form 1042-S and other year-end tax information provide shareholders with actual calendar year amounts that should be included in their tax returns. Shareholders should consult their tax advisors.
The following distribution information is being provided as required by the Internal Revenue Code or to meet a specific state’s requirement.
The Fund designates the following amounts or, if subsequently determined to be different, the maximum amount allowable for its fiscal year ended August 31, 2017:
Federal and State Income Tax | ||||
Long-Term Capital Gain Distributions | $ | 11,506,339 | ||
Qualified Dividend Income* | 0.00 | % | ||
Corporate Dividends Received Deduction* | 0.00 | % | ||
U.S. Treasury Obligations* | 0.00 | % | ||
Tax-Exempt Interest Dividends* | 0.00 | % | ||
| * | The above percentages are based on ordinary income dividends paid to shareholders during the Fund’s fiscal year. |
25 Invesco Small Cap Discovery Fund
Proxy Results
A Special Joint Meeting (“Meeting”) of Shareholders of Invesco Small Cap Discovery Fund, an investment portfolio of AIM Counselor Series Trust (Invesco Counselor Series Trust), a Delaware statutory trust (“Trust”), was held on March 9, 2017. The Meeting was held for the following purposes:
| (1) | Elect 15 trustees to the Board, each of whom will serve until his or her successor is elected and qualified. |
| (2) | Approve an amendment to the Trust’s Agreement and Declaration of Trust that would permit fund mergers and other significant transactions upon the Board’s approval but without shareholder approval of such transactions. |
The results of the voting on the above matters were as follows:
| Matters | Votes For | Votes Withheld | ||||||||||||||||
| (1)* | David C. Arch | 1,425,647,604 | 36,521,875 | |||||||||||||||
| James T. Bunch | 1,425,181,099 | 36,988,380 | ||||||||||||||||
| Bruce L. Crockett | 1,425,174,694 | 36,994,785 | ||||||||||||||||
| Jack M. Fields | 1,426,060,874 | 36,108,605 | ||||||||||||||||
| Martin L. Flanagan | 1,426,481,477 | 35,688,002 | ||||||||||||||||
| Cynthia Hostetler | 1,426,489,972 | 35,679,505 | ||||||||||||||||
| Dr. Eli Jones | 1,426,255,832 | 35,913,647 | ||||||||||||||||
| Dr. Prema Mathai-Davis | 1,425,363,789 | 36,805,689 | ||||||||||||||||
| Teresa M. Ressel | 1,426,514,880 | 35,654,598 | ||||||||||||||||
| Dr. Larry Soll | 1,424,932,245 | 37,237,234 | ||||||||||||||||
| Ann Barnett Stern | 1,426,260,049 | 35,909,429 | ||||||||||||||||
| Raymond Stickel, Jr. | 1,425,391,657 | 36,777,822 | ||||||||||||||||
| Philip A. Taylor | 1,426,285,212 | 35,884,267 | ||||||||||||||||
| Robert C. Troccoli | 1,426,075,097 | 36,094,382 | ||||||||||||||||
| Christopher L. Wilson | 1,426,594,956 | 35,574,523 | ||||||||||||||||
| Votes For | Votes Against | Votes Abstain | Broker Non-Votes | |||||||||||||||
| (2)* | Approve an amendment to the Trust’s Agreement and Declaration of Trust that would permit fund mergers and other significant transactions upon the Board’s approval but without shareholder approval of such transactions | 751,302,707 | 79,810,344 | 41,561,890 | 589,495,482 | |||||||||||||
The Meeting was adjourned until April 11, 2017, with respect to the following proposals:
| (3) | Approve changing the fundamental investment restriction regarding the purchase or sale of physical commodities. |
| 4(a) | Approve an amendment to the current Master Intergroup Sub-Advisory Contract to add Invesco PowerShares Capital Management LLC. |
| 4(b) | Approve an amendment to the current Master Intergroup Sub-Advisory Contract to add Invesco Asset Management (India) Private Limited. |
Invesco Small Cap Discovery Fund did not receive sufficient shareholder votes to pass Proposals 3 and 4(a) - (b).
The results of the voting on the above matters were as follows:
| Matters | Votes For | Votes Against | Votes Abstain | Broker Non-Votes | ||||||||||||||
| (3) | Approve changing the fundamental investment restriction regarding the purchase or sale of physical commodities | 23,046,220 | 2,585,972 | 898,997 | 12,327,051 | |||||||||||||
| 4(a) | Approve an amendment to the current Master Intergroup Sub-Advisory Contract to add Invesco PowerShares Capital Management LLC | 23,672,233 | 2,000,238 | 858,729 | 12,327,040 | |||||||||||||
| 4(b) | Approve an amendment to the current Master Intergroup Sub-Advisory Contract to add Invesco Asset Management (India) Private Limited | 23,449,874 | 2,133,350 | 947,973 | 12,327,043 | |||||||||||||
| * | Each of proposal 1 and 2 required approval by a combined vote of all of the portfolios of AIM Counselor Series Trust (Invesco Counselor Series Trust). |
26 Invesco Small Cap Discovery Fund
Trustees and Officers
The address of each trustee and officer is AIM Counselor Series Trust (Invesco Counselor Series Trust) (the “Trust”), 11 Greenway Plaza, Suite 1000, Houston, Texas 77046-1173. The trustees serve for the life of the Trust, subject to their earlier death, incapacitation, resignation, retirement or removal as more specifically provided in the Trust’s organizational documents. Each officer serves for a one year term or until their successors are elected and qualified. Column two below includes length of time served with predecessor entities, if any.
| Name, Year of Birth and Position(s) Held with the Trust | Trustee and/ or Officer Since | Principal Occupation(s) During Past 5 Years | Number of Overseen by | Other Directorship(s) Held by Trustee During Past 5 Years | ||||
| Interested Persons | ||||||||
| Martin L. Flanagan1 — 1960 Trustee | 2007 | Executive Director, Chief Executive Officer and President, Invesco Ltd. (ultimate parent of Invesco and a global investment management firm); Trustee, The Invesco Funds; Vice Chair, Investment Company Institute; and Member of Executive Board, SMU Cox School of Business
Formerly: Advisor to the Board, Invesco Advisers, Inc. (formerly known as Invesco Institutional (N.A.), Inc.); Chairman and Chief Executive Officer, Invesco Advisers, Inc. (registered investment adviser); Director, Chairman, Chief Executive Officer and President, Invesco Holding Company (US), Inc. (formerly IVZ Inc.) (holding company), Invesco Group Services, Inc. (service provider) and Invesco North American Holdings, Inc. (holding company); Director, Chief Executive Officer and President, Invesco Holding Company Limited (parent of Invesco and a global investment management firm); Director, Invesco Ltd.; Chairman, Investment Company Institute and President, Co-Chief Executive Officer, Co-President, Chief Operating Officer and Chief Financial Officer, Franklin Resources, Inc. (global investment management organization) | 144 | None | ||||
Philip A. Taylor2 — 1954 Trustee and Senior Vice President | 2006 | Head of the Americas and Senior Managing Director, Invesco Ltd.; Director, Invesco Advisers, Inc. (formerly known as Invesco Institutional (N.A.), Inc.) (registered investment adviser); Director, Chairman, Chief Executive Officer and President, Invesco Management Group, Inc. (formerly known as Invesco Aim Management Group, Inc.) (financial services holding company); Director and Chairman, Invesco Investment Services, Inc. (formerly known as Invesco Aim Investment Services, Inc.) (registered transfer agent); Chief Executive Officer, Invesco Corporate Class Inc. (corporate mutual fund company); Director, Chairman and Chief Executive Officer, Invesco Canada Ltd. (formerly known as Invesco Trimark Ltd./Invesco Trimark Ltèe) (registered investment adviser and registered transfer agent); Trustee and Senior Vice President, The Invesco Funds; Director, Invesco Investment Advisers LLC (formerly known as Van Kampen Asset Management).
Formerly: Co-Chairman, Co-President and Co-Chief Executive Officer, Invesco Advisers, Inc. (formerly known as Invesco Institutional (N.A.), Inc.) (registered investment adviser); Director, Chief Executive Officer and President, Van Kampen Exchange Corp; President and Principal Executive Officer, The Invesco Funds (other than AIM Treasurer’s Series Trust (Invesco Treasurer’s Series Trust), Short-Term Investments Trust and Invesco Management Trust); Executive Vice President, The Invesco Funds (AIM Treasurer’s Series Trust (Invesco Treasurer’s Series Trust), Short-Term Investments Trust and Invesco Management Trust only); Director and President, INVESCO Funds Group, Inc. (registered investment adviser and registered transfer agent); Director and Chairman, IVZ Distributors, Inc. (formerly known as INVESCO Distributors, Inc.) (registered broker dealer); Director, President and Chairman, Invesco Inc. (holding company), Invesco Canada Holdings Inc. (holding company), Trimark Investments Ltd./Placements Trimark Ltèe and Invesco Financial Services Ltd/Services Financiers Invesco Ltèe; Chief Executive Officer, Invesco Canada Fund Inc. (corporate mutual fund company); Director and Chairman, Van Kampen Investor Services Inc.; Director, Chief Executive Officer and President, 1371 Preferred Inc. (holding company) and Van Kampen Investments Inc.; Director and President, AIM GP Canada Inc. (general partner for limited partnerships) and Van Kampen Advisors, Inc.; Director and Chief Executive Officer, Invesco Trimark Dealer Inc. (registered broker dealer); Director, Invesco Distributors, Inc. (formerly known as Invesco Aim Distributors, Inc.) (registered broker dealer); Manager, Invesco PowerShares Capital Management LLC; Director, Chief Executive Officer and President, Invesco Advisers, Inc.; Director, Chairman, Chief Executive Officer and President, Invesco Aim Capital Management, Inc.; President, Invesco Trimark Dealer Inc. and Invesco Trimark Ltd./Invesco Trimark Ltèe; Director and President, AIM Trimark Corporate Class Inc. and AIM Trimark Canada Fund Inc.; Senior Managing Director, Invesco Holding Company Limited; Director and Chairman, Fund Management Company (former registered broker dealer); President and Principal Executive Officer, The Invesco Funds (AIM Treasurer’s Series Trust (Invesco Treasurer’s Series Trust), and Short-Term Investments Trust only); President, AIM Trimark Global Fund Inc. and AIM Trimark Canada Fund Inc. | 144 | None |
| 1 | Mr. Flanagan is considered an interested person (within the meaning of Section 2(a)(19) of the 1940 Act) of the Trust because he is an officer of the Adviser to the Trust, and an officer and a director of Invesco Ltd., ultimate parent of the Adviser. |
| 2 | Mr. Taylor is considered an interested person (within the meaning of Section 2(a)(19) of the 1940 Act) of the Trust because he is an officer and a director of the Adviser. |
T-1 Invesco Small Cap Discovery Fund
Trustees and Officers—(continued)
| Name, Year of Birth and Position(s) Held with the Trust | Trustee and/ or Officer Since | Principal Occupation(s) During Past 5 Years | Number of Complex Overseen by Trustee | Other Directorship(s) Held by Trustee During | ||||
| Independent Trustees | ||||||||
Bruce L. Crockett — 1944 Trustee and Chair | 2003 | Chairman, Crockett Technologies Associates (technology consulting company)
Formerly: Director, Captaris (unified messaging provider); Director, President and Chief Executive Officer, COMSAT Corporation; Chairman, Board of Governors of INTELSAT (international communications company); ACE Limited (insurance company); Independent Directors Council and Investment Company Institute: Member of the Audit Committee, Investment Company Institute; Member of the Executive Committee and Chair of the Governance Committee, Independent Directors Council | 144 | Director and Chairman of the Audit Committee, ALPS (Attorneys Liability Protection Society) (insurance company); Director and Member of the Audit Committee, Ferroglobe PLC (metallurgical company) | ||||
David C. Arch — 1945 Trustee | 2010 | Chairman of Blistex Inc. (consumer health care products manufacturer); Member, World Presidents’ Organization | 144 | Board member of the Illinois Manufacturers’ Association | ||||
James T. Bunch — 1942 Trustee | 2000 | Managing Member, Grumman Hill Group LLC (family office/private equity investments)
Formerly: Chairman of the Board, Denver Film Society; Chairman of the Board of Trustees, Evans Scholarship Foundation; Chairman, Board of Governors, Western Golf Association | 144 | Trustee, Evans Scholarship Foundation | ||||
Jack M. Fields — 1952 Trustee | 2003 | Chief Executive Officer, Twenty First Century Group, Inc. (government affairs company); and Discovery Learning Alliance (non-profit)
Formerly: Owner and Chief Executive Officer, Dos Angeles Ranch L.P. (cattle, hunting, corporate entertainment); Director, Insperity, Inc. (formerly known as Administaff); Chief Executive Officer, Texana Timber LP (sustainable forestry company); Director of Cross Timbers Quail Research Ranch (non-profit); and member of the U.S. House of Representatives | 144 | None | ||||
Cynthia Hostetler — 1962 Trustee | 2017 | Non-Executive Director and Trustee of a number of public and private business corporations
Formerly: Head of Investment Funds and Private Equity, Overseas Private Investment Corporation; President, First Manhattan Bancorporation, Inc.; Attorney, Simpson Thacher & Bartlett LLP | 144 | Vulcan Materials Company (construction materials company); Trilinc Global Impact Fund; Aberdeen Investment Funds (4 portfolios); Artio Global Investment LLC (mutual fund complex); Edgen Group, Inc. (specialized energy and infrastructure products distributor) | ||||
Eli Jones — 1961 Trustee | 2016 | Professor and Dean, Mays Business School — Texas A&M University
Formerly: Professor and Dean, Walton College of Business, University of Arkansas and E.J. Ourso College of Business, Louisiana State University; Director, Arvest Bank | 144 | Insperity, Inc. (formerly known as Administaff) (human resources provider) | ||||
Prema Mathai-Davis — 1950 Trustee | 2003 | Retired.
Formerly: Chief Executive Officer, YWCA of the U.S.A. | 144 | None | ||||
Teresa M. Ressel — 1962 Trustee | 2017 | Non-executive director and trustee of a number of public and private business corporations
Formerly: Chief Financial Officer, Olayan America, The Olayan Group (international investor/commercial/industrial); Chief Executive Officer, UBS Securities LLC; Group Chief Operating Officer, Americas, UBS AG; Assistant Secretary for Management & Budget and CFO, US Department of the Treasury; Chief Compliance Officer, Kaiser Permanente; Program Manager, Hewlett-Packard; Nuclear Engineering, General Dynamics Corporation | 144 | Atlantic Power Corporation (power generation company); ON Semiconductor Corp. (semiconductor supplier) | ||||
Larry Soll — 1942 Trustee | 1997 | Retired.
Formerly: Chairman, Chief Executive Officer and President, Synergen Corp. (a biotechnology company) | 144 | None | ||||
Ann Barnett Stern — 1957 Trustee | 2017 | President and Chief Executive Officer, Houston Endowment Inc. (private philanthropic institution)
Formerly: Executive Vice President and General Counsel, Texas Children’s Hospital; Attorney, Beck, Redden and Secrest, LLP; Business Law Instructor, University of St. Thomas; Attorney, Andrews & Kurth LLP | 144 | Federal Reserve Bank of Dallas | ||||
Raymond Stickel, Jr. — 1944 Trustee | 2005 | Retired.
Formerly: Director, Mainstay VP Series Funds, Inc. (25 portfolios); Partner, Deloitte & Touche | 144 | None | ||||
Robert C. Troccoli — 1949 Trustee | 2016 | Adjunct Professor, University of Denver — Daniels College of Business
Formerly: Senior Partner, KPMG LLP | 144 | None | ||||
Christopher L. Wilson — 1957 Trustee | 2017 | Managing Partner, CT2, LLC (investing and consulting firm)
Formerly: President/Chief Executive Officer, Columbia Funds, Bank of America Corporation; President/Chief Executive Officer, CDC IXIS Asset Management Services, Inc.; Principal & Director of Operations, Scudder Funds, Scudder, Stevens & Clark, Inc.; Assistant Vice President, Fidelity Investments | 144 | TD Asset Management USA Inc. (mutual fund complex) (22 portfolios); ISO New England, Inc. (non-profit organization managing regional electricity market) |
T-2 Invesco Small Cap Discovery Fund
Trustees and Officers—(continued)
| Name, Year of Birth and Position(s) Held with the Trust | Trustee and/ or Officer Since | Principal Occupation(s) During Past 5 Years | Number of Complex Overseen by Trustee | Other Directorship(s) Held by Trustee During | ||||
| Other Officers | ||||||||
Sheri Morris — 1964 President, Principal Executive Officer and Treasurer | 2003 | President, Principal Executive Officer and Treasurer, The Invesco Funds; Vice President, Invesco Advisers, Inc. (formerly known as Invesco Institutional (N.A.), Inc.) (registered investment adviser); and Vice President, PowerShares Exchange-Traded Fund Trust, PowerShares Exchange-Traded Fund Trust II, PowerShares India Exchange-Traded Fund Trust, PowerShares Actively Managed Exchange-Traded Fund Trust and PowerShares Actively Managed Exchange-Traded Commodity Fund Trust
Formerly: Vice President and Principal Financial Officer, The Invesco Funds; Vice President, Invesco Aim Advisers, Inc., Invesco Aim Capital Management, Inc. and Invesco Aim Private Asset Management, Inc.; Assistant Vice President and Assistant Treasurer, The Invesco Funds and Assistant Vice President, Invesco Advisers, Inc., Invesco Aim Capital Management, Inc. and Invesco Aim Private Asset Management, Inc.; and Treasurer, PowerShares Exchange-Traded Fund Trust, PowerShares Exchange-Traded Fund Trust II, PowerShares India Exchange-Traded Fund Trust and PowerShares Actively Managed Exchange-Traded Fund Trust | N/A | N/A | ||||
Russell C. Burk — 1958 Senior Vice President and Senior Officer | 2005 | Senior Vice President and Senior Officer, The Invesco Funds | N/A | N/A | ||||
John M. Zerr — 1962 Senior Vice President, Chief Legal Officer and Secretary | 2006 | Director, Senior Vice President, Secretary and General Counsel, Invesco Management Group, Inc. (formerly known as Invesco AIM Management Group, Inc.); Senior Vice President, Invesco Advisers, Inc. (formerly known as Invesco Institutional (N.A.), Inc.) (registered investment adviser); Senior Vice President and Secretary, Invesco Distributors, Inc. (formerly known as Invesco AIM Distributors, Inc.); Director, Vice President and Secretary, Invesco Investment Services, Inc. (formerly known as Invesco AIM Investment Services, Inc.) Senior Vice President, Chief Legal Officer and Secretary, The Invesco Funds; Managing Director, Invesco PowerShares Capital Management LLC; Director, Secretary and General Counsel, Invesco Investment Advisers LLC (formerly known as Van Kampen Asset Management); Secretary and General Counsel, Invesco Capital Markets, Inc. (formerly known as Van Kampen Funds Inc.) and Chief Legal Officer, PowerShares Exchange-Traded Fund Trust, PowerShares Exchange-Traded Fund Trust II, PowerShares India Exchange-Traded Fund Trust, PowerShares Actively Managed Exchange-Traded Fund Trust and PowerShares Actively Managed Exchange-Traded Commodity Fund Trust; Manager and Secretary, Invesco Indexing LLC
Formerly: Director, Secretary, General Counsel and Senior Vice President, Van Kampen Exchange Corp.; Director, Vice President and Secretary, IVZ Distributors, Inc. (formerly known as INVESCO Distributors, Inc.); Director and Vice President, INVESCO Funds Group, Inc.; Director and Vice President, Van Kampen Advisors Inc.; Director, Vice President, Secretary and General Counsel, Van Kampen Investor Services Inc.; Director, Invesco Distributors, Inc. (formerly known as Invesco AIM Distributors, Inc.); Director, Senior Vice President, General Counsel and Secretary, Invesco AIM Advisers, Inc. and Van Kampen Investments Inc.; Director, Vice President and Secretary, Fund Management Company; Director, Senior Vice President, Secretary, General Counsel and Vice President, Invesco AIM Capital Management, Inc.; Chief Operating Officer and General Counsel, Liberty Ridge Capital, Inc. (an investment adviser); Vice President and Secretary, PBHG Funds (an investment company) and PBHG Insurance Series Fund (an investment company); Chief Operating Officer, General Counsel and Secretary, Old Mutual Investment Partners (a broker-dealer); General Counsel and Secretary, Old Mutual Fund Services (an administrator) and Old Mutual Shareholder Services (a shareholder servicing center); Executive Vice President, General Counsel and Secretary, Old Mutual Capital, Inc. (an investment adviser); and Vice President and Secretary, Old Mutual Advisors Funds (an investment company) | N/A | N/A | ||||
Gregory G. McGreevey — 1962 Senior Vice President | 2012 | Senior Managing Director, Invesco Ltd.; Director, Chairman, President, and Chief Executive Officer, Invesco Advisers, Inc. (formerly known as Invesco Institutional (N.A.), Inc.) (registered investment adviser); Director, Invesco Mortgage Capital, Inc. and Invesco Senior Secured Management, Inc.; and Senior Vice President, The Invesco Funds
Formerly: Assistant Vice President, The Invesco Funds | N/A | N/A | ||||
Kelli Gallegos — 1970 Vice President, Principal Financial Officer and Assistant Treasurer | 2008 | Vice President, Principal Financial Officer and Assistant Treasurer, The Invesco Funds; Assistant Treasurer, Invesco PowerShares Capital Management LLC, PowerShares Exchange-Traded Fund Trust, PowerShares Exchange-Traded Fund Trust II, PowerShares India Exchange-Traded Fund Trust, PowerShares Actively Managed Exchange-Traded Fund Trust and PowerShares Actively Managed Exchange-Traded Commodity Fund Trust
Formerly: Assistant Vice President, The Invesco Funds | N/A | N/A |
T-3 Invesco Small Cap Discovery Fund
Trustees and Officers—(continued)
| Name, Year of Birth and Position(s) Held with the Trust | Trustee and/ or Officer Since | Principal Occupation(s) During Past 5 Years | Number of Complex Overseen by Trustee | Other Directorship(s) Held by Trustee During | ||||
| Other Officers—(continued) | ||||||||
Tracy Sullivan — 1962 Vice President, Chief Tax Officer and Assistant Treasurer | 2008 | Vice President, Chief Tax Officer and Assistant Treasurer, The Invesco Funds; Assistant Treasurer, Invesco PowerShares Capital Management LLC, PowerShares Exchange-Traded Fund Trust, PowerShares Exchange-Traded Fund Trust II, PowerShares India Exchange-Traded Fund Trust, PowerShares Actively Managed Exchange-Traded Fund Trust and PowerShares Actively Managed Exchange-Traded Commodity Fund Trust
Formerly: Assistant Vice President, The Invesco Funds | N/A | N/A | ||||
Crissie M. Wisdom — 1969 Anti-Money Laundering Compliance Officer | 2013 | Anti-Money Laundering Compliance Officer, Invesco Advisers, Inc. (formerly known as Invesco Institutional (N.A.), Inc.) (registered investment adviser), Invesco Capital Markets, Inc. (formerly known as Van Kampen Funds Inc.), Invesco Distributors, Inc., Invesco Investment Services, Inc., Invesco Management Group, Inc., The Invesco Funds, and PowerShares Exchange-Traded Fund Trust, PowerShares Exchange-Traded Fund Trust II, PowerShares India Exchange-Traded Fund Trust, PowerShares Actively Managed Exchange-Traded Fund Trust and PowerShares Actively Managed Exchange-Traded Commodity Fund Trust; Anti-Money Laundering Compliance Officer and Bank Secrecy Act Officer, INVESCO National Trust Company and Invesco Trust Company; and Fraud Prevention Manager and Controls and Risk Analysis Manager for Invesco Investment Services, Inc.
Formerly: Anti-Money Laundering Compliance Officer, Van Kampen Exchange Corp. | N/A | N/A | ||||
Robert R. Leveille — 1969 Chief Compliance Officer | 2016 | Chief Compliance Officer, Invesco Advisers, Inc. (registered investment adviser); and Chief Compliance Officer, The Invesco Funds
Formerly: Chief Compliance Officer, Putnam Investments and the Putnam Funds | N/A | N/A |
The Statement of Additional Information of the Trust includes additional information about the Fund’s Trustees and is available upon request, without charge, by calling 1.800.959.4246. Please refer to the Fund’s Statement of Additional Information for information on the Fund’s sub-advisers.
Office of the Fund 11 Greenway Plaza, Suite 1000 Houston, TX 77046-1173 | Investment Adviser Invesco Advisers, Inc. 1555 Peachtree Street, N.E. Atlanta, GA 30309 | Distributor Invesco Distributors, Inc. 11 Greenway Plaza, Suite 1000 Houston, TX 77046-1173 | Auditors PricewaterhouseCoopers LLP 1000 Louisiana Street, Suite 5800 Houston, TX 77002-5678 | |||
Counsel to the Fund Stradley Ronon Stevens & Young, LLP 2005 Market Street, Suite 2600 Philadelphia, PA 19103-7018 | Counsel to the Independent Trustees Goodwin Procter LLP 901 New York Avenue, N.W. Washington, D.C. 20001 | Transfer Agent Invesco Investment Services, Inc. 11 Greenway Plaza, Suite 1000 Houston, TX 77046-1173 | Custodian State Street Bank and Trust Company 225 Franklin Street Boston, MA 02110-2801 | |||
T-4 Invesco Small Cap Discovery Fund
Explore High-Conviction Investing with Invesco

Go paperless with eDelivery
Visit invesco.com/edelivery to enjoy the convenience and security of anytime electronic access to your investment documents.
With eDelivery, you can elect to have any or all of the following materials delivered straight to your inbox to download, save and print from your own computer:
∎ Fund reports and prospectuses
∎ Quarterly statements
∎ Daily confirmations
∎ Tax forms
Invesco mailing information
Send general correspondence to Invesco Investment Services, Inc., P.O. Box 219078, Kansas City, MO 64121-9078.
Important notice regarding delivery of security holder documents
To reduce Fund expenses, only one copy of most shareholder documents may be mailed to shareholders with multiple accounts at the same address (Householding). Mailing of your shareholder documents may be householded indefinitely unless you instruct us otherwise. If you do not want the mailing of these documents to be combined with those for other members of your household, please contact Invesco Investment Services, Inc. at 800 959 4246 or contact your financial institution. We will begin sending you individual copies for each account within 30 days after receiving your request.
Fund holdings and proxy voting information
The Fund provides a complete list of its holdings four times in each fiscal year, at the quarter ends. For the second and fourth quarters, the lists appear in the Fund’s semiannual and annual reports to shareholders. For the first and third quarters, the Fund files the lists with the Securities and Exchange Commission (SEC) on Form N-Q. The most recent list of portfolio holdings is available at invesco.com/completeqtrholdings. Shareholders can also look up the Fund’s Forms N-Q on the SEC website at sec.gov. Copies of the Fund’s Forms N-Q may be reviewed and copied at the SEC Public Reference Room in Washington, D.C. You can obtain information on the operation of the Public Reference Room, including information about duplicating fee charges, by calling 202 551 8090 or 800 732 0330, or by electronic request at the following email address: publicinfo@sec.gov. The SEC file numbers for the Fund are shown below.
A description of the policies and procedures that the Fund uses to determine how to vote proxies relating to portfolio securities is available without charge, upon request, from our Client Services department at 800 959 4246 or at invesco.com/proxyguidelines.
The information is also available on the SEC website, sec.gov.
Information regarding how the Fund voted proxies related to its portfolio securities during the most recent 12-month period ended June 30 is available at invesco.com/proxysearch. The information is also available on the SEC website, sec.gov. Invesco Advisers, Inc. is an investment adviser; it provides investment advisory services to individual and institutional clients and does not sell securities. Invesco Distributors, Inc. is the US distributor for Invesco Ltd.’s retail mutual funds, exchange-traded funds and institutional money market funds. Both are wholly owned, indirect subsidiaries of Invesco Ltd. |  |
SEC file numbers: 811-09913 and 333-36074 Invesco Distributors, Inc. VK-SCD-AR-1 10172017 1558
| ||||
 | Annual Report to Shareholders
| August 31, 2017
| ||
| ||||
Invesco Strategic Real Return Fund
| ||||
| Nasdaq: | ||||
| A: SRRAX § C: SRRCX § R: SRRQX § Y: SRRYX § R5: SRRFX § R6: SRRSX | ||||

Letters to Shareholders
Philip Taylor | Dear Shareholders: This annual report includes information about your Fund, including performance data and a complete list of its investments as of the close of the reporting period. Inside is a discussion of how your Fund was managed and the factors that affected its performance during the reporting period. The reporting period began with stock market volatility in the US and abroad, largely the result of uncertainty about global economic growth and monetary policy. While economic data in the US were generally positive, news overseas was less upbeat. The European Central Bank and central banks in China and Japan – as well as other countries – maintained extraordinarily accommodative monetary policies in response to economic weakness. Citing generally positive economic data – specifically, realized and expected labor market conditions and inflation – the US Federal Reserve raised interest rates three times during the reporting period: in December 2016, and in March and June 2017. The |

major US stock market rally that began in November 2016 continued through the end of the reporting period, with major stock market indexes repeatedly hitting new record highs.
Short-term market volatility can prompt some investors to abandon their investment plans – and can cause others to settle for whatever returns the market has to offer. The investment professionals at Invesco, in contrast, invest with high conviction. This means that, no matter the asset class or the strategy, each investment team has a passion to exceed. We want to help investors achieve better outcomes, such as seeking higher returns, helping mitigate risk and generating income. Of course, investing with high conviction can’t guarantee a profit or ensure success; no investment strategy can. To learn more about how we invest with high conviction, visit invesco.com/HighConviction.
You, too, can invest with high conviction by maintaining a long-term investment perspective and by working with your financial adviser on a regular basis. During periods of short-term market volatility or uncertainty, your financial adviser can keep you focused on your long-term investment goals – a new home, a child’s college education or a secure retirement. He or she also can share research about the economy, the markets and individual investment options.
Visit our website for more information on your investments
Our website, invesco.com/us, offers a wide range of market insights and investment perspectives. On the website, you’ll find detailed information about our funds, including performance, holdings and portfolio manager commentaries. You can access information about your account by completing a simple, secure online registration. To do so, select “Log In” on the right side of the homepage, and then select “Register for Individual Account Access.”
In addition to the resources accessible on our website and through our mobile app, you can obtain timely updates to help you stay informed about the markets and the economy by connecting with Invesco on Twitter, LinkedIn or Facebook. You can access our blog at blog.invesco.us.com. Our goal is to provide you the information you want, when and where you want it.
Finally, I’m pleased to share with you Invesco’s commitment to both the Principles for Responsible Investment and to considering environmental, social and governance issues in our robust investment process. I invite you to learn more at invesco.com/esg.
Have questions?
For questions about your account, contact an Invesco client services representative at 800 959 4246. For Invesco-related questions or comments, please email me directly at phil@invesco.com.
All of us at Invesco look forward to serving your investment management needs. Thank you for investing with us.
Sincerely,

Philip Taylor
Senior Managing Director, Invesco Ltd.
2 Invesco Strategic Real Return Fund
Bruce Crockett | Dear Fellow Shareholders: Among the many important lessons I’ve learned in more than 40 years in a variety of business endeavors is the value of a trusted advocate. As independent chair of the Invesco Funds Board, I can assure you that the members of the Board are strong advocates for the interests of investors in Invesco’s mutual funds. We work hard to represent your interests through oversight of the quality of the investment management services your funds receive and other matters important to your investment, including but not limited to: ∎ Ensuring that Invesco offers a diverse lineup of mutual funds that your financial adviser can use to strive to meet your financial needs as your investment goals change over time. ∎ Monitoring how the portfolio management teams of the Invesco funds are performing in light of changing economic and market conditions. |

| ∎ | Assessing each portfolio management team’s investment performance within the context of the investment strategy described in the fund’s prospectus. |
| ∎ | Monitoring for potential conflicts of interests that may impact the nature of the services that your funds receive. |
We believe one of the most important services we provide our fund shareholders is the annual review of the funds’ advisory and sub-advisory contracts with Invesco Advisers and its affiliates. This review is required by the Investment Company Act of 1940 and focuses on the nature and quality of the services Invesco provides as the adviser to the Invesco funds and the reasonableness of the fees that it charges for those services. Each year, we spend months carefully reviewing information received from Invesco and a variety of independent sources, such as performance and fee data prepared by Lipper, Inc. (a subsidiary of Broadridge Financial Solutions, Inc.), an independent, third-party firm widely recognized as a leader in its field. We also meet with our independent legal counsel and other independent advisers to review and help us assess the information that we have received. Our goal is to assure that you receive quality investment management services for a reasonable fee.
I trust the measures outlined above provide assurance that you have a worthy advocate when it comes to choosing the Invesco Funds.
As always, please contact me at bruce@brucecrockett.com with any questions or concerns you may have. On behalf of the Board, we look forward to continuing to represent your interests and serving your needs.
Sincerely,

Bruce L. Crockett
Independent Chair
Invesco Funds Board of Trustees
3 Invesco Strategic Real Return Fund
Management’s Discussion of Fund Performance
Performance summary
For the fiscal year ended August 31, 2017, Class A shares of Invesco Strategic Real Return Fund (the Fund), at net asset value (NAV), underperformed the Fund’s style-specific benchmark, the Custom Invesco Strategic Real Return Index.
Your Fund’s long-term performance appears later in this report.
Fund vs. Indexes
Total returns, 8/31/16 to 8/31/17, at net asset value (NAV). Performance shown does not include applicable contingent deferred sales charges (CDSC) or front-end sales charges, which would have reduced performance.
Class A Shares | 3.27% | |||
Class C Shares | 2.49 | |||
Class R Shares | 3.00 | |||
Class Y Shares | 3.52 | |||
Class R5 Shares | 3.52 | |||
Class R6 Shares | 3.52 | |||
| The BofA Merrill Lynch Current 10-Year Treasury Indexq (Broad Market Index) | -3.26 | |||
Custom Invesco Strategic Real Return Index∎ (Style-Specific Index) | 4.08 | |||
Lipper Inflation Protected Bond Funds Index¨ (Peer Group Index) | 0.83 |
Source(s): qBloomberg L.P.; ∎Invesco, Bloomberg L.P., FactSet Research Systems Inc.,
S&P Dow Jones Indices LLC; ¨Lipper Inc.
Market conditions and your Fund
The fiscal year began with markets impacted by the lingering effects of the UK’s decision to leave the European Union and concerns over a global economic slowdown. Concerns were somewhat misplaced as investors realized that spillover effects to Europe and elsewhere would be minor. A major theme throughout fixed income markets during the latter part of 2016 was one of reflation and growth. Playing into this was the outcome of the US presidential election and global central bank policy expectations, particularly the actions of the US Federal Reserve (the Fed). Yields on intermediate-term government bonds in developed markets around the globe rose steadily during October 2016, reacting to improved economic growth data and central bank tactics, most notably the Bank of Japan’s announcement of yield curve control, which effectively targeted the 10-year bond’s yield around zero percent. Following the results of the US presidential election, government yields spiked as the president-elect’s policies were viewed as significantly positive for US growth and reflation with significant personal and corporate tax reductions,
infrastructure spending and renegotiated trade agreements potentially having the effect of boosting US gross domestic product. Fed policy further supported rising yields and a steepening of the yield curve in late 2016. Additionally, Fed rhetoric of a stronger US economy and significantly improved employment picture indicated an eventual December 2016 interest rate hike and alluded to additional rate hikes in 2017.
The new year brought on a backdrop of global growth, tightening financial conditions and political uncertainty. In a fully anticipated move, the Fed hiked the federal funds rate in March by 25 basis points to a range of 0.75% to 1.00%.1 (A basis point is one one-hundredth of a percentage point.) The statement accompanying the 25 basis point increase and official Fed forecasts, however, suggested a more gradual path of interest rate hikes than the tone of earlier communications had led the market to expect. This shift in tone helped ease pressure on US Treasuries, which subsequently led other core government bond yields lower.
Amid this backdrop, the US experienced surprisingly low inflation. After
peaking at 2.7% in February, annual growth in the Consumer Price Index (CPI) dropped steadily to 1.7% by July as decreasing prices caused headwinds.2 Despite the lag in inflation, the Fed raised the federal funds target rate another 25 basis points at its June meeting, stating that the US economy is strengthening and any weakness in inflation was transitory.1 In the final two months of the reporting period, longer-maturity US Treasury yields dropped lower due to political tensions between the US and North Korea in addition to the steady decline in inflation. However, yields on 10-year US Treasuries stood at 2.12% as of August 31, 2017, 54 basis points higher than at the beginning of the reporting period.3
In this environment, US Treasury inflation protected securities (TIPS) posted positive returns and outperformed their nominal US Treasury counterparts on a maturity-matched basis as yields on nominal US Treasuries rose more than real yields for TIPS during the reporting period. The difference between yields on a maturity-matched basis and nominal yields on US Treasuries and TIPS is a measure of inflation expectations, also known as breakeven inflation (the amount of inflation needed for TIPS to break even with nominal Treasuries). During the reporting period, inflation expectations increased as nominal rates increased more than real rates given the overall reflationary tone, thus breakeven inflation widened. Returns in the US senior secured loan market were driven by positive risk sentiment, solid borrower fundamentals and steady demand for the asset class. US high yield bonds generated strong returns and fared the best of the primary three asset classes in which the Fund invests – bank loans, high yield securities and TIPS. Credit spreads tightened as the market was driven by global growth and a snapback in commodity prices coming off of the lows set in 2016.
The Fund employs a diversified investment approach in an attempt to manage inflation risk. The Fund invests in bank loans and high yield securities, in addition
Portfolio Composition |
| |||
By security type | % of total net assets | |||
U.S. Treasury Securities | 44.9 | % | ||
Common Stocks | 30.0 | |||
Bonds & Notes | 20.5 | |||
Preferred Stocks | 3.5 | |||
Money Market Funds Plus Other Assets Less Liabilities | 1.1 | |||
| Top Five Debt Issuers* | ||||||
| % of total net assets | ||||||
| 1. | U.S. Treasury | 44.9 | % | |||
| 2. | Starwood Property Trust, Inc. | 0.5 | ||||
| 3. | DISH Network Corp. | 0.4 | ||||
| 4. | Sprint Corp. | 0.4 | ||||
| 5. | HCA, Inc. | 0.4 | ||||
Total Net Assets | $ | 27.6 million | ||
Total Number of Holdings* | 327 | |||
The Fund’s holdings are subject to change, and there is no assurance that the Fund will continue to hold any particular security.
*Excluding money market fund holdings.
Data presented here are as of August 31, 2017.
4 Invesco Strategic Real Return Fund
to TIPS. Historically, these three asset classes have performed well in inflationary environments, while offering competitive yields. In addition to the three primary asset classes, the investment team may make opportunistic investments in other asset classes that it believes have favorable prospects for current income in inflationary environments. The Fund generated positive returns for the reporting period but underperformed its style-specific benchmark, the Custom Invesco Strategic Real Return Index. The most notable detractor from the Fund’s relative performance was the Fund’s security selection within high yield corporates. The Fund’s security selection within senior secured loans was the largest contributor to relative performance during the reporting period. The Fund remains largely invested in bank loans, high yield bonds and TIPS with opportunistic allocations to convertible securities, emerging market debt and investment grade corporate credit.
We wish to remind you that the Fund is subject to interest rate risk, meaning when interest rates rise, the value of fixed income securities tends to fall. This risk may be greater in the current market environment because interest rates are at or near historic lows. The degree to which the value of fixed income securities may decline due to rising interest rates may vary depending on the speed and magnitude of the increase in interest rates, as well as individual security characteristics such as price, maturity, duration and coupon and market forces such as supply and demand for similar securities.
The Fund also invests in senior secured loans, which are an asset class that behaves differently from many traditional fixed income investments. The interest income generated by a portfolio of senior secured loans is usually determined by a fixed credit spread over the London Inter bank Offered Rate (Libor). Because senior secured loans generally have a very short duration and the coupons or interest rates are usually adjusted every 30 to 90 days as Libor changes, the yield on the portfolio adjusts. Interest rate risk refers to the tendency for traditional fixed income prices to decline when interest rates rise. For senior secured loans, however, interest rates and income are variable and the prices of loans are therefore less sensitive to interest rate changes than traditional fixed income bonds – and senior secured loans provide a natural hedge against rising interest rates. We are monitoring interest rates,
as well as the market, economic and geopolitical factors that may impact the direction, speed and magnitude of changes to interest rates across the maturity spectrum, including the potential impact of monetary policy changes by the Fed and certain central banks. If interest rates rise, markets may experience increased volatility, which may affect the value and/or liquidity of certain of the Fund’s investments or the market price of the Fund’s shares.
During the reporting period, the Fund achieved returns from diversified inflation-sensitive securities. This remains a key goal of the Fund.
Thank you for your investment in Invesco Strategic Real Return Fund.
1 Source: US Federal Reserve
2 Source: Bureau of Labor Statistics
3 Source: US Treasury Department
The views and opinions expressed in management’s discussion of Fund performance are those of Invesco Advisers, Inc. These views and opinions are subject to change at any time based on factors such as market and economic conditions. These views and opinions may not be relied upon as investment advice or recommendations, or as an offer for a particular security. The information is not a complete analysis of every aspect of any market, country, industry, security or the Fund. Statements of fact are from sources considered reliable, but Invesco Advisers, Inc. makes no representation or warranty as to their completeness or accuracy. Although historical performance is no guarantee of future results, these insights may help you understand our investment management philosophy.
See important Fund and, if applicable, index disclosures later in this report.
 | Robert Young Chartered Financial Analyst, Portfolio Manager, is lead manager of Invesco Strategic Real Return | |
| Fund. He joined Invesco in 2001. Mr. Young earned a BA in economics from Cornell University and an MBA in finance and international business from Fordham University. | ||
 | Tom Ewald Portfolio Manager, is manager of Invesco Strategic Real Return Fund. He joined Invesco or its | |
| investment advisory affiliates in 2000. Mr. Ewald earned a BA from Harvard College and an MBA from the Darden School of Business at the University of Virginia. | ||
 | Scott Roberts Chartered Financial Analyst, Portfolio Manager, is manager of Invesco Strategic Real Return Fund. He | |
| joined Invesco in 2000. Mr. Roberts earned a BBA in finance from the University of Houston. | ||
 | Brian Schneider Chartered Financial Analyst, Portfolio Manager, is manager of Invesco Strategic Real Return Fund. He | |
| joined Invesco in 1987. Mr. Schneider earned a BA in economics and an MBA from Bellarmine University (formerly Bellarmine College). | ||
5 Invesco Strategic Real Return Fund
Your Fund’s Long-Term Performance
Results of a $10,000 Investment – Oldest Share Class(es) since Inception
Fund and index data from 4/30/14
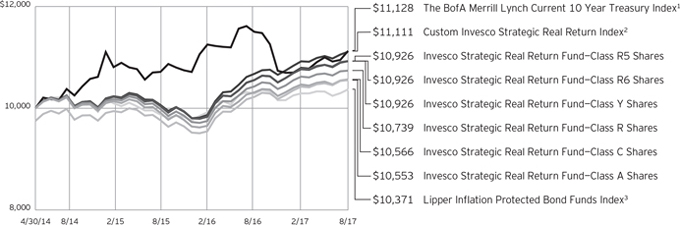
| 1 | Source: Bloomberg L.P. |
| 2 | Source(s): Invesco, Bloomberg L.P., FactSet Research Systems Inc., S&P Dow Jones Indices LLC |
| 3 | Source: Lipper Inc. |
Past performance cannot guarantee comparable future results.
The data shown in the chart include reinvested distributions, applicable sales charges and Fund expenses including
management fees. Index results include reinvested dividends, but they do not reflect sales charges. Performance of the peer group, if applicable, reflects fund expenses and management fees; performance
of a market index does not. Performance shown in the chart and table(s) does not reflect deduction of taxes a shareholder would pay on Fund distributions or sale of Fund shares.
continued from page 10
| ∎ | The S&P/LSTA Leveraged Loan Total Return Index is a market value-weighted index designed to measure the performance of the US leveraged loan market based upon market weightings, spreads and interest payments. |
| ∎ | The BofA Merrill Lynch U.S. High Yield Constrained Index contains all the securities in The BofA Merrill Lynch U.S. High Yield Index but caps issuer exposure at 2%. |
| ∎ | The Fund is not managed to track the performance of any particular index, including the index(es) described here, and consequently, the performance of the Fund may deviate significantly from the performance of the index(es). |
| ∎ | A direct investment cannot be made in an index. Unless otherwise indicated, index results include reinvested dividends, and they do not reflect sales charges. Performance of the peer group, if applicable, reflects fund expenses; performance of a market index does not. |
| ∎ | Merrill Lynch, Pierce, Fenner & Smith Incorporated and its affiliates (“BofAML”) indices and related information, the name “Bank of America Merrill Lynch,” and related trademarks, are intellectual property licensed from BofAML, and may not be copied, used or distributed without BofAML’s prior written approval. The licensee’s products have not been passed on as to their legality or suitability, and are not regulated, issued, endorsed, sold, guaranteed or promoted by |
BofAML. BOFAML MAKES NO WARRANTIES AND BEARS NO LIABILITY WITH RESPECT TO THE INDICES, ANY RELATED INFORMATION, ITS TRADEMARKS, OR THE PRODUCT(S) (INCLUDING WITHOUT LIMITATION, THEIR QUALITY, ACCURACY, SUITABILITY AND/OR COMPLETENESS).
Other information
| ∎ | The returns shown in management’s discussion of Fund performance are based on net asset values (NAVs) calculated for shareholder transactions. Generally accepted accounting principles require adjustments to be made to the net assets of the Fund at period end for financial reporting purposes, and as such, the NAVs for shareholder transactions and the returns based on those NAVs may differ from the NAVs and returns reported in the Financial Highlights. |
6 Invesco Strategic Real Return Fund
Average Annual Total Returns |
| |||
As of 8/31/17, including maximum applicable sales charges
|
| |||
Class A Shares | ||||
Inception (4/30/14) | 1.62 | % | ||
1 Year | 0.69 | |||
Class C Shares | ||||
Inception (4/30/14) | 1.66 | % | ||
1 Year | 1.50 | |||
Class R Shares | ||||
Inception (4/30/14) | 2.16 | % | ||
1 Year | 3.00 | |||
Class Y Shares | ||||
Inception (4/30/14) | 2.69 | % | ||
1 Year | 3.52 | |||
Class R5 Shares | ||||
Inception (4/30/14) | 2.69 | % | ||
1 Year | 3.52 | |||
Class R6 Shares | ||||
Inception (4/30/14) | 2.69 | % | ||
1 Year | 3.52 | |||
The performance data quoted represent past performance and cannot guarantee comparable future results; current performance may be lower or higher. Please visit invesco.com/performance for the most recent month-end performance. Performance figures reflect reinvested distributions, changes in net asset value and the effect of the maximum sales charge unless otherwise stated. Investment return and principal value will fluctuate so that you may have a gain or loss when you sell shares.
The net annual Fund operating expense ratio set forth in the most recent Fund prospectus as of the date of this report for Class A, Class C, Class R, Class Y, Class R5 and Class R6 shares was 0.82%, 1.57%, 1.07%, 0.57%, 0.57%, and 0.57%, respectively.1,2 The total annual Fund operating expense ratio set forth in the most recent Fund prospectus as of the date of this report for Class A, Class C, Class R, Class Y, Class R5 and Class R6 shares was 2.57%, 3.32%, 2.82%, 2.32%, 2.37% and 2.37%, respectively.3 The expense ratios presented above may vary from the expense ratios presented in other sections of this report that are based on expenses incurred during the period covered by this report.
Class A share performance reflects the maximum 2.50% sales charge, and Class C share performance reflects the applicable contingent deferred sales
Average Annual Total Returns |
| |||
| As of 6/30/17, the most recent calendar quarter end, including maximum applicable sales charges | ||||
Class A Shares | ||||
Inception (4/30/14) | 1.40 | % | ||
1 Year | 1.49 | |||
Class C Shares | ||||
Inception (4/30/14) | 1.45 | % | ||
1 Year | 2.34 | |||
Class R Shares | ||||
Inception (4/30/14) | 1.98 | % | ||
1 Year | 3.86 | |||
Class Y Shares | ||||
Inception (4/30/14) | 2.48 | % | ||
1 Year | 4.38 | |||
Class R5 Shares | ||||
Inception (4/30/14) | 2.48 | % | ||
1 Year | 4.38 | |||
Class R6 Shares | ||||
Inception (4/30/14) | 2.51 | % | ||
1 Year | 4.49 | |||
charge (CDSC) for the period involved. The CDSC on Class C shares is 1% for the first year after purchase. Class R, Class Y, Class R5 and Class R6 shares do not have a front-end sales charge or a CDSC; therefore, performance is at net asset value.
The performance of the Fund’s share classes will differ primarily due to different sales charge structures and class expenses.
Fund performance reflects any applicable fee waivers and/or expense reimbursements. Had the adviser not waived fees and/or reimbursed expenses currently or in the past, returns would have been lower. See current prospectus for more information.
| 1 | Total annual Fund operating expenses after any contractual fee waivers and/or expense reimbursements by the adviser in effect through at least December 31, 2017. See current prospectus for more information. |
| 2 | Total annual Fund operating expenses after any contractual fee waivers and/or expense reimbursements by the adviser in effect through at least June 30, 2019. See current prospectus for more information. |
| 3 | The expense ratio includes acquired fund fees and expenses of the underlying funds in which the Fund invests of 0.23% for Invesco Strategic Real Return Fund. |
7 Invesco Strategic Real Return Fund
Invesco Strategic Real Return Fund’s investment objective is to seek to mitigate the effects of unanticipated inflation and to provide current income.
| ∎ | Unless otherwise stated, information presented in this report is as of August 31, 2017, and is based on total net assets. |
| ∎ | Unless otherwise noted, all data provided by Invesco. |
| ∎ | To access your Fund’s reports/prospectus, visit invesco.com/fundreports. |
About share classes
| ∎ | Class R shares are generally available only to employer sponsored retirement and benefit plans. Please see the prospectus for more information. |
| ∎ | Class Y shares are available only to certain investors. Please see the prospectus for more information. |
| ∎ | Class R5 shares and Class R6 shares are available for use by retirement plans that meet certain standards and for institutional investors. Class R6 shares are also available through intermediaries that have established an agreement with Invesco Distributors, Inc. to make such shares available for use in retail omnibus accounts. Please see the prospectus for more information. |
Principal risks of investing in the Fund
| ∎ | Asset-backed securities risk. Asset-backed securities are subject to prepayment or call risk, which is the risk that a borrower’s payments may be received earlier or later than expected due to changes in prepayment rates on underlying loans, which could result in the Fund reinvesting these early payments at lower interest rates, thereby reducing the Fund’s income. Asset-backed securities also are subject to extension risk, which is the risk that a rise in interest rates could reduce the rate of prepayments, causing the price of the asset-backed securities and the Fund’s share price to fall. |
| ∎ | Bank loan risk. There are a number of risks associated with an investment in bank loans including credit risk, interest rate risk, liquidity risk and prepayment risk. Lack of an active trading market, restrictions on resale, irregular trading activity, wide bid/ask spreads and extended trade settlement periods may impair the Fund’s ability to sell bank loans within its desired time frame or at an acceptable price and its ability to accurately value existing and prospective investments. Extended |
trade settlement periods may result in cash not being immediately available to the Fund. As a result, the Fund may have to sell other investments or engage in borrowing transactions to raise cash to meet its obligations. The risk of holding bank loans is also directly tied to the risk of insolvency or bankruptcy of the issuing banks. These risks could cause the Fund to lose income or principal on a particular investment, which in turn could affect the Fund’s returns. The value of bank loans can be affected by and sensitive to changes in government regulation and to economic downturns in the United States and abroad. Bank loans generally are floating rate loans, which are subject to interest rate risk as the interest paid on the floating rate loans adjusts periodically based on changes in widely accepted reference rates. |
| ∎ | Changing fixed income market conditions risk. The current low interest rate environment was created in part by the Federal Reserve Board (FRB) and certain foreign central banks keeping the federal funds and equivalent foreign rates near, at or below zero. Increases in the federal funds and equivalent foreign rates may expose fixed income markets to heightened volatility and reduced liquidity for certain fixed income investments, particularly those with longer maturities. In addition, decreases in fixed income dealer market-making capacity may also potentially lead to heightened volatility and reduced liquidity in the fixed income markets. As a result, the value of the Fund’s investments and share price may decline. Changes in central bank policies could also result in higher than normal shareholder redemptions, which could potentially increase portfolio turnover and the Fund’s transaction costs. |
| ∎ | Collateralized loan obligations (CLO) risk. CLOs are subject to the risks of substantial losses due to actual defaults by underlying borrowers, which will be greater during periods of |
economic or financial stress. CLOs may also lose value due to collateral defaults and disappearance of subordinate tranches, market anticipation of defaults, and investor aversion to CLO securities as a class. The risks of CLOs will be greater if the Fund invests in CLOs that hold loans of uncreditworthy borrowers or if the Fund holds subordinate tranches of the CLO that absorbs losses from the defaults before senior tranches. In addition, CLOs are subject to interest rate risk and credit risk. |
| ∎ | Convertible securities risk. The market values of convertible securities are affected by market interest rates, the risk of actual issuer default on interest or principal payments and the value of the underlying common stock into which the convertible security may be converted. Additionally, a convertible security is subject to the same types of market and issuer risks as apply to the underlying common stock. In addition, certain convertible securities are subject to involuntary conversions and may undergo principal write-downs upon the occurrence of certain triggering events, and, as a result, are subject to an increased risk of loss. Convertible securities may be rated below investment grade. |
| ∎ | Debt securities risk. The prices of debt securities held by the Fund will be affected by changes in interest rates, the creditworthiness of the issuer and other factors. An increase in prevailing interest rates typically causes the value of existing debt securities to fall and often has a greater impact on longer-duration debt securities and higher quality debt securities. Falling interest rates will cause the Fund to reinvest the proceeds of debt securities that have been repaid by the issuer at lower interest rates. Falling interest rates may also reduce the Fund’s distributable income because interest payments on floating rate debt instruments held by the Fund will decline. The Fund could lose money on investments in debt securities if the issuer or borrower fails to meet its obligations to make interest payments and/or to repay principal in a timely manner. Changes in an issuer’s financial strength, the market’s perception of such strength or in the credit rating of the issuer or the security may affect the value of debt securities. The Adviser’s |
| This report must be accompanied or preceded by a currently effective Fund prospectus, which contains more complete information, including sales charges and expenses. Investors should read it carefully before investing. |
| NOT FDIC INSURED | MAY LOSE VALUE | NO BANK GUARANTEE |
8 Invesco Strategic Real Return Fund
| credit analysis may fail to anticipate such changes, which could result in buying a debt security at an inopportune time or failing to sell a debt security in advance of a price decline or other credit event. |
| ∎ | Defaulted securities risk. Defaulted securities pose a greater risk that principal will not be repaid than non-defaulted securities. Defaulted securities and any securities received in an exchange for such securities may be subject to restrictions on resale. |
| ∎ | Derivatives risk. The value of a derivative instrument depends largely on (and is derived from) the value of an underlying security, currency, commodity, interest rate, index or other asset (each referred to as an underlying asset). In addition to risks relating to the underlying assets, the use of derivatives may include other, possibly greater, risks, including counterparty, leverage and liquidity risks. Counterparty risk is the risk that the counterparty to the derivative contract will default on its obligation to pay the Fund the amount owed or otherwise perform under the derivative contract. Derivatives create leverage risk because they do not require payment up front equal to the economic exposure created by owning the derivative. As a result, an adverse change in the value of the underlying asset could result in the Fund sustaining a loss that is substantially greater than the amount invested in the derivative, which may make the Fund’s returns more volatile and increase the risk of loss. Derivative instruments may also be less liquid than more traditional investments and the Fund may be unable to sell or close out its derivative positions at a desirable time or price. This risk may be more acute under adverse market conditions, during which the Fund may be most in need of liquidating its derivative positions. Derivatives may also be harder to value, less tax efficient and subject to changing government regulation that could impact the Fund’s ability to use certain derivatives or their cost. Also, derivatives used for hedging or to gain or limit exposure to a particular market segment may not provide the expected benefits, particularly during adverse market conditions. |
| ∎ | Emerging markets securities risk. Emerging markets (also referred to as developing markets) are generally subject to greater market volatility, political, social and economic instability, uncertain trading markets and more governmental limitations on foreign in- |
vestment than more developed markets. In addition, companies operating in emerging markets may be subject to lower trading volume and greater price fluctuations than companies in more developed markets. Securities law and the enforcement of systems of taxation in many emerging market countries may change quickly and unpredictably. In addition, investments in emerging markets securities may also be subject to additional transaction costs, delays in settlement procedures, and lack of timely information. |
| ∎ | Exchange-traded funds risk. In addition to the risks associated with the underlying assets held by the exchange-traded fund, investments in exchange-traded funds are subject to the following additional risks: (1) an exchange-traded fund’s shares may trade above or below its net asset value; (2) an active trading market for the exchange-traded fund’s shares may not develop or be maintained; (3) trading an exchange-traded fund’s shares may be halted by the listing exchange; (4) a passively managed exchange-traded fund may not track the performance of the reference asset; and (5) a passively managed exchange-traded fund may hold troubled securities. Investment in exchange-traded funds may involve duplication of management fees and certain other expenses, as the Fund indirectly bears its proportionate share of any expenses paid by the exchange-traded funds in which it invests. Further, certain exchange-traded funds in which the Fund may invest are leveraged, which may result in economic leverage, permitting the Fund to gain exposure that is greater than would be the case in an unlevered instrument and potentially resulting in greater volatility. |
| ∎ | Financial services sector risk. The Fund may be susceptible to adverse economic or regulatory occurrences affecting the financial services sector. Financial services companies are subject to extensive goverment regulation and are disproportionately affected by unstable interest rates, each of which could adversely affect the profitability of such companies. Financial services companies may also have concentrated portfolios, which makes them especially vulnerable to unstable economic conditions. |
| ∎ | Foreign securities risk. The Fund’s foreign investments may be adversely affected by political and social instability, changes in economic or taxation policies, difficulty in enforcing obligations, decreased liquidity or increased volatil- |
ity. Foreign investments also involve the risk of the possible seizure, nationalization or expropriation of the issuer or foreign deposits (in which the Fund could lose its entire investments in a certain market) and the possible adoption of foreign governmental restrictions such as exchange controls. Unless the Fund has hedged its foreign securities risk, foreign securities risk also involves the risk of negative foreign currency rate fluctuations, which may cause the value of securities denominated in such foreign currency (or other instruments through which the Fund has exposure to foreign currencies) to decline in value. Currency exchange rates may fluctuate significantly over short periods of time. Currency hedging strategies, if used, are not always successful. |
| ∎ | High yield debt securities (junk bond) risk. Investments in high yield debt securities (“junk bonds”) and other lower-rated securities will subject the Fund to substantial risk of loss. These securities are considered to be speculative with respect to the issuer’s ability to pay interest and principal when due, are more susceptible to default or decline in market value and are less liquid than investment grade debt securities. Prices of high yield debt securities tend to be very volatile. |
| ∎ | Indexing risk. The TIPS Portfolio uses an indexing approach and, therefore, the adverse performance of a particular security necessarily will not result in the elimination of the security from the TIPS Portfolio. Ordinarily, the Adviser will not sell portfolio securities of the TIPS Portfolio except to reflect additions or deletions of the securities that comprise the Underlying Index, or as may be necessary to raise cash to pay Fund shareholders who sell Fund shares. As such, the TIPS Portfolio, and therefore the Fund, will be negatively affected by declines in the securities represented by the Underlying Index. Also, there is no guarantee that the Adviser will be able to correlate the performance of the TIPS Portfolio with that of the Underlying Index. |
| ∎ | Inflation-indexed securities risk. The values of inflation-indexed securities generally fluctuate in response to changes in real interest rates, and the Fund’s income from its investments in these securities is likely to fluctuate considerably more than the income distributions of its investments in more traditional fixed-income securities. |
| ∎ | Inflation-indexed securities tax risk. Any increase in the principal amount of |
9 Invesco Strategic Real Return Fund
| an inflation-indexed security may be included for tax purposes in the Fund’s gross income, even though no cash attributable to such gross income has been received by the Fund. In such event, the Fund may be required to make annual distributions to shareholders that exceed the cash it has otherwise received. In order to pay such distributions, the Fund may be required to raise cash by selling portfolio investments. The sale of such investments could result in capital gains to the Fund and additional capital gain distributions to shareholders. In addition, adjustments during the taxable year for deflation to an inflation-indexed bond held by the Fund may cause amounts previously distributed to shareholders in the taxable year as income to be characterized as a return of capital. |
| ∎ | Investment companies risk. Investing in other investment companies could result in the duplication of certain fees, including management and administrative fees, and may expose the Fund to the risks of owning the underlying investments that the other investment company holds. |
| ∎ | Liquidity risk. The Fund may be unable to sell illiquid investments at the time or price it desires and, as a result, could lose its entire investment in such investments. Liquid securities can become illiquid during periods of market stress. If a significant amount of the Fund’s securities become illiquid, the Fund may not be able to timely pay redemption proceeds and may need to sell securities at significantly reduced prices. |
| ∎ | Management risk. The Fund is actively managed and depends heavily on the Adviser’s judgment about markets, interest rates or the attractiveness, relative values, liquidity, or potential appreciation of particular investments made for the Fund’s portfolio. The Fund could experience losses if these judgments prove to be incorrect. Because the Fund’s investment process relies heavily on its asset allocation process, market movements that are counter to the portfolio managers’ expectations may have a significant adverse effect on the Fund’s net asset value. Additionally, legislative, regulatory, or tax developments may adversely affect management of the Fund and, therefore, the ability of the Fund to achieve its investment objective. |
| ∎ | Market risk. The market values of the Fund’s investments, and therefore the value of the Fund’s shares, will go up and down, sometimes rapidly or unpre- |
dictably. Market risk may affect a single issuer, industry or section of the economy, or it may affect the market as a whole. Individual stock prices tend to go up and down more dramatically than those of certain other types of investments, such as bonds. During a general downturn in the financial markets, multiple asset classes may decline in value. When markets perform well, there can be no assurance that specific investments held by the Fund will rise in value. |
| ∎ | Preferred securities risk. Preferred securities are subject to issuer-specific and market risks applicable generally to equity securities. Preferred securities also may be subordinated to bonds or other debt instruments, subjecting them to a greater risk of non-payment, may be less liquid than many other securities, such as common stocks, and generally offer no voting rights with respect to the issuer. |
| ∎ | Sampling risk. The use by the TIPS Portfolio of a representative sampling approach will result in its holding a smaller number of securities than are in the Underlying Index and in the TIPS Portfolio holding securities not included in the Underlying Index. As a result, an adverse development respecting an issuer of securities held by the TIPS Portfolio could result in a greater decline in the Fund’s NAV than would be the case if all of the securities in the Underlying Index were held. The use by the TIPS Portfolio of a representative sampling approach may also include the risk that it may not track the return of the Underlying Index as well as it would have if the TIPS Portfolio held all of the securities in the Underlying Index. |
| ∎ | Short position risk. Because the Fund’s potential loss on a short position arises from increases in the value of the asset sold short, the Fund will incur a loss on a short position, which is theoretically unlimited, if the price of the asset sold short increases from the short sale price. The counterparty to a short position or other market factors may prevent the Fund from closing out a short position at a desirable time or price and may reduce or eliminate any gain or result in a loss. In a rising market, the Fund’s short positions will cause the Fund to underperform the overall market and its peers that do not engage in shorting. If the Fund holds both long and short positions, and both positions decline simultaneously, the short positions will not provide any buffer (hedge) from declines in value of the |
Fund’s long positions. Certain types of short positions involve leverage, which may exaggerate any losses, potentially more than the actual cost of the investment, and will increase the volatility of the Fund’s returns. |
| ∎ | US government obligations risk. Obligations of US government agencies and authorities receive varying levels of support and may not be backed by the full faith and credit of the US government, which could affect the Fund’s ability to recover should they default. No assurance can be given that the US government will provide financial support to its agencies and authorities if it is not obligated by law to do so. |
| ∎ | When-issued, delayed delivery and forward commitment risks. When-issued and delayed delivery transactions subject the Fund to market risk because the value or yield of a security at delivery may be more or less than the purchase price or yield generally available when delivery occurs, and counterparty risk because the Fund relies on the buyer or seller, as the case may be, to consummate the transaction. These transactions also have a leveraging effect on the Fund because the Fund commits to purchase securities that it does not have to pay for until a later date, which increases the Fund’s overall investment exposure and, as a result, its volatility. |
About indexes used in this report
| ∎ | The BofA Merrill Lynch Current 10-Year Treasury Index is composed of the most recently issued 10-year US Treasury Note. |
| ∎ | The Custom Invesco Strategic Real Return Index consists of 45% The BofA Merrill Lynch US Inflation Linked Treasury Index, 30% S&P/LSTA Leveraged Loan Total Return Index and 25% The BofA Merrill Lynch US High Yield Constrained Index. |
| ∎ | The Lipper Inflation Protected Bond Funds Index is an unmanaged index considered representative of inflation protected bond funds tracked by Lipper. |
| ∎ | The BofA Merrill Lynch U.S. Inflation-Linked Treasury Index tracks the performance of US dollar-denominated, inflation-linked sovereign debt publicly issued by the US government in its domestic market, with at least $1 billion in outstanding face value and a remaining term to final maturity of greater than one year. |
continued on page 6
10 Invesco Strategic Real Return Fund
Schedule of Investments(a)
August 31,2017
| Principal Amount | Value | |||||||
U.S. Treasury Securities–44.87% |
| |||||||
| U.S. Treasury Bills–0.01% | ||||||||
1.11%, 02/01/2018(b)(c) | $ | 3,000 | $ | 2,987 | ||||
| U.S. Treasury Inflation — Indexed Notes–30.08%(d) | ||||||||
2.13%, 01/15/2019 | 168,281 | 173,486 | ||||||
0.13%, 04/15/2019 | 524,039 | 525,193 | ||||||
1.88%, 07/15/2019 | 174,832 | 182,101 | ||||||
1.38%, 01/15/2020 | 214,426 | 222,370 | ||||||
0.13%, 04/15/2020 | 523,931 | 526,698 | ||||||
1.25%, 07/15/2020 | 364,918 | 380,837 | ||||||
1.13%, 01/15/2021 | 411,732 | 429,071 | ||||||
0.13%, 04/15/2021 | 464,662 | 466,989 | ||||||
0.63%, 07/15/2021 | 387,770 | 399,549 | ||||||
0.13%, 01/15/2022 | 445,775 | 448,627 | ||||||
0.13%, 04/15/2022 | 163,168 | 163,755 | ||||||
0.13%, 07/15/2022 | 435,011 | 438,746 | ||||||
0.13%, 01/15/2023 | 435,729 | 436,685 | ||||||
0.38%, 07/15/2023 | 430,853 | 438,843 | ||||||
0.63%, 01/15/2024 | 430,939 | 442,945 | ||||||
0.13%, 07/15/2024 | 423,365 | 422,032 | ||||||
0.25%, 01/15/2025 | 422,458 | 421,602 | ||||||
0.38%, 07/15/2025 | 423,390 | 427,233 | ||||||
0.63%, 01/15/2026 | 437,912 | 448,251 | ||||||
0.13%, 07/15/2026 | 378,815 | 372,363 | ||||||
0.38%, 01/15/2027 | 387,977 | 387,781 | ||||||
0.38%, 07/15/2027 | 132,178 | 132,508 | ||||||
| 8,287,665 | ||||||||
| U.S. Treasury Inflation — Indexed Bonds–14.78%(d) | ||||||||
2.38%, 01/15/2025 | 366,323 | 422,336 | ||||||
2.00%, 01/15/2026 | 245,222 | 278,722 | ||||||
2.38%, 01/15/2027 | 201,143 | 237,933 | ||||||
1.75%, 01/15/2028 | 184,269 | 208,885 | ||||||
3.63%, 04/15/2028 | 253,670 | 336,589 | ||||||
2.50%, 01/15/2029 | 159,611 | 195,385 | ||||||
3.88%, 04/15/2029 | 290,254 | 400,381 | ||||||
3.38%, 04/15/2032 | 70,931 | 99,413 | ||||||
2.13%, 02/15/2040 | 172,147 | 219,268 | ||||||
2.13%, 02/15/2041 | 267,552 | 342,597 | ||||||
0.75%, 02/15/2042 | 251,170 | 245,991 | ||||||
0.63%, 02/15/2043 | 244,083 | 231,429 | ||||||
1.38%, 02/15/2044 | 241,732 | 270,623 | ||||||
0.75%, 02/15/2045 | 240,243 | 232,640 | ||||||
1.00%, 02/15/2046 | 206,582 | 212,838 | ||||||
0.88%, 02/15/2047 | 136,481 | 136,727 | ||||||
| 4,071,757 | ||||||||
Total U.S. Treasury Securities |
| 12,362,409 | ||||||
| Shares | Value | |||||||
Common Stocks–29.96% |
| |||||||
| Fixed-Income Funds–29.96% | ||||||||
Invesco Floating Rate Fund–Class R6 | 1,094,682 | $ | 8,253,905 | |||||
| Principal Amount | ||||||||
Bonds & Notes–20.46% |
| |||||||
| Aerospace & Defense–0.32% | ||||||||
Bombardier Inc. (Canada), Sr. Unsec. Notes, | $ | 11,000 | 11,220 | |||||
7.50%, 03/15/2025(f) | 8,000 | 8,510 | ||||||
KLX Inc., Sr. Unsec. Gtd. Notes, | 17,000 | 17,871 | ||||||
Moog Inc., Sr. Unsec. Gtd. Notes, | 12,000 | 12,540 | ||||||
TransDigm Inc., Sr. Unsec. Gtd. Sub. Global Notes, | 4,000 | 4,175 | ||||||
6.50%, 05/15/2025 | 34,000 | 35,105 | ||||||
| 89,421 | ||||||||
| Agricultural & Farm Machinery–0.09% | ||||||||
Titan International Inc., Sr. Sec. Gtd. First Lien Global Notes, | 23,000 | 23,776 | ||||||
| Air Freight & Logistics–0.03% | ||||||||
XPO Logistics, Inc., Sr. Unsec. Gtd. Notes, | 8,000 | 8,440 | ||||||
| Alternative Carriers–0.12% | ||||||||
Level 3 Financing, Inc., Sr. Unsec. Gtd. Global Notes, | 14,000 | 14,368 | ||||||
5.38%, 05/01/2025 | 19,000 | 19,617 | ||||||
| 33,985 | ||||||||
| Aluminum–0.08% | ||||||||
Novelis Corp., Sr. Unsec. Gtd. Notes, | 21,000 | 22,155 | ||||||
| Apparel Retail–0.28% | ||||||||
Gap, Inc. (The), Sr. Unsec. Global Bonds, | 10,000 | 10,867 | ||||||
Hot Topic, Inc., Sr. Sec. Gtd. First Lien Notes, | 25,000 | 22,750 | ||||||
L Brands, Inc., Sr. Unsec. Gtd. Global Notes, | 31,000 | 32,899 | ||||||
6.75%, 07/01/2036 | 2,000 | 1,912 | ||||||
6.88%, 11/01/2035 | 8,000 | 7,680 | ||||||
| 76,108 | ||||||||
| Asset Management & Custody Banks–0.13% | ||||||||
Prime Security Services Borrower, LLC/Prime Finance, Inc., Sec. Gtd. Second Lien Notes, | 32,000 | 35,440 | ||||||
See accompanying Notes to Financial Statements which are an integral part of the financial statements.
11 Invesco Strategic Real Return Fund
| Principal Amount | Value | |||||||
| Auto Parts & Equipment–0.18% | ||||||||
Dana Financing Luxembourg S.a.r.l., Sr. Unsec. Gtd. Notes, 5.75%, 04/15/2025(f) | $ | 15,000 | $ | 15,694 | ||||
Dana Inc., Sr. Unsec. Notes, | 7,000 | 7,210 | ||||||
Tenneco Inc., Sr. Unsec. Gtd. Global Notes, | 25,000 | 26,156 | ||||||
| 49,060 | ||||||||
| Automotive Retail–0.13% | ||||||||
Lithia Motors, Inc., Sr. Unsec. Gtd. Notes, | 7,000 | 7,157 | ||||||
Murphy Oil USA, Inc., Sr. Unsec. Gtd. Global Notes, 5.63%, 05/01/2027 | 27,000 | 29,059 | ||||||
| 36,216 | ||||||||
| Broadcasting–0.57% | ||||||||
AMC Networks Inc., Sr. Unsec. Gtd. Global Notes, 5.00%, 04/01/2024 | 38,000 | 39,282 | ||||||
Clear Channel Worldwide Holdings, Inc., Series B, Sr. Unsec. Gtd. Global Notes, | 14,000 | 14,473 | ||||||
Sr. Unsec. Gtd. Sub. Global Notes, | 23,000 | 23,000 | ||||||
iHeartCommunications, Inc., Sr. Sec. Gtd. First Lien Global Notes, 9.00%, 12/15/2019 | 21,000 | 16,800 | ||||||
Netflix, Inc., Sr. Unsec. Global Notes, 5.75%, 03/01/2024 | 29,000 | 31,247 | ||||||
Nexstar Broadcasting, Inc., Sr. Unsec. Gtd. Notes, 5.63%, 08/01/2024(f) | 16,000 | 16,560 | ||||||
Tribune Media Co., Sr. Unsec. Gtd. Global Notes, 5.88%, 07/15/2022 | 16,000 | 16,680 | ||||||
| 158,042 | ||||||||
| Building Products–0.31% | ||||||||
Allegion PLC, Sr. Unsec. Gtd. Notes, 5.88%, 09/15/2023 | 17,000 | 18,227 | ||||||
Builders FirstSource, Inc., Sr. Unsec. Gtd. Notes, 10.75%, 08/15/2023(f) | 21,000 | 23,966 | ||||||
Gibraltar Industries Inc., Sr. Unsec. Gtd. Sub. Global Notes, 6.25%, 02/01/2021 | 19,000 | 19,594 | ||||||
Standard Industries Inc., Sr. Unsec. Notes, 5.00%, 02/15/2027(f) | 12,000 | 12,345 | ||||||
6.00%, 10/15/2025(f) | 10,000 | 10,775 | ||||||
| 84,907 | ||||||||
| Cable & Satellite–1.56% | ||||||||
CCO Holdings LLC/CCO Holdings Capital Corp., | 20,000 | 20,950 | ||||||
Sr. Unsec. Notes, | 46,000 | 48,760 | ||||||
CSC Holdings LLC, Sr. Unsec. Global Notes, 6.75%, 11/15/2021 | 65,000 | 71,825 | ||||||
DISH DBS Corp., Sr. Unsec. Gtd. Global Notes, 5.88%, 11/15/2024 | 94,000 | 101,520 | ||||||
DISH Network Corp., Sr. Unsec. Conv. Bonds, 3.38%, 08/15/2026 | 100,000 | 116,375 | ||||||
| Principal Amount | Value | |||||||
| Cable & Satellite–(continued) | ||||||||
Intelsat Jackson Holdings S.A. (Luxembourg), Sr. Unsec. Gtd. Global Bonds, | $ | 10,000 | $ | 8,413 | ||||
Sr. Unsec. Gtd. Global Notes, | 24,000 | 22,920 | ||||||
Sirius XM Radio Inc., Sr. Unsec. Gtd. Notes, | 23,000 | 24,150 | ||||||
6.00%, 07/15/2024(f) | 15,000 | 16,237 | ||||||
| 431,150 | ||||||||
| Casinos & Gaming–0.65% | ||||||||
Boyd Gaming Corp., Sr. Unsec. Gtd. Global Notes, | 6,000 | 6,548 | ||||||
6.88%, 05/15/2023 | 24,000 | 25,890 | ||||||
MGM Resorts International, Sr. Unsec. Gtd. Notes, | 17,000 | 17,297 | ||||||
7.75%, 03/15/2022 | 40,000 | 46,925 | ||||||
Pinnacle Entertainment, Inc., Sr. Unsec. Global Notes, 5.63%, 05/01/2024 | 25,000 | 25,781 | ||||||
Scientific Games International Inc., Sr. Unsec. Gtd. Global Notes, 10.00%, 12/01/2022 | 24,000 | 26,760 | ||||||
Wynn Las Vegas LLC/Wynn Las Vegas Capital Corp., Sr. Unsec. Gtd. Notes, | 7,000 | 7,088 | ||||||
5.50%, 03/01/2025(f) | 23,000 | 24,121 | ||||||
| 180,410 | ||||||||
| Coal & Consumable Fuels–0.05% | ||||||||
SunCoke Energy Partners, L.P./ SunCoke Energy Partners Finance Corp., Sr. Unsec. Gtd. Notes, 7.50%, 06/15/2025(f) | 13,000 | 13,293 | ||||||
| Commercial Printing–0.06% | ||||||||
Multi-Color Corp., Sr. Unsec. Gtd. Notes, 6.13%, 12/01/2022(f) | 16,000 | 16,720 | ||||||
| Commodity Chemicals–0.13% | ||||||||
Koppers Inc., Sr. Unsec. Gtd. Notes, 6.00%, 02/15/2025(f) | 12,000 | 12,780 | ||||||
Valvoline Inc., Sr. Unsec. Gtd. Notes, 5.50%, 07/15/2024(f) | 22,000 | 23,430 | ||||||
| 36,210 | ||||||||
| Communications Equipment–0.26% | ||||||||
CommScope Technologies LLC, Sr. Unsec. Gtd. Notes, 6.00%, 06/15/2025(f) | 33,000 | 35,227 | ||||||
Hughes Satellite Systems Corp., | 16,000 | 16,840 | ||||||
Sr. Unsec. Gtd. Global Notes, | 17,000 | 19,359 | ||||||
| 71,426 | ||||||||
| Construction & Engineering–0.03% | ||||||||
AECOM, Sr. Unsec. Gtd. Global Notes, | 8,000 | 8,170 | ||||||
See accompanying Notes to Financial Statements which are an integral part of the financial statements.
12 Invesco Strategic Real Return Fund
| Principal Amount | Value | |||||||
| Construction Machinery & Heavy Trucks–0.50% | ||||||||
Meritor Inc., Sr. Unsec. Gtd. Notes, 6.25%, 02/15/2024 | $ | 50,000 | $ | 52,875 | ||||
Oshkosh Corp., Sr. Unsec. Gtd. Global Notes, 5.38%, 03/01/2025 | 58,000 | 60,900 | ||||||
Terex Corp., Sr. Unsec. Gtd. Notes, 5.63%, 02/01/2025(f) | 23,000 | 24,207 | ||||||
| 137,982 | ||||||||
| Consumer Finance–0.36% | ||||||||
Ally Financial Inc., | 15,000 | 16,950 | ||||||
Sr. Unsec. Global Notes, | 10,000 | 10,463 | ||||||
5.13%, 09/30/2024 | 35,000 | 37,800 | ||||||
Navient Corp., Sr. Unsec. Medium-Term Notes, | 10,000 | 10,973 | ||||||
8.00%, 03/25/2020 | 20,000 | 22,168 | ||||||
| 98,354 | ||||||||
| Copper–0.18% | ||||||||
First Quantum Minerals Ltd. (Zambia), Sr. Unsec. Gtd. Notes, 7.00%, 02/15/2021(f) | 25,000 | 25,875 | ||||||
Freeport-McMoRan Inc., Sr. Unsec. Gtd. Global Notes, 5.40%, 11/14/2034 | 25,000 | 24,188 | ||||||
| 50,063 | ||||||||
| Data Processing & Outsourced Services–0.25% | ||||||||
First Data Corp., | 8,000 | 8,360 | ||||||
Sr. Unsec. Gtd. Notes, | 56,000 | 60,620 | ||||||
| 68,980 | ||||||||
| Diversified Banks–0.37% | ||||||||
Bank of America Corp., Series K, Jr. Unsec. Sub. Global Notes, 8.00%(g) | 11,000 | 11,261 | ||||||
Citigroup Inc., | 10,000 | 10,712 | ||||||
Series T, Jr. Unsec. Sub. Global Notes, 6.25%(g) | 17,000 | 19,019 | ||||||
JPMorgan Chase & Co., Series 1, Jr. Unsec. Sub. Global Notes, 7.90%(g) | 10,000 | 10,325 | ||||||
Royal Bank of Scotland Group PLC (United Kingdom), Unsec. Sub. Global Notes, 6.00%, 12/19/2023 | 45,000 | 50,017 | ||||||
| 101,334 | ||||||||
| Diversified Chemicals–0.17% | ||||||||
Chemours Co. (The), Sr. Unsec. Gtd. Global Notes, | 30,000 | 32,213 | ||||||
7.00%, 05/15/2025 | 6,000 | 6,630 | ||||||
| Principal Amount | Value | |||||||
| Diversified Chemicals–(continued) | ||||||||
Trinseo Materials Operating S.C.A./Trinseo Materials Finance, Inc., Sr. Unsec. Notes, 5.38%, 09/01/2025(f) | $ | 8,000 | $ | 8,190 | ||||
| 47,033 | ||||||||
| Diversified Metals & Mining–0.19% | ||||||||
HudBay Minerals, Inc. (Canada), Sr. Unsec. Gtd. Notes, 7.63%, 01/15/2025(f) | 23,000 | 25,444 | ||||||
Teck Resources Ltd. (Canada), | 9,000 | 9,428 | ||||||
Sr. Unsec. Notes, | 15,000 | 16,537 | ||||||
| 51,409 | ||||||||
| Diversified Support Services–0.04% | ||||||||
Jaguar Holding Co. II/Pharmaceutical Product Development, LLC, Sr. Unsec. Gtd. Notes, 6.38%, 08/01/2023(f) | 10,000 | 10,513 | ||||||
| Electric Utilities–0.03% | ||||||||
Southern Co. (The), Series B, Jr. Unsec. Sub. Global Notes, 5.50%, 03/15/2057 | 7,000 | 7,455 | ||||||
| Electrical Components & Equipment–0.22% | ||||||||
EnerSys, Sr. Unsec. Gtd. Notes, 5.00%, 04/30/2023(f) | 23,000 | 23,805 | ||||||
Sensata Technologies B.V., Sr. Unsec. Gtd. Notes, 5.00%, 10/01/2025(f) | 35,000 | 36,925 | ||||||
| 60,730 | ||||||||
| Environmental & Facilities Services–0.09% | ||||||||
Advanced Disposal Services, Inc., Sr. Unsec. Gtd. Notes, 5.63%, 11/15/2024(f) | 11,000 | 11,495 | ||||||
CD&R Waterworks Merger Sub, LLC, Sr. Unsec. Notes, 6.13%, 08/15/2025(f) | 12,000 | 12,300 | ||||||
| 23,795 | ||||||||
| Financial Exchanges & Data–0.08% | ||||||||
MSCI Inc., Sr. Unsec. Gtd. Notes, 5.25%, 11/15/2024(f) | 20,000 | 21,300 | ||||||
| Food Distributors–0.10% | ||||||||
US Foods, Inc., Sr. Unsec. Gtd. Notes, 5.88%, 06/15/2024(f) | 27,000 | 28,148 | ||||||
| Food Retail–0.09% | ||||||||
Ingles Markets, Inc., Sr. Unsec. Global Notes, 5.75%, 06/15/2023 | 26,000 | 25,675 | ||||||
| Gas Utilities–0.33% | ||||||||
AmeriGas Partners, L.P./AmeriGas Finance Corp., Sr. Unsec. Global Notes, | 15,000 | 15,637 | ||||||
5.88%, 08/20/2026 | 17,000 | 17,425 | ||||||
Ferrellgas L.P./Ferrellgas Finance Corp., Sr. Unsec. Global Notes, 6.50%, 05/01/2021 | 11,000 | 10,588 | ||||||
NGL Energy Partners L.P./NGL Energy Finance Corp., Sr. Unsec. Gtd. Global Notes, 6.13%, 03/01/2025 | 11,000 | 9,845 | ||||||
See accompanying Notes to Financial Statements which are an integral part of the financial statements.
13 Invesco Strategic Real Return Fund
| Principal Amount | Value | |||||||
| Gas Utilities–(continued) | ||||||||
Suburban Propane Partners, L.P./Suburban Energy Finance Corp., Sr. Unsec. Global Notes, 5.50%, 06/01/2024 | $ | 37,000 | $ | 36,491 | ||||
| 89,986 | ||||||||
| General Merchandise Stores–0.05% | ||||||||
Dollar Tree, Inc., Sr. Unsec. Gtd. Global Notes, 5.75%, 03/01/2023 | 14,000 | 14,840 | ||||||
| Health Care Equipment–0.07% | ||||||||
Hill-Rom Holdings, Inc., Sr. Unsec. Gtd. Notes, 5.00%, 02/15/2025(f) | 15,000 | 15,375 | ||||||
Teleflex Inc., Sr. Unsec. Gtd. Global Notes, | 3,000 | 3,090 | ||||||
5.25%, 06/15/2024 | 2,000 | 2,100 | ||||||
| 20,565 | ||||||||
| Health Care Facilities–0.88% | ||||||||
Acadia Healthcare Co., Inc., Sr. Unsec. Gtd. Global Notes, 6.50%, 03/01/2024 | 15,000 | 16,162 | ||||||
Community Health Systems, Inc., | 5,000 | 5,025 | ||||||
Sr. Sec. Gtd. First Lien Notes, | 29,000 | 29,326 | ||||||
Sr. Unsec. Gtd. Global Notes, | 4,000 | 3,335 | ||||||
8.00%, 11/15/2019 | 11,000 | 10,931 | ||||||
HCA, Inc., | 75,000 | 80,906 | ||||||
Sr. Unsec. Gtd. Notes, | 10,000 | 10,550 | ||||||
5.88%, 02/15/2026 | 15,000 | 16,219 | ||||||
HealthSouth Corp., Sr. Unsec. Gtd. Global Notes, 5.75%, 09/15/2025 | 15,000 | 15,675 | ||||||
LifePoint Health, Inc., | 14,000 | 14,525 | ||||||
Sr. Unsec. Gtd. Notes, | 3,000 | 3,158 | ||||||
Tenet Healthcare Corp., | 3,000 | 3,248 | ||||||
Sr. Unsec. Global Notes, | 14,000 | 13,965 | ||||||
8.00%, 08/01/2020 | 10,000 | 10,158 | ||||||
8.13%, 04/01/2022 | 10,000 | 10,537 | ||||||
| 243,720 | ||||||||
| Health Care Services–0.48% | ||||||||
AMN Healthcare, Inc., Sr. Unsec. Gtd. Notes, 5.13%, 10/01/2024(f) | 10,000 | 10,300 | ||||||
DaVita Inc., Sr. Unsec. Gtd. Global Notes, 5.00%, 05/01/2025 | 34,000 | 34,552 | ||||||
Eagle Holding Co. II, LLC, Sr. Unsec. PIK Notes, 8.38% PIK Rate, 7.63% Cash Rate, 05/15/2022(f)(h) | 13,000 | 13,471 | ||||||
| Principal Amount | Value | |||||||
| Health Care Services–(continued) | ||||||||
MEDNAX, Inc., Sr. Unsec. Gtd. Notes, 5.25%, 12/01/2023(f) | $ | 22,000 | $ | 22,742 | ||||
MPH Acquisition Holdings LLC, Sr. Unsec. Gtd. Notes, 7.13%, 06/01/2024(f) | 33,000 | 35,434 | ||||||
Surgery Center Holdings, Inc., Sr. Unsec. Gtd. Notes, | 3,000 | 2,846 | ||||||
8.88%, 04/15/2021(f) | 3,000 | 3,098 | ||||||
Team Health Holdings, Inc., Sr. Unsec. Gtd. Notes, 6.38%, 02/01/2025(f) | 10,000 | 9,663 | ||||||
| 132,106 | ||||||||
| Home Improvement Retail–0.09% | ||||||||
Hillman Group Inc. (The), Sr. Unsec. Gtd. Notes, 6.38%, 07/15/2022(f) | 25,000 | 24,094 | ||||||
| Homebuilding–0.51% | ||||||||
Ashton Woods USA LLC/Ashton Woods Finance Co., Sr. Unsec. Notes, | 10,000 | 9,975 | ||||||
6.88%, 02/15/2021(f) | 12,000 | 12,345 | ||||||
Beazer Homes USA, Inc., Sr. Unsec. Gtd. Global Notes, | 22,000 | 23,348 | ||||||
8.75%, 03/15/2022 | 10,000 | 11,075 | ||||||
CalAtlantic Group, Inc., Sr. Unsec. Gtd. Notes, 5.38%, 10/01/2022 | 20,000 | 21,750 | ||||||
KB Home, Sr. Unsec. Gtd. Notes, 7.50%, 09/15/2022 | 25,000 | 28,812 | ||||||
Meritage Homes Corp., Sr. Unsec. Gtd. Global Notes, | 13,000 | 14,040 | ||||||
7.15%, 04/15/2020 | 5,000 | 5,525 | ||||||
Taylor Morrison Communities Inc./ Taylor Morrison Holdings II, Inc., Sr. Unsec. Gtd. Notes, 5.88%, 04/15/2023(f) | 12,000 | 12,660 | ||||||
| 139,530 | ||||||||
| Household Products–0.24% | ||||||||
Reynolds Group Issuer Inc./LLC (New Zealand), | 13,000 | 13,553 | ||||||
Sr. Unsec. Gtd. Notes, | 17,000 | 18,232 | ||||||
Spectrum Brands, Inc., Sr. Unsec. Gtd. Global Notes, 5.75%, 07/15/2025 | 18,000 | 19,215 | ||||||
Springs Industries, Inc., Sr. Sec. Global Notes, 6.25%, 06/01/2021 | 14,000 | 14,490 | ||||||
| 65,490 | ||||||||
| Independent Power Producers & Energy Traders–0.38% | ||||||||
AES Corp. (The), | 2,000 | 2,298 | ||||||
Sr. Unsec. Notes, | 45,000 | 46,912 | ||||||
Calpine Corp., Sr. Unsec. Global Notes, 5.50%, 02/01/2024 | 10,000 | 9,325 | ||||||
See accompanying Notes to Financial Statements which are an integral part of the financial statements.
14 Invesco Strategic Real Return Fund
| Principal Amount | Value | |||||||
| Independent Power Producers & Energy Traders–(continued) | ||||||||
Dynegy Inc., Sr. Unsec. Gtd. Global Notes, 7.38%, 11/01/2022 | $ | 10,000 | $ | 10,400 | ||||
NRG Energy, Inc., Sr. Unsec. Gtd. Global Notes, | 18,000 | 18,630 | ||||||
6.63%, 03/15/2023 | 10,000 | 10,375 | ||||||
6.63%, 01/15/2027 | 7,000 | 7,385 | ||||||
| 105,325 | ||||||||
| Integrated Telecommunication Services–0.71% | ||||||||
CenturyLink, Inc., | 10,000 | 10,513 | ||||||
Series Y, Sr. Unsec. Global Notes, | 24,000 | 25,200 | ||||||
Cincinnati Bell Inc., Sr. Unsec. Gtd. Notes, 7.00%, 07/15/2024(f) | 11,000 | 10,945 | ||||||
Frontier Communications Corp., Sr. Unsec. Global Notes, | 16,000 | 15,900 | ||||||
10.50%, 09/15/2022 | 15,000 | 13,519 | ||||||
11.00%, 09/15/2025 | 23,000 | 20,067 | ||||||
T-Mobile USA, Inc., Sr. Unsec. Gtd. Global Bonds, 6.84%, 04/28/2023 | 75,000 | 79,687 | ||||||
Telecom Italia Capital S.A. (Italy), Sr. Unsec. Gtd. Global Notes, | 6,000 | 6,900 | ||||||
7.20%, 07/18/2036 | 10,000 | 12,450 | ||||||
| 195,181 | ||||||||
| Internet & Direct Marketing Retail–0.10% | ||||||||
Priceline Group Inc. (The), Sr. Unsec. Conv. Bonds, 0.90%, 09/15/2021 | 25,000 | 28,547 | ||||||
| Leisure Facilities–0.24% | ||||||||
Cedar Fair L.P./Canada’s Wonderland Co./Magnum Management Corp., Sr. Unsec. Gtd. Global Notes, 5.38%, 06/01/2024 | 40,000 | 42,300 | ||||||
Six Flags Entertainment Corp., Sr. Unsec. Gtd. Notes, 4.88%, 07/31/2024(f) | 23,000 | 23,259 | ||||||
| 65,559 | ||||||||
| Managed Health Care–0.14% | ||||||||
Centene Corp., Sr. Unsec. Notes, 4.75%, 01/15/2025 | 7,000 | 7,280 | ||||||
Molina Healthcare, Inc., Sr. Unsec. Gtd. Notes, 4.88%, 06/15/2025(f) | 10,000 | 9,863 | ||||||
WellCare Health Plans Inc., Sr. Unsec. Notes, 5.25%, 04/01/2025 | 20,000 | 21,050 | ||||||
| 38,193 | ||||||||
| Metal & Glass Containers–0.09% | ||||||||
Berry Global, Inc., Sec. Gtd. Second Lien Notes, 5.50%, 05/15/2022 | 23,000 | 24,064 | ||||||
| Mortgage REIT’s–0.50% | ||||||||
Starwood Property Trust, Inc., Sr. Unsec. Conv. Notes, 4.38%, 04/01/2023 | 125,000 | 127,266 | ||||||
| Principal Amount | Value | |||||||
| Movies & Entertainment–0.16% | ||||||||
AMC Entertainment Holdings, Inc., Sr. Unsec. Gtd. Sub. Global Notes, 5.75%, 06/15/2025 | $ | 25,000 | $ | 23,969 | ||||
Lions Gate Entertainment Corp., Sr. Unsec. Gtd. Notes, 5.88%, 11/01/2024(f) | 19,000 | 19,950 | ||||||
| 43,919 | ||||||||
| Oil & Gas Drilling–0.18% | ||||||||
Ensco PLC, Sr. Unsec. Global Notes, 4.50%, 10/01/2024 | 24,000 | 17,700 | ||||||
Precision Drilling Corp. (Canada), Sr. Unsec. Gtd. Global Notes, | 15,000 | 13,275 | ||||||
6.50%, 12/15/2021 | 7,000 | 6,825 | ||||||
7.75%, 12/15/2023 | 3,000 | 2,993 | ||||||
Transocean Inc., Sr. Unsec. Gtd. Global Notes, 7.50%, 04/15/2031 | 10,000 | 8,475 | ||||||
| 49,268 | ||||||||
| Oil & Gas Equipment & Services–0.20% | ||||||||
Archrock Partners, L.P./Archrock Partners Finance Corp., Sr. Unsec. Gtd. Global Notes, 6.00%, 10/01/2022 | 21,000 | 20,527 | ||||||
SESI, L.L.C., Sr. Unsec. Gtd. Global Notes, | 7,000 | 7,009 | ||||||
7.13%, 12/15/2021 | 13,000 | 13,130 | ||||||
Weatherford International Ltd., | 12,000 | 10,050 | ||||||
8.25%, 06/15/2023 | 5,000 | 4,950 | ||||||
| 55,666 | ||||||||
| Oil & Gas Exploration & Production–1.64% | ||||||||
Antero Resources Corp., Sr. Unsec. Gtd. Global Notes, 5.63%, 06/01/2023 | 39,000 | 39,975 | ||||||
California Resources Corp., Sec. Gtd. Second Lien Notes, 8.00%, 12/15/2022(f) | 22,000 | 12,265 | ||||||
Callon Petroleum Co., Sr. Unsec. Gtd. Global Notes, 6.13%, 10/01/2024 | 27,000 | 27,540 | ||||||
Continental Resources Inc., Sr. Unsec. Gtd. Global Notes, 3.80%, 06/01/2024 | 40,000 | 37,600 | ||||||
Denbury Resources Inc., Sr. Unsec. Gtd. Sub. Notes, 5.50%, 05/01/2022 | 15,000 | 6,938 | ||||||
EP Energy LLC/Everest Acquisition Finance Inc., Sr. Sec. Gtd. First Lien Notes, 8.00%, 11/29/2024(f) | 9,000 | 8,820 | ||||||
Genesis Energy L.P./Genesis Energy Finance Corp., Sr. Unsec. Gtd. Notes, 6.50%, 10/01/2025 | 7,000 | 6,895 | ||||||
Gulfport Energy Corp., Sr. Unsec. Gtd. Notes, 6.00%, 10/15/2024(f) | 23,000 | 22,597 | ||||||
Newfield Exploration Co., Sr. Unsec. Global Notes, 5.63%, 07/01/2024 | 29,000 | 31,030 | ||||||
Oasis Petroleum Inc., Sr. Unsec. Gtd. Global Notes, 6.88%, 01/15/2023 | 19,000 | 18,478 | ||||||
Parsley Energy LLC/Parsley Finance Corp., Sr. Unsec. Gtd. Notes, 6.25%, 06/01/2024(f) | 18,000 | 18,900 | ||||||
See accompanying Notes to Financial Statements which are an integral part of the financial statements.
15 Invesco Strategic Real Return Fund
| Principal Amount | Value | |||||||
| Oil & Gas Exploration & Production–(continued) | ||||||||
QEP Resources, Inc., | $ | 6,000 | $ | 5,753 | ||||
Sr. Unsec. Notes, | 13,000 | 13,520 | ||||||
Range Resources Corp., | 18,000 | 17,325 | ||||||
Sr. Unsec. Gtd. Notes, | 13,000 | 13,260 | ||||||
Rice Energy Inc., Sr. Unsec. Gtd. Global Notes, 7.25%, 05/01/2023 | 31,000 | 33,170 | ||||||
RSP Permian, Inc., Sr. Unsec. Gtd. Global Notes, 6.63%, 10/01/2022 | 21,000 | 21,892 | ||||||
SM Energy Co., Sr. Unsec. Global Notes, 6.13%, 11/15/2022 | 15,000 | 14,250 | ||||||
Southwestern Energy Co., Sr. Unsec. Global Notes, 4.10%, 03/15/2022 | 39,000 | 36,172 | ||||||
Whiting Petroleum Corp., Sr. Unsec. Gtd. Global Notes, 6.25%, 04/01/2023 | 33,000 | 30,772 | ||||||
WildHorse Resource Development Corp., Sr. Unsec. Gtd. Notes, 6.88%, 02/01/2025(f) | 19,000 | 18,715 | ||||||
WPX Energy Inc., Sr. Unsec. Notes, 5.25%, 09/15/2024 | 16,000 | 15,760 | ||||||
| 451,627 | ||||||||
| Oil & Gas Storage & Transportation–0.88% | ||||||||
Andeavor Logistics L.P./Tesoro Logistics Finance Corp., | 30,000 | 32,738 | ||||||
Sr. Unsec. Gtd. Notes, | 4,000 | 4,275 | ||||||
Antero Midstream Partners LP/Antero Midstream Finance Corp., Sr. Unsec. Gtd. Global Notes, 5.38%, 09/15/2024 | 31,000 | 31,775 | ||||||
Energy Transfer Equity, L.P., Sr. Sec. First Lien Notes, 5.88%, 01/15/2024 | 38,000 | 41,135 | ||||||
Holly Energy Partners L.P./Holly Energy Finance Corp., Sr. Unsec. Gtd. Notes, 6.00%, 08/01/2024(f) | 10,000 | 10,450 | ||||||
MPLX LP, Sr. Unsec. Global Notes, 4.88%, 06/01/2025 | 22,000 | 23,593 | ||||||
NGPL PipeCo. LLC, Sr. Unsec. Bonds, 4.88%, 08/15/2027(f) | 3,000 | 3,105 | ||||||
SemGroup Corp., Sr. Unsec. Gtd. Notes, 6.38%, 03/15/2025(f) | 25,000 | 24,750 | ||||||
Targa Resources Partners L.P./Targa Resources Partners Finance Corp., | 17,000 | 17,446 | ||||||
Sr. Unsec. Gtd. Notes, | 18,000 | 18,585 | ||||||
Williams Cos., Inc. (The), | 22,000 | 22,591 | ||||||
Sr. Unsec. Notes, 7.88%, 09/01/2021 | 10,000 | 11,675 | ||||||
| 242,118 | ||||||||
| Principal Amount | Value | |||||||
| Other Diversified Financial Services–0.02% | ||||||||
VFH Parent LLC/Orchestra Co-Issuer Inc., Sec. Gtd. Second Lien Notes, 6.75%, 06/15/2022(f) | $ | 5,000 | $ | 5,213 | ||||
| Packaged Foods & Meats–0.30% | ||||||||
B&G Foods, Inc., Sr. Unsec. Gtd. Notes, 5.25%, 04/01/2025 | 9,000 | 9,281 | ||||||
JBS USA Lux S.A./JBS USA Finance Inc. (Brazil), Sr. Unsec. Gtd. Notes, 5.75%, 06/15/2025(f) | 18,000 | 18,090 | ||||||
Lamb Weston Holdings, Inc., Sr. Unsec. Gtd. Notes, 4.63%, 11/01/2024(f) | 23,000 | 23,834 | ||||||
TreeHouse Foods, Inc., Sr. Unsec. Gtd. Notes, 6.00%, 02/15/2024(f) | 30,000 | 31,950 | ||||||
| 83,155 | ||||||||
| Paper Packaging–0.09% | ||||||||
Graphic Packaging International Inc., Sr. Unsec. Gtd. Notes, 4.88%, 11/15/2022 | 24,000 | 25,560 | ||||||
| Paper Products–0.14% | ||||||||
Clearwater Paper Corp., Sr. Unsec. Gtd. Global Notes, 4.50%, 02/01/2023 | 26,000 | 26,065 | ||||||
Mercer International Inc. (Canada), | 7,000 | 7,481 | ||||||
Sr. Unsec. Notes, | 4,000 | 4,185 | ||||||
| 37,731 | ||||||||
| Pharmaceuticals–0.23% | ||||||||
Valeant Pharmaceuticals International, Inc., Sr. Unsec. Gtd. Notes, | 15,000 | 13,800 | ||||||
5.88%, 05/15/2023(f) | 5,000 | 4,269 | ||||||
7.00%, 10/01/2020(f) | 17,000 | 17,021 | ||||||
7.25%, 07/15/2022(f) | 30,000 | 28,687 | ||||||
| 63,777 | ||||||||
| Railroads–0.09% | ||||||||
Kenan Advantage Group Inc. (The), Sr. Unsec. Notes, 7.88%, 07/31/2023(f) | 23,000 | 24,150 | ||||||
| Regional Banks–0.20% | ||||||||
CIT Group Inc., Sr. Unsec. Global Notes, 5.00%, 08/15/2022 | 51,000 | 55,207 | ||||||
| Restaurants–0.37% | ||||||||
1011778 BC ULC/ New Red Finance, Inc. (Canada), Sec. Gtd. Second Lien Notes, | 29,000 | 29,797 | ||||||
6.00%, 04/01/2022(f) | 20,000 | 20,700 | ||||||
Aramark Services, Inc., Sr. Unsec. Gtd. Notes, 5.00%, 04/01/2025(f) | 24,000 | 25,380 | ||||||
Carrols Restaurant Group, Inc., | 12,000 | 12,810 | ||||||
Sec. Gtd. Second Lien Notes, | 6,000 | 6,405 | ||||||
See accompanying Notes to Financial Statements which are an integral part of the financial statements.
16 Invesco Strategic Real Return Fund
| Principal Amount | Value | |||||||
| Restaurants–(continued) | ||||||||
KFC Holding Co. (The)/Pizza Hut Holdings LLC/Taco Bell of America LLC, Sr. Unsec. Gtd. Notes, 4.75%, 06/01/2027(f) | $ | 7,000 | $ | 7,210 | ||||
| 102,302 | ||||||||
| Semiconductors–0.26% | ||||||||
Micron Technology, Inc., | 7,000 | 7,420 | ||||||
Sr. Unsec. Notes, | 35,000 | 36,400 | ||||||
ON Semiconductor Corp., Sr. Unsec. Gtd. Conv. Notes, 1.63%, 10/15/2023(f) | 25,000 | 27,953 | ||||||
| 71,773 | ||||||||
| Specialized Consumer Services–0.13% | ||||||||
ServiceMaster Co., LLC (The), | 18,000 | 18,540 | ||||||
Sr. Unsec. Notes, 7.45%, 08/15/2027 | 15,000 | 16,331 | ||||||
| 34,871 | ||||||||
| Specialized Finance–0.12% | ||||||||
Aircastle Ltd., Sr. Unsec. Notes, | 8,000 | 8,560 | ||||||
5.50%, 02/15/2022 | 22,000 | 24,008 | ||||||
| 32,568 | ||||||||
| Specialized REIT’s–0.77% | ||||||||
CyrusOne L.P./CyrusOne Finance Corp., Sr. Unsec. Gtd. Notes, | 4,000 | 4,190 | ||||||
5.38%, 03/15/2027(f) | 9,000 | 9,529 | ||||||
Equinix Inc., Sr. Unsec. Notes, 5.88%, 01/15/2026 | 43,000 | 47,300 | ||||||
GLP Capital LP/GLP Financing II Inc., Sr. Unsec. Gtd. Notes, 5.38%, 04/15/2026 | 25,000 | 27,218 | ||||||
Iron Mountain Inc., Sr. Unsec. Gtd. Notes, 6.00%, 08/15/2023 | 12,000 | 12,795 | ||||||
Iron Mountain US Holdings, Inc., Sr. Unsec. Gtd. Notes, 5.38%, 06/01/2026(f) | 14,000 | 14,875 | ||||||
Lamar Media Corp., Sr. Unsec. Gtd. Global Notes, 5.75%, 02/01/2026 | 33,000 | 35,805 | ||||||
Rayonier A.M. Products Inc., Sr. Unsec. Gtd. Notes, 5.50%, 06/01/2024(f) | 27,000 | 26,595 | ||||||
SBA Communications Corp., Sr. Unsec. Global Notes, 4.88%, 09/01/2024 | 32,000 | 33,280 | ||||||
| 211,587 | ||||||||
| Specialty Chemicals–0.47% | ||||||||
Ashland LLC, Sr. Unsec. Gtd. Global Notes, 4.75%, 08/15/2022 | 16,000 | 16,720 | ||||||
GCP Applied Technologies Inc., Sr. Unsec. Gtd. Notes, 9.50%, 02/01/2023(f) | 25,000 | 28,250 | ||||||
Kraton Polymers LLC/Kraton Polymers Capital Corp., Sr. Unsec. Gtd. Notes, 10.50%, 04/15/2023(f) | 17,000 | 19,656 | ||||||
PolyOne Corp., Sr. Unsec. Global Notes, 5.25%, 03/15/2023 | 30,000 | 31,575 | ||||||
| Principal Amount | Value | |||||||
| Specialty Chemicals–(continued) | ||||||||
PQ Corp., Sr. Sec. Gtd. First Lien Notes, 6.75%, 11/15/2022(f) | $ | 11,000 | $ | 11,949 | ||||
Venator Finance S.a.r.l./Venator Materials Corp. (Luxembourg), Sr. Unsec. Gtd. Notes, 5.75%, 07/15/2025(f) | 21,000 | 21,499 | ||||||
| 129,649 | ||||||||
| Steel–0.28% | ||||||||
ArcelorMittal (Luxembourg), Sr. Unsec. Global Notes, 7.50%, 10/15/2039 | 15,000 | 17,719 | ||||||
Steel Dynamics, Inc., Sr. Unsec. Gtd. Global Notes, | 32,000 | 34,040 | ||||||
5.50%, 10/01/2024 | 10,000 | 10,750 | ||||||
United States Steel Corp., Sr. Unsec. Global Notes, 6.88%, 08/15/2025 | 15,000 | 15,337 | ||||||
| 77,846 | ||||||||
| Technology Distributors–0.07% | ||||||||
CDW LLC/CDW Finance Corp., Sr. Unsec. Gtd. Notes, 5.00%, 09/01/2025 | 19,000 | 19,926 | ||||||
| Technology Hardware, Storage & Peripherals–0.42% | ||||||||
Dell International LLC/ EMC Corp., Sr. Unsec. Gtd. Notes, 7.13%, 06/15/2024(f) | 52,000 | 57,655 | ||||||
Diebold Nixdorf, Inc., Sr. Unsec. Gtd. Global Notes, 8.50%, 04/15/2024 | 16,000 | 17,520 | ||||||
Western Digital Corp., Sr. Unsec. Gtd. Global Notes, 10.50%, 04/01/2024 | 35,000 | 41,694 | ||||||
| 116,869 | ||||||||
| Trading Companies & Distributors–0.41% | ||||||||
BMC East, LLC, Sr. Sec. Gtd. First Lien Notes, 5.50%, 10/01/2024(f) | 18,000 | 18,832 | ||||||
H&E Equipment Services, Inc., Sr. Unsec. Gtd. Notes, 5.63%, 09/01/2025(f) | 22,000 | 22,825 | ||||||
Herc Rentals Inc., Sec. Gtd. Second Lien Notes, 7.75%, 06/01/2024(f) | 32,000 | 35,120 | ||||||
United Rentals North America, Inc., | 18,000 | 19,260 | ||||||
Sr. Unsec. Gtd. Notes, | 13,000 | 13,813 | ||||||
5.88%, 09/15/2026 | 4,000 | 4,355 | ||||||
| 114,205 | ||||||||
| Trucking–0.21% | ||||||||
Avis Budget Car Rental LLC/Avis Budget Finance Inc., | 5,000 | 5,050 | ||||||
Sr. Unsec. Gtd. Notes, | 20,000 | 19,625 | ||||||
Hertz Corp. (The), | 12,000 | 12,180 | ||||||
Sr. Unsec. Gtd. Global Notes, | 21,000 | 20,974 | ||||||
| 57,829 | ||||||||
See accompanying Notes to Financial Statements which are an integral part of the financial statements.
17 Invesco Strategic Real Return Fund
| Principal Amount | Value | |||||||
| Wireless Telecommunication Services–0.40% | ||||||||
Sprint Corp., Sr. Unsec. Gtd. Global Notes, | $ | 33,000 | $ | 36,424 | ||||
7.63%, 02/15/2025 | 10,000 | 11,275 | ||||||
7.88%, 09/15/2023 | 54,000 | 61,560 | ||||||
| 109,259 | ||||||||
Total Bonds & Notes |
| 5,638,241 | ||||||
| Shares | ||||||||
Preferred Stocks–3.56% |
| |||||||
| Agricultural Products–0.20% | ||||||||
Bunge Ltd., $4.88, Conv. Pfd. | 525 | 55,683 | ||||||
| Asset Management & Custody Banks–0.22% | ||||||||
AMG Capital Trust II, $2.58, Conv. Pfd. | 1,000 | 60,937 | ||||||
| Diversified Banks–0.96% | ||||||||
Bank of America Corp., Series L, $72.50, Conv. Pfd. | 100 | 131,800 | ||||||
Wells Fargo & Co.,Class A, Series L, $75.00, Conv. Pfd. | 100 | 133,100 | ||||||
| 264,900 | ||||||||
| Electric Utilities–0.24% | ||||||||
NextEra Energy, Inc., Series H, $3.19, Conv. Investment Units | 1,000 | 67,650 | ||||||
| Health Care Equipment–0.20% | ||||||||
Becton, Dickinson and Co., Series A, 3.06%, Conv. Pfd. | 1,000 | 55,620 | ||||||
| Health Care REIT’s–0.09% | ||||||||
Welltower Inc., Series I, $3.25, Conv. Pfd. | 390 | 25,799 | ||||||
| Internet Software & Services–0.14% | ||||||||
Mandatory Exchangeable Trust (China), $5.75, Conv. Pfd.(f) | 205 | 40,038 | ||||||
| Shares | Value | |||||||
| Managed Health Care–0.36% | ||||||||
Anthem Inc., $2.63, Conv. Pfd. | 1,879 | $ | 98,557 | |||||
| Multi-Utilities–0.19% | ||||||||
Dominion Energy, Inc., Series A, $3.38, Conv. Investment Units | 1,000 | 51,430 | ||||||
| Oil & Gas Exploration & Production–0.27% | ||||||||
Hess Corp., Series A, $4.00, Conv. Pfd. | 1,500 | 74,925 | ||||||
| Oil & Gas Storage & Transportation–0.31% | ||||||||
Kinder Morgan, Inc., Series A, $4.88, Conv. Pfd. | 2,000 | 84,340 | ||||||
| Pharmaceuticals–0.12% | ||||||||
Teva Pharmaceutical Industries Ltd. (Israel), $70.00, Conv. Pfd. | 100 | 31,845 | ||||||
| Regional Banks–0.02% | ||||||||
CIT Group Inc., Series A, 5.80%, Pfd. | 5,000 | 5,219 | ||||||
| Specialized REIT’s–0.24% | ||||||||
American Tower Corp., Series B, $5.50, Conv. Pfd. | 500 | 65,225 | ||||||
Total Preferred Stocks |
| 982,168 | ||||||
Money Market Funds–0.42% |
| |||||||
Government & Agency Portfolio–Institutional Class, 0.93%(i) | 70,001 | 70,001 | ||||||
Treasury Portfolio–Institutional Class, 0.90%(i) | 46,667 | 46,667 | ||||||
Total Money Market Funds |
| 116,668 | ||||||
TOTAL INVESTMENTS IN SECURITIES–99.27% |
| 27,353,391 | ||||||
OTHER ASSETS LESS LIABILITIES–0.73% |
| 200,042 | ||||||
NET ASSETS–100.00% |
| $ | 27,553,433 | |||||
Investment Abbreviations:
| Conv. | – Convertible | |
| Gtd. | – Guaranteed | |
| Jr. | – Junior | |
| Pfd. | – Preferred |
| PIK | – Pay-in-Kind | |
| REIT | – Real Estate Investment Trust | |
| Sec. | – Secured | |
| Sr. | – Senior |
| Sub. | – Subordinated | |
| Unsec. | – Unsecured |
Notes to Schedule of Investments:
| (a) | Industry and/or sector classifications used in this report are generally according to the Global Industry Classification Standard, which was developed by and is the exclusive property and a service mark of MSCI Inc. and Standard & Poor’s. |
| (b) | Security traded on a discount basis. The interest rate shown represents the discount rate at the time of purchase by the Fund. |
| (c) | All or a portion of the value was pledged as collateral to cover margin requirements for open futures contracts. See Note 1J. |
| (d) | Principal amount of security and interest payments are adjusted for inflation. See Note 1I. |
| (e) | Invesco Floating Rate Fund and the Fund are affiliated by either having the same investment adviser or an investment adviser under common control with the Fund’s investment adviser. The value of this security as of August 31, 2017 represented 29.96% of the Fund’s Net Assets. See Note 5. |
| (f) | Security purchased or received in a transaction exempt from registration under the Securities Act of 1933, as amended (the “1933 Act”). The security may be resold pursuant to an exemption from registration under the 1933 Act, typically to qualified institutional buyers. The aggregate value of these securities at August 31, 2017 was $1,853,313, which represented 6.73% of the Fund’s Net Assets. |
| (g) | Perpetual bond with no specified maturity date. |
| (h) | All or a portion of this security is Pay-in-Kind. Pay-in-Kind securities pay interest income in the form of securities. |
| (i) | The money market fund and the Fund are affiliated by having the same investment adviser. The rate shown is the 7-day SEC standardized yield as of August 31, 2017. |
| Open Futures Contracts — Interest Risk | ||||||||||||||||||||
| Short Futures Contracts | Number of Contracts | Expiration Month | Notional Value | Value | Unrealized Appreciation | |||||||||||||||
U.S. Treasury 10 Year Notes | 2 | December-2017 | $ | (253,969 | ) | $ | 464 | $ | 464 | |||||||||||
See accompanying Notes to Financial Statements which are an integral part of the financial statements.
18 Invesco Strategic Real Return Fund
Statement of Assets and Liabilities
August 31, 2017
Assets: |
| |||
Investments in securities, at value (Cost $18,683,197) | $ | 18,982,818 | ||
Investments in affiliates, at value (Cost $8,612,760) | 8,370,573 | |||
Receivable for: | ||||
Investments sold | 39,304 | |||
Fund shares sold | 82,174 | |||
Dividends and interest | 147,270 | |||
Fund expenses absorbed | 13,542 | |||
Investment for trustee deferred compensation and retirement plans | 5,534 | |||
Other assets | 46,738 | |||
Total assets | 27,687,953 | |||
Liabilities: |
| |||
Other investments: | ||||
Variation margin payable — futures contracts | 344 | |||
Payable for: | ||||
Investments purchased | 38,454 | |||
Fund shares reacquired | 31,236 | |||
Accrued fees to affiliates | 8,460 | |||
Accrued trustees’ and officers’ fees and benefits | 3,205 | |||
Accrued other operating expenses | 47,287 | |||
Trustee deferred compensation and retirement plans | 5,534 | |||
Total liabilities | 134,520 | |||
Net assets applicable to shares outstanding | $ | 27,553,433 | ||
Net assets consist of: |
| |||
Shares of beneficial interest | $ | 27,889,613 | ||
Undistributed net investment income | 83,714 | |||
Undistributed net realized gain (loss) | (477,792 | ) | ||
Net unrealized appreciation | 57,898 | |||
| $ | 27,553,433 | |||
Net Assets: |
| |||
Class A | $ | 15,357,698 | ||
Class C | $ | 1,538,233 | ||
Class R | $ | 148,229 | ||
Class Y | $ | 10,227,747 | ||
Class R5 | $ | 9,757 | ||
Class R6 | $ | 271,769 | ||
Shares outstanding, no par value, |
| |||
Class A | 1,576,050 | |||
Class C | 157,993 | |||
Class R | 15,214 | |||
Class Y | 1,049,365 | |||
Class R5 | 1,001 | |||
Class R6 | 27,868 | |||
Class A: | ||||
Net asset value per share | $ | 9.74 | ||
Maximum offering price per share | ||||
(Net asset value of $9.74 ¸ 97.50%) | $ | 9.99 | ||
Class C: | ||||
Net asset value and offering price per share | $ | 9.74 | ||
Class R: | ||||
Net asset value and offering price per share | $ | 9.74 | ||
Class Y: | ||||
Net asset value and offering price per share | $ | 9.75 | ||
Class R5: | ||||
Net asset value and offering price per share | $ | 9.75 | ||
Class R6: | ||||
Net asset value and offering price per share | $ | 9.75 | ||
See accompanying Notes to Financial Statements which are an integral part of the financial statements.
19 Invesco Strategic Real Return Fund
Statement of Operations
For the year ended August 31, 2017
Investment income: |
| |||
Interest (net of foreign withholding taxes of $1,068) | $ | 343,909 | ||
Treasury Inflation-Protected Securities inflation adjustments | 164,479 | |||
Dividends from affiliates | 307,490 | |||
Dividends | 34,979 | |||
Total investment income | 850,857 | |||
Expenses: | ||||
Advisory fees | 91,956 | |||
Administrative services fees | 50,000 | |||
Custodian fees | 12,078 | |||
Distribution fees: | ||||
Class A | 31,404 | |||
Class C | 10,075 | |||
Class R | 608 | |||
Transfer agent fees — A, C, R and Y | 15,142 | |||
Transfer agent fees — R5 | 2 | |||
Transfer agent fees — R6 | 38 | |||
Trustees’ and officers’ fees and benefits | 21,163 | |||
Registration and filing fees | 72,343 | |||
Licensing Fees | 4,144 | |||
Reports to shareholders | 17,860 | |||
Professional services fees | 54,239 | |||
Other | 20,028 | |||
Total expenses | 401,080 | |||
Less: Fees waived, expenses reimbursed and expense offset arrangement(s) | (281,626 | ) | ||
Net expenses | 119,454 | |||
Net investment income | 731,403 | |||
Realized and unrealized gain (loss) from: | ||||
Net realized gain (loss) from: | ||||
Investment securities (includes net gains from securities sold to affiliates of $224) | 18,901 | |||
Futures contracts | (8,965 | ) | ||
| 9,936 | ||||
Change in net unrealized appreciation of: | ||||
Investment securities | 31,025 | |||
Futures contracts | 464 | |||
| 31,489 | ||||
Net realized and unrealized gain | 41,425 | |||
Net increase in net assets resulting from operations | $ | 772,828 | ||
See accompanying Notes to Financial Statements which are an integral part of the financial statements.
20 Invesco Strategic Real Return Fund
Statement of Changes in Net Assets
For the years ended August 31, 2017 and 2016
| 2017 | 2016 | |||||||
Operations: | ||||||||
Net investment income | $ | 731,403 | $ | 549,851 | ||||
Net realized gain (loss) | 9,936 | (242,507 | ) | |||||
Change in net unrealized appreciation | 31,489 | 516,603 | ||||||
Net increase in net assets resulting from operations | 772,828 | 823,947 | ||||||
Distributions to shareholders from net investment income: | ||||||||
Class A | (425,514 | ) | (288,940 | ) | ||||
Class C | (26,782 | ) | (8,916 | ) | ||||
Class R | (3,730 | ) | (1,528 | ) | ||||
Class Y | (336,178 | ) | (235,320 | ) | ||||
Class R5 | (366 | ) | (313 | ) | ||||
Class R6 | (4,094 | ) | (313 | ) | ||||
Total distributions from net investment income | (796,664 | ) | (535,330 | ) | ||||
Share transactions–net: | ||||||||
Class A | 5,239,656 | 1,035,979 | ||||||
Class C | 988,783 | 82,103 | ||||||
Class R | 72,341 | 39,543 | ||||||
Class Y | 2,625,232 | 286,958 | ||||||
Class R5 | — | — | ||||||
Class R6 | 260,633 | — | ||||||
Net increase in net assets resulting from share transactions | 9,186,645 | 1,444,583 | ||||||
Net increase in net assets | 9,162,809 | 1,733,200 | ||||||
Net assets: | ||||||||
Beginning of year | 18,390,624 | 16,657,424 | ||||||
End of year (includes undistributed net investment income of $83,714 and $115,155, respectively) | $ | 27,553,433 | $ | 18,390,624 | ||||
Notes to Financial Statements
August 31, 2017
NOTE 1—Significant Accounting Policies
Invesco Strategic Real Return Fund (the “Fund”) is a series portfolio of AIM Counselor Series Trust (Invesco Counselor Series Trust) (the “Trust”). The Trust is a Delaware statutory trust registered under the Investment Company Act of 1940, as amended (the “1940 Act”), as an open-end series management investment company consisting of fourteen separate portfolios, each authorized to issue an unlimited number of shares of beneficial interest. The assets, liabilities and operations of each portfolio are accounted for separately. Information presented in these financial statements pertains only to the Fund. Matters affecting each portfolio or class will be voted on exclusively by the shareholders of such portfolio or class.
The Fund’s investment objective is to seek to mitigate the effects of unanticipated inflation and to provide current income.
The Fund currently consists of six different classes of shares: Class A, Class C, Class R, Class Y, Class R5 and Class R6. Class Y shares are available only to certain investors. Class A shares are sold with a front-end sales charge unless certain waiver criteria are met and under certain circumstances load waived shares may be subject to contingent deferred sales charges (“CDSC”). Class C shares are sold with a CDSC. Class R, Class Y, Class R5 and Class R6 shares are sold at net asset value.
The Fund is an investment company and accordingly follows the investment company accounting and reporting guidance in accordance with Financial Accounting Standards Board Accounting Standards Codification Topic 946, Financial Services — Investment Companies.
The following is a summary of the significant accounting policies followed by the Fund in the preparation of its financial statements.
| A. | Security Valuations — Securities, including restricted securities, are valued according to the following policy. |
Debt obligations (including convertible securities) and unlisted equities are fair valued using an evaluated quote provided by an independent pricing service. Evaluated quotes provided by the pricing service may be determined without exclusive reliance on quoted prices, and may reflect appropriate factors such as institution-size trading in similar groups of securities, developments related to specific securities, dividend rate (for unlisted equities), yield (for debt obligations), quality, type of issue, coupon rate (for debt obligations), maturity (for debt obligations), individual trading characteristics and other market data. Pricing services generally value debt obligations assuming orderly transactions of institutional round lot size, but a Fund may hold or transact in the same securities in smaller, odd lot sizes. Odd lots often trade at lower prices than institutional round lots. Debt obligations are subject to interest rate and credit risks. In addition, all debt obligations involve some risk of default with respect to interest and/or principal payments.
21 Invesco Strategic Real Return Fund
A security listed or traded on an exchange (except convertible securities) is valued at its last sales price or official closing price as of the close of the customary trading session on the exchange where the security is principally traded, or lacking any sales or official closing price on a particular day, the security may be valued at the closing bid price on that day. Securities traded in the over-the-counter market are valued based on prices furnished by independent pricing services or market makers. When such securities are valued by an independent pricing service they may be considered fair valued. Futures contracts are valued at the final settlement price set by an exchange on which they are principally traded. Listed options are valued at the mean between the last bid and asked prices from the exchange on which they are principally traded. Options not listed on an exchange are valued by an independent source at the mean between the last bid and asked prices. For purposes of determining net asset value (“NAV”) per share, futures and option contracts generally are valued 15 minutes after the close of the customary trading session of the New York Stock Exchange (“NYSE”).
Investments in open-end and closed-end registered investment companies that do not trade on an exchange are valued at the end-of-day net asset value per share. Investments in open-end and closed-end registered investment companies that trade on an exchange are valued at the last sales price or official closing price as of the close of the customary trading session on the exchange where the security is principally traded.
Foreign securities’ (including foreign exchange contracts) prices are converted into U.S. dollar amounts using the applicable exchange rates as of the close of the NYSE. If market quotations are available and reliable for foreign exchange-traded equity securities, the securities will be valued at the market quotations. Because trading hours for certain foreign securities end before the close of the NYSE, closing market quotations may become unreliable. If between the time trading ends on a particular security and the close of the customary trading session on the NYSE, events occur that the investment adviser determines are significant and make the closing price unreliable, the Fund may fair value the security. If the event is likely to have affected the closing price of the security, the security will be valued at fair value in good faith using procedures approved by the Board of Trustees. Adjustments to closing prices to reflect fair value may also be based on a screening process of an independent pricing service to indicate the degree of certainty, based on historical data, that the closing price in the principal market where a foreign security trades is not the current value as of the close of the NYSE. Foreign securities’ prices meeting the approved degree of certainty that the price is not reflective of current value will be priced at the indication of fair value from the independent pricing service. Multiple factors may be considered by the independent pricing service in determining adjustments to reflect fair value and may include information relating to sector indices, American Depositary Receipts and domestic and foreign index futures. Foreign securities may have additional risks including exchange rate changes, potential for sharply devalued currencies and high inflation, political and economic upheaval, the relative lack of issuer information, relatively low market liquidity and the potential lack of strict financial and accounting controls and standards.
Securities for which market prices are not provided by any of the above methods may be valued based upon quotes furnished by independent sources. The last bid price may be used to value equity securities. The mean between the last bid and asked prices is used to value debt obligations, including corporate loans.
Securities for which market quotations are not readily available or became unreliable are valued at fair value as determined in good faith by or under the supervision of the Trust’s officers following procedures approved by the Board of Trustees. Issuer specific events, market trends, bid/asked quotes of brokers and information providers and other market data may be reviewed in the course of making a good faith determination of a security’s fair value.
The Fund may invest in securities that are subject to interest rate risk, meaning the risk that the prices will generally fall as interest rates rise and, conversely, the prices will generally rise as interest rates fall. Specific securities differ in their sensitivity to changes in interest rates depending on their individual characteristics. Changes in interest rates may result in increased market volatility, which may affect the value and/or liquidity of certain Fund investments.
Valuations change in response to many factors including the historical and prospective earnings of the issuer, the value of the issuer’s assets, general economic conditions, interest rates, investor perceptions and market liquidity. Because of the inherent uncertainties of valuation, the values reflected in the financial statements may materially differ from the value received upon actual sale of those investments.
| B. | Securities Transactions and Investment Income — Securities transactions are accounted for on a trade date basis. Realized gains or losses on sales are computed on the basis of specific identification of the securities sold. Interest income (net of withholding tax, if any) is recorded on the accrual basis from settlement date and includes income from pay-in-kind securities, if any. Dividend income (net of withholding tax, if any) is recorded on the ex-dividend date. Bond premiums and discounts are amortized and/or accreted for financial reporting purposes. |
The Fund may periodically participate in litigation related to Fund investments. As such, the Fund may receive proceeds from litigation settlements. Any proceeds received are included in the Statement of Operations as realized gain (loss) for investments no longer held and as unrealized gain (loss) for investments still held.
Brokerage commissions and mark ups are considered transaction costs and are recorded as an increase to the cost basis of securities purchased and/or a reduction of proceeds on a sale of securities. Such transaction costs are included in the determination of net realized and unrealized gain (loss) from investment securities reported in the Statement of Operations and the Statement of Changes in Net Assets and the net realized and unrealized gains (losses) on securities per share in the Financial Highlights. Transaction costs are included in the calculation of the Fund’s net asset value and, accordingly, they reduce the Fund’s total returns. These transaction costs are not considered operating expenses and are not reflected in net investment income reported in the Statement of Operations and the Statement of Changes in Net Assets, or the net investment income per share and the ratios of expenses and net investment income reported in the Financial Highlights, nor are they limited by any expense limitation arrangements between the Fund and the investment adviser.
The Fund allocates income and realized and unrealized capital gains and losses to a class based on the relative net assets of each class.
| C. | Country Determination — For the purposes of making investment selection decisions and presentation in the Schedule of Investments, the investment adviser may determine the country in which an issuer is located and/or credit risk exposure based on various factors. These factors include the laws of the country under which the issuer is organized, where the issuer maintains a principal office, the country in which the issuer derives 50% or more of its total revenues and the country that has the primary market for the issuer’s securities, as well as other criteria. Among the other criteria that may be evaluated for making this determination are the country in which the issuer maintains 50% or more of its assets, the type of security, financial guarantees and enhancements, the nature of the collateral and the sponsor organization. Country of issuer and/or credit risk exposure has been determined to be the United States of America, unless otherwise noted. |
22 Invesco Strategic Real Return Fund
| D. | Distributions — Distributions from net investment income, if any, are declared and paid monthly. Distributions from net realized capital gain, if any, are generally declared and paid annually and recorded on the ex-dividend date. The Fund may elect to treat a portion of the proceeds from redemptions as distributions for federal income tax purposes. |
| E. | Federal Income Taxes — The Fund intends to comply with the requirements of Subchapter M of the Internal Revenue Code of 1986, as amended (the “Internal Revenue Code”), necessary to qualify as a regulated investment company and to distribute substantially all of the Fund’s taxable earnings to shareholders. As such, the Fund will not be subject to federal income taxes on otherwise taxable income (including net realized capital gain) that is distributed to shareholders. Therefore, no provision for federal income taxes is recorded in the financial statements. |
The Fund recognizes the tax benefits of uncertain tax positions only when the position is more likely than not to be sustained. Management has analyzed the Fund’s uncertain tax positions and concluded that no liability for unrecognized tax benefits should be recorded related to uncertain tax positions. Management is not aware of any tax positions for which it is reasonably possible that the total amounts of unrecognized tax benefits will change materially in the next 12 months.
The Fund files tax returns in the U.S. Federal jurisdiction and certain other jurisdictions. Generally, the Fund is subject to examinations by such taxing authorities for up to three years after the filing of the return for the tax period.
| F. | Expenses — Fees provided for under the Rule 12b-1 plan of a particular class of the Fund are charged to the operations of such class. Transfer agency fees and expenses and other shareholder recordkeeping fees and expenses attributable to Class R5 and Class R6 are allocated to each share class based on relative net assets. Sub-accounting fees attributable to Class R5 are charged to the operations of the class. Transfer agency fees and expenses and other shareholder recordkeeping fees and expenses relating to all other classes are allocated among those classes based on relative net assets. All other expenses are allocated among the classes based on relative net assets. |
| G. | Accounting Estimates — The preparation of financial statements in conformity with accounting principles generally accepted in the United States of America (“GAAP”) requires management to make estimates and assumptions that affect the reported amounts of assets and liabilities at the date of the financial statements and the reported amounts of revenues and expenses during the reporting period including estimates and assumptions related to taxation. Actual results could differ from those estimates by a significant amount. In addition, the Fund monitors for material events or transactions that may occur or become known after the period-end date and before the date the financial statements are released to print. |
| H. | Indemnifications — Under the Trust’s organizational documents, each Trustee, officer, employee or other agent of the Trust is indemnified against certain liabilities that may arise out of the performance of their duties to the Fund. Additionally, in the normal course of business, the Fund enters into contracts, including the Fund’s servicing agreements, that contain a variety of indemnification clauses. The Fund’s maximum exposure under these arrangements is unknown as this would involve future claims that may be made against the Fund that have not yet occurred. The risk of material loss as a result of such indemnification claims is considered remote. |
| I. | Treasury Inflation-Protected Securities — The Fund may invest in Treasury Inflation-Protected Securities (“TIPS”). TIPS are fixed income securities whose principal value is periodically adjusted to the rate of inflation. The principal value of TIPS will be adjusted upward or downward, and any increase or decrease in the principal amount of TIPS will be included as Treasury Inflation-Protected Securities inflation adjustments in the Statement of Operations, even though investors do not receive their principal until maturity. |
| J. | Futures Contracts — The Fund may enter into futures contracts to manage exposure to interest rate, equity and market price movements and/or currency risks. A futures contract is an agreement between Counterparties to purchase or sell a specified underlying security, currency or commodity (or delivery of a cash settlement price, in the case of an index future) for a fixed price at a future date. The Fund currently invests only in exchange-traded futures and they are standardized as to maturity date and underlying financial instrument. Initial margin deposits required upon entering into futures contracts are satisfied by the segregation of specific securities or cash as collateral at the futures commission merchant (broker). During the period the futures contracts are open, changes in the value of the contracts are recognized as unrealized gains or losses by recalculating the value of the contracts on a daily basis. Subsequent or variation margin payments are received or made depending upon whether unrealized gains or losses are incurred. These amounts are reflected as receivables or payables on the Statement of Assets and Liabilities. When the contracts are closed or expire, the Fund recognizes a realized gain or loss equal to the difference between the proceeds from, or cost of, the closing transaction and the Fund’s basis in the contract. The net realized gain (loss) and the change in unrealized gain (loss) on futures contracts held during the period is included on the Statement of Operations. The primary risks associated with futures contracts are market risk and the absence of a liquid secondary market. If the Fund were unable to liquidate a futures contract and/or enter into an offsetting closing transaction, the Fund would continue to be subject to market risk with respect to the value of the contracts and continue to be required to maintain the margin deposits on the futures contracts. Futures contracts have minimal Counterparty risk since the exchange’s clearinghouse, as Counterparty to all exchange-traded futures, guarantees the futures against default. Risks may exceed amounts recognized in the Statement of Assets and Liabilities. |
| K. | Collateral — To the extent the Fund has designated or segregated a security as collateral and that security is subsequently sold, it is the Fund’s practice to replace such collateral no later than the next business day. |
23 Invesco Strategic Real Return Fund
NOTE 2—Advisory Fees and Other Fees Paid to Affiliates
The Trust has entered into a master investment advisory agreement with Invesco Advisers, Inc. (the “Adviser” or “Invesco”). Under the terms of the investment advisory agreement, the Fund accrues daily and pays monthly, an advisory fee to the Adviser based on the annual rate of the Fund’s average daily net assets as follows:
| Average Daily Net Assets | Rate | |||
First $1 billion | 0.40% | |||
Next $2.5 billion | 0.35% | |||
Over $3.5 billion | 0.33% | |||
For the year ended August 31, 2017, the effective advisory fees incurred by the Fund was 0.40%.
Under the terms of a master sub-advisory agreement between the Adviser and each of Invesco Asset Management Deutschland GmbH, Invesco Asset Management Limited, Invesco Asset Management (Japan) Limited, Invesco Hong Kong Limited, Invesco Senior Secured Management, Inc. and Invesco Canada Ltd. and separate sub-advisory agreements with Invesco PowerShares Capital Management LLC and Invesco Asset Management (India) Private Limited (collectively, the “Affiliated Sub-Advisers”) the Adviser, not the Fund, will pay 40% of the fees paid to the Adviser to any such Affiliated Sub-Adviser(s) that provide(s) discretionary investment management services to the Fund based on the percentage of assets allocated to such Affiliated Sub-Adviser(s).
The Adviser has contractually agreed, through at least December 31, 2017 to waive advisory fees and/or reimburse expenses to the extent necessary to limit total annual fund operating expenses after fee waiver and/or expense reimbursement (including prior fiscal year-ended Acquired Fund Fees and Expenses of 0.23% and excluding certain items discussed below) of Class A, Class C, Class R, Class Y, Class R5 and Class R6 shares to 0.82%, 1.57%, 1.07%, 0.57%, 0.57% and 0.57%, respectively, of average daily net assets (the “expense limits”). In determining the Adviser’s obligation to waive advisory fees and/or reimburse expenses, the following expenses are not taken into account, and could cause the total annual fund operating expenses after fee waiver and/or expense reimbursement to exceed the numbers reflected above: (1) interest; (2) taxes; (3) dividend expense on short sales; (4) extraordinary or non-routine items, including litigation expenses; and (5) expenses that the Fund has incurred but did not actually pay because of an expense offset arrangement. Acquired Fund Fees and Expenses are not operating expenses of the Fund directly, but are fees and expenses, including management fees, of the investment companies in which the Fund invests. As a result, the total annual fund operating expenses after expense reimbursement may exceed the expense limits above. Unless Invesco continues the fee waiver agreement, it will terminate on December 31, 2017. During its term, the fee waiver agreement cannot be terminated or amended to increase the expense limits or reduce the advisory fee waivers without approval of the Board of Trustees.
Further, the Adviser has contractually agreed, through at least June 30, 2019, to waive the advisory fee payable by the Fund in an amount equal to 100% of the net advisory fees the Adviser receives on the Fund’s investments in certain affiliated funds.
For the year ended August 31, 2017, the Adviser waived advisory fees of $266,444 and reimbursed class level expenses of $8,274, $664, $80, $6,021, $2 and $37 of Class A, Class C, Class R, Class Y, Class R5 and Class R6 shares, respectively.
The Trust has entered into a master administrative services agreement with Invesco pursuant to which the Fund has agreed to pay Invesco for certain administrative costs incurred in providing accounting services to the Fund. For the year ended August 31, 2017, expenses incurred under the agreement are shown in the Statement of Operations as Administrative services fees.
The Trust has entered into a transfer agency and service agreement with Invesco Investment Services, Inc. (“IIS”) pursuant to which the Fund has agreed to pay IIS a fee for providing transfer agency and shareholder services to the Fund and reimburse IIS for certain expenses incurred by IIS in the course of providing such services. IIS may make payments to intermediaries that provide omnibus account services, sub-accounting services and/or networking services. All fees payable by IIS to intermediaries that provide omnibus account services or sub-accounting services are charged back to the Fund, subject to certain limitations approved by the Trust’s Board of Trustees. For the year ended August 31, 2017, expenses incurred under the agreement are shown in the Statement of Operations as Transfer agent fees.
The Trust has entered into master distribution agreements with Invesco Distributors, Inc. (“IDI”) to serve as the distributor for the Class A, Class C, Class R, Class Y, Class R5 and Class R6 shares of the Fund. The Trust has adopted plans pursuant to Rule 12b-1 under the 1940 Act with respect to the Fund’s Class A, Class C and Class R shares (collectively the “Plans”). The Fund, pursuant to the Plans, pays IDI compensation at the annual rate of 0.25% of the Fund’s average daily net assets of Class A shares, 1.00% of the average daily net assets of Class C shares and 0.50% of the average daily net assets of Class R shares. Of the Plan payments, up to 0.25% of the average daily net assets of each class of shares may be paid to furnish continuing personal shareholder services to customers who purchase and own shares of such classes. The fees are accrued daily and paid monthly. Any amounts not paid as a service fee under the Plans would constitute an asset-based sales charge. Rules of the Financial Industry Regulatory Authority (“FINRA”) impose a cap on the total sales charges, including asset-based sales charges, that may be paid by any class of shares of the Fund. For the year ended August 31, 2017, expenses incurred under the Plans are shown in the Statement of Operations as Distribution fees.
Front-end sales commissions and CDSC (collectively, the “sales charges”) are not recorded as expenses of the Fund. Front-end sales commissions are deducted from proceeds from the sales of Fund shares prior to investment in Class A shares of the Fund. CDSC are deducted from redemption proceeds prior to remittance to the shareholder. During the year ended August 31, 2017, IDI advised the Fund that IDI retained $5,732 in front-end sales commissions from the sale of Class A shares and $1,956 from Class A shares for CDSC imposed upon redemptions by shareholders.
Certain officers and trustees of the Trust are officers and directors of the Adviser, IIS and/or IDI.
24 Invesco Strategic Real Return Fund
NOTE 3—Additional Valuation Information
GAAP defines fair value as the price that would be received to sell an asset or paid to transfer a liability in an orderly transaction between market participants at the measurement date, under current market conditions. GAAP establishes a hierarchy that prioritizes the inputs to valuation methods, giving the highest priority to readily available unadjusted quoted prices in an active market for identical assets (Level 1) and the lowest priority to significant unobservable inputs (Level 3), generally when market prices are not readily available or are unreliable. Based on the valuation inputs, the securities or other investments are tiered into one of three levels. Changes in valuation methods may result in transfers in or out of an investment’s assigned level:
| Level 1 — | Prices are determined using quoted prices in an active market for identical assets. |
| Level 2 — | Prices are determined using other significant observable inputs. Observable inputs are inputs that other market participants may use in pricing a security. These may include quoted prices for similar securities, interest rates, prepayment speeds, credit risk, yield curves, loss severities, default rates, discount rates, volatilities and others. |
| Level 3 — | Prices are determined using significant unobservable inputs. In situations where quoted prices or observable inputs are unavailable (for example, when there is little or no market activity for an investment at the end of the period), unobservable inputs may be used. Unobservable inputs reflect the Fund’s own assumptions about the factors market participants would use in determining fair value of the securities or instruments and would be based on the best available information. |
The following is a summary of the tiered valuation input levels, as of August 31, 2017. The level assigned to the securities valuations may not be an indication of the risk or liquidity associated with investing in those securities. Because of the inherent uncertainties of valuation, the values reflected in the financial statements may materially differ from the value received upon actual sale of those investments.
The Fund’s policy is to recognize transfers in and out of the valuation levels as of the end of the reporting period. During the year ended August 31, 2017, there were no transfers between valuation levels.
| Level 1 | Level 2 | Level 3 | Total | |||||||||||||
U.S. Treasury Securities | $ | — | $ | 12,362,409 | $ | — | $ | 12,362,409 | ||||||||
Common Stocks | 8,253,905 | — | — | 8,253,905 | ||||||||||||
Bonds & Notes | — | 5,638,241 | — | 5,638,241 | ||||||||||||
Preferred Stocks | 737,016 | 245,152 | — | 982,168 | ||||||||||||
Money Market Funds | 116,668 | — | — | 116,668 | ||||||||||||
| 9,107,589 | 18,245,802 | — | 27,353,391 | |||||||||||||
Futures Contracts* | 464 | — | — | 464 | ||||||||||||
Total Investments | $ | 9,108,053 | $ | 18,245,802 | $ | — | $ | 27,353,855 | ||||||||
| * | Unrealized appreciation . |
NOTE 4—Derivative Investments
The Fund may enter into an International Swaps and Derivatives Association Master Agreement (“ISDA Master Agreement”) under which a Fund may trade OTC derivatives. An OTC transaction entered into under an ISDA Master Agreement typically involves a collateral posting arrangement, payment netting provisions and close-out netting provisions. These netting provisions allow for reduction of credit risk through netting of contractual obligations. The enforceability of the netting provisions of the ISDA Master Agreement depends on the governing law of the ISDA Master Agreement, among other factors.
For financial reporting purposes, the Fund does not offset OTC derivative assets or liabilities that are subject to ISDA Master Agreements in the Statement of Assets and Liabilities.
Value of Derivative Investments at Period-End
The table below summarizes the value of the Fund’s derivative investments, detailed by primary risk exposure, held as of August 31, 2017:
| Value | ||||
| Derivative Assets | Interest Rate Risk | |||
Unrealized appreciation on futures contracts — Exchange-Traded(a) | $ | 464 | ||
Derivatives not subject to master netting agreements | (464 | ) | ||
Total Derivative Assets subject to master netting agreements | $ | — | ||
| (a) | The daily variation margin receivable (payable) at period-end is recorded in the Statement of Assets and Liabilities. |
25 Invesco Strategic Real Return Fund
Effect of Derivative Investments for the year ended August 31, 2017
The table below summarizes the gains (losses) on derivative investments, detailed by primary risk exposure, recognized in earnings during the period:
| Location of Gain (Loss) on Statement of Operations | ||||
| Interest Rate Risk | ||||
Realized Gain (Loss): | ||||
Futures contracts | $ | (8,965 | ) | |
Change in Net Unrealized Appreciation: | ||||
Futures contracts | 464 | |||
Total | $ | (8,501 | ) | |
The table below summarizes the nine month average notional value of futures contracts outstanding during the period.
| Futures Contracts | ||||
Average notional value | $ | 250,736 | ||
NOTE 5—Investments in Affiliates
The Fund’s Adviser and the adviser for Invesco Floating Rate Fund are subsidiaries of Invesco Ltd. and therefore, Invesco Floating Rate Fund is considered to be affiliated with the Fund. The following is a summary of the transactions in, and earnings from, investments in Invesco Floating Rate Fund for the year ended August 31, 2017.
Value 08/31/16 | Purchases at Cost | Proceeds from Sales | Change in Unrealized Appreciation | Realized Gain (Loss) | Value 08/31/17 | Dividend Income | ||||||||||||||||||||||
Invesco Floating Rate — Class R6 | $ | 5,558,524 | $ | 3,155,010 | $ | (547,000 | ) | $ | 89,757 | $ | (2,386 | ) | $ | 8,253,905 | $ | 306,329 | ||||||||||||
NOTE 6—Security Transactions with Affiliated Funds
The Fund is permitted to purchase or sell securities from or to certain other Invesco Funds under specified conditions outlined in procedures adopted by the Board of Trustees of the Trust. The procedures have been designed to ensure that any purchase or sale of securities by the Fund from or to another fund or portfolio that is or could be considered an affiliate by virtue of having a common investment adviser (or affiliated investment advisers), common Trustees and/or common officers complies with Rule 17a-7 of the 1940 Act. Further, as defined under the procedures, each transaction is effected at the current market price. Pursuant to these procedures, for the year ended August 31, 2017, the Fund engaged insecurities sales of $18,372, which resulted in net realized gains of $224.
NOTE 7—Expense Offset Arrangement(s)
The expense offset arrangement is comprised of transfer agency credits which result from balances in demand deposit accounts used by the transfer agent for clearing shareholder transactions. For the year ended August 31, 2017, the Fund received credits from this arrangement, which resulted in the reduction of the Fund’s total expenses of $104.
NOTE 8—Trustees’ and Officers’ Fees and Benefits
Trustees’ and Officers’ Fees and Benefits include amounts accrued by the Fund to pay remuneration to certain Trustees and Officers of the Fund. Trustees have the option to defer compensation payable by the Fund, and Trustees’ and Officers’ Fees and Benefits also include amounts accrued by the Fund to fund such deferred compensation amounts. Those Trustees who defer compensation have the option to select various Invesco Funds in which their deferral accounts shall be deemed to be invested. Obligations under the deferred compensation plan represent unsecured claims against the general assets of the Fund.
NOTE 9—Cash Balances
The Fund is permitted to temporarily carry a negative or overdrawn balance in its account with State Street Bank and Trust Company, the custodian bank. Such balances, if any at period-end, are shown in the Statement of Assets and Liabilities under the payable caption Amount due custodian. To compensate the custodian bank for such overdrafts, the overdrawn Fund may either (1) leave funds as a compensating balance in the account so the custodian bank can be compensated by earning the additional interest; or (2) compensate by paying the custodian bank at a rate agreed upon by the custodian bank and Invesco, not to exceed the contractually agreed upon rate. The Fund may not purchase additional securities when any borrowings from banks exceed 5% of the Fund’s total assets.
26 Invesco Strategic Real Return Fund
NOTE 10—Distributions to Shareholders and Tax Components of Net Assets
Tax Character of Distributions to Shareholders Paid During the Fiscal Years Ended August 31, 2017 and 2016:
| 2017 | 2016 | |||||||
Ordinary income | $ | 796,664 | $ | 535,330 | ||||
Tax Components of Net Assets at Period-End:
| 2017 | ||||
Undistributed ordinary income | $ | 186,976 | ||
Net unrealized appreciation (depreciation) — investments | (109,119 | ) | ||
Temporary book/tax differences | (5,535 | ) | ||
Capital Loss Carryforward | (408,502 | ) | ||
Shares of beneficial interest | 27,889,613 | |||
Total net assets | $ | 27,553,433 | ||
The difference between book-basis and tax-basis unrealized appreciation (depreciation) is due to differences in the timing of recognition of gains and losses on investments for tax and book purposes. The Fund’s net unrealized appreciation (depreciation) difference is attributable primarily to wash sales and bond premium amortization.
The temporary book/tax differences are a result of timing differences between book and tax recognition of income and/or expenses. The Fund’s temporary book/tax differences are the result of the trustee deferral of compensation and retirement plan benefits.
Capital loss carryforward is calculated and reported as of a specific date. Results of transactions and other activity after that date may affect the amount of capital loss carryforward actually available for the Fund to utilize. The ability to utilize capital loss carryforward in the future may be limited under the Internal Revenue Code and related regulations based on the results of future transactions.
The Fund has a capital loss carryforward as of August 31, 2017, which expires as follows:
| Capital Loss Carryforward* | ||||||||||||
| Expiration | Short-Term | Long-Term | Total | |||||||||
Not subject to expiration | $ | 159,212 | $ | 249,290 | $ | 408,502 | ||||||
| * | Capital loss carryforward as of the date listed above is reduced for limitations, if any, to the extent required by the Internal Revenue Code and may be further limited depending upon a variety of factors, including the realization of net unrealized gains or losses as of the date of any reorganization. |
NOTE 11—Investment Transactions
The aggregate amount of investment securities (other than short-term securities, U.S. Treasury obligations and money market funds, if any) purchased and sold by the Fund during the year ended August 31, 2017 was $9,236,226 and $4,447,065, respectively. During the same period, purchases and sales of U.S. Treasury obligations were $6,967,199 and $2,875,437, respectively. Cost of investments, including any derivatives, on a tax basis includes the adjustments for financial reporting purposes as of the most recently completed federal income tax reporting period-end.
| Unrealized Appreciation (Depreciation) of Investments on a Tax Basis | ||||
Aggregate unrealized appreciation of investments | $ | 298,598 | ||
Aggregate unrealized (depreciation) of investments | (407,717 | ) | ||
Net unrealized appreciation (depreciation) of investments | $ | (109,119 | ) | |
Cost of investments for tax purposes is $27,462,974.
NOTE 12—Reclassification of Permanent Differences
Primarily as a result of differing book/tax treatment of bond premium amortization, on August 31, 2017, undistributed net investment income was increased by $33,820 and undistributed net realized gain (loss) was decreased by $33,820. This reclassification had no effect on the net assets of the Fund.
27 Invesco Strategic Real Return Fund
NOTE 13—Share Information
| Summary of Share Activity | ||||||||||||||||
| Years ended August 31, | ||||||||||||||||
| 2017(a) | 2016 | |||||||||||||||
| Shares | Amount | Shares | Amount | |||||||||||||
Sold: | ||||||||||||||||
Class A | 1,058,060 | $ | 10,278,518 | 270,704 | $ | 2,571,457 | ||||||||||
Class C | 138,215 | 1,340,749 | 41,352 | 392,999 | ||||||||||||
Class R | 7,146 | 69,419 | 4,026 | 38,280 | ||||||||||||
Class Y | 342,915 | 3,329,235 | 31,509 | 303,454 | ||||||||||||
Class R6 | 26,563 | 257,679 | — | — | ||||||||||||
Issued as reinvestment of dividends: | ||||||||||||||||
Class A | 16,471 | 159,156 | 7,271 | 68,375 | ||||||||||||
Class C | 2,586 | 24,926 | 909 | 8,553 | ||||||||||||
Class R | 354 | 3,413 | 134 | 1,263 | ||||||||||||
Class Y | 6,332 | 61,209 | 179 | 1,717 | ||||||||||||
Class R6 | 384 | 3,728 | — | — | ||||||||||||
Reacquired: | ||||||||||||||||
Class A | (534,844 | ) | (5,198,018 | ) | (170,511 | ) | (1,603,853 | ) | ||||||||
Class C | (39,042 | ) | (376,892 | ) | (33,763 | ) | (319,449 | ) | ||||||||
Class R | (50 | ) | (491 | ) | — | — | ||||||||||
Class Y | (78,933 | ) | (765,212 | ) | (1,873 | ) | (18,213 | ) | ||||||||
Class R6 | (80 | ) | (774 | ) | — | — | ||||||||||
Net increase in share activity | 946,077 | $ | 9,186,645 | 149,937 | $ | 1,444,583 | ||||||||||
| (a) | There is an entity that is a record owner of more than 5% of the outstanding shares of the Fund and owns 27% of the outstanding shares of the Fund. IDI has an agreement with this entity to sell Fund shares. The Fund, Invesco and/or Invesco affiliates may make payments to this entity, which is considered to be related to the Fund, for providing services to the Fund, Invesco and/or Invesco affiliates including but not limited to services such as, securities brokerage, distribution, third party record keeping and account servicing. The Fund has no knowledge as to whether all or any portion of the shares owned of record by this entity is also owned beneficially. |
| In addition, 53% of the outstanding shares of the Fund are owned by the Adviser or an affiliate of the Adviser. |
28 Invesco Strategic Real Return Fund
NOTE 14—Financial Highlights
The following schedule presents financial highlights for a share of the Fund outstanding throughout the periods indicated.
| Net asset value, beginning of period | Net investment income(a) | Net gains (losses) on securities (both realized and unrealized) | Total from investment operations | Dividends from net investment income | Net asset value, end of period | Total return(b) | Net assets, end of period (000’s omitted) | Ratio of expenses to average net assets with fee waivers and/or expenses absorbed(c) | Ratio of expenses to average net assets without fee waivers and/or expenses absorbed | Ratio of net investment income to average net assets | Portfolio turnover(d) | |||||||||||||||||||||||||||||||||||||
Class A | ||||||||||||||||||||||||||||||||||||||||||||||||
Year ended 08/31/17 | $ | 9.77 | $ | 0.30 | $ | 0.01 | $ | 0.31 | $ | (0.34 | ) | $ | 9.74 | 3.27 | % | $ | 15,358 | 0.59 | %(e) | 1.81 | %(e) | 3.11 | %(e) | 32 | % | |||||||||||||||||||||||
Year ended 08/31/16 | 9.62 | 0.30 | 0.14 | 0.44 | (0.29 | ) | 9.77 | 4.72 | 10,130 | 0.61 | 2.34 | 3.13 | 35 | |||||||||||||||||||||||||||||||||||
Year ended 08/31/15 | 10.11 | 0.26 | (0.49 | ) | (0.23 | ) | (0.26 | ) | 9.62 | (2.26 | ) | 8,936 | 0.60 | 2.25 | 2.71 | 25 | ||||||||||||||||||||||||||||||||
Year ended 08/31/14(f) | 10.00 | 0.14 | 0.10 | 0.24 | (0.13 | ) | 10.11 | 2.44 | 7,880 | 0.59 | (g) | 2.87 | (g) | 4.21 | (g) | 13 | ||||||||||||||||||||||||||||||||
Class C | ||||||||||||||||||||||||||||||||||||||||||||||||
Year ended 08/31/17 | 9.77 | 0.23 | 0.01 | 0.24 | (0.27 | ) | 9.74 | 2.49 | 1,538 | 1.34 | (e) | 2.56 | (e) | 2.36 | (e) | 32 | ||||||||||||||||||||||||||||||||
Year ended 08/31/16 | 9.61 | 0.23 | 0.15 | 0.38 | (0.22 | ) | 9.77 | 4.04 | 549 | 1.36 | 3.09 | 2.38 | 35 | |||||||||||||||||||||||||||||||||||
Year ended 08/31/15 | 10.10 | 0.19 | (0.49 | ) | (0.30 | ) | (0.19 | ) | 9.61 | (3.00 | ) | 459 | 1.35 | 3.00 | 1.96 | 25 | ||||||||||||||||||||||||||||||||
Year ended 08/31/14(f) | 10.00 | 0.12 | 0.09 | 0.21 | (0.11 | ) | 10.10 | 2.14 | 54 | 1.34 | (g) | 3.62 | (g) | 3.46 | (g) | 13 | ||||||||||||||||||||||||||||||||
Class R | ||||||||||||||||||||||||||||||||||||||||||||||||
Year ended 08/31/17 | 9.77 | 0.28 | 0.01 | 0.29 | (0.32 | ) | 9.74 | 3.00 | 148 | 0.84 | (e) | 2.06 | (e) | 2.86 | (e) | 32 | ||||||||||||||||||||||||||||||||
Year ended 08/31/16 | 9.62 | 0.28 | 0.14 | 0.42 | (0.27 | ) | 9.77 | 4.46 | 76 | 0.86 | 2.59 | 2.88 | 35 | |||||||||||||||||||||||||||||||||||
Year ended 08/31/15 | 10.11 | 0.24 | (0.49 | ) | (0.25 | ) | (0.24 | ) | 9.62 | (2.51 | ) | 35 | 0.85 | 2.50 | 2.46 | 25 | ||||||||||||||||||||||||||||||||
Year ended 08/31/14(f) | 10.00 | 0.14 | 0.10 | 0.24 | (0.13 | ) | 10.11 | 2.37 | 10 | 0.84 | (g) | 3.12 | (g) | 3.96 | (g) | 13 | ||||||||||||||||||||||||||||||||
Class Y | ||||||||||||||||||||||||||||||||||||||||||||||||
Year ended 08/31/17 | 9.78 | 0.33 | 0.01 | 0.34 | (0.37 | ) | 9.75 | 3.52 | 10,228 | 0.34 | (e) | 1.56 | (e) | 3.36 | (e) | 32 | ||||||||||||||||||||||||||||||||
Year ended 08/31/16 | 9.62 | 0.32 | 0.15 | 0.47 | (0.31 | ) | 9.78 | 5.09 | 7,616 | 0.36 | 2.09 | 3.38 | 35 | |||||||||||||||||||||||||||||||||||
Year ended 08/31/15 | 10.11 | 0.29 | (0.49 | ) | (0.20 | ) | (0.29 | ) | 9.62 | (2.02 | ) | 7,209 | 0.35 | 2.00 | 2.96 | 25 | ||||||||||||||||||||||||||||||||
Year ended 08/31/14(f) | 10.00 | 0.15 | 0.10 | 0.25 | (0.14 | ) | 10.11 | 2.50 | 7,563 | 0.34 | (g) | 2.62 | (g) | 4.46 | (g) | 13 | ||||||||||||||||||||||||||||||||
Class R5 | ||||||||||||||||||||||||||||||||||||||||||||||||
Year ended 08/31/17 | 9.78 | 0.33 | 0.01 | 0.34 | (0.37 | ) | 9.75 | 3.52 | 10 | 0.34 | (e) | 1.52 | (e) | 3.36 | (e) | 32 | ||||||||||||||||||||||||||||||||
Year ended 08/31/16 | 9.62 | 0.32 | 0.15 | 0.47 | (0.31 | ) | 9.78 | 5.09 | 10 | 0.35 | 2.14 | 3.39 | 35 | |||||||||||||||||||||||||||||||||||
Year ended 08/31/15 | 10.11 | 0.29 | (0.49 | ) | (0.20 | ) | (0.29 | ) | 9.62 | (2.02 | ) | 10 | 0.35 | 2.07 | 2.96 | 25 | ||||||||||||||||||||||||||||||||
Year ended 08/31/14(f) | 10.00 | 0.15 | 0.10 | 0.25 | (0.14 | ) | 10.11 | 2.50 | 10 | 0.34 | (g) | 2.68 | (g) | 4.46 | (g) | 13 | ||||||||||||||||||||||||||||||||
Class R6 | ||||||||||||||||||||||||||||||||||||||||||||||||
Year ended 08/31/17 | 9.78 | 0.33 | 0.01 | 0.34 | (0.37 | ) | 9.75 | 3.52 | 272 | 0.34 | (e) | 1.52 | (e) | 3.36 | (e) | 32 | ||||||||||||||||||||||||||||||||
Year ended 08/31/16 | 9.62 | 0.32 | 0.15 | 0.47 | (0.31 | ) | 9.78 | 5.09 | 10 | 0.35 | 2.14 | 3.39 | 35 | |||||||||||||||||||||||||||||||||||
Year ended 08/31/15 | 10.11 | 0.29 | (0.49 | ) | (0.20 | ) | (0.29 | ) | 9.62 | (2.02 | ) | 10 | 0.35 | 2.07 | 2.96 | 25 | ||||||||||||||||||||||||||||||||
Year ended 08/31/14(f) | 10.00 | 0.15 | 0.10 | 0.25 | (0.14 | ) | 10.11 | 2.50 | 10 | 0.34 | (g) | 2.68 | (g) | 4.46 | (g) | 13 | ||||||||||||||||||||||||||||||||
| (a) | Calculated using average shares outstanding. |
| (b) | Includes adjustments in accordance with accounting principles generally accepted in the United States of America and as such, the net asset value for financial reporting purposes and the returns based upon those net asset values may differ from the net asset value and returns for shareholder transactions. Does not include sales charges and is not annualized for periods less than one year, if applicable. |
| (c) | In addition to the fees and expenses which the Fund bears directly, the Fund indirectly bears a pro rata share of the fees and expenses of the underlying funds in which the Fund invests. Because the underlying funds have varied expenses and fee levels and the Fund may own different proportions at different times, the amount of fees and expenses incurred indirectly by the Fund will vary. Estimated underlying fund expenses are not expenses that are incurred directly by the Fund. They are expenses that are incurred directly by the underlying funds and are deducted from the value of the funds the Fund invests in. The effect of the estimated underlying fund expenses that the Fund bears indirectly is included in the Fund’s total return. Estimated acquired fund fees from underlying funds were 0.22%, 0.23%, 0.22% and 0.21% for the years ended August 31, 2017, 2016, 2015, and for the period April 30, 2014 (commencement date) through August 31, 2014, respectively. |
| (d) | Portfolio turnover is calculated at the fund level and is not annualized for periods less than one year, if applicable. |
| (e) | Ratios are based on average daily net assets (000’s omitted) of $12,562, $1,007, $122, $9,141, $10 and $147 for Class A, Class C, Class R, Class Y, Class R5 and Class R6, respectively. |
| (f) | Commencement date of April 30, 2014. |
| (g) | Annualized. |
29 Invesco Strategic Real Return Fund
Report of Independent Registered Public Accounting Firm
To the Board of Trustees of AIM Counselor Series Trust (Invesco Counselor Series Trust)
and Shareholders of Invesco Strategic Real Return Fund:
In our opinion, the accompanying statement of assets and liabilities, including the schedule of investments, and the related statements of operations and of changes in net assets and the financial highlights present fairly, in all material respects, the financial position of Invesco Strategic Real Return Fund (one of the funds constituting AIM Counselor Series Trust (Invesco Counselor Series Trust), hereafter referred to as the “Fund”) as of August 31, 2017, the results of its operations for the year then ended, the changes in its net assets for each of the two years in the period then ended and the financial highlights for each of the three years in the period then ended and for the period April 30, 2014 (commencement of investment operations) through August 31, 2014, in conformity with accounting principles generally accepted in the United States of America. These financial statements and financial highlights (hereafter referred to as “financial statements”) are the responsibility of the Fund’s management. Our responsibility is to express an opinion on these financial statements based on our audits. We conducted our audits of these financial statements in accordance with the standards of the Public Company Accounting Oversight Board (United States). Those standards require that we plan and perform the audit to obtain reasonable assurance about whether the financial statements are free of material misstatement. An audit includes examining, on a test basis, evidence supporting the amounts and disclosures in the financial statements, assessing the accounting principles used and significant estimates made by management, and evaluating the overall financial statement presentation. We believe that our audits, which included confirmation of securities as of August 31, 2017 by correspondence with the custodian, transfer agent and brokers, and when replies were not received from the brokers, we performed other auditing procedures, provide a reasonable basis for our opinion.
PricewaterhouseCoopers LLP
Houston, Texas
October 30, 2017
30 Invesco Strategic Real Return Fund
Calculating your ongoing Fund expenses
Example
As a shareholder of the Fund, you incur two types of costs: (1) transaction costs, which may include sales charges (loads) on purchase payments or contingent deferred sales charges on redemptions, if any; and (2) ongoing costs, including management fees, distribution and/or service (12b-1) fees, and other Fund expenses. This example is intended to help you understand your ongoing costs (in dollars) of investing in the Fund and to compare these costs with ongoing costs of investing in other mutual funds. The example is based on an investment of $1,000 invested at the beginning of the period and held for the entire period March 1, 2017 through August 31, 2017.
Actual expenses
The table below provides information about actual account values and actual expenses. You may use the information in this table, together with the amount you invested, to estimate the expenses that you paid over the period. Simply divide your account value by $1,000 (for example, an $8,600 account value divided by $1,000 = 8.6), then multiply the result by the number in the table under the heading entitled “Actual Expenses Paid During Period” to estimate the expenses you paid on your account during this period.
Hypothetical example for comparison purposes
The table below also provides information about hypothetical account values and hypothetical expenses based on the Fund’s actual expense ratio and an assumed rate of return of 5% per year before expenses, which is not the Fund’s actual return.
The hypothetical account values and expenses may not be used to estimate the actual ending account balance or expenses you paid for the period. You may use this information to compare the ongoing costs of investing in the Fund and other funds. To do so, compare this 5% hypothetical example with the 5% hypothetical examples that appear in the shareholder reports of the other funds.
Please note that the expenses shown in the table are meant to highlight your ongoing costs only and do not reflect any transaction costs, such as sales charges (loads) on purchase payments or contingent deferred sales charges on redemptions, if any. Therefore, the hypothetical information is useful in comparing ongoing costs only, and will not help you determine the relative total costs of owning different funds. In addition, if these transaction costs were included, your costs would have been higher.
| Class | Beginning Account Value (03/01/17) | ACTUAL | HYPOTHETICAL (5% annual return before expenses) | Annualized Expense Ratio | ||||||||||||||||||||
| Ending Account Value (08/31/17)1 | Expenses Paid During Period2 | Ending Account Value (08/31/17) | Expenses Paid During Period2 | |||||||||||||||||||||
| A | $ | 1,000.00 | $ | 1,012.60 | $ | 2.99 | $ | 1,022.23 | $ | 3.01 | 0.59 | % | ||||||||||||
| C | 1,000.00 | 1,009.80 | 6.79 | 1,018.45 | 6.82 | 1.34 | ||||||||||||||||||
| R | 1,000.00 | 1,011.30 | 4.26 | 1,020.97 | 4.28 | 0.84 | ||||||||||||||||||
| Y | 1,000.00 | 1,014.90 | 1.73 | 1,023.49 | 1.73 | 0.34 | ||||||||||||||||||
| R5 | 1,000.00 | 1,014.90 | 1.73 | 1,023.49 | 1.73 | 0.34 | ||||||||||||||||||
| R6 | 1,000.00 | 1,013.80 | 1.73 | 1,023.49 | 1.73 | 0.34 | ||||||||||||||||||
| 1 | The actual ending account value is based on the actual total return of the Fund for the period March 1, 2017 through August 31, 2017, after actual expenses and will differ from the hypothetical ending account value which is based on the Fund’s expense ratio and a hypothetical annual return of 5% before expenses. |
| 2 | Expenses are equal to the Fund’s annualized expense ratio as indicated above multiplied by the average account value over the period, multiplied by 184/365 to reflect the most recent fiscal half year. |
31 Invesco Strategic Real Return Fund
Approval of Investment Advisory and Sub-Advisory Agreements
The Board of Trustees (the Board) of AIM Counselor Series Trust (Invesco Counselor Series Trust) (the Company) is required under the Investment Company Act of 1940, as amended, to approve annually the renewal of Invesco Strategic Real Return Fund’s (the Fund) investment advisory agreements. During contract renewal meetings held on June 12-13, 2017, the Board as a whole, and the disinterested or “independent” Trustees, who comprise over 75% of the Board, voting separately, approved the continuance for the Fund of the Master Investment Advisory Agreement with Invesco Advisers, Inc. (Invesco Advisers and the investment advisory agreement) and the Master Intergroup Sub-Advisory Contract for Mutual Funds with Invesco Asset Management Deutschland GmbH, Invesco Asset Management Limited, Invesco Asset Management (Japan) Limited, Invesco Hong Kong Limited, Invesco Senior Secured Management, Inc. and Invesco Canada Ltd. and separate Sub-Advisory Contracts with Invesco PowerShares Capital Management LLC and Invesco Asset Management (India) Private Limited (collectively, the Affiliated Sub-Advisers and the sub-advisory contracts) for another year, effective July 1, 2017.
In evaluating the fairness and reasonableness of compensation under the Fund’s investment advisory agreement and sub-advisory contracts, the Board considered, among other things, the factors discussed below. The Board determined that continuation of the Fund’s investment advisory agreement and the sub-advisory contracts is in the best interest of the Fund and its shareholders and that the compensation payable to Invesco Advisers and the Affiliated Sub-Advisers under the agreements is fair and reasonable.
The Board’s Fund Evaluation Process
The Board’s Investments Committee has established three Sub-Committees, which meet throughout the year to review the performance of funds advised by Invesco Advisers (the Invesco Funds). Over the course of each year, the Sub-Committees meet with portfolio managers for their assigned Invesco Funds and other members of management to review the performance, investment objective(s), policies, strategies, limitations and investment risks of these funds. The Board had the benefit of reports from the Sub-Committees and Investments Committee throughout the year in considering approval of the continuance of each Invesco Fund’s investment advisory agreement and sub-advisory contracts for another year.
During the contract renewal process, the Board receives comparative performance and fee data regarding the Invesco Funds prepared by Invesco Advisers and Broadridge Financial Solutions, Inc. (Broadridge), an independent provider of investment company data. The
Board also receives an independent written evaluation from the Senior Officer, an officer of the Invesco Funds who reports directly to the independent Trustees. The Senior Officer’s evaluation is prepared as part of his responsibility to manage the process by which the Invesco Funds’ proposed management fees are negotiated during the annual contract renewal process to ensure they are negotiated in a manner that is at arms’ length and reasonable. In addition to meetings with Invesco Advisers and fund counsel, the independent Trustees also discuss the continuance of the investment advisory agreement and sub-advisory contracts in separate sessions with the Senior Officer and with independent legal counsel.
The Trustees recognized that the advisory fee rates for the Invesco Funds are, in most cases, the result of years of review and negotiation. The Trustees’ deliberations and conclusions in a particular year may be based in part on their deliberations and conclusions regarding these arrangements throughout the year and in prior years. The Trustees’ review and conclusions are based on the comprehensive consideration of all information presented to them and are not the result of any single determinative factor. Moreover, one Trustee may have weighed a particular piece of information or factor differently than another Trustee.
The discussion below is a summary of the Senior Officer’s independent written evaluation with respect to the Fund’s investment advisory agreement as well as a discussion of the material factors and related conclusions that formed the basis for the Board’s approval of the Fund’s investment advisory agreement and sub-advisory contracts. This information is current as of June 13, 2017, and does not reflect consideration of factors that became known to the Board after that date.
Factors and Conclusions and Summary of Independent Written Fee Evaluation
| A. | Nature, Extent and Quality of Services Provided by Invesco Advisers and the Affiliated Sub-Advisers |
The Board reviewed the advisory services provided to the Fund by Invesco Advisers under the Fund’s investment advisory agreement, the performance of Invesco Advisers in providing these services, and the credentials and experience of the officers and employees of Invesco Advisers who provide these services, including the Fund’s portfolio manager or managers. The Board’s review included consideration of Invesco Advisers’ investment process oversight, credit analysis and investment risk management. The Board also considered non-advisory services that Invesco Advisers and its affiliates provide to the Invesco Funds such as various back office support
functions, trading operations, internal audit, valuation and legal and compliance.
In determining whether to continue the Fund’s investment advisory agreement, the Board considered the benefits of reapproving an existing relationship as contrasted with the greater uncertainty that may be associated with entering into a new relationship. The Board concluded that the nature, extent and quality of the services provided to the Fund by Invesco Advisers are appropriate and satisfactory.
The Board reviewed the services that may be provided by the Affiliated Sub-Advisers under the sub-advisory contracts and the credentials and experience of the officers and employees of the Affiliated Sub-Advisers who provide these services. The Board noted that the Affiliated Sub-Advisers have offices and personnel that are located in financial centers around the world. As a result, the Board noted that the Affiliated Sub-Advisers can provide research and investment analysis on the markets and economies of various countries in which the Fund may invest, make recommendations regarding securities and assist with security trades. The Board concluded that the sub-advisory contracts may benefit the Fund and its shareholders by permitting Invesco Advisers to use the resources and talents of the Affiliated Sub-Advisers in managing the Fund. The Board concluded that the nature, extent and quality of the services that may be provided by the Affiliated Sub-Advisers are appropriate and satisfactory.
| B. | Fund Investment Performance |
The Board considered Fund investment performance as a relevant factor in considering whether to approve the investment advisory agreement as well as the sub-advisory contracts for the Fund, as Invesco Senior Secured Management, Inc. currently manages assets of the Fund.
The Board noted that the Fund was new and compared the Fund’s performance during the past one and two calendar years to the performance of funds in the Broadridge performance universe and against the Lipper Inflation Protected Bond Funds Index. The Board noted that performance of Class A shares of the Fund was in the first quintile of its performance universe for the one and two year periods (the first quintile being the best performing funds and the fifth quintile being the worst performing funds). The Board noted that performance of Class A shares of the Fund was above the performance of the Index for the one and two year periods. The Trustees also reviewed more recent Fund performance and this review did not change their conclusions.
| C. | Advisory and Sub-Advisory Fees |
The Board compared the Fund’s contractual management fee rate to the contractual management fee rates of funds in the Fund’s Broadridge expense group at a common asset
32 Invesco Strategic Real Return Fund
level. The Board noted that the contractual management fee rate for Class A shares of the Fund was below the median contractual management fee rate of funds in its expense group. The Board noted that the term “contractual management fee” for funds in the expense group may include both advisory and certain administrative services fees, but that Broadridge does not provide information on a fund by fund basis as to what is included. The Board noted that Invesco does not separately charge the Invesco Funds for the administrative services included in the term as defined by Broadridge. The Board also reviewed the methodology used by Broadridge in providing expense group information, which includes using each fund’s contractual management fee schedule (including any applicable breakpoints) as reported in the most recent prospectus or statement of additional information for each fund in the expense group.
The Board noted that Invesco Advisers has contractually agreed to waive fees and/or limit expenses of the Fund through at least December 31, 2017 in an amount necessary to limit total annual operating expenses to a specified percentage of average daily net assets for each class of the Fund.
The Board noted that Invesco Advisers and the Affiliated Sub-Advisers do not manage other mutual funds or client accounts with investment strategies comparable to those of the Fund.
The Board also considered the services that may be provided by the Affiliated Sub-Advisers pursuant to the sub-advisory contracts, as well as the fees payable by Invesco Advisers to the Affiliated Sub-Advisers pursuant to the sub-advisory contracts. The Board noted that Invesco Advisers retains overall responsibility for, and provides services to, sub-advised Invesco Funds, including oversight of the Affiliated Sub-Advisers as well as the additional services described herein other than day-to-day portfolio management. The Board also noted that the sub-advisory fees are not paid directly by the Fund, but rather, are payable by Invesco Advisers to the Affiliated Sub-Advisers.
| D. | Economies of Scale and Breakpoints |
The Board considered the extent to which there are economies of scale in the provision of advisory services to the Fund. The Board also considered that the Fund may benefit from economies of scale through contractual breakpoints in the Fund’s advisory fee schedule. The Board noted that the Fund shares directly in economies of scale through lower fees charged by third party service providers based on the combined size of the Invesco Funds advised by Invesco Advisers.
| E. | Profitability and Financial Resources |
The Board reviewed information from Invesco Advisers concerning the costs of the advisory and other services that Invesco Advisers and its affiliates provide to the Fund and the Invesco Funds and the profitability of Invesco Advisers and its affiliates in providing these services. The Board noted that Invesco Advisers continues to operate at a net profit from services Invesco
Advisers and its affiliates provide to the Invesco Funds. The Board noted that although Invesco Advisers received a minimal amount of revenues from advising the Fund, Invesco Advisers and its subsidiaries did not make a profit from managing the Fund as a result of fee and expense waivers. The Board received and accepted information from Invesco Advisers demonstrating that Invesco Advisers and each Affiliated Sub-Adviser are financially sound and have the resources necessary to perform their obligations under the investment advisory agreement and sub-advisory contracts.
| F. | Collateral Benefits to Invesco Advisers and its Affiliates |
The Board considered various other benefits received by Invesco Advisers and its affiliates from the relationship with the Fund, including the fees received for providing transfer agency and distribution services to the Fund. The Board considered comparative information regarding fees charged for these services, including information provided by Broadridge and other independent sources. The Board considered the performance of Invesco Advisers and its affiliates in providing these services and the organizational structure employed to provide these services. The Board also considered that these services are provided to the Fund pursuant to written contracts that are reviewed and approved on an annual basis by the Board; and that the services are required for the operation of the Fund.
The Board considered the benefits realized by Invesco Advisers and the Affiliated Sub-Advisers as a result of portfolio brokerage transactions executed through “soft dollar” arrangements. Invesco Advisers noted that the Fund does not execute brokerage transactions through “soft dollar” arrangements to any significant degree.
The Board considered that the Fund’s uninvested cash and cash collateral from any securities lending arrangements may be invested in money market funds advised by Invesco Advisers pursuant to procedures approved by the Board. The Board noted that Invesco Advisers receives advisory fees from these affiliated money market funds attributable to such investments, although Invesco Advisers has contractually agreed to waive through varying periods the advisory fees payable by the Invesco Funds with respect to certain investments in the affiliated money market funds. The waiver is in an amount equal to 100% of the net advisory fee Invesco Advisers receives from the affiliated money market funds with respect to the Fund’s investment in the affiliated money market funds of uninvested cash, but not cash collateral. The Board concluded that the amount of advisory fees received by Invesco Advisers from the Fund’s investment of cash collateral from any securities lending arrangements in the affiliated money market funds is fair and reasonable.
33 Invesco Strategic Real Return Fund
Tax Information
Form 1099-DIV, Form 1042-S and other year-end tax information provide shareholders with actual calendar year amounts that should be included in their tax returns. Shareholders should consult their tax advisors.
The following distribution information is being provided as required by the Internal Revenue Code or to meet a specific state’s requirement.
The Fund designates the following amounts or, if subsequently determined to be different, the maximum amount allowable for its fiscal year ended August 31, 2017:
Federal and State Income Tax | ||||
Long-Term Capital Gain Distributions | $ | 0 | ||
Qualified Dividend Income* | 2.59 | % | ||
Corporate Dividends Received Deduction* | 2.02 | % | ||
U.S. Treasury Obligations* | 10.54 | % | ||
Tax-Exempt Interest Dividends* | 0 | % | ||
| * | The above percentages are based on ordinary income dividends paid to shareholders during the Fund’s fiscal year. |
34 Invesco Strategic Real Return Fund
Proxy Results
A Special Joint Meeting (“Meeting”) of Shareholders of Invesco Strategic Real Return Fund, an investment portfolio of AIM Counselor Series Trust (Invesco Counselor Series Trust), a Delaware statutory trust (“Trust”), was held on March 9, 2017. The Meeting was held for the following purposes:
| (1) | Elect 15 trustees to the Board, each of whom will serve until his or her successor is elected and qualified. |
| (2) | Approve an amendment to the Trust’s Agreement and Declaration of Trust that would permit fund mergers and other significant transactions upon the Board’s approval but without shareholder approval of such transactions. |
| (3) | Approve changing the fundamental investment restriction regarding the purchase or sale of physical commodities. |
| 4(b) | Approve an amendment to the current Master Intergroup Sub-Advisory Contract to add Invesco Asset Management (India) Private Limited. |
The results of the voting on the above matters were as follows:
| Matters | Votes For | Votes Withheld | ||||||||||||||||
| (1)* | David C. Arch | 1,425,647,604 | 36,521,875 | |||||||||||||||
| James T. Bunch | 1,425,181,099 | 36,988,380 | ||||||||||||||||
| Bruce L. Crockett | 1,425,174,694 | 36,994,785 | ||||||||||||||||
| Jack M. Fields | 1,426,060,874 | 36,108,605 | ||||||||||||||||
| Martin L. Flanagan | 1,426,481,477 | 35,688,002 | ||||||||||||||||
| Cynthia Hostetler | 1,426,489,972 | 35,679,505 | ||||||||||||||||
| Dr. Eli Jones | 1,426,255,832 | 35,913,647 | ||||||||||||||||
| Dr. Prema Mathai-Davis | 1,425,363,789 | 36,805,689 | ||||||||||||||||
| Teresa M. Ressel | 1,426,514,880 | 35,654,598 | ||||||||||||||||
| Dr. Larry Soll | 1,424,932,245 | 37,237,234 | ||||||||||||||||
| Ann Barnett Stern | 1,426,260,049 | 35,909,429 | ||||||||||||||||
| Raymond Stickel, Jr. | 1,425,391,657 | 36,777,822 | ||||||||||||||||
| Philip A. Taylor | 1,426,285,212 | 35,884,267 | ||||||||||||||||
| Robert C. Troccoli | 1,426,075,097 | 36,094,382 | ||||||||||||||||
| Christopher L. Wilson | 1,426,594,956 | 35,574,523 | ||||||||||||||||
| Votes For | Votes Against | Votes Abstain | Broker Non-Votes | |||||||||||||||
| (2)* | Approve an amendment to the Trust’s Agreement and Declaration of Trust that would permit fund mergers and other significant transactions upon the Board’s approval but without shareholder approval of such transactions | 751,302,707 | 79,810,344 | 41,561,890 | 589,495,482 | |||||||||||||
| (3) | Approve changing the fundamental investment restriction regarding the purchase or sale of physical commodities | 1,172,907 | 275,146 | 151,505 | 97,388 | |||||||||||||
| 4(b) | Approve an amendment to the current Master Intergroup Sub-Advisory Contract to add Invesco Asset Management (India) Private Limited | 1,199,262 | 248,793 | 151,504 | 97,387 | |||||||||||||
| * | Each of proposal 1 and 2 required approval by a combined vote of all of the portfolios of AIM Counselor Series Trust (Invesco Counselor Series Trust). |
35 Invesco Strategic Real Return Fund
Trustees and Officers
The address of each trustee and officer is AIM Counselor Series Trust (Invesco Counselor Series Trust) (the “Trust”), 11 Greenway Plaza, Suite 1000, Houston, Texas 77046-1173. The trustees serve for the life of the Trust, subject to their earlier death, incapacitation, resignation, retirement or removal as more specifically provided in the Trust’s organizational documents. Each officer serves for a one year term or until their successors are elected and qualified. Column two below includes length of time served with predecessor entities, if any.
| Name, Year of Birth and Position(s) Held with the Trust | Trustee and/ or Officer Since | Principal Occupation(s) During Past 5 Years | Number of Overseen by | Other Directorship(s) Held by Trustee During Past 5 Years | ||||
| Interested Persons | ||||||||
| Martin L. Flanagan1 — 1960 Trustee | 2007 | Executive Director, Chief Executive Officer and President, Invesco Ltd. (ultimate parent of Invesco and a global investment management firm); Trustee, The Invesco Funds; Vice Chair, Investment Company Institute; and Member of Executive Board, SMU Cox School of Business
Formerly: Advisor to the Board, Invesco Advisers, Inc. (formerly known as Invesco Institutional (N.A.), Inc.); Chairman and Chief Executive Officer, Invesco Advisers, Inc. (registered investment adviser); Director, Chairman, Chief Executive Officer and President, Invesco Holding Company (US), Inc. (formerly IVZ Inc.) (holding company), Invesco Group Services, Inc. (service provider) and Invesco North American Holdings, Inc. (holding company); Director, Chief Executive Officer and President, Invesco Holding Company Limited (parent of Invesco and a global investment management firm); Director, Invesco Ltd.; Chairman, Investment Company Institute and President, Co-Chief Executive Officer, Co-President, Chief Operating Officer and Chief Financial Officer, Franklin Resources, Inc. (global investment management organization) | 144 | None | ||||
Philip A. Taylor2 — 1954 Trustee and Senior Vice President | 2006 | Head of the Americas and Senior Managing Director, Invesco Ltd.; Director, Invesco Advisers, Inc. (formerly known as Invesco Institutional (N.A.), Inc.) (registered investment adviser); Director, Chairman, Chief Executive Officer and President, Invesco Management Group, Inc. (formerly known as Invesco Aim Management Group, Inc.) (financial services holding company); Director and Chairman, Invesco Investment Services, Inc. (formerly known as Invesco Aim Investment Services, Inc.) (registered transfer agent); Chief Executive Officer, Invesco Corporate Class Inc. (corporate mutual fund company); Director, Chairman and Chief Executive Officer, Invesco Canada Ltd. (formerly known as Invesco Trimark Ltd./Invesco Trimark Ltèe) (registered investment adviser and registered transfer agent); Trustee and Senior Vice President, The Invesco Funds; Director, Invesco Investment Advisers LLC (formerly known as Van Kampen Asset Management).
Formerly: Co-Chairman, Co-President and Co-Chief Executive Officer, Invesco Advisers, Inc. (formerly known as Invesco Institutional (N.A.), Inc.) (registered investment adviser); Director, Chief Executive Officer and President, Van Kampen Exchange Corp; President and Principal Executive Officer, The Invesco Funds (other than AIM Treasurer’s Series Trust (Invesco Treasurer’s Series Trust), Short-Term Investments Trust and Invesco Management Trust); Executive Vice President, The Invesco Funds (AIM Treasurer’s Series Trust (Invesco Treasurer’s Series Trust), Short-Term Investments Trust and Invesco Management Trust only); Director and President, INVESCO Funds Group, Inc. (registered investment adviser and registered transfer agent); Director and Chairman, IVZ Distributors, Inc. (formerly known as INVESCO Distributors, Inc.) (registered broker dealer); Director, President and Chairman, Invesco Inc. (holding company), Invesco Canada Holdings Inc. (holding company), Trimark Investments Ltd./Placements Trimark Ltèe and Invesco Financial Services Ltd/Services Financiers Invesco Ltèe; Chief Executive Officer, Invesco Canada Fund Inc. (corporate mutual fund company); Director and Chairman, Van Kampen Investor Services Inc.; Director, Chief Executive Officer and President, 1371 Preferred Inc. (holding company) and Van Kampen Investments Inc.; Director and President, AIM GP Canada Inc. (general partner for limited partnerships) and Van Kampen Advisors, Inc.; Director and Chief Executive Officer, Invesco Trimark Dealer Inc. (registered broker dealer); Director, Invesco Distributors, Inc. (formerly known as Invesco Aim Distributors, Inc.) (registered broker dealer); Manager, Invesco PowerShares Capital Management LLC; Director, Chief Executive Officer and President, Invesco Advisers, Inc.; Director, Chairman, Chief Executive Officer and President, Invesco Aim Capital Management, Inc.; President, Invesco Trimark Dealer Inc. and Invesco Trimark Ltd./Invesco Trimark Ltèe; Director and President, AIM Trimark Corporate Class Inc. and AIM Trimark Canada Fund Inc.; Senior Managing Director, Invesco Holding Company Limited; Director and Chairman, Fund Management Company (former registered broker dealer); President and Principal Executive Officer, The Invesco Funds (AIM Treasurer’s Series Trust (Invesco Treasurer’s Series Trust), and Short-Term Investments Trust only); President, AIM Trimark Global Fund Inc. and AIM Trimark Canada Fund Inc. | 144 | None |
| 1 | Mr. Flanagan is considered an interested person (within the meaning of Section 2(a)(19) of the 1940 Act) of the Trust because he is an officer of the Adviser to the Trust, and an officer and a director of Invesco Ltd., ultimate parent of the Adviser. |
| 2 | Mr. Taylor is considered an interested person (within the meaning of Section 2(a)(19) of the 1940 Act) of the Trust because he is an officer and a director of the Adviser. |
T-1 Invesco Strategic Real Return Fund
Trustees and Officers—(continued)
| Name, Year of Birth and Position(s) Held with the Trust | Trustee and/ or Officer Since | Principal Occupation(s) During Past 5 Years | Number of Complex Overseen by Trustee | Other Directorship(s) Held by Trustee During | ||||
| Independent Trustees | ||||||||
Bruce L. Crockett — 1944 Trustee and Chair | 2003 | Chairman, Crockett Technologies Associates (technology consulting company)
Formerly: Director, Captaris (unified messaging provider); Director, President and Chief Executive Officer, COMSAT Corporation; Chairman, Board of Governors of INTELSAT (international communications company); ACE Limited (insurance company); Independent Directors Council and Investment Company Institute: Member of the Audit Committee, Investment Company Institute; Member of the Executive Committee and Chair of the Governance Committee, Independent Directors Council | 144 | Director and Chairman of the Audit Committee, ALPS (Attorneys Liability Protection Society) (insurance company); Director and Member of the Audit Committee, Ferroglobe PLC (metallurgical company) | ||||
David C. Arch — 1945 Trustee | 2010 | Chairman of Blistex Inc. (consumer health care products manufacturer); Member, World Presidents’ Organization | 144 | Board member of the Illinois Manufacturers’ Association | ||||
James T. Bunch — 1942 Trustee | 2000 | Managing Member, Grumman Hill Group LLC (family office/private equity investments)
Formerly: Chairman of the Board, Denver Film Society; Chairman of the Board of Trustees, Evans Scholarship Foundation; Chairman, Board of Governors, Western Golf Association | 144 | Trustee, Evans Scholarship Foundation | ||||
Jack M. Fields — 1952 Trustee | 2003 | Chief Executive Officer, Twenty First Century Group, Inc. (government affairs company); and Discovery Learning Alliance (non-profit)
Formerly: Owner and Chief Executive Officer, Dos Angeles Ranch L.P. (cattle, hunting, corporate entertainment); Director, Insperity, Inc. (formerly known as Administaff); Chief Executive Officer, Texana Timber LP (sustainable forestry company); Director of Cross Timbers Quail Research Ranch (non-profit); and member of the U.S. House of Representatives | 144 | None | ||||
Cynthia Hostetler — 1962 Trustee | 2017 | Non-Executive Director and Trustee of a number of public and private business corporations
Formerly: Head of Investment Funds and Private Equity, Overseas Private Investment Corporation; President, First Manhattan Bancorporation, Inc.; Attorney, Simpson Thacher & Bartlett LLP | 144 | Vulcan Materials Company (construction materials company); Trilinc Global Impact Fund; Aberdeen Investment Funds (4 portfolios); Artio Global Investment LLC (mutual fund complex); Edgen Group, Inc. (specialized energy and infrastructure products distributor) | ||||
Eli Jones — 1961 Trustee | 2016 | Professor and Dean, Mays Business School — Texas A&M University
Formerly: Professor and Dean, Walton College of Business, University of Arkansas and E.J. Ourso College of Business, Louisiana State University; Director, Arvest Bank | 144 | Insperity, Inc. (formerly known as Administaff) (human resources provider) | ||||
Prema Mathai-Davis — 1950 Trustee | 2003 | Retired.
Formerly: Chief Executive Officer, YWCA of the U.S.A. | 144 | None | ||||
Teresa M. Ressel — 1962 Trustee | 2017 | Non-executive director and trustee of a number of public and private business corporations
Formerly: Chief Financial Officer, Olayan America, The Olayan Group (international investor/commercial/industrial); Chief Executive Officer, UBS Securities LLC; Group Chief Operating Officer, Americas, UBS AG; Assistant Secretary for Management & Budget and CFO, US Department of the Treasury; Chief Compliance Officer, Kaiser Permanente; Program Manager, Hewlett-Packard; Nuclear Engineering, General Dynamics Corporation | 144 | Atlantic Power Corporation (power generation company); ON Semiconductor Corp. (semiconductor supplier) | ||||
Larry Soll — 1942 Trustee | 1997 | Retired.
Formerly: Chairman, Chief Executive Officer and President, Synergen Corp. (a biotechnology company) | 144 | None | ||||
Ann Barnett Stern — 1957 Trustee | 2017 | President and Chief Executive Officer, Houston Endowment Inc. (private philanthropic institution)
Formerly: Executive Vice President and General Counsel, Texas Children’s Hospital; Attorney, Beck, Redden and Secrest, LLP; Business Law Instructor, University of St. Thomas; Attorney, Andrews & Kurth LLP | 144 | Federal Reserve Bank of Dallas | ||||
Raymond Stickel, Jr. — 1944 Trustee | 2005 | Retired.
Formerly: Director, Mainstay VP Series Funds, Inc. (25 portfolios); Partner, Deloitte & Touche | 144 | None | ||||
Robert C. Troccoli — 1949 Trustee | 2016 | Adjunct Professor, University of Denver — Daniels College of Business
Formerly: Senior Partner, KPMG LLP | 144 | None | ||||
Christopher L. Wilson — 1957 Trustee | 2017 | Managing Partner, CT2, LLC (investing and consulting firm)
Formerly: President/Chief Executive Officer, Columbia Funds, Bank of America Corporation; President/Chief Executive Officer, CDC IXIS Asset Management Services, Inc.; Principal & Director of Operations, Scudder Funds, Scudder, Stevens & Clark, Inc.; Assistant Vice President, Fidelity Investments | 144 | TD Asset Management USA Inc. (mutual fund complex) (22 portfolios); ISO New England, Inc. (non-profit organization managing regional electricity market) |
T-2 Invesco Strategic Real Return Fund
Trustees and Officers—(continued)
| Name, Year of Birth and Position(s) Held with the Trust | Trustee and/ or Officer Since | Principal Occupation(s) During Past 5 Years | Number of Complex Overseen by Trustee | Other Directorship(s) Held by Trustee During | ||||
| Other Officers | ||||||||
Sheri Morris — 1964 President, Principal Executive Officer and Treasurer | 2003 | President, Principal Executive Officer and Treasurer, The Invesco Funds; Vice President, Invesco Advisers, Inc. (formerly known as Invesco Institutional (N.A.), Inc.) (registered investment adviser); and Vice President, PowerShares Exchange-Traded Fund Trust, PowerShares Exchange-Traded Fund Trust II, PowerShares India Exchange-Traded Fund Trust, PowerShares Actively Managed Exchange-Traded Fund Trust and PowerShares Actively Managed Exchange-Traded Commodity Fund Trust
Formerly: Vice President and Principal Financial Officer, The Invesco Funds; Vice President, Invesco Aim Advisers, Inc., Invesco Aim Capital Management, Inc. and Invesco Aim Private Asset Management, Inc.; Assistant Vice President and Assistant Treasurer, The Invesco Funds and Assistant Vice President, Invesco Advisers, Inc., Invesco Aim Capital Management, Inc. and Invesco Aim Private Asset Management, Inc.; and Treasurer, PowerShares Exchange-Traded Fund Trust, PowerShares Exchange-Traded Fund Trust II, PowerShares India Exchange-Traded Fund Trust and PowerShares Actively Managed Exchange-Traded Fund Trust | N/A | N/A | ||||
Russell C. Burk — 1958 Senior Vice President and Senior Officer | 2005 | Senior Vice President and Senior Officer, The Invesco Funds | N/A | N/A | ||||
John M. Zerr — 1962 Senior Vice President, Chief Legal Officer and Secretary | 2006 | Director, Senior Vice President, Secretary and General Counsel, Invesco Management Group, Inc. (formerly known as Invesco AIM Management Group, Inc.); Senior Vice President, Invesco Advisers, Inc. (formerly known as Invesco Institutional (N.A.), Inc.) (registered investment adviser); Senior Vice President and Secretary, Invesco Distributors, Inc. (formerly known as Invesco AIM Distributors, Inc.); Director, Vice President and Secretary, Invesco Investment Services, Inc. (formerly known as Invesco AIM Investment Services, Inc.) Senior Vice President, Chief Legal Officer and Secretary, The Invesco Funds; Managing Director, Invesco PowerShares Capital Management LLC; Director, Secretary and General Counsel, Invesco Investment Advisers LLC (formerly known as Van Kampen Asset Management); Secretary and General Counsel, Invesco Capital Markets, Inc. (formerly known as Van Kampen Funds Inc.) and Chief Legal Officer, PowerShares Exchange-Traded Fund Trust, PowerShares Exchange-Traded Fund Trust II, PowerShares India Exchange-Traded Fund Trust, PowerShares Actively Managed Exchange-Traded Fund Trust and PowerShares Actively Managed Exchange-Traded Commodity Fund Trust; Manager and Secretary, Invesco Indexing LLC
Formerly: Director, Secretary, General Counsel and Senior Vice President, Van Kampen Exchange Corp.; Director, Vice President and Secretary, IVZ Distributors, Inc. (formerly known as INVESCO Distributors, Inc.); Director and Vice President, INVESCO Funds Group, Inc.; Director and Vice President, Van Kampen Advisors Inc.; Director, Vice President, Secretary and General Counsel, Van Kampen Investor Services Inc.; Director, Invesco Distributors, Inc. (formerly known as Invesco AIM Distributors, Inc.); Director, Senior Vice President, General Counsel and Secretary, Invesco AIM Advisers, Inc. and Van Kampen Investments Inc.; Director, Vice President and Secretary, Fund Management Company; Director, Senior Vice President, Secretary, General Counsel and Vice President, Invesco AIM Capital Management, Inc.; Chief Operating Officer and General Counsel, Liberty Ridge Capital, Inc. (an investment adviser); Vice President and Secretary, PBHG Funds (an investment company) and PBHG Insurance Series Fund (an investment company); Chief Operating Officer, General Counsel and Secretary, Old Mutual Investment Partners (a broker-dealer); General Counsel and Secretary, Old Mutual Fund Services (an administrator) and Old Mutual Shareholder Services (a shareholder servicing center); Executive Vice President, General Counsel and Secretary, Old Mutual Capital, Inc. (an investment adviser); and Vice President and Secretary, Old Mutual Advisors Funds (an investment company) | N/A | N/A | ||||
Gregory G. McGreevey — 1962 Senior Vice President | 2012 | Senior Managing Director, Invesco Ltd.; Director, Chairman, President, and Chief Executive Officer, Invesco Advisers, Inc. (formerly known as Invesco Institutional (N.A.), Inc.) (registered investment adviser); Director, Invesco Mortgage Capital, Inc. and Invesco Senior Secured Management, Inc.; and Senior Vice President, The Invesco Funds
Formerly: Assistant Vice President, The Invesco Funds | N/A | N/A | ||||
Kelli Gallegos — 1970 Vice President, Principal Financial Officer and Assistant Treasurer | 2008 | Vice President, Principal Financial Officer and Assistant Treasurer, The Invesco Funds; Assistant Treasurer, Invesco PowerShares Capital Management LLC, PowerShares Exchange-Traded Fund Trust, PowerShares Exchange-Traded Fund Trust II, PowerShares India Exchange-Traded Fund Trust, PowerShares Actively Managed Exchange-Traded Fund Trust and PowerShares Actively Managed Exchange-Traded Commodity Fund Trust
Formerly: Assistant Vice President, The Invesco Funds | N/A | N/A |
T-3 Invesco Strategic Real Return Fund
Trustees and Officers—(continued)
| Name, Year of Birth and Position(s) Held with the Trust | Trustee and/ or Officer Since | Principal Occupation(s) During Past 5 Years | Number of Complex Overseen by Trustee | Other Directorship(s) Held by Trustee During | ||||
| Other Officers—(continued) | ||||||||
Tracy Sullivan — 1962 Vice President, Chief Tax Officer and Assistant Treasurer | 2008 | Vice President, Chief Tax Officer and Assistant Treasurer, The Invesco Funds; Assistant Treasurer, Invesco PowerShares Capital Management LLC, PowerShares Exchange-Traded Fund Trust, PowerShares Exchange-Traded Fund Trust II, PowerShares India Exchange-Traded Fund Trust, PowerShares Actively Managed Exchange-Traded Fund Trust and PowerShares Actively Managed Exchange-Traded Commodity Fund Trust
Formerly: Assistant Vice President, The Invesco Funds | N/A | N/A | ||||
Crissie M. Wisdom — 1969 Anti-Money Laundering Compliance Officer | 2013 | Anti-Money Laundering Compliance Officer, Invesco Advisers, Inc. (formerly known as Invesco Institutional (N.A.), Inc.) (registered investment adviser), Invesco Capital Markets, Inc. (formerly known as Van Kampen Funds Inc.), Invesco Distributors, Inc., Invesco Investment Services, Inc., Invesco Management Group, Inc., The Invesco Funds, and PowerShares Exchange-Traded Fund Trust, PowerShares Exchange-Traded Fund Trust II, PowerShares India Exchange-Traded Fund Trust, PowerShares Actively Managed Exchange-Traded Fund Trust and PowerShares Actively Managed Exchange-Traded Commodity Fund Trust; Anti-Money Laundering Compliance Officer and Bank Secrecy Act Officer, INVESCO National Trust Company and Invesco Trust Company; and Fraud Prevention Manager and Controls and Risk Analysis Manager for Invesco Investment Services, Inc.
Formerly: Anti-Money Laundering Compliance Officer, Van Kampen Exchange Corp. | N/A | N/A | ||||
Robert R. Leveille — 1969 Chief Compliance Officer | 2016 | Chief Compliance Officer, Invesco Advisers, Inc. (registered investment adviser); and Chief Compliance Officer, The Invesco Funds
Formerly: Chief Compliance Officer, Putnam Investments and the Putnam Funds | N/A | N/A |
The Statement of Additional Information of the Trust includes additional information about the Fund’s Trustees and is available upon request, without charge, by calling 1.800.959.4246. Please refer to the Fund’s Statement of Additional Information for information on the Fund’s sub-advisers.
Office of the Fund 11 Greenway Plaza, Suite 1000 Houston, TX 77046-1173 | Investment Adviser Invesco Advisers, Inc. 1555 Peachtree Street, N.E. Atlanta, GA 30309 | Distributor Invesco Distributors, Inc. 11 Greenway Plaza, Suite 1000 Houston, TX 77046-1173 | Auditors PricewaterhouseCoopers LLP 1000 Louisiana Street, Suite 5800 Houston, TX 77002-5678 | |||
Counsel to the Fund Stradley Ronon Stevens & Young, LLP 2005 Market Street, Suite 2600 Philadelphia, PA 19103-7018 | Counsel to the Independent Trustees Goodwin Procter LLP 901 New York Avenue, N.W. Washington, D.C. 20001 | Transfer Agent Invesco Investment Services, Inc. 11 Greenway Plaza, Suite 1000 Houston, TX 77046-1173 | Custodian State Street Bank and Trust Company 225 Franklin Street Boston, MA 02110-2801 | |||
T-4 Invesco Strategic Real Return Fund
Explore High-Conviction Investing with Invesco

Go paperless with eDelivery
Visit invesco.com/edelivery to enjoy the convenience and security of anytime electronic access to your investment documents.
With eDelivery, you can elect to have any or all of the following materials delivered straight to your inbox to download, save and print from your own computer:
∎ Fund reports and prospectuses
∎ Quarterly statements
∎ Daily confirmations
∎ Tax forms
Invesco mailing information
Send general correspondence to Invesco Investment Services, Inc., P.O. Box 219078, Kansas City, MO 64121-9078.
Important notice regarding delivery of security holder documents
To reduce Fund expenses, only one copy of most shareholder documents may be mailed to shareholders with multiple accounts at the same address (Householding). Mailing of your shareholder documents may be householded indefinitely unless you instruct us otherwise. If you do not want the mailing of these documents to be combined with those for other members of your household, please contact Invesco Investment Services, Inc. at 800 959 4246 or contact your financial institution. We will begin sending you individual copies for each account within 30 days after receiving your request.
Fund holdings and proxy voting information
The Fund provides a complete list of its holdings four times in each fiscal year, at the quarter ends. For the second and fourth quarters, the lists appear in the Fund’s semiannual and annual reports to shareholders. For the first and third quarters, the Fund files the lists with the Securities and Exchange Commission (SEC) on Form N-Q. The most recent list of portfolio holdings is available at invesco.com/completeqtrholdings. Shareholders can also look up the Fund’s Forms N-Q on the SEC website at sec.gov. Copies of the Fund’s Forms N-Q may be reviewed and copied at the SEC Public Reference Room in Washington, D.C. You can obtain information on the operation of the Public Reference Room, including information about duplicating fee charges, by calling 202 551 8090 or 800 732 0330, or by electronic request at the following email address: publicinfo@sec.gov. The SEC file numbers for the Fund are shown below.
A description of the policies and procedures that the Fund uses to determine how to vote proxies relating to portfolio securities is available without charge, upon request, from our Client Services department at 800 959 4246 or at invesco.com/proxyguidelines. The information is also available on the SEC website, sec.gov.
Information regarding how the Fund voted proxies related to its portfolio securities during the most recent 12-month period ended June 30 is available at invesco.com/proxysearch. The information is also available on the SEC website, sec.gov. Invesco Advisers, Inc. is an investment adviser; it provides investment advisory services to individual and institutional clients and does not sell securities. Invesco Distributors, Inc. is the US distributor for Invesco Ltd.’s retail mutual funds, exchange-traded funds and institutional money market funds. Both are wholly owned, indirect subsidiaries of Invesco Ltd. |  |
SEC file numbers: 811-09913 and 333-36074 | Invesco Distributors, Inc. | SRR-AR-1 | 10272017 | 1111 |
| ITEM 2. | CODE OF ETHICS. |
There were no amendments to the Code of Ethics (the “Code”) that applies to the Registrant’s Principal Executive Officer (“PEO”) and Principal Financial Officer (“PFO”) during the period covered by the report. The Registrant did not grant any waivers, including implicit waivers, from any provisions of the Code to the PEO or PFO during the period covered by this report.
| ITEM 3. | AUDIT COMMITTEE FINANCIAL EXPERT. |
The Board of Trustees has determined that the Registrant has at least one audit committee financial expert serving on its Audit Committee. The Audit Committee financial expert is Raymond Stickel, Jr. Mr. Stickel is “independent” within the meaning of that term as used in Form N-CSR.
| ITEM 4. | PRINCIPAL ACCOUNTANT FEES AND SERVICES. |
PricewaterhouseCoopers LLP informed the Trust that it has identified an issue related to its independence under Rule 2-01(c)(1)(ii)(A) of Regulation S-X (referred to as the Loan Rule). The Loan Rule prohibits accounting firms, such as PricewaterhouseCoopers LLP, from being deemed independent if they have certain financial relationships with their audit clients or certain affiliates of those clients. The Trust is required under various securities laws to have its financial statements audited by an independent accounting firm.
The Loan Rule specifically provides that an accounting firm would not be independent if it or certain affiliates and covered persons receives a loan from a lender that is a record or beneficial owner of more than ten percent of an audit client’s equity securities (referred to as a “more than ten percent owner”). For purposes of the Loan Rule, audit clients include the Funds as well as all registered investment companies advised by the Adviser and its affiliates, including other subsidiaries of the Adviser’s parent company, Invesco Ltd. (collectively, the Invesco Fund Complex). PricewaterhouseCoopers LLP informed the Trust it and certain affiliates and covered persons have relationships with lenders who hold, as record owner, more than ten percent of the shares of certain funds within the Invesco Fund Complex, which may implicate the Loan Rule.
On June 20, 2016, the SEC Staff issued a “no-action” letter to another mutual fund complex (see Fidelity Management & Research Company et al., No-Action Letter) related to the audit independence issue described above. In that letter, the SEC confirmed that it would not recommend enforcement action against a fund that relied on audit services performed by an audit firm that was not in compliance with the Loan Rule in certain specified circumstances. In connection with prior independence determinations, PricewaterhouseCoopers LLP communicated, as contemplated by the no-action letter, that it believes that it remains objective and impartial and that a reasonable investor possessing all the facts would conclude that PricewaterhouseCoopers LLP is able to exhibit the requisite objectivity and impartiality to report on the Funds’ financial statements as the independent registered public accounting firm. PricewaterhouseCoopers LLP also represented that it has complied with PCAOB Rule 3526(b)(1) and (2), which are conditions to the Funds relying on the no action letter, and affirmed that it is an independent accountant within the meaning of PCAOB Rule 3520. Therefore, the Adviser, the Funds and PricewaterhouseCoopers LLP concluded that PricewaterhouseCoopers LLP could continue as the Funds’ independent registered public accounting firm. The Invesco Fund Complex relied upon the no-action letter in reaching this conclusion.
If in the future the independence of PricewaterhouseCoopers LLP is called into question under the Loan Rule by circumstances that are not addressed in the SEC’s no-action letter, the Funds will need to take other action in order for the Funds’ filings with the SEC containing financial statements to be deemed compliant with applicable securities laws. Such additional actions could result in additional costs, impair the ability of the Funds to issue new shares or have other material adverse effects on the Funds. In addition, the SEC has indicated that the no-action relief will expire 18 months from its issuance after which the Invesco Funds will no longer be able to rely on the letter unless its term is extended or made permanent by the SEC Staff.
(a) to (d)
Fees Billed by PWC Related to the Registrant
PWC billed the Registrant aggregate fees for services rendered to the Registrant for the last two fiscal years as follows:
| Fees Billed for Services Rendered to the Registrant for fiscal year end 2017 | Fees Billed for Services Rendered to the Registrant for fiscal year end 2016 | |||||||||||
Audit Fees | $ 481,050 | $ 481,050 | ||||||||||
Audit-Related Fees(1) | $ 7,500 | $ 0 | ||||||||||
Tax Fees(2) | $ 106,225 | $ 140,825 | ||||||||||
All Other Fees | $ 0 | $ 0 | ||||||||||
|
|
|
| |||||||||
Total Fees | $ 594,775 | $ 621,875 | ||||||||||
(g) PWC billed the Registrant aggregate non-audit fees of $113,725 for the fiscal year ended 2017, and $140,825 for the fiscal year ended 2016, for non-audit services rendered to the Registrant.
| (1) | Audit-Related fees for the fiscal year end 2017 include fees billed for reviewing regulatory filings. |
| (2) | Tax fees for the fiscal year end August 31, 2017 includes fees billed for reviewing tax returns and/or services related to tax compliance. Tax fees for fiscal year end August 31, 2016 includes fees billed for reviewing tax returns and/or services related to tax compliance. |
Fees Billed by PWC Related to Invesco and Invesco Affiliates
PWC billed Invesco Advisers, Inc. (“Invesco”), the Registrant’s adviser, and any entity controlling, controlled by or under common control with Invesco that provides ongoing services to the Registrant (“Invesco Affiliates”) aggregate fees for pre-approved non-audit services rendered to Invesco and Invesco Affiliates for the last two fiscal years as follows:
Fees Billed for Non- to be Pre-Approved by the Registrant’s Audit Committee | Fees Billed for Non- to be Pre-Approved by the Registrant’s Audit Committee | |||||||||||
Audit-Related Fees | $ 635,000 | $ 635,000 | ||||||||||
Tax Fees | $ 0 | $ 0 | ||||||||||
All Other Fees | $ 1,857,000 | $ 2,731,000 | ||||||||||
|
|
|
| |||||||||
Total Fees(1) | $ 2,492,000 | $ 3,366,000 | ||||||||||
| (1) | Audit-Related fees for the year end 2017 include fees billed related to reviewing controls at a service organization. Audit-Related fees for the year end 2016 include fees billed related to reviewing controls at a service organization. |
All other fees for the year end 2017 include fees billed related to the identification of structural and organizational alternatives, informed by industry practices, for certain of the company’s administrative activities and functions. All other fees for the year end 2016 include fees billed related to the identification of structural and organizational alternatives, informed by industry practices, for certain of the company’s administrative activities and functions.
(e)(2) There were no amounts that were pre-approved by the Audit Committee pursuant to the de minimis exception under Rule 2-01 of Regulation S-X.
(g) Including the fees for services not required to be pre-approved by the registrant’s audit committee, PWC billed Invesco and Invesco Affiliates aggregate non-audit fees of $5,760,000 for the fiscal year ended August 31, 2017, and $5,633,000 for the fiscal year ended August 31, 2016, for non-audit services rendered to Invesco and Invesco Affiliates.
PWC provided audit services to the Investment Company complex of approximately $22 million.
(h) The Audit Committee also has considered whether the provision of non-audit services that were rendered to Invesco and Invesco Affiliates that were not required to be pre-approved pursuant to SEC regulations, if any, is compatible with maintaining PWC’s independence.
(f) Not applicable.
(e)(1)
PRE-APPROVAL OF AUDIT AND NON-AUDIT SERVICES
POLICIES AND PROCEDURES
As adopted by the Audit Committees
of the Invesco Funds (the “Funds”)
Last Amended March 29, 2017
I. Statement of Principles
The Audit Committees (the “Audit Committee”) of the Boards of Trustees of the Funds (the “Board”) have adopted these policies and procedures (the “Procedures”) with respect to the pre-approval of audit and non-audit services to be provided by the Funds’ independent auditor (the “Auditor”) to the Funds, and to the Funds’ investment adviser(s) and any entity controlling, controlled by, or under common control with the investment adviser(s) that provides ongoing services to the Funds (collectively, “Service Affiliates”).
Under Section 202 of the Sarbanes-Oxley Act of 2002, all audit and non-audit services provided to the Funds by the Auditor must be preapproved by the Audit Committee. Rule 2-01 of Regulation S-X requires that the Audit Committee also pre-approve a Service Affiliate’s engagement of the Auditor for non-audit services if the engagement relates directly to the operations and financial reporting of the Funds (a “Service Affiliate’s Covered Engagement”).
These Procedures set forth the procedures and the conditions pursuant to which the Audit Committee may pre-approve audit and non-audit services for the Funds and a Service Affiliate’s Covered Engagement pursuant to rules and regulations of the Securities and Exchange Commission (“SEC”) and other organizations and regulatory bodies applicable to the Funds (“Applicable Rules”).1 They address both general pre-approvals without consideration of specific case-by-case services (“general pre-approvals”) and pre-approvals on a case-by-case basis (“specific pre-approvals”). Any services requiring pre-approval that are not within the scope of general pre-approvals hereunder are subject to specific pre-approval. These Procedures also address the delegation by the Audit Committee of pre-approval authority to the Audit Committee Chair or Vice Chair.
II. Pre-Approval of Fund Audit Services
The annual Fund audit services engagement, including terms and fees, is subject to specific pre-approval by the Audit Committee. Audit services include the annual financial statement audit and other procedures required to be performed by an independent auditor to be able to form an opinion on the Funds’ financial statements. The Audit Committee will receive, review and consider sufficient information concerning a proposed Fund audit engagement to make a reasonable evaluation of the Auditor’s qualifications and independence. The Audit Committee will oversee the Fund audit services engagement as necessary, including approving any changes in terms, audit scope, conditions and fees.
In addition to approving the Fund audit services engagement at least annually and specifically approving any changes, the Audit Committee may generally or specifically pre-approve engagements for other audit services, which are those services that only an independent auditor reasonably can provide. Other audit services may include services associated with SEC registration statements, periodic reports and other documents filed with the SEC.
1 Applicable Rules include, for example, New York Stock Exchange (“NYSE”) rules applicable to closed-end funds managed by Invesco and listed on NYSE.
III. General and Specific Pre-Approval of Non-Audit Fund Services
The Audit Committee will consider, at least annually, the list of General Pre-Approved Non-Audit Services which list may be terminated or modified at any time by the Audit Committee. To inform the Audit Committee’s review and approval of General Pre-Approved Non-Audit Services, the Funds’ Treasurer (or his or her designee) and Auditor shall provide such information regarding independence or other matters as the Audit Committee may request.
Any services or fee ranges that are not within the scope of General Pre-Approved Non-Audit Services have not received general pre-approval and require specific pre-approval. Each request for specific pre-approval by the Audit Committee for services to be provided by the Auditor to the Funds must be submitted to the Audit Committee by the Funds’ Treasurer (or his or her designee) and must include detailed information about the services to be provided, the fees or fee ranges to be charged, and other relevant information sufficient to allow the Audit Committee to consider whether to pre-approve such engagement, including evaluating whether the provision of such services will impair the independence of the Auditor and is otherwise consistent with Applicable Rules.
IV. Non-Audit Service Types
The Audit Committee may provide either general or specific pre-approval of audit-related, tax or other services, each as described in more detail below.
| a. | Audit-Related Services |
“Audit-related services” are assurance and related services that are reasonably related to the performance of the audit or review of the Fund’s financial statements or that are traditionally performed by an independent auditor. Audit-related services include, among others, accounting consultations related to accounting, financial reporting or disclosure matters not classified as “Audit services”; assistance with understanding and implementing new accounting and financial reporting guidance from rulemaking authorities; services related to mergers, acquisitions or dispositions; compliance with ratings agency requirements and interfund lending activities; and assistance with internal control reporting requirements.
| b. | Tax Services |
“Tax services” include, but are not limited to, the review and signing of the Funds’ federal tax returns, the review of required distributions by the Funds and consultations regarding tax matters such as the tax treatment of new investments or the impact of new regulations. The Audit Committee will not approve proposed services of the Auditor which the Audit Committee believes are to be provided in connection with a service or transaction initially recommended by the Auditor, the sole business purpose of which may be tax avoidance and the tax treatment of which may not be supported in the Internal Revenue Code and related regulations. The Audit Committee will consult with the Funds’ Treasurer (or his or her designee) and may consult with outside counsel or advisers as necessary to ensure the consistency of tax services rendered by the Auditor with the foregoing policy. The Auditor shall not represent any Fund or any Service Affiliate before a tax court, district court or federal court of claims.
Each request to provide tax services under either the general or specific pre-approval of the Audit Committee will include a description from the Auditor in writing of (i) the scope of the service, the fee structure for the engagement, and any side letter or other amendment to the engagement letter, or any other agreement (whether oral, written, or otherwise) between the Auditor and the Funds, relating to the service; and (ii) any compensation arrangement or other agreement, such as a referral agreement, a referral fee or fee-sharing arrangement, between the Auditor (or an affiliate of the Auditor) and any person (other than the Funds or Service Affiliates receiving the services) with respect to the promoting, marketing, or recommending of a transaction covered by the service. The Auditor will also discuss with
the Audit Committee the potential effects of the services on the independence of the Auditor, and document the substance of its discussion with the Audit Committee.
| c. | Other Services |
The Audit Committee may pre-approve other non-audit services so long as the Audit Committee believes that the service will not impair the independence of the Auditor. Appendix I includes a list of services that the Auditor is prohibited from performing by the SEC rules. Appendix I also includes a list of services that would impair the Auditor’s independence unless the Audit Committee reasonably concludes that the results of the services will not be subject to audit procedures during an audit of the Funds’ financial statements.
V. Pre-Approval of Service Affiliate’s Covered Engagements
Rule 2-01 of Regulation S-X requires that the Audit Committee pre-approve a Service Affiliate’s engagement of the Auditor for non-audit services if the engagement relates directly to the operations and financial reporting of the Funds, defined above as a “Service Affiliate’s Covered Engagement”.
The Audit Committee may provide either general or specific pre-approval of any Service Affiliate’s Covered Engagement, including for audit-related, tax or other services, as described above, if the Audit Committee believes that the provision of the services to a Service Affiliate will not impair the independence of the Auditor with respect to the Funds. Any Service Affiliate’s Covered Engagements that are not within the scope of General Pre-Approved Non-Audit Services have not received general pre-approval and require specific pre-approval.
Each request for specific pre-approval by the Audit Committee of a Service Affiliate’s Covered Engagement must be submitted to the Audit Committee by the Funds’ Treasurer (or his or her designee) and must include detailed information about the services to be provided, the fees or fee ranges to be charged, a description of the current status of the pre-approval process involving other audit committees in the Invesco investment company complex (as defined in Rule 2-201 of Regulation S-X) with respect to the proposed engagement, and other relevant information sufficient to allow the Audit Committee to consider whether the provision of such services will impair the independence of the Auditor from the Funds. Additionally, the Funds’ Treasurer (or his or her designee) and the Auditor will provide the Audit Committee with a statement that the proposed engagement requires pre-approval by the Audit Committee, the proposed engagement, in their view, will not impair the independence of the Auditor and is consistent with Applicable Rules, and the description of the proposed engagement provided to the Audit Committee is consistent with that presented to or approved by the Invesco audit committee.
Information about all Service Affiliate engagements of the Auditor for non-audit services, whether or not subject to pre-approval by the Audit Committee, shall be provided to the Audit Committee at least quarterly, to allow the Audit Committee to consider whether the provision of such services is compatible with maintaining the Auditor’s independence from the Funds. The Funds’ Treasurer and Auditor shall provide the Audit Committee with sufficiently detailed information about the scope of services provided and the fees for such services, to ensure that the Audit Committee can adequately consider whether the provision of such services is compatible with maintaining the Auditor’s independence from the Funds.
VI. Pre-Approved Fee Levels or Established Amounts
Pre-approved fee levels or ranges for audit and non-audit services to be provided by the Auditor to the Funds, and for a Service Affiliate’s Covered Engagement, under general pre-approval or specific pre-approval will be set periodically by the Audit Committee. Any proposed fees exceeding 110% of the maximum pre-approved fee levels or ranges for such services or engagements will be promptly presented
to the Audit Committee and will require specific pre-approval by the Audit Committee before payment of any additional fees is made.
VII. Delegation
The Audit Committee hereby delegates, subject to the dollar limitations set forth below, specific authority to its Chair, or in his or her absence, Vice Chair, to pre-approve audit and non-audit services proposed to be provided by the Auditor to the Funds and/or a Service Affiliate’s Covered Engagement, between Audit Committee meetings. Such delegation does not preclude the Chair or Vice Chair from declining, on a case by case basis, to exercise his or her delegated authority and instead convening the Audit Committee to consider and pre-approve any proposed services or engagements.
Notwithstanding the foregoing, the Audit Committee must pre-approve: (a) any non-audit services to be provided to the Funds for which the fees are estimated to exceed $500,000; (b) any Service Affiliate’s Covered Engagement for which the fees are estimated to exceed $500,000; or (c) any cost increase to any previously approved service or engagement that exceeds the greater of $250,000 or 50% of the previously approved fees up to a maximum increase of $500,000.
VIII. Compliance with Procedures
Notwithstanding anything herein to the contrary, failure to pre-approve any services or engagements that are not required to be pre-approved pursuant to the de minimis exception provided for in Rule 2-01(c)(7)(i)(C) of Regulation S-X shall not constitute a violation of these Procedures. The Audit Committee has designated the Funds’ Treasurer to ensure services and engagements are pre-approved in compliance with these Procedures. The Funds’ Treasurer will immediately report to the Chair of the Audit Committee, or the Vice Chair in his or her absence, any breach of these Procedures that comes to the attention of the Funds’ Treasurer or any services or engagements that are not required to be pre-approved pursuant to the de minimis exception provided for in Rule 2-01(c)(7)(i)(C) of Regulation S-X.
On at least an annual basis, the Auditor will provide the Audit Committee with a summary of all non-audit services provided to any entity in the investment company complex (as defined in section 2-01(f)(14) of Regulation S-X, including the Funds and Service Affiliates) that were not pre-approved, including the nature of services provided and the associated fees.
IX. Amendments to Procedures
All material amendments to these Procedures must be approved in advance by the Audit Committee. Non-material amendments to these Procedures may be made by the Legal and Compliance Departments and will be reported to the Audit Committee at the next regularly scheduled meeting of the Audit Committee.
Appendix I
Non-Audit Services That May Impair the Auditor’s Independence
The Auditor is not independent if, at any point during the audit and professional engagement, the Auditor provides the following non-audit services:
| • | Management functions; |
| • | Human resources; |
| • | Broker-dealer, investment adviser, or investment banking services ; |
| • | Legal services; |
| • | Expert services unrelated to the audit; |
| • | Any service or product provided for a contingent fee or a commission; |
| • | Services related to marketing, planning, or opining in favor of the tax treatment of confidential transactions or aggressive tax position transactions, a significant purpose of which is tax avoidance; |
| • | Tax services for persons in financial reporting oversight roles at the Fund; and |
| • | Any other service that the Public Company Oversight Board determines by regulation is impermissible. |
An Auditor is not independent if, at any point during the audit and professional engagement, the Auditor provides the following non-audit services unless it is reasonable to conclude that the results of the services will not be subject to audit procedures during an audit of the Funds’ financial statements:
| • | Bookkeeping or other services related to the accounting records or financial statements of the audit client; |
| • | Financial information systems design and implementation; |
| • | Appraisal or valuation services, fairness opinions, or contribution-in-kind reports; |
| • | Actuarial services; and |
| • | Internal audit outsourcing services. |
| ITEM 5. | AUDIT COMMITTEE OF LISTED REGISTRANTS. |
Not applicable.
| ITEM 6. | SCHEDULE OF INVESTMENTS. |
Investments in securities of unaffiliated issuers is included as part of the reports to stockholders filed under Item 1 of this Form.
| ITEM 7. | DISCLOSURE OF PROXY VOTING POLICIES AND PROCEDURES FOR CLOSED-END MANAGEMENT INVESTMENT COMPANIES. |
Not applicable.
| ITEM 8. | PORTFOLIO MANAGERS OF CLOSED-END MANAGEMENT COMPANIES. |
Not applicable.
| ITEM 9. | PURCHASES OF EQUITY SECURITIES BY CLOSED-END MANAGEMENT INVESTMENT COMPANY AND AFFILIATED PURCHASERS. |
Not applicable.
| ITEM 10. | SUBMISSION OF MATTERS TO A VOTE OF SECURITY HOLDERS. |
None
| ITEM 11. | CONTROLS AND PROCEDURES. |
| (a) | As of August 11, 2017, an evaluation was performed under the supervision and with the participation of the officers of the Registrant, including the PEO and PFO, to assess the effectiveness of the Registrant’s disclosure controls and procedures, as that term is defined in Rule 30a-3(c) under the Investment Company Act of 1940 (the “Act”), as amended. Based on that evaluation, the Registrant’s officers, including the PEO and PFO, concluded that, as of August 11, 2017, the Registrant’s disclosure controls and procedures were reasonably designed to ensure: (1) that information required to be disclosed by the Registrant on Form N-CSR is recorded, processed, summarized and reported within the time periods specified by the rules and forms of the Securities and Exchange Commission; and (2) that material information relating to the Registrant is made known to the PEO and PFO as appropriate to allow timely decisions regarding required disclosure. |
| (b) | There have been no changes in the Registrant’s internal control over financial reporting (as defined in Rule 30a-3(d) under the Act) that occurred during the second fiscal quarter of the period covered by this report that have materially affected, or are reasonably likely to materially affect, the Registrant’s internal control over financial reporting. |
| ITEM 12. | EXHIBITS. |
| 12(a) (1) | Code of Ethics. |
| 12(a) (2) | Certifications of principal executive officer and principal financial officer as required by Rule 30a-2(a) under the Investment Company Act of 1940. |
| 12(a) (3) | Not applicable. |
| 12(b) | Certifications of principal executive officer and principal financial officer as required by Rule 30a-2(b) under the Investment Company Act of 1940. |
SIGNATURES
Pursuant to the requirements of the Securities Exchange Act of 1934 and the Investment Company Act of 1940, the Registrant has duly caused this report to be signed on its behalf by the undersigned, thereunto duly authorized.
Registrant: AIM Counselor Series Trust (Invesco Counselor Series Trust)
| By: | /s/ Sheri Morris | |
| Sheri Morris | ||
| Principal Executive Officer | ||
| Date: | November 8, 2017 | |
Pursuant to the requirements of the Securities and Exchange Act of 1934 and the Investment Company Act of 1940, this report has been signed below by the following persons on behalf of the Registrant and in the capacities and on the dates indicated.
| By: | /s/ Sherri Morris | |
| Sheri Morris | ||
| Principal Executive Officer | ||
| Date: | November 8, 2017 | |
| By: | /s/ Kelli Gallegos | |
| Kelli Gallegos | ||
| Principal Financial Officer | ||
| Date: | November 8, 2017 | |
EXHIBIT INDEX
| 12(a) (1) | Code of Ethics. | |
| 12(a) (2) | Certifications of principal executive officer and principal financial officer as required by Rule 30a-2(a) under the Investment Company Act of 1940. | |
| 12(a) (3) | Not applicable. | |
| 12(b) | Certifications of principal executive officer and principal financial officer as required by Rule 30a-2(b) under the Investment Company Act of 1940. | |