OMB APPROVAL | ||||
| OMB Number: 3235-0570 | ||||
| Expires: January 31, 2017 | ||||
| Estimated average burden | ||||
| hours per response: 20.6 | ||||
UNITED STATES
SECURITIES AND EXCHANGE COMMISSION
Washington, D.C. 20549
FORM N-CSR
CERTIFIED SHAREHOLDER REPORT OF REGISTERED
MANAGEMENT INVESTMENT COMPANIES
Investment Company Act file number 811-09913
AIM Counselor Series Trust (Invesco Counselor Series Trust)
(Exact name of registrant as specified in charter)
11 Greenway Plaza, Suite 1000
Houston, Texas 77046
(Address of principal executive offices) (Zip code)
Philip A. Taylor
11 Greenway Plaza, Suite 1000
Houston, Texas 77046
(Name and address of agent for service)
Registrant’s telephone number, including area code: (713) 626-1919
Date of fiscal year end: 8/31
Date of reporting period: 8/31/14
Item 1. Report to Stockholders.

Annual Report to Shareholders August 31, 2014
Invesco American Franchise Fund
Nasdaq:
A: VAFAX • B: VAFBX • C: VAFCX • R: VAFRX • Y: VAFIX • R5: VAFNX • R6: VAFFX
Letters to Shareholders
Philip Taylor | Dear Shareholders: This annual report includes information about your Fund, including performance data and a complete list of its investments as of the close of the reporting period. Inside, your Fund’s portfolio managers discuss how they managed your Fund and the factors that affected its performance during the reporting period. I hope you find this report of interest. During the reporting period covered by this report, the US economy showed signs of continued improvement. After contracting in the first quarter of 2014, the economy expanded strongly in the second quarter and unemployment trended lower. Much of the credit for this improvement goes to the US Federal Reserve (the Fed), which undertook an extraordinary asset purchase program following the global financial crisis. The Fed’s goal was to jumpstart the economy by encouraging banks to lend more, businesses to hire more and consumers to spend more. Signs of a stronger US economy prompted the Fed to reduce, or “taper,” its asset purchase program. Despite this, | |
| interest rates remained near historical low levels due largely to heavy investor demand for bonds. While signs of economic improvement were evident in the US, European economies remained relatively stagnant. During the reporting period, high unemployment persisted, worries about potential deflation grew, and uncertainty about Russian-Ukrainian tensions weighed on European markets. | ||

Extended periods of market strength can lull investors into complacency – just as prolonged periods of market weakness or volatility can discourage investors from initiating long-term investment plans. That’s why Invesco has always encouraged investors to work with a professional financial adviser who can stress the importance of starting to save and invest early and the importance of adhering to a disciplined investment plan – when times are good and when they’re uncertain. A financial adviser who knows your unique financial situation, investment goals and risk tolerance can be an invaluable partner as you seek to achieve your financial goals. He or she can offer a long-term perspective when markets are volatile and time-tested advice and guidance when your financial situation or investment goals change.
Timely information when and where you want it
Invesco’s efforts to help investors achieve their financial objectives include providing individual investors and financial professionals with timely information about the markets, the economy and investing – whenever and wherever they want it.
Our website, invesco.com/us, offers a wide range of market insights and investment perspectives. On the website, you’ll find detailed information about our funds, including prices, performance, holdings and portfolio manager commentaries. You can access information about your individual Invesco account whenever it’s convenient for you; just complete a simple, secure online registration. Use the “Login” box on our home page to get started.
Invesco’s mobile app for iPad® (available free from the App StoreSM) allows you to obtain the same detailed information about your Fund and the same investment insights from our investment leaders, market strategists, economists and retirement experts on the go. You also can watch portfolio manager videos and have instant access to Invesco news and updates wherever you may be.
In addition to the resources accessible on our website and through our mobile app, you can obtain timely updates to help you stay informed about the markets, the economy and investing by connecting with Invesco on Twitter, LinkedIn or Facebook. You can access our blog at blog.invesco.us.com or by clicking the “Intentional Investing Forum” link on our home page. Our goal is to provide you the information you want, when and where you want it.
Have questions?
For questions about your account, feel free to contact an Invesco client services representative at 800 959 4246. For Invesco-related questions or comments, please email me directly at phil@invesco.com.
All of us at Invesco look forward to serving your investment management needs for many years to come. Thank you for investing with us.
Sincerely,

Philip Taylor
Senior Managing Director, Invesco Ltd.
iPad is a trademark of Apple Inc., registered in the US and other countries. App Store is a service mark of Apple Inc. Invesco Distributors, Inc. is not affiliated with Apple Inc.
2 Invesco American Franchise Fund
Bruce Crockett | Dear Fellow Shareholders: There are a variety of factors that can impact investment performance, many of which are uncontrollable by us as investors. These factors can include various economic trends and geopolitical developments. While the members of the Invesco Funds Board, which I chair, can’t dictate the performance of the Invesco funds, be assured that your Board works diligently throughout the year to focus on how your investments are managed. Our job is to represent you and your interests on a variety of fund management-related matters. We regularly monitor how the portfolio management teams of the Invesco funds are performing in light of ever-changing and often unpredictable economic and market conditions. We review the investment strategies and investment process employed by each fund’s management team as explained in the fund’s prospectus. | |
Perhaps our most significant responsibility is conducting the annual review of the funds’ |

advisory and sub-advisory contracts with Invesco Advisers and its affiliates. This annual review, which is required by the Investment Company Act of 1940, focuses on the nature and quality of the services Invesco provides as the adviser to the Invesco funds and the reasonableness of the fees that it charges for those services. Each year, we spend months carefully reviewing information from Invesco that allows us to evaluate the quality of its services and the reasonableness of its fees. We also use information from a variety of independent sources, including materials provided by the independent senior officer of the Invesco funds, who reports directly to the independent trustees on the Board. Additionally, we meet with legal counsel and review performance and fee data prepared for us by Lipper Inc., an independent, third-party firm widely recognized as a leader in its field.
After a careful review, the members of the Invesco Funds Board approved the continuation of advisory and sub-advisory contracts with Invesco Advisers and its affiliates. Be assured that your Board will continue working on behalf of fund shareholders, keeping your needs and interests uppermost in our minds.
As always, please contact me at bruce@brucecrockett.com with any questions or concerns you may have. On behalf of the Board, we look forward to continuing to represent your interests and serving your needs.
Sincerely,

Bruce L. Crockett
Independent Chair
Invesco Funds Board of Trustees
3 Invesco American Franchise Fund
Management’s Discussion of Fund Performance
Performance summary
For the fiscal year ended August 31, 2014, Class A shares of Invesco American Franchise Fund, at net asset value (NAV), produced strong returns and outperformed the Fund’s style-specific benchmark, the Russell 1000 Growth Index. Outperformance was driven primarily by stock selection in several sectors, including the health care, consumer staples, information technology (IT) and consumer discretionary sectors.
Your fund’s long-term performance appears later in this report.
Fund vs. Indexes
Total returns, 8/31/13 to 8/31/14, at net asset value (NAV). Performance shown does not include applicable contingent deferred sales charges (CDSC) or front-end sales charges, which would have reduced performance.
Class A Shares | 27.22 | % | ||
Class B Shares | 27.20 | |||
Class C Shares | 26.23 | |||
Class R Shares | 26.83 | |||
Class Y Shares | 27.48 | |||
Class R5 Shares | 27.65 | |||
Class R6 Shares | 27.69 | |||
S&P 500 Indexq (Broad Market Index) | 25.25 | |||
Russell 1000 Growth Indexq (Style-Specific Index) | 26.29 | |||
Lipper Large-Cap Growth Funds Indexn (Peer Group Index) | 25.74 |
Source(s): qFactSet Research Systems Inc.; nLipper Inc.
How we invest
We believe a growth investment strategy is an essential component of a diversified portfolio.
Our investment process emphasizes rigorous bottom-up analysis of individual companies. We seek to invest in companies with strong or improving fundamentals, attractive valuations relative to growth prospects and earnings expectations that appear fair to conservative.
To narrow our investment universe, we utilize a holistic approach that emphasizes fundamental research and, to a lesser extent, includes quantitative analysis. At the end of this distillation process, we have a set of stocks to analyze in greater depth.
Our fundamental analysis focuses on identifying companies with strong drivers of growth. To accomplish this goal, we
conduct rigorous bottom-up analysis in order to develop higher conviction in each company’s prospects for growth. Through our analysis, we develop a mosaic of each company through detailed discussions with company management teams, competitors, distributors, suppliers, Wall Street analysts and customers. We also utilize a variety of valuation techniques based on the company in question, the industry in which the company operates, the stage of the business cycle and other factors that best reflect a company’s value.
Risk management plays an important role in portfolio construction, as our target portfolio attempts to maximize the relationship between risk and return. We seek to accomplish this goal by investing in companies with attractive fundamental prospects for growth, and we divide the
portfolio between stable growth stocks and catalyst-driven stocks.
We consider selling a stock for any of the following reasons:
| n | The price target set at purchase is reached. |
| n | There is deterioration in fundamentals. |
| n | The catalysts for growth are no longer present or are reflected in the stock price. |
Market conditions and your Fund
US equity market indexes generally rose during the fiscal year ended August 31, 2014. Corporate earnings were resilient in the face of modest economic growth, driven by strong profitability across many sectors, and fundamentals for corporations and consumers remained relatively positive. However, the fiscal year began amid uncertainty created by a two-week federal government shutdown. Despite this and the announcement by the US Federal Reserve (the Fed) in December that it would begin reducing the scope of its asset purchase program in early 2014, US equities rallied through the end of 2013. The market turned volatile in the first months of 2014 as investors began to worry that stocks may have risen too far, too fast. While political upheaval in Ukraine and signs of economic sluggishness in the US and China contributed to investor uncertainty, economic data remained strong enough that the Fed continued to reduce its asset purchase program on schedule. The continued “good but not great” economic environment and historically low interest rates generally led stocks higher throughout the end of the fiscal year.
During the reporting period, the Fund’s Class A shares, at NAV, produced strong returns and outperformed the Russell 1000 Growth Index due to strong stock selection in several sectors, particularly in the health care, consumer staples, IT and
| Portfolio Composition | |||||
| By sector | |||||
Information Technology | 32.7 | % | |||
Consumer Discretionary | 22.3 | ||||
Health Care | 17.4 | ||||
Industrials | 9.0 | ||||
Energy | 4.8 | ||||
Financials | 4.3 | ||||
Consumer Staples | 3.5 | ||||
Telecommunication Services | 3.1 | ||||
Materials | 2.1 | ||||
Money Market Funds | |||||
| Plus Other Assets Less Liabilities | 0.8 | ||||
| Top 10 Equity Holdings* | |||||
1. Facebook Inc.-Class A | 5.6 | % | |||
2. Gilead Sciences, Inc. | 5.2 | ||||
3. Apple Inc. | 5.0 | ||||
4. DISH Network Corp.-Class A | 4.1 | ||||
5. Sprint Corp. | 3.1 | ||||
6. Priceline Group Inc. (The) | 2.9 | ||||
7. Google Inc.-Class A | 2.8 | ||||
8. Lowe’s Cos., Inc. | 2.8 | ||||
9. Google Inc.-Class C | 2.6 | ||||
10. MasterCard, Inc.-Class A | 2.5 | ||||
| Total Net Assets | $10.1 billion | ||||
| Total Number of Holdings* | 69 | ||||
The Fund’s holdings are subject to change, and there is no assurance that the Fund will continue to hold any particular security.
*Excluding money market fund holdings.
4 Invesco American Franchise Fund
consumer discretionary sectors. Some of this outperformance was offset by underperformance within the telecommunication services and industrials sectors.
The health care sector was the leading contributor to Fund performance during the reporting period, driven by stock selection. Within the sector, one of the strongest contributors to Fund performance was Gilead Sciences, which launched Sovaldi as an effective treatment for the hepatitis-C virus. The launch was an immediate success, and investors rewarded the stock as the long-term financial implications of this life-saving treatment became clearer. Another contributor to Fund performance was bio-technology company Celgene, which had positive developments in its cancer treatment pipeline and benefited from favorable resolution to an intellectual property hearing.
Strong stock selection in the consumer staples sector also contributed to Fund performance versus its style-specific benchmark. The top contributor in the sector was Mondalez International, a leading global provider of snack foods and beverages. The company announced it would divest its coffee business through a joint venture and began to show increasing profitability from restructuring efficiencies, both of which were received favorably by investors. During the reporting period, we sold our position in Mondelez to lock in gains when it began to reflect our estimate of fair value.
Additionally, strong stock selection within the IT sector contributed to Fund performance versus its style-specific benchmark. The largest contributor to Fund performance was social networking company Facebook, which continued to exceed investor expectations across the board. Index heavyweight Apple also had strong returns and the Fund’s overweight position contributed to performance as well. Technology stocks which detracted from performance included 3D Systems, which we sold during the reporting period, and Splunk.
The Fund struggled in the telecommunication services sector. Wireless communications company Sprint was the lone Fund holding in the sector and the largest detractor from Fund performance. For much of the reporting period, discussions of a strategic merger with another company led to increasing investor excitement, but when the two parties ended their discussions, it left many investors disappointed.
As we’ve discussed, the Fund produced significant positive performance during the reporting period. However, stocks remain volatile and we caution investors against making investment decisions based on short-term performance.
Thank you for your commitment to Invesco American Franchise Fund and for sharing our long-term investment horizon.
The views and opinions expressed in management’s discussion of Fund performance are those of Invesco Advisers, Inc. These views and opinions are subject to change at any time based on factors such as market and economic conditions. These views and opinions may not be relied upon as investment advice or recommendations, or as an offer for a particular security. The information is not a complete analysis of every aspect of any market, country, industry, security or the Fund. Statements of fact are from sources considered reliable, but Invesco Advisers, Inc. makes no representation or warranty as to their completeness or accuracy. Although historical performance is no guarantee of future results, these insights may help you understand our investment management philosophy.
See important Fund and, if applicable, index disclosures later in this report.
 | Erik Voss Chartered Financial Analyst, Portfolio Manager, is lead manager of Invesco American Franchise | |
| Fund. He joined Invesco in 2010. Mr. Voss earned a BS in mathematics and an MS in finance from the University of Wisconsin. | ||
 | Ido Cohen Portfolio Manager, is manager of Invesco American Franchise Fund. He joined Invesco in 2010. Mr. | |
| Cohen earned a BS in economics from The Wharton School of the University of Pennsylvania. | ||
5 Invesco American Franchise Fund
Your Fund’s Long-Term Performance
Results of a $10,000 Investment – Oldest Share Class(es) since Inception
Fund data from 6/23/05; index data from 6/30/05
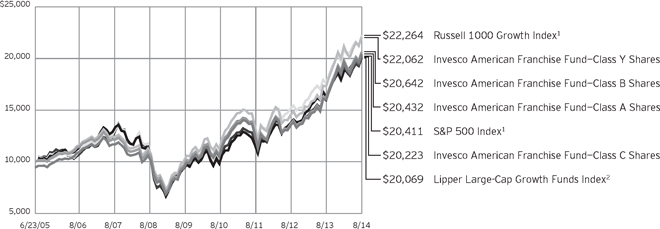
| 1 | Source: FactSet Research Systems Inc. |
| 2 | Source: Lipper Inc. |
Past performance cannot guarantee comparable future results.
The data shown in the chart include reinvested distributions, applicable sales charges and Fund expenses including management fees. Results for Class B shares are calculated as if a hypothetical
shareholder had liquidated his entire investment in the Fund at the close of the reporting period and paid the contingent deferred sales charges, if applicable. Index results include reinvested dividends, but they do not reflect sales charges. Performance of the peer group,
if applicable, reflects fund expenses and management fees; performance of a market index does not. Performance shown in the chart and table(s) does not reflect deduction of taxes a shareholder would pay on Fund distributions or sale of Fund shares.
6 Invesco American Franchise Fund
| Average Annual Total Returns | |||||
As of 8/31/14, including maximum applicable sales charges
|
| ||||
| Class A Shares | |||||
| Inception (6/23/05) | 8.09 | % | |||
5 Years | 15.50 | ||||
1 Year | 20.25 | ||||
Class B Shares | |||||
Inception (6/23/05) | 8.21 | % | |||
5 Years | 16.28 | ||||
1 Year | 22.20 | ||||
Class C Shares | |||||
Inception (6/23/05) | 7.97 | % | |||
5 Years | 16.01 | ||||
1 Year | 25.23 | ||||
Class R Shares | |||||
Inception | 8.47 | % | |||
5 Years | 16.52 | ||||
1 Year | 26.83 | ||||
Class Y Shares | |||||
Inception (6/23/05) | 8.99 | % | |||
5 Years | 17.05 | ||||
1 Year | 27.48 | ||||
Class R5 Shares | |||||
Inception | 8.91 | % | |||
5 Years | 17.14 | ||||
1 Year | 27.65 | ||||
Class R6 Shares | |||||
Inception | 8.85 | % | |||
5 Years | 17.01 | ||||
1 Year | 27.69 | ||||
Effective June 1, 2010, Class A, Class B, Class C and Class I shares of the predecessor fund, Van Kampen American Franchise Fund, advised by Van Kampen Asset Management were reorganized into Class A, Class B, Class C and Class Y shares, respectively, of Invesco Van Kampen American Franchise Fund (renamed Invesco American Franchise Fund). Returns shown above for Class A, Class B, Class C and Class Y shares are blended returns of the predecessor fund and Invesco American Franchise Fund. Share class returns will differ from the predecessor fund because of different expenses.
Class R shares incepted on May 23, 2011. Performance shown prior to that date is that of the Fund’s and the predecessor fund’s Class A shares, restated to reflect the higher 12b-1 fees applicable to Class R shares. Class A share performance reflects any applicable fee waivers or expense reimbursements.
| Average Annual Total Returns | |||||
| As of 6/30/14, the most recent calendar quarter end, including maximum applicable sales charges | |||||
Class A Shares | |||||
Inception (6/23/05) | 7.96 | % | |||
5 Years | 17.88 | ||||
1 Year | 26.50 | ||||
Class B Shares | |||||
Inception (6/23/05) | 8.08 | % | |||
5 Years | 18.68 | ||||
1 Year | 28.87 | ||||
Class C Shares | |||||
Inception (6/23/05) | 7.85 | % | |||
5 Years | 18.41 | ||||
1 Year | 31.74 | ||||
Class R Shares | |||||
Inception | 8.36 | % | |||
5 Years | 18.93 | ||||
1 Year | 33.53 | ||||
Class Y Shares | |||||
Inception (6/23/05) | 8.88 | % | |||
5 Years | 19.48 | ||||
1 Year | 34.17 | ||||
Class R5 Shares | |||||
Inception | 8.79 | % | |||
5 Years | 19.54 | ||||
1 Year | 34.30 | ||||
Class R6 Shares | |||||
Inception | 8.72 | % | |||
5 Years | 19.42 | ||||
1 Year | 34.42 | ||||
Class R5 shares incepted on December 22, 2010. Performance shown prior to that date is that of the Fund’s and the predecessor fund’s Class A shares and includes the 12b-1 fees applicable to Class A shares. Class A share performance reflects any applicable fee waivers or expense reimbursements.
Class R6 shares incepted on September 24, 2012. Performance shown prior to that date is that of the Fund’s and the predecessor fund’s Class A shares and includes the 12b-1 fees applicable to Class A shares. Class A share performance reflects any applicable fee waivers or expense reimbursements.
The performance data quoted represent past performance and cannot guarantee comparable future results; current performance may be lower or higher. Please visit invesco.com/performance for the most recent month-end performance. Performance figures reflect reinvested distributions,
changes in net asset value and the effect of the maximum sales charge unless otherwise stated. Investment return and principal value will fluctuate so that you may have a gain or loss when you sell shares.
The total annual Fund operating expense ratio set forth in the most recent Fund prospectus as of the date of this report for Class A, Class B, Class C, Class R, Class Y, Class R5 and Class R6 shares was 1.14%, 1.14%, 1.89%, 1.39%, 0.89%, 0.75% and 0.65%, respectively. The expense ratios presented above may vary from the expense ratios presented in other sections of this report that are based on expenses incurred during the period covered by this report.
Class A share performance reflects the maximum 5.50% sales charge, and Class B and Class C share performance reflects the applicable contingent deferred sales charge (CDSC) for the period involved. For shares purchased prior to June 1, 2010, the CDSC on Class B shares declines from 5% at the time of purchase to 0% at the beginning of the sixth year. For shares purchased on or after June 1, 2010, the CDSC on Class B shares declines from 5% at the time of purchase to 0% at the beginning of the seventh year. The CDSC on Class C shares is 1% for the first year after purchase. Class R, Class Y, Class R5 and Class R6 shares do not have a front-end sales charge or a CDSC; therefore, performance is at net asset value.
The performance of the Fund’s share classes will differ primarily due to different sales charge structures and class expenses.
Had the adviser not waived fees and/or reimbursed expenses on Class B shares in the past, performance would have been lower.
7 Invesco American Franchise Fund
Invesco American Franchise Fund’s investment objective is to seek long-term capital appreciation.
| n | Unless otherwise stated, information presented in this report is as of August 31, 2014, and is based on total net assets. |
| n | Unless otherwise noted, all data provided by Invesco. |
| n | To access your Fund’s reports/prospectus, visit invesco.com/fundreports. |
About share classes
| n | Class B shares may not be purchased for new or additional investments. Please see the prospectus for more information. |
| n | Class R shares are generally available only to employer sponsored retirement and benefit plans. Please see the prospectus for more information. |
| n | Class Y shares are available only to certain investors. Please see the prospectus for more information. |
| n | Class R5 shares and Class R6 shares are primarily intended for employer sponsored retirement and benefit plans that meet certain standards and for institutional investors. Please see the prospectus for more information. |
Principal risks of investing in the Fund
| n | Equity risk. Equity risk is the risk that the value of securities held by the Fund will fall due to general market and economic conditions, perceptions regarding the industries in which the issuers of securities held by the Fund participate or factors relating to specific companies in which the Fund invests, either directly or through derivative instruments. For example, an adverse event, such as an unfavorable earnings report, may depress the value of securities held by the Fund; the price of securities may be particularly sensitive to general movements in the stock market; or a drop in the stock market may depress the price of most or all of the securities held by the Fund. In addition, securities of an issuer in the Fund’s portfolio may decline in price if the issuer fails to make anticipated dividend payments because, among other reasons, the issuer of the security experiences a decline in its financial condition. |
| n | Foreign securities risk. The Fund’s foreign investments may be affected by changes in a foreign country’s exchange rates, political and social instability, changes in economic or taxation policies, difficulties when enforcing obligations, decreased liquidity, and increased |
Volatility. Foreign companies may be subject to less regulation resulting in less publicly available information about the companies. |
| n | Growth investing risk. Growth stocks tend to be more expensive relative to their earnings or assets compared with other types of stock. As a result they tend to be more sensitive to changes in their earnings and can be more volatile. |
| n | Management risk. The investment techniques and risk analysis used by the Fund’s portfolio managers may not produce the desired results. |
| n | Market risk. The prices of and the income generated by the Fund’s securities may decline in response to, among other things, investor sentiment, general economic and market conditions, regional or global instability, and currency and interest rate fluctuations. |
| n | Mid-capitalization risk. Stocks of mid-sized companies tend to be more vulnerable to adverse developments and may have little or no operating history or track record of success, and limited product lines, markets, management and financial resources. The securities of mid-sized companies may be more volatile due to less market interest and less publicly available information about the issuer. They also may be illiquid or restricted as to resale, or may trade less frequently and in smaller volumes, all of which may cause difficulty when establishing or closing a position at a desirable price. |
About indexes used in this report
| n | The S&P 500 Index is an unmanaged index considered representative of the US stock market. |
| n | The Russell 1000 Growth Index is an unmanaged index considered representative of large-cap growth stocks. The Russell 1000 Growth Index is a trademark/service mark of the Frank Russell Co. Russell® is a trademark of the Frank Russell Co. |
| n | The Lipper Large-Cap Growth Funds Index is an unmanaged index considered representative of large-cap growth funds tracked by Lipper. |
| n | The Fund is not managed to track the performance of any particular index, including the index(es) described here, and consequently, the performance of the Fund may deviate significantly from the performance of the index(es). |
| n | A direct investment cannot be made in an index. Unless otherwise indicated, index results include reinvested dividends, and they do not reflect sales charges. Performance of the peer group, if applicable, reflects fund expenses; performance of a market index does not. |
Other information
| n | The returns shown in management’s discussion of Fund performance are based on net asset values (NAVs) calculated for shareholder transactions. Generally accepted accounting principles require adjustments to be made to the net assets of the Fund at period end for financial reporting purposes, and as such, the NAVs for shareholder transactions and the returns based on those NAVs may differ from the NAVs and returns reported in the Financial Highlights. |
| n | Industry classifications used in this report are generally according to the Global Industry Classification Standard, which was developed by and is the exclusive property and a service mark of MSCI Inc. and Standard & Poor’s. |
This report must be accompanied or preceded by a currently effective Fund prospectus, which contains more complete information, including sales charges and expenses. Investors should read it carefully before investing.
NOT FDIC INSURED | MAY LOSE VALUE | NO BANK GUARANTEE
8 Invesco American Franchise Fund
Schedule of Investments(a)
August 31, 2014
| Shares | Value | |||||||
Common Stocks & Other Equity Interests–99.16% |
| |||||||
| Aerospace & Defense–2.25% | ||||||||
Honeywell International Inc. | 1,506,439 | $ | 143,458,186 | |||||
Precision Castparts Corp. | 340,849 | 83,187,607 | ||||||
| 226,645,793 | ||||||||
| Agricultural Products–0.93% | ||||||||
Archer-Daniels-Midland Co. | 1,869,410 | 93,208,783 | ||||||
| Apparel, Accessories & Luxury Goods–1.00% | ||||||||
Michael Kors Holdings Ltd.(b) | 1,257,805 | 100,775,337 | ||||||
| Application Software–2.66% | ||||||||
salesforce.com, inc.(b) | 3,459,167 | 204,402,178 | ||||||
Splunk Inc.(b) | 1,164,475 | 62,823,426 | ||||||
| 267,225,604 | ||||||||
| Asset Management & Custody Banks–1.11% | ||||||||
Ameriprise Financial, Inc. | 888,175 | 111,696,888 | ||||||
| Biotechnology–11.30% | ||||||||
Alkermes PLC(b) | 2,012,140 | 90,003,022 | ||||||
Amgen Inc. | 646,701 | 90,137,186 | ||||||
Biogen Idec Inc.(b) | 530,252 | 181,897,646 | ||||||
Celgene Corp.(b) | 2,599,637 | 247,017,508 | ||||||
Gilead Sciences, Inc.(b) | 4,904,328 | 527,607,606 | ||||||
| 1,136,662,968 | ||||||||
| Brewers–0.97% | ||||||||
Anheuser-Busch InBev N.V.–ADR (Belgium) | 873,887 | 97,683,089 | ||||||
| Cable & Satellite–7.15% | ||||||||
Comcast Corp. -Class A | 1,401,006 | 76,677,059 | ||||||
DISH Network Corp.–Class A(b) | 6,320,080 | 409,604,385 | ||||||
Time Warner Cable Inc. | 1,574,438 | 232,906,613 | ||||||
| 719,188,057 | ||||||||
| Casinos & Gaming–0.45% | ||||||||
Las Vegas Sands Corp. | 676,859 | 45,017,892 | ||||||
| Communications Equipment–1.62% | ||||||||
F5 Networks, Inc.(b) | 626,410 | 77,793,858 | ||||||
QUALCOMM, Inc. | 1,121,953 | 85,380,623 | ||||||
| 163,174,481 | ||||||||
| Construction & Engineering–3.73% | ||||||||
Fluor Corp. | 1,892,245 | 139,817,983 | ||||||
Jacobs Engineering Group, Inc.(b) | 2,286,150 | 123,246,347 | ||||||
Quanta Services, Inc.(b) | 3,078,744 | 111,881,557 | ||||||
| 374,945,887 | ||||||||
| Construction Materials–0.95% | ||||||||
Martin Marietta Materials, Inc.(c) | 732,813 | 95,969,190 | ||||||
| Shares | Value | |||||||
| Consumer Electronics–1.15% | ||||||||
Harman International Industries, Inc. | 1,002,097 | $ | 115,321,323 | |||||
| Data Processing & Outsourced Services–3.22% | ||||||||
Alliance Data Systems Corp.(b) | 287,475 | 76,077,384 | ||||||
MasterCard, Inc.–Class A | 3,276,878 | 248,420,121 | ||||||
| 324,497,505 | ||||||||
| Drug Retail–1.00% | ||||||||
CVS Caremark Corp. | 1,265,041 | 100,507,507 | ||||||
| Fertilizers & Agricultural Chemicals–1.10% | ||||||||
Monsanto Co. | 961,224 | 111,165,556 | ||||||
| Footwear–0.61% | ||||||||
NIKE, Inc.–Class B | 775,897 | 60,946,709 | ||||||
| Health Care Distributors–0.55% | ||||||||
McKesson Corp. | 282,428 | 55,081,933 | ||||||
| Health Care Facilities–1.10% | ||||||||
HCA Holdings, Inc.(b) | 1,582,388 | 110,482,330 | ||||||
| Home Entertainment Software–0.86% | ||||||||
Activision Blizzard, Inc. | 3,686,731 | 86,785,648 | ||||||
| Home Improvement Retail–2.79% | ||||||||
Lowe’s Cos., Inc. | 5,349,895 | 280,922,986 | ||||||
| Hotels, Resorts & Cruise Lines–2.06% | ||||||||
Carnival Corp. | 4,256,897 | 161,251,258 | ||||||
Royal Caribbean Cruises Ltd. | 726,590 | 46,327,379 | ||||||
| 207,578,637 | ||||||||
| Household Appliances–1.06% | ||||||||
Whirlpool Corp. | 695,314 | 106,396,948 | ||||||
| Industrial Conglomerates–1.02% | ||||||||
Roper Industries, Inc. | 681,055 | 102,539,641 | ||||||
| Industrial Machinery–1.05% | ||||||||
Flowserve Corp. | 1,388,666 | 105,385,863 | ||||||
| Insurance Brokers–0.99% | ||||||||
Aon PLC | 1,139,561 | 99,324,137 | ||||||
| Internet Retail–4.68% | ||||||||
Amazon.com, Inc.(b) | 519,920 | 176,273,677 | ||||||
Priceline Group Inc. (The)(b) | 237,199 | 295,149,087 | ||||||
| 471,422,764 | ||||||||
| Internet Software & Services–13.28% | ||||||||
Baidu, Inc.–ADR (China)(b) | 282,774 | 60,660,678 | ||||||
Facebook Inc.–Class A(b) | 7,522,062 | 562,800,679 | ||||||
Google Inc.–Class A(b) | 491,173 | 286,039,508 | ||||||
Google Inc.–Class C(b) | 459,101 | 262,422,132 | ||||||
Yelp Inc.(b)(c) | 1,989,921 | 164,009,289 | ||||||
| 1,335,932,286 | ||||||||
See accompanying Notes to Financial Statements which are an integral part of the financial statements.
9 Invesco American Franchise Fund
| Shares | Value | |||||||
| Investment Banking & Brokerage–1.12% | ||||||||
Morgan Stanley | 3,294,294 | $ | 113,027,227 | |||||
| IT Consulting & Other Services–0.36% | ||||||||
Cognizant Technology Solutions Corp.–Class A(b) | 792,615 | 36,246,284 | ||||||
| Life Sciences Tools & Services–0.99% | ||||||||
Thermo Fisher Scientific, Inc. | 832,049 | 100,020,610 | ||||||
| Movies & Entertainment–1.33% | ||||||||
Twenty-First Century Fox, Inc.–Class A | 2,042,912 | 72,359,943 | ||||||
Walt Disney Co. (The) | 685,020 | 61,569,598 | ||||||
| 133,929,541 | ||||||||
| Oil & Gas Equipment & Services–2.48% | ||||||||
Baker Hughes Inc. | 1,079,360 | 74,626,950 | ||||||
Halliburton Co. | 2,589,916 | 175,104,221 | ||||||
| 249,731,171 | ||||||||
| Oil & Gas Exploration & Production–2.31% | ||||||||
Anadarko Petroleum Corp. | 1,397,626 | 157,498,474 | ||||||
Pioneer Natural Resources Co. | 357,950 | 74,686,267 | ||||||
| 232,184,741 | ||||||||
| Pharmaceuticals–3.45% | ||||||||
AbbVie Inc. | 1,347,692 | 74,500,414 | ||||||
Actavis PLC(b) | 713,564 | 161,964,757 | ||||||
Allergan, Inc. | 300,496 | 49,185,185 | ||||||
Bristol-Myers Squibb Co. | 1,216,374 | 61,609,343 | ||||||
| 347,259,699 | ||||||||
| Railroads–0.97% | ||||||||
Canadian Pacific Railway Ltd. (Canada) | 486,899 | 97,671,939 | ||||||
| Semiconductor Equipment–0.57% | ||||||||
Applied Materials, Inc. | 2,465,522 | 56,965,886 | ||||||
| Semiconductors–1.99% | ||||||||
Micron Technology, Inc.(b) | 1,695,684 | 55,279,299 | ||||||
NXP Semiconductors N.V. (Netherlands)(b) | 2,116,585 | 145,028,404 | ||||||
| 200,307,703 | ||||||||
| Shares | Value | |||||||
| Soft Drinks–0.60% | ||||||||
Monster Beverage Corp.(b) | 686,190 | $ | 60,666,058 | |||||
| Specialized REIT’s–1.11% | ||||||||
American Tower Corp. | 1,133,312 | 111,744,563 | ||||||
| Systems Software–3.14% | ||||||||
ServiceNow, Inc.(b) | 2,081,412 | 127,236,716 | ||||||
VMware, Inc.–Class A(b)(c) | 1,918,775 | 189,152,839 | ||||||
| 316,389,555 | ||||||||
| Technology Hardware, Storage & Peripherals–5.04% | ||||||||
Apple Inc. | 4,950,767 | 507,453,618 | ||||||
| Wireless Telecommunication Services–3.06% | ||||||||
Sprint Corp.(b)(c) | 54,818,435 | 307,531,420 | ||||||
Total Common Stocks & Other Equity Interests (Cost $6,929,925,397) |
| 9,977,615,757 | ||||||
Money Market Funds–0.89% |
| |||||||
Liquid Assets Portfolio–Institutional Class(d) | 44,823,396 | 44,823,396 | ||||||
Premier Portfolio–Institutional Class(d) | 44,823,396 | 44,823,396 | ||||||
Total Money Market Funds | 89,646,792 | |||||||
TOTAL INVESTMENTS (excluding investments purchased with cash collateral from securities on loan)–100.05% (Cost $7,019,572,189) |
| 10,067,262,549 | ||||||
Investments Purchased with Cash Collateral from Securities on |
| |||||||
| Money Market Funds–0.48% | ||||||||
Liquid Assets Portfolio—Institutional Class (Cost $47,941,171)(d)(e) | 47,941,171 | 47,941,171 | ||||||
TOTAL INVESTMENTS–100.53% |
| 10,115,203,720 | ||||||
OTHER ASSETS LESS LIABILITIES–(0.53)% |
| (53,551,436 | ) | |||||
NET ASSETS–100.00% |
| $ | 10,061,652,284 | |||||
Investment Abbreviations:
| ADR | – American Depositary Receipt | |
| REIT | – Real Estate Investment Trust |
Notes to Schedule of Investments:
| (a) | Industry and/or sector classifications used in this report are generally according to the Global Industry Classification Standard, which was developed by and is the exclusive property and a service mark of MSCI Inc. and Standard & Poor’s. |
| (b) | Non-income producing security. |
| (c) | All or a portion of this security was out on loan at August 31, 2014. |
| (d) | The money market fund and the Fund are affiliated by having the same investment adviser. |
| (e) | The security has been segregated to satisfy the commitment to return the cash collateral received in securities lending transactions upon the borrower’s return of the securities loaned. See Note 1I. The following table presents the Fund’s gross and net amount of assets available for offset by the Fund as of August 31, 2014. |
| Counterparty | Gross Amount on Loan at | Cash Collateral Received for Securities Loaned* | Net Amount | |||||||||
State Street Bank and Trust Co | $ | 45,550,574 | $ | (45,550,574 | ) | $ | — | |||||
| * | Amount does not include excess collateral received. |
See accompanying Notes to Financial Statements which are an integral part of the financial statements.
10 Invesco American Franchise Fund
Statement of Assets and Liabilities
August 31, 2014
Assets: |
| |||
Investments, at value (Cost $6,929,925,397)* | $ | 9,977,615,757 | ||
Investments in affiliated money market funds, at value and cost | 137,587,963 | |||
Total investments, at value (Cost $7,067,513,360) | 10,115,203,720 | |||
Receivable for: | ||||
Investments sold | 12,807,884 | |||
Fund shares sold | 2,839,957 | |||
Dividends | 6,761,368 | |||
Investment for trustee deferred compensation and retirement plans | 2,652,965 | |||
Other assets | 210,071 | |||
Total assets | 10,140,475,965 | |||
Liabilities: |
| |||
Payable for: | ||||
Investments purchased | 13,812,383 | |||
Fund shares reacquired | 7,245,032 | |||
Collateral upon return of securities loaned | 47,941,171 | |||
Accrued fees to affiliates | 6,338,228 | |||
Accrued trustees’ and officers’ fees and benefits | 19,578 | |||
Accrued other operating expenses | 392,785 | |||
Trustee deferred compensation and retirement plans | 3,074,504 | |||
Total liabilities | 78,823,681 | |||
Net assets applicable to shares outstanding | $ | 10,061,652,284 | ||
Net assets consist of: |
| |||
Shares of beneficial interest | $ | 6,603,432,578 | ||
Undistributed net investment income (loss) | (23,695,349 | ) | ||
Undistributed net realized gain | 434,223,662 | |||
Net unrealized appreciation | 3,047,691,393 | |||
| $ | 10,061,652,284 | |||
Net Assets: |
| |||
Class A | $ | 9,034,217,316 | ||
Class B | $ | 247,220,211 | ||
Class C | $ | 417,686,796 | ||
Class R | $ | 31,760,050 | ||
Class Y | $ | 141,094,450 | ||
Class R5 | $ | 52,164,184 | ||
Class R6 | $ | 137,509,277 | ||
Shares outstanding, $0.01 par value per share, |
| |||
Class A | 500,090,145 | |||
Class B | 14,002,611 | |||
Class C | 24,090,905 | |||
Class R | 1,771,238 | |||
Class Y | 7,742,371 | |||
Class R5 | 2,866,092 | |||
Class R6 | 7,546,961 | |||
Class A: | ||||
Net asset value and offering price per share | $ | 18.07 | ||
Maximum offering price per share | ||||
(Net asset value of $18.07 ¸ 94.50%) | $ | 19.12 | ||
Class B: | ||||
Net asset value and offering price per share | $ | 17.66 | ||
Class C: | ||||
Net asset value and offering price per share | $ | 17.34 | ||
Class R: | ||||
Net asset value and offering price per share | $ | 17.93 | ||
Class Y: | ||||
Net asset value and offering price per share | $ | 18.22 | ||
Class R5: | ||||
Net asset value and offering price per share | $ | 18.20 | ||
Class R6: | ||||
Net asset value and offering price per share | $ | 18.22 | ||
| * | At August 31, 2014, securities with an aggregate value of $45,550,574 were on loan to brokers. |
See accompanying Notes to Financial Statements which are an integral part of the financial statements.
11 Invesco American Franchise Fund
Statement of Operations
For the year ended August 31, 2014
Investment income: |
| |||
Dividends (net of foreign withholding taxes of $472,771) | $ | 77,747,720 | ||
Dividends from affiliated money market funds (includes securities lending income of $240,009) | 279,992 | |||
Total investment income | 78,027,712 | |||
Expenses: | ||||
Advisory fees | 56,513,516 | |||
Administrative services fees | 768,047 | |||
Custodian fees | 211,547 | |||
Distribution fees: | ||||
Class A | 21,450,208 | |||
Class B | 688,264 | |||
Class C | 3,988,549 | |||
Class R | 150,151 | |||
Transfer agent fees — A, B, C, R and Y | 19,648,229 | |||
Transfer agent fees — R5 | 50,938 | |||
Transfer agent fees — R6 | 5,615 | |||
Trustees’ and officers’ fees and benefits | 300,181 | |||
Other | 1,920,750 | |||
Total expenses | 105,695,995 | |||
Less: Fees waived and expense offset arrangement(s) | (175,618 | ) | ||
Net expenses | 105,520,377 | |||
Net investment income (loss) | (27,492,665 | ) | ||
Realized and unrealized gain (loss) from: | ||||
Net realized gain (loss) from: | ||||
Investment securities (includes net gains from securities sold to affiliates of $3,097,948) | 1,356,716,659 | |||
Foreign currencies | (95,233 | ) | ||
| 1,356,621,426 | ||||
Change in net unrealized appreciation (depreciation) of: | ||||
Investment securities | 853,805,909 | |||
Foreign currencies | (392 | ) | ||
| 853,805,517 | ||||
Net realized and unrealized gain | 2,210,426,943 | |||
Net increase in net assets resulting from operations | $ | 2,182,934,278 | ||
See accompanying Notes to Financial Statements which are an integral part of the financial statements.
12 Invesco American Franchise Fund
Statement of Changes in Net Assets
For the years ended August 31, 2014 and 2013
| 2014 | 2013 | |||||||
Operations: |
| |||||||
Net investment income (loss) | $ | (27,492,665 | ) | $ | 8,543,462 | |||
Net realized gain | 1,356,621,426 | 787,954,544 | ||||||
Change in net unrealized appreciation | 853,805,517 | 189,234,461 | ||||||
Net increase in net assets resulting from operations | 2,182,934,278 | 985,732,467 | ||||||
Distributions to shareholders from net investment income: | ||||||||
Class A | (8,146,047 | ) | (1,680,357 | ) | ||||
Class B | (284,805 | ) | (88,298 | ) | ||||
Class Y | (287,210 | ) | (269,635 | ) | ||||
Class R5 | (126,411 | ) | (655,036 | ) | ||||
Class R6 | (414,675 | ) | (545,579 | ) | ||||
Total distributions from net investment income | (9,259,148 | ) | (3,238,905 | ) | ||||
Distributions to shareholders from net realized gains: | ||||||||
Class A | (349,819,587 | ) | — | |||||
Class B | (12,230,508 | ) | — | |||||
Class C | (16,851,639 | ) | — | |||||
Class R | (1,234,648 | ) | — | |||||
Class Y | (4,914,966 | ) | — | |||||
Class R5 | (1,888,689 | ) | — | |||||
Class R6 | (5,092,450 | ) | — | |||||
Total distributions from net realized gains | (392,032,487 | ) | — | |||||
Share transactions–net: | ||||||||
Class A | 2,022,415,364 | (135,809,151 | ) | |||||
Class B | (32,429,104 | ) | (87,558,797 | ) | ||||
Class C | 74,675,675 | (22,109,739 | ) | |||||
Class R | 6,673,587 | (2,317,486 | ) | |||||
Class Y | 25,320,157 | (22,131,891 | ) | |||||
Class R5 | (119,562,564 | ) | (181,966,427 | ) | ||||
Class R6 | (1,645,431 | ) | 99,950,199 | |||||
Net increase (decrease) in net assets resulting from share transactions | 1,975,447,684 | (351,943,292 | ) | |||||
Net increase in net assets | 3,757,090,327 | 630,550,270 | ||||||
Net assets: | ||||||||
Beginning of year | 6,304,561,957 | 5,674,011,687 | ||||||
End of year (includes undistributed net investment income (loss) of $(23,695,349) and $8,309,634, respectively) | $ | 10,061,652,284 | $ | 6,304,561,957 | ||||
Notes to Financial Statements
August 31, 2014
NOTE 1—Significant Accounting Policies
Invesco American Franchise Fund (the “Fund”) is a series portfolio of AIM Counselor Series Trust (Invesco Counselor Series Trust) (the “Trust”). The Trust is a Delaware statutory trust registered under the Investment Company Act of 1940, as amended (the “1940 Act”), as an open-end series management investment company consisting of thirteen separate portfolios, each authorized to issue an unlimited number of shares of beneficial interest. The assets, liabilities and operations of each portfolio are accounted for separately. Information presented in these financial statements pertains only to the Fund. Matters affecting each portfolio or class will be voted on exclusively by the shareholders of such portfolio or class.
The Fund’s investment objective is to seek long-term capital appreciation.
The Fund currently consists of seven different classes of shares: Class A, Class B, Class C, Class R, Class Y, Class R5 and Class R6. Class A shares are sold with a front-end sales charge unless certain waiver criteria are met and under certain circumstances load waived shares may be subject to contingent deferred sales charges (“CDSC”). Class C shares are sold with a CDSC. Class R, Class Y, Class R5 and Class R6 shares are sold at net asset value. Effective November 30, 2010, new or additional investments in Class B shares are no longer permitted. Existing shareholders of Class B shares
13 Invesco American Franchise Fund
may continue to reinvest dividends and capital gains distributions in Class B shares until they convert to Class A shares. Also, shareholders in Class B shares will be able to exchange those shares for Class B shares of other Invesco Funds offering such shares until they convert to Class A shares. Generally, Class B shares will automatically convert to Class A shares on or about the month-end, which is at least eight years after the date of purchase. Redemption of Class B shares prior to the conversion date will be subject to a CDSC.
The following is a summary of the significant accounting policies followed by the Fund in the preparation of its financial statements.
| A. | Security Valuations — Securities, including restricted securities, are valued according to the following policy. |
A security listed or traded on an exchange (except convertible securities) is valued at its last sales price or official closing price as of the close of the customary trading session on the exchange where the security is principally traded, or lacking any sales or official closing price on a particular day, the security may be valued at the closing bid price on that day. Securities traded in the over-the-counter market are valued based on prices furnished by independent pricing services or market makers. When such securities are valued by an independent pricing service they may be considered fair valued. Futures contracts are valued at the final settlement price set by an exchange on which they are principally traded. Listed options are valued at the mean between the last bid and ask prices from the exchange on which they are principally traded. Options not listed on an exchange are valued by an independent source at the mean between the last bid and ask prices. For purposes of determining net asset value per share, futures and option contracts generally are valued 15 minutes after the close of the customary trading session of the New York Stock Exchange (“NYSE”).
Investments in open-end and closed-end registered investment companies that do not trade on an exchange are valued at the end of day net asset value per share. Investments in open-end and closed-end registered investment companies that trade on an exchange are valued at the last sales price or official closing price as of the close of the customary trading session on the exchange where the security is principally traded.
Debt obligations (including convertible securities) and unlisted equities are fair valued using an evaluated quote provided by an independent pricing service. Evaluated quotes provided by the pricing service may be determined without exclusive reliance on quoted prices, and may reflect appropriate factors such as institution-size trading in similar groups of securities, developments related to specific securities, dividend rate (for unlisted equities), yield (for debt obligations), quality, type of issue, coupon rate (for debt obligations), maturity (for debt obligations), individual trading characteristics and other market data. Debt obligations are subject to interest rate and credit risks. In addition, all debt obligations involve some risk of default with respect to interest and/or principal payments.
Foreign securities’ (including foreign exchange contracts) prices are converted into U.S. dollar amounts using the applicable exchange rates as of the close of the NYSE. If market quotations are available and reliable for foreign exchange-traded equity securities, the securities will be valued at the market quotations. Because trading hours for certain foreign securities end before the close of the NYSE, closing market quotations may become unreliable. If between the time trading ends on a particular security and the close of the customary trading session on the NYSE, events occur that the Adviser determines are significant and make the closing price unreliable, the Fund may fair value the security. If the event is likely to have affected the closing price of the security, the security will be valued at fair value in good faith using procedures approved by the Board of Trustees. Adjustments to closing prices to reflect fair value may also be based on a screening process of an independent pricing service to indicate the degree of certainty, based on historical data, that the closing price in the principal market where a foreign security trades is not the current value as of the close of the NYSE. Foreign securities’ prices meeting the approved degree of certainty that the price is not reflective of current value will be priced at the indication of fair value from the independent pricing service. Multiple factors may be considered by the independent pricing service in determining adjustments to reflect fair value and may include information relating to sector indices, American Depositary Receipts and domestic and foreign index futures. Foreign securities may have additional risks including exchange rate changes, potential for sharply devalued currencies and high inflation, political and economic upheaval, the relative lack of issuer information, relatively low market liquidity and the potential lack of strict financial and accounting controls and standards.
Securities for which market prices are not provided by any of the above methods may be valued based upon quotes furnished by independent sources. The last bid price may be used to value equity securities. The mean between the last bid and asked prices is used to value debt obligations, including corporate loans.
Securities for which market quotations are not readily available or became unreliable are valued at fair value as determined in good faith by or under the supervision of the Trust’s officers following procedures approved by the Board of Trustees. Issuer specific events, market trends, bid/ask quotes of brokers and information providers and other market data may be reviewed in the course of making a good faith determination of a security’s fair value.
The Fund may invest in securities that are subject to interest rate risk, meaning the risk that the prices will generally fall as interest rates rise and, conversely, the prices will generally rise as interest rates fall. Specific securities differ in their sensitivity to changes in interest rates depending on their individual characteristics. Changes in interest rates may result in increased market volatility, which may affect the value and/or liquidity of certain of the Fund’s investments.
Valuations change in response to many factors including the historical and prospective earnings of the issuer, the value of the issuer’s assets, general economic conditions, interest rates, investor perceptions and market liquidity. Because of the inherent uncertainties of valuation, the values reflected in the financial statements may materially differ from the value received upon actual sale of those investments.
| B. | Securities Transactions and Investment Income — Securities transactions are accounted for on a trade date basis. Realized gains or losses on sales are computed on the basis of specific identification of the securities sold. Interest income (net of withholding tax, if any) is recorded on the accrual basis from settlement date. Dividend income (net of withholding tax, if any) is recorded on the ex-dividend date. |
The Fund may periodically participate in litigation related to Fund investments. As such, the Fund may receive proceeds from litigation settlements. Any proceeds received are included in the Statement of Operations as realized gain (loss) for investments no longer held and as unrealized gain (loss) for investments still held.
Brokerage commissions and mark ups are considered transaction costs and are recorded as an increase to the cost basis of securities purchased and/or a reduction of proceeds on a sale of securities. Such transaction costs are included in the determination of net realized and unrealized gain (loss) from investment securities reported in the Statement of Operations and the Statement of Changes in Net Assets and the net realized and unrealized gains (losses) on securities per share in the Financial Highlights. Transaction costs are included in the calculation of the Fund’s net asset value and, accordingly, they reduce the Fund’s total returns. These transaction costs are not considered operating expenses and are not reflected in net investment income reported in the Statement of Operations and Statement of Changes in Net Assets, or the net investment
14 Invesco American Franchise Fund
income per share and ratios of expenses and net investment income reported in the Financial Highlights, nor are they limited by any expense limitation arrangements between the Fund and the investment adviser.
The Fund allocates income and realized and unrealized capital gains and losses to a class based on the relative net assets of each class.
| C. | Country Determination — For the purposes of making investment selection decisions and presentation in the Schedule of Investments, the investment adviser may determine the country in which an issuer is located and/or credit risk exposure based on various factors. These factors include the laws of the country under which the issuer is organized, where the issuer maintains a principal office, the country in which the issuer derives 50% or more of its total revenues and the country that has the primary market for the issuer’s securities, as well as other criteria. Among the other criteria that may be evaluated for making this determination are the country in which the issuer maintains 50% or more of its assets, the type of security, financial guarantees and enhancements, the nature of the collateral and the sponsor organization. Country of issuer and/or credit risk exposure has been determined to be the United States of America, unless otherwise noted. |
| D. | Distributions — Distributions from net investment income and net realized capital gain, if any, are generally declared and paid annually and recorded on the ex-dividend date. The Fund may elect to treat a portion of the proceeds from redemptions as distributions for federal income tax purposes. |
| E. | Federal Income Taxes — The Fund intends to comply with the requirements of Subchapter M of the Internal Revenue Code of 1986, as amended (the “Internal Revenue Code”), necessary to qualify as a regulated investment company and to distribute substantially all of the Fund’s taxable earnings to shareholders. As such, the Fund will not be subject to federal income taxes on otherwise taxable income (including net realized capital gain) that is distributed to shareholders. Therefore, no provision for federal income taxes is recorded in the financial statements. |
The Fund recognizes the tax benefits of uncertain tax positions only when the position is more likely than not to be sustained. Management has analyzed the Fund’s uncertain tax positions and concluded that no liability for unrecognized tax benefits should be recorded related to uncertain tax positions. Management is not aware of any tax positions for which it is reasonably possible that the total amounts of unrecognized tax benefits will change materially in the next 12 months.
The Fund files tax returns in the U.S. Federal jurisdiction and certain other jurisdictions. Generally, the Fund is subject to examinations by such taxing authorities for up to three years after the filing of the return for the tax period.
| F. | Expenses — Fees provided for under the Rule 12b-1 plan of a particular class of the Fund are charged to the operations of such class. Transfer agency fees and expenses and other shareholder recordkeeping fees and expenses attributable to Class R5 and Class R6 are allocated to each share class based on relative net assets. Sub-accounting fees attributable to Class R5 are charged to the operations of the class. Transfer agency fees and expenses and other shareholder recordkeeping fees and expenses relating to all other classes are allocated among those classes based on relative net assets. All other expenses are allocated among the classes based on relative net assets. Prior to June 1, 2010, incremental transfer agency fees which were unique to each class of shares were charged to the operations of such class. |
| G. | Accounting Estimates — The preparation of financial statements in conformity with accounting principles generally accepted in the United States of America (“GAAP”) requires management to make estimates and assumptions that affect the reported amounts of assets and liabilities at the date of the financial statements and the reported amounts of revenues and expenses during the reporting period including estimates and assumptions related to taxation. Actual results could differ from those estimates by a significant amount. In addition, the Fund monitors for material events or transactions that may occur or become known after the period-end date and before the date the financial statements are released to print. |
| H. | Indemnifications — Under the Trust’s organizational documents, each Trustee, officer, employee or other agent of the Trust is indemnified against certain liabilities that may arise out of the performance of their duties to the Fund. Additionally, in the normal course of business, the Fund enters into contracts, including the Fund’s servicing agreements, that contain a variety of indemnification clauses. The Fund’s maximum exposure under these arrangements is unknown as this would involve future claims that may be made against the Fund that have not yet occurred. The risk of material loss as a result of such indemnification claims is considered remote. |
| I. | Securities Lending — The Fund may lend portfolio securities having a market value up to one-third of the Fund’s total assets. Such loans are secured by collateral equal to no less than the market value of the loaned securities determined daily by the securities lending provider. Such collateral will be cash or debt securities issued or guaranteed by the U.S. Government or any of its sponsored agencies. Cash collateral received in connection with these loans is invested in short-term money market instruments or affiliated money market funds and is shown as such on the Schedule of Investments. It is the Fund’s policy to obtain additional collateral from or return excess collateral to the borrower by the end of the next business day, following the valuation date of the securities loaned. Therefore, the value of the collateral held may be temporarily less than the value of the securities on loan. Lending securities entails a risk of loss to the Fund if, and to the extent that, the market value of the securities loaned were to increase and the borrower did not increase the collateral accordingly, and the borrower failed to return the securities. Upon the failure of the borrower to return the securities, collateral may be liquidated and the securities may be purchased on the open market to replace the loaned securities. The Fund could experience delays and costs in gaining access to the collateral. The Fund bears the risk of any deficiency in the amount of the collateral available for return to the borrower due to any loss on the collateral invested. Dividends received on cash collateral investments for securities lending transactions, which are net of compensation to counterparties, is included in Dividends from affiliated money market funds on the Statement of Operations. The aggregate value of securities out on loan is shown as a footnote on the Statement of Assets and Liabilities, if any. |
| J. | Foreign Currency Translations — Foreign currency is valued at the close of the NYSE based on quotations posted by banks and major currency dealers. Portfolio securities and other assets and liabilities denominated in foreign currencies are translated into U.S. dollar amounts at date of valuation. Purchases and sales of portfolio securities (net of foreign taxes withheld on disposition) and income items denominated in foreign currencies are translated into U.S. dollar amounts on the respective dates of such transactions. The Fund does not separately account for the portion of the results of operations resulting from changes in foreign exchange rates on investments and the fluctuations arising from changes in market prices of securities held. The combined results of changes in foreign exchange rates and the fluctuation of market prices on investments (net of estimated foreign tax withholding) are included with the net realized and unrealized gain or loss from investments in the Statement of Operations. Reported net realized foreign currency gains or losses arise from (1) sales of foreign currencies, (2) currency gains or losses realized between the trade and settlement dates on securities transactions, and (3) the difference between the amounts of dividends, interest, and foreign withholding taxes recorded on the Fund’s books and the U.S. dollar equivalent of the amounts actually received or paid. Net |
15 Invesco American Franchise Fund
| unrealized foreign currency gains and losses arise from changes in the fair values of assets and liabilities, other than investments in securities at fiscal period end, resulting from changes in exchange rates. |
The Fund may invest in foreign securities, which may be subject to foreign taxes on income, gains on investments or currency repatriation, a portion of which may be recoverable. Foreign taxes, if any, are recorded based on the tax regulations and rates that exist in the foreign markets in which the Fund invests and are shown in the Statement of Operations.
| K. | Forward Foreign Currency Contracts — The Fund may engage in foreign currency transactions either on a spot (i.e. for prompt delivery and settlement) basis at the rate prevailing in the currency exchange market at the time or through forward foreign currency contracts to manage or minimize currency or exchange rate risk. |
The Fund may also enter into forward foreign currency contracts for the purchase or sale of a security denominated in a foreign currency in order to “lock in” the U.S. dollar price of that security, or the Fund may also enter into forward foreign currency contracts that do not provide for physical settlement of the two currencies, but instead are settled by a single cash payment calculated as the difference between the agreed upon exchange rate and the spot rate at settlement based upon an agreed upon notional amount (non-deliverable forwards). The Fund will set aside liquid assets in an amount equal to daily mark-to-market obligation for forward foreign currency contracts.
A forward foreign currency contract is an obligation to purchase or sell a specific currency for an agreed-upon price at a future date. The use of forward foreign currency contracts does not eliminate fluctuations in the price of the underlying securities the Fund owns or intends to acquire but establishes a rate of exchange in advance. Fluctuations in the value of these contracts are measured by the difference in the contract date and reporting date exchange rates and are recorded as unrealized appreciation (depreciation) until the contracts are closed. When the contracts are closed, realized gains (losses) are recorded. Realized and unrealized gains (losses) on the contracts are included in the Statement of Operations. The primary risks associated with forward foreign currency contracts include failure of the counterparty to meet the terms of the contract and the value of the foreign currency changing unfavorably. These risks may be in excess of the amounts reflected in the Statement of Assets and Liabilities.
NOTE 2—Advisory Fees and Other Fees Paid to Affiliates
The Trust has entered into a master investment advisory agreement with Invesco Advisers, Inc. (the “Adviser” or “Invesco”). Under the terms of the investment advisory agreement, the Fund pays an advisory fee to the Adviser based on the annual rate of the Fund’s average daily net assets as follows:
| Average Daily Net Assets | Rate | |||||
First $250 million | 0 | .695% | ||||
Next $250 million | 0 | .67% | ||||
Next $500 million | 0 | .645% | ||||
Next $550 million | 0 | .62% | ||||
Next $3.45 billion | 0 | .60% | ||||
Next $250 million | 0 | .595% | ||||
Next $2.25 billion | 0 | .57% | ||||
Next $2.5 billion | 0 | .545% | ||||
Over $10 billion | 0 | .52% | ||||
Under the terms of a master sub-advisory agreement between the Adviser and each of Invesco Asset Management Deutschland GmbH, Invesco Asset Management Limited, Invesco Asset Management (Japan) Limited, Invesco Australia Limited, Invesco Hong Kong Limited, Invesco Senior Secured Management, Inc. and Invesco Canada Ltd. (collectively, the “Affiliated Sub-Advisers”) the Adviser, not the Fund, may pay 40% of the fees paid to the Adviser to any such Affiliated Sub-Adviser(s) that provide(s) discretionary investment management services to the Fund based on the percentage of assets allocated to such Sub-Adviser(s).
The Adviser has contractually agreed, through at least June 30, 2015, to waive advisory fees and/or reimburse expenses of all shares to the extent necessary to limit total annual fund operating expenses after fee waiver and/or expense reimbursement (excluding certain items discussed below) of Class A, Class B, Class C, Class R, Class Y, Class R5 and Class R6 shares to 2.00%, 2.75%, 2.75%, 2.25%, 1.75%, 1.75% and 1.75%, respectively, of average daily net assets. In determining the Adviser’s obligation to waive advisory fees and/or reimburse expenses, the following expenses are not taken into account, and could cause the total annual fund operating expenses after fee waiver and/or expense reimbursement to exceed the numbers reflected above: (1) interest; (2) taxes; (3) dividend expense on short sales; (4) extraordinary or non-routine items, including litigation expenses; and (5) expenses that the Fund has incurred but did not actually pay because of an expense offset arrangement. Unless Invesco continues the fee waiver agreement, it will terminate on June 30, 2015. The fee waiver agreement cannot be terminated during its term. The Adviser did not waive fees and/or reimburse expenses during the period under this expense limitation.
Further, the Adviser has contractually agreed, through at least June 30, 2016, to waive the advisory fee payable by the Fund in an amount equal to 100% of the net advisory fees the Adviser receives from the affiliated money market funds on investments by the Fund of uninvested cash (excluding investments of cash collateral from securities lending) in such affiliated money market funds.
For the year ended August 31, 2014, the Adviser waived advisory fees of $128,671.
The Trust has entered into a master administrative services agreement with Invesco pursuant to which the Fund has agreed to pay Invesco for certain administrative costs incurred in providing accounting services to the Fund. For the year ended August 31, 2014, expenses incurred under the agreement are shown in the Statement of Operations as Administrative services fees.
The Trust has entered into a transfer agency and service agreement with Invesco Investment Services, Inc. (“IIS”) pursuant to which the Fund has agreed to pay IIS a fee for providing transfer agency and shareholder services to the Fund and reimburse IIS for certain expenses incurred by IIS in the course of providing such services. IIS may make payments to intermediaries that provide omnibus account services, sub-accounting services and/or networking services. All fees payable by IIS to intermediaries that provide omnibus account services or sub-accounting are charged back to the Fund,
16 Invesco American Franchise Fund
subject to certain limitations approved by the Trust’s Board of Trustees. For the year ended August 31, 2014, expenses incurred under the agreement are shown in the Statement of Operations as Transfer agent fees.
Shares of the Fund are distributed by Invesco Distributors, Inc. (“IDI”). The Fund has adopted a distribution plan pursuant to Rule 12b-1 under the 1940 Act, and a service plan (collectively, the “Plans”) for Class A, Class B, Class C and Class R shares to compensate IDI for the sale, distribution, shareholder servicing and maintenance of shareholder accounts for these shares. Under the Plans, the Fund will incur annual fees of up to 0.25% of Class A average daily net assets, up to 1.00% each of Class B and Class C average daily net assets and up to 0.50% of Class R average daily net assets.
With respect to Class B and Class C shares, the Fund is authorized to reimburse in future years any distribution related expenses that exceed the maximum annual reimbursement rate for such class, so long as such reimbursement does not cause the Fund to exceed the Class B and Class C maximum annual reimbursement rate, respectively. With respect to Class A shares, distribution related expenses that exceed the maximum annual reimbursement rate for such class are not carried forward to future years and the Fund will not reimburse IDI for any such expenses.
Front-end sales commissions and CDSC (collectively, the “sales charges”) are not recorded as expenses of the Fund. Front-end sales commissions are deducted from proceeds from the sales of Fund shares prior to investment in Class A shares of the Fund. CDSC are deducted from redemption proceeds prior to remittance to the shareholder. During the year ended August 31, 2014, IDI advised the Fund that IDI retained $562,386 in front-end sales commissions from the sale of Class A shares and $13,451, $100,479 and $9,834 from Class A, Class B and Class C shares, respectively, for CDSC imposed on redemptions by shareholders.
For the year ended August 31, 2014, the Fund incurred $81,896 in brokerage commissions with Invesco Capital Markets, Inc., an affiliate of the Adviser and IDI, for portfolio transactions executed on behalf of the Fund.
Certain officers and trustees of the Trust are officers and directors of the Adviser, IIS and/or IDI.
NOTE 3—Additional Valuation Information
GAAP defines fair value as the price that would be received to sell an asset or paid to transfer a liability in an orderly transaction between market participants at the measurement date, under current market conditions. GAAP establishes a hierarchy that prioritizes the inputs to valuation methods, giving the highest priority to readily available unadjusted quoted prices in an active market for identical assets (Level 1) and the lowest priority to significant unobservable inputs (Level 3), generally when market prices are not readily available or are unreliable. Based on the valuation inputs, the securities or other investments are tiered into one of three levels. Changes in valuation methods may result in transfers in or out of an investment’s assigned level:
| Level 1 — | Prices are determined using quoted prices in an active market for identical assets. |
| Level 2 — | Prices are determined using other significant observable inputs. Observable inputs are inputs that other market participants may use in pricing a security. These may include quoted prices for similar securities, interest rates, prepayment speeds, credit risk, yield curves, loss severities, default rates, discount rates, volatilities and others. |
| Level 3 — | Prices are determined using significant unobservable inputs. In situations where quoted prices or observable inputs are unavailable (for example, when there is little or no market activity for an investment at the end of the period), unobservable inputs may be used. Unobservable inputs reflect the Fund’s own assumptions about the factors market participants would use in determining fair value of the securities or instruments and would be based on the best available information. |
As of August 31, 2014, all of the securities in this Fund were valued based on Level 1 inputs (see the Schedule of Investments for security categories). The level assigned to the securities valuations may not be an indication of the risk or liquidity associated with investing in those securities. Because of the inherent uncertainties of valuation, the values reflected in the financial statements may materially differ from the value received upon actual sale of those investments.
NOTE 4—Trustees’ and Officers’ Fees and Benefits
Trustees’ and Officers’ Fees and Benefits include amounts accrued by the Fund to pay remuneration to certain Trustees and Officers of the Fund. Trustees have the option to defer compensation payable by the Fund, and Trustees’ and Officers’ Fees and Benefits also include amounts accrued by the Fund to fund such deferred compensation amounts. Those Trustees who defer compensation have the option to select various Invesco Funds in which their deferral accounts shall be deemed to be invested. Finally, certain current Trustees were eligible to participate in a retirement plan that provided for benefits to be paid upon retirement to Trustees over a period of time based on the number of years of service. The Fund may have certain former Trustees who also participate in a retirement plan and receive benefits under such plan. Trustees’ and Officers’ Fees and Benefits include amounts accrued by the Fund to fund such retirement benefits. Obligations under the deferred compensation and retirement plans represent unsecured claims against the general assets of the Fund.
NOTE 5—Security Transactions with Affiliated Funds
The Fund is permitted to purchase or sell securities from or to certain other Invesco Funds under specified conditions outlined in procedures adopted by the Board of Trustees of the Trust. The procedures have been designed to ensure that any purchase or sale of securities by the Fund from or to another fund or portfolio that is or could be considered an affiliate by virtue of having a common investment adviser (or affiliated investment advisers), common Trustees and/or common officers complies with Rule 17a-7 of the 1940 Act. Further, as defined under the procedures, each transaction is effected at the current market price. Pursuant to these procedures, for the year ended August 31, 2014, the Fund engaged in securities purchases of $29,627,274 and securities sales of $32,005,130, which resulted in net realized gains of $3,097,948.
NOTE 6—Expense Offset Arrangement(s)
The expense offset arrangement is comprised of transfer agency credits which result from balances in demand deposit accounts used by the transfer agent for clearing shareholder transactions. For the year ended August 31, 2014, the Fund received credits from this arrangement, which resulted in the reduction of the Fund’s total expenses of $46,947.
17 Invesco American Franchise Fund
NOTE 7—Cash Balances
The Fund is permitted to temporarily carry a negative or overdrawn balance in its account with State Street Bank and Trust Company, the custodian bank. Such balances, if any at period end, are shown in the Statement of Assets and Liabilities under the payable caption Amount due custodian. To compensate the custodian bank for such overdrafts, the overdrawn Fund may either (1) leave funds as a compensating balance in the account so the custodian bank can be compensated by earning the additional interest; or (2) compensate by paying the custodian bank at a rate agreed upon by the custodian bank and Invesco, not to exceed the contractually agreed upon rate.
NOTE 8—Distributions to Shareholders and Tax Components of Net Assets
Tax Character of Distributions to Shareholders Paid During the Years Ended August 31, 2014 and 2013:
| 2014 | 2013 | |||||||
Ordinary income | $ | 9,609,951 | $ | 3,238,905 | ||||
Long-term capital gain | 391,681,684 | — | ||||||
Total distributions | $ | 401,291,635 | $ | 3,238,905 | ||||
Tax Components of Net Assets at Period-End:
| 2014 | ||||
Undistributed long-term gain | $ | 830,391,594 | ||
Net unrealized appreciation — investments | 3,037,697,961 | |||
Net unrealized appreciation — other investments | 1,033 | |||
Temporary book/tax differences | (2,782,318 | ) | ||
Capital loss carryforward | (386,175,533 | ) | ||
Late-Year ordinary loss deferral | (20,913,031 | ) | ||
Shares of beneficial interest | 6,603,432,578 | |||
Total net assets | $ | 10,061,652,284 | ||
The difference between book-basis and tax-basis unrealized appreciation is due to differences in the timing of recognition of gains and losses on investments for tax and book purposes. The Fund’s net unrealized appreciation difference is attributable primarily to wash sales.
The temporary book/tax differences are a result of timing differences between book and tax recognition of income and/or expenses. The Fund’s temporary book/tax differences are the result of the trustee deferral of compensation and retirement plan benefits.
Capital loss carryforward is calculated and reported as of a specific date. Results of transactions and other activity after that date may affect the amount of capital loss carryforward actually available for the Fund to utilize. Capital losses generated in years beginning after December 22, 2010 can be carried forward for an unlimited period, whereas previous losses expire in 8 tax years. Capital losses with an expiration period may not be used to offset capital gains until all net capital losses without an expiration date have been utilized. Capital loss carryforwards with no expiration date will retain their character as either short-term or long-term capital losses instead of as short-term capital losses as under prior law. The ability to utilize capital loss carryforward in the future may be limited under the Internal Revenue Code and related regulations based on the results of future transactions.
The Fund utilized $401,038,463 of capital loss carryforward in the current period to offset net realized capital gain for federal income tax purposes. The Fund has a capital loss carryforward as of August 31, 2014, which expires as follows:
| Capital Loss Carryforward* | ||||||||||||
| Expiration | Short-Term | Long-Term | Total | |||||||||
August 31, 2015 | $ | 967,126 | $ | — | $ | 967,126 | ||||||
August 31, 2016 | 2,612,897 | — | 2,612,897 | |||||||||
August 31, 2017 | 382,595,510 | — | 382,595,510 | |||||||||
| $ | 386,175,533 | $ | — | $ | 386,175,533 | |||||||
| * | Capital loss carryforward as of the date listed above is reduced for limitations, if any, to the extent required by the Internal Revenue Code and may be further limited depending upon a variety of factors, including the realization of net unrealized gains or losses as of the date of any reorganization. |
NOTE 9—Investment Securities
The aggregate amount of investment securities (other than short-term securities, U.S. Treasury obligations and money market funds, if any) purchased and sold by the Fund during the year ended August 31, 2014 was $6,343,286,149 and $5,889,529,409, respectively. Cost of investments on a tax basis includes the adjustments for financial reporting purposes as of the most recently completed federal income tax reporting period-end.
| Unrealized Appreciation (Depreciation) of Investment Securities on a Tax Basis | ||||
Aggregate unrealized appreciation of investment securities | $ | 3,151,698,680 | ||
Aggregate unrealized (depreciation) of investment securities | (114,000,719 | ) | ||
Net unrealized appreciation of investment securities | $ | 3,037,697,961 | ||
Cost of investments for tax purposes is $7,077,505,759.
18 Invesco American Franchise Fund
NOTE 10—Reclassification of Permanent Differences
Primarily as a result of differing book/tax treatment of net operating losses, on August 31, 2014, undistributed net investment income (loss) was increased by $6,821,423, undistributed net realized gain was increased by $185,409 and shares of beneficial interest was decreased by $7,006,832.
Further, as a result of capital loss carryforwards acquired in the reorganization of Invesco Constellation Fund into the Fund, undistributed net investment income (loss) was decreased by $2,074,593, undistributed net realized gain was decreased by $740,421,229 and shares of beneficial interest was increased by $742,495,822. These reclassifications had no effect on the net assets of the Fund.
NOTE 11—Share Information
| Summary of Share Activity | ||||||||||||||||
| Years ended August 31, | ||||||||||||||||
| 2014(a) | 2013 | |||||||||||||||
| Shares | Amount | Shares | Amount | |||||||||||||
Sold: | ||||||||||||||||
Class A | 13,434,382 | $ | 224,500,898 | 9,792,627 | $ | 131,507,521 | ||||||||||
Class B | 194,996 | 3,185,824 | 136,087 | 1,766,668 | ||||||||||||
Class C | 1,375,112 | 22,116,190 | 1,034,373 | 13,366,766 | ||||||||||||
Class R | 288,299 | 4,772,689 | 251,276 | 3,336,107 | ||||||||||||
Class Y | 2,508,529 | 42,978,258 | 1,654,188 | 22,565,414 | ||||||||||||
Class R5 | 772,745 | 13,042,930 | 1,428,763 | 19,009,427 | ||||||||||||
Class R6(b) | 901,334 | 15,272,963 | 13,767,716 | 181,744,390 | ||||||||||||
Issued as reinvestment of dividends: | ||||||||||||||||
Class A | 20,978,874 | 337,759,873 | 120,687 | 1,561,209 | ||||||||||||
Class B | 779,837 | 12,274,118 | 6,819 | 86,110 | ||||||||||||
Class C | 1,015,415 | 15,779,551 | — | — | ||||||||||||
Class R | 77,072 | 1,233,927 | — | — | ||||||||||||
Class Y | 281,452 | 4,562,336 | 18,246 | 230,140 | ||||||||||||
Class R5 | 124,583 | 2,014,511 | 52,093 | 654,994 | ||||||||||||
Class R6 | 340,156 | 5,507,125 | 43,407 | 545,579 | ||||||||||||
Issued in connection with acquisitions:(c)(d) | ||||||||||||||||
Class A | 159,648,030 | 2,468,502,143 | 28,493,895 | 414,344,182 | ||||||||||||
Class B | 3,865,089 | 58,449,775 | 240,442 | 3,419,085 | ||||||||||||
Class C | 6,095,479 | 91,112,251 | 1,148,422 | 16,170,371 | ||||||||||||
Class R | 518,148 | 7,963,354 | 100,907 | 1,459,285 | ||||||||||||
Class Y | 969,446 | 15,095,293 | 801,793 | 11,737,602 | ||||||||||||
Class R5 | 189,764 | 2,949,334 | — | — | ||||||||||||
Automatic conversion of Class B shares to Class A shares: | ||||||||||||||||
Class A | 4,281,870 | 72,109,330 | 4,333,763 | 57,758,261 | ||||||||||||
Class B | (4,380,637 | ) | (72,109,330 | ) | (4,429,532 | ) | (57,758,261 | ) | ||||||||
Reacquired: | ||||||||||||||||
Class A | (64,487,337 | ) | (1,080,456,880 | ) | (55,559,122 | ) | (740,980,324 | ) | ||||||||
Class B | (2,096,465 | ) | (34,229,491 | ) | (2,697,669 | ) | (35,072,399 | ) | ||||||||
Class C | (3,357,178 | ) | (54,332,317 | ) | (4,005,957 | ) | (51,646,876 | ) | ||||||||
Class R | (440,363 | ) | (7,296,383 | ) | (532,067 | ) | (7,112,878 | ) | ||||||||
Class Y | (2,205,531 | ) | (37,315,730 | ) | (4,221,766 | ) | (56,665,047 | ) | ||||||||
Class R5 | (8,388,466 | ) | (137,569,339 | ) | (15,318,838 | ) | (201,630,848 | ) | ||||||||
Class R6 | (1,334,727 | ) | (22,425,519 | ) | (6,170,925 | ) | (82,339,770 | ) | ||||||||
Net increase (decrease) in share activity | 131,949,908 | $ | 1,975,447,684 | (29,510,372 | ) | $ | (351,943,292 | ) | ||||||||
| (a) | There is an entity that is a record owner of more than 5% of the outstanding shares of the Fund and in the aggregate owns 14% of the outstanding shares of the Fund. IDI has an agreement with this entity to sell Fund shares. The Fund, Invesco and/or Invesco affiliates may make payments to this entity, which is considered to be related to the Fund, for providing services to the Fund, Invesco and/or Invesco affiliates including but not limited to services such as securities brokerage, distribution, third party record keeping and account servicing. The Fund has no knowledge as to whether all or any portion of the shares owned of record by this entity are also owned beneficially. |
| (b) | Commencement date of September 24, 2012. |
| (c) | As of the opening of business on July 15, 2013, the Fund acquired all the net assets of Invesco Leisure Fund (the “Target Fund”) pursuant to a plan of reorganization approved by the Trustees of the Fund and by the shareholders of the Target Fund on April 24, 2013. The acquisition was accomplished by a |
19 Invesco American Franchise Fund
| tax-free exchange of 30,785,459 shares of the Fund for 10,245,465 shares outstanding of the Target Fund as of the close of business on July 12, 2013. Shares of the Target Fund were exchanged for the like class of shares of the Fund, based on the relative net asset value of the Target Fund to the net asset value of the Fund on the close of business, July 12, 2013. The Target Fund’s net assets as of the close of business on July 12, 2013 of $447,130,525, including $168,476,621 of unrealized appreciation, were combined with those of the Fund. The net assets of the Fund immediately before the acquisition were $5,828,287,238 and $6,275,415,763 immediately after the acquisition. |
| The pro forma results of operations for the year ended August 31, 2013 assuming the reorganization had been completed on September 1, 2012, the beginning of the annual reporting period are as follows: |
Net investment income | $ | 8,281,484 | ||
Net realized/unrealized gains | 1,210,553,562 | |||
Change in net assets resulting from operations | $ | 1,218,835,046 |
| As the combined investment portfolios have been managed as a single integrated portfolio since the acquisition was completed, it is not practicable to separate the amounts of revenue and earnings of the Target Fund that have been included in the Fund’s Statement of Operations since July 15, 2013. |
| (d) | As of the opening of business on September 16, 2013, the Fund acquired all the net assets of Invesco Constellation Fund (the “Target Fund”) pursuant to a plan of reorganization approved by the Trustees of the Fund and by the shareholders of the Target Fund on August 27, 2013. The acquisition was accomplished by a tax-free exchange of 171,285,956 shares of the Fund for 90,880,346 shares outstanding of the Target Fund as of the close of business on September 13, 2013. Shares of the Target Fund were exchanged for the like class of shares of the Fund, based on the relative net asset value of the Target Fund to the net asset value of the Fund on the close of business, September 13, 2013. The Target Fund’s net assets as of the close of business on September 13, 2013 of $2,644,072,150, including $725,175,144 of unrealized appreciation, were combined with those of the Fund. The net assets of the Fund immediately before the acquisition were $6,558,988,103 and $9,203,060,253 immediately after the acquisition. |
| The pro forma results of operations for the year ended August 31, 2014 assuming the reorganization had been completed on September 1, 2013, the beginning of the annual reporting period are as follows: |
Net investment income (loss) | $ | (28,410,833 | ) | |
Net realized/unrealized gains | 4,238,871,492 | |||
Change in net assets resulting from operations | $ | 4,210,460,659 |
| As the combined investment portfolios have been managed as a single integrated portfolio since the acquisition was completed, it is not practicable to separate the amounts of revenue and earnings of the Target Fund that have been included in the Fund’s Statement of Operations since September 16, 2013. |
20 Invesco American Franchise Fund
NOTE 12—Financial Highlights
The following schedule presents financial highlights for a share of the Fund outstanding throughout the periods indicated.
| Net asset value, beginning of period | Net investment income (loss)(a) | Net gains (losses) on securities (both realized and unrealized) | Total from investment operations | Dividends from net investment income | Distributions from net realized gains | Total distributions | Net asset value, end of period | Total return(b) | Net assets, end of period (000’s omitted) | Ratio of expenses to average net assets with fee waivers and/or expenses absorbed | Ratio of expenses to average net assets without fee waivers and/or expenses absorbed | Ratio of net investment income (loss) to average net assets | Portfolio turnover(c) | |||||||||||||||||||||||||||||||||||||||||||
Class A |
| |||||||||||||||||||||||||||||||||||||||||||||||||||||||
Year ended 08/31/14 | $ | 14.82 | $ | (0.04 | ) | $ | 3.99 | $ | 3.95 | $ | (0.02 | ) | $ | (0.68 | ) | $ | (0.70 | ) | $ | 18.07 | 27.22 | % | $ | 9,034,217 | 1.08 | %(d) | 1.08 | %(d) | (0.27 | )%(d) | 77 | % | ||||||||||||||||||||||||
Year ended 08/31/13 | 12.47 | 0.02 | 2.33 | 2.35 | (0.00 | ) | — | (0.00 | ) | 14.82 | 18.89 | 5,428,321 | 1.06 | 1.14 | 0.17 | 80 | ||||||||||||||||||||||||||||||||||||||||
Year ended 08/31/12 | 11.72 | (0.01 | ) | 0.88 | 0.87 | — | (0.12 | ) | (0.12 | ) | 12.47 | 7.55 | 4,728,364 | 1.05 | 1.18 | (0.05 | ) | 96 | ||||||||||||||||||||||||||||||||||||||
Year ended 08/31/11 | 9.79 | (0.05 | ) | 1.98 | 1.93 | — | — | — | 11.72 | 19.71 | 4,894,163 | 1.06 | 1.17 | (0.43 | ) | 179 | ||||||||||||||||||||||||||||||||||||||||
Year ended 08/31/10 | 8.87 | 0.01 | 1.03 | 1.04 | (0.12 | ) | — | (0.12 | ) | 9.79 | 11.75 | 168,731 | 1.30 | 1.30 | 0.11 | 101 | ||||||||||||||||||||||||||||||||||||||||
Class B |
| |||||||||||||||||||||||||||||||||||||||||||||||||||||||
Year ended 08/31/14 | 14.50 | (0.04 | ) | 3.90 | 3.86 | (0.02 | ) | (0.68 | ) | (0.70 | ) | 17.66 | 27.20 | (e) | 247,220 | 1.08 | (d)(e) | 1.08 | (d)(e) | (0.27 | )(d)(e) | 77 | ||||||||||||||||||||||||||||||||||
Year ended 08/31/13 | 12.20 | 0.02 | 2.28 | 2.30 | (0.00 | ) | — | (0.00 | ) | 14.50 | 18.90 | (e) | 226,796 | 1.06 | (e) | 1.14 | (e) | 0.17 | (e) | 80 | ||||||||||||||||||||||||||||||||||||
Year ended 08/31/12 | 11.47 | (0.01 | ) | 0.86 | 0.85 | — | (0.12 | ) | (0.12 | ) | 12.20 | 7.54 | (e) | 273,177 | 1.05 | (e) | 1.18 | (e) | (0.05 | )(e) | 96 | |||||||||||||||||||||||||||||||||||
Year ended 08/31/11 | 9.64 | (0.08 | ) | 1.91 | 1.83 | — | — | — | 11.47 | 18.98 | (e) | 373,157 | 1.28 | (e) | 1.65 | (e) | (0.64 | )(e) | 179 | |||||||||||||||||||||||||||||||||||||
Year ended 08/31/10 | 8.75 | (0.06 | ) | 1.01 | 0.95 | (0.06 | ) | — | (0.06 | ) | 9.64 | 10.89 | 22,332 | 2.05 | 2.05 | (0.64 | ) | 101 | ||||||||||||||||||||||||||||||||||||||
Class C |
| |||||||||||||||||||||||||||||||||||||||||||||||||||||||
Year ended 08/31/14 | 14.34 | (0.16 | ) | 3.84 | 3.68 | — | (0.68 | ) | (0.68 | ) | 17.34 | 26.23 | 417,687 | 1.83 | (d) | 1.83 | (d) | (1.02 | )(d) | 77 | ||||||||||||||||||||||||||||||||||||
Year ended 08/31/13 | 12.16 | (0.08 | ) | 2.26 | 2.18 | — | — | — | 14.34 | 17.93 | 271,960 | 1.81 | 1.89 | (0.58 | ) | 80 | ||||||||||||||||||||||||||||||||||||||||
Year ended 08/31/12 | 11.51 | (0.09 | ) | 0.86 | 0.77 | — | (0.12 | ) | (0.12 | ) | 12.16 | 6.82 | 252,685 | 1.80 | 1.93 | (0.80 | ) | 96 | ||||||||||||||||||||||||||||||||||||||
Year ended 08/31/11 | 9.68 | (0.11 | ) | 1.94 | 1.83 | — | — | — | 11.51 | 18.90 | (f) | 266,990 | 1.60 | (f) | 1.71 | (f) | (0.97 | )(f) | 179 | |||||||||||||||||||||||||||||||||||||
Year ended 08/31/10 | 8.76 | (0.05 | ) | 1.03 | 0.98 | (0.06 | ) | — | (0.06 | ) | 9.68 | 11.14 | (f) | 23,718 | 1.93 | (f) | 1.93 | (f) | (0.52 | )(f) | 101 | |||||||||||||||||||||||||||||||||||
Class R |
| |||||||||||||||||||||||||||||||||||||||||||||||||||||||
Year ended 08/31/14 | 14.74 | (0.09 | ) | 3.96 | 3.87 | — | (0.68 | ) | (0.68 | ) | 17.93 | 26.83 | 31,760 | 1.33 | (d) | 1.33 | (d) | (0.52 | )(d) | 77 | ||||||||||||||||||||||||||||||||||||
Year ended 08/31/13 | 12.43 | (0.01 | ) | 2.32 | 2.31 | — | — | — | 14.74 | 18.58 | 19,576 | 1.31 | 1.39 | (0.08 | ) | 80 | ||||||||||||||||||||||||||||||||||||||||
Year ended 08/31/12 | 11.71 | (0.04 | ) | 0.88 | 0.84 | — | (0.12 | ) | (0.12 | ) | 12.43 | 7.30 | 18,746 | 1.30 | 1.43 | (0.30 | ) | 96 | ||||||||||||||||||||||||||||||||||||||
Year ended 08/31/11(g) | 12.81 | (0.02 | ) | (1.08 | ) | (1.10 | ) | — | — | — | 11.71 | (8.59 | ) | 17,698 | 1.30 | (h) | 1.42 | (h) | (0.66 | )(h) | 179 | |||||||||||||||||||||||||||||||||||
Class Y |
| |||||||||||||||||||||||||||||||||||||||||||||||||||||||
Year ended 08/31/14 | 14.93 | (0.00 | ) | 4.01 | 4.01 | (0.04 | ) | (0.68 | ) | (0.72 | ) | 18.22 | 27.48 | 141,094 | 0.83 | (d) | 0.83 | (d) | (0.02 | )(d) | 77 | |||||||||||||||||||||||||||||||||||
Year ended 08/31/13 | 12.57 | 0.06 | 2.34 | 2.40 | (0.04 | ) | — | (0.04 | ) | 14.93 | 19.13 | 92,418 | 0.81 | 0.89 | 0.42 | 80 | ||||||||||||||||||||||||||||||||||||||||
Year ended 08/31/12 | 11.78 | 0.02 | 0.89 | 0.91 | — | (0.12 | ) | (0.12 | ) | 12.57 | 7.86 | 99,758 | 0.80 | 0.93 | 0.20 | 96 | ||||||||||||||||||||||||||||||||||||||||
Year ended 08/31/11 | 9.83 | (0.02 | ) | 1.97 | 1.95 | — | — | — | 11.78 | 19.84 | 117,471 | 0.81 | 0.92 | (0.18 | ) | 179 | ||||||||||||||||||||||||||||||||||||||||
Year ended 08/31/10 | 8.91 | 0.04 | 1.02 | 1.06 | (0.14 | ) | — | (0.14 | ) | 9.83 | 11.95 | 2,592 | 1.05 | 1.05 | 0.35 | 101 | ||||||||||||||||||||||||||||||||||||||||
Class R5 |
| |||||||||||||||||||||||||||||||||||||||||||||||||||||||
Year ended 08/31/14 | 14.90 | 0.02 | 4.01 | 4.03 | (0.05 | ) | (0.68 | ) | (0.73 | ) | 18.20 | 27.65 | 52,164 | 0.70 | (d) | 0.70 | (d) | 0.11 | (d) | 77 | ||||||||||||||||||||||||||||||||||||
Year ended 08/31/13 | 12.55 | 0.06 | 2.34 | 2.40 | (0.05 | ) | — | (0.05 | ) | 14.90 | 19.22 | 151,535 | 0.75 | 0.75 | 0.48 | 80 | ||||||||||||||||||||||||||||||||||||||||
Year ended 08/31/12 | 11.75 | 0.04 | 0.88 | 0.92 | — | (0.12 | ) | (0.12 | ) | 12.55 | 7.96 | 301,283 | 0.69 | 0.69 | 0.31 | 96 | ||||||||||||||||||||||||||||||||||||||||
Year ended 08/31/11(g) | 12.07 | (0.00 | ) | (0.32 | ) | (0.32 | ) | — | — | — | 11.75 | (2.65 | ) | 197,097 | 0.66 | (h) | 0.66 | (h) | (0.03 | )(h) | 179 | |||||||||||||||||||||||||||||||||||
Class R6 |
| |||||||||||||||||||||||||||||||||||||||||||||||||||||||
Year ended 08/31/14 | 14.92 | 0.03 | 4.01 | 4.04 | (0.06 | ) | (0.68 | ) | (0.74 | ) | 18.22 | 27.69 | 137,509 | 0.63 | (d) | 0.63 | (d) | 0.18 | (d) | 77 | ||||||||||||||||||||||||||||||||||||
Year ended 08/31/13(g) | 13.03 | 0.07 | 1.87 | 1.94 | (0.05 | ) | — | (0.05 | ) | 14.92 | 14.98 | 113,955 | 0.65 | (h) | 0.65 | (h) | 0.58 | (h) | 80 | |||||||||||||||||||||||||||||||||||||
| (a) | Calculated using average shares outstanding. |
| (b) | Includes adjustments in accordance with accounting principles generally accepted in the United States of America and as such, the net asset value for financial reporting purposes and the returns based upon those net asset values may differ from the net asset value and returns for shareholder transactions. Does not include sales charges and is not annualized for periods less than one year, if applicable. |
| (c) | Portfolio turnover is calculated at the fund level and is not annualized for periods less than one year, if applicable. For the year ended August 31, 2014, the portfolio turnover calculation excludes the value of securities purchased of $1,921,954,452 and sales of $1,568,687,370 in the effort to realign the Fund’s portfolio holdings after the reorganization of Invesco Constellation Fund into the Fund. For the year ended August 31, 2013, the portfolio turnover calculation excludes the value of securities purchased of $279,161,573 and sales of $299,305,234 in the effort to realign the Fund’s portfolio holdings after the reorganization of Invesco Leisure Fund into the Fund. For the year ended August 31, 2011, the portfolio turnover calculation excludes the value of securities purchased of $4,947,460,310 and sold $2,251,028,915 in the effort to realign the fund’s portfolio holdings after the reorganization of Invesco Large Cap Growth Fund, Invesco Van Kampen Capital Growth Fund and Invesco Van Kampen Enterprise Fund into the Fund. |
| (d) | Ratios are based on average daily net assets (000’s omitted) of $8,580,083, $275,305, $398,855, $30,030, $120,567, $68,089 and $128,632 for Class A, Class B, Class C, Class R, Class Y, Class R5 and Class R6 shares, respectively. |
| (e) | The total return, ratio of expenses to average net assets and ratio of net investment income (loss) to average net assets reflect actual 12b-1 fees of 0.25%, 0.25%, 0.25% and 0.47% for the years ended August 31, 2014, 2013, 2012 and 2011, respectively. |
| (f) | The total return, ratio of expenses to average net assets and ratio of net investment income (loss) to average net assets reflect actual 12b-1 fees of 0.79% and 0.88% for the years ended August 31, 2011 and 2010, respectively. |
| (g) | Commencement date of May 23, 2011 for Class R shares, December 22, 2010 for Class R5 shares and September 24, 2012 for Class R6 shares. |
| (h) | Annualized. |
21 Invesco American Franchise Fund
Report of Independent Registered Public Accounting Firm
To the Board of Trustees of AIM Counselor Series Trust (Invesco Counselor Series Trust) and Shareholders of Invesco American Franchise Fund:
In our opinion, the accompanying statement of assets and liabilities, including the schedule of investments, and the related statements of operations and of changes in net assets and the financial highlights present fairly, in all material respects, the financial position of Invesco American Franchise Fund (one of the funds constituting AIM Counselor Series Trust (Invesco Counselor Series Trust), hereafter referred to as the “Fund”) at August 31, 2014, the results of its operations for the year then ended, the changes in its net assets for each of the two years in the period then ended and the financial highlights for each of the five years in the period then ended, in conformity with accounting principles generally accepted in the United States of America. These financial statements and financial highlights (hereafter referred to as “financial statements”) are the responsibility of the Fund’s management. Our responsibility is to express an opinion on these financial statements based on our audits. We conducted our audits of these financial statements in accordance with the standards of the Public Company Accounting Oversight Board (United States). Those standards require that we plan and perform the audit to obtain reasonable assurance about whether the financial statements are free of material misstatement. An audit includes examining, on a test basis, evidence supporting the amounts and disclosures in the financial statements, assessing the accounting principles used and significant estimates made by management, and evaluating the overall financial statement presentation. We believe that our audits, which included confirmation of securities at August 31, 2014 by correspondence with the custodian and brokers, provide a reasonable basis for our opinion.
PRICEWATERHOUSECOOPERS LLP
October 27, 2014
Houston, Texas
22 Invesco American Franchise Fund
Calculating your ongoing Fund expenses
Example
As a shareholder of the Fund, you incur two types of costs: (1) transaction costs, which may include sales charges (loads) on purchase payments or contingent deferred sales charges on redemptions, if any; and (2) ongoing costs, including management fees, distribution and/or service (12b-1) fees, and other Fund expenses. This example is intended to help you understand your ongoing costs (in dollars) of investing in the Fund and to compare these costs with ongoing costs of investing in other mutual funds. The example is based on an investment of $1,000 invested at the beginning of the period and held for the entire period March 1, 2014 through August 31, 2014.
Actual expenses
The table below provides information about actual account values and actual expenses. You may use the information in this table, together with the amount you invested, to estimate the expenses that you paid over the period. Simply divide your account value by $1,000 (for example, an $8,600 account value divided by $1,000 = 8.6), then multiply the result by the number in the table under the heading entitled “Actual Expenses Paid During Period” to estimate the expenses you paid on your account during this period.
Hypothetical example for comparison purposes
The table below also provides information about hypothetical account values and hypothetical expenses based on the Fund’s actual expense ratio and an assumed rate of return of 5% per year before expenses, which is not the Fund’s actual return.
The hypothetical account values and expenses may not be used to estimate the actual ending account balance or expenses you paid for the period. You may use this information to compare the ongoing costs of investing in the Fund and other funds. To do so, compare this 5% hypothetical example with the 5% hypothetical examples that appear in the shareholder reports of the other funds.
Please note that the expenses shown in the table are meant to highlight your ongoing costs only and do not reflect any transaction costs, such as sales charges (loads) on purchase payments or contingent deferred sales charges on redemptions, if any. Therefore, the hypothetical information is useful in comparing ongoing costs only, and will not help you determine the relative total costs of owning different funds. In addition, if these transaction costs were included, your costs would have been higher.
| Class | Beginning Account Value (03/01/14) | ACTUAL | HYPOTHETICAL (5% annual return before expenses) | Annualized Expense Ratio | ||||||||||||||||||||
| Ending Account Value (08/31/14)1 | Expenses Paid During Period2 | Ending Account Value (08/31/14) | Expenses Paid During Period2 | |||||||||||||||||||||
A | $ | 1,000.00 | $ | 1,040.90 | $ | 5.61 | $ | 1,019.71 | $ | 5.55 | 1.09 | % | ||||||||||||
B | 1,000.00 | 1,040.70 | 5.61 | 1,019.71 | 5.55 | 1.09 | ||||||||||||||||||
C | 1,000.00 | 1,037.10 | 9.45 | 1,015.93 | 9.35 | 1.84 | ||||||||||||||||||
R | 1,000.00 | 1,039.40 | 6.89 | 1,018.45 | 6.82 | 1.34 | ||||||||||||||||||
Y | 1,000.00 | 1,041.70 | 4.32 | 1,020.97 | 4.28 | 0.84 | ||||||||||||||||||
R5 | 1,000.00 | 1,042.40 | 3.81 | 1,021.48 | 3.77 | 0.74 | ||||||||||||||||||
R6 | 1,000.00 | 1,042.90 | 3.19 | 1,022.08 | 3.16 | 0.62 | ||||||||||||||||||
| 1 | The actual ending account value is based on the actual total return of the Fund for the period March 1, 2014 through August 31, 2014, after actual expenses and will differ from the hypothetical ending account value which is based on the Fund’s expense ratio and a hypothetical annual return of 5% before expenses. |
| 2 | Expenses are equal to the Fund’s annualized expense ratio as indicated above multiplied by the average account value over the period, multiplied by 184/365 to reflect the most recent fiscal half year. |
23 Invesco American Franchise Fund
Approval of Investment Advisory and Sub-Advisory Contracts
The Board of Trustees (the Board) of AIM Counselor Series Trust (Invesco Counselor Series Trust) is required under the Investment Company Act of 1940, as amended, to approve annually the renewal of Invesco American Franchise Fund’s (the Fund) investment advisory agreements. During contract renewal meetings held on June 16-17, 2014, the Board as a whole, and the disinterested or “independent” Trustees, who comprise over 75% of the Board, voting separately, approved the continuance for the Fund of the Master Investment Advisory Agreement with Invesco Advisers, Inc. (Invesco Advisers) and the Master Intergroup Sub-Advisory Contract for Mutual Funds with Invesco Asset Management Deutschland GmbH, Invesco Asset Management Limited, Invesco Asset Management (Japan) Limited, Invesco Australia Limited, Invesco Hong Kong Limited, Invesco Senior Secured Management, Inc., and Invesco Canada Ltd. (collectively, the Affiliated Sub-Advisers and the sub-advisory contracts) for another year, effective July 1, 2014.
In evaluating the fairness and reasonableness of compensation under the Fund’s investment advisory agreement and sub-advisory contracts, the Board considered, among other things, the factors discussed below. The Board determined that the continuation of the Fund’s investment advisory agreement and the sub-advisory contracts are in the best interest of the Fund and its shareholders and that the compensation payable to Invesco Advisers and the Affiliated Sub-Advisers under the agreements is fair and reasonable.
The Board’s Fund Evaluation Process
The Board’s Investments Committee has established three Sub-Committees, each of which is primarily responsible for overseeing the management of a number of the funds advised by Invesco Advisers (the Invesco Funds). The Sub-Committees meet throughout the year to review the performance of their assigned Invesco Funds, including reviewing materials prepared under the direction of the independent Senior Officer, an officer of the Invesco Funds who reports directly to the independent Trustees. Over the course of each year, the Sub-Committees meet with portfolio managers for their assigned Invesco Funds and other members of management to review the performance, investment objective(s), policies, strategies, limitations and investment risks of these funds. The Sub-Committees meet regularly and at designated contract renewal meetings each year to conduct a review of the performance, fees, expenses and other matters related to their assigned Invesco Funds. Each Sub-Committee recommends to the Investments Committee, which in turn recommends to the full Board, whether and on what terms to approve the continuance of each Invesco Fund’s investment advisory agreement and sub-advisory contracts for another year.
During the contract renewal process, the Trustees receive comparative performance and fee data regarding the Invesco Funds prepared by Invesco
Advisers and Lipper Inc. (Lipper), an independent provider of investment company data. The Trustees also receive an independent written evaluation from the Senior Officer. The Senior Officer’s evaluation is prepared as part of his responsibility to manage the process by which the Invesco Funds’ proposed management fees are negotiated during the annual contract renewal process to ensure they are negotiated in a manner that is at arms’ length and reasonable. In addition to meetings with Invesco Advisers and fund counsel, the independent Trustees also discuss the continuance of the investment advisory agreement and sub-advisory contracts in separate sessions with the Senior Officer and with independent legal counsel.
The Trustees recognized that the advisory fee rates for the Invesco Funds are, in many cases, the result of years of review and negotiation. The Trustees’ deliberations and conclusions in a particular year may be based in part on their deliberations and conclusions regarding these arrangements throughout the year and in prior years. The Trustees’ review and conclusions are based on the comprehensive consideration of all information presented to them and are not the result of any single determinative factor. Moreover, one Trustee may have weighed a particular piece of information or factor differently than another Trustee.
The discussion below serves as the Senior Officer’s independent written evaluation with respect to the Fund’s investment advisory agreement as well as a discussion of the material factors and related conclusions that formed the basis for the Board’s approval of the Fund’s investment advisory agreement and sub-advisory contracts. Unless otherwise stated, this information is current as of June 17, 2014, and may not reflect consideration of factors that became known to the Board after that date.
Factors and Conclusions and Summary of Independent Written Fee Evaluation
| A. | Nature, Extent and Quality of Services Provided by Invesco Advisers and the Affiliated Sub-Advisers |
The Board reviewed the advisory services provided to the Fund by Invesco Advisers under the Fund’s investment advisory agreement, the performance of Invesco Advisers in providing these services, and the credentials and experience of the officers and employees of Invesco Advisers who provide these services, including the Fund’s portfolio manager or managers, with whom the Sub-Committees met during the year. The Board’s review of the qualifications of Invesco Advisers to provide advisory services included the Board’s consideration of Invesco Advisers’ investment process oversight, independent credit analysis and investment risk management. The Board also considered non-advisory services that Invesco Advisers and its affiliates provide to the Invesco Funds such as various back office support functions, equity and fixed income trading operations, internal audit, distribution and legal and compliance.
In determining whether to continue the Fund’s investment advisory agreement, the Board considered the benefits of reapproving an existing relationship and the greater uncertainty that may be associated with entering into a new relationship. The Board concluded that the nature, extent and quality of the services provided to the Fund by Invesco Advisers are appropriate and satisfactory and consistent with the terms of the Fund’s investment advisory agreement.
The Board reviewed the services that may be provided by the Affiliated Sub-Advisers under the sub-advisory contracts and the credentials and experience of the officers and employees of the Affiliated Sub-Advisers who provide these services. The Board noted that the Affiliated Sub-Advisers have offices and personnel that are located in financial centers around the world. As a result, the Affiliated Sub-Advisers can provide research and investment analysis on the markets and economies of various countries in which the Fund may invest, make recommendations regarding securities and assist with security trades. The Board concluded that the sub-advisory contracts benefit the Fund and its shareholders by permitting Invesco Advisers to use the resources and talents of the Affiliated Sub-Advisers in managing the Fund. The Board concluded that the nature, extent and quality of the services that may be provided by the Affiliated Sub-Advisers are appropriate and satisfactory and consistent with the terms of the Fund’s sub-advisory contracts.
| B. | Fund Performance |
The Board considered Fund performance as a relevant factor in considering whether to approve the investment advisory agreement. The Board did not view Fund performance as a relevant factor in considering whether to approve the sub-advisory contracts for the Fund, as no Affiliated Sub-Adviser currently manages assets of the Fund.
The Board compared the Fund’s performance during the past one, three and five calendar years to the performance of funds in the Lipper performance universe and against the Lipper Large-Cap Growth Funds Index. The Board noted that performance of Class A shares of the Fund was in the first quintile of the performance universe for the one year period, the fourth quintile for the three year period and the third quintile for the five year period (the first quintile being the best performing funds and the fifth quintile being the worst performing funds). The Board noted that performance of Class A shares of the Fund was above the performance of the Index for the one period and below the performance of the Index for the three and five year periods. Invesco Advisers noted that the momentum driven process employed by the Fund had resulted in top performance since November 2012, but that abrupt market changes during 2011 and 2012 had created a challenging environment for the portfolio management team’s process leading to relative underperformance. The Trustees also reviewed more recent Fund performance and this review did not change their conclusions.
24 Invesco American Franchise Fund
| C. | Advisory and Sub-Advisory Fees |
The Board compared the Fund’s contractual management fee rate to the contractual management fee rates of funds in the Fund’s Lipper expense group at a common asset level. The Board noted that the contractual management fee rate for Class A shares of the Fund was below the median contractual management fee rate of funds in the expense group. The Board noted that the term “contractual management fee” may include both advisory and certain administrative services fees, but that Lipper does not provide information on a fund by fund basis as to what is included. The Board noted that Invesco Advisers does not charge the Invesco Funds for the administrative services included in the term as defined by Lipper. The Board also reviewed the methodology used by Lipper in providing expense group information, which includes using each fund’s contractual management fee schedule (including any applicable breakpoints) as reported in the most recent prospectus or statement of additional information for each fund in the expense group.
The Board noted that Invesco Advisers has contractually agreed to waive fees and/or limit expenses of the Fund through at least June 30, 2015 in an amount necessary to limit total annual operating expenses to a specified percentage of average daily net assets for each class of the Fund.
The Board also compared the Fund’s effective advisory fee rate (the advisory fee rate after advisory fee waivers and before other expense limitations/waivers) to the effective advisory fee rates of other mutual funds advised by Invesco Advisers and its affiliates that are managed using an investment process substantially similar to the investment process used for the Fund. The Board noted that the Fund’s rate was below the rate of the one mutual fund advised by Invesco Advisers with a similar investment process. The Board also noted that Invesco Advisers sub-advises one other mutual fund that is managed using an investment process substantially similar to the investment process used for the Fund and that the sub-advisory effective fee rate was below the advisory effective fee rate of the Fund.
The Board also considered the fees charged by Invesco Advisers and the Affiliated Sub-Advisers to other client accounts that are managed using an investment process substantially similar to the investment process used for the Fund. The Board noted that Invesco Advisers or the Affiliated Sub-Advisers may charge lower fees to large institutional clients. Invesco Advisers reviewed with the Board the significantly greater scope of services it provides to the Invesco Funds relative to certain other client accounts. These additional services include provision of administrative services, officers and office space, oversight of service providers, preparation of annual registration statement updates and financial information and regulatory compliance under the Investment Company Act of 1940, as amended. Invesco Advisers also reviewed generally the higher frequency of shareholder purchases and redemptions in the Invesco Funds relative to the flow of assets for other client accounts. Invesco Advisers advised the Board that advance notice of redemptions is often provided to Invesco Advisers by
institutional clients. The Board did note that sub-advisory fee rates charged by the Affiliated Sub-Advisers to manage the Invesco Funds and to manage other client accounts tended to be more comparable, reflecting a more comparable scope of services. The Board concluded that the aggregate services provided to the Invesco Funds were sufficiently different from those provided to institutional clients to support the difference in fees.
The Board also considered the services that may be provided by the Affiliated Sub-Advisers pursuant to the sub-advisory contracts, as well as the fees payable by Invesco Advisers to the Affiliated Sub-Advisers pursuant to the sub-advisory contracts. The Board also noted that the sub-advisory fees are not paid directly by the Fund, but rather, are payable by Invesco Advisers to the Affiliated Sub-Advisers.
| D. | Economies of Scale and Breakpoints |
The Board considered the extent to which there are economies of scale in the provision of advisory services to the Fund. The Board also considered whether the Fund benefits from economies of scale through contractual breakpoints in the Fund’s advisory fee schedule and was assisted in this review by a report from the Senior Officer. The Board also noted that the Fund shares directly in economies of scale through lower fees charged by third party service providers based on the combined size of the Invesco Funds and other clients advised by Invesco Advisers.
| E. | Profitability and Financial Resources |
The Board reviewed information from Invesco Advisers concerning the costs of the advisory and other services that Invesco Advisers and its affiliates provide to the Fund and the profitability of Invesco Advisers and its affiliates in providing these services for the year ended December 31, 2013. The Board received information from Invesco Advisers about the methodology used to prepare the profitability information. The Board considered the profitability of Invesco Advisers in managing the Fund and the Invesco Funds. The Board noted that Invesco Advisers continues to operate at a net profit from services Invesco Advisers and its subsidiaries provide to the Invesco Funds and the Fund. The Board did not deem the level of profits realized by Invesco Advisers and its affiliates from providing services to the Fund to be excessive given the nature, quality and extent of the services provided to the Invesco Funds. The Board received and accepted information from Invesco Advisers demonstrating that Invesco Advisers and each Affiliated Sub-Adviser are financially sound and have the resources necessary to perform their obligations under the investment advisory agreement and sub-advisory contracts.
| F. | Collateral Benefits to Invesco Advisers and its Affiliates |
The Board considered various other benefits received by Invesco Advisers and its affiliates from the relationship with the Fund, including the fees received for their provision of transfer agency and distribution services to the Fund. The Board considered comparative information regarding fees charged for these services, including information provided by Lipper and other independent sources. The Board considered the performance of Invesco Advisers and its affiliates in providing these services and the organizational structure employed to provide
these services. The Board also considered that these services are provided to the Fund pursuant to written contracts that are reviewed and approved on an annual basis by the Board; that the services are required for the operation of the Fund; that Invesco Advisers and its affiliates can provide services, the nature and quality of which are at least equal to those provided by others offering the same or similar services; and that the fees for such services are fair and reasonable in light of the usual and customary charges by others for services of the same nature and quality.
The Board considered the benefits realized by Invesco Advisers and the Affiliated Sub-Advisers as a result of portfolio brokerage transactions executed through “soft dollar” arrangements. The Board noted that soft dollar arrangements shift the payment obligation for research services from Invesco Advisers and the Affiliated Sub-Advisers to the Invesco Funds and that the research received may be used with other clients of Invesco Advisers and may reduce Invesco Advisers’ and the Affiliated Sub-Advisers’ expenses. The Board also considered that it receives periodic reports from the Chief Compliance Officer of the Invesco Funds demonstrating that these arrangements are consistent with regulatory requirements. The Board did not deem the soft dollar arrangements to be inappropriate.
The Board considered that the Fund’s uninvested cash and cash collateral from any securities lending arrangements may be invested in money market funds advised by Invesco Advisers pursuant to procedures approved by the Board. The Board noted that Invesco Advisers receives advisory fees from these affiliated money market funds attributable to such investments, although Invesco Advisers has contractually agreed to waive through varying periods the advisory fees payable by the Invesco Funds with respect to investments in the affiliated money market funds. The waiver is in an amount equal to 100% of the net advisory fee Invesco Advisers receives from the affiliated money market funds with respect to the Fund’s investment in the affiliated money market funds of uninvested cash, but not cash collateral. The Board concluded that the amount of advisory fees received by Invesco Advisors from the Fund’s investment of uninvested cash and cash collateral from any securities lending arrangements in the affiliated money market funds are fair and reasonable.
The Board also considered the Fund may use an affiliated broker to execute certain trades for the Fund to among other things, control information leakage, and were advised that such trades would be executed in compliance with rules under the Investment Company Act of 1940, as amended.
25 Invesco American Franchise Fund
Tax Information
Form 1099-DIV, Form 1042-S and other year–end tax information provide shareholders with actual calendar year amounts that should be included in their tax returns. Shareholders should consult their tax advisors.
The following distribution information is being provided as required by the Internal Revenue Code or to meet a specific state’s requirement.
The Fund designates the following amounts or, if subsequently determined to be different, the maximum amount allowable for its fiscal year ended August 31, 2014:
Federal and State Income Tax | ||||
Long-Term Capital Gain Distributions | $ | 391,681,684 | ||
Qualified Dividend Income* | 100 | % | ||
Corporate Dividends Received Deduction* | 100 | % | ||
U.S. Treasury Obligations* | 0 | % | ||
| * | The above percentages are based on ordinary income dividends paid to shareholders during the Fund’s fiscal year. |
26 Invesco American Franchise Fund
Trustees and Officers
The address of each trustee and officer is AIM Counselor Series Trust (Invesco Counselor Series Trust) (the “Trust”), 11 Greenway Plaza, Suite 1000, Houston, Texas 77046-1173. The trustees serve for the life of the Trust, subject to their earlier death, incapacitation, resignation, retirement or removal as more specifically provided in the Trust’s organizational documents. Each officer serves for a one year term or until their successors are elected and qualified. Column two below includes length of time served with predecessor entities, if any.
Name, Year of Birth and Position(s) Held with the Trust | Trustee and/ or Officer Since | Principal Occupation(s) During Past 5 Years | Number of Funds in Fund Complex Overseen by Trustee | Other Directorship(s) Held by Trustee During Past 5 Years | ||||
| Interested Persons | ||||||||
Martin L. Flanagan1 — 1960 Trustee | 2007 | Executive Director, Chief Executive Officer and President, Invesco Ltd. (ultimate parent of Invesco and a global investment management firm); Advisor to the Board, Invesco Advisers, Inc. (formerly known as Invesco Institutional (N.A.), Inc.); Trustee, The Invesco Funds; Vice Chair, Investment Company Institute; and Member of Executive Board, SMU Cox School of Business.
Formerly: Chairman and Chief Executive Officer, Invesco Advisers, Inc. (registered investment adviser); Director, Chairman, Chief Executive Officer and President, IVZ Inc. (holding company), INVESCO Group Services, Inc. (service provider) and Invesco North American Holdings, Inc. (holding company); Director, Chief Executive Officer and President, Invesco Holding Company Limited (parent of Invesco and a global investment management firm); Director, Invesco Ltd.; Chairman, Investment Company Institute and President, Co-Chief Executive Officer, Co-President, Chief Operating Officer and Chief Financial Officer, Franklin Resources, Inc. (global investment management organization). | 141 | None | ||||
Philip A. Taylor2 — 1954 Trustee, President and Principal Executive Officer | 2006 | Head of North American Retail and Senior Managing Director, Invesco Ltd.; Director, Co-Chairman, Co-President and Co-Chief Executive Officer, Invesco Advisers, Inc. (formerly known as Invesco Institutional (N.A.), Inc.) (registered investment adviser); Director, Chairman, Chief Executive Officer and President, Invesco Management Group, Inc. (formerly known as Invesco Aim Management Group, Inc.) (financial services holding company); Director and President, INVESCO Funds Group, Inc. (registered investment adviser and registered transfer agent); Director and Chairman, Invesco Investment Services, Inc. (formerly known as Invesco Aim Investment Services, Inc.) (registered transfer agent) and IVZ Distributors, Inc. (formerly known as INVESCO Distributors, Inc.) (registered broker dealer); Director, President and Chairman, Invesco Inc. (holding company) and Invesco Canada Holdings Inc. (holding company); Chief Executive Officer, Invesco Corporate Class Inc. (corporate mutual fund company) and Invesco Canada Fund Inc. (corporate mutual fund company); Director, Chairman and Chief Executive Officer, Invesco Canada Ltd. (formerly known as Invesco Trimark Ltd./Invesco Trimark Ltèe) (registered investment adviser and registered transfer agent); Trustee, President and Principal Executive Officer, The Invesco Funds (other than AIM Treasurer’s Series Trust (Invesco Treasurer’s Series Trust) and Short-Term Investments Trust); Trustee and Executive Vice President, The Invesco Funds (AIM Treasurer’s Series Trust (Invesco Treasurer’s Series Trust) and Short-Term Investments Trust only); Director, Invesco Investment Advisers LLC (formerly known as Van Kampen Asset Management); Director, Chief Executive Officer and President, Van Kampen Exchange Corp.
Formerly: Director and Chairman, Van Kampen Investor Services Inc.; Director, Chief Executive Officer and President, 1371 Preferred Inc. (holding company) and Van Kampen Investments Inc.; Director and President, AIM GP Canada Inc. (general partner for limited partnerships) and Van Kampen Advisors, Inc.; Director and Chief Executive Officer, Invesco Trimark Dealer Inc. (registered broker dealer); Director, Invesco Distributors, Inc. (formerly known as Invesco Aim Distributors, Inc.) (registered broker dealer); Manager, Invesco PowerShares Capital Management LLC; Director, Chief Executive Officer and President, Invesco Advisers, Inc.; Director, Chairman, Chief Executive Officer and President, Invesco Aim Capital Management, Inc.; President, Invesco Trimark Dealer Inc. and Invesco Trimark Ltd./Invesco Trimark Ltèe; Director and President, AIM Trimark Corporate Class Inc. and AIM Trimark Canada Fund Inc.; Senior Managing Director, Invesco Holding Company Limited; Director and Chairman, Fund Management Company (former registered broker dealer); President and Principal Executive Officer, The Invesco Funds (AIM Treasurer’s Series Trust (Invesco Treasurer’s Series Trust), and Short-Term Investments Trust only); President, AIM Trimark Global Fund Inc. and AIM Trimark Canada Fund Inc. | 141 | None | ||||
Wayne W. Whalen3 — 1939 Trustee | 2010 | Of Counsel, and prior to 2010, partner in the law firm of Skadden, Arps, Slate, Meagher & Flom LLP, legal counsel to certain funds in the Fund Complex
| 141 | Director of the Mutual fund Directors Forum, a nonprofit membership organization for investment directors; Chairman and Director of the Abraham Lincoln Presidential Library Foundation; and Director of the Stevenson Center for Democracy |
| 1 | Mr. Flanagan is considered an interested person (within the meaning of Section 2(a)(19) of the 1940 Act) of the Trust because he is an officer of the Adviser to the Trust, and an officer and a director of Invesco Ltd., ultimate parent of the Adviser. |
| 2 | Mr. Taylor is considered an interested person (within the meaning of Section 2(a)(19) of the 1940 Act) of the Trust because he is an officer and a director of the Adviser. |
| 3 | Mr. Whalen is retiring effective December 31, 2014. He has been deemed to be an interested person of the Trust because of his prior service as counsel to the predecessor funds of certain Invesco open-end funds and his affiliation with the law firm that served as counsel to such predecessor funds and the Invesco closed-end funds. |
T-1 Invesco American Franchise Fund
Trustees and Officers—(continued)
Name, Year of Birth and Position(s) Held with the Trust | Trustee and/ or Officer Since | Principal Occupation(s) During Past 5 Years | Number of Funds in Fund Complex Overseen by Trustee | Other Directorship(s) Past 5 Years | ||||
| Independent Trustees | ||||||||
Bruce L. Crockett — 1944 Trustee and Chair | 2003 | Chairman, Crockett Technologies Associates (technology consulting company)
Formerly: Director, Captaris (unified messaging provider); Director, President and Chief Executive Officer, COMSAT Corporation; Chairman, Board of Governors of INTELSAT (international communications company); ACE Limited (insurance company); and Investment Company Institute | 141 | ALPS (Attorneys Liability Protection Society) (insurance company) | ||||
David C. Arch — 1945 Trustee | 2010 | Chairman of Blistex Inc., a consumer health care products manufacturer | 141 | Board member of the Illinois Manufacturers’ Association; Member of the Board of Visitors, Institute for the Humanities, University of Michigan; Member of the Audit Committee of the Edward-Elmhurst Hospital | ||||
Frank S. Bayley — 1939 Trustee | 2003 | Retired. Formerly: Director, Badgley Funds Inc. (registered investment company) (2 portfolios) and General Partner and Of Counsel, law firm of Baker & McKenzie, LLP | 141 | Director and Chairman, C.D. Stimson Company (a real estate investment company); Trustee, The Curtis Institute of Music | ||||
James T. Bunch — 1942 Trustee | 2000 | Managing Member, Grumman Hill Group LLC (family office private equity investments)
Formerly: Founder, Green Manning & Bunch Ltd. (investment banking firm) (1988-2010); Executive Committee, United States Golf Association; and Director, Policy Studies, Inc. and Van Gilder Insurance Corporation | 141 | Chairman, Board of Governors, Western Golf Association; Chairman, Evans Scholars Foundation; and Director, Denver Film Society | ||||
Rodney F. Dammeyer — 1940 Trustee | 2010 | Chairman of CAC, LLC, (private company offering capital investment and management advisory services)
Formerly: Prior to 2001, Managing Partner at Equity Group Corporate Investments; Prior to 1995, Chief Executive Officer of Itel Corporation (formerly Anixter International); Prior to 1985, experience includes Senior Vice President and Chief Financial Officer of Household International, Inc., Executive Vice President and Chief Financial Officer of Northwest Industries, Inc. and Partner of Arthur Andersen & Co.; From 1987 to 2010, Director/Trustee of investment companies in the Van Kampen Funds complex | 141 | Director of Quidel Corporation and Stericycle, Inc. | ||||
Albert R. Dowden — 1941 Trustee | 2003 | Director of a number of public and private business corporations, including the Boss Group, Ltd. (private investment and management); Nature’s Sunshine Products, Inc. and Reich & Tang Funds (5 portfolios) (registered investment company)
Formerly: Director, Homeowners of America Holding Corporation/Homeowners of America Insurance Company (property casualty company); Director, Continental Energy Services, LLC (oil and gas pipeline service); Director, CompuDyne Corporation (provider of product and services to the public security market) and Director, Annuity and Life Re (Holdings), Ltd. (reinsurance company); Director, President and Chief Executive Officer, Volvo Group North America, Inc.; Senior Vice President, AB Volvo; Director of various public and private corporations; Chairman, DHJ Media, Inc.; Director, Magellan Insurance Company; and Director, The Hertz Corporation, Genmar Corporation (boat manufacturer), National Media Corporation; Advisory Board of Rotary Power International (designer, manufacturer, and seller of rotary power engines); and Chairman, Cortland Trust, Inc. (registered investment company) | 141 | Director of: Nature’s Sunshine Products, Inc., Reich & Tang Funds, Homeowners of America Holding Corporation/ Homeowners of America Insurance Company, the Boss Group | ||||
Jack M. Fields — 1952 Trustee | 2003 | Chief Executive Officer, Twenty First Century Group, Inc. (government affairs company); Owner and Chief Executive Officer, Dos Angeles Ranch, L.P. (cattle, hunting, corporate entertainment); and Discovery Global Education Fund (non-profit)
Formerly: Chief Executive Officer, Texana Timber LP (sustainable forestry company); Director of Cross Timbers Quail Research Ranch (non-profit); and member of the U.S. House of Representatives | 141 | Insperity, Inc. (formerly known as Administaff) | ||||
Prema Mathai-Davis — 1950 Trustee | 2003 | Retired. Formerly: Chief Executive Officer, YWCA of the U.S.A. | 141 | None | ||||
Larry Soll — 1942 Trustee | 1997 | Retired. Formerly: Chairman, Chief Executive Officer and President, Synergen Corp. (a biotechnology company) | 141 | None | ||||
Hugo F. Sonnenschein — 1940 Trustee | 2010 | President Emeritus and Honorary Trustee of the University of Chicago and the Adam Smith Distinguished Service Professor in the Department of Economics at the University of Chicago. Prior to 2000, President of the University of Chicago | 141 | Trustee of the University of Rochester and a member of its investment committee; Member of the National Academy of Sciences and the American Philosophical Society; Fellow of the American Academy of Arts and Sciences |
T-2 Invesco American Franchise Fund
Trustees and Officers—(continued)
Name, Year of Birth and Position(s) Held with the Trust | Trustee and/ or Officer Since | Principal Occupation(s) During Past 5 Years | Number of Funds in Fund Complex Overseen by Trustee | Other Directorship(s) Past 5 Years | ||||
| Independent Trustees—(continued) | ||||||||
Raymond Stickel, Jr. — 1944 Trustee | 2005 | Retired. Formerly: Director, Mainstay VP Series Funds, Inc. (25 portfolios) and Partner, Deloitte & Touche | 141 | None | ||||
Suzanne H. Woolsey — 1941 Trustee | 2014 | Chief Executive Officer of Woolsey Partners LLC | 141 | Emeritus Chair of the Board of Trustees of the Institute for Defense Analyses; Trustee of Colorado College; Trustee of California Institute of Technology; Prior to 2014, Director of Fluor Corp.; Prior to 2010, Trustee of the German Marshall Fund of the United States; Prior to 2010 Trustee of the Rocky Mountain Institute | ||||
| Other Officers | ||||||||
Russell C. Burk — 1958 Senior Vice President and Senior Officer | 2005 | Senior Vice President and Senior Officer, The Invesco Funds | N/A | N/A | ||||
John M. Zerr — 1962 Senior Vice President, Chief Legal Officer and Secretary | 2006 | Director, Senior Vice President, Secretary and General Counsel, Invesco Management Group, Inc. (formerly known as Invesco Aim Management Group, Inc.) and Van Kampen Exchange Corp.; Senior Vice President, Invesco Advisers, Inc. (formerly known as Invesco Institutional (N.A.), Inc.) (registered investment adviser); Senior Vice President and Secretary, Invesco Distributors, Inc. (formerly known as Invesco Aim Distributors, Inc.); Director, Vice President and Secretary, Invesco Investment Services, Inc. (formerly known as Invesco Aim Investment Services, Inc.) and IVZ Distributors, Inc. (formerly known as INVESCO Distributors, Inc.); Director and Vice President, INVESCO Funds Group, Inc.; Senior Vice President, Chief Legal Officer and Secretary, The Invesco Funds; Manager, Invesco PowerShares Capital Management LLC; Director, Secretary and General Counsel, Invesco Investment Advisers LLC (formerly known as Van Kampen Asset Management); Secretary and General Counsel, Invesco Capital Markets, Inc. (formerly known as Van Kampen Funds Inc.) and Chief Legal Officer, PowerShares Exchange-Traded Fund Trust, PowerShares Exchange-Traded Fund Trust II, PowerShares India Exchange-Traded Fund Trust and PowerShares Actively Managed Exchange-Traded Fund Trust
Formerly: Director and Vice President, Van Kampen Advisors Inc.; Director, Vice President, Secretary and General Counsel, Van Kampen Investor Services Inc.; Director, Invesco Distributors, Inc. (formerly known as Invesco Aim Distributors, Inc.); Director, Senior Vice President, General Counsel and Secretary, Invesco Aim Advisers, Inc. and Van Kampen Investments Inc.; Director, Vice President and Secretary, Fund Management Company; Director, Senior Vice President, Secretary, General Counsel and Vice President, Invesco Aim Capital Management, Inc.; Chief Operating Officer and General Counsel, Liberty Ridge Capital, Inc. (an investment adviser); Vice President and Secretary, PBHG Funds (an investment company) and PBHG Insurance Series Fund (an investment company); Chief Operating Officer, General Counsel and Secretary, Old Mutual Investment Partners (a broker-dealer); General Counsel and Secretary, Old Mutual Fund Services (an administrator) and Old Mutual Shareholder Services (a shareholder servicing center); Executive Vice President, General Counsel and Secretary, Old Mutual Capital, Inc. (an investment adviser); and Vice President and Secretary, Old Mutual Advisors Funds (an investment company) | N/A | N/A | ||||
Sheri Morris — 1964 Vice President, Treasurer and Principal Financial Officer | 2003 | Vice President, Treasurer and Principal Financial Officer, The Invesco Funds; Vice President, Invesco Advisers, Inc. (formerly known as Invesco Institutional (N.A.), Inc.) (registered investment adviser); and Vice President, PowerShares Exchange-Traded Fund Trust, PowerShares Exchange-Traded Fund Trust II, PowerShares India Exchange-Traded Fund Trust and PowerShares Actively Managed Exchange-Traded Fund Trust
Formerly: Vice President, Invesco Aim Advisers, Inc., Invesco Aim Capital Management, Inc. and Invesco Aim Private Asset Management, Inc.; Assistant Vice President and Assistant Treasurer, The Invesco Funds and Assistant Vice President, Invesco Advisers, Inc., Invesco Aim Capital Management, Inc. and Invesco Aim Private Asset Management, Inc.; and Treasurer, PowerShares Exchange-Traded Fund Trust, PowerShares Exchange-Traded Fund Trust II, PowerShares India Exchange-Traded Fund Trust and PowerShares Actively Managed Exchange-Traded Fund Trust | N/A | N/A | ||||
T-3 Invesco American Franchise Fund
Trustees and Officers—(continued)
Name, Year of Birth and Position(s) Held with the Trust | Trustee and/ or Officer Since | Principal Occupation(s) During Past 5 Years | Number of Funds in Fund Complex Overseen by Trustee | Other Directorship(s) Past 5 Years | ||||
| Other Officers—(continued) | ||||||||
Karen Dunn Kelley — 1960 Vice President | 2003 | Senior Managing Director, Investments; Director, Co-President, Co-Chief Executive Officer, and Co-Chairman, Invesco Advisers, Inc. (formerly known as Invesco Institutional (N.A.), Inc.) (registered investment adviser); Chairman, Invesco Senior Secured Management, Inc.; Senior Vice President, Invesco Management Group, Inc. (formerly known as Invesco Aim Management Group, Inc.); Executive Vice President, Invesco Distributors, Inc. (formerly known as Invesco Aim Distributors, Inc.); Director, Invesco Mortgage Capital Inc. and Invesco Management Company Limited; Director and President, INVESCO Asset Management (Bermuda) Ltd., Vice President, The Invesco Funds (other than AIM Treasurer’s Series Trust (Invesco Treasurer’s Series Trust) and Short-Term Investments Trust); and President and Principal Executive Officer, The Invesco Funds (AIM Treasurer’s Series Trust (Invesco Treasurer’s Series Trust) and Short-Term Investments Trust only)
Formerly: Director, INVESCO Global Asset Management Limited and INVESCO Management S.A.; Senior Vice President, Van Kampen Investments Inc. and Invesco Advisers, Inc. (formerly known as Invesco Institutional (N.A.), Inc.) (registered investment adviser); Vice President, Invesco Advisers, Inc. (formerly known as Invesco Institutional (N.A.), Inc.); Director of Cash Management and Senior Vice President, Invesco Advisers, Inc. and Invesco Aim Capital Management, Inc.; Director and President, Fund Management Company; Chief Cash Management Officer, Director of Cash Management, Senior Vice President, and Managing Director, Invesco Aim Capital Management, Inc.; Director of Cash Management, Senior Vice President, and Vice President, Invesco Advisers, Inc. and The Invesco Funds (AIM Treasurer’s Series Trust (Invesco Treasurer’s Series Trust), and Short-Term Investments Trust only) | N/A | N/A | ||||
Crissie M. Wisdom — 1969 Anti-Money Laundering Compliance Officer | 2013 | Anti-Money Laundering Compliance Officer, Invesco Advisers, Inc. (formerly known as Invesco Institutional (N.A.), Inc.) (registered investment adviser), Invesco Capital Markets, Inc. (formerly known as Van Kampen Funds Inc.), Invesco Distributors, Inc., Invesco Investment Services, Inc., Invesco Management Group, Inc., Van Kampen Exchange Corp., The Invesco Funds, and PowerShares Exchange-Traded Fund Trust, PowerShares Exchange-Traded Fund Trust II, PowerShares India Exchange-Traded Fund Trust, and PowerShares Actively Managed Exchange-Traded Fund Trust; and Fraud Prevention Manager and Controls and Risk Analysis Manager for Invesco Investment Services, Inc. | N/A | N/A | ||||
Todd L. Spillane — 1958 Chief Compliance Officer | 2006 | Senior Vice President, Invesco Management Group, Inc. (formerly known as Invesco Aim Management Group, Inc.) and Van Kampen Exchange Corp.; Senior Vice President and Chief Compliance Officer, Invesco Advisers, Inc. (registered investment adviser) (formerly known as Invesco Institutional (N.A.), Inc.); Chief Compliance Officer, The Invesco Funds; Vice President, Invesco Distributors, Inc. (formerly known as Invesco Aim Distributors, Inc.) and Invesco Investment Services, Inc. (formerly known as Invesco Aim Investment Services, Inc.)
Formerly: Chief Compliance Officer, Invesco Funds (Chicago); Senior Vice President, Van Kampen Investments Inc.; Senior Vice President and Chief Compliance Officer, Invesco Aim Advisers, Inc. and Invesco Aim Capital Management, Inc.; Chief Compliance Officer, INVESCO Private Capital Investments, Inc. (holding company), Invesco Private Capital, Inc. (registered investment adviser), Invesco Global Asset Management (N.A.), Inc., Invesco Senior Secured Management, Inc. (registered investment adviser), Van Kampen Investor Services Inc., PowerShares Exchange-Traded Fund Trust, PowerShares Exchange-Traded Fund Trust II, PowerShares India Exchange-Traded Fund Trust and PowerShares Actively Managed Exchange-Traded Fund Trust; and Vice President, Invesco Aim Capital Management, Inc. and Fund Management Company | N/A | N/A |
The Statement of Additional Information of the Trust includes additional information about the Fund’s Trustees and is available upon request, without charge, by calling 1.800.959.4246. Please refer to the Fund’s prospectus for information on the Fund’s sub-advisers.
Office of the Fund 11 Greenway Plaza, Suite 1000 Houston, TX 77046-1173 | Investment Adviser Invesco Advisers, Inc. 1555 Peachtree Street, N.E. Atlanta, GA 30309 | Distributor Invesco Distributors, Inc. 11 Greenway Plaza, Suite 1000 Houston, TX 77046-1173 | Auditors PricewaterhouseCoopers LLP 1201 Louisiana Street, Suite 2900 Houston, TX 77002-5678 | |||
Counsel to the Fund Stradley Ronon Stevens & Young, LLP 2005 Market Street, Suite 2600 Philadelphia, PA 19103-7018 | Counsel to the Independent Trustees Goodwin Procter LLP 901 New York Avenue, N.W. Washington, D.C. 20001 | Transfer Agent Invesco Investment Services, Inc. 11 Greenway Plaza, Suite 1000 Houston, TX 77046-1173 | Custodian State Street Bank and Trust Company 225 Franklin Street Boston, MA 02110-2801 | |||
T-4 Invesco American Franchise Fund

Invesco mailing information
Send general correspondence to Invesco Investment Services, Inc., P.O. Box 219078, Kansas City, MO 64121-9078.
Important notice regarding delivery of security holder documents
To reduce Fund expenses, only one copy of most shareholder documents may be mailed to shareholders with multiple accounts at the same address (Householding). Mailing of your shareholder documents may be householded indefinitely unless you instruct us otherwise. If you do not want the mailing of these documents to be combined with those for other members of your household, please contact Invesco Investment Services, Inc. at 800 959 4246 or contact your financial institution. We will begin sending you individual copies for each account within 30 days after receiving your request.
Fund holdings and proxy voting information
The Fund provides a complete list of its holdings four times in each fiscal year, at the quarter ends. For the second and fourth quarters, the lists appear in the Fund’s semiannual and annual reports to shareholders. For the first and third quarters, the Fund files the lists with the Securities and Exchange Commission (SEC) on Form N-Q. The most recent list of portfolio holdings is available at invesco.com/completeqtrholdings. Shareholders can also look up the Fund’s Forms N-Q on the SEC website at sec.gov. Copies of the Fund’s Forms N-Q may be reviewed and copied at the SEC Public Reference Room in Washington, D.C. You can obtain information on the operation of the Public Reference Room, including information about duplicating fee charges, by calling 202 551 8090 or 800 732 0330, or by electronic request at the following email address: publicinfo@sec.gov. The SEC file numbers for the Fund are shown below.
A description of the policies and procedures that the Fund uses to determine how to vote proxies relating to portfolio securities is available without charge, upon request, from our Client Services department at 800 959 4246 or at invesco.com/proxyguidelines. The information is also available on the SEC website, sec.gov.
Information regarding how the Fund voted proxies related to its portfolio securities during the most recent 12-month period ended June 30 is available at invesco.com/proxysearch. The information is also available on the SEC website, sec.gov. Invesco Advisers, Inc. is an investment adviser; it provides investment advisory services to individual and institutional clients and does not sell securities. Invesco Distributors, Inc. is the US distributor for Invesco Ltd.’s retail mutual funds, exchange-traded funds and institutional money market funds. Both are wholly owned, indirect subsidiaries of Invesco Ltd. |  |
| SEC file numbers: 811-09913 and 333-36074 | VK-AMFR-AR-1 | Invesco Distributors, Inc. |
Letters to Shareholders
Philip Taylor | Dear Shareholders: This annual report includes information about your Fund, including performance data and a complete list of its investments as of the close of the reporting period. Inside, your Fund’s portfolio managers discuss how they managed your Fund and the factors that affected its performance during the reporting period. I hope you find this report of interest. During the reporting period covered by this report, the US economy showed signs of continued improvement. After contracting in the first quarter of 2014, the economy expanded strongly in the second quarter and unemployment trended lower. Much of the credit for this improvement goes to the US Federal Reserve (the Fed), which undertook an extraordinary asset purchase program following the global financial crisis. The Fed’s goal was to jumpstart the economy by encouraging banks to lend more, businesses to hire more and consumers to spend more. Signs of a stronger US economy prompted the Fed to reduce, or “taper,” its asset purchase program. Despite this, |

interest rates remained near historical low levels due largely to heavy investor demand for bonds. While signs of economic improvement were evident in the US, European economies remained relatively stagnant. During the reporting period, high unemployment persisted, worries about potential deflation grew, and uncertainty about Russian-Ukrainian tensions weighed on European markets.
Extended periods of market strength can lull investors into complacency – just as prolonged periods of market weakness or volatility can discourage investors from initiating long-term investment plans. That’s why Invesco has always encouraged investors to work with a professional financial adviser who can stress the importance of starting to save and invest early and the importance of adhering to a disciplined investment plan – when times are good and when they’re uncertain. A financial adviser who knows your unique financial situation, investment goals and risk tolerance can be an invaluable partner as you seek to achieve your financial goals. He or she can offer a long-term perspective when markets are volatile and time-tested advice and guidance when your financial situation or investment goals change.
Timely information when and where you want it
Invesco’s efforts to help investors achieve their financial objectives include providing individual investors and financial professionals with timely information about the markets, the economy and investing – whenever and wherever they want it.
Our website, invesco.com/us, offers a wide range of market insights and investment perspectives. On the website, you’ll find detailed information about our funds, including prices, performance, holdings and portfolio manager commentaries. You can access information about your individual Invesco account whenever it’s convenient for you; just complete a simple, secure online registration. Use the “Login” box on our home page to get started.
Invesco’s mobile app for iPad® (available free from the App StoreSM) allows you to obtain the same detailed information about your Fund and the same investment insights from our investment leaders, market strategists, economists and retirement experts on the go. You also can watch portfolio manager videos and have instant access to Invesco news and updates wherever you may be.
In addition to the resources accessible on our website and through our mobile app, you can obtain timely updates to help you stay informed about the markets, the economy and investing by connecting with Invesco on Twitter, LinkedIn or Facebook. You can access our blog at blog.invesco.us.com or by clicking the “Intentional Investing Forum” link on our home page. Our goal is to provide you the information you want, when and where you want it.
Have questions?
For questions about your account, feel free to contact an Invesco client services representative at 800 959 4246. For Invesco-related questions or comments, please email me directly at phil@invesco.com.
All of us at Invesco look forward to serving your investment management needs for many years to come. Thank you for investing with us.
Sincerely,

Philip Taylor
Senior Managing Director, Invesco Ltd.
iPad is a trademark of Apple Inc., registered in the US and other countries. App Store is a service mark of Apple Inc. Invesco Distributors, Inc. is not affiliated with Apple Inc.
2 Invesco California Tax-Free Income Fund
Bruce Crockett | Dear Fellow Shareholders: There are a variety of factors that can impact investment performance, many of which are uncontrollable by us as investors. These factors can include various economic trends and geopolitical developments. While the members of the Invesco Funds Board, which I chair, can’t dictate the performance of the Invesco funds, be assured that your Board works diligently throughout the year to focus on how your investments are managed. Our job is to represent you and your interests on a variety of fund management-related matters. We regularly monitor how the portfolio management teams of the Invesco funds are performing in light of ever-changing and often unpredictable economic and market conditions. We review the investment strategies and investment process employed by each fund’s management team as explained in the fund’s prospectus. Perhaps our most significant responsibility is conducting the annual review of the funds’ |

advisory and sub-advisory contracts with Invesco Advisers and its affiliates. This annual review, which is required by the Investment Company Act of 1940, focuses on the nature and quality of the services Invesco provides as the adviser to the Invesco funds and the reasonableness of the fees that it charges for those services. Each year, we spend months carefully reviewing information from Invesco that allows us to evaluate the quality of its services and the reasonableness of its fees. We also use information from a variety of independent sources, including materials provided by the independent senior officer of the Invesco funds, who reports directly to the independent trustees on the Board. Additionally, we meet with legal counsel and review performance and fee data prepared for us by Lipper Inc., an independent, third-party firm widely recognized as a leader in its field.
After a careful review, the members of the Invesco Funds Board approved the continuation of advisory and sub-advisory contracts with Invesco Advisers and its affiliates. Be assured that your Board will continue working on behalf of fund shareholders, keeping your needs and interests uppermost in our minds.
As always, please contact me at bruce@brucecrockett.com with any questions or concerns you may have. On behalf of the Board, we look forward to continuing to represent your interests and serving your needs.
Sincerely,

Bruce L. Crockett
Independent Chair
Invesco Funds Board of Trustees
3 Invesco California Tax-Free Income Fund
Management’s Discussion of Fund Performance
Performance summary
Invesco California Tax-Free Income Fund posted positive returns for the fiscal year ended August 31, 2014. At net asset value (NAV), the Fund outperformed its broad market index, the S&P Municipal Bond Index, and its style-specific index, the Barclays California Municipal Index. The Fund’s selection in longer-duration bonds (12+ years) was the primary contributor to its performance versus its style-specific benchmark.
Your Fund’s long-term performance appears later in this report.
Fund vs. Indexes
Total returns, 8/31/13 to 8/31/14, at net asset value (NAV). Performance shown does not include applicable contingent deferred sales charges (CDSC) or front-end sales charges, which would have reduced performance.
Class A Shares | 13.14 | % | ||
Class B Shares | 13.35 | |||
Class C Shares | 12.62 | |||
Class Y Shares | 13.48 | |||
S&P Municipal Bond Indexq (Broad Market Index)* | 10.55 | |||
Barclays California Municipal Indexq | ||||
(Style-Specific Index and Former Broad Market Index)* | 11.85 | |||
Lipper California Municipal Debt Funds Indexn (Peer Group Index) | 13.29 |
Source(s): qFactSet Research Systems Inc.; nLipper Inc.
| * | The Fund has elected to use the S&P Municipal Bond Index as its broad market index, rather than the Barclays California Municipal Index because the adviser believes that the S&P Municipal Bond Index more closely reflects the performance of the broad US municipal bond market. The Barclays California Municipal Index will serve only as the Fund’s style-specific benchmark. |
How we invest
The Fund normally invests at least 80% of its assets in securities that pay interest exempt from federal and California state income tax. We generally invest the Fund’s assets in investment-grade California municipal obligations that generally fall within the four highest grades by Moody’s Investors Service, Inc. (Moody’s), Standard & Poor’s Ratings Group (S&P) or Fitch Ratings (Fitch), at time of purchase.
The principal types of municipal debt securities purchased by the Fund are revenue obligation and general obligation. Under normal market conditions, the Fund invests primarily in municipal securities classified as revenue bonds. To meet its investment objective, the Fund invests in different types of general
obligation and revenue obligation securities, including fixed and variable rate securities, municipal notes, variable rate demand notes, municipal leases, custodial receipts, and participation certificates. The Fund may also invest in other types of municipal securities.
We may also invest in unrated securities that we judge to be of comparable quality to the securities described above. Additionally, we may invest up to 20% of the Fund’s net assets in municipal obligations rated below investment grade at the time of purchase or, if unrated, of comparable quality as we determine.
We buy and sell California municipal securities seeking a high level of current income exempt from federal and California income tax that we believe entail reasonable
credit risk considered in relation to the investment policies of the Fund. In selecting securities for purchase and sale, we use our research capabilities to identify and monitor investment opportunities. In conducting research and analysis, we consider a number of factors, including general market and economic conditions, credit, interest rate and prepayment risk.
We typically sell portfolio securities when our assessments of any of these factors materially change. Measures of interest rate risk that we evaluate include duration, coupon maturity and call protection. Measures of credit risk that we evaluate include individual issuer analysis, sector weightings, geographic distribution and quality spreads.
Market conditions and your Fund
During the reporting period, California’s fiscal situation improved significantly, driven by economic growth, a declining unemployment rate and an improving housing market. The state benefits from a large, diverse economy, high wealth levels and a moderate debt burden. As the largest state, California’s economy represents nearly 13% of US gross domestic product (GDP).1 California’s financial performance is volatile relative to most states with revenues sensitive to both GDP and equity market valuations, stemming from the high percentage of personal income taxes collected from a small population of California’s highest income earners. The passage of temporary tax increases in 2012 improved the state’s financial standing, but also increased the sensitivity of tax revenues to the economic cycle.
Throughout the reporting period, fundamentals for municipal debt issuers improved on the whole. State fundamentals improved as more governors across the nation exercised fiscal restraint. Local governments experienced a credit rally in
Portfolio Composition | ||||
By security type, based on total investments
|
| |||
Revenue Bonds | 79.7 | % | ||
General Obligation Bonds | 16.2 | |||
Pre-Refunded Bonds | 4.1 | |||
Top Five Fixed Income Holdings
|
| |||||
1. | Long Beach (City of) Financing Authority; Series 1992 | 3.7 | % | |||
2. | Southern California Metropolitan Water District; Series 2009 B | 2.8 | ||||
3. | California State University; Series 2005-A | 2.2 | ||||
4. | Bay Area Toll Authority (San Francisco Bay Area); Series 2009 F-1 | 1.7 | ||||
5. | California (State of); Series 2009 | 1.7 | ||||
Total Net Assets | $ | 355.5 million | ||
| Total Number of Holdings | 206 | |||
The Fund’s holdings are subject to change, and there is no assurance that the Fund will continue to hold any particular security.
4 Invesco California Tax-Free Income Fund
2014 driven by property tax revenues. Rebounding home prices, a rising stock market and a growing economy lifted tax collection by local governments.
Income from municipal bonds became attractive after a volatile 2013 drove yields higher. 2013 marked the second consecutive year of negative annual total returns for municipal bonds as investment-grade municipal bonds, as measured by the Barclays Municipal Bond Index, finished the year down -2.55%; high yield municipal bonds, as measured by the Barclays High Yield Municipal Bond Index, also finished the year down -5.51%.2 Further adding to the volatility, the asset class experienced an unprecedented $67.6 billion outflow from March through December of 2013.3 However, investors who showed conviction through the 2013 sell-off and stayed the course were rewarded with strong positive returns during the first eight months of 2014.
During the fiscal year, investment-grade municipal bonds returned 10.14%, as measured by the Barclays Municipal Bond Index, and high yield municipal bonds returned 14.74%, as measured by the Barclays High Yield Municipal Bond Index.2 The Fund’s style-specific index returned 11.85% for the fiscal year. Municipal bonds posted positive returns as Treasury and municipal rates moved lower and investors showed renewed interest in tax-exempt bonds. The rally in Treasuries was driven primarily by softer-than-expected, but still positive, economic data. Despite the Federal Reserve’s continued reduction of quantitative easing, the market expected interest rate increases based on expectations of gradual improvement in unemployment rate and low inflation projections. Through the first half of 2014, municipal bonds rallied along with Treasuries, primarily due to a positive shift in investor sentiment for the asset class. The long end of the yield curve outperformed as long municipal rates followed Treasuries lower and the yield curve flattened.
The municipal bonds asset class added $14.7 billion during the first eight months of 2014, a stark reversal of the outflows in 2013.4 The influx of investors back into the asset class at the start of 2014 allowed municipal bond prices to recover from oversold valuations in 2013. Positive municipal bond performance in the first quarter of 2014 was an impetus for continued interest from investors.
The level of issuance, however, dwindled as the first half of 2014 saw $152 billion in bond issuance, the second-lowest first half issuance in at least a decade, and 22% below the 10-year average.5 This continued the downward trend from
2013, when issuance was curtailed in the second half of the year as higher interest rates made refinancing transactions uneconomic for many issuers.
For the reporting period, the Fund’s selection in long-duration bonds (12+ years) was the primary contributor to its relative performance versus its broad market and style-specific benchmarks. An allocation to holdings at the shorter end of the yield curve (0-2 years) slightly offset the gains from the long end of the curve. Further contributing to relative performance was security selection in AA rated holdings.†
The Fund had a small off-index allocation to Puerto Rico revenue bonds, which detracted from relative performance. The market punished Puerto Rico bonds after they were downgraded, but overall, investor fears seemed to subside during the first quarter of 2014 as most municipal bond participants came to realize that the issues that plagued Puerto Rico were not characteristic of the broader municipal market. Puerto Rico bonds are held in single-state municipal funds as a tool to diversify risk and because of their triple tax-exempt status (federal, state and local).
During the reporting period, leverage contributed positively to Fund performance. The Fund achieved a leveraged position through the use of inverse floating rate securities. The Fund uses leverage because we believe that, over time, leveraging provides opportunities for additional income and total return for shareholders. However, the use of leverage also can expose shareholders to additional volatility. For more information about the Fund’s use of leverage, see the Notes to Financial Statements later in this report.
Thank you for investing in Invesco California Tax-Free Income Fund and for sharing our long-term investment horizon.
| † | A credit rating is an assessment provided by a nationally recognized statistical rating organization (NRSRO) of the creditworthiness of an issuer with respect to debt obligations, including specific securities, money market instruments or other debts. Ratings are measured on a scale that generally ranges from AAA (highest) to D (lowest); ratings are subject to change without notice. “Non-Rated” indicates the debtor was not rated, and should not be interpreted as indicating low quality. For more information on rating methodologies, please visit the following NRSRO websites: standardandpoors. com and select Understanding Ratings” under Rating Resources on the homepage; moodys.com and select “Rating Methodologies” under Research and Ratings on the homepage; and fitchratings.com and select “Ratings Definitions” on the homepage. |
| 1 | Moody’s |
| 2 | Barclays |
| 3 | Morningstar |
| 4 | Investment Company Institute |
| 5 | The Bond Buyer |
The views and opinions expressed in management’s discussion of Fund performance are those of Invesco Advisers, Inc. These views and opinions are subject to change at any time based on factors such as market and economic conditions. These views and opinions may not be relied upon as investment advice or recommendations, or as an offer for a particular security. The information is not a complete analysis of every aspect of any market, country, industry, security or the Fund. Statements of fact are from sources considered reliable, but Invesco Advisers, Inc. makes no representation or warranty as to their completeness or accuracy. Although historical performance is no guarantee of future results, these insights may help you understand our investment management philosophy.
See important Fund and, if applicable, index disclosures later in this report.
 | Thomas Byron Portfolio Manager, is manager of Invesco California Tax-Free Income Fund. He joined Invesco in | |
| 2010. Mr. Byron earned a BS in finance from Marquette University and an MBA in finance from DePaul University. | ||
 | Robert Stryker Chartered Financial Analyst, Portfolio Manager, is manager of Invesco California Tax-Free Income | |
| Fund. He joined Invesco in 2010. Mr. Stryker earned a BS in finance from the University of Illinois at Chicago. | ||
 | Julius Williams Portfolio Manager, is manager of Invesco California Tax-Free Income Fund. He joined Invesco in | |
| 2010. Mr. Williams earned a BA in economics and sociology and a Master of Education degree in educational psychology from the University of Virginia. | ||
 | Robert Wimmel Portfolio Manager, is manager of Invesco California Tax-Free Income Fund. He joined Invesco in | |
| 2010. Mr. Wimmel earned a BA in anthropology from the University of Cincinnati and an MA in economics from the University of Illinois at Chicago. | ||
5 Invesco California Tax-Free Income Fund
Your Fund’s Long-Term Performance
Results of a $10,000 Investment – Oldest Share Class(es)
Fund and index data from 8/31/04
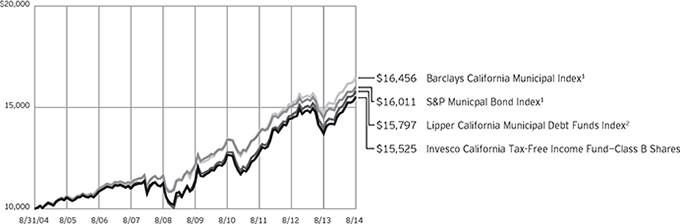
| 1 | Source: FactSet Research Systems Inc. |
| 2 | Source: Lipper Inc. |
Past performance cannot guarantee comparable future results.
The Fund has elected to use the S&P Municipal Bond Index as its broad market index, rather than the Barclays California Municipal Index because the adviser believes that the S&P Municipal Bond Index more closely reflects the performance of the broad US municipal bond market. The Barclays California Municipal Index will serve only as the Fund’s style-specific benchmark.
The data shown in the chart include reinvested distributions, applicable sales charges and Fund expenses including management fees. Results for Class B shares are calculated as if a hypothetical shareholder had liquidated his entire investment in the Fund at the close of the reporting period and paid the contingent deferred sales charges, if applicable. Index results include reinvested dividends, but they do not reflect sales charges. Performance of the peer group, if applicable,
reflects fund expenses and management fees; performance of a market index does not. Performance shown in the chart and table(s) does not reflect deduction of taxes a shareholder would pay on Fund distributions or sale of Fund shares.
6 Invesco California Tax-Free Income Fund
Average Annual Total Returns
As of 8/31/14, including maximum applicable
sales charges
Class A Shares | ||||
Inception (7/28/97) | 4.38 | % | ||
10 Years | 3.98 | |||
5 Years | 5.63 | |||
1 Year | 8.31 | |||
Class B Shares | ||||
Inception (7/11/84) | 6.30 | % | ||
10 Years | 4.50 | |||
5 Years | 6.27 | |||
1 Year | 8.35 | |||
Class C Shares | ||||
Inception (7/28/97) | 4.14 | % | ||
10 Years | 3.92 | |||
5 Years | 6.02 | |||
1 Year | 11.62 | |||
Class Y Shares | ||||
Inception (7/28/97) | 4.91 | % | ||
10 Years | 4.71 | |||
5 Years | 6.82 | |||
1 Year | 13.48 | |||
Effective June 1, 2010, Class A, Class B, Class C and Class I shares of the predecessor fund, Morgan Stanley California Tax-Free Income Fund, advised by Morgan Stanley Investment Advisors Inc. were reorganized into Class A, Class B, Class C and Class Y shares, respectively, of Invesco California Tax-Free Income Fund. Returns shown above for Class A, Class B, Class C and Class Y shares are blended returns of the predecessor fund and Invesco California Tax-Free Income Fund. Share class returns will differ from the predecessor fund because of different expenses.
The performance data quoted represent past performance and cannot guarantee comparable future results; current performance may be lower or higher. Please visit invesco.com/performance for the most recent month-end performance. Performance figures reflect reinvested distributions, changes in net asset value and the effect of the maximum sales charge unless otherwise stated. Investment return and principal value will fluctuate so that you may have a gain or loss when you sell shares.
Average Annual Total Returns
As of 6/30/14, the most recent calendar quarter end, including maximum applicable sales charges
Class A Shares | ||||
Inception (7/28/97) | 4.30 | % | ||
10 Years | 4.11 | |||
5 Years | 6.05 | |||
1 Year | 2.80 | |||
Class B Shares | ||||
Inception (7/11/84) | 6.27 | % | ||
10 Years | 4.62 | |||
5 Years | 6.71 | |||
1 Year | 2.64 | |||
Class C Shares | ||||
Inception (7/28/97) | 4.06 | % | ||
10 Years | 4.05 | |||
5 Years | 6.45 | |||
1 Year | 5.94 | |||
Class Y Shares | ||||
Inception (7/28/97) | 4.83 | % | ||
10 Years | 4.83 | |||
5 Years | 7.23 | |||
1 Year | 7.72 | |||
The total annual Fund operating expense ratio set forth in the most recent Fund prospectus as of the date of this report for Class A, Class B, Class C and Class Y shares was 0.89%, 0.93%, 1.40% and 0.65%, respectively. The expense ratios presented above may vary from the expense ratios presented in other sections of this report that are based on expenses incurred during the period covered by this report.
Class A share performance reflects the maximum 4.25% sales charge, and Class B and Class C share performance reflects the applicable contingent deferred sales charge (CDSC) for the period involved. The CDSC on Class B shares declines from 5% beginning at the time of purchase to 0% at the beginning of the seventh year. The CDSC on Class C shares is 1% for the first year after purchase. Class Y shares do not have a front-end sales charge or a CDSC; therefore, performance is at net asset value.
The performance of the Fund’s share classes will differ primarily due to different sales charge structures and class expenses.
7 Invesco California Tax-Free Income Fund
Invesco California Tax-Free Income Fund’s investment objective is to provide a high level of current income exempt from federal and California income tax, consistent with the preservation of capital.
| n | Unless otherwise stated, information presented in this report is as of August 31, 2014, and is based on total net assets. |
| n | Unless otherwise noted, all data provided by Invesco. |
| n | To access your Fund’s reports/prospectus, visit invesco.com/fundreports. |
About share classes
| n | Class B shares may not be purchased for new or additional investments. Please see the prospectus for more information. |
| n | Class Y shares are available to only certain investors. Please see the prospectus for more information. |
Principal risks of investing in the Fund
| n | Alternative minimum tax risk. A portion of the Fund’s otherwise tax-exempt income may be taxable to those shareholders subject to the federal alternative minimum tax. |
| n | Bond insurance risk. Some of the municipal obligations in which the Fund invests will be covered by insurance at the time of issuance or at a later date. Such insurance guarantees that interest payments on a bond will be made on time and that principal will be repaid when the bond matures. Insured municipal obligations would generally be assigned a lower rating if the rating were based primarily on the credit quality of the issuer without regard to the insurance feature. If the claims-paying ability of the insurer were downgraded, the ratings on the municipal obligations it insures may also be downgraded. Insurance does not protect the Fund against losses caused by declines in a bond’s value due to a change in market conditions. |
| n | California and US territories municipal securities risk. The Fund is more susceptible to political, economic, regulatory or other factors affecting issuers of California municipal securities than a fund that does not limit its investments to such issuers. As with California municipal securities, events in any of the territories where the Fund is invested may affect the Fund’s investments and its performance. |
| n | Call risk. If interest rates fall, it is possible that issuers of debt securities with high interest rates will prepay or call their securities before their maturity |
dates. In this event, the proceeds from the called securities would likely be reinvested by the Fund in securities bearing the new, lower interest rates, resulting in a possible decline in the Fund’s income and distributions to shareholders. |
| n | Credit risk. The issuer of instruments in which the Fund invests may be unable to meet interest and/or principal payments, thereby causing its instruments to decrease in value and lowering the issuer’s credit rating. |
| n | Derivatives risk. The value of a derivative instrument depends largely on (and is derived from) the value of an underlying security, currency, commodity, interest rate, index or other asset (each referred to as an underlying asset). In addition to risks relating to the underlying assets, the use of derivatives may include other, possibly greater, risks, including counterparty, leverage and liquidity risks. Counterparty risk is the risk that the counterparty to the derivative contract will default on its obligation to pay the Fund the amount owed or otherwise perform under the derivative contract. Derivatives create leverage risk because they do not require payment up front equal to the economic exposure created by owning the derivative. As a result, an adverse change in the value of the underlying asset could result in the Fund sustaining a loss that is substantially greater than the amount invested in the derivative, which may make the Fund’s returns more volatile and increase the risk of loss. Derivative instruments may also be less liquid than more traditional investments and the Fund may be unable to sell or close out its derivative positions at a desirable time or price. This risk may be more acute under adverse market conditions, during which the Fund may be most in need of liquidating its derivative positions. Derivatives may also be harder to value, less tax efficient and subject to changing government regulation |
that could impact the Fund’s ability to use certain derivatives or their cost. Also, derivatives used for hedging or to gain or limit exposure to a particular market segment may not provide the expected benefits, particularly during adverse market conditions. |
| n | High yield bond (junk bond) risk. Junk bonds involve a greater risk of default or price changes due to changes in the credit quality of the issuer. The values of junk bonds fluctuate more than those of high- quality bonds in response to company, political, regulatory or economic developments. Values of junk bonds can decline significantly over short periods of time. |
| n | Income risk. The income you receive from the Fund is based primarily on prevailing interest rates, which can vary widely over the short- and long-term. If interest rates drop, your income from the Fund may drop as well. |
| n | Interest rate risk. Interest rate risk refers to the risk that bond prices generally fall as interest rates rise; conversely, bond prices generally rise as interest rates fall. Specific bonds differ in their sensitivity to changes in interest rates depending on their individual characteristics, including duration. |
| n | Inverse floating rate obligations risk. Inverse floating rate obligations, including tender option bonds, may be subject to greater price volatility than a fixed income security with similar qualities. When short-term interest rates rise, they may decrease in value and produce less or no income. Additionally, these securities may lose principal. Similar to derivatives, inverse floating rate obligations have the following risks: counterparty, leverage, correlation, liquidity, market, interest rate, and management risks. |
| n | Leverage risk. Leverage exists when the Fund purchases or sells an instrument or enters into a transaction without investing cash in an amount equal to the full economic exposure of the asset or transaction and the Fund could lose more than it invested. Leverage created from certain types of transactions or instruments may impair the Fund’s liquidity, cause it to liquidate positions at an unfavorable time, increase volatility or otherwise not achieve its intended objective. |
continued on page 9
This report must be accompanied or preceded by a currently effective Fund prospectus, which contains more complete information, including sales charges and expenses. Investors should read it carefully before investing.
| NOT FDIC INSURED | MAY LOSE VALUE | NO BANK GUARANTEE |
| 8 Invesco California Tax-Free Income Fund |
| n | Liquidity risk. The Fund may hold illiquid securities that it is unable to sell at the preferred time or price and could lose its entire investment in such securities. |
| n | Management risk. The investment techniques and risk analysis used by the Fund’s portfolio managers may not produce the desired results. |
| n | Market risk. The prices of and the income generated by the Fund’s securities may decline in response to, among other things, investor sentiment, general economic and market conditions, regional or global instability, and currency and interest rate fluctuations. |
| n | Medium-and lower-grade municipal securities risk. Securities which are in the medium- and lower-grade categories generally offer higher yields than are offered by higher-grade securities of similar maturity, but they also generally involve more volatility and greater risks, such as greater credit risk, market risk, liquidity risk, management risk, and regulatory risk. Furthermore, many medium- and lower-grade securities are not listed for trading on any national securities exchange and many issuers of medium- and lower-grade securities choose not to have a rating assigned to their obligations by any nationally recognized statistical rating organization. As a result, the Fund’s portfolio may consist of a higher portion of unlisted or unrated securities as compared with an investment company that invests solely in higher-grade securities. Unrated securities are usually not as attractive to as many buyers as are rated securities, a factor which may make unrated securities less marketable. These factors may have the effect of limiting the availability of the securities for purchase by the Fund and may also limit the ability of the Fund to sell such securities at their fair value either to meet redemption requests or in response to changes in the economy or the financial markets. |
| n | Municipal issuer focus risk. The Fund generally considers investments in municipal securities not to be subject to industry concentration policies (issuers of municipal securities as a group is not an industry) and the Fund may invest in municipal securities issued by entities having similar characteristics. The issuers may be located in the same geographic area or may pay their interest obligations from revenue of similar projects, such as hospitals, airports, utility systems and housing finance agencies. This may make the Fund’s investments more susceptible to similar social, |
economic, political or regulatory occurrences. As the similarity in issuers increases, the potential for fluctuation in the Fund’s net asset value also increases. |
| n | Municipal securities risk. The Fund may invest in municipal securities. Constitutional amendments, legislative enactments, executive orders, administrative regulations, voter initiatives, and the issuer’s regional economic conditions may affect the municipal security’s value, interest payments, repayment of principal and the Fund’s ability to sell it. Failure of a municipal security issuer to comply with applicable tax requirements may make income paid thereon taxable, resulting in a decline in the security’s value. In addition, there could be changes in applicable tax laws or tax treatments that reduce or eliminate the current federal income tax exemption on municipal securities or otherwise adversely affect the current federal or state tax status of municipal securities. |
| n | Reinvestment risk. Reinvestment risk is the risk that a bond’s cash flows (coupon income and principal repayment) will be reinvested at an interest rate below that on the original bond. |
| n | Variable-rate demand notes risk. The absence of an active secondary market for certain variable and floating rate notes could make it difficult to dispose of the instruments, and a portfolio could suffer a loss if the issuer defaults during periods in which a portfolio is not entitled to exercise its demand rights. |
| n | When-issued and delayed delivery risk. When-issued and delayed delivery transactions are subject to market risk as the value or yield of a security at delivery may be more or less than the purchase price or the yield generally available on securities when delivery occurs. In addition, the Fund is subject to counterparty risk because it relies on the buyer or seller, as the case may be, to consummate the transaction, and failure by the other party to complete the transaction may result in the Fund missing the opportunity of obtaining a price or yield considered to be advantageous. |
| n | Zero coupon or pay-in-kind securities risk. The value, interest rates, and liquidity of non-cash paying instruments, such as zero coupon and pay-in-kind securities, are subject to greater fluctuation than other types of securities. The higher yields and interest rates on pay-in-kind securities reflect the payment deferral and increased credit risk associated with such instruments and that such investments may represent a higher credit risk than |
coupon loans. Pay-in-kind securities may have a potential variability in valuations because their continuing accruals require continuing judgments about the collectability of the deferred payments and the value of any associated collateral. |
About indexes used in this report
| n | The S&P Municipal Bond Index is a broad, market value-weighted index that seeks to measure the performance of the US municipal bond market. |
| n | The Barclays California Municipal Index is an unmanaged index considered representative of California investment-grade municipal bonds. |
| n | The Lipper California Municipal Debt Funds Index is an unmanaged index considered representative of California municipal debt funds tracked by Lipper. |
| n | The Barclays Municipal Bond Index is an unmanaged index considered representative of the tax-exempt bond market. |
| n | The Barclays High Yield Municipal Bond Index is an unmanaged index considered representative of noninvestment-grade bonds. |
| n | The Fund is not managed to track the performance of any particular index, including the index(es) described here, and consequently, the performance of the Fund may deviate significantly from the performance of the index(es). |
| n | A direct investment cannot be made in an index. Unless otherwise indicated, index results include reinvested dividends, and they do not reflect sales charges. Performance of the peer group, if applicable, reflects fund expenses; performance of a market index does not. |
Other information
| n | The returns shown in management’s discussion of Fund performance are based on net asset values (NAVs) calculated for shareholder transactions. Generally accepted accounting principles require adjustments to be made to the net assets of the Fund at period end for financial reporting purposes, and as such, the NAVs for shareholder transactions and the returns based on those NAVs may differ from the NAVs and returns reported in the Financial Highlights. |
9 Invesco California Tax-Free Income Fund
Schedule of Investments
August 31, 2014
| Interest Rate | Maturity Date | Principal Amount (000) | Value | |||||||||||||
Municipal Obligations–106.70% | ||||||||||||||||
| California–102.65% | ||||||||||||||||
ABAG Finance Authority For Nonprofit Corps. (Sharp HealthCare); Series 2014 A, RB | 5.00 | % | 08/01/43 | $ | 500 | $ | 554,210 | |||||||||
Adelanto (City of) Public Utility Authority (Utility System); Series 2009 A, Ref. RB | 6.75 | % | 07/01/39 | 1,000 | 1,125,680 | |||||||||||
Alhambra (City of) (Atherton Baptist Homes); Series 2010 A, RB | 7.63 | % | 01/01/40 | 1,575 | 1,676,603 | |||||||||||
Alhambra Unified School District (Election of 1999); Series 1999 A, Unlimited Tax CAB GO Bonds (INS–AGM)(a)(b) | 0.00 | % | 09/01/20 | 1,925 | 1,681,276 | |||||||||||
Anaheim (City of) Public Financing Authority (Anaheim Public Improvements); Series 1997 C, Sub. Lease RB (INS–AGM)(a) | 6.00 | % | 09/01/16 | 4,000 | 4,304,880 | |||||||||||
Anaheim (City of) Public Financing Authority (Electric System Distribution Facilities); Series 2011 A, RB | 5.38 | % | 10/01/36 | 2,500 | 2,940,225 | |||||||||||
Arcadia Unified School District (Election of 2006); Series 2007 A, Unlimited Tax GO Bonds (INS–AGM)(a) | 5.00 | % | 08/01/37 | 1,500 | 1,628,055 | |||||||||||
Bakersfield (City of); Series 2007 A, Wastewater RB (INS–AGM)(a) | 5.00 | % | 09/15/32 | 2,215 | 2,435,215 | |||||||||||
Bay Area Governments Association (California Capital); Series 2001 A, Lease RB | 5.25 | % | 07/01/17 | 1,430 | 1,501,071 | |||||||||||
Bay Area Toll Authority (San Francisco Bay Area); |
| |||||||||||||||
Series 2008 F-1, Toll Bridge RB(c)(d) | 5.00 | % | 04/01/18 | 2,500 | 2,888,550 | |||||||||||
Series 2008 F-1, Toll Bridge RB(c)(d)(e) | 5.00 | % | 04/01/18 | 1,250 | 1,444,275 | |||||||||||
Series 2009 F-1, Toll Bridge RB(c)(d)(e) | 5.13 | % | 04/01/19 | 1,500 | 1,783,905 | |||||||||||
Series 2009 F-1, Toll Bridge RB(e) | 5.25 | % | 04/01/26 | 4,685 | 5,525,489 | |||||||||||
Series 2009 F-1, Toll Bridge RB(e) | 5.25 | % | 04/01/29 | 5,205 | 6,058,724 | |||||||||||
Bay Area Water Supply & Conservation Agency; Series 2013 A, RB | 5.00 | % | 10/01/34 | 1,500 | 1,726,245 | |||||||||||
Beverly Hills Unified School District (Election of 2008); |
| |||||||||||||||
Series 2009, Unlimited Tax CAB GO Bonds(b) | 0.00 | % | 08/01/26 | 1,465 | 1,045,380 | |||||||||||
Series 2009, Unlimited Tax CAB GO Bonds(b) | 0.00 | % | 08/01/32 | 3,045 | 1,592,383 | |||||||||||
Brea Olinda Unified School District; Series 2002 A, Ref. COP (INS–AGM)(a) | 5.50 | % | 08/01/18 | 1,850 | 1,858,196 | |||||||||||
California (State of) Educational Facilities Authority (California College of the Arts); | 5.00 | % | 06/01/35 | 2,000 | 2,025,360 | |||||||||||
California (State of) Educational Facilities Authority (Claremont McKenna College); | 5.00 | % | 01/01/38 | 2,100 | 2,314,263 | |||||||||||
California (State of) Educational Facilities Authority (Pitzer College); |
| |||||||||||||||
Series 2005 A, RB | 5.00 | % | 04/01/35 | 2,000 | 2,022,240 | |||||||||||
Series 2009, RB | 6.00 | % | 04/01/40 | 2,000 | 2,365,260 | |||||||||||
California (State of) Educational Facilities Authority (University of Southern California); Series 2009 B, RB(e) | 5.25 | % | 10/01/39 | 1,800 | 2,041,236 | |||||||||||
California (State of) Health Facilities Financing Authority (Adventist Health System West); Series 2009 A, RB | 5.75 | % | 09/01/39 | 500 | 580,905 | |||||||||||
California (State of) Health Facilities Financing Authority (Catholic Healthcare West); |
| |||||||||||||||
Series 2009 A, RB | 6.00 | % | 07/01/39 | 500 | 567,430 | |||||||||||
Series 2011 A, RB | 5.25 | % | 03/01/41 | 2,500 | 2,708,700 | |||||||||||
California (State of) Health Facilities Financing Authority (Cedars-Sinai Medical Center); | 5.00 | % | 08/15/39 | 1,050 | 1,145,865 | |||||||||||
California (State of) Health Facilities Financing Authority (Children’s Hospital Los Angeles); Series 2010, RB (INS–AGM)(a) | 5.25 | % | 07/01/38 | 2,950 | 3,149,656 | |||||||||||
California (State of) Health Facilities Financing Authority (Kaiser Permanente); | 5.25 | % | 04/01/39 | 2,000 | 2,074,480 | |||||||||||
California (State of) Health Facilities Financing Authority (Providence Health & Services); |
| |||||||||||||||
Series 2008, RB(c)(d) | 6.50 | % | 10/01/18 | 980 | 1,206,253 | |||||||||||
Series 2008, RB(c)(d) | 6.50 | % | 10/01/18 | 20 | 24,645 | |||||||||||
California (State of) Health Facilities Financing Authority (Scripps Health); Series 2010 A, RB | 5.00 | % | 11/15/36 | 4,000 | 4,458,080 | |||||||||||
California (State of) Health Facilities Financing Authority (St. Joseph Health System); Series 2013 A, RB | 5.00 | % | 07/01/37 | 1,000 | 1,107,130 | |||||||||||
California (State of) Health Facilities Financing Authority (Stanford Hospital); Series 2008 A-2, Ref. RB | 5.25 | % | 11/15/40 | 2,000 | 2,276,560 | |||||||||||
California (State of) Health Facilities Financing Authority (Sutter Health); Series 2011 B, RB | 5.50 | % | 08/15/26 | 1,000 | 1,184,180 | |||||||||||
California (State of) Municipal Finance Authority (American Heritage Education Foundation); Series 2006 A, Education RB | 5.25 | % | 06/01/26 | 1,000 | 1,001,910 | |||||||||||
See accompanying Notes to Financial Statements which are an integral part of the financial statements.
10 Invesco California Tax-Free Income Fund
| Interest Rate | Maturity Date | Principal Amount (000) | Value | |||||||||||||
| California–(continued) | ||||||||||||||||
California (State of) Municipal Finance Authority (Caritas Affordable Housing, Inc.); | ||||||||||||||||
Series 2012 A, Mobile Home Park RB | 5.50 | % | 08/15/47 | $ | 1,500 | $ | 1,624,935 | |||||||||
Series 2014 A, Sr. Mobile Home Park RB | 5.25 | % | 08/15/39 | 1,200 | 1,307,292 | |||||||||||
California (State of) Municipal Finance Authority (Community Hospitals of Central California Obligated Group); | ||||||||||||||||
Series 2007, COP | 5.00 | % | 02/01/20 | 2,385 | 2,573,749 | |||||||||||
Series 2007, COP | 5.25 | % | 02/01/37 | 500 | 522,505 | |||||||||||
California (State of) Municipal Finance Authority (Eisenhower Medical Center); | ||||||||||||||||
Series 2010 A, RB | 5.50 | % | 07/01/30 | 1,000 | 1,070,910 | |||||||||||
Series 2010 A, RB | 5.75 | % | 07/01/40 | 1,500 | 1,610,760 | |||||||||||
California (State of) Municipal Finance Authority (Emerson College); Series 2011, RB | 5.75 | % | 01/01/33 | 1,315 | 1,520,153 | |||||||||||
California (State of) Municipal Finance Authority (Touro College and University System); Series 2014 A, RB | 5.25 | % | 01/01/34 | 620 | 689,452 | |||||||||||
California (State of) Municipal Finance Authority (University of La Verne); Series 2010 A, RB | 6.13 | % | 06/01/30 | 1,000 | 1,139,340 | |||||||||||
California (State of) Pollution Control Finance Authority; Series 2012, Water Furnishing RB(f)(g) | 5.00 | % | 07/01/37 | 3,000 | 3,154,620 | |||||||||||
California (State of) Pollution Control Financing Authority (Waste Management Inc.); Series 2002 A, Ref. Solid Waste Disposal RB(f) | 5.00 | % | 01/01/22 | 2,000 | 2,136,480 | |||||||||||
California (State of) Public Works Board (Various Capital); Series 2011 A, Lease RB | 5.13 | % | 10/01/31 | 2,000 | 2,296,360 | |||||||||||
California (State of) Public Works Board (Various Correctional Facilities); Series 2014 A, Lease RB | 5.00 | % | 09/01/39 | 1,000 | 1,131,570 | |||||||||||
California (State of) Public Works Board (Various State Universities); Series 2013 H, Lease RB | 5.00 | % | 09/01/38 | 1,000 | 1,111,340 | |||||||||||
California (State of) School Finance Authority (Alliance for College-Ready Public Schools); | 6.30 | % | 07/01/43 | 840 | 949,595 | |||||||||||
California (State of) Statewide Communities Development Authority (Adventist Health System/West); Series 2005 A, Health Facility RB | 5.00 | % | 03/01/30 | 5,000 | 5,039,250 | |||||||||||
California (State of) Statewide Communities Development Authority (Alliance for College-Ready Public Schools); Series 2012, School Facility RB | 6.10 | % | 07/01/32 | 820 | 875,555 | |||||||||||
California (State of) Statewide Communities Development Authority (American Baptist Homes of the West); Series 2010, RB | 6.25 | % | 10/01/39 | 2,000 | 2,170,760 | |||||||||||
California (State of) Statewide Communities Development Authority (California Baptist University); | ||||||||||||||||
Series 2007 A, RB | 5.40 | % | 11/01/27 | 1,785 | 1,853,776 | |||||||||||
Series 2014 A, RB | 5.13 | % | 11/01/23 | 715 | 769,669 | |||||||||||
California (State of) Statewide Communities Development Authority (Cottage Health System Obligated Group); Series 2010, RB | 5.25 | % | 11/01/30 | 1,675 | 1,844,175 | |||||||||||
California (State of) Statewide Communities Development Authority (Henry Mayo Newhall Memorial Hospital); Series 2014 A, RB (INS–AGM)(a) | 5.25 | % | 10/01/43 | 600 | 661,740 | |||||||||||
California (State of) Statewide Communities Development Authority (Methodist Hospital); Series 2009, RB (CEP–FHA) | 6.75 | % | 02/01/38 | 445 | 539,540 | |||||||||||
California (State of) Statewide Communities Development Authority (Southern California Presbyterian Homes); | ||||||||||||||||
Series 2009, Senior Living RB | 6.25 | % | 11/15/19 | 2,000 | 2,201,540 | |||||||||||
Series 2009, Senior Living RB | 7.25 | % | 11/15/41 | 500 | 579,790 | |||||||||||
California (State of) Statewide Communities Development Authority (Terraces at San Joaquin Garden); Series 2012, RB | 5.63 | % | 10/01/32 | 1,000 | 1,049,080 | |||||||||||
California (State of) Statewide Communities Development Authority (University of California–Irvine East Campus Apartments); Series 2012, Ref. Student Housing RB | 5.38 | % | 05/15/38 | 2,000 | 2,167,060 | |||||||||||
California (State of); | ||||||||||||||||
Series 2009, Various Purpose Unlimited Tax GO Bonds | 5.75 | % | 04/01/31 | 5,000 | 5,947,400 | |||||||||||
Series 2009, Various Purpose Unlimited Tax GO Bonds | 6.00 | % | 11/01/35 | 1,750 | 2,129,260 | |||||||||||
Series 2009, Various Purpose Unlimited Tax GO Bonds | 6.00 | % | 04/01/38 | 1,250 | 1,489,038 | |||||||||||
Series 2010, Unlimited Tax GO Bonds | 5.25 | % | 11/01/40 | 3,000 | 3,453,300 | |||||||||||
Series 2011, Various Purpose Unlimited Tax GO Bonds | 5.00 | % | 09/01/32 | 2,450 | 2,784,866 | |||||||||||
Series 2011, Various Purpose Unlimited Tax GO Bonds | 5.00 | % | 10/01/41 | 2,500 | 2,787,525 | |||||||||||
Series 2012, Ref. Unlimited Tax GO Bonds | 5.25 | % | 02/01/30 | 1,000 | 1,170,810 | |||||||||||
California Infrastructure & Economic Development Bank (Broad Museum); Series 2011 A, RB | 5.00 | % | 06/01/21 | 2,000 | 2,455,340 | |||||||||||
See accompanying Notes to Financial Statements which are an integral part of the financial statements.
11 Invesco California Tax-Free Income Fund
| Interest Rate | Maturity Date | Principal Amount (000) | Value | |||||||||||||
| California–(continued) | ||||||||||||||||
California State University; | ||||||||||||||||
Series 2009 A, Systemwide RB (INS–AGC)(a) | 5.25 | % | 11/01/38 | $ | 1,000 | $ | 1,147,400 | |||||||||
Series 2012 A, Systemwide RB(e) | 5.00 | % | 11/01/37 | 6,750 | 7,661,520 | |||||||||||
Chino Basin Regional Financing Authority (Inland Empire Utilities Agency); | 5.00 | % | 11/01/33 | 725 | 798,798 | |||||||||||
Clovis Unified School District (Election of 2004); Series 2004 A, Unlimited Tax CAB GO Bonds | 0.00 | % | 08/01/29 | 735 | 408,814 | |||||||||||
Desert Community College District (Election of 2004); Series 2007 C, Unlimited Tax GO Bonds | 5.00 | % | 08/01/37 | 2,500 | 2,735,125 | |||||||||||
East Bay Municipal Utility District; Series 2010 A, Ref. Sub. Water System RB | 5.00 | % | 06/01/36 | 2,000 | 2,296,840 | |||||||||||
Eden (Township of) Healthcare District; Series 2010, COP | 6.13 | % | 06/01/34 | 1,000 | 1,080,460 | |||||||||||
El Monte Union High School District (Election of 2008); Series 2009 A, Unlimited Tax GO Bonds | 5.50 | % | 06/01/34 | 1,000 | 1,133,450 | |||||||||||
El Segundo Unified School District (Election of 2008); Series 2009 A, Unlimited Tax CAB GO Bonds(b) | 0.00 | % | 08/01/33 | 4,430 | 1,933,429 | |||||||||||
Emeryville (City of) Public Financing Authority (Alameda County); | ||||||||||||||||
Series 2014 A, Ref. Tax Allocation RB (INS–AGM)(a) | 5.00 | % | 09/01/27 | 855 | 1,006,036 | |||||||||||
Series 2014 A, Ref. Tax Allocation RB (INS–AGM)(a) | 5.00 | % | 09/01/32 | 445 | 512,911 | |||||||||||
Series 2014 A, Ref. Tax Allocation RB (INS–AGM)(a) | 5.00 | % | 09/01/33 | 385 | 441,272 | |||||||||||
Series 2014 A, Ref. Tax Allocation RB (INS–AGM)(a) | 5.00 | % | 09/01/34 | 500 | 570,330 | |||||||||||
Fairfield (City of) Community Facilities District No. 3 (North Cordelia General Improvements); Series 2008, Special Tax RB | 6.00 | % | 09/01/32 | 1,800 | 1,964,358 | |||||||||||
Fontana (City of) Public Financing Authority (North Fontana Redevelopment); Series 2003 A, Tax Allocation RB (INS–AMBAC)(a) | 5.38 | % | 09/01/25 | 1,500 | 1,503,135 | |||||||||||
Fontana (City of) Redevelopment Agency (Downtown Redevelopment); Series 2000, Ref. Tax Allocation RB (INS–NATL)(a) | 5.00 | % | 09/01/21 | 1,480 | 1,482,220 | |||||||||||
Fullerton (City of) Community Facilities District No. 1 (Amerige Heights); | ||||||||||||||||
Series 2012, Ref. Special Tax RB | 5.00 | % | 09/01/26 | 1,960 | 2,201,276 | |||||||||||
Series 2012, Ref. Special Tax RB | 5.00 | % | 09/01/32 | 1,090 | 1,187,010 | |||||||||||
Gilroy Unified School District (Election of 2008); | ||||||||||||||||
Series 2009 A, Unlimited Tax CAB GO Bonds(b)(d) | 0.00 | % | 08/01/29 | 615 | 402,573 | |||||||||||
Series 2009 A, Unlimited Tax CAB GO Bonds(b)(d) | 0.00 | % | 08/01/31 | 2,235 | 1,336,888 | |||||||||||
Series 2009 A, Unlimited Tax CAB GO Bonds (INS–AGC)(a)(b) | 0.00 | % | 08/01/29 | 4,735 | 2,633,654 | |||||||||||
Series 2009 A, Unlimited Tax CAB GO Bonds (INS–AGC)(a)(b) | 0.00 | % | 08/01/31 | 1,415 | 706,127 | |||||||||||
Glendora (City of) Public Finance Authority; Series 2003 A, Project No. One Tax Allocation RB | 5.00 | % | 09/01/24 | 2,425 | 2,434,748 | |||||||||||
Golden State Tobacco Securitization Corp.; | ||||||||||||||||
Series 2007 A-1, Sr. Tobacco Settlement Asset-Backed RB | 4.50 | % | 06/01/27 | 2,050 | 1,876,898 | |||||||||||
Series 2007 A-1, Sr. Tobacco Settlement Asset-Backed RB | 5.00 | % | 06/01/33 | 2,500 | 2,065,500 | |||||||||||
Series 2013 A, Enhanced Tobacco Settlement Asset-Backed RB | 5.00 | % | 06/01/30 | 2,000 | 2,247,720 | |||||||||||
Inglewood (City of) Redevelopment Agency (Merged Redevelopment); Series 1998 A, Ref. Tax Allocation RB (INS–AMBAC)(a) | 5.25 | % | 05/01/23 | 1,000 | 1,115,140 | |||||||||||
Irvine (City of) (Reassessment District No. 12-1); Series 2012, Limited Obligation Improvement Bonds | 4.00 | % | 09/02/22 | 1,500 | 1,657,560 | |||||||||||
Irvine (City of) Community Facilities District No. 2013-3 (Great Park Improvement Area No. 1); | ||||||||||||||||
Series 2014, Special Tax RB | 5.00 | % | 09/01/44 | 445 | 482,162 | |||||||||||
Series 2014, Special Tax RB | 5.00 | % | 09/01/49 | 445 | 479,875 | |||||||||||
Irvine Unified School District (Community Facilities District No. 06-1- Portola Springs); Series 2010, Special Tax RB | 6.70 | % | 09/01/35 | 515 | 590,061 | |||||||||||
Kern (County of) (Capital Improvments); Series 2009 A, COP (INS–AGC)(a) | 5.75 | % | 08/01/35 | 1,000 | 1,154,030 | |||||||||||
Kern (County of) Water Agency Improvement District No. 4; Series 2008 A, COP (INS–AGC)(a) | 5.00 | % | 05/01/28 | �� | 1,700 | 1,912,993 | ||||||||||
Lodi (City of); Series 2007 A, Wastewater System Revenue COP (INS–AGM)(a) | 5.00 | % | 10/01/37 | 1,000 | 1,094,690 | |||||||||||
Long Beach (City of) Bond Finance Authority (Aquarium of the Pacific); Series 2012, Ref. RB | 5.00 | % | 11/01/29 | 2,000 | 2,231,040 | |||||||||||
Long Beach (City of) Financing Authority; Series 1992, RB (INS–AMBAC)(a) | 6.00 | % | 11/01/17 | 12,415 | 13,014,272 | |||||||||||
Long Beach (City of); Series 2010 A, Sr. Airport RB | 5.00 | % | 06/01/40 | 2,500 | 2,708,050 | |||||||||||
See accompanying Notes to Financial Statements which are an integral part of the financial statements.
12 Invesco California Tax-Free Income Fund
| Interest Rate | Maturity Date | Principal Amount (000) | Value | |||||||||||||
| California–(continued) | ||||||||||||||||
Los Angeles (City of) (FHA Insured Mortgage Loans–Section 8 Assisted); Series 1997 A, Ref. Mortgage RB (INS–NATL)(a) | 6.10 | % | 07/01/25 | $ | 420 | $ | 420,920 | |||||||||
Los Angeles (City of) Community Facilities District No. 4 (Playa Vista–Phase 1); Series 2014, Special Tax Ref. RB | 5.00 | % | 09/01/31 | 600 | 686,046 | |||||||||||
Los Angeles (City of) Department of Airports (Los Angeles International Airport); | ||||||||||||||||
Series 2010 A, Sr. RB | 5.00 | % | 05/15/35 | 2,500 | 2,834,175 | |||||||||||
Series 2010 B, Sub. RB | 5.00 | % | 05/15/40 | 1,000 | 1,128,100 | |||||||||||
Series 2013, RB(f) | 5.00 | % | 05/15/43 | 3,000 | 3,315,060 | |||||||||||
Los Angeles (City of) Department of Water & Power; | ||||||||||||||||
Series 2011 A, Power System RB(e) | 5.00 | % | 07/01/22 | 1,800 | 2,178,756 | |||||||||||
Series 2011 A, Water System RB | 5.25 | % | 07/01/39 | 1,500 | 1,690,215 | |||||||||||
Subseries 2006 A-1, Water System RB (INS–AMBAC)(a) | 5.00 | % | 07/01/36 | 1,485 | 1,591,534 | |||||||||||
Subseries 2007 A-1, Power System RB (INS–AMBAC)(a) | 5.00 | % | 07/01/37 | 1,000 | 1,094,570 | |||||||||||
Subseries 2008 A-1, Power System RB | 5.25 | % | 07/01/38 | 2,000 | 2,256,400 | |||||||||||
Los Angeles (County of) Metropolitan Transportation Authority; Series 2005 A, Proposition A First Tier Sr. Sales Tax RB (INS–AMBAC)(a) | 5.00 | % | 07/01/35 | 1,000 | 1,032,600 | |||||||||||
Los Angeles Community College District (Election of 2003); Series 2008 F-1, Unlimited Tax GO Bonds(e) | 5.00 | % | 08/01/33 | 2,000 | 2,253,380 | |||||||||||
Los Angeles County Schools Regionalized Business Services Corp. (Los Angeles County Schools Pooled Financing Program); Series 1999 A, CAB COP (INS–AMBAC)(a)(b) | 0.00 | % | 08/01/24 | 1,265 | 864,109 | |||||||||||
Los Angeles Unified School District (Election of 2004); | ||||||||||||||||
Series 2007 H, Unlimited Tax GO Bonds (INS–AGM)(a) | 5.00 | % | 07/01/32 | 1,000 | 1,096,320 | |||||||||||
Series 2009 I, Unlimited Tax GO Bonds (INS–AGC)(a) | 5.00 | % | 01/01/34 | 3,000 | 3,412,350 | |||||||||||
M-S-R Energy Authority; | ||||||||||||||||
Series 2009 B, Gas RB | 6.13 | % | 11/01/29 | 1,500 | 1,909,260 | |||||||||||
Series 2009 B, Gas RB | 7.00 | % | 11/01/34 | 465 | 651,209 | |||||||||||
Madera (County of) (Valley Children’s Hospital); Series 1995, COP (INS–NATL)(a) | 6.50 | % | 03/15/15 | 1,695 | 1,735,985 | |||||||||||
Menifee Union School District (Election of 2008); Series 2009 C, Unlimited Tax CAB GO Bonds (INS–AGC)(a)(b) | 0.00 | % | 08/01/35 | 940 | 357,463 | |||||||||||
Montclair (City of) Redevelopment Agency (Montclair Redevelopment Project No. V); Series 2001, Ref. Tax Allocation RB (INS–NATL)(a) | 5.00 | % | 10/01/20 | 1,310 | 1,312,869 | |||||||||||
Montebello Unified School District (Election of 2004); Series 2009 A-1, Unlimited Tax GO Bonds (INS–AGC)(a) | 5.25 | % | 08/01/34 | 1,000 | 1,087,190 | |||||||||||
Moorpark Unified School District (Election of 2008); Series 2009 A, Unlimited Tax CAB GO Bonds (INS–AGC)(a)(b) | 0.00 | % | 08/01/31 | 840 | 413,322 | |||||||||||
Morongo Band of Mission Indians (The) (Enterprise Casino); Series 2008 B, RB(g) | 6.50 | % | 03/01/28 | 1,000 | 1,089,030 | |||||||||||
National City (City of) Community Development Commission (National City Redevelopment); Series 2011, Tax Allocation RB | 7.00 | % | 08/01/32 | 1,500 | 1,892,280 | |||||||||||
Norco (City of) Financing Authority; Series 2009, Ref. Enterprise RB (INS–AGM)(a) | 5.63 | % | 10/01/34 | 1,000 | 1,148,690 | |||||||||||
Palomar Pomerado Health; Series 2009, COP | 6.75 | % | 11/01/39 | 2,000 | 2,161,000 | |||||||||||
Panama-Buena Vista Union School District (School Construction); Series 2006, COP | 5.00 | % | 09/01/30 | 1,045 | 1,080,331 | |||||||||||
Paramount Unified School District (Election of 2006); Series 2007, Unlimited Tax GO Bonds | 5.25 | % | 08/01/30 | 1,600 | 1,710,384 | |||||||||||
Pittsburg Unified School District (Election of 2006); Series 2009 B, Unlimited Tax GO Bonds | 5.50 | % | 08/01/31 | 1,000 | 1,139,880 | |||||||||||
Pomona (City of) Public Financing Authority (Merged Redevelopment); | ||||||||||||||||
Series 2001 AD, Tax Allocation RB (INS–NATL)(a) | 5.00 | % | 02/01/15 | 2,020 | 2,027,292 | |||||||||||
Series 2001 AD, Tax Allocation RB (INS–NATL)(a) | 5.00 | % | 02/01/16 | 1,110 | 1,113,852 | |||||||||||
Series 2007 AW, Sub. RB | 5.13 | % | 02/01/33 | 1,075 | 1,077,322 | |||||||||||
Port Hueneme (City of) (Capital Improvement Program); Series 1992, Ref. COP (INS–NATL)(a) | 6.00 | % | 04/01/19 | 1,025 | 1,141,686 | |||||||||||
Rancho Cordova (City of) Community Facilities District No. 2003-1 (Sunridge Anatolia); Series 2012, Ref. Special Tax RB | 5.00 | % | 09/01/27 | 1,000 | 1,078,100 | |||||||||||
Rancho Cucamonga (City of) Redevelopment Agency (Rancho Redevelopment Housing Set Aside) Series 2007 A, Tax Allocation RB (INS–NATL)(a) | 5.00 | % | 09/01/34 | 1,000 | 1,040,850 | |||||||||||
Redding (City of) Redevelopment Agency (Canby-Hilltop-Cypress Redevelopment); | 5.00 | % | 09/01/23 | 1,400 | 1,405,138 | |||||||||||
See accompanying Notes to Financial Statements which are an integral part of the financial statements.
13 Invesco California Tax-Free Income Fund
| Interest Rate | Maturity Date | Principal Amount (000) | Value | |||||||||||||
| California–(continued) | ||||||||||||||||
Regents of the University of California; | ||||||||||||||||
Series 2009 E, Medical Center Pooled RB | 5.50 | % | 05/15/27 | $ | 2,500 | $ | 2,822,350 | |||||||||
Series 2009 O, General RB(e) | 5.75 | % | 05/15/23 | 705 | 858,598 | |||||||||||
Series 2009 O, General RB(e) | 5.75 | % | 05/15/25 | 1,050 | 1,272,086 | |||||||||||
Series 2009 Q, General RB(e)(h) | 5.00 | % | 05/15/34 | 920 | 1,012,285 | |||||||||||
Riverside (City of); | ||||||||||||||||
Series 2008 B, Water RB (INS–AGM)(a) | 5.00 | % | 10/01/33 | 1,000 | 1,092,870 | |||||||||||
Series 2008 D, Electric RB (INS–AGM)(a) | 5.00 | % | 10/01/38 | 1,800 | 1,972,512 | |||||||||||
Riverside (County of) Transportation Commission; Series 2010 A, Limited Sales Tax RB | 5.00 | % | 06/01/32 | 1,500 | 1,702,680 | |||||||||||
Sacramento (County of) Sanitation Districts Financing Authority (Sacramento Regional County Sanitation District); | ||||||||||||||||
Series 2006, RB(c)(d) | 5.00 | % | 06/01/16 | 2,000 | 2,164,940 | |||||||||||
Series 2014 A, Ref. RB | 5.00 | % | 12/01/35 | 595 | 693,056 | |||||||||||
Sacramento (County of); | ||||||||||||||||
Series 2008 A, Sr. Airport System RB (INS–AGM)(a) | 5.00 | % | 07/01/32 | 1,000 | 1,108,360 | |||||||||||
Series 2008 A, Sr. Airport System RB (INS–AGM)(a) | 5.00 | % | 07/01/41 | 1,015 | 1,116,368 | |||||||||||
Series 2010, Sr. Airport System RB | 5.00 | % | 07/01/40 | 2,200 | 2,445,564 | |||||||||||
San Buenaventura (City of) (Community Memorial Health System); Series 2011, RB | 7.50 | % | 12/01/41 | 2,000 | 2,342,600 | |||||||||||
San Diego (City of) Public Facilities Financing Authority (Southcrest & Central Imperial Redevelopment); Series 2007 B, Pooled Financing Tax Allocation RB (INS–Radian)(a) | 5.25 | % | 10/01/27 | 2,535 | 2,614,599 | |||||||||||
San Diego (City of) Public Facilities Financing Authority; Subseries 2012 A, Ref. Water RB | 5.00 | % | 08/01/32 | 2,215 | 2,559,875 | |||||||||||
San Diego (County of) Regional Transportation Commission; Series 2014 A, Sales & Use Tax RB | 5.00 | % | 04/01/48 | 2,980 | 3,429,146 | |||||||||||
San Diego Community College District (Election of 2002); Series 2009, Unlimited Tax GO Bonds(e) | 5.25 | % | 08/01/33 | 1,500 | 1,739,250 | |||||||||||
San Diego Community College District (Election of 2006); Series 2011, Unlimited Tax GO Bonds | 5.00 | % | 08/01/31 | 2,500 | 2,876,100 | |||||||||||
San Francisco (City & County of) Airport Commission (San Francisco International Airport); | ||||||||||||||||
Series 2009 E, Second Series RB | 6.00 | % | 05/01/39 | 1,000 | 1,193,090 | |||||||||||
Series 2011 C, Ref. Second Series RB(f) | 5.00 | % | 05/01/23 | 5,000 | 5,813,250 | |||||||||||
Series 2011 G, Second Series RB | 5.25 | % | 05/01/28 | 2,000 | 2,294,280 | |||||||||||
San Francisco (City & County of) Public Utilities Commission (Water System Improvement Program); Subseries 2011 A, Water RB | 5.00 | % | 11/01/36 | 4,000 | 4,591,320 | |||||||||||
San Francisco (City & County of) Redevelopment Financing Authority (Mission Bay North Redevelopment); Series 2011 C, Tax Allocation RB | 6.75 | % | 08/01/41 | 1,000 | 1,207,480 | |||||||||||
San Francisco (City & County of) Redevelopment Financing Authority (Mission Bay South Redevelopment); Series 2011 D, Tax Allocation RB | 7.00 | % | 08/01/33 | 500 | 583,270 | |||||||||||
San Francisco (City & County of) Successor Agency to the Redevelopment Agency (Mission Bay South Redevelopment); Series 2014 A, Tax Allocation RB | 5.00 | % | 08/01/43 | 1,060 | 1,164,760 | |||||||||||
San Francisco (City & County of) Successor Agency to the Redevelopment Agency Community Facilities District No. 6 (Mission Bay South Public Improvements); Series 2013 A, Ref. Special | 5.00 | % | 08/01/33 | 500 | 545,285 | |||||||||||
San Francisco (City of) Bay Area Rapid Transit District; Series 2012 A, RB | 5.00 | % | 07/01/36 | 1,000 | 1,136,870 | |||||||||||
San Jose Evergreen Community College District (Election of 2004); Series 2008 B, Unlimited Tax CAB GO Bonds (INS–AGM)(a)(b) | 0.00 | % | 09/01/31 | 3,110 | 1,580,564 | |||||||||||
San Luis Obispo (County of) Financing Authority (Lopez Dam Improvement); Series 2011 A, Ref. RB (INS–AGM)(a) | 5.00 | % | 08/01/30 | 1,500 | 1,657,110 | |||||||||||
Santa Clara (County of) Financing Authority (Multiple Facilities); Series 2008 L, Ref. Lease RB | 5.25 | % | 05/15/36 | 3,000 | 3,340,950 | |||||||||||
Santa Margarita Water District (Community Facilities District No. 2013-1); | ||||||||||||||||
Series 2013, Special Tax RB | 5.63 | % | 09/01/36 | 1,000 | 1,099,900 | |||||||||||
Series 2013, Special Tax RB | 5.63 | % | 09/01/43 | 1,000 | 1,089,500 | |||||||||||
Santaluz Community Facilities District No. 2 (Improvement Area No. 1); | ||||||||||||||||
Series 2011 A, Ref. Special Tax RB | 5.00 | % | 09/01/28 | 825 | 908,564 | |||||||||||
Series 2011 A, Ref. Special Tax RB | 5.00 | % | 09/01/29 | 715 | 783,683 | |||||||||||
Series 2011 A, Ref. Special Tax RB | 5.10 | % | 09/01/30 | 465 | 509,812 | |||||||||||
Sierra View Local Health Care District; Series 2007, RB | 5.25 | % | 07/01/32 | 1,500 | 1,555,470 | |||||||||||
See accompanying Notes to Financial Statements which are an integral part of the financial statements.
14 Invesco California Tax-Free Income Fund
| Interest Rate | Maturity Date | Principal Amount (000) | Value | |||||||||||||
| California–(continued) | ||||||||||||||||
Simi Valley Unified School District (Election of 2004); | ||||||||||||||||
Series 2007 C, Unlimited Tax CAB GO Bonds (INS–AGM)(a)(b) | 0.00 | % | 08/01/28 | $ | 3,480 | $ | 2,040,881 | |||||||||
Series 2007 C, Unlimited Tax CAB GO Bonds (INS–AGM)(a)(b) | 0.00 | % | 08/01/30 | 2,765 | 1,426,519 | |||||||||||
South Orange (County of) Public Financing Authority (Ladera Ranch); Series 2014 A, Ref. Sr. Lien Special Tax RB | 5.00 | % | 08/15/34 | 895 | 978,817 | |||||||||||
Southern California Metropolitan Water District; | ||||||||||||||||
Series 2005 A, RB (INS–AGM)(a) | 5.00 | % | 07/01/35 | 1,520 | 1,569,552 | |||||||||||
Series 2009 B, Ref. RB(e) | 5.00 | % | 07/01/27 | 8,585 | 9,977,144 | |||||||||||
Southern California Public Power Authority (Mead-Adelanto); Series 1994 A, RB (INS–AMBAC)(a)(i) | 9.62 | % | 07/01/15 | 1,300 | 1,386,866 | |||||||||||
Southern California Public Power Authority (Mead-Phoenix); Series 1994 A, RB (INS–AMBAC)(a)(i) | 9.62 | % | 07/01/15 | 200 | 213,364 | |||||||||||
Southern California Public Power Authority (Milford Wind Corridor Phase II); | ||||||||||||||||
Series 2011 1, RB(e) | 5.25 | % | 07/01/31 | 2,100 | 2,446,437 | |||||||||||
Series 2011–1, RB(e) | 5.25 | % | 07/01/29 | 2,100 | 2,477,958 | |||||||||||
Temecula (City of) Redevelopment Agency (Temecula Redevelopment Project No. 1); Series 2002, Tax Allocation RB (INS–NATL)(a) | 5.13 | % | 08/01/27 | 2,150 | 2,169,092 | |||||||||||
Tustin (City of) Public Financing Authority; Series 2011 A, Water RB | 5.00 | % | 04/01/41 | 1,000 | 1,100,840 | |||||||||||
Val Verde Unified School District; Series 2009 A, Ref. COP (INS–AGC)(a) | 5.13 | % | 03/01/36 | 1,475 | 1,560,550 | |||||||||||
Walnut (City of) Energy Center Authority; Series 2010 A, Ref. RB | 5.00 | % | 01/01/35 | 3,000 | 3,279,120 | |||||||||||
West Contra Costa Unified School District; Series 2005, Unlimited Tax CAB GO Bonds (INS-NATL)(a)(b) | 0.00 | % | 08/01/25 | 2,500 | 1,713,100 | |||||||||||
Western Riverside (County of) Water & Wastewater Financing Authority (Eastern Municipal Water District Improvement); Series 2009, RB (INS–AGC)(a) | 5.63 | % | 09/01/39 | 1,000 | 1,101,860 | |||||||||||
Whittier (City of) (Presbyterian Intercommunity Hospital, Inc.); Series 2014, Health Facility RB | 5.00 | % | 06/01/44 | 1,500 | 1,658,385 | |||||||||||
Yosemite Community College District (Election of 2004); Series 2008 C, Unlimited Tax CAB GO Bonds (INS–AGM)(a)(b) | 0.00 | % | 08/01/24 | 4,685 | 3,476,879 | |||||||||||
| 364,924,844 | ||||||||||||||||
| Guam–1.52% | ||||||||||||||||
Guam (Territory of) (Section 30); | ||||||||||||||||
Series 2009 A, Limited Obligation RB | 5.38 | % | 12/01/24 | 1,000 | 1,089,030 | |||||||||||
Series 2009 A, Limited Obligation RB | 5.63 | % | 12/01/29 | 660 | 729,927 | |||||||||||
Guam (Territory of) International Airport Authority; Series 2013 C, General RB(f) | 6.25 | % | 10/01/34 | 1,000 | 1,132,510 | |||||||||||
Guam (Territory of) Waterworks Authority; Series 2014 A, Ref. Water & Wastewater System RB | 5.00 | % | 07/01/35 | 765 | 829,597 | |||||||||||
Guam (Territory of); Series 2011 A, Business Privilege Tax RB | 5.13 | % | 01/01/42 | 1,500 | 1,608,795 | |||||||||||
| 5,389,859 | ||||||||||||||||
| Puerto Rico–1.49% | ||||||||||||||||
Puerto Rico (Commonwealth of) Public Buildings Authority; Series 2002 D, RB(c)(d) | 5.45 | % | 07/01/17 | 3,680 | 4,163,221 | |||||||||||
Puerto Rico Sales Tax Financing Corp.; Series 2011 C, RB | 5.25 | % | 08/01/40 | 1,310 | 1,119,486 | |||||||||||
| 5,282,707 | ||||||||||||||||
| Virgin Islands–1.04% | ||||||||||||||||
Virgin Islands (Government of) Public Finance Authority (Matching Fund Loan Note–Diageo); Series 2009 A, Sub. RB | 6.63 | % | 10/01/29 | 1,675 | 1,919,516 | |||||||||||
Virgin Islands (Government of) Public Finance Authority (Matching Fund Loan Note); Series 2010 A, Sr. Lien RB | 5.00 | % | 10/01/25 | 1,600 | 1,767,184 | |||||||||||
| 3,686,700 | ||||||||||||||||
TOTAL INVESTMENTS(j)–106.70% (Cost $341,360,475) | 379,284,110 | |||||||||||||||
FLOATING RATE NOTE OBLIGATIONS–(8.19)% | ||||||||||||||||
Notes with interest and fee rates ranging from 0.57% to 0.61% at 08/31/14 and contractual maturities of collateral ranging from 07/01/22 to 10/01/39 (See Note 1J)(k) | (29,120,000 | ) | ||||||||||||||
OTHER ASSETS LESS LIABILITIES–1.49% |
| 5,319,239 | ||||||||||||||
NET ASSETS–100.00% |
| $ | 355,483,349 | |||||||||||||
See accompanying Notes to Financial Statements which are an integral part of the financial statements.
15 Invesco California Tax-Free Income Fund
Investment Abbreviations:
| AGC | – Assured Guaranty Corp. | |
| AGM | – Assured Guaranty Municipal Corp. | |
| AMBAC | – American Municipal Bond Assurance Corp. | |
| CAB | – Capital Appreciation Bonds | |
| CEP | – Credit Enhancement Provider | |
| COP | – Certificates of Participation | |
| FHA | – Federal Housing Administration | |
| GO | – General Obligation | |
| INS | – Insurer | |
| NATL | – National Public Finance Guarantee Corp. | |
| Radian | – Radian Asset Assurance, Inc. | |
| RB | – Revenue Bonds | |
| Ref. | – Refunding | |
| Sr. | – Senior | |
| Sub. | – Subordinated |
Notes to Schedule of Investments:
| (a) | Principal and/or interest payments are secured by the bond insurance company listed. |
| (b) | Zero coupon bond issued at a discount. |
| (c) | Security has an irrevocable call by the issuer or mandatory put by the holder. Maturity date reflects such call or put. |
| (d) | Advance refunded; secured by an escrow fund of U.S. Government obligations or other highly rated collateral. |
| (e) | Underlying security related to Dealer Trusts entered into by the Fund. See Note 1J. |
| (f) | Security subject to the alternative minimum tax. |
| (g) | Security purchased or received in a transaction exempt from registration under the Securities Act of 1933, as amended (the “1933 Act”). The security may be resold pursuant to an exemption from registration under the 1933 Act, typically to qualified institutional buyers. The aggregate value of these securities at August 31, 2014 was $4,243,650, which represented 1.19% of the Fund’s Net Assets. |
| (h) | Security is subject to a shortfall agreement which may require the Fund to pay amounts to a counterparty in the event of a significant decline in the market value of the security underlying the Dealer Trusts. In case of a shortfall, the maximum potential amount of payments the Fund could ultimately be required to make under the agreement is $615,000. However, such shortfall payment would be reduced by the proceeds from the sale of the security underlying the Dealer Trusts. |
| (i) | Current coupon rate for inverse floating rate municipal obligations. This rate resets periodically as the rate on the related security changes. Positions in inverse floating rate municipal obligations have a total value of $1,600,230, which represented less than 1% of the Fund’s Net Assets. |
| (j) | This table provides a listing of those entities that have either issued, guaranteed, backed or otherwise enhanced the credit quality of more than 5% of the securities held in the portfolio. In instances where the entity has guaranteed, backed or otherwise enhanced the credit quality of a security, it is not primarily responsible for the issuer’s obligations but may be called upon to satisfy the issuer’s obligations. |
| Entities | Percentage | |||
Assured Guaranty Municipal Corp. | 11.7 | % | ||
American Municipal Bond Assurance Corp. | 6.4 | |||
National Public Finance Guarantee Corp. | 5.1 | |||
| (k) | Floating rate note obligations related to securities held. The interest and fee rates shown reflect the rates in effect at August 31, 2014. At August 31, 2014, the Fund’s investments with a value of $51,045,306 are held by Dealer Trusts and serve as collateral for the $29,120,000 in the floating rate note obligations outstanding at that date. |
See accompanying Notes to Financial Statements which are an integral part of the financial statements.
16 Invesco California Tax-Free Income Fund
Statement of Assets and Liabilities
August 31, 2014
Assets: |
| |||
Investments, at value (Cost $341,360,475) | $ | 379,284,110 | ||
Cash | 418,497 | |||
Receivable for: | ||||
Investments sold | 3,920,018 | |||
Fund shares sold | 549,628 | |||
Interest | 4,943,930 | |||
Investment for trustee deferred compensation and retirement plans | 56,911 | |||
Other assets | 4,278 | |||
Total assets | 389,177,372 | |||
Liabilities: | ||||
Floating rate note obligations | 29,120,000 | |||
Payable for: | ||||
Investments purchased | 3,384,475 | |||
Fund shares reacquired | 318,150 | |||
Dividends | 517,342 | |||
Accrued fees to affiliates | 159,419 | |||
Accrued trustees’ and officers’ fees and benefits | 4,077 | |||
Accrued other operating expenses | 66,943 | |||
Trustee deferred compensation and retirement plans | 123,617 | |||
Total liabilities | 33,694,023 | |||
Net assets applicable to shares outstanding | $ | 355,483,349 | ||
Net assets consist of: | ||||
Shares of beneficial interest | $ | 349,960,393 | ||
Undistributed net investment income | 1,175,971 | |||
Undistributed net realized gain (loss) | (33,576,650 | ) | ||
Net unrealized appreciation | 37,923,635 | |||
| $ | 355,483,349 | |||
Net Assets: | ||||
Class A | $ | 296,199,559 | ||
Class B | $ | 16,418,858 | ||
Class C | $ | 20,484,812 | ||
Class Y | $ | 22,380,120 | ||
Shares outstanding, $0.01 par value per share, |
| |||
Class A | 24,383,699 | |||
Class B | 1,338,920 | |||
Class C | 1,675,429 | |||
Class Y | 1,835,140 | |||
Class A: | ||||
Net asset value per share | $ | 12.15 | ||
Maximum offering price per share | ||||
(Net asset value of $12.15 ¸ 95.75%) | $ | 12.69 | ||
Class B: | ||||
Net asset value and offering price per share | $ | 12.26 | ||
Class C: | ||||
Net asset value and offering price per share | $ | 12.23 | ||
Class Y: | ||||
Net asset value and offering price per share | $ | 12.20 | ||
See accompanying Notes to Financial Statements which are an integral part of the financial statements.
17 Invesco California Tax-Free Income Fund
Statement of Operations
For the year ended August 31, 2014
Investment income: |
| |||
Interest | $ | 18,176,086 | ||
Expenses: | ||||
Advisory fees | 1,649,383 | |||
Administrative services fees | 95,715 | |||
Custodian fees | 10,259 | |||
Distribution fees: | ||||
Class A | 631,854 | |||
Class B | 119,476 | |||
Class C | 148,819 | |||
Interest, facilities and maintenance fees | 202,040 | |||
Transfer agent fees | 250,497 | |||
Trustees’ and officers’ fees and benefits | 39,842 | |||
Other | 173,357 | |||
Total expenses | 3,321,242 | |||
Less: Expense offset arrangement(s) | (111 | ) | ||
Net expenses | 3,321,131 | |||
Net investment income | 14,854,955 | |||
Realized and unrealized gain (loss) from: | ||||
Net realized gain (loss) from investment securities (includes net gains (losses) from securities sold to affiliates of $(98,050)) | (3,637,228 | ) | ||
Change in net unrealized appreciation of investment securities | 32,124,016 | |||
Net realized and unrealized gain | 28,486,788 | |||
Net increase in net assets resulting from operations | $ | 43,341,743 | ||
See accompanying Notes to Financial Statements which are an integral part of the financial statements.
18 Invesco California Tax-Free Income Fund
Statement of Changes in Net Assets
For the years ended August 31, 2014 and 2013
| 2014 | 2013 | |||||||
Operations: | ||||||||
Net investment income | $ | 14,854,955 | $ | 16,549,433 | ||||
Net realized gain (loss) | (3,637,228 | ) | 763,454 | |||||
Change in net unrealized appreciation (depreciation) | 32,124,016 | (37,091,954 | ) | |||||
Net increase (decrease) in net assets resulting from operations | 43,341,743 | (19,779,067 | ) | |||||
Distributions to shareholders from net investment income: | ||||||||
Class A | (11,020,336 | ) | (7,115,529 | ) | ||||
Class B | (2,113,675 | ) | (7,488,596 | ) | ||||
Class C | (751,172 | ) | (843,990 | ) | ||||
Class Y | (926,911 | ) | (1,028,342 | ) | ||||
Total distributions from net investment income | (14,812,094 | ) | (16,476,457 | ) | ||||
Share transactions–net: | ||||||||
Class A | 110,057,457 | 18,657,510 | ||||||
Class B | (143,702,426 | ) | (46,199,280 | ) | ||||
Class C | (2,708,476 | ) | (3,584,104 | ) | ||||
Class Y | 137,694 | (2,122,326 | ) | |||||
Net increase (decrease) in net assets resulting from share transactions | (36,215,751 | ) | (33,248,200 | ) | ||||
Net increase (decrease) in net assets | (7,686,102 | ) | (69,503,724 | ) | ||||
Net assets: | ||||||||
Beginning of year | 363,169,451 | 432,673,175 | ||||||
End of year (includes undistributed net investment income of $1,175,971 and $1,194,328, respectively) | $ | 355,483,349 | $ | 363,169,451 | ||||
Notes to Financial Statements
August 31, 2014
NOTE 1—Significant Accounting Policies
Invesco California Tax-Free Income Fund (the “Fund”) is a series portfolio of AIM Counselor Series Trust (Invesco Counselor Series Trust) (the “Trust”). The Trust is a Delaware statutory trust registered under the Investment Company Act of 1940, as amended (the “1940 Act”), as an open-end series management investment company consisting of thirteen separate portfolios, each authorized to issue an unlimited number of shares of beneficial interest. The assets, liabilities and operations of each portfolio are accounted for separately. Information presented in these financial statements pertains only to the Fund. Matters affecting each portfolio or class will be voted on exclusively by the shareholders of such portfolio or class.
The Fund’s investment objective is to provide a high level of current income exempt from federal and California income tax, consistent with the preservation of capital.
The Fund currently consists of four different classes of shares: Class A, Class B, Class C and Class Y. Class A shares are sold with a front-end sales charge unless certain waiver criteria are met and under certain circumstances load waived shares may be subject to contingent deferred sales charges (“CDSC”). Class C shares are sold with a CDSC. Class Y shares are sold at net asset value. Effective November 30, 2010, new or additional investments in Class B shares are no longer permitted. Existing shareholders of Class B shares may continue to reinvest dividends and capital gains distributions in Class B shares until they convert to Class A shares. Also, shareholders in Class B shares will be able to exchange those shares for Class B shares of other Invesco Funds offering such shares until they convert to Class A shares. Generally, Class B shares will automatically convert to Class A shares on or about the month-end, which is at least eight years after the date of purchase. Redemption of Class B shares prior to conversion date will be subject to a CDSC.
The following is a summary of the significant accounting policies followed by the Fund in the preparation of its financial statements.
| A. | Security Valuations — Securities, including restricted securities, are valued according to the following policy. |
Securities are fair valued using an evaluated quote provided by an independent pricing service approved by the Board of Trustees. Evaluated quotes provided by the pricing service may be determined without exclusive reliance on quoted prices, and may reflect appropriate factors such as institution-size trading in similar groups of securities, developments related to specific securities, dividend rate (for unlisted equities), yield (for debt obligations), quality, type of issue, coupon rate (for debt obligations), maturity (for debt obligations), individual trading characteristics and other market data. Debt obligations are subject to interest rate and credit risks. In addition, all debt obligations involve some risk of default with respect to interest and/or principal payments.
Securities for which market quotations either are not readily available or became unreliable are valued at fair value as determined in good faith by or under the supervision of the Trust’s officers following procedures approved by the Board of Trustees. Some of the factors which may be considered in determining fair value are fundamental analytical data relating to the investment; the nature and duration of any restrictions on
19 Invesco California Tax-Free Income Fund
transferability or disposition; trading in similar securities by the same issuer or comparable companies; relevant political, economic or issuer specific news; and other relevant factors under the circumstances.
The Fund may invest in securities that are subject to interest rate risk, meaning the risk that the prices will generally fall as interest rates rise and, conversely, the prices will generally rise as interest rates fall. Specific securities differ in their sensitivity to changes in interest rates depending on their individual characteristics. Changes in interest rates may result in increased market volatility, which may affect the value and/or liquidity of certain of the Fund’s investments.
Valuations change in response to many factors including the historical and prospective earnings of the issuer, the value of the issuer’s assets, general economic conditions, interest rates, investor perceptions and market liquidity. Because of the inherent uncertainties of valuation, the values reflected in the financial statements may materially differ from the value received upon actual sale of those investments.
| B. | Securities Transactions and Investment Income — Securities transactions are accounted for on a trade date basis. Realized gains or losses on sales are computed on the basis of specific identification of the securities sold. Interest income (net of withholding tax, if any), adjusted for amortization of premiums and accretion of discounts on investments, is recorded on the accrual basis from settlement date. |
The Fund may periodically participate in litigation related to Fund investments. As such, the Fund may receive proceeds from litigation settlements. Any proceeds received are included in the Statement of Operations as realized gain (loss) for investments no longer held and as unrealized gain (loss) for investments still held.
Brokerage commissions and mark ups are considered transaction costs and are recorded as an increase to the cost basis of securities purchased and/or a reduction of proceeds on a sale of securities. Such transaction costs are included in the determination of net realized gain (loss) from investment securities reported in the Statement of Operations and the Statement of Changes in Net Assets and the net realized gains (losses) on securities per share in the Financial Highlights. Transaction costs are included in the calculation of the Fund’s net asset value and, accordingly, they reduce the Fund’s total returns. These transaction costs are not considered operating expenses and are not reflected in net investment income reported in the Statement of Operations and Statement of Changes in Net Assets, or the net investment income per share and ratios of expenses and net investment income reported in the Financial Highlights, nor are they limited by any expense limitation arrangements between the Fund and the investment adviser.
The Fund allocates realized capital gains and losses to a class based on the relative net assets of each class. The Fund allocates income to a class based on the relative value of the settled shares of each class.
| C. | Country Determination — For the purposes of making investment selection decisions and presentation in the Schedule of Investments, the investment adviser may determine the country in which an issuer is located and/or credit risk exposure based on various factors. These factors include the laws of the country under which the issuer is organized, where the issuer maintains a principal office, the country in which the issuer derives 50% or more of its total revenues and the country that has the primary market for the issuer’s securities, as well as other criteria. Among the other criteria that may be evaluated for making this determination are the country in which the issuer maintains 50% or more of its assets, the type of security, financial guarantees and enhancements, the nature of the collateral and the sponsor organization. Country of issuer and/or credit risk exposure has been determined to be the United States of America, unless otherwise noted. |
| D. | Distributions — Distributions from net investment income are declared daily and paid monthly. Distributions from net realized capital gain, if any, are generally declared and paid annually and recorded on the ex-dividend date. The Fund may elect to treat a portion of the proceeds from redemptions as distributions for federal income tax purposes. |
| E. | Federal Income Taxes — The Fund intends to comply with the requirements of Subchapter M of the Internal Revenue Code of 1986, as amended (the “Internal Revenue Code”), necessary to qualify as a regulated investment company and to distribute substantially all of the Fund’s taxable and tax-exempt earnings to shareholders. As such, the Fund will not be subject to federal income taxes on otherwise taxable income (including net realized capital gain) that is distributed to shareholders. Therefore, no provision for federal income taxes is recorded in the financial statements. |
The Fund recognizes the tax benefits of uncertain tax positions only when the position is more likely than not to be sustained. Management has analyzed the Fund’s uncertain tax positions and concluded that no liability for unrecognized tax benefits should be recorded related to uncertain tax positions. Management is not aware of any tax positions for which it is reasonably possible that the total amounts of unrecognized tax benefits will change materially in the next 12 months.
In addition, the Fund intends to invest in such municipal securities to allow it to qualify to pay shareholders “exempt-interest dividends”, as defined in the Internal Revenue Code.
The Fund files tax returns in the U.S. Federal jurisdiction and certain other jurisdictions. Generally, the Fund is subject to examinations by such taxing authorities for up to three years after the filing of the return for the tax period.
| F. | Expenses — Fees provided for under the Rule 12b-1 plan of a particular class of the Fund and which are directly attributable to that class are charged to the operations of such class. All other expenses are allocated among the classes based on relative net assets. |
| G. | Interest, Facilities and Maintenance Fees — Interest, Facilities and Maintenance Fees include interest and related borrowing costs such as commitment fees and other expenses associated with lines of credit and interest and administrative expenses related to establishing and maintaining floating rate note obligations, if any. |
| H. | Accounting Estimates — The preparation of financial statements in conformity with accounting principles generally accepted in the United States of America (“GAAP”) requires management to make estimates and assumptions that affect the reported amounts of assets and liabilities at the date of the financial statements and the reported amounts of revenues and expenses during the reporting period including estimates and assumptions related to taxation. Actual results could differ from those estimates by a significant amount. In addition, the Fund monitors for material events or transactions that may occur or become known after the period-end date and before the date the financial statements are released to print. |
| I. | Indemnifications — Under the Trust’s organizational documents, each Trustee, officer, employee or other agent of the Trust is indemnified against certain liabilities that may arise out of the performance of their duties to the Fund. Additionally, in the normal course of business, the Fund enters into contracts, including the Fund’s servicing agreements, that contain a variety of indemnification clauses. The Fund’s maximum exposure under these arrangements is unknown as this would involve future claims that may be made against the Fund that have not yet occurred. The risk of material loss as a result of such indemnification claims is considered remote. |
20 Invesco California Tax-Free Income Fund
| J. | Floating Rate Note Obligations — The Fund invests in inverse floating rate securities, such as Residual Interest Bonds (“RIBs”) or Tender Option Bonds (“TOBs”) for investment purposes and to enhance the yield of the Fund. Inverse floating rate investments tend to underperform the market for fixed rate bonds in a rising interest rate environment, but tend to outperform the market for fixed rate bonds when interest rates decline or remain relatively stable. Such transactions may be purchased in the secondary market without first owning the underlying bond or by the sale of fixed rate bonds by the Fund to special purpose trusts established by a broker dealer (“Dealer Trusts”) in exchange for cash and residual interests in the Dealer Trusts’ assets and cash flows, which are in the form of inverse floating rate securities. The Dealer Trusts finance the purchases of the fixed rate bonds by issuing floating rate notes to third parties and allowing the Fund to retain residual interests in the bonds. The floating rate notes issued by the Dealer Trusts have interest rates that reset weekly and the floating rate note holders have the option to tender their notes to the Dealer Trusts for redemption at par at each reset date. The residual interests held by the Fund (inverse floating rate investments) include the right of the Fund (1) to cause the holders of the floating rate notes to tender their notes at par at the next interest rate reset date, and (2) to transfer the municipal bond from the Dealer Trusts to the Fund, thereby collapsing the Dealer Trusts. |
Recently published final rules implementing section 619 of the Dodd-Frank Wall Street Reform and Consumer Protection Act (the “Volcker Rule”) prohibit banking entities from engaging in proprietary trading of certain instruments and limit such entities’ investments in, and relationships with, “covered funds.” These rules may preclude banking entities from sponsoring and/or providing services for existing TOB trust programs. There can be no assurances that TOB trusts can be restructured substantially similar to their present form, that new sponsors of TOB trusts would begin providing these services, or that alternative forms of leverage will be available to the Fund in order to maintain current levels of leverage. Any alternative forms of leverage may be less advantageous to the Fund, and may adversely affect the Fund’s net asset value, distribution rate and ability to achieve its investment objective. The ultimate impact of these rules on the TOBs market and the municipal market generally is not yet certain.
TOBs are presently classified as private placement securities. Private placement securities are subject to restrictions on resale because they have not been registered under the Securities Act of 1933, as amended (the “1933 Act”), or are otherwise not readily marketable. As a result of the absence of a public trading market for these securities, they may be less liquid than publicly traded securities. Although these securities may be resold in privately negotiated transactions, the prices realized from these sales could be less than those originally paid by the Fund or less than what may be considered the fair value of such securities.
The Fund accounts for the transfer of bonds to the Dealer Trusts as secured borrowings, with the securities transferred remaining in the Fund’s investment assets, and the related floating rate notes reflected as Fund liabilities under the caption Floating rate note obligations on the Statement of Assets and Liabilities. The Fund records the interest income from the fixed rate bonds under the caption Interest and records the expenses related to floating rate obligations and any administrative expenses of the Dealer Trusts as a component of Interest, facilities and maintenance fees on the Statement of Operations.
The Fund generally invests in inverse floating rate securities that include embedded leverage, thus exposing the Fund to greater risks and increased costs. The primary risks associated with inverse floating rate securities are varying degrees of liquidity and the changes in the value of such securities in response to changes in market rates of interest to a greater extent than the value of an equal principal amount of a fixed rate security having similar credit quality, redemption provisions and maturity which may cause the Fund’s net asset value to be more volatile than if it had not invested in inverse floating rate securities. In certain instances, the short-term floating rate interests created by the special purpose trust may not be able to be sold to third parties or, in the case of holders tendering (or putting) such interests for repayment of principal, may not be able to be remarketed to third parties. In such cases, the special purpose trust holding the long-term fixed rate bonds may be collapsed. In the case of RIBs or TOBs created by the contribution of long-term fixed income bonds by the Fund, the Fund will then be required to repay the principal amount of the tendered securities. During times of market volatility, illiquidity or uncertainty, the Fund could be required to sell other portfolio holdings at a disadvantageous time to raise cash to meet that obligation.
| K. | Other Risks — The value of, payment of interest on, repayment of principal for and the ability to sell a municipal security may be affected by constitutional amendments, legislative enactments, executive orders, administrative regulations, voter initiatives and the economics of the regions in which the issuers are located. |
Since many municipal securities are issued to finance similar projects, especially those relating to education, health care, transportation and utilities, conditions in those sectors can affect the overall municipal securities market and a Fund’s investments in municipal securities.
There is some risk that a portion or all of the interest received from certain tax-free municipal securities could become taxable as a result of determinations by the Internal Revenue Service.
NOTE 2—Advisory Fees and Other Fees Paid to Affiliates
The Trust has entered into a master investment advisory agreement with Invesco Advisers, Inc. (the “Adviser” or “Invesco”). Under the terms of the investment advisory agreement, the Fund pays an advisory fee to the Adviser based on the annual rate of the Fund’s average daily net assets as follows:
| Average Daily Net Assets | Rate | |||||
First $500 million | 0 | .47% | ||||
Next $250 million | 0 | .445% | ||||
Next $250 million | 0 | .42% | ||||
Next $250 million | 0 | .395% | ||||
Over $1.25 billion | 0 | .37% | ||||
Under the terms of a master sub-advisory agreement between the Adviser and each of Invesco Asset Management Deutschland GmbH, Invesco Asset Management Limited, Invesco Asset Management (Japan) Limited, Invesco Australia Limited, Invesco Hong Kong Limited, Invesco Senior Secured Management, Inc. and Invesco Canada Ltd. (collectively, the “Affiliated Sub-Advisers”) the Adviser, not the Fund, may pay 40% of the fees paid to the Adviser to any such Affiliated Sub-Adviser(s) that provide(s) discretionary investment management services to the Fund based on the percentage of assets allocated to such Sub-Adviser(s).
21 Invesco California Tax-Free Income Fund
The Adviser has contractually agreed, through at least June 30, 2015, to waive advisory fees and/or reimburse expenses to the extent necessary to limit total annual fund operating expenses and/or reimbursement (excluding certain items discussed below) of Class A, Class B, Class C and Class Y shares to 1.50%, 2.00%, 2.00% and 1.25% of average daily net assets, respectively. In determining the Adviser’s obligation to waive advisory fees and/or reimburse expenses, the following expenses are not taken into account, and could cause the net annual fund operating expenses and/or reimbursement to exceed the numbers reflected above: (1) interest, facilities and maintenance fees; (2) taxes; (3) dividend expense on short sales; (4) extraordinary or non-routine items, including litigation expenses; and (5) expenses that the Fund has incurred but did not actually pay because of an expense offset arrangement. Unless Invesco continues the fee waiver agreement, it will terminate on June 30, 2015. The fee waiver agreement cannot be terminated during its term. The Adviser did not waive fees and/or reimburse expenses during the period under this expense limitation.
The Trust has entered into a master administrative services agreement with Invesco pursuant to which the Fund has agreed to pay Invesco for certain administrative costs incurred in providing accounting services to the Fund. For the year ended August 31, 2014, expenses incurred under the agreement are shown in the Statement of Operations as Administrative services fees.
The Trust has entered into a transfer agency and service agreement with Invesco Investment Services, Inc. (“IIS”) pursuant to which the Fund has agreed to pay IIS a fee for providing transfer agency and shareholder services to the Fund and reimburse IIS for certain expenses incurred by IIS in the course of providing such services. IIS may make payments to intermediaries that provide omnibus account services, sub-accounting services and/or networking services. All fees payable by IIS to intermediaries that provide omnibus account services or sub-accounting are charged back to the Fund, subject to certain limitations approved by the Trust’s Board of Trustees. For the year ended August 31, 2014, expenses incurred under the agreement are shown in the Statement of Operations as Transfer agent fees.
Shares of the Fund are distributed by Invesco Distributors, Inc. (“IDI”), an affiliate of the Adviser. The Fund has adopted a Plan of Distribution (the “Plan”) pursuant to Rule 12b-1 under the 1940 Act. The Plan provides that the Fund will reimburse IDI for distribution related expenses that IDI incurs up to a maximum of the following annual rates: (1) Class A — up to 0.25% of the average daily net assets of Class A shares; (2) Class B — up to 0.75% of the average daily net assets of Class B shares; and (3) Class C — up to 0.75% of the average daily net assets of Class C shares.
In the case of Class B shares, provided that the Plan continues in effect, any cumulative expenses incurred by IDI, but not yet reimbursed to IDI, may be recovered through the payment of future distribution fees from the Fund pursuant to the Plan and contingent deferred sales charges paid by investors upon redemption of Class B shares.
For the year ended August 31, 2014, expenses incurred under these agreements are shown in the Statement of Operations as Distribution fees.
Front-end sales commissions and CDSC (collectively, the “sales charges”) are not recorded as expenses of the Fund. Front-end sales commissions are deducted from proceeds from the sales of Fund shares prior to investment in Class A shares of the Fund. CDSC are deducted from redemption proceeds prior to remittance to the shareholder. During the year ended August 31, 2014, IDI advised the Fund that IDI retained $11,037 in front-end sales commissions from the sale of Class A shares and $497, $7,753 and $2,692 from Class A, Class B and Class C shares, respectively, for CDSC imposed on redemptions by shareholders.
Certain officers and trustees of the Trust are officers and directors of the Adviser, IIS and/or IDI.
NOTE 3—Additional Valuation Information
GAAP defines fair value as the price that would be received to sell an asset or paid to transfer a liability in an orderly transaction between market participants at the measurement date, under current market conditions. GAAP establishes a hierarchy that prioritizes the inputs to valuation methods, giving the highest priority to readily available unadjusted quoted prices in an active market for identical assets (Level 1) and the lowest priority to significant unobservable inputs (Level 3), generally when market prices are not readily available or are unreliable. Based on the valuation inputs, the securities or other investments are tiered into one of three levels. Changes in valuation methods may result in transfers in or out of an investment’s assigned level:
| Level 1 — | Prices are determined using quoted prices in an active market for identical assets. |
| Level 2 — | Prices are determined using other significant observable inputs. Observable inputs are inputs that other market participants may use in pricing a security. These may include quoted prices for similar securities, interest rates, prepayment speeds, credit risk, yield curves, loss severities, default rates, discount rates, volatilities and others. |
| Level 3 — | Prices are determined using significant unobservable inputs. In situations where quoted prices or observable inputs are unavailable (for example, when there is little or no market activity for an investment at the end of the period), unobservable inputs may be used. Unobservable inputs reflect the Fund’s own assumptions about the factors market participants would use in determining fair value of the securities or instruments and would be based on the best available information. |
As of August 31, 2014, all of the securities in this Fund were valued based on Level 2 inputs (see the Schedule of Investments for security categories). The level assigned to the securities valuations may not be an indication of the risk or liquidity associated with investing in those securities. Because of the inherent uncertainties of valuation, the values reflected in the financial statements may materially differ from the value received upon actual sale of those investments.
NOTE 4—Security Transactions with Affiliated Funds
The Fund is permitted to purchase or sell securities from or to certain other Invesco Funds under specified conditions outlined in procedures adopted by the Board of Trustees of the Trust. The procedures have been designed to ensure that any purchase or sale of securities by the Fund from or to another fund or portfolio that is or could be considered an affiliate by virtue of having a common investment adviser (or affiliated investment advisers), common Trustees and/or common officers complies with Rule 17a-7 of the 1940 Act. Further, as defined under the procedures, each transaction is effected at the current market price. Pursuant to these procedures, for the year ended August 31, 2014, the Fund engaged in securities sales of $969,409, which resulted in net realized gains (losses) of $(98,050).
22 Invesco California Tax-Free Income Fund
NOTE 5—Expense Offset Arrangement(s)
The expense offset arrangement is comprised of transfer agency credits which result from balances in demand deposit accounts used by the transfer agent for clearing shareholder transactions. For the year ended August 31, 2014, the Fund received credits from this arrangement, which resulted in the reduction of the Fund’s total expenses of $111.
NOTE 6—Trustees’ and Officers’ Fees and Benefits
Trustees’ and Officers’ Fees and Benefits include amounts accrued by the Fund to pay remuneration to certain Trustees and Officers of the Fund. Trustees have the option to defer compensation payable by the Fund, and Trustees’ and Officers’ Fees and Benefits also include amounts accrued by the Fund to fund such deferred compensation amounts. Those Trustees who defer compensation have the option to select various Invesco Funds in which their deferral accounts shall be deemed to be invested. Finally, certain current Trustees were eligible to participate in a retirement plan that provided for benefits to be paid upon retirement to Trustees over a period of time based on the number of years of service. The Fund may have certain former Trustees who also participate in a retirement plan and receive benefits under such plan. Trustees’ and Officers’ Fees and Benefits include amounts accrued by the Fund to fund such retirement benefits. Obligations under the deferred compensation and retirement plans represent unsecured claims against the general assets of the Fund.
NOTE 7—Cash Balances and Borrowings
The Trust is permitted to temporarily carry a negative or overdrawn balance in its account with State Street Bank and Trust Company, the custodian bank. Such balances, if any at period end, are shown in the Statement of Assets and Liabilities under the payable caption Amount due custodian. To compensate the custodian bank for such overdrafts, the overdrawn Trust may either (1) leave funds as a compensating balance in the account so the custodian bank can be compensated by earning the additional interest; or (2) compensate by paying the custodian bank at a rate agreed upon by the custodian bank and Invesco, not to exceed the contractually agreed upon rate.
Inverse floating rate obligations resulting from the transfer of bonds to Dealer Trusts are accounted for as secured borrowings. The average floating rate notes outstanding and average annual interest and fee rate related to inverse floating rate note obligations during the year ended August 31, 2014 were $25,673,462 and 0.79%, respectively.
NOTE 8—Distributions to Shareholders and Tax Components of Net Assets
Tax Character of Distributions to Shareholders Paid During the Years Ended August 31, 2014 and 2013:
| 2014 | 2013 | |||||||
Ordinary income | $ | 14,812,094 | $ | 16,476,457 | ||||
Tax Components of Net Assets at Period-End:
| 2014 | ||||
Undistributed ordinary income | $ | 817,436 | ||
Net unrealized appreciation — investments | 38,208,454 | |||
Temporary book/tax differences | (116,366 | ) | ||
Post-October deferrals | (1,611,584 | ) | ||
Capital loss carryforward | (31,774,984 | ) | ||
Shares of beneficial interest | 349,960,393 | |||
Total net assets | $ | 355,483,349 | ||
The difference between book-basis and tax-basis unrealized appreciation (depreciation) is due to differences in the timing of recognition of gains and losses on investments for tax and book purposes. The Fund’s net unrealized appreciation difference is attributable primarily to TOBs, book to tax accretion and amortization differences.
The temporary book/tax differences are a result of timing differences between book and tax recognition of income and/or expenses. The Fund’s temporary book/tax differences are the result of the trustee deferral of compensation and retirement plan benefits.
Capital loss carryforward is calculated and reported as of a specific date. Results of transactions and other activity after that date may affect the amount of capital loss carryforward actually available for the Fund to utilize. Capital losses generated in years beginning after December 22, 2010 can be carried forward for an unlimited period, whereas previous losses expire in 8 tax years. Capital losses with an expiration period may not be used to offset capital gains until all net capital losses without an expiration date have been utilized. Capital loss carryforwards with no expiration date will retain their character as either short-term or long-term capital losses instead of as short-term capital losses as under prior law. The ability to utilize capital loss carryforward in the future may be limited under the Internal Revenue Code and related regulations based on the results of future transactions.
23 Invesco California Tax-Free Income Fund
The Fund has a capital loss carryforward as of August 31, 2014, which expires as follows:
| Capital Loss Carryforward* | ||||||||||||
| Expiration | Short-Term | Long-Term | Total | |||||||||
August 31, 2015 | $ | 803,875 | $ | — | $ | 803,875 | ||||||
August 31, 2016 | 4,399,730 | — | 4,399,730 | |||||||||
August 31, 2017 | 9,460,903 | — | 9,460,903 | |||||||||
August 31, 2018 | 6,678,872 | — | 6,678,872 | |||||||||
August 31, 2019 | 1,906,728 | — | 1,906,728 | |||||||||
Not subject to expiration | 2,006,819 | 6,518,057 | 8,524,876 | |||||||||
| $ | 25,256,927 | $ | 6,518,057 | $ | 31,774,984 | |||||||
| * | Capital loss carryforward as of the date listed above is reduced for limitations, if any, to the extent required by the Internal Revenue Code and may be further limited depending upon a variety of factors, including the realization of net unrealized gains or losses as of the date of any reorganization. |
NOTE 9—Investment Securities
The aggregate amount of investment securities (other than short-term securities, U.S. Treasury obligations and money market funds, if any) purchased and sold by the Fund during the year ended August 31, 2014 was $46,579,677 and $74,354,212, respectively. Cost of investments on a tax basis includes the adjustments for financial reporting purposes as of the most recently completed federal income tax reporting period-end.
| Unrealized Appreciation (Depreciation) of Investment Securities on a Tax Basis | ||||
Aggregate unrealized appreciation of investment securities | $ | 38,223,651 | ||
Aggregate unrealized (depreciation) of investment securities | (15,197 | ) | ||
Net unrealized appreciation of investment securities | $ | 38,208,454 | ||
Cost of investments for tax purposes is $341,075,656.
NOTE 10—Reclassification of Permanent Differences
Primarily as a result of differing book/tax treatment of taxable income, on August 31, 2014, undistributed net investment income was decreased by $61,218, undistributed net realized gain (loss) was increased by $22,888 and shares of beneficial interest was increased by $38,330. This reclassification had no effect on the net assets of the Fund.
NOTE 11—Share Information
| Summary of Share Activity | ||||||||||||||||
| Years ended August 31, | ||||||||||||||||
| 2014(a) | 2013 | |||||||||||||||
| Shares | Amount | Shares | Amount | |||||||||||||
Sold: | ||||||||||||||||
Class A | 12,738,568 | $ | 145,897,191 | 2,224,815 | $ | 27,215,833 | ||||||||||
Class B | 11,680 | 138,829 | 6,140 | 76,451 | ||||||||||||
Class C | 293,547 | 3,474,609 | 501,900 | 6,196,506 | ||||||||||||
Class Y | 371,700 | 4,380,591 | 333,425 | 4,091,272 | ||||||||||||
Issued as reinvestment of dividends: | ||||||||||||||||
Class A | 531,097 | 6,254,004 | 359,160 | 4,327,235 | ||||||||||||
Class B | 54,886 | 649,950 | 299,001 | 3,622,292 | ||||||||||||
Class C | 29,514 | 350,041 | 32,695 | 394,972 | ||||||||||||
Class Y | 29,763 | 352,317 | 36,081 | 434,393 | ||||||||||||
Automatic conversion of Class B shares to Class A shares: | ||||||||||||||||
Class A | 390,948 | 4,608,714 | 2,053,203 | 25,178,400 | ||||||||||||
Class B | (387,175 | ) | (4,608,714 | ) | (2,038,370 | ) | (25,178,400 | ) | ||||||||
Reacquired: | ||||||||||||||||
Class A | (4,023,477 | ) | (46,702,452 | ) | (3,169,198 | ) | (38,063,958 | ) | ||||||||
Class B | (12,162,839 | ) | (139,882,491 | ) | (2,031,233 | ) | (24,719,623 | ) | ||||||||
Class C | (560,471 | ) | (6,533,126 | ) | (838,544 | ) | (10,175,582 | ) | ||||||||
Class Y | (396,116 | ) | (4,595,214 | ) | (547,077 | ) | (6,647,991 | ) | ||||||||
Net increase in share activity | (3,078,375 | ) | $ | (36,215,751 | ) | (2,778,002 | ) | $ | (33,248,200 | ) | ||||||
| (a) | There are entities that are record owners of more than 5% of the outstanding shares of the Fund and in the aggregate own 69% of the outstanding shares of the Fund. IDI has an agreement with these entities to sell Fund shares. The Fund, Invesco and/or Invesco affiliates may make payments to these entities, which are considered to be related to the Fund, for providing services to the Fund, Invesco and/or Invesco affiliates including but not limited to services such as securities brokerage, distribution, third party record keeping and account servicing. The Fund has no knowledge as to whether all or any portion of the shares owned of record by these entities are also owned beneficially. |
24 Invesco California Tax-Free Income Fund
NOTE 12—Financial Highlights
The following schedule presents financial highlights for a share of the Fund outstanding throughout the periods indicated.
| Net asset value, beginning of period | Net investment income | Net gains (losses) on securities (both realized and unrealized) | Total from investment operations | Dividends from net investment income | Net asset value, end of period | Total return(a) | Net assets, end of period (000’s omitted) | Ratio of expenses to average net assets with fee waivers and/or expenses absorbed | Ratio of expenses to average net assets without fee waivers and/or expenses absorbed | Supplemental ratio of expenses to average net assets (excluding interest, facilities and maintenance fees)(b) | Ratio of net investment income to average net assets | Portfolio turnover(c) | ||||||||||||||||||||||||||||||||||||||||
Class A |
| |||||||||||||||||||||||||||||||||||||||||||||||||||
Year ended 08/31/14 | $ | 11.20 | $ | 0.49 | (d) | $ | 0.95 | $ | 1.44 | $ | (0.49 | ) | $ | 12.15 | 13.14 | % | $ | 296,200 | 0.93 | %(e) | 0.93 | %(e) | 0.87 | %(e) | 4.25 | %(e) | 12 | % | ||||||||||||||||||||||||
Year ended 08/31/13 | 12.28 | 0.49 | (d) | (1.08 | ) | (0.59 | ) | (0.49 | ) | 11.20 | (5.06 | ) | 165,142 | 0.89 | 0.89 | 0.84 | 4.02 | 12 | ||||||||||||||||||||||||||||||||||
Year ended 08/31/12 | 11.34 | 0.50 | (d) | 0.94 | 1.44 | (0.50 | ) | 12.28 | 12.91 | 163,047 | 0.87 | 0.87 | 0.82 | 4.21 | 18 | |||||||||||||||||||||||||||||||||||||
Year ended 08/31/11 | 11.75 | 0.52 | (d) | (0.41 | ) | 0.11 | (0.52 | ) | 11.34 | 1.13 | 148,884 | 0.90 | 0.90 | 0.85 | 4.66 | 25 | ||||||||||||||||||||||||||||||||||||
Eight months ended 08/31/10 | 11.21 | 0.37 | 0.52 | 0.89 | (0.35 | ) | 11.75 | 8.05 | 26,015 | 0.88 | (f) | 0.91 | (f) | 0.84 | (f) | 4.88 | (f) | 15 | ||||||||||||||||||||||||||||||||||
Year ended 12/31/09 | 10.23 | 0.51 | 0.97 | 1.48 | (0.50 | ) | 11.21 | 14.74 | 24,377 | 0.86 | 0.92 | 0.85 | 4.65 | 19 | ||||||||||||||||||||||||||||||||||||||
Class B |
| |||||||||||||||||||||||||||||||||||||||||||||||||||
Year ended 08/31/14 | 11.28 | 0.50 | (d) | 0.98 | 1.48 | (0.50 | ) | 12.26 | 13.35 | (g) | 16,419 | 0.93 | (e)(g) | 0.93 | (e)(g) | 0.87 | (e)(g) | 4.25 | (e)(g) | 12 | ||||||||||||||||||||||||||||||||
Year ended 08/31/13 | 12.37 | 0.49 | (d) | (1.09 | ) | (0.60 | ) | (0.49 | ) | 11.28 | (5.11 | )(g) | 155,900 | 0.93 | (g) | 0.93 | (g) | 0.88 | (g) | 3.98 | (g) | 12 | ||||||||||||||||||||||||||||||
Year ended 08/31/12 | 11.42 | 0.50 | (d) | 0.95 | 1.45 | (0.50 | ) | 12.37 | 12.93 | (g) | 217,489 | 0.88 | (g) | 0.88 | (g) | 0.83 | (g) | 4.20 | (g) | 18 | ||||||||||||||||||||||||||||||||
Year ended 08/31/11 | 11.83 | 0.52 | (d) | (0.41 | ) | 0.11 | (0.52 | ) | 11.42 | 1.16 | (g) | 220,478 | 0.89 | (g) | 0.89 | (g) | 0.84 | (g) | 4.67 | (g) | 25 | |||||||||||||||||||||||||||||||
Eight months ended 08/31/10 | 11.28 | 0.37 | 0.53 | 0.90 | (0.35 | ) | 11.83 | 8.10 | 254,907 | 0.88 | (f) | 0.91 | (f) | 0.84 | (f) | 4.88 | (f) | 15 | ||||||||||||||||||||||||||||||||||
Year ended 12/31/09 | 10.30 | 0.51 | 0.98 | 1.49 | (0.51 | ) | 11.28 | 14.68 | 266,270 | 0.85 | 0.94 | 0.84 | 4.66 | 19 | ||||||||||||||||||||||||||||||||||||||
Class C |
| |||||||||||||||||||||||||||||||||||||||||||||||||||
Year ended 08/31/14 | 11.27 | 0.44 | (d) | 0.96 | 1.40 | (0.44 | ) | 12.23 | 12.62 | (h) | 20,485 | 1.43 | (e)(h) | 1.43 | (e)(h) | 1.37 | (e)(h) | 3.75 | (e)(h) | 12 | ||||||||||||||||||||||||||||||||
Year ended 08/31/13 | 12.36 | 0.43 | (d) | (1.09 | ) | (0.66 | ) | (0.43 | ) | 11.27 | (5.57 | ) | 21,558 | 1.40 | 1.40 | 1.35 | 3.51 | 12 | ||||||||||||||||||||||||||||||||||
Year ended 08/31/12 | 11.41 | 0.44 | (d) | 0.95 | 1.39 | (0.44 | ) | 12.36 | 12.37 | 27,394 | 1.38 | 1.38 | 1.33 | 3.70 | 18 | |||||||||||||||||||||||||||||||||||||
Year ended 08/31/11 | 11.82 | 0.46 | (d) | (0.40 | ) | 0.06 | (0.47 | ) | 11.41 | 0.65 | 21,800 | 1.40 | 1.40 | 1.35 | 4.16 | 25 | ||||||||||||||||||||||||||||||||||||
Eight months ended 08/31/10 | 11.27 | 0.34 | 0.52 | 0.86 | (0.31 | ) | 11.82 | 7.76 | 17,528 | 1.38 | (f) | 1.41 | (f) | 1.34 | (f) | 4.38 | (f) | 15 | ||||||||||||||||||||||||||||||||||
Year ended 12/31/09 | 10.29 | 0.46 | 0.97 | 1.43 | (0.45 | ) | 11.27 | 14.11 | 17,245 | 1.36 | 1.42 | 1.35 | 4.15 | 19 | ||||||||||||||||||||||||||||||||||||||
Class Y |
| |||||||||||||||||||||||||||||||||||||||||||||||||||
Year ended 08/31/14 | 11.24 | 0.52 | (d) | 0.96 | 1.48 | (0.52 | ) | 12.20 | 13.48 | 22,380 | 0.69 | (e) | 0.69 | (e) | 0.63 | (e) | 4.49 | (e) | 12 | |||||||||||||||||||||||||||||||||
Year ended 08/31/13 | 12.33 | 0.52 | (d) | (1.09 | ) | (0.57 | ) | (0.52 | ) | 11.24 | (4.88 | ) | 20,569 | 0.65 | 0.65 | 0.60 | 4.26 | 12 | ||||||||||||||||||||||||||||||||||
Year ended 08/31/12 | 11.38 | 0.53 | (d) | 0.95 | 1.48 | (0.53 | ) | 12.33 | 13.24 | 24,742 | 0.63 | 0.63 | 0.58 | 4.45 | 18 | |||||||||||||||||||||||||||||||||||||
Year ended 08/31/11 | 11.79 | 0.55 | (d) | (0.41 | ) | 0.14 | (0.55 | ) | 11.38 | 1.40 | 24,195 | 0.65 | 0.65 | 0.60 | 4.91 | 25 | ||||||||||||||||||||||||||||||||||||
Eight months ended 08/31/10 | 11.25 | 0.39 | 0.52 | 0.91 | (0.37 | ) | 11.79 | 8.21 | 26,837 | 0.63 | (f) | 0.66 | (f) | 0.59 | (f) | 5.13 | (f) | 15 | ||||||||||||||||||||||||||||||||||
Year ended 12/31/09 | 10.26 | 0.54 | 0.98 | 1.52 | (0.53 | ) | 11.25 | 15.10 | 27,388 | 0.61 | 0.67 | 0.60 | 4.90 | 19 | ||||||||||||||||||||||||||||||||||||||
| (a) | Includes adjustments in accordance with accounting principles generally accepted in the United States of America and as such, the net asset value for financial reporting purposes and the returns based upon those net asset values may differ from the net asset value and returns for shareholder transactions. Does not include sales charges and is not annualized for periods less than one year, if applicable. |
| (b) | For the years ended August 31, 2011 and prior, ratio does not exclude facilities and maintenance fees. |
| (c) | Portfolio turnover is calculated at the fund level and is not annualized for periods less than one year, if applicable. For the period ended August 31, 2011, the portfolio turnover calculation excludes the value of securities purchased of $139,542,348 and sold of $13,399,363 in the effort to realign the Fund’s portfolio holdings after the reorganization of Invesco Van Kampen California Insured Tax Free Income Fund into the Fund. |
| (d) | Calculated using average shares outstanding. |
| (e) | Ratios are based on average daily net assets (000’s omitted) of $261,018, $49,103, $20,101 and $20,711 for Class A, Class B, Class C and Class Y shares, respectively. |
| (f) | Annualized. |
| (g) | The total return, ratio of expenses to average net assets and ratio of net investment income to average net assets reflect actual 12b-1 fees of 0.24%, 0.27%, 0.25% and 0.25% for the years ended August 31, 2014, 2013, 2012 and 2011, respectively. |
| (h) | The total return, ratio of expenses to average net assets and ratio of net investment income to average net assets reflect actual 12b-1 fees of 0.74%. |
25 Invesco California Tax-Free Income Fund
Report of Independent Registered Public Accounting Firm
To the Board of Trustees of AIM Counselor Series Trust (Invesco Counselor Series Trust)
and Shareholders of Invesco California Tax-Free Income Fund:
In our opinion, the accompanying statement of assets and liabilities, including the schedule of investments, and the related statements of operations and of changes in net assets and the financial highlights present fairly, in all material respects, the financial position of Invesco California Tax-Free Income Fund (one of the funds constituting AIM Counselor Series Trust (Invesco Counselor Series Trust), hereafter referred to as the “Fund”) at August 31, 2014, the results of its operations for the year then ended, the changes in its net assets for each of the two years in the period then ended and the financial highlights for each of the four years in the period then ended and the eight month period ended August 31, 2010, in conformity with accounting principles generally accepted in the United States of America. These financial statements and financial highlights (hereafter referred to as “financial statements”) are the responsibility of the Fund’s management. Our responsibility is to express an opinion on these financial statements based on our audits. We conducted our audits of these financial statements in accordance with the standards of the Public Company Accounting Oversight Board (United States). Those standards require that we plan and perform the audit to obtain reasonable assurance about whether the financial statements are free of material misstatement. An audit includes examining, on a test basis, evidence supporting the amounts and disclosures in the financial statements, assessing the accounting principles used and significant estimates made by management, and evaluating the overall financial statement presentation. We believe that our audits, which included confirmation of securities at August 31, 2014 by correspondence with the custodian and brokers, provide a reasonable basis for our opinion. The financial highlights of the Fund for the year ended December 31, 2009 were audited by another independent registered public accounting firm whose report dated February 25, 2010 expressed an unqualified opinion on such financial statement.
PRICEWATERHOUSECOOPERS LLP
October 27, 2014
Houston, Texas
26 Invesco California Tax-Free Income Fund
Calculating your ongoing Fund expenses
Example
As a shareholder of the Fund, you incur two types of costs: (1) transaction costs, which may include sales charges (loads) on purchase payments or contingent deferred sales charges on redemptions, if any; and (2) ongoing costs, including management fees, distribution and/or service (12b-1) fees, and other Fund expenses. This example is intended to help you understand your ongoing costs (in dollars) of investing in the Fund and to compare these costs with ongoing costs of investing in other mutual funds. The example is based on an investment of $1,000 invested at the beginning of the period and held for the entire period March 1, 2014 through August 31, 2014.
Actual expenses
The table below provides information about actual account values and actual expenses. You may use the information in this table, together with the amount you invested, to estimate the expenses that you paid over the period. Simply divide your account value by $1,000 (for example, an $8,600 account value divided by $1,000 = 8.6), then multiply the result by the number in the table under the heading entitled “Actual Expenses Paid During Period” to estimate the expenses you paid on your account during this period.
Hypothetical example for comparison purposes
The table below also provides information about hypothetical account values and hypothetical expenses based on the Fund’s actual expense ratio and an assumed rate of return of 5% per year before expenses, which is not the Fund’s actual return.
The hypothetical account values and expenses may not be used to estimate the actual ending account balance or expenses you paid for the period. You may use this information to compare the ongoing costs of investing in the Fund and other funds. To do so, compare this 5% hypothetical example with the 5% hypothetical examples that appear in the shareholder reports of the other funds.
Please note that the expenses shown in the table are meant to highlight your ongoing costs only and do not reflect any transaction costs, such as sales charges (loads) on purchase payments or contingent deferred sales charges on redemptions, if any. Therefore, the hypothetical information is useful in comparing ongoing costs only, and will not help you determine the relative total costs of owning different funds. In addition, if these transaction costs were included, your costs would have been higher.
| Class | Beginning Account Value (03/01/14) | ACTUAL | HYPOTHETICAL (5% annual return before expenses) | Annualized Expense Ratio | ||||||||||||||||||||
| Ending Account Value (08/31/14)1 | Expenses Paid During Period2 | Ending Account Value (08/31/14) | Expenses Paid During Period2 | |||||||||||||||||||||
| A | $ | 1,000.00 | $ | 1,057.50 | $ | 4.82 | $ | 1,020.52 | $ | 4.74 | 0.93 | % | ||||||||||||
| B | 1,000.00 | 1,057.10 | 4.82 | 1,020.52 | 4.74 | 0.93 | ||||||||||||||||||
| C | 1,000.00 | 1,054.70 | 7.35 | 1,018.05 | 7.22 | 1.42 | ||||||||||||||||||
| Y | 1,000.00 | 1,058.60 | 3.58 | 1,021.73 | 3.52 | 0.69 | ||||||||||||||||||
| 1 | The actual ending account value is based on the actual total return of the Fund for the period March 1, 2014 through August 31, 2014, after actual expenses and will differ from the hypothetical ending account value which is based on the Fund’s expense ratio and a hypothetical annual return of 5% before expenses. |
| 2 | Expenses are equal to the Fund’s annualized expense ratio as indicated above multiplied by the average account value over the period, multiplied by 184/365 to reflect the most recent fiscal half year. |
27 Invesco California Tax-Free Income Fund
Approval of Investment Advisory and Sub-Advisory Contracts
The Board of Trustees (the Board) of AIM Counselor Series Trust (Invesco Counselor Series Trust) is required under the Investment Company Act of 1940, as amended, to approve annually the renewal of Invesco California Tax-Free Income Fund’s (the Fund) investment advisory agreements. During contract renewal meetings held on June 16-17, 2014, the Board as a whole, and the disinterested or “independent” Trustees, who comprise over 75% of the Board, voting separately, approved the continuance for the Fund of the Master Investment Advisory Agreement with Invesco Advisers, Inc. (Invesco Advisers) and the Master Intergroup Sub-Advisory Contract for Mutual Funds with Invesco Asset Management Deutschland GmbH, Invesco Asset Management Limited, Invesco Asset Management (Japan) Limited, Invesco Australia Limited, Invesco Hong Kong Limited, Invesco Senior Secured Management, Inc. and Invesco Canada Ltd. (collectively, the Affiliated Sub-Advisers and the sub-advisory contracts) for another year, effective July 1, 2014.
In evaluating the fairness and reasonableness of compensation under the Fund’s investment advisory agreement and sub-advisory contracts, the Board considered, among other things, the factors discussed below. The Board determined that continuation of the Fund’s investment advisory agreement and the sub-advisory contracts are in the best interest of the Fund and its shareholders and that the compensation payable to Invesco Advisers and the Affiliated Sub-Advisers under the agreements is fair and reasonable.
The Board’s Fund Evaluation Process
The Board’s Investments Committee has established three Sub-Committees, each of which is primarily responsible for overseeing the management of a number of the funds advised by Invesco Advisers (the Invesco Funds). The Sub-Committees meet throughout the year to review the performance of their assigned Invesco Funds, including reviewing materials prepared under the direction of the independent Senior Officer, an officer of the Invesco Funds who reports directly to the independent Trustees. Over the course of each year, the Sub-Committees meet with portfolio managers for their assigned Invesco Funds and other members of management to review the performance, investment objective(s), policies, strategies, limitations and investment risks of these funds. The Sub-Committees meet regularly and at designated contract renewal meetings each year to conduct a review of the performance, fees, expenses and other matters related to their assigned Invesco Funds. Each Sub-Committee recommends to the Investments Committee, which in turn recommends to the full Board, whether and on what terms to approve the continuance of each Invesco Fund’s
investment advisory agreement and sub-advisory contracts for another year.
During the contract renewal process, the Trustees receive comparative performance and fee data regarding the Invesco Funds prepared by Invesco Advisers and Lipper Inc. (Lipper), an independent provider of investment company data. The Trustees also receive an independent written evaluation from the Senior Officer. The Senior Officer’s evaluation is prepared as part of his responsibility to manage the process by which the Invesco Funds’ proposed management fees are negotiated during the annual contract renewal process to ensure they are negotiated in a manner that is at arms’ length and reasonable. In addition to meetings with Invesco Advisers and fund counsel, the independent Trustees also discuss the continuance of the investment advisory agreement and sub-advisory contracts in separate sessions with the Senior Officer and with independent legal counsel.
The Trustees recognized that the advisory fee rates for the Invesco Funds are, in many cases, the result of years of review and negotiation. The Trustees’ deliberations and conclusions in a particular year may be based in part on their deliberations and conclusions regarding these arrangements throughout the year and in prior years. The Trustees’ review and conclusions are based on the comprehensive consideration of all information presented to them and are not the result of any single determinative factor. Moreover, one Trustee may have weighed a particular piece of information or factor differently than another Trustee.
The discussion below serves as the Senior Officer’s independent written evaluation with respect to the Fund’s investment advisory agreement as well as a discussion of the material factors and related conclusions that formed the basis for the Board’s approval of the Fund’s investment advisory agreement and sub-advisory contracts. Unless otherwise stated, this information is current as of June 17, 2014, and may not reflect consideration of factors that became known to the Board after that date.
Factors and Conclusions and Summary of Independent Written Fee Evaluation
| A. | Nature, Extent and Quality of Services Provided by Invesco Advisers and the Affiliated Sub-Advisers |
The Board reviewed the advisory services provided to the Fund by Invesco Advisers under the Fund’s investment advisory agreement, the performance of Invesco Advisers in providing these services, and the credentials and experience of the officers and employees of Invesco Advisers who provide these services, including the Fund’s portfolio manager or managers, with whom the Sub-Committees met during the year. The Board’s review of the
qualifications of Invesco Advisers to provide advisory services included the Board’s consideration of Invesco Advisers’ investment process oversight, independent credit analysis and investment risk management. The Board also considered non-advisory services that Invesco Advisers and its affiliates provide to the Invesco Funds such as various back office support functions, equity and fixed income trading operations, internal audit, distribution and legal and compliance.
In determining whether to continue the Fund’s investment advisory agreement, the Board considered the benefits of reapproving an existing relationship and the greater uncertainty that may be associated with entering into a new relationship. The Board concluded that the nature, extent and quality of the services provided to the Fund by Invesco Advisers are appropriate and satisfactory and consistent with the terms of the Fund’s investment advisory agreement.
The Board reviewed the services that may be provided by the Affiliated Sub-Advisers under the sub-advisory contracts and the credentials and experience of the officers and employees of the Affiliated Sub-Advisers who provide these services. The Board concluded that the sub-advisory contracts benefit the Fund and its shareholders by permitting Invesco Advisers to use the resources and talents of the Affiliated Sub-Advisers in managing the Fund. The Board concluded that the nature, extent and quality of the services that may be provided by the Affiliated Sub-Advisers are appropriate and satisfactory and consistent with the terms of the Fund’s sub-advisory contracts.
| B. | Fund Performance |
The Board considered Fund performance as a relevant factor in considering whether to approve the investment advisory agreement. The Board did not view Fund performance as a relevant factor in considering whether to approve the sub-advisory contracts for the Fund, as no Affiliated Sub-Adviser currently manages assets of the Fund.
The Board compared the Fund’s performance during the past one, three and five calendar years to the performance of funds in the Lipper performance universe and against the Lipper California Municipal Debt Funds Index. The Board noted that performance of Class A shares of the Fund was in the third quintile of its performance universe for the one and five year periods and the second quintile for the three year period (the first quintile being the best performing funds and the fifth quintile being the worst performing funds). The Board noted that performance of Class A shares of the Fund was below the performance of the Index for the one, three and five year periods. The Trustees also reviewed more recent Fund performance and this review did not change their conclusions.
28 Invesco California Tax-Free Income Fund
| C. | Advisory and Sub-Advisory Fees |
The Board compared the Fund’s contractual management fee rate to the contractual management fee rates of funds in the Fund’s Lipper expense group at a common asset level. The Board noted that the contractual management fee rate for Class A shares of the Fund was below the median contractual management fee rate of funds in its expense group. The Board noted that the term “contractual management fee” may include both advisory and certain administrative services fees, but that Lipper does not provide information on a fund by fund basis as to what is included. The Board noted that Invesco Advisers does not charge the Invesco Funds for the administrative services included in the term as defined by Lipper. The Board also reviewed the methodology used by Lipper in providing expense group information, which includes using each fund’s contractual management fee schedule (including any applicable breakpoints) as reported in the most recent prospectus or statement of additional information for each fund in the expense group.
The Board noted that Invesco Advisers has contractually agreed to waive fees and/or limit expenses of the Fund through at least June 30, 2015 in an amount necessary to limit total annual operating expenses to a specified percentage of average daily net assets for each class of the Fund.
The Board noted that Invesco Advisers and the Affiliated Sub-Advisers do not manage other mutual funds or client accounts using an investment process substantially similar to the investment process used for the Fund.
The Board also considered the services that may be provided by the Affiliated Sub-Advisers pursuant to the sub-advisory contracts, as well as the fees payable by Invesco Advisers to Affiliated Sub-Advisers pursuant to the sub-advisory contracts. The Board also noted that the sub-advisory fees are not paid directly by the Fund, but rather, are payable by Invesco Advisers to the Affiliated Sub-Advisers.
| D. | Economies of Scale and Breakpoints |
The Board considered the extent to which there are economies of scale in the provision of advisory services to the Fund. The Board also considered whether the Fund benefits from economies of scale through contractual breakpoints in the Fund’s advisory fee schedule and was assisted in this review by a report from the Senior Officer. The Board also noted that the Fund shares directly in economies of scale through lower fees charged by third party service providers based on the combined size of the Invesco Funds and other clients advised by Invesco Advisers.
| E. | Profitability and Financial Resources |
The Board reviewed information from Invesco Advisers concerning the costs of the advisory and other services that Invesco Advisers and its affiliates provide to the Fund and the profitability of Invesco Advisers and its affiliates in providing these services for the year ended December 31, 2013. The Board received
information from Invesco Advisers about the methodology used to prepare the profitability information. The Board considered the profitability of Invesco Advisers in managing the Fund and the Invesco Funds. The Board noted that Invesco Advisers continues to operate at a net profit from services Invesco Advisers and its subsidiaries provide to the Invesco Funds and the Fund. The Board did not deem the level of profits realized by Invesco Advisers and its affiliates from providing services to the Fund to be excessive given the nature, quality and extent of the services provided to the Invesco Funds. The Board received and accepted information from Invesco Advisers demonstrating that Invesco Advisers and each Affiliated Sub-Adviser are financially sound and have the resources necessary to perform their obligations under the investment advisory agreement and sub-advisory contracts.
| F. | Collateral Benefits to Invesco Advisers and its Affiliates |
The Board considered various other benefits received by Invesco Advisers and its affiliates from the relationship with the Fund, including the fees received for their provision of transfer agency and distribution services to the Fund. The Board considered comparative information regarding fees charged for these services, including information provided by Lipper and other independent sources. The Board considered the performance of Invesco Advisers and its affiliates in providing these services and the organizational structure employed to provide these services. The Board also considered that these services are provided to the Fund pursuant to written contracts that are reviewed and approved on an annual basis by the Board; that the services are required for the operation of the Fund; that Invesco Advisers and its affiliates can provide services, the nature and quality of which are at least equal to those provided by others offering the same or similar services; and that the fees for such services are fair and reasonable in light of the usual and customary charges by others for services of the same nature and quality.
The Board considered the benefits realized by Invesco Advisers and the Affiliated Sub-Advisers as a result of portfolio brokerage transactions executed through “soft dollar” arrangements. Invesco Advisers noted that the Fund does not execute brokerage transactions through “soft dollar” arrangements to any significant degree.
The Board considered that the Fund’s uninvested cash and cash collateral from any securities lending arrangements may be invested in money market funds advised by Invesco Advisers pursuant to procedures approved by the Board. The Board noted that Invesco Advisers receives advisory fees from these affiliated money market funds attributable to such investments, although Invesco Advisers has contractually agreed to waive through varying periods the advisory fees payable by the Invesco Funds with respect to investments in the affiliated money market funds. The waiver is in an amount equal to
100% of the net advisory fee Invesco Advisers receives from the affiliated money market funds with respect to the Fund’s investment in the affiliated money market funds of uninvested cash, but not cash collateral. The Board concluded that the amount of advisory fees received by Invesco Advisors from the Fund’s investment of uninvested cash and cash collateral from any securities lending arrangements in the affiliated money market funds are fair and reasonable.
29 Invesco California Tax-Free Income Fund
Tax Information
Form 1099-DIV, Form 1042-S and other year–end tax information provide shareholders with actual calendar year amounts that should be included in their tax returns. Shareholders should consult their tax advisors.
The following distribution information is being provided as required by the Internal Revenue Code or to meet a specific state’s requirement.
The Fund designates the following amounts or, if subsequently determined to be different, the maximum amount allowable for its fiscal year ended August 31, 2014:
Federal and State Income Tax | ||||
Qualified Dividend Income* | 0.00 | % | ||
Corporate Dividends Received Deduction* | 0.00 | % | ||
Tax-Exempt Interest Dividends* | 100.00 | % | ||
U.S. Treasury Obligations* | 0.00 | % | ||
| * | The above percentages are based on ordinary income dividends paid to shareholders during the Fund’s fiscal year. |
30 Invesco California Tax-Free Income Fund
Trustees and Officers
The address of each trustee and officer is AIM Counselor Series Trust (Invesco Counselor Series Trust) (the “Trust”), 11 Greenway Plaza, Suite 1000, Houston, Texas 77046-1173. The trustees serve for the life of the Trust, subject to their earlier death, incapacitation, resignation, retirement or removal as more specifically provided in the Trust’s organizational documents. Each officer serves for a one year term or until their successors are elected and qualified. Column two below includes length of time served with predecessor entities, if any.
Name, Year of Birth and Position(s) Held with the Trust | Trustee and/ or Officer Since | Principal Occupation(s) During Past 5 Years | Number of Funds in Fund Complex Overseen by Trustee | Other Directorship(s) Held by Trustee During Past 5 Years | ||||
| Interested Persons | ||||||||
Martin L. Flanagan1 — 1960 Trustee | 2007 | Executive Director, Chief Executive Officer and President, Invesco Ltd. (ultimate parent of Invesco and a global investment management firm); Advisor to the Board, Invesco Advisers, Inc. (formerly known as Invesco Institutional (N.A.), Inc.); Trustee, The Invesco Funds; Vice Chair, Investment Company Institute; and Member of Executive Board, SMU Cox School of Business.
Formerly: Chairman and Chief Executive Officer, Invesco Advisers, Inc. (registered investment adviser); Director, Chairman, Chief Executive Officer and President, IVZ Inc. (holding company), INVESCO Group Services, Inc. (service provider) and Invesco North American Holdings, Inc. (holding company); Director, Chief Executive Officer and President, Invesco Holding Company Limited (parent of Invesco and a global investment management firm); Director, Invesco Ltd.; Chairman, Investment Company Institute and President, Co-Chief Executive Officer, Co-President, Chief Operating Officer and Chief Financial Officer, Franklin Resources, Inc. (global investment management organization). | 141 | None | ||||
Philip A. Taylor2 — 1954 Trustee, President and Principal Executive Officer | 2006 | Head of North American Retail and Senior Managing Director, Invesco Ltd.; Director, Co-Chairman, Co-President and Co-Chief Executive Officer, Invesco Advisers, Inc. (formerly known as Invesco Institutional (N.A.), Inc.) (registered investment adviser); Director, Chairman, Chief Executive Officer and President, Invesco Management Group, Inc. (formerly known as Invesco Aim Management Group, Inc.) (financial services holding company); Director and President, INVESCO Funds Group, Inc. (registered investment adviser and registered transfer agent); Director and Chairman, Invesco Investment Services, Inc. (formerly known as Invesco Aim Investment Services, Inc.) (registered transfer agent) and IVZ Distributors, Inc. (formerly known as INVESCO Distributors, Inc.) (registered broker dealer); Director, President and Chairman, Invesco Inc. (holding company) and Invesco Canada Holdings Inc. (holding company); Chief Executive Officer, Invesco Corporate Class Inc. (corporate mutual fund company) and Invesco Canada Fund Inc. (corporate mutual fund company); Director, Chairman and Chief Executive Officer, Invesco Canada Ltd. (formerly known as Invesco Trimark Ltd./Invesco Trimark Ltèe) (registered investment adviser and registered transfer agent); Trustee, President and Principal Executive Officer, The Invesco Funds (other than AIM Treasurer’s Series Trust (Invesco Treasurer’s Series Trust) and Short-Term Investments Trust); Trustee and Executive Vice President, The Invesco Funds (AIM Treasurer’s Series Trust (Invesco Treasurer’s Series Trust) and Short-Term Investments Trust only); Director, Invesco Investment Advisers LLC (formerly known as Van Kampen Asset Management); Director, Chief Executive Officer and President, Van Kampen Exchange Corp.
Formerly: Director and Chairman, Van Kampen Investor Services Inc.; Director, Chief Executive Officer and President, 1371 Preferred Inc. (holding company) and Van Kampen Investments Inc.; Director and President, AIM GP Canada Inc. (general partner for limited partnerships) and Van Kampen Advisors, Inc.; Director and Chief Executive Officer, Invesco Trimark Dealer Inc. (registered broker dealer); Director, Invesco Distributors, Inc. (formerly known as Invesco Aim Distributors, Inc.) (registered broker dealer); Manager, Invesco PowerShares Capital Management LLC; Director, Chief Executive Officer and President, Invesco Advisers, Inc.; Director, Chairman, Chief Executive Officer and President, Invesco Aim Capital Management, Inc.; President, Invesco Trimark Dealer Inc. and Invesco Trimark Ltd./Invesco Trimark Ltèe; Director and President, AIM Trimark Corporate Class Inc. and AIM Trimark Canada Fund Inc.; Senior Managing Director, Invesco Holding Company Limited; Director and Chairman, Fund Management Company (former registered broker dealer); President and Principal Executive Officer, The Invesco Funds (AIM Treasurer’s Series Trust (Invesco Treasurer’s Series Trust), and Short-Term Investments Trust only); President, AIM Trimark Global Fund Inc. and AIM Trimark Canada Fund Inc. | 141 | None | ||||
Wayne W. Whalen3 — 1939 Trustee | 2010 | Of Counsel, and prior to 2010, partner in the law firm of Skadden, Arps, Slate, Meagher & Flom LLP, legal counsel to certain funds in the Fund Complex
| 141 | Director of the Mutual fund Directors Forum, a nonprofit membership organization for investment directors; Chairman and Director of the Abraham Lincoln Presidential Library Foundation; and Director of the Stevenson Center for Democracy |
| 1 | Mr. Flanagan is considered an interested person (within the meaning of Section 2(a)(19) of the 1940 Act) of the Trust because he is an officer of the Adviser to the Trust, and an officer and a director of Invesco Ltd., ultimate parent of the Adviser. |
| 2 | Mr. Taylor is considered an interested person (within the meaning of Section 2(a)(19) of the 1940 Act) of the Trust because he is an officer and a director of the Adviser. |
| 3 | Mr. Whalen is retiring effective December 31, 2014. He has been deemed to be an interested person of the Trust because of his prior service as counsel to the predecessor funds of certain Invesco open-end funds and his affiliation with the law firm that served as counsel to such predecessor funds and the Invesco closed-end funds. |
T-1 Invesco California Tax-Free Income Fund
Trustees and Officers—(continued)
Name, Year of Birth and Position(s) Held with the Trust | Trustee and/ or Officer Since | Principal Occupation(s) During Past 5 Years | Number of Funds in Fund Complex Overseen by Trustee | Other Directorship(s) Past 5 Years | ||||
| Independent Trustees | ||||||||
Bruce L. Crockett — 1944 Trustee and Chair | 2003 | Chairman, Crockett Technologies Associates (technology consulting company)
Formerly: Director, Captaris (unified messaging provider); Director, President and Chief Executive Officer, COMSAT Corporation; Chairman, Board of Governors of INTELSAT (international communications company); ACE Limited (insurance company); and Investment Company Institute | 141 | ALPS (Attorneys Liability Protection Society) (insurance company) | ||||
David C. Arch — 1945 Trustee | 2010 | Chairman of Blistex Inc., a consumer health care products manufacturer | 141 | Board member of the Illinois Manufacturers’ Association; Member of the Board of Visitors, Institute for the Humanities, University of Michigan; Member of the Audit Committee of the Edward-Elmhurst Hospital | ||||
Frank S. Bayley — 1939 Trustee | 2003 | Retired. Formerly: Director, Badgley Funds Inc. (registered investment company) (2 portfolios) and General Partner and Of Counsel, law firm of Baker & McKenzie, LLP | 141 | Director and Chairman, C.D. Stimson Company (a real estate investment company); Trustee, The Curtis Institute of Music | ||||
James T. Bunch — 1942 Trustee | 2000 | Managing Member, Grumman Hill Group LLC (family office private equity investments)
Formerly: Founder, Green Manning & Bunch Ltd. (investment banking firm) (1988-2010); Executive Committee, United States Golf Association; and Director, Policy Studies, Inc. and Van Gilder Insurance Corporation | 141 | Chairman, Board of Governors, Western Golf Association; Chairman, Evans Scholars Foundation; and Director, Denver Film Society | ||||
Rodney F. Dammeyer — 1940 Trustee | 2010 | Chairman of CAC, LLC, (private company offering capital investment and management advisory services)
Formerly: Prior to 2001, Managing Partner at Equity Group Corporate Investments; Prior to 1995, Chief Executive Officer of Itel Corporation (formerly Anixter International); Prior to 1985, experience includes Senior Vice President and Chief Financial Officer of Household International, Inc., Executive Vice President and Chief Financial Officer of Northwest Industries, Inc. and Partner of Arthur Andersen & Co.; From 1987 to 2010, Director/Trustee of investment companies in the Van Kampen Funds complex | 141 | Director of Quidel Corporation and Stericycle, Inc. | ||||
Albert R. Dowden — 1941 Trustee | 2003 | Director of a number of public and private business corporations, including the Boss Group, Ltd. (private investment and management); Nature’s Sunshine Products, Inc. and Reich & Tang Funds (5 portfolios) (registered investment company)
Formerly: Director, Homeowners of America Holding Corporation/Homeowners of America Insurance Company (property casualty company); Director, Continental Energy Services, LLC (oil and gas pipeline service); Director, CompuDyne Corporation (provider of product and services to the public security market) and Director, Annuity and Life Re (Holdings), Ltd. (reinsurance company); Director, President and Chief Executive Officer, Volvo Group North America, Inc.; Senior Vice President, AB Volvo; Director of various public and private corporations; Chairman, DHJ Media, Inc.; Director, Magellan Insurance Company; and Director, The Hertz Corporation, Genmar Corporation (boat manufacturer), National Media Corporation; Advisory Board of Rotary Power International (designer, manufacturer, and seller of rotary power engines); and Chairman, Cortland Trust, Inc. (registered investment company) | 141 | Director of: Nature’s Sunshine Products, Inc., Reich & Tang Funds, Homeowners of America Holding Corporation/ Homeowners of America Insurance Company, the Boss Group | ||||
Jack M. Fields — 1952 Trustee | 2003 | Chief Executive Officer, Twenty First Century Group, Inc. (government affairs company); Owner and Chief Executive Officer, Dos Angeles Ranch, L.P. (cattle, hunting, corporate entertainment); and Discovery Global Education Fund (non-profit)
Formerly: Chief Executive Officer, Texana Timber LP (sustainable forestry company); Director of Cross Timbers Quail Research Ranch (non-profit); and member of the U.S. House of Representatives | 141 | Insperity, Inc. (formerly known as Administaff) | ||||
Prema Mathai-Davis — 1950 Trustee | 2003 | Retired. Formerly: Chief Executive Officer, YWCA of the U.S.A. | 141 | None | ||||
Larry Soll — 1942 Trustee | 1997 | Retired. Formerly: Chairman, Chief Executive Officer and President, Synergen Corp. (a biotechnology company) | 141 | None | ||||
Hugo F. Sonnenschein — 1940 Trustee | 2010 | President Emeritus and Honorary Trustee of the University of Chicago and the Adam Smith Distinguished Service Professor in the Department of Economics at the University of Chicago. Prior to 2000, President of the University of Chicago | 141 | Trustee of the University of Rochester and a member of its investment committee; Member of the National Academy of Sciences and the American Philosophical Society; Fellow of the American Academy of Arts and Sciences |
T-2 Invesco California Tax-Free Income Fund
Trustees and Officers—(continued)
Name, Year of Birth and Position(s) Held with the Trust | Trustee and/ or Officer Since | Principal Occupation(s) During Past 5 Years | Number of Funds in Fund Complex Overseen by Trustee | Other Directorship(s) Past 5 Years | ||||
| Independent Trustees—(continued) | ||||||||
Raymond Stickel, Jr. — 1944 Trustee | 2005 | Retired. Formerly: Director, Mainstay VP Series Funds, Inc. (25 portfolios) and Partner, Deloitte & Touche | 141 | None | ||||
Suzanne H. Woolsey — 1941 Trustee | 2014 | Chief Executive Officer of Woolsey Partners LLC | 141 | Emeritus Chair of the Board of Trustees of the Institute for Defense Analyses; Trustee of Colorado College; Trustee of California Institute of Technology; Prior to 2014, Director of Fluor Corp.; Prior to 2010, Trustee of the German Marshall Fund of the United States; Prior to 2010 Trustee of the Rocky Mountain Institute | ||||
| Other Officers | ||||||||
Russell C. Burk — 1958 Senior Vice President and Senior Officer | 2005 | Senior Vice President and Senior Officer, The Invesco Funds | N/A | N/A | ||||
John M. Zerr — 1962 Senior Vice President, Chief Legal Officer and Secretary | 2006 | Director, Senior Vice President, Secretary and General Counsel, Invesco Management Group, Inc. (formerly known as Invesco Aim Management Group, Inc.) and Van Kampen Exchange Corp.; Senior Vice President, Invesco Advisers, Inc. (formerly known as Invesco Institutional (N.A.), Inc.) (registered investment adviser); Senior Vice President and Secretary, Invesco Distributors, Inc. (formerly known as Invesco Aim Distributors, Inc.); Director, Vice President and Secretary, Invesco Investment Services, Inc. (formerly known as Invesco Aim Investment Services, Inc.) and IVZ Distributors, Inc. (formerly known as INVESCO Distributors, Inc.); Director and Vice President, INVESCO Funds Group, Inc.; Senior Vice President, Chief Legal Officer and Secretary, The Invesco Funds; Manager, Invesco PowerShares Capital Management LLC; Director, Secretary and General Counsel, Invesco Investment Advisers LLC (formerly known as Van Kampen Asset Management); Secretary and General Counsel, Invesco Capital Markets, Inc. (formerly known as Van Kampen Funds Inc.) and Chief Legal Officer, PowerShares Exchange-Traded Fund Trust, PowerShares Exchange-Traded Fund Trust II, PowerShares India Exchange-Traded Fund Trust and PowerShares Actively Managed Exchange-Traded Fund Trust
Formerly: Director and Vice President, Van Kampen Advisors Inc.; Director, Vice President, Secretary and General Counsel, Van Kampen Investor Services Inc.; Director, Invesco Distributors, Inc. (formerly known as Invesco Aim Distributors, Inc.); Director, Senior Vice President, General Counsel and Secretary, Invesco Aim Advisers, Inc. and Van Kampen Investments Inc.; Director, Vice President and Secretary, Fund Management Company; Director, Senior Vice President, Secretary, General Counsel and Vice President, Invesco Aim Capital Management, Inc.; Chief Operating Officer and General Counsel, Liberty Ridge Capital, Inc. (an investment adviser); Vice President and Secretary, PBHG Funds (an investment company) and PBHG Insurance Series Fund (an investment company); Chief Operating Officer, General Counsel and Secretary, Old Mutual Investment Partners (a broker-dealer); General Counsel and Secretary, Old Mutual Fund Services (an administrator) and Old Mutual Shareholder Services (a shareholder servicing center); Executive Vice President, General Counsel and Secretary, Old Mutual Capital, Inc. (an investment adviser); and Vice President and Secretary, Old Mutual Advisors Funds (an investment company) | N/A | N/A | ||||
Sheri Morris — 1964 Vice President, Treasurer and Principal Financial Officer | 2003 | Vice President, Treasurer and Principal Financial Officer, The Invesco Funds; Vice President, Invesco Advisers, Inc. (formerly known as Invesco Institutional (N.A.), Inc.) (registered investment adviser); and Vice President, PowerShares Exchange-Traded Fund Trust, PowerShares Exchange-Traded Fund Trust II, PowerShares India Exchange-Traded Fund Trust and PowerShares Actively Managed Exchange-Traded Fund Trust
Formerly: Vice President, Invesco Aim Advisers, Inc., Invesco Aim Capital Management, Inc. and Invesco Aim Private Asset Management, Inc.; Assistant Vice President and Assistant Treasurer, The Invesco Funds and Assistant Vice President, Invesco Advisers, Inc., Invesco Aim Capital Management, Inc. and Invesco Aim Private Asset Management, Inc.; and Treasurer, PowerShares Exchange-Traded Fund Trust, PowerShares Exchange-Traded Fund Trust II, PowerShares India Exchange-Traded Fund Trust and PowerShares Actively Managed Exchange-Traded Fund Trust | N/A | N/A | ||||
T-3 Invesco California Tax-Free Income Fund
Trustees and Officers—(continued)
Name, Year of Birth and Position(s) Held with the Trust | Trustee and/ or Officer Since | Principal Occupation(s) During Past 5 Years | Number of Funds in Fund Complex Overseen by Trustee | Other Directorship(s) Past 5 Years | ||||
| Other Officers—(continued) | ||||||||
Karen Dunn Kelley — 1960 Vice President | 2003 | Senior Managing Director, Investments; Director, Co-President, Co-Chief Executive Officer, and Co-Chairman, Invesco Advisers, Inc. (formerly known as Invesco Institutional (N.A.), Inc.) (registered investment adviser); Chairman, Invesco Senior Secured Management, Inc.; Senior Vice President, Invesco Management Group, Inc. (formerly known as Invesco Aim Management Group, Inc.); Executive Vice President, Invesco Distributors, Inc. (formerly known as Invesco Aim Distributors, Inc.); Director, Invesco Mortgage Capital Inc. and Invesco Management Company Limited; Director and President, INVESCO Asset Management (Bermuda) Ltd., Vice President, The Invesco Funds (other than AIM Treasurer’s Series Trust (Invesco Treasurer’s Series Trust) and Short-Term Investments Trust); and President and Principal Executive Officer, The Invesco Funds (AIM Treasurer’s Series Trust (Invesco Treasurer’s Series Trust) and Short-Term Investments Trust only)
Formerly: Director, INVESCO Global Asset Management Limited and INVESCO Management S.A.; Senior Vice President, Van Kampen Investments Inc. and Invesco Advisers, Inc. (formerly known as Invesco Institutional (N.A.), Inc.) (registered investment adviser); Vice President, Invesco Advisers, Inc. (formerly known as Invesco Institutional (N.A.), Inc.); Director of Cash Management and Senior Vice President, Invesco Advisers, Inc. and Invesco Aim Capital Management, Inc.; Director and President, Fund Management Company; Chief Cash Management Officer, Director of Cash Management, Senior Vice President, and Managing Director, Invesco Aim Capital Management, Inc.; Director of Cash Management, Senior Vice President, and Vice President, Invesco Advisers, Inc. and The Invesco Funds (AIM Treasurer’s Series Trust (Invesco Treasurer’s Series Trust), and Short-Term Investments Trust only) | N/A | N/A | ||||
Crissie M. Wisdom — 1969 Anti-Money Laundering Compliance Officer | 2013 | Anti-Money Laundering Compliance Officer, Invesco Advisers, Inc. (formerly known as Invesco Institutional (N.A.), Inc.) (registered investment adviser), Invesco Capital Markets, Inc. (formerly known as Van Kampen Funds Inc.), Invesco Distributors, Inc., Invesco Investment Services, Inc., Invesco Management Group, Inc., Van Kampen Exchange Corp., The Invesco Funds, and PowerShares Exchange-Traded Fund Trust, PowerShares Exchange-Traded Fund Trust II, PowerShares India Exchange-Traded Fund Trust, and PowerShares Actively Managed Exchange-Traded Fund Trust; and Fraud Prevention Manager and Controls and Risk Analysis Manager for Invesco Investment Services, Inc. | N/A | N/A | ||||
Todd L. Spillane — 1958 Chief Compliance Officer | 2006 | Senior Vice President, Invesco Management Group, Inc. (formerly known as Invesco Aim Management Group, Inc.) and Van Kampen Exchange Corp.; Senior Vice President and Chief Compliance Officer, Invesco Advisers, Inc. (registered investment adviser) (formerly known as Invesco Institutional (N.A.), Inc.); Chief Compliance Officer, The Invesco Funds; Vice President, Invesco Distributors, Inc. (formerly known as Invesco Aim Distributors, Inc.) and Invesco Investment Services, Inc. (formerly known as Invesco Aim Investment Services, Inc.)
Formerly: Chief Compliance Officer, Invesco Funds (Chicago); Senior Vice President, Van Kampen Investments Inc.; Senior Vice President and Chief Compliance Officer, Invesco Aim Advisers, Inc. and Invesco Aim Capital Management, Inc.; Chief Compliance Officer, INVESCO Private Capital Investments, Inc. (holding company), Invesco Private Capital, Inc. (registered investment adviser), Invesco Global Asset Management (N.A.), Inc., Invesco Senior Secured Management, Inc. (registered investment adviser), Van Kampen Investor Services Inc., PowerShares Exchange-Traded Fund Trust, PowerShares Exchange-Traded Fund Trust II, PowerShares India Exchange-Traded Fund Trust and PowerShares Actively Managed Exchange-Traded Fund Trust; and Vice President, Invesco Aim Capital Management, Inc. and Fund Management Company | N/A | N/A |
The Statement of Additional Information of the Trust includes additional information about the Fund’s Trustees and is available upon request, without charge, by calling 1.800.959.4246. Please refer to the Fund’s prospectus for information on the Fund’s sub-advisers.
Office of the Fund 11 Greenway Plaza, Suite 1000 Houston, TX 77046-1173 | Investment Adviser Invesco Advisers, Inc. 1555 Peachtree Street, N.E. Atlanta, GA 30309 | Distributor Invesco Distributors, Inc. 11 Greenway Plaza, Suite 1000 Houston, TX 77046-1173 | Auditors PricewaterhouseCoopers LLP 1201 Louisiana Street, Suite 2900 Houston, TX 77002-5678 | |||
Counsel to the Fund Stradley Ronon Stevens & Young, LLP 2005 Market Street, Suite 2600 Philadelphia, PA 19103-7018 | Counsel to the Independent Trustees Goodwin Procter LLP 901 New York Avenue, N.W. Washington, D.C. 20001 | Transfer Agent Invesco Investment Services, Inc. 11 Greenway Plaza, Suite 1000 Houston, TX 77046-1173 | Custodian State Street Bank and Trust Company 225 Franklin Street Boston, MA 02110-2801 | |||
T-4 Invesco California Tax-Free Income Fund

Invesco mailing information
Send general correspondence to Invesco Investment Services, Inc., P.O. Box 219078, Kansas City, MO 64121-9078.
Important notice regarding delivery of security holder documents
To reduce Fund expenses, only one copy of most shareholder documents may be mailed to shareholders with multiple accounts at the same address (Householding). Mailing of your shareholder documents may be householded indefinitely unless you instruct us otherwise. If you do not want the mailing of these documents to be combined with those for other members of your household, please contact Invesco Investment Services, Inc. at 800 959 4246 or contact your financial institution. We will begin sending you individual copies for each account within 30 days after receiving your request.
Fund holdings and proxy voting information
The Fund provides a complete list of its holdings four times in each fiscal year, at the quarter ends. For the second and fourth quarters, the lists appear in the Fund’s semiannual and annual reports to shareholders. For the first and third quarters, the Fund files the lists with the Securities and Exchange Commission (SEC) on Form N-Q. The most recent list of portfolio holdings is available at invesco.com/completeqtrholdings. Shareholders can also look up the Fund’s Forms N-Q on the SEC website at sec.gov. Copies of the Fund’s Forms N-Q may be reviewed and copied at the SEC Public Reference Room in Washington, D.C. You can obtain information on the operation of the Public Reference Room, including information about duplicating fee charges, by calling 202 551 8090 or 800 732 0330, or by electronic request at the following email address: publicinfo@sec.gov. The SEC file numbers for the Fund are shown below.
A description of the policies and procedures that the Fund uses to determine how to vote proxies relating to portfolio securities is available without charge, upon request, from our Client Services department at 800 959 4246 or at invesco.com/proxyguidelines. The information is also available on the SEC website, sec.gov.
Information regarding how the Fund voted proxies related to its portfolio securities during the most recent 12-month period ended June 30 is available at invesco.com/proxysearch. The information is also available on the SEC website, sec.gov. Invesco Advisers, Inc. is an investment adviser; it provides investment advisory services to individual and institutional clients and does not sell securities. Invesco Distributors, Inc. is the US distributor for Invesco Ltd.’s retail mutual funds, exchange-traded funds and institutional money market funds. Both are wholly owned, indirect subsidiaries of Invesco Ltd. |  |
| SEC file numbers: 811-09913 and 333-36074 | MS-CTFI-AR-1 | Invesco Distributors, Inc. |
Letters to Shareholders
Philip Taylor | Dear Shareholders: This annual report includes information about your Fund, including performance data and a complete list of its investments as of the close of the reporting period. Inside, your Fund’s portfolio managers discuss how they managed your Fund and the factors that affected its performance during the reporting period. I hope you find this report of interest. During the reporting period covered by this report, the US economy showed signs of continued improvement. After contracting in the first quarter of 2014, the economy expanded strongly in the second quarter and unemployment trended lower. Much of the credit for this improvement goes to the US Federal Reserve (the Fed), which undertook an extraordinary asset purchase program following the global financial crisis. The Fed’s goal was to jumpstart the economy by encouraging banks to lend more, businesses to hire more and consumers to spend more. Signs of a stronger US economy prompted the Fed to reduce, or “taper,” its asset purchase program. Despite this, |

interest rates remained near historical low levels due largely to heavy investor demand for bonds. While signs of economic improvement were evident in the US, European economies remained relatively stagnant. During the reporting period, high unemployment persisted, worries about potential deflation grew, and uncertainty about Russian-Ukrainian tensions weighed on European markets.
Extended periods of market strength can lull investors into complacency – just as prolonged periods of market weakness or volatility can discourage investors from initiating long-term investment plans. That’s why Invesco has always encouraged investors to work with a professional financial adviser who can stress the importance of starting to save and invest early and the importance of adhering to a disciplined investment plan – when times are good and when they’re uncertain. A financial adviser who knows your unique financial situation, investment goals and risk tolerance can be an invaluable partner as you seek to achieve your financial goals. He or she can offer a long-term perspective when markets are volatile and time-tested advice and guidance when your financial situation or investment goals change.
Timely information when and where you want it
Invesco’s efforts to help investors achieve their financial objectives include providing individual investors and financial professionals with timely information about the markets, the economy and investing – whenever and wherever they want it.
Our website, invesco.com/us, offers a wide range of market insights and investment perspectives. On the website, you’ll find detailed information about our funds, including prices, performance, holdings and portfolio manager commentaries. You can access information about your individual Invesco account whenever it’s convenient for you; just complete a simple, secure online registration. Use the “Login” box on our home page to get started.
Invesco’s mobile app for iPad® (available free from the App StoreSM) allows you to obtain the same detailed information about your Fund and the same investment insights from our investment leaders, market strategists, economists and retirement experts on the go. You also can watch portfolio manager videos and have instant access to Invesco news and updates wherever you may be.
In addition to the resources accessible on our website and through our mobile app, you can obtain timely updates to help you stay informed about the markets, the economy and investing by connecting with Invesco on Twitter, LinkedIn or Facebook. You can access our blog at blog.invesco.us.com or by clicking the “Intentional Investing Forum” link on our home page. Our goal is to provide you the information you want, when and where you want it.
Have questions?
For questions about your account, feel free to contact an Invesco client services representative at 800 959 4246. For Invesco-related questions or comments, please email me directly at phil@invesco.com.
All of us at Invesco look forward to serving your investment management needs for many years to come. Thank you for investing with us.
Sincerely,

Philip Taylor
Senior Managing Director, Invesco Ltd.
iPad is a trademark of Apple Inc., registered in the US and other countries. App Store is a service mark of Apple Inc. Invesco Distributors, Inc. is not affiliated with Apple Inc.
2 Invesco Core Plus Bond Fund
Bruce Crockett | Dear Fellow Shareholders: There are a variety of factors that can impact investment performance, many of which are uncontrollable by us as investors. These factors can include various economic trends and geopolitical developments. While the members of the Invesco Funds Board, which I chair, can’t dictate the performance of the Invesco funds, be assured that your Board works diligently throughout the year to focus on how your investments are managed. Our job is to represent you and your interests on a variety of fund management-related matters. We regularly monitor how the portfolio management teams of the Invesco funds are performing in light of ever-changing and often unpredictable economic and market conditions. We review the investment strategies and investment process employed by each fund’s management team as explained in the fund’s prospectus. Perhaps our most significant responsibility is conducting the annual review of the funds’ |

advisory and sub-advisory contracts with Invesco Advisers and its affiliates. This annual review, which is required by the Investment Company Act of 1940, focuses on the nature and quality of the services Invesco provides as the adviser to the Invesco funds and the reasonableness of the fees that it charges for those services. Each year, we spend months carefully reviewing information from Invesco that allows us to evaluate the quality of its services and the reasonableness of its fees. We also use information from a variety of independent sources, including materials provided by the independent senior officer of the Invesco funds, who reports directly to the independent trustees on the Board. Additionally, we meet with legal counsel and review performance and fee data prepared for us by Lipper Inc., an independent, third-party firm widely recognized as a leader in its field.
After a careful review, the members of the Invesco Funds Board approved the continuation of advisory and sub-advisory contracts with Invesco Advisers and its affiliates. Be assured that your Board will continue working on behalf of fund shareholders, keeping your needs and interests uppermost in our minds.
As always, please contact me at bruce@brucecrockett.com with any questions or concerns you may have. On behalf of the Board, we look forward to continuing to represent your interests and serving your needs.
Sincerely,

Bruce L. Crockett
Independent Chair
Invesco Funds Board of Trustees
3 Invesco Core Plus Bond Fund
Management’s Discussion of Fund Performance
Performance summary
For the reporting period ended August 31, 2014, Invesco Core Plus Bond Fund, at net asset value (NAV), outperformed its broad market/style-specific index. Sector and security selection were the major contributors to performance for the reporting period.
Your Fund’s long-term performance appears later in this report.
Fund vs. Indexes
Total returns, 8/31/13 to 8/31/14, at net asset value (NAV). Performance shown does not include applicable contingent deferred sales charges (CDSC) or front-end sales charges, which would have reduced performance.
Class A Shares | 9.44 | % | ||
Class B Shares | 8.53 | |||
Class C Shares | 8.53 | |||
Class R Shares | 9.07 | |||
Class Y Shares | 9.61 | |||
Class R5 Shares | 9.61 | |||
Class R6 Shares | 9.64 | |||
Barclays U.S. Aggregate Indexq (Broad Market/Style-Specific Index) | 5.66 | |||
Lipper Core Plus Bond Funds Index¢ (Peer Group Index)* | 6.37 |
Source(s): qFactSet Research Systems Inc.; nLipper Inc.
| * | The Fund has elected to use the Lipper Core Plus Bond Funds Index to represent its peer group index rather than the Lipper Intermediate Investment Grade Debt Funds Index because the Lipper Core Plus Bond Funds Index more closely reflects the performance of the types of securities in which the Fund invests and because the Lipper Intermediate Investment Grade Debt Funds Index no longer exists. |
How we invest
The Fund invests primarily in investment-grade fixed income securities generally represented by the Barclays U.S. Aggregate Index, the Fund’s broad market/ style-specific index. The Fund’s investments typically include corporate bonds, US Treasury and agency securities, including debt securities of issuers located in emerging markets, mortgage-backed securities (MBS) and asset-backed securities. We seek to maintain a dollar-weighted average portfolio maturity of between three and 10 years. The Fund may invest up to 30% of its net assets in foreign debt securities, up to 20% in high yield debt securities (“junk
bonds”) and up to 20% in securities denominated in currencies other than the US dollar.
The Fund invests in derivative instruments such as futures contracts, options and swap agreements, including interest rate and credit derivatives, such as interest rate futures, currency options, swaptions and credit default swaps. It also can engage in to-be-announced (TBA) transactions where the Fund buys or sells mortgage-backed securities on a forward commitment basis. These strategies are implemented within the risk profile of the guidelines set forth in the Fund’s prospectus.
In managing the Fund, we seek to balance between bottom-up and top-down decision making to create informational
Portfolio Composition
By security type, based on total investments
| U.S. Dollar Denominated Bonds and Notes | 43.6 | % | ||
Asset-Backed Securities | 24.0 | |||
| U.S. Government Sponsored Agency Mortgage-Backed Securities | 21.5 | |||
U.S. Treasury Securities | 5.8 | |||
Preferred Stocks | 1.7 | |||
Municipal Obligations | 1.4 | |||
| Non-U.S. Dollar Denominated Bonds and Notes | 1.0 | |||
Money Market Funds | 0.9 | |||
Put Options Purchased | 0.1 | |||
| Common Stocks and Other Equity Interests | 0.0 |
Top Five Fixed Income Issuers
1. | Federal National Mortgage Association | 18.9 | % | |||
2. | U.S. Treasury | 6.8 | ||||
3. | Federal Home Loan Mortgage Corp. | 5.2 | ||||
4. | Verizon Communications, Inc. | 2.1 | ||||
5. | WFRBS Commercial Mortgage Trust | 2.0 |
Total Net Assets | $ | 665.7 million | ||
Total Number of Holdings* | 787 |
The Fund’s holdings are subject to change, and there is no assurance that the Fund will continue to hold any particular security.
*Excluding money market fund holdings.
advantages that exploit opportunities in different geographic regions or market environments. We employ a top-down approach with rigorous bottom-up country, currency and interest rate analysis. In general, the Fund will look for attractive risk-reward opportunities and securities that best enable the Fund to pursue those opportunities. We consider the recommendations of market-specific specialists in adjusting the Fund’s risk exposures and security selection.
Decisions to purchase or sell securities are determined by relative value considerations, which factor in economic and credit-related fundamentals, market supply and demand, market dislocations and situation-specific opportunities. The purchase or sale of securities may be related to a decision to alter the Fund’s macro risk exposure (such as duration, yield curve positioning and sector exposure), a need to limit or reduce the Fund’s exposure to a particular security or issuer, degradation of an issuer’s credit quality or general liquidity needs of the Fund.
Market conditions and your Fund
The fiscal year began on the heels of a tumultuous summer for the bond market, as signs of a strengthening economy and concerns over US monetary policy led investors to sell intermediate and longer term bonds, pushing yields higher and bond prices lower. Continued uncertainty over future policies of the US Federal Reserve (the Fed), especially its quantitative easing program, was the primary driver of bond market volatility that lasted through the fourth quarter of 2013. The yield of the benchmark 10-year Treasury note crossed the 3% threshold for the first time in more than two years by the end of December.1
During the first half of 2014, bond market returns were generally positive, strengthened by a general decline in yields due to renewed concerns over US economic growth following unexpectedly disruptive winter weather in the first quarter of 2014. Yields also were pushed lower due to demand driven by rising tensions in Eastern Europe and the Middle East, which prompted investors to seek safety. The yield on the 10-year Treasury note fell to 2.5% by the end of June.2 This happened despite the Fed’s tapering of its quantitative easing via bond purchases from $85 billion per month in January to $35 billion a month by the end of June.2
4 Invesco Core Plus Bond Fund
Meanwhile, investors’ demand for yield during the reporting period drove rallies in credit-related markets, such as emerging market debt and high yield corporate bonds. The returns for these two market sectors provided nearly double the return of the core US investment-grade market for the same period, as measured by their respective Barclays indexes. A favorable supply/demand dynamic and solid credit fundamentals supported the “risk-on” environment throughout the reporting period. Despite slower economic activity and escalating geopolitical concerns, investors favored credit risk assets.
The Fund generated positive returns for the reporting period in absolute terms and, at NAV, outperformed its broad market/style-specific benchmark. Sustained overweight risk weightings across various non-government bond sectors and security selection across the portfolio contributed to the Fund’s outperformance.
Sector allocation decisions emphasized non-government market exposure throughout the fiscal year. The Fund’s sustained overweight position in corporate bonds was a principal driver of outperformance, along with our strategic out-of-index “plus” sector allocations to high yield corporate bonds and US dollar-denominated emerging market debt securities. Conversely, the Fund’s underweight exposure to the government-related and agency MBS sectors, as well as marginal overweight exposure to the energy and utility corporate sub-sectors, created a slight performance drag versus our broad market/style-specific benchmark.
Selectivity across the various strata of the non-government bond sectors, such as credit quality, coupon, maturity, structure, vintage and issuer were beneficial to the Fund’s relative return for the year. Security selection within securitized and corporate bonds was one of the most notable contributors to our outperformance for the year.
The Fund benefited from incremental income earned transactions in the highly liquid TBA market for agency MBS. Such transactions involve the Fund selling an MBS to a financial institution, with an agreement to repurchase a substantially similar security at an agreed upon price and date. Cash received by the Fund as a result of this repurchase transaction may be invested in short-term instruments, and the income from these investments, together with any additional fee income received from this activity, generates income for the Fund.
The Fund also may use active duration and yield curve positioning for risk management and for generating alpha versus its broad market/style-specific benchmark. Duration measures a portfolio’s price sensitivity to interest rate changes. Yield curve positioning refers to actively emphasizing particular points (maturities) along the yield curve with favorable risk/return expectations. Duration of the portfolio was maintained close to benchmark, on average, and the timing of changes and the degree of variance from the Fund’s broad market/style-specific benchmark during the reporting period provided a small boost to relative returns. Buying and selling US Treasury futures and interest rate swaptions were important tools we used for the management of interest rate risk and to maintain our targeted portfolio duration.
Part of our strategy to manage credit and currency risk in the portfolio during the reporting period entailed purchasing and selling credit and currency derivatives. We managed credit market risk by purchasing and selling protection through credit default swaps at various points throughout the year. The currency management was carried out via currency forwards and options on an as-needed basis and was effective in managing the currency positioning within the Fund.
Thank you for investing in Invesco Core Plus Bond Fund and for sharing our long-term investment horizon.
| 1 | Marketwatch.com |
| 2 | US Federal Reserve |
The views and opinions expressed in management’s discussion of Fund performance are those of Invesco Advisers, Inc. These views and opinions are subject to change at any time based on factors such as market and economic conditions. These views and opinions may not be relied upon as investment advice or recommendations, or as an offer for a particular security. The information is not a complete analysis of every aspect of any market, country, industry, security or the Fund. Statements of fact are from sources considered reliable, but Invesco Advisers, Inc. makes no representation or warranty as to their completeness or accuracy. Although historical performance is no guarantee of future results, these insights may help you understand our investment management philosophy.
See important Fund and, if applicable, index disclosures later in this report.
Chuck Burge
Portfolio Manager, is manager of Invesco Core Plus Bond Fund. He joined Invesco in 2002. Mr. Burge earned a BS in economics from Texas A&M University and an MBA in finance and accounting from Rice University.
Jack Deino
Chartered Financial Analyst, Portfolio Manager, is manager of Invesco Core Plus Bond Fund. He joined Invesco in 2006. Mr. Deino earned a BA in Latin American studies from The University of Texas at Austin.
Darren Hughes
Chartered Financial Analyst, Portfolio Manager, is manager of Invesco Core Plus Bond Fund. He joined Invesco in 1992. Mr. Hughes earned a BBA in finance and economics from Baylor University.
Michael Hyman
Portfolio Manager, is manager of Invesco Core Plus Bond Fund. He began managing the Fund in 2013. Mr. Hyman earned a BSE in finance from Pennsylvania State University and an MBA from the Stern School of Business at New York University.
Joseph Portera
Portfolio Manager, is manager of Invesco Core Plus Bond Fund. He joined Invesco in 2012. Mr. Portera earned BA and MA degrees in Soviet studies and an MA in international political economy and development from Fordham University.
Scott Roberts
Chartered Financial Analyst, Portfolio Manager, is manager of Invesco Core Plus Bond Fund. He joined Invesco in 2000. Mr. Roberts earned a BBA in finance from the University of Houston.
Robert Waldner
Chartered Financial Analyst, Portfolio Manager, is manager of Invesco Core Plus Bond Fund. He joined Invesco in 2013. Mr. Waldner earned a BSE degree in civil engineering from Princeton University.
5 Invesco Core Plus Bond Fund
Your Fund’s Long-Term Performance
Results of a $10,000 Investment – Oldest Share Class(es) since Inception
Fund data from 6/3/09; index data from 5/31/09

1 Source: Lipper Inc.
2 Source: FactSet Research Systems Inc.
Past performance cannot guarantee comparable future results.
During the reporting period covered by this report, the Fund changed its peer group index from the Lipper Intermediate Investment Grade Debt Funds Index to the Lipper Core Plus Bond Funds Index. Following index changes, SEC guidelines require that we compare a fund’s performance to both its old and new indexes. However, because the Lipper Intermediate Investment Grade Debt Funds Index no longer exists, its performance cannot be shown in the chart above.
The data shown in the chart include reinvested distributions, applicable sales charges and Fund expenses including management fees. Results for Class B shares are calculated as if a hypothetical shareholder had liquidated his entire investment in the Fund at the close of the reporting period and paid the contingent deferred sales charges, if applicable. Index results include reinvested dividends, but they do not reflect sales charges. Performance of the peer group, if applicable, reflects fund expenses and management fees; performance of a
market index does not. Performance shown in the chart and table(s) does not reflect deduction of taxes a shareholder would pay on Fund distributions or sale of Fund shares.
6 Invesco Core Plus Bond Fund
Average Annual Total Returns
As of 8/31/14, including maximum applicable sales charges
Class A Shares | ||||
Inception (6/3/09) | 5.22 | % | ||
5 Years | 4.73 | |||
1 Year | 4.81 | |||
Class B Shares | ||||
Inception (6/3/09) | 5.12 | % | ||
5 Years | 4.51 | |||
1 Year | 3.53 | |||
Class C Shares | ||||
Inception (6/3/09) | 5.28 | % | ||
5 Years | 4.84 | |||
1 Year | 7.53 | |||
Class R Shares | ||||
Inception (6/3/09) | 5.80 | % | ||
5 Years | 5.37 | |||
1 Year | 9.07 | |||
Class Y Shares | ||||
Inception (6/3/09) | 6.35 | % | ||
5 Years | 5.91 | |||
1 Year | 9.61 | |||
Class R5 Shares | ||||
Inception (6/3/09) | 6.33 | % | ||
5 Years | 5.89 | |||
1 Year | 9.61 | |||
Class R6 Shares | ||||
Inception | 6.19 | % | ||
5 Years | 5.75 | |||
1 Year | 9.64 | |||
Average Annual Total Returns
As of 6/30/14, the most recent calendar quarter end,including maximum applicable sales charges
Class A Shares | ||||
Inception (6/3/09) | 5.23 | % | ||
5 Years | 5.29 | |||
1 Year | 3.17 | |||
Class B Shares | ||||
Inception (6/3/09) | 5.15 | % | ||
5 Years | 5.06 | |||
1 Year | 1.87 | |||
Class C Shares | ||||
Inception (6/3/09) | 5.31 | % | ||
5 Years | 5.39 | |||
1 Year | 5.97 | |||
Class R Shares | ||||
Inception (6/3/09) | 5.84 | % | ||
5 Years | 5.92 | |||
1 Year | 7.50 | |||
Class Y Shares | ||||
Inception (6/3/09) | 6.41 | % | ||
5 Years | 6.48 | |||
1 Year | 8.14 | |||
Class R5 Shares | ||||
Inception (6/3/09) | 6.37 | % | ||
5 Years | 6.45 | |||
1 Year | 8.04 | |||
Class R6 Shares | ||||
Inception | 6.22 | % | ||
5 Years | 6.30 | |||
1 Year | 8.06 | |||
Class R6 shares incepted on September 24, 2012. Performance shown prior to that date is that of Class A shares and includes the 12b-1 fees applicable to Class A shares. Class A share performance reflects any applicable fee waivers or expense reimbursements.
The performance data quoted represent past performance and cannot guarantee comparable future results; current performance may be lower or higher. Please visit invesco.com/performance for the most recent month-end performance. Performance figures reflect reinvested distributions, changes in net asset value and the effect of the maximum sales charge unless otherwise stated. Investment return and principal value will fluctuate so that you may have a gain or loss when you sell shares.
The net annual Fund operating expense ratio set forth in the most recent Fund prospectus as of the date of this report for Class A, Class B, Class C, Class R, Class Y, Class R5 and
Class R6 shares was 0.84%, 1.59% 1.59%, 1.09%, 0.59%, 0.56% and 0.54%, respectively.1,2 The total annual Fund operating expense ratio set forth in the most recent Fund prospectus as of the date of this report for Class A, Class B, Class C, Class R, Class Y, Class R5 and Class R6 shares was 1.01%, 1.76%, 1.76%, 1.26%, 0.76%, 0.58% and 0.56%, respectively. The expense ratios presented above may vary from the expense ratios presented in other sections of this report that are based on expenses incurred during the period covered by this report.
Class A share performance reflects the maximum 4.25% sales charge, and Class B and Class C share performance reflects the applicable contingent deferred sales charge (CDSC) for the period involved. The CDSC on Class B shares declines from 5% beginning at the time of purchase to 0% at the beginning of the seventh year. The CDSC on Class C shares is 1% for the first year after purchase. Class R, Class
Y, Class R5 and Class R6 shares do not have a front-end sales charge or a CDSC; therefore, performance is at net asset value.
The performance of the Fund’s share classes will differ primarily due to different sales charge structures and class expenses.
Had the adviser not waived fees and/ or reimbursed expenses in the past, performance would have been lower.
| 1 | Total annual Fund operating expenses after any contractual fee waivers and/or expense reimbursements by the adviser in effect through at least December 31, 2014. See current prospectus for more information. |
| 2 | Total annual Fund operating expenses after any contractual fee waivers by the adviser in effect through at least June 30, 2016. See current prospectus for more information. |
7 Invesco Core Plus Bond Fund
Invesco Core Plus Bond Fund’s investment objective is total return, comprised of current income and capital appreciation.
| n | Unless otherwise stated, information presented in this report is as of August 31, 2014, and is based on total net assets. |
| n | Unless otherwise noted, all data provided by Invesco. |
| n | To access your Fund’s reports/prospectus, visit invesco.com/fundreports. |
About share classes
| n | Class B shares may not be purchased for new or additional investments. Please see the prospectus for more information. |
| n | Class R shares are generally available only to employer sponsored retirement and benefit plans. Please see the prospectus for more information. |
| n | Class Y shares are available only to certain investors. Please see the prospectus for more information. |
| n | Class R5 shares and Class R6 shares are primarily intended for employer sponsored retirement and benefit plans that meet certain standards and for institutional investors. Please see the prospectus for more information. |
Principal risks of investing in the Fund
| n | Active Trading Risk. The Fund engages in frequent trading of portfolio securities. Active trading results in added expenses and may result in a lower return and increased tax liability. |
| n | Collateralized loan obligations risk. In addition to the normal interest rate, default and other risk of fixed income securities, collateralized loan obligations carry additional risks, including the possibility that distributions from collateral securities will not be adequate to make interest or other payments, the quality of the collateral may decline in value or default, the Fund may invest in collateralized loan obligations that are subordinate to other classes, values may be volatile, and disputes with the issuer may produce unexpected investment results. |
| n | Credit risk. The issuer of instruments in which the Fund invests may be unable to meet interest and/or principal payments, thereby causing its instruments to decrease in value and lowering the issuer’s credit rating. |
| n | Currency/exchange rate risk. The dollar value of the Fund’s foreign investments will be affected by changes in the exchange rates between the dollar and |
the currencies in which those investments are traded. |
| n | Derivatives risk. The value of a derivative instrument depends largely on (and is derived from) the value of an underlying security, currency, commodity, interest rate, index or other asset (each referred to as an underlying asset). In addition to risks relating to the underlying assets, the use of derivatives may include other, possibly greater, risks, including counterparty, leverage and liquidity risks. Counterparty risk is the risk that the counterparty to the derivative contract will default on its obligation to pay the Fund the amount owed or otherwise perform under the derivative contract. Derivatives create leverage risk because they do not require payment up front equal to the economic exposure created by owning the derivative. As a result, an adverse change in the value of the underlying asset could result in the Fund sustaining a loss that is substantially greater than the amount invested in the derivative, which may make the Fund’s returns more volatile and increase the risk of loss. Derivative instruments may also be less liquid than more traditional investments and the Fund may be unable to sell or close out its derivative positions at a desirable time or price. This risk may be more acute under adverse market conditions, during which the Fund may be most in need of liquidating its derivative positions. Derivatives may also be harder to value, less tax efficient and subject to changing government regulation that could impact the Fund’s ability to use certain derivatives or their cost. Also, derivatives used for hedging or to gain or limit exposure to a particular market segment may not provide the expected benefits, particularly during adverse market conditions. |
| n | Developing/emerging markets securities risk. The prices of securities issued by foreign companies and governments located in developing/emerging |
market countries may be affected more negatively by inflation, devaluation of their currencies, higher transaction costs, delays in settlement, adverse political developments, the introduction of capital controls, withholding taxes, nationalization of private assets, expropriation, social unrest, war or lack of timely information than those in developed countries. |
| n | Foreign securities risk. The Fund’s foreign investments may be affected by changes in a foreign country’s exchange rates, political and social instability, changes in economic or taxation policies, difficulties when enforcing obligations, decreased liquidity, and increased volatility. Foreign companies may be subject to less regulation resulting in less publicly available information about the companies. |
| n | High yield bond (junk bond) risk. Junk bonds involve a greater risk of default or price changes due to changes in the credit quality of the issuer. The values of junk bonds fluctuate more than those of high- quality bonds in response to company, political, regulatory or economic developments. Values of junk bonds can decline significantly over short periods of time. |
| n | Interest rate risk. Interest rate risk refers to the risk that bond prices generally fall as interest rates rise; conversely, bond prices generally rise as interest rates fall. Specific bonds differ in their sensitivity to changes in interest rates depending on their individual characteristics, including duration. |
| n | Liquidity risk. The Fund may hold illiquid securities that it is unable to sell at the preferred time or price and could lose its entire investment in such securities. |
| n | Management risk. The investment techniques and risk analysis used by the Fund’s portfolio managers may not produce the desired results. |
| n | Market risk. The prices of and the income generated by the Fund’s securities may decline in response to, among other things, investor sentiment, general economic and market conditions, regional or global instability, and currency and interest rate fluctuations. |
This report must be accompanied or preceded by a currently effective Fund prospectus, which contains more complete information, including sales charges and expenses. Investors should read it carefully before investing.
| NOT FDIC INSURED | MAY LOSE VALUE | NO BANK GUARANTEE |
continued on page 9
8 Invesco Core Plus Bond Fund
| n | Mortgage- and asset-backed securities risk. The Fund may invest in mortgage- and asset-backed securities that are subject to prepayment or call risk, which is the risk that the borrower’s payments may be received earlier or later than expected due to changes in prepayment rates on underlying loans. Faster prepayments often happen when interest rates are falling. As a result, the Fund may reinvest these early payments at lower interest rates, thereby reducing the Fund’s income. Conversely, when interest rates rise, prepayments may happen more slowly, causing the security to lengthen in duration. Longer duration securities tend to be more volatile. Securities may be prepaid at a price less than the original purchase value. An unexpectedly high rate of defaults on the mortgages held by a mortgage pool may adversely affect the value of mortgage-backed securities and could result in losses to the Fund. The risk of such defaults is generally higher in the case of mortgage pools that include subprime mortgages. Subprime mortgages refer to loans made to borrowers with weakened credit histories or with lower capacity to make timely payments on their mortgages. |
| n | Municipal securities risk. The Fund may invest in municipal securities. Constitutional amendments, legislative enactments, executive orders, administrative regulations, voter initiatives, and the issuer’s regional economic conditions may affect the municipal security’s value, interest payments, repayment of principal and the Fund’s ability to sell it. Failure of a municipal security issuer to comply with applicable tax requirements may make income paid thereon taxable, resulting in a decline in the security’s value. In addition, there could be changes in applicable tax laws or tax treatments that reduce or eliminate the current federal income tax exemption on municipal securities or otherwise adversely affect the current federal or state tax status of municipal securities. |
| n | Reinvestment risk. Reinvestment risk is the risk that a bond’s cash flows (coupon income and principal repayment) will be reinvested at an interest rate below that on the original bond. |
| n | TBA transactions risk. TBA transactions involve the risk that the securities received may be less favorable than what was anticipated by the Fund when entering into the TBA transaction. TBA transactions also involve the risk that a counterparty will fail to deliver the securities, exposing the Fund to further losses. Whether or not the Fund takes delivery of the securities at the termination date of a TBA transaction, the Fund will nonetheless be exposed to changes in the value of the underlying investments during the term of the agreement. |
| n | US government obligations risk. The Fund may invest in obligations issued by US government agencies and instrumentalities that may receive varying levels of support from the government, which could affect the Fund’s ability to recover should they default. |
| n | When-issued and delayed delivery risk. When-issued and delayed delivery transactions are subject to market risk as the value or yield of a security at delivery may be more or less than the purchase price or the yield generally available on securities when delivery occurs. In addition, the Fund is subject to counterparty risk because it relies on the buyer or seller, as the case may be, to consummate the transaction, and failure by the other party to complete the transaction may result in the Fund missing the opportunity of obtaining a price or yield considered to be advantageous. |
| n | Zero coupon or pay-in-kind securities risk. The value, interest rates, and liquidity of non-cash paying instruments, such as zero coupon and pay-in-kind securities, are subject to greater fluctuation than other types of securities. The higher yields and interest rates on pay-in-kind securities reflect the payment deferral and increased credit risk associated with such instruments and that such investments may represent a higher credit risk than coupon loans. Pay-in-kind securities may have a potential variability in valuations because their continuing accruals require continuing judgments about the collectability of the deferred payments and the value of any associated collateral. |
About indexes used in this report
| n | The Barclays U.S. Aggregate Index is an unmanaged index considered representative of the US investment-grade, fixed-rate bond market. |
| n | The Lipper Core Plus Bond Funds Index comprises funds that invest at least 65% in domestic investment-grade debt issues (rated in the top four grades) with any remaining investment in non-benchmark sectors such as high-yield, global and emerging market debt. |
| n | The Fund is not managed to track the performance of any particular index, including the index(es) described here, and consequently, the performance of the Fund may deviate significantly from the performance of the index(es). |
| n | A direct investment cannot be made in an index. Unless otherwise indicated, index results include reinvested dividends, and they do not reflect sales charges. Performance of the peer group, if applicable, reflects fund expenses; performance of a market index does not. |
Other information
| n | The returns shown in management’s discussion of Fund performance are based on net asset values (NAVs) calculated for shareholder transactions. Generally accepted accounting principles require adjustments to be made to the net assets of the Fund at period end for financial reporting purposes, and as such, the NAVs for shareholder transactions and the returns based on those NAVs may differ from the NAVs and returns reported in the Financial Highlights. |
9 Invesco Core Plus Bond Fund
Schedule of Investments(a)
August 31, 2014
| Principal Amount | Value | |||||||
U.S. Dollar Denominated Bonds and Notes–50.56% |
| |||||||
| Aerospace & Defense–0.44% | ||||||||
Bombardier Inc. (Canada), | $ | 13,000 | $ | 13,260 | ||||
7.75%, 03/15/20(b) | 108,000 | 120,690 | ||||||
DigitalGlobe Inc., Sr. Unsec. Gtd. Bonds, 5.25%, 02/01/21(b) | 61,000 | 60,695 | ||||||
GenCorp Inc., Sec. Gtd. Global Notes, 7.13%, 03/15/21 | 204,000 | 221,085 | ||||||
L-3 Communications Corp., | 1,540,000 | 1,543,876 | ||||||
Sr. Unsec. Gtd. Notes, | 679,000 | 742,417 | ||||||
TransDigm Inc., | 115,000 | 115,719 | ||||||
7.50%, 07/15/21 | 50,000 | 55,063 | ||||||
Sr. Unsec. Gtd. Sub. Notes, | 24,000 | 24,510 | ||||||
6.50%, 07/15/24(b) | 33,000 | 33,949 | ||||||
| 2,931,264 | ||||||||
| Agricultural & Farm Machinery–0.01% | ||||||||
Titan International Inc., Sr. Sec. Gtd. Global Notes, 6.88%, 10/01/20 | 74,000 | 75,018 | ||||||
| Airlines–0.54% | ||||||||
American Airlines Pass Through Trust, Series 2011-1, Class B, Sec. Pass Through Ctfs., 7.00%, 01/31/18(b) | 70,548 | 76,809 | ||||||
Continental Airlines Pass Through Trust, | 1,052,368 | 1,186,545 | ||||||
Series 2009-2, Class B, Sec. Global Pass Through Ctfs., 9.25%, 05/10/17 | 2,755 | 3,063 | ||||||
Series 2012-1, Class A, Sr. Sec. Pass Through Ctfs., 4.15%, 04/11/24 | 475,391 | 495,298 | ||||||
United Airlines Pass Through Trust, Series 2014-2, Class B, Sec. Pass Through Ctfs., 4.63%, 09/03/22 | 1,750,000 | 1,760,937 | ||||||
US Airways Pass Through Trust, | 10,447 | 10,551 | ||||||
Series 2012-1, Class B, Sec. Pass Through Ctfs., 8.00%, 10/01/19 | 9,267 | 10,518 | ||||||
Virgin Australia Pass Through Trust (Australia), Series 2013-1, Class B, Sec. Gtd. Pass Through Ctfs., 6.00%, 10/23/20(b) | 61,189 | 64,172 | ||||||
| 3,607,893 | ||||||||
| Alternative Carriers–0.04% | ||||||||
Level 3 Escrow II Inc., Sr. Unsec. Gtd. Notes, 5.38%, 08/15/22(b) | 105,000 | 106,575 | ||||||
| Principal Amount | Value | |||||||
| Alternative Carriers–(continued) | ||||||||
Level 3 Financing Inc., Sr. Unsec. Gtd. Notes, 6.13%, 01/15/21(b) | $ | 164,000 | $ | 173,840 | ||||
| 280,415 | ||||||||
| Apparel Retail–0.09% | ||||||||
Hot Topic, Inc., Sr. Sec. Gtd. Notes, 9.25%, 06/15/21(b) | 141,000 | 154,571 | ||||||
L Brands, Inc., Sr. Unsec. Gtd. Notes, 6.63%, 04/01/21 | 170,000 | 192,737 | ||||||
Men’s Wearhouse Inc. (The), Sr. Unsec. Gtd. Notes, 7.00%, 07/01/22(b) | 165,000 | 174,075 | ||||||
Neiman Marcus Group Ltd. LLC, Sr. Unsec. Gtd. Notes, 8.00%, 10/15/21(b) | 43,000 | 46,494 | ||||||
| 567,877 | ||||||||
| Apparel, Accessories & Luxury Goods–0.03% | ||||||||
Levi Strauss & Co., Sr. Unsec. Global Notes, 6.88%, 05/01/22 | 151,000 | 165,345 | ||||||
William Carter Co. (The), Sr. Unsec. Gtd. Global Notes, 5.25%, 08/15/21 | 16,000 | 16,800 | ||||||
| 182,145 | ||||||||
| Application Software–0.02% | ||||||||
Nuance Communications Inc., Sr. Unsec. Gtd. Notes, 5.38%, 08/15/20(b) | 113,000 | 113,848 | ||||||
| Asset Management & Custody Banks–1.39% | ||||||||
Affiliated Managers Group, Inc., Sr. Unsec. Global Notes, 4.25%, 02/15/24 | 2,865,000 | 2,998,241 | ||||||
Apollo Management Holdings L.P., Sr. Unsec. Gtd. Notes, 4.00%, 05/30/24(b) | 965,000 | 981,484 | ||||||
Blackstone Holdings Finance Co. LLC, Sr. Unsec. Gtd. Notes, 5.00%, 06/15/44(b) | 2,645,000 | 2,852,651 | ||||||
Carlyle Holdings II Finance LLC, Sr. Sec. Gtd. Notes, 5.63%, 03/30/43(b) | 1,545,000 | 1,808,595 | ||||||
KKR Group Finance Co III LLC, Sr. Unsec. Gtd. Bonds, 5.13%, 06/01/44(b) | 505,000 | 539,429 | ||||||
Signode Industrial Group Lux S.A./ | 86,000 | 86,107 | ||||||
| 9,266,507 | ||||||||
| Auto Parts & Equipment–1.12% | ||||||||
CTP Transportation Products LLC/CTP Finance Inc., Sr. Sec. Notes, 8.25%, 12/15/19(b) | 65,000 | 70,363 | ||||||
Dana Holding Corp., Sr. Unsec. Notes, 5.38%, 09/15/21 | 128,000 | 133,440 | ||||||
Johnson Controls, Inc., Sr. Unsec. Global Notes, 4.95%, 07/02/64 | 615,000 | 637,519 | ||||||
Magna International Inc. (Canada), Sr. Unsec. Global Notes, 3.63%, 06/15/24 | 3,295,000 | 3,373,150 | ||||||
See accompanying Notes to Financial Statements which are an integral part of the financial statements.
10 Invesco Core Plus Bond Fund
| Principal Amount | Value | |||||||
| Auto Parts & Equipment–(continued) | ||||||||
Stackpole International Intermediate Co. S.A./Stackpole International Powder Metal (Canada), Sr. Sec. Gtd. Notes, 7.75%, 10/15/21(b) | $ | 148,000 | $ | 152,440 | ||||
TRW Automotive Inc., Sr. Unsec. Gtd. Notes, 4.50%, 03/01/21(b) | 3,000,000 | 3,089,062 | ||||||
| 7,455,974 | ||||||||
| Automobile Manufacturers–0.50% | ||||||||
General Motors Co., Sr. Unsec. Global Notes, 3.50%, 10/02/18 | 2,355,000 | 2,407,987 | ||||||
General Motors Financial Co. Inc, Sr. Unsec. Gtd. Notes, 3.50%, 07/10/19 | 924,000 | 937,860 | ||||||
| 3,345,847 | ||||||||
| Automotive Retail–0.01% | ||||||||
CST Brands, Inc., Sr. Unsec. Gtd. Global Notes, 5.00%, 05/01/23 | 73,000 | 73,730 | ||||||
| Biotechnology–0.24% | ||||||||
Celgene Corp., Sr. Unsec. Global Notes, 3.63%, 05/15/24 | 1,560,000 | 1,592,871 | ||||||
| Broadcasting–0.34% | ||||||||
Central European Media Enterprises Ltd. (Czech Republic), Sr. Sec. Gtd. PIK Global Notes, 15.00%, 12/01/17(c) | 2,499 | 2,846 | ||||||
Clear Channel Communications, Inc., Sr. Unsec. Global Notes, 10.00%, 01/15/18 | 100,000 | 93,750 | ||||||
Clear Channel Worldwide Holdings Inc., Series B, Sr. Unsec. Gtd. Global Notes, 6.50%, 11/15/22 | 74,000 | 79,735 | ||||||
Discovery Communications LLC, Sr. Unsec. Gtd. Global Notes, 6.35%, 06/01/40 | 1,275,000 | 1,576,791 | ||||||
Sinclair Television Group Inc., Sr. Unsec. Gtd. Notes, 5.63%, 08/01/24(b) | 110,000 | 110,550 | ||||||
Starz LLC/Starz Finance Corp., Sr. Unsec. Gtd. Global Notes, 5.00%, 09/15/19 | 5,000 | 5,175 | ||||||
TV Azteca S.A.B. de C.V. (Mexico), REGS, Sr. Unsec. Gtd. Medium-Term Euro Notes, | 350,000 | 378,000 | ||||||
| 2,246,847 | ||||||||
| Building Products–0.15% | ||||||||
Builders FirstSource Inc., Sr. Sec. Notes, 7.63%, 06/01/21(b) | 215,000 | 225,481 | ||||||
Building Materials Holding Corp., Sr. Sec. Notes, 9.00%, 09/15/18(b) | 126,000 | 137,655 | ||||||
Gibraltar Industries Inc., Sr. Unsec. Gtd. Sub. Global Notes, 6.25%, 02/01/21 | 180,000 | 187,650 | ||||||
Norbord Inc. (Canada), Sr. Sec. Notes, 5.38%, 12/01/20(b) | 54,000 | 53,211 | ||||||
Nortek Inc., Sr. Unsec. Gtd. Global Notes, 8.50%, 04/15/21 | 211,000 | 229,990 | ||||||
| Principal Amount | Value | |||||||
| Building Products–(continued) | ||||||||
USG Corp., | $ | 24,000 | $ | 25,320 | ||||
7.88%, 03/30/20(b) | 60,000 | 65,850 | ||||||
Sr. Unsec. Notes, 9.75%, 01/15/18 | 80,000 | 94,600 | ||||||
| 1,019,757 | ||||||||
| Cable & Satellite–0.67% | ||||||||
CCO Holdings LLC/CCO Holdings Capital Corp., Sr. Unsec. Gtd. Global Notes, 5.25%, 03/15/21 | 147,000 | 151,042 | ||||||
COX Communications Inc., Sr. Unsec. Notes, | 1,220,000 | 1,778,171 | ||||||
9.38%, 01/15/19(b) | 25,000 | 32,247 | ||||||
DIRECTV Holdings LLC/DIRECTV Financing Co., Inc., Sr. Unsec. Gtd. Notes, 4.45%, 04/01/24 | 1,090,000 | 1,171,942 | ||||||
DISH DBS Corp., Sr. Unsec. Gtd. Global Notes, | 80,000 | 80,000 | ||||||
5.13%, 05/01/20 | 299,000 | 308,717 | ||||||
Hughes Satellite Systems Corp., | 66,000 | 73,013 | ||||||
Sr. Unsec. Gtd. Global Notes, 7.63%, 06/15/21 | 59,000 | 67,186 | ||||||
Time Warner Cable, Inc., Sr. Unsec. Gtd. Notes, 5.00%, 02/01/20 | 680,000 | 764,145 | ||||||
| 4,426,463 | ||||||||
| Casinos & Gaming–0.06% | ||||||||
Boyd Gaming Corp., Sr. Unsec. Gtd. Global Notes, 9.00%, 07/01/20 | 105,000 | 113,662 | ||||||
Caesars Entertainment Resort Properties LLC, Sr. Sec. Gtd. Notes, 8.00%, 10/01/20(b) | 10,000 | 10,025 | ||||||
Caesars Growth Properties Holdings | 22,000 | 21,450 | ||||||
MGM Resorts International, | 45,000 | 50,288 | ||||||
Sr. Unsec. Gtd. Notes, 7.75%, 03/15/22 | 136,000 | 159,800 | ||||||
Wynn Las Vegas LLC/Wynn Las Vegas Capital Corp., Sr. Unsec. Global Notes, 5.38%, 03/15/22 | 55,000 | 57,750 | ||||||
| 412,975 | ||||||||
| Catalog Retail–1.57% | ||||||||
QVC Inc., | 1,736,000 | 1,803,587 | ||||||
Sr. Sec. Bonds, | 2,800,000 | 2,814,388 | ||||||
Sr. Sec. Notes, | 1,815,000 | 1,842,246 | ||||||
7.50%, 10/01/19(b) | 3,825,000 | 3,993,778 | ||||||
| 10,453,999 | ||||||||
See accompanying Notes to Financial Statements which are an integral part of the financial statements.
11 Invesco Core Plus Bond Fund
| Principal Amount | Value | |||||||
| Coal & Consumable Fuels–0.04% | ||||||||
Alpha Natural Resources Inc., Sec. Gtd. Notes, 7.50%, 08/01/20(b) | $ | 10,000 | $ | 9,700 | ||||
CONSOL Energy Inc., | 50,000 | 53,125 | ||||||
Sr. Unsec. Gtd. Notes, 5.88%, 04/15/22(b) | 129,000 | 134,805 | ||||||
Peabody Energy Corp., Sr. Unsec. Gtd. Notes, 6.50%, 09/15/20 | 78,000 | 78,975 | ||||||
| 276,605 | ||||||||
| Commercial Printing–0.02% | ||||||||
RR Donnelley & Sons Co., Sr. Unsec. Global Notes, 7.88%, 03/15/21 | 90,000 | 102,600 | ||||||
| Commodity Chemicals–0.09% | ||||||||
Braskem Finance Ltd. (Brazil), | 200,000 | 216,400 | ||||||
REGS, Sr. Unsec. Gtd. Euro Notes, 7.38%(b)(d) | 400,000 | 412,400 | ||||||
| 628,800 | ||||||||
| Communications Equipment–0.05% | ||||||||
Avaya Inc., | 40,000 | 36,950 | ||||||
Sr. Sec. Gtd. Notes, | 135,000 | 135,000 | ||||||
9.00%, 04/01/19(b) | 133,000 | 138,819 | ||||||
| 310,769 | ||||||||
| Construction & Engineering–0.08% | ||||||||
Dycom Investments Inc., Sr. Unsec. Gtd. Sub. Global Notes, 7.13%, 01/15/21 | 105,000 | 111,563 | ||||||
Odebrecht Offshore Drilling Finance Ltd. (Brazil), Sr. Sec. Gtd. Notes, 6.63%, 10/01/22(b) | 395,560 | 423,549 | ||||||
| 535,112 | ||||||||
| Construction Machinery & Heavy Trucks–0.10% | ||||||||
Allied Specialty Vehicles, Inc., Sr. Sec. Notes, 8.50%, 11/01/19(b) | 127,000 | 133,667 | ||||||
Commercial Vehicle Group Inc., Sec. Gtd. Global Notes, 7.88%, 04/15/19 | 129,000 | 134,805 | ||||||
Meritor Inc., Sr. Unsec. Gtd. Notes, 6.25%, 02/15/24 | 89,000 | 91,893 | ||||||
6.75%, 06/15/21 | 34,000 | 36,125 | ||||||
Navistar International Corp., Sr. Unsec. Gtd. Notes, 8.25%, 11/01/21 | 108,000 | 112,590 | ||||||
Oshkosh Corp., Sr. Unsec. Gtd. Global Notes, 5.38%, 03/01/22 | 142,000 | 145,905 | ||||||
| 654,985 | ||||||||
| Construction Materials–0.05% | ||||||||
CPG Merger Sub LLC, Sr. Unsec. Gtd. Notes, 8.00%, 10/01/21(b) | 30,000 | 31,650 | ||||||
| Principal Amount | Value | |||||||
| Construction Materials–(continued) | ||||||||
Unifrax I LLC/Unifrax Holding Co., Sr. Unsec. Gtd. Notes, 7.50%, 02/15/19(b) | $ | 170,000 | $ | 175,950 | ||||
US Concrete, Inc., Sr. Sec. Gtd. Global Notes, 8.50%, 12/01/18 | 101,000 | 109,585 | ||||||
| 317,185 | ||||||||
| Consumer Finance–0.06% | ||||||||
Navient LLC, Sr. Unsec. Medium-Term Global Notes, 6.25%, 01/25/16 | 355,000 | 377,037 | ||||||
| Data Processing & Outsourced Services–0.08% | ||||||||
CoreLogic, Inc., Sr. Unsec. Gtd. Global Notes, 7.25%, 06/01/21 | 228,000 | 243,105 | ||||||
First Data Corp., | 37,000 | 45,325 | ||||||
Sr. Unsec. Gtd. Sub. Global Notes, 11.75%, 08/15/21 | 196,000 | 232,505 | ||||||
| 520,935 | ||||||||
| Distillers & Vintners–0.01% | ||||||||
CEDC Finance Corp. International Inc. (Poland), Sr. Sec. Gtd. Global Notes, 10.00%, 04/30/18(e) | 49,281 | 47,619 | ||||||
| Diversified Banks–6.71% | ||||||||
Alfa Bank OJSC Via Alfa Bond Issuance PLC (Russia), Sr. Unsec. Loan Participation Notes, 7.75%, 04/28/21(b) | 200,000 | 201,000 | ||||||
Banco Davivienda S.A. (Colombia), Sr. Unsec. Notes, | 200,000 | 201,076 | ||||||
Banco de Credito e Inversiones (Chile), Sr. Unsec. Notes, | 200,000 | 206,579 | ||||||
4.00%, 02/11/23(b) | 500,000 | 498,845 | ||||||
Banco Inbursa S.A. Institucion de Banca Multiple (Mexico), Sr. Unsec. Notes, 4.13%, 06/06/24(b) | 1,390,000 | 1,367,656 | ||||||
Banco Santander Mexico S.A. Institucion de Banca Multiple Grupo Financiero Santander (Mexico), Unsec. Sub. Bonds, 5.95%, 01/30/24(b) | 400,000 | 433,500 | ||||||
Bancolombia S.A. (Colombia), Unsec. Sub. Global Notes, 5.13%, 09/11/22 | 140,000 | 142,634 | ||||||
Bank of America Corp., Sr. Unsec. Global Notes, 6.50%, 08/01/16 | 10,000 | 11,000 | ||||||
Bank of Montreal (Canada), Sr. Unsec. Medium-Term Notes, 0.80%, 11/06/15 | 1,330,000 | 1,335,906 | ||||||
Barclays Bank PLC (United Kingdom), Unsec. Sub. Global Notes, 5.14%, 10/14/20 | 810,000 | 885,131 | ||||||
BBVA Bancomer S.A. (Mexico), | 1,385,000 | 1,405,245 | ||||||
Unsec. Sub. Notes, 6.75%, 09/30/22(b) | 600,000 | 682,325 | ||||||
See accompanying Notes to Financial Statements which are an integral part of the financial statements.
12 Invesco Core Plus Bond Fund
| Principal Amount | Value | |||||||
| Diversified Banks–(continued) | ||||||||
Citigroup Inc., | $ | 2,970,000 | $ | 3,330,752 | ||||
Series A, Jr. Unsec. Sub. Global Notes, 5.95%(d) | 1,495,000 | 1,513,687 | ||||||
Credit Agricole S.A. (France), Jr. Unsec. Sub. Notes, 7.88%(b)(d) | 1,395,000 | 1,513,575 | ||||||
Eurasian Development Bank (Supranational), Sr. Unsec. Notes, 4.77%, 09/20/22(b) | 200,000 | 196,125 | ||||||
Finansbank A.S. (Turkey), REGS, Sr. Unsec. Euro Notes, 6.25%, 04/30/19(b) | 400,000 | 421,200 | ||||||
Grupo Aval Ltd. (Colombia), Sr. Unsec. Gtd. Notes, 4.75%, 09/26/22(b) | 400,000 | 403,241 | ||||||
Hana Bank (South Korea), Sr. Unsec. Notes, 4.25%, 06/14/17(b) | 700,000 | 747,248 | ||||||
HBOS PLC (United Kingdom), Unsec. Sub. Medium-Term Global Notes, 6.75%, 05/21/18(b) | 1,360,000 | 1,560,941 | ||||||
HSBC Holdings PLC (United Kingdom), | 1,050,000 | 1,130,739 | ||||||
Unsec. Sub. Global Notes, 5.25%, 03/14/44 | 1,475,000 | 1,628,539 | ||||||
ING Bank N.V. (Netherlands), Sr. Unsec. Notes, 3.00%, 09/01/15(b) | 255,000 | 260,742 | ||||||
Intesa Sanpaolo SpA (Italy), Sr. Unsec. Gtd. Notes, 3.88%, 01/15/19 | 2,840,000 | 2,970,081 | ||||||
JPMorgan Chase & Co., Series R, Jr. Unsec. Sub. Global Notes, 6.00%(d) | 2,980,000 | 3,069,400 | ||||||
Lloyds Bank PLC (United Kingdom), Unsec. Gtd. Sub. Medium-Term Notes, 6.50%, 09/14/20(b) | 955,000 | 1,111,542 | ||||||
Nordea Bank AB (Sweden), Sr. Unsec. Notes, 4.88%, 01/27/20(b) | 575,000 | 644,979 | ||||||
Royal Bank of Scotland Group PLC (The) (United Kingdom), Unsec. Sub. Notes, 5.13%, 05/28/24 | 1,245,000 | 1,273,595 | ||||||
6.13%, 12/15/22 | 95,000 | 104,580 | ||||||
Russian Agricultural Bank OJSC Via RSHB Capital S.A. (Russia), REGS, Sr. Unsec. Euro Notes, 5.10%, 07/25/18(b) | 200,000 | 190,275 | ||||||
Societe Generale S.A. (France), | 1,309,000 | 1,371,178 | ||||||
Jr. Unsec. Sub. Notes, 6.00%(b)(d) | 3,430,000 | 3,327,100 | ||||||
Standard Chartered PLC (United Kingdom), | 775,000 | 791,460 | ||||||
Unsec. Sub. Notes, 5.70%, 03/26/44(b) | 960,000 | 1,059,697 | ||||||
State Bank of India (India), Sr. Unsec. Notes, 4.88%, 04/17/24(b) | 400,000 | 415,769 | ||||||
Sumitomo Mitsui Financial Group Inc. (Japan), Unsec. Sub. Bonds, 4.44%, 04/02/24(b) | 2,525,000 | 2,666,826 | ||||||
U.S. Bank N.A., Unsec. Sub. Notes, 3.78%, 04/29/20 | 1,400,000 | 1,428,607 | ||||||
| Principal Amount | Value | |||||||
| Diversified Banks–(continued) | ||||||||
VTB Bank OJSC Via VTB Capital S.A. (Russia), Sr. Unsec. Notes, 6.00%, 04/12/17(b) | $ | 200,000 | $ | 200,050 | ||||
Wells Fargo & Co., Unsec. Sub. Global Notes, 5.38%, 11/02/43 | 3,500,000 | 3,996,432 | ||||||
| 44,699,257 | ||||||||
| Diversified Capital Markets–0.56% | ||||||||
Credit Suisse Group AG (Switzerland), | 2,410,000 | 2,416,025 | ||||||
7.50%(b)(d) | 1,225,000 | 1,341,375 | ||||||
| 3,757,400 | ||||||||
| Diversified Chemicals–0.32% | ||||||||
OCP S.A. (Morocco), Sr. Unsec. Notes, 5.63%, 04/25/24(b) | 2,030,000 | 2,154,337 | ||||||
| Diversified Metals & Mining–0.58% | ||||||||
Cia Minera Ares SAC (Peru), Sr. Unsec. Gtd. Notes, 7.75%, 01/23/21(b) | 600,000 | 653,250 | ||||||
HudBay Minerals, Inc. (Canada), | 99,000 | 108,405 | ||||||
Sr. Unsec. Gtd. Notes, 9.50%, 10/01/20(b) | 30,000 | 32,700 | ||||||
Imperial Metals Corp. (Canada), Sr. Unsec. Gtd. Notes, 7.00%, 03/15/19(b) | 66,000 | 62,040 | ||||||
Rio Tinto Finance USA Ltd. (United Kingdom), Sr. Unsec. Gtd. Global Notes, 7.13%, 07/15/28 | 565,000 | 752,302 | ||||||
Southern Copper Corp., Sr. Unsec. Global Notes, | 1,720,000 | 1,690,852 | ||||||
5.38%, 04/16/20 | 150,000 | 166,987 | ||||||
6.75%, 04/16/40 | 225,000 | 257,881 | ||||||
Vedanta Resources PLC (India), Sr. Unsec. Notes, 9.50%, 07/18/18(b) | 100,000 | 116,475 | ||||||
| 3,840,892 | ||||||||
| Electric Utilities–0.38% | ||||||||
Comision Federal de Electricidad (Mexico), Sr. Unsec. Notes, 5.75%, 02/14/42(b) | 500,000 | 554,408 | ||||||
Electricite de France S.A. (France), Jr. Unsec. Sub. Notes, 5.63%(b)(d) | 1,535,000 | 1,627,868 | ||||||
LSP Energy L.P./LSP Batesville Funding Corp., Series D, Sr. Sec. Bonds, 8.16%, 07/15/25(f) | 5,000 | 0 | ||||||
Majapahit Holding B.V. (Indonesia), | 100,000 | 118,325 | ||||||
REGS, Sr. Unsec. Gtd. Euro Notes, 7.75%, 01/20/20(b) | 200,000 | 236,750 | ||||||
| 2,537,351 | ||||||||
See accompanying Notes to Financial Statements which are an integral part of the financial statements.
13 Invesco Core Plus Bond Fund
| Principal Amount | Value | |||||||
| Electrical Components & Equipment–0.01% | ||||||||
Sensata Technologies B.V. (Netherlands), Sr. Unsec. Gtd. Notes, 4.88%, 10/15/23(b) | $ | 40,000 | $ | 39,677 | ||||
| Electronic Components–0.01% | ||||||||
Belden Inc., Sr. Unsec. Gtd. Sub. Notes, 5.50%, 09/01/22(b) | 75,000 | 78,000 | ||||||
| Environmental & Facilities Services–0.02% | ||||||||
ADS Waste Holdings, Inc., Sr. Unsec. Gtd. Global Notes, 8.25%, 10/01/20 | 38,000 | 40,708 | ||||||
Darling Ingredients Inc., Sr. Unsec. Gtd. Notes, 5.38%, 01/15/22(b) | 71,000 | 74,195 | ||||||
| 114,903 | ||||||||
| Gas Utilities–0.03% | ||||||||
Ferrellgas L.P./Ferrellgas Finance Corp., Sr. Unsec. Global Notes, 6.50%, 05/01/21 | 120,000 | 124,200 | ||||||
6.75%, 01/15/22 | 30,000 | 31,200 | ||||||
Suburban Propane Partners, L.P./ | 16,000 | 16,040 | ||||||
| 171,440 | ||||||||
| General Merchandise Stores–0.23% | ||||||||
Dollar General Corp., Sr. Unsec. Global Notes, 3.25%, 04/15/23 | 1,729,000 | 1,546,424 | ||||||
| Gold–0.92% | ||||||||
Barrick North America Finance LLC (Canada), Sr. Unsec. Gtd. Global Notes, 5.70%, 05/30/41 | 600,000 | 636,112 | ||||||
Gold Fields Orogen Holdings BVI Ltd. (South Africa), Sr. Unsec. Gtd. Notes, 4.88%, 10/07/20(b) | 1,675,000 | 1,494,938 | ||||||
Kinross Gold Corp. (Canada), Sr. Unsec. Gtd. Global Notes, 6.88%, 09/01/41 | 1,365,000 | 1,421,393 | ||||||
New Gold Inc. (Canada), Sr. Unsec. Notes, 6.25%, 11/15/22(b) | 213,000 | 225,248 | ||||||
Newcrest Finance Pty. Ltd. (Australia), Sr. Unsec. Gtd. Notes, 5.75%, 11/15/41(b) | 815,000 | 749,596 | ||||||
Yamana Gold Inc. (Canada), Sr. Unsec. Notes, | 1,585,000 | 1,618,569 | ||||||
| 6,145,856 | ||||||||
| Health Care Distributors–0.61% | ||||||||
AmerisourceBergen Corp., Sr. Unsec. Bonds, 3.40%, 05/15/24 | 1,920,000 | 1,936,078 | ||||||
McKesson Corp., Sr. Unsec. Global Notes, 3.80%, 03/15/24 | 2,085,000 | 2,150,332 | ||||||
| 4,086,410 | ||||||||
| Health Care Equipment–0.69% | ||||||||
CareFusion Corp., Sr. Unsec. Global Notes, | 1,385,000 | 1,411,564 | ||||||
4.88%, 05/15/44 | 1,989,000 | 2,042,114 | ||||||
| Principal Amount | Value | |||||||
| Health Care Equipment–(continued) | ||||||||
Medtronic Inc., Sr. Unsec. Global Notes, 4.63%, 03/15/44 | $ | 971,000 | $ | 1,041,849 | ||||
Universal Hospital Services Inc., Sec. Gtd. Global Notes, 7.63%, 08/15/20 | 90,000 | 90,675 | ||||||
| 4,586,202 | ||||||||
| Health Care Facilities–0.26% | ||||||||
Community Health Systems Inc., | 33,000 | 34,155 | ||||||
Sr. Unsec. Gtd. Notes, 6.88%, 02/01/22(b) | 164,737 | 176,269 | ||||||
HCA Holdings, Inc., Sr. Unsec. Notes, 6.25%, 02/15/21 | 130,000 | 142,187 | ||||||
HCA, Inc., Sr. Sec. Gtd. Global Notes, | 160,000 | 174,800 | ||||||
6.50%, 02/15/20 | 740,000 | 832,500 | ||||||
LifePoint Hospitals, Inc., Sr. Unsec. Gtd. Notes, 5.50%, 12/01/21(b) | 22,000 | 23,128 | ||||||
Tenet Healthcare Corp., | 93,000 | 101,370 | ||||||
Sr. Unsec. Global Notes, 6.75%, 02/01/20 | 40,000 | 43,100 | ||||||
8.13%, 04/01/22 | 165,000 | 190,987 | ||||||
| 1,718,496 | ||||||||
| Health Care REIT’s–0.44% | ||||||||
HCP, Inc., Sr. Unsec. Global Notes, 4.25%, 11/15/23 | 1,305,000 | 1,364,812 | ||||||
Senior Housing Properties Trust, Sr. Unsec. Notes, 4.30%, 01/15/16 | 1,495,000 | 1,542,653 | ||||||
| 2,907,465 | ||||||||
| Health Care Services–0.45% | ||||||||
DaVita HealthCare Partners Inc., Sr. Unsec. Gtd. Global Notes, | 63,000 | 64,181 | ||||||
5.75%, 08/15/22 | 25,000 | 26,875 | ||||||
Express Scripts Holding Co., Sr. Unsec. Gtd. Global Notes, 3.50%, 06/15/24 | 2,794,000 | 2,812,772 | ||||||
MPH Acquisition Holdings LLC, Sr. Unsec. Gtd. Notes, 6.63%, 04/01/22(b) | 94,000 | 98,818 | ||||||
| 3,002,646 | ||||||||
| Home Improvement Retail–0.01% | ||||||||
Hillman Group Inc. (The), Sr. Unsec. Notes, 6.38%, 07/15/22(b) | 41,000 | 41,256 | ||||||
| Homebuilding–0.31% | ||||||||
Ashton Woods USA LLC/Ashton Woods Finance Co., Sr. Unsec. Notes, 6.88%, 02/15/21(b) | 191,000 | 190,045 | ||||||
Beazer Homes USA Inc., Sr. Unsec. Gtd. Global Notes, 7.50%, 09/15/21 | 66,000 | 69,630 | ||||||
See accompanying Notes to Financial Statements which are an integral part of the financial statements.
14 Invesco Core Plus Bond Fund
| Principal Amount | Value | |||||||
| Homebuilding–(continued) | ||||||||
K. Hovnanian Enterprises Inc., | $ | 26,000 | $ | 27,885 | ||||
Sr. Unsec. Gtd. Notes, 7.00%, 01/15/19(b) | 90,000 | 90,675 | ||||||
7.50%, 05/15/16 | 115,000 | 122,188 | ||||||
KB Home, Sr. Unsec. Gtd. Notes, 7.00%, 12/15/21 | 42,000 | 45,360 | ||||||
7.50%, 09/15/22 | 20,000 | 21,900 | ||||||
Lennar Corp., Sr. Unsec. Gtd. Global Notes, 6.95%, 06/01/18 | 87,000 | 97,005 | ||||||
MDC Holdings, Inc., Sr. Unsec. Gtd. Notes, 6.00%, 01/15/43 | 1,470,000 | 1,384,830 | ||||||
Ryland Group Inc. (The), Sr. Unsec. Gtd. Notes, 5.38%, 10/01/22 | 29,000 | 28,855 | ||||||
| 2,078,373 | ||||||||
| Hotels, Resorts & Cruise Lines–0.26% | ||||||||
Choice Hotels International, Inc., | 40,000 | 43,720 | ||||||
Wyndham Worldwide Corp., Sr. Unsec. Notes, 5.63%, 03/01/21 | 1,530,000 | 1,718,466 | ||||||
| 1,762,186 | ||||||||
| Household Products–0.04% | ||||||||
Reynolds Group Issuer Inc./LLC, | 130,000 | 136,337 | ||||||
Sr. Unsec. Gtd. Global Notes, 8.25%, 02/15/21 | 100,000 | 109,500 | ||||||
| 245,837 | ||||||||
| Hypermarkets & Super Centers–0.03% | ||||||||
Cencosud S.A. (Chile), REGS, Sr. Unsec. Gtd. Euro Notes, 4.88%, 01/20/23(b) | 200,000 | 201,185 | ||||||
| Independent Power Producers & Energy Traders–0.03% | ||||||||
AES Corp., Sr. Unsec. Global Notes, 7.38%, 07/01/21 | 97,000 | 111,793 | ||||||
8.00%, 10/15/17 | 1,000 | 1,155 | ||||||
Calpine Corp., Sr. Unsec. Global Notes, 5.38%, 01/15/23 | 98,000 | 99,470 | ||||||
NRG Energy Inc., Sr. Unsec. Gtd. Global Notes, 7.63%, 01/15/18 | 9,000 | 10,170 | ||||||
| 222,588 | ||||||||
| Industrial Conglomerates–0.32% | ||||||||
Grupo KUO S.A.B De C.V. (Mexico), Sr. Unsec. Gtd. Notes, 6.25%, 12/04/22(b) | 400,000 | 422,932 | ||||||
Hutchison Whampoa International (10) Ltd. (Hong Kong), Unsec. Gtd. Sub. Notes, 6.00%(b)(d) | 200,000 | 209,380 | ||||||
Sigma Alimentos S.A. de C.V. (Mexico), Sr. Unsec. Gtd. Notes, 5.63%, 04/14/18(b) | 1,350,000 | 1,489,103 | ||||||
| 2,121,415 | ||||||||
| Principal Amount | Value | |||||||
| Industrial Machinery–0.02% | ||||||||
Waterjet Holdings, Inc., Sr. Sec. Gtd. Notes, 7.63%, 02/01/20(b) | $ | 116,000 | $ | 122,815 | ||||
| Industrial REIT’s–0.22% | ||||||||
Prologis L.P., Sr. Unsec. Gtd. Global Notes, 4.25%, 08/15/23 | 1,415,000 | 1,493,886 | ||||||
| Integrated Oil & Gas–1.86% | ||||||||
Ecopetrol S.A. (Colombia), Sr. Unsec. Global Notes, 5.88%, 05/28/45 | 4,510,000 | 4,863,530 | ||||||
KazMunayGas National Co. JSC (Kazakhstan), Sr. Unsec. Notes, 7.00%, 05/05/20(b) | 210,000 | 245,437 | ||||||
Petrobras Global Finance B.V. (Brazil), Sr. Unsec. Gtd. Global Notes, 4.88%, 03/17/20 | 5,445,000 | 5,648,409 | ||||||
Petroleos de Venezuela S.A. (Venezuela), REGS, Sr. Unsec. Gtd. Euro Notes, | 475,000 | 371,450 | ||||||
Series 2014, Sr. Unsec. Euro Bonds, 4.90%, 10/28/14 | 237,000 | 236,384 | ||||||
State Oil Co. of the Azerbaijan Republic (Azerbaijan), | 200,000 | 209,750 | ||||||
Sr. Unsec. Medium-Term Euro Notes, 4.75%, 03/13/23 | 800,000 | 800,000 | ||||||
| 12,374,960 | ||||||||
| Integrated Telecommunication Services–3.09% | ||||||||
AT&T Inc., Sr. Unsec. Global Notes, 4.80%, 06/15/44 | 1,400,000 | 1,469,190 | ||||||
Digicel Group Ltd. (Jamaica), REGS, Sr. Unsec. Euro Notes, 7.13%, 04/01/22(b) | 400,000 | 416,000 | ||||||
Telecom Italia S.p.A. (Italy), Sr. Unsec. Notes, 5.30%, 05/30/24(b) | 340,000 | 349,350 | ||||||
Telefonica Emisiones SAU (Spain), Sr. Unsec. Gtd. Global Notes, 7.05%, 06/20/36 | 3,170,000 | 4,144,659 | ||||||
Verizon Communications, Inc., Sr. Unsec. Global Notes, 5.05%, 03/15/34 | 3,250,000 | 3,566,775 | ||||||
5.15%, 09/15/23 | 665,000 | 754,387 | ||||||
6.40%, 09/15/33 | 4,665,000 | 5,910,385 | ||||||
6.55%, 09/15/43 | 1,693,000 | 2,193,877 | ||||||
Sr. Unsec. Notes, 5.01%, 08/21/54(b) | 1,698,000 | 1,790,927 | ||||||
| 20,595,550 | ||||||||
| Internet Software & Services–0.81% | ||||||||
Baidu Inc. (China), Sr. Unsec. Global Notes, 2.75%, 06/09/19 | 1,176,000 | 1,183,134 | ||||||
CyrusOne L.P./CyrusOne Finance Corp., Sr. Unsec. Gtd. Global Notes, 6.38%, 11/15/22 | 224,000 | 238,280 | ||||||
EarthLink Holdings Corp., | ||||||||
Sr. Sec. Gtd. Global Notes, 7.38%, 06/01/20 | 55,000 | 58,231 | ||||||
Sr. Unsec. Gtd. Global Notes, 8.88%, 05/15/19 | 62,000 | 63,782 | ||||||
See accompanying Notes to Financial Statements which are an integral part of the financial statements.
15 Invesco Core Plus Bond Fund
| Principal Amount | Value | |||||||
| Internet Software & Services–(continued) | ||||||||
Tencent Holdings Ltd. (China), Sr. Unsec. Notes, 3.38%, 05/02/19(b) | $ | 3,770,000 | $ | 3,854,059 | ||||
| 5,397,486 | ||||||||
| Investment Banking & Brokerage–0.81% | ||||||||
Charles Schwab Corp. (The), Series A, Jr. Unsec. Sub. Notes, 7.00%(d) | 1,315,000 | 1,546,769 | ||||||
Goldman Sachs Group, Inc. (The), Series L, Jr. Unsec. Sub. Notes, 5.70%(d) | 875,000 | 912,187 | ||||||
Macquarie Group Ltd. (Australia), Sr. Unsec. Notes, 6.00%, 01/14/20(b) | 505,000 | 573,245 | ||||||
Morgan Stanley, | 985,000 | 1,143,434 | ||||||
Series H, Jr. Unsec. Sub. Global Bonds, 5.45%(d) | 995,000 | 1,017,387 | ||||||
Raymond James Financial, Inc., Sr. Unsec. Notes, 4.25%, 04/15/16 | 170,000 | 178,723 | ||||||
| 5,371,745 | ||||||||
| Leisure Facilities–0.01% | ||||||||
Cedar Fair L.P./Canada’s Wonderland Co./Magnum Management Corp., Sr. Unsec. Gtd. Global Notes, 5.25%, 03/15/21 | 75,000 | 76,594 | ||||||
| Life & Health Insurance–0.92% | ||||||||
Forethought Financial Group, Inc., Sr. Unsec. Notes, 8.63%, 04/15/21(b) | 50,000 | 57,609 | ||||||
MetLife Inc., Sr. Unsec. Global Notes, 4.13%, 08/13/42 | 2,200,000 | 2,181,271 | ||||||
Nationwide Financial Services, Inc., Sr. Unsec. Notes, 5.38%, 03/25/21(b) | 735,000 | 836,903 | ||||||
Pacific LifeCorp., Sr. Unsec. Notes, 6.00%, 02/10/20(b) | 425,000 | 487,410 | ||||||
Prudential Financial, Inc., | 1,640,000 | 1,990,550 | ||||||
Series D, Sr. Unsec. disc. Medium-Term Notes, 4.75%, 09/17/15 | 550,000 | 573,245 | ||||||
| 6,126,988 | ||||||||
| Managed Health Care–0.16% | ||||||||
Cigna Corp., | 725,000 | 843,795 | ||||||
Sr. Unsec. Notes, 4.50%, 03/15/21 | 180,000 | 198,393 | ||||||
| 1,042,188 | ||||||||
| Marine–0.03% | ||||||||
Navios Maritime Acquisition Corp./Navios Acquisition Finance U.S. Inc., Sr. Sec. Gtd. Mortgage Notes, 8.13%, 11/15/21(b) | 168,000 | 175,560 | ||||||
| Principal Amount | Value | |||||||
| Metal & Glass Containers–0.05% | ||||||||
Ball Corp., Sr. Unsec. Gtd. Notes, 5.00%, 03/15/22 | $ | 76,000 | $ | 78,945 | ||||
Berry Plastics Corp., Sec. Gtd. Notes, 5.50%, 05/15/22 | 226,000 | 227,695 | ||||||
| 306,640 | ||||||||
| Movies & Entertainment–1.09% | ||||||||
AMC Entertainment Inc., Sr. Unsec. Gtd. Sub. Global Notes, 5.88%, 02/15/22 | 61,000 | 63,135 | ||||||
DreamWorks Animation SKG, Inc., Sr. Unsec. Gtd. Notes, 6.88%, 08/15/20(b) | 80,000 | 85,400 | ||||||
Time Warner, Inc., | 2,100,000 | 2,334,847 | ||||||
Sr. Unsec. Gtd. Notes, 5.88%, 11/15/16 | 285,000 | 314,653 | ||||||
Viacom Inc., Sr. Unsec. Global Notes, 5.85%, 09/01/43 | 3,800,000 | 4,429,845 | ||||||
| 7,227,880 | ||||||||
| Multi-Line Insurance–0.90% | ||||||||
American Financial Group, Inc., Sr. Unsec. Notes, 9.88%, 06/15/19 | 10,000 | 13,047 | ||||||
American International Group, Inc., Sr. Unsec. Global Notes, 4.50%, 07/16/44 | 2,100,000 | 2,178,540 | ||||||
Genworth Holdings Inc., Sr. Unsec. Gtd. Global Notes, 4.90%, 08/15/23 | 1,428,000 | 1,519,086 | ||||||
Nationwide Mutual Insurance Co., Unsec. Sub. Notes, 4.95%, 04/22/44(b) | 2,185,000 | 2,290,909 | ||||||
| 6,001,582 | ||||||||
| Multi-Sector Holdings–0.25% | ||||||||
Burlington Northern Santa Fe LLC, Sr. Unsec. Notes, | 915,000 | 926,763 | ||||||
4.55%, 09/01/44 | 540,000 | 562,911 | ||||||
SUAM Finance B.V. (Colombia), Sr. Unsec. Gtd. Notes, 4.88%, 04/17/24(b) | 200,000 | 206,798 | ||||||
| 1,696,472 | ||||||||
| Multi-Utilities–0.39% | ||||||||
Enable Midstream Partners L.P., Sr. Unsec. Notes, | 2,525,000 | 2,568,216 | ||||||
| Office REIT’s–0.47% | ||||||||
Government Properties Income Trust, Sr. Unsec. Notes, 3.75%, 08/15/19 | 1,805,000 | 1,824,780 | ||||||
Piedmont Operating Partnership L.P., Sr. Unsec. Gtd. Global Notes, 4.45%, 03/15/24 | 1,290,000 | 1,335,811 | ||||||
| 3,160,591 | ||||||||
| Office Services & Supplies–0.17% | ||||||||
Pitney Bowes Inc., Sr. Unsec. Global Notes, 4.63%, 03/15/24 | 1,070,000 | 1,114,102 | ||||||
See accompanying Notes to Financial Statements which are an integral part of the financial statements.
16 Invesco Core Plus Bond Fund
| Principal Amount | Value | |||||||
| Oil & Gas Drilling–0.71% | ||||||||
Parker Drilling Co., | $ | 102,000 | $ | 109,650 | ||||
Sr. Unsec. Gtd. Notes, 6.75%, 07/15/22(b) | 7,000 | 7,297 | ||||||
Pioneer Energy Services Corp., Sr. Unsec. Gtd. Notes, 6.13%, 03/15/22(b) | 70,000 | 71,925 | ||||||
Rowan Cos. Inc., Sr. Unsec. Gtd. Notes, 4.75%, 01/15/24 | 1,785,000 | 1,887,472 | ||||||
5.85%, 01/15/44 | 2,495,000 | 2,648,995 | ||||||
| 4,725,339 | ||||||||
| Oil & Gas Equipment & Services–0.03% | ||||||||
Bristow Group, Inc., Sr. Unsec. Gtd. Notes, 6.25%, 10/15/22 | 85,000 | 89,994 | ||||||
Exterran Partners L.P./EXLP Finance Corp., Sr. Unsec. Gtd. Global Notes, 6.00%, 04/01/21 | 94,000 | 95,410 | ||||||
| 185,404 | ||||||||
| Oil & Gas Exploration & Production–1.05% | ||||||||
American Eagle Energy Corp., Sr. Sec. Gtd. Notes, 11.00%, 09/01/19(b) | 43,000 | 43,161 | ||||||
Antero Resources Finance Corp., Sr. Unsec. Gtd. Global Notes, 5.38%, 11/01/21 | 54,000 | 56,160 | ||||||
6.00%, 12/01/20 | 20,000 | 21,250 | ||||||
Approach Resources Inc., Sr. Unsec. Gtd. Global Notes, 7.00%, 06/15/21 | 92,000 | 96,140 | ||||||
Berry Petroleum Co. LLC, Sr. Unsec. Notes, 6.38%, 09/15/22 | 53,000 | 55,451 | ||||||
Chesapeake Energy Corp., Sr. Unsec. Gtd. Global Notes, 6.88%, 11/15/20 | 25,000 | 29,250 | ||||||
Cimarex Energy Co., Sr. Unsec. Gtd. Notes, 4.38%, 06/01/24 | 1,725,000 | 1,804,781 | ||||||
Continental Resources Inc., Sr. Unsec. Gtd. Global Notes, 5.00%, 09/15/22 | 974,000 | 1,053,664 | ||||||
Denbury Resources Inc., Sr. Unsec. Gtd. Sub. Notes, 5.50%, 05/01/22 | 116,000 | 119,480 | ||||||
EV Energy Partners L.P./EV Energy Finance Corp., Sr. Unsec. Gtd. Global Notes, 8.00%, 04/15/19 | 75,000 | 78,187 | ||||||
EXCO Resources, Inc., Sr. Unsec. Gtd. Notes, 8.50%, 04/15/22 | 53,000 | 54,325 | ||||||
Halcon Resources Corp., Sr. Unsec. Gtd. Global Notes, 9.75%, 07/15/20 | 70,000 | 76,125 | ||||||
KazMunayGas National Co. JSC (Kazakhstan), Sr. Unsec. Notes, 4.40%, 04/30/23(b) | 400,000 | 403,035 | ||||||
Kosmos Energy Ltd. (Ghana), Sr. Sec. Gtd. Notes, 7.88%, 08/01/21(b) | 400,000 | 408,000 | ||||||
Laredo Petroleum Inc., Sr. Unsec. Gtd. Global Notes, 7.38%, 05/01/22 | 7,000 | 7,683 | ||||||
Pertamina Persero PT (Indonesia), Sr. Unsec. Notes, | 200,000 | 206,500 | ||||||
REGS, Sr. Unsec. Medium-Term Euro Notes, 4.30%, 05/20/23(b) | 800,000 | 788,400 | ||||||
| Principal Amount | Value | |||||||
| Oil & Gas Exploration & Production–(continued) | ||||||||
Petroleos Mexicanos (Mexico), | $ | 200,000 | $ | 216,991 | ||||
Sr. Unsec. Gtd. Global Notes, 6.50%, 06/02/41 | 100,000 | 122,197 | ||||||
Sr. Unsec. Gtd. Notes, | 120,000 | 124,735 | ||||||
6.38%, 01/23/45(b) | 150,000 | 181,725 | ||||||
Range Resources Corp., Sr. Unsec. Gtd. Sub. Notes, 5.00%, 08/15/22 | 329,000 | 351,619 | ||||||
Rice Energy Inc., Sr. Unsec. Gtd. Notes, 6.25%, 05/01/22(b) | 100,000 | 102,875 | ||||||
Rosetta Resources, Inc., | 34,000 | 34,978 | ||||||
Sr. Unsec. Gtd. Notes, 5.88%, 06/01/22 | 56,000 | 57,680 | ||||||
Sanchez Energy Corp., Sr. Unsec. Gtd. Notes, 6.13%, 01/15/23(b) | 83,000 | 86,320 | ||||||
SM Energy Co., Sr. Unsec. Global Notes, 6.50%, 11/15/21 | 395,000 | 429,562 | ||||||
| 7,010,274 | ||||||||
| Oil & Gas Refining & Marketing–0.03% | ||||||||
Calumet Specialty Products Partners L.P./Calumet Finance Corp., Sr. Unsec. Gtd. Notes, 6.50%, 04/15/21(b) | 180,000 | 180,675 | ||||||
| Oil & Gas Storage & Transportation–0.88% | ||||||||
Access Midstream Partners L.P./ACMP Finance Corp., Sr. Unsec. Gtd. Global Notes, 4.88%, 05/15/23 | 810,000 | 857,588 | ||||||
Crestwood Midstream Partners L.P./ | 127,000 | 132,239 | ||||||
Energy Transfer Equity L.P., Sr. Sec. Gtd. Notes, 7.50%, 10/15/20 | 7,000 | 8,155 | ||||||
Enterprise Products Operating LLC, Sr. Unsec. Gtd. Notes, 3.90%, 02/15/24 | 1,656,000 | 1,732,214 | ||||||
EQT Midstream Partners L.P., Sr. Unsec. Gtd. Notes, 4.00%, 08/01/24 | 2,255,000 | 2,273,681 | ||||||
GNL Quintero S.A. (Chile), Sr. Unsec. Notes, 4.63%, 07/31/29(b) | 300,000 | 309,291 | ||||||
NGL Energy Partners L.P./NGL Energy Finance Corp., Sr. Unsec. Gtd. Notes, 6.88%, 10/15/21(b) | 97,000 | 104,275 | ||||||
Teekay Corp. (Bermuda), Sr. Unsec. Global Notes, 8.50%, 01/15/20 | 35,000 | 39,725 | ||||||
Teekay Offshore Partners L.P./Teekay Offshore Finance Corp. (Bermuda), Sr. Unsec. Global Notes, 6.00%, 07/30/19 | 31,000 | 31,425 | ||||||
Texas Eastern Transmission L.P., Sr. Unsec. Notes, 7.00%, 07/15/32 | 255,000 | 340,339 | ||||||
| 5,828,932 | ||||||||
See accompanying Notes to Financial Statements which are an integral part of the financial statements.
17 Invesco Core Plus Bond Fund
| Principal Amount | Value | |||||||
| Other Diversified Financial Services–1.11% | ||||||||
Corp Financiera de Desarrollo S.A. (Peru), Unsec. Sub. Notes, 5.25%, 07/15/29(b) | $ | 500,000 | $ | 513,250 | ||||
General Electric Capital Corp., Sr. Unsec. Global Notes, 2.25%, 11/09/15 | 65,000 | 66,321 | ||||||
Infinity Acquisition LLC/Infinity Acquisition Finance Corp., Sr. Sec. Notes, 7.25%, 08/01/22(b) | 35,000 | 35,515 | ||||||
InRetail Shopping Malls (Peru), Sr. Unsec. Gtd. Notes, 6.50%, 07/09/21(b) | 200,000 | 209,000 | ||||||
JPMorgan Chase & Co., Sr. Unsec. Global Notes, 6.30%, 04/23/19 | 190,000 | 223,173 | ||||||
Odebrecht Oil & Gas Finance Ltd. (Brazil), Sr. Unsec. Gtd. Notes, 7.00%(b)(d) | 400,000 | 411,000 | ||||||
Rio Oil Finance Trust (Brazil), Series 2014-1, Sr. Sec. Notes, 6.25%, 07/06/24(b) | 1,705,000 | 1,813,694 | ||||||
Trust F/1401 (Mexico), Sr. Unsec. Notes, 5.25%, 12/15/24(b) | 2,823,000 | 2,992,380 | ||||||
Unifin Financiera S.A.P.I. de C.V. SOFOM, E.N.R. (Mexico), Sr. Unsec. Gtd. Bonds, 6.25%, 07/22/19(b) | 600,000 | 591,000 | ||||||
Voya Financial, Inc., Jr. Unsec. Gtd. Sub. Global Notes, 5.65%, 05/15/53 | 535,000 | 545,700 | ||||||
| 7,401,033 | ||||||||
| Packaged Foods & Meats–0.94% | ||||||||
Diamond Foods Inc., Sr. Unsec. Gtd. Notes, 7.00%, 03/15/19(b) | 192,000 | 197,760 | ||||||
Marfrig Holding Europe B.V. (Brazil), Sr. Unsec. Gtd. Notes, 6.88%, 06/24/19(b) | 1,020,000 | 1,039,380 | ||||||
Marfrig Overseas Ltd. (Brazil), Sr. Unsec. Gtd. Notes, 9.50%, 05/04/20(b) | 300,000 | 325,350 | ||||||
Mead Johnson Nutrition Co., Sr. Unsec. Global Notes, 4.60%, 06/01/44 | 796,000 | 828,037 | ||||||
MHP S.A. (Ukraine), REGS, Sr. Unsec. Gtd. Euro Notes, 8.25%, 04/02/20(b) | 200,000 | 170,000 | ||||||
Minerva Luxembourg S.A. (Brazil), Sr. Unsec. Gtd. Notes, 7.75%, 01/31/23(b) | 475,000 | 508,108 | ||||||
Post Holdings Inc., | 95,000 | 99,750 | ||||||
Sr. Unsec. Gtd. Notes, | 50,000 | 49,250 | ||||||
6.75%, 12/01/21(b) | 26,000 | 26,618 | ||||||
Smithfield Foods Inc., | 24,000 | 25,740 | ||||||
6.63%, 08/15/22 | 2,687,000 | 2,962,417 | ||||||
| 6,232,410 | ||||||||
| Paper Packaging–0.39% | ||||||||
Klabin Finance S.A. (Brazil), Sr. Unsec. Gtd. Notes, 5.25%, 07/16/24(b) | 1,770,000 | 1,757,167 | ||||||
| Principal Amount | Value | |||||||
| Paper Packaging–(continued) | ||||||||
Rock-Tenn Co., Sr. Unsec. Gtd. Global Notes, 4.00%, 03/01/23 | $ | 800,000 | $ | 831,069 | ||||
| 2,588,236 | ||||||||
| Paper Products–0.03% | ||||||||
Neenah Paper Inc., Sr. Unsec. Gtd. Notes, 5.25%, 05/15/21(b) | 19,000 | 19,380 | ||||||
PH Glatfelter Co., Sr. Unsec. Gtd. Global Notes, 5.38%, 10/15/20 | 181,000 | 187,335 | ||||||
| 206,715 | ||||||||
| Personal Products–0.25% | ||||||||
Avon Products Inc., Sr. Unsec. Global Notes, 5.00%, 03/15/23 | 427,000 | 429,111 | ||||||
Estee Lauder Cos. Inc. (The), Sr. Unsec. Global Notes, 3.70%, 08/15/42 | 1,340,000 | 1,262,627 | ||||||
| 1,691,738 | ||||||||
| Pharmaceuticals–0.79% | ||||||||
Actavis Funding SCS, Sr. Unsec. Gtd. Notes, 3.85%, 06/15/24(b) | 1,145,000 | 1,162,891 | ||||||
Bristol-Myers Squibb Co., Sr. Unsec. Deb., 6.88%, 08/01/97 | 1,526,000 | 2,182,847 | ||||||
Perrigo Co. PLC, Sr. Unsec. Gtd. Notes, 4.00%, 11/15/23(b) | 1,480,000 | 1,523,828 | ||||||
Salix Pharmaceuticals Ltd., Sr. Unsec. Gtd. Notes, 6.00%, 01/15/21(b) | 30,000 | 32,700 | ||||||
Valeant Pharmaceuticals International, Inc., Sr. Unsec. Gtd. Notes, 5.63%, 12/01/21(b) | 130,000 | 132,762 | ||||||
6.38%, 10/15/20(b) | 150,000 | 157,500 | ||||||
6.75%, 08/15/21(b) | 35,000 | 37,013 | ||||||
7.50%, 07/15/21(b) | 50,000 | 54,750 | ||||||
| 5,284,291 | ||||||||
| Property & Casualty Insurance–0.58% | ||||||||
Allstate Corp. (The), Unsec. Sub. Global Notes, 5.75%, 08/15/53 | 2,085,000 | 2,236,163 | ||||||
CNA Financial Corp., Sr. Unsec. Global Bonds, 5.88%, 08/15/20 | 20,000 | 23,250 | ||||||
Liberty Mutual Group Inc., | 1,320,000 | 1,564,200 | ||||||
Sr. Unsec. Gtd. Notes, 4.25%, 06/15/23(b) | 5,000 | 5,226 | ||||||
| 3,828,839 | ||||||||
| Railroads–0.15% | ||||||||
Georgian Railway JSC (Georgia), Sr. Unsec. Notes, | 200,000 | 224,000 | ||||||
Transnet SOC Ltd. (South Africa), Sr. Unsec. Notes, | 400,000 | 383,256 | ||||||
Transnet SOC Ltd. (South Africa), REGS, Sr. Unsec. Euro Notes, | 400,000 | 383,080 | ||||||
| 990,336 | ||||||||
See accompanying Notes to Financial Statements which are an integral part of the financial statements.
18 Invesco Core Plus Bond Fund
| Principal Amount | Value | |||||||
| Real Estate Development–0.11% | ||||||||
AV Homes, Inc., Sr. Unsec. Notes, | $ | 40,000 | $ | 40,600 | ||||
Country Garden Holdings Co. Ltd. (China), | 200,000 | 196,750 | ||||||
Sr. Unsec. Gtd. Notes, 7.88%, 05/27/19(b) | 300,000 | 314,625 | ||||||
REGS, Sr. Unsec. Gtd. Euro Notes, 7.50%, 01/10/23(b) | 200,000 | 196,500 | ||||||
| 748,475 | ||||||||
| Regional Banks–0.89% | ||||||||
Banco Internacional del Peru | 800,000 | 880,407 | ||||||
Unsec. Sub. Notes, | 500,000 | 540,107 | ||||||
Fifth Third Bancorp, | 1,550,000 | 1,610,575 | ||||||
Series J, Jr. Unsec. Sub. Bonds, 4.90%(d) | 1,520,000 | 1,520,000 | ||||||
First Niagara Financial Group Inc., Unsec. Sub. Notes, | 650,000 | 755,790 | ||||||
Nationwide Building Society (United Kingdom), Sr. Unsec. Notes, 6.25%, 02/25/20(b) | 465,000 | 549,184 | ||||||
Synovus Financial Corp., Sr. Unsec. Global Notes, 7.88%, 02/15/19 | 75,000 | 85,125 | ||||||
| 5,941,188 | ||||||||
| Reinsurance–0.27% | ||||||||
Reinsurance Group of America, Inc., Sr. Unsec. Medium-Term Notes, | 1,650,000 | 1,797,757 | ||||||
| Renewable Electricity–0.23% | ||||||||
Greenko Dutch B.V. (India), Sr. Sec. Gtd. Notes, 8.00%, 08/01/19(b) | 300,000 | 300,000 | ||||||
Oglethorpe Power Corp., Sr. Sec. First Mortgage Bonds, 4.55%, 06/01/44 | 1,194,000 | 1,238,299 | ||||||
| 1,538,299 | ||||||||
| Residential REIT’s–0.33% | ||||||||
Essex Portfolio L.P., Sr. Unsec. Gtd. Global Notes, 3.63%, 08/15/22 | 2,135,000 | 2,195,470 | ||||||
| Security & Alarm Services–0.01% | ||||||||
ADT Corp. (The), Sr. Unsec. Global Notes, 6.25%, 10/15/21 | 70,000 | 74,375 | ||||||
| Semiconductor Equipment–0.07% | ||||||||
Amkor Technology Inc., Sr. Unsec. Global Notes, | 211,000 | 224,187 | ||||||
6.63%, 06/01/21 | 123,000 | 131,303 | ||||||
Entegris Inc., Sr. Unsec. Gtd. Notes, 6.00%, 04/01/22(b) | 102,000 | 105,570 | ||||||
| 461,060 | ||||||||
| Principal Amount | Value | |||||||
| Semiconductors–0.10% | ||||||||
Advanced Micro Devices, Inc., | $ | 122,000 | $ | 128,405 | ||||
7.00%, 07/01/24(b) | 12,000 | 12,270 | ||||||
Freescale Semiconductor Inc., Sr. Sec. Gtd. Notes, 6.00%, 01/15/22(b) | 137,000 | 143,850 | ||||||
Micron Technology, Inc., | 39,000 | 39,585 | ||||||
5.88%, 02/15/22(b) | 112,000 | 120,680 | ||||||
NXP B.V./NXP Funding LLC (Netherlands), Sr. Unsec. Gtd. Notes, 5.75%, 02/15/21(b) | 200,000 | 211,000 | ||||||
| 655,790 | ||||||||
| Sovereign Debt–2.58% | ||||||||
Argentina Boden Bonds (Argentina), Sr. Unsec. Bonds, 7.00%, 10/03/15 | 400,000 | 380,800 | ||||||
Banco Nacional de Desenvolvimento Economico e Social (Brazil), Sr. Unsec. Notes, | 1,606,000 | 1,643,088 | ||||||
5.75%, 09/26/23(b) | 400,000 | 436,282 | ||||||
Commonwealth of the Bahamas (Bahamas), Sr. Unsec. Notes, 5.75%, 01/16/24(b) | 400,000 | 425,291 | ||||||
Guatemala Government Bond (Guatemala), | 520,000 | 679,900 | ||||||
REGS, Sr. Unsec. Euro Bonds, | 90,000 | 117,675 | ||||||
Hungary Government International Bond (Hungary), Sr. Unsec. Global Notes, 5.38%, 02/21/23 | 400,000 | 431,000 | ||||||
5.38%, 03/25/24 | 400,000 | 432,000 | ||||||
7.63%, 03/29/41 | 450,000 | 588,375 | ||||||
Indonesia Government International Bond (Indonesia), Sr. Unsec. Notes, 3.38%, 04/15/23(b) | 300,000 | 287,625 | ||||||
3.75%, 04/25/22(b) | 300,000 | 297,750 | ||||||
Ivory Coast Government International Bond (Ivory Coast), Unsec. Bonds, | 200,000 | 197,000 | ||||||
Kenya Government International Bond (Kenya), Sr. Unsec. Notes, 5.88%, 06/24/19(b) | 200,000 | 208,300 | ||||||
6.88%, 06/24/24(b) | 200,000 | 216,400 | ||||||
Lebanon Government International Bond (Lebanon), REGS, Sr. Unsec. Euro Bonds, 6.00%, 01/27/23(b) | 500,000 | 503,125 | ||||||
Magyar Export-Import Bank Zrt. (Hungary), Sr. Unsec. Gtd. Notes, 5.50%, 02/12/18(b) | 300,000 | 323,250 | ||||||
MDC-GMTN B.V. (United Arab Emirates), Sr. Unsec. Gtd. Bonds, | 300,000 | 305,310 | ||||||
See accompanying Notes to Financial Statements which are an integral part of the financial statements.
19 Invesco Core Plus Bond Fund
| Principal Amount | Value | |||||||
| Sovereign Debt–(continued) | ||||||||
Mexico Government International Bond (Mexico), | $ | 650,000 | $ | 678,622 | ||||
Sr. Unsec. Medium-Term Global Notes, 4.75%, 03/08/44 | 310,000 | 326,740 | ||||||
Nigeria Government International Bond (Nigeria), Sr. Unsec. Notes, 5.13%, 07/12/18(b) | 200,000 | 207,250 | ||||||
6.38%, 07/12/23(b) | 200,000 | 220,540 | ||||||
Pakistan Government International Bond (Pakistan), Unsec. Bonds, | 200,000 | 204,000 | ||||||
Panama Government International Bond (Panama), Sr. Unsec. Global Bonds, 5.20%, 01/30/20 | 1,250,000 | 1,400,000 | ||||||
Perusahaan Penerbit SBSN (Indonesia), Sr. Unsec. Notes, | 200,000 | 207,250 | ||||||
Peruvian Government International Bond (Peru), Sr. Unsec. Global Bonds, 8.75%, 11/21/33 | 436,000 | 684,520 | ||||||
Philippine Government International Bond (Philippines), Sr. Unsec. Global Bonds, | 200,000 | 215,000 | ||||||
5.00%, 01/13/37 | 300,000 | 345,375 | ||||||
Poland Government International Bond (Poland), Sr. Unsec. Global Bonds, 4.00%, 01/22/24 | 400,000 | 421,248 | ||||||
Republic of Angola Via Northern Lights III B.V. (Angola), REGS, Sr. Unsec. Euro Notes, 7.00%, 08/16/19(b) | 850,000 | 934,447 | ||||||
Republic of Azerbaijan International Bond (Azerbaijan), Sr. Unsec. Notes, 4.75%, 03/18/24(b) | 400,000 | 413,500 | ||||||
Republic of Serbia (Serbia), | 200,000 | 204,000 | ||||||
REGS, Sr. Unsec. Euro Bonds, 6.75%, 11/01/24(b)(e) | 216,276 | 219,250 | ||||||
Romanian Government International Bond (Romania), Sr. Unsec. Notes, 4.38%, 08/22/23(b) | 230,000 | 241,212 | ||||||
4.88%, 01/22/24(b) | 800,000 | 860,000 | ||||||
6.75%, 02/07/22(b) | 110,000 | 133,100 | ||||||
Uruguay Government International Bond (Uruguay), Sr. Unsec. Bonds, 5.10%, 06/18/50 | 1,570,000 | 1,632,800 | ||||||
Venezuela Government International Bond (Venezuela), REGS, Sr. Unsec. Euro Bonds, 6.00%, 12/09/20(b) | 205,000 | 145,550 | ||||||
| 17,167,575 | ||||||||
| Specialized Finance–2.08% | ||||||||
Aircastle Ltd., | 206,000 | 238,188 | ||||||
Sr. Unsec. Notes, 5.13%, 03/15/21 | 55,000 | 56,375 | ||||||
| Principal Amount | Value | |||||||
| Specialized Finance–(continued) | ||||||||
CIT Group Inc., Sr. Unsec. Global Notes, 5.00%, 08/15/22 | $ | 137,000 | $ | 145,563 | ||||
CME Group Inc., Sr. Unsec. Global Notes, 5.30%, 09/15/43 | 1,325,000 | 1,562,807 | ||||||
International Lease Finance Corp., Sr. Unsec. Global Notes, 5.75%, 05/15/16 | 400,000 | 423,000 | ||||||
5.88%, 08/15/22 | 120,000 | 131,700 | ||||||
Sr. Unsec. Notes, 8.25%, 12/15/20 | 195,000 | 240,337 | ||||||
Moody’s Corp., Sr. Unsec. Global Notes, 2.75%, 07/15/19 | 1,470,000 | 1,493,020 | ||||||
4.88%, 02/15/24 | 4,595,000 | 5,045,884 | ||||||
5.25%, 07/15/44 | 1,140,000 | 1,221,494 | ||||||
National Rural Utilities Cooperative Finance Corp., Sr. Sec. Collateral Trust Global Bonds, 10.38%, 11/01/18 | 2,130,000 | 2,843,668 | ||||||
VTR Finance B.V. (Chile), REGS, Sr. Sec. Euro Notes, 6.88%, 01/15/24(b) | 400,000 | 430,000 | ||||||
| 13,832,036 | ||||||||
| Specialized REIT’s–1.24% | ||||||||
American Tower Corp., Sr. Unsec. Global Notes, 3.50%, 01/31/23 | 1,250,000 | 1,233,876 | ||||||
Crown Castle International Corp., Sr. Unsec. Global Notes, 5.25%, 01/15/23 | 60,000 | 62,475 | ||||||
Sr. Unsec. Notes, 4.88%, 04/15/22 | 81,000 | 82,924 | ||||||
Crown Castle Towers LLC, Sr. Sec. Gtd. Notes, | 25,000 | 25,388 | ||||||
4.88%, 08/15/20(b) | 1,835,000 | 2,045,417 | ||||||
EPR Properties, Sr. Unsec. Gtd. Global Notes, 7.75%, 07/15/20 | 3,880,000 | 4,743,293 | ||||||
Weyerhaeuser Real Estate Co., Sr. Unsec. Notes, 5.88%, 06/15/24(b) | 40,000 | 41,150 | ||||||
| 8,234,523 | ||||||||
| Specialty Stores–0.05% | ||||||||
Michaels Stores Inc., Sr. Unsec. Gtd. Sub. Notes, 5.88%, 12/15/20(b) | 218,000 | 222,087 | ||||||
Outerwall, Inc., Sr. Unsec. Gtd. Global Notes, 6.00%, 03/15/19 | 67,000 | 68,759 | ||||||
Sally Holdings LLC/Sally Capital Inc., Sr. Unsec. Gtd. Global Bonds, | 71,000 | 75,260 | ||||||
| 366,106 | ||||||||
| Steel–0.47% | ||||||||
ArcelorMittal (Luxembourg), Sr. Unsec. Global Notes, | 19,000 | 19,527 | ||||||
6.00%, 03/01/21 | 172,000 | 185,588 | ||||||
6.75%, 02/25/22 | 40,000 | 44,850 | ||||||
Magnetation LLC/ Mag Finance Corp., Sr. Sec. Gtd. Notes, | 123,000 | 134,070 | ||||||
See accompanying Notes to Financial Statements which are an integral part of the financial statements.
20 Invesco Core Plus Bond Fund
| Principal Amount | Value | |||||||
| Steel–(continued) | ||||||||
OJSC Novolipetsk Steel via Steel Funding Ltd. (Russia), Sr. Unsec. Notes, 4.45%, 02/19/18(b) | $ | 500,000 | $ | 483,461 | ||||
SunCoke Energy Partners L.P./SunCoke Energy Partners Finance Corp., Sr. Unsec. Gtd. Notes, 7.38%, 02/01/20(b) | 32,000 | 34,360 | ||||||
7.38%, 02/01/20(b) | 154,000 | 165,357 | ||||||
United States Steel Corp., Sr. Unsec. Global Notes, 7.50%, 03/15/22 | 100,000 | 110,250 | ||||||
Vale Overseas Ltd. (Brazil), Sr. Unsec. Gtd. Global Notes, | 730,000 | 781,338 | ||||||
6.88%, 11/10/39 | 400,000 | 479,301 | ||||||
Vale S.A. (Brazil), Sr. Unsec. Global Notes, 5.63%, 09/11/42 | 600,000 | 621,064 | ||||||
Walter Energy, Inc., | 73,000 | 73,365 | ||||||
Sr. Unsec. Gtd. Global Notes, 8.50%, 04/15/21 | 41,000 | 20,398 | ||||||
| 3,152,929 | ||||||||
| Technology Hardware, Storage & Peripherals–0.33% | ||||||||
Seagate HDD Cayman, Sr. Unsec. Gtd. Bonds, 4.75%, 01/01/25(b) | 2,175,000 | 2,210,344 | ||||||
| Tires & Rubber–0.06% | ||||||||
Gajah Tunggal Tbk PT (Indonesia), REGS, Sr. Sec. Gtd. Euro Notes, | 400,000 | 414,000 | ||||||
| Tobacco–0.26% | ||||||||
Reynolds American Inc., Sr. Unsec. Gtd. Global Notes, 4.85%, 09/15/23 | 1,615,000 | 1,754,124 | ||||||
| Trading Companies & Distributors–0.70% | ||||||||
AerCap Ireland Capital Ltd./AerCap Global Aviation Trust (Netherlands), | 2,085,000 | 2,142,337 | ||||||
Air Lease Corp., Sr. Unsec. Global Notes, 3.88%, 04/01/21 | 2,425,000 | 2,460,617 | ||||||
United Rentals North America Inc., Sr. Unsec. Gtd. Notes, 6.13%, 06/15/23 | 25,000 | 26,938 | ||||||
| 4,629,892 | ||||||||
| Water Utilities–0.34% | ||||||||
Aquarion Co. Inc., Sr. Unsec. Notes, 4.00%, 08/15/24(b) | 2,300,000 | 2,289,168 | ||||||
| Wireless Telecommunication Services–1.23% | ||||||||
America Movil S.A.B. de | 200,000 | 197,156 | ||||||
Sr. Unsec. Gtd. Global Notes, 6.13%, 03/30/40 | 1,115,000 | 1,368,814 | ||||||
| Principal Amount | Value | |||||||
| Wireless Telecommunication Services–(continued) | ||||||||
Bharti Airtel International Netherlands B.V. (India), Sr. Unsec. Gtd. Bonds, | $ | 500,000 | $ | 539,719 | ||||
Digicel Ltd. (Jamaica), Sr. Unsec. Notes, 6.00%, 04/15/21(b) | 200,000 | 208,540 | ||||||
Intelsat Jackson Holdings S.A. (Luxembourg), Sr. Unsec. Gtd. Global Bonds, 6.63%, 12/15/22 | 124,000 | 130,200 | ||||||
Intelsat Luxembourg S.A. (Luxembourg), Sr. Unsec. Gtd. Global Bonds, 7.75%, 06/01/21 | 120,000 | 127,500 | ||||||
8.13%, 06/01/23 | 60,000 | 65,550 | ||||||
Mobile Telesystems OJSC via MTS International Funding Ltd. (Russia), REGS, Sr. Unsec. Euro Notes, | 200,000 | 181,000 | ||||||
Rogers Communications Inc. (Canada), Sr. Unsec. Gtd. Global Notes, | 2,955,000 | 3,186,550 | ||||||
SBA Communications Corp., Sr. Unsec. Notes, 4.88%, 07/15/22(b) | 105,000 | 104,081 | ||||||
Sistema JSFC via Sistema International Funding S.A (Russia), Sr. Unsec. Loan Participation Notes, | 350,000 | 350,875 | ||||||
Sprint Capital Corp., Sr. Unsec. Gtd. Global Notes, 6.88%, 11/15/28 | 85,000 | 84,150 | ||||||
Sprint Communications Inc., | 69,000 | 69,345 | ||||||
7.00%, 08/15/20 | 39,000 | 41,730 | ||||||
11.50%, 11/15/21 | 15,000 | 19,650 | ||||||
Sr. Unsec. Gtd. Notes, 7.00%, 03/01/20(b) | 780,000 | 873,600 | ||||||
9.00%, 11/15/18(b) | 40,000 | 47,600 | ||||||
Sprint Corp., Sr. Unsec. Gtd. Notes, 7.25%, 09/15/21(b) | 50,000 | 53,375 | ||||||
7.88%, 09/15/23(b) | 136,000 | 145,860 | ||||||
T-Mobile USA, Inc., | 75,000 | 78,281 | ||||||
6.63%, 04/01/23 | 129,000 | 136,579 | ||||||
Sr. Unsec. Gtd. Notes, 6.63%, 04/28/21 | 70,000 | 74,113 | ||||||
6.84%, 04/28/23 | 105,000 | 112,087 | ||||||
| 8,196,355 | ||||||||
Total U.S. Dollar Denominated Bonds and Notes (Cost $317,344,490) |
| 336,551,616 | ||||||
Asset-Backed Securities–27.86% |
| |||||||
Adjustable Rate Mortgage Trust, Series 2005-1, Class 4A1, Floating Rate Pass Through Ctfs., 2.69%, 05/25/35(h) | 2,815,824 | 2,790,655 | ||||||
AmeriCredit Automobile Receivables Trust, Series 2011-2, Class D, Pass Through Ctfs., 4.00%, 05/08/17 | 3,135,000 | 3,213,883 | ||||||
See accompanying Notes to Financial Statements which are an integral part of the financial statements.
21 Invesco Core Plus Bond Fund
| Principal Amount | Value | |||||||
Banc of America Commercial Mortgage Trust, | $ | 3,100,000 | $ | 3,242,397 | ||||
Series 2006-1, Class B, Variable Rate Pass Through Ctfs., | 3,077,000 | 3,206,162 | ||||||
Banc of America Mortgage Trust, Series 2005-12, Class A2, Floating Rate Pass Through Ctfs., | 3,489,392 | 3,170,597 | ||||||
Bear Stearns Adjustable Rate Mortgage Trust, | 580,149 | 583,480 | ||||||
Series 2006-1, Class A1, Floating Rate Pass Through Ctfs., 2.38%, 02/25/36(h) | 2,106,269 | 2,125,364 | ||||||
Bear Stearns ALT-A Trust, | 4,516,371 | 4,461,355 | ||||||
Bear Stearns Commercial Mortgage Securities Trust, Series 2006-PW11, Class AAB, Variable Rate Pass Through Ctfs., 5.60%, 03/11/39(h) | 6,741 | 6,765 | ||||||
Boca Hotel Portfolio Trust, | 2,500,000 | 2,503,885 | ||||||
Centurion CDO 9 Ltd. (Cayman Islands), Series 2005-9X, Class A2, Floating Rate Pass Through Ctfs., | 2,750,000 | 2,631,786 | ||||||
CFCRE Commercial Mortgage Trust, Series 2011-C2, Class C, Variable Rate Pass Through Ctfs., 5.74%, 12/15/47(b)(h) | 5,000,000 | 5,607,350 | ||||||
CGBAM Commercial Mortgage Trust, Series 2013-BREH, Class B, Floating Rate Pass Through Ctfs., 1.96%, 05/15/30(b)(h) | 2,570,000 | 2,577,648 | ||||||
Citigroup Commercial Mortgage Trust, Series 2014-388G, Class C, Floating Rate Pass Through Ctfs., | 5,000,000 | 5,025,365 | ||||||
Citigroup Mortgage Loan Trust, Inc., | 3,991,602 | 3,975,564 | ||||||
Series 2004-UST1, Class A4, Floating Rate Pass Through Ctfs., 2.18%, 08/25/34(h) | 1,737,011 | 1,737,406 | ||||||
Commercial Mortgage Trust, | 3,110,000 | 3,145,123 | ||||||
Series 2013-THL, Class A2, Floating Rate Pass Through Ctfs., | 2,875,000 | 2,884,427 | ||||||
Series 2014-CR15, Class B, Variable Rate Pass Through Ctfs., 4.87%, 02/10/47(h) | 3,000,000 | 3,271,222 | ||||||
| Principal Amount | Value | |||||||
Countrywide Asset-Backed Ctfs., Series 2003-1, Class 3A, Floating Rate Pass Through Ctfs., 0.84%, 06/25/33(h) | $ | 175,619 | $ | 154,332 | ||||
Countrywide Home Loans Mortgage Pass Through Trust, Series 2007-13, Class A10, Pass Through Ctfs., | 977,979 | 935,711 | ||||||
Credit Suisse Mortgage Trust, | 405,294 | 407,142 | ||||||
Series 2010-6R, Class 1A1, Pass Through Ctfs., 5.50%, 02/27/37 (Acquired 03/01/10; | 72,582 | 74,127 | ||||||
First Horizon Alternative Mortgage Securities Trust, | 354,891 | 363,306 | ||||||
Series 2006-FA5, Class A3, Pass Through Ctfs., 6.25%, 08/25/36 | 446,255 | 374,530 | ||||||
Gallatin CLO III, 2007-1 Ltd., | 1,133,000 | 1,105,219 | ||||||
GMAC Mortgage Corporation Loan Trust, Series 2006-AR1, Class 1A1, | 1,999,201 | 1,782,084 | ||||||
GP Portfolio Trust, Series 20014-GPP, Class B, Floating Rate Pass Through Ctfs., 1.45%, 02/15/27(b)(h) | 5,000,000 | 5,010,077 | ||||||
GS Mortgage Securities Trust, | 4,000,000 | 4,335,798 | ||||||
Hamlet II Ltd. (Cayman Islands), | 5,000,000 | 4,770,725 | ||||||
Harborview Mortgage Loan Trust, | 43,800 | 40,987 | ||||||
Hilton USA Trust, Series 2013-HLT, Class BFX, Pass Through Ctfs., | 1,500,000 | 1,534,109 | ||||||
ING Investment Management CLO II, Ltd. (Cayman Islands), | 5,000,000 | 4,944,420 | ||||||
Series 2006-2A, Class B, Floating Rate Pass Through Ctfs., | 2,718,000 | 2,641,708 | ||||||
JP Morgan Chase Commercial Mortgage Securities Corp., Series 2012-LC9, Class B, Variable Rate Pass Through Ctfs., 3.81%, 12/15/47(b)(h) | 5,000,000 | 5,092,725 | ||||||
See accompanying Notes to Financial Statements which are an integral part of the financial statements.
22 Invesco Core Plus Bond Fund
| Principal Amount | Value | |||||||
JP Morgan Chase Commercial Mortgage Securities Trust, | $ | 2,500,000 | $ | 2,613,616 | ||||
Series 2006-LDP8, Class AJ, Variable Rate Pass Through Ctfs., | 1,200,000 | 1,263,893 | ||||||
Series 2006-LDP9, Class A3, Pass Through Ctfs., 5.34%, 05/15/47 | 888,806 | 956,831 | ||||||
JP Morgan Mortgage Trust, | 2,157,294 | 2,153,793 | ||||||
Series 2005-A3, Class 6A5, Floating Rate Pass Through Ctfs., | 1,945,142 | 1,960,086 | ||||||
Series 2005-A6, Class 7A1, Floating Rate Pass Through Ctfs., | 1,964,943 | 1,892,479 | ||||||
Series 2007-A4, Class 3A1, Floating Rate Pass Through Ctfs., | 2,333,232 | 2,154,854 | ||||||
LB-UBS Commercial Mortgage Trust, | 2,110,000 | 2,276,194 | ||||||
Series 2005-C7, Class AJ, Variable Pass Through Ctfs., | 5,200,000 | 5,398,559 | ||||||
Series 2006-C7, Class A3, Pass Through Ctfs., 5.35%, 11/15/38 | 300,000 | 324,431 | ||||||
Lehman Mortgage Trust, Series 2006-1, Class 3A5, Pass Through Ctfs., 5.50%, 02/25/36 | 649,454 | 653,856 | ||||||
Luminent Mortgage Trust, | 1,923,365 | 1,749,075 | ||||||
Merrill Lynch Mortgage Investors Trust, Series 2005-A5, Class A9, Floating Rate Pass Through Ctfs., 2.46%, 06/25/35(h) | 4,375,046 | 4,295,936 | ||||||
Provident Home Equity Loan Trust, Series 2000-2, Class A1, Floating Rate Pass Through Ctfs., 0.70%, 08/25/31(h) | 331,796 | 287,040 | ||||||
Residential Funding Mortgage Sec I Trust, Series 2005-S9, Class A10, Pass Through Ctfs., 6.25%, 12/25/35 | 2,463,743 | 2,422,019 | ||||||
Santander Drive Auto Receivables Trust, Series 2011-1, Class D, Pass Through Ctfs., 4.01%, 02/15/17 | 1,545,000 | 1,586,186 | ||||||
Sequoia Mortgage Trust, | 2,841,215 | 2,610,321 | ||||||
Series 2013-4, Class A3, Variable Rate Pass Through Ctfs., | 2,688,736 | 2,525,756 | ||||||
Series 2013-6, Class A2, Variable Rate Pass Through Ctfs., | 3,636,501 | 3,561,499 | ||||||
Series 2013-7, Class A2, Variable Rate Pass Through Ctfs., 3.00%, 06/25/43(h) | 2,389,763 | 2,340,474 | ||||||
| Principal Amount | Value | |||||||
Shellpoint Asset Funding Trust, | $ | 4,148,725 | $ | 4,265,184 | ||||
Sierra Timeshare Receivables Funding LLC, Series 2013-2A, Class A, Pass Through Ctfs., 2.28%, 11/20/25(b) | 1,310,570 | 1,328,182 | ||||||
Specialty Underwriting & Residential Finance Trust, Series 2004-BC2, Class A2, Floating Rate Pass Through Ctfs., 0.70%, 05/25/35(h) | 41,645 | 38,766 | ||||||
Structured Adjustable Rate Mortgage Loan Trust, Series 2007-3, Class 4A2, Floating Rate Pass Through Ctfs., 4.87%, 04/25/47(h) | 1,005,154 | 686,124 | ||||||
Structured Asset Investment Loan Trust, Series 2003-BC12, Class 3A, Floating Rate Pass Through Ctfs., 0.90%, 11/25/33(h) | 19,475 | 18,878 | ||||||
Suntrust Alternative Loan Trust, Series 2005-1F, Class 2A8, Pass Through Ctfs., 6.00%, 12/25/35 | 714,231 | 655,950 | ||||||
Symphony CLO II, Ltd. (Cayman Islands), Series 2006-2A, Class A2B, Floating Rate Pass Through Ctfs., 0.56%, 10/25/20(b)(h) | 4,545,000 | 4,421,108 | ||||||
Thornburg Mortgage Securities Trust, Series 2003-6, Class A2, Floating Rate Pass Through Ctfs., | 1,747,334 | 1,623,202 | ||||||
UBS-Citigroup Commercial Mortgage Trust, Series 2011-C1, Class C, Variable Rate Pass Through Ctfs., 6.07%, 01/10/45(b)(h) | 4,500,000 | 5,120,208 | ||||||
Wachovia Bank Commercial Mortgage Trust, | 1,515,000 | 1,568,449 | ||||||
Series 2005-C21, Class AM, Variable Rate Pass Through Ctfs., 5.41%, 10/15/44(h) | 1,680,000 | 1,755,774 | ||||||
WaMu Mortgage Pass Through Ctfs., | 1,478,425 | 1,536,739 | ||||||
Series 2005-AR10, Class 1A3, Floating Rate Pass Through Ctfs., 2.40%, 09/25/35(h) | 525,000 | 489,609 | ||||||
Series 2005-AR12, Class 1A8, Floating Rate Pass Through Ctfs., 2.33%, 10/25/35(h) | 2,512,313 | 2,456,951 | ||||||
Series 2007-HY2, Class 2A2, Floating Rate Pass Through Ctfs., 2.35%, 11/25/36(h) | 1,623,360 | 1,421,193 | ||||||
Wells Fargo Commercial Mortgage Trust, Series 2014-TISH, Class B, Floating Rate Pass Through Ctfs., | 2,500,000 | 2,500,604 | ||||||
See accompanying Notes to Financial Statements which are an integral part of the financial statements.
23 Invesco Core Plus Bond Fund
| Principal Amount | Value | |||||||
Wells Fargo Mortgage Backed Securities Trust, | $ | 1,176,576 | $ | 1,193,183 | ||||
Series 2004-Z, Class 2A1, Floating Rate Pass Through Ctfs., 2.61%, 12/25/34(h) | 1,499,650 | 1,531,929 | ||||||
Series 2005-AR14, Class A1, Floating Rate Pass Through Ctfs., 5.35%, 08/25/35(h) | 1,465,622 | 1,509,133 | ||||||
Series 2005-AR2, Class 2A2, Floating Rate Pass Through Ctfs., 2.61%, 03/25/35(h) | 3,031,258 | 3,107,533 | ||||||
Series 2007-7, Class A1, Pass Through Ctfs., 6.00%, 06/25/37 | 2,217,116 | 2,200,499 | ||||||
WFRBS Commercial Mortgage Trust, Series 2011-C5, Class B, Variable Rate Pass Through Ctfs., | 5,000,000 | 5,760,995 | ||||||
Series 2013-C15, Class B, Variable Rate Pass Through Ctfs., | 3,800,000 | 4,038,045 | ||||||
Series 2013-C16, Class B, Variable Rate Pass Through Ctfs., | 3,127,000 | 3,447,502 | ||||||
Total Asset-Backed Securities (Cost $181,676,062) |
| 185,430,072 | ||||||
U.S. Government Sponsored Agency Mortgage-Backed Securities–24.97% |
| |||||||
| Collateralized Mortgage Obligations–0.06% | ||||||||
Fannie Mae REMICs, IO | 21,237 | 4,736 | ||||||
Fannie Mae REMICS, IO | 22,965 | 4,511 | ||||||
Federal Deposit Insurance Co. Floating Rate Notes, 0.71%, 02/25/48 (Acquired 03/05/10; Cost $409,586)(b)(h) | 393,993 | 394,222 | ||||||
| 403,469 | ||||||||
| Federal Home Loan Mortgage Corp. (FHLMC)–5.22% | ||||||||
Pass Through Ctfs., | 6,967,461 | 7,853,253 | ||||||
6.50%, 05/01/16 to 09/01/36 | 1,256,298 | 1,441,177 | ||||||
7.00%, 06/01/16 to 10/01/34 | 2,416,301 | 2,788,284 | ||||||
6.00%, 04/01/17 to 02/01/34 | 594,350 | 660,339 | ||||||
7.50%, 04/01/17 to 05/01/35 | 1,117,769 | 1,343,566 | ||||||
3.50%, 08/01/26 | 1,871,762 | 1,986,660 | ||||||
8.50%, 08/01/31 | 93,370 | 116,443 | ||||||
8.00%, 08/01/32 | 77,658 | 96,107 | ||||||
5.00%, 07/01/34 to 06/01/40 | 7,195,492 | 7,983,138 | ||||||
4.50%, 06/01/41 | 5,007,844 | 5,411,699 | ||||||
Pass Through Ctfs., ARM, 2.54%, 12/01/36(h) | 191,671 | 206,437 | ||||||
2.69%, 02/01/37(h) | 65,224 | 70,319 | ||||||
2.38%, 05/01/37(h) | 484,275 | 519,566 | ||||||
2.38%, 06/01/43(h) | 4,271,702 | 4,289,824 | ||||||
| 34,766,812 | ||||||||
| Principal Amount | Value | |||||||
| Federal National Mortgage Association (FNMA)–18.94% | ||||||||
Pass Through Ctfs., | $ | 1,381,879 | $ | 1,632,770 | ||||
7.00%, 12/01/15 to 02/01/34 | 1,037,602 | 1,221,299 | ||||||
6.50%, 05/01/16 to 01/01/37 | 407,201 | 462,561 | ||||||
6.00%, 05/01/17 to 10/01/39 | 229,527 | 257,535 | ||||||
5.00%, 03/01/18 to 12/01/39 | 2,097,126 | 2,312,214 | ||||||
5.50%, 11/01/18 to 06/01/40 | 3,023,592 | 3,373,165 | ||||||
8.00%, 08/01/21 to 04/01/33 | 170,691 | 203,096 | ||||||
9.50%, 04/01/30 | 37,885 | 44,870 | ||||||
8.50%, 10/01/32 | 137,532 | 168,076 | ||||||
Pass Through Ctfs., ARM, 2.33%, 05/01/35(h) | 646,716 | 691,155 | ||||||
2.28%, 01/01/37(h) | 358,689 | 384,257 | ||||||
2.34%, 03/01/38(h) | 180,948 | 193,782 | ||||||
Pass Through Ctfs., TBA, 2.50%, 09/01/29(i) | 5,800,000 | 5,879,750 | ||||||
3.00%, 09/01/29 to 10/01/44(i) | 29,600,000 | 29,546,768 | ||||||
4.00%, 10/01/44(i) | 32,500,000 | 34,339,552 | ||||||
3.50%, 10/01/44(i) | 25,500,000 | 26,184,514 | ||||||
4.50%, 10/01/44(i) | 17,800,000 | 19,182,629 | ||||||
| 126,077,993 | ||||||||
| Government National Mortgage Association (GNMA)–0.75% | ||||||||
Pass Through Ctfs., | 38,750 | 42,552 | ||||||
9.00%, 09/15/24 to 10/15/24 | 21,082 | 21,176 | ||||||
8.50%, 02/15/25 | 7,123 | 7,222 | ||||||
8.00%, 08/15/25 to 09/15/26 | 72,962 | 79,928 | ||||||
6.56%, 01/15/27 | 160,650 | 182,453 | ||||||
7.00%, 04/15/28 to 09/15/32 | 441,867 | 513,795 | ||||||
6.00%, 11/15/28 to 02/15/33 | 125,608 | 144,627 | ||||||
6.50%, 01/15/29 to 09/15/34 | 322,655 | 369,849 | ||||||
5.50%, 06/15/35 | 195,363 | 218,207 | ||||||
5.00%, 07/15/35 to 08/15/35 | 73,017 | 80,225 | ||||||
Pass Through Ctfs., | 81,152 | 84,423 | ||||||
3.00%, 06/20/25(h) | 10,255 | 10,660 | ||||||
Pass Through Ctfs., TBA, 4.00%, 09/01/44(i) | 3,000,000 | 3,197,344 | ||||||
| 4,952,461 | ||||||||
Total U.S. Government Sponsored Agency Mortgage-Backed Securities (Cost $163,978,578) |
| 166,200,735 | ||||||
U.S. Treasury Securities–6.76% |
| |||||||
| U.S. Treasury Bills–0.66% | ||||||||
0.00%, 11/13/14(j)(k)(l) | 720,000 | 719,978 | ||||||
0.03%, 11/13/14(j)(k)(l) | 170,000 | 169,995 | ||||||
0.04%, 11/13/14(j)(k)(l) | 225,000 | 224,993 | ||||||
0.05%, 11/13/14(j)(k)(l) | 145,000 | 144,996 | ||||||
0.06%, 11/13/14(j)(k)(l) | 635,000 | 634,981 | ||||||
0.08%, 11/13/14(j)(k)(l) | 475,000 | 474,985 | ||||||
0.09%, 11/13/14(j)(k)(l) | 2,000,000 | 1,999,940 | ||||||
| 4,369,868 | ||||||||
See accompanying Notes to Financial Statements which are an integral part of the financial statements.
24 Invesco Core Plus Bond Fund
| Principal Amount | Value | |||||||
| U.S. Treasury Notes–4.87% | ||||||||
1.63%, 07/31/19 | $ | 5,671,800 | $ | 5,673,353 | ||||
2.38%, 08/15/24 | 26,691,400 | 26,772,373 | ||||||
| 32,445,726 | ||||||||
| U.S. Treasury Bonds–1.23% | ||||||||
3.38%, 05/15/44 | 7,744,600 | 8,201,546 | ||||||
Total U.S. Treasury Securities |
| 45,017,140 | ||||||
| Shares | ||||||||
Preferred Stocks–1.97% |
| |||||||
| Asset Management & Custody Banks–0.10% | ||||||||
State Street Corp., Series D, 5.90% Pfd. | 25,000 | 652,500 | ||||||
| Diversified Banks–0.32% | ||||||||
Citigroup Inc., Series K, 6.88% Pfd. | 39,000 | 1,052,220 | ||||||
Wells Fargo & Co., 5.85% Pfd. | 42,000 | 1,094,940 | ||||||
| 2,147,160 | ||||||||
| Investment Banking & Brokerage–1.32% | ||||||||
Goldman Sachs Group, Inc. (The), | 78,000 | 1,909,440 | ||||||
Morgan Stanley, 6.88% Pfd. | 85,000 | 2,295,850 | ||||||
Morgan Stanley, Series E, 7.13% Pfd. | 164,000 | 4,559,200 | ||||||
| 8,764,490 | ||||||||
| Regional Banks–0.11% | ||||||||
PNC Financial Services Group, Inc. (The), Series P, 6.13% Pfd. | 27,000 | 747,900 | ||||||
| Reinsurance–0.12% | ||||||||
Reinsurance Group of America, Inc., 6.20% Sr. Unsec. Sub. Pfd. | 30,000 | 803,700 | ||||||
Total Preferred Stocks |
| 13,115,750 | ||||||
| Principal Amount | ||||||||
Municipal Obligations–1.70% |
| |||||||
Florida Hurricane Catastrophe Fund Finance Corp. Series 2013 A, RB, 3.00%, 07/01/20 | $ | 1,450,000 | 1,476,085 | |||||
Georgia (State of) Municipal Electric Authority (Plant Vogtle Units 3 & 4 Project J); | 550,000 | 686,428 | ||||||
Series 2010 A, Taxable Build America RB, 6.64%, 04/01/57 | 500,000 | 636,465 | ||||||
Indiana (State of) Finance Authority (Ohio Valley Electric Corp.); Series 2012 A, Midwestern Disaster Relief RB, 5.00%, 06/01/39 | 2,000,000 | 2,068,040 | ||||||
Puerto Rico (Commonwealth of); | 1,980,000 | 1,817,600 | ||||||
| Principal Amount | Value | |||||||
Texas Municipal Gas Acquisition & Supply Corp. I; Series 2008 D, Sr. Lien Gas Supply RB, 6.25%, 12/15/26 | $ | 2,000,000 | $ | 2,482,040 | ||||
Virginia (State of) Small Business Financing Authority (Elizabeth River Crossings Opco, LLC); Series 2012, Sr. Lien RB, 5.50%, 01/01/42(m) | 2,000,000 | 2,181,780 | ||||||
Total Municipal Obligations |
| 11,348,438 | ||||||
Non-U.S. Dollar Denominated Bonds & |
| |||||||
| Food Distributors–0.03% | ||||||||
Bakkavor Finance 2 PLC (United Kingdom), REGS, Sr. Sec. Gtd. Euro Notes, 8.25%, 02/15/18(b) | GBP | 100,000 | 176,811 | |||||
| Hotels, Resorts & Cruise Lines–0.03% | ||||||||
Thomas Cook Group PLC (United Kingdom), Sr. Unsec. Gtd. Medium-Term Euro Notes, 7.75%, 06/22/17 | GBP | 100,000 | 177,434 | |||||
| Independent Power Producers & Energy Traders–0.02% | ||||||||
Infinis PLC (United Kingdom), Sr. Sec. Notes, | GBP | 100,000 | 175,566 | |||||
| Other Diversified Financial Services–0.05% | ||||||||
Cabot Financial Luxembourg S.A. (United Kingdom), REGS, Sr. Sec. Gtd. Euro Notes, 10.38%, 10/01/19(b) | GBP | 100,000 | 185,139 | |||||
Lowell Group Financing PLC (United Kingdom), REGS, Sr. Sec. Gtd. Euro Notes, 10.75%, 04/01/19(b) | GBP | 100,000 | 183,867 | |||||
| 369,006 | ||||||||
| Sovereign Debt–1.01% | ||||||||
Brazil Notas do Tesouro Nacional (Brazil), Series F, Sr. Unsec. Notes, 10.00%, 01/01/17 | BRL | 900,000 | 399,130 | |||||
Costa Rica Government International Bond (Costa Rica), Unsec. Bonds, 11.50%, 12/21/22(b) | CRC | 90,000,000 | 177,385 | |||||
Mexican Bonos (Mexico), | MXN | 4,500,000 | 392,505 | |||||
Series M20, Sr. Unsec. Bonds, 10.00%, 12/05/24 | MXN | 1,300,000 | 132,218 | |||||
New Zealand Government Bond (New Zealand), Series 423, Sr. Unsec. Bonds, 5.50%, 04/15/23 | NZD | 6,000,000 | 5,540,419 | |||||
Peruvian Government International Bond (Peru), Sr. Unsec. Notes, 8.60%, 08/12/17(b) | PEN | 210,000 | 83,655 | |||||
| 6,725,312 | ||||||||
Total Non-U.S. Dollar Denominated Bonds & Notes (Cost $7,433,155) |
| 7,624,129 | ||||||
See accompanying Notes to Financial Statements which are an integral part of the financial statements.
25 Invesco Core Plus Bond Fund
| Shares | Value | |||||||
Common Stocks–0.00% |
| |||||||
| Paper Products–0.00% | ||||||||
NewPage Holdings Inc. (Acquired 07/21/11-08/29/11; Cost $34,248)(b)(o) | 160 | $ | 15,360 | |||||
Money Market Funds–1.03% |
| |||||||
Liquid Assets Portfolio– | 3,424,565 | 3,424,565 | ||||||
Premier Portfolio– | 3,424,565 | 3,424,565 | ||||||
Total Money Market Funds |
| 6,849,130 | ||||||
Options Purchased–0.07% |
| |||||||
(Cost $574,223)(q) | 446,451 | |||||||
TOTAL INVESTMENTS–116.06% (Cost $745,334,911) |
| 772,598,821 | ||||||
OTHER ASSETS LESS LIABILITIES–(16.06)% |
| (106,915,788 | ) | |||||
NET ASSETS–100.00% | $ | 665,683,033 | ||||||
Investment Abbreviations:
| ARM | – Adjustable Rate Mortgage | |
| BRL | – Brazilian Real | |
| CDO | – Collateralized Debt Obligation | |
| CLO | – Collateralized Loan Obligation | |
| CRC | – Costa Rican Colon | |
| Ctfs. | – Certificates | |
| Deb. | – Debentures | |
| FHLMC | – Federal Home Loan Mortgage Corp. | |
| FNMA | – Federal National Mortgage Association | |
| GBP | – British Pound | |
| GNMA | – Government National Mortgage Association | |
| GO | – General Obligation | |
| Gtd. | – Guaranteed | |
| IO | – Interest Only | |
| Jr. | – Junior | |
| MXN | – Mexican Peso | |
| NZD | – New Zealand Dollar | |
| PEN | – Peru Nuevo Sol | |
| Pfd. | – Preferred | |
| PIK | – Payment in Kind | |
| RB | – Revenue Bonds | |
| REGS | – Regulation S | |
| REIT | – Real Estate Investment Trust | |
| REMICS | – Real Estate Mortgage Investment Conduits | |
| Sec. | – Secured | |
| Sr. | – Senior | |
| Sub. | – Subordinated | |
| TBA | – To Be Announced | |
| Unsec. | – Unsecured |
Notes to Schedule of Investments:
| (a) | Industry and/or sector classifications used in this report are generally according to the Global Industry Classification Standard, which was developed by and is the exclusive property and a service mark of MSCI Inc. and Standard & Poor’s. |
| (b) | Security purchased or received in a transaction exempt from registration under the Securities Act of 1933, as amended (the “1933 Act”). The security may be resold pursuant to an exemption from registration under the 1933 Act, typically to qualified institutional buyers. The aggregate value of these securities at August 31, 2014 was $196,066,155, which represented 29.45% of the Fund’s Net Assets. |
| (c) | All or a portion of this security is Payment-in-Kind. |
| Issuer | Cash Rate | PIK Rate | ||||
Central European Media Enterprises Ltd. Sr. Sec. Gtd. PIK Global Notes | — | 15.00% | ||||
| (d) | Perpetual bond with no specified maturity date. |
| (e) | Step coupon bond. The interest rate represents the coupon rate at which the bond will accrue at a specified future date. |
| (f) | Defaulted security. Currently, the issuer is partially or fully in default with respect to interest payments. The value of this security at August 31, 2014 represented less than 1% of the Fund’s Net Assets. |
See accompanying Notes to Financial Statements which are an integral part of the financial statements.
26 Invesco Core Plus Bond Fund
| (g) | Security has an irrevocable call by the issuer or mandatory put by the holder. Maturity date reflects such call or put. |
| (h) | Interest or dividend rate is redetermined periodically. Rate shown is the rate in effect on August 31, 2014. |
| (i) | Security purchased on a forward commitment basis. This security is subject to dollar roll transactions. See Note 1N. |
| (j) | Security traded on a discount basis. The interest rate shown represents the discount rate at the time of purchase by the Fund. |
| (k) | All or a portion of the value was pledged as collateral to cover margin requirements for open futures contracts. See Note 1L and Note 4. |
| (l) | All or a portion of the value was pledged as collateral to cover margin requirements for swap agreement. See Note 1I and Note 4. |
| (m) | Security subject to the alternative minimum tax. |
| (n) | Foreign denominated security. Principal amount is denominated in the currency indicated. |
| (o) | Non-income producing security acquired as part of the NewPage Corp. bankruptcy reorganization. |
| (p) | The money market fund and the Fund are affiliated by having the same investment adviser. |
| (q) | The table below details options purchased: |
| Open Over-The-Counter Swaptions Purchased | ||||||||||||||||||||||||||||||||||||||
| Description | Currency | Type of Contract | Counterparty | Exercise Rate | Premium Rate | Pay/ Receive | Floating Rate Index | Expiration Date | Notional Value(a) | Value | ||||||||||||||||||||||||||||
5 Years Interest Rate Swap | USD | Put | Deutsche Bank | 2.15 | % | 0.46 | % | Pay | 3 Month BBA LIBOR | 10/30/14 | $ | 50,000,000 | $ | 62,871 | ||||||||||||||||||||||||
Total Swaptions Purchased – Interest Rate Risk |
| $ | 62,871 | |||||||||||||||||||||||||||||||||||
| (a) | Notional Value is calculated by multiplying the Number of Contracts by the multiplier. |
| Open Over-The-Counter Foreign Currency Options Purchased | ||||||||||||||||||||||||||||||||
| Description | Type of Contract | Counterparty | Expiration Date | Strike Price | Notional Value | Value | ||||||||||||||||||||||||||
EUR versus USD | Put | Deutsche Bank | 11/26/14 | USD | 1.30 | EUR | 34,500,000 | $ | 319,195 | |||||||||||||||||||||||
GBP versus USD | Put | Deutsche Bank | 11/19/14 | USD | 1.65 | GBP | 4,800,000 | 64,385 | ||||||||||||||||||||||||
Total Foreign Currency Options Purchased – Currency Risk |
| $ | 383,580 | |||||||||||||||||||||||||||||
Total Options Purchased (Cost $574,223) |
| $ | 446,451 | |||||||||||||||||||||||||||||
Abbreviations:
| BBA | – British Banker’s Association | |
| EUR | – Euro | |
| GBP | – British Pound Sterling | |
| LIBOR | – London Interbank Offered Rate | |
| USD | – U.S. Dollar |
See accompanying Notes to Financial Statements which are an integral part of the financial statements.
27 Invesco Core Plus Bond Fund
Statement of Assets and Liabilities
August 31, 2014
Assets: |
| |||
Investments, at value (Cost $738,485,781) | $ | 765,749,691 | ||
Investments in affiliated money market funds, at value and cost | 6,849,130 | |||
Total investments, at value (Cost $745,334,911) | 772,598,821 | |||
Cash | 59,820 | |||
Foreign currencies, at value (Cost $283,066) | 273,334 | |||
Receivable for: | ||||
Investments sold | 121,107,735 | |||
Variation margin — futures | 148,060 | |||
Variation margin — centrally cleared swap agreements | 8,417 | |||
Fund shares sold | 1,247,986 | |||
Dividends and interest | 5,569,131 | |||
Fund expenses absorbed | 38,969 | |||
Forward foreign currency contracts outstanding | 688,240 | |||
Principal paydowns | 19,338 | |||
Premiums paid on swap agreements — OTC | 245,733 | |||
Investment for trustee deferred compensation and retirement plans | 115,543 | |||
Total assets | 902,121,127 | |||
Liabilities: |
| |||
Payable for: | ||||
Investments purchased | 235,029,930 | |||
Fund shares reacquired | 269,089 | |||
Dividends | 158,028 | |||
Swaps payable — OTC | 25,208 | |||
Accrued fees to affiliates | 302,423 | |||
Accrued trustees’ and officers’ fees and benefits | 3,821 | |||
Accrued other operating expenses | 180,288 | |||
Trustee deferred compensation and retirement plans | 130,211 | |||
Unrealized depreciation on swap transactions — OTC | 339,096 | |||
Total liabilities | 236,438,094 | |||
Net assets applicable to shares outstanding | $ | 665,683,033 | ||
Net assets consist of: |
| |||
Shares of beneficial interest | $ | 724,126,018 | ||
Undistributed net investment income | (360,638 | ) | ||
Undistributed net realized gain (loss) | (85,148,511 | ) | ||
Net unrealized appreciation | 27,066,164 | |||
| $ | 665,683,033 | |||
Net Assets: |
| |||
Class A | $ | 333,640,733 | ||
Class B | $ | 11,898,510 | ||
Class C | $ | 38,142,349 | ||
Class R | $ | 3,554,010 | ||
Class Y | $ | 9,699,121 | ||
Class R5 | $ | 1,494,575 | ||
Class R6 | $ | 267,253,735 | ||
Shares outstanding, $0.01 par value per share, |
| |||
Class A | 30,565,443 | |||
Class B | 1,090,405 | |||
Class C | 3,495,817 | |||
Class R | 325,674 | |||
Class Y | 887,954 | |||
Class R5 | 137,028 | |||
Class R6 | 24,498,687 | |||
Class A: | ||||
Net asset value per share | $ | 10.92 | ||
Maximum offering price per share | ||||
(Net asset value of $10.92 ¸ 95.75%) | $ | 11.40 | ||
Class B: | ||||
Net asset value and offering price per share | $ | 10.91 | ||
Class C: | ||||
Net asset value and offering price per share | $ | 10.91 | ||
Class R: | ||||
Net asset value and offering price per share | $ | 10.91 | ||
Class Y: | ||||
Net asset value and offering price per share | $ | 10.92 | ||
Class R5: | ||||
Net asset value and offering price per share | $ | 10.91 | ||
Class R6: | ||||
Net asset value and offering price per share | $ | 10.91 | ||
See accompanying Notes to Financial Statements which are an integral part of the financial statements.
28 Invesco Core Plus Bond Fund
Statement of Operations
For the year ended August 31, 2014
Investment income: |
| |||
Interest | $ | 25,715,626 | ||
Dividends (net of foreign withholding taxes of $3) | 863,381 | |||
Dividends from affiliated money market funds | 1,292 | |||
Total investment income | 26,580,299 | |||
Expenses: | ||||
Advisory fees | 2,673,086 | |||
Administrative services fees | 167,896 | |||
Custodian fees | 72,639 | |||
Distribution fees: | ||||
Class A | 799,732 | |||
Class B | 137,899 | |||
Class C | 336,530 | |||
Class R | 15,131 | |||
Transfer agent fees — A, B, C, R and Y | 831,386 | |||
Transfer agent fees — R5 | 819 | |||
Transfer agent fees — R6 | 750 | |||
Trustees’ and officers’ fees and benefits | 42,267 | |||
Other | 372,650 | |||
Total expenses | 5,450,785 | |||
Less: Fees waived, expenses reimbursed and expense offset arrangement(s) | (853,513 | ) | ||
Net expenses | 4,597,272 | |||
Net investment income | 21,983,027 | |||
Realized and unrealized gain (loss) from: | ||||
Net realized gain (loss) from: | ||||
Investment securities | 14,356,851 | |||
Foreign currencies | 174,839 | |||
Forward foreign currency contracts | (1,008,274 | ) | ||
Futures contracts | (8,563,040 | ) | ||
Option contracts written | 55,562 | |||
Swap agreements | (1,897,648 | ) | ||
| 3,118,290 | ||||
Change in net unrealized appreciation (depreciation) of: | ||||
Investment securities | 27,755,590 | |||
Foreign currencies | (11,058 | ) | ||
Forward foreign currency contracts | 693,500 | |||
Futures contracts | 323,048 | |||
Swap agreements | (230,334 | ) | ||
| 28,530,746 | ||||
Net realized and unrealized gain | 31,649,036 | |||
Net increase in net assets resulting from operations | $ | 53,632,063 | ||
See accompanying Notes to Financial Statements which are an integral part of the financial statements.
29 Invesco Core Plus Bond Fund
Statement of Changes in Net Assets
For the years ended August 31, 2014 and 2013
| 2014 | 2013 | |||||||
Operations: |
| |||||||
Net investment income | $ | 21,983,027 | $ | 16,523,223 | ||||
Net realized gain | 3,118,290 | 5,207,319 | ||||||
Change in net unrealized appreciation (depreciation) | 28,530,746 | (33,872,114 | ) | |||||
Net increase (decrease) in net assets resulting from operations | 53,632,063 | (12,141,572 | ) | |||||
Distributions to shareholders from net investment income: | ||||||||
Class A | (13,587,195 | ) | (10,265,479 | ) | ||||
Class B | (483,748 | ) | (483,301 | ) | ||||
Class C | (1,171,456 | ) | (953,544 | ) | ||||
Class R | (120,792 | ) | (95,262 | ) | ||||
Class Y | (124,974 | ) | (141,229 | ) | ||||
Class R5 | (75,598 | ) | (498,139 | ) | ||||
Class R6 | (10,148,675 | ) | (5,578,061 | ) | ||||
Total distributions from net investment income | (25,712,438 | ) | (18,015,015 | ) | ||||
Share transactions–net: | ||||||||
Class A | (6,017,746 | ) | 46,603,321 | |||||
Class B | (4,652,287 | ) | (5,686,495 | ) | ||||
Class C | 778,537 | (32,154 | ) | |||||
Class R | 592,575 | (335,712 | ) | |||||
Class Y | 8,120,874 | (4,179,243 | ) | |||||
Class R5 | (547,261 | ) | (167,831,897 | ) | ||||
Class R6 | 71,556,506 | 195,283,747 | ||||||
Net increase in net assets resulting from share transactions | 69,831,198 | 63,821,567 | ||||||
Net increase in net assets | 97,750,823 | 33,664,980 | ||||||
Net assets: | ||||||||
Beginning of year | 567,932,210 | 534,267,230 | ||||||
End of year (includes undistributed net investment income of $(360,638) and $943,304, respectively) | $ | 665,683,033 | $ | 567,932,210 | ||||
Notes to Financial Statements
August 31, 2014
NOTE 1—Significant Accounting Policies
Invesco Core Plus Bond Fund (the “Fund”) is a series portfolio of AIM Counselor Series Trust (Invesco Counselor Series Trust) (the “Trust”). The Trust is a Delaware statutory trust registered under the Investment Company Act of 1940, as amended (the “1940 Act”), as an open-end series management investment company consisting of thirteen separate portfolios, each authorized to issue an unlimited number of shares of beneficial interest. The assets, liabilities and operations of each portfolio are accounted for separately. Information presented in these financial statements pertains only to the Fund. Matters affecting each portfolio or class will be voted on exclusively by the shareholders of such portfolio or class.
The Fund’s investment objective is total return, comprised of current income and capital appreciation.
The Fund currently consists of seven different classes of shares: Class A, Class B, Class C, Class R, Class Y, Class R5 and Class R6. Class A shares are sold with a front-end sales charge unless certain waiver criteria are met and under certain circumstances load waived shares may be subject to contingent deferred sales charges (“CDSC”). Class C shares are sold with a CDSC. Class R, Class Y, Class R5 and Class R6 shares are sold at net asset value. Effective November 30, 2010, new or additional investments in Class B shares are no longer permitted. Existing shareholders of Class B shares may continue to reinvest dividends and capital gains distributions in Class B shares until they convert to Class A shares. Also, shareholders in Class B shares will be able to exchange those shares for Class B shares of other Invesco Funds offering such shares until they convert to Class A shares. Generally, Class B shares will automatically convert to Class A shares on or about the month-end, which is at least eight years after the date of purchase. Redemption of Class B shares prior to the conversion date will be subject to a CDSC.
The following is a summary of the significant accounting policies followed by the Fund in the preparation of its financial statements.
| A. | Security Valuations — Securities, including restricted securities, are valued according to the following policy. |
Debt obligations (including convertible securities) and unlisted equities are fair valued using an evaluated quote provided by an independent pricing service. Evaluated quotes provided by the pricing service may be determined without exclusive reliance on quoted prices, and may reflect appropriate factors such as institution-size trading in similar groups of securities, developments related to specific securities, dividend rate (for
30 Invesco Core Plus Bond Fund
unlisted equities), yield (for debt obligations), quality, type of issue, coupon rate (for debt obligations), maturity (for debt obligations), individual trading characteristics and other market data. Debt obligations are subject to interest rate and credit risks. In addition, all debt obligations involve some risk of default with respect to interest and/or principal payments.
A security listed or traded on an exchange (except convertible securities) is valued at its last sales price or official closing price as of the close of the customary trading session on the exchange where the security is principally traded, or lacking any sales or official closing price on a particular day, the security may be valued at the closing bid price on that day. Securities traded in the over-the-counter market are valued based on prices furnished by independent pricing services or market makers. When such securities are valued by an independent pricing service they may be considered fair valued. Futures contracts are valued at the final settlement price set by an exchange on which they are principally traded. Listed options are valued at the mean between the last bid and ask prices from the exchange on which they are principally traded. Options not listed on an exchange are valued by an independent source at the mean between the last bid and ask prices. For purposes of determining net asset value per share, futures and option contracts generally are valued 15 minutes after the close of the customary trading session of the New York Stock Exchange (“NYSE”).
Investments in open-end and closed-end registered investment companies that do not trade on an exchange are valued at the end of day net asset value per share. Investments in open-end and closed-end registered investment companies that trade on an exchange are valued at the last sales price or official closing price as of the close of the customary trading session on the exchange where the security is principally traded.
Swap agreements are fair valued using an evaluated quote provided by an independent pricing service. Evaluated quotes provided by the pricing service are valued based on a model which may include end of day net present values, spreads, ratings, industry, and company performance.
Foreign securities’ (including foreign exchange contracts) prices are converted into U.S. dollar amounts using the applicable exchange rates as of the close of the NYSE. If market quotations are available and reliable for foreign exchange-traded equity securities, the securities will be valued at the market quotations. Because trading hours for certain foreign securities end before the close of the NYSE, closing market quotations may become unreliable. If between the time trading ends on a particular security and the close of the customary trading session on the NYSE, events occur that the Adviser determines are significant and make the closing price unreliable, the Fund may fair value the security. If the event is likely to have affected the closing price of the security, the security will be valued at fair value in good faith using procedures approved by the Board of Trustees. Adjustments to closing prices to reflect fair value may also be based on a screening process of an independent pricing service to indicate the degree of certainty, based on historical data, that the closing price in the principal market where a foreign security trades is not the current value as of the close of the NYSE. Foreign securities’ prices meeting the approved degree of certainty that the price is not reflective of current value will be priced at the indication of fair value from the independent pricing service. Multiple factors may be considered by the independent pricing service in determining adjustments to reflect fair value and may include information relating to sector indices, American Depositary Receipts and domestic and foreign index futures. Foreign securities may have additional risks including exchange rate changes, potential for sharply devalued currencies and high inflation, political and economic upheaval, the relative lack of issuer information, relatively low market liquidity and the potential lack of strict financial and accounting controls and standards.
Securities for which market prices are not provided by any of the above methods may be valued based upon quotes furnished by independent sources. The last bid price may be used to value equity securities. The mean between the last bid and asked prices is used to value debt obligations, including corporate loans.
Securities for which market quotations are not readily available or became unreliable are valued at fair value as determined in good faith by or under the supervision of the Trust’s officers following procedures approved by the Board of Trustees. Issuer specific events, market trends, bid/ask quotes of brokers and information providers and other market data may be reviewed in the course of making a good faith determination of a security’s fair value.
The Fund may invest in securities that are subject to interest rate risk, meaning the risk that the prices will generally fall as interest rates rise and, conversely, the prices will generally rise as interest rates fall. Specific securities differ in their sensitivity to changes in interest rates depending on their individual characteristics. Changes in interest rates may result in increased market volatility, which may affect the value and/or liquidity of certain of the Fund’s investments.
Valuations change in response to many factors including the historical and prospective earnings of the issuer, the value of the issuer’s assets, general economic conditions, interest rates, investor perceptions and market liquidity. Because of the inherent uncertainties of valuation, the values reflected in the financial statements may materially differ from the value received upon actual sale of those investments.
| B. | Securities Transactions and Investment Income — Securities transactions are accounted for on a trade date basis. Realized gains or losses on sales are computed on the basis of specific identification of the securities sold. Interest income (net of withholding tax, if any) is recorded on the accrual basis from settlement date. Paydown gains and losses on mortgage and asset-backed securities are recorded as adjustments to interest income. Dividend income (net of withholding tax, if any) is recorded on the ex-dividend date. Bond premiums and discounts are amortized and/or accreted for financial reporting purposes. |
The Fund may periodically participate in litigation related to Fund investments. As such, the Fund may receive proceeds from litigation settlements. Any proceeds received are included in the Statement of Operations as realized gain (loss) for investments no longer held and as unrealized gain (loss) for investments still held.
Brokerage commissions and mark ups are considered transaction costs and are recorded as an increase to the cost basis of securities purchased and/or a reduction of proceeds on a sale of securities. Such transaction costs are included in the determination of net realized and unrealized gain (loss) from investment securities reported in the Statement of Operations and the Statement of Changes in Net Assets and the net realized and unrealized gains (losses) on securities per share in the Financial Highlights. Transaction costs are included in the calculation of the Fund’s net asset value and, accordingly, they reduce the Fund’s total returns. These transaction costs are not considered operating expenses and are not reflected in net investment income reported in the Statement of Operations and Statement of Changes in Net Assets, or the net investment income per share and ratios of expenses and net investment income reported in the Financial Highlights, nor are they limited by any expense limitation arrangements between the Fund and the investment adviser.
The Fund allocates realized and unrealized capital gains and losses to a class based on the relative net assets of each class. The Fund allocates income to a class based on the relative value of the settled shares of each class.
31 Invesco Core Plus Bond Fund
| C. | Country Determination — For the purposes of making investment selection decisions and presentation in the Schedule of Investments, the investment adviser may determine the country in which an issuer is located and/or credit risk exposure based on various factors. These factors include the laws of the country under which the issuer is organized, where the issuer maintains a principal office, the country in which the issuer derives 50% or more of its total revenues and the country that has the primary market for the issuer’s securities, as well as other criteria. Among the other criteria that may be evaluated for making this determination are the country in which the issuer maintains 50% or more of its assets, the type of security, financial guarantees and enhancements, the nature of the collateral and the sponsor organization. Country of issuer and/or credit risk exposure has been determined to be the United States of America, unless otherwise noted. |
| D. | Distributions — Distributions from net investment income are declared daily and paid monthly. Distributions from net realized capital gain, if any, are generally declared and paid annually and recorded on the ex-dividend date. The Fund may elect to treat a portion of the proceeds from redemptions as distributions for federal income tax purposes. |
| E. | Federal Income Taxes — The Fund intends to comply with the requirements of Subchapter M of the Internal Revenue Code of 1986, as amended (the “Internal Revenue Code”), necessary to qualify as a regulated investment company and to distribute substantially all of the Fund’s taxable earnings to shareholders. As such, the Fund will not be subject to federal income taxes on otherwise taxable income (including net realized capital gain) that is distributed to shareholders. Therefore, no provision for federal income taxes is recorded in the financial statements. |
The Fund recognizes the tax benefits of uncertain tax positions only when the position is more likely than not to be sustained. Management has analyzed the Fund’s uncertain tax positions and concluded that no liability for unrecognized tax benefits should be recorded related to uncertain tax positions. Management is not aware of any tax positions for which it is reasonably possible that the total amounts of unrecognized tax benefits will change materially in the next 12 months.
The Fund files tax returns in the U.S. Federal jurisdiction and certain other jurisdictions. Generally, the Fund is subject to examinations by such taxing authorities for up to three years after the filing of the return for the tax period.
| F. | Expenses — Fees provided for under the Rule 12b-1 plan of a particular class of the Fund are charged to the operations of such class. Transfer agency fees and expenses and other shareholder recordkeeping fees and expenses attributable to Class R5 and Class R6 are allocated to each share class based on relative net assets. Sub-accounting fees attributable to Class R5 are charged to the operations of the class. Transfer agency fees and expenses and other shareholder recordkeeping fees and expenses relating to all other classes are allocated among those classes based on relative net assets. All other expenses are allocated among the classes based on relative net assets. |
| G. | Accounting Estimates — The preparation of financial statements in conformity with accounting principles generally accepted in the United States of America (“GAAP”) requires management to make estimates and assumptions that affect the reported amounts of assets and liabilities at the date of the financial statements and the reported amounts of revenues and expenses during the reporting period including estimates and assumptions related to taxation. Actual results could differ from those estimates by a significant amount. In addition, the Fund monitors for material events or transactions that may occur or become known after the period-end date and before the date the financial statements are released to print. |
| H. | Indemnifications — Under the Trust’s organizational documents, each Trustee, officer, employee or other agent of the Trust is indemnified against certain liabilities that may arise out of the performance of their duties to the Fund. Additionally, in the normal course of business, the Fund enters into contracts, including the Fund’s servicing agreements, that contain a variety of indemnification clauses. The Fund’s maximum exposure under these arrangements is unknown as this would involve future claims that may be made against the Fund that have not yet occurred. The risk of material loss as a result of such indemnification claims is considered remote. |
| I. | Swap Agreements — The Fund may enter into various swap transactions, including interest rate, total return, index, currency exchange rate and credit default swap contracts (“CDS”) for investment purposes or to manage interest rate, currency or credit risk. Such transactions are agreements between two parties (“Counterparties”). A swap agreement may be negotiated bilaterally and traded over-the-counter (OTC) between two parties (‘uncleared/OTC”) or, in some instances, must be transacted through a future commission merchant (FCM) and cleared through a clearinghouse that serves as a central Counterparty (“centrally cleared swap”). These agreements may contain among other conditions, events of default and termination events, and various covenants and representations such as provisions that require the Fund to maintain a pre-determined level of net assets, and/or provide limits regarding the decline of the Fund’s NAV over specific periods of time. If the Fund were to trigger such provisions and have open derivative positions at that time, the Counterparty may be able to terminate such agreement and request immediate payment in an amount equal to the net liability positions, if any. |
Interest rate, total return, index, and currency exchange rate swap agreements are two-party contracts entered into primarily to exchange the returns (or differentials in rates of returns) earned or realized on particular predetermined investments or instruments. The gross returns to be exchanged or “swapped” between the parties are calculated with respect to a notional amount, i.e., the return on or increase in value of a particular dollar amount invested at a particular interest rate or return of an underlying asset, in a particular foreign currency, or in a “basket” of securities representing a particular index.
In a centrally cleared swap, the Fund’s ultimate Counterparty is a central clearinghouse. The Fund initially will enter into centrally cleared swaps through an executing broker. When a Fund enters into a centrally cleared swap, it must deliver to the central Counterparty (via the FCM) an amount referred to as “initial margin.” Initial margin requirements are determined by the central Counterparty, but an FCM may require additional initial margin above the amount required by the central Counterparty. Initial margin deposits required upon entering into centrally cleared swaps are satisfied by cash or securities as collateral at the FCM. Securities deposited as initial margin are designated on the Schedule of Investments and cash deposited is recorded on the Statement of Assets and Liabilities. During the term of a cleared swap agreement, a “variation margin” amount may be required to be paid by the Fund or may be received by the Fund, based on the daily change in price of the underlying reference instrument subject to the swap agreement and is recorded as a receivable or payable for variation margin in the Statement of Assets and Liabilities until the centrally cleared swap is terminated at which time a realized gain or loss is recorded.
A CDS is an agreement between Counterparties to exchange the credit risk of an issuer. A buyer of a CDS is said to buy protection by paying a fixed payment over the life of the agreement and in some situations an upfront payment to the seller of the CDS. If a defined credit event occurs (such as payment default or bankruptcy), the Fund as a protection buyer would cease paying its fixed payment, the Fund would deliver eligible bonds issued by the reference entity to the seller, and the seller would pay the full notional value, or the “par value”, of the referenced obligation to the Fund. A seller of a CDS is said to sell protection and thus would receive a fixed payment over the life of the agreement and an upfront
32 Invesco Core Plus Bond Fund
payment, if applicable. If a credit event occurs, the Fund as a protection seller would cease to receive the fixed payment stream, the Fund would pay the buyer “par value” or the full notional value of the referenced obligation, and the Fund would receive the eligible bonds issued by the reference entity. In turn, these bonds may be sold in order to realize a recovery value. Alternatively, the seller of the CDS and its Counterparty may agree to net the notional amount and the market value of the bonds and make a cash payment equal to the difference to the buyer of protection. If no credit event occurs, the Fund receives the fixed payment over the life of the agreement. As the seller, the Fund would effectively add leverage to its portfolio because, in addition to its total net assets, the Fund would be subject to investment exposure on the notional amount of the CDS. In connection with these agreements, cash and securities may be identified as collateral in accordance with the terms of the respective swap agreements to provide assets of value and recourse in the event of default under the swap agreement or bankruptcy/insolvency of a party to the swap agreement. If a Counterparty becomes bankrupt or otherwise fails to perform its obligations due to financial difficulties, the Fund may experience significant delays in obtaining any recovery in a bankruptcy or other reorganization proceeding. The Fund may obtain only limited recovery or may obtain no recovery in such circumstances. The Fund’s maximum risk of loss from Counterparty risk, either as the protection seller or as the protection buyer, is the value of the contract. The risk may be mitigated by having a master netting arrangement between the Fund and the Counterparty and by the designation of collateral by the Counterparty to cover the Fund’s exposure to the Counterparty.
Implied credit spreads represent the current level at which protection could be bought or sold given the terms of the existing CDS contract and serve as an indicator of the current status of the payment/performance risk of the CDS. An implied spread that has widened or increased since entry into the initial contract may indicate a deteriorating credit profile and increased risk of default for the reference entity. A declining or narrowing spread may indicate an improving credit profile or decreased risk of default for the reference entity. Alternatively, credit spreads may increase or decrease reflecting the general tolerance for risk in the credit markets.
An interest rate swap is an agreement between Counterparties pursuant to which the parties exchange a floating rate payment for a fixed rate payment based on a specified notional amount.
Changes in the value of centrally cleared and OTC swap agreements are recognized as unrealized gains (losses) in the Statement of Operations by “marking to market” on a daily basis to reflect the value of the swap agreement at the end of each trading day. Payments received or paid at the beginning of the agreement are reflected as such on the Statement of Assets and Liabilities and may be referred to as upfront payments. The Fund accrues for the fixed payment stream and amortizes upfront payments, if any, on swap agreements on a daily basis with the net amount, recorded as a component of realized gain (loss) on the Statement of Operations. A liquidation payment received or made at the termination of a swap agreement is recorded as realized gain (loss) on the Statement of Operations. The Fund segregates liquid securities having a value at least equal to the amount of the potential obligation of a Fund under any swap transaction. Entering into these agreements involves, to varying degrees, lack of liquidity and elements of credit, market, and Counterparty risk in excess of amounts recognized on the Statement of Assets and Liabilities. Such risks involve the possibility that a swap is difficult to sell or liquidate; the Counterparty does not honor its obligations under the agreement and unfavorable interest rates and market fluctuations. It is possible that developments in the swaps market, including potential government regulation, could adversely affect the Fund’s ability to terminate existing swap agreements or to realize amounts to be received under such agreements.
Notional amounts of each individual credit default swap agreement outstanding as of August 31, 2014 for which the Fund is the seller of protection are disclosed in the Notes to Schedule of Investments. These potential amounts would be partially offset by any recovery values of the respective referenced obligations, upfront payments received upon entering into the agreement, or net amounts received from the settlement of buy protection credit default swap agreements entered into by the Fund for the same referenced entity or entities.
| J. | Foreign Currency Translations — Foreign currency is valued at the close of the NYSE based on quotations posted by banks and major currency dealers. Portfolio securities and other assets and liabilities denominated in foreign currencies are translated into U.S. dollar amounts at date of valuation. Purchases and sales of portfolio securities (net of foreign taxes withheld on disposition) and income items denominated in foreign currencies are translated into U.S. dollar amounts on the respective dates of such transactions. The Fund does not separately account for the portion of the results of operations resulting from changes in foreign exchange rates on investments and the fluctuations arising from changes in market prices of securities held. The combined results of changes in foreign exchange rates and the fluctuation of market prices on investments (net of estimated foreign tax withholding) are included with the net realized and unrealized gain or loss from investments in the Statement of Operations. Reported net realized foreign currency gains or losses arise from (1) sales of foreign currencies, (2) currency gains or losses realized between the trade and settlement dates on securities transactions, and (3) the difference between the amounts of dividends, interest, and foreign withholding taxes recorded on the Fund’s books and the U.S. dollar equivalent of the amounts actually received or paid. Net unrealized foreign currency gains and losses arise from changes in the fair values of assets and liabilities, other than investments in securities at fiscal period end, resulting from changes in exchange rates. |
The Fund may invest in foreign securities, which may be subject to foreign taxes on income, gains on investments or currency repatriation, a portion of which may be recoverable. Foreign taxes, if any, are recorded based on the tax regulations and rates that exist in the foreign markets in which the Fund invests and are shown in the Statement of Operations.
| K. | Forward Foreign Currency Contracts — The Fund may engage in foreign currency transactions either on a spot (i.e. for prompt delivery and settlement) basis at the rate prevailing in the currency exchange market at the time, or through forward foreign currency contracts to manage or minimize currency or exchange rate risk. |
The Fund may also enter into forward foreign currency contracts for the purchase or sale of a security denominated in a foreign currency in order to “lock in” the U.S. dollar price of that security, or the Fund may also enter into forward foreign currency contracts that do not provide for physical settlement of the two currencies, but instead are settled by a single cash payment calculated as the difference between the agreed upon exchange rate and the spot rate at settlement based upon an agreed upon notional amount (non-deliverable forwards). The Fund will set aside liquid assets in an amount equal to daily mark-to-market obligation for forward foreign currency contracts.
A forward foreign currency contract is an obligation to purchase or sell a specific currency for an agreed-upon price at a future date. The use of forward foreign currency contracts does not eliminate fluctuations in the price of the underlying securities the Fund owns or intends to acquire but establishes a rate of exchange in advance. Fluctuations in the value of these contracts are measured by the difference in the contract date and reporting date exchange rates and are recorded as unrealized appreciation (depreciation) until the contracts are closed. When the contracts
33 Invesco Core Plus Bond Fund
are closed, realized gains (losses) are recorded. Realized and unrealized gains (losses) on the contracts are included in the Statement of Operations. The primary risks associated with forward foreign currency contracts include failure of the Counterparty to meet the terms of the contract and the value of the foreign currency changing unfavorably. These risks may be in excess of the amounts reflected in the Statement of Assets and Liabilities.
| L. | Futures Contracts — The Fund may enter into futures contracts to manage exposure to interest rate, equity and market price movements and/or currency risks. A futures contract is an agreement between two parties to purchase or sell a specified underlying security, currency or commodity (or delivery of a cash settlement price, in the case of an index future) for a fixed price at a future date. The Fund currently invests only in exchange-traded futures and they are standardized as to maturity date and underlying financial instrument. Initial margin deposits required upon entering into futures contracts are satisfied by the segregation of specific securities or cash as collateral at the futures commission merchant (broker). During the period the futures contracts are open, changes in the value of the contracts are recognized as unrealized gains or losses by recalculating the value of the contracts on a daily basis. Subsequent or variation margin payments are received or made depending upon whether unrealized gains or losses are incurred. These amounts are reflected as receivables or payables on the Statement of Assets and Liabilities. When the contracts are closed or expire, the Fund recognizes a realized gain or loss equal to the difference between the proceeds from, or cost of, the closing transaction and the Fund’s basis in the contract. The net realized gain (loss) and the change in unrealized gain (loss) on futures contracts held during the period is included on the Statement of Operations. The primary risks associated with futures contracts are market risk and the absence of a liquid secondary market. If the Fund were unable to liquidate a futures contract and/or enter into an offsetting closing transaction, the Fund would continue to be subject to market risk with respect to the value of the contracts and continue to be required to maintain the margin deposits on the futures contracts. Futures contracts have minimal Counterparty risk since the exchange’s clearinghouse, as Counterparty to all exchange-traded futures, guarantees the futures against default. Risks may exceed amounts recognized in the Statement of Assets and Liabilities. |
| M. | Put Options Purchased and Written — The Fund may purchase and write put options including options on securities indexes and/or futures contracts. By purchasing a put option, the Fund obtains the right (but not the obligation) to sell the option’s underlying instrument at a fixed strike price. In return for this right, the Fund pays an option premium. The option’s underlying instrument may be a security, securities index, or a futures contract. |
Additionally, the Fund may enter into an option on a swap agreement, also called a “swaption”. A swaption is an option that gives the buyer the right, but not the obligation, to enter into a swap on a future date in exchange for paying a market-based premium. A receiver swaption gives the owner the right to receive the total return of a specified asset, reference rate or index. Swaptions also include options that allow an existing swap to be terminated or extended by one of the Counterparties.
Put options may be used by the Fund to hedge securities it owns by locking in a minimum price at which the Fund can sell. If security prices fall, the put option could be exercised to offset all or a portion of the Fund’s resulting losses. At the same time, because the maximum the Fund has at risk is the cost of the option, purchasing put options does not eliminate the potential for the Fund to profit from an increase in the value of the underlying portfolio securities. The Fund may write put options to earn additional income in the form of option premiums if it expects the price of the underlying instrument to remain stable or rise during the option period so that the option will not be exercised. The risk in this strategy is that the price of the underlying securities may decline by an amount greater than the premium received. Put options written are reported as a liability in the Statement of Assets and Liabilities. Realized and unrealized gains and losses on these contracts are included in the Statement of Operations. A risk in buying an option is that the Fund pays a premium whether or not the option is exercised. In addition, there can be no assurance that a liquid secondary market will exist for any option purchased.
| N. | Dollar Rolls and Forward Commitment Transactions — The Fund may enter into dollar roll transactions to enhance the Fund’s performance. The Fund executes its dollar roll transactions in the to be announced (“TBA”) market whereby the Fund makes a forward commitment to purchase a security and, instead of accepting delivery, the position is offset by the sale of the security with a simultaneous agreement to repurchase at a future date. |
The Fund accounts for dollar roll transactions as purchases and sales and realizes gains and losses on these transactions. These transactions increase the Fund’s portfolio turnover rate. The Fund will segregate liquid assets in an amount equal to its dollar roll commitments. Dollar roll transactions are considered borrowings under the 1940 Act.
Dollar roll transactions involve the risk that a Counterparty to the transaction may fail to complete the transaction. If this occurs, the Fund may lose the opportunity to purchase or sell the security at the agreed upon price. Dollar rolls transactions also involve the risk that the value of the securities retained by the Fund may decline below the price of the securities that the Fund has sold but is obligated to purchase under the agreement.
| O. | Other Risks — The Fund may invest in obligations issued by agencies and instrumentalities of the U.S. Government that may vary in the level of support they receive from the government. The government may choose not to provide financial support to government sponsored agencies or instrumentalities if it is not legally obligated to do so. In this case, if the issuer defaulted, the Fund may not be able to recover its investment in such issuer from the U.S. Government. Many securities purchased by the Fund are not guaranteed by the U.S. Government. |
| P. | Leverage Risk — Leverage exists when a Fund can lose more than it originally invests because it purchases or sells an instrument or enters into a transaction without investing an amount equal to the full economic exposure of the instrument or transaction. |
| Q. | Collateral — To the extent the Fund has designated or segregated a security as collateral and that security is subsequently sold, it is the Fund’s practice to replace such collateral no later than the next business day. |
34 Invesco Core Plus Bond Fund
NOTE 2—Advisory Fees and Other Fees Paid to Affiliates
The Trust has entered into a master investment advisory agreement with Invesco Advisers, Inc. (the “Adviser” or “Invesco”). Under the terms of the investment advisory agreement, the Fund pays an advisory fee to the Adviser based on the annual rate of the Fund’s average daily net assets as follows:
| Average Daily Net Assets | Rate | |||||
First $500 million | 0 | .45% | ||||
Next $500 million | 0 | .425% | ||||
Next $1.5 billion | 0 | .40% | ||||
Next $2.5 billion | 0 | .375% | ||||
Over $5 billion | 0 | .35% | ||||
Under the terms of a master sub-advisory agreement between the Adviser and each of Invesco Asset Management Deutschland GmbH, Invesco Asset Management Limited, Invesco Asset Management (Japan) Limited, Invesco Australia Limited, Invesco Hong Kong Limited, Invesco Senior Secured Management, Inc. and Invesco Canada Ltd. (collectively, the “Affiliated Sub-Advisers”) the Adviser, not the Fund, may pay 40% of the fees paid to the Adviser to any such Affiliated Sub-Adviser(s) that provide(s) discretionary investment management services to the Fund based on the percentage of assets allocated to such Sub-Adviser(s).
Effective January 1, 2014, the Adviser has contractually agreed, through at least December 31, 2014, to waive advisory fees and/or reimburse expenses of all shares to the extent necessary to limit total annual fund operating expenses after fee waiver and/or expense reimbursement (excluding certain items discussed below) of Class A, Class B, Class C, Class R, Class Y, Class R5 and Class R6 shares to 0.84%, 1.59%, 1.59%, 1.09%, 0.59%, 0.59% and 0.59%, respectively, of average daily net assets. Prior to January 1, 2014, the Adviser had contractually agreed to waive advisory fees and/or reimburse expenses of all shares to the extent necessary to limit total annual fund operating expenses after fee waiver and/or expense reimbursement (excluding certain items discussed below) of Class A, Class B, Class C, Class R, Class Y, Class R5 and Class R6 shares to 0.75%, 1.50%, 1.50%, 1.00%, 0.50%, 0.50% and 0.50%, respectively, of average daily net assets. In determining the Adviser’s obligation to waive advisory fees and/or reimburse expenses, the following expenses are not taken into account, and could cause the total annual fund operating expenses after fee waiver and/or reimbursement to exceed the numbers reflected above: (1) interest; (2) taxes; (3) dividend expense on short sales; (4) extraordinary or non-routine items, including litigation expenses; and (5) expenses that the Fund has incurred but did not actually pay because of an expense offset arrangement. Unless Invesco continues the fee waiver agreement, it will terminate on December 31, 2014. The fee waiver agreement cannot be terminated during its term.
Further, the Adviser has contractually agreed, through at least June 30, 2016, to waive the advisory fee payable by the Fund in an amount equal to 100% of the net advisory fees the Adviser receives from the affiliated money market funds on investments by the Fund of uninvested cash in such affiliated money market funds.
For the year ended August 31, 2014, the Adviser waived advisory fees of $98,611 and reimbursed class level expenses of $645,134, $27,810, $67,869, $6,103, $5,879, $470 and $264 of Class A, Class B, Class C, Class R, Class Y, Class R5 and Class R6 shares, respectively.
The Trust has entered into a master administrative services agreement with Invesco pursuant to which the Fund has agreed to pay Invesco for certain administrative costs incurred in providing accounting services to the Fund. For the year ended August 31, 2014, expenses incurred under the agreement are shown in the Statement of Operations as Administrative services fees.
The Trust has entered into a transfer agency and service agreement with Invesco Investment Services, Inc. (“IIS”) pursuant to which the Fund has agreed to pay IIS a fee for providing transfer agency and shareholder services to the Fund and reimburse IIS for certain expenses incurred by IIS in the course of providing such services. IIS may make payments to intermediaries that provide omnibus account services, sub-accounting services and/or networking services. All fees payable by IIS to intermediaries that provide omnibus account services or sub-accounting are charged back to the Fund, subject to certain limitations approved by the Trust’s Board of Trustees. For the year ended August 31, 2014, expenses incurred under the agreement are shown in the Statement of Operations as Transfer agent fees.
The Trust has entered into master distribution agreements with Invesco Distributors, Inc. (“IDI”) to serve as the distributor for the Class A, Class B, Class C, Class R, Class Y, Class R5 and Class R6 shares of the Fund. The Trust has adopted plans pursuant to Rule 12b-1 under the 1940 Act with respect to the Fund’s Class A, Class B, Class C and Class R shares (collectively, the “Plans”). The Fund, pursuant to the Plans, pays IDI compensation at the annual rate of 0.25% of the Fund’s average daily net assets of Class A shares, 1.00% of the average daily net assets of Class B and Class C shares and 0.50% of the average daily net assets of Class R shares. Of the Plan payments, up to 0.25% of the average daily net assets of each class of shares may be paid to furnish continuing personal shareholder services to customers who purchase and own shares of such classes. Any amounts not paid as a service fee under the Plans would constitute an asset-based sales charge. Rules of the Financial Industry Regulatory Authority (“FINRA”) impose a cap on the total sales charges, including asset-based sales charges, that may be paid by any class of shares of the Fund. For the year ended August 31, 2014, expenses incurred under the Plans are shown in the Statement of Operations as Distribution fees.
Front-end sales commissions and CDSC (collectively, the “sales charges”) are not recorded as expenses of the Fund. Front-end sales commissions are deducted from proceeds from the sales of Fund shares prior to investment in Class A shares of the Fund. CDSC are deducted from redemption proceeds prior to remittance to the shareholder. During the year ended August 31, 2014, IDI advised the Fund that IDI retained $86,894 in front-end sales commissions from the sale of Class A shares and $2,699, $14,460 and $6,150 from Class A, Class B and Class C shares, respectively, for CDSC imposed on redemptions by shareholders.
Certain officers and trustees of the Trust are officers and directors of the Adviser, IIS and/or IDI.
35 Invesco Core Plus Bond Fund
NOTE 3—Additional Valuation Information
GAAP defines fair value as the price that would be received to sell an asset or paid to transfer a liability in an orderly transaction between market participants at the measurement date, under current market conditions. GAAP establishes a hierarchy that prioritizes the inputs to valuation methods, giving the highest priority to readily available unadjusted quoted prices in an active market for identical assets (Level 1) and the lowest priority to significant unobservable inputs (Level 3), generally when market prices are not readily available or are unreliable. Based on the valuation inputs, the securities or other investments are tiered into one of three levels. Changes in valuation methods may result in transfers in or out of an investment’s assigned level:
| Level 1 — | Prices are determined using quoted prices in an active market for identical assets. |
| Level 2 — | Prices are determined using other significant observable inputs. Observable inputs are inputs that other market participants may use in pricing a security. These may include quoted prices for similar securities, interest rates, prepayment speeds, credit risk, yield curves, loss severities, default rates, discount rates, volatilities and others. |
| Level 3 — | Prices are determined using significant unobservable inputs. In situations where quoted prices or observable inputs are unavailable (for example, when there is little or no market activity for an investment at the end of the period), unobservable inputs may be used. Unobservable inputs reflect the Fund’s own assumptions about the factors market participants would use in determining fair value of the securities or instruments and would be based on the best available information. |
The following is a summary of the tiered valuation input levels, as of August 31, 2014. The level assigned to the securities valuations may not be an indication of the risk or liquidity associated with investing in those securities. Because of the inherent uncertainties of valuation, the values reflected in the financial statements may materially differ from the value received upon actual sale of those investments.
| Level 1 | Level 2 | Level 3 | Total | |||||||||||||
Equity Securities | $ | 19,964,880 | $ | 15,360 | $ | — | $ | 19,980,240 | ||||||||
U.S. Treasury Securities | — | 45,017,140 | — | 45,017,140 | ||||||||||||
U.S. Government Sponsored Agency Securities | — | 166,200,735 | — | 166,200,735 | ||||||||||||
Corporate Debt Securities | — | 319,384,041 | 0 | 319,384,041 | ||||||||||||
Asset-Backed Securities | — | 185,430,072 | — | 185,430,072 | ||||||||||||
Municipal Obligations | — | 11,348,438 | — | 11,348,438 | ||||||||||||
Foreign Debt Securities | — | 898,817 | — | 898,817 | ||||||||||||
Foreign Sovereign Debt Securities | — | 23,892,887 | — | 23,892,887 | ||||||||||||
Options Purchased | — | 446,451 | — | 446,451 | ||||||||||||
| 19,964,880 | 752,633,941 | 0 | 772,598,821 | |||||||||||||
Forward Foreign Currency Contracts* | — | 688,240 | — | 688,240 | ||||||||||||
Futures Contracts* | (276,351 | ) | — | — | (276,351 | ) | ||||||||||
Swap Agreements* | — | (596,748 | ) | — | (596,748 | ) | ||||||||||
Total Investments | $ | 19,688,529 | $ | 752,725,433 | $ | 0 | $ | 772,413,962 | ||||||||
| * | Unrealized appreciation (depreciation). |
NOTE 4—Derivative Investments
Value of Derivative Investments at Period-End
The table below summarizes the value of the Fund’s derivative investments, detailed by primary risk exposure, held as of August 31, 2014:
| Value | ||||||||
| Risk Exposure/Derivative Type | Assets | Liabilities | ||||||
Credit risk: | ||||||||
Swap agreements(a)(b) | $ | — | $ | (596,748 | ) | |||
Currency risk: | ||||||||
Forward foreign currency contracts(c) | 1,318,318 | (630,078 | ) | |||||
Options purchased(d) | 383,580 | — | ||||||
Interest rate risk: | ||||||||
Futures contracts(e) | 228,076 | (504,427 | ) | |||||
Options purchased(d) | 62,871 | — | ||||||
Total | $ | 1,992,845 | $ | (1,731,253 | ) | |||
| (a) | Values are disclosed on the Statement of Assets and Liabilities under the caption Unrealized depreciation on swap transactions – OTC. |
| (b) | Includes cumulative appreciation (depreciation) of centrally cleared swap agreements. Only current day’s variation margin receivable is reported within the Statement of Assets and Liabilities. |
| (c) | Values are disclosed on the Statement of Assets and Liabilities under the caption Forward foreign currency contracts outstanding. |
| (d) | Options purchased at value as reported in the Schedule of Investments. |
| (e) | Includes cumulative appreciation (depreciation) of futures contracts. Only current day’s variation margin receivable is reported within the Statement of Assets and Liabilities. |
36 Invesco Core Plus Bond Fund
Effect of Derivative Investments for the year ended August 31, 2014
The table below summarizes the gains (losses) on derivative investments, detailed by primary risk exposure, recognized in earnings during the period:
| Location of Gain (Loss) on Statement of Operations | ||||||||||||||||
| Futures Contracts | Forward Foreign Currency Contracts | Swap Agreements | Options Written(a) | |||||||||||||
Realized Gain (Loss): | ||||||||||||||||
Credit risk | $ | — | $ | — | $ | (1,897,648 | ) | $ | 55,562 | |||||||
Currency risk | — | (1,008,274 | ) | — | — | |||||||||||
Interest rate risk | (8,563,040 | ) | — | — | — | |||||||||||
Change in Unrealized Appreciation (Depreciation): | ||||||||||||||||
Credit risk | — | — | (230,334 | ) | — | |||||||||||
Currency risk | — | 693,500 | — | — | ||||||||||||
Interest rate risk | 323,048 | — | — | — | ||||||||||||
Total | $ | (8,239,992 | ) | $ | (314,774 | ) | $ | (2,127,982 | ) | $ | 55,562 | |||||
| (a) | Options purchased are included in the net realized gain from investment securities and net change in unrealized appreciation on investment securities. |
The table below summarizes the twelve month average notional value of futures contracts, forward foreign currency contracts and swap agreements, the three month average notional value of swaptions purchased and the one month average notional value of swaptions written and currency options purchased during the period.
| Futures Contracts | Forward Foreign Currency Contracts | Swap Agreements | Swaptions Purchased | Swaptions Written | Currency Options Purchased | |||||||||||||||||||
Average notional value | $ | 173,539,143 | $ | 33,909,667 | $ | 96,000,000 | $ | 100,000,000 | $ | 24,000,000 | $ | 53,301,960 | ||||||||||||
| Open Forward Foreign Currency Contracts | ||||||||||||||||||||||||||
Settlement Date
| Counterparty | Contract to | Notional Value | Unrealized Appreciation (Depreciation) | ||||||||||||||||||||||
| Deliver | Receive | |||||||||||||||||||||||||
09/02/14 | Citigroup Global Markets Inc. | EUR | 260,847 | USD | 354,952 | $ | 342,759 | $ | 12,193 | |||||||||||||||||
09/02/14 | Citigroup Global Markets Inc. | USD | 348,867 | EUR | 260,847 | 342,759 | (6,108 | ) | ||||||||||||||||||
09/02/14 | RBC Capital Markets Corp. | GBP | 416,000 | USD | 694,639 | 690,619 | 4,020 | |||||||||||||||||||
09/02/14 | RBC Capital Markets Corp. | USD | 688,205 | GBP | 416,000 | 690,619 | 2,414 | |||||||||||||||||||
09/12/14 | Deutsche Banc | CHF | 7,348,832 | USD | 8,243,111 | 8,005,584 | 237,527 | |||||||||||||||||||
09/12/14 | Deutsche Banc | NOK | 33,242,608 | USD | 5,506,296 | 5,360,659 | 145,637 | |||||||||||||||||||
09/12/14 | Deutsche Banc | USD | 5,600,000 | NOK | 33,242,608 | 5,360,659 | (239,341 | ) | ||||||||||||||||||
09/22/14 | Deutsche Banc | AUD | 12,300,000 | USD | 11,437,499 | 11,468,343 | (30,844 | ) | ||||||||||||||||||
09/22/14 | Deutsche Banc | USD | 5,584,146 | AUD | 6,000,000 | 5,594,314 | 10,168 | |||||||||||||||||||
09/22/14 | Deutsche Banc | USD | 5,482,781 | MXN | 71,759,730 | 5,473,831 | (8,950 | ) | ||||||||||||||||||
10/07/14 | Citigroup Global Markets Inc. | EUR | 8,500,000 | USD | 11,427,085 | 11,171,189 | 255,896 | |||||||||||||||||||
10/07/14 | Citigroup Global Markets Inc. | GBP | 180,000 | USD | 308,716 | 298,734 | 9,982 | |||||||||||||||||||
10/07/14 | Citigroup Global Markets Inc. | NZD | 13,048,842 | USD | 11,325,351 | 10,873,775 | 451,576 | |||||||||||||||||||
10/07/14 | Citigroup Global Markets Inc. | USD | 13,633,461 | EUR | 10,325,000 | 13,569,709 | (63,752 | ) | ||||||||||||||||||
10/07/14 | Citigroup Global Markets Inc. | USD | 93,770 | GBP | 55,914 | 92,796 | (974 | ) | ||||||||||||||||||
10/07/14 | Citigroup Global Markets Inc. | USD | 5,777,508 | NZD | 6,600,000 | 5,499,868 | (277,640 | ) | ||||||||||||||||||
10/07/14 | Deutsche Banc | EUR | 6,325,000 | USD | 8,500,879 | 8,312,679 | 188,200 | |||||||||||||||||||
10/24/14 | RBC Capital Markets Corp. | CAD | 53,276 | USD | 49,522 | 48,935 | 587 | |||||||||||||||||||
10/24/14 | RBC Capital Markets Corp. | USD | 43,623 | CAD | 47,621 | 43,741 | 118 | |||||||||||||||||||
12/15/14 | RBC Capital Markets Corp. | GBP | 430,000 | USD | 710,695 | 713,164 | (2,469 | ) | ||||||||||||||||||
Total forward foreign currency contracts – Currency Risk | $ | 688,240 | ||||||||||||||||||||||||
Currency Abbreviations:
| AUD | – Australian Dollar | |
| CAD | – Canadian Dollar | |
| CHF | – Swiss Franc |
| EUR | – Euro | |
| GBP | – British Pound Sterling | |
| MXN | – Mexican Peso |
| NOK | – Norwegian Krone | |
| NZD | – New Zealand Dollar | |
| USD | – United States Dollar |
37 Invesco Core Plus Bond Fund
| Open Futures Contracts | ||||||||||||||||||||
| Futures Contracts | Type of Contract | Number of Contracts | Expiration Month | Notional Value | Unrealized Appreciation (Depreciation) | |||||||||||||||
U.S. 5 Year Treasury Notes | Long | 578 | December-2014 | $ | 68,687,172 | $ | 201,966 | |||||||||||||
U.S. 10 Year Treasury Notes | Short | 383 | December-2014 | (48,174,219 | ) | 26,110 | ||||||||||||||
U.S. Long Bond | Short | 380 | December-2014 | (53,235,625 | ) | (380,813 | ) | |||||||||||||
U.S. Ultra Bond | Short | 112 | December-2014 | (17,416,000 | ) | (123,614 | ) | |||||||||||||
Total Futures Contracts – Interest Rate Risk | $ | (276,351 | ) | |||||||||||||||||
| Options Written Transactions | ||||||||||||||||
| Call Option Contracts | Put Option Contracts | |||||||||||||||
| Number of Contracts | Premiums Received | Number of Contracts | Premiums Received | |||||||||||||
Beginning of period | — | $ | — | — | $ | — | ||||||||||
Written | 12,000 | 48,690 | 12,000 | 40,169 | ||||||||||||
Closed | (12,000 | ) | (48,690 | ) | (12,000 | ) | (40,169 | ) | ||||||||
Exercised | — | — | — | — | ||||||||||||
Expired | — | — | — | — | ||||||||||||
End of period | — | $ | — | — | $ | — | ||||||||||
| Open Centrally Cleared Credit Default Swap Agreements | ||||||||||||||||||||||||||||||
| Counterparty/Clearinghouse | Reference Entity | Buy/Sell Protection | (Pay)/Receive Fixed Rate | Expiration Date | Implied Credit Spread(a) | Notional Value | Upfront Payments | Unrealized Appreciation (Depreciation) | ||||||||||||||||||||||
Credit Suisse Securities (USA) LLC/CME | Markit CDX North America Investment Grade Index | Buy | (1.00 | )% | 06/20/19 | 0.57 | % | $ | (75,000,000 | ) | $ | (1,359,060 | ) | $ | (257,652 | ) | ||||||||||||||
Total Credit Default Swap Agreements – Credit Risk |
| $ | (1,359,060 | ) | $ | (257,652 | ) | |||||||||||||||||||||||
Abbreviations:
| CME | – Chicago Mercantile Exchange | |||
| Open Over-The-Counter Credit Default Swap Agreements | ||||||||||||||||||||||||||||||
| Counterparty | Reference Entity | Buy/Sell Protection | (Pay)/Receive Fixed Rate | Expiration Date | Implied Credit Spread(a) | Notional Value | Upfront Payments | Unrealized Appreciation (Depreciation) | ||||||||||||||||||||||
Bank of America Securities LLC | Citigroup Inc. | Buy | (1.00 | )% | 06/20/17 | 0.39 | % | $ | (5,500,000 | ) | $ | 245,733 | $ | (339,096 | ) | |||||||||||||||
Total Credit Default Swap Agreements – Credit Risk |
| $ | 245,733 | $ | (339,096 | ) | ||||||||||||||||||||||||
| (a) | Implied credit spreads represent the current level as of August 31, 2014 at which protection could be bought or sold given the terms of the existing credit default swap contract and serve as an indicator of the current status of the payment/performance risk of the credit default swap contract. An implied credit spread that has widened or increased since entry into the initial contract may indicate a deteriorating credit profile and increased risk of default for the reference entity. A declining or narrowing spread may indicate an improving credit profile or decreased risk of default for the reference entity. Alternatively, credit spreads may increase or decrease reflecting the general tolerance for risk in the credit markets generally. |
Offsetting Assets and Liabilities
Accounting Standards Update (“ASU”) No. 2011-11, Disclosures about Offsetting Assets and Liabilities, which was subsequently clarified in Financial Accounting Standards Board ASU 2013-01 “Clarifying the Scope of Disclosures about Offsetting Assets and Liabilities” is intended to enhance disclosures about financial instruments and derivative instruments that are subject to offsetting arrangements on the Statement of Assets and Liabilities and to enable investors to better understand the effect of those arrangements on its financial position. In order for an arrangement to be eligible for netting, the Fund must have a basis to conclude that such netting arrangements are legally enforceable. The Fund enters into netting agreements and collateral agreements in an attempt to reduce the Fund’s Counterparty credit risk by providing for a single net settlement with a Counterparty of all financial transactions covered by the agreement in an event of default as defined under such agreement.
38 Invesco Core Plus Bond Fund
There were no derivative instruments subject to a netting agreement for which the Fund is not currently netting. The following tables present derivative instruments that are either subject to an enforceable netting agreement or offset by collateral arrangements as of August 31, 2014.
| Assets: | ||||||||||||||||||||||||
| Gross amounts presented in Statement of Assets & Liabilities | Gross amounts offset in Statement of Assets & Liabilities | Net amounts of assets presented in the Statement of Assets & Liabilities | Collateral Received | |||||||||||||||||||||
| Counterparty | Financial Instruments | Cash | Net Amount | |||||||||||||||||||||
Bank of America Securities LLC(a) | $ | 228,076 | $ | (228,076 | ) | $ | — | $ | — | $ | — | $ | — | |||||||||||
Bank of America Securities LLC(b) | 245,733 | (245,733 | ) | — | — | — | — | |||||||||||||||||
Citigroup Global Markets Inc.(c) | 729,647 | (348,474 | ) | 381,173 | — | — | 381,173 | |||||||||||||||||
Deutsche Banc(c) | 581,532 | (279,135 | ) | 302,397 | — | — | 302,397 | |||||||||||||||||
RBC Capital Markets Corp.(c) | 7,139 | (2,469 | ) | 4,670 | — | — | 4,670 | |||||||||||||||||
Total | $ | 1,792,127 | $ | (1,103,887 | ) | $ | 688,240 | $ | — | $ | — | $ | 688,240 | |||||||||||
| Liabilities: | ||||||||||||||||||||||||
| Gross amounts presented in Statement of Assets & Liabilities | Gross amounts offset in Statement of Assets & Liabilities | Net amounts of liabilities presented in the Statement of Assets & Liabilities | Collateral Pledged | |||||||||||||||||||||
| Counterparty | Financial Instruments | Cash | Net Amount | |||||||||||||||||||||
Bank of America Securities LLC(a) | $ | 504,427 | $ | (228,076 | ) | $ | 276,351 | $ | (276,351 | ) | $ | — | $ | — | ||||||||||
Bank of America Securities LLC(b) | 364,304 | (245,733 | ) | 118,571 | (118,571 | ) | — | — | ||||||||||||||||
Citigroup Global Markets Inc.(c) | 348,474 | (348,474 | ) | — | — | — | — | |||||||||||||||||
Credit Suisse Securities (USA) | 1,616,712 | — | 1,616,712 | (1,616,712 | ) | — | — | |||||||||||||||||
Deutsche Banc(c) | 279,135 | (279,135 | ) | — | — | — | — | |||||||||||||||||
RBC Capital Markets Corp.(c) | 2,469 | (2,469 | ) | — | — | — | — | |||||||||||||||||
Total | $ | 3,115,521 | $ | (1,103,887 | ) | $ | 2,011,634 | $ | (2,011,634 | ) | $ | — | $ | — | ||||||||||
| (a) | Futures contracts Counterparty. Includes cumulative appreciation (depreciation). |
| (b) | Swap agreements — OTC Counterparty. |
| (c) | Forward foreign currency contracts Counterparty. |
| (d) | Swap agreements — centrally cleared Counterparty. Includes cumulative appreciation (depreciation). |
NOTE 5—Expense Offset Arrangement(s)
The expense offset arrangement is comprised of transfer agency credits which result from balances in demand deposit accounts used by the transfer agent for clearing shareholder transactions. For the year ended August 31, 2014, the Fund received credits from this arrangement, which resulted in the reduction of the Fund’s total expenses of $1,373.
NOTE 6—Trustees’ and Officers’ Fees and Benefits
Trustees’ and Officers’ Fees and Benefits include amounts accrued by the Fund to pay remuneration to certain Trustees and Officers of the Fund. Trustees have the option to defer compensation payable by the Fund, and Trustees’ and Officers’ Fees and Benefits also include amounts accrued by the Fund to fund such deferred compensation amounts. Those Trustees who defer compensation have the option to select various Invesco Funds in which their deferral accounts shall be deemed to be invested. Finally, certain current Trustees were eligible to participate in a retirement plan that provided for benefits to be paid upon retirement to Trustees over a period of time based on the number of years of service. The Fund may have certain former Trustees who also participate in a retirement plan and receive benefits under such plan. Trustees’ and Officers’ Fees and Benefits include amounts accrued by the Fund to fund such retirement benefits. Obligations under the deferred compensation and retirement plans represent unsecured claims against the general assets of the Fund.
NOTE 7—Cash Balances
The Fund may borrow for leveraging in an amount up to 5% of the Fund’s total assets (excluding the amount borrowed) at the time the borrowing is made. In doing so, the Fund is permitted to temporarily carry a negative or overdrawn balance in its account with State Street Bank and Trust Company, the custodian bank. Such balances, if any at period end, are shown in the Statement of Assets and Liabilities under the payable caption Amount due custodian. To compensate the custodian bank for such overdrafts, the overdrawn Fund may either (1) leave funds as a compensating balance in the account so the custodian bank can be compensated by earning the additional interest; or (2) compensate by paying the custodian bank at a rate agreed upon by the custodian bank and Invesco, not to exceed the contractually agreed upon rate. A Fund may not purchase additional securities when any borrowings from banks exceeds 5% of the Fund’s total assets.
39 Invesco Core Plus Bond Fund
NOTE 8—Distributions to Shareholders and Tax Components of Net Assets
Tax Character of Distributions to Shareholders Paid During the Years Ended August 31, 2014 and 2013:
| 2014 | 2013 | |||||||
Ordinary income | $ | 25,712,438 | $ | 18,015,015 | ||||
Tax Components of Net Assets at Period-End:
| 2014 | ||||
Undistributed ordinary income | $ | 179,560 | ||
Net unrealized appreciation — investments | 26,869,592 | |||
Net unrealized appreciation (depreciation) — other investments | (609,636 | ) | ||
Temporary book/tax differences | (327,960 | ) | ||
Post-October deferrals | (1,402,860 | ) | ||
Capital loss carryforward | (83,151,681 | ) | ||
Shares of beneficial interest | 724,126,018 | |||
Total net assets | $ | 665,683,033 | ||
The difference between book-basis and tax-basis unrealized appreciation (depreciation) is due to differences in the timing of recognition of gains and losses on investments for tax and book purposes. The Fund’s net unrealized appreciation (depreciation) difference is attributable primarily to wash sales, book to tax accretion and amortization differences and mortgage-backed dollar rolls.
The temporary book/tax differences are a result of timing differences between book and tax recognition of income and/or expenses. The Fund’s temporary book/tax differences are the result of the trustee deferral of compensation and retirement plan benefits.
Capital loss carryforward is calculated and reported as of a specific date. Results of transactions and other activity after that date may affect the amount of capital loss carryforward actually available for the Fund to utilize. Capital losses generated in years beginning after December 22, 2010 can be carried forward for an unlimited period, whereas previous losses expire in 8 tax years. Capital losses with an expiration period may not be used to offset capital gains until all net capital losses without an expiration date have been utilized. Capital loss carryforwards with no expiration date will retain their character as either short-term or long-term capital losses instead of as short-term capital losses as under prior law. The ability to utilize capital loss carryforward in the future may be limited under the Internal Revenue Code and related regulations based on the results of future transactions.
The Fund has a capital loss carryforward as of August 31, 2014, which expires as follows:
| Capital Loss Carryforward* | ||||||||||||
| Expiration | Short-Term | Long-Term | Total | |||||||||
August 31, 2016 | $ | 80,979,897 | $ | — | $ | 80,979,897 | ||||||
Not subject to expiration | 2,171,784 | — | 2,171,784 | |||||||||
| $ | 83,151,681 | $ | — | $ | 83,151,681 | |||||||
| * | Capital loss carryforward as of the date listed above is reduced for limitations, if any, to the extent required by the Internal Revenue Code and may be further limited depending upon a variety of factors, including the realization of net unrealized gains or losses as of the date of any reorganization. |
NOTE 9—Investment Securities
The aggregate amount of investment securities (other than short-term securities, U.S. Treasury obligations and money market funds, if any) purchased and sold by the Fund during the year ended August 31, 2014 was $2,562,922,615 and $2,470,775,294, respectively. During the same period, purchases and sales of U.S. Treasury obligations were $194,796,138 and $204,366,084, respectively. Cost of investments on a tax basis includes the adjustments for financial reporting purposes as of the most recently completed federal income tax reporting period-end.
| Unrealized Appreciation (Depreciation) of Investment Securities on a Tax Basis | ||||
Aggregate unrealized appreciation of investment securities | $ | 29,519,443 | ||
Aggregate unrealized (depreciation) of investment securities | (2,649,851 | ) | ||
Net unrealized appreciation of investment securities | $ | 26,869,592 | ||
Cost of investments for tax purposes is $745,729,229.
40 Invesco Core Plus Bond Fund
NOTE 10—Reclassification of Permanent Differences
Primarily as a result of differing book/tax treatment of mortgage-backed dollar rolls, bond premium amortization and swap income, on August 31, 2014, undistributed net investment income was increased by $2,425,469 and undistributed net realized gain (loss) was decreased by $2,425,469. This reclassification had no effect on the net assets of the Fund.
NOTE 11—Share Information
| Summary of Share Activity | ||||||||||||||||
| Years ended August 31, | ||||||||||||||||
| 2014(a) | 2013 | |||||||||||||||
| Shares | Amount | Shares | Amount | |||||||||||||
Sold: | ||||||||||||||||
Class A | 5,936,190 | $ | 63,761,071 | 11,443,179 | $ | 124,770,153 | ||||||||||
Class B | 119,540 | 1,281,173 | 259,725 | 2,842,268 | ||||||||||||
Class C | 1,227,666 | 13,233,897 | 1,644,469 | 17,949,741 | ||||||||||||
Class R | 78,626 | 845,313 | 97,728 | 1,065,927 | ||||||||||||
Class Y | 984,592 | 10,675,204 | 342,319 | 3,760,180 | ||||||||||||
Class R5 | 28,631 | 306,446 | 302,401 | 3,240,211 | ||||||||||||
Class R6(b) | 6,811,615 | 73,005,951 | 17,635,417 | 193,142,924 | ||||||||||||
Issued as reinvestment of dividends: | ||||||||||||||||
Class A | 1,199,252 | 12,892,430 | 816,836 | 8,849,484 | ||||||||||||
Class B | 41,100 | 441,232 | 37,163 | 403,488 | ||||||||||||
Class C | 101,712 | 1,092,648 | 74,719 | 809,654 | ||||||||||||
Class R | 11,219 | 120,554 | 8,695 | 94,324 | ||||||||||||
Class Y | 9,882 | 106,881 | 4,187 | 45,485 | ||||||||||||
Class R5 | 6,921 | 74,217 | 8,502 | 92,331 | ||||||||||||
Class R6 | 944,113 | 10,147,976 | 515,819 | 5,577,578 | ||||||||||||
Automatic conversion of Class B shares to Class A shares: | ||||||||||||||||
Class A | 224,452 | 2,413,768 | 311,678 | 3,391,634 | ||||||||||||
Class B | (224,505 | ) | (2,413,768 | ) | (311,701 | ) | (3,391,634 | ) | ||||||||
Reacquired: | ||||||||||||||||
Class A | (7,964,908 | ) | (85,085,015 | ) | (8,373,749 | ) | (90,407,950 | ) | ||||||||
Class B | (370,860 | ) | (3,960,924 | ) | (512,456 | ) | (5,540,617 | ) | ||||||||
Class C | (1,270,424 | ) | (13,548,008 | ) | (1,749,709 | ) | (18,791,549 | ) | ||||||||
Class R | (35,142 | ) | (373,292 | ) | (138,164 | ) | (1,495,963 | ) | ||||||||
Class Y | (246,283 | ) | (2,661,211 | ) | (731,992 | ) | (7,984,908 | ) | ||||||||
Class R5 | (86,919 | ) | (927,924 | ) | (15,607,029 | ) | (171,164,439 | ) | ||||||||
Class R6 | (1,086,134 | ) | (11,597,421 | ) | (322,143 | ) | (3,436,755 | ) | ||||||||
Net increase in share activity | 6,440,336 | $ | 69,831,198 | 5,755,894 | $ | 63,821,567 | ||||||||||
| (a) | There are entities that are record owners of more than 5% of the outstanding shares of the Fund and in the aggregate own 29% of the outstanding shares of the Fund. IDI has an agreement with these entities to sell Fund shares. The Fund, Invesco and/or Invesco affiliates may make payments to these entities, which are considered to be related to the Fund, for providing services to the Fund, Invesco and/or Invesco affiliates including but not limited to services such as securities brokerage, distribution, third party record keeping and account servicing. The Fund has no knowledge as to whether all or any portion of the shares owned of record by these entities are also owned beneficially. |
| In addition, 40% of the outstanding shares of the Fund are owned by affiliated mutual funds. Affiliated mutual funds are mutual funds that are advised by Invesco. |
| (b) | Commencement date of September 24, 2012. |
41 Invesco Core Plus Bond Fund
NOTE 12—Financial Highlights
The following schedule presents financial highlights for a share of the Fund outstanding throughout the periods indicated.
Net asset of period | Net investment income(a) | Net gains (losses) on securities (both realized and unrealized) | Total from investment operations | Dividends from net investment income | Distributions from net realized gains | Total distributions | Net asset value, end of period | Total return(b) | Net assets, end of period (000’s omitted) | Ratio of expenses to average net assets with fee waivers and/or expenses absorbed | Ratio of expenses to average net assets without fee waivers and/or expenses absorbed | Ratio of net investment income to average net assets | Portfolio turnover(c) | |||||||||||||||||||||||||||||||||||||||||||
Class A |
| |||||||||||||||||||||||||||||||||||||||||||||||||||||||
Year ended 08/31/14 | $ | 10.41 | $ | 0.39 | $ | 0.58 | $ | 0.97 | $ | (0.46 | ) | $ | — | $ | (0.46 | ) | $ | 10.92 | 9.44 | % | $ | 333,641 | 0.81 | %(d) | 1.03 | %(d) | 3.62 | %(d) | 398 | % | ||||||||||||||||||||||||||
Year ended 08/31/13 | 10.95 | 0.31 | (0.51 | ) | (0.20 | ) | (0.34 | ) | — | (0.34 | ) | 10.41 | (1.92 | ) | 324,537 | 0.73 | 0.99 | 2.86 | 252 | |||||||||||||||||||||||||||||||||||||
Year ended 08/31/12 | 10.60 | 0.37 | 0.44 | 0.81 | (0.44 | ) | (0.02 | ) | (0.46 | ) | 10.95 | 7.86 | 295,311 | 0.74 | 1.01 | 3.44 | 297 | |||||||||||||||||||||||||||||||||||||||
Year ended 08/31/11 | 10.75 | 0.35 | (0.03 | ) | 0.32 | (0.32 | ) | (0.15 | ) | (0.47 | ) | 10.60 | 3.10 | 225,417 | 0.75 | 1.20 | 3.27 | 138 | ||||||||||||||||||||||||||||||||||||||
Year ended 08/31/10 | 10.29 | 0.37 | 0.65 | 1.02 | (0.49 | ) | (0.07 | ) | (0.56 | ) | 10.75 | 10.26 | 7,219 | 0.87 | 5.61 | 3.55 | 78 | |||||||||||||||||||||||||||||||||||||||
Class B |
| |||||||||||||||||||||||||||||||||||||||||||||||||||||||
Year ended 08/31/14 | 10.41 | 0.31 | 0.57 | 0.88 | (0.38 | ) | — | (0.38 | ) | 10.91 | 8.53 | 11,899 | 1.56 | (d) | 1.78 | (d) | 2.87 | (d) | 398 | |||||||||||||||||||||||||||||||||||||
Year ended 08/31/13 | 10.95 | 0.23 | (0.51 | ) | (0.28 | ) | (0.26 | ) | — | (0.26 | ) | 10.41 | (2.66 | ) | 15,876 | 1.48 | 1.74 | 2.11 | 252 | |||||||||||||||||||||||||||||||||||||
Year ended 08/31/12 | 10.60 | 0.29 | 0.44 | 0.73 | (0.36 | ) | (0.02 | ) | (0.38 | ) | 10.95 | 7.06 | 22,465 | 1.49 | 1.76 | 2.69 | 297 | |||||||||||||||||||||||||||||||||||||||
Year ended 08/31/11 | 10.74 | 0.27 | (0.02 | ) | 0.25 | (0.24 | ) | (0.15 | ) | (0.39 | ) | 10.60 | 2.43 | 24,401 | 1.50 | 1.95 | 2.52 | 138 | ||||||||||||||||||||||||||||||||||||||
Year ended 08/31/10 | 10.29 | 0.29 | 0.64 | 0.93 | (0.41 | ) | (0.07 | ) | (0.48 | ) | 10.74 | 9.34 | 954 | 1.62 | 6.36 | 2.80 | 78 | |||||||||||||||||||||||||||||||||||||||
Class C |
| |||||||||||||||||||||||||||||||||||||||||||||||||||||||
Year ended 08/31/14 | 10.41 | 0.31 | 0.57 | 0.88 | (0.38 | ) | — | (0.38 | ) | 10.91 | 8.53 | 38,142 | 1.56 | (d) | 1.78 | (d) | 2.87 | (d) | 398 | |||||||||||||||||||||||||||||||||||||
Year ended 08/31/13 | 10.94 | 0.23 | (0.50 | ) | (0.27 | ) | (0.26 | ) | — | (0.26 | ) | 10.41 | �� | (2.56 | ) | 35,770 | 1.48 | 1.74 | 2.11 | 252 | ||||||||||||||||||||||||||||||||||||
Year ended 08/31/12 | 10.60 | 0.29 | 0.44 | 0.73 | (0.37 | ) | (0.02 | ) | (0.39 | ) | 10.94 | 6.96 | 37,950 | 1.49 | 1.76 | 2.69 | 297 | |||||||||||||||||||||||||||||||||||||||
Year ended 08/31/11 | 10.74 | 0.27 | (0.02 | ) | 0.25 | (0.24 | ) | (0.15 | ) | (0.39 | ) | 10.60 | 2.43 | 33,476 | 1.50 | 1.95 | 2.52 | 138 | ||||||||||||||||||||||||||||||||||||||
Year ended 08/31/10 | 10.29 | 0.29 | 0.64 | 0.93 | (0.41 | ) | (0.07 | ) | (0.48 | ) | 10.74 | 9.34 | 844 | 1.62 | 6.36 | 2.80 | 78 | |||||||||||||||||||||||||||||||||||||||
Class R |
| |||||||||||||||||||||||||||||||||||||||||||||||||||||||
Year ended 08/31/14 | 10.41 | 0.36 | 0.57 | 0.93 | (0.43 | ) | — | (0.43 | ) | 10.91 | 9.07 | 3,554 | 1.06 | (d) | 1.28 | (d) | 3.37 | (d) | 398 | |||||||||||||||||||||||||||||||||||||
Year ended 08/31/13 | 10.95 | 0.28 | (0.51 | ) | (0.23 | ) | (0.31 | ) | — | (0.31 | ) | 10.41 | (2.16 | ) | 2,820 | 0.98 | 1.24 | 2.61 | 252 | |||||||||||||||||||||||||||||||||||||
Year ended 08/31/12 | 10.60 | 0.34 | 0.44 | 0.78 | (0.41 | ) | (0.02 | ) | (0.43 | ) | 10.95 | 7.59 | 3,313 | 0.99 | 1.26 | 3.19 | 297 | |||||||||||||||||||||||||||||||||||||||
Year ended 08/31/11 | 10.74 | 0.32 | (0.02 | ) | 0.30 | (0.29 | ) | (0.15 | ) | (0.44 | ) | 10.60 | 2.94 | 2,301 | 1.00 | 1.45 | 3.02 | 138 | ||||||||||||||||||||||||||||||||||||||
Year ended 08/31/10 | 10.29 | 0.34 | 0.64 | 0.98 | (0.46 | ) | (0.07 | ) | (0.53 | ) | 10.74 | 9.88 | 153 | 1.12 | 5.86 | 3.30 | 78 | |||||||||||||||||||||||||||||||||||||||
Class Y |
| |||||||||||||||||||||||||||||||||||||||||||||||||||||||
Year ended 08/31/14 | 10.42 | 0.42 | 0.56 | 0.98 | (0.48 | ) | — | (0.48 | ) | 10.92 | 9.61 | 9,699 | 0.56 | (d) | 0.78 | (d) | 3.87 | (d) | 398 | |||||||||||||||||||||||||||||||||||||
Year ended 08/31/13 | 10.95 | 0.34 | (0.50 | ) | (0.16 | ) | (0.37 | ) | — | (0.37 | ) | 10.42 | (1.58 | ) | 1,456 | 0.48 | 0.74 | 3.11 | 252 | |||||||||||||||||||||||||||||||||||||
Year ended 08/31/12 | 10.60 | 0.39 | 0.45 | 0.84 | (0.47 | ) | (0.02 | ) | (0.49 | ) | 10.95 | 8.12 | 5,753 | 0.49 | 0.76 | 3.69 | 297 | |||||||||||||||||||||||||||||||||||||||
Year ended 08/31/11 | 10.74 | 0.37 | (0.01 | ) | 0.36 | (0.35 | ) | (0.15 | ) | (0.50 | ) | 10.60 | 3.46 | 5,234 | 0.50 | 0.95 | 3.52 | 138 | ||||||||||||||||||||||||||||||||||||||
Year ended 08/31/10 | 10.29 | 0.40 | 0.63 | 1.03 | (0.51 | ) | (0.07 | ) | (0.58 | ) | 10.74 | 10.43 | 144 | 0.62 | 5.36 | 3.80 | 78 | |||||||||||||||||||||||||||||||||||||||
Class R5 |
| |||||||||||||||||||||||||||||||||||||||||||||||||||||||
Year ended 08/31/14 | 10.40 | 0.41 | 0.58 | 0.99 | (0.48 | ) | — | (0.48 | ) | 10.91 | 9.72 | 1,495 | 0.56 | (d) | 0.60 | (d) | 3.87 | (d) | 398 | |||||||||||||||||||||||||||||||||||||
Year ended 08/31/13 | 10.94 | 0.34 | (0.51 | ) | (0.17 | ) | (0.37 | ) | — | (0.37 | ) | 10.40 | (1.68 | ) | 1,960 | 0.48 | 0.56 | 3.11 | 252 | |||||||||||||||||||||||||||||||||||||
Year ended 08/31/12 | 10.60 | 0.39 | 0.44 | 0.83 | (0.47 | ) | (0.02 | ) | (0.49 | ) | 10.94 | 8.03 | 169,474 | 0.49 | 0.56 | 3.69 | 297 | |||||||||||||||||||||||||||||||||||||||
Year ended 08/31/11 | 10.74 | 0.37 | (0.01 | ) | 0.36 | (0.35 | ) | (0.15 | ) | (0.50 | ) | 10.60 | 3.46 | 166,656 | 0.50 | 0.66 | 3.52 | 138 | ||||||||||||||||||||||||||||||||||||||
Year ended 08/31/10 | 10.29 | 0.40 | 0.64 | 1.04 | (0.52 | ) | (0.07 | ) | (0.59 | ) | 10.74 | 10.43 | 115 | 0.62 | 5.29 | 3.80 | 78 | |||||||||||||||||||||||||||||||||||||||
Class R6 |
| |||||||||||||||||||||||||||||||||||||||||||||||||||||||
Year ended 08/31/14 | 10.41 | 0.42 | 0.56 | 0.98 | (0.48 | ) | — | (0.48 | ) | 10.91 | 9.64 | 267,254 | 0.54 | (d) | 0.56 | (d) | 3.89 | (d) | 398 | |||||||||||||||||||||||||||||||||||||
Year ended 08/31/13(e) | 10.97 | 0.32 | (0.54 | ) | (0.22 | ) | (0.34 | ) | — | (0.34 | ) | 10.41 | (2.07 | ) | 185,513 | 0.48 | (f) | 0.54 | (f) | 3.11 | (f) | 252 | ||||||||||||||||||||||||||||||||||
| (a) | Calculated using average shares outstanding. |
| (b) | Includes adjustments in accordance with accounting principles generally accepted in the United States of America and as such, the net asset value for financial reporting purposes and the returns based upon those net asset values may differ from the net asset value and returns for shareholder transactions. Does not include sales charges and is not annualized for periods less than one year, if applicable. |
| (c) | Portfolio turnover is calculated at the fund level and is not annualized for periods less than one year, if applicable. For the period ended August 31, 2011, the portfolio turnover calculation excludes the value of securities purchased of $390,261,951 and sold of $29,803,473 in the effort to realign the Fund’s portfolio holdings after the reorganization of Invesco Core Bond Fund and Invesco Van Kampen Core Plus Fixed Income Fund into the Fund. |
| (d) | Ratios are based on average daily net assets (000’s omitted) of $319,893, $13,790, $33,653, $3,026, $2,915, $1,681 and $224,591 for Class A, Class B, Class C, Class R, Class Y, Class R5 and Class R6 shares, respectively. |
| (e) | Commencement date of September 24, 2012 for Class R6 shares. |
| (f) | Annualized. |
42 Invesco Core Plus Bond Fund
Report of Independent Registered Public Accounting Firm
To the Board of Trustees of AIM Counselor Series Trust (Invesco Counselor Series Trust)
and Shareholders of Invesco Core Plus Bond Fund:
In our opinion, the accompanying statement of assets and liabilities, including the schedule of investments, and the related statements of operations and of changes in net assets and the financial highlights present fairly, in all material respects, the financial position of Invesco Core Plus Bond Fund (one of the funds constituting AIM Counselor Series Trust (Invesco Counselor Series Trust), hereafter referred to as the “Fund”) at August 31, 2014, the results of its operations for the year then ended, the changes in its net assets for each of the two years in the period then ended and the financial highlights for each of the five years in the period then ended, in conformity with accounting principles generally accepted in the United States of America. These financial statements and financial highlights (hereafter referred to as “financial statements”) are the responsibility of the Fund’s management. Our responsibility is to express an opinion on these financial statements based on our audits. We conducted our audits of these financial statements in accordance with the standards of the Public Company Accounting Oversight Board (United States). Those standards require that we plan and perform the audit to obtain reasonable assurance about whether the financial statements are free of material misstatement. An audit includes examining, on a test basis, evidence supporting the amounts and disclosures in the financial statements, assessing the accounting principles used and significant estimates made by management, and evaluating the overall financial statement presentation. We believe that our audits, which included confirmation of securities at August 31, 2014 by correspondence with the custodian and brokers, provide a reasonable basis for our opinion.
PRICEWATERHOUSECOOPERS LLP
October 27, 2014
Houston, Texas
43 Invesco Core Plus Bond Fund
Calculating your ongoing Fund expenses
Example
As a shareholder of the Fund, you incur two types of costs: (1) transaction costs, which may include sales charges (loads) on purchase payments or contingent deferred sales charges on redemptions, if any; and (2) ongoing costs, including management fees, distribution and/or service (12b-1) fees, and other Fund expenses. This example is intended to help you understand your ongoing costs (in dollars) of investing in the Fund and to compare these costs with ongoing costs of investing in other mutual funds. The example is based on an investment of $1,000 invested at the beginning of the period and held for the entire period March 1, 2014 through August 31, 2014.
Actual expenses
The table below provides information about actual account values and actual expenses. You may use the information in this table, together with the amount you invested, to estimate the expenses that you paid over the period. Simply divide your account value by $1,000 (for example, an $8,600 account value divided by $1,000 = 8.6), then multiply the result by the number in the table under the heading entitled “Actual Expenses Paid During Period” to estimate the expenses you paid on your account during this period.
Hypothetical example for comparison purposes
The table below also provides information about hypothetical account values and hypothetical expenses based on the Fund’s actual expense ratio and an assumed rate of return of 5% per year before expenses, which is not the Fund’s actual return.
The hypothetical account values and expenses may not be used to estimate the actual ending account balance or expenses you paid for the period. You may use this information to compare the ongoing costs of investing in the Fund and other funds. To do so, compare this 5% hypothetical example with the 5% hypothetical examples that appear in the shareholder reports of the other funds.
Please note that the expenses shown in the table are meant to highlight your ongoing costs only and do not reflect any transaction costs, such as sales charges (loads) on purchase payments or contingent deferred sales charges on redemptions, if any. Therefore, the hypothetical information is useful in comparing ongoing costs only, and will not help you determine the relative total costs of owning different funds. In addition, if these transaction costs were included, your costs would have been higher.
| Class | Beginning Account Value (03/01/14) | ACTUAL | HYPOTHETICAL (5% annual return before | Annualized Expense Ratio | ||||||||||||||||||||
| Ending Account Value (08/31/14)1 | Expenses Paid During Period2 | Ending Account Value (08/31/14) | Expenses Paid During Period2 | |||||||||||||||||||||
| A | $ | 1,000.00 | $ | 1,037.30 | $ | 4.31 | $ | 1,020.97 | $ | 4.28 | 0.84 | % | ||||||||||||
| B | 1,000.00 | 1,032.50 | 8.15 | 1,017.19 | 8.08 | 1.59 | ||||||||||||||||||
| C | 1,000.00 | 1,032.50 | 8.15 | 1,017.19 | 8.08 | 1.59 | ||||||||||||||||||
| R | 1,000.00 | 1,035.10 | 5.59 | 1,019.71 | 5.55 | 1.09 | ||||||||||||||||||
| Y | 1,000.00 | 1,037.70 | 3.03 | 1,022.23 | 3.01 | 0.59 | ||||||||||||||||||
| R5 | 1,000.00 | 1,038.60 | 3.03 | 1,022.23 | 3.01 | 0.59 | ||||||||||||||||||
| R6 | 1,000.00 | 1,038.80 | 2.88 | 1,022.38 | 2.85 | 0.56 | ||||||||||||||||||
| 1 | The actual ending account value is based on the actual total return of the Fund for the period March 1, 2014 through August 31, 2014, after actual expenses and will differ from the hypothetical ending account value which is based on the Fund’s expense ratio and a hypothetical annual return of 5% before expenses. |
| 2 | Expenses are equal to the Fund’s annualized expense ratio as indicated above multiplied by the average account value over the period, multiplied by 184/365 to reflect the most recent fiscal half year. |
44 Invesco Core Plus Bond Fund
Approval of Investment Advisory and Sub-Advisory Contracts
The Board of Trustees (the Board) of AIM Counselor Series Trust (Invesco Counselor Series Trust) is required under the Investment Company Act of 1940, as amended, to approve annually the renewal of Invesco Core Plus Bond Fund’s (the Fund) investment advisory agreements. During contract renewal meetings held on June 16-17, 2014, the Board as a whole, and the disinterested or “independent” Trustees, who comprise over 75% of the Board, voting separately, approved the continuance for the Fund of the Master Investment Advisory Agreement with Invesco Advisers, Inc. (Invesco Advisers) and the Master Intergroup Sub-Advisory Contract for Mutual Funds with Invesco Asset Management Deutschland GmbH, Invesco Asset Management Limited, Invesco Asset Management (Japan) Limited, Invesco Australia Limited, Invesco Hong Kong Limited, Invesco Senior Secured Management, Inc. and Invesco Canada Ltd. (collectively, the Affiliated Sub-Advisers and the sub-advisory contracts) for another year, effective July 1, 2014.
In evaluating the fairness and reasonableness of compensation under the Fund’s investment advisory agreement and sub-advisory contracts, the Board considered, among other things, the factors discussed below. The Board determined that continuation of the Fund’s investment advisory agreement and the sub-advisory contracts are in the best interest of the Fund and its shareholders and that the compensation payable to Invesco Advisers and the Affiliated Sub-Advisers under the agreements is fair and reasonable.
The Board’s Fund Evaluation Process
The Board’s Investments Committee has established three Sub-Committees, each of which is primarily responsible for overseeing the management of a number of the funds advised by Invesco Advisers (the Invesco Funds). The Sub-Committees meet throughout the year to review the performance of their assigned Invesco Funds, including reviewing materials prepared under the direction of the independent Senior Officer, an officer of the Invesco Funds who reports directly to the independent Trustees. Over the course of each year, the Sub-Committees meet with portfolio managers for their assigned Invesco Funds and other members of management to review the performance, investment objective(s), policies, strategies, limitations and investment risks of these funds. The Sub-Committees meet regularly and at designated contract renewal meetings each year to conduct a review of the performance, fees, expenses and other matters related to their assigned Invesco Funds. Each Sub-Committee recommends to the Investments Committee, which in turn recommends to the full Board, whether and on what terms to approve the continuance of each Invesco Fund’s
investment advisory agreement and sub-advisory contracts for another year.
During the contract renewal process, the Trustees receive comparative performance and fee data regarding the Invesco Funds prepared by Invesco Advisers and Lipper Inc. (Lipper), an independent provider of investment company data. The Trustees also receive an independent written evaluation from the Senior Officer. The Senior Officer’s evaluation is prepared as part of his responsibility to manage the process by which the Invesco Funds’ proposed management fees are negotiated during the annual contract renewal process to ensure they are negotiated in a manner that is at arms’ length and reasonable. In addition to meetings with Invesco Advisers and fund counsel, the independent Trustees also discuss the continuance of the investment advisory agreement and sub-advisory contracts in separate sessions with the Senior Officer and with independent legal counsel.
The Trustees recognized that the advisory fee rates for the Invesco Funds are, in many cases, the result of years of review and negotiation. The Trustees’ deliberations and conclusions in a particular year may be based in part on their deliberations and conclusions regarding these arrangements throughout the year and in prior years. The Trustees’ review and conclusions are based on the comprehensive consideration of all information presented to them and are not the result of any single determinative factor. Moreover, one Trustee may have weighed a particular piece of information or factor differently than another Trustee.
The discussion below serves as the Senior Officer’s independent written evaluation with respect to the Fund’s investment advisory agreement as well as a discussion of the material factors and related conclusions that formed the basis for the Board’s approval of the Fund’s investment advisory agreement and sub-advisory contracts. Unless otherwise stated, this information is current as of June 17, 2014, and may not reflect consideration of factors that became known to the Board after that date.
Factors and Conclusions and Summary of Independent Written Fee Evaluation
| A. | Nature, Extent and Quality of Services Provided by Invesco Advisers and the Affiliated Sub-Advisers |
The Board reviewed the advisory services provided to the Fund by Invesco Advisers under the Fund’s investment advisory agreement, the performance of Invesco Advisers in providing these services, and the credentials and experience of the officers and employees of Invesco Advisers who provide these services, including the Fund’s portfolio manager or managers, with whom the Sub-Committees met during the year. The Board’s review of the
qualifications of Invesco Advisers to provide advisory services included the Board’s consideration of Invesco Advisers’ investment process oversight, independent credit analysis and investment risk management. The Board also considered non-advisory services that Invesco Advisers and its affiliates provide to the Invesco Funds such as various back office support functions, equity and fixed income trading operations, internal audit, distribution and legal and compliance.
In determining whether to continue the Fund’s investment advisory agreement, the Board considered the benefits of reapproving an existing relationship and the greater uncertainty that may be associated with entering into a new relationship. The Board concluded that the nature, extent and quality of the services provided to the Fund by Invesco Advisers are appropriate and satisfactory and consistent with the terms of the Fund’s investment advisory agreement.
The Board reviewed the services that may be provided by the Affiliated Sub-Advisers under the sub-advisory contracts and the credentials and experience of the officers and employees of the Affiliated Sub-Advisers who provide these services. The Board noted that the Affiliated Sub-Advisers have offices and personnel that are located in financial centers around the world. As a result, the Affiliated Sub-Advisers can provide research and investment analysis on the markets and economies of various countries in which the Fund may invest, make recommendations regarding securities and assist with security trades. The Board concluded that the sub-advisory contracts benefit the Fund and its shareholders by permitting Invesco Advisers to use the resources and talents of the Affiliated Sub-Advisers in managing the Fund. The Board concluded that the nature, extent and quality of the services that may be provided by the Affiliated Sub-Advisers are appropriate and satisfactory and consistent with the terms of the Fund’s sub-advisory contracts.
| B. | Fund Performance |
The Board considered Fund performance as a relevant factor in considering whether to approve the investment advisory agreement. The Board did not view Fund performance as a relevant factor in considering whether to approve the sub-advisory contracts for the Fund, as no Affiliated Sub-Adviser currently manages assets of the Fund.
The Board noted that only four calendar years of comparative performance data was available for the Fund. The Board compared the Fund’s performance during the past one, three and four calendar years to the performance of funds in the Lipper performance universe and against the Lipper Core Plus Bond Funds Index. The Board noted that performance of Class A shares of the Fund was in the second quintile of its performance universe for the one year
45 Invesco Core Plus Bond Fund
period, the third quintile for the three year period and the fourth quintile for the four year period (the first quintile being the best performing funds and the fifth quintile being the worst performing funds). The Board noted that performance of Class A shares of the Fund was above the performance of the Index for the one year period and below the Index for the three and four year periods. The Board noted that the Fund had merged with another fund in 2011 and achieved sufficient assets to implement fully the “plus” factors of investing in emerging market and high yield bonds. The Trustees also reviewed more recent Fund performance and this review did not change their conclusions.
| C. | Advisory and Sub-Advisory Fees |
The Board compared the Fund’s contractual management fee rate to the contractual management fee rates of funds in the Fund’s Lipper expense group at a common asset level. The Board noted that the contractual management fee rate for Class A shares of the Fund was below the median contractual management fee rate of funds in its expense group. The Board noted that the term “contractual management fee” may include both advisory and certain administrative services fees, but that Lipper does not provide information on a fund by fund basis as to what is included. The Board noted that Invesco Advisers does not charge the Invesco Funds for the administrative services included in the term as defined by Lipper. The Board also reviewed the methodology used by Lipper in providing expense group information, which includes using each fund’s contractual management fee schedule (including any applicable breakpoints) as reported in the most recent prospectus or statement of additional information for each fund in the expense group.
The Board noted that Invesco Advisers has contractually agreed to waive fees and/or limit expenses of the Fund through at least December 31, 2014 in an amount necessary to limit total annual operating expenses to a specified percentage of average daily net assets for each class of the Fund.
The Board also compared the Fund’s effective advisory fee rate (the advisory fee rate after advisory fee waivers and before other expense limitations/waivers) to the effective advisory fee rates of other mutual funds and client accounts advised by Invesco Advisers and its affiliates that are managed using an investment process substantially similar to the investment process used for the Fund. The Board noted that Invesco Advisers and the Affiliated Sub-Advisers do not advised other funds, but do advise other client accounts using an investment process substantially similar to the investment process used for the Fund. The Board noted that Invesco Advisers or the Affiliated Sub-Advisers may charge lower fees to large institutional clients. Invesco Advisers reviewed with the Board the significantly greater scope of services it provides to the Invesco Funds relative to certain other client accounts. These additional services include provision of administrative services,
officers and office space, oversight of service providers, preparation of annual registration statement updates and financial information and regulatory compliance under the Investment Company Act of 1940, as amended. Invesco Advisers also reviewed generally the higher frequency of shareholder purchases and redemptions in the Invesco Funds relative to the flow of assets for other client accounts. Invesco Advisers advised the Board that advance notice of redemptions is often provided to Invesco Advisers by institutional clients. The Board did note that sub-advisory fee rates charged by the Affiliated Sub-Advisers to manage the Invesco Funds and to manage other client accounts tended to be more comparable, reflecting a more comparable scope of services. The Board concluded that the aggregate services provided to the Invesco Funds were sufficiently different from those provided to institutional clients to support the difference in fees.
The Board also considered the services that may be provided by the Affiliated Sub-Advisers pursuant to the sub-advisory contracts, as well as the fees payable by Invesco Advisers to the Affiliated Sub-Advisers pursuant to the sub-advisory contracts. The Board also noted that the sub-advisory fees are not paid directly by the Fund, but rather, are payable by Invesco Advisers to the Affiliated Sub-Advisers.
| D. | Economies of Scale and Breakpoints |
The Board considered the extent to which there are economies of scale in the provision of advisory services to the Fund. The Board also considered whether the Fund benefits from economies of scale through contractual breakpoints in the Fund’s advisory fee schedule and was assisted in this review by a report from the Senior Officer. The Board also noted that the Fund shares directly in economies of scale through lower fees charged by third party service providers based on the combined size of the Invesco Funds and other clients advised by Invesco Advisers.
| E. | Profitability and Financial Resources |
The Board reviewed information from Invesco Advisers concerning the costs of the advisory and other services that Invesco Advisers and its affiliates provide to the Fund and the profitability of Invesco Advisers and its affiliates in providing these services for the year ended December 31, 2013. The Board received information from Invesco Advisers about the methodology used to prepare the profitability information. The Board considered the profitability of Invesco Advisers in managing the Fund and the Invesco Funds. The Board noted that Invesco Advisers continues to operate at a net profit from services Invesco Advisers and its subsidiaries provide to the Invesco Funds and the Fund. The Board did not deem the level of profits realized by Invesco Advisers and its affiliates from providing services to the Fund to be excessive given the nature, quality and extent of the services provided to the Invesco Funds. The Board received and accepted information from Invesco Advisers demonstrating that Invesco Advisers and each
Affiliated Sub-Adviser are financially sound and have the resources necessary to perform their obligations under the investment advisory agreement and sub-advisory contracts.
| F. | Collateral Benefits to Invesco Advisers and its Affiliates |
The Board considered various other benefits received by Invesco Advisers and its affiliates from the relationship with the Fund, including the fees received for their provision of transfer agency and distribution services to the Fund. The Board considered comparative information regarding fees charged for these services, including information provided by Lipper and other independent sources. The Board considered the performance of Invesco Advisers and its affiliates in providing these services and the organizational structure employed to provide these services. The Board also considered that these services are provided to the Fund pursuant to written contracts that are reviewed and approved on an annual basis by the Board; that the services are required for the operation of the Fund; that Invesco Advisers and its affiliates can provide services, the nature and quality of which are at least equal to those provided by others offering the same or similar services; and that the fees for such services are fair and reasonable in light of the usual and customary charges by others for services of the same nature and quality.
The Board considered the benefits realized by Invesco Advisers and the Affiliated Sub-Advisers as a result of portfolio brokerage transactions executed through “soft dollar” arrangements. Invesco Advisers noted that the Fund does not execute brokerage transactions through “soft dollar” arrangements to any significant degree.
The Board considered that the Fund’s uninvested cash and cash collateral from any securities lending arrangements may be invested in money market funds advised by Invesco Advisers pursuant to procedures approved by the Board. The Board noted that Invesco Advisers receives advisory fees from these affiliated money market funds attributable to such investments, although Invesco Advisers has contractually agreed to waive through varying periods the advisory fees payable by the Invesco Funds with respect to investments in the affiliated money market funds. The waiver is in an amount equal to 100% of the net advisory fee Invesco Advisers receives from the affiliated money market funds with respect to the Fund’s investment in the affiliated money market funds of uninvested cash, but not cash collateral. The Board concluded that the amount of advisory fees received by Invesco Advisors from the Fund’s investment of uninvested cash and cash collateral from any securities lending arrangements in the affiliated money market funds are fair and reasonable.
46 Invesco Core Plus Bond Fund
Tax Information
Form 1099-DIV, Form 1042-S and other year–end tax information provide shareholders with actual calendar year amounts that should be included in their tax returns. Shareholders should consult their tax advisors.
The following distribution information is being provided as required by the Internal Revenue Code or to meet a specific state’s requirement.
The Fund designates the following amounts or, if subsequently determined to be different, the maximum amount allowable for its fiscal year ended August 31, 2014:
Federal and State Income Tax | ||||
Qualified Dividend Income* | 3.42 | % | ||
Corporate Dividends Received Deduction* | 3.42 | % | ||
U.S. Treasury Obligations* | 3.29 | % | ||
| * | The above percentages are based on ordinary income dividends paid to shareholders during the Fund’s fiscal year. |
47 Invesco Core Plus Bond Fund
Trustees and Officers
The address of each trustee and officer is AIM Counselor Series Trust (Invesco Counselor Series Trust) (the “Trust”), 11 Greenway Plaza, Suite 1000, Houston, Texas 77046-1173. The trustees serve for the life of the Trust, subject to their earlier death, incapacitation, resignation, retirement or removal as more specifically provided in the Trust’s organizational documents. Each officer serves for a one year term or until their successors are elected and qualified. Column two below includes length of time served with predecessor entities, if any.
Name, Year of Birth and Position(s) Held with the Trust | Trustee and/ or Officer Since | Principal Occupation(s) During Past 5 Years | Number of Funds in Fund Complex Overseen by Trustee | Other Directorship(s) Held by Trustee During Past 5 Years | ||||
| Interested Persons | ||||||||
Martin L. Flanagan1 — 1960 Trustee | 2007 | Executive Director, Chief Executive Officer and President, Invesco Ltd. (ultimate parent of Invesco and a global investment management firm); Advisor to the Board, Invesco Advisers, Inc. (formerly known as Invesco Institutional (N.A.), Inc.); Trustee, The Invesco Funds; Vice Chair, Investment Company Institute; and Member of Executive Board, SMU Cox School of Business.
Formerly: Chairman and Chief Executive Officer, Invesco Advisers, Inc. (registered investment adviser); Director, Chairman, Chief Executive Officer and President, IVZ Inc. (holding company), INVESCO Group Services, Inc. (service provider) and Invesco North American Holdings, Inc. (holding company); Director, Chief Executive Officer and President, Invesco Holding Company Limited (parent of Invesco and a global investment management firm); Director, Invesco Ltd.; Chairman, Investment Company Institute and President, Co-Chief Executive Officer, Co-President, Chief Operating Officer and Chief Financial Officer, Franklin Resources, Inc. (global investment management organization). | 141 | None | ||||
Philip A. Taylor2 — 1954 Trustee, President and Principal Executive Officer | 2006 | Head of North American Retail and Senior Managing Director, Invesco Ltd.; Director, Co-Chairman, Co-President and Co-Chief Executive Officer, Invesco Advisers, Inc. (formerly known as Invesco Institutional (N.A.), Inc.) (registered investment adviser); Director, Chairman, Chief Executive Officer and President, Invesco Management Group, Inc. (formerly known as Invesco Aim Management Group, Inc.) (financial services holding company); Director and President, INVESCO Funds Group, Inc. (registered investment adviser and registered transfer agent); Director and Chairman, Invesco Investment Services, Inc. (formerly known as Invesco Aim Investment Services, Inc.) (registered transfer agent) and IVZ Distributors, Inc. (formerly known as INVESCO Distributors, Inc.) (registered broker dealer); Director, President and Chairman, Invesco Inc. (holding company) and Invesco Canada Holdings Inc. (holding company); Chief Executive Officer, Invesco Corporate Class Inc. (corporate mutual fund company) and Invesco Canada Fund Inc. (corporate mutual fund company); Director, Chairman and Chief Executive Officer, Invesco Canada Ltd. (formerly known as Invesco Trimark Ltd./Invesco Trimark Ltèe) (registered investment adviser and registered transfer agent); Trustee, President and Principal Executive Officer, The Invesco Funds (other than AIM Treasurer’s Series Trust (Invesco Treasurer’s Series Trust) and Short-Term Investments Trust); Trustee and Executive Vice President, The Invesco Funds (AIM Treasurer’s Series Trust (Invesco Treasurer’s Series Trust) and Short-Term Investments Trust only); Director, Invesco Investment Advisers LLC (formerly known as Van Kampen Asset Management); Director, Chief Executive Officer and President, Van Kampen Exchange Corp.
Formerly: Director and Chairman, Van Kampen Investor Services Inc.; Director, Chief Executive Officer and President, 1371 Preferred Inc. (holding company) and Van Kampen Investments Inc.; Director and President, AIM GP Canada Inc. (general partner for limited partnerships) and Van Kampen Advisors, Inc.; Director and Chief Executive Officer, Invesco Trimark Dealer Inc. (registered broker dealer); Director, Invesco Distributors, Inc. (formerly known as Invesco Aim Distributors, Inc.) (registered broker dealer); Manager, Invesco PowerShares Capital Management LLC; Director, Chief Executive Officer and President, Invesco Advisers, Inc.; Director, Chairman, Chief Executive Officer and President, Invesco Aim Capital Management, Inc.; President, Invesco Trimark Dealer Inc. and Invesco Trimark Ltd./Invesco Trimark Ltèe; Director and President, AIM Trimark Corporate Class Inc. and AIM Trimark Canada Fund Inc.; Senior Managing Director, Invesco Holding Company Limited; Director and Chairman, Fund Management Company (former registered broker dealer); President and Principal Executive Officer, The Invesco Funds (AIM Treasurer’s Series Trust (Invesco Treasurer’s Series Trust), and Short-Term Investments Trust only); President, AIM Trimark Global Fund Inc. and AIM Trimark Canada Fund Inc. | 141 | None | ||||
Wayne W. Whalen3 — 1939 Trustee | 2010 | Of Counsel, and prior to 2010, partner in the law firm of Skadden, Arps, Slate, Meagher & Flom LLP, legal counsel to certain funds in the Fund Complex
| 141 | Director of the Mutual fund Directors Forum, a nonprofit membership organization for investment directors; Chairman and Director of the Abraham Lincoln Presidential Library Foundation; and Director of the Stevenson Center for Democracy |
| 1 | Mr. Flanagan is considered an interested person (within the meaning of Section 2(a)(19) of the 1940 Act) of the Trust because he is an officer of the Adviser to the Trust, and an officer and a director of Invesco Ltd., ultimate parent of the Adviser. |
| 2 | Mr. Taylor is considered an interested person (within the meaning of Section 2(a)(19) of the 1940 Act) of the Trust because he is an officer and a director of the Adviser. |
| 3 | Mr. Whalen is retiring effective December 31, 2014. He has been deemed to be an interested person of the Trust because of his prior service as counsel to the predecessor funds of certain Invesco open-end funds and his affiliation with the law firm that served as counsel to such predecessor funds and the Invesco closed-end funds. |
T-1 Invesco Core Plus Bond Fund
Trustees and Officers—(continued)
Name, Year of Birth and Position(s) Held with the Trust | Trustee and/ or Officer Since | Principal Occupation(s) During Past 5 Years | Number of Funds in Fund Complex Overseen by Trustee | Other Directorship(s) Past 5 Years | ||||
| Independent Trustees | ||||||||
Bruce L. Crockett — 1944 Trustee and Chair | 2003 | Chairman, Crockett Technologies Associates (technology consulting company)
Formerly: Director, Captaris (unified messaging provider); Director, President and Chief Executive Officer, COMSAT Corporation; Chairman, Board of Governors of INTELSAT (international communications company); ACE Limited (insurance company); and Investment Company Institute | 141 | ALPS (Attorneys Liability Protection Society) (insurance company) | ||||
David C. Arch — 1945 Trustee | 2010 | Chairman of Blistex Inc., a consumer health care products manufacturer | 141 | Board member of the Illinois Manufacturers’ Association; Member of the Board of Visitors, Institute for the Humanities, University of Michigan; Member of the Audit Committee of the Edward-Elmhurst Hospital | ||||
Frank S. Bayley — 1939 Trustee | 2003 | Retired. Formerly: Director, Badgley Funds Inc. (registered investment company) (2 portfolios) and General Partner and Of Counsel, law firm of Baker & McKenzie, LLP | 141 | Director and Chairman, C.D. Stimson Company (a real estate investment company); Trustee, The Curtis Institute of Music | ||||
James T. Bunch — 1942 Trustee | 2000 | Managing Member, Grumman Hill Group LLC (family office private equity investments)
Formerly: Founder, Green Manning & Bunch Ltd. (investment banking firm) (1988-2010); Executive Committee, United States Golf Association; and Director, Policy Studies, Inc. and Van Gilder Insurance Corporation | 141 | Chairman, Board of Governors, Western Golf Association; Chairman, Evans Scholars Foundation; and Director, Denver Film Society | ||||
Rodney F. Dammeyer — 1940 Trustee | 2010 | Chairman of CAC, LLC, (private company offering capital investment and management advisory services)
Formerly: Prior to 2001, Managing Partner at Equity Group Corporate Investments; Prior to 1995, Chief Executive Officer of Itel Corporation (formerly Anixter International); Prior to 1985, experience includes Senior Vice President and Chief Financial Officer of Household International, Inc., Executive Vice President and Chief Financial Officer of Northwest Industries, Inc. and Partner of Arthur Andersen & Co.; From 1987 to 2010, Director/Trustee of investment companies in the Van Kampen Funds complex | 141 | Director of Quidel Corporation and Stericycle, Inc. | ||||
Albert R. Dowden — 1941 Trustee | 2003 | Director of a number of public and private business corporations, including the Boss Group, Ltd. (private investment and management); Nature’s Sunshine Products, Inc. and Reich & Tang Funds (5 portfolios) (registered investment company)
Formerly: Director, Homeowners of America Holding Corporation/Homeowners of America Insurance Company (property casualty company); Director, Continental Energy Services, LLC (oil and gas pipeline service); Director, CompuDyne Corporation (provider of product and services to the public security market) and Director, Annuity and Life Re (Holdings), Ltd. (reinsurance company); Director, President and Chief Executive Officer, Volvo Group North America, Inc.; Senior Vice President, AB Volvo; Director of various public and private corporations; Chairman, DHJ Media, Inc.; Director, Magellan Insurance Company; and Director, The Hertz Corporation, Genmar Corporation (boat manufacturer), National Media Corporation; Advisory Board of Rotary Power International (designer, manufacturer, and seller of rotary power engines); and Chairman, Cortland Trust, Inc. (registered investment company) | 141 | Director of: Nature’s Sunshine Products, Inc., Reich & Tang Funds, Homeowners of America Holding Corporation/ Homeowners of America Insurance Company, the Boss Group | ||||
Jack M. Fields — 1952 Trustee | 2003 | Chief Executive Officer, Twenty First Century Group, Inc. (government affairs company); Owner and Chief Executive Officer, Dos Angeles Ranch, L.P. (cattle, hunting, corporate entertainment); and Discovery Global Education Fund (non-profit)
Formerly: Chief Executive Officer, Texana Timber LP (sustainable forestry company); Director of Cross Timbers Quail Research Ranch (non-profit); and member of the U.S. House of Representatives | 141 | Insperity, Inc. (formerly known as Administaff) | ||||
Prema Mathai-Davis — 1950 Trustee | 2003 | Retired. Formerly: Chief Executive Officer, YWCA of the U.S.A. | 141 | None | ||||
Larry Soll — 1942 Trustee | 1997 | Retired. Formerly: Chairman, Chief Executive Officer and President, Synergen Corp. (a biotechnology company) | 141 | None | ||||
Hugo F. Sonnenschein — 1940 Trustee | 2010 | President Emeritus and Honorary Trustee of the University of Chicago and the Adam Smith Distinguished Service Professor in the Department of Economics at the University of Chicago. Prior to 2000, President of the University of Chicago | 141 | Trustee of the University of Rochester and a member of its investment committee; Member of the National Academy of Sciences and the American Philosophical Society; Fellow of the American Academy of Arts and Sciences |
T-2 Invesco Core Plus Bond Fund
Trustees and Officers—(continued)
Name, Year of Birth and Position(s) Held with the Trust | Trustee and/ or Officer Since | Principal Occupation(s) During Past 5 Years | Number of Funds in Fund Complex Overseen by Trustee | Other Directorship(s) Past 5 Years | ||||
| Independent Trustees—(continued) | ||||||||
Raymond Stickel, Jr. — 1944 Trustee | 2005 | Retired. Formerly: Director, Mainstay VP Series Funds, Inc. (25 portfolios) and Partner, Deloitte & Touche | 141 | None | ||||
Suzanne H. Woolsey — 1941 Trustee | 2014 | Chief Executive Officer of Woolsey Partners LLC | 141 | Emeritus Chair of the Board of Trustees of the Institute for Defense Analyses; Trustee of Colorado College; Trustee of California Institute of Technology; Prior to 2014, Director of Fluor Corp.; Prior to 2010, Trustee of the German Marshall Fund of the United States; Prior to 2010 Trustee of the Rocky Mountain Institute | ||||
| Other Officers | ||||||||
Russell C. Burk — 1958 Senior Vice President and Senior Officer | 2005 | Senior Vice President and Senior Officer, The Invesco Funds | N/A | N/A | ||||
John M. Zerr — 1962 Senior Vice President, Chief Legal Officer and Secretary | 2006 | Director, Senior Vice President, Secretary and General Counsel, Invesco Management Group, Inc. (formerly known as Invesco Aim Management Group, Inc.) and Van Kampen Exchange Corp.; Senior Vice President, Invesco Advisers, Inc. (formerly known as Invesco Institutional (N.A.), Inc.) (registered investment adviser); Senior Vice President and Secretary, Invesco Distributors, Inc. (formerly known as Invesco Aim Distributors, Inc.); Director, Vice President and Secretary, Invesco Investment Services, Inc. (formerly known as Invesco Aim Investment Services, Inc.) and IVZ Distributors, Inc. (formerly known as INVESCO Distributors, Inc.); Director and Vice President, INVESCO Funds Group, Inc.; Senior Vice President, Chief Legal Officer and Secretary, The Invesco Funds; Manager, Invesco PowerShares Capital Management LLC; Director, Secretary and General Counsel, Invesco Investment Advisers LLC (formerly known as Van Kampen Asset Management); Secretary and General Counsel, Invesco Capital Markets, Inc. (formerly known as Van Kampen Funds Inc.) and Chief Legal Officer, PowerShares Exchange-Traded Fund Trust, PowerShares Exchange-Traded Fund Trust II, PowerShares India Exchange-Traded Fund Trust and PowerShares Actively Managed Exchange-Traded Fund Trust
Formerly: Director and Vice President, Van Kampen Advisors Inc.; Director, Vice President, Secretary and General Counsel, Van Kampen Investor Services Inc.; Director, Invesco Distributors, Inc. (formerly known as Invesco Aim Distributors, Inc.); Director, Senior Vice President, General Counsel and Secretary, Invesco Aim Advisers, Inc. and Van Kampen Investments Inc.; Director, Vice President and Secretary, Fund Management Company; Director, Senior Vice President, Secretary, General Counsel and Vice President, Invesco Aim Capital Management, Inc.; Chief Operating Officer and General Counsel, Liberty Ridge Capital, Inc. (an investment adviser); Vice President and Secretary, PBHG Funds (an investment company) and PBHG Insurance Series Fund (an investment company); Chief Operating Officer, General Counsel and Secretary, Old Mutual Investment Partners (a broker-dealer); General Counsel and Secretary, Old Mutual Fund Services (an administrator) and Old Mutual Shareholder Services (a shareholder servicing center); Executive Vice President, General Counsel and Secretary, Old Mutual Capital, Inc. (an investment adviser); and Vice President and Secretary, Old Mutual Advisors Funds (an investment company) | N/A | N/A | ||||
Sheri Morris — 1964 Vice President, Treasurer and Principal Financial Officer | 2003 | Vice President, Treasurer and Principal Financial Officer, The Invesco Funds; Vice President, Invesco Advisers, Inc. (formerly known as Invesco Institutional (N.A.), Inc.) (registered investment adviser); and Vice President, PowerShares Exchange-Traded Fund Trust, PowerShares Exchange-Traded Fund Trust II, PowerShares India Exchange-Traded Fund Trust and PowerShares Actively Managed Exchange-Traded Fund Trust
Formerly: Vice President, Invesco Aim Advisers, Inc., Invesco Aim Capital Management, Inc. and Invesco Aim Private Asset Management, Inc.; Assistant Vice President and Assistant Treasurer, The Invesco Funds and Assistant Vice President, Invesco Advisers, Inc., Invesco Aim Capital Management, Inc. and Invesco Aim Private Asset Management, Inc.; and Treasurer, PowerShares Exchange-Traded Fund Trust, PowerShares Exchange-Traded Fund Trust II, PowerShares India Exchange-Traded Fund Trust and PowerShares Actively Managed Exchange-Traded Fund Trust | N/A | N/A | ||||
T-3 Invesco Core Plus Bond Fund
Trustees and Officers—(continued)
Name, Year of Birth and Position(s) Held with the Trust | Trustee and/ or Officer Since | Principal Occupation(s) During Past 5 Years | Number of Funds in Fund Complex Overseen by Trustee | Other Directorship(s) Past 5 Years | ||||
| Other Officers—(continued) | ||||||||
Karen Dunn Kelley — 1960 Vice President | 2003 | Senior Managing Director, Investments; Director, Co-President, Co-Chief Executive Officer, and Co-Chairman, Invesco Advisers, Inc. (formerly known as Invesco Institutional (N.A.), Inc.) (registered investment adviser); Chairman, Invesco Senior Secured Management, Inc.; Senior Vice President, Invesco Management Group, Inc. (formerly known as Invesco Aim Management Group, Inc.); Executive Vice President, Invesco Distributors, Inc. (formerly known as Invesco Aim Distributors, Inc.); Director, Invesco Mortgage Capital Inc. and Invesco Management Company Limited; Director and President, INVESCO Asset Management (Bermuda) Ltd., Vice President, The Invesco Funds (other than AIM Treasurer’s Series Trust (Invesco Treasurer’s Series Trust) and Short-Term Investments Trust); and President and Principal Executive Officer, The Invesco Funds (AIM Treasurer’s Series Trust (Invesco Treasurer’s Series Trust) and Short-Term Investments Trust only)
Formerly: Director, INVESCO Global Asset Management Limited and INVESCO Management S.A.; Senior Vice President, Van Kampen Investments Inc. and Invesco Advisers, Inc. (formerly known as Invesco Institutional (N.A.), Inc.) (registered investment adviser); Vice President, Invesco Advisers, Inc. (formerly known as Invesco Institutional (N.A.), Inc.); Director of Cash Management and Senior Vice President, Invesco Advisers, Inc. and Invesco Aim Capital Management, Inc.; Director and President, Fund Management Company; Chief Cash Management Officer, Director of Cash Management, Senior Vice President, and Managing Director, Invesco Aim Capital Management, Inc.; Director of Cash Management, Senior Vice President, and Vice President, Invesco Advisers, Inc. and The Invesco Funds (AIM Treasurer’s Series Trust (Invesco Treasurer’s Series Trust), and Short-Term Investments Trust only) | N/A | N/A | ||||
Crissie M. Wisdom — 1969 Anti-Money Laundering Compliance Officer | 2013 | Anti-Money Laundering Compliance Officer, Invesco Advisers, Inc. (formerly known as Invesco Institutional (N.A.), Inc.) (registered investment adviser), Invesco Capital Markets, Inc. (formerly known as Van Kampen Funds Inc.), Invesco Distributors, Inc., Invesco Investment Services, Inc., Invesco Management Group, Inc., Van Kampen Exchange Corp., The Invesco Funds, and PowerShares Exchange-Traded Fund Trust, PowerShares Exchange-Traded Fund Trust II, PowerShares India Exchange-Traded Fund Trust, and PowerShares Actively Managed Exchange-Traded Fund Trust; and Fraud Prevention Manager and Controls and Risk Analysis Manager for Invesco Investment Services, Inc. | N/A | N/A | ||||
Todd L. Spillane — 1958 Chief Compliance Officer | 2006 | Senior Vice President, Invesco Management Group, Inc. (formerly known as Invesco Aim Management Group, Inc.) and Van Kampen Exchange Corp.; Senior Vice President and Chief Compliance Officer, Invesco Advisers, Inc. (registered investment adviser) (formerly known as Invesco Institutional (N.A.), Inc.); Chief Compliance Officer, The Invesco Funds; Vice President, Invesco Distributors, Inc. (formerly known as Invesco Aim Distributors, Inc.) and Invesco Investment Services, Inc. (formerly known as Invesco Aim Investment Services, Inc.)
Formerly: Chief Compliance Officer, Invesco Funds (Chicago); Senior Vice President, Van Kampen Investments Inc.; Senior Vice President and Chief Compliance Officer, Invesco Aim Advisers, Inc. and Invesco Aim Capital Management, Inc.; Chief Compliance Officer, INVESCO Private Capital Investments, Inc. (holding company), Invesco Private Capital, Inc. (registered investment adviser), Invesco Global Asset Management (N.A.), Inc., Invesco Senior Secured Management, Inc. (registered investment adviser), Van Kampen Investor Services Inc., PowerShares Exchange-Traded Fund Trust, PowerShares Exchange-Traded Fund Trust II, PowerShares India Exchange-Traded Fund Trust and PowerShares Actively Managed Exchange-Traded Fund Trust; and Vice President, Invesco Aim Capital Management, Inc. and Fund Management Company | N/A | N/A |
The Statement of Additional Information of the Trust includes additional information about the Fund’s Trustees and is available upon request, without charge, by calling 1.800.959.4246. Please refer to the Fund’s prospectus for information on the Fund’s sub-advisers.
Office of the Fund 11 Greenway Plaza, Suite 1000 Houston, TX 77046-1173 | Investment Adviser Invesco Advisers, Inc. 1555 Peachtree Street, N.E. Atlanta, GA 30309 | Distributor Invesco Distributors, Inc. 11 Greenway Plaza, Suite 1000 Houston, TX 77046-1173 | Auditors PricewaterhouseCoopers LLP 1201 Louisiana Street, Suite 2900 Houston, TX 77002-5678 | |||
Counsel to the Fund Stradley Ronon Stevens & Young, LLP 2005 Market Street, Suite 2600 Philadelphia, PA 19103-7018 | Counsel to the Independent Trustees Goodwin Procter LLP 901 New York Avenue, N.W. Washington, D.C. 20001 | Transfer Agent Invesco Investment Services, Inc. 11 Greenway Plaza, Suite 1000 Houston, TX 77046-1173 | Custodian State Street Bank and Trust Company 225 Franklin Street Boston, MA 02110-2801 | |||
T-4 Invesco Core Plus Bond Fund

Invesco mailing information
Send general correspondence to Invesco Investment Services, Inc., P.O. Box 219078, Kansas City, MO 64121-9078.
Important notice regarding delivery of security holder documents
To reduce Fund expenses, only one copy of most shareholder documents may be mailed to shareholders with multiple accounts at the same address (Householding). Mailing of your shareholder documents may be householded indefinitely unless you instruct us otherwise. If you do not want the mailing of these documents to be combined with those for other members of your household, please contact Invesco Investment Services, Inc. at 800 959 4246 or contact your financial institution. We will begin sending you individual copies for each account within 30 days after receiving your request.
Fund holdings and proxy voting information
The Fund provides a complete list of its holdings four times in each fiscal year, at the quarter ends. For the second and fourth quarters, the lists appear in the Fund’s semiannual and annual reports to shareholders. For the first and third quarters, the Fund files the lists with the Securities and Exchange Commission (SEC) on Form N-Q. The most recent list of portfolio holdings is available at invesco.com/completeqtrholdings. Shareholders can also look up the Fund’s Forms N-Q on the SEC website at sec.gov. Copies of the Fund’s Forms N-Q may be reviewed and copied at the SEC Public Reference Room in Washington, D.C. You can obtain information on the operation of the Public Reference Room, including information about duplicating fee charges, by calling 202 551 8090 or 800 732 0330, or by electronic request at the following email address: publicinfo@sec.gov. The SEC file numbers for the Fund are shown below.
A description of the policies and procedures that the Fund uses to determine how to vote proxies relating to portfolio securities is available without charge, upon request, from our Client Services department at 800 959 4246 or at invesco.com/proxyguidelines. The information is also available on the SEC website, sec.gov.
Information regarding how the Fund voted proxies related to its portfolio securities during the most recent 12-month period ended June 30 is available at invesco.com/proxysearch. The information is also available on the SEC website, sec.gov. Invesco Advisers, Inc. is an investment adviser; it provides investment advisory services to individual and institutional clients and does not sell securities. Invesco Distributors, Inc. is the US distributor for Invesco Ltd.’s retail mutual funds, exchange-traded funds and institutional money market funds. Both are wholly owned, indirect subsidiaries of Invesco Ltd. |  |
| SEC file numbers: 811-09913 and 333-36074 | CPB-AR-1 | Invesco Distributors, Inc. |

Letters to Shareholders
Philip Taylor | Dear Shareholders: This annual report includes information about your Fund, including performance data and a complete list of its investments as of the close of the reporting period. Inside, your Fund’s portfolio managers discuss how they managed your Fund and the factors that affected its performance during the reporting period. I hope you find this report of interest. During the reporting period covered by this report, the US economy showed signs of continued improvement. After contracting in the first quarter of 2014, the economy expanded strongly in the second quarter and unemployment trended lower. Much of the credit for this improvement goes to the US Federal Reserve (the Fed), which undertook an extraordinary asset purchase program following the global financial crisis. The Fed’s goal was to jumpstart the economy by encouraging banks to lend more, businesses to hire more and consumers to spend more. Signs of a stronger |

US economy prompted the Fed to reduce, or “taper,” its asset purchase program. Despite this, interest rates remained near historical low levels due largely to heavy investor demand for bonds. While signs of economic improvement were evident in the US, European economies remained relatively stagnant. During the reporting period, high unemployment persisted, worries about potential deflation grew, and uncertainty about Russian-Ukrainian tensions weighed on European markets.
Extended periods of market strength can lull investors into complacency – just as prolonged periods of market weakness or volatility can discourage investors from initiating long-term investment plans. That’s why Invesco has always encouraged investors to work with a professional financial adviser who can stress the importance of starting to save and invest early and the importance of adhering to a disciplined investment plan – when times are good and when they’re uncertain. A financial adviser who knows your unique financial situation, investment goals and risk tolerance can be an invaluable partner as you seek to achieve your financial goals. He or she can offer a long-term perspective when markets are volatile and time-tested advice and guidance when your financial situation or investment goals change.
Timely information when and where you want it
Invesco’s efforts to help investors achieve their financial objectives include providing individual investors and financial professionals with timely information about the markets, the economy and investing – whenever and wherever they want it.
Our website, invesco.com/us, offers a wide range of market insights and investment perspectives. On the website, you’ll find detailed information about our funds, including prices, performance, holdings and portfolio manager commentaries. You can access information about your individual Invesco account whenever it’s convenient for you; just complete a simple, secure online registration. Use the “Login” box on our home page to get started.
Invesco’s mobile app for iPad® (available free from the App StoreSM) allows you to obtain the same detailed information about your Fund and the same investment insights from our investment leaders, market strategists, economists and retirement experts on the go. You also can watch portfolio manager videos and have instant access to Invesco news and updates wherever you may be.
In addition to the resources accessible on our website and through our mobile app, you can obtain timely updates to help you stay informed about the markets, the economy and investing by connecting with Invesco on Twitter, LinkedIn or Facebook. You can access our blog at blog.invesco.us.com or by clicking the “Intentional Investing Forum” link on our home page. Our goal is to provide you the information you want, when and where you want it.
Have questions?
For questions about your account, feel free to contact an Invesco client services representative at 800 959 4246. For Invesco-related questions or comments, please email me directly at phil@invesco.com.
All of us at Invesco look forward to serving your investment management needs for many years to come. Thank you for investing with us.
Sincerely,

Philip Taylor
Senior Managing Director, Invesco Ltd.
iPad is a trademark of Apple Inc., registered in the US and other countries. App Store is a service mark of Apple Inc. Invesco Distributors, Inc. is not affiliated with Apple Inc.
2 Invesco Equally-Weighted S&P 500 Fund
Bruce Crockett | Dear Fellow Shareholders: There are a variety of factors that can impact investment performance, many of which are uncontrollable by us as investors. These factors can include various economic trends and geopolitical developments. While the members of the Invesco Funds Board, which I chair, can’t dictate the performance of the Invesco funds, be assured that your Board works diligently throughout the year to focus on how your investments are managed. Our job is to represent you and your interests on a variety of fund management-related matters. We regularly monitor how the portfolio management teams of the Invesco funds are performing in light of ever-changing and often unpredictable economic and market conditions. We review the investment strategies and investment process employed by each fund’s management team as explained in the fund’s prospectus. | |
Perhaps our most significant responsibility is conducting the annual review of the funds’ |

advisory and sub-advisory contracts with Invesco Advisers and its affiliates. This annual review, which is required by the Investment Company Act of 1940, focuses on the nature and quality of the services Invesco provides as the adviser to the Invesco funds and the reasonableness of the fees that it charges for those services. Each year, we spend months carefully reviewing information from Invesco that allows us to evaluate the quality of its services and the reasonableness of its fees. We also use information from a variety of independent sources, including materials provided by the independent senior officer of the Invesco funds, who reports directly to the independent trustees on the Board. Additionally, we meet with legal counsel and review performance and fee data prepared for us by Lipper Inc., an independent, third-party firm widely recognized as a leader in its field.
After a careful review, the members of the Invesco Funds Board approved the continuation of advisory and sub-advisory contracts with Invesco Advisers and its affiliates. Be assured that your Board will continue working on behalf of fund shareholders, keeping your needs and interests uppermost in our minds.
As always, please contact me at bruce@brucecrockett.com with any questions or concerns you may have. On behalf of the Board, we look forward to continuing to represent your interests and serving your needs.
Sincerely,

Bruce L. Crockett
Independent Chair
Invesco Funds Board of Trustees
3 Invesco Equally-Weighted S&P 500 Fund
Management’s Discussion of Fund Performance
Performance summary
For the fiscal year ended August 31, 2014, Invesco Equally-Weighted S&P 500 Fund, at net asset value, performed in line with its broad market index, the S&P 500 Index, and outperformed its peer group index, the Lipper Multi-Cap Core Funds Index. The Fund seeks total return through growth of capital and current income. The consumer discretionary, energy, financials, health care, industrials and information technology (IT) sectors contributed the most to the Fund’s overall positive performance for the reporting period.
Your Fund’s long-term performance appears later in this report.
Fund vs. Indexes
Total returns, 8/31/13 to 8/31/14, at net asset value (NAV). Performance shown does not include applicable contingent deferred sales charges (CDSC) or front-end sales charges, which would have reduced performance.
Class A Shares | 25.64 | % | ||
Class B Shares | 24.70 | |||
Class C Shares | 24.73 | |||
Class R Shares | 25.35 | |||
Class Y Shares | 25.95 | |||
Class R6 Shares | 26.05 | |||
S&P 500 Indexq (Broad Market Index) | 25.25 | |||
S&P 500 Equal Weight Indexq (Style-Specific Index) | 26.47 | |||
Lipper Multi-Cap Core Funds Indexn (Peer Group Index) | 23.05 | |||
Source(s): qFactSet Research Systems, Inc.; ¢Lipper Inc.
How we invest
The Fund invests in a diversified portfolio of common stocks represented in the S&P 500 Index. The S&P 500 Index is a well-known stock market index that includes common stocks of 500 companies. The Fund generally invests in each stock included in the S&P 500 Index in approximately equal proportions. This approach differs from the S&P 500 Index because stocks in the S&P 500 Index are represented in proportion to their market value, or market capitalization. For example, the 50 largest companies in the S&P 500 Index represent approximately 50% of the S&P 500 Index’s value; however,
these same 50 companies represent roughly 10% of the Fund’s value. The Fund may invest in foreign securities represented in the S&P 500 Index, including depositary receipts. The sale of a security by the Fund is a function of Standard & Poor’s either adding a stock to the S&P 500 Index or deleting a stock from the index. Securities that are added to or deleted from the Fund are driven by changes to the S&P 500 Index, not by a stock selection model.
Market conditions and your Fund
US equity market indexes generally rose during the fiscal year ended August 31,
2014. Corporate earnings were resilient in the face of modest economic growth, driven by strong profitability across many sectors, and fundamentals for corporations and consumers remained relatively positive. However, the fiscal year began amid uncertainty created by a two-week federal government shutdown. Despite this and the announcement by the US Federal Reserve (the Fed) in December that it would begin reducing the scope of its asset purchase program in early 2014, US equities rallied through the end of 2013. The market turned volatile in the first months of 2014 as investors began to worry that stocks may have risen too far, too fast. While political upheaval in Ukraine and signs of economic sluggishness in the US and China contributed to investor uncertainty, economic data remained strong enough that the Fed continued to reduce its asset purchase program on schedule. The continued “good but not great” economic environment and historically low interest rates generally led stocks higher throughout the end of the fiscal year.
The Fund stayed true to its process by maintaining balanced exposure to all constituents of the S&P 500 Index. On an absolute basis, all sectors posted positive returns for the reporting period. Sectors that contributed most to overall Fund performance were the consumer discretionary, energy, financials, health care, industrials, and IT sectors. The telecommunication services sector contributed the least to the Fund’s overall positive performance.
One of our best performing stocks during the fiscal year was Forest Laboratories. The pharmaceutical company announced
Portfolio Composition
By sector
Consumer Discretionary | 17.2 | % | ||
Financials | 16.2 | |||
Information Technology | 12.8 | |||
Industrials | 12.5 | |||
Health Care | 11.1 | |||
Energy | 8.3 | |||
Consumer Staples | 7.8 | |||
Utilities | 6.1 | |||
Materials | 5.7 | |||
| Telecommunication Services | 1.2 | |||
| Money Market Funds | ||||
| Plus Other Assets Less Liabilities | 1.1 |
Top 10 Equity Holdings
1. | Gilead Sciences, Inc. | 0.3 | % | |||
2. | Tenet Healthcare Corp. | 0.3 | ||||
3. | Monster Beverage Corp. | 0.3 | ||||
4. | Vertex Pharmaceuticals Inc. | 0.2 | ||||
5. | Edwards Lifesciences Corp. | 0.2 | ||||
6. | Williams Cos., Inc. (The) | 0.2 | ||||
7. | PetSmart, Inc. | 0.2 | ||||
8. | Southwest Airlines Co. | 0.2 | ||||
9. | Frontier Communications Corp. | 0.2 | ||||
10. | Covidien PLC | 0.2 |
Total Net Assets | $ | 3.0 billion | ||
Total Number of Holdings* | 502 | |||
The Fund’s holdings are subject to change, and there is no assurance that the Fund will continue to hold any particular security.
*Excluding money market fund holdings.
4 Invesco Equally-Weighted S&P 500 Fund
in February, 2014 that it was being acquired by Actavis in a $25 billion deal.
Also contributing to the Fund’s positive performance was information technology company Micron Technology. The company announced strong revenue and earnings improvements toward the end of the fiscal year.
Several Fund holdings in the consumer staples sector struggled during the reporting period, including Whole Foods Market. The company delivered disappointing earnings during the fiscal year which caused a drop in its share price. Also lagging was retailer Coach.
The largest detractor from Fund performance for the reporting period was Avon Products.
During the reporting period, the Fund invested in S&P 500 futures contracts, a derivative instrument, to gain exposure to the equity market. These futures contracts added to the Fund’s performance.
We welcome new investors who joined the Fund during the fiscal year and thank all of our shareholders for your investment in Invesco Equally-Weighted S&P 500 Fund.
The views and opinions expressed in management’s discussion of Fund performance are those of Invesco Advisers, Inc. These views and opinions are subject to change at any time based on factors such as market and economic conditions. These views and opinions may not be relied upon as investment advice or recommendations, or as an offer for a particular security. The information is not a complete analysis of every aspect of any market, country, industry, security or the Fund. Statements of fact are from sources considered reliable, but Invesco Advisers, Inc. makes no representation or warranty as to their completeness or accuracy. Although historical performance is no guarantee of future results, these insights may help you understand our investment management philosophy.
See important Fund and, if applicable, index disclosures later in this report.
 | Anthony Munchak Chartered Financial Analyst, Portfolio Manager, is manager of Invesco Equally-Weighted S&P 500 | |
| Fund. He joined Invesco in 2000. Mr. Munchak earned a BS and an MS in finance from Boston College and an MBA from Bentley College. | ||
 | Glen Murphy Chartered Financial Analyst, Portfolio Manager, is manager of Invesco Equally- | |
| Fund. He joined Invesco in 1995. Mr. Murphy earned a BA in business administration from the University of Massachusetts Amherst and an MS in finance from Boston College. | ||
 | Francis Orlando Chartered Financial Analyst, Portfolio Manager, is manager of Invesco Equally- | |
| Fund. He joined Invesco in 1987. Mr. Orlando earned a BA in business administration from Merrimack College and an MBA from Boston University. | ||
 | Daniel Tsai Chartered Financial Analyst, Portfolio Manager, is manager of Invesco Equally- | |
| Fund. He joined Invesco in 2000. Mr. Tsai earned a BS in mechanical engineering from National Taiwan University, an MS in mechanical engineering from the University of Michigan and an MS in computer science from Wayne State University. | ||
 | Anne Unflat Portfolio Manager, is manager of Invesco Equally-Weighted S&P 500 Fund. She joined Invesco in | |
| 1988. Ms. Unflat earned a BA in economics from Queens College and an MBA in finance from St. John’s University. | ||
5 Invesco Equally-Weighted S&P 500 Fund
Your Fund’s Long-Term Performance
Results of a $10,000 Investment – Oldest Share Class(es)
Fund and index data from 8/31/04
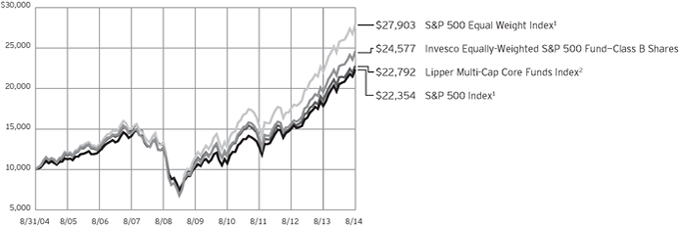
1 Source: FactSet Research Systems Inc.
2 Source: Lipper Inc.
Past performance cannot guarantee comparable future results.
The data shown in the chart include reinvested distributions, applicable sales charges and Fund expenses including management fees. Results for Class B shares are calculated as if a hypothetical
shareholder had liquidated his entire investment in the Fund at the close of the reporting period and paid the contingent deferred sales charges, if applicable. Index results include reinvested dividends, but they do not reflect sales charges. Performance of the peer group,
if applicable, reflects fund expenses and management fees; performance of a market index does not. Performance shown in the chart and table(s) does not reflect deduction of taxes a shareholder would pay on Fund distributions or sale of Fund shares.
continued from page 8
| n | Market risk. The prices of and the income generated by the Fund’s securities may decline in response to, among other things, investor sentiment, general economic and market conditions, regional or global instability, and currency and interest rate fluctuations. |
About indexes used in this report
| n | The S&P 500® Index is an unmanaged index considered representative of the US stock market. |
| n | The S&P 500® Equal Weight Index is the equally weighted version of the S&P 500 Index. |
| n | The Lipper Multi-Cap Core Funds Index is an unmanaged index considered representative of multicap core funds tracked by Lipper. |
| n | A direct investment cannot be made in an index. Unless otherwise indicated, index results include reinvested dividends, and they do not reflect sales charges. Performance of the peer group, if applicable, reflects fund expenses; performance of a market index does not. |
Other information
| n | The returns shown in management’s discussion of Fund performance are based on net asset values (NAVs) calculated for shareholder transactions. Generally accepted accounting principles require adjustments to be made to the net assets of the Fund at period end for financial reporting purposes, and as such, the NAVs for shareholder transactions |
and the returns based on those NAVs may differ from the NAVs and returns reported in the Financial Highlights. |
| n | Industry classifications used in this report are generally according to the Global Industry Classification Standard, which was developed by and is the exclusive property and a service mark of MSCI Inc. and Standard & Poor’s. |
6 Invesco Equally-Weighted S&P 500 Fund
Average Annual Total Returns
As of 8/31/14, including maximum applicable sales charges
Class A Shares | ||||
Inception (7/28/97) | 8.48 | % | ||
10 Years | 9.45 | |||
5 Years | 17.29 | |||
1 Year | 18.74 | |||
Class B Shares | ||||
Inception (12/1/87) | 11.44 | % | ||
10 Years | 9.41 | |||
5 Years | 17.52 | |||
1 Year | 19.70 | |||
Class C Shares | ||||
Inception (7/28/97) | 8.04 | % | ||
10 Years | 9.26 | |||
5 Years | 17.74 | |||
1 Year | 23.73 | |||
Class R Shares | ||||
Inception (3/31/08) | 11.04 | % | ||
5 Years | 18.32 | |||
1 Year | 25.35 | |||
Class Y Shares | ||||
Inception (7/28/97) | 9.11 | % | ||
10 Years | 10.34 | |||
5 Years | 18.91 | |||
1 Year | 25.95 | |||
Class R6 Shares | ||||
10 Years | 10.14 | % | ||
5 Years | 18.76 | |||
1 Year | 26.05 | |||
Average Annual Total Returns
As of 6/30/14, the most recent calendar quarter end, including maximum applicable sales charges
Class A Shares | ||||
Inception (7/28/97) | 8.46 | % | ||
10 Years | 8.74 | |||
5 Years | 20.26 | |||
1 Year | 19.53 | |||
Class B Shares | ||||
Inception (12/1/87) | 11.44 | % | ||
10 Years | 8.70 | |||
5 Years | 20.52 | |||
1 Year | 20.57 | |||
Class C Shares | ||||
Inception (7/28/97) | 8.02 | % | ||
10 Years | 8.55 | |||
5 Years | 20.72 | |||
1 Year | 24.58 | |||
Class R Shares | ||||
Inception (3/31/08) | 11.05 | % | ||
5 Years | 21.32 | |||
1 Year | 26.19 | |||
Class Y Shares | ||||
Inception (7/28/97) | 9.09 | % | ||
10 Years | 9.63 | |||
5 Years | 21.92 | |||
1 Year | 26.84 | |||
Class R6 Shares | ||||
10 Years | 9.41 | % | ||
5 Years | 21.75 | |||
1 Year | 26.86 | |||
Effective June 1, 2010, Class A, Class B, Class C, Class R, Class W and Class I shares of the predecessor fund, Morgan Stanley Equally-Weighted S&P 500 Fund, advised by Morgan Stanley Investment Advisors Inc. were reorganized into Class A, Class B, Class C, Class R, Class A and Class Y shares, respectively, of Invesco Equally-Weighted S&P 500 Fund. Returns shown above for Class A, Class B, Class C, Class R and Class Y shares are blended returns of the predecessor fund and Invesco Equally-Weighted S&P 500 Fund. Share class returns will differ from the predecessor fund because of different expenses.
Class R6 shares incepted on September 24, 2012. Performance shown prior to that date is that of the Fund’s and the predecessor fund’s Class A shares and includes the 12b-1 fees applicable to Class A shares. Class A share performance reflects any applicable fee waivers or expense reimbursements.
The performance data quoted represent past performance and cannot guarantee comparable future results; current performance may be lower or higher. Please visit invesco.com/performance for the most recent month-end performance. Performance figures reflect reinvested distributions, changes in net asset value and the effect of the maximum sales charge unless otherwise stated. Investment return and principal value will fluctuate so that you may have a gain or loss when you sell shares.
The total annual Fund operating expense ratio set forth in the most recent Fund prospectus as of the date of this report for Class A, Class B, Class C, Class R, Class Y and Class R6 shares was 0.57%, 1.32%, 1.32%, 0.82%, 0.32% and 0.28%, respectively. The expense ratios presented above may vary from the expense ratios presented in other sections of this report that are based on expenses incurred during the period covered by this report.
Class A share performance reflects the maximum 5.50% sales charge, and Class B and Class C share performance reflects the applicable contingent deferred sales charge (CDSC) for the period involved. The CDSC on Class B shares declines from 5% beginning at the time of purchase to 0% at the beginning of the seventh year. The CDSC on Class C shares is 1% for the first year after purchase. Class R, Class Y and Class R6 shares do not have a front-end sales charge or a CDSC; therefore, performance is at net asset value.
The performance of the Fund’s share classes will differ primarily due to different sales charge structures and class expenses.
7 Invesco Equally-Weighted S&P 500 Fund
Invesco Equally-Weighted S&P 500 Fund’s investment objective is total return through growth of capital and current income.
| n | Unless otherwise stated, information presented in this report is as of August 31, 2014, and is based on total net assets. |
| n | Unless otherwise noted, all data provided by Invesco. |
| n | To access your Fund’s reports/prospectus, visit invesco.com/fundreports. |
About share classes
| n | Class B shares may not be purchased for new or additional investments. Please see the prospectus for more information. |
| n | Class R shares are generally available only to employer sponsored retirement and benefit plans. Please see the prospectus for more information. |
| n | Class Y shares are available only to certain investors. Please see the prospectus for more information. |
| n | Class R6 shares are primarily intended for employer sponsored retirement and benefit plans that meet certain standards and for institutional investors. |
Principal risks of investing in the Fund
| n | Depositary receipts risk. Depositary receipts involve many of the same risks as those associated with direct investment in foreign securities. In addition, the underlying issuers of certain depositary receipts, particularly unsponsored or unregistered depositary receipts, are under no obligation to distribute shareholder communications to the holders of such receipts or to pass through to them any voting rights with respect to the deposited securities. |
| n | Derivatives risk. The value of a derivative instrument depends largely on (and is derived from) the value of an underlying security, currency, commodity, interest rate, index or other asset (each referred to as an underlying asset). In addition to risks relating to the underlying assets, the use of derivatives may include other, possibly greater, risks, including counterparty, leverage and liquidity risks. Counterparty risk is the risk that the counterparty to the derivative contract will default on its obligation to pay the Fund the amount owed or otherwise perform under the derivative contract. Derivatives create leverage risk because they do not require payment up front equal to the economic exposure |
created by owning the derivative. As a result, an adverse change in the value of the underlying asset could result in the Fund sustaining a loss that is substantially greater than the amount invested in the derivative, which may make the Fund’s returns more volatile and increase the risk of loss. Derivative instruments may also be less liquid than more traditional investments and the Fund may be unable to sell or close out its derivative positions at a desirable time or price. This risk may be more acute under adverse market conditions, during which the Fund may be most in need of liquidating its derivative positions. Derivatives may also be harder to value, less tax efficient and subject to changing government regulation that could impact the Fund’s ability to use certain derivatives or their cost. Also, derivatives used for hedging or to gain or limit exposure to a particular market segment may not provide the expected benefits, particularly during adverse market conditions. |
| n | Developing/emerging markets securities risk. The prices of securities issued by foreign companies and governments located in developing/emerging market countries may be affected more negatively by inflation, devaluation of their currencies, higher transaction costs, delays in settlement, adverse political developments, the introduction of capital controls, withholding taxes, nationalization of private assets, expropriation, social unrest, war or lack of timely information than those in developed countries. |
| n | Equity risk. Equity risk is the risk that the value of securities held by the Fund will fall due to general market and economic conditions, perceptions regarding the industries in which the issuers of securities held by the Fund participate or factors relating to specific companies in which the Fund invests, either directly or through derivative instruments. For example, an adverse event, such as an unfavorable earnings report, may |
depress the value of securities held by the Fund; the price of securities may be particularly sensitive to general movements in the stock market; or a drop in the stock market may depress the price of most or all of the securities held by the Fund. In addition, securities of an issuer in the Fund’s portfolio may decline in price if the issuer fails to make anticipated dividend payments because, among other reasons, the issuer of the security experiences a decline in its financial condition. |
| n | Foreign securities risk. The Fund’s foreign investments may be affected by changes in a foreign country’s exchange rates, political and social instability, changes in economic or taxation policies, difficulties when enforcing obligations, decreased liquidity, and increased volatility. Foreign companies may be subject to less regulation resulting in less publicly available information about the companies. |
| n | Indexing risk. The Fund is operated as a passively managed index fund. As such, the adverse performance of a particular stock ordinarily will not result in the elimination of the stock from the Fund’s portfolio. The Fund will remain invested in common stocks even when stock prices are generally falling. Ordinarily, the Adviser will not sell the Fund’s portfolio securities except to reflect additions or deletions of the stocks that comprise the S&P 500 Index, or as may be necessary to raise cash to pay Fund shareholders who sell Fund shares. The Fund’s ability to correlate its performance, before expenses, with the S&P 500 Index may be affected by, among other things, changes in securities markets, the manner in which the S&P 500 Index is calculated and the timing of purchases and sales, and also depends to some extent on the size of the Fund’s portfolio, the size of cash flows into and out of the Fund and differences between how and when the Fund and the Index are valued. |
| n | Management risk. The investment techniques and risk analysis used by the Fund’s portfolio managers may not produce the desired results. |
This report must be accompanied or preceded by a currently effective Fund prospectus, which contains more complete information, including sales charges and expenses. Investors should read it carefully before investing.
|
| NOT FDIC INSURED | MAY LOSE VALUE | NO BANK GUARANTEE |
continued on page 6
8 Invesco Equally-Weighted S&P 500 Fund
Schedule of Investments(a)
August 31, 2014
| Shares | Value | |||||||
Common Stocks & Other Equity Interests–98.93% |
| |||||||
| Advertising–0.39% | ||||||||
Interpublic Group of Cos., Inc. (The) | 289,845 | $ | 5,660,673 | |||||
Omnicom Group Inc. | 80,725 | 5,813,007 | ||||||
| 11,473,680 | ||||||||
| Aerospace & Defense–2.06% | ||||||||
Boeing Co. (The) | 42,855 | 5,434,014 | ||||||
General Dynamics Corp. | 47,585 | 5,864,851 | ||||||
Honeywell International Inc. | 60,459 | 5,757,511 | ||||||
L-3 Communications Holdings, Inc. | 45,152 | 4,964,462 | ||||||
Lockheed Martin Corp. | 34,560 | 6,013,440 | ||||||
Northrop Grumman Corp. | 46,931 | 5,970,562 | ||||||
Precision Castparts Corp. | 21,342 | 5,208,729 | ||||||
Raytheon Co. | 58,694 | 5,654,580 | ||||||
Rockwell Collins, Inc. | 71,428 | 5,498,527 | ||||||
Textron Inc. | 143,892 | 5,467,896 | ||||||
United Technologies Corp. | 48,542 | 5,241,565 | ||||||
| 61,076,137 | ||||||||
| Agricultural & Farm Machinery–0.18% | ||||||||
Deere & Co. | 62,664 | 5,269,416 | ||||||
| Agricultural Products–0.22% | ||||||||
Archer-Daniels-Midland Co. | 129,318 | 6,447,796 | ||||||
| Air Freight & Logistics–0.77% | ||||||||
C.H. Robinson Worldwide, Inc. | 91,426 | 6,240,739 | ||||||
Expeditors International of Washington, Inc. | 126,916 | 5,241,631 | ||||||
FedEx Corp. | 40,417 | 5,976,866 | ||||||
United Parcel Service, Inc.–Class B | 56,114 | 5,461,575 | ||||||
| 22,920,811 | ||||||||
| Airlines–0.43% | ||||||||
Delta Air Lines, Inc. | 144,479 | 5,718,479 | ||||||
Southwest Airlines Co. | 215,565 | 6,900,235 | ||||||
| 12,618,714 | ||||||||
| Aluminum–0.22% | ||||||||
Alcoa Inc. | 390,452 | 6,485,408 | ||||||
| Apparel Retail–1.08% | ||||||||
Gap, Inc. (The) | 137,940 | 6,365,931 | ||||||
L Brands, Inc. | 98,855 | 6,311,892 | ||||||
Ross Stores, Inc. | 84,466 | 6,370,426 | ||||||
TJX Cos., Inc. (The) | 103,474 | 6,168,085 | ||||||
Urban Outfitters, Inc.(b) | 169,133 | 6,729,802 | ||||||
| 31,946,136 | ||||||||
| Apparel, Accessories & Luxury Goods–1.35% | ||||||||
Coach, Inc. | 144,002 | 5,303,594 | ||||||
Fossil Group, Inc.(b) | 53,262 | 5,394,908 | ||||||
Michael Kors Holdings Ltd.(b) | 60,375 | 4,837,245 | ||||||
PVH Corp. | 48,663 | 5,680,919 | ||||||
| Shares | Value | |||||||
| Apparel, Accessories & Luxury Goods–(continued) | ||||||||
Ralph Lauren Corp. | 36,923 | $ | 6,247,371 | |||||
Under Armour, Inc.–Class A(b) | 98,580 | 6,738,929 | ||||||
VF Corp. | 91,975 | 5,897,437 | ||||||
| 40,100,403 | ||||||||
| Application Software–1.02% | ||||||||
Adobe Systems Inc.(b) | 84,845 | 6,100,355 | ||||||
Autodesk, Inc.(b) | 104,504 | 5,605,595 | ||||||
Citrix Systems, Inc.(b) | 89,042 | 6,256,091 | ||||||
Intuit Inc. | 71,773 | 5,970,078 | ||||||
salesforce.com, inc.(b) | 104,388 | 6,168,287 | ||||||
| 30,100,406 | ||||||||
| Asset Management & Custody Banks–2.04% | ||||||||
Affiliated Managers Group, Inc.(b) | 28,891 | 6,100,335 | ||||||
Ameriprise Financial, Inc. | 48,852 | 6,143,627 | ||||||
Bank of New York Mellon Corp. (The) | 160,332 | 6,281,808 | ||||||
BlackRock, Inc. | 18,320 | 6,055,310 | ||||||
Franklin Resources, Inc. | 101,948 | 5,762,101 | ||||||
Invesco Ltd.(c) | 152,238 | 6,217,400 | ||||||
Legg Mason, Inc. | 114,186 | 5,631,653 | ||||||
Northern Trust Corp. | 91,132 | 6,320,004 | ||||||
State Street Corp. | 85,562 | 6,163,031 | ||||||
T. Rowe Price Group Inc. | 69,272 | 5,610,686 | ||||||
| 60,285,955 | ||||||||
| Auto Parts & Equipment–0.57% | ||||||||
BorgWarner, Inc. | 87,060 | 5,414,262 | ||||||
Delphi Automotive PLC (United Kingdom) | 83,385 | 5,801,928 | ||||||
Johnson Controls, Inc. | 114,209 | 5,574,541 | ||||||
| 16,790,731 | ||||||||
| Automobile Manufacturers–0.39% | ||||||||
Ford Motor Co. | 342,352 | 5,960,348 | ||||||
General Motors Co. | 159,117 | 5,537,272 | ||||||
| 11,497,620 | ||||||||
| Automotive Retail–0.81% | ||||||||
AutoNation, Inc.(b) | 102,482 | 5,559,648 | ||||||
AutoZone, Inc.(b) | 10,837 | 5,839,409 | ||||||
CarMax, Inc.(b) | 128,294 | 6,722,606 | ||||||
O’Reilly Automotive, Inc.(b) | 37,911 | 5,913,358 | ||||||
| 24,035,021 | ||||||||
| Biotechnology–1.59% | ||||||||
Alexion Pharmaceuticals, Inc.(b) | 34,625 | 5,861,666 | ||||||
Amgen Inc. | 48,860 | 6,810,107 | ||||||
Biogen Idec Inc.(b) | 18,289 | 6,273,859 | ||||||
Celgene Corp.(b) | 70,870 | 6,734,067 | ||||||
Gilead Sciences, Inc.(b) | 70,234 | 7,555,774 | ||||||
Regeneron Pharmaceuticals, Inc.(b) | 18,510 | 6,488,125 | ||||||
Vertex Pharmaceuticals Inc.(b) | 77,144 | 7,218,364 | ||||||
| 46,941,962 | ||||||||
See accompanying Notes to Financial Statements which are an integral part of the financial statements.
9 Invesco Equally-Weighted S&P 500 Fund
| Shares | Value | |||||||
| Brewers–0.20% | ||||||||
Molson Coors Brewing Co.–Class B | 79,592 | $ | 5,885,828 | |||||
| Broadcasting–0.60% | ||||||||
CBS Corp.–Class B | 93,785 | 5,560,513 | ||||||
Discovery Communications, Inc.– | 72,946 | 3,189,199 | ||||||
Discovery Communications, Inc.– | 72,946 | 3,134,490 | ||||||
Scripps Networks Interactive Inc.–Class A | 73,257 | 5,839,315 | ||||||
| 17,723,517 | ||||||||
| Building Products–0.38% | ||||||||
Allegion PLC | 101,076 | 5,198,339 | ||||||
Masco Corp. | 259,467 | 6,089,690 | ||||||
| 11,288,029 | ||||||||
| Cable & Satellite–0.81% | ||||||||
Cablevision Systems Corp.–Class A | 333,100 | 6,165,681 | ||||||
Comcast Corp.–Class A | 108,049 | 5,913,522 | ||||||
DIRECTV(b) | 68,247 | 5,899,953 | ||||||
Time Warner Cable Inc. | 39,851 | 5,895,158 | ||||||
| 23,874,314 | ||||||||
| Casinos & Gaming–0.18% | ||||||||
Wynn Resorts Ltd. | 28,197 | 5,438,637 | ||||||
| Coal & Consumable Fuels–0.35% | ||||||||
CONSOL Energy Inc. | 123,005 | 4,954,641 | ||||||
Peabody Energy Corp. | 337,663 | 5,362,089 | ||||||
| 10,316,730 | ||||||||
| Commodity Chemicals–0.22% | ||||||||
LyondellBasell Industries N.V.–Class A | 57,288 | 6,550,883 | ||||||
| Communications Equipment–1.12% | ||||||||
Cisco Systems, Inc. | 229,529 | 5,735,930 | ||||||
F5 Networks, Inc.(b) | 50,483 | 6,269,484 | ||||||
Harris Corp. | 74,606 | 5,326,122 | ||||||
Juniper Networks, Inc. | 230,556 | 5,346,594 | ||||||
Motorola Solutions, Inc. | 84,896 | 5,042,822 | ||||||
QUALCOMM, Inc. | 71,663 | 5,453,554 | ||||||
| 33,174,506 | ||||||||
| Computer & Electronics Retail–0.43% | ||||||||
Best Buy Co., Inc. | 197,952 | 6,312,689 | ||||||
GameStop Corp. –Class A | 153,267 | 6,467,868 | ||||||
| 12,780,557 | ||||||||
| Construction & Engineering–0.58% | ||||||||
Fluor Corp. | 73,021 | 5,395,522 | ||||||
Jacobs Engineering Group, Inc.(b) | 103,568 | 5,583,351 | ||||||
Quanta Services, Inc.(b) | 167,188 | 6,075,612 | ||||||
| 17,054,485 | ||||||||
| Construction Machinery & Heavy Trucks–0.76% | ||||||||
Caterpillar Inc. | 53,098 | 5,791,399 | ||||||
Cummins Inc. | 36,334 | 5,272,427 | ||||||
| Shares | Value | |||||||
| Construction Machinery & Heavy Trucks–(continued) | ||||||||
Joy Global Inc. | 92,803 | $ | 5,860,509 | |||||
PACCAR Inc. | 89,577 | 5,626,331 | ||||||
| 22,550,666 | ||||||||
| Construction Materials–0.39% | ||||||||
Martin Marietta Materials, Inc. | 46,625 | 6,106,010 | ||||||
Vulcan Materials Co. | 87,557 | 5,549,363 | ||||||
| 11,655,373 | ||||||||
| Consumer Electronics–0.39% | ||||||||
Garmin Ltd. | 95,653 | 5,196,827 | ||||||
Harman International Industries, Inc. | 55,047 | 6,334,809 | ||||||
| 11,531,636 | ||||||||
| Consumer Finance–0.78% | ||||||||
American Express Co. | 59,771 | 5,352,493 | ||||||
Capital One Financial Corp. | 70,452 | 5,781,291 | ||||||
Discover Financial Services | 92,909 | 5,794,734 | ||||||
Navient Corp. | 340,093 | 6,101,269 | ||||||
| 23,029,787 | ||||||||
| Data Processing & Outsourced Services–2.17% | ||||||||
Alliance Data Systems Corp.(b) | 21,011 | 5,560,351 | ||||||
Automatic Data Processing, Inc. | 71,937 | 6,005,301 | ||||||
Computer Sciences Corp. | 89,591 | 5,356,646 | ||||||
Fidelity National Information Services, Inc. | 105,280 | 5,974,640 | ||||||
Fiserv, Inc.(b) | 94,631 | 6,100,861 | ||||||
MasterCard, Inc.–Class A | 74,655 | 5,659,595 | ||||||
Paychex, Inc. | 137,940 | 5,745,201 | ||||||
Total System Services, Inc. | 185,941 | 5,849,704 | ||||||
Visa Inc.–Class A | 26,831 | 5,702,124 | ||||||
Western Union Co. (The) | 352,353 | 6,155,607 | ||||||
Xerox Corp. | 449,593 | 6,208,879 | ||||||
| 64,318,909 | ||||||||
| Department Stores–0.62% | ||||||||
Kohl’s Corp. | 108,774 | 6,394,824 | ||||||
Macy’s, Inc. | 98,769 | 6,152,321 | ||||||
Nordstrom, Inc. | 83,508 | 5,782,929 | ||||||
| 18,330,074 | ||||||||
| Distillers & Vintners–0.39% | ||||||||
Brown-Forman Corp.–Class B | 60,543 | 5,609,914 | ||||||
Constellation Brands, Inc.–Class A(b) | 68,652 | 5,978,903 | ||||||
| 11,588,817 | ||||||||
| Distributors–0.20% | ||||||||
Genuine Parts Co. | 66,619 | 5,845,151 | ||||||
| Diversified Banks–1.18% | ||||||||
Bank of America Corp. | 367,187 | 5,908,039 | ||||||
Citigroup Inc. | 119,128 | 6,152,961 | ||||||
Comerica Inc. | 113,160 | 5,696,474 | ||||||
JPMorgan Chase & Co. | 99,392 | 5,908,855 | ||||||
U.S. Bancorp | 131,661 | 5,566,627 | ||||||
See accompanying Notes to Financial Statements which are an integral part of the financial statements.
10 Invesco Equally-Weighted S&P 500 Fund
| Shares | Value | |||||||
| Diversified Banks–(continued) | ||||||||
Wells Fargo & Co. | 109,236 | $ | 5,619,100 | |||||
| 34,852,056 | ||||||||
| Diversified Chemicals–0.72% | ||||||||
Dow Chemical Co. (The) | 108,193 | 5,793,735 | ||||||
E. I. du Pont de Nemours and Co. | 83,006 | 5,487,527 | ||||||
Eastman Chemical Co. | 63,814 | 5,262,741 | ||||||
FMC Corp. | 73,389 | 4,853,948 | ||||||
| 21,397,951 | ||||||||
| Diversified Metals & Mining–0.21% | ||||||||
Freeport-McMoRan Inc. | 166,893 | 6,069,898 | ||||||
| Diversified REIT’s–0.19% | ||||||||
Vornado Realty Trust | 54,251 | 5,743,553 | ||||||
| Diversified Support Services–0.42% | ||||||||
Cintas Corp. | 89,833 | 5,941,555 | ||||||
Iron Mountain Inc. | 182,882 | 6,580,094 | ||||||
| 12,521,649 | ||||||||
| Drug Retail–0.36% | ||||||||
CVS Caremark Corp. | 74,734 | 5,937,616 | ||||||
Walgreen Co. | 77,598 | 4,696,231 | ||||||
| 10,633,847 | ||||||||
| Education Services–0.20% | ||||||||
Graham Holdings Co.–Class B | 8,110 | 5,829,468 | ||||||
| Electric Utilities–2.53% | ||||||||
American Electric Power Co., Inc. | 107,414 | 5,768,132 | ||||||
Duke Energy Corp. | 80,041 | 5,922,234 | ||||||
Edison International | 103,285 | 6,108,275 | ||||||
Entergy Corp. | 72,498 | 5,612,070 | ||||||
Exelon Corp. | 158,716 | 5,304,289 | ||||||
FirstEnergy Corp. | 165,867 | 5,679,286 | ||||||
NextEra Energy, Inc. | 58,579 | 5,767,102 | ||||||
Northeast Utilities | 124,985 | 5,735,562 | ||||||
Pepco Holdings, Inc. | 207,213 | 5,710,790 | ||||||
Pinnacle West Capital Corp. | 104,562 | 5,954,806 | ||||||
PPL Corp. | 166,599 | 5,769,323 | ||||||
Southern Co. (The) | 130,239 | 5,782,612 | ||||||
Xcel Energy, Inc. | 184,729 | 5,920,564 | ||||||
| 75,035,045 | ||||||||
| Electrical Components & Equipment–0.73% | ||||||||
AMETEK, Inc. | 106,426 | 5,634,193 | ||||||
Eaton Corp. PLC | 75,430 | 5,265,768 | ||||||
Emerson Electric Co. | 85,292 | 5,460,394 | ||||||
Rockwell Automation, Inc. | 45,130 | 5,262,609 | ||||||
| 21,622,964 | ||||||||
| Electronic Components–0.39% | ||||||||
Amphenol Corp.–Class A | 58,555 | 6,031,750 | ||||||
Corning Inc. | 267,422 | 5,578,423 | ||||||
| 11,610,173 | ||||||||
| Shares | Value | |||||||
| Electronic Equipment & Instruments–0.18% | ||||||||
FLIR Systems, Inc. | 158,539 | $ | 5,357,033 | |||||
| Electronic Manufacturing Services–0.40% | ||||||||
Jabil Circuit, Inc. | 286,475 | 6,182,130 | ||||||
TE Connectivity Ltd. (Switzerland) | 92,244 | 5,781,854 | ||||||
| 11,963,984 | ||||||||
| Environmental & Facilities Services–0.60% | ||||||||
Republic Services, Inc. | 154,436 | 6,073,968 | ||||||
Stericycle, Inc.(b) | 47,854 | 5,687,448 | ||||||
Waste Management, Inc. | 128,848 | 6,051,990 | ||||||
| 17,813,406 | ||||||||
| Fertilizers & Agricultural Chemicals–0.58% | ||||||||
CF Industries Holdings, Inc. | 24,100 | 6,209,847 | ||||||
Monsanto Co. | 47,374 | 5,478,803 | ||||||
Mosaic Co. (The) | 116,701 | 5,573,640 | ||||||
| 17,262,290 | ||||||||
| Food Distributors–0.20% | ||||||||
Sysco Corp. | 153,516 | 5,807,510 | ||||||
| Food Retail–0.58% | ||||||||
Kroger Co. (The) | 120,240 | 6,129,835 | ||||||
Safeway Inc. | 166,305 | 5,784,088 | ||||||
Whole Foods Market, Inc. | 134,599 | 5,268,205 | ||||||
| 17,182,128 | ||||||||
| Footwear–0.20% | ||||||||
NIKE, Inc.–Class B | 75,976 | 5,967,915 | ||||||
| Gas Utilities–0.19% | ||||||||
AGL Resources Inc. | 107,110 | 5,710,034 | ||||||
| General Merchandise Stores–0.82% | ||||||||
Dollar General Corp.(b) | 93,415 | 5,977,626 | ||||||
Dollar Tree, Inc.(b) | 105,143 | 5,638,293 | ||||||
Family Dollar Stores, Inc. | 85,048 | 6,789,382 | ||||||
Target Corp. | 99,062 | 5,950,654 | ||||||
| 24,355,955 | ||||||||
| Gold–0.22% | ||||||||
Newmont Mining Corp. | 242,280 | 6,563,365 | ||||||
| Health Care Distributors–0.82% | ||||||||
AmerisourceBergen Corp. | 78,982 | 6,112,417 | ||||||
Cardinal Health, Inc. | 83,680 | 6,167,216 | ||||||
McKesson Corp. | 31,045 | 6,054,706 | ||||||
Patterson Cos. Inc. | 146,457 | 5,897,824 | ||||||
| 24,232,163 | ||||||||
| Health Care Equipment–2.86% | ||||||||
Abbott Laboratories | 142,481 | 6,018,397 | ||||||
Baxter International Inc. | 77,535 | 5,813,574 | ||||||
Becton, Dickinson and Co. | 48,191 | 5,646,539 | ||||||
Boston Scientific Corp.(b) | 442,919 | 5,616,213 | ||||||
C.R. Bard, Inc. | 41,255 | 6,123,892 | ||||||
CareFusion Corp.(b) | 132,709 | 6,092,670 | ||||||
See accompanying Notes to Financial Statements which are an integral part of the financial statements.
11 Invesco Equally-Weighted S&P 500 Fund
| Shares | Value | |||||||
| Health Care Equipment–(continued) | ||||||||
Covidien PLC | 78,719 | $ | 6,835,171 | |||||
Edwards Lifesciences Corp.(b) | 72,350 | 7,181,461 | ||||||
Intuitive Surgical, Inc.(b) | 14,286 | 6,714,563 | ||||||
Medtronic, Inc. | 93,399 | 5,963,526 | ||||||
St. Jude Medical, Inc. | 87,100 | 5,712,889 | ||||||
Stryker Corp. | 67,944 | 5,660,415 | ||||||
Varian Medical Systems, Inc.(b) | 69,281 | 5,890,271 | ||||||
Zimmer Holdings, Inc. | 53,696 | 5,332,550 | ||||||
| 84,602,131 | ||||||||
| Health Care Facilities–0.25% | ||||||||
Tenet Healthcare Corp.(b) | 120,701 | 7,384,487 | ||||||
| Health Care REIT’s–0.60% | ||||||||
HCP, Inc. | 136,643 | 5,920,741 | ||||||
Health Care REIT, Inc. | 89,747 | 6,065,102 | ||||||
Ventas, Inc. | 89,084 | 5,859,946 | ||||||
| 17,845,789 | ||||||||
| Health Care Services–0.81% | ||||||||
DaVita HealthCare Partners Inc.(b) | 80,087 | 5,980,897 | ||||||
Express Scripts Holding Co.(b) | 79,192 | 5,854,665 | ||||||
Laboratory Corp. of America Holdings(b) | 55,706 | 5,973,354 | ||||||
Quest Diagnostics Inc. | 95,750 | 6,052,358 | ||||||
| 23,861,274 | ||||||||
| Health Care Supplies–0.19% | ||||||||
DENTSPLY International Inc. | 118,605 | 5,658,052 | ||||||
| Health Care Technology–0.21% | ||||||||
Cerner Corp.(b) | 107,069 | 6,173,599 | ||||||
| Home Entertainment Software–0.20% | ||||||||
Electronic Arts Inc.(b) | 158,894 | 6,012,549 | ||||||
| Home Furnishings–0.41% | ||||||||
Leggett & Platt, Inc. | 169,386 | 5,943,755 | ||||||
Mohawk Industries, Inc.(b) | 42,893 | 6,263,236 | ||||||
| 12,206,991 | ||||||||
| Home Improvement Retail–0.45% | ||||||||
Home Depot, Inc. (The) | 72,619 | 6,789,877 | ||||||
Lowe’s Cos., Inc. | 124,738 | 6,549,992 | ||||||
| 13,339,869 | ||||||||
| Homebuilding–0.55% | ||||||||
D.R. Horton, Inc. | 241,867 | 5,243,677 | ||||||
Lennar Corp.–Class A | 141,098 | 5,528,220 | ||||||
PulteGroup Inc. | 291,934 | 5,610,971 | ||||||
| 16,382,868 | ||||||||
| Homefurnishing Retail–0.20% | ||||||||
Bed Bath & Beyond Inc.(b) | 94,128 | 6,048,665 | ||||||
| Hotel and Resort REIT’s–0.20% | ||||||||
Host Hotels & Resorts Inc. | 255,491 | 5,830,305 | ||||||
| Shares | Value | |||||||
| Hotels, Resorts & Cruise Lines–0.82% | ||||||||
Carnival Corp. | 145,667 | $ | 5,517,866 | |||||
Marriott International Inc.–Class A | 92,364 | 6,410,062 | ||||||
Starwood Hotels & Resorts Worldwide, Inc. | 71,708 | 6,062,194 | ||||||
Wyndham Worldwide Corp. | 78,230 | 6,331,936 | ||||||
| 24,322,058 | ||||||||
| Household Appliances–0.21% | ||||||||
Whirlpool Corp. | 41,013 | 6,275,809 | ||||||
| Household Products–0.76% | ||||||||
Clorox Co. (The) | 62,943 | 5,576,750 | ||||||
Colgate-Palmolive Co. | 83,545 | 5,407,868 | ||||||
Kimberly-Clark Corp. | 51,231 | 5,532,948 | ||||||
Procter & Gamble Co. (The) | 71,186 | 5,916,268 | ||||||
| 22,433,834 | ||||||||
| Housewares & Specialties–0.21% | ||||||||
Newell Rubbermaid Inc. | 185,333 | 6,212,362 | ||||||
| Human Resource & Employment Services–0.20% | ||||||||
Robert Half International, Inc. | 119,656 | 6,007,928 | ||||||
| Hypermarkets & Super Centers–0.39% | ||||||||
Costco Wholesale Corp. | 49,169 | 5,953,383 | ||||||
Wal-Mart Stores, Inc. | 75,310 | 5,685,905 | ||||||
| 11,639,288 | ||||||||
| Independent Power Producers & Energy Traders–0.37% | ||||||||
AES Corp. (The) | 399,251 | 6,060,630 | ||||||
NRG Energy, Inc. | 154,436 | 4,753,540 | ||||||
| 10,814,170 | ||||||||
| Industrial Conglomerates–0.76% | ||||||||
3M Co. | 39,545 | 5,694,480 | ||||||
Danaher Corp. | 70,627 | 5,410,734 | ||||||
General Electric Co. | 209,665 | 5,447,097 | ||||||
Roper Industries, Inc. | 38,785 | 5,839,470 | ||||||
| 22,391,781 | ||||||||
| Industrial Gases–0.60% | ||||||||
Air Products and Chemicals, Inc. | 46,803 | 6,234,627 | ||||||
Airgas, Inc. | 53,428 | 5,897,383 | ||||||
Praxair, Inc. | 43,102 | 5,670,068 | ||||||
| 17,802,078 | ||||||||
| Industrial Machinery–1.88% | ||||||||
Dover Corp. | 63,592 | 5,587,829 | ||||||
Flowserve Corp. | 73,370 | 5,568,049 | ||||||
Illinois Tool Works Inc. | 64,292 | 5,671,197 | ||||||
Ingersoll-Rand PLC | 91,000 | 5,478,200 | ||||||
Pall Corp. | 67,483 | 5,693,541 | ||||||
Parker Hannifin Corp. | 44,580 | 5,148,990 | ||||||
Pentair PLC (United Kingdom) | 75,410 | 5,133,159 | ||||||
Snap-on Inc. | 48,530 | 6,063,823 | ||||||
Stanley Black & Decker Inc. | 65,037 | 5,950,886 | ||||||
Xylem, Inc. | 146,875 | 5,472,563 | ||||||
| 55,768,237 | ||||||||
See accompanying Notes to Financial Statements which are an integral part of the financial statements.
12 Invesco Equally-Weighted S&P 500 Fund
| Shares | Value | |||||||
| Industrial REIT’s–0.19% | ||||||||
Prologis, Inc. | 138,580 | $ | 5,673,465 | |||||
| Insurance Brokers–0.39% | ||||||||
Aon PLC | 63,041 | 5,494,653 | ||||||
Marsh & McLennan Cos., Inc. | 111,557 | 5,923,677 | ||||||
| 11,418,330 | ||||||||
| Integrated Oil & Gas–0.77% | ||||||||
Chevron Corp. | 44,548 | 5,766,739 | ||||||
Exxon Mobil Corp. | 55,229 | 5,493,076 | ||||||
Hess Corp. | 59,085 | 5,973,493 | ||||||
Occidental Petroleum Corp. | 54,919 | 5,696,748 | ||||||
| 22,930,056 | ||||||||
| Integrated Telecommunication Services–1.05% | ||||||||
AT&T Inc. | 161,843 | 5,658,031 | ||||||
CenturyLink Inc. | 153,433 | 6,289,219 | ||||||
Frontier Communications Corp. | 1,005,208 | 6,835,415 | ||||||
Verizon Communications Inc. | 115,277 | 5,743,100 | ||||||
Windstream Holdings Inc. | 578,507 | 6,537,129 | ||||||
| 31,062,894 | ||||||||
| Internet Retail–1.02% | ||||||||
Amazon.com, Inc.(b) | 17,376 | 5,891,159 | ||||||
Expedia, Inc. | 76,344 | 6,557,950 | ||||||
Netflix Inc.(b) | 13,255 | 6,331,118 | ||||||
Priceline Group Inc. (The)(b) | 4,766 | 5,930,382 | ||||||
TripAdvisor Inc.(b) | 55,592 | 5,508,611 | ||||||
| 30,219,220 | ||||||||
| Internet Software & Services–1.25% | ||||||||
Akamai Technologies, Inc.(b) | 96,352 | 5,821,588 | ||||||
eBay Inc.(b) | 115,606 | 6,416,133 | ||||||
Facebook Inc.–Class A(b) | 87,897 | 6,576,454 | ||||||
Google Inc.–Class A(b) | 5,097 | 2,968,289 | ||||||
Google Inc.–Class C(b) | 5,097 | 2,913,445 | ||||||
VeriSign, Inc.(b) | 111,579 | 6,368,371 | ||||||
Yahoo! Inc.(b) | 153,475 | 5,910,322 | ||||||
| 36,974,602 | ||||||||
| Investment Banking & Brokerage–0.84% | ||||||||
Charles Schwab Corp. (The) | 217,969 | 6,214,296 | ||||||
E*TRADE Financial Corp.(b) | 281,078 | 6,256,796 | ||||||
Goldman Sachs Group, Inc. (The) | 34,175 | 6,121,084 | ||||||
Morgan Stanley | 179,466 | 6,157,479 | ||||||
| 24,749,655 | ||||||||
| IT Consulting & Other Services–0.78% | ||||||||
Accenture PLC–Class A | 68,527 | 5,554,799 | ||||||
Cognizant Technology Solutions Corp.–Class A(b) | 119,581 | 5,468,439 | ||||||
International Business Machines Corp. | 31,054 | 5,971,684 | ||||||
Teradata Corp.(b) | 130,569 | 5,963,086 | ||||||
| 22,958,008 | ||||||||
| Shares | Value | |||||||
| Leisure Products–0.36% | ||||||||
Hasbro, Inc. | 108,214 | $ | 5,698,008 | |||||
Mattel, Inc. | 147,371 | 5,082,826 | ||||||
| 10,780,834 | ||||||||
| Life & Health Insurance–1.39% | ||||||||
Aflac, Inc. | 91,500 | 5,603,460 | ||||||
Lincoln National Corp. | 112,153 | 6,172,901 | ||||||
MetLife, Inc. | 104,082 | 5,697,449 | ||||||
Principal Financial Group, Inc. | 116,294 | 6,313,601 | ||||||
Prudential Financial, Inc. | 64,321 | 5,769,594 | ||||||
Torchmark Corp. | 104,395 | 5,694,747 | ||||||
Unum Group | 162,539 | 5,895,290 | ||||||
| 41,147,042 | ||||||||
| Life Sciences Tools & Services–0.75% | ||||||||
Agilent Technologies, Inc. | 96,912 | 5,539,490 | ||||||
PerkinElmer, Inc. | 122,157 | 5,478,742 | ||||||
Thermo Fisher Scientific, Inc. | 47,577 | 5,719,231 | ||||||
Waters Corp.(b) | 54,049 | 5,590,288 | ||||||
| 22,327,751 | ||||||||
| Managed Health Care–1.01% | ||||||||
Aetna Inc. | 70,043 | 5,752,631 | ||||||
Cigna Corp. | 62,286 | 5,892,256 | ||||||
Humana Inc. | 45,478 | 5,854,838 | ||||||
UnitedHealth Group Inc. | 71,600 | 6,206,288 | ||||||
WellPoint, Inc. | 53,043 | 6,180,040 | ||||||
| 29,886,053 | ||||||||
| Metal & Glass Containers–0.38% | ||||||||
Ball Corp. | 93,138 | 5,970,146 | ||||||
Owens-Illinois, Inc.(b) | 170,353 | 5,245,169 | ||||||
| 11,215,315 | ||||||||
| Motorcycle Manufacturers–0.18% | ||||||||
Harley-Davidson, Inc. | 82,057 | 5,215,543 | ||||||
| Movies & Entertainment–0.80% | ||||||||
Time Warner Inc. | 83,569 | 6,437,320 | ||||||
Twenty-First Century Fox, Inc.–Class A | 159,610 | 5,653,386 | ||||||
Viacom Inc.–Class B | 65,991 | 5,355,170 | ||||||
Walt Disney Co. (The) | 68,469 | 6,153,994 | ||||||
| 23,599,870 | ||||||||
| Multi-Line Insurance–0.93% | ||||||||
American International Group, Inc. | 103,644 | 5,810,283 | ||||||
Assurant, Inc. | 83,953 | 5,603,863 | ||||||
Genworth Financial Inc.–Class A(b) | 325,264 | 4,615,496 | ||||||
Hartford Financial Services Group, Inc. (The) | 158,672 | 5,878,797 | ||||||
Loews Corp. | 130,269 | 5,697,966 | ||||||
| 27,606,405 | ||||||||
| Multi-Sector Holdings–0.39% | ||||||||
Berkshire Hathaway Inc.–Class B(b) | 44,802 | 6,149,075 | ||||||
Leucadia National Corp. | 219,999 | 5,484,575 | ||||||
| 11,633,650 | ||||||||
See accompanying Notes to Financial Statements which are an integral part of the financial statements.
13 Invesco Equally-Weighted S&P 500 Fund
| Shares | Value | |||||||
| Multi-Utilities–2.79% | ||||||||
Ameren Corp. | 147,639 | $ | 5,904,084 | |||||
CenterPoint Energy, Inc. | 236,125 | 5,865,345 | ||||||
CMS Energy Corp. | 191,791 | 5,857,297 | ||||||
Consolidated Edison, Inc. | 102,668 | 5,943,451 | ||||||
Dominion Resources, Inc. | 82,837 | 5,816,814 | ||||||
DTE Energy Co. | 76,129 | 5,957,094 | ||||||
Integrys Energy Group, Inc. | 98,255 | 6,670,532 | ||||||
NiSource Inc. | 152,443 | 6,047,414 | ||||||
PG&E Corp. | 121,790 | 5,660,799 | ||||||
Public Service Enterprise Group Inc. | 149,824 | 5,601,919 | ||||||
SCANA Corp. | 111,843 | 5,809,126 | ||||||
Sempra Energy | 56,065 | 5,941,208 | ||||||
TECO Energy, Inc. | 326,013 | 5,900,835 | ||||||
Wisconsin Energy Corp. | 125,789 | 5,702,015 | ||||||
| 82,677,933 | ||||||||
| Office REIT’s–0.20% | ||||||||
Boston Properties, Inc. | 48,534 | 5,892,998 | ||||||
| Office Services & Supplies–0.19% | ||||||||
Pitney Bowes Inc. | 206,383 | 5,584,724 | ||||||
| Oil & Gas Drilling–1.07% | ||||||||
Diamond Offshore Drilling, Inc. | 114,324 | 5,023,396 | ||||||
Ensco PLC –Class A | 106,386 | 5,370,365 | ||||||
Helmerich & Payne, Inc. | 50,135 | 5,266,682 | ||||||
Nabors Industries Ltd. | 206,158 | 5,609,559 | ||||||
Noble Corp. PLC | 195,634 | 5,567,744 | ||||||
Transocean Ltd. | 127,889 | 4,942,910 | ||||||
| 31,780,656 | ||||||||
| Oil & Gas Equipment & Services–1.21% | ||||||||
Baker Hughes Inc. | 79,681 | 5,509,144 | ||||||
Cameron International Corp.(b) | 87,100 | 6,474,143 | ||||||
FMC Technologies, Inc.(b) | 96,335 | 5,957,356 | ||||||
Halliburton Co. | 83,891 | 5,671,871 | ||||||
National Oilwell Varco Inc. | 73,115 | 6,319,330 | ||||||
Schlumberger Ltd. | 52,372 | 5,742,066 | ||||||
| 35,673,910 | ||||||||
| Oil & Gas Exploration & Production–3.40% | ||||||||
Anadarko Petroleum Corp. | 51,835 | 5,841,286 | ||||||
Apache Corp. | 58,051 | 5,911,333 | ||||||
Cabot Oil & Gas Corp. | 163,523 | 5,484,561 | ||||||
Chesapeake Energy Corp. | 196,710 | 5,350,512 | ||||||
Cimarex Energy Co. | 40,821 | 5,925,576 | ||||||
ConocoPhillips | 68,239 | 5,542,372 | ||||||
Denbury Resources Inc. | 320,665 | 5,521,851 | ||||||
Devon Energy Corp. | 72,647 | 5,479,037 | ||||||
EOG Resources, Inc. | 49,721 | 5,463,343 | ||||||
EQT Corp. | 53,559 | 5,305,555 | ||||||
Marathon Oil Corp. | 145,071 | 6,048,010 | ||||||
Murphy Oil Corp. | 86,846 | 5,425,270 | ||||||
Newfield Exploration Co.(b) | 140,156 | 6,281,792 | ||||||
Noble Energy, Inc. | 74,411 | 5,368,010 | ||||||
| Shares | Value | |||||||
| Oil & Gas Exploration & Production–(continued) | ||||||||
Pioneer Natural Resources Co. | 24,980 | $ | 5,212,077 | |||||
QEP Resources Inc. | 175,359 | 6,237,520 | ||||||
Range Resources Corp. | 64,285 | 5,052,158 | ||||||
Southwestern Energy Co.(b) | 123,757 | 5,096,313 | ||||||
| 100,546,576 | ||||||||
| Oil & Gas Refining & Marketing–0.81% | ||||||||
Marathon Petroleum Corp. | 65,601 | 5,970,347 | ||||||
Phillips 66 | 67,903 | 5,908,919 | ||||||
Tesoro Corp. | 98,119 | 6,352,224 | ||||||
Valero Energy Corp. | 105,495 | 5,711,499 | ||||||
| 23,942,989 | ||||||||
| Oil & Gas Storage & Transportation–0.86% | ||||||||
Kinder Morgan Inc. | 161,107 | 6,486,168 | ||||||
ONEOK, Inc. | 87,020 | 6,108,804 | ||||||
Spectra Energy Corp. | 137,705 | 5,736,790 | ||||||
Williams Cos., Inc. (The) | 120,164 | 7,142,548 | ||||||
| 25,474,310 | ||||||||
| Packaged Foods & Meats–2.51% | ||||||||
Campbell Soup Co. | 125,095 | 5,606,758 | ||||||
ConAgra Foods, Inc. | 174,441 | 5,617,000 | ||||||
General Mills, Inc. | 104,388 | 5,572,231 | ||||||
Hershey Co. (The) | 58,063 | 5,308,120 | ||||||
Hormel Foods Corp. | 117,767 | 5,968,432 | ||||||
JM Smucker Co. (The) | 53,870 | 5,527,062 | ||||||
Kellogg Co. | 84,353 | 5,480,414 | ||||||
Keurig Green Mountain Inc. | 47,323 | 6,309,102 | ||||||
Kraft Foods Group, Inc. | 96,074 | 5,658,759 | ||||||
McCormick & Co., Inc. | 79,059 | 5,509,622 | ||||||
Mead Johnson Nutrition Co. | 64,829 | 6,197,652 | ||||||
Mondelez International Inc.–Class A | 151,385 | 5,478,623 | ||||||
Tyson Foods, Inc.–Class A | 160,016 | 6,090,209 | ||||||
| 74,323,984 | ||||||||
| Paper Packaging–0.77% | ||||||||
Avery Dennison Corp. | 113,979 | 5,485,810 | ||||||
Bemis Co., Inc. | 138,546 | 5,644,364 | ||||||
MeadWestvaco Corp. | 130,901 | 5,628,743 | ||||||
Sealed Air Corp. | 170,302 | 6,147,902 | ||||||
| 22,906,819 | ||||||||
| Paper Products–0.20% | ||||||||
International Paper Co. | 119,604 | 5,794,814 | ||||||
| Personal Products–0.38% | ||||||||
Avon Products, Inc. | 385,934 | 5,418,513 | ||||||
Estee Lauder Cos. Inc. (The)–Class A | 74,119 | 5,694,563 | ||||||
| 11,113,076 | ||||||||
| Pharmaceuticals–2.59% | ||||||||
AbbVie Inc. | 104,677 | 5,786,545 | ||||||
Actavis PLC(b) | 27,125 | 6,156,832 | ||||||
Allergan, Inc. | 35,041 | 5,735,511 | ||||||
Bristol-Myers Squibb Co. | 120,393 | 6,097,905 | ||||||
See accompanying Notes to Financial Statements which are an integral part of the financial statements.
14 Invesco Equally-Weighted S&P 500 Fund
| Shares | Value | |||||||
| Pharmaceuticals–(continued) | ||||||||
Eli Lilly and Co. | 96,253 | $ | 6,117,841 | |||||
Hospira, Inc.(b) | 111,601 | 5,997,438 | ||||||
Johnson & Johnson | 55,294 | 5,735,647 | ||||||
Mallinckrodt PLC(b) | 71,571 | 5,832,321 | ||||||
Merck & Co., Inc. | 97,344 | 5,851,348 | ||||||
Mylan Inc.(b) | 112,935 | 5,488,641 | ||||||
Perrigo Co. PLC | 40,382 | 6,006,419 | ||||||
Pfizer Inc. | 191,986 | 5,642,468 | ||||||
Zoetis Inc. | 176,505 | 6,255,337 | ||||||
| 76,704,253 | ||||||||
| Property & Casualty Insurance–1.35% | ||||||||
ACE Ltd. | 54,564 | 5,801,790 | ||||||
Allstate Corp. (The) | 96,074 | 5,907,590 | ||||||
Chubb Corp. (The) | 60,634 | 5,575,296 | ||||||
Cincinnati Financial Corp. | 115,961 | 5,576,565 | ||||||
Progressive Corp. (The) | 224,174 | 5,608,834 | ||||||
Travelers Cos., Inc. (The) | 59,420 | 5,627,668 | ||||||
XL Group PLC | 172,793 | 5,906,065 | ||||||
| 40,003,808 | ||||||||
| Publishing–0.42% | ||||||||
Gannett Co., Inc. | 197,332 | 6,661,928 | ||||||
News Corp.–Class A(b) | 329,040 | 5,799,330 | ||||||
| 12,461,258 | ||||||||
| Railroads–0.81% | ||||||||
CSX Corp. | 186,799 | 5,773,957 | ||||||
Kansas City Southern | 54,189 | 6,251,243 | ||||||
Norfolk Southern Corp. | 56,042 | 5,996,494 | ||||||
Union Pacific Corp. | 56,187 | 5,914,806 | ||||||
| 23,936,500 | ||||||||
| Real Estate Services–0.20% | ||||||||
CBRE Group, Inc.–Class A(b) | 185,637 | 5,899,544 | ||||||
| Regional Banks–1.68% | ||||||||
BB&T Corp. | 147,678 | 5,512,820 | ||||||
Fifth Third Bancorp | 265,295 | 5,413,345 | ||||||
Huntington Bancshares Inc. | 600,569 | 5,912,602 | ||||||
KeyCorp | 398,409 | 5,422,347 | ||||||
M&T Bank Corp. | 46,215 | 5,713,560 | ||||||
PNC Financial Services Group, Inc. (The) | 64,563 | 5,471,714 | ||||||
Regions Financial Corp. | 529,353 | 5,372,933 | ||||||
SunTrust Banks, Inc. | 140,818 | 5,362,349 | ||||||
Zions Bancorp. | 191,403 | 5,577,483 | ||||||
| 49,759,153 | ||||||||
| Research & Consulting Services–0.62% | ||||||||
Dun & Bradstreet Corp. (The) | 54,543 | 6,402,257 | ||||||
Equifax Inc. | 79,092 | 6,229,286 | ||||||
Nielsen N.V. | 122,210 | 5,742,648 | ||||||
| 18,374,191 | ||||||||
| Shares | Value | |||||||
| Residential REIT’s–0.83% | ||||||||
Apartment Investment & Management Co.–Class A | 176,780 | $ | 6,058,250 | |||||
AvalonBay Communities, Inc. | 40,489 | 6,239,355 | ||||||
Equity Residential | 91,796 | 6,101,680 | ||||||
Essex Property Trust, Inc. | 31,604 | 6,113,794 | ||||||
| 24,513,079 | ||||||||
| Restaurants–0.96% | ||||||||
Chipotle Mexican Grill, Inc.(b) | 9,637 | 6,540,150 | ||||||
Darden Restaurants, Inc. | 114,117 | 5,400,016 | ||||||
McDonald’s Corp. | 56,416 | 5,287,308 | ||||||
Starbucks Corp. | 75,905 | 5,906,168 | ||||||
Yum! Brands, Inc. | 71,554 | 5,182,656 | ||||||
| 28,316,298 | ||||||||
| Retail REIT’s–0.79% | ||||||||
General Growth Properties, Inc. | 241,147 | 5,924,982 | ||||||
Kimco Realty Corp. | 249,861 | 5,869,235 | ||||||
Macerich Co. (The) | 86,740 | 5,663,254 | ||||||
Simon Property Group, Inc. | 34,539 | 5,872,666 | ||||||
| 23,330,137 | ||||||||
| Security & Alarm Services–0.40% | ||||||||
ADT Corp. (The) | 166,942 | 6,153,482 | ||||||
Tyco International Ltd. | 126,689 | 5,652,863 | ||||||
| 11,806,345 | ||||||||
| Semiconductor Equipment–0.62% | ||||||||
Applied Materials, Inc. | 253,436 | 5,855,639 | ||||||
KLA-Tencor Corp. | 82,679 | 6,318,329 | ||||||
Lam Research Corp. | 86,291 | 6,205,186 | ||||||
| 18,379,154 | ||||||||
| Semiconductors–2.35% | ||||||||
Altera Corp. | 166,746 | 5,892,804 | ||||||
Analog Devices, Inc. | 101,930 | 5,210,661 | ||||||
Avago Technologies Ltd. (Singapore) | 79,380 | 6,516,304 | ||||||
Broadcom Corp.–Class A | 147,832 | 5,821,624 | ||||||
First Solar, Inc.(b) | 87,937 | 6,127,450 | ||||||
Intel Corp.(d) | 189,864 | 6,630,051 | ||||||
Linear Technology Corp. | 120,240 | 5,424,026 | ||||||
Microchip Technology Inc. | 115,371 | 5,633,566 | ||||||
Micron Technology, Inc.(b) | 181,885 | 5,929,451 | ||||||
NVIDIA Corp. | 290,142 | 5,643,262 | ||||||
Texas Instruments Inc. | 117,304 | 5,651,707 | ||||||
Xilinx, Inc. | 121,243 | 5,122,517 | ||||||
| 69,603,423 | ||||||||
| Soft Drinks–1.06% | ||||||||
Coca-Cola Co. (The) | 140,434 | 5,858,906 | ||||||
Coca-Cola Enterprises, Inc. | 127,172 | 6,076,278 | ||||||
Dr Pepper Snapple Group, Inc. | 98,119 | 6,173,648 | ||||||
Monster Beverage Corp.(b) | 82,319 | 7,277,823 | ||||||
PepsiCo, Inc. | 65,022 | 6,013,885 | ||||||
| 31,400,540 | ||||||||
See accompanying Notes to Financial Statements which are an integral part of the financial statements.
15 Invesco Equally-Weighted S&P 500 Fund
| Shares | Value | |||||||
| Specialized Consumer Services–0.20% | ||||||||
H&R Block, Inc. | 174,495 | $ | 5,850,817 | |||||
| Specialized Finance–1.01% | ||||||||
CME Group Inc.–Class A | �� | 79,347 | 6,074,013 | |||||
Intercontinental Exchange, Inc. | 29,335 | 5,544,315 | ||||||
McGraw Hill Financial, Inc. | 68,009 | 5,517,570 | ||||||
Moody’s Corp. | 66,106 | 6,185,538 | ||||||
NASDAQ OMX Group, Inc. (The) | 154,352 | 6,709,682 | ||||||
| 30,031,118 | ||||||||
| Specialized REIT’s–1.00% | ||||||||
American Tower Corp. | 64,103 | 6,320,556 | ||||||
Crown Castle International Corp. | 76,820 | 6,107,958 | ||||||
Plum Creek Timber Co., Inc. | 128,469 | 5,219,696 | ||||||
Public Storage | 33,441 | 5,858,194 | ||||||
Weyerhaeuser Co. | 183,831 | 6,241,062 | ||||||
| 29,747,466 | ||||||||
| Specialty Chemicals–0.99% | ||||||||
Ecolab Inc. | 52,420 | 6,018,864 | ||||||
International Flavors & Fragrances Inc. | 56,248 | 5,714,234 | ||||||
PPG Industries, Inc. | 27,753 | 5,713,233 | ||||||
Sherwin-Williams Co. (The) | 27,964 | 6,099,228 | ||||||
Sigma-Aldrich Corp. | 56,675 | 5,894,200 | ||||||
| 29,439,759 | ||||||||
| Specialty Stores–0.83% | ||||||||
PetSmart, Inc. | 97,378 | 6,969,343 | ||||||
Staples, Inc. | 515,866 | 6,025,315 | ||||||
Tiffany & Co. | 57,248 | 5,778,613 | ||||||
Tractor Supply Co. | 87,220 | 5,839,379 | ||||||
| 24,612,650 | ||||||||
| Steel–0.40% | ||||||||
Allegheny Technologies, Inc. | 136,347 | 5,749,753 | ||||||
Nucor Corp. | 111,513 | 6,057,386 | ||||||
| 11,807,139 | ||||||||
| Systems Software–1.03% | ||||||||
CA, Inc. | 195,900 | 5,532,216 | ||||||
Microsoft Corp. | 137,505 | 6,246,852 | ||||||
Oracle Corp. | 134,535 | 5,587,238 | ||||||
Red Hat, Inc.(b) | 109,193 | 6,652,038 | ||||||
Symantec Corp. | 261,260 | 6,343,393 | ||||||
| 30,361,737 | ||||||||
| Shares | Value | |||||||
| Technology Hardware, Storage & Peripherals–1.48% | ||||||||
Apple Inc. | 62,108 | $ | 6,366,070 | |||||
EMC Corp. | 212,973 | 6,289,093 | ||||||
Hewlett-Packard Co. | 161,244 | 6,127,272 | ||||||
NetApp, Inc. | 158,984 | 6,702,765 | ||||||
SanDisk Corp. | 57,573 | 5,639,851 | ||||||
Seagate Technology PLC | 102,408 | 6,408,693 | ||||||
Western Digital Corp. | 61,542 | 6,339,441 | ||||||
| 43,873,185 | ||||||||
| Thrifts & Mortgage Finance–0.39% | ||||||||
Hudson City Bancorp, Inc. | 575,571 | 5,680,886 | ||||||
People’s United Financial Inc. | 382,548 | 5,719,092 | ||||||
| 11,399,978 | ||||||||
| Tires & Rubber–0.19% | ||||||||
Goodyear Tire & Rubber Co. (The) | 216,058 | 5,611,026 | ||||||
| Tobacco–0.76% | ||||||||
Altria Group, Inc. | 136,775 | 5,892,267 | ||||||
Lorillard, Inc. | 92,757 | 5,537,593 | ||||||
Philip Morris International Inc. | 64,096 | 5,485,336 | ||||||
Reynolds American Inc. | 94,884 | 5,547,867 | ||||||
| 22,463,063 | ||||||||
| Trading Companies & Distributors–0.36% | ||||||||
Fastenal Co. | 114,370 | 5,178,674 | ||||||
W.W. Grainger, Inc. | 21,820 | 5,372,084 | ||||||
| 10,550,758 | ||||||||
| Trucking–0.20% | ||||||||
Ryder System, Inc. | 65,435 | 5,911,398 | ||||||
Total Common Stocks & Other Equity Interests |
| 2,928,733,865 | ||||||
Money Market Funds–1.95% |
| |||||||
Liquid Assets Portfolio–Institutional Class(e) | 28,868,656 | 28,868,656 | ||||||
Premier Portfolio–Institutional Class(e) | 28,868,657 | 28,868,657 | ||||||
Total Money Market Funds |
| 57,737,313 | ||||||
TOTAL INVESTMENTS–100.88% |
| 2,986,471,178 | ||||||
OTHER ASSETS LESS LIABILITIES–(0.88)% |
| (25,938,070 | ) | |||||
NET ASSETS–100.00% |
| $ | 2,960,533,108 | |||||
Investment Abbreviations:
| REIT | – Real Estate Investment Trust |
Notes to Schedule of Investments:
| (a) | Industry and/or sector classifications used in this report are generally according to the Global Industry Classification Standard, which was developed by and is the exclusive property and a service mark of MSCI Inc. and Standard & Poor’s. |
| (b) | Non-income producing security. |
| (c) | The Fund’s Adviser is a subsidiary of Invesco Ltd. and therefore, Invesco Ltd. is considered to be affiliated with the Fund. See Note 5. |
| (d) | All or a portion of the value was pledged as collateral to cover margin requirements for open futures contracts. See Note 1J and Note 4. |
| (e) | The money market fund and the Fund are affiliated by having the same investment adviser. |
See accompanying Notes to Financial Statements which are an integral part of the financial statements.
16 Invesco Equally-Weighted S&P 500 Fund
Statement of Assets and Liabilities
August 31, 2014
Assets: | ||||
Investments, at value (Cost $1,758,303,187) | $ | 2,922,516,465 | ||
Investments in affiliates, at value (Cost $61,402,980) | 63,954,713 | |||
Total investments, at value (Cost $1,819,706,167) | 2,986,471,178 | |||
Receivable for: | ||||
Variation margin — futures | 41,152 | |||
Fund shares sold | 17,395,853 | |||
Dividends | 4,985,206 | |||
Investment for trustee deferred compensation and retirement plans | 122,987 | |||
Other assets | 82,189 | |||
Total assets | 3,009,098,565 | |||
Liabilities: |
| |||
Payable for: | ||||
Investments purchased | 41,003,422 | |||
Fund shares reacquired | 5,421,101 | |||
Accrued fees to affiliates | 1,718,456 | |||
Accrued trustees’ and officers’ fees and benefits | 5,719 | |||
Accrued other operating expenses | 209,750 | |||
Trustee deferred compensation and retirement plans | 207,009 | |||
Total liabilities | 48,565,457 | |||
Net assets applicable to shares outstanding | $ | 2,960,533,108 | ||
Net assets consist of: |
| |||
Shares of beneficial interest | $ | 1,761,777,259 | ||
Undistributed net investment income | 20,614,719 | |||
Undistributed net realized gain | 11,344,752 | |||
Net unrealized appreciation | 1,166,796,378 | |||
| $ | 2,960,533,108 | |||
Net Assets: | ||||
Class A | $ | 1,506,665,307 | ||
Class B | $ | 15,851,342 | ||
Class C | $ | 349,738,884 | ||
Class R | $ | 65,777,468 | ||
Class Y | $ | 1,021,246,924 | ||
Class R6 | $ | 1,253,183 | ||
Shares outstanding, $0.01 par value per share, |
| |||
Class A | 31,037,966 | |||
Class B | 327,837 | |||
Class C | 7,475,094 | |||
Class R | 1,360,285 | |||
Class Y | 20,861,431 | |||
Class R6 | 25,582 | |||
Class A: | ||||
Net asset value per share | $ | 48.54 | ||
Maximum offering price per share | ||||
(Net asset value of $48.54 ¸ 94.50%) | $ | 51.37 | ||
Class B: | ||||
Net asset value and offering price per share | $ | 48.35 | ||
Class C: | ||||
Net asset value and offering price per share | $ | 46.79 | ||
Class R: | ||||
Net asset value and offering price per share | $ | 48.36 | ||
Class Y: | ||||
Net asset value and offering price per share | $ | 48.95 | ||
Class R6: | ||||
Net asset value and offering price per share | $ | 48.99 | ||
See accompanying Notes to Financial Statements which are an integral part of the financial statements.
17 Invesco Equally-Weighted S&P 500 Fund
Statement of Operations
For the year ended August 31, 2014
Investment income: |
| |||
Dividends (net of foreign withholding taxes of $12,956) | $ | 43,141,096 | ||
Dividends from affiliates (includes securities lending income of $35,307) | 175,856 | |||
Total investment income | 43,316,952 | |||
Expenses: | ||||
Advisory fees | 2,710,320 | |||
Administrative services fees | 475,342 | |||
Custodian fees | 135,673 | |||
Distribution fees: | ||||
Class A | 3,209,564 | |||
Class B | 195,077 | |||
Class C | 2,424,710 | |||
Class R | 239,057 | |||
Transfer agent fees — A, B, C, R & Y | 2,912,097 | |||
Transfer agent fees — R6 | 132 | |||
Trustees’ and officers’ fees and benefits | 86,765 | |||
Other | 897,943 | |||
Total expenses | 13,286,680 | |||
Less: Fees waived and expense offset arrangement(s) | (43,864 | ) | ||
Net expenses | 13,242,816 | |||
Net investment income | 30,074,136 | |||
Realized and unrealized gain from: | ||||
Net realized gain from: | ||||
Investment securities | 54,447,078 | |||
Futures contracts | 3,439,952 | |||
| 57,887,030 | ||||
Change in net unrealized appreciation of: | ||||
Investment securities | 412,254,923 | |||
Futures contracts | 214,158 | |||
| 412,469,081 | ||||
Net realized and unrealized gain | 470,356,111 | |||
Net increase in net assets resulting from operations | $ | 500,430,247 | ||
See accompanying Notes to Financial Statements which are an integral part of the financial statements.
18 Invesco Equally-Weighted S&P 500 Fund
Statement of Changes in Net Assets
For the years ended August 31, 2014 and 2013
| 2014 | 2013 | |||||||
Operations: |
| |||||||
Net investment income | $ | 30,074,136 | $ | 20,543,924 | ||||
Net realized gain | 57,887,030 | 41,189,706 | ||||||
Change in net unrealized appreciation | 412,469,081 | 232,941,418 | ||||||
Net increase in net assets resulting from operations | 500,430,247 | 294,675,048 | ||||||
Distributions to shareholders from net investment income: | ||||||||
Class A | (12,875,050 | ) | (11,160,240 | ) | ||||
Class B | (126,859 | ) | (254,363 | ) | ||||
Class C | (1,210,824 | ) | (631,218 | ) | ||||
Class R | (354,344 | ) | (152,295 | ) | ||||
Class Y | (7,443,262 | ) | (5,410,532 | ) | ||||
Class R6 | (165 | ) | (170 | ) | ||||
Total distributions from net investment income | (22,010,504 | ) | (17,608,818 | ) | ||||
Distributions to shareholders from net realized gains: | ||||||||
Class A | (29,164,508 | ) | (18,393,200 | ) | ||||
Class B | (532,180 | ) | (869,049 | ) | ||||
Class C | (5,079,486 | ) | (2,156,598 | ) | ||||
Class R | (946,483 | ) | (301,636 | ) | ||||
Class Y | (14,325,712 | ) | (7,685,801 | ) | ||||
Class R6 | (311 | ) | (240 | ) | ||||
Total distributions from net realized gains | (50,048,680 | ) | (29,406,524 | ) | ||||
Share transactions–net: | ||||||||
Class A | 266,279,740 | 115,974,489 | ||||||
Class B | (10,881,910 | ) | (25,161,061 | ) | ||||
Class C | 164,908,129 | 47,119,734 | ||||||
Class R | 27,842,070 | 17,285,208 | ||||||
Class Y | 406,934,786 | 103,991,172 | ||||||
Class R6 | 1,159,547 | 9,805 | ||||||
Net increase in net assets resulting from share transactions | 856,242,362 | 259,219,347 | ||||||
Net increase in net assets | 1,284,613,425 | 506,879,053 | ||||||
Net assets: | ||||||||
Beginning of year | 1,675,919,683 | 1,169,040,630 | ||||||
End of year (includes undistributed net investment income of $20,614,719 and $12,133,943, respectively) | $ | 2,960,533,108 | $ | 1,675,919,683 | ||||
Notes to Financial Statements
August 31, 2014
NOTE 1—Significant Accounting Policies
Invesco Equally-Weighted S&P 500 Fund (the “Fund”) is a series portfolio of AIM Counselor Series Trust (Invesco Counselor Series Trust) (the “Trust”). The Trust is a Delaware statutory trust registered under the Investment Company Act of 1940, as amended (the “1940 Act”), as an open-end series management investment company consisting of thirteen separate portfolios, each authorized to issue an unlimited number of shares of beneficial interest. The assets, liabilities and operations of each portfolio are accounted for separately. Information presented in these financial statements pertains only to the Fund. Matters affecting each portfolio or class will be voted on exclusively by the shareholders of such portfolio or class.
The Fund’s investment objective is total return through growth of capital and current income.
The Fund currently consists of six different classes of shares: Class A, Class B, Class C, Class R, Class Y and Class R6. Class A shares are sold with a front-end sales charge unless certain waiver criteria are met and under certain circumstances load waived shares may be subject to contingent deferred sales charges (“CDSC”). Class C shares are sold with a CDSC. Class R, Class Y and Class R6 shares are sold at net asset value. Effective November 30, 2010, new or additional investments in Class B shares are no longer permitted. Existing shareholders of Class B shares may continue to reinvest dividends and capital gains distributions in Class B shares until they convert to Class A shares. Also, shareholders in Class B shares will be able to exchange those shares for Class B shares of other Invesco Funds offering such shares until they convert to Class A shares. Generally,
19 Invesco Equally-Weighted S&P 500 Fund
Class B shares will automatically convert to Class A shares on or about the month-end, which is at least eight years after the date of purchase. Redemption of Class B shares prior to the conversion date will be subject to a CDSC.
The following is a summary of the significant accounting policies followed by the Fund in the preparation of its financial statements.
| A. | Security Valuations — Securities, including restricted securities, are valued according to the following policy. |
A security listed or traded on an exchange (except convertible securities) is valued at its last sales price or official closing price as of the close of the customary trading session on the exchange where the security is principally traded, or lacking any sales or official closing price on a particular day, the security may be valued at the closing bid price on that day. Securities traded in the over-the-counter market are valued based on prices furnished by independent pricing services or market makers. When such securities are valued by an independent pricing service they may be considered fair valued. Futures contracts are valued at the final settlement price set by an exchange on which they are principally traded. Listed options are valued at the mean between the last bid and ask prices from the exchange on which they are principally traded. Options not listed on an exchange are valued by an independent source at the mean between the last bid and ask prices. For purposes of determining net asset value per share, futures and option contracts generally are valued 15 minutes after the close of the customary trading session of the New York Stock Exchange (“NYSE”).
Investments in open-end and closed-end registered investment companies that do not trade on an exchange are valued at the end of day net asset value per share. Investments in open-end and closed-end registered investment companies that trade on an exchange are valued at the last sales price or official closing price as of the close of the customary trading session on the exchange where the security is principally traded.
Debt obligations (including convertible securities) and unlisted equities are fair valued using an evaluated quote provided by an independent pricing service. Evaluated quotes provided by the pricing service may be determined without exclusive reliance on quoted prices, and may reflect appropriate factors such as institution-size trading in similar groups of securities, developments related to specific securities, dividend rate (for unlisted equities), yield (for debt obligations), quality, type of issue, coupon rate (for debt obligations), maturity (for debt obligations), individual trading characteristics and other market data. Debt obligations are subject to interest rate and credit risks. In addition, all debt obligations involve some risk of default with respect to interest and/or principal payments.
Foreign securities’ (including foreign exchange contracts) prices are converted into U.S. dollar amounts using the applicable exchange rates as of the close of the NYSE. If market quotations are available and reliable for foreign exchange-traded equity securities, the securities will be valued at the market quotations. Because trading hours for certain foreign securities end before the close of the NYSE, closing market quotations may become unreliable. If between the time trading ends on a particular security and the close of the customary trading session on the NYSE, events occur that the Adviser determines are significant and make the closing price unreliable, the Fund may fair value the security. If the event is likely to have affected the closing price of the security, the security will be valued at fair value in good faith using procedures approved by the Board of Trustees. Adjustments to closing prices to reflect fair value may also be based on a screening process of an independent pricing service to indicate the degree of certainty, based on historical data, that the closing price in the principal market where a foreign security trades is not the current value as of the close of the NYSE. Foreign securities’ prices meeting the approved degree of certainty that the price is not reflective of current value will be priced at the indication of fair value from the independent pricing service. Multiple factors may be considered by the independent pricing service in determining adjustments to reflect fair value and may include information relating to sector indices, American Depositary Receipts and domestic and foreign index futures. Foreign securities may have additional risks including exchange rate changes, potential for sharply devalued currencies and high inflation, political and economic upheaval, the relative lack of issuer information, relatively low market liquidity and the potential lack of strict financial and accounting controls and standards.
Securities for which market prices are not provided by any of the above methods may be valued based upon quotes furnished by independent sources. The last bid price may be used to value equity securities. The mean between the last bid and asked prices is used to value debt obligations, including corporate loans.
Securities for which market quotations are not readily available or became unreliable are valued at fair value as determined in good faith by or under the supervision of the Trust’s officers following procedures approved by the Board of Trustees. Issuer specific events, market trends, bid/ask quotes of brokers and information providers and other market data may be reviewed in the course of making a good faith determination of a security’s fair value.
The Fund may invest in securities that are subject to interest rate risk, meaning the risk that the prices will generally fall as interest rates rise and, conversely, the prices will generally rise as interest rates fall. Specific securities differ in their sensitivity to changes in interest rates depending on their individual characteristics. Changes in interest rates may result in increased market volatility, which may affect the value and/or liquidity of certain of the Fund’s investments.
Valuations change in response to many factors including the historical and prospective earnings of the issuer, the value of the issuer’s assets, general economic conditions, interest rates, investor perceptions and market liquidity. Because of the inherent uncertainties of valuation, the values reflected in the financial statements may materially differ from the value received upon actual sale of those investments.
| B. | Securities Transactions and Investment Income — Securities transactions are accounted for on a trade date basis. Realized gains or losses on sales are computed on the basis of specific identification of the securities sold. Interest income (net of withholding tax, if any) is recorded on the accrual basis from settlement date. Dividend income (net of withholding tax, if any) is recorded on the ex-dividend date. |
The Fund may periodically participate in litigation related to Fund investments. As such, the Fund may receive proceeds from litigation settlements. Any proceeds received are included in the Statement of Operations as realized gain (loss) for investments no longer held and as unrealized gain (loss) for investments still held.
Brokerage commissions and mark ups are considered transaction costs and are recorded as an increase to the cost basis of securities purchased and/or a reduction of proceeds on a sale of securities. Such transaction costs are included in the determination of net realized and unrealized gain (loss) from investment securities reported in the Statement of Operations and the Statement of Changes in Net Assets and the net realized and unrealized gains (losses) on securities per share in the Financial Highlights. Transaction costs are included in the calculation of the Fund’s net asset value and, accordingly, they reduce the Fund’s total returns. These transaction costs are not considered operating expenses and are not reflected in net investment income reported in the Statement of Operations and Statement of Changes in Net Assets, or the net investment income per share and ratios of expenses and net investment income reported in the Financial Highlights, nor are they limited by any expense limitation arrangements between the Fund and the investment adviser.
20 Invesco Equally-Weighted S&P 500 Fund
The Fund allocates income and realized and unrealized capital gains and losses to a class based on the relative net assets of each class.
| C. | Country Determination — For the purposes of making investment selection decisions and presentation in the Schedule of Investments, the investment adviser may determine the country in which an issuer is located and/or credit risk exposure based on various factors. These factors include the laws of the country under which the issuer is organized, where the issuer maintains a principal office, the country in which the issuer derives 50% or more of its total revenues and the country that has the primary market for the issuer’s securities, as well as other criteria. Among the other criteria that may be evaluated for making this determination are the country in which the issuer maintains 50% or more of its assets, the type of security, financial guarantees and enhancements, the nature of the collateral and the sponsor organization. Country of issuer and/or credit risk exposure has been determined to be the United States of America, unless otherwise noted. |
| D. | Distributions — Distributions from net investment income and net realized capital gain, if any, are generally declared and paid annually and recorded on the ex-dividend date. The Fund may elect to treat a portion of the proceeds from redemptions as distributions for federal income tax purposes. |
| E. | Federal Income Taxes — The Fund intends to comply with the requirements of Subchapter M of the Internal Revenue Code of 1986, as amended (the “Internal Revenue Code”), necessary to qualify as a regulated investment company and to distribute substantially all of the Fund’s taxable earnings to shareholders. As such, the Fund will not be subject to federal income taxes on otherwise taxable income (including net realized capital gain) that is distributed to shareholders. Therefore, no provision for federal income taxes is recorded in the financial statements. |
The Fund recognizes the tax benefits of uncertain tax positions only when the position is more likely than not to be sustained. Management has analyzed the Fund’s uncertain tax positions and concluded that no liability for unrecognized tax benefits should be recorded related to uncertain tax positions. Management is not aware of any tax positions for which it is reasonably possible that the total amounts of unrecognized tax benefits will change materially in the next 12 months.
The Fund files tax returns in the U.S. Federal jurisdiction and certain other jurisdictions. Generally, the Fund is subject to examinations by such taxing authorities for up to three years after the filing of the return for the tax period.
| F. | Expenses — Fees provided for under the Rule 12b-1 plan of a particular class of the Fund are charged to the operations of such class. Transfer agency fees and expenses and other shareholder recordkeeping fees and expenses attributable to Class R6 are charged to such class. Transfer agency fees and expenses and other shareholder recordkeeping fees and expenses relating to all other classes are allocated among those classes based on relative net assets. All other expenses are allocated among the classes based on relative net assets. |
| G. | Accounting Estimates — The preparation of financial statements in conformity with accounting principles generally accepted in the United States of America (“GAAP”) requires management to make estimates and assumptions that affect the reported amounts of assets and liabilities at the date of the financial statements and the reported amounts of revenues and expenses during the reporting period including estimates and assumptions related to taxation. Actual results could differ from those estimates by a significant amount. In addition, the Fund monitors for material events or transactions that may occur or become known after the period-end date and before the date the financial statements are released to print. |
| H. | Indemnifications — Under the Trust’s organizational documents, each Trustee, officer, employee or other agent of the Trust is indemnified against certain liabilities that may arise out of the performance of their duties to the Fund. Additionally, in the normal course of business, the Fund enters into contracts, including the Fund’s servicing agreements, that contain a variety of indemnification clauses. The Fund’s maximum exposure under these arrangements is unknown as this would involve future claims that may be made against the Fund that have not yet occurred. The risk of material loss as a result of such indemnification claims is considered remote. |
| I. | Securities Lending — The Fund may lend portfolio securities having a market value up to one-third of the Fund’s total assets. Such loans are secured by collateral equal to no less than the market value of the loaned securities determined daily by the securities lending provider. Such collateral will be cash or debt securities issued or guaranteed by the U.S. Government or any of its sponsored agencies. Cash collateral received in connection with these loans is invested in short-term money market instruments or affiliated money market funds and is shown as such on the Schedule of Investments. It is the Fund’s policy to obtain additional collateral from or return excess collateral to the borrower by the end of the next business day, following the valuation date of the securities loaned. Therefore, the value of the collateral held may be temporarily less than the value of the securities on loan. Lending securities entails a risk of loss to the Fund if, and to the extent that, the market value of the securities loaned were to increase and the borrower did not increase the collateral accordingly, and the borrower failed to return the securities. Upon the failure of the borrower to return the securities, collateral may be liquidated and the securities may be purchased on the open market to replace the loaned securities. The Fund could experience delays and costs in gaining access to the collateral. The Fund bears the risk of any deficiency in the amount of the collateral available for return to the borrower due to any loss on the collateral invested. Dividends received on cash collateral investments for securities lending transactions, which are net of compensation to counterparties, is included in Dividends from affiliated money market funds on the Statement of Operations. The aggregate value of securities out on loan is shown as a footnote on the Statement of Assets and Liabilities, if any. |
| J. | Futures Contracts — The Fund may enter into futures contracts to manage exposure to interest rate, equity and market price movements and/or currency risks. A futures contract is an agreement between two parties to purchase or sell a specified underlying security, currency or commodity (or delivery of a cash settlement price, in the case of an index future) for a fixed price at a future date. The Fund currently invests only in exchange-traded futures and they are standardized as to maturity date and underlying financial instrument. Initial margin deposits required upon entering into futures contracts are satisfied by the segregation of specific securities or cash as collateral at the futures commission merchant (broker). During the period the futures contracts are open, changes in the value of the contracts are recognized as unrealized gains or losses by recalculating the value of the contracts on a daily basis. Subsequent or variation margin payments are received or made depending upon whether unrealized gains or losses are incurred. These amounts are reflected as receivables or payables on the Statement of Assets and Liabilities. When the contracts are closed or expire, the Fund recognizes a realized gain or loss equal to the difference between the proceeds from, or cost of, the closing transaction and the Fund’s basis in the contract. The net realized gain (loss) and the change in unrealized gain (loss) on futures contracts held during the period is included on the Statement of Operations. The primary risks associated with futures contracts are market risk and the absence of a liquid secondary market. If the Fund were unable to liquidate a futures contract and/or enter into an offsetting closing transaction, the Fund would continue to be subject to market risk with respect to the value of the contracts and continue to be required to maintain the margin deposits on the futures contracts. Futures contracts have minimal counterparty risk since the exchange’s clearinghouse, as |
21 Invesco Equally-Weighted S&P 500 Fund
| counterparty to all exchange-traded futures, guarantees the futures against default. Risks may exceed amounts recognized in the Statement of Assets and Liabilities. |
| K. | Collateral — To the extent the Fund has pledged or segregated a security as collateral and that security is subsequently sold, it is the Fund’s practice to replace such collateral no later than the next business day. |
NOTE 2—Advisory Fees and Other Fees Paid to Affiliates
The Trust has entered into a master investment advisory agreement with Invesco Advisers, Inc. (the “Adviser” or “Invesco”). Under the terms of the investment advisory agreement, the Fund pays an advisory fee to the Adviser based on the annual rate of the Fund’s average daily net assets as follows:
| Average Daily Net Assets | Rate | |||
First $2 billion | 0.12% | |||
Over $2 billion | 0.10% | |||
Under the terms of a master sub-advisory agreement between the Adviser and each of Invesco Asset Management Deutschland GmbH, Invesco Asset Management Limited, Invesco Asset Management (Japan) Limited, Invesco Australia Limited, Invesco Hong Kong Limited, Invesco Senior Secured Management, Inc. and Invesco Canada Ltd. (collectively, the “Affiliated Sub-Advisers”) the Adviser, not the Fund, may pay 40% of the fees paid to the Adviser to any such Affiliated Sub-Adviser(s) that provide(s) discretionary investment management services to the Fund based on the percentage of assets allocated to such Sub-Adviser(s).
The Adviser has contractually agreed, through at least June 30, 2015, to waive advisory fees and/or reimburse expenses to the extent necessary to limit total annual fund operating expenses and/or reimbursement (excluding certain items discussed below) of Class A, Class B, Class C, Class R, Class Y and Class R6 shares to 2.00%, 2.75%, 2.75%, 2.25%, 1.75% and 1.75% of average daily net assets, respectively. In determining the Adviser’s obligation to waive advisory fees and/or reimburse expenses, the following expenses are not taken into account, and could cause the net annual fund operating expenses and/or reimbursement to exceed the numbers reflected above: (1) interest; (2) taxes; (3) dividend expense on short sales; (4) extraordinary or non-routine items, including litigation expenses; and (5) expenses that the Fund has incurred but did not actually pay because of an expense offset arrangement. Unless Invesco continues the fee waiver agreement, it will terminate on June 30, 2015. The fee waiver agreement cannot be terminated during its term. The Adviser did not waive fees and/or reimburse expenses during the period under this expense limitation.
Further, the Adviser has contractually agreed, through at least June 30, 2016, to waive the advisory fee payable by the Fund in an amount equal to 100% of the net advisory fees the Adviser receives from the affiliated money market funds on investments by the Fund of uninvested cash (excluding investments of cash collateral from securities lending) in such affiliated money market funds.
For the year ended August 31, 2014, the Adviser waived advisory fees of $42,756.
The Trust has entered into a master administrative services agreement with Invesco pursuant to which the Fund has agreed to pay Invesco for certain administrative costs incurred in providing accounting services to the Fund. For the year ended August 31, 2014, expenses incurred under the agreement are shown in the Statement of Operations as Administrative services fees.
The Trust has entered into a transfer agency and service agreement with Invesco Investment Services, Inc. (“IIS”) pursuant to which the Fund has agreed to pay IIS a fee for providing transfer agency and shareholder services to the Fund and reimburse IIS for certain expenses incurred by IIS in the course of providing such services. IIS may make payments to intermediaries that provide omnibus account services, sub-accounting services and/or networking services. All fees payable by IIS to intermediaries that provide omnibus account services or sub-accounting are charged back to the Fund, subject to certain limitations approved by the Trust’s Board of Trustees. For the year ended August 31, 2014, expenses incurred under the agreement are shown in the Statement of Operations as Transfer agent fees.
Shares of the Fund are distributed by Invesco Distributors, Inc. (“IDI”), an affiliate of the Adviser. The Fund has adopted a Plan of Distribution (the “Plan”) pursuant to Rule 12b-1 under the 1940 Act. The Plan provides that the Fund will reimburse IDI for distribution related expenses that IDI incurs up to a maximum of the following annual rates: (1) Class A — up to 0.25% of the average daily net assets of Class A shares; (2) Class B — up to 1.00% of the average daily net assets of Class B shares; (3) Class C — up to 1.00% of the average daily net assets of Class C shares; and (4) Class R — up to 0.50% of the average daily net assets of Class R shares.
In the case of Class B shares, provided that the Plan continues in effect, any cumulative expenses incurred by IDI, but not yet reimbursed to IDI, may be recovered through the payment of future distribution fees from the Fund pursuant to the Plan and contingent deferred sales charges paid by investors upon redemption of Class B shares.
For the year ended August 31, 2014, expenses incurred under these agreements are shown in the Statement of Operations as Distribution fees.
Front-end sales commissions and CDSC (collectively, the “sales charges”) are not recorded as expenses of the Fund. Front-end sales commissions are deducted from proceeds from the sales of Fund shares prior to investment in Class A shares of the Fund. CDSC are deducted from redemption proceeds prior to remittance to the shareholder. During the year ended August 31, 2014, IDI advised the Fund that IDI retained $400,149 in front-end sales commissions from the sale of Class A shares and $6,148, $3,704 and $22,914 from Class A, Class B and Class C shares, respectively, for CDSC imposed on redemptions by shareholders.
Certain officers and trustees of the Trust are officers and directors of the Adviser, IIS and/or IDI.
22 Invesco Equally-Weighted S&P 500 Fund
NOTE 3—Additional Valuation Information
GAAP defines fair value as the price that would be received to sell an asset or paid to transfer a liability in an orderly transaction between market participants at the measurement date, under current market conditions. GAAP establishes a hierarchy that prioritizes the inputs to valuation methods, giving the highest priority to readily available unadjusted quoted prices in an active market for identical assets (Level 1) and the lowest priority to significant unobservable inputs (Level 3), generally when market prices are not readily available or are unreliable. Based on the valuation inputs, the securities or other investments are tiered into one of three levels. Changes in valuation methods may result in transfers in or out of an investment’s assigned level:
| Level 1 — | Prices are determined using quoted prices in an active market for identical assets. |
| Level 2 — | Prices are determined using other significant observable inputs. Observable inputs are inputs that other market participants may use in pricing a security. These may include quoted prices for similar securities, interest rates, prepayment speeds, credit risk, yield curves, loss severities, default rates, discount rates, volatilities and others. |
| Level 3 — | Prices are determined using significant unobservable inputs. In situations where quoted prices or observable inputs are unavailable (for example, when there is little or no market activity for an investment at the end of the period), unobservable inputs may be used. Unobservable inputs reflect the Fund’s own assumptions about the factors market participants would use in determining fair value of the securities or instruments and would be based on the best available information. |
The following is a summary of the tiered valuation input levels, as of August 31, 2014. The level assigned to the securities valuations may not be an indication of the risk or liquidity associated with investing in those securities. Because of the inherent uncertainties of valuation, the values reflected in the financial statements may materially differ from the value received upon actual sale of those investments.
| Level 1 | Level 2 | Level 3 | Total | |||||||||||||
Equity Securities | $ | 2,986,471,178 | $ | — | $ | — | $ | 2,986,471,178 | ||||||||
Futures Contracts* | 31,367 | — | — | 31,367 | ||||||||||||
Total Investments | $ | 2,986,502,545 | $ | — | $ | — | $ | 2,986,502,545 | ||||||||
| * | Unrealized appreciation. |
NOTE 4—Derivative Investments
Value of Derivative Investments at Period-End
The table below summarizes the value of the Fund’s derivative investments, detailed by primary risk exposure, held as of August 31, 2014:
| Value | ||||||||
| Risk Exposure/Derivative Type | Assets | Liabilities | ||||||
Market risk: | ||||||||
Futures contracts(a) | $ | 31,367 | $ | — | ||||
| (a) | Includes cumulative appreciation of futures contracts. Only current day’s variation margin receivable is reported within the Statement of Assets and Liabilities. |
Effect of Derivative Investments for the year ended August 31, 2014
The table below summarizes the gains on derivative investments, detailed by primary risk exposure, recognized in earnings during the period:
| Location of Gain on Statement of Operations | ||||
| Futures Contracts | ||||
Realized Gain: | ||||
Market risk | $ | 3,439,952 | ||
Change in Unrealized Appreciation: | ||||
Market risk | 214,158 | |||
Total | $ | 3,654,110 | ||
The table below summarizes the average notional value of futures contracts outstanding during the period.
| Futures Contracts | ||||
Average notional value | $ | 23,785,461 | ||
| Open Futures Contracts at Period-End | ||||||||||||||||||||
| Futures Contracts | Type of Contract | Number of Contracts | Expiration Month | Notional Value | Unrealized Appreciation | |||||||||||||||
E-Mini S&P 500 | Long | 215 | September-2014 | $ | 21,515,050 | $ | 31,367 | |||||||||||||
23 Invesco Equally-Weighted S&P 500 Fund
Offsetting Assets and Liabilities
Accounting Standards Update (“ASU”) No. 2011-11, Disclosures about Offsetting Assets and Liabilities, which was subsequently clarified in Financial Accounting Standards Board ASU 2013-01 “Clarifying the Scope of Disclosures about Offsetting Assets and Liabilities” is intended to enhance disclosures about financial instruments and derivative instruments that are subject to offsetting arrangements on the Statement of Assets and Liabilities and to enable investors to better understand the effect of those arrangements on its financial position. In order for an arrangement to be eligible for netting, the Fund must have a basis to conclude that such netting arrangements are legally enforceable. The Fund enters into netting agreements and collateral agreements in an attempt to reduce the Fund’s Counterparty credit risk by providing for a single net settlement with a Counterparty of all financial transactions covered by the agreement in an event of default as defined under such agreement.
There were no derivative instruments subject to a netting agreement for which the Fund is not currently netting. The following tables present derivative instruments that are either subject to an enforceable netting agreement or offset by collateral arrangements as of August 31, 2014.
| Assets: | ||||||||||||||||||||||||
| Gross amounts presented in Statement of Assets & Liabilities(a) | Gross amounts offset in Statement of Assets & Liabilities | Net amounts of assets presented in the Statement of Assets & Liabilities | Collateral Received | |||||||||||||||||||||
| Counterparty | Financial Instruments | Cash | Net Amount | |||||||||||||||||||||
Goldman Sachs & Co. | $ | 31,367 | $ | — | $ | 31,367 | $ | — | $ | — | $ | 31,367 | ||||||||||||
| (a) | Includes cumulative appreciation of futures contracts. |
NOTE 5—Investments in Affiliates
The Fund’s Adviser is a subsidiary of Invesco Ltd. and therefore, Invesco Ltd. is considered to be affiliated with the Fund. The following is a summary of the transactions in, and earnings from, investments in Invesco Ltd. for the year ended August 31, 2014.
Value 08/31/13 | Purchases at Cost | Proceeds from Sales | Change in Unrealized Appreciation | Realized Gain | Value 08/31/14 | Dividend Income | ||||||||||||||||||||||
Invesco Ltd. | $ | 2,960,373 | $ | 2,270,367 | $ | (377,137 | ) | $ | 1,350,833 | $ | 12,964 | $ | 6,217,400 | $ | 127,284 | |||||||||||||
NOTE 6—Expense Offset Arrangement(s)
The expense offset arrangement is comprised of transfer agency credits which result from balances in demand deposit accounts used by the transfer agent for clearing shareholder transactions. For the year ended August 31, 2014, the Fund received credits from this arrangement, which resulted in the reduction of the Fund’s total expenses of $1,108.
NOTE 7—Trustees’ and Officers’ Fees and Benefits
Trustees’ and Officers’ Fees and Benefits include amounts accrued by the Fund to pay remuneration to certain Trustees and Officers of the Fund. Trustees have the option to defer compensation payable by the Fund, and Trustees’ and Officers’ Fees and Benefits also include amounts accrued by the Fund to fund such deferred compensation amounts. Those Trustees who defer compensation have the option to select various Invesco Funds in which their deferral accounts shall be deemed to be invested. Finally, certain current Trustees were eligible to participate in a retirement plan that provided for benefits to be paid upon retirement to Trustees over a period of time based on the number of years of service. The Fund may have certain former Trustees who also participate in a retirement plan and receive benefits under such plan. Trustees’ and Officers’ Fees and Benefits include amounts accrued by the Fund to fund such retirement benefits. Obligations under the deferred compensation and retirement plans represent unsecured claims against the general assets of the Fund.
NOTE 8—Cash Balances
The Fund is permitted to temporarily carry a negative or overdrawn balance in its account with State Street Bank and Trust Company, the custodian bank. Such balances, if any at period end, are shown in the Statement of Assets and Liabilities under the payable caption Amount due custodian. To compensate the custodian bank for such overdrafts, the overdrawn Fund may either (1) leave funds as a compensating balance in the account so the custodian bank can be compensated by earning the additional interest; or (2) compensate by paying the custodian bank at a rate agreed upon by the custodian bank and Invesco, not to exceed the contractually agreed upon rate.
24 Invesco Equally-Weighted S&P 500 Fund
NOTE 9—Distributions to Shareholders and Tax Components of Net Assets
Tax Character of Distributions to Shareholders Paid During the Years Ended August 31, 2014 and 2013:
| 2014 | 2013 | |||||||
Ordinary income | $ | 39,735,545 | $ | 19,912,458 | ||||
Long-term capital gain | 32,323,639 | 27,102,884 | ||||||
Total distributions | $ | 72,059,184 | $ | 47,015,342 | ||||
Tax Components of Net Assets at Period-End:
| 2014 | ||||
Undistributed ordinary income | $ | 37,153,129 | ||
Undistributed long-term gain | 27,422,345 | |||
Net unrealized appreciation – investments | 1,134,422,634 | |||
Net unrealized appreciation (depreciation) – other investments | (47,941 | ) | ||
Temporary book/tax differences | (194,318 | ) | ||
Shares of beneficial interest | 1,761,777,259 | |||
Total net assets | $ | 2,960,533,108 | ||
The difference between book-basis and tax-basis unrealized appreciation (depreciation) is due to differences in the timing of recognition of gains and losses on investments for tax and book purposes. The Fund’s net unrealized appreciation difference is attributable primarily to wash sales.
The temporary book/tax differences are a result of timing differences between book and tax recognition of income and/or expenses. The Fund’s temporary book/tax differences are the result of the trustee deferral of compensation and retirement plan benefits.
Capital loss carryforward is calculated and reported as of a specific date. Results of transactions and other activity after that date may affect the amount of capital loss carryforward actually available for the Fund to utilize. Capital losses generated in years beginning after December 22, 2010 can be carried forward for an unlimited period, whereas previous losses expire in 8 tax years. Capital losses with an expiration period may not be used to offset capital gains until all net capital losses without an expiration date have been utilized. Capital loss carryforwards with no expiration date will retain their character as either short-term or long-term capital losses instead of as short-term capital losses as under prior law. The ability to utilize capital loss carryforward in the future may be limited under the Internal Revenue Code and related regulations based on the results of future transactions.
The Fund does not have a capital loss carryforward as of August 31, 2014.
NOTE 10—Investment Securities
The aggregate amount of investment securities (other than short-term securities, U.S. Treasury obligations and money market funds, if any) purchased and sold by the Fund during the year ended August 31, 2014 was $1,200,127,961 and $393,517,554, respectively. Cost of investments on a tax basis includes the adjustments for financial reporting purposes as of the most recently completed federal income tax reporting period-end.
| Unrealized Appreciation (Depreciation) of Investment Securities on a Tax Basis | ||||
Aggregate unrealized appreciation of investment securities | $ | 1,141,132,463 | ||
Aggregate unrealized (depreciation) of investment securities | (6,709,829 | ) | ||
Net unrealized appreciation of investment securities | $ | 1,134,422,634 | ||
Cost of investments for tax purposes is $1,852,048,544.
NOTE 11—Reclassification of Permanent Differences
Primarily as a result of differing book/tax treatment of real estate investment trusts distribution on August 31, 2014, undistributed net investment income was increased by $417,144, undistributed net realized gain was decreased by $453,169 and shares of beneficial interest was increased by $36,025. This reclassification had no effect on the net assets of the Fund.
25 Invesco Equally-Weighted S&P 500 Fund
NOTE 12—Share Information
| Summary of Share Activity | ||||||||||||||||
| Years ended August 31, | ||||||||||||||||
| 2014(a) | 2013 | |||||||||||||||
| Shares | Amount | Shares | Amount | |||||||||||||
Sold: | ||||||||||||||||
Class A | 11,111,178 | $ | 497,003,093 | 6,938,918 | $ | 263,020,016 | ||||||||||
Class B | 36,745 | 1,631,827 | 65,896 | 2,465,090 | ||||||||||||
Class C | 4,539,053 | 196,758,364 | 1,723,158 | 63,962,776 | ||||||||||||
Class R | 908,413 | 40,579,106 | 629,268 | 23,479,568 | ||||||||||||
Class Y | 11,606,461 | 529,732,277 | 4,878,656 | 185,994,372 | ||||||||||||
Class R6(b) | 25,789 | 1,182,670 | 286 | 9,805 | ||||||||||||
Issued as reinvestment of dividends: | ||||||||||||||||
Class A | 886,321 | 37,385,013 | 788,153 | 26,190,326 | ||||||||||||
Class B | 14,292 | 603,698 | 30,790 | 1,027,145 | ||||||||||||
Class C | 141,126 | 5,767,810 | 75,170 | 2,568,785 | ||||||||||||
Class R | 30,735 | 1,293,625 | 13,660 | 453,388 | ||||||||||||
Class Y | 453,253 | 19,245,106 | 353,324 | 11,808,079 | ||||||||||||
Automatic conversion of Class B shares to Class A shares: | ||||||||||||||||
Class A | 230,621 | 10,198,764 | 639,095 | 23,292,837 | ||||||||||||
Class B | (230,900 | ) | (10,198,764 | ) | (638,871 | ) | (23,292,837 | ) | ||||||||
Reacquired: | ||||||||||||||||
Class A | (6,140,632 | ) | (278,307,130 | ) | (5,290,801 | ) | (196,528,690 | ) | ||||||||
Class B | (65,314 | ) | (2,918,671 | ) | (148,389 | ) | (5,360,459 | ) | ||||||||
Class C | (868,921 | ) | (37,618,045 | ) | (537,590 | ) | (19,411,827 | ) | ||||||||
Class R | (312,777 | ) | (14,030,661 | ) | (176,971 | ) | (6,647,748 | ) | ||||||||
Class Y | (3,134,890 | ) | (142,042,597 | ) | (2,498,828 | ) | (93,811,279 | ) | ||||||||
Class R6 | (493 | ) | (23,123 | ) | — | — | ||||||||||
Net increase in share activity | 19,230,060 | $ | 856,242,362 | 6,844,924 | $ | 259,219,347 | ||||||||||
| (a) | There are entities that are record owners of more than 5% of the outstanding shares of the Fund and in the aggregate own 41% of the outstanding shares of the Fund. IDI has an agreement with these entities to sell Fund shares. The Fund, Invesco and/or Invesco affiliates may make payments to these entities, which are considered to be related to the Fund, for providing services to the Fund, Invesco and/or Invesco affiliates including but not limited to services such as securities brokerage, distribution, third party record keeping and account servicing. The Fund has no knowledge as to whether all or any portion of the shares owned of record by these entities are also owned beneficially. |
| (b) | Commencement date of September 24, 2012. |
26 Invesco Equally-Weighted S&P 500 Fund
NOTE 13—Financial Highlights
The following schedule presents financial highlights for a share of the Fund outstanding throughout the periods indicated.
| Net asset value, beginning of period | Net investment income(a) | Net gains on securities (both realized and unrealized) | Total from investment operations | Dividends from net investment income | Distributions from net realized gains | Total distributions | Net asset value, end of period | Total return(b) | Net assets, end of period (000’s omitted) | Ratio of expenses to average net assets with fee waivers and/or expenses absorbed | Ratio of expenses to average net assets without fee waivers and/or expenses absorbed | Ratio of net investment income to average net assets | Portfolio turnover(c) | |||||||||||||||||||||||||||||||||||||||||||
Class A |
| |||||||||||||||||||||||||||||||||||||||||||||||||||||||
Year ended 08/31/14 | $ | 40.07 | $ | 0.59 | $ | 9.45 | $ | 10.04 | $ | (0.48 | ) | $ | (1.09 | ) | $ | (1.57 | ) | $ | 48.54 | 25.64 | % | $ | 1,506,665 | 0.56 | %(d) | 0.56 | %(d) | 1.31 | %(d) | 17 | % | |||||||||||||||||||||||||
Year ended 08/31/13 | 33.40 | 0.55 | 7.47 | 8.02 | (0.51 | ) | (0.84 | ) | (1.35 | ) | 40.07 | 24.83 | 999,730 | 0.57 | 0.57 | 1.48 | 18 | |||||||||||||||||||||||||||||||||||||||
Year ended 08/31/12 | 29.89 | 0.42 | 3.61 | 4.03 | (0.52 | ) | — | (0.52 | ) | 33.40 | 13.66 | 730,648 | 0.60 | 0.60 | 1.34 | 27 | ||||||||||||||||||||||||||||||||||||||||
Year ended 08/31/11 | 25.26 | 0.39 | 4.65 | 5.04 | (0.41 | ) | — | (0.41 | ) | 29.89 | 19.91 | 639,478 | 0.56 | 0.56 | 1.26 | 22 | ||||||||||||||||||||||||||||||||||||||||
Two months ended 08/31/10 | 24.74 | 0.08 | 0.44 | 0.52 | — | — | — | 25.26 | 2.10 | 556,910 | 0.65 | (e) | 0.65 | (e) | 1.81 | (e) | 0 | |||||||||||||||||||||||||||||||||||||||
Year ended 06/30/10 | 20.14 | 0.30 | 4.56 | 4.86 | (0.26 | ) | — | (0.26 | ) | 24.74 | 24.08 | 552,673 | 0.64 | 0.64 | 1.17 | 24 | ||||||||||||||||||||||||||||||||||||||||
Class B |
| |||||||||||||||||||||||||||||||||||||||||||||||||||||||
Year ended 08/31/14 | 40.01 | 0.25 | 9.44 | 9.69 | (0.26 | ) | (1.09 | ) | (1.35 | ) | 48.35 | 24.70 | 15,851 | 1.31 | (d) | 1.31 | (d) | 0.56 | (d) | 17 | ||||||||||||||||||||||||||||||||||||
Year ended 08/31/13 | 33.34 | 0.27 | 7.49 | 7.76 | (0.25 | ) | (0.84 | ) | (1.09 | ) | 40.01 | 23.90 | 22,925 | 1.32 | 1.32 | 0.73 | 18 | |||||||||||||||||||||||||||||||||||||||
Year ended 08/31/12 | 29.70 | 0.18 | 3.61 | 3.79 | (0.15 | ) | — | (0.15 | ) | 33.34 | 12.82 | 42,131 | 1.35 | 1.35 | 0.59 | 27 | ||||||||||||||||||||||||||||||||||||||||
Year ended 08/31/11 | 25.05 | 0.16 | 4.60 | 4.76 | (0.11 | ) | — | (0.11 | ) | 29.70 | 18.98 | 77,702 | 1.31 | 1.31 | 0.51 | 22 | ||||||||||||||||||||||||||||||||||||||||
Two months ended 08/31/10 | 24.56 | 0.05 | 0.44 | 0.49 | — | — | — | 25.05 | 2.00 | 110,367 | 1.40 | (e) | 1.40 | (e) | 1.06 | (e) | 0 | |||||||||||||||||||||||||||||||||||||||
Year ended 06/30/10 | 20.08 | 0.10 | 4.54 | 4.64 | (0.16 | ) | — | (0.16 | ) | 24.56 | 23.09 | 118,559 | 1.39 | 1.39 | 0.42 | 24 | ||||||||||||||||||||||||||||||||||||||||
Class C |
| |||||||||||||||||||||||||||||||||||||||||||||||||||||||
Year ended 08/31/14 | 38.75 | 0.25 | 9.14 | 9.39 | (0.26 | ) | (1.09 | ) | (1.35 | ) | 46.79 | 24.73 | 349,739 | 1.31 | (d) | 1.31 | (d) | 0.56 | (d) | 17 | ||||||||||||||||||||||||||||||||||||
Year ended 08/31/13 | 32.33 | 0.26 | 7.24 | 7.50 | (0.24 | ) | (0.84 | ) | (1.08 | ) | 38.75 | 23.88 | 141,986 | 1.32 | 1.32 | 0.73 | 18 | |||||||||||||||||||||||||||||||||||||||
Year ended 08/31/12 | 28.81 | 0.18 | 3.49 | 3.67 | (0.15 | ) | — | (0.15 | ) | 32.33 | 12.80 | 77,691 | 1.35 | 1.35 | 0.59 | 27 | ||||||||||||||||||||||||||||||||||||||||
Year ended 08/31/11 | 24.29 | 0.16 | 4.47 | 4.63 | (0.11 | ) | — | (0.11 | ) | 28.81 | 19.04 | 67,788 | 1.31 | 1.31 | 0.51 | 22 | ||||||||||||||||||||||||||||||||||||||||
Two months ended 08/31/10 | 23.82 | 0.04 | 0.43 | 0.47 | — | — | — | 24.29 | 1.97 | 55,797 | 1.40 | (e) | 1.40 | (e) | 1.06 | (e) | 0 | |||||||||||||||||||||||||||||||||||||||
Year ended 06/30/10 | 19.49 | 0.10 | 4.42 | 4.52 | (0.19 | ) | — | (0.19 | ) | 23.82 | 23.15 | 56,462 | 1.39 | 1.39 | 0.42 | 24 | ||||||||||||||||||||||||||||||||||||||||
Class R |
| |||||||||||||||||||||||||||||||||||||||||||||||||||||||
Year ended 08/31/14 | 39.95 | 0.48 | 9.43 | 9.91 | (0.41 | ) | (1.09 | ) | (1.50 | ) | 48.36 | 25.35 | 65,777 | 0.81 | (d) | 0.81 | (d) | 1.06 | (d) | 17 | ||||||||||||||||||||||||||||||||||||
Year ended 08/31/13 | 33.31 | 0.46 | 7.44 | 7.90 | (0.42 | ) | (0.84 | ) | (1.26 | ) | 39.95 | 24.48 | 29,320 | 0.82 | 0.82 | 1.23 | 18 | |||||||||||||||||||||||||||||||||||||||
Year ended 08/31/12 | 29.77 | 0.35 | 3.59 | 3.94 | (0.40 | ) | — | (0.40 | ) | 33.31 | 13.36 | 8,924 | 0.85 | 0.85 | 1.09 | 27 | ||||||||||||||||||||||||||||||||||||||||
Year ended 08/31/11 | 25.14 | 0.31 | 4.63 | 4.94 | (0.31 | ) | — | (0.31 | ) | 29.77 | 19.62 | 1,176 | 0.81 | 0.81 | 1.01 | 22 | ||||||||||||||||||||||||||||||||||||||||
Two months ended 08/31/10 | 24.63 | 0.07 | 0.44 | 0.51 | — | — | — | 25.14 | 2.07 | 205 | 0.90 | (e) | 0.90 | (e) | 1.56 | (e) | 0 | |||||||||||||||||||||||||||||||||||||||
Year ended 06/30/10 | 20.10 | 0.23 | 4.56 | 4.79 | (0.26 | ) | — | (0.26 | ) | 24.63 | 23.78 | 208 | 0.89 | 0.89 | 0.92 | 24 | ||||||||||||||||||||||||||||||||||||||||
Class Y |
| |||||||||||||||||||||||||||||||||||||||||||||||||||||||
Year ended 08/31/14 | 40.38 | 0.71 | 9.52 | 10.23 | (0.57 | ) | (1.09 | ) | (1.66 | ) | 48.95 | 25.95 | 1,021,247 | 0.31 | (d) | 0.31 | (d) | 1.56 | (d) | 17 | ||||||||||||||||||||||||||||||||||||
Year ended 08/31/13 | 33.64 | 0.65 | 7.52 | 8.17 | (0.59 | ) | (0.84 | ) | (1.43 | ) | 40.38 | 25.16 | 481,948 | 0.32 | 0.32 | 1.73 | 18 | |||||||||||||||||||||||||||||||||||||||
Year ended 08/31/12 | 30.13 | 0.50 | 3.63 | 4.13 | (0.62 | ) | — | (0.62 | ) | 33.64 | 13.94 | 309,645 | 0.35 | 0.35 | 1.59 | 27 | ||||||||||||||||||||||||||||||||||||||||
Year ended 08/31/11 | 25.47 | 0.47 | 4.68 | 5.15 | (0.49 | ) | — | (0.49 | ) | 30.13 | 20.19 | 178,056 | 0.31 | 0.31 | 1.51 | 22 | ||||||||||||||||||||||||||||||||||||||||
Two months ended 08/31/10 | 24.94 | 0.09 | 0.44 | 0.53 | — | — | — | 25.47 | 2.12 | 155,551 | 0.40 | (e) | 0.40 | (e) | 2.06 | (e) | 0 | |||||||||||||||||||||||||||||||||||||||
Year ended 06/30/10 | 20.27 | 0.36 | 4.59 | 4.95 | (0.28 | ) | — | (0.28 | ) | 24.94 | 24.39 | 151,901 | 0.39 | 0.39 | 1.42 | 24 | ||||||||||||||||||||||||||||||||||||||||
Class R6 |
| |||||||||||||||||||||||||||||||||||||||||||||||||||||||
Year ended 08/31/14 | 40.39 | 0.78 | 9.49 | 10.27 | (0.58 | ) | (1.09 | ) | (1.67 | ) | 48.99 | 26.05 | 1,253 | 0.22 | (d) | 0.22 | (d) | 1.65 | (d) | 17 | ||||||||||||||||||||||||||||||||||||
Year ended 08/31/13(f) | 34.93 | 0.62 | 6.27 | 6.89 | (0.59 | ) | (0.84 | ) | (1.43 | ) | 40.39 | 20.58 | 12 | 0.27 | (e) | 0.27 | (e) | 1.78 | (e) | 18 | ||||||||||||||||||||||||||||||||||||
| (a) | Calculated using average shares outstanding. |
| (b) | Includes adjustments in accordance with accounting principles generally accepted in the United States of America and as such, the net asset value for financial reporting purposes and the returns based upon those net asset values may differ from the net asset value and returns for shareholder transactions. Does not include sales charges and is not annualized for periods less than one year, if applicable. |
| (c) | Portfolio turnover is calculated at the fund level and is not annualized for periods less than one year, if applicable. |
| (d) | Ratios are based on average daily net assets (000’s omitted) of $1,294,409, $19,508, $242,471, $47,811, $705,663 and $459 for Class A, Class B, Class C, Class R, Class Y and Class R6 shares, respectively. |
| (e) | Annualized. |
| (f) | Commencement date of September 24, 2012. |
27 Invesco Equally-Weighted S&P 500 Fund
Report of Independent Registered Public Accounting Firm
To the Board of Trustees of AIM Counselor Series Trust (Invesco Counselor Series Trust)
and Shareholders of Invesco Equally-Weighted S&P 500 Fund:
In our opinion, the accompanying statement of assets and liabilities, including the schedule of investments, and the related statements of operations and of changes in net assets and the financial highlights present fairly, in all material respects, the financial position of Invesco Equally-Weighted S&P 500 Fund (one of the funds constituting AIM Counselor Series Trust (Invesco Counselor Series Trust), hereafter referred to as the “Fund”) at August 31, 2014, the results of its operations for the year then ended, the changes in its net assets for each of the two years in the period then ended and the financial highlights for each of the four years in the period then ended, the two month period ended August 31, 2010, and the year ended June 30, 2010, in conformity with accounting principles generally accepted in the United States of America. These financial statements and financial highlights (hereafter referred to as “financial statements”) are the responsibility of the Fund’s management. Our responsibility is to express an opinion on these financial statements based on our audits. We conducted our audits of these financial statements in accordance with the standards of the Public Company Accounting Oversight Board (United States). Those standards require that we plan and perform the audit to obtain reasonable assurance about whether the financial statements are free of material misstatement. An audit includes examining, on a test basis, evidence supporting the amounts and disclosures in the financial statements, assessing the accounting principles used and significant estimates made by management, and evaluating the overall financial statement presentation. We believe that our audits, which included confirmation of securities at August 31, 2014 by correspondence with the custodian and brokers, provide a reasonable basis for our opinion.
PRICEWATERHOUSECOOPERS LLP
October 27, 2014
Houston, Texas
28 Invesco Equally-Weighted S&P 500 Fund
Calculating your ongoing Fund expenses
Example
As a shareholder of the Fund, you incur two types of costs: (1) transaction costs, which may include sales charges (loads) on purchase payments or contingent deferred sales charges on redemptions, if any; and (2) ongoing costs, including management fees, distribution and/or service (12b-1) fees, and other Fund expenses. This example is intended to help you understand your ongoing costs (in dollars) of investing in the Fund and to compare these costs with ongoing costs of investing in other mutual funds. The example is based on an investment of $1,000 invested at the beginning of the period and held for the entire period March 1, 2014 through August 31, 2014.
Actual expenses
The table below provides information about actual account values and actual expenses. You may use the information in this table, together with the amount you invested, to estimate the expenses that you paid over the period. Simply divide your account value by $1,000 (for example, an $8,600 account value divided by $1,000 = 8.6), then multiply the result by the number in the table under the heading entitled “Actual Expenses Paid During Period” to estimate the expenses you paid on your account during this period.
Hypothetical example for comparison purposes
The table below also provides information about hypothetical account values and hypothetical expenses based on the Fund’s actual expense ratio and an assumed rate of return of 5% per year before expenses, which is not the Fund’s actual return.
The hypothetical account values and expenses may not be used to estimate the actual ending account balance or expenses you paid for the period. You may use this information to compare the ongoing costs of investing in the Fund and other funds. To do so, compare this 5% hypothetical example with the 5% hypothetical examples that appear in the shareholder reports of the other funds.
Please note that the expenses shown in the table are meant to highlight your ongoing costs only and do not reflect any transaction costs, such as sales charges (loads) on purchase payments or contingent deferred sales charges on redemptions, if any. Therefore, the hypothetical information is useful in comparing ongoing costs only, and will not help you determine the relative total costs of owning different funds. In addition, if these transaction costs were included, your costs would have been higher.
| Class | Beginning Account Value (03/01/14) | ACTUAL | HYPOTHETICAL (5% annual return before expenses) | Annualized Expense Ratio | ||||||||||||||||||||
| Ending Account Value (08/31/14)1 | Expenses Paid During Period2 | Ending Account Value (08/31/14) | Expenses Paid During Period2 | |||||||||||||||||||||
| A | $ | 1,000.00 | $ | 1,078.70 | $ | 2.99 | $ | 1,022.33 | $ | 2.91 | 0.57 | % | ||||||||||||
| B | 1,000.00 | 1,074.70 | 6.96 | 1,018.50 | 6.77 | 1.33 | ||||||||||||||||||
| C | 1,000.00 | 1,074.90 | 6.96 | 1,018.50 | 6.77 | 1.33 | ||||||||||||||||||
| R | 1,000.00 | 1,077.60 | 4.35 | 1,021.02 | 4.23 | 0.83 | ||||||||||||||||||
| Y | 1,000.00 | 1,080.10 | 1.73 | 1,023.54 | 1.68 | 0.33 | ||||||||||||||||||
| R6 | 1,000.00 | 1,080.70 | 1.10 | 1,024.15 | 1.07 | 0.21 | ||||||||||||||||||
| 1 | The actual ending account value is based on the actual total return of the Fund for the period March 1, 2014 through August 31, 2014, after actual expenses and will differ from the hypothetical ending account value which is based on the Fund’s expense ratio and a hypothetical annual return of 5% before expenses. |
| 2 | Expenses are equal to the Fund’s annualized expense ratio as indicated above multiplied by the average account value over the period, multiplied by 184/365 to reflect the most recent fiscal half year. |
29 Invesco Equally-Weighted S&P 500 Fund
Approval of Investment Advisory and Sub-Advisory Contracts
The Board of Trustees (the Board) of AIM Counselor Series Trust (Invesco Counselor Series Trust) is required under the Investment Company Act of 1940, as amended, to approve annually the renewal of Invesco Equally-Weighted S&P 500 Fund’s (the Fund) investment advisory agreements. During contract renewal meetings held on June 16-17, 2014, the Board as a whole, and the disinterested or “independent” Trustees, who comprise over 75% of the Board, voting separately, approved the continuance for the Fund of the Master Investment Advisory Agreement with Invesco Advisers, Inc. (Invesco Advisers) and the Master Intergroup Sub-Advisory Contract for Mutual Funds with Invesco Asset Management Deutschland GmbH, Invesco Asset Management Limited, Invesco Asset Management (Japan) Limited, Invesco Australia Limited, Invesco Hong Kong Limited, Invesco Senior Secured Management, Inc. and Invesco Canada Ltd. (collectively, the Affiliated Sub-Advisers and the sub-advisory contracts) for another year, effective July 1, 2014.
In evaluating the fairness and reasonableness of compensation under the Fund’s investment advisory agreement and sub-advisory contracts, the Board considered, among other things, the factors discussed below. The Board determined that the continuation of the Fund’s investment advisory agreement and the sub-advisory contracts are in the best interest of the Fund and its shareholders and that the compensation payable to Invesco Advisers and the Affiliated Sub-Advisers under the agreements is fair and reasonable.
The Board’s Fund Evaluation Process
The Board’s Investments Committee has established three Sub-Committees, each of which is primarily responsible for overseeing the management of a number of the funds advised by Invesco Advisers (the Invesco Funds). The Sub-Committees meet throughout the year to review the performance of their assigned Invesco Funds, including reviewing materials prepared under the direction of the independent Senior Officer, an officer of the Invesco Funds who reports directly to the independent Trustees. Over the course of each year, the Sub-Committees meet with portfolio managers for their assigned Invesco Funds and other members of management to review the performance, investment objective(s), policies, strategies, limitations and investment risks of these funds. The Sub-Committees meet regularly and at designated contract renewal meetings each year to conduct a review of the performance, fees, expenses and other matters related to their assigned Invesco Funds. Each Sub-Committee recommends to the Investments Committee, which in turn recommends to the full Board, whether and on what terms to approve the continuance of each Invesco Fund’s
investment advisory agreement and sub-advisory contracts for another year.
During the contract renewal process, the Trustees receive comparative performance and fee data regarding the Invesco Funds prepared by Invesco Advisers and Lipper Inc. (Lipper), an independent provider of investment company data. The Trustees also receive an independent written evaluation from the Senior Officer. The Senior Officer’s evaluation is prepared as part of his responsibility to manage the process by which the Invesco Funds’ proposed management fees are negotiated during the annual contract renewal process to ensure they are negotiated in a manner that is at arms’ length and reasonable. In addition to meetings with Invesco Advisers and fund counsel, the independent Trustees also discuss the continuance of the investment advisory agreement and sub-advisory contracts in separate sessions with the Senior Officer and with independent legal counsel.
The Trustees recognized that the advisory fee rates for the Invesco Funds are, in many cases, the result of years of review and negotiation. The Trustees’ deliberations and conclusions in a particular year may be based in part on their deliberations and conclusions regarding these arrangements throughout the year and in prior years. The Trustees’ review and conclusions are based on the comprehensive consideration of all information presented to them and are not the result of any single determinative factor. Moreover, one Trustee may have weighed a particular piece of information or factor differently than another Trustee.
The discussion below serves as the Senior Officer’s independent written evaluation with respect to the Fund’s investment advisory agreement as well as a discussion of the material factors and related conclusions that formed the basis for the Board’s approval of the Fund’s investment advisory agreement and sub-advisory contracts. Unless otherwise stated, this information is current as of June 17, 2014, and may not reflect consideration of factors that became known to the Board after that date.
Factors and Conclusions and Summary of Independent Written Fee Evaluation
| A. | Nature, Extent and Quality of Services Provided by Invesco Advisers and the Affiliated Sub-Advisers |
The Board reviewed the advisory services provided to the Fund by Invesco Advisers under the Fund’s investment advisory agreement, the performance of Invesco Advisers in providing these services, and the credentials and experience of the officers and employees of Invesco Advisers who provide these services, including the Fund’s portfolio manager or managers, with whom the Sub-Committees met during the year. The Board’s review of the
qualifications of Invesco Advisers to provide advisory services included the Board’s consideration of Invesco Advisers’ investment process oversight, independent credit analysis and investment risk management. The Board also considered non-advisory services that Invesco Advisers and its affiliates provide to the Invesco Funds such as various back office support functions, equity and fixed income trading operations, internal audit, distribution and legal and compliance.
In determining whether to continue the Fund’s investment advisory agreement, the Board considered the benefits of reapproving an existing relationship and the greater uncertainty that may be associated with entering into a new relationship. The Board concluded that the nature, extent and quality of the services provided to the Fund by Invesco Advisers are appropriate and satisfactory and consistent with the terms of the Fund’s investment advisory agreement.
The Board reviewed the services that may be provided by the Affiliated Sub-Advisers under the sub-advisory contracts and the credentials and experience of the officers and employees of the Affiliated Sub-Advisers who provide these services. The Board noted that the Affiliated Sub-Advisers have offices and personnel that are located in financial centers around the world. As a result, the Affiliated Sub-Advisers can provide research and investment analysis on the markets and economies of various countries in which the Fund may invest, make recommendations regarding securities and assist with security trades. The Board concluded that the sub-advisory contracts benefit the Fund and its shareholders by permitting Invesco Advisers to use the resources and talents of the Affiliated Sub-Advisers in managing the Fund. The Board concluded that the nature, extent and quality of the services that may be provided by the Affiliated Sub-Advisers are appropriate and satisfactory and consistent with the terms of the Fund’s sub-advisory contracts.
| B. | Fund Performance |
The Board considered Fund performance as a relevant factor in considering whether to approve the investment advisory agreement. The Board did not view Fund performance as a relevant factor in considering whether to approve the sub-advisory contracts for the Fund, as no Affiliated Sub-Adviser currently manages assets of the Fund.
The Board compared the Fund’s performance during the past one, three and five calendar years to the performance of funds in the Lipper performance universe and against the Lipper Multi-Cap Core Funds Index. The Board noted that performance of Class A shares of the Fund was in the second quintile of the performance universe for the one and three year periods and the first quintile for the five year period (the first quintile being the best performing funds
30 Invesco Equally-Weighted S&P 500 Fund
and the fifth quintile being the worst performing funds). The Board noted that performance of Class A shares of the Fund was above the performance of the Index for the one, three and five year periods. The Trustees also reviewed more recent Fund performance and this review did not change their conclusions.
| C. | Advisory and Sub-Advisory Fees |
The Board compared the Fund’s contractual management fee rate to the contractual management fee rates of funds in the Fund’s Lipper expense group at a common asset level. The Board noted that the contractual management fee rate for Class A shares of the Fund was below the median contractual management fee rate of funds in the expense group. The Board noted that the term “contractual management fee” may include both advisory and certain administrative services fees, but that Lipper does not provide information on a fund by fund basis as to what is included. The Board noted that Invesco Advisers does not charge the Invesco Funds for the administrative services included in the term as defined by Lipper. The Board also reviewed the methodology used by Lipper in providing expense group information, which includes using each fund’s contractual management fee schedule (including any applicable breakpoints) as reported in the most recent prospectus or statement of additional information for each fund in the expense group.
The Board noted that Invesco Advisers has contractually agreed to waive fees and/or limit expenses of the Fund through at least June 30, 2015 in an amount necessary to limit total annual operating expenses to a specified percentage of average daily net assets for each class of the Fund.
The Board also compared the Fund’s effective advisory fee rate (the advisory fee rate after advisory fee waivers and before other expense limitations/waivers) to the effective advisory fee rates of other mutual funds advised by Invesco Advisers and its affiliates that are managed using an investment process substantially similar to the investment process used for the Fund. The Board noted that the Fund’s effective advisory fee rate was the same as the effective advisory fee rate of one mutual fund with a similar investment process. The Board noted that Invesco Advisers and the Affiliated Sub-Advisers do not manage other client accounts using a similar investment process.
The Board also considered the services that may be provided by the Affiliated Sub-Advisers pursuant to the sub-advisory contracts, as well as the fees payable by Invesco Advisers to the Affiliated Sub-Advisers pursuant to the sub-advisory contracts. The Board also noted that the sub-advisory fees are not paid directly by the Fund, but rather, are payable by Invesco Advisers to the Affiliated Sub-Advisers.
| D. | Economies of Scale and Breakpoints |
The Board considered the extent to which there are economies of scale in the provision of advisory services to the Fund. The Board also considered whether the Fund benefits from
economies of scale through contractual breakpoints in the Fund’s advisory fee schedule and was assisted in this review by a report from the Senior Officer. The Board also noted that the Fund shares directly in economies of scale through lower fees charged by third party service providers based on the combined size of the Invesco Funds and other clients advised by Invesco Advisers.
| E. | Profitability and Financial Resources |
The Board reviewed information from Invesco Advisers concerning the costs of the advisory and other services that Invesco Advisers and its affiliates provide to the Fund and the profitability of Invesco Advisers and its affiliates in providing these services for the year ended December 31, 2013. The Board received information from Invesco Advisers about the methodology used to prepare the profitability information. The Board considered the profitability of Invesco Advisers in managing the Fund and the Invesco Funds. The Board noted that Invesco Advisers continues to operate at a net profit from services Invesco Advisers and its subsidiaries provide to the Invesco Funds. The Board noted that although Invesco Advisers received a minimal amount of revenues from advising the Fund. The Board received and accepted information from Invesco Advisers demonstrating that Invesco Advisers and each Affiliated Sub-Adviser are financially sound and have the resources necessary to perform their obligations under the investment advisory agreement and sub-advisory contracts.
| F. | Collateral Benefits to Invesco Advisers and its Affiliates |
The Board considered various other benefits received by Invesco Advisers and its affiliates from the relationship with the Fund, including the fees received for their provision of transfer agency and distribution services to the Fund. The Board considered comparative information regarding fees charged for these services, including information provided by Lipper and other independent sources. The Board considered the performance of Invesco Advisers and its affiliates in providing these services and the organizational structure employed to provide these services. The Board also considered that these services are provided to the Fund pursuant to written contracts that are reviewed and approved on an annual basis by the Board; that the services are required for the operation of the Fund; that Invesco Advisers and its affiliates can provide services, the nature and quality of which are at least equal to those provided by others offering the same or similar services; and that the fees for such services are fair and reasonable in light of the usual and customary charges by others for services of the same nature and quality.
The Board considered the benefits realized by Invesco Advisers and the Affiliated Sub-Advisers as a result of portfolio brokerage transactions executed through “soft dollar” arrangements. The Board noted that soft dollar arrangements shift the payment obligation for research services from Invesco Advisers and the
Affiliated Sub-Advisers to the Invesco Funds and that the research received may be used with other clients of Invesco Advisers and may reduce Invesco Advisers’ and the Affiliated Sub-Advisers’ expenses. The Board also considered that it receives periodic reports from the Chief Compliance Officer of the Invesco Funds demonstrating that these arrangements are consistent with regulatory requirements. The Board did not deem the soft dollar arrangements to be inappropriate.
The Board considered that the Fund’s uninvested cash and cash collateral from any securities lending arrangements may be invested in money market funds advised by Invesco Advisers pursuant to procedures approved by the Board. The Board noted that Invesco Advisers receives advisory fees from these affiliated money market funds attributable to such investments, although Invesco Advisers has contractually agreed to waive through varying periods the advisory fees payable by the Invesco Funds with respect to investments in the affiliated money market funds. The waiver is in an amount equal to 100% of the net advisory fee Invesco Advisers receives from the affiliated money market funds with respect to the Fund’s investment in the affiliated money market funds of uninvested cash, but not cash collateral. The Board concluded that the amount of advisory fees received by Invesco Advisors from the Fund’s investment of uninvested cash and cash collateral from any securities lending arrangements in the affiliated money market funds are fair and reasonable.
The Board also considered the Fund may use an affiliated broker to execute certain trades for the Fund to among other things, control information leakage, and were advised that such trades would be executed in compliance with rules under the Investment Company Act of 1940, as amended.
31 Invesco Equally-Weighted S&P 500 Fund
Tax Information
Form 1099-DIV, Form 1042-S and other year–end tax information provide shareholders with actual calendar year amounts that should be included in their tax returns. Shareholders should consult their tax advisors.
The following distribution information is being provided as required by the Internal Revenue Code or to meet a specific state’s requirement.
The Fund designates the following amounts or, if subsequently determined to be different, the maximum amount allowable for its fiscal year ended August 31, 2014:
Federal and State Income Tax | ||||
Long-Term Capital Gain Distributions | $ | 32,323,639 | ||
Qualified Dividend Income* | 74.35 | % | ||
Corporate Dividends Received Deduction* | 70.54 | % | ||
U.S. Treasury Obligations* | 0 | % | ||
| * | The above percentages are based on ordinary income dividends paid to shareholders during the Fund’s fiscal year. |
Non-Resident Alien Shareholders | ||||
Qualified Short-Term Gains | $ | 17,725,041 | ||
32 Invesco Equally-Weighted S&P 500 Fund
Trustees and Officers
The address of each trustee and officer is AIM Counselor Series Trust (Invesco Counselor Series Trust) (the “Trust”), 11 Greenway Plaza, Suite 1000, Houston, Texas 77046-1173. The trustees serve for the life of the Trust, subject to their earlier death, incapacitation, resignation, retirement or removal as more specifically provided in the Trust’s organizational documents. Each officer serves for a one year term or until their successors are elected and qualified. Column two below includes length of time served with predecessor entities, if any.
Name, Year of Birth and Position(s) Held with the Trust | Trustee and/ or Officer Since | Principal Occupation(s) During Past 5 Years | Number of Funds in Fund Complex Overseen by Trustee | Other Directorship(s) Held by Trustee During Past 5 Years | ||||
| Interested Persons | ||||||||
Martin L. Flanagan1 — 1960 Trustee | 2007 | Executive Director, Chief Executive Officer and President, Invesco Ltd. (ultimate parent of Invesco and a global investment management firm); Advisor to the Board, Invesco Advisers, Inc. (formerly known as Invesco Institutional (N.A.), Inc.); Trustee, The Invesco Funds; Vice Chair, Investment Company Institute; and Member of Executive Board, SMU Cox School of Business.
Formerly: Chairman and Chief Executive Officer, Invesco Advisers, Inc. (registered investment adviser); Director, Chairman, Chief Executive Officer and President, IVZ Inc. (holding company), INVESCO Group Services, Inc. (service provider) and Invesco North American Holdings, Inc. (holding company); Director, Chief Executive Officer and President, Invesco Holding Company Limited (parent of Invesco and a global investment management firm); Director, Invesco Ltd.; Chairman, Investment Company Institute and President, Co-Chief Executive Officer, Co-President, Chief Operating Officer and Chief Financial Officer, Franklin Resources, Inc. (global investment management organization). | 141 | None | ||||
Philip A. Taylor2 — 1954 Trustee, President and Principal Executive Officer | 2006 | Head of North American Retail and Senior Managing Director, Invesco Ltd.; Director, Co-Chairman, Co-President and Co-Chief Executive Officer, Invesco Advisers, Inc. (formerly known as Invesco Institutional (N.A.), Inc.) (registered investment adviser); Director, Chairman, Chief Executive Officer and President, Invesco Management Group, Inc. (formerly known as Invesco Aim Management Group, Inc.) (financial services holding company); Director and President, INVESCO Funds Group, Inc. (registered investment adviser and registered transfer agent); Director and Chairman, Invesco Investment Services, Inc. (formerly known as Invesco Aim Investment Services, Inc.) (registered transfer agent) and IVZ Distributors, Inc. (formerly known as INVESCO Distributors, Inc.) (registered broker dealer); Director, President and Chairman, Invesco Inc. (holding company) and Invesco Canada Holdings Inc. (holding company); Chief Executive Officer, Invesco Corporate Class Inc. (corporate mutual fund company) and Invesco Canada Fund Inc. (corporate mutual fund company); Director, Chairman and Chief Executive Officer, Invesco Canada Ltd. (formerly known as Invesco Trimark Ltd./Invesco Trimark Ltèe) (registered investment adviser and registered transfer agent); Trustee, President and Principal Executive Officer, The Invesco Funds (other than AIM Treasurer’s Series Trust (Invesco Treasurer’s Series Trust) and Short-Term Investments Trust); Trustee and Executive Vice President, The Invesco Funds (AIM Treasurer’s Series Trust (Invesco Treasurer’s Series Trust) and Short-Term Investments Trust only); Director, Invesco Investment Advisers LLC (formerly known as Van Kampen Asset Management); Director, Chief Executive Officer and President, Van Kampen Exchange Corp.
Formerly: Director and Chairman, Van Kampen Investor Services Inc.; Director, Chief Executive Officer and President, 1371 Preferred Inc. (holding company) and Van Kampen Investments Inc.; Director and President, AIM GP Canada Inc. (general partner for limited partnerships) and Van Kampen Advisors, Inc.; Director and Chief Executive Officer, Invesco Trimark Dealer Inc. (registered broker dealer); Director, Invesco Distributors, Inc. (formerly known as Invesco Aim Distributors, Inc.) (registered broker dealer); Manager, Invesco PowerShares Capital Management LLC; Director, Chief Executive Officer and President, Invesco Advisers, Inc.; Director, Chairman, Chief Executive Officer and President, Invesco Aim Capital Management, Inc.; President, Invesco Trimark Dealer Inc. and Invesco Trimark Ltd./Invesco Trimark Ltèe; Director and President, AIM Trimark Corporate Class Inc. and AIM Trimark Canada Fund Inc.; Senior Managing Director, Invesco Holding Company Limited; Director and Chairman, Fund Management Company (former registered broker dealer); President and Principal Executive Officer, The Invesco Funds (AIM Treasurer’s Series Trust (Invesco Treasurer’s Series Trust), and Short-Term Investments Trust only); President, AIM Trimark Global Fund Inc. and AIM Trimark Canada Fund Inc. | 141 | None | ||||
Wayne W. Whalen3 — 1939 Trustee | 2010 | Of Counsel, and prior to 2010, partner in the law firm of Skadden, Arps, Slate, Meagher & Flom LLP, legal counsel to certain funds in the Fund Complex
| 141 | Director of the Mutual fund Directors Forum, a nonprofit membership organization for investment directors; Chairman and Director of the Abraham Lincoln Presidential Library Foundation; and Director of the Stevenson Center for Democracy |
| 1 | Mr. Flanagan is considered an interested person (within the meaning of Section 2(a)(19) of the 1940 Act) of the Trust because he is an officer of the Adviser to the Trust, and an officer and a director of Invesco Ltd., ultimate parent of the Adviser. |
| 2 | Mr. Taylor is considered an interested person (within the meaning of Section 2(a)(19) of the 1940 Act) of the Trust because he is an officer and a director of the Adviser. |
| 3 | Mr. Whalen is retiring effective December 31, 2014. He has been deemed to be an interested person of the Trust because of his prior service as counsel to the predecessor funds of certain Invesco open-end funds and his affiliation with the law firm that served as counsel to such predecessor funds and the Invesco closed-end funds. |
T-1 Invesco Equally-Weighted S&P 500 Fund
Trustees and Officers—(continued)
Name, Year of Birth and Position(s) Held with the Trust | Trustee and/ or Officer Since | Principal Occupation(s) During Past 5 Years | Number of Funds in Fund Complex Overseen by Trustee | Other Directorship(s) Past 5 Years | ||||
| Independent Trustees | ||||||||
Bruce L. Crockett — 1944 Trustee and Chair | 2003 | Chairman, Crockett Technologies Associates (technology consulting company)
Formerly: Director, Captaris (unified messaging provider); Director, President and Chief Executive Officer, COMSAT Corporation; Chairman, Board of Governors of INTELSAT (international communications company); ACE Limited (insurance company); and Investment Company Institute | 141 | ALPS (Attorneys Liability Protection Society) (insurance company) | ||||
David C. Arch — 1945 Trustee | 2010 | Chairman of Blistex Inc., a consumer health care products manufacturer | 141 | Board member of the Illinois Manufacturers’ Association; Member of the Board of Visitors, Institute for the Humanities, University of Michigan; Member of the Audit Committee of the Edward-Elmhurst Hospital | ||||
Frank S. Bayley — 1939 Trustee | 2003 | Retired. Formerly: Director, Badgley Funds Inc. (registered investment company) (2 portfolios) and General Partner and Of Counsel, law firm of Baker & McKenzie, LLP | 141 | Director and Chairman, C.D. Stimson Company (a real estate investment company); Trustee, The Curtis Institute of Music | ||||
James T. Bunch — 1942 Trustee | 2000 | Managing Member, Grumman Hill Group LLC (family office private equity investments)
Formerly: Founder, Green Manning & Bunch Ltd. (investment banking firm) (1988-2010); Executive Committee, United States Golf Association; and Director, Policy Studies, Inc. and Van Gilder Insurance Corporation | 141 | Chairman, Board of Governors, Western Golf Association; Chairman, Evans Scholars Foundation; and Director, Denver Film Society | ||||
Rodney F. Dammeyer — 1940 Trustee | 2010 | Chairman of CAC, LLC, (private company offering capital investment and management advisory services)
Formerly: Prior to 2001, Managing Partner at Equity Group Corporate Investments; Prior to 1995, Chief Executive Officer of Itel Corporation (formerly Anixter International); Prior to 1985, experience includes Senior Vice President and Chief Financial Officer of Household International, Inc., Executive Vice President and Chief Financial Officer of Northwest Industries, Inc. and Partner of Arthur Andersen & Co.; From 1987 to 2010, Director/Trustee of investment companies in the Van Kampen Funds complex | 141 | Director of Quidel Corporation and Stericycle, Inc. | ||||
Albert R. Dowden — 1941 Trustee | 2003 | Director of a number of public and private business corporations, including the Boss Group, Ltd. (private investment and management); Nature’s Sunshine Products, Inc. and Reich & Tang Funds (5 portfolios) (registered investment company)
Formerly: Director, Homeowners of America Holding Corporation/Homeowners of America Insurance Company (property casualty company); Director, Continental Energy Services, LLC (oil and gas pipeline service); Director, CompuDyne Corporation (provider of product and services to the public security market) and Director, Annuity and Life Re (Holdings), Ltd. (reinsurance company); Director, President and Chief Executive Officer, Volvo Group North America, Inc.; Senior Vice President, AB Volvo; Director of various public and private corporations; Chairman, DHJ Media, Inc.; Director, Magellan Insurance Company; and Director, The Hertz Corporation, Genmar Corporation (boat manufacturer), National Media Corporation; Advisory Board of Rotary Power International (designer, manufacturer, and seller of rotary power engines); and Chairman, Cortland Trust, Inc. (registered investment company) | 141 | Director of: Nature’s Sunshine Products, Inc., Reich & Tang Funds, Homeowners of America Holding Corporation/ Homeowners of America Insurance Company, the Boss Group | ||||
Jack M. Fields — 1952 Trustee | 2003 | Chief Executive Officer, Twenty First Century Group, Inc. (government affairs company); Owner and Chief Executive Officer, Dos Angeles Ranch, L.P. (cattle, hunting, corporate entertainment); and Discovery Global Education Fund (non-profit)
Formerly: Chief Executive Officer, Texana Timber LP (sustainable forestry company); Director of Cross Timbers Quail Research Ranch (non-profit); and member of the U.S. House of Representatives | 141 | Insperity, Inc. (formerly known as Administaff) | ||||
Prema Mathai-Davis — 1950 Trustee | 2003 | Retired. Formerly: Chief Executive Officer, YWCA of the U.S.A. | 141 | None | ||||
Larry Soll — 1942 Trustee | 1997 | Retired. Formerly: Chairman, Chief Executive Officer and President, Synergen Corp. (a biotechnology company) | 141 | None | ||||
Hugo F. Sonnenschein — 1940 Trustee | 2010 | President Emeritus and Honorary Trustee of the University of Chicago and the Adam Smith Distinguished Service Professor in the Department of Economics at the University of Chicago. Prior to 2000, President of the University of Chicago | 141 | Trustee of the University of Rochester and a member of its investment committee; Member of the National Academy of Sciences and the American Philosophical Society; Fellow of the American Academy of Arts and Sciences |
T-2 Invesco Equally-Weighted S&P 500 Fund
Trustees and Officers—(continued)
Name, Year of Birth and Position(s) Held with the Trust | Trustee and/ or Officer Since | Principal Occupation(s) During Past 5 Years | Number of Funds in Fund Complex Overseen by Trustee | Other Directorship(s) Past 5 Years | ||||
| Independent Trustees—(continued) | ||||||||
Raymond Stickel, Jr. — 1944 Trustee | 2005 | Retired. Formerly: Director, Mainstay VP Series Funds, Inc. (25 portfolios) and Partner, Deloitte & Touche | 141 | None | ||||
Suzanne H. Woolsey — 1941 Trustee | 2014 | Chief Executive Officer of Woolsey Partners LLC | 141 | Emeritus Chair of the Board of Trustees of the Institute for Defense Analyses; Trustee of Colorado College; Trustee of California Institute of Technology; Prior to 2014, Director of Fluor Corp.; Prior to 2010, Trustee of the German Marshall Fund of the United States; Prior to 2010 Trustee of the Rocky Mountain Institute | ||||
| Other Officers | ||||||||
Russell C. Burk — 1958 Senior Vice President and Senior Officer | 2005 | Senior Vice President and Senior Officer, The Invesco Funds | N/A | N/A | ||||
John M. Zerr — 1962 Senior Vice President, Chief Legal Officer and Secretary | 2006 | Director, Senior Vice President, Secretary and General Counsel, Invesco Management Group, Inc. (formerly known as Invesco Aim Management Group, Inc.) and Van Kampen Exchange Corp.; Senior Vice President, Invesco Advisers, Inc. (formerly known as Invesco Institutional (N.A.), Inc.) (registered investment adviser); Senior Vice President and Secretary, Invesco Distributors, Inc. (formerly known as Invesco Aim Distributors, Inc.); Director, Vice President and Secretary, Invesco Investment Services, Inc. (formerly known as Invesco Aim Investment Services, Inc.) and IVZ Distributors, Inc. (formerly known as INVESCO Distributors, Inc.); Director and Vice President, INVESCO Funds Group, Inc.; Senior Vice President, Chief Legal Officer and Secretary, The Invesco Funds; Manager, Invesco PowerShares Capital Management LLC; Director, Secretary and General Counsel, Invesco Investment Advisers LLC (formerly known as Van Kampen Asset Management); Secretary and General Counsel, Invesco Capital Markets, Inc. (formerly known as Van Kampen Funds Inc.) and Chief Legal Officer, PowerShares Exchange-Traded Fund Trust, PowerShares Exchange-Traded Fund Trust II, PowerShares India Exchange-Traded Fund Trust and PowerShares Actively Managed Exchange-Traded Fund Trust
Formerly: Director and Vice President, Van Kampen Advisors Inc.; Director, Vice President, Secretary and General Counsel, Van Kampen Investor Services Inc.; Director, Invesco Distributors, Inc. (formerly known as Invesco Aim Distributors, Inc.); Director, Senior Vice President, General Counsel and Secretary, Invesco Aim Advisers, Inc. and Van Kampen Investments Inc.; Director, Vice President and Secretary, Fund Management Company; Director, Senior Vice President, Secretary, General Counsel and Vice President, Invesco Aim Capital Management, Inc.; Chief Operating Officer and General Counsel, Liberty Ridge Capital, Inc. (an investment adviser); Vice President and Secretary, PBHG Funds (an investment company) and PBHG Insurance Series Fund (an investment company); Chief Operating Officer, General Counsel and Secretary, Old Mutual Investment Partners (a broker-dealer); General Counsel and Secretary, Old Mutual Fund Services (an administrator) and Old Mutual Shareholder Services (a shareholder servicing center); Executive Vice President, General Counsel and Secretary, Old Mutual Capital, Inc. (an investment adviser); and Vice President and Secretary, Old Mutual Advisors Funds (an investment company) | N/A | N/A | ||||
Sheri Morris — 1964 Vice President, Treasurer and Principal Financial Officer | 2003 | Vice President, Treasurer and Principal Financial Officer, The Invesco Funds; Vice President, Invesco Advisers, Inc. (formerly known as Invesco Institutional (N.A.), Inc.) (registered investment adviser); and Vice President, PowerShares Exchange-Traded Fund Trust, PowerShares Exchange-Traded Fund Trust II, PowerShares India Exchange-Traded Fund Trust and PowerShares Actively Managed Exchange-Traded Fund Trust
Formerly: Vice President, Invesco Aim Advisers, Inc., Invesco Aim Capital Management, Inc. and Invesco Aim Private Asset Management, Inc.; Assistant Vice President and Assistant Treasurer, The Invesco Funds and Assistant Vice President, Invesco Advisers, Inc., Invesco Aim Capital Management, Inc. and Invesco Aim Private Asset Management, Inc.; and Treasurer, PowerShares Exchange-Traded Fund Trust, PowerShares Exchange-Traded Fund Trust II, PowerShares India Exchange-Traded Fund Trust and PowerShares Actively Managed Exchange-Traded Fund Trust | N/A | N/A | ||||
T-3 Invesco Equally-Weighted S&P 500 Fund
Trustees and Officers—(continued)
Name, Year of Birth and Position(s) Held with the Trust | Trustee and/ or Officer Since | Principal Occupation(s) During Past 5 Years | Number of Funds in Fund Complex Overseen by Trustee | Other Directorship(s) Past 5 Years | ||||
| Other Officers—(continued) | ||||||||
Karen Dunn Kelley — 1960 Vice President | 2003 | Senior Managing Director, Investments; Director, Co-President, Co-Chief Executive Officer, and Co-Chairman, Invesco Advisers, Inc. (formerly known as Invesco Institutional (N.A.), Inc.) (registered investment adviser); Chairman, Invesco Senior Secured Management, Inc.; Senior Vice President, Invesco Management Group, Inc. (formerly known as Invesco Aim Management Group, Inc.); Executive Vice President, Invesco Distributors, Inc. (formerly known as Invesco Aim Distributors, Inc.); Director, Invesco Mortgage Capital Inc. and Invesco Management Company Limited; Director and President, INVESCO Asset Management (Bermuda) Ltd., Vice President, The Invesco Funds (other than AIM Treasurer’s Series Trust (Invesco Treasurer’s Series Trust) and Short-Term Investments Trust); and President and Principal Executive Officer, The Invesco Funds (AIM Treasurer’s Series Trust (Invesco Treasurer’s Series Trust) and Short-Term Investments Trust only)
Formerly: Director, INVESCO Global Asset Management Limited and INVESCO Management S.A.; Senior Vice President, Van Kampen Investments Inc. and Invesco Advisers, Inc. (formerly known as Invesco Institutional (N.A.), Inc.) (registered investment adviser); Vice President, Invesco Advisers, Inc. (formerly known as Invesco Institutional (N.A.), Inc.); Director of Cash Management and Senior Vice President, Invesco Advisers, Inc. and Invesco Aim Capital Management, Inc.; Director and President, Fund Management Company; Chief Cash Management Officer, Director of Cash Management, Senior Vice President, and Managing Director, Invesco Aim Capital Management, Inc.; Director of Cash Management, Senior Vice President, and Vice President, Invesco Advisers, Inc. and The Invesco Funds (AIM Treasurer’s Series Trust (Invesco Treasurer’s Series Trust), and Short-Term Investments Trust only) | N/A | N/A | ||||
Crissie M. Wisdom — 1969 Anti-Money Laundering Compliance Officer | 2013 | Anti-Money Laundering Compliance Officer, Invesco Advisers, Inc. (formerly known as Invesco Institutional (N.A.), Inc.) (registered investment adviser), Invesco Capital Markets, Inc. (formerly known as Van Kampen Funds Inc.), Invesco Distributors, Inc., Invesco Investment Services, Inc., Invesco Management Group, Inc., Van Kampen Exchange Corp., The Invesco Funds, and PowerShares Exchange-Traded Fund Trust, PowerShares Exchange-Traded Fund Trust II, PowerShares India Exchange-Traded Fund Trust, and PowerShares Actively Managed Exchange-Traded Fund Trust; and Fraud Prevention Manager and Controls and Risk Analysis Manager for Invesco Investment Services, Inc. | N/A | N/A | ||||
Todd L. Spillane — 1958 Chief Compliance Officer | 2006 | Senior Vice President, Invesco Management Group, Inc. (formerly known as Invesco Aim Management Group, Inc.) and Van Kampen Exchange Corp.; Senior Vice President and Chief Compliance Officer, Invesco Advisers, Inc. (registered investment adviser) (formerly known as Invesco Institutional (N.A.), Inc.); Chief Compliance Officer, The Invesco Funds; Vice President, Invesco Distributors, Inc. (formerly known as Invesco Aim Distributors, Inc.) and Invesco Investment Services, Inc. (formerly known as Invesco Aim Investment Services, Inc.)
Formerly: Chief Compliance Officer, Invesco Funds (Chicago); Senior Vice President, Van Kampen Investments Inc.; Senior Vice President and Chief Compliance Officer, Invesco Aim Advisers, Inc. and Invesco Aim Capital Management, Inc.; Chief Compliance Officer, INVESCO Private Capital Investments, Inc. (holding company), Invesco Private Capital, Inc. (registered investment adviser), Invesco Global Asset Management (N.A.), Inc., Invesco Senior Secured Management, Inc. (registered investment adviser), Van Kampen Investor Services Inc., PowerShares Exchange-Traded Fund Trust, PowerShares Exchange-Traded Fund Trust II, PowerShares India Exchange-Traded Fund Trust and PowerShares Actively Managed Exchange-Traded Fund Trust; and Vice President, Invesco Aim Capital Management, Inc. and Fund Management Company | N/A | N/A |
The Statement of Additional Information of the Trust includes additional information about the Fund’s Trustees and is available upon request, without charge, by calling 1.800.959.4246. Please refer to the Fund’s prospectus for information on the Fund’s sub-advisers.
Office of the Fund 11 Greenway Plaza, Suite 1000 Houston, TX 77046-1173 | Investment Adviser Invesco Advisers, Inc. 1555 Peachtree Street, N.E. Atlanta, GA 30309 | Distributor Invesco Distributors, Inc. 11 Greenway Plaza, Suite 1000 Houston, TX 77046-1173 | Auditors PricewaterhouseCoopers LLP 1201 Louisiana Street, Suite 2900 Houston, TX 77002-5678 | |||
Counsel to the Fund Stradley Ronon Stevens & Young, LLP 2005 Market Street, Suite 2600 Philadelphia, PA 19103-7018 | Counsel to the Independent Trustees Goodwin Procter LLP 901 New York Avenue, N.W. Washington, D.C. 20001 | Transfer Agent Invesco Investment Services, Inc. 11 Greenway Plaza, Suite 1000 Houston, TX 77046-1173 | Custodian State Street Bank and Trust Company 225 Franklin Street Boston, MA 02110-2801 | |||
T-4 Invesco Equally-Weighted S&P 500 Fund

Invesco mailing information
Send general correspondence to Invesco Investment Services, Inc., P.O. Box 219078, Kansas City, MO 64121-9078.
Important notice regarding delivery of security holder documents
To reduce Fund expenses, only one copy of most shareholder documents may be mailed to shareholders with multiple accounts at the same address (Householding). Mailing of your shareholder documents may be householded indefinitely unless you instruct us otherwise. If you do not want the mailing of these documents to be combined with those for other members of your household, please contact Invesco Investment Services, Inc. at 800 959 4246 or contact your financial institution. We will begin sending you individual copies for each account within 30 days after receiving your request.
Fund holdings and proxy voting information
The Fund provides a complete list of its holdings four times in each fiscal year, at the quarter ends. For the second and fourth quarters, the lists appear in the Fund’s semiannual and annual reports to shareholders. For the first and third quarters, the Fund files the lists with the Securities and Exchange Commission (SEC) on Form N-Q. The most recent list of portfolio holdings is available at invesco.com/completeqtrholdings. Shareholders can also look up the Fund’s Forms N-Q on the SEC website at sec.gov. Copies of the Fund’s Forms N-Q may be reviewed and copied at the SEC Public Reference Room in Washington, D.C. You can obtain information on the operation of the Public Reference Room, including information about duplicating fee charges, by calling 202 551 8090 or 800 732 0330, or by electronic request at the following email address: publicinfo@sec.gov. The SEC file numbers for the Fund are shown below.
A description of the policies and procedures that the Fund uses to determine how to vote proxies relating to portfolio securities is available without charge, upon request, from our Client Services department at 800 959 4246 or at invesco.com/proxyguidelines. The information is also available on the SEC website, sec.gov. Information regarding how the Fund voted proxies related to its portfolio securities during the most recent 12-month period ended June 30 is available at invesco.com/proxysearch. The information is also available on the SEC website, sec.gov. Invesco Advisers, Inc. is an investment adviser; it provides investment advisory services to individual and institutional clients and does not sell securities. Invesco Distributors, Inc. is the US distributor for Invesco Ltd.’s retail mutual funds, exchange-traded funds and institutional money market funds. Both are wholly owned, indirect subsidiaries of Invesco Ltd. |  |
| SEC file numbers: 811-09913 and 333-36074 MS-EWSP-AR-1 Invesco Distributors, Inc. |
`
Letters to Shareholders
Philip Taylor | Dear Shareholders: This annual report includes information about your Fund, including performance data and a complete list of its investments as of the close of the reporting period. Inside, your Fund’s portfolio managers discuss how they managed your Fund and the factors that affected its performance during the reporting period. I hope you find this report of interest. During the reporting period covered by this report, the US economy showed signs of continued improvement. After contracting in the first quarter of 2014, the economy expanded strongly in the second quarter and unemployment trended lower. Much of the credit for this improvement goes to the US Federal Reserve (the Fed), which undertook an extraordinary asset purchase program following the global financial crisis. The Fed’s goal was to jumpstart the economy by encouraging banks to lend more, businesses to hire more and consumers to spend more. Signs of a stronger | |
| US economy prompted the Fed to reduce, or “taper,” its asset purchase program. Despite this, interest rates remained near historical low levels due largely to heavy investor demand for bonds. While signs of economic improvement were evident in the US, European economies remained relatively stagnant. During the reporting period, high unemployment persisted, worries about potential deflation grew, and uncertainty about Russian-Ukrainian tensions weighed on European markets. | ||

Extended periods of market strength can lull investors into complacency – just as prolonged periods of market weakness or volatility can discourage investors from initiating long-term investment plans. That’s why Invesco has always encouraged investors to work with a professional financial adviser who can stress the importance of starting to save and invest early and the importance of adhering to a disciplined investment plan – when times are good and when they’re uncertain. A financial adviser who knows your unique financial situation, investment goals and risk tolerance can be an invaluable partner as you seek to achieve your financial goals. He or she can offer a long-term perspective when markets are volatile and time-tested advice and guidance when your financial situation or investment goals change.
Timely information when and where you want it
Invesco’s efforts to help investors achieve their financial objectives include providing individual investors and financial professionals with timely information about the markets, the economy and investing – whenever and wherever they want it.
Our website, invesco.com/us, offers a wide range of market insights and investment perspectives. On the website, you’ll find detailed information about our funds, including prices, performance, holdings and portfolio manager commentaries. You can access information about your individual Invesco account whenever it’s convenient for you; just complete a simple, secure online registration. Use the “Login” box on our home page to get started.
Invesco’s mobile app for iPad® (available free from the App StoreSM) allows you to obtain the same detailed information about your Fund and the same investment insights from our investment leaders, market strategists, economists and retirement experts on the go. You also can watch portfolio manager videos and have instant access to Invesco news and updates wherever you may be.
In addition to the resources accessible on our website and through our mobile app, you can obtain timely updates to help you stay informed about the markets, the economy and investing by connecting with Invesco on Twitter, LinkedIn or Facebook. You can access our blog at blog.invesco.us.com or by clicking the “Intentional Investing Forum” link on our home page. Our goal is to provide you the information you want, when and where you want it.
Have questions?
For questions about your account, feel free to contact an Invesco client services representative at 800 959 4246. For Invesco-related questions or comments, please email me directly at phil@invesco.com.
All of us at Invesco look forward to serving your investment management needs for many years to come. Thank you for investing with us.
Sincerely,

Philip Taylor
Senior Managing Director, Invesco Ltd.
iPad is a trademark of Apple Inc., registered in the US and other countries. App Store is a service mark of Apple Inc. Invesco Distributors, Inc. is not affiliated with Apple Inc.
2 Invesco Equity and Income Fund
Bruce Crockett | Dear Fellow Shareholders: There are a variety of factors that can impact investment performance, many of which are uncontrollable by us as investors. These factors can include various economic trends and geopolitical developments. While the members of the Invesco Funds Board, which I chair, can’t dictate the performance of the Invesco funds, be assured that your Board works diligently throughout the year to focus on how your investments are managed. Our job is to represent you and your interests on a variety of fund management-related matters. We regularly monitor how the portfolio management teams of the Invesco funds are performing in light of ever-changing and often unpredictable economic and market conditions. We review the investment strategies and investment process employed by each fund’s management team as explained in the fund’s prospectus. Perhaps our most significant responsibility is conducting the annual review of the funds’ |

advisory and sub-advisory contracts with Invesco Advisers and its affiliates. This annual review, which is required by the Investment Company Act of 1940, focuses on the nature and quality of the services Invesco provides as the adviser to the Invesco funds and the reasonableness of the fees that it charges for those services. Each year, we spend months carefully reviewing information from Invesco that allows us to evaluate the quality of its services and the reasonableness of its fees. We also use information from a variety of independent sources, including materials provided by the independent senior officer of the Invesco funds, who reports directly to the independent trustees on the Board. Additionally, we meet with legal counsel and review performance and fee data prepared for us by Lipper Inc., an independent, third-party firm widely recognized as a leader in its field.
After a careful review, the members of the Invesco Funds Board approved the continuation of advisory and sub-advisory contracts with Invesco Advisers and its affiliates. Be assured that your Board will continue working on behalf of fund shareholders, keeping your needs and interests uppermost in our minds.
As always, please contact me at bruce@brucecrockett.com with any questions or concerns you may have. On behalf of the Board, we look forward to continuing to represent your interests and serving your needs.
Sincerely,

Bruce L. Crockett
Independent Chair
Invesco Funds Board of Trustees
3 Invesco Equity and Income Fund
Management’s Discussion of Fund Performance
Performance summary
For the fiscal year ended August 31, 2014, Invesco Equity and Income Fund underperformed the Russell 1000 Value Index, its broad market benchmark. Both sector allocation and stock selection negatively impacted overall performance.
Your Fund’s long-term performance appears later in this report.
Fund vs. Indexes
Total returns, 8/31/13 to 8/31/14, at net asset value (NAV). Performance shown does not include applicable contingent deferred sales charges (CDSC) or front-end sales charges, which would have reduced performance.
Class A Shares | 17.86 | % | ||
Class B Shares | 17.01 | |||
Class C Shares | 17.03 | |||
Class R Shares | 17.60 | |||
Class Y Shares | 18.25 | |||
Class R5 Shares | 18.22 | |||
Class R6 Shares | 18.44 | |||
Russell 1000 Value Indexq (Broad Market Index) | 24.43 | |||
Barclays U.S. Government/Credit Indexq (Style-Specific Index) | 5.82 |
Source(s): qFactSet Research Systems Inc.
How we invest
We call our investment philosophy within stock investing “value with a catalyst.” We believe undervalued companies that are experiencing positive changes (i.e., “catalysts”) have the potential to generate long-term stock price equity for shareholders. We generally seek to identify companies that are undervalued, earning below their potential and are out of favor with investors. Then, from these companies, we attempt to identify catalysts that may improve the financial results and/or correct the undervaluation. Examples of catalysts typically include improved operational efficiency, changing industry dynamics and/or a change in management.
We initially identify potential investments through a series of quantitative screens, which look at valuation and rate of return metrics. We then conduct fundamental research on the most attractive
opportunities. The research process includes a thorough review of a company’s financial statements, an evaluation of its competitive position and stability, and meetings with its executives. During the research process, we also value the company under various scenarios to determine if the investment is an attractive opportunity relative to its risks. This is also where we typically identify the positive catalyst, a prerequisite for potential investment. Finally, we generally set a price target for a stock based on normalized earnings and historical valuation multiples.
In short, our objective is to exploit perceived market skepticism toward a company’s stock by analyzing the company’s operations in the context of a cyclical environment and identifying one or more catalysts that may improve the company’s financial performance. Improved financial performance, in turn, has the potential to drive the company’s stock price higher.
We typically sell an investment when it reaches our estimate of fair value or when we identify a more attractive investment opportunity.
Market conditions and your Fund
US equity market indexes generally rose during the fiscal year ended August 31, 2014. Corporate earnings were resilient in the face of modest economic growth, driven by strong profitability across many sectors, and fundamentals for corporations and consumers remained relatively positive. However, the fiscal year began amid uncertainty created by a two-week federal government shutdown. Despite this and the announcement by the US Federal Reserve (the Fed) in December that it would begin reducing the scope of its asset purchase program in early 2014, US equities rallied through the end of 2013. The market turned volatile in the first months of 2014 as investors began to worry that stocks may have risen too far, too fast. While political upheaval in Ukraine and signs of economic sluggishness in the US and China contributed to investor uncertainty, economic data remained strong enough that the Fed continued to reduce its asset purchase program on schedule. The continued “good but not great” economic environment and historically low interest rates generally led stocks higher throughout the end of the fiscal year.
All sectors within the Russell 1000 Value Index posted strong returns for the reporting period, with telecommunication services and consumer staples sectors posting returns in the teens, and all other sectors posting returns over 20%.
On the positive side, select Fund holdings in the energy sector were among the largest contributors to Fund performance for the reporting period. Baker Hughes, an oil and gas services company, and
Portfolio Composition
By security type
| Common Stocks and Other Equity Interests | 63.5 | % | ||
| Bonds and Notes | 20.9 | |||
| US Treasury Securities | 5.2 | |||
| Preferred Stocks | 1.1 | |||
| Security Types Each Less Than 1% of Portfolio | 0.8 | |||
| Money Market Funds Plus Other Assets Less Liabilities | 8.5 |
Top 10 Equity Holdings*
| 1. | JPMorgan Chase & Co. | 2.7% | ||||
| 2. | Citigroup Inc. | 2.7 | ||||
| 3. | General Electric Co. | 1.9 | ||||
| 4. | Royal Dutch Shell PLC-Class A | 1.6 | ||||
| 5. | Morgan Stanley | 1.4 | ||||
| 6. | Applied Materials, Inc. | 1.3 | ||||
| 7. | eBay Inc. | 1.2 | ||||
| 8. | Adobe Systems Inc. | 1.2 | ||||
| 9. | Viacom Inc.-Class B | 1.1 | ||||
| 10. | PNC Financial Services Group, Inc. (The) | 1.1 |
Total Net Assets | $ | 13.8 billion | ||
| Total Number of Holdings* | 452 | |||
The Fund’s holdings are subject to change, and there is no assurance that the Fund will continue to hold any particular security.
*Excluding money market fund holdings.
4 Invesco Equity and Income Fund
Canadian Natural Resources, an oil and gas producer, were among the top performing holdings within this sector. Canadian Natural Resources pleased investors as it increased dividends and surpassed earnings estimates during the latter part of the reporting period based on higher production and improvements in realized pricing in oil and gas. Also, having a material underweight position in Exxon Mobil versus the Fund’s broad market benchmark contributed to relative performance, as the stock underperformed both the energy sector and the broad market benchmark.
Strong stock selection and an underweight position in the utilities sector was also a large contributor to performance versus the Fund’s broad market benchmark. Within this sector, Pepco Holdings was a strong contributor, as the stock rallied following an announcement that the company would be acquired for a premium. The stock posted returns of over 35% for the reporting period, outperforming the sector and the broad market benchmark. We sold our position in Pepco Holdings toward the end of the reporting period.
Stock selection within the telecommunication services sector also enhanced relative performance. Not owning AT&T was the main contributor within this sector, as the stock materially underperformed the broad market benchmark and the sector, only posting single-digit returns for the reporting period.
On the negative side, stock selection within the consumer staples sector hindered relative performance. Avon Products was the largest detractor within the sector due to lowered earnings guidance and missed earnings targets in late fall 2013 and again in May 2014.
The Fund attempts to remain fully invested, while attempting to target cash below 5% under normal market environments. Even though the average cash position was not exceptionally high during the reporting period, cash detracted from Fund performance in a strong equity market.
The allocation to investment grade corporate bonds, government agency bonds and US Treasury bonds was a valuable source of income, helping dampen overall portfolio volatility. However, they detracted from relative performance versus the broad market benchmark, as bonds meaningfully underperformed equities during the reporting period. The allocation to convertible bonds provided
positive absolute returns, while detracting from relative performance, as convertible bonds underperformed the broad market benchmark.
We used currency forward contracts during the reporting period for the purpose of hedging currency exposure of non-US-based companies held in the Fund. Derivatives were used primarily for the purpose of hedging and not for speculative purposes or leverage. The use of currency forward contracts had a negligible impact on performance relative to its broad market benchmark.
Equity markets, although providing investors strong absolute returns, experienced continued volatility during the reporting period, based on the anticipation of the Fed slowing its asset purchases and rising interest rates that may result. We believe that market volatility creates opportunities to invest in companies with attractive valuations and strong fundamentals. We believe that ultimately those valuations and fundamentals will be reflected in those companies’ stock prices.
Thank you for your investment in Invesco Equity and Income Fund and for sharing our long-term investment horizon.
The views and opinions expressed in management’s discussion of Fund performance are those of Invesco Advisers, Inc. These views and opinions are subject to change at any time based on factors such as market and economic conditions. These views and opinions may not be relied upon as investment advice or recommendations, or as an offer for a particular security. The information is not a complete analysis of every aspect of any market, country, industry, security or the Fund. Statements of fact are from sources considered reliable, but Invesco Advisers, Inc. makes no representation or warranty as to their completeness or accuracy. Although historical performance is no guarantee of future results, these insights may help you understand our investment management philosophy.
See important Fund and, if applicable, index disclosures later in this report.
 | Thomas Bastian Chartered Financial Analyst, Portfolio Manager, is lead manager of Invesco Equity and Income | |
| Fund. He joined Invesco in 2010. Mr. Bastian earned a BA in accounting from St. John’s University and an MBA in finance from University of Michigan. | ||
 | Chuck Burge Portfolio Manager, is manager of Invesco Equity and Income Fund. He joined Invesco in 2002. | |
| Mr. Burge earned a BS in economics from Texas A&M University and an MBA in finance and accounting from Rice University. | ||
 | Mary Jayne Maly Chartered Financial Analyst, Portfolio Manager, is manager of Invesco Equity and Income Fund. She | |
| joined Invesco in 2010. Ms. Maly earned a BA from the University of Pittsburgh and an MBA from the Thunderbird School of Global Management. | ||
 | Sergio Marcheli Portfolio Manager, is manager of Invesco Equity and Income Fund. He joined Invesco in 2010. | |
| Mr. Marcheli earned a BBA from the University of Houston and an MBA from the University of St. Thomas. | ||
 | James Roeder Chartered Financial Analyst, Portfolio Manager, is manager of Invesco Equity and Income Fund. He | |
| joined Invesco in 2010. Mr. Roeder earned a BS in accounting from Clemson University and an MBA in economics and finance from the University of Chicago Booth School of Business. | ||
| 5 Invesco Equity and Income Fund |
Your Fund’s Long-Term Performance
Results of a $10,000 Investment — Oldest Share Class(es)
Fund and index data from 8/31/04
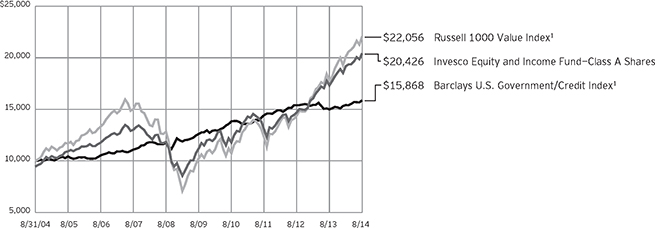
1 Source: FactSet Research Systems Inc.
Past performance cannot guarantee comparable future results.
The data shown in the chart include reinvested distributions, applicable sales charges and Fund expenses including management fees. Index results include reinvested dividends, but they do not reflect sales charges. Performance of the
peer group, if applicable, reflects fund expenses and management fees; performance of a market index does not. Performance shown in the chart and table(s) does not reflect deduction of taxes a shareholder would pay on Fund distributions or sale of Fund shares.
6 Invesco Equity and Income Fund
Average Annual Total Returns
As of 8/31/14, including maximum applicable sales charges
Class A Shares | ||||
Inception (8/3/60) | 10.36 | % | ||
10 Years | 7.40 | |||
5 Years | 11.50 | |||
1 Year | 11.34 | |||
Class B Shares | ||||
Inception (5/1/92) | 9.93 | % | ||
10 Years | 7.74 | |||
5 Years | 12.09 | |||
1 Year | 12.01 | |||
Class C Shares | ||||
Inception (7/6/93) | 9.21 | % | ||
10 Years | 7.23 | |||
5 Years | 11.94 | |||
1 Year | 16.03 | |||
Class R Shares | ||||
Inception (10/1/02) | 8.74 | % | ||
10 Years | 7.75 | |||
5 Years | 12.48 | |||
1 Year | 17.60 | |||
Class Y Shares | ||||
Inception (12/22/04) | 7.56 | % | ||
5 Years | 13.06 | |||
1 Year | 18.25 | |||
Class R5 Shares | ||||
10 Years | 8.17 | % | ||
5 Years | 13.10 | |||
1 Year | 18.22 | |||
Class R6 Shares | ||||
10 Years | 8.10 | % | ||
5 Years | 12.94 | |||
1 Year | 18.44 | |||
Effective June 1, 2010, Class A, Class B, Class C, Class I and Class R shares of the predecessor fund, Van Kampen Equity and Income Fund, advised by Van Kampen Asset Management were reorganized into Class A, Class B, Class C, Class Y and Class R shares, respectively, of Invesco Van Kampen Equity and Income Fund (renamed Invesco Equity and Income Fund). Returns shown above for Class A, Class B, Class C, Class R and Class Y shares are blended returns of the predecessor fund and Invesco Equity and Income Fund. Share class returns will differ from the predecessor fund because of different expenses.
Class R5 shares incepted on June 1, 2010. Performance shown prior to that date is that of the predecessor fund’s Class A shares and includes the 12b-1 fees applicable to Class A shares. Class
Average Annual Total Returns
As of 6/30/14, the most recent calendar quarter end, including maximum applicable sales charges
Class A Shares | ||||
Inception (8/3/60) | 10.36 | % | ||
10 Years | 7.11 | |||
5 Years | 13.57 | |||
1 Year | 11.11 | |||
Class B Shares | ||||
Inception (5/1/92) | 9.92 | % | ||
10 Years | 7.44 | |||
5 Years | 14.22 | |||
1 Year | 11.72 | |||
Class C Shares | ||||
Inception (7/6/93) | 9.20 | % | ||
10 Years | 6.93 | |||
5 Years | 14.03 | |||
1 Year | 15.75 | |||
Class R Shares | ||||
Inception (10/1/02) | 8.71 | % | ||
10 Years | 7.45 | |||
5 Years | 14.57 | |||
1 Year | 17.34 | |||
Class Y Shares | ||||
Inception (12/22/04) | 7.49 | % | ||
5 Years | 15.15 | |||
1 Year | 17.89 | |||
Class R5 Shares | ||||
10 Years | 7.89 | % | ||
5 Years | 15.21 | |||
1 Year | 18.07 | |||
Class R6 Shares | ||||
10 Years | 7.80 | % | ||
5 Years | 15.02 | |||
1 Year | 18.08 | |||
A share performance reflects any applicable fee waivers or expense reimbursements.
Class R6 shares incepted on September 24, 2012. Performance shown prior to that date is that of the Fund’s and the predecessor fund’s Class A shares and includes the 12b-1 fees applicable to Class A shares. Class A share performance reflects any applicable fee waivers or expense reimbursements.
The performance data quoted represent past performance and cannot guarantee comparable future results; current performance may be lower or higher. Please visit invesco.com/performance for the most recent month-end performance. Performance figures reflect reinvested distributions, changes in net asset value and the effect of the maximum
sales charge unless otherwise stated. Investment return and principal value will fluctuate so that you may have a gain or loss when you sell shares.
The net annual Fund operating expense ratio set forth in the most recent Fund prospectus as of the date of this report for Class A, Class B, Class C, Class R, Class Y, Class R5 and Class R6 shares was 0.79%, 1.54%, 1.54%, 1.04%, 0.54%, 0.48% and 0.38%, respectively.1 The total annual Fund operating expense ratio set forth in the most recent Fund prospectus as of the date of this report for Class A, Class B, Class C, Class R, Class Y, Class R5 and Class R6 shares was 0.80%, 1.55%, 1.55%, 1.05%, 0.55%, 0.49% and 0.39%, respectively. The expense ratios presented above may vary from the expense ratios presented in other sections of this report that are based on expenses incurred during the period covered by this report.
Class A share performance reflects the maximum 5.50% sales charge, and Class B and Class C share performance reflects the applicable contingent deferred sales charge (CDSC) for the period involved. For shares purchased prior to June 1, 2010, the CDSC on Class B shares declines from 5% at the time of purchase to 0% at the beginning of the sixth year. For shares purchased on or after June 1, 2010, the CDSC on Class B shares declines from 5% at the time of purchase to 0% at the beginning of the seventh year. The CDSC on Class C shares is 1% for the first year after purchase. Class R, Class Y, Class R5 and Class R6 shares do not have a front-end sales charge or a CDSC; therefore, performance is at net asset value.
The performance of the Fund’s share classes will differ primarily due to different sales charge structures and class expenses.
Had the adviser not waived fees and/or reimbursed expenses on Class B shares in the past, performance would have been lower.
| 1 | Total annual Fund operating expenses after any contractual fee waivers and/or expense reimbursements by the adviser in effect through at least June 30, 2016. See current prospectus for more information. |
| 7 Invesco Equity and Income Fund |
Invesco Equity and Income Fund’s investment objective is current income and, secondarily, capital appreciation.
| n | Unless otherwise stated, information presented in this report is as of August 31, 2014, and is based on total net assets. |
| n | Unless otherwise noted, all data provided by Invesco. |
| n | To access your Fund’s reports/prospectus, visit invesco.com/fundreports. |
About share classes
| n | Class B shares may not be purchased for new or additional investments. Please see the prospectus for more information. |
| n | Class R shares are generally available only to employer sponsored retirement and benefit plans. Please see the prospectus for more information. |
| n | Class Y shares are available only to certain investors. Please see the prospectus for more information. |
| n | Class R5 shares and Class R6 shares are primarily intended for employer sponsored retirement and benefit plans that meet certain standards and for institutional investors. Please see the prospectus for more information. |
Principal risks of investing in the Fund
| n | Call risk. If interest rates fall, it is possible that issuers of debt securities with high interest rates will prepay or call their securities before their maturity dates. In this event, the proceeds from the called securities would likely be reinvested by the Fund in securities bearing the new, lower interest rates, resulting in a possible decline in the Fund’s income and distributions to shareholders. |
| n | Convertible securities risk. The Fund may own convertible securities, the value of which may be affected by market interest rates, the risk that the issuer will default, the value of the underlying stock or the right of the issuer to buy back the convertible securities. |
| n | Credit risk. The issuer of instruments in which the Fund invests may be unable to meet interest and/or principal payments, thereby causing its instruments to decrease in value and lowering the issuer’s credit rating. |
| n | Depositary receipts risk. Depositary receipts involve many of the same risks as those associated with direct investment in foreign securities. In addition, the underlying issuers of certain depositary receipts, particularly unsponsored |
or unregistered depositary receipts, are under no obligation to distribute shareholder communications to the holders of such receipts or to pass through to them any voting rights with respect to the deposited securities.
| n | Derivatives risk. The value of a derivative instrument depends largely on (and is derived from) the value of an underlying security, currency, commodity, interest rate, index or other asset (each referred to as an underlying asset). In addition to risks relating to the underlying assets, the use of derivatives may include other, possibly greater, risks, including counterparty, leverage and liquidity risks. Counterparty risk is the risk that the counterparty to the derivative contract will default on its obligation to pay the Fund the amount owed or otherwise perform under the derivative contract. Derivatives create leverage risk because they do not require payment up front equal to the economic exposure created by owning the derivative. As a result, an adverse change in the value of the underlying asset could result in the Fund sustaining a loss that is substantially greater than the amount invested in the derivative, which may make the Fund’s returns more volatile and increase the risk of loss. Derivative instruments may also be less liquid than more traditional investments and the Fund may be unable to sell or close out its derivative positions at a desirable time or price. This risk may be more acute under adverse market conditions, during which the Fund may be most in need of liquidating its derivative positions. Derivatives may also be harder to value, less tax efficient and subject to changing government regulation that could impact the Fund’s ability to use certain derivatives or their cost. Also, derivatives used for hedging or to gain or limit exposure to a particular market segment may not provide the expected benefits, particularly during adverse market conditions. |
| n | Equity risk. Equity risk is the risk that the value of securities held by the Fund will fall due to general market and economic conditions, perceptions regarding the industries in which the issuers of securities held by the Fund participate or factors relating to specific companies in which the Fund invests, either directly or through derivative instruments. For example, an adverse event, such as an unfavorable earnings report, may depress the value of securities held by the Fund; the price of securities may be particularly sensitive to general movements in the stock market; or a drop in the stock market may depress the price of most or all of the securities held by the Fund. In addition, securities of an issuer in the Fund’s portfolio may decline in price if the issuer fails to make anticipated dividend payments because, among other reasons, the issuer of the security experiences a decline in its financial condition. |
| n | Foreign securities risk. The Fund’s foreign investments may be affected by changes in a foreign country’s exchange rates, political and social instability, changes in economic or taxation policies, difficulties when enforcing obligations, decreased liquidity, and increased volatility. Foreign companies may be subject to less regulation resulting in less publicly available information about the companies. |
| n | Income risk. The income you receive from the Fund is based primarily on prevailing interest rates, which can vary widely over the short- and long-term. If interest rates drop, your income from the Fund may drop as well. |
| n | Interest rate risk. Interest rate risk refers to the risk that bond prices generally fall as interest rates rise; conversely, bond prices generally rise as interest rates fall. Specific bonds differ in their sensitivity to changes in interest rates depending on their individual characteristics, including duration. |
continued on page 9
This report must be accompanied or preceded by a currently effective Fund prospectus, which contains more complete information, including sales charges and expenses. Investors should read it carefully before investing.
| NOT FDIC INSURED | MAY LOSE VALUE | NO BANK GUARANTEE |
8 Invesco Equity and Income Fund
| n | Management risk. The investment techniques and risk analysis used by the Fund’s portfolio managers may not produce the desired results. |
| n | Market risk. The prices of and the income generated by the Fund’s securities may decline in response to, among other things, investor sentiment, general economic and market conditions, regional or global instability, and currency and interest rate fluctuations. |
| n | Preferred securities risk. Preferred securities may include provisions that permit the issuer, in its discretion, to defer or omit distributions for a certain period of time. If the Fund owns a security that is deferring or omitting its distributions, the Fund may be required to report the distribution on its tax returns, even though it may not have received this income. Further, preferred securities may lose substantial value due to the omission or deferment of dividend payments. |
| n | Real estate investment trust (REIT) risk/ real estate risk. Investments in real estate related instruments may be affected by economic, legal, cultural, environmental or technological factors that affect property values, rents or occupancies of real estate related to the Fund’s holdings. Real estate companies, including REITs or similar structures, tend to be small- and mid-cap companies, and their shares may be more volatile and less liquid. The value of investments in real estate related companies may be affected by the quality of management, the ability to repay loans, the utilization of leverage and financial covenants related thereto, whether the company carries adequate insurance and environmental factors. If a real estate related company defaults, the Fund may own real estate directly, which involves the following additional risks: environmental liabilities; difficulty in valuing and selling the real estate; and economic or regulatory changes. |
| n | Small- and mid-capitalization risks. Stocks of small- and mid-sized companies tend to be more vulnerable to adverse developments and may have little or no operating history or track record of success, and limited product lines, |
markets, management and financial resources. The securities of small- and mid-sized companies may be more volatile due to less market interest and less publicly available information about the issuer. They also may be illiquid or restricted as to resale, or may trade less frequently and in smaller volumes, all of which may cause difficulty when establishing or closing a position at a desirable price.
| n | Value investing style risk. The Fund emphasizes a value style of investing, which focuses on undervalued companies with characteristics for improved valuations. This style of investing is subject to the risk that the valuations never improve or that the returns on value equity securities are less than returns on other styles of investing or the overall stock market. Value stocks also may decline in price, even though in theory they are already underpriced. |
About indexes used in this report
| n | The Russell 1000 Value Index is an unmanaged index considered representative of large-cap value stocks. The Russell 1000 Value Index is a trademark/service mark of the Frank Russell Co. Russell® is a trademark of the Frank Russell Co. |
| n | The Barclays U.S. Government/Credit Index includes treasuries and agencies that represent the government portion of the index, and includes publically issued US corporate and foreign debentures and secured notes that meet specified maturity, liquidity and quality requirements. |
| n | The Fund is not managed to track the performance of any particular index, including the index(es) described here, and consequently, the performance of the Fund may deviate significantly from the performance of the index(es). |
| n | A direct investment cannot be made in an index. Unless otherwise indicated, index results include reinvested dividends, and they do not reflect sales charges. Performance of the peer group, if applicable, reflects fund expenses; performance of a market index does not. |
Other information
| n | The returns shown in management’s discussion of Fund performance are based on net asset values (NAVs) calculated for shareholder transactions. Generally accepted accounting principles require adjustments to be made to the net assets of the Fund at period end for financial reporting purposes, and as such, the NAVs for shareholder transactions and the returns based on those NAVs may differ from the NAVs and returns reported in the Financial Highlights. |
| n | Industry classifications used in this report are generally according to the Global Industry Classification Standard, which was developed by and is the exclusive property and a service mark of MSCI Inc. and Standard & Poor’s. |
9 Invesco Equity and Income Fund
Schedule of Investments(a)
August 31, 2014
| Shares | Value | |||||||
Common Stocks & Other Equity Interests–63.54% |
| |||||||
| Aerospace & Defense–0.70% | ||||||||
General Dynamics Corp. | 780,349 | $ | 96,178,014 | |||||
| Agricultural Products–0.67% | ||||||||
Archer-Daniels-Midland Co. | 1,860,923 | 92,785,621 | ||||||
| Apparel Retail–0.70% | ||||||||
Abercrombie & Fitch Co.–Class A | 2,294,824 | 95,923,643 | ||||||
| Application Software–1.69% | ||||||||
Adobe Systems Inc.(b) | 2,201,376 | 158,278,934 | ||||||
Citrix Systems, Inc.(b) | 1,056,835 | 74,253,227 | ||||||
| 232,532,161 | ||||||||
| Asset Management & Custody Banks–1.39% | ||||||||
Northern Trust Corp. | 1,272,994 | 88,282,134 | ||||||
State Street Corp. | 1,436,958 | 103,504,085 | ||||||
| 191,786,219 | ||||||||
| Automobile Manufacturers–0.74% | ||||||||
General Motors Co. | 2,904,130 | 101,063,724 | ||||||
| Biotechnology–0.76% | ||||||||
Amgen Inc. | 750,983 | �� | 104,672,011 | |||||
| Cable & Satellite–1.99% | ||||||||
Comcast Corp.–Class A | 2,514,705 | 137,629,805 | ||||||
Time Warner Cable Inc. | 923,141 | 136,560,248 | ||||||
| 274,190,053 | ||||||||
| Communications Equipment–0.48% | ||||||||
Cisco Systems, Inc. | 2,664,005 | 66,573,485 | ||||||
| Construction Machinery & Heavy Trucks–0.97% | ||||||||
Caterpillar Inc. | 1,218,488 | 132,900,486 | ||||||
| Consumer Finance–0.29% | ||||||||
Synchrony Financial(b) | 1,551,433 | 40,011,457 | ||||||
| Diversified Banks–7.56% | ||||||||
Bank of America Corp. | 7,735,988 | 124,472,047 | ||||||
Citigroup Inc. | 7,021,074 | 362,638,472 | ||||||
Comerica Inc. | 1,666,876 | 83,910,538 | ||||||
JPMorgan Chase & Co. | 6,138,389 | 364,927,226 | ||||||
Wells Fargo & Co. | 2,010,043 | 103,396,612 | ||||||
| 1,039,344,895 | ||||||||
| Diversified Chemicals–0.77% | ||||||||
Dow Chemical Co. (The) | 1,986,507 | 106,377,450 | ||||||
| Diversified Metals & Mining–0.59% | ||||||||
Freeport-McMoRan Inc. | 2,212,021 | 80,451,204 | ||||||
| Electric Utilities–0.69% | ||||||||
Edison International | 689,030 | 40,749,234 | ||||||
FirstEnergy Corp. | 1,461,751 | 50,050,354 | ||||||
| Shares | Value | |||||||
| Electric Utilities–(continued) | ||||||||
Pinnacle West Capital Corp. | 70,135 | $ | 3,994,189 | |||||
| 94,793,777 | ||||||||
| Electronic Components–0.75% | ||||||||
Corning Inc. | 4,951,501 | 103,288,311 | ||||||
| General Merchandise Stores–0.79% | ||||||||
Target Corp. | 1,818,728 | 109,250,991 | ||||||
| Health Care Equipment–0.50% | ||||||||
Medtronic, Inc. | 1,085,274 | 69,294,745 | ||||||
| Hotels, Resorts & Cruise Lines–0.84% | ||||||||
Carnival Corp. | 3,032,337 | 114,864,926 | ||||||
| Household Products–0.85% | ||||||||
Procter & Gamble Co. (The) | 1,410,490 | 117,225,824 | ||||||
| Industrial Conglomerates–1.90% | ||||||||
General Electric Co. | 10,059,406 | 261,343,368 | ||||||
| Industrial Machinery–0.72% | ||||||||
Ingersoll-Rand PLC | 1,648,834 | 99,259,807 | ||||||
| Insurance Brokers–2.11% | ||||||||
Aon PLC | 1,016,626 | 88,609,122 | ||||||
Marsh & McLennan Cos., Inc. | 2,558,750 | 135,869,625 | ||||||
Willis Group Holdings PLC | 1,557,316 | 65,360,553 | ||||||
| 289,839,300 | ||||||||
| Integrated Oil & Gas–3.91% | ||||||||
Exxon Mobil Corp. | 833,781 | 82,927,858 | ||||||
Occidental Petroleum Corp. | 953,735 | 98,930,932 | ||||||
Royal Dutch Shell PLC–Class A (United Kingdom) | 5,473,255 | 221,533,696 | ||||||
Total S.A. (France) | 2,029,564 | 133,957,473 | ||||||
| 537,349,959 | ||||||||
| Integrated Telecommunication Services–1.06% | ||||||||
Koninklijke KPN N.V. (Netherlands)(b) | 4,245,802 | 14,086,934 | ||||||
Orange S.A. (France) | 1,381,185 | 20,933,476 | ||||||
Telecom Italia S.p.A. (Italy)(b) | 11,101,091 | 12,798,370 | ||||||
Telefonica S.A. (Spain) | 928,862 | 14,731,733 | ||||||
Verizon Communications Inc. | 1,661,597 | 82,780,763 | ||||||
| 145,331,276 | ||||||||
| Internet Software & Services–1.16% | ||||||||
eBay Inc.(b) | 2,862,611 | 158,874,910 | ||||||
| Investment Banking & Brokerage–3.00% | ||||||||
Charles Schwab Corp. (The) | 4,706,290 | 134,176,328 | ||||||
Goldman Sachs Group, Inc. (The) | 497,423 | 89,093,433 | ||||||
Morgan Stanley | 5,527,771 | 189,657,823 | ||||||
| 412,927,584 | ||||||||
See accompanying Notes to Financial Statements which are an integral part of the financial statements.
10 Invesco Equity and Income Fund
| Shares | Value | |||||||
| IT Consulting & Other Services–0.73% | ||||||||
Amdocs Ltd. | 2,123,594 | $ | 100,021,277 | |||||
| Managed Health Care–1.99% | ||||||||
Cigna Corp. | 764,789 | 72,349,039 | ||||||
UnitedHealth Group Inc. | 1,001,595 | 86,818,255 | ||||||
WellPoint, Inc. | 985,821 | 114,858,005 | ||||||
| 274,025,299 | ||||||||
| Movies & Entertainment–1.48% | ||||||||
Time Warner Inc. | 691,372 | 53,256,385 | ||||||
Viacom Inc.–Class B | 1,851,149 | 150,220,741 | ||||||
| 203,477,126 | ||||||||
| Multi-Utilities–0.42% | ||||||||
PG&E Corp. | 1,238,963 | 57,587,000 | ||||||
| Oil & Gas Equipment & Services–0.85% | ||||||||
Baker Hughes Inc. | 1,689,346 | 116,801,382 | ||||||
| Oil & Gas Exploration & Production–2.27% | ||||||||
Anadarko Petroleum Corp. | 838,180 | 94,454,504 | ||||||
Apache Corp. | 1,018,326 | 103,696,137 | ||||||
Canadian Natural Resources Ltd. (Canada) | 2,620,376 | 114,219,664 | ||||||
| 312,370,305 | ||||||||
| Other Diversified Financial Services–0.67% | ||||||||
Voya Financial, Inc. | 2,352,934 | 91,976,190 | ||||||
| Packaged Foods & Meats–1.15% | ||||||||
Mondelez International Inc.–Class A | 2,814,170 | 101,844,813 | ||||||
Unilever N.V.–New York Shares (Netherlands) | 1,361,041 | 56,673,747 | ||||||
| 158,518,560 | ||||||||
| Personal Products–1.00% | ||||||||
Avon Products, Inc. | 9,801,435 | 137,612,147 | ||||||
| Pharmaceuticals–5.07% | ||||||||
Bristol-Myers Squibb Co. | 730,994 | 37,024,846 | ||||||
Eli Lilly and Co. | 1,703,632 | 108,282,850 | ||||||
Hospira, Inc.(b) | 651,622 | 35,018,166 | ||||||
Merck & Co., Inc. | 2,270,028 | 136,451,383 | ||||||
Novartis AG (Switzerland) | 1,227,353 | 110,203,944 | ||||||
Novartis AG–ADR (Switzerland) | 104,308 | 9,371,031 | ||||||
Pfizer Inc. | 2,090,374 | 61,436,092 | ||||||
Sanofi (France) | 834,919 | 91,606,478 | ||||||
Teva Pharmaceutical Industries Ltd.–ADR (Israel) | 2,050,187 | 107,675,821 | ||||||
| 697,070,611 | ||||||||
| Publishing–0.51% | ||||||||
Thomson Reuters Corp. | 1,858,271 | 70,420,130 | ||||||
| Railroads–0.63% | ||||||||
CSX Corp. | 2,823,461 | 87,273,180 | ||||||
| Shares | Value | |||||||
| Regional Banks–2.08% | ||||||||
BB&T Corp. | 1,929,869 | $ | 72,042,010 | |||||
Fifth Third Bancorp | 3,450,659 | 70,410,697 | ||||||
PNC Financial Services Group, Inc. (The) | 1,691,412 | 143,347,167 | ||||||
| 285,799,874 | ||||||||
| Security & Alarm Services–0.90% | ||||||||
Tyco International Ltd. | 2,770,617 | 123,624,931 | ||||||
| Semiconductor Equipment–1.31% | ||||||||
Applied Materials, Inc. | 7,785,384 | 179,881,297 | ||||||
| Semiconductors–1.66% | ||||||||
Broadcom Corp.–Class A | 2,012,294 | 79,244,138 | ||||||
Intel Corp. | 2,362,729 | 82,506,496 | ||||||
Texas Instruments Inc. | 1,378,756 | 66,428,464 | ||||||
| 228,179,098 | ||||||||
| Specialized Finance–0.51% | ||||||||
CME Group Inc.–Class A | 916,005 | 70,120,183 | ||||||
| Specialty Chemicals–0.23% | ||||||||
PPG Industries, Inc. | 155,687 | 32,049,726 | ||||||
| Systems Software–1.54% | ||||||||
Microsoft Corp. | 2,215,196 | 100,636,354 | ||||||
Symantec Corp. | 4,556,582 | 110,633,811 | ||||||
| 211,270,165 | ||||||||
| Technology Hardware, Storage & Peripherals–0.42% | ||||||||
NetApp, Inc. | 1,361,911 | 57,418,168 | ||||||
| Wireless Telecommunication Services–0.54% | ||||||||
Vodafone Group PLC–ADR (United Kingdom) | 2,166,098 | 74,383,805 | ||||||
Total Common Stocks & Other Equity Interests |
| 8,738,315,655 | ||||||
| Principal Amount | ||||||||
Bonds and Notes–20.91% |
| |||||||
| Advertising–0.03% | ||||||||
Interpublic Group of Cos., Inc. (The), Sr. Unsec. Global Notes, 2.25%, 11/15/17 | $ | 4,145,000 | 4,205,349 | |||||
| Aerospace & Defense–0.06% | ||||||||
L-3 Communications Corp., Sr. Unsec. Gtd. Global Notes, 3.95%, 05/28/24 | 4,355,000 | 4,365,962 | ||||||
Precision Castparts Corp., Sr. Unsec. Global Notes, 2.50%, 01/15/23 | 4,150,000 | 4,034,039 | ||||||
| 8,400,001 | ||||||||
| Agricultural & Farm Machinery–0.11% | ||||||||
Deere & Co., Sr. Unsec. Notes, 2.60%, 06/08/22 | 14,645,000 | 14,473,841 | ||||||
See accompanying Notes to Financial Statements which are an integral part of the financial statements.
11 Invesco Equity and Income Fund
| Principal Amount | Value | |||||||
| Agricultural Products–0.15% | ||||||||
Bunge Ltd Finance Corp., Sr. Unsec. Gtd. Global Notes, 5.10%, 07/15/15 | $ | 14,380,000 | $ | 14,925,112 | ||||
Ingredion Inc., Sr. Unsec. Notes, 6.63%, 04/15/37 | 3,940,000 | 5,049,575 | ||||||
| 19,974,687 | ||||||||
| Air Freight & Logistics–0.31% | ||||||||
FedEx Corp., | ||||||||
Sr. Unsec. Gtd. Bonds, | ||||||||
4.90%, 01/15/34 | 4,310,000 | 4,787,867 | ||||||
Sr. Unsec. Gtd. Notes, | ||||||||
5.10%, 01/15/44 | 8,875,000 | 9,945,569 | ||||||
United Parcel Service Inc., Sr. Unsec. Global Notes, 2.45%, 10/01/22 | 3,320,000 | 3,247,554 | ||||||
UTi Worldwide Inc., Sr. Unsec. Conv. Notes, 4.50%, 03/01/19(c) | 24,390,000 | 24,938,775 | ||||||
| 42,919,765 | ||||||||
| Airlines–0.18% | ||||||||
Continental Airlines Pass Through Trust, | ||||||||
Series 2010-1, Class A, | ||||||||
Sr. Sec. Pass Through Ctfs., | ||||||||
4.75%, 01/12/21 | 4,020,275 | 4,346,922 | ||||||
Series 2012-1, Class A, | ||||||||
Sr. Sec. Pass Through Ctfs., | ||||||||
4.15%, 04/11/24 | 5,466,992 | 5,695,923 | ||||||
Delta Air Lines Pass Through Trust, Series 2010-1, Class A, Sr. Sec. Pass Through Ctfs., 6.20%, 07/02/18 | 2,192,490 | 2,445,997 | ||||||
United Airlines Pass Through Trust, Series 2014-2, Class A, Sr. Sec. Pass Through Ctfs., 3.75%, 09/03/26 | 5,455,000 | 5,495,912 | ||||||
Virgin Australia Pass Through Trust (Australia), Series 2013-1, Class A, Sec. Gtd. Pass Through Ctfs., 5.00%, 10/23/23(c) | 6,373,845 | 6,764,243 | ||||||
| 24,748,997 | ||||||||
| Airport Services–0.05% | ||||||||
Heathrow Funding Ltd. (United Kingdom), Sr. Sec. Notes, 2.50%, 06/25/15(c) | 6,220,000 | 6,298,404 | ||||||
| Application Software–0.31% | ||||||||
Citrix Systems Inc., Sr. Unsec. Conv. Notes, 0.50%, 04/15/19(c) | 38,333,000 | 42,477,756 | ||||||
| Asset Management & Custody Banks–0.12% | ||||||||
Apollo Management Holdings L.P., Sr. Unsec. Gtd. Notes, 4.00%, 05/30/24(c) | 4,260,000 | 4,332,767 | ||||||
Bank of New York Mellon Corp. (The), Series D, Jr. Unsec. Sub. Global Notes, 4.50%(d) | 5,600,000 | 5,250,000 | ||||||
| Principal Amount | Value | |||||||
| Asset Management & Custody Banks–(continued) | ||||||||
Blackstone Holdings Finance Co. LLC, Sr. Unsec. Gtd. Notes, 5.00%, 06/15/44(c) | $ | 3,975,000 | $ | 4,287,066 | ||||
KKR Group Finance Co III LLC, Sr. Unsec. Gtd. Bonds, 5.13%, 06/01/44(c) | 2,220,000 | 2,371,350 | ||||||
| 16,241,183 | ||||||||
| Automobile Manufacturers–0.22% | ||||||||
Daimler Finance North America LLC (Germany), Sr. Unsec. Gtd. Notes, | ||||||||
1.88%, 09/15/14(c) | 7,170,000 | 7,173,381 | ||||||
1.88%, 01/11/18(c) | 5,220,000 | 5,285,188 | ||||||
Ford Motor Co., Sr. Unsec. Global Notes, 4.75%, 01/15/43 | 11,500,000 | 12,096,554 | ||||||
Ford Motor Credit Co. LLC., Sr. Unsec. Global Notes, 2.50%, 01/15/16 | 4,970,000 | 5,076,823 | ||||||
| 29,631,946 | ||||||||
| Automotive Retail–0.11% | ||||||||
Advance Auto Parts, Inc., Sr. Unsec. Gtd. Notes, | ||||||||
4.50%, 12/01/23 | 6,415,000 | 6,819,457 | ||||||
5.75%, 05/01/20 | 7,393,000 | 8,457,320 | ||||||
| 15,276,777 | ||||||||
| Biotechnology–0.61% | ||||||||
BioMarin Pharmaceutical Inc., Sr. Unsec. Sub. Conv. Notes, 1.50%, 10/15/20 | 14,196,000 | 15,837,413 | ||||||
Celgene Corp., Sr. Unsec. Global Notes, | ||||||||
4.00%, 08/15/23 | 4,735,000 | 5,001,923 | ||||||
4.63%, 05/15/44 | 13,875,000 | 14,490,866 | ||||||
Cubist Pharmaceuticals Inc., | ||||||||
Sr. Unsec. Conv. Bonds, | ||||||||
1.88%, 09/01/20(c) | 26,245,000 | 29,886,494 | ||||||
Sr. Unsec. Conv. Notes, | ||||||||
1.13%, 09/01/18(c) | 10,648,000 | 11,852,555 | ||||||
Gilead Sciences, Inc., Sr. Unsec. Global Bonds, 2.05%, 04/01/19 | 6,515,000 | 6,547,155 | ||||||
| 83,616,406 | ||||||||
| Brewers–0.13% | ||||||||
Anheuser-Busch InBev Worldwide, Inc. (Belgium), Sr. Unsec. Gtd. Global Notes, | ||||||||
0.80%, 07/15/15 | 3,745,000 | 3,760,160 | ||||||
3.63%, 04/15/15 | 6,145,000 | 6,275,642 | ||||||
FBG Finance Pty Ltd. (Australia), Sr. Unsec. Gtd. Notes, 5.13%, 06/15/15(c) | 6,965,000 | 7,209,042 | ||||||
| 17,244,844 | ||||||||
| Broadcasting–0.53% | ||||||||
Discovery Communications LLC, Sr. Unsec. Gtd. Global Notes, 3.70%, 06/01/15 | 11,220,000 | 11,489,612 | ||||||
See accompanying Notes to Financial Statements which are an integral part of the financial statements.
12 Invesco Equity and Income Fund
| Principal Amount | Value | |||||||
| Broadcasting–(continued) | ||||||||
Grupo Televisa S.A.B. (Mexico), Sr. Unsec. Global Notes, 5.00%, 05/13/45 | $ | 3,000,000 | $ | 3,119,443 | ||||
Liberty Media Corp., Sr. Unsec. Conv. Notes, 1.38%, 10/15/23(c) | 56,561,000 | 58,222,480 | ||||||
| 72,831,535 | ||||||||
| Cable & Satellite–0.37% | ||||||||
Comcast Corp., | ||||||||
Sr. Unsec. Gtd. Global Notes, | ||||||||
4.25%, 01/15/33 | 8,165,000 | 8,518,560 | ||||||
5.70%, 05/15/18 | 4,735,000 | 5,424,245 | ||||||
Sr. Unsec. Gtd. Notes, | ||||||||
6.45%, 03/15/37 | 2,465,000 | 3,247,622 | ||||||
Cox Communications Inc., Sr. Unsec. Global Notes, 5.45%, 12/15/14 | 128,000 | 129,780 | ||||||
Sr. Unsec. Notes, | ||||||||
4.70%, 12/15/42(c) | 4,980,000 | 4,943,605 | ||||||
6.25%, 06/01/18(c) | 3,700,000 | 4,250,115 | ||||||
7.25%, 11/15/15 | 5,000,000 | 5,377,118 | ||||||
8.38%, 03/01/39(c) | 655,000 | 954,674 | ||||||
DIRECTV Holdings LLC/DIRECTV Financing Co., Inc., Sr. Unsec. Gtd. Global Notes, 5.15%, 03/15/42 | 1,370,000 | 1,483,169 | ||||||
NBCUniversal Media LLC, | ||||||||
Sr. Unsec. Gtd. Global Notes, | ||||||||
5.15%, 04/30/20 | 3,320,000 | 3,808,268 | ||||||
5.95%, 04/01/41 | 3,365,000 | 4,247,502 | ||||||
Time Warner Cable, Inc., Sr. Unsec. Gtd. Deb., 5.88%, 11/15/40 | 7,235,000 | 8,785,636 | ||||||
| 51,170,294 | ||||||||
| Casinos & Gaming–0.09% | ||||||||
MGM Resorts International, Sr. Unsec. Gtd. Conv. Notes, 4.25%, 04/15/15 | 9,376,000 | 12,716,200 | ||||||
| Catalog Retail–0.17% | ||||||||
Liberty Interactive LLC, Sr. Unsec. Conv. Global Bonds, 0.75%, 03/30/23(e) | 11,090,000 | 15,089,331 | ||||||
QVC Inc., Sr. Sec. Notes, 5.45%, 08/15/34(c) | 8,810,000 | 8,942,251 | ||||||
| 24,031,582 | ||||||||
| Coal & Consumable Fuels–0.01% | ||||||||
Peabody Energy Corp., Jr. Unsec. Sub. Conv. Deb., 4.75%, 12/15/41 | 1,820,000 | 1,317,225 | ||||||
| Commodity Chemicals–0.07% | ||||||||
Montell Finance Co. B.V. (Netherlands), Sr. Unsec. Gtd. Deb., 8.10%, 03/15/27(c) | 7,384,000 | 10,071,268 | ||||||
| Principal Amount | Value | |||||||
| Communications Equipment–0.39% | ||||||||
Ciena Corp., Sr. Unsec. Conv. Notes, 4.00%, 12/15/20(c) | $ | 22,524,000 | $ | 30,182,160 | ||||
JDS Uniphase Corp., Sr. Unsec. Conv. Bonds, 0.63%, 08/15/18(e) | 19,999,000 | 19,949,002 | ||||||
Juniper Networks Inc., Sr. Unsec. Global Notes, 4.50%, 03/15/24 | 3,010,000 | 3,170,203 | ||||||
| 53,301,365 | ||||||||
| Data Processing & Outsourced Services–0.04% | ||||||||
Computer Sciences Corp., Sr. Unsec. Global Notes, 4.45%, 09/15/22 | 4,954,000 | 5,246,044 | ||||||
Xerox Corp., Sr. Unsec. Notes, 4.25%, 02/15/15 | 820,000 | 833,717 | ||||||
| 6,079,761 | ||||||||
| Distillers & Vintners–0.02% | ||||||||
Brown-Forman Corp., Sr. Unsec. Notes, 2.25%, 01/15/23 | 3,480,000 | 3,311,005 | ||||||
| Diversified Banks–1.86% | ||||||||
Abbey National Treasury Services PLC (United Kingdom), Sr. Unsec. Gtd. Medium-Term Euro Notes, 3.88%, 11/10/14(c) | 9,000,000 | 9,057,581 | ||||||
Banco Inbursa S.A. Institucion de Banca Multiple (Mexico), Sr. Unsec. Notes, | 5,000,000 | 4,919,627 | ||||||
Bank of America Corp., | ||||||||
Sr. Unsec. Global Notes, | ||||||||
5.75%, 12/01/17 | 2,825,000 | 3,171,043 | ||||||
Sr. Unsec. Medium-Term Notes, | ||||||||
1.25%, 01/11/16 | 6,465,000 | 6,503,152 | ||||||
5.00%, 01/21/44 | 2,905,000 | 3,166,995 | ||||||
6.88%, 04/25/18 | 9,445,000 | 11,046,293 | ||||||
Series L, Sr. Unsec. Medium-Term Global Notes, 5.65%, 05/01/18 | 8,680,000 | 9,760,466 | ||||||
Barclays Bank PLC (United Kingdom), | ||||||||
Sr. Unsec. Global Notes, | ||||||||
2.75%, 02/23/15 | 2,535,000 | 2,563,353 | ||||||
6.75%, 05/22/19 | 8,500,000 | 10,171,400 | ||||||
Unsec. Sub. Global Notes, | ||||||||
5.14%, 10/14/20 | 5,015,000 | 5,480,163 | ||||||
BBVA Bancomer S.A. (Mexico), Sr. Unsec. Notes, | 6,875,000 | 6,975,494 | ||||||
Bear Stearns Cos., LLC (The), Sr. Unsec. Global Notes, 7.25%, 02/01/18 | 8,140,000 | 9,605,503 | ||||||
See accompanying Notes to Financial Statements which are an integral part of the financial statements.
13 Invesco Equity and Income Fund
| Principal Amount | Value | |||||||
| Diversified Banks–(continued) | ||||||||
Citigroup Inc., | ||||||||
Sr. Unsec. Global Notes, | ||||||||
6.01%, 01/15/15 | $ | 1,615,000 | $ | 1,647,634 | ||||
6.13%, 11/21/17 | 11,440,000 | 13,001,342 | ||||||
8.50%, 05/22/19 | 2,385,000 | 3,025,530 | ||||||
Unsec. Sub. Global Notes, | ||||||||
3.50%, 05/15/23 | 5,000,000 | 4,912,121 | ||||||
5.30%, 05/06/44 | 2,765,000 | 2,979,210 | ||||||
6.68%, 09/13/43 | 8,000,000 | 10,236,037 | ||||||
Danske Bank A/S (Denmark), Sr. Unsec. Notes, 3.88%, 04/14/16(c) | 9,435,000 | 9,869,371 | ||||||
HBOS PLC (United Kingdom), Unsec. Sub. Medium-Term Global Notes, 6.75%, 05/21/18(c) | 8,535,000 | 9,796,055 | ||||||
HSBC Holdings PLC (United Kingdom), Unsec. Sub. Global Notes, 4.25%, 03/14/24 | 2,165,000 | 2,256,667 | ||||||
JPMorgan Chase & Co., | ||||||||
Sr. Unsec. Global Notes, | ||||||||
4.40%, 07/22/20 | 5,700,000 | 6,226,473 | ||||||
Series S, Jr. Unsec. Sub. Notes, 6.75%(d) | 5,885,000 | 6,355,800 | ||||||
Series V, Jr. Unsec. Sub. Global Notes, 5.00%(d) | 6,410,000 | 6,393,975 | ||||||
Korea Development Bank (The) (South Korea), Sr. Unsec. Global Notes, 4.38%, 08/10/15 | 3,460,000 | 3,573,672 | ||||||
Lloyds Bank PLC (United Kingdom), Sr. Unsec. Gtd. Global Notes, 2.30%, 11/27/18 | 5,240,000 | 5,306,961 | ||||||
Mizuho Financial Group Cayman 3 Ltd. (Japan), Unsec. Gtd. Sub. Notes, 4.60%, 03/27/24(c) | 5,010,000 | 5,304,387 | ||||||
National Australia Bank Ltd. (Australia), Sr. Unsec. Bonds, 3.75%, 03/02/15(c) | 3,390,000 | 3,445,907 | ||||||
Nordea Bank AB (Sweden), | ||||||||
Sr. Unsec. Notes, | ||||||||
4.88%, 01/27/20(c) | 4,495,000 | 5,042,051 | ||||||
Series 2, Sr. Unsec. Notes, 3.70%, 11/13/14(c) | 880,000 | 885,851 | ||||||
Rabobank Nederland N.V. (Netherlands), Sr. Unsec. Medium-Term Global Notes, 4.75%, 01/15/20(c) | 9,100,000 | 10,163,603 | ||||||
Santander Holdings USA Inc., Sr. Unsec. Global Notes, 3.00%, 09/24/15 | 14,213,000 | 14,533,301 | ||||||
Santander U.S. Debt S.A. Unipersonal (Spain), Sr. Unsec. Gtd. Notes, 3.72%, 01/20/15(c) | 3,200,000 | 3,233,640 | ||||||
Societe Generale S.A. (France), Unsec. Sub. Notes, 5.00%, 01/17/24(c) | 7,365,000 | 7,667,598 | ||||||
| Principal Amount | Value | |||||||
| Diversified Banks–(continued) | ||||||||
Standard Chartered PLC (United Kingdom), | ||||||||
Sr. Unsec. Notes, | ||||||||
3.85%, 04/27/15(c) | $ | 4,190,000 | $ | 4,278,991 | ||||
5.50%, 11/18/14(c) | 1,140,000 | 1,151,570 | ||||||
Unsec. Sub. Notes, | ||||||||
5.70%, 03/26/44(c) | 4,170,000 | 4,603,060 | ||||||
U.S. Bank N.A., Unsec. Sub. Notes, 3.78%, 04/29/20 | 8,200,000 | 8,367,554 | ||||||
Wells Fargo & Co., | ||||||||
Sr. Unsec. Global Notes, | ||||||||
1.50%, 01/16/18 | 2,070,000 | 2,064,476 | ||||||
3.63%, 04/15/15 | 750,000 | 765,350 | ||||||
Unsec. Sub. Global Notes, | ||||||||
4.13%, 08/15/23 | 11,753,000 | 12,388,656 | ||||||
Unsec. Sub. Medium-Term Notes, | ||||||||
4.10%, 06/03/26 | 4,515,000 | 4,630,079 | ||||||
| 256,527,992 | ||||||||
| Diversified Capital Markets–0.08% | ||||||||
Credit Suisse AG (Switzerland), Unsec. Sub. Notes, 6.50%, 08/08/23(c) | 6,536,000 | 7,250,655 | ||||||
UBS AG (Switzerland), | ||||||||
Sr. Unsec. Medium-Term Bank Notes, 3.88%, 01/15/15 | 834,000 | 844,971 | ||||||
Sr. Unsec. Medium-Term Global Bank Notes, 5.75%, 04/25/18 | 2,414,000 | 2,745,705 | ||||||
| 10,841,331 | ||||||||
| Diversified Metals & Mining–0.41% | ||||||||
Anglo American Capital PLC (United Kingdom), | ||||||||
Sr. Unsec. Gtd. Notes, | ||||||||
4.13%, 04/15/21(c) | 5,205,000 | 5,373,451 | ||||||
9.38%, 04/08/19(c) | 3,185,000 | 4,076,526 | ||||||
Freeport-McMoRan Inc., Sr. Unsec. Global Notes, 1.40%, 02/13/15 | 5,940,000 | 5,958,289 | ||||||
Glencore Finance Canada Ltd. (Canada), Sr. Unsec. Gtd. Notes, | ||||||||
2.05%, 10/23/15(c) | 4,700,000 | 4,757,652 | ||||||
2.70%, 10/25/17(c) | 4,700,000 | 4,842,090 | ||||||
Glencore Funding LLC (Switzerland), Sr. Unsec. Gtd. Notes, 3.13%, 04/29/19(c) | 10,535,000 | 10,755,599 | ||||||
Rio Tinto Finance USA Ltd. (United Kingdom), Sr. Unsec. Gtd. Global Notes, | ||||||||
7.13%, 07/15/28 | 2,175,000 | 2,896,029 | ||||||
9.00%, 05/01/19 | 5,240,000 | 6,824,539 | ||||||
Southern Copper Corp., Sr. Unsec. Global Notes, | ||||||||
5.25%, 11/08/42 | 7,260,000 | 7,136,969 | ||||||
5.38%, 04/16/20 | 1,170,000 | 1,302,498 | ||||||
6.75%, 04/16/40 | 1,695,000 | 1,942,703 | ||||||
| 55,866,345 | ||||||||
See accompanying Notes to Financial Statements which are an integral part of the financial statements.
14 Invesco Equity and Income Fund
| Principal Amount | Value | |||||||
| Diversified Support Services–0.03% | ||||||||
Cintas Corp. No. 2, Sr. Unsec. Gtd. Notes, 2.85%, 06/01/16 | $ | 4,605,000 | $ | 4,756,527 | ||||
| Drug Retail–0.11% | ||||||||
CVS Health Corp., Sr. Unsec. Global Notes, 3.38%, 08/12/24 | 3,740,000 | 3,770,490 | ||||||
CVS Pass Through Trust, Sr. Sec. Global Pass Through Ctfs., 6.04%, 12/10/28 | 9,378,182 | 10,951,764 | ||||||
| 14,722,254 | ||||||||
| Electric Utilities–0.28% | ||||||||
Baltimore Gas & Electric Co., Sr. Unsec. Notes, 3.35%, 07/01/23 | 6,220,000 | 6,417,743 | ||||||
Electricite de France S.A. (France), | ||||||||
Jr. Unsec. Sub. Notes, 5.63%(c)(d) | 8,670,000 | 9,194,535 | ||||||
Sr. Unsec. Notes, | ||||||||
4.60%, 01/27/20(c) | 2,150,000 | 2,396,911 | ||||||
4.88%, 01/22/44(c) | 9,110,000 | 10,000,116 | ||||||
Enel Finance International N.V. (Italy), Sr. Unsec. Gtd. Notes, 3.88%, 10/07/14(c) | 600,000 | 601,692 | ||||||
Iberdrola Finance Ireland Ltd. (Spain), Sr. Unsec. Gtd. Notes, 3.80%, 09/11/14(c) | 2,175,000 | 2,176,315 | ||||||
Louisville Gas & Electric Co., Sr. Sec. First Mortgage Global Bonds, 1.63%, 11/15/15 | 5,525,000 | 5,597,737 | ||||||
Ohio Power Co., Series M, Sr. Unsec. Notes, 5.38%, 10/01/21 | 1,050,000 | 1,235,829 | ||||||
PPL Electric Utilities Corp., Sr. Sec. First Mortgage Bonds, 6.25%, 05/15/39 | 355,000 | 477,750 | ||||||
| 38,098,628 | ||||||||
| Electrical Components & Equipment–0.06% | ||||||||
Eaton Corp., Sr. Unsec. Gtd. Global Notes, 0.95%, 11/02/15 | 8,285,000 | 8,320,382 | ||||||
| Fertilizers & Agricultural Chemicals–0.07% | ||||||||
Monsanto Co., Sr. Unsec. Global Notes, | ||||||||
2.13%, 07/15/19 | 3,055,000 | 3,063,170 | ||||||
3.38%, 07/15/24 | 2,085,000 | 2,130,106 | ||||||
3.60%, 07/15/42 | 4,150,000 | 3,783,419 | ||||||
| 8,976,695 | ||||||||
| Food Retail–0.10% | ||||||||
Kroger Co. (The), Sr. Unsec. Global Notes, 3.30%, 01/15/21 | 12,870,000 | 13,259,073 | ||||||
| General Merchandise Stores–0.10% | ||||||||
Dollar General Corp., Sr. Unsec. Global Notes, 3.25%, 04/15/23 | 3,650,000 | 3,264,575 | ||||||
Target Corp., Sr. Unsec. Global Notes, 2.90%, 01/15/22 | 9,830,000 | 9,928,768 | ||||||
| 13,193,343 | ||||||||
| Principal Amount | Value | |||||||
| Gold–0.14% | ||||||||
Barrick North America Finance LLC (Canada), Sr. Unsec. Gtd. Global Notes, 5.70%, 05/30/41 | $ | 4,000,000 | $ | 4,240,747 | ||||
Gold Fields Orogen Holdings BVI Ltd. (South Africa), Sr. Unsec. Gtd. Notes, 4.88%, 10/07/20(c) | 10,422,000 | 9,301,635 | ||||||
Newmont Mining Corp., Sr. Unsec. Gtd. Global Notes, 3.50%, 03/15/22 | 6,300,000 | 6,202,293 | ||||||
| 19,744,675 | ||||||||
| Health Care Distributors–0.15% | ||||||||
AmerisourceBergen Corp., Sr. Unsec. Bonds, 3.40%, 05/15/24 | 9,400,000 | 9,478,712 | ||||||
McKesson Corp., Sr. Unsec. Global Notes, 2.28%, 03/15/19 | 11,085,000 | 11,112,254 | ||||||
| 20,590,966 | ||||||||
| Health Care Equipment–0.57% | ||||||||
CareFusion Corp., Sr. Unsec. Global Notes, | ||||||||
3.88%, 05/15/24 | 6,825,000 | 6,955,904 | ||||||
4.88%, 05/15/44 | 7,465,000 | 7,664,344 | ||||||
Edwards Lifesciences Corp., Sr. Unsec. Global Notes, 2.88%, 10/15/18 | 7,055,000 | 7,211,434 | ||||||
Medtronic Inc., Sr. Unsec. Global Notes, | ||||||||
4.00%, 04/01/43 | 5,720,000 | 5,679,515 | ||||||
4.63%, 03/15/44 | 5,490,000 | 5,890,577 | ||||||
NuVasive Inc., Sr. Unsec. Conv. Notes, 2.75%, 07/01/17 | 13,684,000 | 15,488,577 | ||||||
Volcano Corp., Sr. Unsec. Conv. Notes, 1.75%, 12/01/17 | 32,517,000 | 29,305,946 | ||||||
| 78,196,297 | ||||||||
| Health Care Facilities–0.53% | ||||||||
Brookdale Senior Living Inc., Sr. Unsec. Conv. Notes, 2.75%, 06/15/18 | 24,795,000 | 33,969,150 | ||||||
HealthSouth Corp., Sr. Unsec. Sub. Conv. Notes, 2.00%, 12/01/20(e) | 33,605,000 | 38,267,694 | ||||||
| 72,236,844 | ||||||||
| Health Care REIT’s–0.26% | ||||||||
HCP, Inc., Sr. Unsec. Global Notes, | ||||||||
3.88%, 08/15/24 | 8,600,000 | 8,696,933 | ||||||
4.20%, 03/01/24 | 4,690,000 | 4,865,569 | ||||||
Health Care REIT, Inc., Sr. Unsec. Global Notes, 4.50%, 01/15/24 | 5,990,000 | 6,342,702 | ||||||
Senior Housing Properties Trust, Sr. Unsec. Notes, 4.30%, 01/15/16 | 6,620,000 | 6,831,012 | ||||||
Ventas Realty L.P., Sr. Unsec. Gtd. Notes, 5.70%, 09/30/43 | 2,080,000 | 2,483,702 | ||||||
See accompanying Notes to Financial Statements which are an integral part of the financial statements.
15 Invesco Equity and Income Fund
| Principal Amount | Value | |||||||
| Health Care REIT’s–(continued) | ||||||||
Ventas Realty L.P./Ventas Capital Corp., Sr. Unsec. Gtd. Notes, | ||||||||
2.70%, 04/01/20 | $ | 4,710,000 | $ | 4,703,517 | ||||
4.25%, 03/01/22 | 1,905,000 | 2,021,904 | ||||||
| 35,945,339 | ||||||||
| Health Care Services–0.74% | ||||||||
Express Scripts Holding Co., | ||||||||
Sr. Unsec. Gtd. Global Notes, | ||||||||
2.25%, 06/15/19 | 9,380,000 | 9,339,078 | ||||||
Sr. Unsec. Gtd. Notes, | ||||||||
3.13%, 05/15/16 | 3,800,000 | 3,947,282 | ||||||
Medco Health Solutions Inc., Sr. Unsec. Gtd. Notes, 2.75%, 09/15/15 | 3,535,000 | 3,614,058 | ||||||
Omnicare, Inc., | ||||||||
Sr. Unsec. Gtd. Sub. Conv. Notes, | ||||||||
3.75%, 04/01/42 | 29,270,000 | 46,905,175 | ||||||
Sr. Unsec. Gtd. Sub. Conv. Notes, | ||||||||
3.50%, 02/15/44 | 18,351,000 | 20,736,630 | ||||||
Series OCR, Sr. Unsec. Gtd. Conv. Deb., 3.25%, 12/15/15(e) | 16,126,000 | 17,073,402 | ||||||
| 101,615,625 | ||||||||
| Homebuilding–0.07% | ||||||||
MDC Holdings, Inc., Sr. Unsec. Gtd. Notes, 6.00%, 01/15/43 | 10,130,000 | 9,543,081 | ||||||
| Hotels, Resorts & Cruise Lines–0.08% | ||||||||
Wyndham Worldwide Corp., | ||||||||
Sr. Unsec. Notes, | ||||||||
2.95%, 03/01/17 | 1,225,000 | 1,265,567 | ||||||
5.63%, 03/01/21 | 8,170,000 | 9,176,381 | ||||||
| 10,441,948 | ||||||||
| Housewares & Specialties–0.10% | ||||||||
Tupperware Brands Corp., Sr. Unsec. Gtd. Global Notes, 4.75%, 06/01/21 | 12,185,000 | 13,146,662 | ||||||
| Hypermarkets & Super Centers–0.03% | ||||||||
Wal-Mart Stores, Inc., | ||||||||
Sr. Unsec. Global Bonds, | ||||||||
3.30%, 04/22/24 | 3,610,000 | 3,699,003 | ||||||
Sr. Unsec. Global Notes, | ||||||||
6.50%, 08/15/37 | 730,000 | 998,053 | ||||||
| 4,697,056 | ||||||||
| Industrial Conglomerates–0.14% | ||||||||
General Electric Capital Corp., | ||||||||
Sr. Unsec. Medium-Term Global Notes, 6.00%, 08/07/19 | 8,500,000 | 10,027,253 | ||||||
Series C, Jr. Unsec. Sub. Global Bonds, 5.25%(d) | 9,400,000 | 9,646,750 | ||||||
| 19,674,003 | ||||||||
| Principal Amount | Value | |||||||
| Industrial Machinery–0.06% | ||||||||
Pentair Finance S.A., Sr. Unsec. Gtd. Global Notes, 5.00%, 05/15/21 | $ | 7,940,000 | $ | 8,831,449 | ||||
| Insurance Brokers–0.03% | ||||||||
Marsh & McLennan Cos., Inc., Sr. Unsec. Global Notes, 4.05%, 10/15/23 | 3,960,000 | 4,228,020 | ||||||
| Integrated Oil & Gas–0.20% | ||||||||
BP Capital Markets PLC (United Kingdom), Sr. Unsec. Gtd. Global Notes, 2.24%, 05/10/19 | 9,645,000 | 9,713,591 | ||||||
Chevron Corp., Sr. Unsec. Global Notes, 1.72%, 06/24/18 | 5,275,000 | 5,318,990 | ||||||
Husky Energy Inc. (Canada), Sr. Unsec. Global Notes, 3.95%, 04/15/22 | 3,630,000 | 3,868,608 | ||||||
Petrobras Global Finance B.V. (Brazil), Sr. Unsec. Gtd. Global Notes, 5.63%, 05/20/43 | 6,505,000 | 6,280,954 | ||||||
Shell International Finance B.V. (Netherlands), Sr. Unsec. Gtd. Global Notes, 3.10%, 06/28/15 | 1,965,000 | 2,008,605 | ||||||
| 27,190,748 | ||||||||
| Integrated Telecommunication Services–0.51% | ||||||||
AT&T Corp., Sr. Unsec. Gtd. Global Notes, 8.00%, 11/15/31 | 63,000 | 94,451 | ||||||
AT&T Inc., Sr. Unsec. Global Notes, | ||||||||
5.35%, 09/01/40 | 2,077,000 | 2,323,045 | ||||||
6.15%, 09/15/34 | 3,675,000 | 4,527,104 | ||||||
British Telecommunications PLC (United Kingdom), Sr. Unsec. Global Notes, 1.25%, 02/14/17 | 5,420,000 | 5,421,937 | ||||||
Telefonica Emisiones SAU (Spain), Sr. Unsec. Gtd. Global Notes, 7.05%, 06/20/36 | 3,600,000 | 4,706,868 | ||||||
Verizon Communications, Inc., | ||||||||
Sr. Unsec. Global Notes, | ||||||||
3.00%, 04/01/16 | 3,575,000 | 3,700,108 | ||||||
5.15%, 09/15/23 | 4,525,000 | 5,133,233 | ||||||
6.40%, 09/15/33 | 18,470,000 | 23,400,817 | ||||||
6.40%, 02/15/38 | 3,500,000 | 4,399,838 | ||||||
6.55%, 09/15/43 | 6,705,000 | 8,688,685 | ||||||
Sr. Unsec. Notes, | ||||||||
5.01%, 08/21/54(c) | 6,727,000 | 7,095,153 | ||||||
| 69,491,239 | ||||||||
| Internet Software & Services–0.12% | ||||||||
Baidu Inc. (China), Sr. Unsec. Global Notes, 3.25%, 08/06/18 | 6,700,000 | 6,985,129 | ||||||
Tencent Holdings Ltd. (China), Sr. Unsec. Notes, 3.38%, 05/02/19(c) | 9,435,000 | 9,645,370 | ||||||
| 16,630,499 | ||||||||
See accompanying Notes to Financial Statements which are an integral part of the financial statements.
16 Invesco Equity and Income Fund
| Principal Amount | Value | |||||||
| Investment Banking & Brokerage–1.81% | ||||||||
Charles Schwab Corp. (The), Sr. Unsec. Notes, 4.45%, 07/22/20 | $ | 7,880,000 | $ | 8,769,709 | ||||
Goldman Sachs Group, Inc. (The), | ||||||||
Sr. Unsec. Global Notes, | ||||||||
2.63%, 01/31/19 | 5,200,000 | 5,268,594 | ||||||
5.25%, 07/27/21 | 5,510,000 | 6,211,927 | ||||||
6.15%, 04/01/18 | 10,325,000 | 11,780,142 | ||||||
Sr. Unsec. Medium-Term Global Notes, 3.70%, 08/01/15 | 1,350,000 | 1,388,157 | ||||||
Unsec. Sub. Global Notes, | ||||||||
6.75%, 10/01/37 | 4,585,000 | 5,678,382 | ||||||
Series 0000, Sr. Unsec. Exchangeable Basket-Linked Conv. Medium-Term Notes, | ||||||||
1.00%, 03/15/17(c)(f) | 61,461,000 | 80,019,764 | ||||||
1.00%, 09/28/20(c)(g) | 59,890,000 | 66,050,285 | ||||||
Jefferies Group LLC, Sr. Unsec. Conv. Deb., 3.88%, 11/01/17(e) | 14,346,000 | 15,368,152 | ||||||
Macquarie Bank Ltd. (Australia), Sr. Unsec. Notes, 5.00%, 02/22/17(c) | 6,100,000 | 6,622,956 | ||||||
Macquarie Group Ltd. (Australia), Sr. Unsec. Notes, 6.00%, 01/14/20(c) | 3,169,000 | 3,597,254 | ||||||
Morgan Stanley, | ||||||||
Sr. Unsec. Global Notes, | ||||||||
6.38%, 07/24/42 | 8,140,000 | 10,649,679 | ||||||
Sr. Unsec. Medium-Term Global Notes, 4.00%, 07/24/15 | 12,875,000 | 13,278,174 | ||||||
Sr. Unsec. Notes, | ||||||||
3.45%, 11/02/15 | 9,855,000 | 10,167,756 | ||||||
5.75%, 01/25/21 | 3,135,000 | 3,639,254 | ||||||
| 248,490,185 | ||||||||
| IT Consulting & Other Services–0.00% | ||||||||
International Business Machines Corp., Sr. Unsec. Global Notes, 7.63%, 10/15/18 | 100,000 | 122,876 | ||||||
| Life & Health Insurance–0.20% | ||||||||
Aegon N.V. (Netherlands), Sr. Unsec. Global Bonds, 4.63%, 12/01/15 | 3,100,000 | 3,247,476 | ||||||
Lincoln National Corp., Sr. Unsec. Global Notes, 4.00%, 09/01/23 | 4,505,000 | 4,760,102 | ||||||
Pacific LifeCorp., Sr. Unsec. Notes, 6.00%, 02/10/20(c) | 3,425,000 | 3,927,954 | ||||||
Prudential Financial, Inc., | ||||||||
Sr. Unsec. Medium-Term Notes, | ||||||||
5.10%, 08/15/43 | 4,010,000 | 4,469,140 | ||||||
Series D, Sr. Unsec. Medium-Term Notes, | 950,000 | 961,443 | ||||||
4.75%, 09/17/15 | 5,030,000 | 5,242,586 | ||||||
6.63%, 12/01/37 | 3,475,000 | 4,594,861 | ||||||
| 27,203,562 | ||||||||
| Principal Amount | Value | |||||||
| Managed Health Care–0.62% | ||||||||
Aetna, Inc., Sr. Unsec. Global Notes, 3.95%, 09/01/20 | $ | 9,990,000 | $ | 10,781,833 | ||||
Wellpoint Inc., Sr. Unsec. Conv. Bonds, 2.75%, 10/15/42 | 45,576,000 | 74,374,335 | ||||||
| 85,156,168 | ||||||||
| Movies & Entertainment–0.05% | ||||||||
Live Nation Entertainment, Inc., Sr. Unsec. Conv. Notes, 2.50%, 05/15/19(c) | 4,582,000 | 4,616,365 | ||||||
Time Warner, Inc., Sr. Unsec. Gtd. Notes, 5.88%, 11/15/16 | 2,655,000 | 2,931,239 | ||||||
| 7,547,604 | ||||||||
| Multi-Line Insurance–0.03% | ||||||||
American International Group, Inc., Sr. Unsec. Global Notes, 2.30%, 07/16/19 | 3,855,000 | 3,878,593 | ||||||
| Multi-Utilities–0.03% | ||||||||
Enable Midstream Partners L.P., Sr. Unsec. Gtd. Notes, 2.40%, 05/15/19(c) | 4,395,000 | 4,387,850 | ||||||
| Office REIT’s–0.20% | ||||||||
Dexus Diversified Trust/Dexus Office Trust (Australia), Sr. Unsec. Gtd. Notes, 5.60%, 03/15/21(c) | 12,535,000 | 14,424,181 | ||||||
Digital Realty Trust L.P., Sr. Unsec. Gtd. Global Notes, 4.50%, 07/15/15 | 5,210,000 | 5,330,837 | ||||||
Highwoods Realty L.P., Sr. Unsec. Notes, 3.20%, 06/15/21 | 1,650,000 | 1,642,149 | ||||||
Piedmont Operating Partnership L.P., Sr. Unsec. Gtd. Global Notes, 4.45%, 03/15/24 | 6,115,000 | 6,332,158 | ||||||
| 27,729,325 | ||||||||
| Office Services & Supplies–0.04% | ||||||||
Pitney Bowes Inc., Sr. Unsec. Global Notes, 4.63%, 03/15/24 | 5,065,000 | 5,273,764 | ||||||
| Oil & Gas Drilling–0.10% | ||||||||
Noble Holding International Ltd., Sr. Unsec. Gtd. Global Notes, 2.50%, 03/15/17 | 1,150,000 | 1,175,878 | ||||||
Rowan Cos. Inc., Sr. Unsec. Gtd. Notes, 5.85%, 01/15/44 | 11,390,000 | 12,093,007 | ||||||
| 13,268,885 | ||||||||
| Oil & Gas Equipment & Services–0.12% | ||||||||
Helix Energy Solutions Group, Inc., Sr. Unsec. Conv. Notes, 3.25%, 03/15/18(e) | 11,911,000 | 16,169,182 | ||||||
| Oil & Gas Exploration & Production–0.57% | ||||||||
Cobalt International Energy Inc., Sr. Unsec. Conv. Notes, 2.63%, 12/01/19 | 29,294,000 | 25,851,955 | ||||||
See accompanying Notes to Financial Statements which are an integral part of the financial statements.
17 Invesco Equity and Income Fund
| Principal Amount | Value | |||||||
| Oil & Gas Exploration & Production–(continued) | ||||||||
Noble Energy, Inc., Sr. Unsec. Global Notes, 5.25%, 11/15/43 | $ | 7,940,000 | $ | 8,906,371 | ||||
Petroleos Mexicanos (Mexico), Sr. Unsec. Gtd. Global Notes, 4.88%, 01/24/22 | 7,430,000 | 8,105,279 | ||||||
Southwestern Energy Co., Sr. Unsec. Gtd. Global Notes, 4.10%, 03/15/22 | 7,500,000 | 7,970,123 | ||||||
Stone Energy Corp., Sr. Unsec. Gtd. Conv. Notes, 1.75%, 03/01/17 | 24,746,000 | 27,792,851 | ||||||
| 78,626,579 | ||||||||
| Oil & Gas Refining & Marketing–0.03% | ||||||||
Phillips 66, Sr. Unsec. Gtd. Global Notes, 1.95%, 03/05/15 | 4,760,000 | 4,795,570 | ||||||
| Oil & Gas Storage & Transportation–0.42% | ||||||||
Enterprise Products Operating LLC, | ||||||||
Sr. Unsec. Gtd. Global Notes, | ||||||||
5.25%, 01/31/20 | 2,889,000 | 3,293,324 | ||||||
Sr. Unsec. Gtd. Notes, | ||||||||
6.45%, 09/01/40 | 555,000 | 720,179 | ||||||
Series N, Sr. Unsec. Gtd. Notes, | ||||||||
6.50%, 01/31/19 | 4,420,000 | 5,236,613 | ||||||
Plains All American Pipeline L.P./ PAA Finance Corp., Sr. Unsec. Global Notes, 3.65%, 06/01/22 | 4,275,000 | 4,436,162 | ||||||
Spectra Energy Capital LLC, Sr. Unsec. Gtd. Notes, 7.50%, 09/15/38 | 2,245,000 | 2,976,263 | ||||||
Sunoco Logistics Partners Operations L.P., Sr. Unsec. Gtd. Notes, | 8,165,000 | 8,689,523 | ||||||
5.50%, 02/15/20 | 5,405,000 | 6,120,945 | ||||||
Texas Eastern Transmission L.P., Sr. Unsec. Notes, 7.00%, 07/15/32 | 3,835,000 | 5,118,437 | ||||||
Western Gas Partners L.P., Sr. Unsec. Notes, 5.45%, 04/01/44 | 9,710,000 | 10,956,574 | ||||||
Williams Partners L.P., Sr. Unsec. Global Notes, 5.40%, 03/04/44 | 9,000,000 | 9,897,688 | ||||||
| 57,445,708 | ||||||||
| Other Diversified Financial Services–0.13% | ||||||||
ERAC USA Finance LLC, Sr. Unsec. Gtd. Notes, 2.35%, 10/15/19(c) | 9,335,000 | 9,314,213 | ||||||
ING Bank N.V. (Netherlands), Sr. Unsec. Notes, 3.75%, 03/07/17(c) | 8,380,000 | 8,866,036 | ||||||
| 18,180,249 | ||||||||
| Packaged Foods & Meats–0.12% | ||||||||
Grupo Bimbo S.A.B. de C.V. (Mexico), Sr. Unsec. Gtd. Notes, 3.88%, 06/27/24(c) | 7,565,000 | 7,645,292 | ||||||
| Principal Amount | Value | |||||||
| Packaged Foods & Meats–(continued) | ||||||||
Mondelez International Inc., Sr. Unsec. Global Notes, 6.50%, 02/09/40 | $ | 1,476,000 | $ | 1,945,635 | ||||
Tyson Foods, Inc., Sr. Unsec. Gtd. Global Bonds, 3.95%, 08/15/24 | 2,372,000 | 2,427,251 | ||||||
4.88%, 08/15/34 | 2,136,000 | 2,261,874 | ||||||
5.15%, 08/15/44 | 2,202,000 | 2,350,388 | ||||||
| 16,630,440 | ||||||||
| Paper Packaging–0.09% | ||||||||
Packaging Corp. of America, Sr. Unsec. Global Notes, 4.50%, 11/01/23 | 11,775,000 | 12,730,590 | ||||||
| Paper Products–0.02% | ||||||||
International Paper Co., Sr. Unsec. Global Notes, 6.00%, 11/15/41 | 2,855,000 | 3,437,791 | ||||||
| Personal Products–0.01% | ||||||||
Avon Products Inc., Sr. Unsec. Global Notes, 2.38%, 03/15/16 | 1,610,000 | 1,629,513 | ||||||
| Pharmaceuticals–1.01% | ||||||||
AbbVie Inc., Sr. Unsec. Global Notes, 1.20%, 11/06/15 | 18,095,000 | 18,200,334 | ||||||
Actavis Funding SCS, Sr. Unsec. Gtd. Notes, 4.85%, 06/15/44(c) | 9,265,000 | 9,589,369 | ||||||
Jazz Investments I Ltd., Sr. Unsec. Gtd. Conv. Notes, 1.88%, 08/15/21(c) | 14,556,000 | 16,475,573 | ||||||
Mylan Inc., Sr. Unsec. Gtd. Notes, 6.00%, 11/15/18(c) | 10,574,000 | 10,983,743 | ||||||
Novartis Capital Corp. (Switzerland), Sr. Unsec. Gtd. Global Notes, 4.40%, 05/06/44 | 12,800,000 | 13,796,445 | ||||||
Perrigo Co. PLC, Sr. Unsec. Gtd. Notes, 2.30%, 11/08/18(c) | 3,945,000 | 3,941,308 | ||||||
Salix Pharmaceuticals Ltd., Sr. Unsec. Conv. Notes, 1.50%, 03/15/19 | 25,242,000 | 62,016,439 | ||||||
Zoetis Inc., Sr. Unsec. Global Notes, 4.70%, 02/01/43 | 4,101,000 | 4,294,617 | ||||||
| 139,297,828 | ||||||||
| Property & Casualty Insurance–0.29% | ||||||||
CNA Financial Corp., | ||||||||
Sr. Unsec. Global Bonds, | ||||||||
5.88%, 08/15/20 | 4,915,000 | 5,713,787 | ||||||
Sr. Unsec. Notes, | ||||||||
7.35%, 11/15/19 | 425,000 | 522,143 | ||||||
Liberty Mutual Group Inc., Sr. Unsec. Gtd. Bonds, 4.85%, 08/01/44(c) | 6,360,000 | 6,515,344 | ||||||
Markel Corp., Sr. Unsec. Notes, 5.00%, 03/30/43 | 4,185,000 | 4,483,204 | ||||||
Old Republic International Corp., Sr. Unsec. Conv. Notes, 3.75%, 03/15/18 | 8,381,000 | 10,104,343 | ||||||
See accompanying Notes to Financial Statements which are an integral part of the financial statements.
18 Invesco Equity and Income Fund
| Principal Amount | Value | |||||||
| Property & Casualty Insurance–(continued) | ||||||||
Travelers Cos., Inc. (The), Sr. Unsec. Global Notes, 4.60%, 08/01/43 | $ | 6,455,000 | $ | 7,002,154 | ||||
WR Berkley Corp., Sr. Unsec. Global Notes, 4.63%, 03/15/22 | 5,040,000 | 5,466,975 | ||||||
| 39,807,950 | ||||||||
| Railroads–0.26% | ||||||||
Burlington Northern Santa Fe, LLC, Sr. Unsec. Bonds, 5.15%, 09/01/43 | 19,380,000 | 21,931,648 | ||||||
CSX Corp., Sr. Unsec. Notes, 5.50%, 04/15/41 | 1,660,000 | 1,965,963 | ||||||
Union Pacific Corp., Sr. Unsec. Notes, 3.25%, 01/15/25 | 1,550,000 | 1,574,879 | ||||||
4.15%, 01/15/45 | 4,410,000 | 4,473,687 | ||||||
4.85%, 06/15/44 | 5,560,000 | 6,286,768 | ||||||
| 36,232,945 | ||||||||
| Regional Banks–0.12% | ||||||||
Nationwide Building Society (United Kingdom), Sr. Unsec. Notes, 6.25%, 02/25/20(c) | 8,845,000 | 10,446,299 | ||||||
PNC Funding Corp., Sr. Unsec. Gtd. Global Notes, 5.13%, 02/08/20 | 5,305,000 | 6,046,178 | ||||||
| 16,492,477 | ||||||||
| Reinsurance–0.06% | ||||||||
Reinsurance Group of America, Inc., Sr. Unsec. Medium-Term Notes, 4.70%, 09/15/23 | 7,510,000 | 8,182,518 | ||||||
| Renewable Electricity–0.04% | ||||||||
Oglethorpe Power Corp., Sr. Sec. First Mortgage Bonds, 4.55%, 06/01/44 | 5,806,000 | 6,021,411 | ||||||
| Semiconductor Equipment–0.32% | ||||||||
Lam Research Corp., Series B, Sr. Unsec. Conv. Notes, 1.25%, 05/15/18 | 33,039,000 | 44,602,650 | ||||||
| Semiconductors–0.65% | ||||||||
Micron Technology, Inc., Series G, Sr. Unsec. Conv. Global Bonds, 3.00%, 11/15/28(e) | 31,699,000 | 40,634,156 | ||||||
NVIDIA Corp., Sr. Unsec. Conv. Notes, 1.00%, 12/01/18(c) | 42,110,000 | 48,163,312 | ||||||
| 88,797,468 | ||||||||
| Soft Drinks–0.09% | ||||||||
PepsiCo, Inc., Sr. Unsec. Global Notes, 3.60%, 03/01/24 | 11,445,000 | 11,962,236 | ||||||
| Sovereign Debt–0.15% | ||||||||
Brazilian Government International Bond (Brazil), Sr. Unsec. Global Bonds, 6.00%, 01/17/17 | 16,505,000 | 18,295,792 | ||||||
| Principal Amount | Value | |||||||
| Sovereign Debt–(continued) | ||||||||
Peruvian Government International Bond (Peru), Sr. Unsec. Global Notes, 7.13%, 03/30/19 | $ | 1,650,000 | $ | 2,006,813 | ||||
| 20,302,605 | ||||||||
| Specialized Finance–0.09% | ||||||||
Moody’s Corp., Sr. Unsec. Global Notes, 4.50%, 09/01/22 | 9,185,000 | 9,841,618 | ||||||
National Rural Utilities Cooperative Finance Corp., Sr. Sec. Collateral Trust Bonds, 3.05%, 02/15/22 | 2,550,000 | 2,615,364 | ||||||
| 12,456,982 | ||||||||
| Specialized REIT’s–0.24% | ||||||||
American Tower Corp., | ||||||||
Sr. Unsec. Global Notes, | ||||||||
3.40%, 02/15/19 | 7,235,000 | 7,505,356 | ||||||
4.63%, 04/01/15 | 2,425,000 | 2,480,928 | ||||||
5.00%, 02/15/24 | 5,500,000 | 5,961,458 | ||||||
Sr. Unsec. Notes, | ||||||||
4.50%, 01/15/18 | 4,620,000 | 4,988,115 | ||||||
Crown Castle Towers LLC, | ||||||||
Sr. Sec. Gtd. Notes, | ||||||||
3.21%, 08/15/15(c) | 5,295,000 | 5,377,195 | ||||||
6.11%, 01/15/20(c) | 6,300,000 | 7,347,375 | ||||||
| 33,660,427 | ||||||||
| Steel–0.49% | ||||||||
ArcelorMittal (Luxembourg), | ||||||||
Sr. Unsec. Global Bonds, | ||||||||
10.35%, 06/01/19 | 7,005,000 | 8,861,325 | ||||||
Sr. Unsec. Global Notes, | ||||||||
4.25%, 08/05/15 | 8,775,000 | 9,018,506 | ||||||
6.13%, 06/01/18 | 390,000 | 426,153 | ||||||
7.25%, 03/01/41 | 2,225,000 | 2,369,625 | ||||||
United States Steel Corp., Sr. Unsec. Conv. Notes, 2.75%, 04/01/19 | 22,883,000 | 37,170,573 | ||||||
Vale Overseas Ltd. (Brazil), | ||||||||
Sr. Unsec. Gtd. Global Notes, | ||||||||
4.63%, 09/15/20 | 320,000 | 342,504 | ||||||
5.63%, 09/15/19 | 4,655,000 | 5,255,609 | ||||||
Vale S.A. (Brazil), Sr. Unsec. Global Notes, 5.63%, 09/11/42 | 4,075,000 | 4,218,058 | ||||||
| 67,662,353 | ||||||||
| Systems Software–0.22% | ||||||||
NetSuite Inc., Sr. Unsec. Conv. Notes, 0.25%, 06/01/18 | 23,004,000 | 23,967,292 | ||||||
Oracle Corp., Sr. Unsec. Global Notes, 4.30%, 07/08/34 | 6,045,000 | 6,336,621 | ||||||
| 30,303,913 | ||||||||
| Technology Hardware, Storage & Peripherals–0.63% | ||||||||
Apple Inc., Sr. Unsec. Global Notes, 3.45%, 05/06/24 | 3,055,000 | 3,137,731 | ||||||
Hewlett-Packard Co., Sr. Unsec. Global Notes, 2.63%, 12/09/14 | 5,620,000 | 5,652,346 | ||||||
See accompanying Notes to Financial Statements which are an integral part of the financial statements.
19 Invesco Equity and Income Fund
| Principal Amount | Value | |||||||
| Technology Hardware, Storage & Peripherals–(continued) | ||||||||
SanDisk Corp., Sr. Unsec. Conv. Notes, 0.50%, 10/15/20(c) | $ | 55,749,000 | $ | 68,013,780 | ||||
Seagate HDD Cayman, Sr. Unsec. Gtd. Bonds, 4.75%, 01/01/25(c) | 9,725,000 | 9,883,031 | ||||||
| 86,686,888 | ||||||||
| Thrifts & Mortgage Finance–0.42% | ||||||||
MGIC Investment Corp., Sr. Unsec. Conv. Notes, | 6,962,000 | 9,772,908 | ||||||
5.00%, 05/01/17 | 24,396,000 | 27,308,272 | ||||||
Radian Group Inc., Sr. Unsec. Conv. Notes, | 4,063,000 | 5,967,531 | ||||||
3.00%, 11/15/17 | 10,019,000 | 14,201,933 | ||||||
| 57,250,644 | ||||||||
| Tobacco–0.13% | ||||||||
Altria Group, Inc., Sr. Unsec. Gtd. Global Notes, 4.13%, 09/11/15 | 715,000 | 741,842 | ||||||
Philip Morris International Inc., | ||||||||
Sr. Unsec. Global Notes, | ||||||||
3.60%, 11/15/23 | 3,940,000 | 4,100,299 | ||||||
4.88%, 11/15/43 | 11,740,000 | 12,966,801 | ||||||
| 17,808,942 | ||||||||
| Trucking–0.08% | ||||||||
Penske Truck Leasing Co., L.P./PTL Finance Corp., Sr. Unsec. Notes, 2.50%, 03/15/16(c) | 7,435,000 | 7,609,651 | ||||||
Ryder System, Inc., Sr. Unsec. Medium-Term Notes, 3.15%, 03/02/15 | 4,030,000 | 4,084,624 | ||||||
| 11,694,275 | ||||||||
| Wireless Telecommunication Services–0.12% | ||||||||
America Movil S.A.B. de C.V. (Mexico), | ||||||||
Sr. Unsec. Global Notes, | ||||||||
4.38%, 07/16/42 | 6,610,000 | 6,516,008 | ||||||
Sr. Unsec. Gtd. Global Notes, | ||||||||
2.38%, 09/08/16 | 4,450,000 | 4,571,990 | ||||||
Rogers Communications Inc. (Canada), Sr. Unsec. Gtd. Global Notes, 4.50%, 03/15/43 | 6,080,000 | 6,102,531 | ||||||
| 17,190,529 | ||||||||
Total Bonds & Notes |
| 2,876,226,687 | ||||||
U.S. Treasury Securities–5.16% |
| |||||||
| U.S. Treasury Bills–0.02% | ||||||||
0.04%, 11/13/14(h)(i) | 2,280,000 | 2,279,931 | ||||||
| U.S. Treasury Bonds–0.25% | ||||||||
3.38%, 05/15/44 | 32,678,100 | 34,606,167 | ||||||
| U.S. Treasury Notes–4.89% | ||||||||
2.38%, 10/31/14 | 206,415,000 | 207,190,730 | ||||||
2.13%, 11/30/14 | 77,385,000 | 77,772,877 | ||||||
| Principal Amount | Value | |||||||
| U.S. Treasury Notes–(continued) | ||||||||
2.25%, 01/31/15 | $ | 19,650,000 | $ | 19,825,415 | ||||
2.50%, 03/31/15 | 495,000 | 501,975 | ||||||
2.13%, 05/31/15 | 4,445,000 | 4,511,842 | ||||||
2.00%, 04/30/16 | 17,445,000 | 17,912,577 | ||||||
1.75%, 05/31/16 | 950,000 | 971,904 | ||||||
0.50%, 07/31/16 | 21,000,000 | 21,011,839 | ||||||
0.88%, 04/30/17 | 2,000,000 | 2,002,697 | ||||||
0.63%, 05/31/17 | 4,410,000 | 4,381,505 | ||||||
0.88%, 08/15/17 | 73,025,000 | 72,907,434 | ||||||
1.25%, 01/31/19 | 23,000,000 | 22,736,491 | ||||||
1.63%, 07/31/19 | 123,590,000 | 123,623,842 | ||||||
3.63%, 08/15/19 | 58,350,000 | 63,891,417 | ||||||
3.38%, 11/15/19 | 10,000,000 | 10,846,612 | ||||||
2.38%, 08/15/24 | 22,377,200 | 22,445,085 | ||||||
| 672,534,242 | ||||||||
Total U.S. Treasury Securities |
| 709,420,340 | ||||||
| Shares | ||||||||
Preferred Stocks–1.08% |
| |||||||
| Asset Management & Custody Banks–0.21% | ||||||||
AMG Capital Trust II, $2.58 Jr. Gtd. Sub. Conv. Pfd. | 321,000 | 20,604,187 | ||||||
State Street Corp., Series D, 5.90% Pfd. | 300,000 | 7,830,000 | ||||||
| 28,434,187 | ||||||||
| Diversified Banks–0.09% | ||||||||
Wells Fargo & Co., 5.85% Pfd. | 476,600 | 12,424,962 | ||||||
| Oil & Gas Storage & Transportation–0.37% | ||||||||
El Paso Energy Capital Trust I, $2.38 Jr. Unsec. Gtd. Sub. Conv. Pfd. | 875,900 | 51,704,377 | ||||||
| Regional Banks–0.41% | ||||||||
KeyCorp, Series A, $7.75 Conv. Pfd. | 427,098 | 55,949,838 | ||||||
Total Preferred Stocks |
| 148,513,364 | ||||||
| Principal Amount | ||||||||
U.S. Government Sponsored Agency |
| |||||||
| Federal Home Loan Mortgage Corp. (FHLMC)–0.35% | ||||||||
Unsec. Global Notes, | ||||||||
4.88%, 06/13/18 | $ | 33,680,000 | 38,025,238 | |||||
6.75%, 03/15/31 | 7,000,000 | 10,260,947 | ||||||
| 48,286,185 | ||||||||
| Federal National Mortgage Association (FNMA)–0.36% | ||||||||
Unsec. Global Notes, | ||||||||
4.38%, 10/15/15 | 38,850,000 | 40,641,630 | ||||||
6.63%, 11/15/30 | 6,315,000 | 9,142,082 | ||||||
| 49,783,712 | ||||||||
Total U.S. Government Sponsored Agency Securities (Cost $97,504,798) |
| 98,069,897 | ||||||
See accompanying Notes to Financial Statements which are an integral part of the financial statements.
20 Invesco Equity and Income Fund
| Principal Amount | Value | |||||||
Municipal Obligations–0.07% |
| |||||||
Georgia (State of) Municipal Electric Authority (Plant Vogtle Units 3 & 4 Project J); | ||||||||
Series 2010, Class A, Build America Taxable RB, | ||||||||
6.66%, 04/01/57 | $ | 4,980,000 | $ | 6,215,289 | ||||
Series 2010 A, Taxable Build America RB, 6.64%, 04/01/57 | 2,600,000 | 3,309,618 | ||||||
Total Municipal Obligations |
| 9,524,907 | ||||||
U.S. Government Sponsored Agency Mortgage-Backed Securities–0.00% |
| |||||||
| Federal Home Loan Mortgage Corp. (FHLMC)–0.00% | ||||||||
Pass Through Ctfs., | ||||||||
6.50%, 05/01/29 | 2 | 3 | ||||||
5.50%, 02/01/37 | 117 | 129 | ||||||
| 132 | ||||||||
| Federal National Mortgage Association (FNMA)–0.00% | ||||||||
Pass Through Ctfs., | ||||||||
7.00%, 07/01/18 to 07/01/32 | 50,675 | 54,366 | ||||||
5.50%, 03/01/21 | 142 | 155 | ||||||
8.00%, 08/01/21 | 3,785 | 4,056 | ||||||
| 58,577 | ||||||||
| Government National Mortgage Association (GNMA)–0.00% | ||||||||
Pass Through Ctfs., | ||||||||
8.00%, 04/15/26 to 01/20/31 | 37,119 | 40,341 | ||||||
7.50%, 12/20/30 | 2,423 | 2,931 | ||||||
| 43,272 | ||||||||
Total U.S. Government Sponsored Agency Mortgage-Backed Securities (Cost $97,169) |
| 101,981 | ||||||
| Number of Contracts | Exercise Price | Expiration Date | Value | |||||||||||||
Put Options Purchased–0.00% |
| |||||||||||||||
| Personal Products–0.00% | ||||||||||||||||
Avon Products, Inc. |
| 16,508 |
| $ | 11 | Oct-14 | $ | 82,540 | ||||||||
| Shares | ||||||||
Money Market Funds–8.12% |
| |||||||
Liquid Assets Portfolio–Institutional Class(j) | 558,004,437 | 558,004,437 | ||||||
Premier Portfolio– Institutional Class(j) | 558,004,436 | 558,004,436 | ||||||
Total Money Market Funds |
| 1,116,008,873 | ||||||
TOTAL INVESTMENTS–99.59% |
| 13,696,264,244 | ||||||
OTHER ASSETS LESS LIABILITIES–0.41% |
| 56,911,685 | ||||||
NET ASSETS–100.00% |
| $ | 13,753,175,929 | |||||
Investment Abbreviations:
| ADR | – American Depositary Receipt | |
| Conv. | – Convertible | |
| Ctfs. | – Certificates | |
| Deb. | – Debentures | |
| Gtd. | – Guaranteed | |
| Jr. | – Junior | |
| Pfd. | – Preferred | |
| RB | – Revenue Bonds | |
| REIT | – Real Estate Investment Trust | |
| Sec. | – Secured | |
| Sr. | – Senior | |
| Sub. | – Subordinated | |
| Unsec. | – Unsecured |
Notes to Schedule of Investments:
| (a) | Industry and/or sector classifications used in this report are generally according to the Global Industry Classification Standard, which was developed by and is the exclusive property and a service mark of MSCI Inc. and Standard & Poor’s. |
| (b) | Non-income producing security. |
| (c) | Security purchased or received in a transaction exempt from registration under the Securities Act of 1933, as amended (the “1933 Act”). The security may be resold pursuant to an exemption from registration under the 1933 Act, typically to qualified institutional buyers. The aggregate value of these securities at August 31, 2014 was $858,124,190, which represented 6.24% of the Fund’s Net Assets. |
| (d) | Perpetual bond with no specified maturity date. |
| (e) | Security has an irrevocable call by the issuer or mandatory put by the holder. Maturity date reflects such call or put. |
| (f) | Exchangeable for a basket of four common stocks and one ordinary Share. |
| (g) | Exchangeable for a basket of five common shares. |
| (h) | Security traded on a discount basis. The interest rate shown represents the discount rate at the time of purchase by the Fund. |
| (i) | All or a portion of the value was pledged as collateral to cover margin requirements for open futures contracts. See Note 1K and Note 4. |
| (j) | The money market fund and the Fund are affiliated by having the same investment adviser. |
See accompanying Notes to Financial Statements which are an integral part of the financial statements.
21 Invesco Equity and Income Fund
Statement of Assets and Liabilities
August 31, 2014
Assets: |
| |||
Investments, at value (Cost $9,963,495,728) | $ | 12,580,255,371 | ||
Investments in affiliated money market funds, at value and cost | 1,116,008,873 | |||
Total investments, at value (Cost $11,079,504,601) | 13,696,264,244 | |||
Foreign currencies, at value (Cost $249,132) | 221,685 | |||
Receivable for: | ||||
Investments sold | 70,058,713 | |||
Variation margin — futures | 42,313 | |||
Fund shares sold | 16,774,114 | |||
Dividends and interest | 50,183,488 | |||
Forward foreign currency contracts outstanding | 307,499 | |||
Investment for trustee deferred compensation and retirement plans | 1,257,897 | |||
Other assets | 273,998 | |||
Total assets | 13,835,383,951 | |||
Liabilities: |
| |||
Payable for: | ||||
Investments purchased | 57,337,365 | |||
Fund shares reacquired | 13,495,276 | |||
Accrued fees to affiliates | 9,395,142 | |||
Accrued trustees’ and officers’ fees and benefits | 25,150 | |||
Accrued other operating expenses | 470,869 | |||
Trustee deferred compensation and retirement plans | 1,484,220 | |||
Total liabilities | 82,208,022 | |||
Net assets applicable to shares outstanding | $ | 13,753,175,929 | ||
Net assets consist of: |
| |||
Shares of beneficial interest | $ | 10,094,334,286 | ||
Undistributed net investment income | 132,247,328 | |||
Undistributed net realized gain | 909,557,934 | |||
Net unrealized appreciation | 2,617,036,381 | |||
| $ | 13,753,175,929 | |||
Net Assets: |
| |||
Class A | $ | 10,181,795,621 | ||
Class B | $ | 442,317,533 | ||
Class C | $ | 1,624,964,885 | ||
Class R | $ | 232,454,692 | ||
Class Y | $ | 719,931,391 | ||
Class R5 | $ | 402,366,106 | ||
Class R6 | $ | 149,345,701 | ||
Shares outstanding, $0.01 par value per share, |
| |||
Class A | 891,394,898 | |||
Class B | 39,550,365 | |||
Class C | 144,589,878 | |||
Class R | 20,267,133 | |||
Class Y | 63,005,377 | |||
Class R5 | 35,198,417 | |||
Class R6 | 13,068,029 | |||
Class A: | ||||
Net asset value per share | $ | 11.42 | ||
Maximum offering price per share | ||||
(Net asset value of $11.42 ¸ 94.50%) | $ | 12.08 | ||
Class B: | ||||
Net asset value and offering price per share | $ | 11.18 | ||
Class C: | ||||
Net asset value and offering price per share | $ | 11.24 | ||
Class R: | ||||
Net asset value and offering price per share | $ | 11.47 | ||
Class Y: | ||||
Net asset value and offering price per share | $ | 11.43 | ||
Class R5: | ||||
Net asset value and offering price per share | $ | 11.43 | ||
Class R6: | ||||
Net asset value and offering price per share | $ | 11.43 | ||
See accompanying Notes to Financial Statements which are an integral part of the financial statements.
22 Invesco Equity and Income Fund
Statement of Operations
For the year ended August 31, 2014
Investment income: |
| |||
Dividends (net of foreign withholding taxes of $3,906,010) | $ | 249,345,808 | ||
Dividends from affiliated money market funds | 363,367 | |||
Interest | 107,087,940 | |||
Total investment income | 356,797,115 | |||
Expenses: | ||||
Advisory fees | 45,307,917 | |||
Administrative services fees | 865,139 | |||
Custodian fees | 406,520 | |||
Distribution fees: | ||||
Class A | 23,947,907 | |||
Class B | 5,163,932 | |||
Class C | 14,798,109 | |||
Class R | 1,071,304 | |||
Transfer agent fees — A, B, C, R and Y | 19,964,633 | |||
Transfer agent fees — R5 | 343,282 | |||
Transfer agent fees — R6 | 4,288 | |||
Trustees’ and officers’ fees and benefits | 422,822 | |||
Other | 3,291,738 | |||
Total expenses | 115,587,591 | |||
Less: Fees waived and expense offset arrangement(s) | (1,172,098 | ) | ||
Net expenses | 114,415,493 | |||
Net investment income | 242,381,622 | |||
Realized and unrealized gain (loss) from: | ||||
Net realized gain (loss) from: | ||||
Investment securities | 1,235,711,760 | |||
Foreign currencies | 153,924 | |||
Forward foreign currency contracts | 3,416,858 | |||
Futures contracts | (8,202,015 | ) | ||
| 1,231,080,527 | ||||
Change in net unrealized appreciation (depreciation) of: | ||||
Investment securities | 603,859,790 | |||
Foreign currencies | (1,932 | ) | ||
Forward foreign currency contracts | (1,303,078 | ) | ||
Futures contracts | 102,570 | |||
| 602,657,350 | ||||
Net realized and unrealized gain | 1,833,737,877 | |||
Net increase in net assets resulting from operations | $ | 2,076,119,499 | ||
See accompanying Notes to Financial Statements which are an integral part of the financial statements.
23 Invesco Equity and Income Fund
Statement of Changes in Net Assets
For the years ended August 31, 2014 and 2013
| 2014 | 2013 | |||||||
Operations: |
| |||||||
Net investment income | $ | 242,381,622 | $ | 180,139,165 | ||||
Net realized gain | 1,231,080,527 | 610,922,992 | ||||||
Change in net unrealized appreciation | 602,657,350 | 986,558,488 | ||||||
Net increase in net assets resulting from operations | 2,076,119,499 | 1,777,620,645 | ||||||
Distributions to shareholders from net investment income: | ||||||||
Class A | (176,864,717 | ) | (177,192,280 | ) | ||||
Class B | (6,019,914 | ) | (9,850,781 | ) | ||||
Class C | (16,287,779 | ) | (16,986,784 | ) | ||||
Class R | (3,426,602 | ) | (3,445,076 | ) | ||||
Class Y | (12,338,759 | ) | (10,171,497 | ) | ||||
Class R5 | (7,043,126 | ) | (5,604,640 | ) | ||||
Class R6 | (1,862,221 | ) | (1,344,016 | ) | ||||
Total distributions from net investment income | (223,843,118 | ) | (224,595,074 | ) | ||||
Distributions to shareholders from net realized gains: | ||||||||
Class A | (493,452,271 | ) | — | |||||
Class B | (29,777,478 | ) | — | |||||
Class C | (75,974,395 | ) | — | |||||
Class R | (10,930,123 | ) | — | |||||
Class Y | (30,498,502 | ) | — | |||||
Class R5 | (15,792,758 | ) | — | |||||
Class R6 | (3,739,507 | ) | — | |||||
Total distributions from net realized gains | (660,165,034 | ) | — | |||||
Share transactions–net: | ||||||||
Class A | 535,605,880 | (291,238,977 | ) | |||||
Class B | (174,743,171 | ) | (266,029,232 | ) | ||||
Class C | 204,432,386 | (40,820,681 | ) | |||||
Class R | 18,698,631 | (8,690,407 | ) | |||||
Class Y | 187,672,956 | 9,342,497 | ||||||
Class R5 | 129,099,607 | (29,202,753 | ) | |||||
Class R6 | 102,986,907 | 29,344,576 | ||||||
Net increase (decrease) in net assets resulting from share transactions | 1,003,753,196 | (597,294,977 | ) | |||||
Net increase in net assets | 2,195,864,543 | 955,730,594 | ||||||
Net assets: | ||||||||
Beginning of year | 11,557,311,386 | 10,601,580,792 | ||||||
End of year (includes undistributed net investment income of $132,247,328 and $55,604,360, respectively) | $ | 13,753,175,929 | $ | 11,557,311,386 | ||||
Notes to Financial Statements
August 31, 2014
NOTE 1—Significant Accounting Policies
Invesco Equity and Income Fund (the “Fund”) is a series portfolio of AIM Counselor Series Trust (Invesco Counselor Series Trust) (the “Trust”). The Trust is a Delaware statutory trust registered under the Investment Company Act of 1940, as amended (the “1940 Act”), as an open-end series management investment company consisting of thirteen separate portfolios, each authorized to issue an unlimited number of shares of beneficial interest. The assets, liabilities and operations of each portfolio are accounted for separately. Information presented in these financial statements pertains only to the Fund. Matters affecting each portfolio or class will be voted on exclusively by the shareholders of such portfolio or class.
The Fund’s investment objective is current income and, secondarily, capital appreciation.
The Fund currently consists of seven different classes of shares: Class A, Class B, Class C, Class R, Class Y, Class R5 and Class R6. Class A shares are sold with a front-end sales charge unless certain waiver criteria are met and under certain circumstances load waived shares may be subject to
24 Invesco Equity and Income Fund
contingent deferred sales charges (“CDSC”). Class C shares are sold with a CDSC. Class R, Class Y, Class R5 and Class R6 shares are sold at net asset value. Effective November 30, 2010, new or additional investments in Class B shares are no longer permitted. Existing shareholders of Class B shares may continue to reinvest dividends and capital gains distributions in Class B shares until they convert to Class A shares. Also, shareholders in Class B shares will be able to exchange those shares for Class B shares of other Invesco Funds offering such shares until they convert to Class A shares. Generally, Class B shares will automatically convert to Class A shares on or about the month-end, which is at least eight years after the date of purchase. Redemption of Class B shares prior to the conversion date will be subject to a CDSC.
The following is a summary of the significant accounting policies followed by the Fund in the preparation of its financial statements.
| A. | Security Valuations — Securities, including restricted securities, are valued according to the following policy. |
Debt obligations (including convertible securities) and unlisted equities are fair valued using an evaluated quote provided by an independent pricing service. Evaluated quotes provided by the pricing service may be determined without exclusive reliance on quoted prices, and may reflect appropriate factors such as institution-size trading in similar groups of securities, developments related to specific securities, dividend rate (for unlisted equities), yield (for debt obligations), quality, type of issue, coupon rate (for debt obligations), maturity (for debt obligations), individual trading characteristics and other market data. Debt obligations are subject to interest rate and credit risks. In addition, all debt obligations involve some risk of default with respect to interest and/or principal payments.
A security listed or traded on an exchange (except convertible securities) is valued at its last sales price or official closing price as of the close of the customary trading session on the exchange where the security is principally traded, or lacking any sales or official closing price on a particular day, the security may be valued at the closing bid price on that day. Securities traded in the over-the-counter market are valued based on prices furnished by independent pricing services or market makers. When such securities are valued by an independent pricing service they may be considered fair valued. Futures contracts are valued at the final settlement price set by an exchange on which they are principally traded. Listed options are valued at the mean between the last bid and ask prices from the exchange on which they are principally traded. Options not listed on an exchange are valued by an independent source at the mean between the last bid and ask prices. For purposes of determining net asset value per share, futures and option contracts generally are valued 15 minutes after the close of the customary trading session of the New York Stock Exchange (“NYSE”).
Investments in open-end and closed-end registered investment companies that do not trade on an exchange are valued at the end of day net asset value per share. Investments in open-end and closed-end registered investment companies that trade on an exchange are valued at the last sales price or official closing price as of the close of the customary trading session on the exchange where the security is principally traded.
Foreign securities’ (including foreign exchange contracts) prices are converted into U.S. dollar amounts using the applicable exchange rates as of the close of the NYSE. If market quotations are available and reliable for foreign exchange-traded equity securities, the securities will be valued at the market quotations. Because trading hours for certain foreign securities end before the close of the NYSE, closing market quotations may become unreliable. If between the time trading ends on a particular security and the close of the customary trading session on the NYSE, events occur that the Adviser determines are significant and make the closing price unreliable, the Fund may fair value the security. If the event is likely to have affected the closing price of the security, the security will be valued at fair value in good faith using procedures approved by the Board of Trustees. Adjustments to closing prices to reflect fair value may also be based on a screening process of an independent pricing service to indicate the degree of certainty, based on historical data, that the closing price in the principal market where a foreign security trades is not the current value as of the close of the NYSE. Foreign securities’ prices meeting the approved degree of certainty that the price is not reflective of current value will be priced at the indication of fair value from the independent pricing service. Multiple factors may be considered by the independent pricing service in determining adjustments to reflect fair value and may include information relating to sector indices, American Depositary Receipts and domestic and foreign index futures. Foreign securities may have additional risks including exchange rate changes, potential for sharply devalued currencies and high inflation, political and economic upheaval, the relative lack of issuer information, relatively low market liquidity and the potential lack of strict financial and accounting controls and standards.
Securities for which market prices are not provided by any of the above methods may be valued based upon quotes furnished by independent sources. The last bid price may be used to value equity securities. The mean between the last bid and asked prices is used to value debt obligations, including corporate loans.
Securities for which market quotations are not readily available or became unreliable are valued at fair value as determined in good faith by or under the supervision of the Trust’s officers following procedures approved by the Board of Trustees. Issuer specific events, market trends, bid/ask quotes of brokers and information providers and other market data may be reviewed in the course of making a good faith determination of a security’s fair value.
The Fund may invest in securities that are subject to interest rate risk, meaning the risk that the prices will generally fall as interest rates rise and, conversely, the prices will generally rise as interest rates fall. Specific securities differ in their sensitivity to changes in interest rates depending on their individual characteristics. Changes in interest rates may result in increased market volatility, which may affect the value and/or liquidity of certain of the Fund’s investments.
Valuations change in response to many factors including the historical and prospective earnings of the issuer, the value of the issuer’s assets, general economic conditions, interest rates, investor perceptions and market liquidity. Because of the inherent uncertainties of valuation, the values reflected in the financial statements may materially differ from the value received upon actual sale of those investments.
| B. | Securities Transactions and Investment Income — Securities transactions are accounted for on a trade date basis. Realized gains or losses on sales are computed on the basis of specific identification of the securities sold. Interest income (net of withholding tax, if any) is recorded on the accrual basis from settlement date. Paydown gains and losses on mortgage and asset-backed securities are recorded as adjustments to interest income. Dividend income (net of withholding tax, if any) is recorded on the ex-dividend date. Bond premiums and discounts are amortized and/or accreted for financial reporting purposes. |
The Fund may periodically participate in litigation related to Fund investments. As such, the Fund may receive proceeds from litigation settlements. Any proceeds received are included in the Statement of Operations as realized gain (loss) for investments no longer held and as unrealized gain (loss) for investments still held.
Brokerage commissions and mark ups are considered transaction costs and are recorded as an increase to the cost basis of securities purchased and/or a reduction of proceeds on a sale of securities. Such transaction costs are included in the determination of net realized and
25 Invesco Equity and Income Fund
unrealized gain (loss) from investment securities reported in the Statement of Operations and the Statement of Changes in Net Assets and the net realized and unrealized gains (losses) on securities per share in the Financial Highlights. Transaction costs are included in the calculation of the Fund’s net asset value and, accordingly, they reduce the Fund’s total returns. These transaction costs are not considered operating expenses and are not reflected in net investment income reported in the Statement of Operations and Statement of Changes in Net Assets, or the net investment income per share and ratios of expenses and net investment income reported in the Financial Highlights, nor are they limited by any expense limitation arrangements between the Fund and the investment adviser.
The Fund allocates income and realized and unrealized capital gains and losses to a class based on the relative net assets of each class.
| C. | Country Determination — For the purposes of making investment selection decisions and presentation in the Schedule of Investments, the investment adviser may determine the country in which an issuer is located and/or credit risk exposure based on various factors. These factors include the laws of the country under which the issuer is organized, where the issuer maintains a principal office, the country in which the issuer derives 50% or more of its total revenues and the country that has the primary market for the issuer’s securities, as well as other criteria. Among the other criteria that may be evaluated for making this determination are the country in which the issuer maintains 50% or more of its assets, the type of security, financial guarantees and enhancements, the nature of the collateral and the sponsor organization. Country of issuer and/or credit risk exposure has been determined to be the United States of America, unless otherwise noted. |
| D. | Distributions — Distributions from net investment income, if any, are declared and paid quarterly and are recorded on the ex-dividend date. Distributions from net realized capital gain, if any, are generally declared and paid annually and recorded on the ex-dividend date. The Fund may elect to treat a portion of the proceeds from redemptions as distributions for federal income tax purposes. |
| E. | Federal Income Taxes — The Fund intends to comply with the requirements of Subchapter M of the Internal Revenue Code of 1986, as amended (the “Internal Revenue Code”), necessary to qualify as a regulated investment company and to distribute substantially all of the Fund’s taxable earnings to shareholders. As such, the Fund will not be subject to federal income taxes on otherwise taxable income (including net realized capital gain) that is distributed to shareholders. Therefore, no provision for federal income taxes is recorded in the financial statements. |
The Fund recognizes the tax benefits of uncertain tax positions only when the position is more likely than not to be sustained. Management has analyzed the Fund’s uncertain tax positions and concluded that no liability for unrecognized tax benefits should be recorded related to uncertain tax positions. Management is not aware of any tax positions for which it is reasonably possible that the total amounts of unrecognized tax benefits will change materially in the next 12 months.
The Fund files tax returns in the U.S. Federal jurisdiction and certain other jurisdictions. Generally, the Fund is subject to examinations by such taxing authorities for up to three years after the filing of the return for the tax period.
| F. | Expenses — Fees provided for under the Rule 12b-1 plan of a particular class of the Fund are charged to the operations of such class. Transfer agency fees and expenses and other shareholder recordkeeping fees and expenses attributable to Class R5 and Class R6 are allocated to each share class based on relative net assets. Sub-accounting fees attributable to Class R5 are charged to the operations of the class. Transfer agency fees and expenses and other shareholder recordkeeping fees and expenses relating to all other classes are allocated among those classes based on relative net assets. All other expenses are allocated among the classes based on relative net assets. Prior to June 1, 2010, incremental transfer agency fees which were unique to each class of shares were charged to the operations of such class. |
| G. | Accounting Estimates — The preparation of financial statements in conformity with accounting principles generally accepted in the United States of America (“GAAP”) requires management to make estimates and assumptions that affect the reported amounts of assets and liabilities at the date of the financial statements and the reported amounts of revenues and expenses during the reporting period including estimates and assumptions related to taxation. Actual results could differ from those estimates by a significant amount. In addition, the Fund monitors for material events or transactions that may occur or become known after the period-end date and before the date the financial statements are released to print. |
| H. | Indemnifications — Under the Trust’s organizational documents, each Trustee, officer, employee or other agent of the Trust is indemnified against certain liabilities that may arise out of the performance of their duties to the Fund. Additionally, in the normal course of business, the Fund enters into contracts, including the Fund’s servicing agreements, that contain a variety of indemnification clauses. The Fund’s maximum exposure under these arrangements is unknown as this would involve future claims that may be made against the Fund that have not yet occurred. The risk of material loss as a result of such indemnification claims is considered remote. |
| I. | Foreign Currency Translations — Foreign currency is valued at the close of the NYSE based on quotations posted by banks and major currency dealers. Portfolio securities and other assets and liabilities denominated in foreign currencies are translated into U.S. dollar amounts at date of valuation. Purchases and sales of portfolio securities (net of foreign taxes withheld on disposition) and income items denominated in foreign currencies are translated into U.S. dollar amounts on the respective dates of such transactions. The Fund does not separately account for the portion of the results of operations resulting from changes in foreign exchange rates on investments and the fluctuations arising from changes in market prices of securities held. The combined results of changes in foreign exchange rates and the fluctuation of market prices on investments (net of estimated foreign tax withholding) are included with the net realized and unrealized gain or loss from investments in the Statement of Operations. Reported net realized foreign currency gains or losses arise from (1) sales of foreign currencies, (2) currency gains or losses realized between the trade and settlement dates on securities transactions, and (3) the difference between the amounts of dividends, interest, and foreign withholding taxes recorded on the Fund’s books and the U.S. dollar equivalent of the amounts actually received or paid. Net unrealized foreign currency gains and losses arise from changes in the fair values of assets and liabilities, other than investments in securities at fiscal period end, resulting from changes in exchange rates. |
The Fund may invest in foreign securities, which may be subject to foreign taxes on income, gains on investments or currency repatriation, a portion of which may be recoverable. Foreign taxes, if any, are recorded based on the tax regulations and rates that exist in the foreign markets in which the Fund invests and are shown in the Statement of Operations.
| J. | Forward Foreign Currency Contracts — The Fund may engage in foreign currency transactions either on a spot (i.e. for prompt delivery and settlement) basis at the rate prevailing in the currency exchange market at the time or through forward foreign currency contracts to manage or minimize currency or exchange rate risk. |
The Fund may also enter into forward foreign currency contracts for the purchase or sale of a security denominated in a foreign currency in order to “lock in” the U.S. dollar price of that security, or the Fund may also enter into forward foreign currency contracts that do not provide for
26 Invesco Equity and Income Fund
physical settlement of the two currencies, but instead are settled by a single cash payment calculated as the difference between the agreed upon exchange rate and the spot rate at settlement based upon an agreed upon notional amount (non-deliverable forwards). The Fund will set aside liquid assets in an amount equal to daily mark-to-market obligation for forward foreign currency contracts.
A forward foreign currency contract is an obligation to purchase or sell a specific currency for an agreed-upon price at a future date. The use of forward foreign currency contracts does not eliminate fluctuations in the price of the underlying securities the Fund owns or intends to acquire but establishes a rate of exchange in advance. Fluctuations in the value of these contracts are measured by the difference in the contract date and reporting date exchange rates and are recorded as unrealized appreciation (depreciation) until the contracts are closed. When the contracts are closed, realized gains (losses) are recorded. Realized and unrealized gains (losses) on the contracts are included in the Statement of Operations. The primary risks associated with forward foreign currency contracts include failure of the counterparty to meet the terms of the contract and the value of the foreign currency changing unfavorably. These risks may be in excess of the amounts reflected in the Statement of Assets and Liabilities.
| K. | Futures Contracts — The Fund may enter into futures contracts to manage exposure to interest rate, equity and market price movements and/or currency risks. A futures contract is an agreement between two parties to purchase or sell a specified underlying security, currency or commodity (or delivery of a cash settlement price, in the case of an index future) for a fixed price at a future date. The Fund currently invests only in exchange-traded futures and they are standardized as to maturity date and underlying financial instrument. Initial margin deposits required upon entering into futures contracts are satisfied by the segregation of specific securities or cash as collateral at the futures commission merchant (broker). During the period the futures contracts are open, changes in the value of the contracts are recognized as unrealized gains or losses by recalculating the value of the contracts on a daily basis. Subsequent or variation margin payments are received or made depending upon whether unrealized gains or losses are incurred. These amounts are reflected as receivables or payables on the Statement of Assets and Liabilities. When the contracts are closed or expire, the Fund recognizes a realized gain or loss equal to the difference between the proceeds from, or cost of, the closing transaction and the Fund’s basis in the contract. The net realized gain (loss) and the change in unrealized gain (loss) on futures contracts held during the period is included on the Statement of Operations. The primary risks associated with futures contracts are market risk and the absence of a liquid secondary market. If the Fund were unable to liquidate a futures contract and/or enter into an offsetting closing transaction, the Fund would continue to be subject to market risk with respect to the value of the contracts and continue to be required to maintain the margin deposits on the futures contracts. Futures contracts have minimal counterparty risk since the exchange’s clearinghouse, as counterparty to all exchange-traded futures, guarantees the futures against default. Risks may exceed amounts recognized in the Statement of Assets and Liabilities. |
| L. | Put Options Purchased — The Fund may purchase put options including options on securities indexes and/or futures contracts. By purchasing a put option, the Fund obtains the right (but not the obligation) to sell the option’s underlying instrument at a fixed strike price. In return for this right, the Fund pays an option premium. The option’s underlying instrument may be a security, securities index, or a futures contract. Put options may be used by the Fund to hedge securities it owns by locking in a minimum price at which the Fund can sell. If security prices fall, the put option could be exercised to offset all or a portion of the Fund’s resulting losses. At the same time, because the maximum the Fund has at risk is the cost of the option, purchasing put options does not eliminate the potential for the Fund to profit from an increase in the value of the securities hedged. Realized and unrealized gains and losses on these contracts are included in the Statement of Operations. A risk in buying an option is that the Fund pays a premium whether or not the option is exercised. In addition, there can be no assurance that a liquid secondary market will exist for any option purchased. |
| M. | Collateral — To the extent the Fund has designated or segregated a security as collateral and that security is subsequently sold, it is the Fund’s practice to replace such collateral no later than the next business day. |
NOTE 2—Advisory Fees and Other Fees Paid to Affiliates
The Trust has entered into a master investment advisory agreement with Invesco Advisers, Inc. (the “Adviser” or “Invesco”). Under the terms of the investment advisory agreement, the Fund pays an advisory fee to the Adviser based on the annual rate of the Fund’s average daily net assets as follows:
| Average Daily Net Assets | Rate | |||
First $150 million | 0.50% | |||
Next $100 million | 0.45% | |||
Next $100 million | 0.40% | |||
Over $350 million | 0.35% | |||
Under the terms of a master sub-advisory agreement between the Adviser and each of Invesco Asset Management Deutschland GmbH, Invesco Asset Management Limited, Invesco Asset Management (Japan) Limited, Invesco Australia Limited, Invesco Hong Kong Limited, Invesco Senior Secured Management, Inc. and Invesco Canada Ltd. (collectively, the “Affiliated Sub-Advisers”) the Adviser, not the Fund, may pay 40% of the fees paid to the Adviser to any such Affiliated Sub-Adviser(s) that provide(s) discretionary investment management services to the Fund based on the percentage of assets allocated to such Sub-Adviser(s).
The Adviser has contractually agreed, through at least June 30, 2015, to waive advisory fees and/or reimburse expenses to the extent necessary to limit total annual fund operating expenses after fee waiver and/or expense reimbursement (excluding certain items discussed below) of Class A, Class B, Class C, Class R, Class Y, Class R5 and Class R6 shares to 1.50%, 2.25%, 2.25%, 1.75%, 1.25%, 1.25% and 1.25% of average daily net assets, respectively. In determining the Adviser’s obligation to waive advisory fees and/or reimburse expenses, the following expenses are not taken into account, and could cause total annual fund operating expenses after fee waiver and/or expense reimbursement to exceed the numbers reflected above: (1) interest; (2) taxes; (3) dividend expense on short sales; (4) extraordinary or non-routine items, including litigation expenses; and (5) expenses that the Fund has incurred but did not actually pay because of an expense offset arrangement. Unless Invesco continues the fee waiver agreement, it will terminate on June 30, 2015. The fee waiver agreement cannot be terminated during its term. The Adviser did not waive fees and/or reimburse expenses during the period under this expense limitation.
27 Invesco Equity and Income Fund
Further, the Adviser has contractually agreed, through at least June 30, 2016, to waive the advisory fee payable by the Fund in an amount equal to 100% of the net advisory fees the Adviser receives from the affiliated money market funds on investments by the Fund of uninvested cash in such affiliated money market funds.
For the year ended August 31, 2014, the Adviser waived advisory fees of $1,157,230.
The Trust has entered into a master administrative services agreement with Invesco pursuant to which the Fund has agreed to pay Invesco for certain administrative costs incurred in providing accounting services to the Fund. For the year ended August 31, 2014, expenses incurred under the agreement are shown in the Statement of Operations as Administrative services fees.
The Trust has entered into a transfer agency and service agreement with Invesco Investment Services, Inc. (“IIS”) pursuant to which the Fund has agreed to pay IIS a fee for providing transfer agency and shareholder services to the Fund and reimburse IIS for certain expenses incurred by IIS in the course of providing such services. IIS may make payments to intermediaries that provide omnibus account services, sub-accounting services and/or networking services. All fees payable by IIS to intermediaries that provide omnibus account services or sub-accounting are charged back to the Fund, subject to certain limitations approved by the Trust’s Board of Trustees. For the year ended August 31, 2014, expenses incurred under the agreement are shown in the Statement of Operations as Transfer agent fees.
Shares of the Fund are distributed by Invesco Distributors, Inc. (“IDI”). The Fund has adopted a distribution plan pursuant to Rule 12b-1 under the 1940 Act, and a service plan (collectively, the “Plans”) for Class A shares, Class B shares, Class C shares and Class R shares to compensate IDI for the sale, distribution, shareholder servicing and maintenance of shareholder accounts for these shares. Under the Plans, the Fund will incur annual fees of up to 0.25% of Class A average daily net assets, up to 1.00% each of Class B and Class C average daily net assets and up to 0.50% of Class R average daily net assets.
With respect to Class B and Class C shares, the Fund is authorized to reimburse in future years any distribution related expenses that exceed the maximum annual reimbursement rate for such class, so long as such reimbursement does not cause the Fund to exceed the Class B and Class C maximum annual reimbursement rate, respectively. With respect to Class A shares, distribution related expenses that exceed the maximum annual reimbursement rate for such class are not carried forward to future years and the Fund will not reimburse IDI for any such expenses.
For the year ended August 31, 2014, expenses incurred under these agreements are shown in the Statement of Operations as Distribution fees.
Front-end sales commissions and CDSC (collectively, the “sales charges”) are not recorded as expenses of the Fund. Front-end sales commissions are deducted from proceeds from the sales of Fund shares prior to investment in Class A shares of the Fund. CDSC are deducted from redemption proceeds prior to remittance to the shareholder. During the year ended August 31, 2014, IDI advised the Fund that IDI retained $3,195,030 in front-end sales commissions from the sale of Class A shares and $23,219, $158,884 and $48,179 from Class A, Class B and Class C shares, respectively, for CDSC imposed on redemptions by shareholders.
For the year ended August 31, 2014, the Fund incurred $47,223 in brokerage commissions with Invesco Capital Markets, Inc., an affiliate of the Adviser and IDI, for portfolio transactions executed on behalf of the Fund.
Certain officers and trustees of the Trust are officers and directors of the Adviser, IIS and/or IDI.
NOTE 3—Additional Valuation Information
GAAP defines fair value as the price that would be received to sell an asset or paid to transfer a liability in an orderly transaction between market participants at the measurement date, under current market conditions. GAAP establishes a hierarchy that prioritizes the inputs to valuation methods, giving the highest priority to readily available unadjusted quoted prices in an active market for identical assets (Level 1) and the lowest priority to significant unobservable inputs (Level 3), generally when market prices are not readily available or are unreliable. Based on the valuation inputs, the securities or other investments are tiered into one of three levels. Changes in valuation methods may result in transfers in or out of an investment’s assigned level:
| Level 1 — | Prices are determined using quoted prices in an active market for identical assets. |
| Level 2 — | Prices are determined using other significant observable inputs. Observable inputs are inputs that other market participants may use in pricing a security. These may include quoted prices for similar securities, interest rates, prepayment speeds, credit risk, yield curves, loss severities, default rates, discount rates, volatilities and others. |
| Level 3 — | Prices are determined using significant unobservable inputs. In situations where quoted prices or observable inputs are unavailable (for example, when there is little or no market activity for an investment at the end of the period), unobservable inputs may be used. Unobservable inputs reflect the Fund’s own assumptions about the factors market participants would use in determining fair value of the securities or instruments and would be based on the best available information. |
28 Invesco Equity and Income Fund
The following is a summary of the tiered valuation input levels, as of August 31, 2014. The level assigned to the securities valuations may not be an indication of the risk or liquidity associated with investing in those securities. Because of the inherent uncertainties of valuation, the values reflected in the financial statements may materially differ from the value received upon actual sale of those investments.
| Level 1 | Level 2 | Level 3 | Total | |||||||||||||
Equity Securities | $ | 9,704,340,441 | $ | 298,497,451 | $ | — | $ | 10,002,837,892 | ||||||||
U.S. Treasury Securities | — | 709,420,340 | — | 709,420,340 | ||||||||||||
Corporate Debt Securities | — | 2,855,924,082 | — | 2,855,924,082 | ||||||||||||
U.S. Government Sponsored Agency Securities | — | 98,171,878 | — | 98,171,878 | ||||||||||||
Municipal Obligations | — | 9,524,907 | — | 9,524,907 | ||||||||||||
Foreign Sovereign Debt Securities | — | 20,302,605 | — | 20,302,605 | ||||||||||||
Options Purchased | 82,540 | — | — | 82,540 | ||||||||||||
| 9,704,422,981 | 3,991,841,263 | — | 13,696,264,244 | |||||||||||||
Forward Foreign Currency Contracts* | — | 307,499 | — | 307,499 | ||||||||||||
Futures Contracts* | (29,487 | ) | — | — | (29,487 | ) | ||||||||||
Total Investments | $ | 9,704,393,494 | $ | 3,992,148,762 | $ | — | $ | 13,696,542,256 | ||||||||
| * | Unrealized appreciation (depreciation). |
NOTE 4—Derivative Investments
Value of Derivative Investments at Period-End
The table below summarizes the value of the Fund’s derivative investments, detailed by primary risk exposure, held as of August 31, 2014:
| Value | ||||||||
| Risk Exposure/Derivative Type | Assets | Liabilities | ||||||
Currency risk: | ||||||||
Forward foreign currency contracts(a) | $ | 1,573,058 | $ | (1,265,559 | ) | |||
Equity risk: | ||||||||
Options purchased(b) | 82,540 | — | ||||||
Interest rate risk: | ||||||||
Futures contracts(c) | 69,877 | (99,364 | ) | |||||
Total | $ | 1,725,475 | $ | (1,364,923 | ) | |||
| (a) | Values are disclosed on the Statement of Assets and Liabilities under the caption Forward foreign currency contracts outstanding. |
| (b) | Options purchased at value as reported in the Schedule of Investments. |
| (c) | Includes cumulative appreciation (depreciation) of futures contracts. Only current day’s variation margin receivable (payable) is reported within the Statement of Assets and Liabilities. |
Effect of Derivative Investments for the year ended August 31, 2014
The table below summarizes the gains (losses) on derivative investments, detailed by primary risk exposure, recognized in earnings during the period:
| Location of Gain (Loss) on Statement of Operations(a) | ||||||||
| Futures Contracts | Forward Foreign Currency Contracts | |||||||
Realized Gain (Loss): | ||||||||
Currency risk | $ | — | $ | 3,416,858 | ||||
Interest rate risk | (8,202,015 | ) | — | |||||
Change in Unrealized Appreciation (Depreciation): | ||||||||
Currency risk | — | (1,303,078 | ) | |||||
Interest rate risk | 102,570 | — | ||||||
Total | $ | (8,099,445 | ) | $ | 2,113,780 | |||
| (a) | Options purchased are included in the net change in unrealized appreciation (depreciation) on investment securities. |
The table below summarizes the twelve month average notional value of futures contracts and forward foreign currency contracts and the two month average notional value of options purchased outstanding during the period.
| Futures Contracts | Forward Foreign Currency Contracts | Options Purchased | ||||||||||
Average notional value | $ | 211,094,867 | $ | 631,289,896 | $ | 18,158,800 | ||||||
29 Invesco Equity and Income Fund
| Open Forward Foreign Currency Contracts at Period-End | ||||||||||||||||||||||||||
Settlement
| Counterparty | Contract to | Notional Value
| Unrealized Appreciation (Depreciation)
| ||||||||||||||||||||||
| Deliver | Receive | |||||||||||||||||||||||||
09/30/14 | Bank of New York Mellon (The) | CAD | 74,555,995 | USD | 68,007,858 | $ | 68,522,380 | $ | (514,522 | ) | ||||||||||||||||
09/30/14 | State Street Bank and Trust Co. | CAD | 74,625,396 | USD | 68,068,991 | 68,586,165 | (517,174 | ) | ||||||||||||||||||
09/30/14 | Bank of New York Mellon (The) | CHF | 40,764,843 | USD | 44,533,489 | 44,416,456 | 117,033 | |||||||||||||||||||
09/30/14 | State Street Bank and Trust Co. | CHF | 40,814,250 | USD | 44,588,195 | 44,470,289 | 117,906 | |||||||||||||||||||
09/30/14 | Bank of New York Mellon (The) | EUR | 93,649,779 | USD | 123,644,867 | 123,073,479 | 571,388 | |||||||||||||||||||
09/30/14 | State Street Bank and Trust Co. | EUR | 93,722,055 | USD | 123,731,857 | 123,168,463 | 563,394 | |||||||||||||||||||
09/30/14 | Bank of New York Mellon (The) | GBP | 64,291,540 | USD | 106,586,694 | 106,706,970 | (120,276 | ) | ||||||||||||||||||
09/30/14 | State Street Bank and Trust Co. | GBP | 64,325,960 | USD | 106,650,512 | 106,764,099 | (113,587 | ) | ||||||||||||||||||
09/30/14 | Bank of New York Mellon (The) | ILS | 143,501,355 | USD | 40,264,355 | 40,161,059 | 103,296 | |||||||||||||||||||
09/30/14 | State Street Bank and Trust Co. | ILS | 143,208,737 | USD | 40,179,207 | 40,079,166 | 100,041 | |||||||||||||||||||
Total Forward Foreign Currency Contracts — Currency Risk | $ | 307,499 | ||||||||||||||||||||||||
Currency Abbreviations:
| CAD | – Canadian Dollar | |
| CHF | – Swiss Franc | |
| EUR | – Euro |
| GBP | – British Pound Sterling | |
| ILS | – Israeli Shekel |
| Open Futures Contracts at Period-End | ||||||||||||||||||||
| Futures Contracts | Type of Contract | Number of Contracts | Expiration Month | Notional Value | Unrealized Appreciation (Depreciation) | |||||||||||||||
U.S. Treasury 5 Year Notes | Short | 696 | December-2014 | $ | (82,709,813 | ) | $ | (99,364 | ) | |||||||||||
U.S. Treasury 10 Year Notes | Short | 1,025 | December-2014 | (125,925,781 | ) | 69,877 | ||||||||||||||
Total Futures Contracts — Interest Rate Risk | $ | (29,487 | ) | |||||||||||||||||
Offsetting Assets and Liabilities
Accounting Standards Update (“ASU”) No. 2011-11, Disclosures about Offsetting Assets and Liabilities, which was subsequently clarified in Financial Accounting Standards Board ASU 2013-01 “Clarifying the Scope of Disclosures about Offsetting Assets and Liabilities” is intended to enhance disclosures about financial instruments and derivative instruments that are subject to offsetting arrangements on the Statement of Assets and Liabilities and to enable investors to better understand the effect of those arrangements on its financial position. In order for an arrangement to be eligible for netting, the Fund must have a basis to conclude that such netting arrangements are legally enforceable. The Fund enters into netting agreements and collateral agreements in an attempt to reduce the Fund’s Counterparty credit risk by providing for a single net settlement with a Counterparty of all financial transactions covered by the agreement in an event of default as defined under such agreement.
There were no derivative instruments subject to a netting agreement for which the Fund is not currently netting. The following tables present derivative instruments that are either subject to an enforceable netting agreement or offset by collateral arrangements as of August 31, 2014.
| Assets: | ||||||||||||||||||||||||
| Gross amounts presented in Statement of Assets & Liabilities(a) | Gross amounts offset in Statement of Assets & Liabilities | Net amounts of assets presented in the Statement of Assets & Liabilities | Collateral Received | |||||||||||||||||||||
| Counterparty | Financial Instruments | Cash | Net Amount | |||||||||||||||||||||
Bank of New York Mellon (The) | $ | 791,717 | $ | (634,798 | ) | $ | 156,919 | $ | — | $ | — | $ | 156,919 | |||||||||||
State Street Bank and Trust Co. | 781,341 | (630,761 | ) | 150,580 | — | — | 150,580 | |||||||||||||||||
Goldman Sachs & Co. | 69,877 | (69,877 | ) | — | — | — | — | |||||||||||||||||
Total | $ | 1,642,935 | $ | (1,335,436 | ) | $ | 307,499 | $ | — | $ | — | $ | 307,499 | |||||||||||
| Liabilities: | ||||||||||||||||||||||||
| Gross amounts presented in Statement of Assets & Liabilities(a) | Gross amounts offset in Statement of Assets & Liabilities | Net amounts of liabilities presented in the Statement of Assets & Liabilities | Collateral Pledged | |||||||||||||||||||||
| Counterparty | Financial Instruments | Cash | Net Amount | |||||||||||||||||||||
Bank of New York Mellon (The) | $ | 634,798 | $ | (634,798 | ) | $ | — | $ | — | $ | — | $ | — | |||||||||||
State Street Bank and Trust Co. | 630,761 | (630,761 | ) | — | — | — | — | |||||||||||||||||
Goldman Sachs & Co. | 99,364 | (69,877 | ) | 29,487 | (29,487 | ) | — | — | ||||||||||||||||
Total | $ | 1,364,923 | $ | (1,335,436 | ) | $ | 29,487 | $ | (29,487 | ) | $ | — | $ | — | ||||||||||
| (a) | Includes cumulative appreciation (depreciation) of futures contracts. |
30 Invesco Equity and Income Fund
NOTE 5—Security Transactions with Affiliated Funds
The Fund is permitted to purchase or sell securities from or to certain other Invesco Funds under specified conditions outlined in procedures adopted by the Board of Trustees of the Trust. The procedures have been designed to ensure that any purchase or sale of securities by the Fund from or to another fund or portfolio that is or could be considered an affiliate by virtue of having a common investment adviser (or affiliated investment advisers), common Trustees and/or common officers complies with Rule 17a-7 of the 1940 Act. Further, as defined under the procedures, each transaction is effected at the current market price. Pursuant to these procedures, for the year ended August 31, 2014, the Fund engaged in securities purchases of $13,837,414.
NOTE 6—Expense Offset Arrangement(s)
The expense offset arrangement is comprised of transfer agency credits which result from balances in demand deposit accounts used by the transfer agent for clearing shareholder transactions. For the year ended August 31, 2014, the Fund received credits from this arrangement, which resulted in the reduction of the Fund’s total expenses of $14,868.
NOTE 7—Trustees’ and Officers’ Fees and Benefits
Trustees’ and Officers’ Fees and Benefits include amounts accrued by the Fund to pay remuneration to certain Trustees and Officers of the Fund. Trustees have the option to defer compensation payable by the Fund, and Trustees’ and Officers’ Fees and Benefits also include amounts accrued by the Fund to fund such deferred compensation amounts. Those Trustees who defer compensation have the option to select various Invesco Funds in which their deferral accounts shall be deemed to be invested. Finally, certain current Trustees were eligible to participate in a retirement plan that provided for benefits to be paid upon retirement to Trustees over a period of time based on the number of years of service. The Fund may have certain former Trustees who also participate in a retirement plan and receive benefits under such plan. Trustees’ and Officers’ Fees and Benefits include amounts accrued by the Fund to fund such retirement benefits. Obligations under the deferred compensation and retirement plans represent unsecured claims against the general assets of the Fund.
NOTE 8—Cash Balances
The Fund is permitted to temporarily carry a negative or overdrawn balance in its account with State Street Bank and Trust Company, the custodian bank. Such balances, if any at period end, are shown in the Statement of Assets and Liabilities under the payable caption Amount due custodian. To compensate the custodian bank for such overdrafts, the overdrawn Fund may either (1) leave funds as a compensating balance in the account so the custodian bank can be compensated by earning the additional interest; or (2) compensate by paying the custodian bank at a rate agreed upon by the custodian bank and Invesco, not to exceed the contractually agreed upon rate.
NOTE 9—Distributions to Shareholders and Tax Components of Net Assets
Tax Character of Distributions to Shareholders Paid During the Years Ended August 31, 2014 and 2013:
| 2014 | 2013 | |||||||
Ordinary income | $ | 223,843,118 | $ | 224,595,074 | ||||
Long-term capital gain | 660,165,034 | — | ||||||
Total distributions | $ | 884,008,152 | $ | 224,595,074 | ||||
Tax Components of Net Assets at Period-End:
| 2014 | ||||
Undistributed ordinary income | $ | 242,440,100 | ||
Undistributed long-term gain | 862,708,178 | |||
Net unrealized appreciation — investments | 2,565,886,974 | |||
Net unrealized appreciation (depreciation) — other investments | (1,273 | ) | ||
Temporary book/tax differences | (6,641,168 | ) | ||
Capital loss carryforward | (5,551,168 | ) | ||
Shares of beneficial interest | 10,094,334,286 | |||
Total net assets | $ | 13,753,175,929 | ||
The difference between book-basis and tax-basis unrealized appreciation (depreciation) is due to differences in the timing of recognition of gains and losses on investments for tax and book purposes. The Fund’s net unrealized appreciation difference is attributable primarily to wash sales, book to tax accretion and amortization differences and contingent payment debt instruments.
The temporary book/tax differences are a result of timing differences between book and tax recognition of income and/or expenses. The Fund’s temporary book/tax differences are the result of the trustee deferral of compensation and retirement plan benefits.
Capital loss carryforward is calculated and reported as of a specific date. Results of transactions and other activity after that date may affect the amount of capital loss carryforward actually available for the Fund to utilize. Capital losses generated in years beginning after December 22, 2010 can be carried forward for an unlimited period, whereas previous losses expire in 8 tax years. Capital losses with an expiration period may not be used to offset capital gains until all net capital losses without an expiration date have been utilized. Capital loss carryforwards with no expiration date will retain their character as either short-term or long-term capital losses instead of as short-term capital losses as under prior law. The ability to utilize capital loss carryforward in the future may be limited under the Internal Revenue Code and related regulations based on the results of future transactions.
31 Invesco Equity and Income Fund
The Fund utilized $45,448,741 of capital loss carryforward in the current period to offset net realized capital gain for federal income tax purposes. The Fund has a capital loss carryforward as of August 31, 2014, which expires as follows:
| Capital Loss Carryforward* | ||||||||||||
| Expiration | Short-Term | Long-Term | Total | |||||||||
August 31, 2016 | $ | 251,980 | $ | — | $ | 251,980 | ||||||
August 31, 2017 | 5,299,188 | — | 5,299,188 | |||||||||
| $ | 5,551,168 | $ | $ | 5,551,168 | ||||||||
| * | Capital loss carryforward as of the date listed above is reduced for limitations, if any, to the extent required by the Internal Revenue Code and may be further limited depending upon a variety of factors, including the realization of net unrealized gains or losses as of the date of any reorganization. |
NOTE 10—Investment Securities
The aggregate amount of investment securities (other than short-term securities, U.S. Treasury obligations and money market funds, if any) purchased and sold by the Fund during the year ended August 31, 2014 was $4,295,686,882 and $4,648,476,947, respectively. During the same period, purchases and sales of U.S. Treasury obligations were $2,805,758,331 and $2,851,400,924, respectively. Cost of investments on a tax basis includes the adjustments for financial reporting purposes as of the most recently completed federal income tax reporting period-end.
| Unrealized Appreciation (Depreciation) of Investment Securities on a Tax Basis | ||||
Aggregate unrealized appreciation of investment securities | $ | 2,687,030,769 | ||
Aggregate unrealized (depreciation) of investment securities | (121,143,795 | ) | ||
Net unrealized appreciation of investment securities | $ | 2,565,886,974 | ||
Cost of investments for tax purposes is $11,130,377,270.
NOTE 11—Reclassification of Permanent Differences
Primarily as a result of differing book/tax treatment of bond premiums and contingent payment debt instruments, on August 31, 2014, undistributed net investment income was increased by $58,104,464, undistributed net realized gain was decreased by $56,387,105 and shares of beneficial interest was decreased by $1,717,359. This reclassification had no effect on the net assets of the Fund.
32 Invesco Equity and Income Fund
NOTE 12—Share Information
| Summary of Share Activity | ||||||||||||||||
| Years ended August 31, | ||||||||||||||||
| 2014(a) | 2013 | |||||||||||||||
| Shares | Amount | Shares | Amount | |||||||||||||
Sold: | ||||||||||||||||
Class A | 123,294,433 | $ | 1,338,786,753 | 87,700,842 | $ | 873,364,044 | ||||||||||
Class B | 681,308 | 7,216,215 | 823,802 | 8,051,441 | ||||||||||||
Class C | 27,559,284 | 294,554,564 | 12,109,400 | 121,759,085 | ||||||||||||
Class R | 6,158,932 | 67,354,694 | 4,574,200 | 45,460,476 | ||||||||||||
Class Y | 25,562,881 | 279,392,264 | 16,892,433 | 170,702,836 | ||||||||||||
Class R5 | 21,087,163 | 228,477,944 | 6,739,690 | 64,982,296 | ||||||||||||
Class R6(b) | 11,239,560 | 122,857,003 | 10,147,759 | 98,261,438 | ||||||||||||
Issued as reinvestment of dividends: | ||||||||||||||||
Class A | 59,884,857 | 626,269,537 | 17,150,441 | 163,264,966 | ||||||||||||
Class B | 3,366,931 | 34,386,317 | 995,825 | 9,235,728 | ||||||||||||
Class C | 8,120,425 | 83,387,271 | 1,579,331 | 14,763,683 | ||||||||||||
Class R | 1,367,065 | 14,353,524 | 352,640 | 3,369,248 | ||||||||||||
Class Y | 3,766,637 | 39,437,002 | 997,253 | 9,485,943 | ||||||||||||
Class R5 | 2,125,920 | 22,271,818 | 540,105 | 5,162,156 | ||||||||||||
Class R6 | 533,196 | 5,601,728 | 138,720 | 1,344,016 | ||||||||||||
Automatic conversion of Class B shares to Class A shares: | ||||||||||||||||
Class A | 12,844,760 | 139,827,651 | 17,617,079 | 173,428,532 | ||||||||||||
Class B | (13,105,664 | ) | (139,827,651 | ) | (17,961,899 | ) | (173,428,532 | ) | ||||||||
Reacquired: | ||||||||||||||||
Class A | (144,137,291 | ) | (1,569,278,061 | ) | (154,007,991 | ) | (1,501,296,519 | ) | ||||||||
Class B | (7,178,837 | ) | (76,518,052 | ) | (11,491,060 | ) | (109,887,869 | ) | ||||||||
Class C | (16,168,255 | ) | (173,509,449 | ) | (18,523,803 | ) | (177,343,449 | ) | ||||||||
Class R | (5,756,408 | ) | (63,009,587 | ) | (5,914,742 | ) | (57,520,131 | ) | ||||||||
Class Y | (12,079,237 | ) | (131,156,310 | ) | (17,512,155 | ) | (170,846,282 | ) | ||||||||
Class R5 | (11,162,020 | ) | (121,650,155 | ) | (10,465,023 | ) | (99,347,205 | ) | ||||||||
Class R6 | (2,336,610 | ) | (25,471,824 | ) | (6,654,596 | ) | (70,260,878 | ) | ||||||||
Net increase (decrease) in share activity | 95,669,030 | $ | 1,003,753,196 | (64,171,749 | ) | $ | (597,294,977 | ) | ||||||||
| (a) | There are entities that are record owners of more than 5% of the outstanding shares of the Fund and in the aggregate own 33% of the outstanding shares of the Fund. IDI has an agreement with these entities to sell Fund shares. The Fund, Invesco and/or Invesco affiliates may make payments to these entities, which are considered to be related to the Fund, for providing services to the Fund, Invesco and/or Invesco affiliates including but not limited to services such as securities brokerage, distribution, third party record keeping and account servicing. The Fund has no knowledge as to whether all or any portion of the shares owned of record by these entities are also owned beneficially. |
| (b) | Commencement date of September 24, 2012. |
33 Invesco Equity and Income Fund
NOTE 13—Financial Highlights
The following schedule presents financial highlights for a share of the Fund outstanding throughout the periods indicated.
| Net asset value, beginning of period | Net investment income(a) | Net gains (losses) on securities (both realized and unrealized) | Total from investment operations | Dividends from net investment income | Distributions from net realized gains | Total distributions | Net asset value, end of period | Total return | Net assets, end of period (000’s omitted) | Ratio of expenses to average net assets with fee waivers and/or expenses absorbed | Ratio of expenses to average net assets without fee waivers and/or expenses absorbed | Ratio of net investment income to average net assets | Portfolio turnover(b) | |||||||||||||||||||||||||||||||||||||||||||
Class A |
| |||||||||||||||||||||||||||||||||||||||||||||||||||||||
Year ended 08/31/14 | $ | 10.43 | $ | 0.22 | (c) | $ | 1.56 | $ | 1.78 | $ | (0.20 | ) | $ | (0.59 | ) | $ | (0.79 | ) | $ | 11.42 | 17.86 | %(d) | $ | 10,181,796 | 0.79 | %(e) | 0.80 | %(e) | 1.99 | %(c)(e) | 60 | % | ||||||||||||||||||||||||
Year ended 08/31/13 | 9.05 | 0.17 | 1.42 | 1.59 | (0.21 | ) | — | (0.21 | ) | 10.43 | 17.80 | (d) | 8,752,700 | 0.78 | 0.79 | 1.74 | 26 | |||||||||||||||||||||||||||||||||||||||
Year ended 08/31/12 | 8.19 | 0.17 | 0.85 | 1.02 | (0.16 | ) | — | (0.16 | ) | 9.05 | 12.67 | (d) | 7,878,694 | 0.80 | 0.81 | 2.05 | 21 | |||||||||||||||||||||||||||||||||||||||
Year ended 08/31/11 | 7.53 | 0.15 | 0.66 | 0.81 | (0.15 | ) | — | (0.15 | ) | 8.19 | 10.78 | (d) | 7,908,623 | 0.81 | 0.81 | 1.74 | 22 | |||||||||||||||||||||||||||||||||||||||
Eight months ended 08/31/10 | 7.79 | 0.10 | (0.28 | ) | (0.18 | ) | (0.08 | ) | — | (0.08 | ) | 7.53 | (2.40 | )(d) | 7,560,462 | 0.78 | (f) | 0.78 | (f) | 1.89 | (f) | 24 | ||||||||||||||||||||||||||||||||||
Year ended 12/31/09 | 6.45 | 0.15 | 1.34 | 1.49 | (0.15 | ) | — | (0.15 | ) | 7.79 | 23.51 | (g) | 8,395,716 | 0.82 | 0.82 | 2.15 | 78 | |||||||||||||||||||||||||||||||||||||||
Class B | ||||||||||||||||||||||||||||||||||||||||||||||||||||||||
Year ended 08/31/14 | 10.22 | 0.13 | (c) | 1.54 | 1.67 | (0.12 | ) | (0.59 | ) | (0.71 | ) | 11.18 | 17.01 | (d) | 442,318 | 1.54 | (e) | 1.55 | (e) | 1.24 | (c)(e) | 60 | ||||||||||||||||||||||||||||||||||
Year ended 08/31/13 | 8.87 | 0.09 | 1.39 | 1.48 | (0.13 | ) | — | (0.13 | ) | 10.22 | 16.90 | (d) | 570,146 | 1.53 | 1.54 | 0.99 | 26 | |||||||||||||||||||||||||||||||||||||||
Year ended 08/31/12 | 8.04 | 0.15 | 0.83 | 0.98 | (0.15 | ) | — | (0.15 | ) | 8.87 | 12.36 | (d) | 739,631 | 1.02 | 1.56 | 1.83 | 21 | |||||||||||||||||||||||||||||||||||||||
Year ended 08/31/11 | 7.39 | 0.14 | 0.65 | 0.79 | (0.14 | ) | — | (0.14 | ) | 8.04 | 10.69 | (d)(h) | 1,014,527 | 0.84 | (h) | 0.98 | (h) | 1.71 | (h) | 22 | ||||||||||||||||||||||||||||||||||||
Eight months ended 08/31/10 | 7.64 | 0.09 | (0.27 | ) | (0.18 | ) | (0.07 | ) | — | (0.07 | ) | 7.39 | (2.40 | )(d)(h) | 1,278,734 | 0.91 | (f)(h) | 0.91 | (f)(h) | 1.76 | (f)(h) | 24 | ||||||||||||||||||||||||||||||||||
Year ended 12/31/09 | 6.33 | 0.14 | 1.32 | 1.46 | (0.15 | ) | — | (0.15 | ) | 7.64 | 23.48 | (i)(j) | 1,594,135 | 0.82 | (j) | 0.82 | (j) | 2.16 | (j) | 78 | ||||||||||||||||||||||||||||||||||||
Class C | ||||||||||||||||||||||||||||||||||||||||||||||||||||||||
Year ended 08/31/14 | 10.27 | 0.13 | (c) | 1.55 | 1.68 | (0.12 | ) | (0.59 | ) | (0.71 | ) | 11.24 | 17.03 | (d) | 1,624,965 | 1.54 | (e) | 1.55 | (e) | 1.24 | (c)(e) | 60 | ||||||||||||||||||||||||||||||||||
Year ended 08/31/13 | 8.91 | 0.10 | 1.40 | 1.50 | (0.14 | ) | — | (0.14 | ) | 10.27 | 16.95 | (d) | 1,284,225 | 1.53 | 1.54 | 0.99 | 26 | |||||||||||||||||||||||||||||||||||||||
Year ended 08/31/12 | 8.07 | 0.11 | 0.83 | 0.94 | (0.10 | ) | — | (0.10 | ) | 8.91 | 11.77 | (d)(k) | 1,157,325 | 1.54 | (k) | 1.54 | (k) | 1.31 | (k) | 21 | ||||||||||||||||||||||||||||||||||||
Year ended 08/31/11 | 7.42 | 0.09 | 0.65 | 0.74 | (0.09 | ) | — | (0.09 | ) | 8.07 | 9.95 | (d)(k) | 1,216,936 | 1.54 | (k) | 1.54 | (k) | 1.01 | (k) | 22 | ||||||||||||||||||||||||||||||||||||
Eight months ended 08/31/10 | 7.68 | 0.06 | (0.27 | ) | (0.21 | ) | (0.05 | ) | — | (0.05 | ) | 7.42 | (2.81 | )(d)(k) | 1,211,089 | 1.52 | (f)(k) | 1.52 | (f)(k) | 1.15 | (f)(k) | 24 | ||||||||||||||||||||||||||||||||||
Year ended 12/31/09 | 6.36 | 0.09 | 1.33 | 1.42 | (0.10 | ) | — | (0.10 | ) | 7.68 | 22.63 | (j)(l) | 1,375,516 | 1.56 | (j) | 1.56 | (j) | 1.40 | (j) | 78 | ||||||||||||||||||||||||||||||||||||
Class R | ||||||||||||||||||||||||||||||||||||||||||||||||||||||||
Year ended 08/31/14 | 10.47 | 0.19 | (c) | 1.58 | 1.77 | (0.18 | ) | (0.59 | ) | (0.77 | ) | 11.47 | 17.60 | (d) | 232,455 | 1.04 | (e) | 1.05 | (e) | 1.74 | (c)(e) | 60 | ||||||||||||||||||||||||||||||||||
Year ended 08/31/13 | 9.08 | 0.15 | 1.43 | 1.58 | (0.19 | ) | — | (0.19 | ) | 10.47 | 17.57 | (d) | 193,610 | 1.03 | 1.04 | 1.49 | 26 | |||||||||||||||||||||||||||||||||||||||
Year ended 08/31/12 | 8.23 | 0.15 | 0.85 | 1.00 | (0.15 | ) | — | (0.15 | ) | 9.08 | 12.23 | (d) | 176,940 | 1.05 | 1.06 | 1.80 | 21 | |||||||||||||||||||||||||||||||||||||||
Year ended 08/31/11 | 7.57 | 0.13 | 0.66 | 0.79 | (0.13 | ) | — | (0.13 | ) | 8.23 | 10.45 | (d) | 182,135 | 1.06 | 1.06 | 1.49 | 22 | |||||||||||||||||||||||||||||||||||||||
Eight months ended 08/31/10 | 7.83 | 0.09 | (0.28 | ) | (0.19 | ) | (0.07 | ) | — | (0.07 | ) | 7.57 | (2.51 | )(d) | 172,143 | 1.03 | (f) | 1.03 | (f) | 1.64 | (f) | 24 | ||||||||||||||||||||||||||||||||||
Year ended 12/31/09 | 6.48 | 0.13 | 1.35 | 1.48 | (0.13 | ) | — | (0.13 | ) | 7.83 | 23.25 | (m) | 169,713 | 1.07 | 1.07 | 1.88 | 78 | |||||||||||||||||||||||||||||||||||||||
Class Y(n) | ||||||||||||||||||||||||||||||||||||||||||||||||||||||||
Year ended 08/31/14 | 10.43 | 0.24 | (c) | 1.58 | 1.82 | (0.23 | ) | (0.59 | ) | (0.82 | ) | 11.43 | 18.25 | (d) | 719,931 | 0.54 | (e) | 0.55 | (e) | 2.24 | (c)(e) | 60 | ||||||||||||||||||||||||||||||||||
Year ended 08/31/13 | 9.05 | 0.20 | 1.41 | 1.61 | (0.23 | ) | — | (0.23 | ) | 10.43 | 18.10 | (d) | 477,207 | 0.53 | 0.54 | 1.99 | 26 | |||||||||||||||||||||||||||||||||||||||
Year ended 08/31/12 | 8.20 | 0.20 | 0.84 | 1.04 | (0.19 | ) | — | (0.19 | ) | 9.05 | 12.83 | (d) | 410,600 | 0.55 | 0.56 | 2.30 | 21 | |||||||||||||||||||||||||||||||||||||||
Year ended 08/31/11 | 7.54 | 0.17 | 0.67 | 0.84 | (0.18 | ) | — | (0.18 | ) | 8.20 | 11.04 | (d) | 422,009 | 0.56 | 0.56 | 1.99 | 22 | |||||||||||||||||||||||||||||||||||||||
Eight months ended 08/31/10 | 7.79 | 0.11 | (0.28 | ) | (0.17 | ) | (0.08 | ) | — | (0.08 | ) | 7.54 | (2.15 | )(d) | 414,203 | 0.53 | (f) | 0.53 | (f) | 2.15 | (f) | 24 | ||||||||||||||||||||||||||||||||||
Year ended 12/31/09 | 6.45 | 0.16 | 1.35 | 1.51 | (0.17 | ) | — | (0.17 | ) | 7.79 | 23.82 | (o) | 530,010 | 0.57 | 0.57 | 2.34 | 78 | |||||||||||||||||||||||||||||||||||||||
Class R5 | ||||||||||||||||||||||||||||||||||||||||||||||||||||||||
Year ended 08/31/14 | 10.43 | 0.25 | (c) | 1.58 | 1.83 | (0.24 | ) | (0.59 | ) | (0.83 | ) | 11.43 | 18.33 | (d) | 402,366 | 0.48 | (e) | 0.49 | (e) | 2.30 | (c)(e) | 60 | ||||||||||||||||||||||||||||||||||
Year ended 08/31/13 | 9.05 | 0.20 | 1.42 | 1.62 | (0.24 | ) | — | (0.24 | ) | 10.43 | 18.17 | (d) | 241,540 | 0.47 | 0.48 | 2.05 | 26 | |||||||||||||||||||||||||||||||||||||||
Year ended 08/31/12 | 8.20 | 0.21 | 0.84 | 1.05 | (0.20 | ) | — | (0.20 | ) | 9.05 | 12.96 | (d) | 238,392 | 0.44 | 0.44 | 2.41 | 21 | |||||||||||||||||||||||||||||||||||||||
Year ended 08/31/11 | 7.54 | 0.19 | 0.65 | 0.84 | (0.18 | ) | — | (0.18 | ) | 8.20 | 11.16 | (d) | 156,096 | 0.39 | 0.39 | 2.16 | 22 | |||||||||||||||||||||||||||||||||||||||
Eight months ended 08/31/10(p) | 7.59 | 0.03 | (0.04 | ) | (0.01 | ) | (0.04 | ) | — | (0.04 | ) | 7.54 | (0.13 | )(d) | 63,598 | 0.45 | (f) | 0.45 | (f) | 1.79 | (f) | 24 | ||||||||||||||||||||||||||||||||||
Class R6 | ||||||||||||||||||||||||||||||||||||||||||||||||||||||||
Year ended 08/31/14 | 10.43 | 0.26 | (c) | 1.58 | 1.84 | (0.25 | ) | (0.59 | ) | (0.84 | ) | 11.43 | 18.44 | (d) | 149,346 | 0.39 | (e) | 0.40 | (e) | 2.39 | (c)(e) | 60 | ||||||||||||||||||||||||||||||||||
Year ended 08/31/13(p) | 9.27 | 0.21 | 1.14 | 1.35 | (0.19 | ) | — | (0.19 | ) | 10.43 | 14.81 | (d) | 37,884 | 0.37 | (f) | 0.38 | (f) | 2.15 | (f) | 26 | ||||||||||||||||||||||||||||||||||||
| (a) | Calculated using average shares outstanding. |
| (b) | Portfolio turnover is calculated at the fund level and is not annualized for periods less than one year, if applicable. For the year ended August 31, 2011, the portfolio turnover calculation excludes the value of securities purchased of $602,192,170 and sold of $70,835,642 in the effort to realign the Fund’s portfolio holdings after the reorganization of Invesco Balanced Fund and Invesco Basic Balanced into the Fund. |
| (c) | Net investment income per share and the ratio of net investment income to average net assets includes significant dividends received during the period. Net investment income per share and the ratio of net investment income to average net assets excluding the significant dividends are $0.16 and 1.47%, $0.07 and 0.72%, $0.07 and 0.72%, $0.13 and 1.22%, $0.18 and 1.72%, $0.19 and 1.78% and $0.20 and 1.87% for Class A, Class B, Class C, Class R, Class Y, Class R5 and Class R6 shares, respectively. |
| (d) | Includes adjustments in accordance with accounting principles generally accepted in the United States of America and as such, the net asset value for financial reporting purposes and the returns based upon those net asset values may differ from the net asset value and returns for shareholder transactions. Does not include sales charges and is not annualized for periods less than one year, if applicable. |
| (e) | Ratios are based on average daily net assets (000’s omitted) of $9,586,832, $516,393, $1,479,811, $214,261, $604,351, $343,327 and $93,002 for Class A, Class B, Class C, Class R, Class Y, Class R5 and Class R6 shares, respectively. |
| (f) | Annualized. |
| (g) | Assumes reinvestment of all distributions for the period and does not include payment of the maximum sales charge of 5.75% or contingent deferred sales charge (CDSC). On purchases of $1 million or more, a CDSC of 1% may be imposed on certain redemptions made within eighteen months of purchase. If the sales charges were included, total returns would be lower. These returns include combined Rule 12b-1 fees and service fees of up to 0.25% and do not reflect the deduction of taxes that a shareholder would pay on Fund distributions or the redemption of Fund shares. |
| (h) | The total return, ratio of expenses to average net assets and ratio of net investment income to average net assets reflect actual 12b-1 fees of 0.28% and 0.38% for the year ended August 31, 2011 and eight months ended August 31, 2010, respectively. |
| (i) | Assumes reinvestment of all distributions for the period and does not include payment of the maximum CDSC of 5%, charged on certain redemptions made within one year of purchase and declining to 0% after the fifth year. If the sales charge was included, total returns would be lower. These returns include combined Rule 12b-1 fees and service fees of up to 1% and do not reflect the deduction of taxes that a shareholder would pay on Fund distributions or the redemption of Fund shares. |
| (j) | The total return, ratio of expenses to average net assets and ratio of net investment income to average net assets reflect actual 12b-1 fees of less than 1%. |
| (k) | The total return, ratio of expenses to average net assets and ratio of net investment income to average net assets reflect actual 12b-1 fees of 0.99%, 0.97% and 0.99% for the years ended August 31, 2012, August 31, 2011 and the eight months ended August 31, 2010, respectively. |
34 Invesco Equity and Income Fund
| (l) | Assumes reinvestment of all distributions for the period and does not include payment of the maximum CDSC of 1%, charged on certain redemptions made within one year of purchase. If the sales charge was included, total returns would be lower. These returns include combined Rule 12b-1 fees and service fees of up to 1% and do not reflect the deduction of taxes that a shareholder would pay on Fund distributions or the redemption of Fund shares. |
| (m) | Assumes reinvestment of all distributions for the period. These returns include combined Rule 12b-1 fees and service fees of up to 0.50% and do not reflect the deduction of taxes that a shareholder would pay on Fund distributions or the redemption on Fund shares. |
| (n) | On June 1, 2010, Class I shares of Van Kampen Equity and Income Fund were reorganized into Class Y shares. |
| (o) | Assumes reinvestment of all distributions for the period. These returns do not reflect the deduction of taxes that a shareholder would pay on Fund distributions or the redemption on Fund shares. |
| (p) | Commencement date of June 1, 2010 and September 24, 2012 for Class R5 and Class R6 shares, respectively. |
35 Invesco Equity and Income Fund
Report of Independent Registered Public Accounting Firm
To the Board of Trustees of AIM Counselor Series Trust (Invesco Counselor Series Trust)
and Shareholders of Invesco Equity and Income Fund:
In our opinion, the accompanying statement of assets and liabilities, including the schedule of investments, and the related statements of operations and of changes in net assets and the financial highlights present fairly, in all material respects, the financial position of Invesco Equity and Income Fund (one of the funds constituting AIM Counselor Series Trust (Invesco Counselor Series Trust), hereafter referred to as the “Fund”) at August 31, 2014, the results of its operations for the year then ended, the changes in its net assets for each of the two years in the period then ended and the financial highlights for each of the four years in the period then ended and the eight month period ended August 31, 2010, in conformity with accounting principles generally accepted in the United States of America. These financial statements and financial highlights (hereafter referred to as “financial statements”) are the responsibility of the Fund’s management. Our responsibility is to express an opinion on these financial statements based on our audits. We conducted our audits of these financial statements in accordance with the standards of the Public Company Accounting Oversight Board (United States). Those standards require that we plan and perform the audit to obtain reasonable assurance about whether the financial statements are free of material misstatement. An audit includes examining, on a test basis, evidence supporting the amounts and disclosures in the financial statements, assessing the accounting principles used and significant estimates made by management, and evaluating the overall financial statement presentation. We believe that our audits, which included confirmation of securities at August 31, 2014 by correspondence with the custodian and brokers, provide a reasonable basis for our opinion. The financial highlights of the Fund for the year ended December 31, 2009 were audited by another independent registered public accounting firm whose report dated February 19, 2010 expressed an unqualified opinion on such financial statement.
PRICEWATERHOUSECOOPERS LLP
October 27, 2014
Houston, Texas
36 Invesco Equity and Income Fund
Calculating your ongoing Fund expenses
Example
As a shareholder of the Fund, you incur two types of costs: (1) transaction costs, which may include sales charges (loads) on purchase payments or contingent deferred sales charges on redemptions, if any; and (2) ongoing costs, including management fees, distribution and/or service (12b-1) fees, and other Fund expenses. This example is intended to help you understand your ongoing costs (in dollars) of investing in the Fund and to compare these costs with ongoing costs of investing in other mutual funds. The example is based on an investment of $1,000 invested at the beginning of the period and held for the entire period March 1, 2014 through August 31, 2014.
Actual expenses
The table below provides information about actual account values and actual expenses. You may use the information in this table, together with the amount you invested, to estimate the expenses that you paid over the period. Simply divide your account value by $1,000 (for example, an $8,600 account value divided by $1,000 = 8.6), then multiply the result by the number in the table under the heading entitled “Actual Expenses Paid During Period” to estimate the expenses you paid on your account during this period.
Hypothetical example for comparison purposes
The table below also provides information about hypothetical account values and hypothetical expenses based on the Fund’s actual expense ratio and an assumed rate of return of 5% per year before expenses, which is not the Fund’s actual return.
The hypothetical account values and expenses may not be used to estimate the actual ending account balance or expenses you paid for the period. You may use this information to compare the ongoing costs of investing in the Fund and other funds. To do so, compare this 5% hypothetical example with the 5% hypothetical examples that appear in the shareholder reports of the other funds.
Please note that the expenses shown in the table are meant to highlight your ongoing costs only and do not reflect any transaction costs, such as sales charges (loads) on purchase payments or contingent deferred sales charges on redemptions, if any. Therefore, the hypothetical information is useful in comparing ongoing costs only, and will not help you determine the relative total costs of owning different funds. In addition, if these transaction costs were included, your costs would have been higher.
| Class | Beginning Account Value (03/01/14) | ACTUAL | HYPOTHETICAL (5% annual return before | Annualized Expense Ratio | ||||||||||||||||||||
| Ending Account Value (08/31/14)1 | Expenses Paid During Period2 | Ending Account Value (08/31/14) | Expenses Paid During Period2 | |||||||||||||||||||||
| A | $ | 1,000.00 | $ | 1,064.10 | $ | 4.27 | $ | 1,021.07 | $ | 4.18 | 0.82 | % | ||||||||||||
| B | 1,000.00 | 1,059.40 | 8.15 | 0,017.29 | 7.98 | 1.57 | ||||||||||||||||||
| C | 1,000.00 | 1,060.10 | 8.15 | 1,017.29 | 7.98 | 1.57 | ||||||||||||||||||
| R | 1,000.00 | 1,062.50 | 5.56 | 1,019.81 | 5.45 | 1.07 | ||||||||||||||||||
| Y | 1,000.00 | 1,065.30 | 2.97 | 1,022.33 | 2.91 | 0.57 | ||||||||||||||||||
| R5 | 1,000.00 | 1,065.80 | 2.55 | 1,022.74 | 2.50 | 0.49 | ||||||||||||||||||
| R6 | 1,000.00 | 1,066.20 | 2.08 | 1,023.19 | 2.04 | 0.40 | ||||||||||||||||||
| 1 | The actual ending account value is based on the actual total return of the Fund for the period March 1, 2014 through August 31, 2014, after actual expenses and will differ from the hypothetical ending account value which is based on the Fund’s expense ratio and a hypothetical annual return of 5% before expenses. |
| 2 | Expenses are equal to the Fund’s annualized expense ratio as indicated above multiplied by the average account value over the period, multiplied by 184/365 to reflect the most recent fiscal half year. |
37 Invesco Equity and Income Fund
Approval of Investment Advisory and Sub-Advisory Contracts
The Board of Trustees (the Board) of AIM Counselor Series Trust (Invesco Counselor Series Trust) is required under the Investment Company Act of 1940, as amended, to approve annually the renewal of Invesco Equity and Income Fund’s (the Fund) investment advisory agreements. During contract renewal meetings held on June 16-17, 2014, the Board as a whole, and the disinterested or “independent” Trustees, who comprise over 75% of the Board, voting separately, approved the continuance for the Fund of the Master Investment Advisory Agreement with Invesco Advisers, Inc. (Invesco Advisers) and the Master Intergroup Sub-Advisory Contract for Mutual Funds with Invesco Asset Management Deutschland GmbH, Invesco Asset Management Limited, Invesco Asset Management (Japan) Limited, Invesco Australia Limited, Invesco Hong Kong Limited, Invesco Senior Secured Management, Inc. and Invesco Canada Ltd. (collectively, the Affiliated Sub-Advisers and the sub-advisory contracts) for another year, effective July 1, 2014.
In evaluating the fairness and reasonableness of compensation under the Fund’s investment advisory agreement and sub-advisory contracts, the Board considered, among other things, the factors discussed below. The Board determined that continuation of the Fund’s investment advisory agreement and the sub-advisory contracts are in the best interest of the Fund and its shareholders and that the compensation payable to Invesco Advisers and the Affiliated Sub-Advisers under the agreements is fair and reasonable.
The Board’s Fund Evaluation Process
The Board’s Investments Committee has established three Sub-Committees, each of which is primarily responsible for overseeing the management of a number of the funds advised by Invesco Advisers (the Invesco Funds). The Sub-Committees meet throughout the year to review the performance of their assigned Invesco Funds, including reviewing materials prepared under the direction of the independent Senior Officer, an officer of the Invesco Funds who reports directly to the independent Trustees. Over the course of each year, the Sub-Committees meet with portfolio managers for their assigned Invesco Funds and other members of management to review the performance, investment objective(s), policies, strategies, limitations and investment risks of these funds. The Sub-Committees meet regularly and at designated contract renewal meetings each year to conduct a review of the performance, fees, expenses and other matters related to their assigned Invesco Funds. Each Sub-Committee recommends to the Investments Committee, which in turn recommends to the full Board, whether and on what terms to approve the continuance of each Invesco Fund’s
investment advisory agreement and sub-advisory contracts for another year.
During the contract renewal process, the Trustees receive comparative performance and fee data regarding the Invesco Funds prepared by Invesco Advisers and Lipper Inc. (Lipper), an independent provider of investment company data. The Trustees also receive an independent written evaluation from the Senior Officer. The Senior Officer’s evaluation is prepared as part of his responsibility to manage the process by which the Invesco Funds’ proposed management fees are negotiated during the annual contract renewal process to ensure they are negotiated in a manner that is at arms’ length and reasonable. In addition to meetings with Invesco Advisers and fund counsel, the independent Trustees also discuss the continuance of the investment advisory agreement and sub-advisory contracts in separate sessions with the Senior Officer and with independent legal counsel.
The Trustees recognized that the advisory fee rates for the Invesco Funds are, in many cases, the result of years of review and negotiation. The Trustees’ deliberations and conclusions in a particular year may be based in part on their deliberations and conclusions regarding these same arrangements throughout the year and in prior years. The Trustees’ review and conclusions are based on the comprehensive consideration of all information presented to them and are not the result of any single determinative factor. Moreover, one Trustee may have weighed a particular piece of information or factor differently than another Trustee.
The discussion below serves as the Senior Officer’s independent written evaluation with respect to the Fund’s investment advisory agreement as well as a discussion of the material factors and related conclusions that formed the basis for the Board’s approval of the Fund’s investment advisory agreement and sub-advisory contracts. Unless otherwise stated, this information is current as of June 17, 2014, and may not reflect consideration of factors that became known to the Board after that date.
Factors and Conclusions and Summary of Independent Written Fee Evaluation
| A. | Nature, Extent and Quality of Services Provided by Invesco Advisers and the Affiliated Sub-Advisers |
The Board reviewed the advisory services provided to the Fund by Invesco Advisers under the Fund’s investment advisory agreement, the performance of Invesco Advisers in providing these services, and the credentials and experience of the officers and employees of Invesco Advisers who provide these services, including the Fund’s portfolio manager or managers, with whom the Sub-Committees met
during the year. The Board’s review of the qualifications of Invesco Advisers to provide advisory services included the Board’s consideration of Invesco Advisers’ investment process oversight, independent credit analysis and investment risk management. The Board also considered non-advisory services that Invesco Advisers and its affiliates provide to the Invesco Funds such as various back office support functions, equity and fixed income trading operations, internal audit, distribution and legal and compliance.
In determining whether to continue the Fund’s investment advisory agreement, the Board considered the benefits of reapproving an existing relationship and the greater uncertainty that may be associated with entering into a new relationship. The Board concluded that the nature, extent and quality of the services provided to the Fund by Invesco Advisers are appropriate and satisfactory and consistent with the terms of the Fund’s investment advisory agreement.
The Board reviewed the services that may be provided by the Affiliated Sub-Advisers under the sub-advisory contracts and the credentials and experience of the officers and employees of the Affiliated Sub-Advisers who provide these services. The Board noted that the Affiliated Sub-Advisers have offices and personnel that are located in financial centers around the world. As a result, the Affiliated Sub-Advisers can provide research and investment analysis on the markets and economies of various countries in which the Fund may invest, make recommendations regarding securities and assist with security trades. The Board concluded that the sub-advisory contracts benefit the Fund and its shareholders by permitting Invesco Advisers to use the resources and talents of the Affiliated Sub-Advisers in managing the Fund. The Board concluded that the nature, extent and quality of the services that may be provided by the Affiliated Sub-Advisers are appropriate and satisfactory and consistent with the terms of the Fund’s sub-advisory contracts.
| B. | Fund Performance |
The Board considered Fund performance as a relevant factor in considering whether to approve the investment advisory agreement. The Board did not view Fund performance as a relevant factor in considering whether to approve the sub-advisory contracts for the Fund, as no Affiliated Sub-Adviser currently manages assets of the Fund.
The Board compared the Fund’s performance during the past one, three and five calendar years to the performance of funds in the Lipper performance universe and against the Lipper Mixed-Asset Target Allocation Growth Funds Index. The Board noted that performance of Class A shares of the Fund was in the first quintile of its performance universe for the one
38 Invesco Equity and Income Fund
and three year periods and the second quintile for the five year period (the first quintile being the best performing funds and the fifth quintile being the worst performing funds). The Board noted that performance of Class A shares of the Fund was above the performance of the Index for the one, three and five year periods. The Trustees also reviewed more recent Fund performance and this review did not change their conclusions.
| C. | Advisory and Sub-Advisory Fees |
The Board compared the Fund’s contractual management fee rate to the contractual management fee rates of funds in the Fund’s Lipper expense group at a common asset level. The Board noted that the contractual management fee rate for Class A shares of the Fund was below the median contractual management fee rate of funds in the expense group. The Board noted that the term “contractual management fee” may include both advisory and certain administrative services fees, but that Lipper does not provide information on a fund by fund basis as to what is included. The Board noted that Invesco Advisers does not charge the Invesco Funds for the administrative services included in the term as defined by Lipper. The Board also reviewed the methodology used by Lipper in providing expense group information, which includes using each fund’s contractual management fee schedule (including any applicable breakpoints) as reported in the most recent prospectus or statement of additional information for each fund in the expense group.
The Board noted that Invesco Advisers has contractually agreed to waive fees and/or limit expenses of the Fund through at least June 30, 2015 in an amount necessary to limit total annual operating expenses to a specified percentage of average daily net assets for each class of the Fund.
The Board also compared the Fund’s effective advisory fee rate (the advisory fee rate after advisory fee waivers and before other expense limitations/waivers) to the effective advisory fee rates of other mutual funds advised by Invesco Advisers that are managed using an investment process substantially similar to the investment process used for the Fund. The Board noted that the Fund’s rate was below the rate of one such mutual fund and below the sub-adviser effective fee rate of two funds sub-advised by Invesco Advisers using a similar investment process and above the effective fee rate of one fund sub-advised by Invesco Advisers using a similar investment process. The Board noted that Invesco Advisers and the Affiliated Sub-Advisers do not advise other client accounts that are managed using an investment process substantially similar to the investment process used for the Fund.
The Board also considered the services that may be provided by the Affiliated Sub-Advisers pursuant to the sub-advisory contracts, as well as the fees payable by Invesco Advisers to the Affiliated Sub-Advisers pursuant to the sub-advisory contracts. The Board also noted
that the sub-advisory fees are not paid directly by the Fund, but rather, are payable by Invesco Advisers to the Affiliated Sub-Advisers.
| D. | Economies of Scale and Breakpoints |
The Board considered the extent to which there are economies of scale in the provision of advisory services to the Fund. The Board also considered whether the Fund benefits from economies of scale through contractual breakpoints in the Fund’s advisory fee schedule and was assisted in this review by a report from the Senior Officer. The Board also noted that the Fund shares directly in economies of scale through lower fees charged by third party service providers based on the combined size of the Invesco Funds and other clients advised by Invesco Advisers.
| E. | Profitability and Financial Resources |
The Board reviewed information from Invesco Advisers concerning the costs of the advisory and other services that Invesco Advisers and its affiliates provide to the Fund and the profitability of Invesco Advisers and its affiliates in providing these services for the year ended December 31, 2013. The Board received information from Invesco Advisers about the methodology used to prepare the profitability information. The Board considered the profitability of Invesco Advisers in managing the Fund and the Invesco Funds. The Board noted that Invesco Advisers continues to operate at a net profit from services Invesco Advisers and its subsidiaries provide to the Invesco Funds and the Fund. The Board did not deem the level of profits realized by Invesco Advisers and its affiliates from providing services to the Fund to be excessive given the nature, quality and extent of the services provided to the Invesco Funds. The Board received and accepted information from Invesco Advisers demonstrating that Invesco Advisers and each Affiliated Sub-Adviser are financially sound and have the resources necessary to perform their obligations under the investment advisory agreement and sub-advisory contracts.
| F. | Collateral Benefits to Invesco Advisers and its Affiliates |
The Board considered various other benefits received by Invesco Advisers and its affiliates from the relationship with the Fund, including the fees received for their provision of transfer agency and distribution services to the Fund. The Board considered comparative information regarding fees charged for these services, including information provided by Lipper and other independent sources. The Board considered the performance of Invesco Advisers and its affiliates in providing these services and the organizational structure employed to provide these services. The Board also considered that these services are provided to the Fund pursuant to written contracts that are reviewed and approved on an annual basis by the Board; that the services are required for the operation of the Fund; that Invesco Advisers and its affiliates can provide services, the nature and quality of which are at least equal to those provided by others offering the same or
similar services; and that the fees for such services are fair and reasonable in light of the usual and customary charges by others for services of the same nature and quality.
The Board considered the benefits realized by Invesco Advisers and the Affiliated Sub-Advisers as a result of portfolio brokerage transactions executed through “soft dollar” arrangements. The Board noted that soft dollar arrangements shift the payment obligation for research services from Invesco Advisers and the Affiliated Sub-Advisers to the Invesco Funds and that the research received may be used with other clients of Invesco Advisers and may reduce Invesco Advisers’ and the Affiliated Sub-Advisers’ expenses. The Board also considered that it receives periodic reports from the Chief Compliance Officer of the Invesco Funds demonstrating that these arrangements are consistent with regulatory requirements. The Board did not deem the soft dollar arrangements to be inappropriate.
The Board considered that the Fund’s uninvested cash and cash collateral from any securities lending arrangements may be invested in money market funds advised by Invesco Advisers pursuant to procedures approved by the Board. The Board noted that Invesco Advisers receives advisory fees from these affiliated money market funds attributable to such investments, although Invesco Advisers has contractually agreed to waive through varying periods the advisory fees payable by the Invesco Funds with respect to investments in the affiliated money market funds. The waiver is in an amount equal to 100% of the net advisory fee Invesco Advisers receives from the affiliated money market funds with respect to the Fund’s investment in the affiliated money market funds of uninvested cash, but not cash collateral. The Board concluded that the amount of advisory fees received by Invesco Advisors from the Fund’s investment of uninvested cash and cash collateral from any securities lending arrangements in the affiliated money market funds are fair and reasonable.
The Board also considered the Fund may use an affiliated broker to execute certain trades for the Fund to among other things, control information leakage, and were advised that such trades would be executed in compliance with rules under the Investment Company Act of 1940, as amended.
39 Invesco Equity and Income Fund
Tax Information
Form 1099-DIV, Form 1042-S and other year–end tax information provide shareholders with actual calendar year amounts that should be included in their tax returns. Shareholders should consult their tax advisors.
The following distribution information is being provided as required by the Internal Revenue Code or to meet a specific state’s requirement.
The Fund designates the following amounts or, if subsequently determined to be different, the maximum amount allowable for its fiscal year ended August 31, 2014:
Federal and State Income Tax | ||||
Long-Term Capital Gain Distributions | $ | 660,165,034 | ||
Qualified Dividend Income* | 69.80 | % | ||
Corporate Dividends Received Deduction* | 50.34 | % | ||
U.S. Treasury Obligations* | 5.92 | % | ||
| * | The above percentages are based on ordinary income dividends paid to shareholders during the Fund’s fiscal year. |
40 Invesco Equity and Income Fund
Trustees and Officers
The address of each trustee and officer is AIM Counselor Series Trust (Invesco Counselor Series Trust) (the “Trust”), 11 Greenway Plaza, Suite 1000, Houston, Texas 77046-1173. The trustees serve for the life of the Trust, subject to their earlier death, incapacitation, resignation, retirement or removal as more specifically provided in the Trust’s organizational documents. Each officer serves for a one year term or until their successors are elected and qualified. Column two below includes length of time served with predecessor entities, if any.
Name, Year of Birth and Position(s) Held with the Trust | Trustee and/ or Officer Since | Principal Occupation(s) During Past 5 Years | Number of Funds in Fund Complex Overseen by Trustee | Other Directorship(s) Held by Trustee During Past 5 Years | ||||
| Interested Persons | ||||||||
Martin L. Flanagan1 — 1960 Trustee | 2007 | Executive Director, Chief Executive Officer and President, Invesco Ltd. (ultimate parent of Invesco and a global investment management firm); Advisor to the Board, Invesco Advisers, Inc. (formerly known as Invesco Institutional (N.A.), Inc.); Trustee, The Invesco Funds; Vice Chair, Investment Company Institute; and Member of Executive Board, SMU Cox School of Business.
Formerly: Chairman and Chief Executive Officer, Invesco Advisers, Inc. (registered investment adviser); Director, Chairman, Chief Executive Officer and President, IVZ Inc. (holding company), INVESCO Group Services, Inc. (service provider) and Invesco North American Holdings, Inc. (holding company); Director, Chief Executive Officer and President, Invesco Holding Company Limited (parent of Invesco and a global investment management firm); Director, Invesco Ltd.; Chairman, Investment Company Institute and President, Co-Chief Executive Officer, Co-President, Chief Operating Officer and Chief Financial Officer, Franklin Resources, Inc. (global investment management organization). | 141 | None | ||||
Philip A. Taylor2 — 1954 Trustee, President and Principal Executive Officer | 2006 | Head of North American Retail and Senior Managing Director, Invesco Ltd.; Director, Co-Chairman, Co-President and Co-Chief Executive Officer, Invesco Advisers, Inc. (formerly known as Invesco Institutional (N.A.), Inc.) (registered investment adviser); Director, Chairman, Chief Executive Officer and President, Invesco Management Group, Inc. (formerly known as Invesco Aim Management Group, Inc.) (financial services holding company); Director and President, INVESCO Funds Group, Inc. (registered investment adviser and registered transfer agent); Director and Chairman, Invesco Investment Services, Inc. (formerly known as Invesco Aim Investment Services, Inc.) (registered transfer agent) and IVZ Distributors, Inc. (formerly known as INVESCO Distributors, Inc.) (registered broker dealer); Director, President and Chairman, Invesco Inc. (holding company) and Invesco Canada Holdings Inc. (holding company); Chief Executive Officer, Invesco Corporate Class Inc. (corporate mutual fund company) and Invesco Canada Fund Inc. (corporate mutual fund company); Director, Chairman and Chief Executive Officer, Invesco Canada Ltd. (formerly known as Invesco Trimark Ltd./Invesco Trimark Ltèe) (registered investment adviser and registered transfer agent); Trustee, President and Principal Executive Officer, The Invesco Funds (other than AIM Treasurer’s Series Trust (Invesco Treasurer’s Series Trust) and Short-Term Investments Trust); Trustee and Executive Vice President, The Invesco Funds (AIM Treasurer’s Series Trust (Invesco Treasurer’s Series Trust) and Short-Term Investments Trust only); Director, Invesco Investment Advisers LLC (formerly known as Van Kampen Asset Management); Director, Chief Executive Officer and President, Van Kampen Exchange Corp.
Formerly: Director and Chairman, Van Kampen Investor Services Inc.; Director, Chief Executive Officer and President, 1371 Preferred Inc. (holding company) and Van Kampen Investments Inc.; Director and President, AIM GP Canada Inc. (general partner for limited partnerships) and Van Kampen Advisors, Inc.; Director and Chief Executive Officer, Invesco Trimark Dealer Inc. (registered broker dealer); Director, Invesco Distributors, Inc. (formerly known as Invesco Aim Distributors, Inc.) (registered broker dealer); Manager, Invesco PowerShares Capital Management LLC; Director, Chief Executive Officer and President, Invesco Advisers, Inc.; Director, Chairman, Chief Executive Officer and President, Invesco Aim Capital Management, Inc.; President, Invesco Trimark Dealer Inc. and Invesco Trimark Ltd./Invesco Trimark Ltèe; Director and President, AIM Trimark Corporate Class Inc. and AIM Trimark Canada Fund Inc.; Senior Managing Director, Invesco Holding Company Limited; Director and Chairman, Fund Management Company (former registered broker dealer); President and Principal Executive Officer, The Invesco Funds (AIM Treasurer’s Series Trust (Invesco Treasurer’s Series Trust), and Short-Term Investments Trust only); President, AIM Trimark Global Fund Inc. and AIM Trimark Canada Fund Inc. | 141 | None | ||||
Wayne W. Whalen3 — 1939 Trustee | 2010 | Of Counsel, and prior to 2010, partner in the law firm of Skadden, Arps, Slate, Meagher & Flom LLP, legal counsel to certain funds in the Fund Complex
| 141 | Director of the Mutual fund Directors Forum, a nonprofit membership organization for investment directors; Chairman and Director of the Abraham Lincoln Presidential Library Foundation; and Director of the Stevenson Center for Democracy |
| 1 | Mr. Flanagan is considered an interested person (within the meaning of Section 2(a)(19) of the 1940 Act) of the Trust because he is an officer of the Adviser to the Trust, and an officer and a director of Invesco Ltd., ultimate parent of the Adviser. |
| 2 | Mr. Taylor is considered an interested person (within the meaning of Section 2(a)(19) of the 1940 Act) of the Trust because he is an officer and a director of the Adviser. |
| 3 | Mr. Whalen is retiring effective December 31, 2014. He has been deemed to be an interested person of the Trust because of his prior service as counsel to the predecessor funds of certain Invesco open-end funds and his affiliation with the law firm that served as counsel to such predecessor funds and the Invesco closed-end funds. |
T-1 Invesco Equity and Income Fund
Trustees and Officers—(continued)
Name, Year of Birth and Position(s) Held with the Trust | Trustee and/ or Officer Since | Principal Occupation(s) During Past 5 Years | Number of Funds in Fund Complex Overseen by Trustee | Other Directorship(s) Past 5 Years | ||||
| Independent Trustees | ||||||||
Bruce L. Crockett — 1944 Trustee and Chair | 2003 | Chairman, Crockett Technologies Associates (technology consulting company)
Formerly: Director, Captaris (unified messaging provider); Director, President and Chief Executive Officer, COMSAT Corporation; Chairman, Board of Governors of INTELSAT (international communications company); ACE Limited (insurance company); and Investment Company Institute | 141 | ALPS (Attorneys Liability Protection Society) (insurance company) | ||||
David C. Arch — 1945 Trustee | 2010 | Chairman of Blistex Inc., a consumer health care products manufacturer | 141 | Board member of the Illinois Manufacturers’ Association; Member of the Board of Visitors, Institute for the Humanities, University of Michigan; Member of the Audit Committee of the Edward-Elmhurst Hospital | ||||
Frank S. Bayley — 1939 Trustee | 2003 | Retired. Formerly: Director, Badgley Funds Inc. (registered investment company) (2 portfolios) and General Partner and Of Counsel, law firm of Baker & McKenzie, LLP | 141 | Director and Chairman, C.D. Stimson Company (a real estate investment company); Trustee, The Curtis Institute of Music | ||||
James T. Bunch — 1942 Trustee | 2000 | Managing Member, Grumman Hill Group LLC (family office private equity investments)
Formerly: Founder, Green Manning & Bunch Ltd. (investment banking firm) (1988-2010); Executive Committee, United States Golf Association; and Director, Policy Studies, Inc. and Van Gilder Insurance Corporation | 141 | Chairman, Board of Governors, Western Golf Association; Chairman, Evans Scholars Foundation; and Director, Denver Film Society | ||||
Rodney F. Dammeyer — 1940 Trustee | 2010 | Chairman of CAC, LLC, (private company offering capital investment and management advisory services)
Formerly: Prior to 2001, Managing Partner at Equity Group Corporate Investments; Prior to 1995, Chief Executive Officer of Itel Corporation (formerly Anixter International); Prior to 1985, experience includes Senior Vice President and Chief Financial Officer of Household International, Inc., Executive Vice President and Chief Financial Officer of Northwest Industries, Inc. and Partner of Arthur Andersen & Co.; From 1987 to 2010, Director/Trustee of investment companies in the Van Kampen Funds complex | 141 | Director of Quidel Corporation and Stericycle, Inc. | ||||
Albert R. Dowden — 1941 Trustee | 2003 | Director of a number of public and private business corporations, including the Boss Group, Ltd. (private investment and management); Nature’s Sunshine Products, Inc. and Reich & Tang Funds (5 portfolios) (registered investment company)
Formerly: Director, Homeowners of America Holding Corporation/Homeowners of America Insurance Company (property casualty company); Director, Continental Energy Services, LLC (oil and gas pipeline service); Director, CompuDyne Corporation (provider of product and services to the public security market) and Director, Annuity and Life Re (Holdings), Ltd. (reinsurance company); Director, President and Chief Executive Officer, Volvo Group North America, Inc.; Senior Vice President, AB Volvo; Director of various public and private corporations; Chairman, DHJ Media, Inc.; Director, Magellan Insurance Company; and Director, The Hertz Corporation, Genmar Corporation (boat manufacturer), National Media Corporation; Advisory Board of Rotary Power International (designer, manufacturer, and seller of rotary power engines); and Chairman, Cortland Trust, Inc. (registered investment company) | 141 | Director of: Nature’s Sunshine Products, Inc., Reich & Tang Funds, Homeowners of America Holding Corporation/ Homeowners of America Insurance Company, the Boss Group | ||||
Jack M. Fields — 1952 Trustee | 2003 | Chief Executive Officer, Twenty First Century Group, Inc. (government affairs company); Owner and Chief Executive Officer, Dos Angeles Ranch, L.P. (cattle, hunting, corporate entertainment); and Discovery Global Education Fund (non-profit)
Formerly: Chief Executive Officer, Texana Timber LP (sustainable forestry company); Director of Cross Timbers Quail Research Ranch (non-profit); and member of the U.S. House of Representatives | 141 | Insperity, Inc. (formerly known as Administaff) | ||||
Prema Mathai-Davis — 1950 Trustee | 2003 | Retired. Formerly: Chief Executive Officer, YWCA of the U.S.A. | 141 | None | ||||
Larry Soll — 1942 Trustee | 1997 | Retired. Formerly: Chairman, Chief Executive Officer and President, Synergen Corp. (a biotechnology company) | 141 | None | ||||
Hugo F. Sonnenschein — 1940 Trustee | 2010 | President Emeritus and Honorary Trustee of the University of Chicago and the Adam Smith Distinguished Service Professor in the Department of Economics at the University of Chicago. Prior to 2000, President of the University of Chicago | 141 | Trustee of the University of Rochester and a member of its investment committee; Member of the National Academy of Sciences and the American Philosophical Society; Fellow of the American Academy of Arts and Sciences |
T-2 Invesco Equity and Income Fund
Trustees and Officers—(continued)
Name, Year of Birth and Position(s) Held with the Trust | Trustee and/ or Officer Since | Principal Occupation(s) During Past 5 Years | Number of Funds in Fund Complex Overseen by Trustee | Other Directorship(s) Past 5 Years | ||||
| Independent Trustees—(continued) | ||||||||
Raymond Stickel, Jr. — 1944 Trustee | 2005 | Retired. Formerly: Director, Mainstay VP Series Funds, Inc. (25 portfolios) and Partner, Deloitte & Touche | 141 | None | ||||
Suzanne H. Woolsey — 1941 Trustee | 2014 | Chief Executive Officer of Woolsey Partners LLC | 141 | Emeritus Chair of the Board of Trustees of the Institute for Defense Analyses; Trustee of Colorado College; Trustee of California Institute of Technology; Prior to 2014, Director of Fluor Corp.; Prior to 2010, Trustee of the German Marshall Fund of the United States; Prior to 2010 Trustee of the Rocky Mountain Institute | ||||
| Other Officers | ||||||||
Russell C. Burk — 1958 Senior Vice President and Senior Officer | 2005 | Senior Vice President and Senior Officer, The Invesco Funds | N/A | N/A | ||||
John M. Zerr — 1962 Senior Vice President, Chief Legal Officer and Secretary | 2006 | Director, Senior Vice President, Secretary and General Counsel, Invesco Management Group, Inc. (formerly known as Invesco Aim Management Group, Inc.) and Van Kampen Exchange Corp.; Senior Vice President, Invesco Advisers, Inc. (formerly known as Invesco Institutional (N.A.), Inc.) (registered investment adviser); Senior Vice President and Secretary, Invesco Distributors, Inc. (formerly known as Invesco Aim Distributors, Inc.); Director, Vice President and Secretary, Invesco Investment Services, Inc. (formerly known as Invesco Aim Investment Services, Inc.) and IVZ Distributors, Inc. (formerly known as INVESCO Distributors, Inc.); Director and Vice President, INVESCO Funds Group, Inc.; Senior Vice President, Chief Legal Officer and Secretary, The Invesco Funds; Manager, Invesco PowerShares Capital Management LLC; Director, Secretary and General Counsel, Invesco Investment Advisers LLC (formerly known as Van Kampen Asset Management); Secretary and General Counsel, Invesco Capital Markets, Inc. (formerly known as Van Kampen Funds Inc.) and Chief Legal Officer, PowerShares Exchange-Traded Fund Trust, PowerShares Exchange-Traded Fund Trust II, PowerShares India Exchange-Traded Fund Trust and PowerShares Actively Managed Exchange-Traded Fund Trust
Formerly: Director and Vice President, Van Kampen Advisors Inc.; Director, Vice President, Secretary and General Counsel, Van Kampen Investor Services Inc.; Director, Invesco Distributors, Inc. (formerly known as Invesco Aim Distributors, Inc.); Director, Senior Vice President, General Counsel and Secretary, Invesco Aim Advisers, Inc. and Van Kampen Investments Inc.; Director, Vice President and Secretary, Fund Management Company; Director, Senior Vice President, Secretary, General Counsel and Vice President, Invesco Aim Capital Management, Inc.; Chief Operating Officer and General Counsel, Liberty Ridge Capital, Inc. (an investment adviser); Vice President and Secretary, PBHG Funds (an investment company) and PBHG Insurance Series Fund (an investment company); Chief Operating Officer, General Counsel and Secretary, Old Mutual Investment Partners (a broker-dealer); General Counsel and Secretary, Old Mutual Fund Services (an administrator) and Old Mutual Shareholder Services (a shareholder servicing center); Executive Vice President, General Counsel and Secretary, Old Mutual Capital, Inc. (an investment adviser); and Vice President and Secretary, Old Mutual Advisors Funds (an investment company) | N/A | N/A | ||||
Sheri Morris — 1964 Vice President, Treasurer and Principal Financial Officer | 2003 | Vice President, Treasurer and Principal Financial Officer, The Invesco Funds; Vice President, Invesco Advisers, Inc. (formerly known as Invesco Institutional (N.A.), Inc.) (registered investment adviser); and Vice President, PowerShares Exchange-Traded Fund Trust, PowerShares Exchange-Traded Fund Trust II, PowerShares India Exchange-Traded Fund Trust and PowerShares Actively Managed Exchange-Traded Fund Trust
Formerly: Vice President, Invesco Aim Advisers, Inc., Invesco Aim Capital Management, Inc. and Invesco Aim Private Asset Management, Inc.; Assistant Vice President and Assistant Treasurer, The Invesco Funds and Assistant Vice President, Invesco Advisers, Inc., Invesco Aim Capital Management, Inc. and Invesco Aim Private Asset Management, Inc.; and Treasurer, PowerShares Exchange-Traded Fund Trust, PowerShares Exchange-Traded Fund Trust II, PowerShares India Exchange-Traded Fund Trust and PowerShares Actively Managed Exchange-Traded Fund Trust | N/A | N/A | ||||
T-3 Invesco Equity and Income Fund
Trustees and Officers—(continued)
Name, Year of Birth and Position(s) Held with the Trust | Trustee and/ or Officer Since | Principal Occupation(s) During Past 5 Years | Number of Funds in Fund Complex Overseen by Trustee | Other Directorship(s) Past 5 Years | ||||
| Other Officers—(continued) | ||||||||
Karen Dunn Kelley — 1960 Vice President | 2003 | Senior Managing Director, Investments; Director, Co-President, Co-Chief Executive Officer, and Co-Chairman, Invesco Advisers, Inc. (formerly known as Invesco Institutional (N.A.), Inc.) (registered investment adviser); Chairman, Invesco Senior Secured Management, Inc.; Senior Vice President, Invesco Management Group, Inc. (formerly known as Invesco Aim Management Group, Inc.); Executive Vice President, Invesco Distributors, Inc. (formerly known as Invesco Aim Distributors, Inc.); Director, Invesco Mortgage Capital Inc. and Invesco Management Company Limited; Director and President, INVESCO Asset Management (Bermuda) Ltd., Vice President, The Invesco Funds (other than AIM Treasurer’s Series Trust (Invesco Treasurer’s Series Trust) and Short-Term Investments Trust); and President and Principal Executive Officer, The Invesco Funds (AIM Treasurer’s Series Trust (Invesco Treasurer’s Series Trust) and Short-Term Investments Trust only)
Formerly: Director, INVESCO Global Asset Management Limited and INVESCO Management S.A.; Senior Vice President, Van Kampen Investments Inc. and Invesco Advisers, Inc. (formerly known as Invesco Institutional (N.A.), Inc.) (registered investment adviser); Vice President, Invesco Advisers, Inc. (formerly known as Invesco Institutional (N.A.), Inc.); Director of Cash Management and Senior Vice President, Invesco Advisers, Inc. and Invesco Aim Capital Management, Inc.; Director and President, Fund Management Company; Chief Cash Management Officer, Director of Cash Management, Senior Vice President, and Managing Director, Invesco Aim Capital Management, Inc.; Director of Cash Management, Senior Vice President, and Vice President, Invesco Advisers, Inc. and The Invesco Funds (AIM Treasurer’s Series Trust (Invesco Treasurer’s Series Trust), and Short-Term Investments Trust only) | N/A | N/A | ||||
Crissie M. Wisdom — 1969 Anti-Money Laundering Compliance Officer | 2013 | Anti-Money Laundering Compliance Officer, Invesco Advisers, Inc. (formerly known as Invesco Institutional (N.A.), Inc.) (registered investment adviser), Invesco Capital Markets, Inc. (formerly known as Van Kampen Funds Inc.), Invesco Distributors, Inc., Invesco Investment Services, Inc., Invesco Management Group, Inc., Van Kampen Exchange Corp., The Invesco Funds, and PowerShares Exchange-Traded Fund Trust, PowerShares Exchange-Traded Fund Trust II, PowerShares India Exchange-Traded Fund Trust, and PowerShares Actively Managed Exchange-Traded Fund Trust; and Fraud Prevention Manager and Controls and Risk Analysis Manager for Invesco Investment Services, Inc. | N/A | N/A | ||||
Todd L. Spillane — 1958 Chief Compliance Officer | 2006 | Senior Vice President, Invesco Management Group, Inc. (formerly known as Invesco Aim Management Group, Inc.) and Van Kampen Exchange Corp.; Senior Vice President and Chief Compliance Officer, Invesco Advisers, Inc. (registered investment adviser) (formerly known as Invesco Institutional (N.A.), Inc.); Chief Compliance Officer, The Invesco Funds; Vice President, Invesco Distributors, Inc. (formerly known as Invesco Aim Distributors, Inc.) and Invesco Investment Services, Inc. (formerly known as Invesco Aim Investment Services, Inc.)
Formerly: Chief Compliance Officer, Invesco Funds (Chicago); Senior Vice President, Van Kampen Investments Inc.; Senior Vice President and Chief Compliance Officer, Invesco Aim Advisers, Inc. and Invesco Aim Capital Management, Inc.; Chief Compliance Officer, INVESCO Private Capital Investments, Inc. (holding company), Invesco Private Capital, Inc. (registered investment adviser), Invesco Global Asset Management (N.A.), Inc., Invesco Senior Secured Management, Inc. (registered investment adviser), Van Kampen Investor Services Inc., PowerShares Exchange-Traded Fund Trust, PowerShares Exchange-Traded Fund Trust II, PowerShares India Exchange-Traded Fund Trust and PowerShares Actively Managed Exchange-Traded Fund Trust; and Vice President, Invesco Aim Capital Management, Inc. and Fund Management Company | N/A | N/A |
The Statement of Additional Information of the Trust includes additional information about the Fund’s Trustees and is available upon request, without charge, by calling 1.800.959.4246. Please refer to the Fund’s prospectus for information on the Fund’s sub-advisers.
Office of the Fund 11 Greenway Plaza, Suite 1000 Houston, TX 77046-1173 | Investment Adviser Invesco Advisers, Inc. 1555 Peachtree Street, N.E. Atlanta, GA 30309 | Distributor Invesco Distributors, Inc. 11 Greenway Plaza, Suite 1000 Houston, TX 77046-1173 | Auditors PricewaterhouseCoopers LLP 1201 Louisiana Street, Suite 2900 Houston, TX 77002-5678 | |||
Counsel to the Fund Stradley Ronon Stevens & Young, LLP 2005 Market Street, Suite 2600 Philadelphia, PA 19103-7018 | Counsel to the Independent Trustees Goodwin Procter LLP 901 New York Avenue, N.W. Washington, D.C. 20001 | Transfer Agent Invesco Investment Services, Inc. 11 Greenway Plaza, Suite 1000 Houston, TX 77046-1173 | Custodian State Street Bank and Trust Company 225 Franklin Street Boston, MA 02110-2801 | |||
T-4 Invesco Equity and Income Fund

Invesco mailing information
Send general correspondence to Invesco Investment Services, Inc., P.O. Box 219078, Kansas City, MO 64121-9078.
Important notice regarding delivery of security holder documents
To reduce Fund expenses, only one copy of most shareholder documents may be mailed to shareholders with multiple accounts at the same address (Householding). Mailing of your shareholder documents may be householded indefinitely unless you instruct us otherwise. If you do not want the mailing of these documents to be combined with those for other members of your household, please contact Invesco Investment Services, Inc. at 800 959 4246 or contact your financial institution. We will begin sending you individual copies for each account within 30 days after receiving your request.
Fund holdings and proxy voting information
The Fund provides a complete list of its holdings four times in each fiscal year, at the quarter ends. For the second and fourth quarters, the lists appear in the Fund’s semiannual and annual reports to shareholders. For the first and third quarters, the Fund files the lists with the Securities and Exchange Commission (SEC) on Form N-Q. The most recent list of portfolio holdings is available at invesco.com/completeqtrholdings. Shareholders can also look up the Fund’s Forms N-Q on the SEC website at sec.gov. Copies of the Fund’s Forms N-Q may be reviewed and copied at the SEC Public Reference Room in Washington, D.C. You can obtain information on the operation of the Public Reference Room, including information about duplicating fee charges, by calling 202 551 8090 or 800 732 0330, or by electronic request at the following email address: publicinfo@sec.gov. The SEC file numbers for the Fund are shown below.
A description of the policies and procedures that the Fund uses to determine how to vote proxies relating to portfolio securities is available without charge, upon request, from our Client Services department at 800 959 4246 or at invesco.com/proxyguidelines. The information is also available on the SEC website, sec.gov.
Information regarding how the Fund voted proxies related to its portfolio securities during the most recent 12-month period ended June 30 is available at invesco.com/proxysearch. The information is also available on the SEC website, sec.gov. Invesco Advisers, Inc. is an investment adviser; it provides investment advisory services to individual and institutional clients and does not sell securities. Invesco Distributors, Inc. is the US distributor for Invesco Ltd.’s retail mutual funds, exchange-traded funds and institutional money market funds. Both are wholly owned, indirect subsidiaries of Invesco Ltd. |  |
| SEC file numbers: 811-09913 and 333-36074 | VK-EQI-AR-1 | Invesco Distributors, Inc. |

Letters to Shareholders
Philip Taylor | Dear Shareholders: This annual report includes information about your Fund, including performance data and a complete list of its investments as of the close of the reporting period. Inside, your Fund’s portfolio managers discuss how they managed your Fund and the factors that affected its performance during the reporting period. I hope you find this report of interest. During the reporting period covered by this report, the US economy showed signs of continued improvement. After contracting in the first quarter of 2014, the economy expanded strongly in the second quarter and unemployment trended lower. Much of the credit for this improvement goes to the US Federal Reserve (the Fed), which undertook an extraordinary asset purchase program following the global financial crisis. The Fed’s goal was to jumpstart the economy by encouraging banks to lend more, businesses to hire more and consumers to spend more. |

Signs of a stronger US economy prompted the Fed to reduce, or “taper,” its asset purchase program. Despite this, interest rates remained near historical low levels due largely to heavy investor demand for bonds. While signs of economic improvement were evident in the US, European economies remained relatively stagnant. During the reporting period, high unemployment persisted, worries about potential deflation grew, and uncertainty about Russian-Ukrainian tensions weighed on European markets.
Extended periods of market strength can lull investors into complacency – just as prolonged periods of market weakness or volatility can discourage investors from initiating long-term investment plans. That’s why Invesco has always encouraged investors to work with a professional financial adviser who can stress the importance of starting to save and invest early and the importance of adhering to a disciplined investment plan – when times are good and when they’re uncertain. A financial adviser who knows your unique financial situation, investment goals and risk tolerance can be an invaluable partner as you seek to achieve your financial goals. He or she can offer a long-term perspective when markets are volatile and time-tested advice and guidance when your financial situation or investment goals change.
Timely information when and where you want it
Invesco’s efforts to help investors achieve their financial objectives include providing individual investors and financial professionals with timely information about the markets, the economy and investing – whenever and wherever they want it.
Our website, invesco.com/us, offers a wide range of market insights and investment perspectives. On the website, you’ll find detailed information about our funds, including prices, performance, holdings and portfolio manager commentaries. You can access information about your individual Invesco account whenever it’s convenient for you; just complete a simple, secure online registration. Use the “Login” box on our home page to get started.
Invesco’s mobile app for iPad® (available free from the App StoreSM) allows you to obtain the same detailed information about your Fund and the same investment insights from our investment leaders, market strategists, economists and retirement experts on the go. You also can watch portfolio manager videos and have instant access to Invesco news and updates wherever you may be.
In addition to the resources accessible on our website and through our mobile app, you can obtain timely updates to help you stay informed about the markets, the economy and investing by connecting with Invesco on Twitter, LinkedIn or Facebook. You can access our blog at blog.invesco.us.com or by clicking the “Intentional Investing Forum” link on our home page. Our goal is to provide you the information you want, when and where you want it.
Have questions?
For questions about your account, feel free to contact an Invesco client services representative at 800 959 4246. For Invesco-related questions or comments, please email me directly at phil@invesco.com.
All of us at Invesco look forward to serving your investment management needs for many years to come. Thank you for investing with us.
Sincerely,

Philip Taylor
Senior Managing Director, Invesco Ltd.
iPad is a trademark of Apple Inc., registered in the US and other countries. App Store is a service mark of Apple Inc. Invesco Distributors, Inc. is not affiliated with Apple Inc.
2 Invesco Floating Rate Fund
Bruce Crockett | Dear Fellow Shareholders: There are a variety of factors that can impact investment performance, many of which are uncontrollable by us as investors. These factors can include various economic trends and geopolitical developments. While the members of the Invesco Funds Board, which I chair, can’t dictate the performance of the Invesco funds, be assured that your Board works diligently throughout the year to focus on how your investments are managed. Our job is to represent you and your interests on a variety of fund management-related matters. We regularly monitor how the portfolio management teams of the Invesco funds are performing in light of ever-changing and often unpredictable economic and market conditions. We review the investment strategies and investment process employed by each fund’s management team as explained in the fund’s prospectus. Perhaps our most significant responsibility is conducting the annual review of the funds’ |

advisory and sub-advisory contracts with Invesco Advisers and its affiliates. This annual review, which is required by the Investment Company Act of 1940, focuses on the nature and quality of the services Invesco provides as the adviser to the Invesco funds and the reasonableness of the fees that it charges for those services. Each year, we spend months carefully reviewing information from Invesco that allows us to evaluate the quality of its services and the reasonableness of its fees. We also use information from a variety of independent sources, including materials provided by the independent senior officer of the Invesco funds, who reports directly to the independent trustees on the Board. Additionally, we meet with legal counsel and review performance and fee data prepared for us by Lipper Inc., an independent, third-party firm widely recognized as a leader in its field.
After a careful review, the members of the Invesco Funds Board approved the continuation of advisory and sub-advisory contracts with Invesco Advisers and its affiliates. Be assured that your Board will continue working on behalf of fund shareholders, keeping your needs and interests uppermost in our minds.
As always, please contact me at bruce@brucecrockett.com with any questions or concerns you may have. On behalf of the Board, we look forward to continuing to represent your interests and serving your needs.
Sincerely,
��

Bruce L. Crockett
Independent Chair
Invesco Funds Board of Trustees
3 Invesco Floating Rate Fund
Management’s Discussion of Fund Performance
Performance summary
For the fiscal year ended August 31, 2014, Class A shares of Invesco Floating Rate Fund, at net asset value (NAV), underperformed the Fund’s broad market and style-specific indexes. The Fund invests in lower-rated fixed income instruments, primarily senior secured corporate loans.
Your Fund’s long-term performance appears later in this report.
Fund vs. Indexes
Total returns, 8/31/13 to 8/31/14, at net asset value (NAV). Performance shown does not include applicable contingent deferred sales charges (CDSC) or front-end sales charges, which would have reduced performance.
Class A Shares | 4.30 | % | ||
Class C Shares | 3.91 | |||
Class R Shares | 4.18 | |||
Class Y Shares | 4.69 | |||
Class R5 Shares | 4.72 | |||
Class R6 Shares | 4.66 | |||
Barclays U.S. Aggregate Indexq (Broad Market Index) | 5.66 | |||
Credit Suisse Leveraged Loan Indexn (Style-Specific Index) | 5.15 | |||
Lipper Loan Participation Funds Classification Average¿ (Peer Group) | 4.49 |
Source(s): qFactSet Research Systems Inc.; nBloomberg LP; ¿Lipper Inc.
How we invest
We believe a highly diversified pool of bank loans from a broad spectrum of issuers and consisting of the highest risk-adjusted credit quality available in line with portfolio objectives has the best risk-reward potential.†
Our credit analysts review all holdings and prospective holdings.
Key consideration is given to the following:
| n | Management. Factors include direct operating experience in managing a business, management depth and incentives and track record operating in a leveraged environment. |
| n | Industry position and dynamics. Factors include a company’s industry position, life cycle phase of the industry, barriers to entry and current industry capacity and utilization. |
| n | Asset quality. Considerations may include valuations of hard and intangible assets, how easily those assets can be converted to cash and appropriateness to leverage those assets. |
| n | Divisibility. This factor focuses on operating and corporate structures, ability to divide easily and efficiently, examination of non-core assets and valuation of multiple brand names. |
| n | Sponsors. Considerations include a firm’s track record of quality transactions, access to additional capital and control or ownership of the sponsoring firm. |
| n | Cash flow. We examine a firm’s sales and earnings breakdown by product, divisions and subsidiaries. We look at the predictability of corporate earnings and the cash requirement of the business and conduct an examination of |
the business cycles, seasonality and international pressures.
| n | Recovery and loan-to-value. These factors focus on further examination of the default probability and the rate of recovery associated with loans. |
The portfolio is constructed using a conservative bias to help manage credit risk, while focusing on optimization of return relative to appropriate benchmarks. We continually monitor the holdings in the portfolio and conduct daily, weekly and monthly meetings with our portfolio management teams, traders and analysts.
Utilizing our proprietary risk rating system, our analysts assign, continuously monitor and update probability of default and expected recovery ratings for every asset in the portfolio. Using the resulting risk adjusted returns, analysts monitor positions relative to market levels to detect early sell signals in an attempt to minimize principal loss and maximize relative value.
Market conditions and your Fund
During the fiscal year covered by this report, the senior secured loan market was generally steady in terms of price volatility on both a relative and an absolute level with the vast majority of loans trading at or near par. While loans continued to show correlation with equities and other high-risk assets, loans experienced meaningfully lower levels of volatility. Some of the lack of loan volatility was a function of a generally benign credit environment and a low default rate. Additionally, loan prices were supported by strong technicals as loan demand remained robust throughout the year. This demand principally came from:
Portfolio Composition* By credit quality | ||||
BBB | 0.1 | % | ||
BBB- | 0.3 | |||
BB+ | 4.7 | |||
BB | 12.5 | |||
BB- | 15.1 | |||
B+ | 20.8 | |||
B | 27.4 | |||
B- | 7.3 | |||
CCC+ | 6.1 | |||
CCC | 0.5 | |||
CCC- | 0.4 | |||
CC | 0.1 | |||
Not Rated | 4.3 | |||
Equity | 0.4 | |||
Source: Standard & Poor’s. A credit rating is an assessment provided by a nationally recognized statistical rating organization (NRSRO) of the creditworthiness of an issuer with respect to debt obligations, including specific securities, money market instruments or other debts. Ratings are measured on a scale that generally ranges from AAA (highest) to D (lowest); ratings are subject to change without notice. “Non-Rated” indicates the debtor was not rated, and should not be interpreted as indicating low quality. For more information on Standard and Poor’s rating methodology, please visit standardan-dpoors.com and select “Understanding Ratings” under Rating Resources on the homepage.
Top Five Holdings*
|
| |||
1. First Data Corp. | 1.6 | % | ||
2. Federal-Mogul Corp. | 1.4 | |||
3. Clear Channel Communications, Inc. | 1.3 | |||
4. Asurion LLC | 1.2 | |||
5. Nuveen Investments, Inc. | 1.1 | |||
Total Net Assets | $ | 2.6 billion | ||
Total Number of Holdings* | 634 | |||
The Fund’s holdings are subject to change, and there is no assurance that the Fund will continue to hold any particular security.
| *Excluding | money market fund holdings. |
4 Invesco Floating Rate Fund
| n | Collateralized loan obligation (CLO) issuance, which during the 12 months ended August 31, 2014, was the strongest since 2007, with total inflows of $117 billion1 from August of 2013 through July 2014. |
| n | Net retail inflows, which during the same period totaled $22 billion.1 |
| n | Institutional demand. |
It should be noted that while net retail demand was a negative $8 billion1 from April to July 2014, CLO issuance during this same period was a positive $56 billion.1
Corporate issuers in the senior secured loan market have benefited from robust capital markets since 2009, and issuers have generally maintained good credit performance, strengthened their balance sheets, improved liquidity and addressed near-term maturities. The default rate rose slightly from the 2011 low, but at the close of the reporting period, loan defaults remained comfortably below historical averages.
The Fund was managed with a view toward taking advantage of what appeared to be an expanding (albeit slowly) economy, an absence of corporate restructurings and strong demand for floating rate assets from investors concerned about how rising interest rates might impact the market value of longer dated fixed income investments.
As part of the Fund’s investment strategy, we seek to take advantage of market opportunities by decreasing risk in the Fund when we believe loans are overbought and increasing risk when we believe loans are oversold. The Fund benefited from some of the newer primary deals which exhibited low levels of market volatility during the reporting period and were sold at prices that offered, in our opinion, above-market returns for the associated risk. On an industry basis, the Fund benefited from its housing and telecommunications holdings.
At the close of the reporting period, fundamentals remained favorable for bank loans, with corporate balance sheets generally healthy and default rates below approximately 2%2, the Fund was positioned with a bias towards lower quality loans. Additionally, by the close of the reporting period, we had reduced our holdings of high yield bonds in the portfolio to a level that we believed was below that of many of our peers. At the close of the reporting period, we felt that we had an appropriate mix of caution and aggressiveness given existing market conditions.
As always, we appreciate your continued participation in Invesco Floating Rate Fund.
| 1 | JPMorgan |
| 2 | Standard & Poor’s LSTA Index Loans in Payment Default or Bankruptcy, excluding the April 2014 default of Energy Future Holdings. |
The views and opinions expressed in management’s discussion of Fund performance are those of Invesco Advisers, Inc. These views and opinions are subject to change at any time based on factors such as market and economic conditions. These views and opinions may not be relied upon as investment advice or recommendations, or as an offer for a particular security. The information is not a complete analysis of every aspect of any market, country, industry, security or the Fund. Statements of fact are from sources considered reliable, but Invesco Advisers, Inc. makes no representation or warranty as to their completeness or accuracy. Although historical performance is no guarantee of future results, these insights may help you understand our investment management philosophy.
See important Fund and, if applicable, index disclosures later in this report.
| † | Diversification does not guarantee a profit or eliminate the risk of loss. |
 | Tom Ewald Portfolio Manager, is lead manager of Invesco Floating Rate Fund. He joined Invesco in 2000. | |
| Mr. Ewald earned a BA from Harvard College and an MBA from the University of Virginia Darden School of Business. | ||
 | Scott Baskind Portfolio Manager, is manager of Invesco Floating Rate Fund. He joined Invesco or its investment | |
| advisory affiliates in 1999. Mr. Baskind earned a BS in business administration from University at Albany, The State University of New York. | ||
 | Philip Yarrow Chartered Financial Analyst, Portfolio Manager, is manager of Invesco Floating Rate Fund. He | |
| joined Invesco in 2010. Mr. Yarrow earned a BS in mathematics and economics from The University of Nottingham and a Master of Management degree in finance from Northwestern University. | ||
| 5 Invesco Floating Rate Fund |
Your Fund’s Long-Term Performance
Results of a $10,000 Investment – Oldest Share Class(es)
Fund and index data from 8/31/04
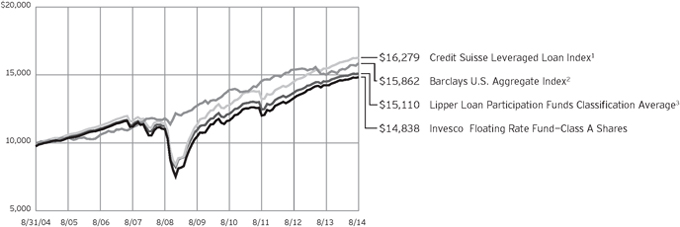
1 Source: Bloomberg L.P.
2 Source: FactSet Research Systems Inc.
3 Source: Lipper Inc.
Past performance cannot guarantee comparable future results.
The data shown in the chart include reinvested distributions, applicable sales charges and Fund expenses including
management fees. Index results include reinvested dividends, but they do not reflect sales charges. Performance of the peer group, if applicable, reflects fund expenses and management fees;
performance of a market index does not. Performance shown in the chart and table(s) does not reflect deduction of taxes a shareholder would pay on Fund distributions or sale of Fund shares.
continued from page 8
supply of short-term financing; changes in government regulation and interest rates; and overall economy.
| n | Interest rate risk. Interest rate risk refers to the risk that bond prices generally fall as interest rates rise; conversely, bond prices generally rise as interest rates fall. Specific bonds differ in their sensitivity to changes in interest rates depending on their individual characteristics, including duration. |
| n | Liquidity risk. The majority of the Fund’s assets is likely to be invested in loans and securities that are less liquid than those traded on national exchanges. In the event the Fund voluntarily or involuntarily liquidates portfolio assets during periods of infrequent trading, it may not receive full value for those assets. |
| n | Management risk. The investment techniques and risk analysis used by the Fund’s portfolio managers may not produce the desired results. |
| n | Market risk. The prices of and the income generated by the Fund’s securities may decline in response to, among other things, investor sentiment, general economic and market conditions, regional or global instability, and currency and interest rate fluctuations. |
| n | Prepayment risk. An issuer’s ability to prepay principal on a loan or debt security prior to maturity can limit the Fund’s potential gains. Prepayments may require the Fund to replace the loan or debt security with a lower yielding security, adversely affecting the Fund’s yield. |
About indexes used in this report
| n | The Barclays U.S. Aggregate Index is an unmanaged index considered representative of the US investment-grade, fixed-rate bond market. |
| n | The Credit Suisse Leveraged Loan Index represents tradable, senior-secured, US-dollar-denominated, noninvestment-grade loans. |
| n | The Lipper Loan Participation Funds Classification Average represents an average of all of the funds in the Lipper Loan Participation Funds classification. |
| n | The Fund is not managed to track the performance of any particular index, including the index(es) described here, and consequently, the performance of the Fund may deviate significantly from the performance of the index(es). |
| n | A direct investment cannot be made in an index. Unless otherwise indicated, index results include reinvested dividends, and they do not reflect sales charges. Performance of the peer group, if applicable, reflects fund expenses; performance of a market index does not. |
Other information
| n | The returns shown in management’s discussion of Fund performance are based on net asset values (NAVs) calculated for shareholder transactions. Generally accepted accounting principles require adjustments to be made to the net assets of the Fund at period end for financial reporting purposes, and as such, the NAVs for shareholder transactions and the returns based on those NAVs may differ from the NAVs and returns reported in the Financial Highlights. |
| n | Industry classifications used in this report are generally according to the Global Industry Classification Standard, which was developed by and is the exclusive property and a service mark of MSCI Inc. and Standard & Poor’s. |
6 Invesco Floating Rate Fund
Average Annual Total Returns
As of 8/31/14, including maximum applicable sales charges
Class A Shares | ||||
Inception (5/1/97) | 4.21 | % | ||
10 Years | 4.02 | |||
5 Years | 6.69 | |||
1 Year | 1.74 | |||
Class C Shares | ||||
Inception (3/31/00) | 3.60 | % | ||
10 Years | 3.81 | |||
5 Years | 6.70 | |||
1 Year | 2.91 | |||
Class R Shares | ||||
10 Years | 4.10 | % | ||
5 Years | 6.98 | |||
1 Year | 4.18 | |||
Class Y Shares | ||||
10 Years | 4.42 | % | ||
5 Years | 7.49 | |||
1 Year | 4.69 | |||
Class R5 Shares | ||||
10 Years | 4.58 | % | ||
5 Years | 7.58 | |||
1 Year | 4.72 | |||
Class R6 Shares | ||||
10 Years | 4.36 | % | ||
5 Years | 7.36 | |||
1 Year | 4.66 | |||
On April 13, 2006, the Fund reorganized from a closed-end fund to an open-end fund. Performance shown for Class A shares prior to that date is that of the closed-end fund’s Class B shares and includes the management and 12b-1 fees applicable to B shares. The closed-end fund’s B-share performance reflects any applicable fee waivers or expense reimbursements.
On April 13, 2006, the Fund reorganized from a closed-end fund to an open-end fund. Performance shown for Class C shares prior to that date is that of the closed-end fund’s Class C shares and includes the management and 12b-1 fees applicable to C shares. The closed-end fund’s C-share performance reflects any applicable fee waivers or expense reimbursements.
Class R shares incepted on April 13, 2006. Performance shown prior to that date is that of Class A shares and includes the 12b-1 fees applicable to Class A shares. Class A share performance reflects any applicable fee waivers or expense reimbursements.
Average Annual Total Returns
As of 6/30/14, the most recent calendar quarter end, including maximum applicable sales charges
Class A Shares | ||||
Inception (5/1/97) | 4.24 | % | ||
10 Years | 4.07 | |||
5 Years | 7.90 | |||
1 Year | 2.56 | |||
Class C Shares | ||||
Inception (3/31/00) | 3.63 | % | ||
10 Years | 3.84 | |||
5 Years | 7.88 | |||
1 Year | 3.63 | |||
Class R Shares | ||||
10 Years | 4.13 | % | ||
5 Years | 8.10 | |||
1 Year | 4.76 | |||
Class Y Shares | ||||
10 Years | 4.45 | % | ||
5 Years | 8.68 | |||
1 Year | 5.28 | |||
Class R5 Shares | ||||
10 Years | 4.61 | % | ||
5 Years | 8.71 | |||
1 Year | 5.30 | |||
Class R6 Shares | ||||
10 Years | 4.39 | % | ||
5 Years | 8.56 | |||
1 Year | 5.50 | |||
Class Y shares incepted on October 3, 2008. Performance shown prior to that date is that of Class A shares and includes the 12b-1 fees applicable to Class A shares. Class A share performance reflects any applicable fee waivers or expense reimbursements.
Class R5 shares incepted on April 13, 2006. Performance shown prior to that date is that of Class A shares and includes the 12b-1 fees applicable to Class A shares. Class A share performance reflects any applicable fee waivers or expense reimbursements.
Class R6 shares incepted on September 24, 2012. Performance shown prior to that date is that of Class A shares and includes the 12b-1 fees applicable to Class A shares. Class A share performance reflects any applicable fee waivers or expense reimbursements.
The performance data quoted represent past performance and cannot guarantee comparable future results; current performance may be lower or higher. Please visit invesco.com/performance for the most recent month-end performance.
Performance figures reflect reinvested distributions, changes in net asset value and the effect of the maximum sales charge unless otherwise stated. Investment return and principal value will fluctuate so that you may have a gain or loss when you sell shares.
The net annual Fund operating expense ratio set forth in the most recent Fund prospectus as of the date of this report for Class A, Class C, Class R, Class Y, Class R5 and Class R6 shares was 1.10%, 1.60%, 1.35%, 0.85%, 0.83% and 0.76%, respectively.1 The total annual Fund operating expense ratio set forth in the most recent Fund prospectus as of the date of this report for Class A, Class C, Class R, Class Y, Class R5 and Class R6 shares was 1.11%, 1.61%, 1.36%, 0.86%, 0.84% and 0.77%, respectively.1 The expense ratios presented above may vary from the expense ratios presented in other sections of this report that are based on expenses incurred during the period covered by this report.
Class A share performance reflects the maximum 2.50% sales charge and Class C share performance reflects the applicable contingent deferred sales charge (CDSC) for the period involved. The CDSC on Class C shares is 1% for the first year after purchase. Class R, Class Y, Class R5 and Class R6 shares do not have a front-end sales charge or a CDSC; therefore, performance is at net asset value.
The performance of the Fund’s share classes will differ primarily due to different sales charge structures and class expenses.
Had the adviser not waived fees and/ or reimbursed expenses in the past, performance would have been lower.
| 1 | Total annual Fund operating expenses after any contractual fee waivers and/or expense reimbursements by the adviser in effect through at least June 30, 2016. See current prospectus for more information. |
7 Invesco Floating Rate Fund
Invesco Floating Rate Fund’s investment objective is total return, comprised of current income and capital appreciation.
| n | Unless otherwise stated, information presented in this report is as of August 31, 2014, and is based on total net assets. |
| n | Unless otherwise noted, all data provided by Invesco. |
| n | To access your Fund’s reports/prospectus, visit invesco.com/fundreports. |
About share classes
| n | As of the close of business on April 13, 2006, Invesco Floating Rate Fund reorganized from a closed-end fund to an open-end fund. Information presented for Class A shares prior to the reorganization includes financial data for Class B shares of the closed-end fund. Information presented for Class C shares prior to the reorganization includes financial data for Class C shares of the closed-end fund. |
| n | On July 27, 2006, all Class B1 shares converted into Class A shares. |
| n | Class R shares are generally available only to employer sponsored retirement and benefit plans. Please see the prospectus for more information. |
| n | Class Y shares are available only to certain investors. Please see the prospectus for more information. |
| n | Class R5 shares and Class R6 shares are primarily intended for employer sponsored retirement and benefit plans. that meet certain standards and for institutional investors. Please see the prospectus for more information. |
Principal risks of investing in the Fund
| n | Collateralized loan obligations risk. In addition to the normal interest rate, default and other risk of fixed income securities, collateralized loan obligations carry additional risks, including the possibility that distributions from collateral securities will not be adequate to make interest or other payments, the quality of the collateral may decline in value or default, the Fund may invest in collateralized loan obligations that are subordinate to other classes, values may be volatile, and disputes with the issuer may produce unexpected investment results. |
| n | Credit linked notes risk. Risks of credit linked notes include those risks associated with the underlying reference obligation including but not limited to market risk, interest rate risk, credit risk, default risk and foreign currency risk. In the case of a credit linked note created |
with credit default swaps, the structure will be “funded” such that the par amount of the security will represent the maximum loss that could be incurred on the investment and no leverage is introduced. An investor in a credit linked note bears counterparty risk or the risk that the issuer of the credit linked note will default or become bankrupt and not make timely payment of principal and interest of the structured security. |
| n | Credit risk. The issuer of instruments in which the Fund invests may be unable to meet interest and/or principal payments, thereby causing its instruments to decrease in value and lowering the issuer’s credit rating. |
| n | Defaulted securities risk. Defaulted securities involve the substantial risk that principal will not be repaid. Defaulted securities and any securities received in an exchange for such securities may be subject to restrictions on resale. |
| n | Derivatives risk. The value of a derivative instrument depends largely on (and is derived from) the value of an underlying security, currency, commodity, interest rate, index or other asset (each referred to as an underlying asset). In addition to risks relating to the underlying assets, the use of derivatives may include other, possibly greater, risks, including counterparty, leverage and liquidity risks. |
Counterparty risk is the risk that the counterparty to the derivative contract will default on its obligation to pay the Fund the amount owed or otherwise perform under the derivative contract. Derivatives create leverage risk because they do not require payment up front equal to the economic exposure created by owning the derivative. As a result, an adverse change in the value of the underlying asset could result in the Fund sustaining a loss that is substantially greater than the amount invested in the derivative, which may make the Fund’s returns more volatile and increase the risk of loss. Derivative instruments may also be less liquid
than more traditional investments and the Fund may be unable to sell or close out its derivative positions at a desirable time or price. This risk may be more acute under adverse market conditions, during which the Fund may be most in need of liquidating its derivative positions. Derivatives may also be harder to value, less tax efficient and subject to changing government regulation that could impact the Fund’s ability to use certain derivatives or their cost. Also, derivatives used for hedging or to gain or limit exposure to a particular market segment may not provide the expected benefits, particularly during adverse market conditions. |
| n | Floating rate risk. The Fund may invest in senior secured floating rate loans and debt securities that require collateral. There is a risk that the value of the collateral may not be sufficient to cover the amount owed, collateral securing a loan may be found invalid, and collateral may be used to pay other outstanding obligations of the borrower under applicable law or may be difficult to sell. There is also the risk that the collateral may be difficult to liquidate, or that a majority of the collateral may be illiquid. |
| n | Foreign securities risk. The Fund’s foreign investments may be affected by changes in a foreign country’s exchange rates, political and social instability, changes in economic or taxation policies, difficulties when enforcing obligations, decreased liquidity, and increased volatility. Foreign companies may be subject to less regulation resulting in less publicly available information about the companies. |
| n | High yield bond (junk bond) risk. Junk bonds involve a greater risk of default or price changes due to changes in the credit quality of the issuer. The values of junk bonds fluctuate more than those of high- quality bonds in response to company, political, regulatory or economic developments. Values of junk bonds can decline significantly over short periods of time. |
| n | Industry focus risk. To the extent a Fund invests in securities issued or guaranteed by companies in the banking and financial services industries, the Fund’s performance will depend on the overall condition of those industries, which may be affected by the following factors: the |
This report must be accompanied or preceded by a currently effective Fund prospectus, which contains more complete information, including sales charges and expenses. Investors should read it carefully before investing.
| ||||
NOT FDIC INSURED | MAY LOSE VALUE | NO BANK GUARANTEE | ||||
continued on page 6
8 Invesco Floating Rate Fund
Schedule of Investments
August 31, 2014
| Interest Rate | Maturity Date | Principal Amount (000) | Value | |||||||||||||
Variable Rate Senior Loan Interests–94.73%(a)(b) |
| |||||||||||||||
| Aerospace & Defense–1.96% | ||||||||||||||||
Aveos Fleet Performance Inc. (Canada), Second Lien Term Loan | 0.00 | % | 03/12/15 | $ | 390 | $ | 980 | |||||||||
Booz Allen Hamilton Inc., Term Loan B | 3.75 | % | 07/31/19 | 1,815 | 1,816,214 | |||||||||||
Camp International Holding Co., | ||||||||||||||||
First Lien Term Loan | 4.75 | % | 05/31/19 | 4,266 | 4,283,134 | |||||||||||
Second Lien Term Loan | 8.25 | % | 11/30/19 | 258 | 261,697 | |||||||||||
Consolidated Aerospace Manufacturing, LLC, Term Loan (Acquired 02/28/14; Cost $2,082,195) | 5.00 | % | 03/27/20 | 2,092 | 2,092,005 | |||||||||||
DAE Aviation Holdings, Inc., | ||||||||||||||||
Term Loan B-1 | 5.00 | % | 11/02/18 | 4,010 | 4,032,884 | |||||||||||
Term Loan B-2 | 5.00 | % | 11/02/18 | 1,432 | 1,439,649 | |||||||||||
DynCorp International Inc., Term Loan | 6.25 | % | 07/07/16 | 260 | 259,590 | |||||||||||
Element Materials Technology Group US Holdings Inc., Term Loan B | 5.25 | % | 08/06/21 | 1,502 | 1,506,188 | |||||||||||
IAP Worldwide Services, Inc., | ||||||||||||||||
Revolver Loan(d) | — | 07/18/18 | 877 | 881,069 | ||||||||||||
Second Lien Term Loan | 9.25 | % | 07/18/19 | 1,036 | 932,558 | |||||||||||
Landmark U.S. Holdings LLC, | ||||||||||||||||
Canadian Term Loan | 4.75 | % | 10/25/19 | 229 | 228,299 | |||||||||||
First Lien Term Loan | 4.75 | % | 10/25/19 | 5,757 | 5,751,852 | |||||||||||
PRV Aerospace, LLC, Term Loan | 6.50 | % | 05/09/18 | 1,884 | 1,887,080 | |||||||||||
Sequa Corp., Term Loan | 5.25 | % | 06/19/17 | 4,850 | 4,762,317 | |||||||||||
Transdigm Inc., | ||||||||||||||||
Term Loan C | 3.75 | % | 02/28/20 | 14,144 | 14,082,245 | |||||||||||
Term Loan D | 3.75 | % | 06/04/21 | 7,080 | 7,046,231 | |||||||||||
| 51,263,992 | ||||||||||||||||
| Air Transport–0.62% | ||||||||||||||||
American Airlines, Inc., Term Loan B | 3.75 | % | 06/27/19 | 4,084 | 4,066,070 | |||||||||||
Delta Air Lines, Inc., | ||||||||||||||||
Revolver Loan(e) | 0.00 | % | 04/20/16 | 7,785 | 7,609,867 | |||||||||||
Revolver Loan(e) | 0.00 | % | 10/18/17 | 1,145 | 1,116,236 | |||||||||||
United Continental Holdings, Inc., Term Loan B-1(d) | — | 09/15/21 | 3,362 | 3,361,788 | ||||||||||||
| 16,153,961 | ||||||||||||||||
| Automotive–4.61% | ||||||||||||||||
Affinia Group Inc., Term Loan B-2 | 4.75 | % | 04/27/20 | 1,396 | 1,404,988 | |||||||||||
American Tire Distributors, Inc., Term Loan | 5.75 | % | 06/01/18 | 6,482 | 6,505,967 | |||||||||||
August U.S. Holding Company, Inc., | ||||||||||||||||
First Lien Term Loan B-2 (Acquired 05/03/12-06/06/14; Cost $2,405,223) | 5.00 | % | 04/27/18 | 2,412 | 2,432,604 | |||||||||||
First Lien Term Loan B-2 (Acquired 05/03/12-06/06/14; Cost $1,966,744) | 5.00 | % | 04/27/18 | 1,968 | 1,985,071 | |||||||||||
Autoparts Holdings Ltd., First Lien Term Loan B-2 | 6.50 | % | 07/28/17 | 5,032 | 5,044,987 | |||||||||||
BBB Industries, LLC, Term Loan | 5.50 | % | 03/27/19 | 2,828 | 2,834,334 | |||||||||||
Dexter Axle Co., Term Loan | 4.50 | % | 02/28/20 | 3,344 | 3,320,762 | |||||||||||
Federal-Mogul Corp., Term Loan C | 4.75 | % | 04/15/21 | 36,601 | 36,581,004 | |||||||||||
Gates Global, LLC, Term Loan | 4.25 | % | 07/05/21 | 11,888 | 11,819,890 | |||||||||||
Goodyear Tire & Rubber Co., Second Lien Term Loan | 4.75 | % | 04/30/19 | 3,269 | 3,285,424 | |||||||||||
Henniges Automotive Holdings, Inc., Term Loan | 6.00 | % | 06/12/21 | 2,440 | 2,470,639 | |||||||||||
Key Safety Systems, Inc., Term Loan(d) | — | 08/29/21 | 3,107 | 3,120,747 | ||||||||||||
Metaldyne, LLC, Term Loan | 4.25 | % | 12/18/18 | 4,658 | 4,664,023 | |||||||||||
See accompanying Notes to Financial Statements which are an integral part of the financial statements.
9 Invesco Floating Rate Fund
| Interest Rate | Maturity Date | Principal Amount (000) | Value | |||||||||||||
| Automotive–(continued) | ||||||||||||||||
Schaeffler AG (Germany), Term Loan E | 3.75 | % | 05/15/20 | $ | 8,307 | $ | 8,303,511 | |||||||||
TI Group Automotive Systems, LLC, Term Loan | 4.25 | % | 07/01/21 | 13,642 | 13,642,298 | |||||||||||
Tower Automotive Holdings USA, LLC, Term Loan | 4.00 | % | 04/23/20 | 7,217 | 7,180,577 | |||||||||||
Transtar Holding Co., | ||||||||||||||||
First Lien Term Loan | 5.75 | % | 10/09/18 | 4,645 | 4,644,729 | |||||||||||
Second Lien Term Loan | 10.00 | % | 10/09/19 | 1,654 | 1,612,276 | |||||||||||
| 120,853,831 | ||||||||||||||||
| Beverage and Tobacco–0.32% | ||||||||||||||||
DS Services of America, Inc., Term Loan B | 5.25 | % | 08/30/20 | 4,853 | 4,883,751 | |||||||||||
Winebow Holdings, Inc., | ||||||||||||||||
First Lien Term Loan | 4.75 | % | 07/01/21 | 1,881 | 1,883,471 | |||||||||||
Second Lien Term Loan (Acquired 07/02/14; Cost $1,497,096) | 8.50 | % | 12/31/21 | 1,508 | 1,511,950 | |||||||||||
| 8,279,172 | ||||||||||||||||
| Building & Development–2.50% | ||||||||||||||||
ABC Supply Co., Inc., Term Loan B | 3.50 | % | 04/16/20 | 4,665 | 4,629,098 | |||||||||||
Capital Automotive L.P., | ||||||||||||||||
Second Lien Term Loan | 6.00 | % | 04/30/20 | 3,668 | 3,723,257 | |||||||||||
Term Loan B-1 | 4.00 | % | 04/10/19 | 4,002 | 4,002,140 | |||||||||||
HD Supply, Inc., Term Loan | 4.00 | % | 06/28/18 | 3,907 | 3,894,956 | |||||||||||
Lake at Las Vegas Joint Venture, LLC, | ||||||||||||||||
Exit Revolver Loan (Acquired 08/09/12; Cost $10,794)(e) | 0.00 | % | 02/28/17 | 11 | 3,265 | |||||||||||
PIK Exit Revolver Loan (Acquired 05/15/12-06/30/14; Cost $145,432)(f) | 4.65 | % | 02/28/17 | 145 | 43,993 | |||||||||||
Quikrete Holdings, Inc., | ||||||||||||||||
First Lien Term Loan | 4.00 | % | 09/28/20 | 10,686 | 10,643,641 | |||||||||||
Second Lien Term Loan | 7.00 | % | 03/26/21 | 1,651 | 1,675,229 | |||||||||||
Re/Max International, Inc., Term Loan | 4.00 | % | 07/31/20 | 3,878 | 3,876,197 | |||||||||||
Realogy Corp., | ||||||||||||||||
Revolver Loan(d) | — | 03/05/18 | 5,984 | 5,385,271 | ||||||||||||
Synthetic LOC | 4.42 | % | 10/10/16 | — | 293 | |||||||||||
Term Loan B | 3.75 | % | 03/05/20 | 26,563 | 26,488,793 | |||||||||||
United Subcontractors, Inc., Term Loan (Acquired 02/15/06-09/30/13; Cost $1,385,421) | 4.24 | % | 06/30/15 | 129 | 125,439 | |||||||||||
WireCo WorldGroup Inc., Term Loan | 6.00 | % | 02/15/17 | 1,135 | 1,139,438 | |||||||||||
| 65,631,010 | ||||||||||||||||
| Business Equipment & Services–10.90% | ||||||||||||||||
Accelya International S.A. (Luxembourg), | ||||||||||||||||
Term Loan A-1 (Acquired 03/06/14; Cost $2,703,950) | 5.08 | % | 03/06/20 | 2,716 | 2,699,415 | |||||||||||
Term Loan A-2 (Acquired 03/06/14; Cost $934,501) | 5.08 | % | 03/06/20 | 939 | 932,942 | |||||||||||
Acosta, Inc., Term Loan(d) | — | 08/15/21 | 7,882 | 7,932,124 | ||||||||||||
Asurion LLC, | ||||||||||||||||
Incremental Term Loan B-1 | 5.00 | % | 05/24/19 | 24,660 | 24,775,827 | |||||||||||
Incremental Term Loan B-2 | 4.25 | % | 07/08/20 | 22,331 | 22,306,387 | |||||||||||
Second Lien Term Loan | 8.50 | % | 03/03/21 | 29,705 | 30,752,480 | |||||||||||
AVSC Holding Corp., First Lien Term Loan | 4.50 | % | 01/24/21 | 6,466 | 6,472,908 | |||||||||||
Brickman Group Ltd. LLC, | ||||||||||||||||
First Lien Term Loan | 4.00 | % | 12/18/20 | 9,297 | 9,161,572 | |||||||||||
Second Lien Term Loan | 7.50 | % | 12/17/21 | 1,110 | 1,115,509 | |||||||||||
Brock Holdings III, Inc., First Lien Term Loan | 6.00 | % | 03/16/17 | 227 | 227,703 | |||||||||||
Caraustar Industries, Inc., Term Loan | 7.50 | % | 05/01/19 | 5,917 | 5,981,535 | |||||||||||
Checkout Holding Corp., | ||||||||||||||||
Second Lien Term Loan | 7.75 | % | 04/11/22 | 3,962 | 3,915,766 | |||||||||||
See accompanying Notes to Financial Statements which are an integral part of the financial statements.
10 Invesco Floating Rate Fund
| Interest Rate | Maturity Date | Principal Amount (000) | Value | |||||||||||||
| Business Equipment & Services–(continued) | ||||||||||||||||
Term Loan B | 4.50 | % | 04/09/21 | $ | 7,031 | $ | 6,932,090 | |||||||||
Connolly, LLC, | ||||||||||||||||
First Lien Term Loan | 5.00 | % | 05/14/21 | 6,663 | 6,713,433 | |||||||||||
Second Lien Term Loan | 8.00 | % | 05/14/22 | 3,931 | 3,965,199 | |||||||||||
Crossmark Holdings, Inc., | ||||||||||||||||
First Lien Term Loan | 4.50 | % | 12/20/19 | 5,633 | 5,593,088 | |||||||||||
Second Lien Term Loan | 8.75 | % | 12/21/20 | 576 | 573,070 | |||||||||||
Emdeon Inc., Term Loan B-2 | 3.75 | % | 11/02/18 | 1,643 | 1,636,293 | |||||||||||
Expert Global Solutions, Inc., First Lien Term Loan B | 8.50 | % | 04/03/18 | 10,626 | 10,647,616 | |||||||||||
First Data Corp., | ||||||||||||||||
Second Lien Term Loan | 3.66 | % | 09/24/18 | 4,547 | 4,516,015 | |||||||||||
Term Loan | 3.66 | % | 03/23/18 | 41,607 | 41,268,491 | |||||||||||
Term Loan | 4.16 | % | 03/24/21 | 373 | 372,608 | |||||||||||
Genesys Telecom Holdings, U.S., Inc., | ||||||||||||||||
Term Loan | 4.00 | % | 02/07/20 | 793 | 789,009 | |||||||||||
Term Loan 2 | 4.50 | % | 11/13/20 | 3,459 | 3,464,723 | |||||||||||
Hillman Group Inc. (The), Term Loan | 4.50 | % | 06/30/21 | 2,359 | 2,365,316 | |||||||||||
Information Resources, Inc., Term Loan | 4.75 | % | 09/30/20 | 3,807 | 3,815,215 | |||||||||||
Inmar, Inc., | ||||||||||||||||
Term Loan | 4.25 | % | 01/27/21 | 2,461 | 2,430,589 | |||||||||||
Second Lien Term Loan | 8.00 | % | 01/27/22 | 306 | 304,652 | |||||||||||
Karman Buyer Corp., | ||||||||||||||||
Delayed Draw Term Loan(d) | — | 07/23/21 | 303 | 300,466 | ||||||||||||
Second Lien Term Loan | 7.50 | % | 07/25/22 | 4,420 | 4,440,048 | |||||||||||
Term Loan | 4.25 | % | 07/23/21 | 9,088 | 9,013,979 | |||||||||||
Kronos Inc., | ||||||||||||||||
First Lien Incremental Term Loan | 4.50 | % | 10/30/19 | 11,147 | 11,178,044 | |||||||||||
Second Lien Term Loan | 9.75 | % | 04/30/20 | 1,711 | 1,768,150 | |||||||||||
Learning Care Group (US) No. 2 Inc., Term Loan | 5.50 | % | 05/05/21 | 2,672 | 2,683,508 | |||||||||||
Nuance Communications, Inc., Term Loan C | 2.91 | % | 08/07/19 | 6,121 | 6,034,643 | |||||||||||
Sensus USA, Inc., First Lien Term Loan | 4.75 | % | 05/09/17 | 3,691 | 3,698,235 | |||||||||||
ServiceMaster Co. (The), Term Loan | 4.25 | % | 07/01/21 | 6,657 | 6,617,794 | |||||||||||
SourceHOV LLC, | ||||||||||||||||
First Lien Term Loan B | 5.25 | % | 04/30/18 | 5,143 | 5,174,542 | |||||||||||
Second Lien Term Loan | 8.75 | % | 04/30/19 | 355 | 356,916 | |||||||||||
SunGard Data Systems Inc. | ||||||||||||||||
Term Loan C | 3.91 | % | 02/28/17 | 791 | 791,636 | |||||||||||
Term Loan E | 4.00 | % | 03/08/20 | 6,124 | 6,126,800 | |||||||||||
TNS Inc., | ||||||||||||||||
First Lien Term Loan | 5.00 | % | 02/14/20 | 2,767 | 2,774,210 | |||||||||||
Second Lien Term Loan (Acquired 02/14/13-02/28/14; Cost $259,898) | 9.00 | % | 08/14/20 | 262 | 261,165 | |||||||||||
Trans Union, LLC, | ||||||||||||||||
Revolver Loan(d) | — | 04/09/19 | 1,889 | 1,868,842 | ||||||||||||
Term Loan | 4.00 | % | 04/09/21 | 9,346 | 9,324,718 | |||||||||||
Wash MultiFamily Laundry Systems, LLC, Term Loan | 4.50 | % | 02/21/19 | 1,585 | 1,584,005 | |||||||||||
| 285,659,276 | ||||||||||||||||
| Cable & Satellite Television–3.65% | ||||||||||||||||
Charter Communications Operating, LLC, Term Loan G(d) | — | 08/15/21 | 12,628 | 12,724,850 | ||||||||||||
CSC Holdings, LLC, Term Loan B | 2.66 | % | 04/17/20 | 6,310 | 6,221,556 | |||||||||||
ION Media Networks, Inc., Term Loan | 5.00 | % | 12/18/20 | 10,671 | 10,730,904 | |||||||||||
See accompanying Notes to Financial Statements which are an integral part of the financial statements.
11 Invesco Floating Rate Fund
| Interest Rate | Maturity Date | Principal Amount (000) | Value | |||||||||||||
| Cable & Satellite Television–(continued) | ||||||||||||||||
MCC Iowa LLC, | ||||||||||||||||
Term Loan G | 4.00 | % | 01/20/20 | $ | 990 | $ | 984,356 | |||||||||
Term Loan H | 3.25 | % | 01/29/21 | 3,277 | 3,228,702 | |||||||||||
Term Loan J | 3.75 | % | 06/30/21 | 1,872 | 1,866,420 | |||||||||||
Mediacom Illinois LLC, | ||||||||||||||||
Term Loan E | 3.13 | % | 10/23/17 | 1,933 | 1,929,186 | |||||||||||
Term Loan G | 3.75 | % | 06/30/21 | 2,727 | 2,710,427 | |||||||||||
Quebecor Media Inc. (Canada), Term Loan B-1 | 3.25 | % | 08/17/20 | 2,492 | 2,456,168 | |||||||||||
Virgin Media Investment Holdings Ltd. (United Kingdom), Term Loan B | 3.50 | % | 06/07/20 | 14,076 | 13,908,324 | |||||||||||
WaveDivision Holdings, LLC, Term Loan | 4.00 | % | 10/15/19 | 1,856 | 1,851,135 | |||||||||||
WideOpenWest Finance, LLC, | ||||||||||||||||
Term Loan B | 4.75 | % | 04/01/19 | 8,337 | 8,374,573 | |||||||||||
Term Loan B-1 | 3.75 | % | 07/17/17 | 4,822 | 4,827,361 | |||||||||||
Ziggo B.V. (Netherlands), | ||||||||||||||||
Term Loan B-1 | 3.25 | % | 01/15/22 | 9,021 | 8,863,184 | |||||||||||
Term Loan B-2(e) | 0.00 | % | 01/15/22 | 499 | 490,013 | |||||||||||
Term Loan B-2 | 2.99 | % | 01/15/22 | 5,314 | 5,221,590 | |||||||||||
Term Loan B-3(d) | — | 01/15/22 | 9,560 | 9,393,547 | ||||||||||||
| 95,782,296 | ||||||||||||||||
| Chemicals & Plastics–4.66% | ||||||||||||||||
Allnex & Cy S.C.A., | ||||||||||||||||
Second Lien Term Loan | 8.25 | % | 04/03/20 | 49 | 50,057 | |||||||||||
Term Loan B-1 | 4.50 | % | 10/03/19 | 2,783 | 2,789,205 | |||||||||||
Term Loan B-2 | 4.50 | % | 10/03/19 | 1,444 | 1,447,184 | |||||||||||
Arysta LifeScience SPC, LLC, | ||||||||||||||||
First Lien Term Loan | 4.50 | % | 05/29/20 | 13,715 | 13,722,420 | |||||||||||
Second Lien Term Loan | 8.25 | % | 11/30/20 | 1,038 | 1,051,428 | |||||||||||
Ascend Performance Materials Operations LLC, Term Loan B | 6.75 | % | 04/10/18 | 4,400 | 4,350,677 | |||||||||||
Axalta Coating Systems Dutch Holding B B.V., Term Loan B | 3.75 | % | 02/01/20 | 7,978 | 7,944,110 | |||||||||||
Colouroz Investment LLC (Germany), | ||||||||||||||||
Term Loan B-2(d) | — | 05/03/21 | 6,307 | 6,309,150 | ||||||||||||
Term Loan B-2(d) | — | 05/02/22 | 3,449 | 3,462,975 | ||||||||||||
Term Loan B-5 | 5.38 | % | 12/31/16 | 721 | 727,489 | |||||||||||
Term Loan C(d) | — | 05/02/21 | 1,043 | 1,042,976 | ||||||||||||
Term Loan C-5 | 5.38 | % | 12/30/16 | 738 | 744,900 | |||||||||||
Chromaflo Technologies Corp., | ||||||||||||||||
First Lien Term Loan B | 4.50 | % | 12/02/19 | 2,172 | 2,168,209 | |||||||||||
Second Lien Term Loan | 8.25 | % | 05/30/20 | 815 | 815,093 | |||||||||||
Ferro Corp., Term Loan (Acquired 08/04/14; Cost $1,362,187) | 4.00 | % | 07/31/21 | 1,369 | 1,369,015 | |||||||||||
HII Holding Corp., First Lien Term Loan | 4.00 | % | 12/20/19 | 5,555 | 5,530,327 | |||||||||||
Huntsman International LLC, Incremental Term Loan | 3.75 | % | 08/12/21 | 18,700 | 18,668,497 | |||||||||||
Ineos Holdings Ltd., Term Loan | 3.75 | % | 05/04/18 | 14,294 | 14,227,164 | |||||||||||
Kronos Worldwide, Inc., Term Loan | 4.75 | % | 02/18/20 | 1,927 | 1,935,047 | |||||||||||
MacDermid, Inc., First Lien Term Loan B | 4.00 | % | 06/07/20 | 3,612 | 3,604,472 | |||||||||||
Momentive Performance Materials USA Inc., DIP Term Loan | 4.00 | % | 04/15/15 | 892 | 892,462 | |||||||||||
OMNOVA Solutions, Inc., Term Loan B-1 | 4.25 | % | 05/31/18 | 3,679 | 3,688,313 | |||||||||||
Otter Products, LLC, Term Loan B | 5.75 | % | 06/03/20 | 6,935 | 6,908,632 | |||||||||||
Oxea Finance LLC, | ||||||||||||||||
First Lien Term Loan B-2 | 4.25 | % | 01/15/20 | 4,587 | 4,583,908 | |||||||||||
Second Lien Term Loan | 8.25 | % | 07/15/20 | 1,557 | 1,568,219 | |||||||||||
Phillips-Medisize Corp., | ||||||||||||||||
Second Lien Term Loan | 8.25 | % | 06/16/22 | 788 | 791,567 | |||||||||||
Term Loan | 4.75 | % | 06/16/21 | 1,631 | 1,630,818 | |||||||||||
See accompanying Notes to Financial Statements which are an integral part of the financial statements.
12 Invesco Floating Rate Fund
| Interest Rate | Maturity Date | Principal Amount (000) | Value | |||||||||||||
| Chemicals & Plastics–(continued) | ||||||||||||||||
Tata Chemicals North America Inc., Term Loan | 3.75 | % | 08/07/20 | $ | 1,622 | $ | 1,609,969 | |||||||||
Univar Inc., Term Loan B | 5.00 | % | 06/30/17 | 3,948 | 3,959,470 | |||||||||||
WNA Holdings, Inc., | ||||||||||||||||
Second Lien Term Loan | 8.50 | % | 12/07/20 | 642 | 643,056 | |||||||||||
Term Loan | 4.50 | % | 06/05/20 | 2,332 | 2,329,542 | |||||||||||
Term Loan | 4.50 | % | 06/07/20 | 1,625 | 1,622,539 | |||||||||||
| 122,188,890 | ||||||||||||||||
| Clothing & Textiles–0.19% | ||||||||||||||||
ABG Intermediate Holdings 2 LLC, | ||||||||||||||||
First Lien Term Loan (Acquired 05/27/14; Cost $3,338,846) | 5.50 | % | 05/27/21 | 3,371 | 3,375,566 | |||||||||||
Second Lien Term Loan (Acquired 05/27/14; Cost $1,589,578) | 9.00 | % | 05/27/22 | 1,605 | 1,603,225 | |||||||||||
| 4,978,791 | ||||||||||||||||
| Conglomerates–0.65% | ||||||||||||||||
CeramTec Acquisition Corp., | ||||||||||||||||
Term Loan B-1 | 4.25 | % | 08/31/20 | 4,809 | 4,811,316 | |||||||||||
Term Loan B-2 | 4.25 | % | 08/28/20 | 477 | 477,056 | |||||||||||
Term Loan B-3 | 4.25 | % | 08/28/20 | 1,448 | 1,448,370 | |||||||||||
Epiq Systems, Inc., Term Loan | 4.25 | % | 08/27/20 | 4,406 | 4,411,161 | |||||||||||
Polymer Group, Inc., | ||||||||||||||||
Delayed Draw Incremental Term Loan(d) | — | 12/19/19 | 468 | 469,008 | ||||||||||||
Term Loan | 5.25 | % | 12/19/19 | 5,295 | 5,331,639 | |||||||||||
| 16,948,550 | ||||||||||||||||
| Containers & Glass Products–2.09% | ||||||||||||||||
Ardagh Glass Finance PLC, Term Loan | 4.00 | % | 12/17/19 | 5 | 4,481 | |||||||||||
Berlin Packaging, LLC, | ||||||||||||||||
First Lien Term Loan | 4.75 | % | 04/02/19 | 4,300 | 4,307,887 | |||||||||||
Second Lien Term Loan | 8.75 | % | 04/02/20 | 845 | 861,846 | |||||||||||
Berry Plastics Group, Inc., | ||||||||||||||||
Term Loan D | 3.50 | % | 02/08/20 | 15,298 | 15,047,466 | |||||||||||
Term Loan E | 3.75 | % | 01/06/21 | 2,658 | 2,628,149 | |||||||||||
BWAY Holding Company, Inc., Term Loan(d) | — | 08/14/20 | 9,313 | 9,378,749 | ||||||||||||
Consolidated Container Co. LLC, Term Loan | 5.00 | % | 07/03/19 | 1,364 | 1,366,673 | |||||||||||
Devix US, Inc., | ||||||||||||||||
First Lien Term Loan B | 4.25 | % | 05/02/21 | 1,871 | 1,875,341 | |||||||||||
Second Lien Term Loan | 8.00 | % | 05/02/22 | 1,248 | 1,252,444 | |||||||||||
Exopack Holdings S.A., Term Loan | 5.25 | % | 05/08/19 | 2,274 | 2,295,648 | |||||||||||
Hoffmaster Group, Inc., | ||||||||||||||||
First Lien Term Loan | 5.25 | % | 05/09/20 | 3,719 | 3,720,543 | |||||||||||
Second Lien Term Loan | 10.00 | % | 05/09/21 | 786 | 790,092 | |||||||||||
IBC Capital Ltd., | ||||||||||||||||
Second Lien Term Loan(d) | — | 01/01/22 | 1,422 | 1,426,017 | ||||||||||||
Term Loan(d) | — | 01/01/21 | 5,082 | 5,078,904 | ||||||||||||
Libbey Glass, Inc., Term Loan | 3.75 | % | 04/09/21 | 24 | 23,821 | |||||||||||
Ranpak Corp., | ||||||||||||||||
First Lien Term Loan | 4.50 | % | 04/23/19 | 551 | 550,727 | |||||||||||
Second Lien Term Loan | 8.50 | % | 04/23/20 | 650 | 662,853 | |||||||||||
Reynolds Group Holdings Inc., Incremental Term Loan | 4.00 | % | 12/01/18 | 1,623 | 1,622,581 | |||||||||||
TricorBraun Inc., Term Loan | 4.00 | % | 05/03/18 | 1,918 | 1,916,778 | |||||||||||
| 54,811,000 | ||||||||||||||||
See accompanying Notes to Financial Statements which are an integral part of the financial statements.
13 Invesco Floating Rate Fund
| Interest Rate | Maturity Date | Principal Amount (000) | Value | |||||||||||||
| Cosmetics & Toiletries–0.47% | ||||||||||||||||
Nice-Pak Products, Inc., Term Loan | 6.75 | % | 06/18/15 | $ | 432 | $ | 421,637 | |||||||||
Prestige Brands, Inc., Term Loan B-2(d) | — | 09/03/21 | 4,865 | 4,898,615 | ||||||||||||
Revlon Consumer Products Corp., Term Loan | 4.00 | % | 10/08/19 | 3,912 | 3,907,186 | |||||||||||
Vogue International Inc., Term Loan B | 5.25 | % | 02/14/20 | 3,126 | 3,137,237 | |||||||||||
| 12,364,675 | ||||||||||||||||
| Drugs–2.73% | ||||||||||||||||
BPA Laboratories, | ||||||||||||||||
First Lien Term Loan | 2.73 | % | 07/01/17 | 1,202 | 1,093,970 | |||||||||||
Second Lien Term Loan | 2.73 | % | 07/01/17 | 1,045 | 862,358 | |||||||||||
Catalent Pharma Solutions, Inc., Term Loan | 4.50 | % | 05/20/21 | 5,051 | 5,068,434 | |||||||||||
Grifols Worldwide Operations USA, Inc., Term Loan B | 3.16 | % | 02/27/21 | 16,112 | 16,024,637 | |||||||||||
Ikaria, Inc., First Lien Term Loan | 5.00 | % | 02/12/21 | 2,711 | 2,726,478 | |||||||||||
Millennium Laboratories, LLC, Term Loan B | 5.25 | % | 04/16/21 | 20,689 | 20,759,719 | |||||||||||
Quintiles Transnational Corp., Term Loan B-3 | 3.75 | % | 06/08/18 | 1,431 | 1,423,097 | |||||||||||
Salix Pharmaceuticals, Ltd., Term Loan | 4.25 | % | 01/02/20 | 797 | 799,578 | |||||||||||
Valeant Pharmaceuticals International, Inc. (Canada), | ||||||||||||||||
Series C-2 Term Loan B | 3.75 | % | 12/11/19 | 9,649 | 9,646,578 | |||||||||||
Series E-1 Term Loan B | 3.75 | % | 08/05/20 | 13,174 | 13,156,532 | |||||||||||
| 71,561,381 | ||||||||||||||||
| Ecological Services & Equipment–0.04% | ||||||||||||||||
WCA Waste Corp., Term Loan | 4.00 | % | 03/23/18 | 938 | 936,347 | |||||||||||
| Electronics & Electrical–6.19% | ||||||||||||||||
4L Technologies Inc., Term Loan | 5.50 | % | 05/08/20 | 9,615 | 9,651,769 | |||||||||||
Aeroflex Inc., Term Loan B-1 | 4.50 | % | 11/11/19 | 5,996 | 5,995,987 | |||||||||||
Blackboard Inc., Term Loan B-3 | 4.75 | % | 10/04/18 | 11,187 | 11,199,682 | |||||||||||
Blue Coat Systems, Inc., Term Loan | 4.00 | % | 05/31/19 | 1,373 | 1,364,229 | |||||||||||
BMC Software Finance, Inc., Term Loan | 5.00 | % | 09/10/20 | 1,552 | 1,549,942 | |||||||||||
DEI Sales, Inc., Term Loan | 5.75 | % | 07/13/17 | 1,956 | 1,886,182 | |||||||||||
Dell International LLC, Term Loan C | 3.75 | % | 10/29/18 | 16,523 | 16,500,468 | |||||||||||
Deltek, Inc., First Lien Term Loan | 4.50 | % | 10/10/18 | 11,269 | 11,265,181 | |||||||||||
Entegris, Inc., Term Loan B | 3.50 | % | 04/30/21 | 1,550 | 1,533,687 | |||||||||||
Fidji Luxembourg BC4 S.a r.l. (Luxembourg), Term Loan | 6.25 | % | 12/24/20 | 3,443 | 3,467,491 | |||||||||||
Freescale Semiconductor, Inc., | ||||||||||||||||
Term Loan B-4 | 4.25 | % | 02/28/20 | 18,675 | 18,638,152 | |||||||||||
Term Loan B-5 | 5.00 | % | 01/15/21 | 12,433 | 12,499,254 | |||||||||||
Infor (US), Inc., | ||||||||||||||||
Term Loan B-3 | 3.75 | % | 06/03/20 | 10,727 | 10,644,495 | |||||||||||
Term Loan B-5 | 3.75 | % | 06/03/20 | 1,722 | 1,711,334 | |||||||||||
Microsemi Corp., Incremental Term Loan | 3.51 | % | 02/19/20 | 971 | 968,486 | |||||||||||
Mirion Technologies, Inc., Term Loan | 5.75 | % | 03/30/18 | 2,753 | 2,759,537 | |||||||||||
MSC.Software Corp., | ||||||||||||||||
First Lien Term Loan | 5.00 | % | 05/29/20 | 1,622 | 1,622,305 | |||||||||||
Second Lien Term Loan | 8.50 | % | 05/31/21 | 803 | 803,619 | |||||||||||
Oberthur Technologies of America Corp., Term Loan B-2 | 4.50 | % | 10/18/19 | 1,885 | 1,891,183 | |||||||||||
Omnitracs, Inc., Term Loan | 4.75 | % | 11/25/20 | 4,911 | 4,921,206 | |||||||||||
Peak 10, Inc., | ||||||||||||||||
First Lien Term Loan | 5.00 | % | 06/17/21 | 1,327 | 1,335,690 | |||||||||||
Second Lien Term Loan (Acquired 06/18/14; Cost $779,949) | 8.25 | % | 06/17/22 | 788 | 789,598 | |||||||||||
RP Crown Parent, LLC, | ||||||||||||||||
First Lien Term Loan | 6.00 | % | 12/21/18 | 15,511 | 15,310,430 | |||||||||||
Second Lien Term Loan | 11.25 | % | 12/20/19 | 602 | 580,716 | |||||||||||
See accompanying Notes to Financial Statements which are an integral part of the financial statements.
14 Invesco Floating Rate Fund
| Interest Rate | Maturity Date | Principal Amount (000) | Value | |||||||||||||
| Electronics & Electrical–(continued) | ||||||||||||||||
Ship Luxco 3 S.a.r.l., (Luxembourg) | ||||||||||||||||
Term Loan | 4.50 | % | 11/30/19 | $ | 3,740 | $ | 3,749,440 | |||||||||
Term Loan B-2A-II | 5.25 | % | 11/29/19 | 1,486 | 1,497,391 | |||||||||||
Term Loan C-2 | 4.75 | % | 11/29/19 | 915 | 919,449 | |||||||||||
SkillSoft Corp., | ||||||||||||||||
Second Lien Term Loan | 7.75 | % | 04/28/22 | 2,784 | 2,733,423 | |||||||||||
Term Loan | 4.50 | % | 04/28/21 | 9,590 | 9,446,234 | |||||||||||
Sybil Software LLC, Term Loan | 4.75 | % | 03/20/20 | 4,059 | 4,069,209 | |||||||||||
Verint Systems Inc., Incremental Term Loan B | 3.50 | % | 09/06/19 | 795 | 794,371 | |||||||||||
| 162,100,140 | ||||||||||||||||
| Equipment Leasing–0.08% | ||||||||||||||||
Delos Finance S.a r.l., Term Loan | 3.50 | % | 03/06/21 | 2,182 | 2,171,710 | |||||||||||
| Financial Intermediaries–2.65% | ||||||||||||||||
Bankruptcy Management Solutions, Inc., Term Loan B (Acquired 06/27/13; Cost $21,121) | 7.00 | % | 06/27/18 | 23 | 18,720 | |||||||||||
Intertrust Group Holding B.V., (Netherlands) | ||||||||||||||||
Second Lien Term Loan 2 | 8.00 | % | 04/16/22 | 3,172 | 3,178,002 | |||||||||||
Term Loan B-5 | 4.48 | % | 04/16/21 | 1,746 | 1,745,301 | |||||||||||
iPayment Inc., Term Loan | 6.75 | % | 05/08/17 | 3,978 | 3,951,797 | |||||||||||
MIP Delaware, LLC, Term Loan B-1 | 4.00 | % | 03/09/20 | 930 | 930,372 | |||||||||||
MoneyGram International, Inc., Term Loan | 4.25 | % | 03/27/20 | 13,631 | 13,440,744 | |||||||||||
Nuveen Investments, Inc., First Lien Term Loan B | 4.16 | % | 05/15/17 | 29,700 | 29,684,011 | |||||||||||
RJO Holdings Corp., Term Loan | 6.91 | % | 12/10/15 | 1,623 | 1,578,163 | |||||||||||
SAM Finance Lux S.a r.l. (Luxembourg), Term Loan | 4.25 | % | 12/17/20 | 4,528 | 4,536,065 | |||||||||||
TMFS Holdings, LLC, Term Loan | 5.50 | % | 07/29/21 | 820 | 822,174 | |||||||||||
Transfirst Holdings, Inc., | ||||||||||||||||
First Lien Term Loan B-2 | 4.25 | % | 12/27/17 | 5,812 | 5,803,451 | |||||||||||
Second Lien Term Loan B-1 | 7.50 | % | 06/27/18 | 3,824 | 3,842,949 | |||||||||||
| 69,531,749 | ||||||||||||||||
| Food & Drug Retailers–1.12% | ||||||||||||||||
Albertson’s LLC, Term Loan B-4(d) | — | 08/25/21 | 14,604 | 14,661,425 | ||||||||||||
Pantry Inc. (The), Term Loan | 4.75 | % | 08/02/19 | 2,250 | 2,254,001 | |||||||||||
Rite Aid Corp., | ||||||||||||||||
Second Lien Term Loan 1 | 5.75 | % | 08/21/20 | 1,353 | 1,371,673 | |||||||||||
Term Loan 7 | 3.50 | % | 02/21/20 | 4,123 | 4,107,785 | |||||||||||
Supervalu Inc., Term Loan | 4.50 | % | 03/21/19 | 7,091 | 7,055,583 | |||||||||||
| 29,450,467 | ||||||||||||||||
| Food Products–3.72% | ||||||||||||||||
AdvancePierre Foods, Inc., | ||||||||||||||||
First Lien Term Loan | 5.75 | % | 07/10/17 | 10,691 | 10,754,053 | |||||||||||
Second Lien Term Loan | 9.50 | % | 10/10/17 | 524 | 513,182 | |||||||||||
Big Heart Pet Brands, Term Loan | 3.50 | % | 03/08/20 | 9,153 | 9,020,055 | |||||||||||
Candy Intermediate Holdings, Inc., Term Loan | 7.50 | % | 06/18/18 | 2,817 | 2,757,440 | |||||||||||
CSM Bakery Supplies LLC, | ||||||||||||||||
First Lien Term Loan | 5.00 | % | 07/03/20 | 9,458 | 9,437,493 | |||||||||||
Second Lien Term Loan(d) | — | 07/03/21 | 2,992 | 2,954,684 | ||||||||||||
Del Monte Foods, Inc., | ||||||||||||||||
First Lien Term Loan | 4.26 | % | 02/18/21 | 4,389 | 4,350,324 | |||||||||||
Second Lien Term Loan | 8.25 | % | 08/18/21 | 3,739 | 3,598,489 | |||||||||||
Diamond Foods, Inc., Term Loan | 4.25 | % | 08/20/18 | 1,373 | 1,366,994 | |||||||||||
See accompanying Notes to Financial Statements which are an integral part of the financial statements.
15 Invesco Floating Rate Fund
| Interest Rate | Maturity Date | Principal Amount (000) | Value | |||||||||||||
| Food Products–(continued) | ||||||||||||||||
Dole Food Co., Inc., Term Loan B | 4.50 | % | 11/01/18 | $ | 12,270 | $ | 12,255,094 | |||||||||
H.J. Heinz Co., Revolver Loan(e) | 0.00 | % | 06/07/18 | 10,581 | 10,492,412 | |||||||||||
Hearthside Group Holdings, LLC, | ||||||||||||||||
Revolver Loan(d) | — | 06/02/19 | 2,634 | 2,620,176 | ||||||||||||
Term Loan | 4.50 | % | 06/02/21 | 4,620 | 4,634,504 | |||||||||||
JBS USA, LLC, | ||||||||||||||||
Incremental Term Loan | 3.75 | % | 09/18/20 | 2,625 | 2,602,205 | |||||||||||
Term Loan | 3.75 | % | 05/25/18 | 6,906 | 6,863,301 | |||||||||||
New HB Acquisition, LLC, Term Loan B | 6.75 | % | 04/09/20 | 3,040 | 3,134,153 | |||||||||||
Oak Tea, Inc., Term Loan B(d) | — | 07/23/21 | 8,769 | 8,604,107 | ||||||||||||
QCE LLC, Term Loan(g) | 15.00 | % | 07/01/19 | 5 | 3,727 | |||||||||||
Shearer’s Foods, LLC, | ||||||||||||||||
First Lien Term Loan | 4.50 | % | 06/30/21 | 1,085 | 1,084,847 | |||||||||||
Second Lien Term Loan | 7.75 | % | 06/30/22 | 457 | 455,013 | |||||||||||
| 97,502,253 | ||||||||||||||||
| Food Service–1.72% | ||||||||||||||||
Aramark Corp., | ||||||||||||||||
LOC | 3.73 | % | 07/26/16 | 82 | 81,853 | |||||||||||
Term Loan F | 3.25 | % | 02/24/21 | 3,215 | 3,185,801 | |||||||||||
ARG IH Corp., Term Loan | 5.00 | % | 11/15/20 | 1,453 | 1,458,905 | |||||||||||
CEC Entertainment, Inc., Term Loan B | 4.25 | % | 02/14/21 | 1,609 | 1,596,819 | |||||||||||
Portillo’s Holdings, LLC, | ||||||||||||||||
First Lien Term Loan B(d) | — | 08/02/21 | 2,479 | 2,479,069 | ||||||||||||
Second Lien Term Loan(d) | — | 08/01/22 | 569 | 570,632 | ||||||||||||
Red Lobster Management LLC, Term Loan | 6.25 | % | 07/28/21 | 3,424 | 3,445,126 | |||||||||||
Restaurant Holding Co., LLC, First Lien Term Loan | 8.75 | % | 02/28/19 | 2,809 | 2,584,607 | |||||||||||
Seminole Hard Rock Entertainment, Inc., Term Loan | 3.50 | % | 05/14/20 | 1,911 | 1,889,816 | |||||||||||
Steak N’ Shake Operations, Inc., Term Loan | 4.75 | % | 03/19/21 | 2,489 | 2,494,631 | |||||||||||
US Foods, Inc., Incremental Term Loan | 4.50 | % | 03/31/19 | 15,973 | 15,968,386 | |||||||||||
Weight Watchers International, Inc., Term Loan B-2 | 4.00 | % | 04/02/20 | 11,756 | 9,287,740 | |||||||||||
| 45,043,385 | ||||||||||||||||
| Forest Products–0.34% | ||||||||||||||||
NewPage Corp., Term Loan B | 9.50 | % | 02/11/21 | 4,818 | 4,857,752 | |||||||||||
Xerium Technologies, Inc., Term Loan | 5.75 | % | 05/17/19 | 4,006 | 4,034,870 | |||||||||||
| 8,892,622 | ||||||||||||||||
| Health Care–5.88% | ||||||||||||||||
Accellent Inc., | ||||||||||||||||
Second Lien Term Loan | 7.50 | % | 03/11/22 | 2,122 | 2,080,697 | |||||||||||
Term Loan | 4.50 | % | 03/12/21 | 10,388 | 10,292,978 | |||||||||||
Alere Inc., Term Loan B | 4.25 | % | 06/30/17 | 3,352 | 3,347,397 | |||||||||||
ATI Holdings, Inc., Term Loan | 5.00 | % | 12/20/19 | 1,121 | 1,125,833 | |||||||||||
Biomet, Inc., Term Loan B-2 | 3.66 | % | 07/25/17 | 10,096 | 10,093,337 | |||||||||||
Carestream Health, Inc., First Lien Term Loan | 5.00 | % | 06/07/19 | 11,353 | 11,393,400 | |||||||||||
Community Health Systems, Inc., | ||||||||||||||||
Term Loan D | 4.25 | % | 01/27/21 | 11,216 | 11,260,958 | |||||||||||
Term Loan E | 3.48 | % | 01/25/17 | 5,659 | 5,663,301 | |||||||||||
DJO Finance LLC, Term Loan B | 4.25 | % | 09/15/17 | 13,432 | 13,448,487 | |||||||||||
Drumm Investors LLC, Term Loan | 6.75 | % | 05/04/18 | 806 | 811,828 | |||||||||||
Kindred Healthcare, Inc., Term Loan | 4.00 | % | 04/09/21 | 11,157 | 11,076,957 | |||||||||||
Kinetic Concepts, Inc., Term Loan E-1 | 4.00 | % | 05/04/18 | 26,908 | 26,845,758 | |||||||||||
See accompanying Notes to Financial Statements which are an integral part of the financial statements.
16 Invesco Floating Rate Fund
| Interest Rate | Maturity Date | Principal Amount (000) | Value | |||||||||||||
| Health Care–(continued) | ||||||||||||||||
Knowledge Universe Education LLC, Term Loan | 5.25 | % | 03/18/21 | $ | 2,344 | $ | 2,372,818 | |||||||||
MPH Acquisition Holdings LLC, Term Loan | 4.00 | % | 03/31/21 | 13,347 | 13,292,416 | |||||||||||
Ortho-Clinical Diagnostics, Inc., Term Loan | 4.75 | % | 06/30/21 | 7,981 | 7,996,514 | |||||||||||
Pharmaceutical Product Development, Inc., Term Loan | 4.00 | % | 12/05/18 | 654 | 655,205 | |||||||||||
Surgery Center Holdings, Inc., | ||||||||||||||||
Second Lien Term Loan(d) | — | 01/01/21 | 4,280 | 4,242,433 | ||||||||||||
Term Loan(d) | — | 01/01/20 | 3,105 | 3,108,822 | ||||||||||||
Surgical Care Affiliates, LLC, Incremental Term Loan C | 4.00 | % | 06/29/18 | 2,097 | 2,097,235 | |||||||||||
TriZetto Group, Inc., | ||||||||||||||||
Second Lien Term Loan | 8.50 | % | 03/28/19 | 1,968 | 1,992,779 | |||||||||||
Term Loan | 4.75 | % | 05/02/18 | 6,858 | 6,876,217 | |||||||||||
Western Dental Services, Inc., Term Loan | 6.00 | % | 11/01/18 | 4,101 | 4,119,623 | |||||||||||
| 154,194,993 | ||||||||||||||||
| Home Furnishings–0.32% | ||||||||||||||||
Britax Group Ltd., Term Loan | 4.50 | % | 10/15/20 | 1,791 | 1,531,189 | |||||||||||
Mattress Holding Corp., Term Loan B-2 | 3.66 | % | 01/18/16 | 929 | 928,865 | |||||||||||
Serta Simmons Holdings, LLC, Term Loan | 4.25 | % | 10/01/19 | 6,005 | 6,011,193 | |||||||||||
| 8,471,247 | ||||||||||||||||
| Industrial Equipment–3.05% | ||||||||||||||||
Accudyne Industries LLC, Term Loan | 4.00 | % | 12/13/19 | 2,679 | 2,673,367 | |||||||||||
Alliance Laundry Systems LLC, | ||||||||||||||||
First Lien Term Loan | 4.26 | % | 12/10/18 | 708 | 710,006 | |||||||||||
Second Lien Term Loan | 9.50 | % | 12/10/19 | 535 | 541,055 | |||||||||||
Apex Tool Group, LLC, Term Loan | 4.50 | % | 01/31/20 | 7,382 | 7,283,795 | |||||||||||
Capital Safety North America Holdings, Inc., First Lien Term Loan | 3.75 | % | 03/29/21 | 349 | 346,871 | |||||||||||
Carros US LLC, Term Loan(d) | — | 06/18/21 | 1,991 | 1,991,091 | ||||||||||||
Crosby US Acquisition Corp., | ||||||||||||||||
First Lien Term Loan | 3.75 | % | 11/23/20 | 6,815 | 6,797,771 | |||||||||||
Second Lien Term Loan | 7.00 | % | 11/22/21 | 1,620 | 1,633,089 | |||||||||||
Doncasters US Finance LLC, Term Loan B | 4.50 | % | 04/09/20 | 6,924 | 6,930,109 | |||||||||||
Doosan Infracore International, Inc., Term Loan B | 4.50 | % | 05/28/21 | 7,683 | 7,712,180 | |||||||||||
Filtration Group Corp., | ||||||||||||||||
First Lien Term Loan | 4.50 | % | 11/21/20 | 632 | 634,245 | |||||||||||
Second Lien Term Loan | 8.25 | % | 11/21/21 | 821 | 830,827 | |||||||||||
Gardner Denver, Inc., Term Loan | 4.25 | % | 07/30/20 | 4,506 | 4,507,181 | |||||||||||
Generac Power System, Inc., Term Loan B | 3.25 | % | 05/31/20 | 1,854 | 1,839,670 | |||||||||||
Grede Holdings LLC, Term Loan | 4.75 | % | 06/02/21 | 5,408 | 5,411,738 | |||||||||||
Husky Injection Molding Systems Ltd. (Canada), | ||||||||||||||||
Second Lien Term Loan | 7.25 | % | 06/30/22 | 753 | 756,491 | |||||||||||
Term Loan | 4.25 | % | 06/30/21 | 7,162 | 7,157,817 | |||||||||||
MX Holdings US, Inc., Term Loan B-1 | 4.50 | % | 08/14/20 | 3,351 | 3,364,553 | |||||||||||
North American Lifting Holdings, Inc., First Lien Term Loan | 5.50 | % | 11/27/20 | 3,879 | 3,910,272 | |||||||||||
Penn Engineering & Manufacturing Corp., Term Loan B(d) | — | 08/29/21 | 1,490 | 1,491,784 | ||||||||||||
Rexnord LLC/ RBS Global, Inc., Term Loan B | 4.00 | % | 08/21/20 | 8,331 | 8,294,003 | |||||||||||
Tank Holding Corp., Term Loan | 4.25 | % | 07/09/19 | 2,416 | 2,409,812 | |||||||||||
Unifrax Holding Co., Term Loan | 4.25 | % | 11/28/18 | 732 | 730,307 | |||||||||||
Virtuoso US LLC, Term Loan | 4.75 | % | 02/11/21 | 1,945 | 1,948,936 | |||||||||||
| 79,906,970 | ||||||||||||||||
See accompanying Notes to Financial Statements which are an integral part of the financial statements.
17 Invesco Floating Rate Fund
| Interest Rate | Maturity Date | Principal Amount (000) | Value | |||||||||||||
| Insurance–0.24% | ||||||||||||||||
Applied Systems, Inc., | ||||||||||||||||
Second Lien Term Loan | 7.50 | % | 01/23/22 | $ | 1,231 | $ | 1,243,845 | |||||||||
Term Loan | 4.25 | % | 01/25/21 | 1,965 | 1,964,368 | |||||||||||
Cooper Gay Swett & Crawford Ltd., | ||||||||||||||||
First Lien Term Loan | 5.00 | % | 04/16/20 | 1,930 | 1,809,442 | |||||||||||
Second Lien Term Loan | 8.25 | % | 10/16/20 | 1,300 | 1,176,239 | |||||||||||
| 6,193,894 | ||||||||||||||||
| Leisure Goods, Activities & Movies–3.17% | ||||||||||||||||
Alpha Topco Ltd., (United Kingdom) | ||||||||||||||||
Second Lien Term Loan(d) | — | 07/31/22 | 10,067 | 10,176,375 | ||||||||||||
Term Loan B-3 | 4.75 | % | 07/30/21 | 28,780 | 28,714,346 | |||||||||||
Bright Horizons Family Solutions, Inc., Term Loan B | 3.75 | % | 01/30/20 | 1,985 | 1,976,295 | |||||||||||
CWGS Group, LLC, Term Loan | 5.75 | % | 02/20/20 | 8,035 | 8,105,011 | |||||||||||
Dave & Buster’s, Inc., Term Loan | 4.50 | % | 07/25/20 | 1,368 | 1,367,887 | |||||||||||
Dorna Sports S.L. (Spain), Term Loan B | 4.33 | % | 04/30/21 | 2,447 | 2,471,682 | |||||||||||
Equinox Holdings Inc., | ||||||||||||||||
First Lien Term Loan | 4.25 | % | 01/31/20 | 2,804 | 2,798,324 | |||||||||||
Revolver Loan (Acquired 04/14/14-07/18/14; Cost $1,389,989)(e) | 0.00 | % | 02/01/18 | 1,493 | 1,384,769 | |||||||||||
Revolver Loan (Acquired 07/24/14; Cost $373,253) | 1.65 | % | 02/01/18 | 373 | 346,192 | |||||||||||
Fitness International, LLC, Term Loan B | 5.50 | % | 07/01/20 | 5,375 | 5,367,909 | |||||||||||
Live Nation Entertainment, Inc., Term Loan B-1 | 3.50 | % | 08/17/20 | 1,340 | 1,336,568 | |||||||||||
Merlin Entertainments Group Luxembourg 2 S.a.r.l. (Luxembourg), Term Loan B-1 | 3.37 | % | 06/28/19 | 3,882 | 3,883,784 | |||||||||||
Metro-Goldwyn-Mayer Inc., Second Lien Term Loan | 5.13 | % | 06/26/20 | 1,556 | 1,564,523 | |||||||||||
Outerstuff, LLC, Term Loan | 5.00 | % | 07/28/21 | 1,230 | 1,223,865 | |||||||||||
Performance Sports Group Ltd. (Canada), Term Loan | 4.00 | % | 04/15/21 | 2,262 | 2,259,011 | |||||||||||
Sabre Inc., Term Loan B | 4.00 | % | 02/19/19 | 9,224 | 9,197,915 | |||||||||||
Six Flags Theme Parks Inc., Term Loan B | 3.50 | % | 12/20/18 | 579 | 579,144 | |||||||||||
World Triathlon Corp., Term Loan (Acquired 06/27/14; Cost $420,796) | 5.25 | % | 06/26/21 | 423 | 423,565 | |||||||||||
| 83,177,165 | ||||||||||||||||
| Lodging & Casinos–3.36% | ||||||||||||||||
Belmond Interfin Ltd. (Bermuda), Term Loan | 4.00 | % | 03/21/21 | 2,359 | 2,347,535 | |||||||||||
Caesars Growth Properties Holdings, LLC, Term Loan B | 6.25 | % | 05/08/21 | 6,332 | 6,208,702 | |||||||||||
Cannery Casino Resorts, LLC, First Lien Term Loan | 6.00 | % | 10/02/18 | 2,730 | 2,739,874 | |||||||||||
ESH Hospitality, Inc., Term Loan | 5.00 | % | 06/24/19 | 3,859 | 3,902,358 | |||||||||||
Four Seasons Holdings Inc. (Canada), | ||||||||||||||||
First Lien Term Loan | 3.50 | % | 06/27/20 | 3,275 | 3,254,138 | |||||||||||
Second Lien Term Loan (Acquired 06/27/13-07/17/13; Cost $2,061,188) | 6.25 | % | 12/28/20 | 2,066 | 2,078,601 | |||||||||||
Great Wolf Resorts, Inc., Term Loan B | 4.25 | % | 08/06/20 | 5,064 | 5,060,302 | |||||||||||
Harrah’s Operating Co., Inc., Term Loan B-6 | 6.95 | % | 03/01/17 | 11,394 | 10,707,703 | |||||||||||
Hilton Worldwide Finance, LLC, Term Loan | 3.50 | % | 10/26/20 | 3,530 | 3,513,414 | |||||||||||
La Quinta Intermediate Holdings LLC, Term Loan | 4.00 | % | 04/14/21 | 10,619 | 10,623,015 | |||||||||||
MGM Resorts International, Term Loan B | 3.50 | % | 12/20/19 | 1,034 | 1,029,454 | |||||||||||
Scientific Games International, Inc., Term Loan | 4.25 | % | 10/18/20 | 26,147 | 25,858,666 | |||||||||||
Station Casinos LLC, Term Loan B | 4.25 | % | 03/02/20 | 797 | 795,184 | |||||||||||
Twin River Management Group, Inc., Term Loan | 5.25 | % | 07/10/20 | 6,298 | 6,321,756 | |||||||||||
Yonkers Racing Corp., | ||||||||||||||||
First Lien Term Loan | 4.25 | % | 08/16/19 | 3,431 | 3,243,754 | |||||||||||
Second Lien Term Loan | 8.75 | % | 08/20/20 | 392 | 355,705 | |||||||||||
| 88,040,161 | ||||||||||||||||
See accompanying Notes to Financial Statements which are an integral part of the financial statements.
18 Invesco Floating Rate Fund
| Interest Rate | Maturity Date | Principal Amount (000) | Value | |||||||||||||
| Nonferrous Metals & Minerals–0.89% | ||||||||||||||||
Alpha Natural Resources, Inc., Term Loan B | 3.50 | % | 05/22/20 | $ | 5,380 | $ | 5,112,540 | |||||||||
Arch Coal, Inc., Term Loan | 6.25 | % | 05/16/18 | 5,636 | 5,494,043 | |||||||||||
EP Minerals, LLC, Term Loan(d) | — | 08/20/20 | 887 | 896,041 | ||||||||||||
Noranda Aluminum Acquisition Corp., Term Loan B | 5.75 | % | 02/28/19 | 3,375 | 3,303,203 | |||||||||||
Walter Energy, Inc., Term Loan B | 7.25 | % | 04/02/18 | 8,913 | 8,496,169 | |||||||||||
| 23,301,996 | ||||||||||||||||
| Oil & Gas–6.39% | ||||||||||||||||
American Energy–Marcellus, LLC, | ||||||||||||||||
First Lien Term Loan | 5.25 | % | 08/04/20 | 3,730 | 3,745,351 | |||||||||||
Second Lien Term Loan | 8.50 | % | 08/04/21 | 999 | 1,008,941 | |||||||||||
Ameriforge Group Inc., First Lien Term Loan | 5.00 | % | 12/19/19 | 69 | 69,204 | |||||||||||
Atlas Energy, L.P., Term Loan | 6.50 | % | 07/31/19 | 3,688 | 3,734,273 | |||||||||||
Bronco Midstream Funding, LLC, Term Loan | 5.00 | % | 08/17/20 | 6,555 | 6,591,634 | |||||||||||
Citgo Petroleum Corp., Term Loan B | 4.50 | % | 07/29/21 | 2,041 | 2,052,019 | |||||||||||
Crestwood Holdings LLC, Term Loan B-1 | 7.00 | % | 06/19/19 | 4,119 | 4,199,517 | |||||||||||
Drillships Financing Holding Inc., Term Loan B-1 | 6.00 | % | 03/31/21 | 21,725 | 21,851,570 | |||||||||||
Drillships Ocean Ventures Inc., Term Loan | 5.50 | % | 07/25/21 | 7,610 | 7,655,549 | |||||||||||
EMG Utica, LLC, Term Loan | 4.75 | % | 03/27/20 | 2,761 | 2,768,285 | |||||||||||
Expro Holdings UK 3 Ltd., Term Loan(d) | — | 09/02/21 | 5,524 | 5,547,011 | ||||||||||||
Fieldwood Energy LLC, | ||||||||||||||||
Second Lien Term Loan | 8.38 | % | 09/30/20 | 7,465 | 7,651,585 | |||||||||||
Term Loan | 3.88 | % | 09/28/18 | 6,840 | 6,830,798 | |||||||||||
Floatel International Ltd., Term Loan | 6.00 | % | 06/27/20 | 5,728 | 5,756,554 | |||||||||||
Glenn Pool Oil & Gas Trust I, Term Loan (Acquired 06/08/11; Cost $604,542) | 4.50 | % | 05/02/16 | 605 | 610,588 | |||||||||||
HGIM Corp., Term Loan B | 5.50 | % | 06/18/20 | 7,001 | 7,009,350 | |||||||||||
Jonah Energy LLC, Second Lien Term Loan | 7.50 | % | 05/12/21 | 3,530 | 3,547,912 | |||||||||||
McDermott International, Inc., Term Loan | 5.25 | % | 04/16/19 | 2,405 | 2,430,932 | |||||||||||
NGPL PipeCo LLC, Term Loan | 6.75 | % | 09/15/17 | 4,933 | 4,944,370 | |||||||||||
Obsidian Natural Gas Trust (United Kingdom), Term Loan | 7.00 | % | 11/02/15 | 591 | 595,668 | |||||||||||
Osum Production Corp. (Canada), Term Loan | 6.50 | % | 07/28/20 | 2,159 | 2,153,608 | |||||||||||
Pacific Drilling S.A. (Luxembourg), Term Loan | 4.50 | % | 06/04/18 | 3,897 | 3,902,481 | |||||||||||
Paragon Offshore Finance Co. (Cayman Islands), Term Loan | 3.75 | % | 07/18/21 | 2,557 | 2,531,855 | |||||||||||
Petroleum Geo-Services ASA, Term Loan | 3.25 | % | 03/19/21 | 4,808 | 4,710,750 | |||||||||||
Samson Investment Co., Second Lien Term Loan | 5.00 | % | 09/25/18 | 5,609 | 5,564,164 | |||||||||||
Seadrill Operating LP, Term Loan | 4.00 | % | 02/21/21 | 26,491 | 26,104,998 | |||||||||||
Seventy Seven Operating LLC, Term Loan | 3.75 | % | 06/25/21 | 1,340 | 1,342,416 | |||||||||||
Southcross Energy Partners, L.P., Term Loan(d) | — | 08/04/21 | 1,902 | 1,917,633 | ||||||||||||
Tallgrass Operations, LLC, Term Loan | 4.25 | % | 11/13/18 | 6,665 | 6,688,112 | |||||||||||
Tervita Corp. (Canada), Term Loan | 6.25 | % | 05/15/18 | 8,318 | 8,351,333 | |||||||||||
Utex Industries, Inc., | ||||||||||||||||
First Lien Term Loan | 5.00 | % | 05/22/21 | 1,995 | 2,000,236 | |||||||||||
Second Lien Term Loan | 8.25 | % | 05/22/22 | 786 | 801,884 | |||||||||||
Western Refining, Inc., Term Loan | 4.25 | % | 11/12/20 | 2,749 | 2,749,795 | |||||||||||
| 167,420,376 | ||||||||||||||||
| Publishing–3.17% | ||||||||||||||||
Chesapeake US Holdings Inc., | ||||||||||||||||
Term Loan A | 4.25 | % | 09/30/20 | 1,570 | 1,569,252 | |||||||||||
Term Loan B | 4.25 | % | 09/30/20 | 4,354 | 4,351,028 | |||||||||||
See accompanying Notes to Financial Statements which are an integral part of the financial statements.
19 Invesco Floating Rate Fund
| Interest Rate | Maturity Date | Principal Amount (000) | Value | |||||||||||||
| Publishing–(continued) | ||||||||||||||||
Getty Images, Inc., | ||||||||||||||||
Revolver Loan(e) | 0.00 | % | 10/18/17 | $ | 4,889 | $ | 4,302,146 | |||||||||
Revolver Loan(d) | — | 10/18/17 | 2,088 | 1,837,625 | ||||||||||||
Term Loan | 4.75 | % | 10/18/19 | 5,472 | 5,189,015 | |||||||||||
Harland Clarke Holdings Corp., | ||||||||||||||||
Term Loan B-2 | 5.48 | % | 06/30/17 | 330 | 331,331 | |||||||||||
Term Loan B-4 | 6.00 | % | 08/04/19 | 1,430 | 1,449,060 | |||||||||||
Interactive Data Corp., Term Loan | 4.75 | % | 05/02/21 | 12,674 | 12,731,769 | |||||||||||
Media General, Inc., Term Loan B | 4.25 | % | 07/31/20 | 4,235 | 4,253,287 | |||||||||||
MediMedia USA, Inc., First Lien Term Loan | 8.00 | % | 11/20/18 | 5,549 | 5,451,480 | |||||||||||
Merrill Communications LLC, Term Loan | 5.75 | % | 03/08/18 | 5,281 | 5,347,479 | |||||||||||
MTL Publishing LLC, Term Loan B-2 | 3.75 | % | 06/29/18 | 3,429 | 3,410,635 | |||||||||||
Newsday, LLC, Term Loan | 3.66 | % | 10/12/16 | 3,615 | 3,624,720 | |||||||||||
ProQuest LLC, Term Loan | 6.00 | % | 04/13/18 | 1,774 | 1,781,736 | |||||||||||
Southern Graphics Inc., Term Loan | 4.25 | % | 10/17/19 | 4,355 | 4,355,070 | |||||||||||
Tribune Co., Term Loan | 4.00 | % | 12/27/20 | 23,164 | 23,172,635 | |||||||||||
| 83,158,268 | ||||||||||||||||
| Radio & Television–3.14% | ||||||||||||||||
Clear Channel Communications, Inc., | ||||||||||||||||
Term Loan B | 3.81 | % | 01/29/16 | 361 | 359,575 | |||||||||||
Term Loan D | 6.91 | % | 01/30/19 | 35,662 | 35,223,756 | |||||||||||
Term Loan E | 7.66 | % | 07/30/19 | 6,670 | 6,665,313 | |||||||||||
Entravision Communications Corp., Term Loan B | 3.50 | % | 05/29/20 | 5,880 | 5,810,210 | |||||||||||
Gray Television, Inc., Term Loan | 3.75 | % | 06/10/21 | 2,920 | 2,912,236 | |||||||||||
Lin Television Corp., Term Loan | 4.00 | % | 12/21/18 | 643 | 641,524 | |||||||||||
Mission Broadcasting, Inc., Term Loan B-2 | 3.75 | % | 10/01/20 | 638 | 632,771 | |||||||||||
NEP/NCP HoldCo, Inc., | ||||||||||||||||
Incremental Term Loan | 4.25 | % | 01/22/20 | 3,510 | 3,494,941 | |||||||||||
Second Lien Term Loan | 9.50 | % | 07/22/20 | 132 | 134,558 | |||||||||||
Nexstar Broadcasting, Inc., Term Loan B-2 | 3.75 | % | 10/01/20 | 723 | 717,572 | |||||||||||
TWCC Holding Corp., | ||||||||||||||||
Second Lien Term Loan | 7.00 | % | 06/26/20 | 7,922 | 7,839,924 | |||||||||||
Term Loan | 3.50 | % | 02/13/17 | 12,280 | 12,156,633 | |||||||||||
Univision Communications Inc., First Lien Term Loan | 4.00 | % | 03/01/20 | 5,611 | 5,586,112 | |||||||||||
| 82,175,125 | ||||||||||||||||
| Retailers (except Food & Drug)–5.30% | ||||||||||||||||
Academy, Ltd., Term Loan | 4.50 | % | 08/03/18 | 2,253 | 2,252,699 | |||||||||||
CDW LLC, Term Loan | 3.25 | % | 04/29/20 | 4,321 | 4,274,424 | |||||||||||
David’s Bridal, Inc., | ||||||||||||||||
Asset-Based Revolver Loan(e) | 0.00 | % | 10/11/17 | 1,573 | 1,462,593 | |||||||||||
Term Loan | 5.00 | % | 10/11/19 | 6,948 | 6,823,503 | |||||||||||
J. Crew Group, Inc., Term Loan | 4.00 | % | 03/05/21 | 6,900 | 6,782,464 | |||||||||||
J.C. Penney Corp., Inc., Term Loan | 5.00 | % | 06/20/19 | 2,550 | 2,555,534 | |||||||||||
Lands’ End, Inc., Term Loan B | 4.25 | % | 04/02/21 | 4,906 | 4,875,340 | |||||||||||
Leonardo Acquisition Corp., Term Loan | 4.25 | % | 01/31/21 | 1,805 | 1,794,251 | |||||||||||
Men’s Wearhouse, Inc., (The), Term Loan B | 4.50 | % | 06/18/21 | 9,603 | 9,652,689 | |||||||||||
Michaels Stores, Inc., Incremental Term Loan | 4.00 | % | 01/28/20 | 6,095 | 6,072,635 | |||||||||||
National Vision, Inc., First Lien Term Loan | 4.00 | % | 03/12/21 | 3,703 | 3,650,412 | |||||||||||
Nine West Holdings, Inc., Term Loan | 4.75 | % | 10/08/19 | 3,432 | 3,444,770 | |||||||||||
OSP Group, Inc., First Lien Term Loan | 4.50 | % | 03/18/21 | 4,306 | 4,305,512 | |||||||||||
See accompanying Notes to Financial Statements which are an integral part of the financial statements.
20 Invesco Floating Rate Fund
| Interest Rate | Maturity Date | Principal Amount (000) | Value | |||||||||||||
| Retailers (except Food & Drug)–(continued) | ||||||||||||||||
Payless Inc., | ||||||||||||||||
Second Lien Term Loan | 8.50 | % | 03/11/22 | $ | 2,178 | $ | 2,164,942 | |||||||||
Term Loan | 5.00 | % | 03/11/21 | 7,178 | 7,164,657 | |||||||||||
Pep Boys–Manny, Moe & Jack, Term Loan | 4.25 | % | 10/11/18 | 1,463 | 1,460,374 | |||||||||||
Pier 1 Imports (U.S.), Inc., Term Loan | 4.50 | % | 04/30/21 | 1,980 | 1,978,791 | |||||||||||
Savers Inc., Term Loan | 5.00 | % | 07/09/19 | 4,866 | 4,879,251 | |||||||||||
Sears Roebuck Acceptance Corp., Term Loan | 5.50 | % | 06/30/18 | 24,898 | 24,938,266 | |||||||||||
Spin Holdco Inc., First Lien Term Loan | 4.25 | % | 11/14/19 | 22,146 | 22,015,496 | |||||||||||
Toys ‘R’ US Property Co. I, LLC, Term Loan | 6.00 | % | 08/21/19 | 12,901 | 12,425,614 | |||||||||||
Toys ‘R’ US-Delaware, Inc., | ||||||||||||||||
Term Loan | 6.00 | % | 09/01/16 | 1,902 | 1,787,371 | |||||||||||
Term Loan B-2 | 5.25 | % | 05/25/18 | 396 | 335,651 | |||||||||||
Term Loan B-3 | 5.25 | % | 05/25/18 | 115 | 97,381 | |||||||||||
Wilton Brands LLC, Term Loan B | 7.50 | % | 08/30/18 | 1,848 | 1,757,834 | |||||||||||
| 138,952,454 | ||||||||||||||||
| Steel–0.36% | ||||||||||||||||
JFB Firth Rixson Inc., Term Loan | 4.25 | % | 06/30/17 | 663 | 663,746 | |||||||||||
JMC Steel Group Inc., Term Loan | 4.75 | % | 04/03/17 | 1,076 | 1,074,868 | |||||||||||
TMS International Corp., Term Loan B | 4.50 | % | 10/16/20 | 3,373 | 3,376,254 | |||||||||||
Waupaca Foundry, Inc., Term Loan | 4.00 | % | 06/29/17 | 4,325 | 4,327,338 | |||||||||||
| 9,442,206 | ||||||||||||||||
| Surface Transport–0.96% | ||||||||||||||||
Hertz Corp. (The), LOC | 3.75 | % | 03/09/18 | 552 | 544,694 | |||||||||||
Navios Partners Finance (US) Inc., Term Loan | 5.25 | % | 06/27/18 | 8,119 | 8,224,091 | |||||||||||
Stena International S.A. (Luxembourg), Term Loan | 4.00 | % | 03/03/21 | 8,191 | 8,176,039 | |||||||||||
Swift Transportation Co., LLC, Term Loan B | 3.75 | % | 06/09/21 | 1,981 | 1,982,548 | |||||||||||
U.S. Shipping Corp., Term Loan B-1(d) | — | 04/30/18 | 4,171 | 4,217,893 | ||||||||||||
Vouvray US Finance LLC, | ||||||||||||||||
Second Lien Term Loan | 8.50 | % | 12/27/21 | 1,070 | 1,071,364 | |||||||||||
Term Loan | 5.00 | % | 06/27/21 | 939 | 941,947 | |||||||||||
| 25,158,576 | ||||||||||||||||
| Telecommunications–5.41% | ||||||||||||||||
Arris Enterprises, Inc., Term Loan B | 3.25 | % | 04/17/20 | 160 | 159,036 | |||||||||||
Avaya Inc., | ||||||||||||||||
Term Loan B-3 | 4.66 | % | 10/26/17 | 29,544 | 28,725,541 | |||||||||||
Term Loan B-6 | 6.50 | % | 03/30/18 | 4,213 | 4,234,034 | |||||||||||
Consolidated Communications, Inc., Term Loan | 4.25 | % | 12/23/20 | 15,239 | 15,289,338 | |||||||||||
Fairpoint Communications, Inc., Term Loan | 7.50 | % | 02/14/19 | 9,402 | 9,607,909 | |||||||||||
Hargray Communications Group, Inc., Term Loan | 4.75 | % | 06/26/19 | 2,411 | 2,424,406 | |||||||||||
Intelsat Jackson Holdings S.A., Term Loan B-2 | 3.75 | % | 06/30/19 | 10,787 | 10,751,059 | |||||||||||
Level 3 Communications, Inc., | ||||||||||||||||
Term Loan B | 4.00 | % | 01/15/20 | 20,559 | 20,500,992 | |||||||||||
Term Loan B-III | 4.00 | % | 08/01/19 | 428 | 427,315 | |||||||||||
LTS Buyer LLC, Second Lien Term Loan | 8.00 | % | 04/12/21 | 82 | 83,029 | |||||||||||
Nextgen Finance, LLC, Term Loan B | 5.00 | % | 05/31/21 | 5,764 | 5,724,394 | |||||||||||
NTELOS Inc., Term Loan B | 5.75 | % | 11/08/19 | 6,601 | 6,630,157 | |||||||||||
Syniverse Holdings, Inc., Term Loan | 4.00 | % | 04/23/19 | 9,263 | 9,184,057 | |||||||||||
Telesat LLC, Term Loan B-2 | 3.50 | % | 03/28/19 | 1,266 | 1,258,328 | |||||||||||
U.S. TelePacific Corp., Term Loan | 5.75 | % | 02/23/17 | 5,581 | 5,595,431 | |||||||||||
Windstream Corp., Term Loan B-5 | 3.50 | % | 08/08/19 | 995 | 998,005 | |||||||||||
See accompanying Notes to Financial Statements which are an integral part of the financial statements.
21 Invesco Floating Rate Fund
| Interest Rate | Maturity Date | Principal Amount (000) | Value | |||||||||||||
| Telecommunications–(continued) | ||||||||||||||||
XO Communications, LLC, Term Loan | 4.25 | % | 03/17/21 | $ | 2,604 | $ | 2,601,312 | |||||||||
Yankee Cable Acquisition, LLC, Term Loan | 4.50 | % | 03/02/20 | 3,910 | 3,920,684 | |||||||||||
Zayo Group, LLC, Term Loan | 4.00 | % | 07/02/19 | 13,717 | 13,689,097 | |||||||||||
| 141,804,124 | ||||||||||||||||
| Utilities–1.88% | ||||||||||||||||
Calpine Construction Finance Co., L.P., | ||||||||||||||||
Term Loan B-1 | 3.00 | % | 05/03/20 | 2,184 | 2,143,982 | |||||||||||
Term Loan B-2 | 3.25 | % | 01/31/22 | 6,213 | 6,120,824 | |||||||||||
Calpine Corp., | ||||||||||||||||
Term Loan | 4.00 | % | 04/01/18 | 42 | 42,474 | |||||||||||
Term Loan | 4.00 | % | 10/09/19 | 8,772 | 8,777,354 | |||||||||||
Term Loan B | 4.00 | % | 10/30/20 | 1,018 | 1,016,712 | |||||||||||
Dynegy Inc., Term Loan B-2 | 4.00 | % | 04/23/20 | 4,505 | 4,507,255 | |||||||||||
EquiPower Resources Holdings, LLC, | ||||||||||||||||
First Lien Term Loan B | 4.25 | % | 12/21/18 | 6,058 | 6,062,065 | |||||||||||
First Lien Term Loan C | 4.25 | % | 12/31/19 | 3,291 | 3,293,686 | |||||||||||
NSG Holdings LLC, Term Loan | 3.75 | % | 12/11/19 | 863 | 856,434 | |||||||||||
Texas Competitive Electric Holdings Co. LLC, | ||||||||||||||||
PIK Term Loan(f)(g) | 4.65 | % | 10/10/14 | 5,052 | 3,924,263 | |||||||||||
Term Loan(g) | 4.65 | % | 10/10/17 | 10,167 | 7,900,108 | |||||||||||
USIC Holding, Inc., First Lien Term Loan | 4.00 | % | 07/10/20 | 4,612 | 4,589,251 | |||||||||||
| 49,234,408 | ||||||||||||||||
Total Variable Rate Senior Loan Interests | 2,482,737,461 | |||||||||||||||
| Structured Products–4.06% | ||||||||||||||||
Apidos Cinco CDO(h)(i) | 4.48 | % | 05/14/20 | 345 | 336,915 | |||||||||||
Apidos CLO IX(h)(i) | 6.73 | % | 07/15/23 | 3,083 | 3,090,936 | |||||||||||
Apidos CLO X(h)(i) | 6.47 | % | 10/30/22 | 2,190 | 2,193,114 | |||||||||||
Apidos CLO X(h)(i) | 6.49 | % | 10/30/22 | 3,367 | 3,371,788 | |||||||||||
Apidos CLO XI(h)(i) | 5.48 | % | 01/17/23 | 2,070 | 1,959,379 | |||||||||||
Apidos CLO XV(h)(i) | 4.98 | % | 10/20/25 | 6,500 | 5,943,769 | |||||||||||
Apidos Quattro CDO(h)(i) | 3.83 | % | 01/20/19 | 408 | 401,931 | |||||||||||
Ares XI CLO, Ltd.(h)(i) | 3.23 | % | 10/11/21 | 724 | 700,382 | |||||||||||
Atrium IV CDO Corp.(i) | 9.18 | % | 06/08/19 | 205 | 215,635 | |||||||||||
Atrium X CDO(h)(i) | 4.73 | % | 07/16/25 | 3,742 | 3,363,695 | |||||||||||
Babson CLO Ltd. 2007-I(h)(i) | 3.48 | % | 01/18/21 | 1,034 | 975,611 | |||||||||||
Babson CLO Ltd. 2013-II(h)(i) | 4.73 | % | 01/18/25 | 6,540 | 5,886,314 | |||||||||||
Carlyle Global Market Strategies 2012-3(h)(i) | 5.73 | % | 10/14/24 | 3,188 | 3,135,465 | |||||||||||
Carlyle Global Market Strategies 2013-1(h)(i) | 5.73 | % | 02/14/25 | 3,200 | 3,070,870 | |||||||||||
Carlyle High Yield Partners 2007-10(h)(i) | 3.43 | % | 04/19/22 | 1,400 | 1,292,816 | |||||||||||
Columbus Nova CLO Ltd.(h)(i) | 3.83 | % | 05/16/19 | 429 | 418,097 | |||||||||||
Columbus Nova CLO Ltd.(h)(i) | 3.83 | % | 05/16/19 | 1,093 | 1,065,223 | |||||||||||
Dryden Senior Loan Fund 2013-30(h)(i) | 5.22 | % | 10/15/25 | 3,276 | 3,035,535 | |||||||||||
Dryden Senior Loan Fund 2014-34 (Acquired 07/21/14; Cost $911,181)(h)(i) | 5.03 | % | 10/15/26 | 1,000 | 911,061 | |||||||||||
Duane Street CLO 2007-4(h)(i) | 4.48 | % | 11/14/21 | 1,764 | 1,722,638 | |||||||||||
Flagship CLO VI(h)(i) | 4.99 | % | 06/10/21 | 987 | 974,093 | |||||||||||
Flagship CLO VI(h)(i) | 4.99 | % | 06/10/21 | 3,254 | 3,212,234 | |||||||||||
Four Corners CLO II, Ltd.(h)(i) | 2.08 | % | 01/26/20 | 103 | 100,246 | |||||||||||
Four Corners CLO II, Ltd.(h)(i) | 2.08 | % | 01/26/20 | 310 | 301,712 | |||||||||||
Halcyon Loan Investors CLO II, Ltd.(h)(i) | 3.83 | % | 04/24/21 | 917 | 866,006 | |||||||||||
See accompanying Notes to Financial Statements which are an integral part of the financial statements.
22 Invesco Floating Rate Fund
| Interest Rate | Maturity Date | Principal Amount (000) | Value | |||||||||||||
| Structured Products–(continued) | ||||||||||||||||
ING Investment Management CLO 2012-3, Ltd.(h)(i) | 6.08 | % | 10/15/22 | $ | 1,243 | $ | 1,224,761 | |||||||||
ING Investment Management CLO 2012-4, Ltd.(h)(i) | 5.98 | % | 10/15/23 | 1,861 | 1,847,653 | |||||||||||
ING Investment Management CLO 2013-1, Ltd.(h)(i) | 5.23 | % | 04/15/24 | 4,807 | 4,456,136 | |||||||||||
ING Investment Management CLO 2013-3, Ltd.(h)(i) | 4.73 | % | 01/18/26 | 2,745 | 2,449,981 | |||||||||||
ING Investment Management CLO III, Ltd.(h)(i) | 3.73 | % | 12/13/20 | 1,188 | 1,145,340 | |||||||||||
ING Investment Management CLO IV, Ltd.(h)(i) | 4.48 | % | 06/14/22 | 293 | 287,086 | |||||||||||
Keuka Park CLO 2013-1(h)(i) | 4.73 | % | 10/21/24 | 617 | 555,899 | |||||||||||
Kingsland Ltd. 2006-2(h)(i) | 4.73 | % | 04/21/21 | 1,205 | 1,161,572 | |||||||||||
KKR Financial CLO 2012-1(h)(i) | 5.73 | % | 12/15/24 | 2,100 | 2,044,289 | |||||||||||
KKR Financial CLO 2013-1(h)(i) | 4.98 | % | 07/15/25 | 2,461 | 2,234,236 | |||||||||||
Madison Park Funding IV, Ltd.(h)(i) | 3.83 | % | 03/22/21 | 1,344 | 1,301,206 | |||||||||||
Madison Park Funding X, Ltd.(h)(i) | 5.48 | % | 01/20/25 | 1,953 | 1,904,581 | |||||||||||
Madison Park Funding XIV, Ltd.(h)(i) | 4.98 | % | 07/20/26 | 1,350 | 1,223,220 | |||||||||||
Madison Park Funding XIV, Ltd.(h)(i) | 5.63 | % | 07/20/26 | 1,915 | 1,691,523 | |||||||||||
Marine Park CLO 2012-1(h)(i) | 5.98 | % | 05/18/23 | 2,191 | 2,155,519 | |||||||||||
Octagon Investment Partners XIV Ltd.(h)(i) | 5.48 | % | 01/15/24 | 2,052 | 1,929,834 | |||||||||||
Octagon Investment Partners XIX Ltd.(h)(i) | 5.08 | % | 04/15/26 | 2,920 | 2,676,965 | |||||||||||
Octagon Investment Partners XVII Ltd.(h)(i) | 4.73 | % | 10/25/25 | 1,975 | 1,777,638 | |||||||||||
Octagon Investment Partners XVIII Ltd.(h)(i) | 5.48 | % | 12/16/24 | 4,442 | 4,184,386 | |||||||||||
Pacifica CDO VI, Ltd.(h)(i) | 3.97 | % | 08/15/21 | 565 | 530,413 | |||||||||||
Regatta IV Funding Ltd. 2014-1(h)(i) | 5.18 | % | 07/25/26 | 3,250 | 2,945,979 | |||||||||||
Seneca Park CLO 2014-1, Ltd.(h)(i) | 4.92 | % | 07/17/26 | 2,750 | 2,497,006 | |||||||||||
Sierra CLO II Ltd.(h) | 3.73 | % | 01/22/21 | 733 | 709,424 | |||||||||||
Silverado CLO 2006-II, Ltd.(h)(i) | 3.98 | % | 10/16/20 | 886 | 848,093 | |||||||||||
Slater Mill Loan Fund, LP(h)(i) | 5.73 | % | 08/17/22 | 1,108 | 1,089,706 | |||||||||||
Stone Tower CLO 2007-6, Ltd.(h)(i) | 3.83 | % | 04/17/21 | 1,750 | 1,677,900 | |||||||||||
Symphony CLO IX, Ltd.(h)(i) | 5.23 | % | 04/16/22 | 1,901 | 1,851,519 | |||||||||||
Symphony CLO VIII, Ltd.(h)(i) | 5.98 | % | 01/09/23 | 1,035 | 1,029,750 | |||||||||||
Symphony CLO XI(h)(i) | 5.48 | % | 01/17/25 | 2,640 | 2,499,787 | |||||||||||
Symphony CLO XII(h)(i) | 5.13 | % | 10/15/25 | 1,850 | 1,705,929 | |||||||||||
Symphony CLO XIV(h)(i) | 4.60 | % | 07/14/26 | 2,750 | 2,473,199 | |||||||||||
Voya CLO 2014-2, Ltd.(h)(i) | 4.97 | % | 07/17/26 | 1,875 | 1,692,555 | |||||||||||
Total Structured Products | 106,348,550 | |||||||||||||||
Bonds and Notes–3.21% | ||||||||||||||||
| Aerospace & Defense–0.06% | ||||||||||||||||
LMI Aerospace Inc.(i) | 7.38 | % | 07/15/19 | 1,501 | 1,529,144 | |||||||||||
| Air Transport–0.02% | ||||||||||||||||
Continental Airlines, Inc.(i) | 6.75 | % | 09/15/15 | 460 | 460,920 | |||||||||||
| Business Equipment & Services–0.17% | ||||||||||||||||
ADT Corp. (The) | 6.25 | % | 10/15/21 | 2,222 | 2,360,875 | |||||||||||
First Data Corp.(i) | 6.75 | % | 11/01/20 | 1,977 | 2,145,045 | |||||||||||
| 4,505,920 | ||||||||||||||||
| Cable & Satellite Television–0.05% | ||||||||||||||||
UPC Broadband Holdings, B.V. (Netherlands)(i) | 7.25 | % | 11/15/21 | 1,074 | 1,181,400 | |||||||||||
UPC Broadband Holdings, B.V. (Netherlands)(i) | 6.88 | % | 01/15/22 | 173 | 189,435 | |||||||||||
| 1,370,835 | ||||||||||||||||
See accompanying Notes to Financial Statements which are an integral part of the financial statements.
23 Invesco Floating Rate Fund
| Interest Rate | Maturity Date | Principal Amount (000) | Value | |||||||||||||
| Chemicals & Plastics–0.32% | ||||||||||||||||
Hexion Specialty Chemicals, Inc. | 6.63 | % | 04/15/20 | $ | 7,205 | $ | 7,619,288 | |||||||||
Ineos Holdings Ltd.(i) | 8.38 | % | 02/15/19 | 241 | 261,786 | |||||||||||
Ineos Holdings Ltd.(i) | 7.50 | % | 05/01/20 | 157 | 170,345 | |||||||||||
Taminco Global Chemical Corp.(i) | 9.75 | % | 03/31/20 | 226 | 250,295 | |||||||||||
| 8,301,714 | ||||||||||||||||
| Containers & Glass Products–0.52% | ||||||||||||||||
Ardagh Glass Finance PLC(i) | 6.25 | % | 01/31/19 | 1,631 | 1,663,620 | |||||||||||
Ardagh Glass Finance PLC(i) | 7.00 | % | 11/15/20 | 151 | 155,197 | |||||||||||
Ardagh Glass Finance PLC(i) | 6.00 | % | 06/30/21 | 375 | 376,875 | |||||||||||
Reynolds Group Holdings Inc. | 7.88 | % | 08/15/19 | 1,854 | 2,009,273 | |||||||||||
Reynolds Group Holdings Inc. | 9.88 | % | 08/15/19 | 1,879 | 2,090,387 | |||||||||||
Reynolds Group Holdings Inc. | 5.75 | % | 10/15/20 | 7,036 | 7,379,005 | |||||||||||
| 13,674,357 | ||||||||||||||||
| Electronics & Electrical–0.16% | ||||||||||||||||
Blackboard Inc.(i) | 7.75 | % | 11/15/19 | 4,194 | 4,309,335 | |||||||||||
| Food Products–0.02% | ||||||||||||||||
Chiquita Brands LLC | 7.88 | % | 02/01/21 | 412 | 453,715 | |||||||||||
| Forest Products–0.07% | ||||||||||||||||
Verso Paper Holdings LLC | 11.75 | % | 01/15/19 | 1,626 | 1,715,430 | |||||||||||
| Healthcare–0.32% | ||||||||||||||||
Biomet Inc. | 6.50 | % | 08/01/20 | 469 | 506,520 | |||||||||||
Community Health Systems, Inc.(i) | 6.88 | % | 02/01/22 | 971 | 1,038,970 | |||||||||||
DJO Finance LLC | 9.75 | % | 10/15/17 | 3,319 | 3,476,652 | |||||||||||
DJO Finance LLC | 8.75 | % | 03/15/18 | 1,386 | 1,479,555 | |||||||||||
Kinetic Concepts, Inc. | 10.50 | % | 11/01/18 | 1,764 | 1,982,295 | |||||||||||
| 8,483,992 | ||||||||||||||||
| Lodging & Casinos–0.02% | ||||||||||||||||
Harrah’s Operating Company, Inc. | 9.00 | % | 02/15/20 | 791 | 640,710 | |||||||||||
| Nonferrous Metals & Minerals–0.14% | ||||||||||||||||
TiZir Ltd. (United Kingdom) | 9.00 | % | 09/28/17 | 3,600 | 3,618,000 | |||||||||||
| Oil & Gas–0.20% | ||||||||||||||||
Pacific Drilling S.A. (Luxembourg)(i) | 5.38 | % | 06/01/20 | 2,798 | 2,742,040 | |||||||||||
Seventy Seven Operating LLC(i) | 6.50 | % | 07/15/22 | 236 | 244,260 | |||||||||||
Tervita Corp. (Canada)(i) | 8.00 | % | 11/15/18 | 1,949 | 2,037,290 | |||||||||||
Western Refining, Inc. | 6.25 | % | 04/01/21 | 190 | 198,550 | |||||||||||
| 5,222,140 | ||||||||||||||||
| Publishing–0.04% | ||||||||||||||||
Merrill Communications LLC(i) | 10.00 | % | 03/08/23 | 1,160 | 1,020,438 | |||||||||||
| Radio & Television–0.05% | ||||||||||||||||
Sinclair Television Group, Inc. | 6.38 | % | 11/01/21 | 1,208 | 1,292,560 | |||||||||||
| Retailers (except Food & Drug)–0.36% | ||||||||||||||||
Claire’s Stores Inc.(i) | 9.00 | % | 03/15/19 | 2,952 | 3,084,840 | |||||||||||
Claire’s Stores Inc.(i) | 6.13 | % | 03/15/20 | 2,079 | 1,985,445 | |||||||||||
Guitar Center, Inc.(i) | 6.50 | % | 04/15/19 | 4,669 | 4,458,895 | |||||||||||
| 9,529,180 | ||||||||||||||||
See accompanying Notes to Financial Statements which are an integral part of the financial statements.
24 Invesco Floating Rate Fund
| Interest Rate | Maturity Date | Principal Amount (000) | Value | |||||||||||||
| Telecommunications–0.56% | ||||||||||||||||
Avaya Inc.(i) | 7.00 | % | 04/01/19 | $ | 2,835 | $ | 2,835,200 | |||||||||
Goodman Networks Inc. | 12.13 | % | 07/01/18 | 7,708 | 8,411,355 | |||||||||||
Wind Telecomunicazioni S.p.A. (Italy)(i) | 7.38 | % | 04/23/21 | 1,422 | 1,510,875 | |||||||||||
Wind Telecomunicazioni S.p.A. (Italy)(i) | 6.50 | % | 04/30/20 | 256 | 277,120 | |||||||||||
Windstream Corp. | 7.50 | % | 06/01/22 | 1,484 | 1,623,125 | |||||||||||
Windstream Corp. | 6.38 | % | 08/01/23 | 17 | 17,106 | |||||||||||
| 14,674,781 | ||||||||||||||||
| Utilities–0.13% | ||||||||||||||||
Calpine Corp.(i) | 7.50 | % | 02/15/21 | 1 | 772 | |||||||||||
Calpine Corp.(i) | 6.00 | % | 01/15/22 | 807 | 875,595 | |||||||||||
Calpine Corp.(i) | 7.88 | % | 01/15/23 | — | 288 | |||||||||||
NRG Energy Inc.(i) | 6.25 | % | 07/15/22 | 1,579 | 1,663,871 | |||||||||||
NRG Energy Inc. | 6.63 | % | 03/15/23 | 880 | 939,400 | |||||||||||
| 3,479,926 | ||||||||||||||||
Total Bonds and Notes | 84,283,097 | |||||||||||||||
| Shares | ||||||||||||||||
Common Stocks & Other Equity Interests–0.35% | ||||||||||||||||
| Aerospace & Defense–0.00% | ||||||||||||||||
IAP Worldwide Services(i) | 134 | 107,509 | ||||||||||||||
| Automotive–0.01% | ||||||||||||||||
Dayco Products, LLC(i)(j) | 856 | 46,010 | ||||||||||||||
Dayco Products, LLC(i)(j) | 3,261 | 175,279 | ||||||||||||||
| 221,289 | ||||||||||||||||
| Building & Development–0.12% | ||||||||||||||||
Lake at Las Vegas Joint Venture, LLC, Class A | 518 | 0 | ||||||||||||||
Lake at Las Vegas Joint Venture, LLC, Class B | 4 | 0 | ||||||||||||||
Lake at Las Vegas Joint Venture, LLC, Class C, Wts. expiring 07/15/15, | 17 | 0 | ||||||||||||||
Lake at Las Vegas Joint Venture, LLC, Class D, Wts. expiring 07/15/15, | 24 | 0 | ||||||||||||||
Lake at Las Vegas Joint Venture, LLC, Class E, Wts. expiring 07/15/15, | 27 | 0 | ||||||||||||||
Lake at Las Vegas Joint Venture, LLC, Class F, Wts. expiring 07/15/15, | 30 | 0 | ||||||||||||||
Lake at Las Vegas Joint Venture, LLC, Class G, Wts. expiring 07/15/15, | 34 | 0 | ||||||||||||||
Stile Acquisition Corp. (Canada)(i)(j) | 53,093 | 3,035,858 | ||||||||||||||
United Subcontractors, Inc.(i)(j) | 4,840 | 91,969 | ||||||||||||||
| 3,127,827 | ||||||||||||||||
| Business Equipment & Services–0.01% | ||||||||||||||||
Koosharem LLC(i)(j) | 28,380 | 404,415 | ||||||||||||||
| Cable & Satellite Television–0.09% | ||||||||||||||||
Ion Media Networks, Inc. (Acquired 01/17/06-12/17/09; Cost $3,038,036)(i)(j) | 4,471 | 2,258,749 | ||||||||||||||
| Chemicals & Plastics–0.00% | ||||||||||||||||
LyondellBasell Industries N.V. Class A | 218 | 24,928 | ||||||||||||||
See accompanying Notes to Financial Statements which are an integral part of the financial statements.
25 Invesco Floating Rate Fund
| Shares | Value | |||||||||||
| Drugs–0.00% | ||||||||||||
BPA Laboratories, Inc., Class A, Wts. expiring 04/29/24 (Acquired 04/29/14; Cost $0)(i)(j) | 3,490 | $ | 0 | |||||||||
BPA Laboratories, Inc., Class B, Wts. expiring 04/29/24 (Acquired 04/29/14; Cost $0)(i)(j) | 5,595 | 0 | ||||||||||
| 0 | ||||||||||||
| Financial Intermediaries–0.00% | ||||||||||||
Bankruptcy Management Solutions, Inc.(i)(k) | 335 | 11,725 | ||||||||||
Bankruptcy Management Solutions, Inc., Class A, Wts. expiring 06/27/18, | 19 | 0 | ||||||||||
Bankruptcy Management Solutions, Inc., Class B, Wts. expiring 06/27/18, | 21 | 0 | ||||||||||
Bankruptcy Management Solutions, Inc., Class C, Wts. expiring 06/27/18, | 31 | 0 | ||||||||||
| 11,725 | ||||||||||||
| Food Products–0.00% | ||||||||||||
QCE LLC(i)(k) | 17 | 29 | ||||||||||
| Forest Products–0.00% | ||||||||||||
Xerium Technologies, Inc.(j) | 1,766 | 26,402 | ||||||||||
| Leisure Goods, Activities & Movies–0.00% | ||||||||||||
AMF Bowling Centers, Inc.(i)(j) | 1,665 | 59,108 | ||||||||||
| Lodging & Casinos–0.03% | ||||||||||||
Twin River Worldwide Holdings, Inc.,(i)(j) | 18,663 | 696,746 | ||||||||||
| Publishing–0.06% | ||||||||||||
F&W Publications, Inc.(i)(j) | 288 | 17,280 | ||||||||||
Merrill Communications LLC, Class A(i)(j) | 133,776 | 802,656 | ||||||||||
Tribune Media Co., Class A(k) | 9,050 | 690,515 | ||||||||||
Tribune Publishing Co.(k) | 2,262 | 43,430 | ||||||||||
| 1,553,881 | ||||||||||||
| Surface Transport–0.00% | ||||||||||||
U.S. Shipping Corp.(i)(j) | 6,189 | 4,642 | ||||||||||
U.S. Shipping Corp. (Acquired 09/28/07-09/30/09; Cost $87,805)(i)(j) | 87,805 | 48,292 | ||||||||||
| 52,934 | ||||||||||||
| Telecommunications–0.03% | ||||||||||||
FairPoint Communications, Inc.(j) | 44,928 | 726,036 | ||||||||||
| Utilities–0.00% | ||||||||||||
Bicent Power, LLC Series A, Wts. expiring 08/21/22 (Acquired 08/21/12; Cost $0)(i)(j) | 101 | 0 | ||||||||||
Bicent Power, LLC Series B, Wts. expiring 08/21/22 (Acquired 08/21/12; Cost $0)(i)(j) | 164 | 0 | ||||||||||
| 0 | ||||||||||||
Total Common Stocks & Other Equity Interests | 9,271,578 | |||||||||||
Preferred Stock–0.01% | ||||||||||||
| Building & Development–0.01% | ||||||||||||
United Subcontractors, Inc. (Acquired 08/02/13; Cost $0)(i)(j) | 4,840 | 145,214 | ||||||||||
Money Market Funds–1.27% | ||||||||||||
Liquid Assets Portfolio–Institutional Class(l) | 16,686,399 | 16,686,399 | ||||||||||
Premier Portfolio–Institutional Class(l) | 16,686,399 | 16,686,399 | ||||||||||
Total Money Market Funds | 33,372,798 | |||||||||||
TOTAL INVESTMENTS–103.63% (Cost $2,711,542,280) | �� | 2,716,158,698 | ||||||||||
OTHER ASSETS LESS LIABILITIES–(3.63)% | (95,141,291 | ) | ||||||||||
NET ASSETS–100.00% | $ | 2,621,017,407 | ||||||||||
See accompanying Notes to Financial Statements which are an integral part of the financial statements.
26 Invesco Floating Rate Fund
Investment Abbreviations:
| CDO | – Collateralized Debt Obligation | |
| CLO | – Collateralized Loan Obligation | |
| DIP | – Debtor-in-possession | |
| LOC | – Letter of Credit | |
| PIK | – Payment in Kind | |
| Wts. | – Warrants |
Notes to Schedule of Investments:
| (a) | Variable rate senior loan interests often require prepayments from excess cash flow or permit the borrower to repay at its election. The degree to which borrowers repay, whether as a contractual requirement or at their election, cannot be predicted with accuracy. As a result, the actual remaining maturity may be substantially less than the stated maturities shown. However, it is anticipated that the senior secured floating rate interests will have an expected average life of three to five years. |
| (b) | Variable rate senior loan interests are, at present, not readily marketable, not registered under the Securities Act of 1933, as amended (the “1933 Act”), and may be subject to contractual and legal restrictions on sale. Senior secured corporate loans and senior secured debt securities in the Fund’s portfolio generally have variable rates which adjust to a base, such as the London Inter-Bank Offered Rate (“LIBOR”), on set dates, typically every 30 days but not greater than one year; and/or have interest rates that float at a margin above a widely recognized base lending rate such as the Prime Rate of a designated U.S. bank. |
| (c) | Defaulted security. Currently, the issuer is in default with respect to principal and/or interest payments. The value of this security at August 31, 2014 represented less than 1% of the Fund’s Net Assets. |
| (d) | This floating rate interest will settle after August 31, 2014, at which time the interest rate will be determined. |
| (e) | All or a portion of this holding is subject to unfunded loan commitments. Interest rate will be determined at the time of funding. See Note 7. |
| (f) | All or a portion of this security is Payment-in-Kind. |
| Issuer | Cash Rate | PIK Rate | ||||||
Lake at Las Vegas Joint Venture LLC, Exit Revolver Loan | 0.00 | % | 5.00 | % | ||||
Texas Competitive Electric Holdings Co. LLC, Term Loan | 4.65 | 4.65 | ||||||
| (g) | The borrower has filed for protection in federal bankruptcy court. |
| (h) | Interest or dividend rate is redetermined periodically. Rate shown is the rate in effect on August 31, 2014. |
| (i) | Security purchased or received in a transaction exempt from registration under the Securities Act of 1933, as amended (the “1933 Act”). The security may be resold pursuant to an exemption from registration under the 1933 Act, typically to qualified institutional buyers. The aggregate value of these securities at August 31, 2014 was $150,013,903, which represented 5.72% of the Fund’s Net Assets. |
| (j) | Non-income producing securities acquired through the restructuring of senior loans. |
| (k) | Non-income producing securities acquired as part of a bankruptcy restructuring. |
| (l) | The money market fund and the Fund are affiliated by having the same investment adviser. |
See accompanying Notes to Financial Statements which are an integral part of the financial statements.
27 Invesco Floating Rate Fund
Statement of Assets and Liabilities
August 31, 2014
Assets: |
| |||
Investments, at value (Cost $2,678,169,482) | $ | 2,682,785,900 | ||
Investments in affiliated money market funds, at value and cost | 33,372,798 | |||
Total investments, at value (Cost $2,711,542,280) | 2,716,158,698 | |||
Cash | 24,253,321 | |||
Receivable for: | ||||
Investments sold | 81,261,964 | |||
Interest and fees | 14,323,268 | |||
Fund shares sold | 8,392,131 | |||
Investments matured (Cost $152,259) | 3,564 | |||
Investment for trustee deferred compensation and retirement plans | 161,342 | |||
Other assets | 317,683 | |||
Total assets | 2,844,871,971 | |||
Liabilities: |
| |||
Payable for: | ||||
Investments purchased | 212,793,812 | |||
Fund shares repurchased | 8,135,993 | |||
Income distributions | 1,250,920 | |||
Accrued fees to affiliates | 1,224,741 | |||
Accrued trustees’ and officers’ fees and benefits | 8,065 | |||
Accrued other operating expenses | 254,772 | |||
Trustee deferred compensation and retirement plans | 186,261 | |||
Total liabilities | 223,854,564 | |||
Net assets applicable to common shares | $ | 2,621,017,407 | ||
Net assets consist of: |
| |||
Shares of beneficial interest | $ | 2,628,985,058 | ||
Undistributed net investment income | (1,290,187 | ) | ||
Undistributed net realized gain (loss) | (11,145,187 | ) | ||
Net unrealized appreciation (depreciation) | 4,467,723 | |||
| $ | 2,621,017,407 | |||
Net Assets: |
| |||
Class A | $ | 1,025,091,681 | ||
Class C | $ | 691,152,294 | ||
Class R | $ | 11,152,150 | ||
Class Y | $ | 802,508,418 | ||
Class R5 | $ | 8,087,400 | ||
Class R6 | $ | 83,025,464 | ||
Shares outstanding, $0.01 par value per share |
| |||
Class A | 128,898,530 | |||
Class C | 87,296,731 | |||
Class R | 1,399,844 | |||
Class Y | 101,071,733 | |||
Class R5 | 1,016,093 | |||
Class R6 | 10,438,555 | |||
Class A: | ||||
Net asset value per share | $ | 7.95 | ||
Maximum offering price per share | ||||
(Net asset value of $7.95 ¸ 97.50%) | $ | 8.15 | ||
Class C: | ||||
Net asset value and offering price per share | $ | 7.92 | ||
Class R: | ||||
Net asset value and offering price per share | $ | 7.97 | ||
Class Y: | ||||
Net asset value and offering price per share | $ | 7.94 | ||
Class R5: | ||||
Net asset value and offering price per share | $ | 7.96 | ||
Class R6: | ||||
Net asset value and offering price per share | $ | 7.95 | ||
See accompanying Notes to Financial Statements which are an integral part of the financial statements.
28 Invesco Floating Rate Fund
Statement of Operations
For the year ended August 31, 2014
Investment income: |
| |||
Interest | $ | 120,189,984 | ||
Dividends | 2,205,486 | |||
Dividends from affiliated money market funds | 53,333 | |||
Other income | 5,512,656 | |||
Total investment income | 127,961,459 | |||
Expenses: | ||||
Advisory fees | 15,466,578 | |||
Administrative services fees | 504,693 | |||
Custodian fees | 485,111 | |||
Distributions fees: | ||||
Class A | 2,746,227 | |||
Class C | 4,717,693 | |||
Class R | 44,796 | |||
Interest, facilities and maintenance fees | 501,768 | |||
Transfer agent fees — A, C, R & Y | 2,314,733 | |||
Transfer agent fees — R5 | 6,839 | |||
Transfer agent fees — R6 | 2,782 | |||
Trustees’ and officers’ fees and benefits | 94,105 | |||
Other | 665,509 | |||
Total expenses | 27,550,834 | |||
Less: Fees waived and expense offset arrangement(s) | (196,092 | ) | ||
Net expenses | 27,354,742 | |||
Net investment income | 100,606,717 | |||
Realized and unrealized gain (loss): | ||||
Net realized gain (loss) from Investment securities | (2,940,982 | ) | ||
Change in net unrealized appreciation of investment securities | 7,995,687 | |||
Net realized and unrealized gain | 5,054,705 | |||
Net increase in net assets resulting from operations | $ | 105,661,422 | ||
See accompanying Notes to Financial Statements which are an integral part of the financial statements.
29 Invesco Floating Rate Fund
Statement of Changes in Net Assets
For the years ended August 31, 2014 and 2013
| 2014 | 2013 | |||||||
Operations: |
| |||||||
Net investment income | $ | 100,606,717 | $ | 56,982,715 | ||||
Net realized gain (loss) | (2,940,982 | ) | 14,606,234 | |||||
Change in net unrealized appreciation | 7,995,687 | 3,528,753 | ||||||
Net increase in net assets resulting from operations | 105,661,422 | 75,117,702 | ||||||
Distributions to shareholders from net investment income: | ||||||||
Class A | (44,823,675 | ) | (27,865,428 | ) | ||||
Class C | (22,528,888 | ) | (13,389,847 | ) | ||||
Class R | (344,787 | ) | (102,164 | ) | ||||
Class Y | (31,175,753 | ) | (13,386,252 | ) | ||||
Class R5 | (421,837 | ) | (770,560 | ) | ||||
Class R6 | (3,091,977 | ) | (2,424,391 | ) | ||||
Total distributions to shareholders from net investment income | (102,386,917 | ) | (57,938,642 | ) | ||||
Share transactions–net: | ||||||||
Class A | 65,718,204 | 500,918,627 | ||||||
Class C | 171,360,975 | 255,350,771 | ||||||
Class R | 7,601,981 | 1,748,631 | ||||||
Class Y | 251,164,235 | 382,712,276 | ||||||
Class R5 | (1,196,676 | ) | (49,516,697 | ) | ||||
Class R6 | 19,879,757 | 62,452,814 | ||||||
Net increase in net assets resulting from share transactions | 514,528,476 | 1,153,666,422 | ||||||
Net increase in net assets | 517,802,981 | 1,170,845,482 | ||||||
Net assets: | ||||||||
Beginning of year | 2,103,214,426 | 932,368,944 | ||||||
End of year (includes undistributed net investment income of $(1,290,187) and $(321,456), respectively) | $ | 2,621,017,407 | $ | 2,103,214,426 | ||||
See accompanying Notes to Financial Statements which are an integral part of the financial statements.
30 Invesco Floating Rate Fund
Statement of Cash Flows
For the year ended August 31, 2014
Cash provided by (used in) operating activities: | ||||
Net increase in net assets resulting from operations applicable to common shares | $ | 105,661,422 | ||
Adjustments to reconcile net increase in net assets to net cash provided by (used in) operating activities: |
| |||
Purchases of investments | (2,718,553,853 | ) | ||
Proceeds from sales of investments | 2,019,660,132 | |||
Increase in receivables and other assets | (4,923,583 | ) | ||
Amortization of loan fees | 2,690,352 | |||
Accretion of discount on investment securities | (7,225,540 | ) | ||
Increase in accrued expenses and other payables | 331,891 | |||
Net realized loss from investment securities | 2,940,982 | |||
Net change in unrealized appreciation on investment securities | (7,995,687 | ) | ||
Net cash provided by (used in) operating activities | (607,413,884 | ) | ||
Cash provided by (used in) financing activities: | ||||
Dividends paid to common shareholders from net investment income | (29,128,862 | ) | ||
Proceeds from shares of beneficial interest sold | 1,674,582,465 | |||
Disbursements from shares of beneficial interest reacquired | (1,211,220,863 | ) | ||
Net cash provided (used in) by financing activities | 434,232,740 | |||
Net increase (decrease) in cash and cash equivalents | (173,181,144 | ) | ||
Cash and cash equivalents at beginning of period | 230,807,263 | |||
Cash and cash equivalents at end of period | $ | 57,626,119 | ||
Non-cash financing activities: | ||||
Value of shares of beneficial interest issued in reinvestment of dividends paid to shareholders | $ | 72,985,507 | ||
Supplemental disclosure of cash flow information: | ||||
Cash paid during the period for interest, facilities and maintenance fees | $ | 582,850 | ||
Notes to Financial Statements
August 31, 2014
NOTE 1—Significant Accounting Policies
Invesco Floating Rate Fund (the “Fund”) is a series portfolio of AIM Counselor Series Trust (Invesco Counselor Series Trust) (the “Trust”). The Trust is a Delaware statutory trust registered under the Investment Company Act of 1940, as amended (the “1940 Act”), as an open-end series management investment company consisting of thirteen separate portfolios, each authorized to issue an unlimited number of shares of beneficial interest. The assets, liabilities and operations of each portfolio are accounted for separately. Information presented in these financial statements pertains only to the Fund. Matters affecting each portfolio or class will be voted on exclusively by the shareholders of such portfolio or class.
The Fund’s investment objective is total return, comprised of current income and capital appreciation.
The Fund currently consists of six different classes of shares: Class A, Class C, Class R, Class Y, Class R5 and Class R6. Class A shares are sold with a front-end sales charge unless certain waiver criteria are met and under certain circumstances load waived shares may be subject to contingent deferred sales charges (“CDSC”). Class C shares are sold with a CDSC. Class R, Class Y, Class R5 and Class R6 shares are sold at net asset value.
The following is a summary of the significant accounting policies followed by the Fund in the preparation of its financial statements.
| A. | Security Valuations — Variable rate senior loan interests are fair valued using an evaluated quote provided by an independent pricing service. Evaluated quotes provided by the pricing service may reflect appropriate factors such as ratings, tranche type, industry, company performance, spread, individual trading characteristics, institution-size trading in similar groups of securities and other market data. |
Securities, including restricted securities, are valued according to the following policy. A security listed or traded on an exchange (except convertible securities) is valued at its last sales price as of the close of the customary trading session on the exchange where the security is principally traded, or lacking any sales on a particular day, the security may be valued at the closing bid price on that day. Securities traded in the over-the-counter market (but not securities reported on the NASDAQ Stock Exchange) are valued based on the prices furnished by independent pricing services, in which case the securities may be considered fair valued, or by market makers. Each security reported on the NASDAQ Stock Exchange is valued at the NASDAQ Official Closing Price (“NOCP”) as of the close of the customary trading session on the valuation date or absent a NOCP, at the closing bid price.
Futures contracts are valued at the final settlement price set by an exchange on which they are principally traded. Listed options are valued at the mean between the last bid and the ask prices from the exchange on which they are principally traded. Options not listed on an exchange are valued by an independent source at the mean between the last bid and ask prices. For purposes of determining net asset value per share, futures and option contracts generally are valued 15 minutes after the close of the customary trading session of the New York Stock Exchange (“NYSE”).
31 Invesco Floating Rate Fund
Investments in open-end and closed-end registered investment companies that do not trade on an exchange are valued at the end of day net asset value per share. Investments in open-end and closed-end registered investment companies that trade on an exchange are valued at the last sales price or official closing price as of the close of the customary trading session on the exchange where the security is principally traded.
Debt obligations (including convertible securities) and unlisted equities are fair valued using an evaluated quote provided by an independent pricing service. Evaluated quotes provided by the pricing service may be determined without exclusive reliance on quoted prices, and may reflect appropriate factors such as institution-size trading in similar groups of securities, developments related to specific securities, dividend rate (for unlisted equities), yield (for debt obligations), quality, type of issue, coupon rate (for debt obligations), maturity (for debt obligations), individual trading characteristics and other market data. Debt obligations are subject to interest rate and credit risks. In addition, all debt obligations involve some risk of default with respect to interest and/or principal payments.
Swap agreements are fair valued using an evaluated quote provided by an independent pricing service. Evaluated quotes provided by the pricing service are valued based on a model which may include end of day net present values, spreads, ratings, industry, and company performance.
Foreign securities’ (including foreign exchange contracts) prices are converted into U.S. dollar amounts using the applicable exchange rates as of the close of the NYSE. If market quotations are available and reliable for foreign exchange-traded equity securities, the securities will be valued at the market quotations. Because trading hours for certain foreign securities end before the close of the NYSE, closing market quotations may become unreliable. If between the time trading ends on a particular security and the close of the customary trading session on the NYSE, events occur that the Adviser determines are significant and make the closing price unreliable, the Fund may fair value the security. If the event is likely to have affected the closing price of the security, the security will be valued at fair value in good faith using procedures approved by the Board of Trustees. Adjustments to closing prices to reflect fair value may also be based on a screening process of an independent pricing service to indicate the degree of certainty, based on historical data, that the closing price in the principal market where a foreign security trades is not the current value as of the close of the NYSE. Foreign securities’ prices meeting the approved degree of certainty that the price is not reflective of current value will be priced at the indication of fair value from the independent pricing service. Multiple factors may be considered by the independent pricing service in determining adjustments to reflect fair value and may include information relating to sector indices, American Depositary Receipts and domestic and foreign index futures. Foreign securities may have additional risks including exchange rate changes, potential for sharply devalued currencies and high inflation, political and economic upheaval, the relative lack of issuer information, relatively low market liquidity and the potential lack of strict financial and accounting controls and standards.
Securities for which market prices are not provided by any of the above methods may be valued based upon quotes furnished by independent sources. The last bid price may be used to value equity securities. The mean between the last bid and asked prices is used to value debt obligations, including corporate loans.
Securities for which market quotations are not readily available or became unreliable are valued at fair value as determined in good faith by or under the supervision of the Trust’s officers following procedures approved by the Board of Trustees. Issuer specific events, market trends, bid/ask quotes of brokers and information providers and other market data may be reviewed in the course of making a good faith determination of a security’s fair value.
The Fund may invest in securities that are subject to interest rate risk, meaning the risk that the prices will generally fall as interest rates rise and, conversely, the prices will generally rise as interest rates fall. Specific securities differ in their sensitivity to changes in interest rates depending on their individual characteristics. Changes in interest rates may result in increased market volatility, which may affect the value and/or liquidity of certain of the Fund’s investments.
Valuations change in response to many factors including the historical and prospective earnings of the issuer, the value of the issuer’s assets, general economic conditions, interest rates, investor perceptions and market liquidity. Because of the inherent uncertainties of valuation, the values reflected in the financial statements may materially differ from the value received upon actual sale of those investments.
| B. | Securities Transactions and Investment Income — Securities transactions are accounted for on a trade date basis. Realized gains or losses on sales are computed on the basis of specific identification of the securities sold. Interest income (net of withholding tax, if any) is recorded on the accrual basis from the settlement date. Facility fees received may be amortized over the life of the loan. Dividend income (net of withholding tax, if any) is recorded on the ex-dividend date. Bond premiums and discounts are amortized and/or accreted for financial reporting purposes. |
The Fund may periodically participate in litigation related to Fund investments. As such, the Fund may receive proceeds from litigation settlements. Any proceeds received are included in the Statement of Operations as realized gain (loss) for investments no longer held and as unrealized gain (loss) for investments still held.
Other income is comprised primarily of amendment fees which are recorded when received. Amendment fees are received in return for changes in the terms of the loan or note.
Brokerage commissions and mark ups are considered transaction costs and are recorded as an increase to the cost basis of securities purchased and/or a reduction of proceeds on a sale of securities. Such transaction costs are included in the determination of net realized and unrealized gain (loss) from investment securities reported in the Statement of Operations and the Statement of Changes in Net Assets and the net realized and unrealized gains (losses) on securities per share in the Financial Highlights. Transaction costs are included in the calculation of the Fund’s net asset value and, accordingly, they reduce the Fund’s total returns. These transaction costs are not considered operating expenses and are not reflected in net investment income reported in the Statement of Operations and Statement of Changes in Net Assets, or the net investment income per share and ratios of expenses and net investment income reported in the Financial Highlights, nor are they limited by any expense limitation arrangements between the Fund and the investment adviser.
The Fund allocates realized and unrealized capital gains and losses to a class based on the relative net assets of each class. The Fund allocates income to a class based on the relative value of the settled shares of each class.
| C. | Country Determination — For the purposes of making investment selection decisions and presentation in the Schedule of Investments, the investment adviser may determine the country in which an issuer is located and/or credit risk exposure based on various factors. These factors include the laws of the country under which the issuer is organized, where the issuer maintains a principal office, the country in which the issuer derives 50% or more of its total revenues and the country that has the primary market for the issuer’s securities, as well as other criteria. Among |
32 Invesco Floating Rate Fund
| the other criteria that may be evaluated for making this determination are the country in which the issuer maintains 50% or more of its assets, the type of security, financial guarantees and enhancements, the nature of the collateral and the sponsor organization. Country of issuer and/or credit risk exposure has been determined to be the United States of America, unless otherwise noted. |
| D. | Distributions — Distributions from net investment income are declared daily and paid monthly. Distributions from net realized capital gain, if any, are generally declared and paid annually and recorded on the ex-dividend date. The Fund may elect to treat a portion of the proceeds from redemptions as distributions for federal income tax purposes. |
| E. | Federal Income Taxes — The Fund intends to comply with the requirements of Subchapter M of the Internal Revenue Code of 1986, as amended (the “Internal Revenue Code”), necessary to qualify as a regulated investment company and to distribute substantially all of the Fund’s taxable earnings to shareholders. As such, the Fund will not be subject to federal income taxes on otherwise taxable income (including net realized capital gain) that is distributed to shareholders. Therefore, no provision for federal income taxes is recorded in the financial statements. |
The Fund recognizes the tax benefits of uncertain tax positions only when the position is more likely than not to be sustained. Management has analyzed the Fund’s uncertain tax positions and concluded that no liability for unrecognized tax benefits should be recorded related to uncertain tax positions. Management is not aware of any tax positions for which it is reasonably possible that the total amounts of unrecognized tax benefits will change materially in the next 12 months.
The Fund files tax returns in the U.S. Federal jurisdiction and certain other jurisdictions. Generally, the Fund is subject to examinations by such taxing authorities for up to three years after the filing of the return for the tax period.
| F. | Expenses — Fees provided for under the Rule 12b-1 plan of a particular class of the Fund are charged to the operations of such class. Transfer agency fees and expenses and other shareholder recordkeeping fees and expenses attributable to Class R5 and Class R6 are allocated to each share class based on relative net assets. Sub-accounting fees attributable to Class R5 are charged to the operations of the class. Transfer agency fees and expenses and other shareholder recordkeeping fees and expenses relating to all other classes are allocated among those classes based on relative net assets. All other expenses are allocated among the classes based on relative net assets. |
| G. | Interest, Facilities and Maintenance Fees — Interest, Facilities and Maintenance Fees include interest and related borrowing costs such as commitment fees and other expenses associated with lines of credit and interest and administrative expenses related to establishing and maintaining the credit agreement. |
| H. | Accounting Estimates — The preparation of financial statements in conformity with accounting principles generally accepted in the United States of America (“GAAP”) requires management to make estimates and assumptions that affect the reported amounts of assets and liabilities at the date of the financial statements and the reported amounts of revenues and expenses during the reporting period including estimates and assumptions related to taxation. Actual results could differ from those estimates by a significant amount. In addition, the Fund monitors for material events or transactions that may occur or become known after the period-end date and before the date the financial statements are released to print. |
| I. | Indemnifications — Under the Trust’s organizational documents, each Trustee, officer, employee or other agent of the Trust is indemnified against certain liabilities that may arise out of the performance of their duties to the Fund. Additionally, in the normal course of business, the Fund enters into contracts, including the Fund’s servicing agreements, that contain a variety of indemnification clauses. The Fund’s maximum exposure under these arrangements is unknown as this would involve future claims that may be made against the Fund that have not yet occurred. The risk of material loss as a result of such indemnification claims is considered remote. |
| J. | Cash and Cash Equivalents — For the purposes of the Statement of Cash Flows, the Fund defines Cash and Cash Equivalents as cash (including foreign currency), money market funds and other investments held in lieu of cash and excludes investments made with cash collateral received. |
| K. | Securities Purchased on a When-Issued and Delayed Delivery Basis — The Fund may purchase and sell interests in corporate loans and corporate debt securities and other portfolio securities on a when-issued and delayed delivery basis, with payment and delivery scheduled for a future date. No income accrues to the Fund on such interests or securities in connection with such transactions prior to the date the Fund actually takes delivery of such interests or securities. These transactions are subject to market fluctuations and are subject to the risk that the value at delivery may be more or less than the trade date purchase price. Although the Fund will generally purchase these securities with the intention of acquiring such securities, they may sell such securities prior to the settlement date. |
| L. | Industry Concentration — To the extent that the Fund is concentrated in securities of issuers in the banking and financial services industries, the Fund’s performance will depend to a greater extent on the overall condition of those industries. The value of these securities can be sensitive to changes in government regulation, interest rates and economic downturns in the U.S. and abroad. |
| M. | Bank Loan Risk Disclosures — Although the resale, or secondary market for floating rate loans has grown substantially over the past decade, both in overall size and number of market participants, there is no organized exchange or board of trade on which floating rate loans are traded. Instead, the secondary market for floating rate loans is a private, unregulated interdealer or interbank resale market. Such a market may therefore be subject to irregular trading activity, wide bid/ask spreads, and extended trade settlement periods. Similar to other asset classes, bank loan funds may be exposed to counterparty credit risk, or the risk than an entity with which the Fund has unsettled or open transactions may fail to or be unable to perform on its commitments. The Fund manages counterparty credit risk by entering into transactions only with counterparties that they believe have the financial resources to honor their obligations and by monitoring the financial stability of those counterparties. |
| N. | Other Risks — The Fund may invest all or substantially of its assets in senior secured floating rate loans, senior secured debt securities or other securities rated below investment grade. These securities are generally considered to have speculative characteristics and are subject to greater risk of loss of principal and interest than higher rated securities. The value of lower quality debt securities and floating rate loans can be more volatile due to increased sensitivity to adverse issuer, political, regulatory, market or economic developments. |
The Fund invests in corporate loans from U.S. or non-U.S. companies (the “Borrowers”). The investment of the Fund in a corporate loan may take the form of participation interests or assignments. If the Fund purchases a participation interest from a syndicate of lenders (“Lenders”) or one of the participants in the syndicate (“Participant”), one or more of which administers the loan on behalf of all the Lenders (the “Agent Bank”), the Fund would be required to rely on the Lender that sold the participation interest not only for the enforcement of the Fund’s rights against the Borrower but also for the receipt and processing of payments due to the Fund under the corporate loans. As such, the Fund is subject to the credit
33 Invesco Floating Rate Fund
risk of the Borrower and the Participant. Lenders and Participants interposed between the Fund and a Borrower, together with Agent Banks, are referred to as “Intermediate Participants”.
| O. | Leverage Risk — The Fund may utilize leverage to seek to enhance the yield of the Fund by borrowing. There are risks associated with borrowing in an effort to increase the yield and distributions on the shares, including that the costs of the financial leverage may exceed the income from investments made with such leverage, the higher volatility of the net asset value of the shares, and that fluctuations in the interest rates on the borrowing may affect the yield and distributions to the shareholders. There can be no assurance that the Fund’s leverage strategy will be successful. |
NOTE 2—Advisory Fees and Other Fees Paid to Affiliates
The Trust has entered into a master investment advisory agreement with Invesco Advisers, Inc. (the “Adviser” or “Invesco”). Under the terms of the investment advisory agreement, the Fund pays an advisory fee to the Adviser based on the annual rate of the Fund’s average daily net assets as follows:
| Average Daily Net Assets | Rate | |||||
First $500 million | 0 | .65% | ||||
Next $4.5 billion | 0 | .60% | ||||
Next $5 billion | 0 | .575% | ||||
Over $10 billion | 0 | .55% | ||||
Under the terms of a master sub-advisory agreement between the Adviser and each of Invesco Asset Management Deutschland GmbH, Invesco Asset Management Limited, Invesco Asset Management (Japan) Limited, Invesco Australia Limited, Invesco Hong Kong Limited, Invesco Senior Secured Management, Inc. and Invesco Canada Ltd. (collectively, the “Affiliated Sub-Advisers”) the Adviser, not the Fund, may pay 40% of the fees paid to the Adviser to any such Affiliated Sub-Adviser(s) that provide(s) discretionary investment management services to the Fund based on the percentage of assets allocated to such Sub-Adviser(s).
The Adviser has contractually agreed, through at least June 30, 2015, to waive advisory fees and/or reimburse expenses of all shares to the extent necessary to limit total annual fund operating expenses after fee waiver and/or reimbursement (excluding certain items discussed below) of Class A, Class C, Class R, Class Y, Class R5 and Class R6 shares to 1.50%, 2.00%, 1.75%, 1.25%, 1.25% and 1.25% of average daily net assets. In determining the Adviser’s obligation to waive advisory fees and/or reimburse expenses, the following expenses are not taken into account, and could cause the total annual fund operating expenses after fee waiver and/or reimbursement to exceed the numbers reflected above: (1) interest, facilities and maintenance fees; (2) taxes; (3) dividend expense on short sales; (4) extraordinary or non-routine items, including litigation expenses; and (5) expenses that the Fund has incurred but did not actually pay because of an expense offset arrangement. Unless Invesco continues the fee waiver agreement, it will terminate on June 30, 2015. The fee waiver agreement cannot be terminated during its term. The Adviser did not waive fees and/or reimburse expenses during the period under this expense limitation.
Further, the Adviser has contractually agreed, through at least June 30, 2016, to waive the advisory fee payable by the Fund in an amount equal to 100% of the net advisory fees the Adviser receives from the affiliated money market funds on investments by the Fund of uninvested cash in such affiliated money market funds.
For the year ended August 31, 2014, the Adviser waived advisory fees of $195,108.
The Trust has entered into a master administrative services agreement with Invesco pursuant to which the Fund has agreed to pay Invesco for certain administrative costs incurred in providing accounting services to the Fund. For the year ended August 31, 2014, expenses incurred under the agreement are shown in the Statement of Operations as Administrative services fees.
Also, Invesco has entered into service agreements whereby State Street Bank and Trust Company (“SSB”) serves as the custodian, fund accountant and provides certain administrative services to the Fund.
The Trust has entered into a transfer agency and service agreement with Invesco Investment Services, Inc. (“IIS”) pursuant to which the Fund has agreed to pay IIS a fee for providing transfer agency and shareholder services to the Fund and reimburse IIS for certain expenses incurred by IIS in the course of providing such services. IIS may make payments to intermediaries that provide omnibus account services, sub-accounting services and/or networking services. All fees payable by IIS to intermediaries that provide omnibus account services or sub-accounting are charged back to the Fund, subject to certain limitations approved by the Trust’s Board of Trustees. For the year ended August 31, 2014, expenses incurred under the agreement are shown in the Statement of Operations as Transfer agent fees.
The Trust has entered into master distribution agreements with Invesco Distributors, Inc. (“IDI”) to serve as the distributor for the Class A, Class C, Class R, Class Y, Class R5 and Class R6 shares of the Fund. The Trust has adopted plans pursuant to Rule 12b-1 under the 1940 Act with respect to the Fund’s Class A, Class C and Class R shares (collectively, the “Plans”). The Fund, pursuant to the Plans, pays IDI compensation at the annual rate of 0.25% of the Fund’s average daily net assets of Class A shares, 0.75% of the average daily net assets of Class C shares and 0.50% of the average daily net assets of Class R shares. Of the Plan payments, up to 0.25% of the average daily net assets of each class of shares may be paid to furnish continuing personal shareholder services to customers who purchase and own shares of such classes. Any amounts not paid as a service fee under the Plans would constitute an asset-based sales charge. Rules of the Financial Industry Regulatory Authority (“FINRA”) impose a cap on the total sales charges, including asset-based sales charges, that may be paid by any class of shares of the Fund. For the year ended August 31, 2014, expenses incurred under the Plans are shown in the Statement of Operations as Distribution fees.
Front-end sales commissions and CDSC (collectively, the “sales charges”) are not recorded as expenses of the Fund. Front-end sales commissions are deducted from proceeds from the sales of Fund shares prior to investment in Class A shares of the Fund. CDSC are deducted from redemption proceeds prior to remittance to the shareholder. During the year ended August 31, 2014, IDI advised the Fund that IDI retained $314,014 in front-end sales commissions from the sale of Class A shares and $79,148 and $119,649 from Class A and Class C shares, respectively, for CDSC imposed upon redemptions by shareholders.
Certain officers and trustees of the Trust are officers and directors of the Adviser, IIS and/or IDI.
34 Invesco Floating Rate Fund
NOTE 3—Additional Valuation Information
GAAP defines fair value as the price that would be received to sell an asset or paid to transfer a liability in an orderly transaction between market participants at the measurement date, under current market conditions. GAAP establishes a hierarchy that prioritizes the inputs to valuation methods, giving the highest priority to readily available unadjusted quoted prices in an active market for identical assets (Level 1) and the lowest priority to significant unobservable inputs (Level 3), generally when market prices are not readily available or are unreliable. Based on the valuation inputs, the securities or other investments are tiered into one of three levels. Changes in valuation methods may result in transfers in or out of an investment’s assigned level:
| Level 1 — | Prices are determined using quoted prices in an active market for identical assets. |
| Level 2 — | Prices are determined using other significant observable inputs. Observable inputs are inputs that other market participants may use in pricing a security. These may include quoted prices for similar securities, interest rates, prepayment speeds, credit risk, yield curves, loss severities, default rates, discount rates, volatilities and others. |
| Level 3 — | Prices are determined using significant unobservable inputs. In situations where quoted prices or observable inputs are unavailable (for example, when there is little or no market activity for an investment at the end of the period), unobservable inputs may be used. Unobservable inputs reflect the Fund’s own assumptions about the factors market participants would use in determining fair value of the securities or instruments and would be based on the best available information. |
The following is a summary of the tiered valuation input levels, as of August 31, 2014. The level assigned to the securities valuations may not be an indication of the risk or liquidity associated with investing in those securities. Because of the inherent uncertainties of valuation, the values reflected in the financial statements may materially differ from the value received upon actual sale of those investments.
| Level 1 | Level 2 | Level 3 | Total | |||||||||||||
Equity Securities | $ | 37,919,967 | $ | 1,899,062 | $ | 2,970,561 | $ | 42,789,590 | ||||||||
Variable Rate Senior Loan Interests | — | 2,345,135,043 | 137,602,418 | 2,482,737,461 | ||||||||||||
Bonds and Notes | — | 84,283,097 | — | 84,283,097 | ||||||||||||
Structured Products | — | 106,348,550 | — | 106,348,550 | ||||||||||||
Total Investments | $ | 37,919,967 | $ | 2,537,665,752 | $ | 140,572,979 | $ | 2,716,158,698 | ||||||||
A reconciliation of Level 3 investments is presented when the Fund had a significant amount of Level 3 investments at the beginning and/or end of the reporting period in relation to net assets.
The following is a reconciliation of the fair valuations using significant unobservable inputs (Level 3) during the year ended August 31, 2014:
| Beginning Balance, as of August 31, 2013 | Purchases | Sales | Accrued premiums | Net realized gain (loss) | Net Change in Unrealized Appreciation/ (Depreciation) | Transfers into Level 3 | Transfers out of Level 3 | Ending as of | ||||||||||||||||||||||||||||
Variable Rate Senior Loan Interests | $ | 57,870,285 | $ | 128,673,819 | $ | (46,186,249 | ) | $ | 186,880 | �� | $ | (248,546 | ) | $ | 304,759 | $ | 36,304,179 | $ | (39,302,709 | ) | $ | 137,602,418 | ||||||||||||||
Equity Securities | 208,198 | 283,806 | (97,168 | ) | — | 14,600 | (353,129 | ) | 2,925,979 | (11,725 | ) | 2,970,561 | ||||||||||||||||||||||||
Total | $ | 58,078,483 | $ | 128,957,625 | $ | (46,283,417 | ) | $ | 186,880 | $ | (233,946 | ) | $ | (48,370 | ) | $ | 39,230,158 | $ | (39,314,434 | ) | $ | 140,572,979 | ||||||||||||||
Securities determined to be Level 3 at the end of the reporting period were valued utilizing quotes from a third-party vendor pricing service. A significant change in third-party pricing information could result in a significantly lower or higher value in Level 3 investments.
NOTE 4—Expense Offset Arrangement(s)
The expense offset arrangement is comprised of transfer agency credits which result from balances in demand deposit accounts used by the transfer agent for clearing shareholder transactions. For the year ended August 31, 2014, the Fund received credits from this arrangement, which resulted in the reduction of the Fund’s total expenses of $984.
NOTE 5—Trustees’ and Officers’ Fees and Benefits
Trustees’ and Officers’ Fees and Benefits include amounts accrued by the Fund to pay remuneration to certain Trustees and Officers of the Fund. Trustees have the option to defer compensation payable by the Fund, and Trustees’ and Officers’ Fees and Benefits also include amounts accrued by the Fund to fund such deferred compensation amounts. Those Trustees who defer compensation have the option to select various Invesco Funds in which their deferral accounts shall be deemed to be invested. Finally, certain current Trustees were eligible to participate in a retirement plan that provided for benefits to be paid upon retirement to Trustees over a period of time based on the number of years of service. The Fund may have certain former Trustees who also participate in a retirement plan and receive benefits under such plan. Trustees’ and Officers’ Fees and Benefits include amounts accrued by the Fund to fund such retirement benefits. Obligations under the deferred compensation and retirement plans represent unsecured claims against the general assets of the Fund.
35 Invesco Floating Rate Fund
NOTE 6—Borrowings
Effective July 23, 2014, the Board of Trustees of the Fund approved a revolving line of credit agreement with SSB in which the Fund may borrow up to the lesser of (1) $500,000,000 or (2) the limits set by its prospectus for borrowings. This agreement will expire on July 22, 2015. For the period June 18, 2014 through July 22, 2014, the Fund could borrow up to the lesser of (1) $400,000,000 or (2) the limits set by its prospectus for borrowings. Prior to June 18, 2014, the Fund could borrow up to the lesser of (1) $300,000,000 or (2) the limits set by its prospectus for borrowings.
Additionally, the Fund is permitted to temporarily carry a negative or overdrawn balance in its account with SSB, the custodian bank. Such balances, if any at period end, are shown in the Statement of Assets and Liabilities under the payable caption Amount due custodian. To compensate the custodian bank for such overdrafts, the overdrawn Fund may either (1) leave funds as a compensating balance in the account so the custodian bank can be compensated by earning the additional interest; or (2) compensate by paying the custodian bank at a rate agreed upon by the custodian bank and Invesco, not to exceed the contractually agreed upon rate.
NOTE 7—Unfunded Loan Commitments
As of August 31, 2014, the Fund had unfunded loan commitments, which could be extended at the option of the borrower, pursuant to the following loan agreements with the following borrowers:
| Borrower | Type | Principal Amount | Value | |||||||
David’s Bridal, Inc. | Asset-Based Revolver Loan | $ | 1,572,681 | $ | 1,462,593 | |||||
Delta Air Lines, Inc. | Revolver Loan | 1,144,857 | 1,116,236 | |||||||
Delta Air Lines, Inc. | Revolver Loan | 7,785,030 | 7,609,867 | |||||||
Equinox Holdings, Inc. | Revolver Loan | 1,493,012 | 1,384,769 | |||||||
Getty Images, Inc. | Revolver Loan | 4,888,802 | 4,302,146 | |||||||
H.J. Heinz Co. | Revolver Loan | 10,580,654 | 10,492,412 | |||||||
Lake at Las Vegas Joint Venture, LLC | Exit Revolver Loan | 10,794 | 3,265 | |||||||
Ziggo B.V. | Term Loan | 498,713 | 490,013 | |||||||
| $ | 27,974,543 | $ | 26,861,301 | |||||||
NOTE 8—Distributions to Shareholders and Tax Components of Net Assets
Tax Character of Distributions to Shareholders Paid During the Years Ended August 31, 2014 and 2013:
| 2014 | 2013 | |||||||
Ordinary income | $ | 102,386,917 | $ | 57,938,642 | ||||
Tax Components of Net Assets at Period-End:
| 2014 | ||||
Undistributed ordinary income | $ | 1,741,550 | ||
Net unrealized appreciation — investments | 664,979 | |||
Net unrealized appreciation (depreciation) — investments matured | (148,695 | ) | ||
Temporary book/tax differences | (168,180 | ) | ||
Post-October deferrals | (7,318,020 | ) | ||
Capital loss carryforward | (2,739,285 | ) | ||
Shares of beneficial interest | 2,628,985,058 | |||
Total net assets | $ | 2,621,017,407 | ||
The difference between book-basis and tax-basis unrealized appreciation (depreciation) is due to differences in the timing of recognition of gains and losses on investments for tax and book purposes. The Fund’s net unrealized appreciation (depreciation) difference is attributable primarily to wash sales, book to tax accretion and amortization differences.
The temporary book/tax differences are a result of timing differences between book and tax recognition of income and/or expenses. The Fund’s temporary book/tax differences are the result of the trustee deferral of compensation and retirement plan benefits.
Capital loss carryforward is calculated and reported as of a specific date. Results of transactions and other activity after that date may affect the amount of capital loss carryforward actually available for the Fund to utilize. Capital losses generated in years beginning after December 22, 2010 can be carried forward for an unlimited period, whereas previous losses expire in 8 tax years. Capital losses with an expiration period may not be used to offset capital gains until all net capital losses without an expiration date have been utilized. Capital loss carryforwards with no expiration date will retain their character as either short-term or long-term capital losses instead of as short-term capital losses as under prior law. The ability to utilize capital loss carryforward in the future may be limited under the Internal Revenue Code and related regulations based on the results of future transactions.
36 Invesco Floating Rate Fund
The Fund utilized $3,300,269 of capital loss carryforward in the current period to offset net realized capital gain for federal income tax purposes. The Fund has a capital loss carryforward as of August 31, 2014, which expires as follows:
| Capital Loss Carryforward* | ||||||||||||
| Expiration | Short-Term | Long-Term | Total | |||||||||
August 31, 2017 | $ | 2,739,285 | $ | — | $ | 2,739,285 | ||||||
| * | Capital loss carryforward as of the date listed above is reduced for limitations, if any, to the extent required by the Internal Revenue Code and may be further limited depending upon a variety of factors, including the realization of net unrealized gains or losses as of the date of any reorganization. |
NOTE 9—Investment Securities
The aggregate amount of investment securities (other than short-term securities, U.S. Treasury obligations and money market funds, if any) purchased and sold by the Fund during the year ended August 31, 2014 was $2,693,595,866 and $2,056,511,169, respectively. Cost of investments on a tax basis includes the adjustments for financial reporting purposes as of the most recently completed federal income tax reporting period-end.
| Unrealized Appreciation (Depreciation) of Investment Securities on a Tax Basis | ||||
Aggregate unrealized appreciation of investment securities | $ | 22,495,460 | ||
Aggregate unrealized (depreciation) of investment securities | (21,830,481 | ) | ||
Net unrealized appreciation of investment securities | $ | 664,979 | ||
Cost of investments for tax purposes is $2,715,493,719.
NOTE 10—Reclassification of Permanent Differences
Primarily as a result of differing book/tax treatment of the sale of bonds with amortization and excise taxes, on August 31, 2014, undistributed net investment income was increased by $811,469, undistributed net realized gain (loss) was decreased by $764,750 and shares of beneficial interest was decreased by $46,719. This reclassification had no effect on the net assets of the Fund.
37 Invesco Floating Rate Fund
NOTE 11—Share Information
| Summary of Share Activity | ||||||||||||||||
| Years Ended August 31, | ||||||||||||||||
| 2014(a) | 2013 | |||||||||||||||
| Shares | Amount | Shares | Amount | |||||||||||||
Sold: | ||||||||||||||||
Class A | 73,021,095 | $ | 582,061,700 | 85,809,233 | $ | 681,689,852 | ||||||||||
Class C | 43,755,226 | 347,221,070 | 39,732,283 | 314,470,469 | ||||||||||||
Class R | 1,028,390 | 8,209,977 | 282,129 | 2,247,568 | ||||||||||||
Class Y | 86,284,466 | 686,988,793 | 65,890,315 | 522,776,943 | ||||||||||||
Class R5 | 670,297 | 5,353,051 | 1,652,090 | 13,075,361 | ||||||||||||
Class R6(b) | 3,394,845 | 27,056,438 | 7,948,789 | 62,499,889 | ||||||||||||
Issued as reinvestment of dividends: | ||||||||||||||||
Class A | 3,944,046 | 31,431,898 | 2,577,561 | 20,453,288 | ||||||||||||
Class C | 2,116,573 | 16,796,382 | 1,263,362 | 9,972,285 | ||||||||||||
Class R | 39,884 | 318,622 | 12,477 | 99,053 | ||||||||||||
Class Y | 2,630,434 | 20,928,501 | 1,196,684 | 9,480,543 | ||||||||||||
Class R5 | 52,414 | 418,127 | 72,079 | 571,177 | ||||||||||||
Class R6 | 387,916 | 3,091,977 | 305,796 | 2,424,391 | ||||||||||||
Reacquired: | ||||||||||||||||
Class A | (68,738,831 | ) | (547,775,394 | ) | (25,392,869 | ) | (201,224,513 | ) | ||||||||
Class C | (24,275,598 | ) | (192,656,477 | ) | (8,754,185 | ) | (69,091,983 | ) | ||||||||
Class R | (116,049 | ) | (926,618 | ) | (75,449 | ) | (597,990 | ) | ||||||||
Class Y | (57,403,642 | ) | (456,753,059 | ) | (18,876,729 | ) | (149,545,210 | ) | ||||||||
Class R5 | (873,072 | ) | (6,967,854 | ) | (8,025,950 | ) | (63,163,235 | ) | ||||||||
Class R6 | (1,286,994 | ) | (10,268,658 | ) | (311,797 | ) | (2,471,466 | ) | ||||||||
Net increase in share activity | 64,631,400 | $ | 514,528,476 | 145,305,819 | $ | 1,153,666,422 | ||||||||||
| (a) | There are entities that are record owners of more than 5% of the outstanding shares of the Fund and in the aggregate own 66% of the outstanding shares of the Fund. IDI has an agreement with these entities to sell Fund shares. The Fund, Invesco and/or Invesco affiliates may make payments to these entities, which are considered to be related to the Fund, for providing services to the Fund, Invesco and/or Invesco affiliates including but not limited to services such as securities brokerage, distribution, third party record keeping and account servicing. The Fund has no knowledge as to whether all or any portion of the shares owned of record by these entities are also owned beneficially. |
| (b) | Commencement date of September 24, 2012. |
NOTE 12—Senior Loan Participation Commitments
The Fund invests in participations, assignments, or acts as a party to the primary lending syndicate of a Senior Loan interest to corporations, partnerships, and other entities. When the Fund purchases a participation of a Senior Loan interest, the Fund typically enters into a contractual agreement with the lender or other third party selling the participation, but not with the borrower directly. As such, the Fund assumes the credit risk of the borrower, selling participant or other persons interpositioned between the Fund and the borrower.
At the year ended August 31, 2014, the following sets forth the selling participants with respect to interest in Senior Loans purchased by the Fund on a participation basis.
| Selling Participant | Principal Amount | Value | ||||||
Barclays Bank PLC | $ | 4,888,802 | $ | 4,302,146 | ||||
Goldman Sachs Lending Partners LLC | 12,153,335 | 11,955,005 | ||||||
Total | $ | 17,042,137 | $ | 16,257,151 | ||||
38 Invesco Floating Rate Fund
NOTE 13—Financial Highlights
The following schedule presents financial highlights for a share of the Fund outstanding throughout the periods indicated.
| Net asset value, beginning of period | Net investment income(a) | Net gains (losses) on securities (both realized and unrealized) | Total from investment operations | Dividends from net investment income | Net asset value, end of period(b) | Total return(c) | Net assets, end of period (000’s omitted) | Ratio of expenses to average net assets with fee waivers and/or expenses absorbed | Ratio of expenses to average net assets without fee waivers and/or expenses absorbed | Ratio of net investment income to average net assets | Portfolio turnover(d) | |||||||||||||||||||||||||||||||||||||
Class A | ||||||||||||||||||||||||||||||||||||||||||||||||
Year ended 08/31/14 | $ | 7.93 | $ | 0.32 | $ | 0.03 | $ | 0.35 | $ | (0.33 | ) | $ | 7.95 | 4.43 | % | $ | 1,025,092 | 1.03 | %(e)(f) | 1.04 | %(e)(f) | 4.01 | %(e) | 82 | % | |||||||||||||||||||||||
Year ended 08/31/13 | 7.77 | 0.35 | 0.17 | 0.52 | (0.36 | ) | 7.93 | 6.83 | 957,442 | 1.08 | (f) | 1.09 | (f) | 4.36 | 97 | |||||||||||||||||||||||||||||||||
Year ended 08/31/12 | 7.36 | 0.37 | 0.41 | 0.78 | (0.37 | ) | 7.77 | 10.75 | 448,142 | 1.11 | (f) | 1.11 | (f) | 4.80 | 82 | |||||||||||||||||||||||||||||||||
Year ended 08/31/11 | 7.47 | 0.35 | (0.11 | ) | 0.24 | (0.35 | ) | 7.36 | 3.07 | 450,750 | 0.99 | (f) | 1.00 | (f) | 4.53 | 152 | ||||||||||||||||||||||||||||||||
Year ended 08/31/10 | 7.09 | 0.40 | 0.39 | (g) | 0.79 | (0.41 | ) | 7.47 | 11.28 | (g) | 359,476 | 1.12 | (f) | 1.14 | (f) | 5.34 | 106 | |||||||||||||||||||||||||||||||
Class C | ||||||||||||||||||||||||||||||||||||||||||||||||
Year ended 08/31/14 | 7.90 | 0.28 | 0.03 | 0.31 | (0.29 | ) | 7.92 | 3.91 | 691,152 | 1.53 | (e)(f) | 1.54 | (e)(f) | 3.51 | (e) | 82 | ||||||||||||||||||||||||||||||||
Year ended 08/31/13 | 7.73 | 0.31 | 0.18 | 0.49 | (0.32 | ) | 7.90 | 6.45 | 518,948 | 1.58 | (f) | 1.59 | (f) | 3.86 | 97 | |||||||||||||||||||||||||||||||||
Year ended 08/31/12 | 7.32 | 0.33 | 0.41 | 0.74 | (0.33 | ) | 7.73 | 10.24 | 258,800 | 1.61 | (f) | 1.61 | (f) | 4.30 | 82 | |||||||||||||||||||||||||||||||||
Year ended 08/31/11 | 7.44 | 0.31 | (0.12 | ) | 0.19 | (0.31 | ) | 7.32 | 2.41 | 267,796 | 1.49 | (f) | 1.50 | (f) | 4.03 | 152 | ||||||||||||||||||||||||||||||||
Year ended 08/31/10 | 7.06 | 0.36 | 0.39 | (g) | 0.75 | (0.37 | ) | 7.44 | 10.75 | (g) | 189,966 | 1.62 | (f) | 1.64 | (f) | 4.84 | 106 | |||||||||||||||||||||||||||||||
Class R | ||||||||||||||||||||||||||||||||||||||||||||||||
Year ended 08/31/14 | 7.95 | 0.30 | 0.03 | 0.33 | (0.31 | ) | 7.97 | 4.18 | 11,152 | 1.28 | (e)(f) | 1.29 | (e)(f) | 3.76 | (e) | 82 | ||||||||||||||||||||||||||||||||
Year ended 08/31/13 | 7.79 | 0.33 | 0.17 | 0.50 | (0.34 | ) | 7.95 | 6.57 | 3,559 | 1.33 | (f) | 1.34 | (f) | 4.11 | 97 | |||||||||||||||||||||||||||||||||
Year ended 08/31/12 | 7.37 | 0.35 | 0.42 | 0.77 | (0.35 | ) | 7.79 | 10.61 | 1,779 | 1.36 | (f) | 1.36 | (f) | 4.55 | 82 | |||||||||||||||||||||||||||||||||
Year ended 08/31/11 | 7.49 | 0.33 | (0.12 | ) | 0.21 | (0.33 | ) | 7.37 | 2.68 | 1,491 | 1.24 | (f) | 1.25 | (f) | 4.28 | 152 | ||||||||||||||||||||||||||||||||
Year ended 08/31/10 | 7.10 | 0.39 | 0.39 | (g) | 0.78 | (0.39 | ) | 7.49 | 11.15 | (g) | 1,080 | 1.37 | (f) | 1.39 | (f) | 5.09 | 106 | |||||||||||||||||||||||||||||||
Class Y | ||||||||||||||||||||||||||||||||||||||||||||||||
Year ended 08/31/14 | 7.92 | 0.34 | 0.03 | 0.37 | (0.35 | ) | 7.94 | 4.69 | 802,508 | 0.78 | (e)(f) | 0.79 | (e)(f) | 4.26 | (e) | 82 | ||||||||||||||||||||||||||||||||
Year ended 08/31/13 | 7.76 | 0.37 | 0.17 | 0.54 | (0.38 | ) | 7.92 | 7.10 | 550,974 | 0.83 | (f) | 0.84 | (f) | 4.61 | 97 | |||||||||||||||||||||||||||||||||
Year ended 08/31/12 | 7.34 | 0.38 | 0.42 | 0.80 | (0.38 | ) | 7.76 | 11.19 | 165,609 | 0.86 | (f) | 0.86 | (f) | 5.05 | 82 | |||||||||||||||||||||||||||||||||
Year ended 08/31/11 | 7.46 | 0.37 | (0.12 | ) | 0.25 | (0.37 | ) | 7.34 | 3.19 | 125,900 | 0.74 | (f) | 0.75 | (f) | 4.78 | 152 | ||||||||||||||||||||||||||||||||
Year ended 08/31/10 | 7.07 | 0.42 | 0.39 | (g) | 0.81 | (0.42 | ) | 7.46 | 11.72 | (g) | 93,479 | 0.87 | (f) | 0.89 | (f) | 5.59 | 106 | |||||||||||||||||||||||||||||||
Class R5 | ||||||||||||||||||||||||||||||||||||||||||||||||
Year ended 08/31/14 | 7.94 | 0.34 | 0.03 | 0.37 | (0.35 | ) | 7.96 | 4.72 | 8,087 | 0.76 | (e)(f) | 0.77 | (e)(f) | 4.28 | (e) | 82 | ||||||||||||||||||||||||||||||||
Year ended 08/31/13 | 7.77 | 0.37 | 0.18 | 0.55 | (0.38 | ) | 7.94 | 7.26 | 9,260 | 0.81 | (f) | 0.82 | (f) | 4.63 | 97 | |||||||||||||||||||||||||||||||||
Year ended 08/31/12 | 7.36 | 0.39 | 0.41 | 0.80 | (0.39 | ) | 7.77 | 11.13 | 58,039 | 0.77 | (f) | 0.77 | (f) | 5.14 | 82 | |||||||||||||||||||||||||||||||||
Year ended 08/31/11 | 7.47 | 0.38 | (0.12 | ) | 0.26 | (0.37 | ) | 7.36 | 3.40 | 48,967 | 0.68 | (f) | 0.69 | (f) | 4.84 | 152 | ||||||||||||||||||||||||||||||||
Year ended 08/31/10 | 7.09 | 0.42 | 0.39 | (g) | 0.81 | (0.43 | ) | 7.47 | 11.65 | (g) | 37,580 | 0.79 | (f) | 0.81 | (f) | 5.67 | 106 | |||||||||||||||||||||||||||||||
Class R6 | ||||||||||||||||||||||||||||||||||||||||||||||||
Year ended 08/31/14 | 7.94 | 0.35 | 0.01 | 0.36 | (0.35 | ) | 7.95 | 4.66 | 83,025 | 0.69 | (e)(f) | 0.70 | (e)(f) | 4.35 | (e) | 82 | ||||||||||||||||||||||||||||||||
Year ended 08/31/13(h) | 7.84 | 0.35 | 0.11 | 0.46 | (0.36 | ) | 7.94 | 6.01 | 63,032 | 0.76 | (f)(i) | 0.77 | (f)(i) | 4.68 | (i) | 97 | ||||||||||||||||||||||||||||||||
| (a) | Calculated using average shares outstanding. |
| (b) | Includes redemption fees added to shares of beneficial interest which were less than $0.005 per share for the fiscal years ended August 31, 2012 and prior. |
| (c) | Includes adjustments in accordance with accounting principles generally accepted in the United States of America and as such, the net asset value for financial reporting purposes and the returns based upon those net asset values may differ from the net asset value and returns for shareholder transactions. Does not include sales charges and is not annualized for periods less than one year, if applicable. |
| (d) | Portfolio turnover is calculated at the fund level and is not annualized for periods less than one year, if applicable. |
| (e) | Ratios are based on average daily net assets (000’s omitted) of $1,098,491, $629,026, $8,959, $720,250, $9,697 and $69,674 for Class A, Class C, Class R, Class Y, Class R5 and Class R6 shares, respectively. |
| (f) | Ratio includes line of credit expense of 0.02%, 0.02%, 0.03%, 0.01% and 0.02% for the year ended August 31, 2014, August 31, 2013, August 31, 2012, August 31, 2011 and August 31, 2010, respectively. |
| (g) | Includes the impact of the valuation policy on Corporate Loans effective January 1, 2010. Had the policy change not occurred, Net gains on securities (both realized and unrealized) per share would have been $0.33, $0.33, $0.33, $0.33 and $0.33 for Class A, Class C, Class R, Class Y and Class R5 shares, respectively, and total returns would have been lower. |
| (h) | Commencement date September 24, 2012. |
| (i) | Annualized. |
39 Invesco Floating Rate Fund
Report of Independent Registered Public Accounting Firm
To the Board of Trustees of AIM Counselor Series Trust (Invesco Counselor Series Trust) and
Shareholders of Invesco Floating Rate Fund:
In our opinion, the accompanying statement of assets and liabilities, including the schedule of investments, and the related statements of operations, of changes in net assets and of cash flows and the financial highlights present fairly, in all material respects, the financial position of Invesco Floating Rate Fund (one of the funds constituting AIM Counselor Series Trust (Invesco Counselor Series Trust), hereafter referred to as the “Fund”) at August 31, 2014, the results of its operations and its cash flows for the year then ended, the changes in its net assets for each of the two years in the period then ended and the financial highlights for each of the five years in the period then ended, in conformity with accounting principles generally accepted in the United States of America. These financial statements and financial highlights (hereafter referred to as “financial statements”) are the responsibility of the Fund’s management. Our responsibility is to express an opinion on these financial statements based on our audits. We conducted our audits of these financial statements in accordance with the standards of the Public Company Accounting Oversight Board (United States). Those standards require that we plan and perform the audit to obtain reasonable assurance about whether the financial statements are free of material misstatement. An audit includes examining, on a test basis, evidence supporting the amounts and disclosures in the financial statements, assessing the accounting principles used and significant estimates made by management, and evaluating the overall financial statement presentation. We believe that our audits, which included confirmation of securities at August 31, 2014 by correspondence with the custodian and brokers, provide a reasonable basis for our opinion.
PRICEWATERHOUSECOOPERS LLP
October 30, 2014
Houston, Texas
40 Invesco Floating Rate Fund
Calculating your ongoing Fund expenses
Example
As a shareholder of the Fund, you incur two types of costs: (1) transaction costs, which may include sales charges (loads) on purchase payments or contingent deferred sales charges on redemptions, if any; and (2) ongoing costs, including management fees, distribution and/or service (12b-1) fees, and other Fund expenses. This example is intended to help you understand your ongoing costs (in dollars) of investing in the Fund and to compare these costs with ongoing costs of investing in other mutual funds. The example is based on an investment of $1,000 invested at the beginning of the period and held for the entire period March 1, 2014 through August 31, 2014.
Actual expenses
The table below provides information about actual account values and actual expenses. You may use the information in this table, together with the amount you invested, to estimate the expenses that you paid over the period. Simply divide your account value by $1,000 (for example, an $8,600 account value divided by $1,000 = 8.6), then multiply the result by the number in the table under the heading entitled “Actual Expenses Paid During Period” to estimate the expenses you paid on your account during this period.
Hypothetical example for comparison purposes
The table below also provides information about hypothetical account values and hypothetical expenses based on the Fund’s actual expense ratio and an assumed rate of return of 5% per year before expenses, which is not the Fund’s actual return.
The hypothetical account values and expenses may not be used to estimate the actual ending account balance or expenses you paid for the period. You may use this information to compare the ongoing costs of investing in the Fund and other funds. To do so, compare this 5% hypothetical example with the 5% hypothetical examples that appear in the shareholder reports of the other funds.
Please note that the expenses shown in the table are meant to highlight your ongoing costs only and do not reflect any transaction costs, such as sales charges (loads) on purchase payments or contingent deferred sales charges on redemptions, if any. Therefore, the hypothetical information is useful in comparing ongoing costs only, and will not help you determine the relative total costs of owning different funds. In addition, if these transaction costs were included, your costs would have been higher.
| Class | Beginning Account Value (03/01/14) | ACTUAL | HYPOTHETICAL (5% annual return before expenses) | Annualized Expense Ratio | ||||||||||||||||||||
| Ending Account Value (08/31/14)1 | Expenses Paid During Period2 | Ending Account Value (08/31/14) | Expenses Paid During Period2 | |||||||||||||||||||||
| A | $ | 1,000.00 | $ | 1,017.70 | $ | 5.34 | $ | 1,019.91 | $ | 5.35 | 1.05 | % | ||||||||||||
| C | 1,000.00 | 1,014.60 | 7.87 | 1,017.39 | 7.88 | 1.55 | ||||||||||||||||||
| R | 1,000.00 | 1,015.90 | 6.61 | 1,018.65 | 6.61 | 1.30 | ||||||||||||||||||
| Y | 1,000.00 | 1,018.40 | 4.07 | 1,021.17 | 4.08 | 0.80 | ||||||||||||||||||
| R5 | 1,000.00 | 1,018.50 | 3.97 | 1,021.27 | 3.97 | 0.78 | ||||||||||||||||||
| R6 | 1,000.00 | 1,017.70 | 3.56 | 1,021.68 | 3.57 | 0.70 | ||||||||||||||||||
| 1 | The actual ending account value is based on the actual total return of the Fund for the period March 1, 2014 through August 31, 2014, after actual expenses and will differ from the hypothetical ending account value which is based on the Fund’s expense ratio and a hypothetical annual return of 5% before expenses. |
| 2 | Expenses are equal to the Fund’s annualized expense ratio as indicated above multiplied by the average account value over the period, multiplied by 184/365 to reflect the most recent fiscal half year. |
41 Invesco Floating Rate Fund
Approval of Investment Advisory and Sub-Advisory Contracts
The Board of Trustees (the Board) of AIM Counselor Series Trust (Invesco Counselor Series Trust) is required under the Investment Company Act of 1940, as amended, to approve annually the renewal of Invesco Floating Rate Fund’s (the Fund) investment advisory agreements. During contract renewal meetings held on June 16-17, 2014, the Board as a whole, and the disinterested or “independent” Trustees, who comprise over 75% of the Board, voting separately, approved the continuance for the Fund of the Master Investment Advisory Agreement with Invesco Advisers, Inc. (Invesco Advisers) and the Master Intergroup Sub-Advisory Contract for Mutual Funds with Invesco Asset Management Deutschland GmbH, Invesco Asset Management Limited, Invesco Asset Management (Japan) Limited, Invesco Australia Limited, Invesco Hong Kong Limited, Invesco Senior Secured Management, Inc. and Invesco Canada Ltd. (collectively, the Affiliated Sub-Advisers and the sub-advisory contracts) for another year, effective July 1, 2014.
In evaluating the fairness and reasonableness of compensation under the Fund’s investment advisory agreement and sub-advisory contracts, the Board considered, among other things, the factors discussed below. The Board determined that continuation of the Fund’s investment advisory agreement and the sub-advisory contracts are in the best interest of the Fund and its shareholders and that the compensation payable to Invesco Advisers and the Affiliated Sub-Advisers under the agreements is fair and reasonable.
The Board’s Fund Evaluation Process
The Board’s Investments Committee has established three Sub-Committees, each of which is primarily responsible for overseeing the management of a number of the funds advised by Invesco Advisers (the Invesco Funds). The Sub-Committees meet throughout the year to review the performance of their assigned Invesco Funds, including reviewing materials prepared under the direction of the independent Senior Officer, an officer of the Invesco Funds who reports directly to the independent Trustees. Over the course of each year, the Sub-Committees meet with portfolio managers for their assigned Invesco Funds and other members of management to review the performance, investment objective(s), policies, strategies, limitations and investment risks of these funds. The Sub-Committees meet regularly and at designated contract renewal meetings each year to conduct a review of the performance, fees, expenses and other matters related to their assigned Invesco Funds. Each Sub-Committee recommends to the Investments Committee, which in turn recommends to the full Board, whether and on what terms to approve the continuance of each Invesco Fund’s
investment advisory agreement and sub-advisory contracts for another year.
During the contract renewal process, the Trustees receive comparative performance and fee data regarding the Invesco Funds prepared by Invesco Advisers and Lipper Inc. (Lipper), an independent provider of investment company data. The Trustees also receive an independent written evaluation from the Senior Officer. The Senior Officer’s evaluation is prepared as part of his responsibility to manage the process by which the Invesco Funds’ proposed management fees are negotiated during the annual contract renewal process to ensure they are negotiated in a manner that is at arms’ length and reasonable. In addition to meetings with Invesco Advisers and fund counsel, the independent Trustees also discuss the continuance of the investment advisory agreement and sub-advisory contracts in separate sessions with the Senior Officer and with independent legal counsel.
The Trustees recognized that the advisory fee rates for the Invesco Funds are, in many cases, the result of years of review and negotiation. The Trustees’ deliberations and conclusions in a particular year may be based in part on their deliberations and conclusions regarding these arrangements throughout the year and in prior years. The Trustees’ review and conclusions are based on the comprehensive consideration of all information presented to them and are not the result of any single determinative factor. Moreover, one Trustee may have weighed a particular piece of information or factor differently than another Trustee.
The discussion below serves as the Senior Officer’s independent written evaluation with respect to the Fund’s investment advisory agreement as well as a discussion of the material factors and related conclusions that formed the basis for the Board’s approval of the Fund’s investment advisory agreement and sub-advisory contracts. Unless otherwise stated, this information is current as of June 17, 2014, and may not reflect consideration of factors that became known to the Board after that date.
Factors and Conclusions and Summary of Independent Written Fee Evaluation
| A. | Nature, Extent and Quality of Services Provided by Invesco Advisers and the Affiliated Sub-Advisers |
The Board reviewed the advisory services provided to the Fund by Invesco Advisers under the Fund’s investment advisory agreement, the performance of Invesco Advisers in providing these services, and the credentials and experience of the officers and employees of Invesco Advisers who provide these services, including the Fund’s portfolio manager or managers, with whom the Sub-Committees met during the year. The Board’s review of the
qualifications of Invesco Advisers to provide advisory services included the Board’s consideration of Invesco Advisers’ investment process oversight, independent credit analysis and investment risk management. The Board also considered non-advisory services that Invesco Advisers and its affiliates provide to the Invesco Funds such as various back office support functions, equity and fixed income trading operations, internal audit, distribution and legal and compliance.
In determining whether to continue the Fund’s investment advisory agreement, the Board considered the benefits of reapproving an existing relationship and the greater uncertainty that may be associated with entering into a new relationship. The Board concluded that the nature, extent and quality of the services provided to the Fund by Invesco Advisers are appropriate and satisfactory and consistent with the terms of the Fund’s investment advisory agreement.
The Board reviewed the services that may be provided by the Affiliated Sub-Advisers under the sub-advisory contracts and the credentials and experience of the officers and employees of the Affiliated Sub-Advisers who provide these services. The Board noted that the Affiliated Sub-Advisers have offices and personnel that are located in financial centers around the world. As a result, the Affiliated Sub-Advisers can provide research and investment analysis on the markets and economies of various countries in which the Fund may invest, make recommendations regarding securities and assist with security trades. The Board concluded that the sub-advisory contracts benefit the Fund and its shareholders by permitting Invesco Advisers to use the resources and talents of the Affiliated Sub-Advisers in managing the Fund. The Board concluded that the nature, extent and quality of the services that may be provided by the Affiliated Sub-Advisers are appropriate and satisfactory and consistent with the terms of the Fund’s sub-advisory contracts.
| B. | Fund Performance |
The Board considered Fund performance as a relevant factor in considering whether to approve the investment advisory agreement as well as the sub-advisory contracts for the Fund, as Invesco Senior Secured Management, Inc. currently manages assets of the Fund.
The Board compared the Fund’s performance during the past one, three and five calendar years to the performance of funds in the Lipper performance universe and against the Lipper Loan Participation Funds Index. The Board noted that performance of Class A shares of the Fund was in the second quintile of its performance universe for the one year period and the first quintile for the three and five year periods (the first quintile being the best performing funds and the fifth quintile being the worst performing funds). The Board noted that performance of
42 Invesco Floating Rate Fund
Class A shares of the Fund was above the performance of the Index for the one, three and five year periods. The Trustees also reviewed more recent Fund performance and this review did not change their conclusions.
| C. | Advisory and Sub-Advisory Fees |
The Board compared the Fund’s contractual management fee rate to the contractual management fee rates of funds in the Fund’s Lipper expense group at a common asset level. The Board noted that the contractual management fee rate for Class A shares of the Fund was below the median contractual management fee rate of funds in its expense group. The Board noted that the term “contractual management fee” may include both advisory and certain administrative services fees, but that Lipper does not provide information on a fund by fund basis as to what is included. The Board noted that Invesco Advisers does not charge the Invesco Funds for the administrative services included in the term as defined by Lipper. The Board also reviewed the methodology used by Lipper in providing expense group information, which includes using each fund’s contractual management fee schedule (including any applicable breakpoints) as reported in the most recent prospectus or statement of additional information for each fund in the expense group.
The Board noted that Invesco Advisers has contractually agreed to waive fees and/or limit expenses of the Fund through at least June 30, 2015 in an amount necessary to limit total annual operating expenses to a specified percentage of average daily net assets for each class of the Fund.
The Board also compared the Fund’s effective advisory fee rate (the advisory fee rate after advisory fee waivers and before other expense limitations/waivers) to the effective advisory fee rates of other mutual funds advised by Invesco Advisers and its affiliates that are managed using an investment process substantially similar to the investment process used for the Fund. The Board noted that the Fund’s rate was below the rate of one closed-end fund and two off-shore funds and above the rate of three off-shore funds that are managed using an investment process substantially similar to the investment process used for the Fund.
The Board also considered the fees charged by Invesco Advisers and the Affiliated Sub-Advisers to other client accounts that are managed using an investment process substantially similar to the investment process used for the Fund. The Board noted that Invesco Advisers or the Affiliated Sub-Advisers may charge lower fees to large institutional clients. Invesco Advisers reviewed with the Board the significantly greater scope of services it provides to the Invesco Funds relative to certain other client accounts. These additional services include provision of administrative services, officers and office space, oversight of service providers, preparation of annual registration statement updates and financial information and regulatory compliance under the
Investment Company Act of 1940, as amended. Invesco Advisers also reviewed generally the higher frequency of shareholder purchases and redemptions in the Invesco Funds relative to the flow of assets for other client accounts. Invesco Advisers advised the Board that advance notice of redemptions is often provided to Invesco Advisers by institutional clients. The Board did note that sub-advisory fee rates charged by the Affiliated Sub-Advisers to manage the Invesco Funds and to manage other client accounts tended to be more comparable, reflecting a more comparable scope of services. The Board concluded that the aggregate services provided to the Invesco Funds were sufficiently different from those provided to institutional clients to support the difference in fees.
The Board also considered the services that may be provided by the Affiliated Sub-Advisers pursuant to the sub-advisory contracts, as well as the fees payable by Invesco Advisers to the Affiliated Sub-Advisers pursuant to the sub-advisory contracts. The Board noted that Invesco Advisers retains overall responsibility for, and provides services to, sub-advised Invesco Funds, including oversight of the Affiliated Sub-Advisers as well as the additional services described herein other than day-to-day portfolio management. The Board also noted that the sub-advisory fees are not paid directly by the Fund, but rather, are payable by Invesco Advisers to the Affiliated Sub-Advisers.
| D. | Economies of Scale and Breakpoints |
The Board considered the extent to which there are economies of scale in the provision of advisory services to the Fund. The Board also considered whether the Fund benefits from economies of scale through contractual breakpoints in the Fund’s advisory fee schedule and was assisted in this review by a report from the Senior Officer. The Board also noted that the Fund shares directly in economies of scale through lower fees charged by third party service providers based on the combined size of the Invesco Funds and other clients advised by Invesco Advisers.
| E. | Profitability and Financial Resources |
The Board reviewed information from Invesco Advisers concerning the costs of the advisory and other services that Invesco Advisers and its affiliates provide to the Fund and the profitability of Invesco Advisers and its affiliates in providing these services for the year ended December 31, 2013. The Board received information from Invesco Advisers about the methodology used to prepare the profitability information. The Board considered the profitability of Invesco Advisers in managing the Fund and the Invesco Funds. The Board noted that Invesco Advisers continues to operate at a net profit from services Invesco Advisers and its subsidiaries provide to the Invesco Funds and the Fund. The Board did not deem the level of profits realized by Invesco Advisers and its affiliates from providing services to the Fund to be excessive given the nature, quality and extent of the services provided to the Invesco Funds. The Board received and accepted
information from Invesco Advisers demonstrating that Invesco Advisers and each Affiliated Sub-Adviser are financially sound and have the resources necessary to perform their obligations under the investment advisory agreement and sub-advisory contracts.
| F. | Collateral Benefits to Invesco Advisers and its Affiliates |
The Board considered various other benefits received by Invesco Advisers and its affiliates from the relationship with the Fund, including the fees received for their provision of transfer agency and distribution services to the Fund. The Board considered comparative information regarding fees charged for these services, including information provided by Lipper and other independent sources. The Board considered the performance of Invesco Advisers and its affiliates in providing these services and the organizational structure employed to provide these services. The Board also considered that these services are provided to the Fund pursuant to written contracts that are reviewed and approved on an annual basis by the Board; that the services are required for the operation of the Fund; that Invesco Advisers and its affiliates can provide services, the nature and quality of which are at least equal to those provided by others offering the same or similar services; and that the fees for such services are fair and reasonable in light of the usual and customary charges by others for services of the same nature and quality.
The Board considered the benefits realized by Invesco Advisers and the Affiliated Sub-Advisers as a result of portfolio brokerage transactions executed through “soft dollar” arrangements. Invesco Advisers noted that the Fund does not execute brokerage transactions through “soft dollar” arrangements to any significant degree.
The Board considered that the Fund’s uninvested cash and cash collateral from any securities lending arrangements may be invested in money market funds advised by Invesco Advisers pursuant to procedures approved by the Board. The Board noted that Invesco Advisers receives advisory fees from these affiliated money market funds attributable to such investments, although Invesco Advisers has contractually agreed to waive through varying periods the advisory fees payable by the Invesco Funds with respect to investments in the affiliated money market funds. The waiver is in an amount equal to 100% of the net advisory fee Invesco Advisers receives from the affiliated money market funds with respect to the Fund’s investment in the affiliated money market funds of uninvested cash, but not cash collateral. The Board concluded that the amount of advisory fees received by Invesco Advisors from the Fund’s investment of uninvested cash and cash collateral from any securities lending arrangements in the affiliated money market funds are fair and reasonable.
43 Invesco Floating Rate Fund
Tax Information
Form 1099-DIV, Form 1042-S and other year–end tax information provide shareholders with actual calendar year amounts that should be included in their tax returns. Shareholders should consult their tax advisors.
The following distribution information is being provided as required by the Internal Revenue Code or to meet a specific state’s requirement.
The Fund designates the following amounts or, if subsequently determined to be different, the maximum amount allowable for its fiscal year ended August 31, 2014:
Federal and State Income Tax | ||||
Qualified Dividend Income* | 2.14 | % | ||
Corporate Dividends Received Deduction* | 2.14 | % | ||
| * | The above percentages are based on ordinary income dividends paid to shareholders during the Fund’s fiscal year. |
44 Invesco Floating Rate Fund
Trustees and Officers
The address of each trustee and officer is AIM Counselor Series Trust (Invesco Counselor Series Trust) (the “Trust”), 11 Greenway Plaza, Suite 1000, Houston, Texas 77046-1173. The trustees serve for the life of the Trust, subject to their earlier death, incapacitation, resignation, retirement or removal as more specifically provided in the Trust’s organizational documents. Each officer serves for a one year term or until their successors are elected and qualified. Column two below includes length of time served with predecessor entities, if any.
Name, Year of Birth and Position(s) Held with the Trust | Trustee and/ or Officer Since | Principal Occupation(s) During Past 5 Years | Number of Funds in Fund Complex Overseen by Trustee | Other Directorship(s) Held by Trustee During Past 5 Years | ||||
| Interested Persons | ||||||||
Martin L. Flanagan1 — 1960 Trustee | 2007 | Executive Director, Chief Executive Officer and President, Invesco Ltd. (ultimate parent of Invesco and a global investment management firm); Advisor to the Board, Invesco Advisers, Inc. (formerly known as Invesco Institutional (N.A.), Inc.); Trustee, The Invesco Funds; Vice Chair, Investment Company Institute; and Member of Executive Board, SMU Cox School of Business.
Formerly: Chairman and Chief Executive Officer, Invesco Advisers, Inc. (registered investment adviser); Director, Chairman, Chief Executive Officer and President, IVZ Inc. (holding company), INVESCO Group Services, Inc. (service provider) and Invesco North American Holdings, Inc. (holding company); Director, Chief Executive Officer and President, Invesco Holding Company Limited (parent of Invesco and a global investment management firm); Director, Invesco Ltd.; Chairman, Investment Company Institute and President, Co-Chief Executive Officer, Co-President, Chief Operating Officer and Chief Financial Officer, Franklin Resources, Inc. (global investment management organization). | 141 | None | ||||
Philip A. Taylor2 — 1954 Trustee, President and Principal Executive Officer | 2006 | Head of North American Retail and Senior Managing Director, Invesco Ltd.; Director, Co-Chairman, Co-President and Co-Chief Executive Officer, Invesco Advisers, Inc. (formerly known as Invesco Institutional (N.A.), Inc.) (registered investment adviser); Director, Chairman, Chief Executive Officer and President, Invesco Management Group, Inc. (formerly known as Invesco Aim Management Group, Inc.) (financial services holding company); Director and President, INVESCO Funds Group, Inc. (registered investment adviser and registered transfer agent); Director and Chairman, Invesco Investment Services, Inc. (formerly known as Invesco Aim Investment Services, Inc.) (registered transfer agent) and IVZ Distributors, Inc. (formerly known as INVESCO Distributors, Inc.) (registered broker dealer); Director, President and Chairman, Invesco Inc. (holding company) and Invesco Canada Holdings Inc. (holding company); Chief Executive Officer, Invesco Corporate Class Inc. (corporate mutual fund company) and Invesco Canada Fund Inc. (corporate mutual fund company); Director, Chairman and Chief Executive Officer, Invesco Canada Ltd. (formerly known as Invesco Trimark Ltd./Invesco Trimark Ltèe) (registered investment adviser and registered transfer agent); Trustee, President and Principal Executive Officer, The Invesco Funds (other than AIM Treasurer’s Series Trust (Invesco Treasurer’s Series Trust) and Short-Term Investments Trust); Trustee and Executive Vice President, The Invesco Funds (AIM Treasurer’s Series Trust (Invesco Treasurer’s Series Trust) and Short-Term Investments Trust only); Director, Invesco Investment Advisers LLC (formerly known as Van Kampen Asset Management); Director, Chief Executive Officer and President, Van Kampen Exchange Corp.
Formerly: Director and Chairman, Van Kampen Investor Services Inc.; Director, Chief Executive Officer and President, 1371 Preferred Inc. (holding company) and Van Kampen Investments Inc.; Director and President, AIM GP Canada Inc. (general partner for limited partnerships) and Van Kampen Advisors, Inc.; Director and Chief Executive Officer, Invesco Trimark Dealer Inc. (registered broker dealer); Director, Invesco Distributors, Inc. (formerly known as Invesco Aim Distributors, Inc.) (registered broker dealer); Manager, Invesco PowerShares Capital Management LLC; Director, Chief Executive Officer and President, Invesco Advisers, Inc.; Director, Chairman, Chief Executive Officer and President, Invesco Aim Capital Management, Inc.; President, Invesco Trimark Dealer Inc. and Invesco Trimark Ltd./Invesco Trimark Ltèe; Director and President, AIM Trimark Corporate Class Inc. and AIM Trimark Canada Fund Inc.; Senior Managing Director, Invesco Holding Company Limited; Director and Chairman, Fund Management Company (former registered broker dealer); President and Principal Executive Officer, The Invesco Funds (AIM Treasurer’s Series Trust (Invesco Treasurer’s Series Trust), and Short-Term Investments Trust only); President, AIM Trimark Global Fund Inc. and AIM Trimark Canada Fund Inc. | 141 | None | ||||
Wayne W. Whalen3 — 1939 Trustee | 2010 | Of Counsel, and prior to 2010, partner in the law firm of Skadden, Arps, Slate, Meagher & Flom LLP, legal counsel to certain funds in the Fund Complex
| 141 | Director of the Mutual fund Directors Forum, a nonprofit membership organization for investment directors; Chairman and Director of the Abraham Lincoln Presidential Library Foundation; and Director of the Stevenson Center for Democracy |
| 1 | Mr. Flanagan is considered an interested person (within the meaning of Section 2(a)(19) of the 1940 Act) of the Trust because he is an officer of the Adviser to the Trust, and an officer and a director of Invesco Ltd., ultimate parent of the Adviser. |
| 2 | Mr. Taylor is considered an interested person (within the meaning of Section 2(a)(19) of the 1940 Act) of the Trust because he is an officer and a director of the Adviser. |
| 3 | Mr. Whalen is retiring effective December 31, 2014. He has been deemed to be an interested person of the Trust because of his prior service as counsel to the predecessor funds of certain Invesco open-end funds and his affiliation with the law firm that served as counsel to such predecessor funds and the Invesco closed-end funds. |
T-1 Invesco Floating Rate Fund
Trustees and Officers—(continued)
Name, Year of Birth and Position(s) Held with the Trust | Trustee and/ or Officer Since | Principal Occupation(s) During Past 5 Years | Number of Funds in Fund Complex Overseen by Trustee | Other Directorship(s) Past 5 Years | ||||
| Independent Trustees | ||||||||
Bruce L. Crockett — 1944 Trustee and Chair | 2003 | Chairman, Crockett Technologies Associates (technology consulting company)
Formerly: Director, Captaris (unified messaging provider); Director, President and Chief Executive Officer, COMSAT Corporation; Chairman, Board of Governors of INTELSAT (international communications company); ACE Limited (insurance company); and Investment Company Institute | 141 | ALPS (Attorneys Liability Protection Society) (insurance company) | ||||
David C. Arch — 1945 Trustee | 2010 | Chairman of Blistex Inc., a consumer health care products manufacturer | 141 | Board member of the Illinois Manufacturers’ Association; Member of the Board of Visitors, Institute for the Humanities, University of Michigan; Member of the Audit Committee of the Edward-Elmhurst Hospital | ||||
Frank S. Bayley — 1939 Trustee | 2003 | Retired. Formerly: Director, Badgley Funds Inc. (registered investment company) (2 portfolios) and General Partner and Of Counsel, law firm of Baker & McKenzie, LLP | 141 | Director and Chairman, C.D. Stimson Company (a real estate investment company); Trustee, The Curtis Institute of Music | ||||
James T. Bunch — 1942 Trustee | 2000 | Managing Member, Grumman Hill Group LLC (family office private equity investments)
Formerly: Founder, Green Manning & Bunch Ltd. (investment banking firm) (1988-2010); Executive Committee, United States Golf Association; and Director, Policy Studies, Inc. and Van Gilder Insurance Corporation | 141 | Chairman, Board of Governors, Western Golf Association; Chairman, Evans Scholars Foundation; and Director, Denver Film Society | ||||
Rodney F. Dammeyer — 1940 Trustee | 2010 | Chairman of CAC, LLC, (private company offering capital investment and management advisory services)
Formerly: Prior to 2001, Managing Partner at Equity Group Corporate Investments; Prior to 1995, Chief Executive Officer of Itel Corporation (formerly Anixter International); Prior to 1985, experience includes Senior Vice President and Chief Financial Officer of Household International, Inc., Executive Vice President and Chief Financial Officer of Northwest Industries, Inc. and Partner of Arthur Andersen & Co.; From 1987 to 2010, Director/Trustee of investment companies in the Van Kampen Funds complex | 141 | Director of Quidel Corporation and Stericycle, Inc. | ||||
Albert R. Dowden — 1941 Trustee | 2003 | Director of a number of public and private business corporations, including the Boss Group, Ltd. (private investment and management); Nature’s Sunshine Products, Inc. and Reich & Tang Funds (5 portfolios) (registered investment company)
Formerly: Director, Homeowners of America Holding Corporation/Homeowners of America Insurance Company (property casualty company); Director, Continental Energy Services, LLC (oil and gas pipeline service); Director, CompuDyne Corporation (provider of product and services to the public security market) and Director, Annuity and Life Re (Holdings), Ltd. (reinsurance company); Director, President and Chief Executive Officer, Volvo Group North America, Inc.; Senior Vice President, AB Volvo; Director of various public and private corporations; Chairman, DHJ Media, Inc.; Director, Magellan Insurance Company; and Director, The Hertz Corporation, Genmar Corporation (boat manufacturer), National Media Corporation; Advisory Board of Rotary Power International (designer, manufacturer, and seller of rotary power engines); and Chairman, Cortland Trust, Inc. (registered investment company) | 141 | Director of: Nature’s Sunshine Products, Inc., Reich & Tang Funds, Homeowners of America Holding Corporation/ Homeowners of America Insurance Company, the Boss Group | ||||
Jack M. Fields — 1952 Trustee | 2003 | Chief Executive Officer, Twenty First Century Group, Inc. (government affairs company); Owner and Chief Executive Officer, Dos Angeles Ranch, L.P. (cattle, hunting, corporate entertainment); and Discovery Global Education Fund (non-profit)
Formerly: Chief Executive Officer, Texana Timber LP (sustainable forestry company); Director of Cross Timbers Quail Research Ranch (non-profit); and member of the U.S. House of Representatives | 141 | Insperity, Inc. (formerly known as Administaff) | ||||
Prema Mathai-Davis — 1950 Trustee | 2003 | Retired. Formerly: Chief Executive Officer, YWCA of the U.S.A. | 141 | None | ||||
Larry Soll — 1942 Trustee | 1997 | Retired. Formerly: Chairman, Chief Executive Officer and President, Synergen Corp. (a biotechnology company) | 141 | None | ||||
Hugo F. Sonnenschein — 1940 Trustee | 2010 | President Emeritus and Honorary Trustee of the University of Chicago and the Adam Smith Distinguished Service Professor in the Department of Economics at the University of Chicago. Prior to 2000, President of the University of Chicago | 141 | Trustee of the University of Rochester and a member of its investment committee; Member of the National Academy of Sciences and the American Philosophical Society; Fellow of the American Academy of Arts and Sciences |
T-2 Invesco Floating Rate Fund
Trustees and Officers—(continued)
Name, Year of Birth and Position(s) Held with the Trust | Trustee and/ or Officer Since | Principal Occupation(s) During Past 5 Years | Number of Funds in Fund Complex Overseen by Trustee | Other Directorship(s) Past 5 Years | ||||
| Independent Trustees—(continued) | ||||||||
Raymond Stickel, Jr. — 1944 Trustee | 2005 | Retired. Formerly: Director, Mainstay VP Series Funds, Inc. (25 portfolios) and Partner, Deloitte & Touche | 141 | None | ||||
Suzanne H. Woolsey — 1941 Trustee | 2014 | Chief Executive Officer of Woolsey Partners LLC | 141 | Emeritus Chair of the Board of Trustees of the Institute for Defense Analyses; Trustee of Colorado College; Trustee of California Institute of Technology; Prior to 2014, Director of Fluor Corp.; Prior to 2010, Trustee of the German Marshall Fund of the United States; Prior to 2010 Trustee of the Rocky Mountain Institute | ||||
| Other Officers | ||||||||
Russell C. Burk — 1958 Senior Vice President and Senior Officer | 2005 | Senior Vice President and Senior Officer, The Invesco Funds | N/A | N/A | ||||
John M. Zerr — 1962 Senior Vice President, Chief Legal Officer and Secretary | 2006 | Director, Senior Vice President, Secretary and General Counsel, Invesco Management Group, Inc. (formerly known as Invesco Aim Management Group, Inc.) and Van Kampen Exchange Corp.; Senior Vice President, Invesco Advisers, Inc. (formerly known as Invesco Institutional (N.A.), Inc.) (registered investment adviser); Senior Vice President and Secretary, Invesco Distributors, Inc. (formerly known as Invesco Aim Distributors, Inc.); Director, Vice President and Secretary, Invesco Investment Services, Inc. (formerly known as Invesco Aim Investment Services, Inc.) and IVZ Distributors, Inc. (formerly known as INVESCO Distributors, Inc.); Director and Vice President, INVESCO Funds Group, Inc.; Senior Vice President, Chief Legal Officer and Secretary, The Invesco Funds; Manager, Invesco PowerShares Capital Management LLC; Director, Secretary and General Counsel, Invesco Investment Advisers LLC (formerly known as Van Kampen Asset Management); Secretary and General Counsel, Invesco Capital Markets, Inc. (formerly known as Van Kampen Funds Inc.) and Chief Legal Officer, PowerShares Exchange-Traded Fund Trust, PowerShares Exchange-Traded Fund Trust II, PowerShares India Exchange-Traded Fund Trust and PowerShares Actively Managed Exchange-Traded Fund Trust
Formerly: Director and Vice President, Van Kampen Advisors Inc.; Director, Vice President, Secretary and General Counsel, Van Kampen Investor Services Inc.; Director, Invesco Distributors, Inc. (formerly known as Invesco Aim Distributors, Inc.); Director, Senior Vice President, General Counsel and Secretary, Invesco Aim Advisers, Inc. and Van Kampen Investments Inc.; Director, Vice President and Secretary, Fund Management Company; Director, Senior Vice President, Secretary, General Counsel and Vice President, Invesco Aim Capital Management, Inc.; Chief Operating Officer and General Counsel, Liberty Ridge Capital, Inc. (an investment adviser); Vice President and Secretary, PBHG Funds (an investment company) and PBHG Insurance Series Fund (an investment company); Chief Operating Officer, General Counsel and Secretary, Old Mutual Investment Partners (a broker-dealer); General Counsel and Secretary, Old Mutual Fund Services (an administrator) and Old Mutual Shareholder Services (a shareholder servicing center); Executive Vice President, General Counsel and Secretary, Old Mutual Capital, Inc. (an investment adviser); and Vice President and Secretary, Old Mutual Advisors Funds (an investment company) | N/A | N/A | ||||
Sheri Morris — 1964 Vice President, Treasurer and Principal Financial Officer | 2003 | Vice President, Treasurer and Principal Financial Officer, The Invesco Funds; Vice President, Invesco Advisers, Inc. (formerly known as Invesco Institutional (N.A.), Inc.) (registered investment adviser); and Vice President, PowerShares Exchange-Traded Fund Trust, PowerShares Exchange-Traded Fund Trust II, PowerShares India Exchange-Traded Fund Trust and PowerShares Actively Managed Exchange-Traded Fund Trust
Formerly: Vice President, Invesco Aim Advisers, Inc., Invesco Aim Capital Management, Inc. and Invesco Aim Private Asset Management, Inc.; Assistant Vice President and Assistant Treasurer, The Invesco Funds and Assistant Vice President, Invesco Advisers, Inc., Invesco Aim Capital Management, Inc. and Invesco Aim Private Asset Management, Inc.; and Treasurer, PowerShares Exchange-Traded Fund Trust, PowerShares Exchange-Traded Fund Trust II, PowerShares India Exchange-Traded Fund Trust and PowerShares Actively Managed Exchange-Traded Fund Trust | N/A | N/A | ||||
T-3 Invesco Floating Rate Fund
Trustees and Officers—(continued)
Name, Year of Birth and Position(s) Held with the Trust | Trustee and/ or Officer Since | Principal Occupation(s) During Past 5 Years | Number of Funds in Fund Complex Overseen by Trustee | Other Directorship(s) Past 5 Years | ||||
| Other Officers—(continued) | ||||||||
Karen Dunn Kelley — 1960 Vice President | 2003 | Senior Managing Director, Investments; Director, Co-President, Co-Chief Executive Officer, and Co-Chairman, Invesco Advisers, Inc. (formerly known as Invesco Institutional (N.A.), Inc.) (registered investment adviser); Chairman, Invesco Senior Secured Management, Inc.; Senior Vice President, Invesco Management Group, Inc. (formerly known as Invesco Aim Management Group, Inc.); Executive Vice President, Invesco Distributors, Inc. (formerly known as Invesco Aim Distributors, Inc.); Director, Invesco Mortgage Capital Inc. and Invesco Management Company Limited; Director and President, INVESCO Asset Management (Bermuda) Ltd., Vice President, The Invesco Funds (other than AIM Treasurer’s Series Trust (Invesco Treasurer’s Series Trust) and Short-Term Investments Trust); and President and Principal Executive Officer, The Invesco Funds (AIM Treasurer’s Series Trust (Invesco Treasurer’s Series Trust) and Short-Term Investments Trust only)
Formerly: Director, INVESCO Global Asset Management Limited and INVESCO Management S.A.; Senior Vice President, Van Kampen Investments Inc. and Invesco Advisers, Inc. (formerly known as Invesco Institutional (N.A.), Inc.) (registered investment adviser); Vice President, Invesco Advisers, Inc. (formerly known as Invesco Institutional (N.A.), Inc.); Director of Cash Management and Senior Vice President, Invesco Advisers, Inc. and Invesco Aim Capital Management, Inc.; Director and President, Fund Management Company; Chief Cash Management Officer, Director of Cash Management, Senior Vice President, and Managing Director, Invesco Aim Capital Management, Inc.; Director of Cash Management, Senior Vice President, and Vice President, Invesco Advisers, Inc. and The Invesco Funds (AIM Treasurer’s Series Trust (Invesco Treasurer’s Series Trust), and Short-Term Investments Trust only) | N/A | N/A | ||||
Crissie M. Wisdom — 1969 Anti-Money Laundering Compliance Officer | 2013 | Anti-Money Laundering Compliance Officer, Invesco Advisers, Inc. (formerly known as Invesco Institutional (N.A.), Inc.) (registered investment adviser), Invesco Capital Markets, Inc. (formerly known as Van Kampen Funds Inc.), Invesco Distributors, Inc., Invesco Investment Services, Inc., Invesco Management Group, Inc., Van Kampen Exchange Corp., The Invesco Funds, and PowerShares Exchange-Traded Fund Trust, PowerShares Exchange-Traded Fund Trust II, PowerShares India Exchange-Traded Fund Trust, and PowerShares Actively Managed Exchange-Traded Fund Trust; and Fraud Prevention Manager and Controls and Risk Analysis Manager for Invesco Investment Services, Inc. | N/A | N/A | ||||
Todd L. Spillane — 1958 Chief Compliance Officer | 2006 | Senior Vice President, Invesco Management Group, Inc. (formerly known as Invesco Aim Management Group, Inc.) and Van Kampen Exchange Corp.; Senior Vice President and Chief Compliance Officer, Invesco Advisers, Inc. (registered investment adviser) (formerly known as Invesco Institutional (N.A.), Inc.); Chief Compliance Officer, The Invesco Funds; Vice President, Invesco Distributors, Inc. (formerly known as Invesco Aim Distributors, Inc.) and Invesco Investment Services, Inc. (formerly known as Invesco Aim Investment Services, Inc.)
Formerly: Chief Compliance Officer, Invesco Funds (Chicago); Senior Vice President, Van Kampen Investments Inc.; Senior Vice President and Chief Compliance Officer, Invesco Aim Advisers, Inc. and Invesco Aim Capital Management, Inc.; Chief Compliance Officer, INVESCO Private Capital Investments, Inc. (holding company), Invesco Private Capital, Inc. (registered investment adviser), Invesco Global Asset Management (N.A.), Inc., Invesco Senior Secured Management, Inc. (registered investment adviser), Van Kampen Investor Services Inc., PowerShares Exchange-Traded Fund Trust, PowerShares Exchange-Traded Fund Trust II, PowerShares India Exchange-Traded Fund Trust and PowerShares Actively Managed Exchange-Traded Fund Trust; and Vice President, Invesco Aim Capital Management, Inc. and Fund Management Company | N/A | N/A |
The Statement of Additional Information of the Trust includes additional information about the Fund’s Trustees and is available upon request, without charge, by calling 1.800.959.4246. Please refer to the Fund’s prospectus for information on the Fund’s sub-advisers.
Office of the Fund 11 Greenway Plaza, Suite 1000 Houston, TX 77046-1173 | Investment Adviser Invesco Advisers, Inc. 1555 Peachtree Street, N.E. Atlanta, GA 30309 | Distributor Invesco Distributors, Inc. 11 Greenway Plaza, Suite 1000 Houston, TX 77046-1173 | Auditors PricewaterhouseCoopers LLP 1201 Louisiana Street, Suite 2900 Houston, TX 77002-5678 | |||
Counsel to the Fund Stradley Ronon Stevens & Young, LLP 2005 Market Street, Suite 2600 Philadelphia, PA 19103-7018 | Counsel to the Independent Trustees Goodwin Procter LLP 901 New York Avenue, N.W. Washington, D.C. 20001 | Transfer Agent Invesco Investment Services, Inc. 11 Greenway Plaza, Suite 1000 Houston, TX 77046-1173 | Custodian State Street Bank and Trust Company 225 Franklin Street Boston, MA 02110-2801 | |||
T-4 Invesco Floating Rate Fund

Invesco mailing information
Send general correspondence to Invesco Investment Services, Inc., P.O. Box 219078, Kansas City, MO 64121-9078.
Important notice regarding delivery of security holder documents
To reduce Fund expenses, only one copy of most shareholder documents may be mailed to shareholders with multiple accounts at the same address (Householding). Mailing of your shareholder documents may be householded indefinitely unless you instruct us otherwise. If you do not want the mailing of these documents to be combined with those for other members of your household, please contact Invesco Investment Services, Inc. at 800 959 4246 or contact your financial institution. We will begin sending you individual copies for each account within 30 days after receiving your request.
Fund holdings and proxy voting information
The Fund provides a complete list of its holdings four times in each fiscal year, at the quarter ends. For the second and fourth quarters, the lists appear in the Fund’s semiannual and annual reports to shareholders. For the first and third quarters, the Fund files the lists with the Securities and Exchange Commission (SEC) on Form N-Q. The most recent list of portfolio holdings is available at invesco.com/completeqtrholdings. Shareholders can also look up the Fund’s Forms N-Q on the SEC website at sec.gov. Copies of the Fund’s Forms N-Q may be reviewed and copied at the SEC Public Reference Room in Washington, D.C. You can obtain information on the operation of the Public Reference Room, including information about duplicating fee charges, by calling 202 551 8090 or 800 732 0330, or by electronic request at the following email address: publicinfo@sec.gov. The SEC file numbers for the Fund are shown below.
A description of the policies and procedures that the Fund uses to determine how to vote proxies relating to portfolio securities is available without charge, upon request, from our Client Services department at 800 959 4246 or at invesco.com/proxyguidelines. The information is also available on the SEC website, sec.gov.
Information regarding how the Fund voted proxies related to its portfolio securities during the most recent 12-month period ended June 30 is available at invesco.com/proxysearch. The information is also available on the SEC website, sec.gov. Invesco Advisers, Inc. is an investment adviser; it provides investment advisory services to individual and institutional clients and does not sell securities. Invesco Distributors, Inc. is the US distributor for Invesco Ltd.’s retail mutual funds, exchange-traded funds and institutional money market funds. Both are wholly owned, indirect subsidiaries of Invesco Ltd. |
| |||||
| SEC file numbers: 811-09913 and 333-36074 | FLR-AR-1 | Invesco Distributors, Inc. | ||||

Letters to Shareholders
Philip Taylor | Dear Shareholders: This annual report includes information about your Fund, including performance data and a complete list of its investments as of the close of the reporting period. Inside, your Fund’s portfolio managers discuss how they managed your Fund and the factors that affected its performance during the reporting period. I hope you find this report of interest. During the reporting period covered by this report, the US economy showed signs of continued improvement. After contracting in the first quarter of 2014, the economy expanded strongly in the second quarter and unemployment trended lower. Much of the credit for this improvement goes to the US Federal Reserve (the Fed), which undertook an extraordinary asset purchase program following the global financial crisis. The Fed’s goal was to jumpstart the economy by encouraging banks to lend more, businesses to hire more and consumers to spend more. Signs of a stronger US economy prompted the Fed to reduce, or “taper,” its | |
| asset purchase program. Despite this, interest rates remained near historical low levels due largely to heavy investor demand for bonds. While signs of economic improvement were evident in the US, European economies remained relatively stagnant. During the reporting period, high unemployment persisted, worries about potential deflation grew, and uncertainty about Russian-Ukrainian tensions weighed on European markets. | ||

Extended periods of market strength can lull investors into complacency – just as prolonged periods of market weakness or volatility can discourage investors from initiating long-term investment plans. That’s why Invesco has always encouraged investors to work with a professional financial adviser who can stress the importance of starting to save and invest early and the importance of adhering to a disciplined investment plan – when times are good and when they’re uncertain. A financial adviser who knows your unique financial situation, investment goals and risk tolerance can be an invaluable partner as you seek to achieve your financial goals. He or she can offer a long-term perspective when markets are volatile and time-tested advice and guidance when your financial situation or investment goals change.
Timely information when and where you want it
Invesco’s efforts to help investors achieve their financial objectives include providing individual investors and financial professionals with timely information about the markets, the economy and investing – whenever and wherever they want it.
Our website, invesco.com/us, offers a wide range of market insights and investment perspectives. On the website, you’ll find detailed information about our funds, including prices, performance, holdings and portfolio manager commentaries. You can access information about your individual Invesco account whenever it’s convenient for you; just complete a simple, secure online registration. Use the “Login” box on our home page to get started.
Invesco’s mobile app for iPad® (available free from the App StoreSM) allows you to obtain the same detailed information about your Fund and the same investment insights from our investment leaders, market strategists, economists and retirement experts on the go. You also can watch portfolio manager videos and have instant access to Invesco news and updates wherever you may be.
In addition to the resources accessible on our website and through our mobile app, you can obtain timely updates to help you stay informed about the markets, the economy and investing by connecting with Invesco on Twitter, LinkedIn or Facebook. You can access our blog at blog.invesco.us.com or by clicking the “Intentional Investing Forum” link on our home page. Our goal is to provide you the information you want, when and where you want it.
Have questions?
For questions about your account, feel free to contact an Invesco client services representative at 800 959 4246. For Invesco-related questions or comments, please email me directly at phil@invesco.com.
All of us at Invesco look forward to serving your investment management needs for many years to come. Thank you for investing with us.
Sincerely,

Philip Taylor
Senior Managing Director, Invesco Ltd.
iPad is a trademark of Apple Inc., registered in the US and other countries. App Store is a service mark of Apple Inc. Invesco Distributors, Inc. is not affiliated with Apple Inc.
2 Invesco Global Real Estate Income Fund
Bruce Crockett | Dear Fellow Shareholders: There are a variety of factors that can impact investment performance, many of which are uncontrollable by us as investors. These factors can include various economic trends and geopolitical developments. While the members of the Invesco Funds Board, which I chair, can’t dictate the performance of the Invesco funds, be assured that your Board works diligently throughout the year to focus on how your investments are managed. Our job is to represent you and your interests on a variety of fund management-related matters. We regularly monitor how the portfolio management teams of the Invesco funds are performing in light of ever-changing and often unpredictable economic and market conditions. We review the investment strategies and investment process employed by each fund’s management team as explained in the fund’s prospectus. |

Perhaps our most significant responsibility is conducting the annual review of the funds’ advisory and sub-advisory contracts with Invesco Advisers and its affiliates. This annual review, which is required by the Investment Company Act of 1940, focuses on the nature and quality of the services Invesco provides as the adviser to the Invesco funds and the reasonableness of the fees that it charges for those services. Each year, we spend months carefully reviewing information from Invesco that allows us to evaluate the quality of its services and the reasonableness of its fees. We also use information from a variety of independent sources, including materials provided by the independent senior officer of the Invesco funds, who reports directly to the independent trustees on the Board. Additionally, we meet with legal counsel and review performance and fee data prepared for us by Lipper Inc., an independent, third-party firm widely recognized as a leader in its field.
After a careful review, the members of the Invesco Funds Board approved the continuation of advisory and sub-advisory contracts with Invesco Advisers and its affiliates. Be assured that your Board will continue working on behalf of fund shareholders, keeping your needs and interests uppermost in our minds.
As always, please contact me at bruce@brucecrockett.com with any questions or concerns you may have. On behalf of the Board, we look forward to continuing to represent your interests and serving your needs.
Sincerely,

Bruce L. Crockett
Independent Chair
Invesco Funds Board of Trustees
3 Invesco Global Real Estate Income Fund
Management’s Discussion of Fund Performance
Performance summary
Global real estate equities recovered following poor performance during the second half of 2013. For the fiscal year ended August 31, 2014, global real estate equities produced strong double-digit gains, but lagged both US and global broad market equities. Invesco Global Real Estate Income Fund underperformed its style-specific benchmark, the Custom Global Real Estate Income Index, primarily as a result of the Fund’s fixed income allocation lagging in a strong equity market. As a reminder, the Fund invests across the capital structure in both equity and fixed income, while the style-specific benchmark includes equities only.
Your Fund’s long-term performance appears later in this report.
Fund vs. Indexes
Total returns, 8/31/13 to 8/31/14, at net asset value (NAV). Performance shown does not include applicable contingent deferred sales charges (CDSC) or front-end sales charges, which would have reduced performance.
Class A Shares | 18.13 | % | ||
Class B Shares | 17.13 | |||
Class C Shares | 17.27 | |||
Class Y Shares | 18.33 | |||
Class R5 Shares | 18.40 | |||
Class R6 Shares | 18.62 | |||
MSCI World Indexq (Broad Market Index) | 21.10 | |||
Custom Global Real Estate Income Indexn (Style-Specific Index)* | 19.41 | |||
FTSE EPRA/NAREIT Developed Real Estate Indexq (Former Style-Specific)* | 20.29 | |||
Lipper Global Real Estate Funds Classification Average¿ (Peer Group) | 20.11 |
Source(s): qFactSet Research Systems Inc.; nInvesco, FactSet Research Systems Inc.; ¿Lipper Inc.
| * | The Fund has elected to use the Custom Global Real Estate Income Index as its style-specific index rather than the FTSE EPRA/NAREIT Developed Real Estate Index because the Custom Global Real Estate Income Index more closely reflects the performance of the types of securities in which the Fund invests. |
How we invest
Your Fund holds primarily real estate-oriented securities from the US and abroad whose value is driven by tangible assets. Our goal is to create a global fund that will provide attractive current income, with capital appreciation as a secondary objective. We use a fundamentals-driven investment process, including property market cycle analysis, property evaluation, and management and structure review, to identify securities with:
| n | Attractive relative yields. |
| n | Favorable property market outlooks. |
| n | Reasonable valuations relative to peer investment alternatives. |
We attempt to manage risk by allocating assets between property-related common stocks and fixed income securities, as well as diversifying by property types and geographic location, and limiting the size of any one holding.
We consider selling a holding when:
| n | Relative yields and/or valuation falls below desired levels. |
| n | Risk-return relationships change significantly. |
| n | Company fundamentals change (property type, geography or management changes). |
| n | A more attractive investment opportunity is identified. |
Market conditions and your Fund
In the fiscal year ended August 31, 2014, the global economy showed signs of broad, continued growth. However, the recovery is likely to remain uneven, with the use of historically unconventional means of economic stimulus still necessary in many parts of the world. Economic rebalancing and balance sheet repair remain key themes in many economies and are reflected in below-long-term-average gross domestic product growth and relatively modest inflationary pressures. We believe the potential exists for capital markets to remain volatile. The world has benefited from the willingness of financial authorities to undertake unprecedented amounts of market intervention. However, a true economic recovery will only have occurred when such abnormal levels of stimulus have been removed. This process is in its formative stages and should not be expected to occur without some degree of further market uncertainty and periods of volatility.
As developed world economies staged a recovery, growth among the world’s emerging economies weakened somewhat. However, the long-term health of emerging economies remained highly dependent on overall global trends in trade and consumption, and they continued to benefit from long-term structural population growth and urbanization trends.
In most markets across the globe, supply of newly developed real estate was low for the past six years, and absolute levels of vacancies have been declining.
Portfolio Composition
By country
United States | 58.1 | % | ||
Japan | 7.8 | |||
Australia | 6.9 | |||
United Kingdom | 4.7 | |||
Canada | 4.0 | |||
Singapore | 3.2 | |||
Hong Kong | 3.1 | |||
France | 2.6 | |||
| Countries each less than 2.0% of portfolio | 4.7 | |||
Money Market Funds | ||||
Plus Other Assets Less Liabilities | 4.9 |
Top 10 Equity Holdings*
1. Land Securities Group PLC | 2.2 | % | ||
2. AvalonBay Communities, Inc. | 2.1 | |||
3. Mid-America Apartment | 1.5 | |||
4. LaSalle Hotel Properties | 1.5 | |||
5. Simon Property Group, Inc. | 1.5 | |||
6. Unibail-Rodamco S.E. | 1.4 | |||
7. Hudson Pacific Properties | 1.4 | |||
8. Essex Property Trust, Inc. | 1.3 | |||
9. Retail Opportunity Investments | 1.2 | |||
10. RLJ Lodging Trust | 1.2 |
Total Net Assets | $ | 1.2 billion | ||
Total Number of Holdings* | 185 | |||
The Fund’s holdings are subject to change, and there is no assurance that the Fund will continue to hold any particular security.
*Excluding money market fund holdings.
| 4 Invesco Global Real Estate Income Fund |
The lack of new construction created more orderly real estate rental markets that offered better rental growth prospects when combined with trade, employment or consumption growth.
Against a backdrop of positive economic growth and low inflation, real estate investments trusts (REITs) remained in favor with investors in 2014. Commercial real estate fundamentals remained healthy, as evidenced by favorable earnings reports. Companies in most sectors reported healthy demand for space, driving occupancy and rental rates higher. Falling bond yields also supported the pricing of quality income streams from real estate investments throughout 2014.
On an absolute basis, each component of the capital structure, including real estate common stock, preferred securities, corporate debt and commercial mortgage-backed securities, contributed to Fund performance during the fiscal year. Common stock was the greatest absolute contributor to performance, however, given the strong returns in equity markets during the fiscal year.
From a sector standpoint, diversified real estate companies, which are primarily international companies, made the greatest contribution to Fund performance. Within US REITs, office, regional malls and apartment REITs were strong contributors, while manufactured homes detracted. From a country standpoint, the US, the UK, Japan and Australia were strong contributors, while the British Virgin Islands, New Zealand and Finland were laggards.
In light of a shift in investor focus from yield to growth, we increased the Fund’s exposure to real estate common stock slightly during the reporting period. We emphasized companies that we believed were able to grow their underlying cash flows and increase their dividends. Additionally, we kept the duration of the fixed income portion of the Fund short, as we believed interest rates could rise. For our preferred securities allocation, we remained focused on higher paying coupons with shorter dated call schedules, which we believed may have the opportunity to be less volatile compared with those that have lower coupons and longer dated call schedules.
The Fund has the flexibility to invest across equities and fixed income securities on a global basis, in an effort to take advantage of market dislocations driven by capital market influences rather than
underlying commercial real estate fundamentals. We remain committed to owning quality real estate companies that we believe may benefit from relatively better sector trends. We continue to manage risk by holding a portfolio that is diversified by property type and geographic location. We also continue to favor lower-leveraged companies with above-average levels of dividend coverage in the portfolio.
We thank you for your continued investment in Invesco Global Real Estate Income Fund.
The views and opinions expressed in management’s discussion of Fund performance are those of Invesco Advisers, Inc. These views and opinions are subject to change at any time based on factors such as market and economic conditions. These views and opinions may not be relied upon as investment advice or recommendations, or as an offer for a particular security. The information is not a complete analysis of every aspect of any market, country, industry, security or the Fund. Statements of fact are from sources considered reliable, but Invesco Advisers, Inc. makes no representation or warranty as to their completeness or accuracy. Although historical performance is no guarantee of future results, these insights may help you understand our investment management philosophy.
See important Fund and, if applicable, index disclosures later in this report.
| Joe Rodriguez Jr. Portfolio Manager, is lead manager of Invesco Global Real Estate Income Fund. He joined Invesco in | |
| 1990. Mr. Rodriguez earned a BBA in economics and finance and an MBA in finance from Baylor University. | ||

| Mark Blackburn Chartered Financial Analyst, Portfolio Manager, is manager of Invesco Global Real Estate Income | |
| Fund. He joined Invesco in 1998. Mr. Blackburn earned a BS in accounting from Louisiana State University and an MBA from Southern Methodist University. | ||

| James Cowen Portfolio Manager, is manager of Invesco Global Real Estate Income Fund. He joined Invesco in | |
| 2001. Mr. Cowen earned a Master of Town and Country Planning degree from the University of Manchester and a Master of Philosophy degree in land economy from Cambridge University. | ||

| Paul Curbo Chartered Financial Analyst, Portfolio Manager, is manager of Invesco Global Real Estate Income | |
| Fund. He joined Invesco in 1998. Mr. Curbo earned a BBA in finance from The University of Texas at Austin. | ||

| Darin Turner Portfolio Manager, is manager of Invesco Global Real Estate Income Fund. He joined Invesco in | |
| 2005. Mr. Turner earned a BBA in finance from Baylor University, an MS in real estate from The University of Texas at Arlington and an MBA specializing in investments from Southern Methodist University. | ||

| Ping-Ying Wang Chartered Financial Analyst, Portfolio Manager, is manager of Invesco Global Real Estate Income | |
| Fund. She joined Invesco in 1998. Ms. Wang earned a BS in international finance from the People’s University of China and a PhD in finance from The University of Texas at Dallas. | ||

5 Invesco Global Real Estate Income Fund
Your Fund’s Long-Term Performance
Results of a $10,000 Investment – Oldest Share Class(es)
Fund and index data from 8/31/04
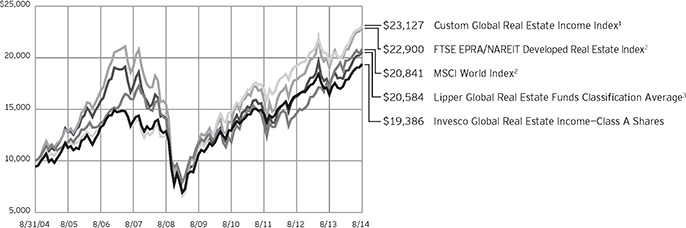
1 Source(s): Invesco, FactSet Research Systems Inc.
2 Source: FactSet Research Systems Inc.
3 Source: Lipper Inc.
Past performance cannot guarantee comparable future results.
The data shown in the chart include reinvested distributions, applicable sales charges and Fund expenses including management fees. Index results include reinvested dividends, but they do not reflect sales charges. Performance of the
peer group, if applicable, reflects fund expenses and management fees; performance of a market index does not. Performance shown in the chart and table(s) does not reflect deduction of taxes a shareholder would pay on Fund distributions or sale of Fund shares.
6 Invesco Global Real Estate Income Fund
Average Annual Total Returns
As of 8/31/14, including maximum
applicable sales charges
Class A Shares | ||||
Inception (5/31/02) | 9.40 | % | ||
10 Years | 6.84 | |||
5 Years | 11.42 | |||
1 Year | 11.58 | |||
Class B Shares | ||||
10 Years | 6.54 | % | ||
5 Years | 11.62 | |||
1 Year | 12.13 | |||
Class C Shares | ||||
10 Years | 6.54 | % | ||
5 Years | 11.88 | |||
1 Year | 16.27 | |||
Class Y Shares | ||||
10 Years | 7.57 | % | ||
5 Years | 12.98 | |||
1 Year | 18.33 | |||
Class R5 Shares | ||||
10 Years | 7.75 | % | ||
5 Years | 13.13 | |||
1 Year | 18.40 | |||
Class R6 Shares | ||||
10 Years | 7.55 | % | ||
5 Years | 12.92 | |||
1 Year | 18.62 | |||
On March 12, 2007, the Fund reorganized from a Closed-End Fund to an Open-End Fund. Performance shown prior to that date is that of the Closed-End Fund’s Common shares and includes the fees applicable to Common shares. The Closed-End Fund’s Common shares performance reflects any applicable fee waivers or expense reimbursements.
Class B shares incepted on March 9, 2007. Performance shown prior to that date is that of Class A shares, restated to reflect the higher 12b-1 fees applicable to Class B shares. Class A share performance reflects any applicable fee waivers or expense reimbursements.
Class C shares incepted on March 9, 2007. Performance shown prior to that date is that of Class A shares, restated to reflect the higher 12b-1 fees applicable to Class C shares. Class A share performance reflects any applicable fee waivers or expense reimbursements.
Class Y shares incepted on October 3, 2008. Performance shown prior to that date is that of Class A shares and includes the 12b-1 fees applicable to Class A shares. Class A share
Average Annual Total Returns
As of 6/30/14, the most recent calendar quarter end, including maximum applicable sales charges
Class A Shares | ||||
Inception (5/31/02) | 9.37 | % | ||
10 Years | 7.46 | |||
5 Years | 15.11 | |||
1 Year | 5.72 | |||
Class B Shares | ||||
10 Years | 7.15 | % | ||
5 Years | 15.33 | |||
1 Year | 5.85 | |||
Class C Shares | ||||
10 Years | 7.15 | % | ||
5 Years | 15.55 | |||
1 Year | 9.85 | |||
Class Y Shares | ||||
10 Years | 8.19 | % | ||
5 Years | 16.71 | |||
1 Year | 11.99 | |||
Class R5 Shares | ||||
10 Years | 8.37 | % | ||
5 Years | 16.86 | |||
1 Year | 12.19 | |||
Class R6 Shares | ||||
10 Years | 8.16 | % | ||
5 Years | 16.60 | |||
1 Year | 12.28 | |||
performance reflects any applicable fee waivers or expense reimbursements.
Class R5 shares incepted on March 9, 2007. Performance shown prior to that date is that of Class A shares and includes the 12b-1 fees applicable to Class A shares. Class A share performance reflects any applicable fee waivers or expense reimbursements.
Class R6 shares incepted on September 24, 2012. Performance shown prior to that date is that of Class A shares and includes the 12b-1 fees applicable to Class A shares. Class A share performance reflects any applicable fee waivers or expense reimbursements.
The performance data quoted represent past performance and cannot guarantee comparable future results; current performance may be lower or higher. Please visit invesco.com/performance for the most recent month-end performance. Performance figures reflect reinvested distributions (reinvested at net asset value, except for periods prior to March 12, 2007 where reinvestments were made at the lower of the Closed-End
Fund’s net asset value or market price), changes in net asset value and the effect of the maximum sales charge unless otherwise stated. Investment return and principal value will fluctuate so that you may have a gain or loss when you sell shares.
The net annual Fund operating expense ratio set forth in the most recent Fund prospectus as of the date of this report for Class A, Class B, Class C, Class Y, Class R5 and Class R6 shares was 1.27%, 2.02%, 2.02%, 1.02%, 0.95% and 0.87%, respectively.1 The total annual Fund operating expense ratio set forth in the most recent Fund prospectus as of the date of this report for Class A, Class B, Class C, Class Y, Class R5 and Class R6 shares was 1.28%, 2.03%, 2.03%, 1.03%, 0.96% and 0.88%, respectively. The expense ratios presented above may vary from the expense ratios presented in other sections of this report that are based on expenses incurred during the period covered by this report.
Class A share performance reflects the maximum 5.50% sales charge, and Class B and Class C share performance reflects the applicable contingent deferred sales charge (CDSC) for the period involved. The CDSC on Class B shares declines from 5% beginning at the time of purchase to 0% at the beginning of the seventh year. The CDSC on Class C shares is 1% for the first year after purchase. Class Y, Class R5 and Class R6 shares do not have a front-end sales charge or a CDSC; therefore, performance is at net asset value.
The performance of the Fund’s share classes will differ primarily due to different sales charge structures and class expenses.
Fund performance was positively impacted by a temporary 2% fee on redemptions that was in effect from March 12, 2007 to March 12, 2008. Without income from this temporary fee, returns would have been lower.
Had the adviser not waived fees and/ or reimbursed expenses in the past, performance would have been lower.
| 1 | Total annual Fund operating expenses after any contractual fee waivers and/or expense reimbursements by the adviser in effect through at least June 30, 2016. See current prospectus for more information. |
| 7 Invesco Global Real Estate Income Fund |
Invesco Global Real Estate Income Fund’s investment objective is current income and, secondarily, capital appreciation.
| n | Unless otherwise stated, information presented in this report is as of August 31, 2014, and is based on total net assets. |
| n | Unless otherwise noted, all data provided by Invesco. |
| n | To access your Fund’s reports/prospectus, visit invesco.com/fundreports. |
About share classes
| n | On March 12, 2007, Invesco Select Real Estate Income Fund was reorganized from a Closed-End Fund to an Open-End Fund. Information presented for Class A shares prior to the reorganization included financial data for the Closed-End Fund’s Common Shares. |
| n | Class B shares may not be purchased for new or additional investments. Please see the prospectus for more information. |
| n | Class Y shares are available only to certain investors. Please see the prospectus for more information. |
| n | Class R5 shares and Class R6 shares are primarily intended for employer sponsored retirement and benefit plans that meet certain standards and for institutional investors. Please see the prospectus for more information. |
Principal risks of investing in the Fund
| n | Concentration risk. To the extent the Fund invests a greater amount in any one sector or industry, the Fund’s performance will depend to a greater extent on the overall condition of the sector or industry, and there is increased risk to the Fund if conditions adversely affect that sector or industry. |
| n | Credit risk. The issuer of instruments in which the Fund invests may be unable to meet interest and/or principal payments, thereby causing its instruments to decrease in value and lowering the issuer’s credit rating. |
| n | Depositary receipts risk. Depositary receipts involve many of the same risks as those associated with direct investment in foreign securities. In addition, the underlying issuers of certain depositary receipts, particularly unsponsored or unregistered depositary receipts, are under no obligation to distribute shareholder communications to the holders of such receipts or to pass through to them any voting rights with respect to the deposited securities. |
| n | Derivatives risk. The value of a derivative instrument depends largely on (and is derived from) the value of an underlying security, currency, commodity, interest rate, index or other asset (each referred to as an underlying asset). In addition to risks relating to the underlying assets, the use of derivatives may include other, possibly greater, risks, including counterparty, leverage and liquidity risks. Counterparty risk is the risk that the counterparty to the derivative contract will default on its obligation to pay the Fund the amount owed or otherwise perform under the derivative contract. Derivatives create leverage risk because they do not require payment up front equal to the economic exposure created by owning the derivative. As a result, an adverse change in the value of the underlying asset could result in the Fund sustaining a loss that is substantially greater than the amount invested in the derivative, which may make the Fund’s returns more volatile and increase the risk of loss. Derivative instruments may also be less liquid than more traditional investments and the Fund may be unable to sell or close out its derivative positions at a desirable time or price. This risk may be more acute under adverse market conditions, during which the Fund may be most in need of liquidating its derivative positions. Derivatives may also be harder to value, less tax efficient and subject to changing government regulation that could impact the Fund’s ability to use certain derivatives or their cost. Also, derivatives used for hedging or to gain or limit exposure to a particular market segment may not provide the expected benefits, particularly during adverse market conditions. |
| n | Developing/emerging markets securities risk. The prices of securities issued by foreign companies and governments located in developing/emerging market countries may be affected more negatively by inflation, devaluation of their currencies, higher transaction |
costs, delays in settlement, adverse political developments, the introduction of capital controls, withholding taxes, nationalization of private assets, expropriation, social unrest, war or lack of timely information than those in developed countries. |
| n | Equity risk. Equity risk is the risk that the value of securities held by the Fund will fall due to general market and economic conditions, perceptions regarding the industries in which the issuers of securities held by the Fund participate or factors relating to specific companies in which the Fund invests, either directly or through derivative instruments. For example, an adverse event, such as an unfavorable earnings report, may depress the value of securities held by the Fund; the price of securities may be particularly sensitive to general movements in the stock market; or a drop in the stock market may depress the price of most or all of the securities held by the Fund. In addition, securities of an issuer in the Fund’s portfolio may decline in price if the issuer fails to make anticipated dividend payments because, among other reasons, the issuer of the security experiences a decline in its financial condition. |
| n | Foreign securities risk. The Fund’s foreign investments may be affected by changes in a foreign country’s exchange rates, political and social instability, changes in economic or taxation policies, difficulties when enforcing obligations, decreased liquidity, and increased volatility. Foreign companies may be subject to less regulation resulting in less publicly available information about the companies. |
| n | High yield bond (junk bond) risk. Junk bonds involve a greater risk of default or price changes due to changes in the credit quality of the issuer. The values of junk bonds fluctuate more than those of high- quality bonds in response to company, political, regulatory or economic developments. Values of junk bonds can decline significantly over short periods of time. |
This report must be accompanied or preceded by a currently effective Fund prospectus, which contains more complete information, including sales charges and expenses. Investors should read it carefully before investing.
NOT FDIC INSURED | MAY LOSE VALUE | NO BANK GUARANTEE
continued on page 9
8 Invesco Global Real Estate Income Fund
| n | Interest rate risk. Interest rate risk refers to the risk that bond prices generally fall as interest rates rise; conversely, bond prices generally rise as interest rates fall. Specific bonds differ in their sensitivity to changes in interest rates depending on their individual characteristics, including duration. |
| n | Management risk. The investment techniques and risk analysis used by the Fund’s portfolio managers may not produce the desired results. |
| n | Market risk. The prices of and the income generated by the Fund’s securities may decline in response to, among other things, investor sentiment, general economic and market conditions, regional or global instability, and currency and interest rate fluctuations. |
| n | Mortgage- and asset backed-securities risk. The Fund may invest in mortgage- and asset-backed securities that are subject to prepayment or call risk, which is the risk that the borrower’s payments may be received earlier or later than expected due to changes in prepayment rates on underlying loans. Faster prepayments often happen when interest rates are falling. As a result, the Fund may reinvest these early payments at lower interest rates, thereby reducing the Fund’s income. Conversely, when interest rates rise, prepayments may happen more slowly, causing the security to lengthen in duration. Longer duration securities tend to be more volatile. Securities may be prepaid at a price less than the original purchase value. An unexpectedly high rate of defaults on the mortgages held by a mortgage pool may adversely affect the value of mortgage-backed securities and could result in losses to the Fund. The risk of such defaults is generally higher in the case of mortgage pools that include subprime mortgages. Subprime mortgages refer to loans made to borrowers with weakened credit histories or with lower capacity to make timely payments on their mortgages. |
| n | REIT/real estate risk. Investments in real estate related instruments may be affected by economic, legal, cultural, environmental or technological factors that affect property values, rents or occupancies of real estate related to the Fund’s holdings. Real estate companies, including REITs or similar structures, |
tend to be small- and mid-cap companies, and their shares may be more volatile and less liquid. The value of investments in real estate related companies may be affected by the quality of management, the ability to repay loans, the utilization of leverage and financial covenants related thereto, whether the company carries adequate insurance and environmental factors. If a real estate related company defaults, the Fund may own real estate directly, which involves the following additional risks: environmental liabilities; difficulty in valuing and selling the real estate; and economic or regulatory changes. |
| n | Short sales risk. Short sales may cause the Fund to repurchase a security at a higher price, thereby causing a loss. A short position in a security poses more risk than holding the same security long. As there is no limit on how much the price of the security can increase, the Fund’s exposure is unlimited. In order to establish a short position in a security, the Fund must borrow the security from a broker. The Fund may not always be able to borrow a security the Fund seeks to sell short at a particular time or at an acceptable price. The Fund also may not always be able to close out the short position by replacing the borrowed securities at a particular time or at an acceptable price. The Fund will incur increased transaction costs associated with selling securities short. In addition, taking short positions in securities results in a form of leverage which may cause the Fund to be volatile. |
| n | Small- and mid-capitalization risk. Stocks of small- and mid-sized companies tend to be more vulnerable to adverse developments and may have little or no operating history or track record of success, and limited product lines, markets, management and financial resources. The securities of small- and mid-sized companies may be more volatile due to less market interest and less publicly available information about the issuer. They also may be illiquid or restricted as to resale, or may trade less frequently and in smaller volumes, all of which may cause difficulty when establishing or closing a position at a desirable price. |
About indexes used in this report
| n | The MSCI World IndexSM is an unmanaged index considered representative of stocks of developed countries. The index is computed using the net return, which withholds applicable taxes for non-resident investors. |
| n | The Custom Global Real Estate Income Index is an index comprised of the FTSE NAREIT All Equity REIT Index through August 31, 2011 and FTSE EPRA/NAREIT Developed Index thereafter, which is computed using the net return by withholding applicable taxes. |
| n | The FTSE EPRA/NAREIT Developed Real Estate Index is an unmanaged index considered representative of global real estate companies and REITs. The index is computed using the gross return which does not withhold taxes for non-resident investors. |
| n | The Lipper Global Real Estate Funds Classification Average represents an average of all funds in the Lipper Global Real Estate Funds classification. |
| n | The Fund is not managed to track the performance of any particular index, including the index(es) described here, and consequently, the performance of the Fund may deviate significantly from the performance of the index(es). |
| n | A direct investment cannot be made in an index. Unless otherwise indicated, index results include reinvested dividends, and they do not reflect sales charges. Performance of the peer group, if applicable, reflects fund expenses; performance of a market index does not. |
Other information
| n | The returns shown in management’s discussion of Fund performance are based on net asset values (NAVs) calculated for shareholder transactions. Generally accepted accounting principles require adjustments to be made to the net assets of the Fund at period end for financial reporting purposes, and as such, the NAVs for shareholder transactions and the returns based on those NAVs may differ from the NAVs and returns reported in the Financial Highlights. |
| n | Industry classifications used in this report are generally according to the Global Industry Classification Standard, which was developed by and is the exclusive property and a service mark of MSCI Inc. and Standard & Poor’s. |
9 Invesco Global Real Estate Income Fund
Schedule of Investments
August 31, 2014
| Shares | Value | |||||||
Real Estate Investment Trusts, Common Stocks & Other Equity Interests–60.54% |
| |||||||
| Australia–6.13% | ||||||||
CFS Retail Property Trust Group | 2,499,503 | $ | 5,018,715 | |||||
Charter Hall Group | 957,356 | 4,041,218 | ||||||
Dexus Property Group | 10,724,385 | 12,068,681 | ||||||
Federation Centres | 4,212,909 | 10,465,599 | ||||||
Goodman Group | 1,885,793 | 9,849,176 | ||||||
GPT Group | 1,108,313 | 4,133,952 | ||||||
Investa Office Fund | 950,510 | 3,257,790 | ||||||
Scentre Group(a) | 3,042,150 | 9,744,849 | ||||||
Stockland | 3,528,267 | 14,025,971 | ||||||
| 72,605,951 | ||||||||
| Canada–4.02% | ||||||||
Allied Properties REIT | 375,300 | 12,323,593 | ||||||
Artis REIT | 544,100 | 7,967,322 | ||||||
Boardwalk REIT | 74,600 | 4,724,941 | ||||||
Canadian REIT | 179,800 | 7,999,380 | ||||||
Chartwell Retirement Residences | 663,854 | 6,844,926 | ||||||
H&R REIT | 363,900 | 7,741,912 | ||||||
| 47,602,074 | ||||||||
| China–0.95% | ||||||||
China Overseas Land & Investment Ltd. | 986,000 | 2,773,487 | ||||||
China Resources Land Ltd. | 1,394,000 | 3,190,870 | ||||||
Shimao Property Holdings Ltd. | 1,253,500 | 2,759,282 | ||||||
SOHO China Ltd. | 3,071,000 | 2,512,243 | ||||||
| 11,235,882 | ||||||||
| Finland–0.21% | ||||||||
Sponda Oyj | 484,261 | 2,532,549 | ||||||
| France–2.62% | ||||||||
Gecina S.A. | 38,581 | 5,449,759 | ||||||
Mercialys S.A. | 357,562 | 8,856,418 | ||||||
Unibail-Rodamco S.E. | 62,409 | 16,761,909 | ||||||
| 31,068,086 | ||||||||
| Germany–0.59% | ||||||||
Deutsche Euroshop AG | 85,762 | 4,062,317 | ||||||
Deutsche Wohnen AG | 128,550 | 2,900,265 | ||||||
| 6,962,582 | ||||||||
| Hong Kong–3.06% | ||||||||
Fortune REIT | 3,243,000 | 3,016,997 | ||||||
Henderson Land Development Co. Ltd. | 376,200 | 2,492,596 | ||||||
Hongkong Land Holdings Ltd. | 330,000 | 2,260,500 | ||||||
Link REIT (The) | 1,998,000 | 11,858,944 | ||||||
New World Development Co. Ltd. | 2,310,000 | 2,914,390 | ||||||
Sino Land Co. Ltd. | 1,883,000 | 3,320,274 | ||||||
Sun Hung Kai Properties Ltd. | 245,000 | 3,717,629 | ||||||
Wharf Holdings Ltd. (The) | 862,000 | 6,740,197 | ||||||
| 36,321,527 | ||||||||
| Shares | Value | |||||||
| Japan–7.83% | ||||||||
Activia Properties, Inc. | 794 | $ | 6,997,578 | |||||
Advance Residence Investment Corp. | 2,694 | 6,633,376 | ||||||
Frontier Real Estate Investment Corp. | 828 | 4,408,573 | ||||||
Hulic Reit, Inc. | 3,856 | 6,537,226 | ||||||
Japan Logistics Fund Inc. | 1,677 | 3,858,470 | ||||||
Japan Prime Realty Investment Corp. | 2,815 | 10,348,270 | ||||||
Japan Retail Fund Investment Corp. | 3,581 | 7,509,603 | ||||||
Kenedix Office Investment Corp. | 1,930 | 10,684,094 | ||||||
Mitsui Fudosan Co., Ltd. | 330,000 | 10,513,696 | ||||||
Mori Hills REIT Investment Corp. | 3,120 | 4,518,828 | ||||||
Nippon Accommodations Fund Inc. | 890 | 3,233,253 | ||||||
Nippon Prologis REIT Inc. | 2,255 | 5,474,416 | ||||||
Sumitomo Realty & Development Co., Ltd. | 208,000 | 8,065,662 | ||||||
United Urban Investment Corp. | 2,482 | 4,002,687 | ||||||
| 92,785,732 | ||||||||
| Netherlands–0.45% | ||||||||
VastNed Retail N.V. | 51,987 | 2,529,553 | ||||||
Wereldhave N.V. | 30,392 | 2,797,453 | ||||||
| 5,327,006 | ||||||||
| Singapore–3.24% | ||||||||
Ascendas REIT | 4,568,000 | 8,594,716 | ||||||
CapitaCommercial Trust | 5,833,000 | 7,939,231 | ||||||
CapitaMall Trust | 1,424,000 | 2,280,224 | ||||||
CDL Hospitality Trusts | 2,000,000 | 2,642,114 | ||||||
Frasers Centrepoint Trust | 3,812,000 | 6,104,083 | ||||||
Global Logistic Properties Ltd. | 1,557,000 | 3,552,802 | ||||||
Mapletree Industrial Trust | 3,894,000 | 4,489,480 | ||||||
Suntec REIT | 1,916,000 | 2,799,600 | ||||||
| 38,402,250 | ||||||||
| South Africa–0.68% | ||||||||
Growthpoint Properties Ltd. | 1,645,163 | 3,888,982 | ||||||
Hyprop Investments Ltd. | 510,636 | 4,136,188 | ||||||
| 8,025,170 | ||||||||
| Sweden–0.69% | ||||||||
Castellum AB | 254,985 | 4,162,232 | ||||||
Fabege AB | 156,333 | 2,055,601 | ||||||
Wihlborgs Fastigheter AB | 108,064 | 1,994,542 | ||||||
| 8,212,375 | ||||||||
| United Kingdom–4.08% | ||||||||
Big Yellow Group PLC | 725,831 | 6,350,480 | ||||||
British Land Co. PLC | 314,472 | 3,813,841 | ||||||
Hammerson PLC | 962,563 | 9,715,379 | ||||||
Land Securities Group PLC | 1,422,495 | 25,574,234 | ||||||
Segro PLC | 463,651 | 2,848,857 | ||||||
| 48,302,791 | ||||||||
See accompanying Notes to Financial Statements which are an integral part of the financial statements.
10 Invesco Global Real Estate Income Fund
| Shares | Value | |||||||
| United States–25.99% | ||||||||
AvalonBay Communities, Inc. | 158,426 | $ | 24,413,447 | |||||
BioMed Realty Trust, Inc. | 330,800 | 7,426,460 | ||||||
Brandywine Realty Trust | 148,008 | 2,371,088 | ||||||
Brixmor Property Group, Inc. | 437,800 | 10,362,726 | ||||||
Cohen & Steers Quality Income Realty Fund, Inc. | 357,173 | 4,046,770 | ||||||
CoreSite Realty Corp. | 116,600 | 4,089,162 | ||||||
Corrections Corp. of America | 108,577 | 3,869,684 | ||||||
Cousins Properties, Inc. | 451,000 | 5,723,190 | ||||||
EastGroup Properties, Inc. | 98,700 | 6,399,708 | ||||||
Essex Property Trust, Inc. | 81,900 | 15,843,555 | ||||||
Federal Realty Investment Trust | 75,200 | 9,383,456 | ||||||
General Growth Properties, Inc. | 571,500 | 14,041,755 | ||||||
Geo Group Inc. (The) | 65,000 | 2,432,300 | ||||||
Government Properties Income Trust | 216,750 | 5,206,335 | ||||||
Health Care REIT, Inc. | 53,200 | 3,595,256 | ||||||
Healthcare Realty Trust, Inc. | 334,300 | 8,344,128 | ||||||
Healthcare Trust of America, Inc.–Class A | 993,600 | 12,370,320 | ||||||
Highwoods Properties, Inc. | 136,200 | 5,795,310 | ||||||
Host Hotels & Resorts Inc. | 155,400 | 3,546,228 | ||||||
Hudson Pacific Properties Inc. | 301,600 | 8,097,960 | ||||||
LaSalle Hotel Properties | 484,600 | 17,712,130 | ||||||
Mid-America Apartment Communities, Inc. | 245,200 | 17,732,864 | ||||||
National Health Investors, Inc. | 147,500 | 9,515,225 | ||||||
National Retail Properties Inc. | 329,200 | 12,226,488 | ||||||
Piedmont Office Realty Trust Inc.–Class A | 590,200 | 11,502,998 | ||||||
Prologis, Inc. | 179,800 | 7,361,012 | ||||||
Public Storage | 44,077 | 7,721,409 | ||||||
Realty Income Corp. | 162,266 | 7,256,535 | ||||||
Retail Opportunity Investments Corp. | 929,900 | 14,729,616 | ||||||
RLJ Lodging Trust | 493,600 | 14,714,216 | ||||||
Simon Property Group, Inc. | 103,600 | 17,615,108 | ||||||
UDR, Inc. | 299,639 | 8,965,199 | ||||||
Washington Prime Group Inc. | 179,700 | 3,507,744 | ||||||
| 307,919,382 | ||||||||
Total Real Estate Investment Trusts, Common Stocks & Other Equity Interests (Cost $641,137,661) |
| 717,303,357 | ||||||
Preferred Stocks–17.22% |
| |||||||
| Australia–0.49% | ||||||||
Goodman PLUS Trust, 6.46% Unsec. Sub. Gtd. Floating Rate Pfd.(b) | 60,179 | 5,873,022 | ||||||
| United States–16.73% | ||||||||
Alexandria Real Estate Equities Inc., Series D, $1.75 Conv. Pfd. | 252,000 | 7,036,319 | ||||||
American Tower Corp., Series A, $5.25 Conv. Pfd. | 63,640 | 7,206,594 | ||||||
Coresite Realty Corp., Series A, 7.25% Pfd. | 292,585 | 7,563,322 | ||||||
Crown Castle International Corp., Series A, $4.50 Conv. Pfd. | 75,000 | 7,818,000 | ||||||
| Shares | Value | |||||||
| United States–(continued) | ||||||||
CubeSmart, Series A, 7.75% Pfd. | 90,601 | $ | 2,410,893 | |||||
DDR Corp., Series K, 6.25% Pfd. | 17,502 | 434,575 | ||||||
Eagle Hospitality Properties Trust Inc., Series A, 8.25% Pfd. | 195,800 | 12,433 | ||||||
EPR Properties, Series E, $2.25 Conv. Pfd. | 111,000 | 3,473,190 | ||||||
EPR Properties, Series F, 6.63% Pfd. | 79,000 | 1,959,990 | ||||||
Essex Property Trust, Inc., Series H, 7.13% Pfd. | 247,220 | 6,647,746 | ||||||
General Growth Properties, Inc., Series A, 6.38% Pfd. | 24,236 | 600,810 | ||||||
Health Care REIT, Inc., Series I, $3.25 Conv. Pfd. | 209,100 | 12,738,372 | ||||||
Hersha Hospitality Trust, Series B, 8.00% Pfd. | 340,500 | 9,030,060 | ||||||
Hudson Pacific Properties Inc., Series B, 8.38% Pfd. | 607,407 | 16,120,582 | ||||||
Kilroy Realty Corp., Series G, 6.88% Pfd. | 284,410 | 7,320,713 | ||||||
Kilroy Realty Corp., Series H, 6.38% Pfd. | 275,622 | 6,761,008 | ||||||
LaSalle Hotel Properties, Series H, 7.50% Pfd. | 249,210 | 6,559,207 | ||||||
National Retail Properties Inc., Series D, 6.63% Pfd. | 454,000 | 11,967,440 | ||||||
Pebblebrook Hotel Trust, Series A, 7.88% Pfd. | 240,700 | 6,296,712 | ||||||
Pebblebrook Hotel Trust, Series B, 8.00% Pfd. | 155,910 | 4,116,024 | ||||||
Pebblebrook Hotel Trust, Series C, 6.50% Pfd. | 165,370 | 4,134,250 | ||||||
Public Storage, Series P, 6.50% Pfd. | 16,000 | 420,800 | ||||||
Public Storage, Series Q, 6.50% Pfd. | 124,041 | 3,326,780 | ||||||
Public Storage, Series R, 6.35% Pfd. | 123,834 | 3,211,016 | ||||||
Public Storage, Series Y, 6.38% Pfd. | 410,000 | 10,696,900 | ||||||
Public Storage, Series Z, 6.00% Pfd. | 102,000 | 2,573,460 | ||||||
Realty Income Corp., Series F, 6.63% Pfd. | 41,942 | 1,102,236 | ||||||
Senior Housing Properties Trust 5.63% Sr. Unsec. Pfd. | 16,000 | 380,960 | ||||||
SL Green Realty Corp., Series I, 6.50% Pfd. | 438,000 | 11,116,440 | ||||||
Summit Hotel Properties, Inc., Series A, 9.25% Pfd. | 36,183 | 997,203 | ||||||
Summit Hotel Properties, Inc., Series B, 7.88% Pfd. | 161,156 | 4,248,072 | ||||||
Taubman Centers, Inc., Series J, 6.50% Pfd. | 214,895 | 5,436,843 | ||||||
Taubman Centers, Inc., Series K, 6.25% Pfd. | 141,968 | 3,549,200 | ||||||
Terreno Realty Corp., Series A, 7.75% Pfd. | 111,651 | 3,025,742 | ||||||
Vornado Realty L.P. 7.88% Sr. Unsec. Pfd. | 40,500 | 1,031,130 | ||||||
Vornado Realty Trust, Series G, 6.63% Pfd. | 22,000 | 564,080 | ||||||
Vornado Realty Trust, Series I, 6.63% Pfd. | 281,574 | 7,154,795 | ||||||
See accompanying Notes to Financial Statements which are an integral part of the financial statements.
11 Invesco Global Real Estate Income Fund
| Shares | Value | |||||||
| United States–(continued) | ||||||||
Vornado Realty Trust, Series J, 6.88% Pfd. | 11,000 | $ | 294,360 | |||||
Weyerhaeuser Co., Series A, $3.19 Conv. Pfd. | 153,700 | 8,877,712 | ||||||
| 198,215,969 | ||||||||
Total Preferred Stocks |
| 204,088,991 | ||||||
| Principal Amount | ||||||||
Mortgage-Backed Securities–15.76% |
| |||||||
| United Kingdom–0.65% | ||||||||
Hercules (Eclipse) PLC., Series 2006-4, Class B, Floating Rate Pass Through Ctfs., 0.91%, 10/25/18(b)(c) | GBP | 3,842,446 | 6,039,287 | |||||
Triton European Loan Conduit PLC, | ||||||||
Series 26X, Class F, Floating Rate Pass Through Ctfs., 1.06%, 10/25/19(b)(c) | GBP | 94,274 | 149,679 | |||||
Series 26X, Class G, Floating Rate Pass Through Ctfs., 1.24%, 10/25/19(b)(c) | GBP | 975,926 | 1,525,989 | |||||
| 7,714,955 | ||||||||
| United States–15.11% | ||||||||
ACRE Commercial Mortgage Trust, | ||||||||
Series 2013-FL1, Class D, Floating Rate Pass Through Ctfs., 4.55%, 06/15/30(b)(d) | $ | 10,040,000 | 10,207,046 | |||||
Series 2013-FL1, Class C, Floating Rate Pass Through Ctfs., 3.15%, 06/15/30(b)(d) | 4,900,000 | 4,942,169 | ||||||
Banc of America Merrill Lynch Large Loan Inc., Series 2014-ICTS, Class E, Floating Rate Pass Through Ctfs., 3.11%, 06/15/28(b)(d) | 7,350,000 | 7,342,635 | ||||||
Banc of America Merrill Lynch Commercial Mortgage Inc., Series 2004-2, Class L, Variable Rate Pass Through Ctfs., 4.90%, 11/10/38(b)(d) | 600,000 | 608,788 | ||||||
Bear Stearns Commercial Mortgage Securities Trust, | ||||||||
Series 2004-PWR6, Class B, Variable Rate Pass Through Ctfs., 4.95%, 11/11/41(b)(d) | 50,000 | 52,238 | ||||||
Series 2005-PWR8, Class C, Pass Through Ctfs., 4.86%, 06/11/41 | 4,900,000 | 4,873,119 | ||||||
Citigroup/Deutsche Commercial Mortgage Trust, Series 2005-CD1, Class E, Variable Rate Pass Through Ctfs., 5.40%, 07/15/44(b) | 12,309,000 | 12,270,159 | ||||||
| Principal Amount | Value | |||||||
| United States–(continued) | ||||||||
Credit Suisse First Boston Mortgage Securities Corp., | ||||||||
Series 2003-C5, Class G, Variable Rate Pass Through Ctfs., 5.75%, 12/15/36(b)(d) | $ | 2,350,000 | $ | 2,351,768 | ||||
Series 2005-C3, Class B, Pass Through Ctfs., 4.88%, 07/15/37 | 9,950,000 | 9,832,675 | ||||||
Series 2005-C4, Class D, Variable Rate Pass Through Ctfs., 5.38%, 08/15/38(b) | 8,950,000 | 9,062,197 | ||||||
Series 2005-C5, Class C, Variable Rate Pass Through Ctfs., 5.10%, 08/15/38(b) | 4,975,000 | 5,110,317 | ||||||
Del Coronado Trust, Series 2013-HDMZ, Class M, Floating Rate Pass Through Ctfs., 5.15%, 03/15/18(b)(d) | 12,420,000 | 12,460,986 | ||||||
FREMF Mortgage Trust, Series 2012-KF01, Class C, Floating Rate Pass Through Ctfs., 4.41%, 10/25/44(b)(d) | 1,278,000 | 1,355,077 | ||||||
GS Mortgage Securities Corp. II, Series 2013-KING, Class E, Variable Rate Pass Through Ctfs., 3.55%, 12/10/27(b)(d) | 1,000,000 | 953,679 | ||||||
GS Mortgage Securities Corp. Trust, Series 2013-NYC5, Class G, Variable Rate Pass Through Ctfs., 3.77%, 01/10/30(b)(d) | 4,000,000 | 3,877,264 | ||||||
GS Mortgage Securities Trust, | ||||||||
Series GSMS 2011-GC3, Class E, Pass Through Ctfs., 5.00%, 03/10/44(d) | 7,475,000 | 7,015,669 | ||||||
Series GSMS 2011-GC5, Class E, Variable Rate Pass Through Ctfs., 5.47%, 08/10/44(b)(d) | 11,025,000 | 10,398,273 | ||||||
Hilton USA Trust, | ||||||||
Series 2013-HLF, Class EFL, Floating Rate Pass Through Ctfs., 3.91%, 11/05/30(b)(d) | 12,375,000 | 12,428,411 | ||||||
Series 2014-ORL, Class E, Floating Rate Pass Through Ctfs., 2.16%, 07/15/29(b)(d) | 2,500,000 | 2,505,903 | ||||||
JP Morgan Chase Commercial Mortgage Securities Corp., Series 2004-C3, Class F, Variable Rate Pass Through Ctfs., 5.25%, 01/15/42(b)(d) | 7,950,000 | 7,801,550 | ||||||
JP Morgan Chase Commercial Mortgage Securities Trust, Series 2011-C4, Class TAC1, Pass Through Ctfs., 7.99%, 07/15/46(d) | 1,889,938 | 2,058,999 | ||||||
LB-UBS Commercial Mortgage Trust, | ||||||||
Series 2005-C1, Class C, Variable Rate Pass Through Ctfs., 4.84%, 02/15/40(b) | 170,000 | 171,908 | ||||||
Series 2006-C4, Class AJ, Variable Rate Pass Through Ctfs., 6.05%, 06/15/38(b) | 4,260,000 | 4,478,031 | ||||||
Merrill Lynch Mortgage Trust, | ||||||||
Series 2003-KEY1, Class F, Variable Rate Pass Through Ctfs., 6.42%, 11/12/35(b)(d) | 937,000 | 940,941 | ||||||
Series 2005-MCP1, Class E, Variable Rate Pass Through Ctfs., 5.13%, 06/12/43(b)(d) | 4,500,000 | 4,442,949 | ||||||
See accompanying Notes to Financial Statements which are an integral part of the financial statements.
12 Invesco Global Real Estate Income Fund
| Principal Amount | Value | |||||||
| United States–(continued) | ||||||||
Morgan Stanley Capital I Trust, | ||||||||
Series 2005-IQ10, Class B, Variable Rate Pass Through Ctfs., 5.39%, 09/15/42(b) | $ | 6,475,000 | $ | 6,610,211 | ||||
Series 2006-IQ11, Class B, Variable Rate Pass Through Ctfs., 5.83%, 10/15/42(b) | 270,000 | 257,317 | ||||||
Series 2006-TOP23, Class C, Variable Rate Pass Through Ctfs., 5.98%, 08/12/41(b)(d) | 8,875,000 | 9,235,494 | ||||||
Series 2007-HQ11, Class AJ, Pass Through Ctfs., 5.51%, 02/12/44 | 5,000,000 | 5,233,017 | ||||||
Series 2007-TOP27, Class AJ, Variable Rate Pass Through Ctfs., 5.83%, 06/11/42(b) | 7,400,000 | 8,012,483 | ||||||
Series 2007-TOP27, Class AM, Variable Rate Pass Through Ctfs., 5.83%, 06/11/42(b) | 25,000 | 27,652 | ||||||
Wachovia Bank Commercial Mortgage Trust, | ||||||||
Series 2005-C16, Class H, Variable Rate Pass Through Ctfs., 5.76%, 10/15/41(b)(d) | 550,000 | 553,989 | ||||||
Series 2005-C16, Class TO, Variable Rate Pass Through Ctfs., 5.62%, 10/15/41(b)(d) | 419,953 | 420,019 | ||||||
Series 2005-C19, Class F, Variable Rate Pass Through Ctfs., 5.60%, 05/15/44(b)(d) | 900,000 | 906,328 | ||||||
Series 2005-C19, Class G, Variable Rate Pass Through Ctfs., 5.61%, 05/15/44(b)(d) | 5,000,000 | 5,029,142 | ||||||
Series 2005-C19, Class H, Variable Rate Pass Through Ctfs., 5.61%, 05/15/44(b)(d) | 1,700,000 | 1,709,765 | ||||||
Series 2005-C21, Class D, Variable Rate Pass Through Ctfs., 5.41%, 10/15/44(b) | 3,450,000 | 3,493,665 | ||||||
| 179,031,833 | ||||||||
Total Mortgage-Backed Securities |
| 186,746,788 | ||||||
| Principal Amount | Value | |||||||
U.S. Dollar Denominated Bonds & Notes–1.35% |
| |||||||
| Brazil–0.67% | ||||||||
BR Properties S.A., Sr. Unsec. Gtd. Notes, 9.00%(d)(e) | $ | 7,700,000 | $ | 7,969,500 | ||||
| China–0.42% | ||||||||
Country Garden Holdings Co. Ltd., Sr. Unsec. Gtd. Notes, | 4,500,000 | 4,938,750 | ||||||
| United States–0.26% | ||||||||
Retail Opportunity Investments Partnership L.P., Sr. Unsec. Gtd. Notes, 5.00%, 12/15/23 | 1,975,000 | 2,135,012 | ||||||
Senior Housing Properties Trust, Sr. Unsec. Notes, 4.30%, 01/15/16 | 900,000 | 928,688 | ||||||
| 3,063,700 | ||||||||
Total U.S. Dollar Denominated Bonds & Notes |
| 15,971,950 | ||||||
Non U.S. Dollar Denominated Bonds & Notes–0.26%(c) |
| |||||||
| Australia–0.26% | ||||||||
General Property Trust, Sr. Unsec. Gtd. Medium-Term Notes, 6.75%, 01/24/19 (Cost $3,231,205) | AUD | 2,980,000 | 3,069,662 | |||||
| Shares | ||||||||
Money Market Funds–3.79% |
| |||||||
Liquid Assets Portfolio–Institutional Class(f) | 22,429,157 | 22,429,157 | ||||||
Premier Portfolio–Institutional Class(f) | 22,429,157 | 22,429,157 | ||||||
Total Money Market Funds |
| 44,858,314 | ||||||
TOTAL INVESTMENTS–98.92% |
| 1,172,039,062 | ||||||
OTHER ASSETS LESS LIABILITIES–1.08% |
| 12,773,279 | ||||||
NET ASSETS–100.00% |
| $ | 1,184,812,341 | |||||
Investment Abbreviations:
| AUD | – Australian Dollar | |
| Conv. | – Convertible | |
| Ctfs. | – Certificates | |
| GBP | – British Pound | |
| Gtd. | – Guaranteed |
| Pfd. | – Preferred | |
| REIT | – Real Estate Investment Trust | |
| Sr. | – Senior | |
| Sub. | – Subordinated | |
| Unsec. | – Unsecured |
Notes to Schedule of Investments:
| (a) | Non-income producing security. |
| (b) | Interest or dividend rate is redetermined periodically. Rate shown is the rate in effect on August 31, 2014. |
| (c) | Foreign denominated security. Principal amount is denominated in the currency indicated. |
| (d) | Security purchased or received in a transaction exempt from registration under the Securities Act of 1933, as amended (the “1933 Act”). The security may be resold pursuant to an exemption from registration under the 1933 Act, typically to qualified institutional buyers. The aggregate value of these securities at August 31, 2014 was $122,507,332, which represented 10.34% of the Fund’s Net Assets. |
| (e) | Perpetual bond with no specified maturity date. |
| (f) | The money market fund and the Fund are affiliated by having the same investment adviser. |
See accompanying Notes to Financial Statements which are an integral part of the financial statements.
13 Invesco Global Real Estate Income Fund
Statement of Assets and Liabilities
August 31, 2014
Assets: |
| |||
Investments, at value (Cost $1,040,348,197) | $ | 1,127,180,748 | ||
Investments in affiliated money market funds, at value and cost | 44,858,314 | |||
Total investments, at value (Cost $1,085,206,511) | 1,172,039,062 | |||
Foreign currencies, at value (Cost $2,022,067) | 2,016,341 | |||
Receivable for: | ||||
Investments sold | 6,568,162 | |||
Fund shares sold | 6,382,059 | |||
Dividends and interest | 2,992,208 | |||
Investment for trustee deferred compensation and retirement plans | 129,598 | |||
Other assets | 68,195 | |||
Total assets | 1,190,195,625 | |||
Liabilities: |
| |||
Payable for: | ||||
Investments purchased | 3,074,238 | |||
Fund shares reacquired | 1,310,620 | |||
Accrued fees to affiliates | 702,938 | |||
Accrued trustees’ and officers’ fees and benefits | 5,217 | |||
Accrued other operating expenses | 141,167 | |||
Trustee deferred compensation and retirement plans | 149,104 | |||
Total liabilities | 5,383,284 | |||
Net assets applicable to shares outstanding | $ | 1,184,812,341 | ||
Net assets consist of: |
| |||
Shares of beneficial interest | $ | 1,100,737,098 | ||
Undistributed net investment income | (3,240,481 | ) | ||
Undistributed net realized gain | 490,686 | |||
Net unrealized appreciation | 86,825,038 | |||
| $ | 1,184,812,341 | |||
Net Assets: |
| |||
Class A | $ | 609,824,060 | ||
Class B | $ | 1,647,416 | ||
Class C | $ | 118,318,942 | ||
Class Y | $ | 428,853,583 | ||
Class R5 | $ | 24,748,592 | ||
Class R6 | $ | 1,419,748 | ||
Shares outstanding, $0.01 par value per share, |
| |||
Class A | 64,355,147 | |||
Class B | 174,210 | |||
Class C | 12,513,643 | |||
Class Y | 45,382,673 | |||
Class R5 | 2,613,487 | |||
Class R6 | 149,784 | |||
Class A: | ||||
Net asset value per share | $ | 9.48 | ||
Maximum offering price per share | ||||
(Net asset value of $9.48 ¸ 94.50%) | $ | 10.03 | ||
Class B: | ||||
Net asset value and offering price per share | $ | 9.46 | ||
Class C: | ||||
Net asset value and offering price per share | $ | 9.46 | ||
Class Y: | ||||
Net asset value and offering price per share | $ | 9.45 | ||
Class R5: | ||||
Net asset value and offering price per share | $ | 9.47 | ||
Class R6: | ||||
Net asset value and offering price per share | $ | 9.48 | ||
See accompanying Notes to Financial Statements which are an integral part of the financial statements.
14 Invesco Global Real Estate Income Fund
Statement of Operations
For the year ended August 31, 2014
Investment income: |
| |||
Dividends (net of foreign withholding taxes of $1,983,616) | $ | 38,723,100 | ||
Dividends from affiliated money market funds | 11,629 | |||
Interest | 9,832,923 | |||
Total investment income | 48,567,652 | |||
Expenses: | ||||
Advisory fees | 7,892,581 | |||
Administrative services fees | 271,534 | |||
Custodian fees | 162,231 | |||
Distribution fees: | ||||
Class A | 1,545,489 | |||
Class B | 17,280 | |||
Class C | 1,131,559 | |||
Transfer Agent Fees — A, B, C and Y | 1,805,906 | |||
Transfer agent fees — R5 | 15,262 | |||
Transfer agent fees — R6 | 74 | |||
Trustees’ and officers’ fees and benefits | 58,378 | |||
Other | 660,884 | |||
Total expenses | 13,561,178 | |||
Less: Fees waived and expense offset arrangement(s) | (38,976 | ) | ||
Net expenses | 13,522,202 | |||
Net investment income | 35,045,450 | |||
Realized and unrealized gain (loss) from: | ||||
Net realized gain (loss) from: | ||||
Investment securities | 8,971,710 | |||
Foreign currencies | (40,690 | ) | ||
| 8,931,020 | ||||
Change in net unrealized appreciation of: | ||||
Investment securities | 131,949,149 | |||
Foreign currencies | 7,839 | |||
| 131,956,988 | ||||
Net realized and unrealized gain | 140,888,008 | |||
Net increase in net assets resulting from operations | $ | 175,933,458 | ||
See accompanying Notes to Financial Statements which are an integral part of the financial statements.
15 Invesco Global Real Estate Income Fund
Statement of Changes in Net Assets
For the years ended August 31, 2014 and 2013
| 2014 | 2013 | |||||||
Operations: |
| |||||||
Net investment income | $ | 35,045,450 | $ | 34,376,102 | ||||
Net realized gain | 8,931,020 | 20,420,827 | ||||||
Change in net unrealized appreciation (depreciation) | 131,956,988 | (78,750,517 | ) | |||||
Net increase (decrease) in net assets resulting from operations | 175,933,458 | (23,953,588 | ) | |||||
Distributions to shareholders from net investment income: | ||||||||
Class A | (29,303,895 | ) | (25,666,681 | ) | ||||
Class B | (69,155 | ) | (85,901 | ) | ||||
Class C | (4,479,405 | ) | (3,226,317 | ) | ||||
Class Y | (14,944,102 | ) | (11,045,614 | ) | ||||
Class R5 | (1,233,982 | ) | (1,588,351 | ) | ||||
Class R6 | (3,215 | ) | (305,539 | ) | ||||
Total distributions from net investment income | (50,033,754 | ) | (41,918,403 | ) | ||||
Distributions to shareholders from net realized gains: | ||||||||
Class A | (7,329,405 | ) | — | |||||
Class B | (20,716 | ) | — | |||||
Class C | (1,307,959 | ) | — | |||||
Class Y | (3,044,760 | ) | — | |||||
Class R5 | (292,640 | ) | — | |||||
Class R6 | (633 | ) | — | |||||
Total distributions from net realized gains | (11,996,113 | ) | — | |||||
Share transactions–net: | ||||||||
Class A | (71,036,172 | ) | 336,455,070 | |||||
Class B | (356,965 | ) | 313,925 | |||||
Class C | (2,483,292 | ) | 72,059,586 | |||||
Class Y | 124,475,560 | 173,687,611 | ||||||
Class R5 | (1,406,971 | ) | (5,198,420 | ) | ||||
Class R6 | 1,319,530 | (509,175 | ) | |||||
Net increase in net assets resulting from share transactions | 50,511,690 | 576,808,597 | ||||||
Net increase in net assets | 164,415,281 | 510,936,606 | ||||||
Net assets: | ||||||||
Beginning of year | 1,020,397,060 | 509,460,454 | ||||||
End of year (includes undistributed net investment income of $(3,240,481) and $3,702,802, respectively) | $ | 1,184,812,341 | $ | 1,020,397,060 | ||||
Notes to Financial Statements
August 31, 2014
NOTE 1—Significant Accounting Policies
Invesco Global Real Estate Income Fund (the “Fund”) is a series portfolio of AIM Counselor Series Trust (Invesco Counselor Series Trust) (the “Trust”). The Trust is a Delaware statutory trust registered under the Investment Company Act of 1940, as amended (the “1940 Act”), as an open-end series management investment company consisting of thirteen separate portfolios, each authorized to issue an unlimited number of shares of beneficial interest. The assets, liabilities and operations of each portfolio are accounted for separately. Information presented in these financial statements pertains only to the Fund. Matters affecting each portfolio or class will be voted on exclusively by the shareholders of such portfolio or class.
The Fund’s investment objective is current income and, secondarily, capital appreciation.
The Fund currently consists of six different classes of shares: Class A, Class B, Class C, Class Y, Class R5 and Class R6. Class A shares are sold with a front-end sales charge unless certain waiver criteria are met and under certain circumstances load waived shares may be subject to contingent deferred sales charges (“CDSC”). Class C shares are sold with a CDSC. Class Y, Class R5 and Class R6 shares are sold at net asset value. Effective November 30, 2010, new or additional investments in Class B shares are no longer permitted. Existing shareholders of Class B shares may continue to reinvest dividends and capital gains distributions in Class B shares until they convert to Class A shares. Also, shareholders in Class B shares will be able to exchange those shares for Class B shares of other Invesco Funds offering such shares until they convert to Class A shares. Generally,
16 Invesco Global Real Estate Income Fund
Class B shares will automatically convert to Class A shares on or about the month-end, which is at least eight years after the date of purchase. Redemption of Class B shares prior to the conversion date will be subject to a CDSC.
The following is a summary of the significant accounting policies followed by the Fund in the preparation of its financial statements.
| A. | Security Valuations — Securities, including restricted securities, are valued according to the following policy. |
A security listed or traded on an exchange (except convertible securities) is valued at its last sales price or official closing price as of the close of the customary trading session on the exchange where the security is principally traded, or lacking any sales or official closing price on a particular day, the security may be valued at the closing bid price on that day. Securities traded in the over-the-counter market are valued based on prices furnished by independent pricing services or market makers. When such securities are valued by an independent pricing service they may be considered fair valued. Futures contracts are valued at the final settlement price set by an exchange on which they are principally traded. Listed options are valued at the mean between the last bid and ask prices from the exchange on which they are principally traded. Options not listed on an exchange are valued by an independent source at the mean between the last bid and ask prices. For purposes of determining net asset value per share, futures and option contracts generally are valued 15 minutes after the close of the customary trading session of the New York Stock Exchange (“NYSE”).
Investments in open-end and closed-end registered investment companies that do not trade on an exchange are valued at the end of day net asset value per share. Investments in open-end and closed-end registered investment companies that trade on an exchange are valued at the last sales price or official closing price as of the close of the customary trading session on the exchange where the security is principally traded.
Debt obligations (including convertible securities) and unlisted equities are fair valued using an evaluated quote provided by an independent pricing service. Evaluated quotes provided by the pricing service may be determined without exclusive reliance on quoted prices, and may reflect appropriate factors such as institution-size trading in similar groups of securities, developments related to specific securities, dividend rate (for unlisted equities), yield (for debt obligations), quality, type of issue, coupon rate (for debt obligations), maturity (for debt obligations), individual trading characteristics and other market data. Debt obligations are subject to interest rate and credit risks. In addition, all debt obligations involve some risk of default with respect to interest and/or principal payments.
Foreign securities’ (including foreign exchange contracts) prices are converted into U.S. dollar amounts using the applicable exchange rates as of the close of the NYSE. If market quotations are available and reliable for foreign exchange-traded equity securities, the securities will be valued at the market quotations. Because trading hours for certain foreign securities end before the close of the NYSE, closing market quotations may become unreliable. If between the time trading ends on a particular security and the close of the customary trading session on the NYSE, events occur that the Adviser determines are significant and make the closing price unreliable, the Fund may fair value the security. If the event is likely to have affected the closing price of the security, the security will be valued at fair value in good faith using procedures approved by the Board of Trustees. Adjustments to closing prices to reflect fair value may also be based on a screening process of an independent pricing service to indicate the degree of certainty, based on historical data, that the closing price in the principal market where a foreign security trades is not the current value as of the close of the NYSE. Foreign securities’ prices meeting the approved degree of certainty that the price is not reflective of current value will be priced at the indication of fair value from the independent pricing service. Multiple factors may be considered by the independent pricing service in determining adjustments to reflect fair value and may include information relating to sector indices, American Depositary Receipts and domestic and foreign index futures. Foreign securities may have additional risks including exchange rate changes, potential for sharply devalued currencies and high inflation, political and economic upheaval, the relative lack of issuer information, relatively low market liquidity and the potential lack of strict financial and accounting controls and standards.
Securities for which market prices are not provided by any of the above methods may be valued based upon quotes furnished by independent sources. The last bid price may be used to value equity securities. The mean between the last bid and asked prices will be used to value debt obligations and corporate loans.
Securities for which market quotations are not readily available or became unreliable are valued at fair value as determined in good faith by or under the supervision of the Trust’s officers following procedures approved by the Board of Trustees. Issuer specific events, market trends, bid/ask quotes of brokers and information providers and other market data may be reviewed in the course of making a good faith determination of a security’s fair value.
The Fund may invest in securities that are subject to interest rate risk, meaning the risk that the prices will generally fall as interest rates rise and, conversely, the prices will generally rise as interest rates fall. Specific securities differ in their sensitivity to changes in interest rates depending on their individual characteristics. Changes in interest rates may result in increased market volatility, which may affect the value and/or liquidity of certain of the Fund’s investments.
Valuations change in response to many factors including the historical and prospective earnings of the issuer, the value of the issuer’s assets, general economic conditions, interest rates, investor perceptions and market liquidity. Because of the inherent uncertainties of valuation, the values reflected in the financial statements may materially differ from the value received upon actual sale of those investments.
| B. | Securities Transactions and Investment Income — Securities transactions are accounted for on a trade date basis. Realized gains or losses on sales are computed on the basis of specific identification of the securities sold. Interest income (net of withholding tax, if any) is recorded on the accrual basis from settlement date. Paydown gains and losses on mortgage and asset-backed securities are recorded as adjustments to interest income. Dividend income (net of withholding tax, if any) is recorded on the ex-dividend date. Bond premiums and discounts are amortized and/or accreted for financial reporting purposes. |
The Fund may periodically participate in litigation related to Fund investments. As such, the Fund may receive proceeds from litigation settlements. Any proceeds received are included in the Statement of Operations as realized gain (loss) for investments no longer held and as unrealized gain (loss) for investments still held.
Brokerage commissions and mark ups are considered transaction costs and are recorded as an increase to the cost basis of securities purchased and/or a reduction of proceeds on a sale of securities. Such transaction costs are included in the determination of net realized and unrealized gain (loss) from investment securities reported in the Statement of Operations and the Statement of Changes in Net Assets and the net realized and unrealized gains (losses) on securities per share in the Financial Highlights. Transaction costs are included in the calculation of the Fund’s net asset value and, accordingly, they reduce the Fund’s total returns. These transaction costs are not considered operating expenses and are not reflected in net investment income reported in the Statement of Operations and Statement of Changes in Net Assets, or the net investment
17 Invesco Global Real Estate Income Fund
income per share and ratios of expenses and net investment income reported in the Financial Highlights, nor are they limited by any expense limitation arrangements between the Fund and the investment adviser.
The Fund recharacterizes distributions received from REIT investments based on information provided by the REIT into the following categories: ordinary income, long-term and short-term capital gains, and return of capital. If information is not available timely from the REIT, the recharacterization will be based on available information which may include the previous year’s allocation. If new or additional information becomes available from the REIT at a later date, a recharacterization will be made in the following year. The Fund records as dividend income the amount recharacterized as ordinary income and as realized gain the amount recharacterized as capital gain in the Statement of Operations, and the amount recharacterized as return of capital in the Statement of Changes in Net Assets. These recharacterizations are reflected in the accompanying financial statements.
| C. | Country Determination — For the purposes of making investment selection decisions and presentation in the Schedule of Investments, the investment adviser may determine the country in which an issuer is located and/or credit risk exposure based on various factors. These factors include the laws of the country under which the issuer is organized, where the issuer maintains a principal office, the country in which the issuer derives 50% or more of its total revenues and the country that has the primary market for the issuer’s securities, as well as other criteria. Among the other criteria that may be evaluated for making this determination are the country in which the issuer maintains 50% or more of its assets, the type of security, financial guarantees and enhancements, the nature of the collateral and the sponsor organization. Country of issuer and/or credit risk exposure has been determined to be the United States of America, unless otherwise noted. |
| D. | Distributions — Distributions from net investment income, if any, are declared and paid quarterly and are recorded on the ex-dividend date. Distributions from net realized capital gain, if any, are generally declared and paid annually and recorded on the ex-dividend date. The Fund may elect to treat a portion of the proceeds from redemptions as distributions for federal income tax purposes. |
| E. | Federal Income Taxes — The Fund intends to comply with the requirements of Subchapter M of the Internal Revenue Code of 1986, as amended (the “Internal Revenue Code”), necessary to qualify as a regulated investment company and to distribute substantially all of the Fund’s taxable earnings to shareholders. As such, the Fund will not be subject to federal income taxes on otherwise taxable income (including net realized capital gain) that is distributed to shareholders. Therefore, no provision for federal income taxes is recorded in the financial statements. |
The Fund recognizes the tax benefits of uncertain tax positions only when the position is more likely than not to be sustained. Management has analyzed the Fund’s uncertain tax positions and concluded that no liability for unrecognized tax benefits should be recorded related to uncertain tax positions. Management is not aware of any tax positions for which it is reasonably possible that the total amounts of unrecognized tax benefits will change materially in the next 12 months.
The Fund files tax returns in the U.S. Federal jurisdiction and certain other jurisdictions. Generally, the Fund is subject to examinations by such taxing authorities for up to three years after the filing of the return for the tax period.
| F. | Expenses — Fees provided for under the Rule 12b-1 plan of a particular class of the Fund are charged to the operations of such class. Transfer agency fees and expenses and other shareholder recordkeeping fees and expenses attributable to Class R5 and Class R6 are allocated to each share class based on relative net assets. Sub-accounting fees attributable to Class R5 are charged to the operations of the class. Transfer agency fees and expenses and other shareholder recordkeeping fees and expenses relating to all other classes are allocated among those classes based on relative net assets. All other expenses are allocated among the classes based on relative net assets. |
| G. | Accounting Estimates — The preparation of financial statements in conformity with accounting principles generally accepted in the United States of America (“GAAP”) requires management to make estimates and assumptions that affect the reported amounts of assets and liabilities at the date of the financial statements and the reported amounts of revenues and expenses during the reporting period including estimates and assumptions related to taxation. Actual results could differ from those estimates by a significant amount. In addition, the Fund monitors for material events or transactions that may occur or become known after the period-end date and before the date the financial statements are released to print. |
| H. | Indemnifications — Under the Trust’s organizational documents, each Trustee, officer, employee or other agent of the Trust is indemnified against certain liabilities that may arise out of the performance of their duties to the Fund. Additionally, in the normal course of business, the Fund enters into contracts, including the Fund’s servicing agreements, that contain a variety of indemnification clauses. The Fund’s maximum exposure under these arrangements is unknown as this would involve future claims that may be made against the Fund that have not yet occurred. The risk of material loss as a result of such indemnification claims is considered remote. |
| I. | Foreign Currency Translations — Foreign currency is valued at the close of the NYSE based on quotations posted by banks and major currency dealers. Portfolio securities and other assets and liabilities denominated in foreign currencies are translated into U.S. dollar amounts at date of valuation. Purchases and sales of portfolio securities (net of foreign taxes withheld on disposition) and income items denominated in foreign currencies are translated into U.S. dollar amounts on the respective dates of such transactions. The Fund does not separately account for the portion of the results of operations resulting from changes in foreign exchange rates on investments and the fluctuations arising from changes in market prices of securities held. The combined results of changes in foreign exchange rates and the fluctuation of market prices on investments (net of estimated foreign tax withholding) are included with the net realized and unrealized gain or loss from investments in the Statement of Operations. Reported net realized foreign currency gains or losses arise from (1) sales of foreign currencies, (2) currency gains or losses realized between the trade and settlement dates on securities transactions, and (3) the difference between the amounts of dividends, interest, and foreign withholding taxes recorded on the Fund’s books and the U.S. dollar equivalent of the amounts actually received or paid. Net unrealized foreign currency gains and losses arise from changes in the fair values of assets and liabilities, other than investments in securities at fiscal period end, resulting from changes in exchange rates. |
The Fund may invest in foreign securities, which may be subject to foreign taxes on income, gains on investments or currency repatriation, a portion of which may be recoverable. Foreign taxes, if any, are recorded based on the tax regulations and rates that exist in the foreign markets in which the Fund invests and are shown in the Statement of Operations.
| J. | Forward Foreign Currency Contracts — The Fund may engage in foreign currency transactions either on a spot (i.e. for prompt delivery and settlement) basis at the rate prevailing in the currency exchange market at the time or through forward foreign currency contracts to manage or minimize currency or exchange rate risk. |
18 Invesco Global Real Estate Income Fund
The Fund may also enter into forward foreign currency contracts for the purchase or sale of a security denominated in a foreign currency in order to “lock in” the U.S. dollar price of that security, or the Fund may also enter into forward foreign currency contracts that do not provide for physical settlement of the two currencies, but instead are settled by a single cash payment calculated as the difference between the agreed upon exchange rate and the spot rate at settlement based upon an agreed upon notional amount (non-deliverable forwards). The Fund will set aside liquid assets in an amount equal to daily mark-to-market obligation for forward foreign currency contracts.
A forward foreign currency contract is an obligation to purchase or sell a specific currency for an agreed-upon price at a future date. The use of forward foreign currency contracts does not eliminate fluctuations in the price of the underlying securities the Fund owns or intends to acquire but establishes a rate of exchange in advance. Fluctuations in the value of these contracts are measured by the difference in the contract date and reporting date exchange rates and are recorded as unrealized appreciation (depreciation) until the contracts are closed. When the contracts are closed, realized gains (losses) are recorded. Realized and unrealized gains (losses) on the contracts are included in the Statement of Operations. The primary risks associated with forward foreign currency contracts include failure of the counterparty to meet the terms of the contract and the value of the foreign currency changing unfavorably. These risks may be in excess of the amounts reflected in the Statement of Assets and Liabilities.
| K. | Other Risks — The Fund’s investments are concentrated in a comparatively narrow segment of the economy. Consequently, the Fund may tend to be more volatile than other mutual funds, and the value of the Fund’s investments may tend to rise and fall more rapidly. |
Because, the Fund concentrates its assets in the real estate industry, an investment in the Fund will be closely linked to the performance of the real estate markets. Property values may fall due to increasing vacancies or declining rents resulting from economic, legal, cultural or technological developments.
NOTE 2—Advisory Fees and Other Fees Paid to Affiliates
The Trust has entered into a master investment advisory agreement with Invesco Advisers, Inc. (the “Adviser” or “Invesco”). Under the terms of the investment advisory agreement, the Fund pays an advisory fee to the Adviser based on the annual rate of the Fund’s average daily net assets as follows:
| Average Daily Net Assets | Rate | |||
First $250 million | 0.75% | |||
Next $250 million | 0.74% | |||
Next $500 million | 0.73% | |||
Next $1.5 billion | 0.72% | |||
Next $2.5 billion | 0.71% | |||
Next $2.5 billion | 0.70% | |||
Next $2.5 billion | 0.69% | |||
Over $10 billion | 0.68% | |||
Under the terms of a master sub-advisory agreement between the Adviser and each of Invesco Asset Management Deutschland GmbH, Invesco Asset Management Limited, Invesco Asset Management (Japan) Limited, Invesco Australia Limited, Invesco Hong Kong Limited, Invesco Senior Secured Management, Inc. and Invesco Canada Ltd. (collectively, the “Affiliated Sub-Advisers”) the Adviser, not the Fund, may pay 40% of the fees paid to the Adviser to any such Affiliated Sub-Adviser(s) that provide(s) discretionary investment management services to the Fund based on the percentage of assets allocated to such Sub-Adviser(s).
The Adviser has contractually agreed, through at least June 30, 2015, to waive advisory fees and/or reimburse expenses of all shares to the extent necessary to limit total annual fund operating expenses after fee waiver and/or expense reimbursemnt (excluding certain items discussed below) of Class A, Class B, Class C, Class Y, Class R5 and Class R6 shares to 2.00%, 2.75%, 2.75%, 1.75%, 1.75% and 1.75% of average daily net assets. In determining the Adviser’s obligation to waive advisory fees and/or reimburse expenses, the following expenses are not taken into account, and could cause the total annual fund operating expenses after fee waiver and/or expense reimbursemnt to exceed the numbers reflected above: (1) interest; (2) taxes; (3) dividend expense on short sales; (4) extraordinary or non-routine items, including litigation expenses; and (5) expenses that the Fund has incurred but did not actually pay because of an expense offset arrangement. Unless Invesco continues the fee waiver agreement, it will terminate on June 30, 2015. The fee waiver agreement cannot be terminated during its term. The Adviser did not waive fees and/or reimburse expenses during the period under this expense limitation.
Further, the Adviser has contractually agreed, through at least June 30, 2016, to waive the advisory fee payable by the Fund in an amount equal to 100% of the net advisory fees the Adviser receives from the affiliated money market funds on investments by the Fund of uninvested cash in such affiliated money market funds.
For the year ended August 31, 2014, the Adviser waived advisory fees of $38,361.
The Trust has entered into a master administrative services agreement with Invesco pursuant to which the Fund has agreed to pay Invesco for certain administrative costs incurred in providing accounting services to the Fund. For the year ended August 31, 2014, expenses incurred under the agreement are shown in the Statement of Operations as Administrative services fees.
The Trust has entered into a transfer agency and service agreement with Invesco Investment Services, Inc. (“IIS”) pursuant to which the Fund has agreed to pay IIS a fee for providing transfer agency and shareholder services to the Fund and reimburse IIS for certain expenses incurred by IIS in the course of providing such services. IIS may make payments to intermediaries that provide omnibus account services, sub-accounting services and/or networking services. All fees payable by IIS to intermediaries that provide omnibus account services or sub-accounting are charged back to the Fund, subject to certain limitations approved by the Trust’s Board of Trustees. For the year ended August 31, 2014, expenses incurred under the agreement are shown in the Statement of Operations as Transfer agent fees.
19 Invesco Global Real Estate Income Fund
The Trust has entered into master distribution agreements with Invesco Distributors, Inc. (“IDI”) to serve as the distributor for the Class A, Class B, Class C, Class Y, Class R5 and Class R6 shares of the Fund. The Trust has adopted plans pursuant to Rule 12b-1 under the 1940 Act with respect to the Fund’s Class A, Class B and Class C shares (collectively, the “Plans”). The Fund, pursuant to the Plans, pays IDI compensation at the annual rate of 0.25% of the Fund’s average daily net assets of Class A shares and 1.00% of the average daily net assets of Class B and Class C shares. Of the Plan payments, up to 0.25% of the average daily net assets of each class of shares may be paid to furnish continuing personal shareholder services to customers who purchase and own shares of such classes. Any amounts not paid as a service fee under the Plans would constitute an asset-based sales charge. Rules of the Financial Industry Regulatory Authority (“FINRA”) impose a cap on the total sales charges, including asset-based sales charges, that may be paid by any class of shares of the Fund. For the year ended August 31, 2014, expenses incurred under the Plans are shown in the Statement of Operations as Distribution fees.
Front-end sales commissions and CDSC (collectively, the “sales charges”) are not recorded as expenses of the Fund. Front-end sales commissions are deducted from proceeds from the sales of Fund shares prior to investment in Class A shares of the Fund. CDSC are deducted from redemption proceeds prior to remittance to the shareholder. During the year ended August 31, 2014, IDI advised the Fund that IDI retained $162,399 in front-end sales commissions from the sale of Class A shares and $19,361, $1,827 and $27,299 from Class A, Class B and Class C shares, respectively, for CDSC imposed on redemptions by shareholders.
Certain officers and trustees of the Trust are officers and directors of the Adviser, IIS and/or IDI.
NOTE 3—Additional Valuation Information
GAAP defines fair value as the price that would be received to sell an asset or paid to transfer a liability in an orderly transaction between market participants at the measurement date, under current market conditions. GAAP establishes a hierarchy that prioritizes the inputs to valuation methods, giving the highest priority to readily available unadjusted quoted prices in an active market for identical assets (Level 1) and the lowest priority to significant unobservable inputs (Level 3), generally when market prices are not readily available or are unreliable. Based on the valuation inputs, the securities or other investments are tiered into one of three levels. Changes in valuation methods may result in transfers in or out of an investment’s assigned level:
| Level 1 — | Prices are determined using quoted prices in an active market for identical assets. |
| Level 2 — | Prices are determined using other significant observable inputs. Observable inputs are inputs that other market participants may use in pricing a security. These may include quoted prices for similar securities, interest rates, prepayment speeds, credit risk, yield curves, loss severities, default rates, discount rates, volatilities and others. |
| Level 3 — | Prices are determined using significant unobservable inputs. In situations where quoted prices or observable inputs are unavailable (for example, when there is little or no market activity for an investment at the end of the period), unobservable inputs may be used. Unobservable inputs reflect the Fund’s own assumptions about the factors market participants would use in determining fair value of the securities or instruments and would be based on the best available information. |
The following is a summary of the tiered valuation input levels, as of August 31, 2014. The level assigned to the securities valuations may not be an indication of the risk or liquidity associated with investing in those securities. Because of the inherent uncertainties of valuation, the values reflected in the financial statements may materially differ from the value received upon actual sale of those investments.
During the year ended August 31, 2014, there were transfers from Level 1 to Level 2 of $39,351,930 and from Level 2 to Level 1 of $162,238,962, due to foreign fair value adjustments.
| Level 1 | Level 2 | Level 3 | Total | |||||||||||||
Australia | $ | 50,469,874 | $ | 31,078,761 | $ | — | $ | 81,548,635 | ||||||||
Brazil | — | 7,969,500 | — | 7,969,500 | ||||||||||||
Canada | 47,602,074 | — | — | 47,602,074 | ||||||||||||
China | 11,235,882 | 4,938,750 | — | 16,174,632 | ||||||||||||
Finland | 2,532,549 | — | — | 2,532,549 | ||||||||||||
France | 31,068,086 | — | — | 31,068,086 | ||||||||||||
Germany | 2,900,265 | 4,062,317 | — | 6,962,582 | ||||||||||||
Hong Kong | 30,086,863 | 6,234,664 | — | 36,321,527 | ||||||||||||
Japan | 84,720,070 | 8,065,662 | — | 92,785,732 | ||||||||||||
Netherlands | 5,327,006 | — | — | 5,327,006 | ||||||||||||
Singapore | 38,402,250 | — | — | 38,402,250 | ||||||||||||
South Africa | 8,025,170 | — | — | 8,025,170 | ||||||||||||
Sweden | 4,050,143 | 4,162,232 | — | 8,212,375 | ||||||||||||
United Kingdom | 13,013,178 | 43,004,568 | — | 56,017,746 | ||||||||||||
United States | 543,944,913 | 189,144,285 | — | 733,089,198 | ||||||||||||
Total Investments | $ | 873,378,323 | $ | 298,660,739 | $ | — | $ | 1,172,039,062 | ||||||||
NOTE 4—Expense Offset Arrangement(s)
The expense offset arrangement is comprised of transfer agency credits which result from balances in demand deposit accounts used by the transfer agent for clearing shareholder transactions. For the year ended August 31, 2014, the Fund received credits from this arrangement, which resulted in the reduction of the Fund’s total expenses of $615.
20 Invesco Global Real Estate Income Fund
NOTE 5—Trustees’ and Officers’ Fees and Benefits
Trustees’ and Officers’ Fees and Benefits include amounts accrued by the Fund to pay remuneration to certain Trustees and Officers of the Fund. Trustees have the option to defer compensation payable by the Fund, and Trustees’ and Officers’ Fees and Benefits also include amounts accrued by the Fund to fund such deferred compensation amounts. Those Trustees who defer compensation have the option to select various Invesco Funds in which their deferral accounts shall be deemed to be invested. Finally, certain current Trustees were eligible to participate in a retirement plan that provided for benefits to be paid upon retirement to Trustees over a period of time based on the number of years of service. The Fund may have certain former Trustees who also participate in a retirement plan and receive benefits under such plan. Trustees’ and Officers’ Fees and Benefits include amounts accrued by the Fund to fund such retirement benefits. Obligations under the deferred compensation and retirement plans represent unsecured claims against the general assets of the Fund.
NOTE 6—Cash Balances
The Fund is permitted to temporarily carry a negative or overdrawn balance in its account with State Street Bank and Trust Company, the custodian bank. Such balances, if any at period end, are shown in the Statement of Assets and Liabilities under the payable caption Amount due custodian. To compensate the custodian bank for such overdrafts, the overdrawn Fund may either (1) leave funds as a compensating balance in the account so the custodian bank can be compensated by earning the additional interest; or (2) compensate by paying the custodian bank at a rate agreed upon by the custodian bank and Invesco, not to exceed the contractually agreed upon rate.
NOTE 7—Distributions to Shareholders and Tax Components of Net Assets
Tax Character of Distributions to Shareholders Paid During the Years Ended August 31, 2014 and 2013:
| 2014 | 2013 | |||||||
Ordinary income | $ | 49,534,870 | $ | 41,918,403 | ||||
Long-term capital gain | 12,494,997 | — | ||||||
Total distributions | $ | 62,029,867 | $ | 41,918,403 | ||||
Tax Components of Net Assets at Period-End:
| 2014 | ||||
Undistributed ordinary income | $ | 24,264,901 | ||
Undistributed long-term gain | 583,624 | |||
Net unrealized appreciation — investments | 59,368,329 | |||
Net unrealized appreciation (depreciation) — other investments | (7,513 | ) | ||
Temporary book/tax differences | (134,098 | ) | ||
Shares of beneficial interest | 1,100,737,098 | |||
Total net assets | $ | 1,184,812,341 | ||
The difference between book-basis and tax-basis unrealized appreciation (depreciation) is due to differences in the timing of recognition of gains and losses on investments for tax and book purposes. The Fund’s net unrealized appreciation difference is attributable primarily to wash sales and passive foreign investment companies.
The temporary book/tax differences are a result of timing differences between book and tax recognition of income and/or expenses. The Fund’s temporary book/tax differences are the result of the trustee deferral of compensation and retirement plan benefits.
Capital loss carryforward is calculated and reported as of a specific date. Results of transactions and other activity after that date may affect the amount of capital loss carryforward actually available for the Fund to utilize. Capital losses generated in years beginning after December 22, 2010 can be carried forward for an unlimited period, whereas previous losses expire in 8 tax years. Capital losses with an expiration period may not be used to offset capital gains until all net capital losses without an expiration date have been utilized. Capital loss carryforwards with no expiration date will retain their character as either short-term or long-term capital losses instead of as short-term capital losses as under prior law. The ability to utilize capital loss carryforward in the future may be limited under the Internal Revenue Code and related regulations based on the results of future transactions.
The Fund does not have a capital loss carryforward as of August 31, 2014.
NOTE 8—Investment Securities
The aggregate amount of investment securities (other than short-term securities, U.S. Treasury obligations and money market funds, if any) purchased and sold by the Fund during the year ended August 31, 2014 was $638,435,721 and $636,466,104, respectively. Cost of investments on a tax basis includes the adjustments for financial reporting purposes as of the most recently completed federal income tax reporting period-end.
| Unrealized Appreciation (Depreciation) of Investment Securities on a Tax Basis | ||||
Aggregate unrealized appreciation of investment securities | $ | 67,234,458 | ||
Aggregate unrealized (depreciation) of investment securities | (7,866,129 | ) | ||
Net unrealized appreciation of investment securities | $ | 59,368,329 | ||
Cost of investments for tax purposes is $1,112,670,733.
21 Invesco Global Real Estate Income Fund
NOTE 9—Reclassification of Permanent Differences
Primarily as a result of differing book/tax treatment of foreign currency transactions and passive foreign investment companies, on August 31, 2014, undistributed net investment income was increased by $8,045,021, undistributed net realized gain was decreased by $7,846,620 and shares of beneficial interest was decreased by $198,401. This reclassification had no effect on the net assets of the Fund.
NOTE 10—Share Information
| Summary of Share Activity | ||||||||||||||||
| Years ended August 31, | ||||||||||||||||
| 2014(a) | 2013 | |||||||||||||||
| Shares | Amount | Shares | Amount | |||||||||||||
Sold: | ||||||||||||||||
Class A | 21,831,402 | $ | 194,598,629 | 51,782,661 | $ | 473,071,246 | ||||||||||
Class B | 19,347 | 175,050 | 92,521 | 840,179 | ||||||||||||
Class C | 2,660,455 | 23,754,784 | 9,354,648 | 86,167,442 | ||||||||||||
Class Y | 30,854,297 | 277,083,008 | 28,585,952 | 260,842,380 | ||||||||||||
Class R5 | 571,384 | 5,091,729 | 1,792,319 | 16,207,911 | ||||||||||||
Class R6(b) | 154,100 | 1,425,572 | 1,058,633 | 9,542,340 | ||||||||||||
Issued as reinvestment of dividends: | ||||||||||||||||
Class A | 3,295,294 | 28,602,726 | 2,262,975 | 20,143,201 | ||||||||||||
Class B | 8,822 | 76,364 | 8,184 | 72,954 | ||||||||||||
Class C | 553,619 | 4,795,746 | 310,380 | 2,758,916 | ||||||||||||
Class Y | 1,678,076 | 14,607,185 | 1,013,301 | 9,002,041 | ||||||||||||
Class R5 | 164,077 | 1,423,539 | 165,684 | 1,478,806 | ||||||||||||
Class R6 | 374 | 3,267 | 34,061 | 305,436 | ||||||||||||
Automatic conversion of Class B shares to Class A shares: | ||||||||||||||||
Class A | 21,919 | 197,730 | 34,937 | 321,041 | ||||||||||||
Class B | (21,948 | ) | (197,730 | ) | (34,993 | ) | (321,041 | ) | ||||||||
Reacquired: | ||||||||||||||||
Class A | (33,038,903 | ) | (294,435,257 | ) | (17,336,317 | ) | (157,080,418 | ) | ||||||||
Class B | (46,209 | ) | (410,649 | ) | (30,996 | ) | (278,167 | ) | ||||||||
Class C | (3,501,043 | ) | (31,033,822 | ) | (1,869,410 | ) | (16,866,772 | ) | ||||||||
Class Y | (18,932,345 | ) | (167,214,633 | ) | (10,617,706 | ) | (96,156,810 | ) | ||||||||
Class R5 | (889,093 | ) | (7,922,239 | ) | (2,548,470 | ) | (22,885,137 | ) | ||||||||
Class R6 | (11,744 | ) | (109,309 | ) | (1,085,640 | ) | (10,356,951 | ) | ||||||||
Net increase in share activity | 5,371,881 | $ | 50,511,690 | 62,972,724 | $ | 576,808,597 | ||||||||||
| (a) | There are entities that are record owners of more than 5% of the outstanding shares of the Fund and in the aggregate own 52% of the outstanding shares of the Fund. IDI has an agreement with these entities to sell Fund shares. The Fund, Invesco and/or Invesco affiliates may make payments to these entities, which are considered to be related to the Fund, for providing services to the Fund, Invesco and/or Invesco affiliates including but not limited to services such as securities brokerage, distribution, third party record keeping and account servicing. The Fund has no knowledge as to whether all or any portion of the shares owned of record by these entities are also owned beneficially. |
| (b) | Commencement date of September 24, 2012. |
22 Invesco Global Real Estate Income Fund
NOTE 11—Financial Highlights
The following schedule presents financial highlights for a share of the Fund outstanding throughout the periods indicated.
| Net asset value, beginning of period | Net investment income(a) | Net gains (losses) on securities (both realized and unrealized) | Total from investment operations | Dividends from net investment income | Distributions from net realized gains | Total distributions | Net asset value, end of period | Total return(b) | Net assets, end of period (000’s omitted) | Ratio of expenses to average net assets with fee waivers and/or expenses absorbed | Ratio of expenses to average net assets without fee waivers and/or expenses absorbed | Ratio of net investment income to average net assets | Portfolio turnover(c) | |||||||||||||||||||||||||||||||||||||||||||
Class A |
| |||||||||||||||||||||||||||||||||||||||||||||||||||||||
Year ended 08/31/14 | $ | 8.52 | $ | 0.29 | $ | 1.19 | $ | 1.48 | $ | (0.42 | ) | $ | (0.10 | ) | $ | (0.52 | ) | $ | 9.48 | 18.13 | % | $ | 609,824 | 1.27 | %(d) | 1.27 | %(d) | 3.26 | %(d) | 61 | % | |||||||||||||||||||||||||
Year ended 08/31/13 | 8.97 | 0.36 | (0.31 | ) | 0.05 | (0.50 | ) | — | (0.50 | ) | 8.52 | 0.43 | 615,876 | 1.26 | 1.27 | 4.00 | 63 | |||||||||||||||||||||||||||||||||||||||
Year ended 08/31/12 | 8.39 | 0.41 | 0.57 | 0.98 | (0.40 | ) | — | (0.40 | ) | 8.97 | (e) | 12.19 | 318,464 | 1.31 | 1.31 | 4.82 | 49 | |||||||||||||||||||||||||||||||||||||||
Year ended 08/31/11 | 7.77 | 0.32 | 0.61 | 0.93 | (0.31 | ) | — | (0.31 | ) | 8.39 | 12.11 | 203,100 | 1.30 | 1.30 | 3.83 | 101 | ||||||||||||||||||||||||||||||||||||||||
Year ended 08/31/10 | 6.62 | 0.28 | 1.14 | 1.42 | (0.27 | ) | — | (0.27 | ) | 7.77 | 21.85 | 147,568 | 1.37 | 1.38 | 3.93 | 77 | ||||||||||||||||||||||||||||||||||||||||
Class B |
| |||||||||||||||||||||||||||||||||||||||||||||||||||||||
Year ended 08/31/14 | 8.51 | 0.23 | 1.18 | 1.41 | (0.36 | ) | (0.10 | ) | (0.46 | ) | 9.46 | 17.13 | 1,647 | 2.02 | (d) | 2.02 | (d) | 2.51 | (d) | 61 | ||||||||||||||||||||||||||||||||||||
Year ended 08/31/13 | 8.95 | 0.29 | (0.30 | ) | (0.01 | ) | (0.43 | ) | — | (0.43 | ) | 8.51 | (0.23 | ) | 1,822 | 2.01 | 2.02 | 3.25 | 63 | |||||||||||||||||||||||||||||||||||||
Year ended 08/31/12 | 8.36 | 0.34 | 0.59 | 0.93 | (0.34 | ) | — | (0.34 | ) | 8.95 | (e) | 11.49 | 1,606 | 2.06 | 2.06 | 4.07 | 49 | |||||||||||||||||||||||||||||||||||||||
Year ended 08/31/11 | 7.75 | 0.26 | 0.59 | 0.85 | (0.24 | ) | — | (0.24 | ) | 8.36 | 11.15 | 1,772 | 2.05 | 2.05 | 3.08 | 101 | ||||||||||||||||||||||||||||||||||||||||
Year ended 08/31/10 | 6.60 | 0.23 | 1.14 | 1.37 | (0.22 | ) | — | (0.22 | ) | 7.75 | 21.02 | 1,676 | 2.12 | 2.13 | 3.18 | 77 | ||||||||||||||||||||||||||||||||||||||||
Class C |
| |||||||||||||||||||||||||||||||||||||||||||||||||||||||
Year ended 08/31/14 | 8.51 | 0.23 | 1.18 | 1.41 | (0.36 | ) | (0.10 | ) | (0.46 | ) | 9.46 | 17.14 | 118,319 | 2.02 | (d) | 2.02 | (d) | 2.51 | (d) | 61 | ||||||||||||||||||||||||||||||||||||
Year ended 08/31/13 | 8.95 | 0.29 | (0.30 | ) | (0.01 | ) | (0.43 | ) | — | (0.43 | ) | 8.51 | (0.23 | ) | 108,878 | 2.01 | 2.02 | 3.25 | 63 | |||||||||||||||||||||||||||||||||||||
Year ended 08/31/12 | 8.36 | 0.34 | 0.59 | 0.93 | (0.34 | ) | — | (0.34 | ) | 8.95 | (e) | 11.49 | 44,790 | 2.06 | 2.06 | 4.07 | 49 | |||||||||||||||||||||||||||||||||||||||
Year ended 08/31/11 | 7.75 | 0.26 | 0.59 | 0.85 | (0.24 | ) | — | (0.24 | ) | 8.36 | 11.15 | 26,511 | 2.05 | 2.05 | 3.08 | 101 | ||||||||||||||||||||||||||||||||||||||||
Year ended 08/31/10 | 6.60 | 0.23 | 1.14 | 1.37 | (0.22 | ) | — | (0.22 | ) | 7.75 | 21.02 | 16,692 | 2.12 | 2.13 | 3.18 | 77 | ||||||||||||||||||||||||||||||||||||||||
Class Y |
| |||||||||||||||||||||||||||||||||||||||||||||||||||||||
Year ended 08/31/14 | 8.50 | 0.32 | 1.17 | 1.49 | (0.44 | ) | (0.10 | ) | (0.54 | ) | 9.45 | 18.33 | 428,854 | 1.02 | (d) | 1.02 | (d) | 3.51 | (d) | 61 | ||||||||||||||||||||||||||||||||||||
Year ended 08/31/13 | 8.95 | 0.39 | (0.32 | ) | 0.07 | (0.52 | ) | — | (0.52 | ) | 8.50 | 0.68 | 270,196 | 1.01 | 1.02 | 4.25 | 63 | |||||||||||||||||||||||||||||||||||||||
Year ended 08/31/12 | 8.36 | 0.43 | 0.58 | 1.01 | (0.42 | ) | — | (0.42 | ) | 8.95 | (e) | 12.62 | 114,525 | 1.06 | 1.06 | 5.07 | 49 | |||||||||||||||||||||||||||||||||||||||
Year ended 08/31/11 | 7.75 | 0.34 | 0.60 | 0.94 | (0.33 | ) | — | (0.33 | ) | 8.36 | 12.28 | 26,139 | 1.05 | 1.05 | 4.08 | 101 | ||||||||||||||||||||||||||||||||||||||||
Year ended 08/31/10 | 6.60 | 0.31 | 1.13 | 1.44 | (0.29 | ) | — | (0.29 | ) | 7.75 | 22.21 | 22,047 | 1.12 | 1.13 | 4.18 | 77 | ||||||||||||||||||||||||||||||||||||||||
Class R5 |
| |||||||||||||||||||||||||||||||||||||||||||||||||||||||
Year ended 08/31/14 | 8.52 | 0.32 | 1.18 | 1.50 | (0.45 | ) | (0.10 | ) | (0.55 | ) | 9.47 | 18.40 | 24,749 | 0.91 | (d) | 0.91 | (d) | 3.62 | (d) | 61 | ||||||||||||||||||||||||||||||||||||
Year ended 08/31/13 | 8.96 | 0.39 | (0.30 | ) | 0.09 | (0.53 | ) | — | (0.53 | ) | 8.52 | 0.85 | 23,565 | 0.94 | 0.95 | 4.32 | 63 | |||||||||||||||||||||||||||||||||||||||
Year ended 08/31/12 | 8.38 | 0.44 | 0.57 | 1.01 | (0.43 | ) | — | (0.43 | ) | 8.96 | (e) | 12.63 | 30,076 | 0.98 | 0.98 | 5.15 | 49 | |||||||||||||||||||||||||||||||||||||||
Year ended 08/31/11 | 7.76 | 0.35 | 0.61 | 0.96 | (0.34 | ) | — | (0.34 | ) | 8.38 | 12.52 | 35,777 | 0.96 | 0.96 | 4.17 | 101 | ||||||||||||||||||||||||||||||||||||||||
Year ended 08/31/10 | 6.62 | 0.32 | 1.13 | 1.45 | (0.31 | ) | — | (0.31 | ) | 7.76 | 22.27 | 37,711 | 0.92 | 0.93 | 4.38 | 77 | ||||||||||||||||||||||||||||||||||||||||
Class R6 |
| |||||||||||||||||||||||||||||||||||||||||||||||||||||||
Year ended 08/31/14 | 8.52 | 0.34 | 1.18 | 1.52 | (0.46 | ) | (0.10 | ) | (0.56 | ) | 9.48 | 18.62 | 1,420 | 0.87 | (d) | 0.87 | (d) | 3.66 | (d) | 61 | ||||||||||||||||||||||||||||||||||||
Year ended 08/31/13(f) | 8.98 | 0.38 | (0.41 | ) | (0.03 | ) | (0.43 | ) | — | (0.43 | ) | 8.52 | (0.49 | ) | 60 | 0.86 | (g) | 0.87 | (g) | 4.40 | (g) | 63 | ||||||||||||||||||||||||||||||||||
| (a) | Calculated using average shares outstanding. |
| (b) | Includes adjustments in accordance with accounting principles generally accepted in the United States of America and as such, the net asset value for financial reporting purposes and the returns based upon those net asset values may differ from the net asset value and returns for shareholder transactions. Does not include sales charges and is not annualized for periods less than one year, if applicable. |
| (c) | Portfolio turnover is calculated at the fund level and is not annualized for periods less than one year, if applicable. |
| (d) | Ratios are based on average daily net assets (000’s omitted) of $618,195, $1,728, $113,156, $314,013, $24,481 and $312 for Class A, Class B, Class C, Class Y, Class R5 and Class R6 shares, respectively. |
| (e) | Includes redemption fees added to shares of beneficial interest which were less than $0.005 per share. |
| (f) | Commencement date of September 24, 2012. |
| (g) | Annualized. |
23 Invesco Global Real Estate Income Fund
Report of Independent Registered Public Accounting Firm
To the Board of Trustees of AIM Counselor Series Trust (Invesco Counselor Series Trust)
and Shareholders of Invesco Global Real Estate Income Fund:
In our opinion, the accompanying statement of assets and liabilities, including the schedule of investments, and the related statements of operations and of changes in net assets and the financial highlights present fairly, in all material respects, the financial position of Invesco Global Real Estate Income Fund (one of the funds constituting AIM Counselor Series Trust (Invesco Counselor Series Trust, hereafter referred to as the “Fund”) at August 31, 2014 the results of its operations for the year then ended, the changes in its net assets for each of the two years in the period then ended and the financial highlights for each of the five years in the period then ended, in conformity with accounting principles generally accepted in the United States of America. These financial statements and financial highlights (hereafter referred to as “financial statements”) are the responsibility of the Fund’s management. Our responsibility is to express an opinion on these financial statements based on our audits. We conducted our audits of these financial statements in accordance with the standards of the Public Company Accounting Oversight Board (United States). Those standards require that we plan and perform the audit to obtain reasonable assurance about whether the financial statements are free of material misstatement. An audit includes examining, on a test basis, evidence supporting the amounts and disclosures in the financial statements, assessing the accounting principles used and significant estimates made by management, and evaluating the overall financial statement presentation. We believe that our audits, which included confirmation of securities at August 31, 2014 by correspondence with the custodian and brokers, provide a reasonable basis for our opinion.
PRICEWATERHOUSECOOPERS LLP
October 27, 2014
Houston, Texas
24 Invesco Global Real Estate Income Fund
Calculating your ongoing Fund expenses
Example
As a shareholder of the Fund, you incur two types of costs: (1) transaction costs, which may include sales charges (loads) on purchase payments or contingent deferred sales charges on redemptions, if any; and (2) ongoing costs, including management fees, distribution and/or service (12b-1) fees, and other Fund expenses. This example is intended to help you understand your ongoing costs (in dollars) of investing in the Fund and to compare these costs with ongoing costs of investing in other mutual funds. The example is based on an investment of $1,000 invested at the beginning of the period and held for the entire period March 1, 2014 through August 31, 2014.
Actual expenses
The table below provides information about actual account values and actual expenses. You may use the information in this table, together with the amount you invested, to estimate the expenses that you paid over the period. Simply divide your account value by $1,000 (for example, an $8,600 account value divided by $1,000 = 8.6), then multiply the result by the number in the table under the heading entitled “Actual Expenses Paid During Period” to estimate the expenses you paid on your account during this period.
Hypothetical example for comparison purposes
The table below also provides information about hypothetical account values and hypothetical expenses based on the Fund’s actual expense ratio and an assumed rate of return of 5% per year before expenses, which is not the Fund’s actual return.
The hypothetical account values and expenses may not be used to estimate the actual ending account balance or expenses you paid for the period. You may use this information to compare the ongoing costs of investing in the Fund and other funds. To do so, compare this 5% hypothetical example with the 5% hypothetical examples that appear in the shareholder reports of the other funds.
Please note that the expenses shown in the table are meant to highlight your ongoing costs only and do not reflect any transaction costs, such as sales charges (loads) on purchase payments or contingent deferred sales charges on redemptions, if any. Therefore, the hypothetical information is useful in comparing ongoing costs only, and will not help you determine the relative total costs of owning different funds. In addition, if these transaction costs were included, your costs would have been higher.
| Class | Beginning Account Value (03/01/14) | ACTUAL | HYPOTHETICAL (5% annual return before expenses) | Annualized Expense Ratio | ||||||||||||||||||||
| Ending Account Value (08/31/14)1 | Expenses Paid During | Ending Account Value | Expenses Paid During | |||||||||||||||||||||
| A | $ | 1,000.00 | $ | 1,086.70 | $ | 6.73 | $ | 1,018.75 | $ | 6.51 | 1.28 | % | ||||||||||||
| B | 1,000.00 | 1,082.70 | 10.66 | 1,014.97 | 10.31 | 2.03 | ||||||||||||||||||
| C | 1,000.00 | 1,082.70 | 10.66 | 1,014.97 | 10.31 | 2.03 | ||||||||||||||||||
| Y | 1,000.00 | 1,088.30 | 5.42 | 1,020.01 | 5.24 | 1.03 | ||||||||||||||||||
| R5 | 1,000.00 | 1,088.50 | 5.05 | 1,020.37 | 4.89 | 0.96 | ||||||||||||||||||
| R6 | 1,000.00 | 1,088.90 | 4.63 | 1,020.77 | 4.48 | 0.88 | ||||||||||||||||||
| 1 | The actual ending account value is based on the actual total return of the Fund for the period March 1, 2014 through August 31, 2014, after actual expenses and will differ from the hypothetical ending account value which is based on the Fund’s expense ratio and a hypothetical annual return of 5% before expenses. |
| 2 | Expenses are equal to the Fund’s annualized expense ratio as indicated above multiplied by the average account value over the period, multiplied by 184/365 to reflect the most recent fiscal half year. |
25 Invesco Global Real Estate Income Fund
Approval of Investment Advisory and Sub-Advisory Contracts
The Board of Trustees (the Board) of AIM Counselor Series Trust (Invesco Counselor Series Trust) is required under the Investment Company Act of 1940, as amended, to approve annually the renewal of Invesco Global Real Estate Income Fund’s (the Fund) investment advisory agreements. During contract renewal meetings held on June 16-17, 2014, the Board as a whole, and the disinterested or “independent” Trustees, who comprise over 75% of the Board, voting separately, approved the continuance for the Fund of the Master Investment Advisory Agreement with Invesco Advisers, Inc. (Invesco Advisers) and the Master Intergroup Sub-Advisory Contract for Mutual Funds with Invesco Asset Management Deutschland GmbH, Invesco Asset Management Limited, Invesco Asset Management (Japan) Limited, Invesco Australia Limited, Invesco Hong Kong Limited, Invesco Senior Secured Management, Inc. and Invesco Canada Ltd. (collectively, the Affiliated Sub-Advisers and the sub-advisory contracts) for another year, effective July 1, 2014.
In evaluating the fairness and reasonableness of compensation under the Fund’s investment advisory agreement and sub-advisory contracts, the Board considered, among other things, the factors discussed below. The Board determined that continuation of the Fund’s investment advisory agreement and the sub-advisory contracts are in the best interest of the Fund and its shareholders and that the compensation payable to Invesco Advisers and the Affiliated Sub-Advisers under the agreements is fair and reasonable.
The Board’s Fund Evaluation Process
The Board’s Investments Committee has established three Sub-Committees, each of which is primarily responsible for overseeing the management of a number of the funds advised by Invesco Advisers (the Invesco Funds). The Sub-Committees meet throughout the year to review the performance of their assigned Invesco Funds, including reviewing materials prepared under the direction of the independent Senior Officer, an officer of the Invesco Funds who reports directly to the independent Trustees. Over the course of each year, the Sub-Committees meet with portfolio managers for their assigned Invesco Funds and other members of management to review the performance, investment objective(s), policies, strategies, limitations and investment risks of these funds. The Sub-Committees meet regularly and at designated contract renewal meetings each year to conduct a review of the performance, fees, expenses and other matters related to their assigned Invesco Funds. Each Sub-Committee recommends to the Investments Committee, which in turn recommends to the full Board, whether and on what terms to approve the continuance of each Invesco Fund’s
investment advisory agreement and sub-advisory contracts for another year.
During the contract renewal process, the Trustees receive comparative performance and fee data regarding the Invesco Funds prepared by Invesco Advisers and Lipper Inc. (Lipper), an independent provider of investment company data. The Trustees also receive an independent written evaluation from the Senior Officer. The Senior Officer’s evaluation is prepared as part of his responsibility to manage the process by which the Invesco Funds’ proposed management fees are negotiated during the annual contract renewal process to ensure they are negotiated in a manner that is at arms’ length and reasonable. In addition to meetings with Invesco Advisers and fund counsel, the independent Trustees also discuss the continuance of the investment advisory agreement and sub-advisory contracts in separate sessions with the Senior Officer and with independent legal counsel.
The Trustees recognized that the advisory fee rates for the Invesco Funds are, in many cases, the result of years of review and negotiation. The Trustees’ deliberations and conclusions in a particular year may be based in part on their deliberations and conclusions regarding these arrangements throughout the year and in prior years. The Trustees’ review and conclusions are based on the comprehensive consideration of all information presented to them and are not the result of any single determinative factor. Moreover, one Trustee may have weighed a particular piece of information or factor differently than another Trustee.
The discussion below serves as the Senior Officer’s independent written evaluation with respect to the Fund’s investment advisory agreement as well as a discussion of the material factors and related conclusions that formed the basis for the Board’s approval of the Fund’s investment advisory agreement and sub-advisory contracts. Unless otherwise stated, this information is current as of June 17, 2014, and may not reflect consideration of factors that became known to the Board after that date.
Factors and Conclusions and Summary of Independent Written Fee Evaluation
| A. | Nature, Extent and Quality of Services Provided by Invesco Advisers and the Affiliated Sub-Advisers |
The Board reviewed the advisory services provided to the Fund by Invesco Advisers under the Fund’s investment advisory agreement, the performance of Invesco Advisers in providing these services, and the credentials and experience of the officers and employees of Invesco Advisers who provide these services, including the Fund’s portfolio manager or managers, with whom the Sub-Committees met during the year. The Board’s review of the
qualifications of Invesco Advisers to provide advisory services included the Board’s consideration of Invesco Advisers’ investment process oversight, independent credit analysis and investment risk management. The Board also considered non-advisory services that Invesco Advisers and its affiliates provide to the Invesco Funds such as various back office support functions, equity and fixed income trading operations, internal audit, distribution and legal and compliance.
In determining whether to continue the Fund’s investment advisory agreement, the Board considered the benefits of reapproving an existing relationship and the greater uncertainty that may be associated with entering into a new relationship. The Board concluded that the nature, extent and quality of the services provided to the Fund by Invesco Advisers are appropriate and satisfactory and consistent with the terms of the Fund’s investment advisory agreement.
The Board reviewed the services that may be provided by the Affiliated Sub-Advisers under the sub-advisory contracts and the credentials and experience of the officers and employees of the Affiliated Sub-Advisers who provide these services. The Board noted that the Affiliated Sub-Advisers have offices and personnel that are located in financial centers around the world. As a result, the Affiliated Sub-Advisers can provide research and investment analysis on the markets and economies of various countries in which the Fund may invest, make recommendations regarding securities and assist with security trades. The Board concluded that the sub-advisory contracts benefit the Fund and its shareholders by permitting Invesco Advisers to use the resources and talents of the Affiliated Sub-Advisers in managing the Fund. The Board concluded that the nature, extent and quality of the services that may be provided by the Affiliated Sub-Advisers are appropriate and satisfactory and consistent with the terms of the Fund’s sub-advisory contracts.
| B. | Fund Performance |
The Board considered Fund performance as a relevant factor in considering whether to approve the investment advisory agreement as well as the sub-advisory contracts for the Fund, as Invesco Asset Management Limited currently manages assets of the Fund.
The Board compared the Fund’s performance during the past one, three and five calendar years to the performance of funds in the Lipper performance universe and against the Lipper Global Real Estate Funds Index. The Board noted that performance of Class A shares of the Fund was in the fifth quintile of the Lipper performance universe for the one year period and the third quintile for the three and five year periods (the first quintile being the best performing funds and the fifth quintile being the worst performing funds). The Board noted that
26 Invesco Global Real Estate Income Fund
performance of Class A shares of the Fund was below the performance of the Index for the one, three and five year periods. The Trustees also reviewed more recent Fund performance and this review did not change their conclusions.
| C. | Advisory and Sub-Advisory Fees |
The Board compared the Fund’s contractual management fee rate to the contractual management fee rates of funds in the Fund’s Lipper expense group at a common asset level. The Board noted that the contractual management fee rate for Class A shares of the Fund was below the median contractual management fee rate of funds in the expense group. The Board noted that the term “contractual management fee” may include both advisory and certain administrative services fees, but that Lipper does not provide information on a fund by fund basis as to what is included. The Board noted that Invesco Advisers does not charge the Invesco Funds for the administrative services included in the term as defined by Lipper. The Board also reviewed the methodology used by Lipper in providing expense group information, which includes using each fund’s contractual management fee schedule (including any applicable breakpoints) as reported in the most recent prospectus or statement of additional information for each fund in the expense group.
The Board noted that Invesco Advisers has contractually agreed to waive fees and/or limit expenses of the Fund through at least June 30, 2015 in an amount necessary to limit total annual operating expenses to a specified percentage of average daily net assets for each class of the Fund.
The Board noted that Invesco Advisers and the Affiliated Sub-Advisers do not manage other mutual funds or client accounts using an investment process substantially similar to the investment process used for the Fund.
The Board also considered the services that may be provided by the Affiliated Sub-Advisers pursuant to the sub-advisory contracts, as well as the fees payable by Invesco Advisers to the Affiliated Sub-Advisers pursuant to the sub-advisory contracts. The Board also noted that the sub-advisory fees are not paid directly by the Fund, but rather, are payable by Invesco Advisers to the Affiliated Sub-Advisers.
| D. | Economies of Scale and Breakpoints |
The Board considered the extent to which there are economies of scale in the provision of advisory services to the Fund. The Board also considered whether the Fund benefits from economies of scale through contractual breakpoints in the Fund’s advisory fee schedule and was assisted in this review by a report from the Senior Officer. The Board also noted that the Fund shares directly in economies of scale through lower fees charged by third party service providers based on the combined size of the Invesco Funds and other clients advised by Invesco Advisers.
| E. | Profitability and Financial Resources |
The Board reviewed information from Invesco Advisers concerning the costs of the advisory
and other services that Invesco Advisers and its affiliates provide to the Fund and the profitability of Invesco Advisers and its affiliates in providing these services for the year ended December 31, 2013. The Board received information from Invesco Advisers about the methodology used to prepare the profitability information. The Board considered the profitability of Invesco Advisers in managing the Fund and the Invesco Funds. The Board noted that Invesco Advisers continues to operate at a net profit from services Invesco Advisers and its subsidiaries provide to the Invesco Funds and the Fund. The Board did not deem the level of profits realized by Invesco Advisers and its affiliates from providing services to the Fund to be excessive given the nature, quality and extent of the services provided to the Invesco Funds. The Board received and accepted information from Invesco Advisers demonstrating that Invesco Advisers and each Affiliated Sub-Adviser are financially sound and have the resources necessary to perform their obligations under the investment advisory agreement and sub-advisory contracts.
| F. | Collateral Benefits to Invesco Advisers and its Affiliates |
The Board considered various other benefits received by Invesco Advisers and its affiliates from the relationship with the Fund, including the fees received for their provision of transfer agency and distribution services to the Fund. The Board considered comparative information regarding fees charged for these services, including information provided by Lipper and other independent sources. The Board considered the performance of Invesco Advisers and its affiliates in providing these services and the organizational structure employed to provide these services. The Board also considered that these services are provided to the Fund pursuant to written contracts that are reviewed and approved on an annual basis by the Board; that the services are required for the operation of the Fund; that Invesco Advisers and its affiliates can provide services, the nature and quality of which are at least equal to those provided by others offering the same or similar services; and that the fees for such services are fair and reasonable in light of the usual and customary charges by others for services of the same nature and quality.
The Board considered the benefits realized by Invesco Advisers and the Affiliated Sub-Advisers as a result of portfolio brokerage transactions executed through “soft dollar” arrangements. The Board noted that soft dollar arrangements shift the payment obligation for research services from Invesco Advisers and the Affiliated Sub-Advisers to the Invesco Funds and that the research received may be used with other clients of Invesco Advisers and may reduce Invesco Advisers’ and the Affiliated Sub-Advisers’ expenses. The Board also considered that it receives periodic reports from the Chief Compliance Officer of the Invesco Funds demonstrating that these arrangements are consistent with regulatory requirements.
The Board did not deem the soft dollar arrangements to be inappropriate.
The Board considered that the Fund’s uninvested cash and cash collateral from any securities lending arrangements may be invested in money market funds advised by Invesco Advisers pursuant to procedures approved by the Board. The Board noted that Invesco Advisers receives advisory fees from these affiliated money market funds attributable to such investments, although Invesco Advisers has contractually agreed to waive through varying periods the advisory fees payable by the Invesco Funds with respect to investments in the affiliated money market funds. The waiver is in an amount equal to 100% of the net advisory fee Invesco Advisers receives from the affiliated money market funds with respect to the Fund’s investment in the affiliated money market funds of uninvested cash, but not cash collateral. The Board concluded that the amount of advisory fees received by Invesco Advisors from the Fund’s investment of uninvested cash and cash collateral from any securities lending arrangements in the affiliated money market funds are fair and reasonable.
The Board also considered the Fund may use an affiliated broker to execute certain trades for the Fund to among other things, control information leakage, and were advised that such trades would be executed in compliance with rules under the Investment Company Act of 1940, as amended.
27 Invesco Global Real Estate Income Fund
Tax Information
Form 1099-DIV, Form 1042-S and other year–end tax information provide shareholders with actual calendar year amounts that should be included in their tax returns. Shareholders should consult their tax advisors.
The following distribution information is being provided as required by the Internal Revenue Code or to meet a specific state’s requirement.
The Fund designates the following amounts or, if subsequently determined to be different, the maximum amount allowable for its fiscal year ended August 31, 2014:
Federal and State Income Tax | ||||
Long-Term Capital Gain Distributions | $ | 12,494,997 | ||
Qualified Dividend Income* | 0.00 | % | ||
Corporate Dividends Received Deduction* | 0.00 | % | ||
U.S. Treasury Obligations* | 0.00 | % | ||
| * | The above percentages are based on ordinary income dividends paid to shareholders during the Fund’s fiscal year. |
Distribution Notice
Form 1099-DIV for 2014 will report distributions for federal income tax purposes. The Fund’s annual report to shareholders will include information regarding the tax character of Fund distributions for the fiscal year. This Notice is sent to comply with certain Securities and Exchange Commission requirements.
Shareholders were sent a notice from the Fund that set forth an estimate on a per share basis of the source or sources from which the distribution was paid in September 2014. Subsequently, certain of these estimates have been corrected. Listed below is a written statement of the sources of this distribution, as corrected, on a generally accepted accounting principles (“GAAP”) basis and as noted above are not being provided for tax reporting purposes.
During the month of September 2014, the Fund declared a quarterly distribution, which was payable to shareholders on September 18, 2014. This distribution, determined in accordance with generally accepted accounting principles, is estimated to be from the following sources: (1) $0.0343 (Class A), $0.0163 (Class B), $0.0163 (Class C), $0.0413 (Class R5), $0.0433 (Class R6), and $0.0398 (Class Y) per share from net investment income, and (3) $0.0917 (Class A), $0.0917 (Class B), $0.0917 (Class C), $0.0917 (Class R5), $0.0917 (Class R6), and $0.0917 (Class Y) per share from return of principal.
28 Invesco Global Real Estate Income Fund
Trustees and Officers
The address of each trustee and officer is AIM Counselor Series Trust (Invesco Counselor Series Trust) (the “Trust”), 11 Greenway Plaza, Suite 1000, Houston, Texas 77046-1173. The trustees serve for the life of the Trust, subject to their earlier death, incapacitation, resignation, retirement or removal as more specifically provided in the Trust’s organizational documents. Each officer serves for a one year term or until their successors are elected and qualified. Column two below includes length of time served with predecessor entities, if any.
Name, Year of Birth and Position(s) Held with the Trust | Trustee and/ or Officer Since | Principal Occupation(s) During Past 5 Years | Number of Funds in Fund Complex Overseen by Trustee | Other Directorship(s) Held by Trustee During Past 5 Years | ||||
| Interested Persons | ||||||||
Martin L. Flanagan1 — 1960 Trustee | 2007 | Executive Director, Chief Executive Officer and President, Invesco Ltd. (ultimate parent of Invesco and a global investment management firm); Advisor to the Board, Invesco Advisers, Inc. (formerly known as Invesco Institutional (N.A.), Inc.); Trustee, The Invesco Funds; Vice Chair, Investment Company Institute; and Member of Executive Board, SMU Cox School of Business.
Formerly: Chairman and Chief Executive Officer, Invesco Advisers, Inc. (registered investment adviser); Director, Chairman, Chief Executive Officer and President, IVZ Inc. (holding company), INVESCO Group Services, Inc. (service provider) and Invesco North American Holdings, Inc. (holding company); Director, Chief Executive Officer and President, Invesco Holding Company Limited (parent of Invesco and a global investment management firm); Director, Invesco Ltd.; Chairman, Investment Company Institute and President, Co-Chief Executive Officer, Co-President, Chief Operating Officer and Chief Financial Officer, Franklin Resources, Inc. (global investment management organization). | 141 | None | ||||
Philip A. Taylor2 — 1954 Trustee, President and Principal Executive Officer | 2006 | Head of North American Retail and Senior Managing Director, Invesco Ltd.; Director, Co-Chairman, Co-President and Co-Chief Executive Officer, Invesco Advisers, Inc. (formerly known as Invesco Institutional (N.A.), Inc.) (registered investment adviser); Director, Chairman, Chief Executive Officer and President, Invesco Management Group, Inc. (formerly known as Invesco Aim Management Group, Inc.) (financial services holding company); Director and President, INVESCO Funds Group, Inc. (registered investment adviser and registered transfer agent); Director and Chairman, Invesco Investment Services, Inc. (formerly known as Invesco Aim Investment Services, Inc.) (registered transfer agent) and IVZ Distributors, Inc. (formerly known as INVESCO Distributors, Inc.) (registered broker dealer); Director, President and Chairman, Invesco Inc. (holding company) and Invesco Canada Holdings Inc. (holding company); Chief Executive Officer, Invesco Corporate Class Inc. (corporate mutual fund company) and Invesco Canada Fund Inc. (corporate mutual fund company); Director, Chairman and Chief Executive Officer, Invesco Canada Ltd. (formerly known as Invesco Trimark Ltd./Invesco Trimark Ltèe) (registered investment adviser and registered transfer agent); Trustee, President and Principal Executive Officer, The Invesco Funds (other than AIM Treasurer’s Series Trust (Invesco Treasurer’s Series Trust) and Short-Term Investments Trust); Trustee and Executive Vice President, The Invesco Funds (AIM Treasurer’s Series Trust (Invesco Treasurer’s Series Trust) and Short-Term Investments Trust only); Director, Invesco Investment Advisers LLC (formerly known as Van Kampen Asset Management); Director, Chief Executive Officer and President, Van Kampen Exchange Corp.
Formerly: Director and Chairman, Van Kampen Investor Services Inc.; Director, Chief Executive Officer and President, 1371 Preferred Inc. (holding company) and Van Kampen Investments Inc.; Director and President, AIM GP Canada Inc. (general partner for limited partnerships) and Van Kampen Advisors, Inc.; Director and Chief Executive Officer, Invesco Trimark Dealer Inc. (registered broker dealer); Director, Invesco Distributors, Inc. (formerly known as Invesco Aim Distributors, Inc.) (registered broker dealer); Manager, Invesco PowerShares Capital Management LLC; Director, Chief Executive Officer and President, Invesco Advisers, Inc.; Director, Chairman, Chief Executive Officer and President, Invesco Aim Capital Management, Inc.; President, Invesco Trimark Dealer Inc. and Invesco Trimark Ltd./Invesco Trimark Ltèe; Director and President, AIM Trimark Corporate Class Inc. and AIM Trimark Canada Fund Inc.; Senior Managing Director, Invesco Holding Company Limited; Director and Chairman, Fund Management Company (former registered broker dealer); President and Principal Executive Officer, The Invesco Funds (AIM Treasurer’s Series Trust (Invesco Treasurer’s Series Trust), and Short-Term Investments Trust only); President, AIM Trimark Global Fund Inc. and AIM Trimark Canada Fund Inc. | 141 | None | ||||
Wayne W. Whalen3 — 1939 Trustee | 2010 | Of Counsel, and prior to 2010, partner in the law firm of Skadden, Arps, Slate, Meagher & Flom LLP, legal counsel to certain funds in the Fund Complex
| 141 | Director of the Mutual fund Directors Forum, a nonprofit membership organization for investment directors; Chairman and Director of the Abraham Lincoln Presidential Library Foundation; and Director of the Stevenson Center for Democracy |
| 1 | Mr. Flanagan is considered an interested person (within the meaning of Section 2(a)(19) of the 1940 Act) of the Trust because he is an officer of the Adviser to the Trust, and an officer and a director of Invesco Ltd., ultimate parent of the Adviser. |
| 2 | Mr. Taylor is considered an interested person (within the meaning of Section 2(a)(19) of the 1940 Act) of the Trust because he is an officer and a director of the Adviser. |
| 3 | Mr. Whalen is retiring effective December 31, 2014. He has been deemed to be an interested person of the Trust because of his prior service as counsel to the predecessor funds of certain Invesco open-end funds and his affiliation with the law firm that served as counsel to such predecessor funds and the Invesco closed-end funds. |
T-1 Invesco Global Real Estate Income Fund
Trustees and Officers—(continued)
Name, Year of Birth and Position(s) Held with the Trust | Trustee and/ or Officer Since | Principal Occupation(s) During Past 5 Years | Number of Funds in Fund Complex Overseen by Trustee | Other Directorship(s) Past 5 Years | ||||
| Independent Trustees | ||||||||
Bruce L. Crockett — 1944 Trustee and Chair | 2003 | Chairman, Crockett Technologies Associates (technology consulting company)
Formerly: Director, Captaris (unified messaging provider); Director, President and Chief Executive Officer, COMSAT Corporation; Chairman, Board of Governors of INTELSAT (international communications company); ACE Limited (insurance company); and Investment Company Institute | 141 | ALPS (Attorneys Liability Protection Society) (insurance company) | ||||
David C. Arch — 1945 Trustee | 2010 | Chairman of Blistex Inc., a consumer health care products manufacturer | 141 | Board member of the Illinois Manufacturers’ Association; Member of the Board of Visitors, Institute for the Humanities, University of Michigan; Member of the Audit Committee of the Edward-Elmhurst Hospital | ||||
Frank S. Bayley — 1939 Trustee | 2003 | Retired. Formerly: Director, Badgley Funds Inc. (registered investment company) (2 portfolios) and General Partner and Of Counsel, law firm of Baker & McKenzie, LLP | 141 | Director and Chairman, C.D. Stimson Company (a real estate investment company); Trustee, The Curtis Institute of Music | ||||
James T. Bunch — 1942 Trustee | 2000 | Managing Member, Grumman Hill Group LLC (family office private equity investments)
Formerly: Founder, Green Manning & Bunch Ltd. (investment banking firm) (1988-2010); Executive Committee, United States Golf Association; and Director, Policy Studies, Inc. and Van Gilder Insurance Corporation | 141 | Chairman, Board of Governors, Western Golf Association; Chairman, Evans Scholars Foundation; and Director, Denver Film Society | ||||
Rodney F. Dammeyer — 1940 Trustee | 2010 | Chairman of CAC, LLC, (private company offering capital investment and management advisory services)
Formerly: Prior to 2001, Managing Partner at Equity Group Corporate Investments; Prior to 1995, Chief Executive Officer of Itel Corporation (formerly Anixter International); Prior to 1985, experience includes Senior Vice President and Chief Financial Officer of Household International, Inc., Executive Vice President and Chief Financial Officer of Northwest Industries, Inc. and Partner of Arthur Andersen & Co.; From 1987 to 2010, Director/Trustee of investment companies in the Van Kampen Funds complex | 141 | Director of Quidel Corporation and Stericycle, Inc. | ||||
Albert R. Dowden — 1941 Trustee | 2003 | Director of a number of public and private business corporations, including the Boss Group, Ltd. (private investment and management); Nature’s Sunshine Products, Inc. and Reich & Tang Funds (5 portfolios) (registered investment company)
Formerly: Director, Homeowners of America Holding Corporation/Homeowners of America Insurance Company (property casualty company); Director, Continental Energy Services, LLC (oil and gas pipeline service); Director, CompuDyne Corporation (provider of product and services to the public security market) and Director, Annuity and Life Re (Holdings), Ltd. (reinsurance company); Director, President and Chief Executive Officer, Volvo Group North America, Inc.; Senior Vice President, AB Volvo; Director of various public and private corporations; Chairman, DHJ Media, Inc.; Director, Magellan Insurance Company; and Director, The Hertz Corporation, Genmar Corporation (boat manufacturer), National Media Corporation; Advisory Board of Rotary Power International (designer, manufacturer, and seller of rotary power engines); and Chairman, Cortland Trust, Inc. (registered investment company) | 141 | Director of: Nature’s Sunshine Products, Inc., Reich & Tang Funds, Homeowners of America Holding Corporation/ Homeowners of America Insurance Company, the Boss Group | ||||
Jack M. Fields — 1952 Trustee | 2003 | Chief Executive Officer, Twenty First Century Group, Inc. (government affairs company); Owner and Chief Executive Officer, Dos Angeles Ranch, L.P. (cattle, hunting, corporate entertainment); and Discovery Global Education Fund (non-profit)
Formerly: Chief Executive Officer, Texana Timber LP (sustainable forestry company); Director of Cross Timbers Quail Research Ranch (non-profit); and member of the U.S. House of Representatives | 141 | Insperity, Inc. (formerly known as Administaff) | ||||
Prema Mathai-Davis — 1950 Trustee | 2003 | Retired. Formerly: Chief Executive Officer, YWCA of the U.S.A. | 141 | None | ||||
Larry Soll — 1942 Trustee | 1997 | Retired. Formerly: Chairman, Chief Executive Officer and President, Synergen Corp. (a biotechnology company) | 141 | None | ||||
Hugo F. Sonnenschein — 1940 Trustee | 2010 | President Emeritus and Honorary Trustee of the University of Chicago and the Adam Smith Distinguished Service Professor in the Department of Economics at the University of Chicago. Prior to 2000, President of the University of Chicago | 141 | Trustee of the University of Rochester and a member of its investment committee; Member of the National Academy of Sciences and the American Philosophical Society; Fellow of the American Academy of Arts and Sciences |
T-2 Invesco Global Real Estate Income Fund
Trustees and Officers—(continued)
Name, Year of Birth and Position(s) Held with the Trust | Trustee and/ or Officer Since | Principal Occupation(s) During Past 5 Years | Number of Funds in Fund Complex Overseen by Trustee | Other Directorship(s) Past 5 Years | ||||
| Independent Trustees—(continued) | ||||||||
Raymond Stickel, Jr. — 1944 Trustee | 2005 | Retired. Formerly: Director, Mainstay VP Series Funds, Inc. (25 portfolios) and Partner, Deloitte & Touche | 141 | None | ||||
Suzanne H. Woolsey — 1941 Trustee | 2014 | Chief Executive Officer of Woolsey Partners LLC | 141 | Emeritus Chair of the Board of Trustees of the Institute for Defense Analyses; Trustee of Colorado College; Trustee of California Institute of Technology; Prior to 2014, Director of Fluor Corp.; Prior to 2010, Trustee of the German Marshall Fund of the United States; Prior to 2010 Trustee of the Rocky Mountain Institute | ||||
| Other Officers | ||||||||
Russell C. Burk — 1958 Senior Vice President and Senior Officer | 2005 | Senior Vice President and Senior Officer, The Invesco Funds | N/A | N/A | ||||
John M. Zerr — 1962 Senior Vice President, Chief Legal Officer and Secretary | 2006 | Director, Senior Vice President, Secretary and General Counsel, Invesco Management Group, Inc. (formerly known as Invesco Aim Management Group, Inc.) and Van Kampen Exchange Corp.; Senior Vice President, Invesco Advisers, Inc. (formerly known as Invesco Institutional (N.A.), Inc.) (registered investment adviser); Senior Vice President and Secretary, Invesco Distributors, Inc. (formerly known as Invesco Aim Distributors, Inc.); Director, Vice President and Secretary, Invesco Investment Services, Inc. (formerly known as Invesco Aim Investment Services, Inc.) and IVZ Distributors, Inc. (formerly known as INVESCO Distributors, Inc.); Director and Vice President, INVESCO Funds Group, Inc.; Senior Vice President, Chief Legal Officer and Secretary, The Invesco Funds; Manager, Invesco PowerShares Capital Management LLC; Director, Secretary and General Counsel, Invesco Investment Advisers LLC (formerly known as Van Kampen Asset Management); Secretary and General Counsel, Invesco Capital Markets, Inc. (formerly known as Van Kampen Funds Inc.) and Chief Legal Officer, PowerShares Exchange-Traded Fund Trust, PowerShares Exchange-Traded Fund Trust II, PowerShares India Exchange-Traded Fund Trust and PowerShares Actively Managed Exchange-Traded Fund Trust
Formerly: Director and Vice President, Van Kampen Advisors Inc.; Director, Vice President, Secretary and General Counsel, Van Kampen Investor Services Inc.; Director, Invesco Distributors, Inc. (formerly known as Invesco Aim Distributors, Inc.); Director, Senior Vice President, General Counsel and Secretary, Invesco Aim Advisers, Inc. and Van Kampen Investments Inc.; Director, Vice President and Secretary, Fund Management Company; Director, Senior Vice President, Secretary, General Counsel and Vice President, Invesco Aim Capital Management, Inc.; Chief Operating Officer and General Counsel, Liberty Ridge Capital, Inc. (an investment adviser); Vice President and Secretary, PBHG Funds (an investment company) and PBHG Insurance Series Fund (an investment company); Chief Operating Officer, General Counsel and Secretary, Old Mutual Investment Partners (a broker-dealer); General Counsel and Secretary, Old Mutual Fund Services (an administrator) and Old Mutual Shareholder Services (a shareholder servicing center); Executive Vice President, General Counsel and Secretary, Old Mutual Capital, Inc. (an investment adviser); and Vice President and Secretary, Old Mutual Advisors Funds (an investment company) | N/A | N/A | ||||
Sheri Morris — 1964 Vice President, Treasurer and Principal Financial Officer | 2003 | Vice President, Treasurer and Principal Financial Officer, The Invesco Funds; Vice President, Invesco Advisers, Inc. (formerly known as Invesco Institutional (N.A.), Inc.) (registered investment adviser); and Vice President, PowerShares Exchange-Traded Fund Trust, PowerShares Exchange-Traded Fund Trust II, PowerShares India Exchange-Traded Fund Trust and PowerShares Actively Managed Exchange-Traded Fund Trust
Formerly: Vice President, Invesco Aim Advisers, Inc., Invesco Aim Capital Management, Inc. and Invesco Aim Private Asset Management, Inc.; Assistant Vice President and Assistant Treasurer, The Invesco Funds and Assistant Vice President, Invesco Advisers, Inc., Invesco Aim Capital Management, Inc. and Invesco Aim Private Asset Management, Inc.; and Treasurer, PowerShares Exchange-Traded Fund Trust, PowerShares Exchange-Traded Fund Trust II, PowerShares India Exchange-Traded Fund Trust and PowerShares Actively Managed Exchange-Traded Fund Trust | N/A | N/A | ||||
T-3 Invesco Global Real Estate Income Fund
Trustees and Officers—(continued)
Name, Year of Birth and Position(s) Held with the Trust | Trustee and/ or Officer Since | Principal Occupation(s) During Past 5 Years | Number of Funds in Fund Complex Overseen by Trustee | Other Directorship(s) Past 5 Years | ||||
| Other Officers—(continued) | ||||||||
Karen Dunn Kelley — 1960 Vice President | 2003 | Senior Managing Director, Investments; Director, Co-President, Co-Chief Executive Officer, and Co-Chairman, Invesco Advisers, Inc. (formerly known as Invesco Institutional (N.A.), Inc.) (registered investment adviser); Chairman, Invesco Senior Secured Management, Inc.; Senior Vice President, Invesco Management Group, Inc. (formerly known as Invesco Aim Management Group, Inc.); Executive Vice President, Invesco Distributors, Inc. (formerly known as Invesco Aim Distributors, Inc.); Director, Invesco Mortgage Capital Inc. and Invesco Management Company Limited; Director and President, INVESCO Asset Management (Bermuda) Ltd., Vice President, The Invesco Funds (other than AIM Treasurer’s Series Trust (Invesco Treasurer’s Series Trust) and Short-Term Investments Trust); and President and Principal Executive Officer, The Invesco Funds (AIM Treasurer’s Series Trust (Invesco Treasurer’s Series Trust) and Short-Term Investments Trust only)
Formerly: Director, INVESCO Global Asset Management Limited and INVESCO Management S.A.; Senior Vice President, Van Kampen Investments Inc. and Invesco Advisers, Inc. (formerly known as Invesco Institutional (N.A.), Inc.) (registered investment adviser); Vice President, Invesco Advisers, Inc. (formerly known as Invesco Institutional (N.A.), Inc.); Director of Cash Management and Senior Vice President, Invesco Advisers, Inc. and Invesco Aim Capital Management, Inc.; Director and President, Fund Management Company; Chief Cash Management Officer, Director of Cash Management, Senior Vice President, and Managing Director, Invesco Aim Capital Management, Inc.; Director of Cash Management, Senior Vice President, and Vice President, Invesco Advisers, Inc. and The Invesco Funds (AIM Treasurer’s Series Trust (Invesco Treasurer’s Series Trust), and Short-Term Investments Trust only) | N/A | N/A | ||||
Crissie M. Wisdom — 1969 Anti-Money Laundering Compliance Officer | 2013 | Anti-Money Laundering Compliance Officer, Invesco Advisers, Inc. (formerly known as Invesco Institutional (N.A.), Inc.) (registered investment adviser), Invesco Capital Markets, Inc. (formerly known as Van Kampen Funds Inc.), Invesco Distributors, Inc., Invesco Investment Services, Inc., Invesco Management Group, Inc., Van Kampen Exchange Corp., The Invesco Funds, and PowerShares Exchange-Traded Fund Trust, PowerShares Exchange-Traded Fund Trust II, PowerShares India Exchange-Traded Fund Trust, and PowerShares Actively Managed Exchange-Traded Fund Trust; and Fraud Prevention Manager and Controls and Risk Analysis Manager for Invesco Investment Services, Inc. | N/A | N/A | ||||
Todd L. Spillane — 1958 Chief Compliance Officer | 2006 | Senior Vice President, Invesco Management Group, Inc. (formerly known as Invesco Aim Management Group, Inc.) and Van Kampen Exchange Corp.; Senior Vice President and Chief Compliance Officer, Invesco Advisers, Inc. (registered investment adviser) (formerly known as Invesco Institutional (N.A.), Inc.); Chief Compliance Officer, The Invesco Funds; Vice President, Invesco Distributors, Inc. (formerly known as Invesco Aim Distributors, Inc.) and Invesco Investment Services, Inc. (formerly known as Invesco Aim Investment Services, Inc.)
Formerly: Chief Compliance Officer, Invesco Funds (Chicago); Senior Vice President, Van Kampen Investments Inc.; Senior Vice President and Chief Compliance Officer, Invesco Aim Advisers, Inc. and Invesco Aim Capital Management, Inc.; Chief Compliance Officer, INVESCO Private Capital Investments, Inc. (holding company), Invesco Private Capital, Inc. (registered investment adviser), Invesco Global Asset Management (N.A.), Inc., Invesco Senior Secured Management, Inc. (registered investment adviser), Van Kampen Investor Services Inc., PowerShares Exchange-Traded Fund Trust, PowerShares Exchange-Traded Fund Trust II, PowerShares India Exchange-Traded Fund Trust and PowerShares Actively Managed Exchange-Traded Fund Trust; and Vice President, Invesco Aim Capital Management, Inc. and Fund Management Company | N/A | N/A |
The Statement of Additional Information of the Trust includes additional information about the Fund’s Trustees and is available upon request, without charge, by calling 1.800.959.4246. Please refer to the Fund’s prospectus for information on the Fund’s sub-advisers.
Office of the Fund 11 Greenway Plaza, Suite 1000 Houston, TX 77046-1173 | Investment Adviser Invesco Advisers, Inc. 1555 Peachtree Street, N.E. Atlanta, GA 30309 | Distributor Invesco Distributors, Inc. 11 Greenway Plaza, Suite 1000 Houston, TX 77046-1173 | Auditors PricewaterhouseCoopers LLP 1201 Louisiana Street, Suite 2900 Houston, TX 77002-5678 | |||
Counsel to the Fund Stradley Ronon Stevens & Young, LLP 2005 Market Street, Suite 2600 Philadelphia, PA 19103-7018 | Counsel to the Independent Trustees Goodwin Procter LLP 901 New York Avenue, N.W. Washington, D.C. 20001 | Transfer Agent Invesco Investment Services, Inc. 11 Greenway Plaza, Suite 1000 Houston, TX 77046-1173 | Custodian State Street Bank and Trust Company 225 Franklin Street Boston, MA 02110-2801 | |||
T-4 Invesco Global Real Estate Income Fund

Invesco mailing information
Send general correspondence to Invesco Investment Services, Inc., P.O. Box 219078, Kansas City, MO 64121-9078.
Important notice regarding delivery of security holder documents
To reduce Fund expenses, only one copy of most shareholder documents may be mailed to shareholders with multiple accounts at the same address (Householding). Mailing of your shareholder documents may be householded indefinitely unless you instruct us otherwise. If you do not want the mailing of these documents to be combined with those for other members of your household, please contact Invesco Investment Services, Inc. at 800 959 4246 or contact your financial institution. We will begin sending you individual copies for each account within 30 days after receiving your request.
Fund holdings and proxy voting information
The Fund provides a complete list of its holdings four times in each fiscal year, at the quarter ends. For the second and fourth quarters, the lists appear in the Fund’s semiannual and annual reports to shareholders. For the first and third quarters, the Fund files the lists with the Securities and Exchange Commission (SEC) on Form N-Q. The most recent list of portfolio holdings is available at invesco.com/completeqtrholdings. Shareholders can also look up the Fund’s
Forms N-Q on the SEC website at sec.gov. Copies of the Fund’s Forms N-Q may be reviewed and copied at the SEC Public Reference Room in Washington, D.C. You can obtain information on the operation of the Public Reference Room, including information about duplicating fee charges, by calling 202 551 8090 or 800 732 0330, or by electronic request at the following email address: publicinfo@sec.gov. The SEC file numbers for the Fund are shown below.
A description of the policies and procedures that the Fund uses to determine how to vote proxies relating to portfolio securities is available without charge, upon request, from our Client Services department at 800 959 4246 or at invesco.com/proxyguidelines. The information is also available on the SEC website, sec.gov.
Information regarding how the Fund voted proxies related to its portfolio securities during the most recent 12-month period ended June 30 is available at invesco.com/proxysearch. The information is also available on the SEC website, sec.gov. Invesco Advisers, Inc. is an investment adviser; it provides investment advisory services to individual and institutional clients and does not sell securities. Invesco Distributors, Inc. is the US distributor for Invesco Ltd.’s retail mutual funds, exchange-traded funds and institutional money market funds. Both are wholly owned, indirect subsidiaries of Invesco Ltd. |  |
| SEC file numbers: 811-09913 and 333-36074 | GREI-AR-1 | Invesco Distributors, Inc. |

Letters to Shareholders
Philip Taylor | Dear Shareholders: This annual report includes information about your Fund, including performance data and a complete list of its investments as of the close of the reporting period. Inside, your Fund’s portfolio managers discuss how they managed your Fund and the factors that affected its performance during the reporting period. I hope you find this report of interest. During the reporting period covered by this report, the US economy showed signs of continued improvement. After contracting in the first quarter of 2014, the economy expanded strongly in the second quarter and unemployment trended lower. Much of the credit for this improvement goes to the US Federal Reserve (the Fed), which undertook an extraordinary asset purchase program following the global financial crisis. The Fed’s goal was to jumpstart the economy by encouraging banks to lend more, businesses to hire more and consumers to spend more. Signs of a stronger US economy prompted the Fed to reduce, or “taper,” its | |
| asset purchase program. Despite this, interest rates remained near historical low levels due largely to heavy investor demand for bonds. While signs of economic improvement were evident in the US, European economies remained relatively stagnant. During the reporting period, high unemployment persisted, worries about potential deflation grew, and uncertainty about Russian-Ukrainian tensions weighed on European markets. | ||

Extended periods of market strength can lull investors into complacency – just as prolonged periods of market weakness or volatility can discourage investors from initiating long-term investment plans. That’s why Invesco has always encouraged investors to work with a professional financial adviser who can stress the importance of starting to save and invest early and the importance of adhering to a disciplined investment plan – when times are good and when they’re uncertain. A financial adviser who knows your unique financial situation, investment goals and risk tolerance can be an invaluable partner as you seek to achieve your financial goals. He or she can offer a long-term perspective when markets are volatile and time-tested advice and guidance when your financial situation or investment goals change.
Timely information when and where you want it
Invesco’s efforts to help investors achieve their financial objectives include providing individual investors and financial professionals with timely information about the markets, the economy and investing – whenever and wherever they want it.
Our website, invesco.com/us, offers a wide range of market insights and investment perspectives. On the website, you’ll find detailed information about our funds, including prices, performance, holdings and portfolio manager commentaries. You can access information about your individual Invesco account whenever it’s convenient for you; just complete a simple, secure online registration. Use the “Login” box on our home page to get started.
Invesco’s mobile app for iPad® (available free from the App StoreSM) allows you to obtain the same detailed information about your Fund and the same investment insights from our investment leaders, market strategists, economists and retirement experts on the go. You also can watch portfolio manager videos and have instant access to Invesco news and updates wherever you may be.
In addition to the resources accessible on our website and through our mobile app, you can obtain timely updates to help you stay informed about the markets, the economy and investing by connecting with Invesco on Twitter, LinkedIn or Facebook. You can access our blog at blog.invesco.us.com or by clicking the “Intentional Investing Forum” link on our home page. Our goal is to provide you the information you want, when and where you want it.
Have questions?
For questions about your account, feel free to contact an Invesco client services representative at 800 959 4246. For Invesco-related questions or comments, please email me directly at phil@invesco.com.
All of us at Invesco look forward to serving your investment management needs for many years to come. Thank you for investing with us.
Sincerely,

Philip Taylor
Senior Managing Director, Invesco Ltd.
iPad is a trademark of Apple Inc., registered in the US and other countries. App Store is a service mark of Apple Inc. Invesco Distributors, Inc. is not affiliated with Apple Inc.
2 Invesco Growth and Income Fund
Bruce Crockett | Dear Fellow Shareholders: There are a variety of factors that can impact investment performance, many of which are uncontrollable by us as investors. These factors can include various economic trends and geopolitical developments. While the members of the Invesco Funds Board, which I chair, can’t dictate the performance of the Invesco funds, be assured that your Board works diligently throughout the year to focus on how your investments are managed. Our job is to represent you and your interests on a variety of fund management-related matters. We regularly monitor how the portfolio management teams of the Invesco funds are performing in light of ever-changing and often unpredictable economic and market conditions. We review the investment strategies and investment process employed by each fund’s management team as explained in the fund’s prospectus. Perhaps our most significant responsibility is conducting the annual review of the funds’ |

advisory and sub-advisory contracts with Invesco Advisers and its affiliates. This annual review, which is required by the Investment Company Act of 1940, focuses on the nature and quality of the services Invesco provides as the adviser to the Invesco funds and the reasonableness of the fees that it charges for those services. Each year, we spend months carefully reviewing information from Invesco that allows us to evaluate the quality of its services and the reasonableness of its fees. We also use information from a variety of independent sources, including materials provided by the independent senior officer of the Invesco funds, who reports directly to the independent trustees on the Board. Additionally, we meet with legal counsel and review performance and fee data prepared for us by Lipper Inc., an independent, third-party firm widely recognized as a leader in its field.
After a careful review, the members of the Invesco Funds Board approved the continuation of advisory and sub-advisory contracts with Invesco Advisers and its affiliates. Be assured that your Board will continue working on behalf of fund shareholders, keeping your needs and interests uppermost in our minds.
As always, please contact me at bruce@brucecrockett.com with any questions or concerns you may have. On behalf of the Board, we look forward to continuing to represent your interests and serving your needs.
Sincerely,

Bruce L. Crockett
Independent Chair
Invesco Funds Board of Trustees
3 Invesco Growth and Income Fund
Management’s Discussion of Fund Performance
Performance summary
For the fiscal year ended August 31, 2014, Invesco Growth and Income Fund underperformed the Russell 1000 Value Index, its style-specific benchmark. Stock selection negatively impacted overall performance.
Your Fund’s long-term performance appears later in this report.
Fund vs. Indexes
Total returns, 8/31/13 to 8/31/14, at net asset value (NAV). Performance shown does not include applicable contingent deferred sales charges (CDSC) or front-end sales charges, which would have reduced performance.
Class A Shares | 21.88 | % | ||
Class B Shares | 21.86 | |||
Class C Shares | 20.94 | |||
Class R Shares | 21.53 | |||
Class Y Shares | 22.17 | |||
Class R5 Shares | 22.27 | |||
Class R6 Shares | 22.38 | |||
S&P 500 Indexq (Broad Market Index) | 25.25 | |||
Russell 1000 Value Indexq (Style-Specific Index) | 24.43 | |||
Lipper Large-Cap Value Funds Indexn (Peer Group Index) | 22.98 |
Source(s): qFactSet Research Systems Inc.; nLipper Inc.
How we invest
We call our investment philosophy “value with a catalyst.” We believe undervalued companies that are experiencing positive changes (i.e., “catalysts”) have the potential to generate long-term stock price growth for shareholders. We generally seek to identify companies that are undervalued, earning below their potential and out of favor with investors. Then, from these companies, we attempt to identify catalysts that may improve the financial results and/or correct the undervaluation. Examples of catalysts typically include improved operational efficiency, changing industry dynamics and/or a change in management.
We initially identify potential investments through a series of quantitative screens, which look at valuation and rate of return metrics. We then conduct fundamental
research on the most attractive opportunities. The research process includes a thorough review of a company’s financial statements, an evaluation of its competitive position and stability, and meetings with its executives. During the research process, we also value the company under various scenarios to determine if the investment is an attractive opportunity relative to its risks. This is also where we typically identify the positive catalyst, a prerequisite for potential investment. Finally, we generally set a price target for a stock based on normalized earnings and historical valuation multiples.
In short, our objective is to exploit perceived market skepticism toward a company’s stock by analyzing the company’s operations in the context of a cyclical environment and identifying one or more catalysts that may improve the
company’s financial performance. Improved financial performance, in turn, has the potential to drive the company’s stock price higher.
We typically sell an investment when it reaches our estimate of fair value or when we identify a more attractive investment opportunity.
Market conditions and your Fund
US equity market indexes generally rose during the fiscal year ended August 31, 2014. Corporate earnings were resilient in the face of modest economic growth, driven by strong profitability across many sectors, and fundamentals for corporations and consumers remained relatively positive. However, the fiscal year began amid uncertainty created by a two-week federal government shutdown. Despite this and the announcement by the US Federal Reserve (the Fed) in December that it would begin reducing the scope of its asset purchase program in early 2014, US equities rallied through the end of 2013. The market turned volatile in the first months of 2014 as investors began to worry that stocks may have risen too far, too fast. While political upheaval in Ukraine and signs of economic sluggishness in the US and China contributed to investor uncertainty, economic data remained strong enough that the Fed continued to reduce its asset purchase program on schedule. The continued “good but not great” economic environment and historically low interest rates generally led stocks higher throughout the end of the fiscal year.
All sectors within the Russell 1000 Value index posted strong returns for the reporting period, with telecommunication services and consumer staples sectors posting returns in the teens, and all other sectors posting returns over 20%.
| Portfolio Composition | |||||
By sector
|
| ||||
Financials | 27.0 | % | |||
Information Technology | 14.9 | ||||
Health Care | 12.9 | ||||
Energy | 11.2 | ||||
Consumer Discretionary | 10.8 | ||||
Industrials | 8.6 | ||||
Consumer Staples | 5.5 | ||||
Telecommunication Services | 2.5 | ||||
Materials | 2.4 | ||||
Utilities | 1.8 | ||||
Money Market Funds | |||||
Plus Other Assets Less Liabilities | 2.4 | ||||
Top 10 Equity Holdings* | |||||
1. JPMorgan Chase & Co. | 4.1 | % | |||
2. Citigroup Inc. | 3.9 | ||||
3. General Electric Co. | 2.8 | ||||
4. Royal Dutch Shell PLC-Class A | 2.5 | ||||
5. Morgan Stanley | 2.4 | ||||
6. Applied Materials, Inc. | 2.0 | ||||
7. Adobe Systems Inc. | 1.7 | ||||
8. eBay Inc. | 1.7 | ||||
9. Viacom Inc.-Class B | 1.6 | ||||
10. PNC Financial Services Group, | 1.6 | ||||
Total Net Assets | $ | 9.6 billion | ||
Total Number of Holdings* | 87 | |||
The Fund’s holdings are subject to change, and there is no assurance that the Fund will continue to hold any particular security.
*Excluding money market fund holdings.
4 Invesco Growth and Income Fund
On the positive side, select Fund holdings in the energy sector were among the largest contributors to Fund performance for the reporting period. Baker Hughes, an oil and gas services company, and Canadian Natural Resources, an oil and gas producer, were among the top performing holdings within this sector. Canadian Natural Resources pleased investors as it increased dividends and surpassed earnings estimates during the latter part of the reporting period based on higher production and improvements in realized pricing in oil and gas. Also, having a material underweight position in Exxon Mobil versus the Fund’s style-specific benchmark contributed to relative performance, as the stock underperformed both the energy sector and the benchmark.
Strong stock selection and an underweight position in the utilities sector was also a large contributor to performance versus the Fund’s style-specific benchmark. Within this sector, Pepco Holdings was a strong contributor, as the stock rallied following an announcement that the company would be acquired for a premium. The stock posted returns of over 35% for the reporting period, outperforming the sector and style-specific benchmark. We sold our position in Pepco Holdings toward the end of the reporting period.
Stock selection within the telecommunication services sector also enhanced relative performance. Not owning AT&T was the main contributor within this sector, as the stock materially underperformed the Fund’s style-specific benchmark and the sector, only posting single-digit returns for the reporting period.
Stock selection in materials also helped relative performance. Dow Chemical was a large contributor, as investors cheered the company’s announcement in December that it would divest low margin assets to focus on higher margin businesses.
On the negative side, stock selection within the consumer staples sector hindered relative performance. Avon Products was the largest detractor within the sector due to lowered earnings guidance and missed earnings targets in late fall 2013 and again in May 2014.
Additionally, stock selection within the consumer discretionary sector, notably within the media and auto industries, hurt performance versus the Fund’s style-specific benchmark. Contributions from Time Warner Cable, which rallied after Comcast announced plans to acquire the
company, were offset by underperformance from Viacom after it missed earnings estimates late in the reporting period. General Motors stock sold off in early 2014 when the company announced a recall of ignition switches after a 10-year delay.
The Fund attempts to remain fully invested, while attempting to target cash below 5% under normal market environments. Even though we had average cash positions within our acceptable range during the reporting period, cash detracted from Fund performance in a strong equity market.
We used currency forward contracts during the reporting period for the purpose of hedging currency exposure of non-US-based companies held in the Fund. Derivatives were used primarily for the purpose of hedging and not for speculative purposes or leverage. The use of currency forward contracts had a negligible impact on performance relative to its style-specific benchmark.
Equity markets, although providing investors strong absolute returns, experienced continued volatility during the reporting period, based on the anticipation of the Fed slowing its asset purchases and rising interest rates that may result. We believe that market volatility creates opportunities to invest in companies with attractive valuations and strong fundamentals. We believe that ultimately those valuations and fundamentals will be reflected in those companies’ stock prices.
Thank you for your investment in Invesco Growth and Income Fund and for sharing our long-term investment horizon.
The views and opinions expressed in management’s discussion of Fund performance are those of Invesco Advisers, Inc. These views and opinions are subject to change at any time based on factors such as market and economic conditions. These views and opinions may not be relied upon as investment advice or recommendations, or as an offer for a particular security. The information is not a complete analysis of every aspect of any market, country, industry, security or the Fund. Statements of fact are from sources considered reliable, but Invesco Advisers, Inc. makes no representation or warranty as to their completeness or accuracy. Although historical performance is no guarantee of future results, these insights may help you understand our investment management philosophy.
See important Fund and, if applicable, index disclosures later in this report.
| Thomas Bastian Chartered Financial Analyst, Portfolio Manager, is lead manager of Invesco Growth and Income | |
| Fund. He joined Invesco in 2010. Mr. Bastian earned a BA in accounting from St. John’s University and an MBA in finance from University of Michigan. | ||

| Mary Jayne Maly Chartered Financial Analyst, Portfolio Manager, is manager of Invesco Growth and Income Fund. | |
| She joined Invesco in 2010. Ms. Maly earned a BA from the University of Pittsburgh and an MBA from the Thunderbird School of Global Management. | ||

| Sergio Marcheli Portfolio Manager, is manager of Invesco Growth and Income Fund. He joined Invesco in 2010. Mr. | |
| Marcheli earned a BBA from the University of Houston and an MBA from the University of St. Thomas. | ||

| James Roeder Chartered Financial Analyst, Portfolio Manager, is manager of Invesco Growth and Income | |
| Fund. He joined Invesco in 2010. Mr. Roeder earned a BS in accounting from Clemson University and an MBA in economics and finance from the University of Chicago Booth School of Business. | ||

5 Invesco Growth and Income Fund
Your Fund’s Long-Term Performance
Results of a $10,000 Investment — Oldest Share Class(es)
Fund and index data from 8/31/04
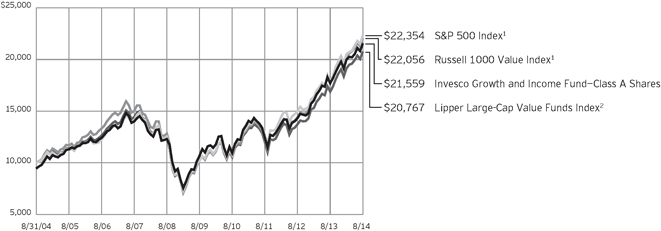
| 1 | Source: FactSet Research Systems Inc. |
| 2 | Source: Lipper Inc. |
Past performance cannot guarantee comparable future results.
The data shown in the chart include reinvested distributions, applicable sales charges and Fund expenses including
management fees. Index results include reinvested dividends, but they do not reflect sales charges. Performance of the peer group, if applicable, reflects fund expenses and management fees;
performance of a market index does not. Performance shown in the chart and table(s) does not reflect deduction of taxes a shareholder would pay on Fund distributions or sale of Fund shares.
continued from page 8
| n | Small- and mid-capitalization risks. Stocks of small- and mid-sized companies tend to be more vulnerable to adverse developments and may have little or no operating history or track record of success, and limited product lines, markets, management and financial resources. The securities of small- and mid-sized companies may be more volatile due to less market interest and less publicly available information about the issuer. They also may be illiquid or restricted as to resale, or may trade less frequently and in smaller volumes, all of which may cause difficulty when establishing or closing a position at a desirable price. |
| n | Value investing style risk. The Fund emphasizes a value style of investing, which focuses on undervalued companies with characteristics for improved valuations. This style of investing is subject to the risk that the valuations never improve or that the returns on value equity securities are less than returns on other styles of investing or the overall stock market. Value stocks also may decline in price, even though in theory they are already underpriced. |
About indexes used in this report
| n | The S&P 500 Index is an unmanaged index considered representative of the US stock market. |
| n | The Russell 1000 Value Index is an unmanaged index considered representative of large-cap value stocks. The Russell 1000 Value Index is a trademark/service mark of the Frank Russell Co. Russell® is a trademark of the Frank Russell Co. |
| n | The Lipper Large-Cap Value Funds Index is an unmanaged index considered representative of large-cap value funds tracked by Lipper. |
| n | The Fund is not managed to track the performance of any particular index, including the index(es) described here, and consequently, the performance of the Fund may deviate significantly from the performance of the index(es). |
| n | A direct investment cannot be made in an index. Unless otherwise indicated, index results include reinvested dividends, and they do not reflect sales charges. Performance of the peer group, if applicable, reflects fund expenses; performance of a market index does not. |
Other information
| n | The returns shown in management’s discussion of Fund performance are based on net asset values (NAVs) calculated for shareholder transactions. Generally accepted accounting principles require adjustments to be made to the net assets of the Fund at period end for financial reporting purposes, and as such, the NAVs for shareholder transactions and the returns based on those NAVs may differ from the NAVs and returns reported in the Financial Highlights. |
| n | Industry classifications used in this report are generally according to the Global Industry Classification Standard, which was developed by and is the exclusive property and a service mark of MSCI Inc. and Standard & Poor’s. |
6 Invesco Growth and Income Fund
Average Annual Total Returns
As of 8/31/14, including maximum applicable sales charges
Class A Shares | ||||
Inception (8/1/46) | 9.58 | % | ||
10 Years | 7.98 | |||
5 Years | 13.78 | |||
1 Year | 15.19 | |||
Class B Shares | ||||
Inception (8/2/93) | 9.98 | % | ||
10 Years | 8.47 | |||
5 Years | 14.81 | |||
1 Year | 16.86 | |||
Class C Shares | ||||
Inception (8/2/93) | 9.48 | % | ||
10 Years | 7.80 | |||
5 Years | 14.21 | |||
1 Year | 19.94 | |||
Class R Shares | ||||
Inception (10/1/02) | 9.67 | % | ||
10 Years | 8.32 | |||
5 Years | 14.77 | |||
1 Year | 21.53 | |||
Class Y Shares | ||||
Inception (10/19/04) | 8.86 | % | ||
5 Years | 15.34 | |||
1 Year | 22.17 | |||
Class R5 Shares | ||||
10 Years | 8.77 | % | ||
5 Years | 15.44 | |||
1 Year | 22.27 | |||
Class R6 Shares | ||||
10 Years | 8.69 | % | ||
5 Years | 15.25 | |||
1 Year | 22.38 | |||
Effective June 1, 2010, Class A, Class B, Class C, Class R and Class I shares of the predecessor fund, Van Kampen Growth and Income Fund, advised by Van Kampen Asset Management were reorganized into Class A, Class B, Class C, Class R and Class Y shares, respectively, of Invesco Van Kampen Growth and Income Fund (renamed Invesco Growth and Income Fund). Returns shown above for Class A, Class B, Class C, Class R and Class Y shares are blended returns of the predecessor fund and Invesco Growth and Income Fund. Share class returns will differ from the predecessor fund because of different expenses.
Class R5 shares incepted on June 1, 2010. Performance shown prior to that date is that of the predecessor fund’s Class A shares and includes the 12b-1 fees applicable to Class A shares.
Average Annual Total Returns
As of 6/30/14, the most recent calendar quarter end, including maximum applicable sales charges
Class A Shares | ||||
Inception (8/1/46) | 9.57 | % | ||
10 Years | 7.56 | |||
5 Years | 16.44 | |||
1 Year | 14.88 | |||
Class B Shares | ||||
Inception (8/2/93) | 9.95 | % | ||
10 Years | 8.03 | |||
5 Years | 17.55 | |||
1 Year | 16.57 | |||
Class C Shares | ||||
Inception (8/2/93) | 9.46 | % | ||
10 Years | 7.37 | |||
5 Years | 16.90 | |||
1 Year | 19.61 | |||
Class R Shares | ||||
Inception (10/1/02) | 9.62 | % | ||
10 Years | 7.90 | |||
5 Years | 17.48 | |||
1 Year | 21.24 | |||
Class Y Shares | ||||
Inception (10/19/04) | 8.78 | % | ||
5 Years | 18.06 | |||
1 Year | 21.84 | |||
Class R5 Shares | ||||
10 Years | 8.34 | % | ||
5 Years | 18.14 | |||
1 Year | 21.99 | |||
Class R6 Shares | ||||
10 Years | 8.25 | % | ||
5 Years | 17.95 | |||
1 Year | 22.06 | |||
Class A share performance reflects any applicable fee waivers or expense reimbursements.
Class R6 shares incepted on September 24, 2012. Performance shown prior to that date is that of the Fund’s and the predecessor fund’s Class A shares and includes the 12b-1 fees applicable to Class A shares. Class A share performance reflects any applicable fee waivers or expense reimbursements.
The performance data quoted represent past performance and cannot guarantee comparable future results; current performance may be lower or higher. Please visit invesco.com/performance for the most recent month-end performance. Performance figures reflect reinvested distributions, changes in net asset value and the effect of the maximum
sales charge unless otherwise stated. Investment return and principal value will fluctuate so that you may have a gain or loss when you sell shares.
The net annual Fund operating expense ratio set forth in the most recent Fund prospectus as of the date of this report for Class A, Class B, Class C, Class R, Class Y, Class R5 and Class R6 shares was 0.82%, 0.82%, 1.57%, 1.07%, 0.57%, 0.48% and 0.39%, respectively.1 The total annual Fund operating expense ratio set forth in the most recent Fund prospectus as of the date of this report for Class A, Class B, Class C, Class R, Class Y, Class R5 and Class R6 shares was 0.83%, 0.83%, 1.58%, 1.08%, 0.58%, 0.49% and 0.40%, respectively. The expense ratios presented above may vary from the expense ratios presented in other sections of this report that are based on expenses incurred during the period covered by this report.
Class A share performance reflects the maximum 5.50% sales charge, and Class B and Class C share performance reflects the applicable contingent deferred sales charge (CDSC) for the period involved. For shares purchased prior to June 1, 2010, the CDSC on Class B shares declines from 5% at the time of purchase to 0% at the beginning of the sixth year. For shares purchased on or after June 1, 2010, the CDSC on Class B shares declines from 5% at the time of purchase to 0% at the beginning of the seventh year. The CDSC on Class C shares is 1% for the first year after purchase. Class R, Class Y, Class R5 and Class R6 shares do not have a front-end sales charge or a CDSC; therefore, performance is at net asset value.
The performance of the Fund’s share classes will differ primarily due to different sales charge structures and class expenses.
| 1 | Total annual Fund operating expenses after any contractual fee waivers and/or expense reimbursements by the adviser in effect through at least June 30, 2016. See current prospectus for more information. |
7 Invesco Growth and Income Fund
Invesco Growth and Income Fund’s investment objective is total return through growth of capital and current income.
| n | Unless otherwise stated, information presented in this report is as of August 31, 2014, and is based on total net assets. |
| n | Unless otherwise noted, all data provided by Invesco. |
| n | To access your Fund’s reports/prospectus, visit invesco.com/fundreports. |
About share classes
| n | Class B shares may not be purchased for new or additional investments. Please see the prospectus for more information. |
| n | Class R shares are generally available only to employer sponsored retirement and benefit plans. Please see the prospectus for more information. |
| n | Class Y shares are available only to certain investors. Please see the prospectus for more information. |
| n | Class R5 shares and Class R6 shares are primarily intended for employer sponsored retirement and benefit plans that meet certain standards and for institutional investors. Please see the prospectus for more information. |
Principal risks of investing in the Fund
| n | Convertible securities risk. The Fund may own convertible securities, the value of which may be affected by market interest rates, the risk that the issuer will default, the value of the underlying stock or the right of the issuer to buy back the convertible securities. |
| n | Depositary receipts risk. Depositary receipts involve many of the same risks as those associated with direct investment in foreign securities. In addition, the underlying issuers of certain depositary receipts, particularly unsponsored or unregistered depositary receipts, are under no obligation to distribute shareholder communications to the holders of such receipts or to pass through to them any voting rights with respect to the deposited securities. |
| n | Derivatives risk. The value of a derivative instrument depends largely on (and is derived from) the value of an underlying security, currency, commodity, interest rate, index or other asset (each referred to as an underlying asset). In addition to risks relating to the underlying assets, the use of derivatives may include other, possibly greater, risks, including counterparty, |
leverage and liquidity risks. Counterparty risk is the risk that the counterparty to the derivative contract will default on its obligation to pay the Fund the amount owed or otherwise perform under the derivative contract. Derivatives create leverage risk because they do not require payment up front equal to the economic exposure created by owning the derivative. As a result, an adverse change in the value of the underlying asset could result in the Fund sustaining a loss that is substantially greater than the amount invested in the derivative, which may make the Fund’s returns more volatile and increase the risk of loss. Derivative instruments may also be less liquid than more traditional investments and the Fund may be unable to sell or close out its derivative positions at a desirable time or price. This risk may be more acute under adverse market conditions, during which the Fund may be most in need of liquidating |
its derivative positions. Derivatives may also be harder to value, less tax efficient and subject to changing government regulation that could impact the Fund’s ability to use certain derivatives or their cost. Also, derivatives used for hedging or to gain or limit exposure to a particular market segment may not provide the expected benefits, particularly during adverse market conditions.
| n | Equity risk. Equity risk is the risk that the value of securities held by the Fund will fall due to general market and economic conditions, perceptions regarding the industries in which the issuers of securities held by the Fund participate or factors relating to specific companies in which the Fund invests, either directly or through derivative instruments. For example, an adverse event, such as an unfavorable earnings report, |
This report must be accompanied or preceded by a currently effective Fund prospectus, which contains more complete information, including sales charges and expenses. Investors should read it carefully before investing.
NOT FDIC INSURED | MAY LOSE VALUE | NO BANK GUARANTEE |
may depress the value of securities held by the Fund; the price of securities may be particularly sensitive to general movements in the stock market; or a drop in the stock market may depress the price of most or all of the securities held by the Fund. In addition, securities of an issuer in the Fund’s portfolio may decline in price if the issuer fails to make anticipated dividend payments because, among other reasons, the issuer of the security experiences a decline in its financial condition. |
| n | Foreign securities risk. The Fund’s foreign investments may be affected by changes in a foreign country’s exchange rates, political and social instability, changes in economic or taxation policies, difficulties when enforcing obligations, decreased liquidity, and increased volatility. Foreign companies may be subject to less regulation resulting in less publicly available information about the companies. |
| n | Management risk. The investment techniques and risk analysis used by the Fund’s portfolio managers may not produce the desired results. |
| n | Market risk. The prices of and the income generated by the Fund’s securities may decline in response to, among other things, investor sentiment, general economic and market conditions, regional or global instability, and currency and interest rate fluctuations. |
| n | Real estate investment trust (REIT) risk/real estate risk. Investments in real estate related instruments may be affected by economic, legal, cultural, environmental or technological factors that affect property values, rents or occupancies of real estate related to the Fund’s holdings. Real estate companies, including REITs or similar structures, tend to be small- and mid-cap companies, and their shares may be more volatile and less liquid. The value of investments in real estate related companies may be affected by the quality of management, the ability to repay loans, the utilization of leverage and financial covenants related thereto, whether the company carries adequate insurance and environmental factors. If a real estate related company defaults, the Fund may own real estate directly, which involves the following additional risks: environmental liabilities; difficulty in valuing and selling the real estate; and economic or regulatory changes. |
continued on page 6
8 Invesco Growth and Income Fund
Schedule of Investments(a)
August 31, 2014
| Shares | Value | |||||||
Common Stocks & Other Equity Interests–97.61% |
| |||||||
| Aerospace & Defense–1.06% | ||||||||
General Dynamics Corp. | 828,828 | $ | 102,153,051 | |||||
| Agricultural Products–1.03% | ||||||||
Archer-Daniels-Midland Co. | 1,981,101 | 98,777,696 | ||||||
| Apparel Retail–1.06% | ||||||||
Abercrombie & Fitch Co.–Class A | 2,434,975 | 101,781,955 | ||||||
| Application Software–2.53% | ||||||||
Adobe Systems Inc.(b) | 2,303,757 | 165,640,128 | ||||||
Citrix Systems, Inc.(b) | 1,107,242 | 77,794,823 | ||||||
| 243,434,951 | ||||||||
| Asset Management & Custody Banks–2.16% | ||||||||
Northern Trust Corp. | 1,438,971 | 99,792,639 | ||||||
State Street Corp. | 1,496,364 | 107,783,099 | ||||||
| 207,575,738 | ||||||||
| Automobile Manufacturers–1.08% | ||||||||
General Motors Co. | 2,996,530 | 104,279,244 | ||||||
| Biotechnology–1.16% | ||||||||
Amgen Inc. | 801,577 | 111,723,802 | ||||||
| Cable & Satellite–3.03% | ||||||||
Comcast Corp.–Class A | 2,630,789 | 143,983,082 | ||||||
Time Warner Cable Inc. | 994,539 | 147,122,154 | ||||||
| 291,105,236 | ||||||||
| Communications Equipment–0.71% | ||||||||
Cisco Systems, Inc. | 2,717,895 | 67,920,196 | ||||||
| Construction Machinery & Heavy Trucks–1.47% | ||||||||
Caterpillar Inc. | 1,294,183 | 141,156,540 | ||||||
| Consumer Finance–0.42% | ||||||||
Synchrony Financial(b) | 1,583,760 | 40,845,170 | ||||||
| Diversified Banks–11.66% | ||||||||
Bank of America Corp. | 7,888,482 | 126,925,675 | ||||||
Citigroup Inc. | 7,311,334 | 377,630,401 | ||||||
Comerica Inc. | 2,020,341 | 101,703,966 | ||||||
JPMorgan Chase & Co. | 6,684,308 | 397,382,111 | ||||||
Wells Fargo & Co. | 2,285,910 | 117,587,210 | ||||||
| 1,121,229,363 | ||||||||
| Diversified Chemicals–1.18% | ||||||||
Dow Chemical Co. (The) | 2,114,796 | 113,247,326 | ||||||
| Diversified Metals & Mining–0.88% | ||||||||
Freeport-McMoRan Inc. | 2,315,633 | 84,219,572 | ||||||
| Electric Utilities–1.10% | ||||||||
Edison International | 837,862 | 49,551,159 | ||||||
FirstEnergy Corp. | 1,493,234 | 51,128,332 | ||||||
Pinnacle West Capital Corp. | 83,567 | 4,759,141 | ||||||
| 105,438,632 | ||||||||
| Shares | Value | |||||||
| Electronic Components–1.24% | ||||||||
Corning Inc. | 5,729,211 | $ | 119,511,342 | |||||
| General Merchandise Stores–1.16% | ||||||||
Target Corp. | 1,862,457 | 111,877,792 | ||||||
| Health Care Equipment–0.75% | ||||||||
Medtronic, Inc. | 1,135,815 | 72,521,788 | ||||||
| Hotels, Resorts & Cruise Lines–1.37% | ||||||||
Carnival Corp. | 3,470,476 | 131,461,631 | ||||||
| Household Products–1.24% | ||||||||
Procter & Gamble Co. (The) | 1,436,911 | 119,421,673 | ||||||
| Industrial Conglomerates–2.78% | ||||||||
General Electric Co. | 10,301,274 | 267,627,099 | ||||||
| Industrial Machinery–1.09% | ||||||||
Ingersoll-Rand PLC | 1,744,161 | 104,998,492 | ||||||
| Insurance Brokers–3.12% | ||||||||
Aon PLC | 1,035,641 | 90,266,470 | ||||||
Marsh & McLennan Cos., Inc. | 2,688,670 | 142,768,377 | ||||||
Willis Group Holdings PLC | 1,586,493 | 66,585,111 | ||||||
| 299,619,958 | ||||||||
| Integrated Oil & Gas–6.15% | ||||||||
Exxon Mobil Corp. | 890,293 | 88,548,542 | ||||||
Occidental Petroleum Corp. | 1,096,177 | 113,706,440 | ||||||
Royal Dutch Shell PLC–Class A (United Kingdom) | 5,992,517 | 242,551,177 | ||||||
Total S.A. (France) | 2,222,117 | 146,666,564 | ||||||
| 591,472,723 | ||||||||
| Integrated Telecommunication Services–1.65% | ||||||||
Koninklijke KPN N.V. (Netherlands)(b) | 4,292,847 | 14,243,022 | ||||||
Orange S.A. (France) | 1,393,492 | 21,120,004 | ||||||
Telecom Italia S.p.A. (Italy)(b) | 11,472,263 | 13,226,292 | ||||||
Telefonica S.A. (Spain) | 964,776 | 15,301,328 | ||||||
Verizon Communications Inc. | 1,905,336 | 94,923,840 | ||||||
| 158,814,486 | ||||||||
| Internet Software & Services–1.69% | ||||||||
eBay Inc.(b) | 2,929,774 | 162,602,457 | ||||||
| Investment Banking & Brokerage–4.85% | ||||||||
Charles Schwab Corp. (The) | 5,009,893 | 142,832,049 | ||||||
Goldman Sachs Group, Inc. (The) | 520,385 | 93,206,157 | ||||||
Morgan Stanley | 6,710,518 | 230,237,873 | ||||||
| 466,276,079 | ||||||||
| IT Consulting & Other Services–1.17% | ||||||||
Amdocs Ltd. | 2,380,614 | 112,126,919 | ||||||
| Managed Health Care–3.24% | ||||||||
Cigna Corp. | 869,587 | 82,262,930 | ||||||
UnitedHealth Group Inc. | 1,138,840 | 98,714,651 | ||||||
WellPoint, Inc. | 1,120,911 | 130,597,341 | ||||||
| 311,574,922 | ||||||||
See accompanying Notes to Financial Statements which are an integral part of the financial statements.
9 Invesco Growth and Income Fund
| Shares | Value | |||||||
| Movies & Entertainment–2.29% | ||||||||
Time Warner Inc. | 822,225 | $ | 63,335,992 | |||||
Viacom Inc.–Class B | 1,937,243 | 157,207,269 | ||||||
| 220,543,261 | ||||||||
| Multi-Utilities–0.66% | ||||||||
PG&E Corp. | 1,365,347 | 63,461,329 | ||||||
| Oil & Gas Equipment & Services–1.37% | ||||||||
Baker Hughes Inc. | 1,907,662 | 131,895,751 | ||||||
| Oil & Gas Exploration & Production–3.70% | ||||||||
Anadarko Petroleum Corp. | 946,653 | 106,678,327 | ||||||
Apache Corp. | 1,086,674 | 110,656,013 | ||||||
Canadian Natural Resources Ltd. (Canada) | 3,169,828 | 138,169,747 | ||||||
| 355,504,087 | ||||||||
| Other Diversified Financial Services–0.97% | ||||||||
Voya Financial, Inc. | 2,386,092 | 93,272,336 | ||||||
| Packaged Foods & Meats–1.77% | ||||||||
Mondelez International Inc.–Class A | 2,977,293 | 107,748,234 | ||||||
Unilever N.V.–New York Shares (Netherlands) | 1,498,780 | 62,409,199 | ||||||
| 170,157,433 | ||||||||
| Personal Products–1.50% | ||||||||
Avon Products, Inc. | 10,249,243 | 143,899,372 | ||||||
| Pharmaceuticals–7.74% | ||||||||
Bristol-Myers Squibb Co. | 739,911 | 37,476,492 | ||||||
Eli Lilly and Co. | 1,818,410 | 115,578,139 | ||||||
Hospira, Inc.(b) | 659,570 | 35,445,292 | ||||||
Merck & Co., Inc. | 2,401,624 | 144,361,619 | ||||||
Novartis AG (Switzerland) | 1,416,777 | 127,212,313 | ||||||
Novartis AG–ADR (Switzerland) | 116,971 | 10,508,675 | ||||||
Pfizer Inc. | 2,231,202 | 65,575,027 | ||||||
Sanofi (France) | 854,508 | 93,755,763 | ||||||
Teva Pharmaceutical Industries Ltd.–ADR (Israel) | 2,174,201 | 114,189,036 | ||||||
| 744,102,356 | ||||||||
| Publishing–0.77% | ||||||||
Thomson Reuters Corp. | 1,959,951 | 74,273,346 | ||||||
| Railroads–0.93% | ||||||||
CSX Corp. | 2,885,375 | 89,186,941 | ||||||
| Regional Banks–3.11% | ||||||||
BB&T Corp. | 2,018,959 | 75,367,739 | ||||||
Fifth Third Bancorp | 3,609,949 | 73,661,009 | ||||||
| Shares | Value | |||||||
| Regional Banks–(continued) | ||||||||
PNC Financial Services Group, Inc. (The) | 1,769,490 | $ | 149,964,278 | |||||
| 298,993,026 | ||||||||
| Security & Alarm Services–1.31% | ||||||||
Tyco International Ltd. | 2,835,623 | 126,525,498 | ||||||
| Semiconductor Equipment–1.96% | ||||||||
Applied Materials, Inc. | 8,147,460 | 188,247,063 | ||||||
| Semiconductors–2.45% | ||||||||
Broadcom Corp.–Class A | 2,088,744 | 82,254,739 | ||||||
Intel Corp. | 2,406,996 | 84,052,300 | ||||||
Texas Instruments Inc. | 1,430,130 | 68,903,663 | ||||||
| 235,210,702 | ||||||||
| Specialized Finance–0.76% | ||||||||
CME Group Inc.–Class A | 958,287 | 73,356,870 | ||||||
| Specialty Chemicals–0.34% | ||||||||
PPG Industries, Inc. | 157,587 | 32,440,860 | ||||||
| Systems Software–2.52% | ||||||||
Microsoft Corp. | 2,563,129 | 116,442,950 | ||||||
Symantec Corp. | 5,179,120 | 125,749,034 | ||||||
| 242,191,984 | ||||||||
| Technology Hardware, Storage & Peripherals–0.60% | ||||||||
NetApp, Inc. | 1,373,412 | 57,903,050 | ||||||
| Wireless Telecommunication Services–0.83% | ||||||||
Vodafone Group PLC–ADR (United Kingdom) | 2,326,932 | 79,906,845 | ||||||
Total Common Stocks & Other |
| 9,385,867,943 | ||||||
| Number of Contracts | Exercise Price | Expiration Date | ||||||||||||||
Put Options Purchased–0.00% |
| |||||||||||||||
| Personal Products–0.00% | ||||||||||||||||
Avon Products, Inc. | 14,675 | $ | 11.00 | Oct-14 | 73,375 | |||||||||||
| Shares | ||||||||
Money Market Funds–2.29% |
| |||||||
Liquid Assets Portfolio–Institutional Class(c) | 109,862,935 | 109,862,935 | ||||||
Premier Portfolio– | 109,862,935 | 109,862,935 | ||||||
Total Money Market Funds |
| 219,725,870 | ||||||
TOTAL INVESTMENTS–99.90% |
| 9,605,667,188 | ||||||
OTHER ASSETS LESS LIABILITIES–0.10% |
| 9,977,881 | ||||||
NET ASSETS–100.00% |
| $ | 9,615,645,069 | |||||
Investment Abbreviations:
| ADR | – American Depositary Receipt |
Notes to Schedule of Investments:
| (a) | Industry and/or sector classifications used in this report are generally according to the Global Industry Classification Standard, which was developed by and is the exclusive property and a service mark of MSCI Inc. and Standard & Poor’s. |
| (b) | Non-income producing security. |
| (c) | The money market fund and the Fund are affiliated by having the same investment adviser. |
See accompanying Notes to Financial Statements which are an integral part of the financial statements.
10 Invesco Growth and Income Fund
Statement of Assets and Liabilities
August 31, 2014
Assets: |
| |||
Investments, at value (Cost $6,576,953,872) | $ | 9,385,941,318 | ||
Investments in affiliated money market funds, at value and cost | 219,725,870 | |||
Total investments, at value (Cost $6,796,679,742) | 9,605,667,188 | |||
Receivable for: | ||||
Investments sold | 17,784,652 | |||
Fund shares sold | 11,411,625 | |||
Dividends | 20,449,641 | |||
Forward foreign currency contracts outstanding | 254,244 | |||
Investment for trustee deferred compensation and retirement plans | 627,028 | |||
Other assets | 148,038 | |||
Total assets | 9,656,342,416 | |||
Liabilities: |
| |||
Payable for: | ||||
Investments purchased | 18,262,584 | |||
Fund shares reacquired | 14,427,307 | |||
Amount due custodian — foreign currency | 921,263 | |||
Accrued fees to affiliates | 6,031,692 | |||
Accrued trustees’ and officers’ fees and benefits | 17,329 | |||
Accrued other operating expenses | 288,698 | |||
Trustee deferred compensation and retirement plans | 748,474 | |||
Total liabilities | 40,697,347 | |||
Net assets applicable to shares outstanding | $ | 9,615,645,069 | ||
Net assets consist of: |
| |||
Shares of beneficial interest | $ | 6,115,925,162 | ||
Undistributed net investment income | 108,981,756 | |||
Undistributed net realized gain | 581,489,052 | |||
Net unrealized appreciation | 2,809,249,099 | |||
| $ | 9,615,645,069 | |||
Net Assets: |
| |||
Class A | $ | 5,302,375,019 | ||
Class B | $ | 82,970,240 | ||
Class C | $ | 334,901,855 | ||
Class R | $ | 181,301,165 | ||
Class Y | $ | 2,186,472,084 | ||
Class R5 | $ | 880,275,002 | ||
Class R6 | $ | 647,349,704 | ||
Shares outstanding, $0.01 par value per share, |
| |||
Class A | 180,945,218 | |||
Class B | 2,851,607 | |||
Class C | 11,543,464 | |||
Class R | 6,185,283 | |||
Class Y | 74,549,007 | |||
Class R5 | 29,985,643 | |||
Class R6 | 22,045,516 | |||
Class A: | ||||
Net asset value per share | $ | 29.30 | ||
Maximum offering price per share | ||||
(Net asset value of $29.30 ¸ 94.50%) | $ | 31.01 | ||
Class B: | ||||
Net asset value and offering price per share | $ | 29.10 | ||
Class C: | ||||
Net asset value and offering price per share | $ | 29.01 | ||
Class R: | ||||
Net asset value and offering price per share | $ | 29.31 | ||
Class Y: | ||||
Net asset value and offering price per share | $ | 29.33 | ||
Class R5: | ||||
Net asset value and offering price per share | $ | 29.36 | ||
Class R6: | ||||
Net asset value and offering price per share | $ | 29.36 | ||
See accompanying Notes to Financial Statements which are an integral part of the financial statements.
11 Invesco Growth and Income Fund
Statement of Operations
For the year ended August 31, 2014
Investment income: |
| |||
Dividends (net of foreign withholding taxes of $4,111,766) | $ | 258,580,692 | ||
Dividends from affiliated money market funds | 140,447 | |||
Total investment income | 258,721,139 | |||
Expenses: | ||||
Advisory fees | 32,080,300 | |||
Administrative services fees | 751,760 | |||
Custodian fees | 359,991 | |||
Distribution fees: | ||||
Class A | 12,792,570 | |||
Class B | 236,938 | |||
Class C | 3,182,182 | |||
Class R | 903,975 | |||
Transfer agent fees — A, B, C, R and Y | 15,709,801 | |||
Transfer agent fees — R5 | 820,011 | |||
Transfer agent fees — R6 | 21,391 | |||
Trustees’ and officers’ fees and benefits | 308,028 | |||
Other | 1,271,056 | |||
Total expenses | 68,438,003 | |||
Less: Fees waived and expense offset arrangement(s) | (477,100 | ) | ||
Net expenses | 67,960,903 | |||
Net investment income | 190,760,236 | |||
Realized and unrealized gain (loss) from: | ||||
Net realized gain from: | ||||
Investment securities | 713,319,223 | |||
Foreign currencies | 144,847 | |||
Forward foreign currency contracts | 4,423,573 | |||
| 717,887,643 | ||||
Change in net unrealized appreciation (depreciation) of: | ||||
Investment securities | 868,340,801 | |||
Foreign currencies | 6,271 | |||
Forward foreign currency contracts | (1,379,994 | ) | ||
| 866,967,078 | ||||
Net realized and unrealized gain | 1,584,854,721 | |||
Net increase in net assets resulting from operations | $ | 1,775,614,957 | ||
See accompanying Notes to Financial Statements which are an integral part of the financial statements.
12 Invesco Growth and Income Fund
Statement of Changes in Net Assets
For the years ended August 31, 2014 and 2013
| 2014 | 2013 | |||||||
Operations: |
| |||||||
Net investment income | $ | 190,760,236 | $ | 108,443,047 | ||||
Net realized gain | 717,887,643 | 349,587,687 | ||||||
Change in net unrealized appreciation | 866,967,078 | 1,112,776,078 | ||||||
Net increase in net assets resulting from operations | 1,775,614,957 | 1,570,806,812 | ||||||
Distributions to shareholders from net investment income: | ||||||||
Class A | (61,612,058 | ) | (67,443,335 | ) | ||||
Class B | (1,179,649 | ) | (1,795,917 | ) | ||||
Class C | (1,447,199 | ) | (2,104,718 | ) | ||||
Class R | (1,736,950 | ) | (1,994,383 | ) | ||||
Class Y | (29,080,386 | ) | (28,763,044 | ) | ||||
Class R5 | (12,570,413 | ) | (11,863,944 | ) | ||||
Class R6 | (7,418,125 | ) | (2,246,832 | ) | ||||
Total distributions from net investment income | (115,044,780 | ) | (116,212,173 | ) | ||||
Distributions to shareholders from net realized gains: | ||||||||
Class A | (117,716,418 | ) | — | |||||
Class B | (2,338,436 | ) | — | |||||
Class C | (7,258,149 | ) | — | |||||
Class R | (4,191,643 | ) | — | |||||
Class Y | (45,186,746 | ) | — | |||||
Class R5 | (18,438,457 | ) | — | |||||
Class R6 | (8,430,934 | ) | — | |||||
Total distributions from net realized gains | (203,560,783 | ) | — | |||||
Share transactions–net: | ||||||||
Class A | (288,693,649 | ) | (374,596,526 | ) | ||||
Class B | (34,204,390 | ) | (45,861,702 | ) | ||||
Class C | (5,617,121 | ) | (17,556,960 | ) | ||||
Class R | (18,402,121 | ) | (7,843,983 | ) | ||||
Class Y | 34,843,158 | (1,106,001 | ) | |||||
Class R5 | 29,578,569 | (101,402,342 | ) | |||||
Class R6 | 231,388,328 | 308,180,509 | ||||||
Net increase (decrease) in net assets resulting from share transactions | (51,107,226 | ) | (240,187,005 | ) | ||||
Net increase in net assets | 1,405,902,168 | 1,214,407,634 | ||||||
Net assets: | ||||||||
Beginning of year | 8,209,742,901 | 6,995,335,267 | ||||||
End of year (includes undistributed net investment income of $108,981,756 and $32,190,683, respectively) | $ | 9,615,645,069 | $ | 8,209,742,901 | ||||
Notes to Financial Statements
August 31, 2014
NOTE 1—Significant Accounting Policies
Invesco Growth and Income Fund (the “Fund”) is a series portfolio of AIM Counselor Series Trust (Invesco Counselor Series Trust) (the “Trust”). The Trust is a Delaware statutory trust registered under the Investment Company Act of 1940, as amended (the “1940 Act”), as an open-end series management investment company consisting of thirteen separate portfolios, each authorized to issue an unlimited number of shares of beneficial interest. The assets, liabilities and operations of each portfolio are accounted for separately. Information presented in these financial statements pertains only to the Fund. Matters affecting each portfolio or class will be voted on exclusively by the shareholders of such portfolio or class.
The Fund’s investment objective is total return through growth of capital and current income.
The Fund currently consists of seven different classes of shares: Class A, Class B, Class C, Class R, Class Y, Class R5 and Class R6. Class A shares are sold with a front-end sales charge unless certain waiver criteria are met and under certain circumstances load waived shares may be subject to contingent deferred sales charges (“CDSC”). Class C shares are sold with a CDSC. Class R, Class Y, Class R5 and Class R6 shares are sold at net asset
13 Invesco Growth and Income Fund
value. Effective November 30, 2010, new or additional investments in Class B shares are no longer permitted. Existing shareholders of Class B shares may continue to reinvest dividends and capital gains distributions in Class B shares until they convert to Class A shares. Also, shareholders in Class B shares will be able to exchange those shares for Class B shares of other Invesco Funds offering such shares until they convert to Class A shares. Generally, Class B shares will automatically convert to Class A shares on or about the month-end, which is at least eight years after the date of purchase. Redemption of Class B shares prior to the conversion date will be subject to a CDSC.
The following is a summary of the significant accounting policies followed by the Fund in the preparation of its financial statements.
| A. | Security Valuations — Securities, including restricted securities, are valued according to the following policy. |
A security listed or traded on an exchange (except convertible securities) is valued at its last sales price or official closing price as of the close of the customary trading session on the exchange where the security is principally traded, or lacking any sales or official closing price on a particular day, the security may be valued at the closing bid price on that day. Securities traded in the over-the-counter market are valued based on prices furnished by independent pricing services or market makers. When such securities are valued by an independent pricing service they may be considered fair valued. Futures contracts are valued at the final settlement price set by an exchange on which they are principally traded. Listed options are valued at the mean between the last bid and ask prices from the exchange on which they are principally traded. Options not listed on an exchange are valued by an independent source at the mean between the last bid and ask prices. For purposes of determining net asset value per share, futures and option contracts generally are valued 15 minutes after the close of the customary trading session of the New York Stock Exchange (“NYSE”).
Investments in open-end and closed-end registered investment companies that do not trade on an exchange are valued at the end of day net asset value per share. Investments in open-end and closed-end registered investment companies that trade on an exchange are valued at the last sales price or official closing price as of the close of the customary trading session on the exchange where the security is principally traded.
Debt obligations (including convertible securities) and unlisted equities are fair valued using an evaluated quote provided by an independent pricing service. Evaluated quotes provided by the pricing service may be determined without exclusive reliance on quoted prices, and may reflect appropriate factors such as institution-size trading in similar groups of securities, developments related to specific securities, dividend rate (for unlisted equities), yield (for debt obligations), quality, type of issue, coupon rate (for debt obligations), maturity (for debt obligations), individual trading characteristics and other market data. Debt obligations are subject to interest rate and credit risks. In addition, all debt obligations involve some risk of default with respect to interest and/or principal payments.
Foreign securities’ (including foreign exchange contracts) prices are converted into U.S. dollar amounts using the applicable exchange rates as of the close of the NYSE. If market quotations are available and reliable for foreign exchange-traded equity securities, the securities will be valued at the market quotations. Because trading hours for certain foreign securities end before the close of the NYSE, closing market quotations may become unreliable. If between the time trading ends on a particular security and the close of the customary trading session on the NYSE, events occur that the Adviser determines are significant and make the closing price unreliable, the Fund may fair value the security. If the event is likely to have affected the closing price of the security, the security will be valued at fair value in good faith using procedures approved by the Board of Trustees. Adjustments to closing prices to reflect fair value may also be based on a screening process of an independent pricing service to indicate the degree of certainty, based on historical data, that the closing price in the principal market where a foreign security trades is not the current value as of the close of the NYSE. Foreign securities’ prices meeting the approved degree of certainty that the price is not reflective of current value will be priced at the indication of fair value from the independent pricing service. Multiple factors may be considered by the independent pricing service in determining adjustments to reflect fair value and may include information relating to sector indices, American Depositary Receipts and domestic and foreign index futures. Foreign securities may have additional risks including exchange rate changes, potential for sharply devalued currencies and high inflation, political and economic upheaval, the relative lack of issuer information, relatively low market liquidity and the potential lack of strict financial and accounting controls and standards.
Securities for which market prices are not provided by any of the above methods may be valued based upon quotes furnished by independent sources. The last bid price may be used to value equity securities. The mean between the last bid and asked prices is used to value debt obligations, including corporate loans.
Securities for which market quotations are not readily available or became unreliable are valued at fair value as determined in good faith by or under the supervision of the Trust’s officers following procedures approved by the Board of Trustees. Issuer specific events, market trends, bid/ask quotes of brokers and information providers and other market data may be reviewed in the course of making a good faith determination of a security’s fair value.
The Fund may invest in securities that are subject to interest rate risk, meaning the risk that the prices will generally fall as interest rates rise and, conversely, the prices will generally rise as interest rates fall. Specific securities differ in their sensitivity to changes in interest rates depending on their individual characteristics. Changes in interest rates may result in increased market volatility, which may affect the value and/or liquidity of certain of the Fund’s investments.
Valuations change in response to many factors including the historical and prospective earnings of the issuer, the value of the issuer’s assets, general economic conditions, interest rates, investor perceptions and market liquidity. Because of the inherent uncertainties of valuation, the values reflected in the financial statements may materially differ from the value received upon actual sale of those investments.
| B. | Securities Transactions and Investment Income — Securities transactions are accounted for on a trade date basis. Realized gains or losses on sales are computed on the basis of specific identification of the securities sold. Interest income (net of withholding tax, if any) is recorded on the accrual basis from settlement date. Dividend income (net of withholding tax, if any) is recorded on the ex-dividend date. |
The Fund may periodically participate in litigation related to Fund investments. As such, the Fund may receive proceeds from litigation settlements. Any proceeds received are included in the Statement of Operations as realized gain (loss) for investments no longer held and as unrealized gain (loss) for investments still held.
Brokerage commissions and mark ups are considered transaction costs and are recorded as an increase to the cost basis of securities purchased and/or a reduction of proceeds on a sale of securities. Such transaction costs are included in the determination of net realized and unrealized gain (loss) from investment securities reported in the Statement of Operations and the Statement of Changes in Net Assets and the net realized and unrealized gains (losses) on securities per share in the Financial Highlights. Transaction costs are included in the calculation of the Fund’s net asset value and, accordingly, they reduce the Fund’s total returns. These transaction costs are not considered operating expenses and
14 Invesco Growth and Income Fund
are not reflected in net investment income reported in the Statement of Operations and Statement of Changes in Net Assets, or the net investment income per share and ratios of expenses and net investment income reported in the Financial Highlights, nor are they limited by any expense limitation arrangements between the Fund and the investment adviser.
The Fund allocates income and realized and unrealized capital gains and losses to a class based on the relative net assets of each class.
| C. | Country Determination — For the purposes of making investment selection decisions and presentation in the Schedule of Investments, the investment adviser may determine the country in which an issuer is located and/or credit risk exposure based on various factors. These factors include the laws of the country under which the issuer is organized, where the issuer maintains a principal office, the country in which the issuer derives 50% or more of its total revenues and the country that has the primary market for the issuer’s securities, as well as other criteria. Among the other criteria that may be evaluated for making this determination are the country in which the issuer maintains 50% or more of its assets, the type of security, financial guarantees and enhancements, the nature of the collateral and the sponsor organization. Country of issuer and/or credit risk exposure has been determined to be the United States of America, unless otherwise noted. |
| D. | Distributions — Distributions from net investment income, if any, are declared and paid quarterly and are recorded on the ex-dividend date. Distributions from net realized capital gain, if any, are generally declared and paid annually and recorded on the ex-dividend date. The Fund may elect to treat a portion of the proceeds from redemptions as distributions for federal income tax purposes. |
| E. | Federal Income Taxes — The Fund intends to comply with the requirements of Subchapter M of the Internal Revenue Code of 1986, as amended (the “Internal Revenue Code”), necessary to qualify as a regulated investment company and to distribute substantially all of the Fund’s taxable earnings to shareholders. As such, the Fund will not be subject to federal income taxes on otherwise taxable income (including net realized capital gain) that is distributed to shareholders. Therefore, no provision for federal income taxes is recorded in the financial statements. |
The Fund recognizes the tax benefits of uncertain tax positions only when the position is more likely than not to be sustained. Management has analyzed the Fund’s uncertain tax positions and concluded that no liability for unrecognized tax benefits should be recorded related to uncertain tax positions. Management is not aware of any tax positions for which it is reasonably possible that the total amounts of unrecognized tax benefits will change materially in the next 12 months.
The Fund files tax returns in the U.S. Federal jurisdiction and certain other jurisdictions. Generally, the Fund is subject to examinations by such taxing authorities for up to three years after the filing of the return for the tax period.
| F. | Expenses — Fees provided for under the Rule 12b-1 plan of a particular class of the Fund are charged to the operations of such class. Transfer agency fees and expenses and other shareholder recordkeeping fees and expenses attributable to Class R5 and Class R6 are allocated to each share class based on relative net assets. Sub-accounting fees attributable to Class R5 are charged to the operations of the class. Transfer agency fees and expenses and other shareholder recordkeeping fees and expenses relating to all other classes are allocated among those classes based on relative net assets. All other expenses are allocated among the classes based on relative net assets. Prior to June 1, 2010, incremental transfer agency fees which were unique to each class of shares were charged to the operations of such class. |
| G. | Accounting Estimates — The preparation of financial statements in conformity with accounting principles generally accepted in the United States of America (“GAAP”) requires management to make estimates and assumptions that affect the reported amounts of assets and liabilities at the date of the financial statements and the reported amounts of revenues and expenses during the reporting period including estimates and assumptions related to taxation. Actual results could differ from those estimates by a significant amount. In addition, the Fund monitors for material events or transactions that may occur or become known after the period-end date and before the date the financial statements are released to print. |
| H. | Indemnifications — Under the Trust’s organizational documents, each Trustee, officer, employee or other agent of the Trust is indemnified against certain liabilities that may arise out of the performance of their duties to the Fund. Additionally, in the normal course of business, the Fund enters into contracts, including the Fund’s servicing agreements, that contain a variety of indemnification clauses. The Fund’s maximum exposure under these arrangements is unknown as this would involve future claims that may be made against the Fund that have not yet occurred. The risk of material loss as a result of such indemnification claims is considered remote. |
| I. | Foreign Currency Translations — Foreign currency is valued at the close of the NYSE based on quotations posted by banks and major currency dealers. Portfolio securities and other assets and liabilities denominated in foreign currencies are translated into U.S. dollar amounts at date of valuation. Purchases and sales of portfolio securities (net of foreign taxes withheld on disposition) and income items denominated in foreign currencies are translated into U.S. dollar amounts on the respective dates of such transactions. The Fund does not separately account for the portion of the results of operations resulting from changes in foreign exchange rates on investments and the fluctuations arising from changes in market prices of securities held. The combined results of changes in foreign exchange rates and the fluctuation of market prices on investments (net of estimated foreign tax withholding) are included with the net realized and unrealized gain or loss from investments in the Statement of Operations. Reported net realized foreign currency gains or losses arise from (1) sales of foreign currencies, (2) currency gains or losses realized between the trade and settlement dates on securities transactions, and (3) the difference between the amounts of dividends, interest, and foreign withholding taxes recorded on the Fund’s books and the U.S. dollar equivalent of the amounts actually received or paid. Net unrealized foreign currency gains and losses arise from changes in the fair values of assets and liabilities, other than investments in securities at fiscal period end, resulting from changes in exchange rates. |
The Fund may invest in foreign securities, which may be subject to foreign taxes on income, gains on investments or currency repatriation, a portion of which may be recoverable. Foreign taxes, if any, are recorded based on the tax regulations and rates that exist in the foreign markets in which the Fund invests and are shown in the Statement of Operations.
| J. | Forward Foreign Currency Contracts — The Fund may engage in foreign currency transactions either on a spot (i.e. for prompt delivery and settlement) basis at the rate prevailing in the currency exchange market at the time or through forward foreign currency contracts to manage or minimize currency or exchange rate risk. |
The Fund may also enter into forward foreign currency contracts for the purchase or sale of a security denominated in a foreign currency in order to “lock in” the U.S. dollar price of that security, or the Fund may also enter into forward foreign currency contracts that do not provide for physical settlement of the two currencies, but instead are settled by a single cash payment calculated as the difference between the agreed upon exchange rate and the spot rate at settlement based upon an agreed upon notional amount (non-deliverable forwards). The Fund will set aside liquid assets in an amount equal to daily mark-to-market obligation for forward foreign currency contracts.
15 Invesco Growth and Income Fund
A forward foreign currency contract is an obligation to purchase or sell a specific currency for an agreed-upon price at a future date. The use of forward foreign currency contracts does not eliminate fluctuations in the price of the underlying securities the Fund owns or intends to acquire but establishes a rate of exchange in advance. Fluctuations in the value of these contracts are measured by the difference in the contract date and reporting date exchange rates and are recorded as unrealized appreciation (depreciation) until the contracts are closed. When the contracts are closed, realized gains (losses) are recorded. Realized and unrealized gains (losses) on the contracts are included in the Statement of Operations. The primary risks associated with forward foreign currency contracts include failure of the counterparty to meet the terms of the contract and the value of the foreign currency changing unfavorably. These risks may be in excess of the amounts reflected in the Statement of Assets and Liabilities.
| K. | Put Options Purchased — The Fund may purchase put options including options on securities indexes and/or futures contracts. By purchasing a put option, the Fund obtains the right (but not the obligation) to sell the option’s underlying instrument at a fixed strike price. In return for this right, the Fund pays an option premium. The option’s underlying instrument may be a security, securities index, or a futures contract. Put options may be used by the Fund to hedge securities it owns by locking in a minimum price at which the Fund can sell. If security prices fall, the put option could be exercised to offset all or a portion of the Fund’s resulting losses. At the same time, because the maximum the Fund has at risk is the cost of the option, purchasing put options does not eliminate the potential for the Fund to profit from an increase in the value of the securities hedged. Realized and unrealized gains and losses on these contracts are included in the Statement of Operations. A risk in buying an option is that the Fund pays a premium whether or not the option is exercised. In addition, there can be no assurance that a liquid secondary market will exist for any option purchased. |
NOTE 2—Advisory Fees and Other Fees Paid to Affiliates
The Trust has entered into a master investment advisory agreement with Invesco Advisers, Inc. (the “Adviser” or “Invesco”). Under the terms of the investment advisory agreement, the Fund pays an advisory fee to the Adviser based on the annual rate of the Fund’s average daily net assets as follows:
| Average Daily Net Assets | Rate | |||
First $150 million | 0.50% | |||
Next $100 million | 0.45% | |||
Next $100 million | 0.40% | |||
Over $350 million | 0.35% | |||
Under the terms of a master sub-advisory agreement between the Adviser and each of Invesco Asset Management Deutschland GmbH, Invesco Asset Management Limited, Invesco Asset Management (Japan) Limited, Invesco Australia Limited, Invesco Hong Kong Limited, Invesco Senior Secured Management, Inc. and Invesco Canada Ltd. (collectively, the “Affiliated Sub-Advisers”) the Adviser, not the Fund, may pay 40% of the fees paid to the Adviser to any such Affiliated Sub-Adviser(s) that provide(s) discretionary investment management services to the Fund based on the percentage of assets allocated to such Sub-Adviser(s).
The Adviser has contractually agreed, through at least June 30, 2015, to waive advisory fees and/or reimburse expenses to the extent necessary to limit total annual fund operating expenses after fee waiver and/or expense reimbursement (excluding certain items discussed below) of Class A, Class B, Class C, Class R, Class Y, Class R5 and Class R6 shares to 2.00%, 2.75%, 2.75%, 2.25%, 1.75%, 1.75% and 1.75% of average daily net assets, respectively. In determining the Adviser’s obligation to waive advisory fees and/or reimburse expenses, the following expenses are not taken into account, and could cause total annual fund operating expenses after fee waiver and/or expense reimbursement to exceed the numbers reflected above: (1) interest; (2) taxes; (3) dividend expense on short sales; (4) extraordinary or non-routine items, including litigation expenses; and (5) expenses that the Fund has incurred but did not actually pay because of an expense offset arrangement. Unless Invesco continues the fee waiver agreement, it will terminate on June 30, 2015. The fee waiver agreement cannot be terminated during its term. The Adviser did not waive fees and/or reimburse expenses during the period under this expense limitation.
Further, the Adviser has contractually agreed, through at least June 30, 2016, to waive the advisory fee payable by the Fund in an amount equal to 100% of the net advisory fees the Adviser receives from the affiliated money market funds on investments by the Fund of uninvested cash in such affiliated money market funds.
For the year ended August 31, 2014, the Adviser waived advisory fees of $472,141.
The Trust has entered into a master administrative services agreement with Invesco pursuant to which the Fund has agreed to pay Invesco for certain administrative costs incurred in providing accounting services to the Fund. For the year ended August 31, 2014, expenses incurred under the agreement are shown in the Statement of Operations as Administrative services fees.
The Trust has entered into a transfer agency and service agreement with Invesco Investment Services, Inc. (“IIS”) pursuant to which the Fund has agreed to pay IIS a fee for providing transfer agency and shareholder services to the Fund and reimburse IIS for certain expenses incurred by IIS in the course of providing such services. IIS may make payments to intermediaries that provide omnibus account services, sub-accounting services and/or networking services. All fees payable by IIS to intermediaries that provide omnibus account services or sub-accounting are charged back to the Fund, subject to certain limitations approved by the Trust’s Board of Trustees. For the year ended August 31, 2014, expenses incurred under the agreement are shown in the Statement of Operations as Transfer agent fees.
Shares of the Fund are distributed by Invesco Distributors, Inc. (“IDI”). The Fund has adopted a distribution plan pursuant to Rule 12b-1 under the 1940 Act, and a service plan (collectively, the “Plans”) for Class A, Class B, Class C and Class R shares to compensate IDI for the sale, distribution, shareholder servicing and maintenance of shareholder accounts for these shares. Under the Plans, the Fund will incur annual fees of up to 0.25% of Class A average daily net assets, up to 1.00% each of Class B and Class C average daily net assets and up to 0.50% of Class R average daily net assets.
With respect to Class B and Class C shares, the Fund is authorized to reimburse in future years any distribution related expenses that exceed the maximum annual reimbursement rate for such class, so long as such reimbursement does not cause the Fund to exceed the Class B and Class C
16 Invesco Growth and Income Fund
maximum annual reimbursement rate, respectively. With respect to Class A shares, distribution related expenses that exceed the maximum annual reimbursement rate for such class are not carried forward to future years and the Fund will not reimburse IDI for any such expenses.
For the year ended August 31, 2014, expenses incurred under these agreements are shown in the Statement of Operations as Distribution fees.
Front-end sales commissions and CDSC (collectively, the “sales charges”) are not recorded as expenses of the Fund. Front-end sales commissions are deducted from proceeds from the sales of Fund shares prior to investment in Class A shares of the Fund. CDSC are deducted from redemption proceeds prior to remittance to the shareholder. During the year ended August 31, 2014, IDI advised the Fund that IDI retained $531,531 in front-end sales commissions from the sale of Class A shares and $3,853, $28,039 and $6,788 from Class A, Class B and Class C shares, respectively, for CDSC imposed on redemptions by shareholders.
For the year ended August 31, 2014, the Fund incurred $58,635 in brokerage commissions with Invesco Capital Markets, Inc., an affiliate of the Adviser and IDI, for portfolio transactions executed on behalf of the Fund.
Certain officers and trustees of the Trust are officers and directors of the Adviser, IIS and/or IDI.
NOTE 3—Additional Valuation Information
GAAP defines fair value as the price that would be received to sell an asset or paid to transfer a liability in an orderly transaction between market participants at the measurement date, under current market conditions. GAAP establishes a hierarchy that prioritizes the inputs to valuation methods, giving the highest priority to readily available unadjusted quoted prices in an active market for identical assets (Level 1) and the lowest priority to significant unobservable inputs (Level 3), generally when market prices are not readily available or are unreliable. Based on the valuation inputs, the securities or other investments are tiered into one of three levels. Changes in valuation methods may result in transfers in or out of an investment’s assigned level:
| Level 1 — | Prices are determined using quoted prices in an active market for identical assets. |
| Level 2 — | Prices are determined using other significant observable inputs. Observable inputs are inputs that other market participants may use in pricing a security. These may include quoted prices for similar securities, interest rates, prepayment speeds, credit risk, yield curves, loss severities, default rates, discount rates, volatilities and others. |
| Level 3 — | Prices are determined using significant unobservable inputs. In situations where quoted prices or observable inputs are unavailable (for example, when there is little or no market activity for an investment at the end of the period), unobservable inputs may be used. Unobservable inputs reflect the Fund’s own assumptions about the factors market participants would use in determining fair value of the securities or instruments and would be based on the best available information. |
The following is a summary of the tiered valuation input levels, as of August 31, 2014. The level assigned to the securities valuations may not be an indication of the risk or liquidity associated with investing in those securities. Because of the inherent uncertainties of valuation, the values reflected in the financial statements may materially differ from the value received upon actual sale of those investments.
| Level 1 | Level 2 | Level 3 | Total | |||||||||||||
Equity Securities | $ | 9,297,368,640 | $ | 308,225,173 | $ | — | $ | 9,605,593,813 | ||||||||
Options Purchased | 73,375 | — | — | 73,375 | ||||||||||||
| 9,297,442,015 | 308,225,173 | — | 9,605,667,188 | |||||||||||||
Forward Foreign Currency Contracts* | — | 254,244 | — | 254,244 | ||||||||||||
Total Investments | $ | 9,297,442,015 | $ | 308,479,417 | $ | — | $ | 9,605,921,432 | ||||||||
| * | Unrealized appreciation. |
NOTE 4—Derivative Investments
Value of Derivative Investments at Period-End
The table below summarizes the value of the Fund’s derivative investments, detailed by primary risk exposure, held as of August 31, 2014:
| Value | ||||||||
| Risk Exposure/Derivative Type | Assets | Liabilities | ||||||
Currency risk: | ||||||||
Forward foreign currency contracts(a) | $ | 1,698,936 | $ | (1,444,692 | ) | |||
Equity risk: | ||||||||
Put options purchased(b) | 73,375 | — | ||||||
Total | $ | 1,772,311 | $ | (1,444,692 | ) | |||
| (a) | Values are disclosed on the Statement of Assets and Liabilities under the caption Forward foreign currency contracts outstanding. |
| (b) | Options purchased at value as reported in the Schedule of Investments. |
17 Invesco Growth and Income Fund
Effect of Derivative Investments for the year ended August 31, 2014
The table below summarizes the gains (losses) on derivative investments, detailed by primary risk exposure, recognized in earnings during the period:
| Location of Gain (Loss) on Statement of Operations(a) | ||||
| Forward Foreign Currency Contracts | ||||
Realized Gain: | ||||
Currency risk | $ | 4,423,573 | ||
Change in Unrealized Appreciation (Depreciation): | ||||
Currency risk | (1,379,994 | ) | ||
Total | $ | 3,043,579 | ||
| (a) | Options purchased are included in the net change in unrealized appreciation on investment securities. |
The table below summarizes the twelve month average notional value of forward foreign currency contracts and the two month average notional value of options purchased outstanding during the period.
| Forward Foreign Currency Contracts | Options Purchased | |||||||
Average notional value | $ | 674,450,047 | $ | 16,142,500 | ||||
| Open Forward Foreign Currency Contracts at Period-End | ||||||||||||||||||||||||||
Settlement
| Counterparty | Contract to | Notional Value | Unrealized Appreciation (Depreciation) | ||||||||||||||||||||||
| Deliver | Receive | |||||||||||||||||||||||||
9/30/14 | Bank of New York Mellon (The) | CAD | 85,731,358 | USD | 78,201,707 | $ | 78,793,351 | $ | (591,644 | ) | ||||||||||||||||
9/30/14 | State Street Bank & Trust Co. | CAD | 85,811,160 | USD | 78,272,001 | 78,866,695 | (594,694 | ) | ||||||||||||||||||
9/30/14 | Bank of New York Mellon (The) | CHF | 46,951,416 | USD | 51,292,001 | 51,157,207 | 134,794 | |||||||||||||||||||
9/30/14 | State Street Bank & Trust Co. | CHF | 47,008,320 | USD | 51,355,007 | 51,219,208 | 135,799 | |||||||||||||||||||
9/30/14 | Bank of New York Mellon (The) | EUR | 100,080,577 | USD | 132,135,385 | 131,524,760 | 610,625 | |||||||||||||||||||
9/30/14 | State Street Bank & Trust Co. | EUR | 100,157,815 | USD | 132,228,348 | 131,626,266 | 602,082 | |||||||||||||||||||
9/30/14 | Bank of New York Mellon (The) | GBP | 71,024,161 | USD | 117,748,471 | 117,881,343 | (132,872 | ) | ||||||||||||||||||
9/30/14 | State Street Bank & Trust Co. | GBP | 71,062,184 | USD | 117,818,969 | 117,944,451 | (125,482 | ) | ||||||||||||||||||
9/30/14 | Bank of New York Mellon (The) | ILK | 152,181,627 | USD | 42,699,911 | 42,590,367 | 109,544 | |||||||||||||||||||
9/30/14 | State Street Bank & Trust Co. | ILK | 151,871,306 | USD | 42,609,611 | 42,503,519 | 106,092 | |||||||||||||||||||
Total open forward foreign currency contracts — Currency Risk | $ | 254,244 | ||||||||||||||||||||||||
Currency Abbreviations:
| CAD | – Canadian Dollar | |
| CHF | – Swiss Franc | |
| EUR | – Euro | |
| GBP | – British Pound Sterling | |
| ILK | – Israeli Shekel | |
| USD | – U.S. Dollar |
Offsetting Assets and Liabilities
Accounting Standards Update (“ASU”) No. 2011-11, Disclosures about Offsetting Assets and Liabilities, which was subsequently clarified in Financial Accounting Standards Board ASU 2013-01 “Clarifying the Scope of Disclosures about Offsetting Assets and Liabilities” is intended to enhance disclosures about financial instruments and derivative instruments that are subject to offsetting arrangements on the Statement of Assets and Liabilities and to enable investors to better understand the effect of those arrangements on its financial position. In order for an arrangement to be eligible for netting, the Fund must have a basis to conclude that such netting arrangements are legally enforceable. The Fund enters into netting agreements and collateral agreements in an attempt to reduce the Fund’s Counterparty credit risk by providing for a single net settlement with a Counterparty of all financial transactions covered by the agreement in an event of default as defined under such agreement.
18 Invesco Growth and Income Fund
There were no derivative instruments subject to a netting agreement for which the Fund is not currently netting. The following tables present derivative instruments that are either subject to an enforceable netting agreement or offset by collateral arrangements as of August 31, 2014.
| Assets: | ||||||||||||||||||||||||
| Gross amounts presented in Statement of Assets & Liabilities | Gross amounts offset in Statement of Assets & Liabilities | Net amounts of assets presented in the Statement of Assets & Liabilities | Collateral Received | |||||||||||||||||||||
| Counterparty | Financial Instruments | Cash | Net Amount | |||||||||||||||||||||
Bank of New York Mellon (The) | $ | 854,963 | $ | (724,516 | ) | $ | 130,447 | $ | — | $ | — | $ | 130,447 | |||||||||||
State Street Bank & Trust Co. | 843,973 | (720,176 | ) | 123,797 | — | — | 123,797 | |||||||||||||||||
Total | $ | 1,698,936 | $ | (1,444,692 | ) | $ | 254,244 | $ | — | $ | — | $ | 254,244 | |||||||||||
| Liabilities: | ||||||||||||||||||||||||
| Gross amounts presented in Statement of Assets & Liabilities | Gross amounts offset in Statement of Assets & Liabilities | Net amounts of liabilities presented in the Statement of Assets & Liabilities | Collateral Pledged | |||||||||||||||||||||
| Counterparty | Financial Instruments | Cash | Net Amount | |||||||||||||||||||||
Bank of New York Mellon (The) | $ | 724,516 | $ | (724,516 | ) | $ | — | $ | — | $ | — | $ | — | |||||||||||
State Street Bank & Trust Co. | 720,176 | (720,176 | ) | — | — | — | — | |||||||||||||||||
Total | $ | 1,444,692 | $ | (1,444,692 | ) | $ | — | $ | — | $ | — | $ | — | |||||||||||
NOTE 5—Security Transactions with Affiliated Funds
The Fund is permitted to purchase or sell securities from or to certain other Invesco Funds under specified conditions outlined in procedures adopted by the Board of Trustees of the Trust. The procedures have been designed to ensure that any purchase or sale of securities by the Fund from or to another fund or portfolio that is or could be considered an affiliate by virtue of having a common investment adviser (or affiliated investment advisers), common Trustees and/or common officers complies with Rule 17a-7 of the 1940 Act. Further, as defined under the procedures, each transaction is effected at the current market price. Pursuant to these procedures, for the year ended August 31, 2014, the Fund engaged in securities purchases of $3,466,198.
NOTE 6—Expense Offset Arrangement(s)
The expense offset arrangement is comprised of transfer agency credits which result from balances in demand deposit accounts used by the transfer agent for clearing shareholder transactions. For the year ended August 31, 2014, the Fund received credits from this arrangement, which resulted in the reduction of the Fund’s total expenses of $4,959.
NOTE 7—Trustees’ and Officers’ Fees and Benefits
Trustees’ and Officers’ Fees and Benefits include amounts accrued by the Fund to pay remuneration to certain Trustees and Officers of the Fund. Trustees have the option to defer compensation payable by the Fund, and Trustees’ and Officers’ Fees and Benefits also include amounts accrued by the Fund to fund such deferred compensation amounts. Those Trustees who defer compensation have the option to select various Invesco Funds in which their deferral accounts shall be deemed to be invested. Finally, certain current Trustees were eligible to participate in a retirement plan that provided for benefits to be paid upon retirement to Trustees over a period of time based on the number of years of service. The Fund may have certain former Trustees who also participate in a retirement plan and receive benefits under such plan. Trustees’ and Officers’ Fees and Benefits include amounts accrued by the Fund to fund such retirement benefits. Obligations under the deferred compensation and retirement plans represent unsecured claims against the general assets of the Fund.
NOTE 8—Cash Balances
The Fund is permitted to temporarily carry a negative or overdrawn balance in its account with State Street Bank and Trust Company, the custodian bank. Such balances, if any at period end, are shown in the Statement of Assets and Liabilities under the payable caption Amount due custodian. To compensate the custodian bank for such overdrafts, the overdrawn Fund may either (1) leave funds as a compensating balance in the account so the custodian bank can be compensated by earning the additional interest; or (2) compensate by paying the custodian bank at a rate agreed upon by the custodian bank and Invesco, not to exceed the contractually agreed upon rate.
19 Invesco Growth and Income Fund
NOTE 9—Distributions to Shareholders and Tax Components of Net Assets
Tax Character of Distributions to Shareholders Paid During the Years Ended August 31, 2014 and 2013:
| 2014 | 2013 | |||||||
Ordinary income | $ | 119,076,289 | $ | 116,212,173 | ||||
Long-term capital gain | 199,529,274 | — | ||||||
Total distributions | 318,605,563 | 116,212,173 | ||||||
Tax Components of Net Assets at Period-End:
| 2014 | ||||
Undistributed ordinary income | $ | 168,400,547 | ||
Undistributed long-term gain | 529,234,169 | |||
Net unrealized appreciation — investments | 2,802,770,931 | |||
Net unrealized appreciation — other investments | 7,409 | |||
Temporary book/tax differences | (693,149 | ) | ||
Shares of beneficial interest | 6,115,925,162 | |||
Total net assets | $ | 9,615,645,069 | ||
The difference between book-basis and tax-basis unrealized appreciation (depreciation) is due to differences in the timing of recognition of gains and losses on investments for tax and book purposes. The Fund’s net unrealized appreciation difference is attributable primarily to wash sales.
The temporary book/tax differences are a result of timing differences between book and tax recognition of income and/or expenses. The Fund’s temporary book/tax differences are the result of the trustee deferral of compensation and retirement plan benefits.
Capital loss carryforward is calculated and reported as of a specific date. Results of transactions and other activity after that date may affect the amount of capital loss carryforward actually available for the Fund to utilize. Capital losses generated in years beginning after December 22, 2010 can be carried forward for an unlimited period, whereas previous losses expire in 8 tax years. Capital losses with an expiration period may not be used to offset capital gains until all net capital losses without an expiration date have been utilized. Capital loss carryforwards with no expiration date will retain their character as either short-term or long-term capital losses instead of as short-term capital losses as under prior law. The ability to utilize capital loss carryforward in the future may be limited under the Internal Revenue Code and related regulations based on the results of future transactions.
The Fund utilized $3,545,948 of capital loss carryforward in the current period to offset net realized capital gain for federal income tax purposes. The Fund does not have a capital loss carryforward as of August 31, 2014.
NOTE 10—Investment Securities
The aggregate amount of investment securities (other than short-term securities, U.S. Treasury obligations and money market funds, if any) purchased and sold by the Fund during the year ended August 31, 2014 was $2,686,267,917 and $2,846,207,954, respectively. Cost of investments on a tax basis includes the adjustments for financial reporting purposes as of the most recently completed federal income tax reporting period-end.
| Unrealized Appreciation (Depreciation) of Investment Securities on a Tax Basis | ||||
Aggregate unrealized appreciation of investment securities | $ | 2,901,065,663 | ||
Aggregate unrealized (depreciation) of investment securities | (98,294,732 | ) | ||
Net unrealized appreciation of investment securities | $ | 2,802,770,931 | ||
Cost of investments for tax purposes is $6,802,896,257.
NOTE 11—Reclassification of Permanent Differences
Primarily as a result of differing book/tax treatment of excise taxes and foreign currency transactions, on August 31, 2014, undistributed net investment income was increased by $1,075,617, undistributed net realized gain was decreased by $145,682 and shares of beneficial interest was decreased by $929,935. This reclassification had no effect on the net assets of the Fund.
20 Invesco Growth and Income Fund
NOTE 12—Share Information
| Summary of Share Activity | ||||||||||||||||
| Years ended August 31, | ||||||||||||||||
| 2014(a) | 2013 | |||||||||||||||
| Shares | Amount | Shares | Amount | |||||||||||||
Sold: | ||||||||||||||||
Class A | 20,450,645 | $ | 551,400,574 | 21,889,645 | $ | 507,265,364 | ||||||||||
Class B | 55,993 | 1,492,955 | 80,985 | 1,873,907 | ||||||||||||
Class C | 1,054,947 | 28,254,914 | 893,335 | 20,882,198 | ||||||||||||
Class R | 1,443,041 | 39,138,626 | 1,604,065 | 37,088,413 | ||||||||||||
Class Y | 17,406,820 | 473,531,971 | 16,183,091 | 373,292,940 | ||||||||||||
Class R5 | 10,863,248 | 296,409,011 | 11,429,384 | 261,754,743 | ||||||||||||
Class R6(b) | 10,686,110 | 288,760,455 | 14,418,821 | 332,177,637 | ||||||||||||
Issued as reinvestment of dividends: | ||||||||||||||||
Class A | 6,491,884 | 170,525,029 | 2,888,899 | 63,304,665 | ||||||||||||
Class B | 128,924 | 3,358,844 | 78,113 | 1,692,792 | ||||||||||||
Class C | 306,483 | 7,924,492 | 87,511 | 1,872,237 | ||||||||||||
Class R | 225,990 | 5,927,788 | 91,211 | 1,994,223 | ||||||||||||
Class Y | 2,711,161 | 71,425,728 | 1,250,788 | 27,518,735 | ||||||||||||
Class R5 | 1,172,727 | 30,940,210 | 539,320 | 11,863,653 | ||||||||||||
Class R6 | 594,490 | 15,775,850 | 97,673 | 2,246,832 | ||||||||||||
Automatic conversion of Class B shares to Class A shares: | ||||||||||||||||
Class A | 970,672 | 26,486,043 | 1,358,676 | 30,970,994 | ||||||||||||
Class B | (977,570 | ) | (26,486,043 | ) | (1,368,129 | ) | (30,970,994 | ) | ||||||||
Reacquired: | ||||||||||||||||
Class A | (38,227,817 | ) | (1,037,105,295 | ) | (43,134,152 | ) | (976,137,549 | ) | ||||||||
Class B | (465,664 | ) | (12,570,146 | ) | (822,250 | ) | (18,457,407 | ) | ||||||||
Class C | (1,545,384 | ) | (41,796,527 | ) | (1,805,148 | ) | (40,311,395 | ) | ||||||||
Class R | (2,330,503 | ) | (63,468,535 | ) | (2,054,646 | ) | (46,926,619 | ) | ||||||||
Class Y | (18,798,733 | ) | (510,114,541 | ) | (17,592,305 | ) | (401,917,676 | ) | ||||||||
Class R5 | (10,842,356 | ) | (297,770,652 | ) | (17,151,492 | ) | (375,020,738 | ) | ||||||||
Class R6 | (2,670,780 | ) | (73,147,977 | ) | (1,080,798 | ) | (26,243,960 | ) | ||||||||
Net increase (decrease) in share activity | (1,295,672 | ) | $ | (51,107,226 | ) | (12,117,403 | ) | $ | (240,187,005 | ) | ||||||
| (a) | There are entities that are record owners of more than 5% of the outstanding shares of the Fund and in the aggregate own 34% of the outstanding shares of the Fund. IDI has an agreement with these entities to sell Fund shares. The Fund, Invesco and/or Invesco affiliates may make payments to these entities, which are considered to be related to the Fund, for providing services to the Fund, Invesco and/or Invesco affiliates including but not limited to services such as securities brokerage, distribution, third party record keeping and account servicing. The Fund has no knowledge as to whether all or any portion of the shares owned of record by these entities are also owned beneficially. |
| (b) | Commencement date of September 24, 2012. |
21 Invesco Growth and Income Fund
NOTE 13—Financial Highlights
The following schedule presents financial highlights for a share of the Fund outstanding throughout the periods indicated.
| Net asset value, beginning of period | Net investment income(a) | Net gains (losses) on securities (both realized and unrealized) | Total from investment operations | Dividends from net investment income | Distributions from net realized gains | Total distributions | Net asset value, end of period | Total return | Net assets, end of period (000’s omitted) | Ratio of expenses to average net assets with fee waivers and/or expenses absorbed | Ratio of expenses to average net assets without fee waivers and/or expenses absorbed | Ratio of net investment income to average net assets | Portfolio turnover(b) | |||||||||||||||||||||||||||||||||||||||||||
Class A |
| |||||||||||||||||||||||||||||||||||||||||||||||||||||||
Year ended 08/31/14 | $ | 24.92 | $ | 0.55 | (c) | $ | 4.78 | $ | 5.33 | $ | (0.33 | ) | $ | (0.62 | ) | $ | (0.95 | ) | $ | 29.30 | 21.84 | %(d) | $ | 5,302,375 | 0.83 | %(e) | 0.84 | %(e) | 2.03 | %(c)(e) | 31 | % | ||||||||||||||||||||||||
Year ended 08/31/13 | 20.48 | 0.31 | 4.47 | 4.78 | (0.34 | ) | — | (0.34 | ) | 24.92 | 23.57 | (d) | 4,766,860 | 0.81 | 0.82 | 1.37 | 29 | |||||||||||||||||||||||||||||||||||||||
Year ended 08/31/12 | 18.01 | 0.32 | 2.42 | 2.74 | (0.27 | ) | — | (0.27 | ) | 20.48 | 15.33 | (d) | 4,266,135 | 0.83 | 0.84 | 1.66 | 25 | |||||||||||||||||||||||||||||||||||||||
Year ended 08/31/11 | 16.06 | 0.24 | 1.91 | 2.15 | (0.20 | ) | — | (0.20 | ) | 18.01 | 13.37 | (d) | 4,149,537 | 0.83 | 0.84 | 1.23 | 23 | |||||||||||||||||||||||||||||||||||||||
Nine months 08/31/10 | 17.19 | 0.18 | (1.13 | ) | (0.95 | ) | (0.18 | ) | — | (0.18 | ) | 16.06 | (5.60 | )(d) | 4,122,779 | 0.74 | (f) | 0.74 | (f) | 1.36 | (f) | 23 | ||||||||||||||||||||||||||||||||||
Year ended 11/30/09 | 13.87 | 0.23 | 3.34 | 3.57 | (0.25 | ) | — | (0.25 | ) | 17.19 | 26.24 | (g) | 4,496,159 | 0.88 | 0.88 | 1.58 | 51 | |||||||||||||||||||||||||||||||||||||||
Class B | ||||||||||||||||||||||||||||||||||||||||||||||||||||||||
Year ended 08/31/14 | 24.75 | 0.54 | (c) | 4.75 | 5.29 | (0.32 | ) | (0.62 | ) | (0.94 | ) | 29.10 | 21.86 | (d)(h) | 82,970 | 0.83 | (e)(h) | 0.84 | (e)(h) | 2.03 | (c)(e)(h) | 31 | ||||||||||||||||||||||||||||||||||
Year ended 08/31/13 | 20.34 | 0.31 | 4.44 | 4.75 | (0.34 | ) | — | (0.34 | ) | 24.75 | 23.57 | (d)(h) | 101,723 | 0.81 | (h) | 0.82 | (h) | 1.37 | (h) | 29 | ||||||||||||||||||||||||||||||||||||
Year ended 08/31/12 | 17.88 | 0.31 | 2.41 | 2.72 | (0.26 | ) | — | (0.26 | ) | 20.34 | 15.37 | (d)(h) | 124,930 | 0.81 | (h) | 0.82 | (h) | 1.68 | (h) | 25 | ||||||||||||||||||||||||||||||||||||
Year ended 08/31/11 | 15.93 | 0.23 | 1.90 | 2.13 | (0.18 | ) | — | (0.18 | ) | 17.88 | 13.36 | (d)(h) | 173,129 | 0.83 | (h) | 0.84 | (h) | 1.23 | (h) | 23 | ||||||||||||||||||||||||||||||||||||
Nine months 08/31/10 | 17.05 | 0.16 | (1.12 | ) | (0.96 | ) | (0.16 | ) | — | (0.16 | ) | 15.93 | (5.69 | )(d)(h) | 231,193 | 0.89 | (f)(h) | 0.89 | (f)(h) | 1.21 | (f)(h) | 23 | ||||||||||||||||||||||||||||||||||
Year ended 11/30/09 | 13.76 | 0.22 | 3.32 | 3.54 | (0.25 | ) | — | (0.25 | ) | 17.05 | 26.32 | (i)(j) | 320,577 | 0.89 | (j) | 0.89 | (j) | 1.59 | (j) | 51 | ||||||||||||||||||||||||||||||||||||
Class C |
| |||||||||||||||||||||||||||||||||||||||||||||||||||||||
Year ended 08/31/14 | 24.68 | 0.34 | (c) | 4.73 | 5.07 | (0.12 | ) | (0.62 | ) | (0.74 | ) | 29.01 | 20.94 | (d) | 334,902 | 1.58 | (e) | 1.59 | (e) | 1.28 | (c)(e) | 31 | ||||||||||||||||||||||||||||||||||
Year ended 08/31/13 | 20.29 | 0.14 | 4.42 | 4.56 | (0.17 | ) | — | (0.17 | ) | 24.68 | 22.63 | (d) | 289,458 | 1.56 | 1.57 | 0.62 | 29 | |||||||||||||||||||||||||||||||||||||||
Year ended 08/31/12 | 17.84 | 0.18 | 2.40 | 2.58 | (0.13 | ) | — | (0.13 | ) | 20.29 | 14.53 | (d)(k) | 254,679 | 1.55 | (k) | 1.56 | (k) | 0.94 | (k) | 25 | ||||||||||||||||||||||||||||||||||||
Year ended 08/31/11 | 15.91 | 0.09 | 1.90 | 1.99 | (0.06 | ) | — | (0.06 | ) | 17.84 | 12.52 | (d)(k) | 258,606 | 1.57 | (k) | 1.58 | (k) | 0.49 | (k) | 23 | ||||||||||||||||||||||||||||||||||||
Nine months 08/31/10 | 17.03 | 0.08 | (1.12 | ) | (1.04 | ) | (0.08 | ) | — | (0.08 | ) | 15.91 | (6.13 | )(d) | 269,051 | 1.49 | (f) | 1.49 | (f) | 0.61 | (f) | 23 | ||||||||||||||||||||||||||||||||||
Year ended 11/30/09 | 13.74 | 0.12 | 3.32 | 3.44 | (0.15 | ) | — | (0.15 | ) | 17.03 | 25.36 | (j)(l) | 316,283 | 1.62 | (j) | 1.62 | (j) | 0.84 | (j) | 51 | ||||||||||||||||||||||||||||||||||||
Class R |
| |||||||||||||||||||||||||||||||||||||||||||||||||||||||
Year ended 08/31/14 | 24.93 | 0.48 | (c) | 4.78 | 5.26 | (0.26 | ) | (0.62 | ) | (0.88 | ) | 29.31 | 21.53 | (d) | 181,301 | 1.08 | (e) | 1.09 | (e)�� | 1.78 | (c)(e) | 31 | ||||||||||||||||||||||||||||||||||
Year ended 08/31/13 | 20.49 | 0.25 | 4.47 | 4.72 | (0.28 | ) | — | (0.28 | ) | 24.93 | 23.26 | (d) | 170,691 | 1.06 | 1.07 | 1.12 | 29 | |||||||||||||||||||||||||||||||||||||||
Year ended 08/31/12 | 18.02 | 0.27 | 2.42 | 2.69 | (0.22 | ) | — | (0.22 | ) | 20.49 | 15.03 | (d) | 147,659 | 1.08 | 1.09 | 1.41 | 25 | |||||||||||||||||||||||||||||||||||||||
Year ended 08/31/11 | 16.07 | 0.19 | 1.92 | 2.11 | (0.16 | ) | — | (0.16 | ) | 18.02 | 13.08 | (d) | 147,453 | 1.08 | 1.09 | 0.98 | 23 | |||||||||||||||||||||||||||||||||||||||
Nine months 08/31/10 | 17.19 | 0.14 | (1.11 | ) | (0.97 | ) | (0.15 | ) | — | (0.15 | ) | 16.07 | (5.72 | )(d) | 122,188 | 0.99 | (f) | 0.99 | (f) | 1.11 | (f) | 23 | ||||||||||||||||||||||||||||||||||
Year ended 11/30/09 | 13.87 | 0.18 | 3.35 | 3.53 | (0.21 | ) | — | (0.21 | ) | 17.19 | 26.00 | (m) | 107,371 | 1.13 | 1.13 | 1.29 | 51 | |||||||||||||||||||||||||||||||||||||||
Class Y |
| |||||||||||||||||||||||||||||||||||||||||||||||||||||||
Year ended 08/31/14 | 24.94 | 0.62 | (c) | 4.78 | 5.40 | (0.39 | ) | (0.62 | ) | (1.01 | ) | 29.33 | 22.17 | (d) | 2,186,472 | 0.58 | (e) | 0.59 | (e) | 2.28 | (c)(e) | 31 | ||||||||||||||||||||||||||||||||||
Year ended 08/31/13 | 20.50 | 0.37 | 4.47 | 4.84 | (0.40 | ) | — | (0.40 | ) | 24.94 | 23.86 | (d) | 1,826,646 | 0.56 | 0.57 | 1.62 | 29 | |||||||||||||||||||||||||||||||||||||||
Year ended 08/31/12 | 18.03 | 0.36 | 2.42 | 2.78 | (0.31 | ) | — | (0.31 | ) | 20.50 | 15.60 | (d) | 1,504,586 | 0.58 | 0.59 | 1.91 | 25 | |||||||||||||||||||||||||||||||||||||||
Year ended 08/31/11 | 16.08 | 0.28 | 1.92 | 2.20 | (0.25 | ) | — | (0.25 | ) | 18.03 | 13.64 | (d) | 1,544,968 | 0.58 | 0.59 | 1.48 | 23 | |||||||||||||||||||||||||||||||||||||||
Nine months 08/31/10 | 17.21 | 0.21 | (1.13 | ) | (0.92 | ) | (0.21 | ) | — | (0.21 | ) | 16.08 | (5.41 | )(d) | 1,206,652 | 0.49 | (f) | 0.49 | (f) | 1.61 | (f) | 23 | ||||||||||||||||||||||||||||||||||
Year ended 11/30/09 | 13.88 | 0.26 | 3.35 | 3.61 | (0.28 | ) | — | (0.28 | ) | 17.21 | 26.60 | (n) | 1,095,692 | 0.63 | 0.63 | 1.81 | 51 | |||||||||||||||||||||||||||||||||||||||
Class R5 |
| |||||||||||||||||||||||||||||||||||||||||||||||||||||||
Year ended 08/31/14 | 24.97 | 0.65 | (c) | 4.78 | 5.43 | (0.42 | ) | (0.62 | ) | (1.04 | ) | 29.36 | 22.27 | (d) | 880,275 | 0.47 | (e) | 0.48 | (e) | 2.39 | (c)(e) | 31 | ||||||||||||||||||||||||||||||||||
Year ended 08/31/13 | 20.53 | 0.39 | 4.47 | 4.86 | (0.42 | ) | — | (0.42 | ) | 24.97 | 23.96 | (d) | 718,816 | 0.47 | 0.48 | 1.71 | 29 | |||||||||||||||||||||||||||||||||||||||
Year ended 08/31/12 | 18.05 | 0.39 | 2.43 | 2.82 | (0.34 | ) | — | (0.34 | ) | 20.53 | 15.80 | (d) | 697,346 | 0.46 | 0.47 | 2.03 | 25 | |||||||||||||||||||||||||||||||||||||||
Year ended 08/31/11 | 16.08 | 0.32 | 1.92 | 2.24 | (0.27 | ) | — | (0.27 | ) | 18.05 | 13.87 | (d) | 307,338 | 0.39 | 0.40 | 1.67 | 23 | |||||||||||||||||||||||||||||||||||||||
Nine months 08/31/10(o) | 16.48 | 0.05 | (0.39 | ) | (0.34 | ) | (0.06 | ) | — | (0.06 | ) | 16.08 | (2.05 | )(d) | 41,861 | 0.45 | (f) | 0.45 | (f) | 1.31 | (f) | 23 | ||||||||||||||||||||||||||||||||||
Class R6 |
| |||||||||||||||||||||||||||||||||||||||||||||||||||||||
Year ended 08/31/14 | 24.97 | 0.68 | (c) | 4.78 | 5.46 | (0.45 | ) | (0.62 | ) | (1.07 | ) | 29.36 | 22.38 | (d) | 647,350 | 0.38 | (e) | 0.39 | (e) | 2.48 | (c)(e) | 31 | ||||||||||||||||||||||||||||||||||
Year ended 08/31/13(o) | 21.23 | 0.43 | 3.66 | 4.09 | (0.35 | ) | — | (0.35 | ) | 24.97 | 19.45 | (d) | 335,549 | 0.38 | (f) | 0.38 | (f) | 1.80 | (f) | 29 | ||||||||||||||||||||||||||||||||||||
| (a) | Calculated using average shares outstanding. |
| (b) | Portfolio turnover is calculated at the fund level and is not annualized for periods less than one year, if applicable. For year ended August 31, 2011, the portfolio turnover calculation excludes the value of securities purchased of $138,016,999 and sold of $13,000,923 in the effort to realign the Fund’s portfolio holdings after the reorganization of Invesco Fundamental Value Fund & Invesco Large Cap Relative Value Fund into the Fund. |
| (c) | Net investment income per share and the ratio of net investment income to average net assets includes significant dividends received during the period. Net investment income per share and the ratio of net investment income to average net assets excluding the significant dividends are $0.34 and 1.24%, $0.33 and 1.24%, $0.13 and 0.49%, $0.27 and 0.99%, $0.41 and 1.49%, $0.44 and 1.60% and $0.47 and 1.69% for Class A, Class B, Class C, Class R, Class Y, Class R5 and Class R6 shares, respectively. |
| (d) | Includes adjustments in accordance with accounting principles generally accepted in the United States of America and as such, the net asset value for financial reporting purposes and the returns based upon those net asset values may differ from the net asset value and returns for shareholder transactions. Does not include sales charges and is not annualized for periods less than one year, if applicable. |
| (e) | Ratios are based on average daily net assets (000’s omitted) of $5,121,125, $94,775, $318,218, $180,795, $2,016,621, $829,549 and $497,574 for Class A, Class B, Class C, Class R, Class Y, Class R5 and Class R6 shares, respectively. |
| (f) | Annualized. |
| (g) | Assumes reinvestment of all distributions for the period and does not include payment of the maximum sales charge of 5.75% or contingent deferred sales charge (CDSC). On purchases of $1 million or more, a CDSC of 1% may be imposed on certain redemptions made within eighteen months of purchase. If the sales charges were included, total returns would be lower. These returns include combined Rule 12b-1 fees and service fees of up to 0.25% and do not reflect the deduction of taxes that a shareholder would pay on Fund distributions or the redemption of Fund shares. |
| (h) | The total return, ratio of expenses to average net assets and ratio of net investment income to average net assets reflect actual 12b-1 fees of 0.25%, 0.25%, 0.23%, 0.25% and 0.40% for the years ended August 31, 2014, 2013, 2012 and 2011 and the nine months ended August 31, 2010, respectively. |
| (i) | Assumes reinvestment of all distributions for the period and does not include payment of the maximum CDSC of 5%, charged on certain redemptions made within one year of purchase and declining to 0% after the fifth year. If the sales charge was included, total returns would be lower. These returns include combined Rule 12b-1 fees and service fees of up to 1% and do not reflect the deduction of taxes that a shareholder would pay on Fund distributions or the redemption of Fund shares. |
| (j) | The total return, ratio of expenses to average net assets and ratio of net investment income (loss) to average net assets reflect actual 12b-1 fees of less than 1%. |
22 Invesco Growth and Income Fund
| (k) | The total return, ratio of expenses to average net assets and ratio of net investment income (loss) to average net assets reflect actual 12b-1 fees of 0.97% and 0.99% for the years ended August 31, 2012 and 2011, respectively. |
| (l) | Assumes reinvestment of all distributions for the period and does not include payment of the maximum CDSC of 1%, charged on certain redemptions made within one year of purchase. If the sales charge was included, total returns would be lower. These returns include combined Rule 12b-1 fees and service fees of up to 1% and do not reflect the deduction of taxes that a shareholder would pay on Fund distributions or the redemption of Fund shares. |
| (m) | Assumes reinvestment of all distributions for the period. These returns include combined Rule 12b-1 fees and service fees of up to 0.50% and do not reflect the deduction of taxes that a shareholder would pay on Fund distributions or the redemption on Fund shares. |
| (n) | Assumes reinvestment of all distributions for the period. These returns do not reflect the deduction of taxes that a shareholder would pay on Fund distributions or the redemption on Fund shares. |
| (o) | Commencement date of June 1, 2010 and September 24, 2012 for Class R5 and Class R6 shares, respectively. |
23 Invesco Growth and Income Fund
Report of Independent Registered Public Accounting Firm
To the Board of Trustees of AIM Counselor Series Trust (Invesco Counselor Series Trust)
and Shareholders of Invesco Growth and Income Fund:
In our opinion, the accompanying statement of assets and liabilities, including the schedule of investments, and the related statements of operations and of changes in net assets and the financial highlights present fairly, in all material respects, the financial position of Invesco Growth and Income Fund (one of the funds constituting AIM Counselor Series Trust (Invesco Counselor Series Trust), hereafter referred to as the “Fund”) at August 31, 2014, the results of its operations for the year then ended, the changes in its net assets for each of the two years in the period then ended and the financial highlights for each of the four years in the period then ended and the nine month period ended August 31, 2010, in conformity with accounting principles generally accepted in the United States of America. These financial statements and financial highlights (hereafter referred to as “financial statements”) are the responsibility of the Fund’s management. Our responsibility is to express an opinion on these financial statements based on our audits. We conducted our audits of these financial statements in accordance with the standards of the Public Company Accounting Oversight Board (United States). Those standards require that we plan and perform the audit to obtain reasonable assurance about whether the financial statements are free of material misstatement. An audit includes examining, on a test basis, evidence supporting the amounts and disclosures in the financial statements, assessing the accounting principles used and significant estimates made by management, and evaluating the overall financial statement presentation. We believe that our audits, which included confirmation of securities at August 31, 2014 by correspondence with the custodian and brokers, provide a reasonable basis for our opinion. The financial highlights of the Fund for the year ended November 30, 2009 were audited by another independent registered public accounting firm whose report dated January 22, 2010 expressed an unqualified opinion on such financial statement.
PRICEWATERHOUSECOOPERS LLP
October 27, 2014
Houston, Texas
24 Invesco Growth and Income Fund
Calculating your ongoing Fund expenses
Example
As a shareholder of the Fund, you incur two types of costs: (1) transaction costs, which may include sales charges (loads) on purchase payments or contingent deferred sales charges on redemptions, if any; and (2) ongoing costs, including management fees, distribution and/or service (12b-1) fees, and other Fund expenses. This example is intended to help you understand your ongoing costs (in dollars) of investing in the Fund and to compare these costs with ongoing costs of investing in other mutual funds. The example is based on an investment of $1,000 invested at the beginning of the period and held for the entire period March 1, 2014 through August 31, 2014.
Actual expenses
The table below provides information about actual account values and actual expenses. You may use the information in this table, together with the amount you invested, to estimate the expenses that you paid over the period. Simply divide your account value by $1,000 (for example, an $8,600 account value divided by $1,000 = 8.6), then multiply the result by the number in the table under the heading entitled “Actual Expenses Paid During Period” to estimate the expenses you paid on your account during this period.
Hypothetical example for comparison purposes
The table below also provides information about hypothetical account values and hypothetical expenses based on the Fund’s actual expense ratio and an assumed rate of return of 5% per year before expenses, which is not the Fund’s actual return.
The hypothetical account values and expenses may not be used to estimate the actual ending account balance or expenses you paid for the period. You may use this information to compare the ongoing costs of investing in the Fund and other funds. To do so, compare this 5% hypothetical example with the 5% hypothetical examples that appear in the shareholder reports of the other funds.
Please note that the expenses shown in the table are meant to highlight your ongoing costs only and do not reflect any transaction costs, such as sales charges (loads) on purchase payments or contingent deferred sales charges on redemptions, if any. Therefore, the hypothetical information is useful in comparing ongoing costs only, and will not help you determine the relative total costs of owning different funds. In addition, if these transaction costs were included, your costs would have been higher.
| Class | Beginning Account Value (03/01/14) | ACTUAL | HYPOTHETICAL (5% annual return before | Annualized Expense Ratio | ||||||||||||||||||||
| Ending Account Value (08/31/14)1 | Expenses Paid During Period2 | Ending Account Value (08/31/14) | Expenses Paid During Period2 | |||||||||||||||||||||
| A | $ | 1,000.00 | $ | 1,078.80 | $ | 4.35 | $ | 1,021.02 | $ | 4.23 | 0.83 | % | ||||||||||||
| B | 1,000.00 | 1,078.60 | 4.35 | 1,021.02 | 4.23 | 0.83 | ||||||||||||||||||
| C | 1,000.00 | 1,074.50 | 8.26 | 1,017.24 | 8.03 | 1.58 | ||||||||||||||||||
| R | 1,000.00 | 1,077.10 | 5.65 | 1,019.76 | 5.50 | 1.08 | ||||||||||||||||||
| Y | 1,000.00 | 1,080.10 | 3.04 | 1,022.28 | 2.96 | 0.58 | ||||||||||||||||||
| R5 | 1,000.00 | 1,080.60 | 2.52 | 1,022.79 | 2.45 | 0.48 | ||||||||||||||||||
| R6 | 1,000.00 | 1,080.80 | 2.05 | 1,023.24 | 1.99 | 0.39 | ||||||||||||||||||
| 1 | The actual ending account value is based on the actual total return of the Fund for the period March 1, 2014 through August 31, 2014, after actual expenses and will differ from the hypothetical ending account value which is based on the Fund’s expense ratio and a hypothetical annual return of 5% before expenses. |
| 2 | Expenses are equal to the Fund’s annualized expense ratio as indicated above multiplied by the average account value over the period, multiplied by 184/365 to reflect the most recent fiscal half year. |
25 Invesco Growth and Income Fund
Approval of Investment Advisory and Sub-Advisory Contracts
The Board of Trustees (the Board) of AIM Counselor Series Trust (Invesco Counselor Series Trust) is required under the Investment Company Act of 1940, as amended, to approve annually the renewal of Invesco Growth and Income Fund’s (the Fund) investment advisory agreements. During contract renewal meetings held on June 16-17, 2014, the Board as a whole, and the disinterested or “independent” Trustees, who comprise over 75% of the Board, voting separately, approved the continuance for the Fund of the Master Investment Advisory Agreement with Invesco Advisers, Inc. (Invesco Advisers) and the Master Intergroup Sub-Advisory Contract for Mutual Funds with Invesco Asset Management Deutschland GmbH, Invesco Asset Management Limited, Invesco Asset Management (Japan) Limited, Invesco Australia Limited, Invesco Hong Kong Limited, Invesco Senior Secured Management, Inc. and Invesco Canada Ltd. (collectively, the Affiliated Sub-Advisers and the sub-advisory contracts) for another year, effective July 1, 2014.
In evaluating the fairness and reasonableness of compensation under the Fund’s investment advisory agreement and sub-advisory contracts, the Board considered, among other things, the factors discussed below. The Board determined that continuation of the Fund’s investment advisory agreement and the sub-advisory contracts are in the best interest of the Fund and its shareholders and that the compensation payable to Invesco Advisers and the Affiliated Sub-Advisers under the agreements is fair and reasonable.
The Board’s Fund Evaluation Process
The Board’s Investments Committee has established three Sub-Committees, each of which is primarily responsible for overseeing the management of a number of the funds advised by Invesco Advisers (the Invesco Funds). The Sub-Committees meet throughout the year to review the performance of their assigned Invesco Funds, including reviewing materials prepared under the direction of the independent Senior Officer, an officer of the Invesco Funds who reports directly to the independent Trustees. Over the course of each year, the Sub-Committees meet with portfolio managers for their assigned Invesco Funds and other members of management to review the performance, investment objective(s), policies, strategies, limitations and investment risks of these funds. The Sub-Committees meet regularly and at designated contract renewal meetings each year to conduct a review of the performance, fees, expenses and other matters related to their assigned Invesco Funds. Each Sub-Committee recommends to the Investments Committee, which in turn recommends to the full Board, whether and on what terms to approve the continuance of each Invesco Fund’s investment advisory agreement and sub-advisory contracts for another year.
During the contract renewal process, the Trustees receive comparative performance and fee data regarding the Invesco Funds prepared by Invesco Advisers and Lipper Inc. (Lipper), an independent provider of investment company data. The Trustees also receive an independent written evaluation from the Senior Officer. The Senior Officer’s evaluation is prepared as part of his responsibility to manage the process by which the Invesco Funds’ proposed management fees are negotiated during the annual contract renewal process to ensure they are negotiated in a manner that is at arms’ length and reasonable. In addition to meetings with Invesco Advisers and fund counsel, the independent Trustees also discuss the continuance of the investment advisory agreement and sub-advisory contracts in separate sessions with the Senior Officer and with independent legal counsel.
The Trustees recognized that the advisory fee rates for the Invesco Funds are, in many cases, the result of years of review and negotiation. The Trustees’ deliberations and conclusions in a particular year may be based in part on their deliberations and conclusions regarding these same arrangements throughout the year and in prior years. The Trustees’ review and conclusions are based on the comprehensive consideration of all information presented to them and are not the result of any single determinative factor. Moreover, one Trustee may have weighed a particular piece of information or factor differently than another Trustee.
The discussion below serves as the Senior Officer’s independent written evaluation with respect to the Fund’s investment advisory agreement as well as a discussion of the material factors and related conclusions that formed the basis for the Board’s approval of the Fund’s investment advisory agreement and sub-advisory contracts. Unless otherwise stated, this information is current as of June 17, 2014, and may not reflect consideration of factors that became known to the Board after that date.
Factors and Conclusions and Summary of Independent Written Fee Evaluation
| A. | Nature, Extent and Quality of Services Provided by Invesco Advisers and the Affiliated Sub-Advisers |
The Board reviewed the advisory services provided to the Fund by Invesco Advisers under the Fund’s investment advisory agreement, the performance of Invesco Advisers in providing these services, and the credentials and experience of the officers and employees of Invesco Advisers who provide these services, including the Fund’s portfolio manager or managers, with whom the Sub-Committees met during the year. The Board’s review of the qualifications of Invesco Advisers to provide advisory services included the Board’s consideration of Invesco Advisers’ investment process oversight, independent credit analysis
and investment risk management. The Board also considered non-advisory services that Invesco Advisers and its affiliates provide to the Invesco Funds such as various back office support functions, equity and fixed income trading operations, internal audit, distribution and legal and compliance.
In determining whether to continue the Fund’s investment advisory agreement, the Board considered the benefits of reapproving an existing relationship and the greater uncertainty that may be associated with entering into a new relationship. The Board concluded that the nature, extent and quality of the services provided to the Fund by Invesco Advisers are appropriate and satisfactory and consistent with the terms of the Fund’s investment advisory agreement.
The Board reviewed the services that may be provided by the Affiliated Sub-Advisers under the sub-advisory contracts and the credentials and experience of the officers and employees of the Affiliated Sub-Advisers who provide these services. The Board noted that the Affiliated Sub-Advisers have offices and personnel that are located in financial centers around the world. As a result, the Affiliated Sub-Advisers can provide research and investment analysis on the markets and economies of various countries in which the Fund may invest, make recommendations regarding securities and assist with security trades. The Board concluded that the sub-advisory contracts benefit the Fund and its shareholders by permitting Invesco Advisers to use the resources and talents of the Affiliated Sub-Advisers in managing the Fund. The Board concluded that the nature, extent and quality of the services that may be provided by the Affiliated Sub-Advisers are appropriate and satisfactory and consistent with the terms of the Fund’s sub-advisory contracts.
| B. | Fund Performance |
The Board considered Fund performance as a relevant factor in considering whether to approve the investment advisory agreement. The Board did not view Fund performance as a relevant factor in considering whether to approve the sub-advisory contracts for the Fund, as no Affiliated Sub-Adviser currently manages assets of the Fund.
The Board compared the Fund’s performance during the past one, three and five calendar years to the performance of funds in the Lipper performance universe and against the Lipper Large-Cap Value Funds Index. The Board noted that performance of Class A shares of the Fund was in the second quintile of its performance universe for the one year period and the third quintile for the three and five year periods (the first quintile being the best performing funds and the fifth quintile being the worst performing funds). The Board noted that performance of Class A shares of the Fund was above the performance of the Index for the one year period
26 Invesco Growth and Income Fund
and below the performance of the Index for the three and five year periods. The Trustees also reviewed more recent Fund performance and this review did not change their conclusions.
| C. | Advisory and Sub-Advisory Fees |
The Board compared the Fund’s contractual management fee rate to the contractual management fee rates of funds in the Fund’s Lipper expense group at a common asset level. The Board noted that the contractual management fee rate for Class A shares of the Fund was below the median contractual management fee rate of funds in the expense group. The Board noted that the term “contractual management fee” may include both advisory and certain administrative services fees, but that Lipper does not provide information on a fund by fund basis as to what is included. The Board noted that Invesco Advisers does not charge the Invesco Funds for the administrative services included in the term as defined by Lipper. The Board also reviewed the methodology used by Lipper in providing expense group information, which includes using each fund’s contractual management fee schedule (including any applicable breakpoints) as reported in the most recent prospectus or statement of additional information for each fund in the expense group.
The Board noted that Invesco Advisers has contractually agreed to waive fees and/or limit expenses of the Fund through at least June 30, 2015 in an amount necessary to limit total annual operating expenses to a specified percentage of average daily net assets for each class of the Fund.
The Board also compared the Fund’s effective advisory fee rate (the advisory fee rate after advisory fee waivers and before other expense limitations/waivers) to the effective advisory fee rates of other mutual funds advised by Invesco Advisers and its affiliates that are managed using an investment process substantially similar to the investment process used for the Fund. The Board noted that the Fund’s rate was below the rate of one such mutual fund and below the sub-adviser effective rate for one mutual fund and above the sub-adviser effective rate for another mutual fund sub-advised by Invesco Advisers using a similar investment process.
The Board also considered the fees charged by Invesco Advisers and the Affiliated Sub-Advisers to other client accounts that are managed using an investment process substantially similar to the investment process used for the Fund. The Board noted that Invesco Advisers or the Affiliated Sub-Advisers may charge lower fees to large institutional clients. Invesco Advisers reviewed with the Board the significantly greater scope of services it provides to the Invesco Funds relative to certain other client accounts. These additional services include provision of administrative services, officers and office space, oversight of service providers, preparation of annual registration statement updates and financial information and regulatory compliance under the Investment Company Act of 1940, as amended. Invesco Advisers also reviewed generally the higher frequency of shareholder purchases and
redemptions in the Invesco Funds relative to the flow of assets for other client accounts. Invesco Advisers advised the Board that advance notice of redemptions is often provided to Invesco Advisers by institutional clients. The Board did note that sub-advisory fee rates charged by the Affiliated Sub-Advisers to manage the Invesco Funds and to manage other client accounts tended to be more comparable, reflecting a more comparable scope of services. The Board concluded that the aggregate services provided to the Invesco Funds were sufficiently different from those provided to institutional clients to support the difference in fees.
The Board also considered the services that may be provided by the Affiliated Sub-Advisers pursuant to the sub-advisory contracts, as well as the fees payable by Invesco Advisers to the Affiliated Sub-Advisers pursuant to the sub-advisory contracts. The Board also noted that the sub-advisory fees are not paid directly by the Fund, but rather, are payable by Invesco Advisers to the Affiliated Sub-Advisers.
| D. | Economies of Scale and Breakpoints |
The Board considered the extent to which there are economies of scale in the provision of advisory services to the Fund. The Board also considered whether the Fund benefits from economies of scale through contractual breakpoints in the Fund’s advisory fee schedule and was assisted in this review by a report from the Senior Officer. The Board also noted that the Fund shares directly in economies of scale through lower fees charged by third party service providers based on the combined size of the Invesco Funds and other clients advised by Invesco Advisers.
| E. | Profitability and Financial Resources |
The Board reviewed information from Invesco Advisers concerning the costs of the advisory and other services that Invesco Advisers and its affiliates provide to the Fund and the profitability of Invesco Advisers and its affiliates in providing these services for the year ended December 31, 2013. The Board received information from Invesco Advisers about the methodology used to prepare the profitability information. The Board considered the profitability of Invesco Advisers in managing the Fund and the Invesco Funds. The Board noted that Invesco Advisers continues to operate at a net profit from services Invesco Advisers and its subsidiaries provide to the Invesco Funds and the Fund. The Board did not deem the level of profits realized by Invesco Advisers and its affiliates from providing services to the Fund to be excessive given the nature, quality and extent of the services provided to the Invesco Funds. The Board received and accepted information from Invesco Advisers demonstrating that Invesco Advisers and each Affiliated Sub-Adviser are financially sound and have the resources necessary to perform their obligations under the investment advisory agreement and sub-advisory contracts.
| F. | Collateral Benefits to Invesco Advisers and its Affiliates |
The Board considered various other benefits received by Invesco Advisers and its affiliates from
the relationship with the Fund, including the fees received for their provision of transfer agency and distribution services to the Fund. The Board considered comparative information regarding fees charged for these services, including information provided by Lipper and other independent sources. The Board considered the performance of Invesco Advisers and its affiliates in providing these services and the organizational structure employed to provide these services. The Board also considered that these services are provided to the Fund pursuant to written contracts that are reviewed and approved on an annual basis by the Board; that the services are required for the operation of the Fund; that Invesco Advisers and its affiliates can provide services, the nature and quality of which are at least equal to those provided by others offering the same or similar services; and that the fees for such services are fair and reasonable in light of the usual and customary charges by others for services of the same nature and quality.
The Board considered the benefits realized by Invesco Advisers and the Affiliated Sub-Advisers as a result of portfolio brokerage transactions executed through “soft dollar” arrangements. The Board noted that soft dollar arrangements shift the payment obligation for research services from Invesco Advisers and the Affiliated Sub-Advisers to the Invesco Funds and that the research received may be used with other clients of Invesco Advisers and may reduce Invesco Advisers’ and the Affiliated Sub-Advisers’ expenses. The Board also considered that it receives periodic reports from the Chief Compliance Officer of the Invesco Funds demonstrating that these arrangements are consistent with regulatory requirements. The Board did not deem the soft dollar arrangements to be inappropriate.
The Board considered that the Fund’s uninvested cash and cash collateral from any securities lending arrangements may be invested in money market funds advised by Invesco Advisers pursuant to procedures approved by the Board. The Board noted that Invesco Advisers receives advisory fees from these affiliated money market funds attributable to such investments, although Invesco Advisers has contractually agreed to waive through varying periods the advisory fees payable by the Invesco Funds with respect to investments in the affiliated money market funds. The waiver is in an amount equal to 100% of the net advisory fee Invesco Advisers receives from the affiliated money market funds with respect to the Fund’s investment in the affiliated money market funds of uninvested cash, but not cash collateral. The Board concluded that the amount of advisory fees received by Invesco Advisors from the Fund’s investment of uninvested cash and cash collateral from any securities lending arrangements in the affiliated money market funds are fair and reasonable.
The Board also considered the Fund may use an affiliated broker to execute certain trades for the Fund to among other things, control information leakage, and were advised that such trades would be executed in compliance with rules under the Investment Company Act of 1940, as amended.
27 Invesco Growth and Income Fund
Tax Information
Form 1099-DIV, Form 1042-S and other year–end tax information provide shareholders with actual calendar year amounts that should be included in their tax returns. Shareholders should consult their tax advisors.
The following distribution information is being provided as required by the Internal Revenue Code or to meet a specific state’s requirement.
The Fund designates the following amounts or, if subsequently determined to be different, the maximum amount allowable for its fiscal year ended August 31, 2014:
Federal and State Income Tax | ||||
Long-Term Capital Gain Distributions | $ | 199,529,274 | ||
Qualified Dividend Income* | 100.00 | % | ||
Corporate Dividends Received Deduction* | 70.82 | % | ||
U.S. Treasury Obligations* | 0.00 | % | ||
| * | The above percentages are based on ordinary income dividends paid to shareholders during the Fund’s fiscal year. |
Non-Resident Alien Shareholders | ||||
Qualified Short-Term Gains | $ | 4,031,510 | ||
28 Invesco Growth and Income Fund
Trustees and Officers
The address of each trustee and officer is AIM Counselor Series Trust (Invesco Counselor Series Trust) (the “Trust”), 11 Greenway Plaza, Suite 1000, Houston, Texas 77046-1173. The trustees serve for the life of the Trust, subject to their earlier death, incapacitation, resignation, retirement or removal as more specifically provided in the Trust’s organizational documents. Each officer serves for a one year term or until their successors are elected and qualified. Column two below includes length of time served with predecessor entities, if any.
Name, Year of Birth and Position(s) Held with the Trust | Trustee and/ or Officer Since | Principal Occupation(s) During Past 5 Years | Number of Funds in Fund Complex Overseen by Trustee | Other Directorship(s) Held by Trustee During Past 5 Years | ||||
| Interested Persons | ||||||||
Martin L. Flanagan1 — 1960 Trustee | 2007 | Executive Director, Chief Executive Officer and President, Invesco Ltd. (ultimate parent of Invesco and a global investment management firm); Advisor to the Board, Invesco Advisers, Inc. (formerly known as Invesco Institutional (N.A.), Inc.); Trustee, The Invesco Funds; Vice Chair, Investment Company Institute; and Member of Executive Board, SMU Cox School of Business.
Formerly: Chairman and Chief Executive Officer, Invesco Advisers, Inc. (registered investment adviser); Director, Chairman, Chief Executive Officer and President, IVZ Inc. (holding company), INVESCO Group Services, Inc. (service provider) and Invesco North American Holdings, Inc. (holding company); Director, Chief Executive Officer and President, Invesco Holding Company Limited (parent of Invesco and a global investment management firm); Director, Invesco Ltd.; Chairman, Investment Company Institute and President, Co-Chief Executive Officer, Co-President, Chief Operating Officer and Chief Financial Officer, Franklin Resources, Inc. (global investment management organization). | 141 | None | ||||
Philip A. Taylor2 — 1954 Trustee, President and Principal Executive Officer | 2006 | Head of North American Retail and Senior Managing Director, Invesco Ltd.; Director, Co-Chairman, Co-President and Co-Chief Executive Officer, Invesco Advisers, Inc. (formerly known as Invesco Institutional (N.A.), Inc.) (registered investment adviser); Director, Chairman, Chief Executive Officer and President, Invesco Management Group, Inc. (formerly known as Invesco Aim Management Group, Inc.) (financial services holding company); Director and President, INVESCO Funds Group, Inc. (registered investment adviser and registered transfer agent); Director and Chairman, Invesco Investment Services, Inc. (formerly known as Invesco Aim Investment Services, Inc.) (registered transfer agent) and IVZ Distributors, Inc. (formerly known as INVESCO Distributors, Inc.) (registered broker dealer); Director, President and Chairman, Invesco Inc. (holding company) and Invesco Canada Holdings Inc. (holding company); Chief Executive Officer, Invesco Corporate Class Inc. (corporate mutual fund company) and Invesco Canada Fund Inc. (corporate mutual fund company); Director, Chairman and Chief Executive Officer, Invesco Canada Ltd. (formerly known as Invesco Trimark Ltd./Invesco Trimark Ltèe) (registered investment adviser and registered transfer agent); Trustee, President and Principal Executive Officer, The Invesco Funds (other than AIM Treasurer’s Series Trust (Invesco Treasurer’s Series Trust) and Short-Term Investments Trust); Trustee and Executive Vice President, The Invesco Funds (AIM Treasurer’s Series Trust (Invesco Treasurer’s Series Trust) and Short-Term Investments Trust only); Director, Invesco Investment Advisers LLC (formerly known as Van Kampen Asset Management); Director, Chief Executive Officer and President, Van Kampen Exchange Corp.
Formerly: Director and Chairman, Van Kampen Investor Services Inc.; Director, Chief Executive Officer and President, 1371 Preferred Inc. (holding company) and Van Kampen Investments Inc.; Director and President, AIM GP Canada Inc. (general partner for limited partnerships) and Van Kampen Advisors, Inc.; Director and Chief Executive Officer, Invesco Trimark Dealer Inc. (registered broker dealer); Director, Invesco Distributors, Inc. (formerly known as Invesco Aim Distributors, Inc.) (registered broker dealer); Manager, Invesco PowerShares Capital Management LLC; Director, Chief Executive Officer and President, Invesco Advisers, Inc.; Director, Chairman, Chief Executive Officer and President, Invesco Aim Capital Management, Inc.; President, Invesco Trimark Dealer Inc. and Invesco Trimark Ltd./Invesco Trimark Ltèe; Director and President, AIM Trimark Corporate Class Inc. and AIM Trimark Canada Fund Inc.; Senior Managing Director, Invesco Holding Company Limited; Director and Chairman, Fund Management Company (former registered broker dealer); President and Principal Executive Officer, The Invesco Funds (AIM Treasurer’s Series Trust (Invesco Treasurer’s Series Trust), and Short-Term Investments Trust only); President, AIM Trimark Global Fund Inc. and AIM Trimark Canada Fund Inc. | 141 | None | ||||
Wayne W. Whalen3 — 1939 Trustee | 2010 | Of Counsel, and prior to 2010, partner in the law firm of Skadden, Arps, Slate, Meagher & Flom LLP, legal counsel to certain funds in the Fund Complex
| 141 | Director of the Mutual fund Directors Forum, a nonprofit membership organization for investment directors; Chairman and Director of the Abraham Lincoln Presidential Library Foundation; and Director of the Stevenson Center for Democracy |
| 1 | Mr. Flanagan is considered an interested person (within the meaning of Section 2(a)(19) of the 1940 Act) of the Trust because he is an officer of the Adviser to the Trust, and an officer and a director of Invesco Ltd., ultimate parent of the Adviser. |
| 2 | Mr. Taylor is considered an interested person (within the meaning of Section 2(a)(19) of the 1940 Act) of the Trust because he is an officer and a director of the Adviser. |
| 3 | Mr. Whalen is retiring effective December 31, 2014. He has been deemed to be an interested person of the Trust because of his prior service as counsel to the predecessor funds of certain Invesco open-end funds and his affiliation with the law firm that served as counsel to such predecessor funds and the Invesco closed-end funds. |
T-1 Invesco Growth and Income Fund
Trustees and Officers—(continued)
Name, Year of Birth and Position(s) Held with the Trust | Trustee and/ or Officer Since | Principal Occupation(s) During Past 5 Years | Number of Funds in Fund Complex Overseen by Trustee | Other Directorship(s) Past 5 Years | ||||
| Independent Trustees | ||||||||
Bruce L. Crockett — 1944 Trustee and Chair | 2003 | Chairman, Crockett Technologies Associates (technology consulting company)
Formerly: Director, Captaris (unified messaging provider); Director, President and Chief Executive Officer, COMSAT Corporation; Chairman, Board of Governors of INTELSAT (international communications company); ACE Limited (insurance company); and Investment Company Institute | 141 | ALPS (Attorneys Liability Protection Society) (insurance company) | ||||
David C. Arch — 1945 Trustee | 2010 | Chairman of Blistex Inc., a consumer health care products manufacturer | 141 | Board member of the Illinois Manufacturers’ Association; Member of the Board of Visitors, Institute for the Humanities, University of Michigan; Member of the Audit Committee of the Edward-Elmhurst Hospital | ||||
Frank S. Bayley — 1939 Trustee | 2003 | Retired. Formerly: Director, Badgley Funds Inc. (registered investment company) (2 portfolios) and General Partner and Of Counsel, law firm of Baker & McKenzie, LLP | 141 | Director and Chairman, C.D. Stimson Company (a real estate investment company); Trustee, The Curtis Institute of Music | ||||
James T. Bunch — 1942 Trustee | 2000 | Managing Member, Grumman Hill Group LLC (family office private equity investments)
Formerly: Founder, Green Manning & Bunch Ltd. (investment banking firm) (1988-2010); Executive Committee, United States Golf Association; and Director, Policy Studies, Inc. and Van Gilder Insurance Corporation | 141 | Chairman, Board of Governors, Western Golf Association; Chairman, Evans Scholars Foundation; and Director, Denver Film Society | ||||
Rodney F. Dammeyer — 1940 Trustee | 2010 | Chairman of CAC, LLC, (private company offering capital investment and management advisory services)
Formerly: Prior to 2001, Managing Partner at Equity Group Corporate Investments; Prior to 1995, Chief Executive Officer of Itel Corporation (formerly Anixter International); Prior to 1985, experience includes Senior Vice President and Chief Financial Officer of Household International, Inc., Executive Vice President and Chief Financial Officer of Northwest Industries, Inc. and Partner of Arthur Andersen & Co.; From 1987 to 2010, Director/Trustee of investment companies in the Van Kampen Funds complex | 141 | Director of Quidel Corporation and Stericycle, Inc. | ||||
Albert R. Dowden — 1941 Trustee | 2003 | Director of a number of public and private business corporations, including the Boss Group, Ltd. (private investment and management); Nature’s Sunshine Products, Inc. and Reich & Tang Funds (5 portfolios) (registered investment company)
Formerly: Director, Homeowners of America Holding Corporation/Homeowners of America Insurance Company (property casualty company); Director, Continental Energy Services, LLC (oil and gas pipeline service); Director, CompuDyne Corporation (provider of product and services to the public security market) and Director, Annuity and Life Re (Holdings), Ltd. (reinsurance company); Director, President and Chief Executive Officer, Volvo Group North America, Inc.; Senior Vice President, AB Volvo; Director of various public and private corporations; Chairman, DHJ Media, Inc.; Director, Magellan Insurance Company; and Director, The Hertz Corporation, Genmar Corporation (boat manufacturer), National Media Corporation; Advisory Board of Rotary Power International (designer, manufacturer, and seller of rotary power engines); and Chairman, Cortland Trust, Inc. (registered investment company) | 141 | Director of: Nature’s Sunshine Products, Inc., Reich & Tang Funds, Homeowners of America Holding Corporation/ Homeowners of America Insurance Company, the Boss Group | ||||
Jack M. Fields — 1952 Trustee | 2003 | Chief Executive Officer, Twenty First Century Group, Inc. (government affairs company); Owner and Chief Executive Officer, Dos Angeles Ranch, L.P. (cattle, hunting, corporate entertainment); and Discovery Global Education Fund (non-profit)
Formerly: Chief Executive Officer, Texana Timber LP (sustainable forestry company); Director of Cross Timbers Quail Research Ranch (non-profit); and member of the U.S. House of Representatives | 141 | Insperity, Inc. (formerly known as Administaff) | ||||
Prema Mathai-Davis — 1950 Trustee | 2003 | Retired. Formerly: Chief Executive Officer, YWCA of the U.S.A. | 141 | None | ||||
Larry Soll — 1942 Trustee | 1997 | Retired. Formerly: Chairman, Chief Executive Officer and President, Synergen Corp. (a biotechnology company) | 141 | None | ||||
Hugo F. Sonnenschein — 1940 Trustee | 2010 | President Emeritus and Honorary Trustee of the University of Chicago and the Adam Smith Distinguished Service Professor in the Department of Economics at the University of Chicago. Prior to 2000, President of the University of Chicago | 141 | Trustee of the University of Rochester and a member of its investment committee; Member of the National Academy of Sciences and the American Philosophical Society; Fellow of the American Academy of Arts and Sciences |
T-2 Invesco Growth and Income Fund
Trustees and Officers—(continued)
Name, Year of Birth and Position(s) Held with the Trust | Trustee and/ or Officer Since | Principal Occupation(s) During Past 5 Years | Number of Funds in Fund Complex Overseen by Trustee | Other Directorship(s) Past 5 Years | ||||
| Independent Trustees—(continued) | ||||||||
Raymond Stickel, Jr. — 1944 Trustee | 2005 | Retired. Formerly: Director, Mainstay VP Series Funds, Inc. (25 portfolios) and Partner, Deloitte & Touche | 141 | None | ||||
Suzanne H. Woolsey — 1941 Trustee | 2014 | Chief Executive Officer of Woolsey Partners LLC | 141 | Emeritus Chair of the Board of Trustees of the Institute for Defense Analyses; Trustee of Colorado College; Trustee of California Institute of Technology; Prior to 2014, Director of Fluor Corp.; Prior to 2010, Trustee of the German Marshall Fund of the United States; Prior to 2010 Trustee of the Rocky Mountain Institute | ||||
| Other Officers | ||||||||
Russell C. Burk — 1958 Senior Vice President and Senior Officer | 2005 | Senior Vice President and Senior Officer, The Invesco Funds | N/A | N/A | ||||
John M. Zerr — 1962 Senior Vice President, Chief Legal Officer and Secretary | 2006 | Director, Senior Vice President, Secretary and General Counsel, Invesco Management Group, Inc. (formerly known as Invesco Aim Management Group, Inc.) and Van Kampen Exchange Corp.; Senior Vice President, Invesco Advisers, Inc. (formerly known as Invesco Institutional (N.A.), Inc.) (registered investment adviser); Senior Vice President and Secretary, Invesco Distributors, Inc. (formerly known as Invesco Aim Distributors, Inc.); Director, Vice President and Secretary, Invesco Investment Services, Inc. (formerly known as Invesco Aim Investment Services, Inc.) and IVZ Distributors, Inc. (formerly known as INVESCO Distributors, Inc.); Director and Vice President, INVESCO Funds Group, Inc.; Senior Vice President, Chief Legal Officer and Secretary, The Invesco Funds; Manager, Invesco PowerShares Capital Management LLC; Director, Secretary and General Counsel, Invesco Investment Advisers LLC (formerly known as Van Kampen Asset Management); Secretary and General Counsel, Invesco Capital Markets, Inc. (formerly known as Van Kampen Funds Inc.) and Chief Legal Officer, PowerShares Exchange-Traded Fund Trust, PowerShares Exchange-Traded Fund Trust II, PowerShares India Exchange-Traded Fund Trust and PowerShares Actively Managed Exchange-Traded Fund Trust
Formerly: Director and Vice President, Van Kampen Advisors Inc.; Director, Vice President, Secretary and General Counsel, Van Kampen Investor Services Inc.; Director, Invesco Distributors, Inc. (formerly known as Invesco Aim Distributors, Inc.); Director, Senior Vice President, General Counsel and Secretary, Invesco Aim Advisers, Inc. and Van Kampen Investments Inc.; Director, Vice President and Secretary, Fund Management Company; Director, Senior Vice President, Secretary, General Counsel and Vice President, Invesco Aim Capital Management, Inc.; Chief Operating Officer and General Counsel, Liberty Ridge Capital, Inc. (an investment adviser); Vice President and Secretary, PBHG Funds (an investment company) and PBHG Insurance Series Fund (an investment company); Chief Operating Officer, General Counsel and Secretary, Old Mutual Investment Partners (a broker-dealer); General Counsel and Secretary, Old Mutual Fund Services (an administrator) and Old Mutual Shareholder Services (a shareholder servicing center); Executive Vice President, General Counsel and Secretary, Old Mutual Capital, Inc. (an investment adviser); and Vice President and Secretary, Old Mutual Advisors Funds (an investment company) | N/A | N/A | ||||
Sheri Morris — 1964 Vice President, Treasurer and Principal Financial Officer | 2003 | Vice President, Treasurer and Principal Financial Officer, The Invesco Funds; Vice President, Invesco Advisers, Inc. (formerly known as Invesco Institutional (N.A.), Inc.) (registered investment adviser); and Vice President, PowerShares Exchange-Traded Fund Trust, PowerShares Exchange-Traded Fund Trust II, PowerShares India Exchange-Traded Fund Trust and PowerShares Actively Managed Exchange-Traded Fund Trust
Formerly: Vice President, Invesco Aim Advisers, Inc., Invesco Aim Capital Management, Inc. and Invesco Aim Private Asset Management, Inc.; Assistant Vice President and Assistant Treasurer, The Invesco Funds and Assistant Vice President, Invesco Advisers, Inc., Invesco Aim Capital Management, Inc. and Invesco Aim Private Asset Management, Inc.; and Treasurer, PowerShares Exchange-Traded Fund Trust, PowerShares Exchange-Traded Fund Trust II, PowerShares India Exchange-Traded Fund Trust and PowerShares Actively Managed Exchange-Traded Fund Trust | N/A | N/A | ||||
T-3 Invesco Growth and Income Fund
Trustees and Officers—(continued)
Name, Year of Birth and Position(s) Held with the Trust | Trustee and/ or Officer Since | Principal Occupation(s) During Past 5 Years | Number of Funds in Fund Complex Overseen by Trustee | Other Directorship(s) Past 5 Years | ||||
| Other Officers—(continued) | ||||||||
Karen Dunn Kelley — 1960 Vice President | 2003 | Senior Managing Director, Investments; Director, Co-President, Co-Chief Executive Officer, and Co-Chairman, Invesco Advisers, Inc. (formerly known as Invesco Institutional (N.A.), Inc.) (registered investment adviser); Chairman, Invesco Senior Secured Management, Inc.; Senior Vice President, Invesco Management Group, Inc. (formerly known as Invesco Aim Management Group, Inc.); Executive Vice President, Invesco Distributors, Inc. (formerly known as Invesco Aim Distributors, Inc.); Director, Invesco Mortgage Capital Inc. and Invesco Management Company Limited; Director and President, INVESCO Asset Management (Bermuda) Ltd., Vice President, The Invesco Funds (other than AIM Treasurer’s Series Trust (Invesco Treasurer’s Series Trust) and Short-Term Investments Trust); and President and Principal Executive Officer, The Invesco Funds (AIM Treasurer’s Series Trust (Invesco Treasurer’s Series Trust) and Short-Term Investments Trust only)
Formerly: Director, INVESCO Global Asset Management Limited and INVESCO Management S.A.; Senior Vice President, Van Kampen Investments Inc. and Invesco Advisers, Inc. (formerly known as Invesco Institutional (N.A.), Inc.) (registered investment adviser); Vice President, Invesco Advisers, Inc. (formerly known as Invesco Institutional (N.A.), Inc.); Director of Cash Management and Senior Vice President, Invesco Advisers, Inc. and Invesco Aim Capital Management, Inc.; Director and President, Fund Management Company; Chief Cash Management Officer, Director of Cash Management, Senior Vice President, and Managing Director, Invesco Aim Capital Management, Inc.; Director of Cash Management, Senior Vice President, and Vice President, Invesco Advisers, Inc. and The Invesco Funds (AIM Treasurer’s Series Trust (Invesco Treasurer’s Series Trust), and Short-Term Investments Trust only) | N/A | N/A | ||||
Crissie M. Wisdom — 1969 Anti-Money Laundering Compliance Officer | 2013 | Anti-Money Laundering Compliance Officer, Invesco Advisers, Inc. (formerly known as Invesco Institutional (N.A.), Inc.) (registered investment adviser), Invesco Capital Markets, Inc. (formerly known as Van Kampen Funds Inc.), Invesco Distributors, Inc., Invesco Investment Services, Inc., Invesco Management Group, Inc., Van Kampen Exchange Corp., The Invesco Funds, and PowerShares Exchange-Traded Fund Trust, PowerShares Exchange-Traded Fund Trust II, PowerShares India Exchange-Traded Fund Trust, and PowerShares Actively Managed Exchange-Traded Fund Trust; and Fraud Prevention Manager and Controls and Risk Analysis Manager for Invesco Investment Services, Inc. | N/A | N/A | ||||
Todd L. Spillane — 1958 Chief Compliance Officer | 2006 | Senior Vice President, Invesco Management Group, Inc. (formerly known as Invesco Aim Management Group, Inc.) and Van Kampen Exchange Corp.; Senior Vice President and Chief Compliance Officer, Invesco Advisers, Inc. (registered investment adviser) (formerly known as Invesco Institutional (N.A.), Inc.); Chief Compliance Officer, The Invesco Funds; Vice President, Invesco Distributors, Inc. (formerly known as Invesco Aim Distributors, Inc.) and Invesco Investment Services, Inc. (formerly known as Invesco Aim Investment Services, Inc.)
Formerly: Chief Compliance Officer, Invesco Funds (Chicago); Senior Vice President, Van Kampen Investments Inc.; Senior Vice President and Chief Compliance Officer, Invesco Aim Advisers, Inc. and Invesco Aim Capital Management, Inc.; Chief Compliance Officer, INVESCO Private Capital Investments, Inc. (holding company), Invesco Private Capital, Inc. (registered investment adviser), Invesco Global Asset Management (N.A.), Inc., Invesco Senior Secured Management, Inc. (registered investment adviser), Van Kampen Investor Services Inc., PowerShares Exchange-Traded Fund Trust, PowerShares Exchange-Traded Fund Trust II, PowerShares India Exchange-Traded Fund Trust and PowerShares Actively Managed Exchange-Traded Fund Trust; and Vice President, Invesco Aim Capital Management, Inc. and Fund Management Company | N/A | N/A |
The Statement of Additional Information of the Trust includes additional information about the Fund’s Trustees and is available upon request, without charge, by calling 1.800.959.4246. Please refer to the Fund’s prospectus for information on the Fund’s sub-advisers.
Office of the Fund 11 Greenway Plaza, Suite 1000 Houston, TX 77046-1173 | Investment Adviser Invesco Advisers, Inc. 1555 Peachtree Street, N.E. Atlanta, GA 30309 | Distributor Invesco Distributors, Inc. 11 Greenway Plaza, Suite 1000 Houston, TX 77046-1173 | Auditors PricewaterhouseCoopers LLP 1201 Louisiana Street, Suite 2900 Houston, TX 77002-5678 | |||
Counsel to the Fund Stradley Ronon Stevens & Young, LLP 2005 Market Street, Suite 2600 Philadelphia, PA 19103-7018 | Counsel to the Independent Trustees Goodwin Procter LLP 901 New York Avenue, N.W. Washington, D.C. 20001 | Transfer Agent Invesco Investment Services, Inc. 11 Greenway Plaza, Suite 1000 Houston, TX 77046-1173 | Custodian State Street Bank and Trust Company 225 Franklin Street Boston, MA 02110-2801 | |||
T-4 Invesco Growth and Income Fund

Invesco mailing information
Send general correspondence to Invesco Investment Services, Inc., P.O. Box 219078, Kansas City, MO 64121-9078.
Important notice regarding delivery of security holder documents
To reduce Fund expenses, only one copy of most shareholder documents may be mailed to shareholders with multiple accounts at the same address (Householding). Mailing of your shareholder documents may be householded indefinitely unless you instruct us otherwise. If you do not want the mailing of these documents to be combined with those for other members of your household, please contact Invesco Investment Services, Inc. at 800 959 4246 or contact your financial institution. We will begin sending you individual copies for each account within 30 days after receiving your request.
Fund holdings and proxy voting information
The Fund provides a complete list of its holdings four times in each fiscal year, at the quarter ends. For the second and fourth quarters, the lists appear in the Fund’s semiannual and annual reports to shareholders. For the first and third quarters, the Fund files the lists with the Securities and Exchange Commission (SEC) on Form N-Q. The most recent list of portfolio holdings is available at invesco.com/completeqtrholdings. Shareholders can also look up the Fund’s Forms N-Q on the SEC website at sec.gov. Copies of the Fund’s Forms N-Q may be reviewed and copied at the SEC Public Reference Room in Washington, D.C. You can obtain information on the operation of the Public Reference Room, including information about duplicating fee charges, by calling 202 551 8090 or 800 732 0330, or by electronic request at the following email address: publicinfo@sec.gov. The SEC file numbers for the Fund are shown below.
A description of the policies and procedures that the Fund uses to determine how to vote proxies relating to portfolio securities is available without charge, upon request, from our Client Services department at 800 959 4246 or at invesco.com/proxyguidelines. The information is also available on the SEC website, sec.gov.
Information regarding how the Fund voted proxies related to its portfolio securities during the most Invesco Advisers, Inc. is an investment adviser; it provides investment advisory services to |  |
| SEC file numbers: 811-09913 and 333-36074 | VK-GRI-AR-1 | Invesco Distributors, Inc. |
Letters to Shareholders
Philip Taylor | Dear Shareholders: This annual report includes information about your Fund, including performance data and a com- plete list of its investments as of the close of the reporting period. Inside, your Fund’s portfolio managers discuss how they managed your Fund and the factors that affected its performance during the reporting period. I hope you find this report of interest. During the reporting period covered by this report, the US economy showed signs of continued improvement. After contracting in the first quarter of 2014, the economy expanded strongly in the second quarter and unemployment trended lower. Much of the credit for this improvement goes to the US Federal Reserve (the Fed), which undertook an extraordinary asset purchase program following the global financial crisis. The Fed’s goal was to jumpstart the economy by encouraging banks to lend more, businesses to hire more and consumers to spend more. Signs of a stronger US economy prompted the Fed to reduce, or “taper,” its asset purchase program. Despite this, |

interest rates remained near historical low levels due largely to heavy investor demand for bonds. While signs of economic improvement were evident in the US, European economies remained relatively stagnant. During the reporting period, high unemployment persisted, worries about potential deflation grew, and uncertainty about Russian-Ukrainian tensions weighed on European markets.
Extended periods of market strength can lull investors into complacency – just as prolonged periods of market weakness or volatility can discourage investors from initiating long-term investment plans. That’s why Invesco has always encouraged investors to work with a professional financial adviser who can stress the importance of starting to save and invest early and the importance of adhering to a disciplined investment plan – when times are good and when they’re uncertain. A financial adviser who knows your unique financial situation, investment goals and risk tolerance can be an invaluable partner as you seek to achieve your financial goals. He or she can offer a long-term perspective when markets are volatile and time-tested advice and guidance when your financial situation or investment goals change.
Timely information when and where you want it
Invesco’s efforts to help investors achieve their financial objectives include providing individual investors and financial professionals with timely information about the markets, the economy and investing – whenever and wherever they want it.
Our website, invesco.com/us, offers a wide range of market insights and investment perspectives. On the website, you’ll find detailed information about our funds, including prices, performance, holdings and portfolio manager commentaries. You can access information about your individual Invesco account whenever it’s convenient for you; just complete a simple, secure online registration. Use the “Login” box on our home page to get started.
Invesco’s mobile app for iPad® (available free from the App StoreSM) allows you to obtain the same detailed information about your Fund and the same investment insights from our investment leaders, market strategists, economists and retirement experts on the go. You also can watch portfolio manager videos and have instant access to Invesco news and updates wherever you may be.
In addition to the resources accessible on our website and through our mobile app, you can obtain timely updates to help you stay informed about the markets, the economy and investing by connecting with Invesco on Twitter, LinkedIn or Facebook. You can access our blog at blog.invesco.us.com or by clicking the “Intentional Investing Forum” link on our home page. Our goal is to provide you the information you want, when and where you want it.
Have questions?
For questions about your account, feel free to contact an Invesco client services representative at 800 959 4246. For Invesco-related questions or comments, please email me directly at phil@invesco.com.
All of us at Invesco look forward to serving your investment management needs for many years to come. Thank you for investing with us.
Sincerely,

Philip Taylor
Senior Managing Director, Invesco Ltd.
iPad is a trademark of Apple Inc., registered in the US and other countries. App Store is a service mark of Apple Inc. Invesco Distributors, Inc. is not affiliated with Apple Inc.
2 Invesco Low Volatility Equity Yield Fund
Bruce Crockett | Dear Fellow Shareholders: There are a variety of factors that can impact investment performance, many of which are uncontrollable by us as investors. These factors can include various economic trends and geopolitical developments. While the members of the Invesco Funds Board, which I chair, can’t dictate the performance of the Invesco funds, be assured that your Board works diligently throughout the year to focus on how your investments are managed. Our job is to represent you and your interests on a variety of fund management-related matters. We regularly monitor how the portfolio management teams of the Invesco funds are performing in light of ever-changing and often unpredictable economic and market conditions. We review the investment strategies and investment process employed by each fund’s management team as explained in the fund’s prospectus. Perhaps our most significant responsibility is conducting the annual review of the funds’ |

advisory and sub-advisory contracts with Invesco Advisers and its affiliates. This annual review, which is required by the Investment Company Act of 1940, focuses on the nature and quality of the services Invesco provides as the adviser to the Invesco funds and the reasonableness of the fees that it charges for those services. Each year, we spend months carefully reviewing information from Invesco that allows us to evaluate the quality of its services and the reasonableness of its fees. We also use information from a variety of independent sources, including materials provided by the independent senior officer of the Invesco funds, who reports directly to the independent trustees on the Board. Additionally, we meet with legal counsel and review performance and fee data prepared for us by Lipper Inc., an independent, third-party firm widely recognized as a leader in its field.
After a careful review, the members of the Invesco Funds Board approved the continuation of advisory and sub-advisory contracts with Invesco Advisers and its affiliates. Be assured that your Board will continue working on behalf of fund shareholders, keeping your needs and interests uppermost in our minds.
As always, please contact me at bruce@brucecrockett.com with any questions or concerns you may have. On behalf of the Board, we look forward to continuing to represent your interests and serving your needs.
Sincerely,

Bruce L. Crockett
Independent Chair
Invesco Funds Board of Trustees
3 Invesco Low Volatility Equity Yield Fund
Management’s Discussion of Fund Performance
Performance summary
For the fiscal year ended August 31, 2014, Invesco Low Volatility Equity Yield Fund, at net asset value (NAV), underperformed the S&P 500 Index but outperformed the Lipper Equity Income Index. The consumer staples, financials, industrials, information technology (IT) and telecommunication services sectors contributed the most to the Fund’s positive relative performance. The consumer discretionary, energy and health care sectors detracted from overall Fund performance.
Your Fund’s long-term performance appears later in this report.
Fund vs. Indexes
Total returns, 8/31/13 to 8/31/14, at net asset value (NAV). Performance shown does not include applicable contingent deferred sales charges (CDSC) or front-end sales charges, which would have reduced performance.
Class A Shares | 22.91 | % | ||
Class B Shares | 22.08 | |||
Class C Shares | 22.01 | |||
Class R Shares | 22.60 | |||
Class Y Shares | 23.24 | |||
Investor Class Shares | 22.95 | |||
Class R5 Shares | 23.48 | |||
S&P 500 Indexq (Broad Market Index) | 25.25 | |||
Russell 1000 Indexq (Style-Specific Index) | 25.36 | |||
Lipper Equity Income Indexn (Peer Group Index) | 21.47 |
Source(s): qFactSet Research Systems Inc.; nLipper Inc.
How we invest
The Fund seeks to provide income and long-term growth of capital by investing, typically, at least 80% of its net assets (plus any borrowings for investment purposes) in equity securities, and in derivatives and other instruments that have economic characteristics similar to such securities.
The investment team utilizes a comprehensive, “total return” approach seeking the benefits of integrating the desired outcomes of price appreciation, high income and low volatility. This is achieved by using a bottom-up, disciplined investment process in which returns are driven by a successful, long-standing stock
selection model based on four investment concepts:
| n | Earnings Expectations (how are expectations changing?) |
| n | Market Sentiment (what is market sentiment telling us?) |
| n | Management and Quality (what is management doing?) |
| n | Value (how attractive are valuations?) |
The team employs a low volatility approach to construct the portfolio with freedom from index constraints, creating a wider opportunity set with the freedom to seek the highest level of return and generate income (dividend yield) for a lower level of total risk relative to the style-specific index.
Market conditions and your Fund
US equity market indexes generally rose during the fiscal year ended August 31, 2014. Corporate earnings were resilient in the face of modest economic growth, driven by strong profitability across many sectors, and fundamentals for corporations and consumers remained relatively positive. However, the fiscal year began amid uncertainty created by a two-week federal government shutdown. Despite this and the announcement by the US Federal Reserve (the Fed) in December that it would begin reducing the scope of its asset purchase program in early 2014, US equities rallied through the end of 2013. The market turned volatile in the first months of 2014 as investors began to worry that stocks may have risen too far, too fast. While political upheaval in Ukraine and signs of economic sluggishness in the US and China contributed to investor uncertainty, economic data remained strong enough that the Fed continued to reduce its asset purchase program on schedule. The continued “good but not great” economic environment and historically low interest rates generally led stocks higher throughout the end of the fiscal year.
All sectors in the Fund and the Fund’s broad market index posted positive returns for the reporting period. Stock selection in the consumer staples, IT, financials and industrials sectors was particularly strong. Telecommunication services and IT holdings also aided in the Fund’s absolute positive performance. Stock selection in the consumer discretionary, health care, energy and materials sectors was a drag on overall performance.
In the IT sector, Hewlett Packard, Intel, Seagate Technology and Windstream Holdings were a few of the Fund’s largest contributors to
Portfolio Composition
By sector
Financials | 20.5 | % | ||
Utilities | 16.8 | |||
Energy | 15.9 | |||
Information Technology | 13.0 | |||
Industrials | 8.5 | |||
Telecommunication Services | 6.0 | |||
Health Care | 5.3 | |||
Consumer Staples | 5.0 | |||
Consumer Discretionary | 3.9 | |||
Materials | 2.1 | |||
U.S. Treasury Bills, Plus Money | ||||
Market Funds, Plus Other Assets | ||||
Less Liabilities | 3.0 |
Top 10 Equity Holdings
1. Hewlett-Packard Co. | 2.0 | % | ||
2. Apple Inc. | 1.9 | |||
3. CenturyLink Inc. | 1.8 | |||
4. Windstream Holdings Inc. | 1.8 | |||
5. Cisco Systems, Inc. | 1.8 | |||
6. Encana Corp. | 1.8 | |||
7. AT&T Inc. | 1.7 | |||
8. Raytheon Co. | 1.7 | |||
9. Suncor Energy, Inc. | 1.7 | |||
10. Entergy Corp. | 1.7 |
Total Net Assets | $ | 364.2 million | ||
Total Number of Holdings* | 113 | |||
The Fund’s holdings are subject to change, and there is no assurance that the Fund will continue to hold any particular security.
*Excluding money market fund holdings.
| 4 Invesco Low Volatility Equity Yield Fund |
performance. Hewlett-Packard’s solid balance sheet and strong cash flow made it attractive relative to industry peers. Intel raised its revenue and gross margin expectation during the fiscal year. Analysts raised their earnings estimates accordingly, resulting in good news for the PC market. We sold our positions in Intel and Seagate Technology during the reporting period.
The largest detractor from Fund performance for the fiscal year was stock selection in the consumer discretionary sector. Within this sector, retailer Best Buy was the largest detractor. Best Buy struggled during the fiscal year due to disappointing holiday sales and we eliminated our position in the company during the reporting period.
Also detracting from Fund performance were Seadrill and Diamond Offshore Drilling, both oil and gas drilling companies. Neither company was held by the Fund at the end of the reporting period.
The Fund’s stock selection model was overall a positive predictor of returns and was especially adept at navigating the intermittent shifts in investor sentiment that occurred during the fiscal year. US equity markets fared quite well over the past year but geopolitical risk and the realization that the end of quantitative easing by the Fed was near caused a few hiccups. Of the Fund’s four investment concepts that make up its stock selection model – Earnings Expectations, Market Sentiment, Management and Quality, and Value – three of them were positive and contributed to Fund performance for the fiscal year.
Generally, given the low-to-negative correlation of the Management and Quality and Value concepts with the Market Sentiment and Earnings Expectations concepts, it is expected that these concepts will not likely add value simultaneously but work together to generate positive returns in various market environments.
The Value concept was the strongest driver of returns over the reporting period as investors sought attractive valuation given both its upside potential and downside protection.
The Management and Quality concept was positive for the reporting period because investors generally favored managements that protected their interests by buying back stock, reducing debt and paying out dividends.
The Earnings Expectations concept was positive during the reporting period as investors generally were willing to rely on earnings as a predictor of future returns.
Market Sentiment was the only concept to detract from the stock selection model as it was slightly negative for the reporting period, likely due to the concept’s higher risk profile. However, when investors had a “risk on” mentality during the reporting period, the concept fared well.
During the reporting period, the Fund invested in S&P 500 futures contracts, a derivative instrument, to gain exposure to the equity market. These futures contracts generated a positive return and contributed to Fund performance.
We welcome new investors who joined the Fund during the fiscal year and thank all of our shareholders for your investment in Invesco Low Volatility Equity Yield Fund.
The views and opinions expressed in management’s discussion of Fund performance are those of Invesco Advisers, Inc. These views and opinions are subject to change at any time based on factors such as market and economic conditions. These views and opinions may not be relied upon as investment advice or recommendations, or as an offer for a particular security. The information is not a complete analysis of every aspect of any market, country, industry, security or the Fund. Statements of fact are from sources considered reliable, but Invesco Advisers, Inc. makes no representation or warranty as to their completeness or accuracy. Although historical performance is no guarantee of future results, these insights may help you understand our investment management philosophy.
See important Fund and, if applicable, index disclosures later in this report.
| Michael Abata Chartered Financial Analyst, Portfolio Manager, is manager of Invesco Low Volatility Equity Yield | |
Fund. He joined Invesco in 2011. Mr. Abata earned a BA in economics from Binghamton University.
| ||
 | Charlie Ko Chartered Financial Analyst, Portfolio Manager, is manager of Invesco Low Volatility Equity Yield | |
Fund. He joined Invesco in 2012. Mr. Ko earned a BS from MIT and an MBA from Yale University.
| ||
 | Anthony Munchak Chartered Financial Analyst, Portfolio Manager, is manager of Invesco Low Volatility Equity Yield | |
Fund. He joined Invesco in 2000. Mr. Munchak earned a BS and an MS in finance from Boston College and an MBA from Bentley College.
| ||
 | Glen Murphy Chartered Financial Analyst, Portfolio Manager, is manager of Invesco Low Volatility Equity Yield | |
Fund. He joined Invesco in 1995. Mr. Murphy earned a BA in business administration from the University of Massachusetts Amherst and an MS in finance from Boston College.
| ||
 | Francis Orlando Chartered Financial Analyst, Portfolio Manager, is manager of Invesco Low Volatility Equity Yield | |
| Fund. He joined Invesco in 1987. Mr. Orlando earned a BA in business administration from Merrimack College and an MBA from Boston University. | ||
 | Andrew Waisburd Portfolio Manager, is manager of Invesco Low Volatility Equity Yield Fund. He joined Invesco in 2008. | |
| Mr. Waisburd earned a BS in statistics from Cornell University and an MS and a PhD in finance from Indiana University. | ||

5 Invesco Low Volatility Equity Yield Fund
Your Fund’s Long-Term Performance
Results of a $10,000 Investment – Oldest Share Class(es) since Inception
Fund and index data from 3/31/06
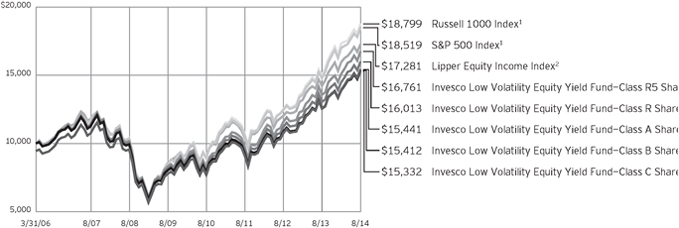
| 1 | Source: FactSet Research Systems Inc. |
| 2 | Source: Lipper Inc. |
Past performance cannot guarantee comparable future results.
The data shown in the chart include reinvested distributions, applicable sales charges and Fund expenses including management fees. Results for Class B shares are calculated as if a hypothetical
shareholder had liquidated his entire investment in the Fund at the close of the reporting period and paid the contingent deferred sales charges, if applicable. Index results include reinvested dividends, but they do not reflect sales charges. Performance of the peer group,
if applicable, reflects fund expenses and management fees; performance of a market index does not. Performance shown in the chart and table(s) does not reflect deduction of taxes a shareholder would pay on Fund distributions or sale of Fund shares.
continued from page 8
About indexes used in this report
| n | The S&P 500® Index is an unmanaged index considered representative of the US stock market. |
| n | The Russell 1000® Index is an unmanaged index considered representative of large-cap stocks. The Russell 1000 Index is a trademark/service mark of the Frank Russell Co. Russell® is a trademark of the Frank Russell Co. |
| n | The Lipper Equity Income Index is an unmanaged Index considered representative of equity income funds tracked by Lipper. |
| n | The Fund is not managed to track the performance of any particular index, including the index(es) described here, and consequently, the performance of the Fund may deviate significantly from the performance of the index(es). |
| n | A direct investment cannot be made in an index. Unless otherwise indicated, index results include reinvested dividends, and they do not reflect sales charges. Performance of the peer group, if applicable, reflects fund expenses; performance of a market index does not. |
Other information
| n | The returns shown in management’s discussion of Fund performance are based on net asset values (NAVs) calculated for shareholder transactions. Generally accepted accounting principles require adjustments to be made to the net assets of the Fund at period end for financial reporting purposes, and as such, the NAVs for shareholder transactions and the returns based on those NAVs may differ from the NAVs and |
returns reported in the Financial Highlights. |
| n | Industry classifications used in this report are generally according to the Global Industry Classification Standard, which was developed by and is the exclusive property and a service mark of MSCI Inc. and Standard & Poor’s. |
6 Invesco Low Volatility Equity Yield Fund
Average Annual Total Returns
As of 8/31/14, including maximum applicable sales charges
Class A Shares | ||||
Inception (3/31/06) | 5.30 | % | ||
5 Years | 13.40 | |||
1 Year | 16.16 | |||
Class B Shares | ||||
Inception (3/31/06) | 5.27 | % | ||
5 Years | 13.61 | |||
1 Year | 17.08 | |||
Class C Shares | ||||
Inception (3/31/06) | 5.21 | % | ||
5 Years | 13.79 | |||
1 Year | 21.01 | |||
Class R Shares | ||||
Inception (3/31/06) | 5.75 | % | ||
5 Years | 14.40 | |||
1 Year | 22.60 | |||
Class Y Shares | ||||
Inception | 6.21 | % | ||
5 Years | 14.96 | |||
1 Year | 23.24 | |||
Investor Class Shares | ||||
Inception | 6.02 | % | ||
5 Years | 14.66 | |||
1 Year | 22.95 | |||
Class R5 Shares | ||||
Inception (3/31/06) | 6.33 | % | ||
5 Years | 15.05 | |||
1 Year | 23.48 | |||
Average Annual Total Returns
As of 6/30/14, the most recent calendar quarter end, including maximum applicable sales charges
Class A Shares | ||||
Inception (3/31/06) | 5.18 | % | ||
5 Years | 15.38 | |||
1 Year | 15.51 | |||
Class B Shares | ||||
Inception (3/31/06) | 5.15 | % | ||
5 Years | 15.60 | |||
1 Year | 16.31 | |||
Class C Shares | ||||
Inception (3/31/06) | 5.11 | % | ||
5 Years | 15.76 | |||
1 Year | 20.24 | |||
Class R Shares | ||||
Inception (3/31/06) | 5.65 | % | ||
5 Years | 16.37 | |||
1 Year | 21.86 | |||
Class Y Shares | ||||
Inception | 6.11 | % | ||
5 Years | 16.99 | |||
1 Year | 22.51 | |||
Investor Class Shares | ||||
Inception | 5.92 | % | ||
5 Years | 16.69 | |||
1 Year | 22.23 | |||
Class R5 Shares | ||||
Inception (3/31/06) | 6.22 | % | ||
5 Years | 17.02 | |||
1 Year | 22.64 | |||
Class Y shares incepted on October 3, 2008. Performance shown prior to that date is that of Class A shares and includes the 12b-1 fees applicable to Class A shares. Class A share performance reflects any applicable fee waivers or expense reimbursements.
Investor Class shares incepted on April 25, 2008. Performance shown prior to that date is that of Class A shares and includes the 12b-1 fees applicable to Class A shares. Class A share performance reflects any applicable fee waivers or expense reimbursements.
The performance data quoted represent past performance and cannot guarantee comparable future results; current performance may be lower or higher. Please visit invesco.com/performance for the most recent month-end performance. Performance figures reflect reinvested distributions, changes in net asset value and the effect of the maximum
sales charge unless otherwise stated. Investment return and principal value will fluctuate so that you may have a gain or loss when you sell shares.
The total annual Fund operating expense ratio set forth in the most recent Fund prospectus as of the date of this report for Class A, Class B, Class C, Class R, Class Y, Investor Class and Class R5 shares was 1.18%, 1.93%, 1.93%, 1.43%, 0.93%, 1.18% and 0.76%, respectively. The expense ratios presented above may vary from the expense ratios presented in other sections of this report that are based on expenses incurred during the period covered by this report.
Class A share performance reflects the maximum 5.50% sales charge, and Class B and Class C share performance reflects the applicable contingent deferred sales charge (CDSC) for the period involved. The CDSC on Class B shares declines from 5% beginning at the time of purchase to 0% at the
beginning of the seventh year. The CDSC on Class C shares is 1% for the first year after purchase. Class R, Class Y, Investor Class and Class R5 shares do not have a front-end sales charge or a CDSC; therefore, performance is at net asset value.
The performance of the Fund’s share classes will differ primarily due to different sales charge structures and class expenses.
Had the adviser not waived fees and/ or reimbursed expenses in the past, performance would have been lower.
7 Invesco Low Volatility Equity Yield Fund
Invesco Low Volatility Equity Yield Fund’s investment objective is income and long-term growth of capital.
| n | Unless otherwise stated, information presented in this report is as of August 31, 2014, and is based on total net assets. |
| n | Unless otherwise noted, all data provided by Invesco. |
| n | To access your Fund’s reports/prospectus, visit invesco.com/fundreports. |
About share classes
| n | Class B shares may not be purchased for new or additional investments. Please see the prospectus for more information. |
| n | Class R shares are generally available only to employer sponsored retirement and benefit plans. Please see the prospectus for more information. |
| n | Class Y shares are available only to certain investors. Please see the prospectus for more information. |
| n | Investor Class shares are closed to new investors. Contact your financial adviser about purchasing our other share classes. Please see the prospectus for more information. |
| n | Class R5 shares are primarily intended for employer sponsored retirement and benefit plans that meet certain standards and for institutional investors. Please see the prospectus for more information. |
Principal risks of investing in the Fund
| n | Active trading risk. The Fund engages in frequent trading of portfolio securities. Active trading results in added expenses and may result in a lower return and increased tax liability. |
| n | Depositary receipts risk. Depositary receipts involve many of the same risks as those associated with direct investment in foreign securities. In addition, the underlying issuers of certain depositary receipts, particularly unsponsored or unregistered depositary receipts, are under no obligation to distribute shareholder communications to the holders of such receipts or to pass through to them any voting rights with respect to the deposited securities. |
| n | Derivatives risk. The value of a derivative instrument depends largely on (and is derived from) the value of an underlying security, currency, commodity, interest rate, index or other asset (each referred to as an underlying asset). In addition to risks relating to the underlying assets, the use of derivatives |
may include other, possibly greater, risks, including counterparty, leverage and liquidity risks. Counterparty risk is the risk that the counterparty to the derivative contract will default on its obligation to pay the Fund the amount owed or otherwise perform under the derivative contract. Derivatives create leverage risk because they do not require payment up front equal to the economic exposure created by owning the derivative. As a result, an adverse change in the value of the underlying asset could result in the Fund sustaining a loss that is substantially greater than the amount invested in the derivative, which may make the Fund’s returns more volatile and increase the risk of loss. Derivative instruments may also be less liquid than more traditional investments and the Fund may be unable to sell or close out its derivative positions at a desirable time or price. This risk may be more acute under adverse market conditions, during which the Fund may be most in need of liquidating its derivative positions. Derivatives may also be harder to value, less tax efficient and subject to changing government regulation that could impact the Fund’s ability to use certain derivatives or their cost. Also, derivatives used for hedging or to gain or limit exposure to a particular market segment may not provide the expected benefits, particularly during adverse market conditions. |
| n | Equity risk. Equity risk is the risk that the value of securities held by the Fund will fall due to general market and economic conditions, perceptions regarding the industries in which the issuers of securities held by the Fund participate or factors relating to specific companies in which the Fund invests, either directly or through derivative instruments. For example, an adverse event, such as an unfavorable earnings report, may depress the value of securities held by the Fund; the price of securities may be particularly sensitive to general movements |
in the stock market; or a drop in the stock market may depress the price of most or all of the securities held by the Fund. In addition, securities of an issuer in the Fund’s portfolio may decline in price if the issuer fails to make anticipated dividend payments because, among other reasons, the issuer of the security experiences a decline in its financial condition. |
| n | Foreign securities risk. The Fund’s foreign investments may be affected by changes in a foreign country’s exchange rates, political and social instability, changes in economic or taxation policies, difficulties when enforcing obligations, decreased liquidity, and increased volatility. Foreign companies may be subject to less regulation resulting in less publicly available information about the companies. |
| n | Management risk. The investment techniques and risk analysis used by the Fund’s portfolio managers may not produce the desired results. |
| n | Market risk. The prices of and the income generated by the Fund’s securities may decline in response to, among other things, investor sentiment, general economic and market conditions, regional or global instability, and currency and interest rate fluctuations. |
| n | Real estate investment trust (REIT)/real estate risk. Investments in real estate related instruments may be affected by economic, legal, cultural, environmental or technological factors that affect property values, rents or occupancies of real estate related to the Fund’s holdings. Real estate companies, including REITs or similar structures, tend to be small- and mid-cap companies, and their shares may be more volatile and less liquid. The value of investments in real estate related companies may be affected by the quality of management, the ability to repay loans, the utilization of leverage and financial covenants related thereto, whether the company carries adequate insurance and environmental factors. If a real estate related company defaults, the Fund may own real estate directly, which involves the following additional risks: environmental liabilities; difficulty in valuing and selling the real estate; and economic or regulatory changes. |
This report must be accompanied or preceded by a currently effective Fund prospectus, which contains more complete information, including sales charges and expenses. Investors should read it carefully before investing.
NOT FDIC INSURED | MAY LOSE VALUE | NO BANK GUARANTEE |
continued on page 6
8 Invesco Low Volatility Equity Yield Fund
Schedule of Investments(a)
August 31, 2014
| Shares | Value | |||||||
Common Stocks & Other Equity Interests–97.00% |
| |||||||
| Aerospace & Defense–3.22% | ||||||||
Lockheed Martin Corp. | 31,250 | $ | 5,437,500 | |||||
Raytheon Co. | 65,300 | 6,291,002 | ||||||
| 11,728,502 | ||||||||
| Agricultural Products–1.64% | ||||||||
Archer-Daniels-Midland Co. | 119,700 | 5,968,242 | ||||||
| Apparel Retail–0.25% | ||||||||
Guess?, Inc. | 39,300 | 921,192 | ||||||
| Biotechnology–0.73% | ||||||||
PDL BioPharma Inc. | 264,000 | 2,663,760 | ||||||
| Broadcasting–0.17% | ||||||||
CTC Media, Inc. (Russia) | 68,900 | 625,612 | ||||||
| Building Products–0.14% | ||||||||
Allegion PLC | 10,200 | 524,586 | ||||||
| Coal & Consumable Fuels–1.08% | ||||||||
Peabody Energy Corp. | 246,800 | 3,919,184 | ||||||
| Communications Equipment–1.81% | ||||||||
Cisco Systems, Inc. | 263,700 | 6,589,863 | ||||||
| Computer & Electronics Retail–1.59% | ||||||||
GameStop Corp.–Class A | 136,800 | 5,772,960 | ||||||
| Construction Machinery & Heavy Trucks–1.43% | ||||||||
Caterpillar Inc. | 47,800 | 5,213,546 | ||||||
| Data Processing & Outsourced Services–1.58% | ||||||||
Computer Sciences Corp. | 17,300 | 1,034,367 | ||||||
Western Union Co. (The) | 124,000 | 2,166,280 | ||||||
Xerox Corp. | 183,600 | 2,535,516 | ||||||
| 5,736,163 | ||||||||
| Diversified Metals & Mining–0.47% | ||||||||
Compass Minerals International, Inc. | 19,200 | 1,710,144 | ||||||
| Diversified REIT’s–0.15% | ||||||||
Lexington Realty Trust | 51,200 | 557,056 | ||||||
| Electric Utilities–10.08% | ||||||||
American Electric Power Co., Inc. | 96,200 | 5,165,940 | ||||||
Edison International | 87,800 | 5,192,492 | ||||||
Entergy Corp. | 79,600 | 6,161,836 | ||||||
Exelon Corp. | 161,400 | 5,393,988 | ||||||
FirstEnergy Corp. | 163,300 | 5,591,392 | ||||||
PPL Corp. | 161,100 | 5,578,893 | ||||||
Southern Co. (The) | 73,400 | 3,258,960 | ||||||
Xcel Energy, Inc. | 10,800 | 346,140 | ||||||
| 36,689,641 | ||||||||
| Shares | Value | |||||||
| Electrical Components & Equipment–0.17% | ||||||||
General Cable Corp. | 29,100 | $ | 624,777 | |||||
| Electronic Components–0.15% | ||||||||
Knowles Corp.(b) | 17,000 | 559,640 | ||||||
| Fertilizers & Agricultural Chemicals–0.10% | ||||||||
Scotts Miracle-Gro Co. (The)–Class A | 6,000 | 346,380 | ||||||
| Gas Utilities–0.92% | ||||||||
AGL Resources Inc. | 41,800 | 2,228,358 | ||||||
New Jersey Resources Corp. | 21,300 | 1,112,499 | ||||||
| 3,340,857 | ||||||||
| Health Care REIT’s–5.96% | ||||||||
HCP, Inc. | 117,000 | 5,069,610 | ||||||
Health Care REIT, Inc. | 29,900 | 2,020,642 | ||||||
Healthcare Trust of America, Inc.–Class A | 94,500 | 1,176,525 | ||||||
National Health Investors, Inc. | 14,600 | 941,846 | ||||||
Omega Healthcare Investors, Inc. | 100,900 | 3,800,903 | ||||||
Senior Housing Properties Trust | 148,500 | 3,464,505 | ||||||
Ventas, Inc. | 79,300 | 5,216,354 | ||||||
| 21,690,385 | ||||||||
| Hotel and Resort REIT’s–1.25% | ||||||||
Hospitality Properties Trust | 71,200 | 2,095,416 | ||||||
RLJ Lodging Trust | 18,400 | 548,504 | ||||||
Ryman Hospitality Properties, Inc. | 38,000 | 1,890,500 | ||||||
| 4,534,420 | ||||||||
| Hypermarkets & Super Centers–0.52% | ||||||||
Wal-Mart Stores, Inc. | 25,100 | 1,895,050 | ||||||
| Industrial Conglomerates–1.43% | ||||||||
General Electric Co. | 200,300 | 5,203,794 | ||||||
| Integrated Oil & Gas–2.34% | ||||||||
Cenovus Energy Inc. (Canada) | 72,000 | 2,296,080 | ||||||
Suncor Energy, Inc. (Canada) | 151,300 | 6,216,917 | ||||||
| 8,512,997 | ||||||||
| Integrated Telecommunication Services–5.97% | ||||||||
AT&T Inc. | 181,200 | 6,334,752 | ||||||
BCE Inc. (Canada) | 45,200 | 2,034,904 | ||||||
CenturyLink Inc. | 163,400 | 6,697,766 | ||||||
Windstream Holdings Inc. | 589,600 | 6,662,480 | ||||||
| 21,729,902 | ||||||||
| IT Consulting & Other Services–0.39% | ||||||||
Leidos Holdings, Inc. | 37,400 | 1,408,110 | ||||||
| Mortgage REIT’s–5.72% | ||||||||
American Capital Agency Corp. | 223,500 | 5,285,775 | ||||||
Annaly Capital Management Inc. | 509,900 | 6,067,810 | ||||||
CYS Investments, Inc. | 208,600 | 1,967,098 | ||||||
See accompanying Notes to Financial Statements which are an integral part of the financial statements.
9 Invesco Low Volatility Equity Yield Fund
| Shares | Value | |||||||
| Mortgage REIT’s–(continued) | ||||||||
Hatteras Financial Corp. | 69,500 | $ | 1,383,050 | |||||
MFA Financial, Inc. | 364,800 | 3,078,912 | ||||||
Two Harbors Investment Corp. | 283,100 | 3,034,832 | ||||||
| 20,817,477 | ||||||||
| Movies & Entertainment–0.32% | ||||||||
Regal Entertainment Group–Class A | 54,700 | 1,151,435 | ||||||
| Multi-Utilities–5.83% | ||||||||
Ameren Corp. | 129,300 | 5,170,707 | ||||||
Consolidated Edison, Inc. | 38,300 | 2,217,187 | ||||||
PG&E Corp. | 110,400 | 5,131,392 | ||||||
Public Service Enterprise Group Inc. | 154,300 | 5,769,277 | ||||||
TECO Energy, Inc. | 152,300 | 2,756,630 | ||||||
Vectren Corp. | 4,600 | 189,658 | ||||||
| 21,234,851 | ||||||||
| Office REIT’s–2.08% | ||||||||
Digital Realty Trust, Inc. | 91,000 | 5,937,750 | ||||||
Piedmont Office Realty Trust Inc.–Class A | 84,300 | 1,643,007 | ||||||
| 7,580,757 | ||||||||
| Office Services & Supplies–1.78% | ||||||||
Pitney Bowes Inc. | 225,800 | 6,110,148 | ||||||
West Corp. | 13,000 | 385,580 | ||||||
| 6,495,728 | ||||||||
| Oil & Gas Drilling–1.52% | ||||||||
Nabors Industries Ltd. | 202,900 | 5,520,909 | ||||||
| Oil & Gas Equipment & Services–0.96% | ||||||||
National Oilwell Varco Inc. | 34,400 | 2,973,192 | ||||||
Seventy Seven Energy Inc.(b) | 21,500 | 504,605 | ||||||
| 3,477,797 | ||||||||
| Oil & Gas Exploration & Production–7.88% | ||||||||
Baytex Energy Corp. (Canada) | 14,500 | 646,555 | ||||||
Canadian Natural Resources Ltd. (Canada) | 127,200 | 5,539,560 | ||||||
Chesapeake Energy Corp. | 194,500 | 5,290,400 | ||||||
Encana Corp. (Canada) | 280,600 | 6,462,218 | ||||||
Enerplus Corp. (Canada) | 49,700 | 1,139,124 | ||||||
Gran Tierra Energy, Inc. (Canada)(b) | 60,700 | 407,297 | ||||||
Kosmos Energy Ltd.(b) | 51,100 | 512,022 | ||||||
Marathon Oil Corp. | 134,100 | 5,590,629 | ||||||
Pengrowth Energy Corp. (Canada) | 117,300 | 749,547 | ||||||
Talisman Energy Inc. (Canada) | 235,200 | 2,368,464 | ||||||
| 28,705,816 | ||||||||
| Oil & Gas Refining & Marketing–2.13% | ||||||||
CVR Energy, Inc. | 66,900 | 3,320,247 | ||||||
Marathon Petroleum Corp. | 40,500 | 3,685,905 | ||||||
Western Refining, Inc. | 16,100 | 749,133 | ||||||
| 7,755,285 | ||||||||
| Packaged Foods & Meats–0.75% | ||||||||
Pilgrim’s Pride Corp.(b) | 91,600 | 2,736,092 | ||||||
| Shares | Value | |||||||
| Pharmaceuticals–4.57% | ||||||||
Eli Lilly and Co. | 84,300 | $ | 5,358,108 | |||||
Merck & Co., Inc. | 87,900 | 5,283,669 | ||||||
Pfizer Inc. | 203,700 | 5,986,743 | ||||||
| 16,628,520 | ||||||||
| Property & Casualty Insurance–0.10% | ||||||||
Old Republic International Corp. | 24,900 | 382,215 | ||||||
| Publishing–0.13% | ||||||||
Time Inc.(b) | 20,300 | 476,644 | ||||||
| Reinsurance–1.23% | ||||||||
Everest Re Group, Ltd. | 2,100 | 344,064 | ||||||
PartnerRe Ltd. | 35,500 | 3,964,995 | ||||||
Validus Holdings, Ltd. | 4,700 | 183,817 | ||||||
| 4,492,876 | ||||||||
| Residential REIT’s–0.14% | ||||||||
Starwood Waypoint Residential Trust(b) | 18,600 | 514,848 | ||||||
| Retail REIT’s–1.77% | ||||||||
Kimco Realty Corp. | 7,600 | 178,524 | ||||||
Regency Centers Corp. | 13,800 | 788,532 | ||||||
Retail Properties of America, Inc.–Class A | 105,200 | 1,664,264 | ||||||
Simon Property Group, Inc. | 19,300 | 3,281,579 | ||||||
Washington Prime Group Inc. | 27,500 | 536,800 | ||||||
| 6,449,699 | ||||||||
| Semiconductors–1.63% | ||||||||
Intersil Corp.–Class A | 55,200 | 830,484 | ||||||
Marvell Technology Group Ltd. | 367,200 | 5,107,752 | ||||||
| 5,938,236 | ||||||||
| Soft Drinks–0.44% | ||||||||
Dr Pepper Snapple Group, Inc. | 25,700 | 1,617,044 | ||||||
| Specialized REIT’s–1.01% | ||||||||
Corrections Corp. of America | 20,100 | 716,364 | ||||||
Geo Group Inc. (The) | 57,500 | 2,151,650 | ||||||
Potlatch Corp | 19,200 | 819,456 | ||||||
| 3,687,470 | ||||||||
| Specialty Stores–1.42% | ||||||||
Staples, Inc. | 443,500 | 5,180,080 | ||||||
| Steel–1.51% | ||||||||
United States Steel Corp. | 142,200 | 5,496,030 | ||||||
| Systems Software–1.27% | ||||||||
CA, Inc. | 163,900 | 4,628,536 | ||||||
| Technology Hardware, Storage & Peripherals–6.19% | ||||||||
Apple Inc. | 66,640 | 6,830,600 | ||||||
Hewlett-Packard Co. | 193,900 | 7,368,200 | ||||||
Lexmark International, Inc.–Class A | 86,500 | 4,373,440 | ||||||
NetApp, Inc. | 94,200 | 3,971,472 | ||||||
| 22,543,712 | ||||||||
See accompanying Notes to Financial Statements which are an integral part of the financial statements.
10 Invesco Low Volatility Equity Yield Fund
| Shares | Value | |||||||
| Thrifts & Mortgage Finance–1.25% | ||||||||
New York Community Bancorp, Inc. | 286,300 | $ | 4,566,485 | |||||
| Tobacco–1.69% | ||||||||
Altria Group, Inc. | 142,800 | 6,151,824 | ||||||
| Trading Companies & Distributors–0.14% | ||||||||
NOW Inc.(b) | 15,500 | 511,965 | ||||||
Total Common Stocks & Other Equity Interests (Cost $312,421,870) |
| 353,209,094 | ||||||
| Principal Amount | ||||||||
U.S. Treasury Bills–0.19% |
| |||||||
0.08%, 09/11/14 | $ | 700,000 | 699,996 | |||||
| Shares | Value | |||||||
Money Market Funds–2.75% |
| |||||||
Liquid Assets Portfolio–Institutional Class(e) | 5,013,751 | $ | 5,013,751 | |||||
Premier Portfolio–Institutional Class(e) | 5,013,750 | 5,013,750 | ||||||
Total Money Market Funds |
| 10,027,501 | ||||||
TOTAL INVESTMENTS–99.94% |
| 363,936,591 | ||||||
OTHER ASSETS LESS LIABILITIES–0.06% |
| 220,085 | ||||||
NET ASSETS–100.00% |
| $ | 364,156,676 | |||||
Investment Abbreviations:
| REIT | – Real Estate Investment Trust |
Notes to Schedule of Investments:
| (a) | Industry and/or sector classifications used in this report are generally according to the Global Industry Classification Standard, which was developed by and is the exclusive property and a service mark of MSCI Inc. and Standard & Poor’s. |
| (b) | Non-income producing security. |
| (c) | All or a portion of the value was pledged as collateral to cover margin requirements for open futures contracts. See Note 1I and Note 4. |
| (d) | Security traded on a discount basis. The interest rate shown represents the discount rate at the time of purchase by the Fund. |
| (e) | The money market fund and the Fund are affiliated by having the same investment adviser. |
See accompanying Notes to Financial Statements which are an integral part of the financial statements.
11 Invesco Low Volatility Equity Yield Fund
Statement of Assets and Liabilities
August 31, 2014
Assets: |
| |||
Investments, at value (Cost $313,121,852) | $ | 353,909,090 | ||
Investments in affiliated money market funds, at value and cost | 10,027,501 | |||
Total investments, at value (Cost $323,149,353) | 363,936,591 | |||
Receivable for: | ||||
Variation margin — futures | 24,456 | |||
Fund shares sold | 80,589 | |||
Dividends | 844,779 | |||
Investment for trustee deferred compensation and retirement plans | 234,088 | |||
Other assets | 41,127 | |||
Total assets | 365,161,630 | |||
Liabilities: |
| |||
Payable for: | ||||
Fund shares reacquired | 470,061 | |||
Accrued fees to affiliates | 232,269 | |||
Accrued trustees’ and officers’ fees and benefits | 3,570 | |||
Accrued other operating expenses | 42,690 | |||
Trustee deferred compensation and retirement plans | 256,364 | |||
Total liabilities | 1,004,954 | |||
Net assets applicable to shares outstanding | $ | 364,156,676 | ||
Net assets consist of: |
| |||
Shares of beneficial interest | $ | 336,742,435 | ||
Undistributed net investment income | 4,079,260 | |||
Undistributed net realized gain (loss) | (17,743,397 | ) | ||
Net unrealized appreciation | 41,078,378 | |||
| $ | 364,156,676 | |||
Net Assets: |
| |||
Class A | $ | 224,786,427 | ||
Class B | $ | 11,962,015 | ||
Class C | $ | 40,118,921 | ||
Class R | $ | 206,482 | ||
Class Y | $ | 5,382,608 | ||
Investor Class | $ | 65,428,407 | ||
Class R5 | $ | 16,271,816 | ||
Shares outstanding, $0.01 par value per share, |
| |||
Class A | 19,132,906 | |||
Class B | 1,032,347 | |||
Class C | 3,469,964 | |||
Class R | 17,658 | |||
Class Y | 456,159 | |||
Investor Class | 5,551,917 | |||
Class R5 | 1,377,064 | |||
Class A: | ||||
Net asset value per share | $ | 11.75 | ||
Maximum offering price per share | ||||
(Net asset value of $11.75 ¸ 94.50%) | $ | 12.43 | ||
Class B: | ||||
Net asset value and offering price per share | $ | 11.59 | ||
Class C: | ||||
Net asset value and offering price per share | $ | 11.56 | ||
Class R: | ||||
Net asset value and offering price per share | $ | 11.69 | ||
Class Y: | ||||
Net asset value and offering price per share | $ | 11.80 | ||
Investor Class: | ||||
Net asset value and offering price per share | $ | 11.78 | ||
Class R5: | ||||
Net asset value and offering price per share | $ | 11.82 | ||
See accompanying Notes to Financial Statements which are an integral part of the financial statements.
12 Invesco Low Volatility Equity Yield Fund
Statement of Operations
For the year ended August 31, 2014
Investment income: |
| |||
Dividends (net of foreign withholding taxes of $60,932) | $ | 13,626,005 | ||
Dividends from affiliated money market funds | 3,618 | |||
Total investment income | 13,629,623 | |||
Expenses: | ||||
Advisory fees | 2,049,897 | |||
Administrative services fees | 109,496 | |||
Custodian fees | 14,142 | |||
Distribution fees: | ||||
Class A | 529,362 | |||
Class B | 128,883 | |||
Class C | 388,018 | |||
Class R | 1,019 | |||
Investor Class | 157,124 | |||
Transfer agent fees — A, B, C, R, Y and Investor | 659,142 | |||
Transfer agent fees — R5 | 8,027 | |||
Trustees’ and officers’ fees and benefits | 34,662 | |||
Other | 186,867 | |||
Total expenses | 4,266,639 | |||
Less: Fees waived and expense offset arrangement(s) | (14,079 | ) | ||
Net expenses | 4,252,560 | |||
Net investment income | 9,377,063 | |||
Realized and unrealized gain from: | ||||
Net realized gain from: | ||||
Investment securities | 48,876,666 | |||
Futures contracts | 1,607,443 | |||
| 50,484,109 | ||||
Change in net unrealized appreciation of: | ||||
Investment securities | 10,564,684 | |||
Futures contracts | 448,896 | |||
| 11,013,580 | ||||
Net realized and unrealized gain | 61,497,689 | |||
Net increase in net assets resulting from operations | $ | 70,874,752 | ||
See accompanying Notes to Financial Statements which are an integral part of the financial statements.
13 Invesco Low Volatility Equity Yield Fund
Statement of Changes in Net Assets
For the years ended August 31, 2014 and 2013
| August 31, 2014 | August 31, 2013 | |||||||
Operations: |
| |||||||
Net investment income | $ | 9,377,063 | $ | 4,063,726 | ||||
Net realized gain | 50,484,109 | 80,098,018 | ||||||
Change in net unrealized appreciation (depreciation) | 11,013,580 | (33,342,112 | ) | |||||
Net increase in net assets resulting from operations | 70,874,752 | 50,819,632 | ||||||
Distributions to shareholders from net investment income: | ||||||||
Class A | (5,646,913 | ) | (2,404,575 | ) | ||||
Class B | (254,144 | ) | (47,545 | ) | ||||
Class C | (751,282 | ) | (119,396 | ) | ||||
Class R | (4,843 | ) | (8,911 | ) | ||||
Class Y | (131,250 | ) | (68,486 | ) | ||||
Investor Class | (1,690,488 | ) | (773,952 | ) | ||||
Class R5 | (439,228 | ) | (185,733 | ) | ||||
Total distributions from net investment income | (8,918,148 | ) | (3,608,598 | ) | ||||
Distributions to shareholders from net realized gains: | ||||||||
Class A | (3,264,831 | ) | — | |||||
Class B | (212,478 | ) | — | |||||
Class C | (616,876 | ) | — | |||||
Class R | (3,433 | ) | — | |||||
Class Y | (68,027 | ) | — | |||||
Investor Class | (956,050 | ) | — | |||||
Class R5 | (215,652 | ) | — | |||||
Total distributions from net realized gains | (5,337,347 | ) | — | |||||
Share transactions–net: | ||||||||
Class A | (9,469,200 | ) | (27,233,949 | ) | ||||
Class B | (3,423,364 | ) | (5,795,678 | ) | ||||
Class C | (3,531,091 | ) | (9,320,625 | ) | ||||
Class R | (26,497 | ) | (905,829 | ) | ||||
Class Y | 444,728 | (690,831 | ) | |||||
Investor Class | (9,352,837 | ) | (8,125,971 | ) | ||||
Class R5 | 877,747 | (33,993 | ) | |||||
Net increase (decrease) in net assets resulting from share transactions | (24,480,514 | ) | (52,106,876 | ) | ||||
Net increase (decrease) in net assets | 32,138,743 | (4,895,842 | ) | |||||
Net assets: | ||||||||
Beginning of year | 332,017,933 | 336,913,775 | ||||||
End of year (includes undistributed net investment income of $4,079,260 and $3,558,026, respectively) | $ | 364,156,676 | $ | 332,017,933 | ||||
Notes to Financial Statements
August 31, 2014
NOTE 1—Significant Accounting Policies
Invesco Low Volatility Equity Yield Fund (the “Fund”) is a series portfolio of AIM Counselor Series Trust (Invesco Counselor Series Trust) (the “Trust”). The Trust is a Delaware statutory trust registered under the Investment Company Act of 1940, as amended (the “1940 Act”), as an open-end series management investment company consisting of thirteen separate portfolios, each authorized to issue an unlimited number of shares of beneficial interest. The assets, liabilities and operations of each portfolio are accounted for separately. Information presented in these financial statements pertains only to the Fund. Matters affecting each portfolio or class will be voted on exclusively by the shareholders of such portfolio or class.
The Fund’s investment objective is income and long-term growth of capital.
14 Invesco Low Volatility Equity Yield Fund
The Fund currently consists of seven different classes of shares: Class A, Class B, Class C, Class R, Class Y, Investor Class and Class R5. Investor Class shares of the Fund are offered only to certain grandfathered investors. Class A shares are sold with a front-end sales charge unless certain waiver criteria are met and under certain circumstances load waived shares may be subject to contingent deferred sales charges (“CDSC”). Class C shares are sold with a CDSC. Class R, Class Y, Investor Class and Class R5 shares are sold at net asset value. Existing shareholders of Class B shares may continue to reinvest dividends and capital gains distributions in Class B shares until they convert to Class A shares. Also, shareholders in Class B shares will be able to exchange those shares for Class B shares of other Invesco Funds offering such shares until they convert to Class A shares. Generally, Class B shares will automatically convert to Class A shares on or about the month-end, which is at least eight years after the date of purchase. Redemption of Class B shares prior to the conversion date will be subject to a CDSC.
The following is a summary of the significant accounting policies followed by the Fund in the preparation of its financial statements.
| A. | Security Valuations — Securities, including restricted securities, are valued according to the following policy. |
A security listed or traded on an exchange (except convertible securities) is valued at its last sales price or official closing price as of the close of the customary trading session on the exchange where the security is principally traded, or lacking any sales or official closing price on a particular day, the security may be valued at the closing bid price on that day. Securities traded in the over-the-counter market are valued based on prices furnished by independent pricing services or market makers. When such securities are valued by an independent pricing service they may be considered fair valued. Futures contracts are valued at the final settlement price set by an exchange on which they are principally traded. Listed options are valued at the mean between the last bid and ask prices from the exchange on which they are principally traded. Options not listed on an exchange are valued by an independent source at the mean between the last bid and ask prices. For purposes of determining net asset value per share, futures and option contracts generally are valued 15 minutes after the close of the customary trading session of the New York Stock Exchange (“NYSE”).
Investments in open-end and closed-end registered investment companies that do not trade on an exchange are valued at the end of day net asset value per share. Investments in open-end and closed-end registered investment companies that trade on an exchange are valued at the last sales price or official closing price as of the close of the customary trading session on the exchange where the security is principally traded.
Debt obligations (including convertible securities) and unlisted equities are fair valued using an evaluated quote provided by an independent pricing service. Evaluated quotes provided by the pricing service may be determined without exclusive reliance on quoted prices, and may reflect appropriate factors such as institution-size trading in similar groups of securities, developments related to specific securities, dividend rate (for unlisted equities), yield (for debt obligations), quality, type of issue, coupon rate (for debt obligations), maturity (for debt obligations), individual trading characteristics and other market data. Debt obligations are subject to interest rate and credit risks. In addition, all debt obligations involve some risk of default with respect to interest and/or principal payments.
Foreign securities’ (including foreign exchange contracts) prices are converted into U.S. dollar amounts using the applicable exchange rates as of the close of the NYSE. If market quotations are available and reliable for foreign exchange-traded equity securities, the securities will be valued at the market quotations. Because trading hours for certain foreign securities end before the close of the NYSE, closing market quotations may become unreliable. If between the time trading ends on a particular security and the close of the customary trading session on the NYSE, events occur that the Adviser determines are significant and make the closing price unreliable, the Fund may fair value the security. If the event is likely to have affected the closing price of the security, the security will be valued at fair value in good faith using procedures approved by the Board of Trustees. Adjustments to closing prices to reflect fair value may also be based on a screening process of an independent pricing service to indicate the degree of certainty, based on historical data, that the closing price in the principal market where a foreign security trades is not the current value as of the close of the NYSE. Foreign securities’ prices meeting the approved degree of certainty that the price is not reflective of current value will be priced at the indication of fair value from the independent pricing service. Multiple factors may be considered by the independent pricing service in determining adjustments to reflect fair value and may include information relating to sector indices, American Depositary Receipts and domestic and foreign index futures. Foreign securities may have additional risks including exchange rate changes, potential for sharply devalued currencies and high inflation, political and economic upheaval, the relative lack of issuer information, relatively low market liquidity and the potential lack of strict financial and accounting controls and standards.
Securities for which market prices are not provided by any of the above methods may be valued based upon quotes furnished by independent sources. The last bid price may be used to value equity securities. The mean between the last bid and asked prices is used to value debt obligations, including corporate loans.
Securities for which market quotations are not readily available or became unreliable are valued at fair value as determined in good faith by or under the supervision of the Trust’s officers following procedures approved by the Board of Trustees. Issuer specific events, market trends, bid/ask quotes of brokers and information providers and other market data may be reviewed in the course of making a good faith determination of a security’s fair value.
The Fund may invest in securities that are subject to interest rate risk, meaning the risk that the prices will generally fall as interest rates rise and, conversely, the prices will generally rise as interest rates fall. Specific securities differ in their sensitivity to changes in interest rates depending on their individual characteristics. Changes in interest rates may result in increased market volatility, which may affect the value and/or liquidity of certain of the Fund’s investments.
Valuations change in response to many factors including the historical and prospective earnings of the issuer, the value of the issuer’s assets, general economic conditions, interest rates, investor perceptions and market liquidity. Because of the inherent uncertainties of valuation, the values reflected in the financial statements may materially differ from the value received upon actual sale of those investments.
| B. | Securities Transactions and Investment Income — Securities transactions are accounted for on a trade date basis. Realized gains or losses on sales are computed on the basis of specific identification of the securities sold. Interest income (net of withholding tax, if any) is recorded on the accrual basis from settlement date. Dividend income (net of withholding tax, if any) is recorded on the ex-dividend date. Bond premiums and discounts are amortized and/or accreted for financial reporting purposes. |
The Fund may periodically participate in litigation related to Fund investments. As such, the Fund may receive proceeds from litigation settlements. Any proceeds received are included in the Statement of Operations as realized gain (loss) for investments no longer held and as unrealized gain (loss) for investments still held.
15 Invesco Low Volatility Equity Yield Fund
Brokerage commissions and mark ups are considered transaction costs and are recorded as an increase to the cost basis of securities purchased and/or a reduction of proceeds on a sale of securities. Such transaction costs are included in the determination of net realized and unrealized gain (loss) from investment securities reported in the Statement of Operations and the Statement of Changes in Net Assets and the net realized and unrealized gains (losses) on securities per share in the Financial Highlights. Transaction costs are included in the calculation of the Fund’s net asset value and, accordingly, they reduce the Fund’s total returns. These transaction costs are not considered operating expenses and are not reflected in net investment income reported in the Statement of Operations and Statement of Changes in Net Assets, or the net investment income per share and ratios of expenses and net investment income reported in the Financial Highlights, nor are they limited by any expense limitation arrangements between the Fund and the investment adviser.
The Fund allocates income and realized and unrealized capital gains and losses to a class based on the relative net assets of each class.
| C. | Country Determination — For the purposes of making investment selection decisions and presentation in the Schedule of Investments, the investment adviser may determine the country in which an issuer is located and/or credit risk exposure based on various factors. These factors include the laws of the country under which the issuer is organized, where the issuer maintains a principal office, the country in which the issuer derives 50% or more of its total revenues and the country that has the primary market for the issuer’s securities, as well as other criteria. Among the other criteria that may be evaluated for making this determination are the country in which the issuer maintains 50% or more of its assets, the type of security, financial guarantees and enhancements, the nature of the collateral and the sponsor organization. Country of issuer and/or credit risk exposure has been determined to be the United States of America, unless otherwise noted. |
| D. | Distributions — Distributions from net investment income, if any, are declared and paid quarterly and are recorded on the ex-dividend date. Distributions from net realized capital gain, if any, are generally declared and paid annually and recorded on the ex-dividend date. The Fund may elect to treat a portion of the proceeds from redemptions as distributions for federal income tax purposes. |
| E. | Federal Income Taxes — The Fund intends to comply with the requirements of Subchapter M of the Internal Revenue Code of 1986, as amended (the “Internal Revenue Code”), necessary to qualify as a regulated investment company and to distribute substantially all of the Fund’s taxable earnings to shareholders. As such, the Fund will not be subject to federal income taxes on otherwise taxable income (including net realized capital gain) that is distributed to shareholders. Therefore, no provision for federal income taxes is recorded in the financial statements. |
The Fund recognizes the tax benefits of uncertain tax positions only when the position is more likely than not to be sustained. Management has analyzed the Fund’s uncertain tax positions and concluded that no liability for unrecognized tax benefits should be recorded related to uncertain tax positions. Management is not aware of any tax positions for which it is reasonably possible that the total amounts of unrecognized tax benefits will change materially in the next 12 months.
The Fund files tax returns in the U.S. Federal jurisdiction and certain other jurisdictions. Generally, the Fund is subject to examinations by such taxing authorities for up to three years after the filing of the return for the tax period.
| F. | Expenses — Fees provided for under the Rule 12b-1 plan of a particular class of the Fund are charged to the operations of such class. Transfer agency fees and expenses and other shareholder recordkeeping fees and expenses attributable to Class R5 are charged to such class. Transfer agency fees and expenses and other shareholder recordkeeping fees and expenses relating to all other classes are allocated among those classes based on relative net assets. All other expenses are allocated among the classes based on relative net assets. |
| G. | Accounting Estimates — The preparation of financial statements in conformity with accounting principles generally accepted in the United States of America (“GAAP”) requires management to make estimates and assumptions that affect the reported amounts of assets and liabilities at the date of the financial statements and the reported amounts of revenues and expenses during the reporting period including estimates and assumptions related to taxation. Actual results could differ from those estimates by a significant amount. In addition, the Fund monitors for material events or transactions that may occur or become known after the period-end date and before the date the financial statements are released to print. |
| H. | Indemnifications — Under the Trust’s organizational documents, each Trustee, officer, employee or other agent of the Trust is indemnified against certain liabilities that may arise out of the performance of their duties to the Fund. Additionally, in the normal course of business, the Fund enters into contracts, including the Fund’s servicing agreements, that contain a variety of indemnification clauses. The Fund’s maximum exposure under these arrangements is unknown as this would involve future claims that may be made against the Fund that have not yet occurred. The risk of material loss as a result of such indemnification claims is considered remote. |
| I. | Futures Contracts — The Fund may enter into futures contracts to manage exposure to interest rate, equity and market price movements and/or currency risks. A futures contract is an agreement between two parties to purchase or sell a specified underlying security, currency or commodity (or delivery of a cash settlement price, in the case of an index future) for a fixed price at a future date. The Fund currently invests only in exchange-traded futures and they are standardized as to maturity date and underlying financial instrument. Initial margin deposits required upon entering into futures contracts are satisfied by the segregation of specific securities or cash as collateral at the futures commission merchant (broker). During the period the futures contracts are open, changes in the value of the contracts are recognized as unrealized gains or losses by recalculating the value of the contracts on a daily basis. Subsequent or variation margin payments are received or made depending upon whether unrealized gains or losses are incurred. These amounts are reflected as receivables or payables on the Statement of Assets and Liabilities. When the contracts are closed or expire, the Fund recognizes a realized gain or loss equal to the difference between the proceeds from, or cost of, the closing transaction and the Fund’s basis in the contract. The net realized gain (loss) and the change in unrealized gain (loss) on futures contracts held during the period is included on the Statement of Operations. The primary risks associated with futures contracts are market risk and the absence of a liquid secondary market. If the Fund were unable to liquidate a futures contract and/or enter into an offsetting closing transaction, the Fund would continue to be subject to market risk with respect to the value of the contracts and continue to be required to maintain the margin deposits on the futures contracts. Futures contracts have minimal counterparty risk since the exchange’s clearinghouse, as counterparty to all exchange-traded futures, guarantees the futures against default. Risks may exceed amounts recognized in the Statement of Assets and Liabilities. |
| J. | Collateral — To the extent the Fund has designated or segregated a security as collateral and that security is subsequently sold, it is the Fund’s practice to replace such collateral no later than the next business day. |
16 Invesco Low Volatility Equity Yield Fund
NOTE 2—Advisory Fees and Other Fees Paid to Affiliates
The Trust has entered into a master investment advisory agreement with Invesco Advisers, Inc. (the “Adviser” or “Invesco”). Under the terms of the investment advisory agreement, the Fund pays an advisory fee to the Adviser based on the annual rate of the Fund’s average daily net assets as follows:
| Average Daily Net Assets | Rate | |||||
First $250 million | 0 | .60% | ||||
Next $250 million | 0 | .575% | ||||
Next $500 million | 0 | .55% | ||||
Next $1.5 billion | 0 | .525% | ||||
Next $2.5 billion | 0 | .50% | ||||
Next $2.5 billion | 0 | .475% | ||||
Next $2.5 billion | 0 | .45% | ||||
Over $10 billion | 0 | .425% | ||||
Under the terms of a master sub-advisory agreement between the Adviser and each of Invesco Asset Management Deutschland GmbH, Invesco Asset Management Limited, Invesco Asset Management (Japan) Limited, Invesco Australia Limited, Invesco Hong Kong Limited, Invesco Senior Secured Management, Inc. and Invesco Canada Ltd. (collectively, the “Affiliated Sub-Advisers”) the Adviser, not the Fund, may pay 40% of the fees paid to the Adviser to any such Affiliated Sub-Adviser(s) that provide(s) discretionary investment management services to the Fund based on the percentage of assets allocated to such Sub-Adviser(s).
The Adviser has contractually agreed, through at least June 30, 2015, to waive advisory fees and/or reimburse expenses to the extent necessary to limit total annual fund operating expenses after fee waiver and/or reimbursement (excluding certain items discussed below) of Class A, Class B, Class C, Class R, Class Y, Investor Class and Class R5 shares to 2.00%, 2.75%, 2.75%, 2.25%, 1.75%, 2.00% and 1.75% of average daily net assets, respectively. In determining the Adviser’s obligation to waive advisory fees and/or reimburse expenses, the following expenses are not taken into account, and could cause the total annual fund operating expenses after fee waiver and/or reimbursement to exceed the numbers reflected above: (1) interest; (2) taxes; (3) dividend expense on short sales; (4) extraordinary or non-routine items, including litigation expenses; and (5) expenses that the Fund has incurred but did not actually pay because of an expense offset arrangement. Unless Invesco continues the fee waiver agreement, it will terminate on June 30, 2015. The fee waiver agreement cannot be terminated during its term. The Adviser did not waive fees and/or reimburse expenses during the period under this expense limitation.
Further, the Adviser has contractually agreed, through at least June 30, 2016, to waive the advisory fee payable by the Fund in an amount equal to 100% of the net advisory fees the Adviser receives from the affiliated money market funds on investments by the Fund of uninvested cash in such affiliated money market funds.
For the year ended August 31, 2014, the Adviser waived advisory fees of $11,956.
The Trust has entered into a master administrative services agreement with Invesco pursuant to which the Fund has agreed to pay Invesco for certain administrative costs incurred in providing accounting services to the Fund. For the year ended August 31, 2014, expenses incurred under the agreement are shown in the Statement of Operations as Administrative services fees.
The Trust has entered into a transfer agency and service agreement with Invesco Investment Services, Inc. (“IIS”) pursuant to which the Fund has agreed to pay IIS a fee for providing transfer agency and shareholder services to the Fund and reimburse IIS for certain expenses incurred by IIS in the course of providing such services. IIS may make payments to intermediaries that provide omnibus account services, sub-accounting services and/or networking services. All fees payable by IIS to intermediaries that provide omnibus account services or sub-accounting are charged back to the Fund, subject to certain limitations approved by the Trust’s Board of Trustees. For the year ended August 31, 2014, expenses incurred under the agreement are shown in the Statement of Operations as Transfer agent fees.
The Trust has entered into master distribution agreements with Invesco Distributors, Inc. (“IDI”) to serve as the distributor for the Class A, Class B, Class C, Class R, Class Y, Investor Class and Class R5 shares of the Fund. The Trust has adopted plans pursuant to Rule 12b-1 under the 1940 Act with respect to the Fund’s Class A, Class B, Class C, Class R and Investor Class shares (collectively, the “Plans”). The Fund, pursuant to the Plans, pays IDI compensation at the annual rate of 0.25% of the Fund’s average daily net assets of Class A shares, 1.00% of the average daily net assets of Class B and Class C shares, 0.50% of the average daily net assets of Class R shares and 0.25% of the average daily net assets of Investor Class shares. Of the Plan payments, up to 0.25% of the average daily net assets of each class of shares may be paid to furnish continuing personal shareholder services to customers who purchase and own shares of such classes. Any amounts not paid as a service fee under the Plans would constitute an asset-based sales charge. Rules of the Financial Industry Regulatory Authority (“FINRA”) impose a cap on the total sales charges, including asset-based sales charges, that may be paid by any class of shares of the Fund. For the year ended August 31, 2014, expenses incurred under the Plans are shown in the Statement of Operations as Distribution fees.
Front-end sales commissions and CDSC (collectively, the “sales charges”) are not recorded as expenses of the Fund. Front-end sales commissions are deducted from proceeds from the sales of Fund shares prior to investment in Class A shares of the Fund. CDSC are deducted from redemption proceeds prior to remittance to the shareholder. During the year ended August 31, 2014, IDI advised the Fund that IDI retained $17,076 in front-end sales commissions from the sale of Class A shares and $5, $6,511 and $691 from Class A, Class B and Class C shares, respectively, for CDSC imposed on redemptions by shareholders.
Certain officers and trustees of the Trust are officers and directors of the Adviser, IIS and/or IDI.
17 Invesco Low Volatility Equity Yield Fund
NOTE 3—Additional Valuation Information
GAAP defines fair value as the price that would be received to sell an asset or paid to transfer a liability in an orderly transaction between market participants at the measurement date, under current market conditions. GAAP establishes a hierarchy that prioritizes the inputs to valuation methods, giving the highest priority to readily available unadjusted quoted prices in an active market for identical assets (Level 1) and the lowest priority to significant unobservable inputs (Level 3), generally when market prices are not readily available or are unreliable. Based on the valuation inputs, the securities or other investments are tiered into one of three levels. Changes in valuation methods may result in transfers in or out of an investment’s assigned level:
| Level 1 — | Prices are determined using quoted prices in an active market for identical assets. |
| Level 2 — | Prices are determined using other significant observable inputs. Observable inputs are inputs that other market participants may use in pricing a security. These may include quoted prices for similar securities, interest rates, prepayment speeds, credit risk, yield curves, loss severities, default rates, discount rates, volatilities and others. |
| Level 3 — | Prices are determined using significant unobservable inputs. In situations where quoted prices or observable inputs are unavailable (for example, when there is little or no market activity for an investment at the end of the period), unobservable inputs may be used. Unobservable inputs reflect the Fund’s own assumptions about the factors market participants would use in determining fair value of the securities or instruments and would be based on the best available information. |
The following is a summary of the tiered valuation input levels, as of August 31, 2014. The level assigned to the securities valuations may not be an indication of the risk or liquidity associated with investing in those securities. Because of the inherent uncertainties of valuation, the values reflected in the financial statements may materially differ from the value received upon actual sale of those investments.
| Level 1 | Level 2 | Level 3 | Total | |||||||||||||
Equity Securities | $ | 363,236,595 | $ | — | $ | — | $ | 363,236,595 | ||||||||
U.S. Treasury Securities | — | 699,996 | — | 699,996 | ||||||||||||
| 363,236,595 | 699,996 | — | 363,936,591 | |||||||||||||
Futures Contracts* | 291,140 | — | — | 291,140 | ||||||||||||
Total Investments | $ | 363,527,735 | $ | 699,996 | $ | — | $ | 364,227,731 | ||||||||
| * | Unrealized appreciation. |
NOTE 4—Derivative Investments
Value of Derivative Investments at Period-End
The table below summarizes the value of the Fund’s derivative investments, detailed by primary risk exposure, held as of August 31, 2014:
| Value | ||||||||
| Risk Exposure/Derivative Type | Assets | Liabilities | ||||||
Market risk: | ||||||||
Futures contracts(a) | $ | 291,140 | $ | — | ||||
| (a) | Includes cumulative appreciation of futures contracts. Only current day’s variation margin receivable is reported within the Statement of Assets and Liabilities. |
Effect of Derivative Investments for the year ended August 31, 2014
The table below summarizes the gains on derivative investments, detailed by primary risk exposure, recognized in earnings during the period:
| Location of Gain on Statement of Operations | ||||
| Futures Contracts | ||||
Realized Gain: | ||||
Market risk | $ | 1,607,443 | ||
Change in Unrealized Appreciation: | ||||
Market risk | 448,896 | |||
Total | $ | 2,056,339 | ||
The table below summarizes the average notional value of futures contracts outstanding during the period.
| Futures Contracts | ||||
Average notional value | $ | 8,930,434 | ||
| Open Futures Contracts at Period-End | ||||||||||||||||||||
| Futures Contracts — Market risk | Type of Contract | Number of Contracts | Expiration Month | Notional Value | Unrealized Appreciation | |||||||||||||||
E- Mini S&P 500 Index | Long | 103 | September-2014 | $ | 10,307,210 | $ | 291,140 | |||||||||||||
18 Invesco Low Volatility Equity Yield Fund
Offsetting Assets and Liabilities
Accounting Standards Update (“ASU”) No. 2011-11, Disclosures about Offsetting Assets and Liabilities, which was subsequently clarified in Financial Accounting Standards Board ASU 2013-01 “Clarifying the Scope of Disclosures about Offsetting Assets and Liabilities” is intended to enhance disclosures about financial instruments and derivative instruments that are subject to offsetting arrangements on the Statement of Assets and Liabilities and to enable investors to better understand the effect of those arrangements on its financial position. In order for an arrangement to be eligible for netting, the Fund must have a basis to conclude that such netting arrangements are legally enforceable. The Fund enters into netting agreements and collateral agreements in an attempt to reduce the Fund’s Counterparty credit risk by providing for a single net settlement with a Counterparty of all financial transactions covered by the agreement in an event of default as defined under such agreement.
There were no derivative instruments subject to a netting agreement for which the Fund is not currently netting. The following tables present derivative instruments that are either subject to an enforceable netting agreement or offset by collateral arrangements as of August 31, 2014.
| Assets: | ||||||||||||||||||||||||
| Gross amounts presented in Statement of Assets & Liabilities* | Gross amounts offset in Statement of Assets & Liabilities | Net amounts of assets presented in the Statement of Assets & Liabilities | Collateral Received | |||||||||||||||||||||
| Counterparty | Financial Instruments | Cash | Net Amount | |||||||||||||||||||||
Bank of America Securities LLC | $ | 291,140 | $ | — | $ | 291,140 | $ | — | $ | — | $ | 291,140 | ||||||||||||
| * | Includes cumulative appreciation of futures contracts. |
NOTE 5—Expense Offset Arrangement(s)
The expense offset arrangement is comprised of transfer agency credits which result from balances in demand deposit accounts used by the transfer agent for clearing shareholder transactions. For the year ended August 31, 2014, the Fund received credits from this arrangement, which resulted in the reduction of the Fund’s total expenses of $2,123.
NOTE 6—Trustees’ and Officers’ Fees and Benefits
Trustees’ and Officers’ Fees and Benefits include amounts accrued by the Fund to pay remuneration to certain Trustees and Officers of the Fund. Trustees have the option to defer compensation payable by the Fund, and Trustees’ and Officers’ Fees and Benefits also include amounts accrued by the Fund to fund such deferred compensation amounts. Those Trustees who defer compensation have the option to select various Invesco Funds in which their deferral accounts shall be deemed to be invested. Finally, certain current Trustees were eligible to participate in a retirement plan that provided for benefits to be paid upon retirement to Trustees over a period of time based on the number of years of service. The Fund may have certain former Trustees who also participate in a retirement plan and receive benefits under such plan. Trustees’ and Officers’ Fees and Benefits include amounts accrued by the Fund to fund such retirement benefits. Obligations under the deferred compensation and retirement plans represent unsecured claims against the general assets of the Fund.
NOTE 7—Cash Balances
The Fund is permitted to temporarily carry a negative or overdrawn balance in its account with State Street Bank and Trust Company, the custodian bank. Such balances, if any at period end, are shown in the Statement of Assets and Liabilities under the payable caption Amount due custodian. To compensate the custodian bank for such overdrafts, the overdrawn Fund may either (1) leave funds as a compensating balance in the account so the custodian bank can be compensated by earning the additional interest; or (2) compensate by paying the custodian bank at a rate agreed upon by the custodian bank and Invesco, not to exceed the contractually agreed upon rate.
NOTE 8—Distributions to Shareholders and Tax Components of Net Assets
Tax Character of Distributions to Shareholders Paid During the Years Ended August 31, 2014 and 2013:
| 2014 | 2013 | |||||||
Ordinary income | $ | 8,860,538 | $ | 3,608,598 | ||||
Long-term capital gain | 5,394,957 | — | ||||||
Total distributions | $ | 14,255,495 | $ | 3,608,598 | ||||
Tax Components of Net Assets at Period-End:
| 2014 | ||||
Undistributed ordinary income | $ | 4,300,556 | ||
Undistributed long-term gain | 25,755,321 | |||
Net unrealized appreciation — investments | 40,468,860 | |||
Temporary book/tax differences | (221,296 | ) | ||
Capital loss carryforward | (42,889,200 | ) | ||
Shares of beneficial interest | 336,742,435 | |||
Total net assets | $ | 364,156,676 | ||
19 Invesco Low Volatility Equity Yield Fund
The difference between book-basis and tax-basis unrealized appreciation (depreciation) is due to differences in the timing of recognition of gains and losses on investments for tax and book purposes. The Fund’s net unrealized appreciation difference is attributable primarily to wash sales and futures contracts.
The temporary book/tax differences are a result of timing differences between book and tax recognition of income and/or expenses. The Fund’s temporary book/tax differences are the result of the trustee deferral of compensation and retirement plan benefits.
Capital loss carryforward is calculated and reported as of a specific date. Results of transactions and other activity after that date may affect the amount of capital loss carryforward actually available for the Fund to utilize. Capital losses generated in years beginning after December 22, 2010 can be carried forward for an unlimited period, whereas previous losses expire in 8 tax years. Capital losses with an expiration period may not be used to offset capital gains until all net capital losses without an expiration date have been utilized. Capital loss carryforwards with no expiration date will retain their character as either short-term or long-term capital losses instead of as short-term capital losses as under prior law. The ability to utilize capital loss carryforward in the future may be limited under the Internal Revenue Code and related regulations based on the results of future transactions.
The Fund utilized $24,585,210 of capital loss carryforward in the current period to offset net realized capital gain for federal income tax purposes. The Fund has a capital loss carryforward as of August 31, 2014, which expires as follows:
| Capital Loss Carryforward* | ||||||||||||
| Expiration | Short-Term | Long-Term | Total | |||||||||
August 31, 2016 | $ | 20,591,619 | $ | — | $ | 20,591,619 | ||||||
August 31, 2018 | 22,297,581 | — | 22,297,581 | |||||||||
| $ | 42,889,200 | $ | — | $ | 42,889,200 | |||||||
| * | Capital loss carryforward as of the date listed above is reduced for limitations, if any, to the extent required by the Internal Revenue Code and may be further limited depending upon a variety of factors, including the realization of net unrealized gains or losses as of the date of any reorganization. |
NOTE 9—Investment Securities
The aggregate amount of investment securities (other than short-term securities, U.S. Treasury obligations and money market funds, if any) purchased and sold by the Fund during the year ended August 31, 2014 was $367,939,884 and $397,489,698, respectively. Cost of investments on a tax basis includes the adjustments for financial reporting purposes as of the most recently completed federal income tax reporting period-end.
| Unrealized Appreciation (Depreciation) of Investment Securities on a Tax Basis | ||||
Aggregate unrealized appreciation of investment securities | $ | 42,337,758 | ||
Aggregate unrealized (depreciation) of investment securities | (1,868,898 | ) | ||
Net unrealized appreciation of investment securities | $ | 40,468,860 | ||
Cost of investments for tax purposes is $323,467,731.
NOTE 10—Reclassification of Permanent Differences
Primarily as a result of differing book/tax treatment of partnership reclasses, on August 31, 2014, undistributed net investment income was increased by $62,319 and undistributed net realized gain (loss) was decreased by $62,319. This reclassification had no effect on the net assets of the Fund.
20 Invesco Low Volatility Equity Yield Fund
NOTE 11—Share Information
| Summary of Share Activity | ||||||||||||||||
| Years ended August 31, | ||||||||||||||||
| 2014(a) | 2013 | |||||||||||||||
| Shares | Amount | Shares | Amount | |||||||||||||
Sold: | ||||||||||||||||
Class A | 942,877 | $ | 10,325,144 | 791,263 | $ | 7,509,498 | ||||||||||
Class B | 19,559 | 214,463 | 27,394 | 256,786 | ||||||||||||
Class C | 248,245 | 2,662,846 | 224,308 | 2,102,551 | ||||||||||||
Class R | 6,518 | 69,319 | 47,129 | 407,001 | ||||||||||||
Class Y | 162,907 | 1,791,033 | 124,611 | 1,160,536 | ||||||||||||
Investor Class | 486,151 | 5,236,634 | 598,412 | 5,620,041 | ||||||||||||
Class R5 | 135,907 | 1,500,816 | 251,033 | 2,499,070 | ||||||||||||
Issued as reinvestment of dividends: | ||||||||||||||||
Class A | 764,241 | 8,048,990 | 248,581 | 2,142,768 | ||||||||||||
Class B | 38,089 | 394,085 | 4,655 | 39,806 | ||||||||||||
Class C | 108,516 | 1,121,474 | 10,631 | 90,790 | ||||||||||||
Class R | 731 | 7,634 | 1,023 | 8,795 | ||||||||||||
Class Y | 14,543 | 154,082 | 6,167 | 53,284 | ||||||||||||
Investor Class | 243,096 | 2,566,955 | 87,128 | 753,658 | ||||||||||||
Class R5 | 61,598 | 654,033 | 21,468 | 185,483 | ||||||||||||
Automatic conversion of Class B shares to Class A shares: | ||||||||||||||||
Class A | 158,984 | 1,737,656 | 218,167 | 2,029,866 | ||||||||||||
Class B | (161,092 | ) | (1,737,656 | ) | (220,775 | ) | (2,029,866 | ) | ||||||||
Reacquired: | ||||||||||||||||
Class A | (2,738,197 | ) | (29,580,990 | ) | (4,206,505 | ) | (38,916,081 | ) | ||||||||
Class B | (214,003 | ) | (2,294,256 | ) | (444,734 | ) | (4,062,404 | ) | ||||||||
Class C | (687,387 | ) | (7,315,411 | ) | (1,269,208 | ) | (11,513,966 | ) | ||||||||
Class R | (9,723 | ) | (103,450 | ) | (151,067 | ) | (1,321,625 | ) | ||||||||
Class Y | (139,361 | ) | (1,500,387 | ) | (203,050 | ) | (1,904,651 | ) | ||||||||
Investor Class | (1,608,307 | ) | (17,156,426 | ) | (1,540,011 | ) | (14,499,670 | ) | ||||||||
Class R5 | (116,076 | ) | (1,277,102 | ) | (285,481 | ) | (2,718,546 | ) | ||||||||
Net increase (decrease) in share activity | (2,282,184 | ) | $ | (24,480,514 | ) | (5,658,861 | ) | $ | (52,106,876 | ) | ||||||
| (a) | There are entities that are record owners of more than 5% of the outstanding shares of the Fund and in the aggregate own 18% of the outstanding shares of the Fund. IDI has an agreement with these entities to sell Fund shares. The Fund, Invesco and/or Invesco affiliates may make payments to these entities, which are considered to be related to the Fund, for providing services to the Fund, Invesco and/or Invesco affiliates including but not limited to services such as securities brokerage, distribution, third party record keeping and account servicing. The Fund has no knowledge as to whether all or any portion of the shares owned of record by these entities are also owned beneficially. |
21 Invesco Low Volatility Equity Yield Fund
NOTE 12—Financial Highlights
The following schedule presents financial highlights for a share of the Fund outstanding throughout the periods indicated.
Net asset value, beginning of period | Net investment income(a) | Net gains (losses) (both realized and unrealized) | Total from investment operations | Dividends from net investment income | Distributions from net realized | Total distributions | Net asset value, end of period | Total return(b) | Net assets, end of period (000’s omitted) | Ratio of expenses to average net assets with fee waivers and/or expenses absorbed | Ratio of expenses to average net fee waivers and/or expenses absorbed | Ratio of net investment net assets | Portfolio turnover(c) | |||||||||||||||||||||||||||||||||||||||||||
Class A | ||||||||||||||||||||||||||||||||||||||||||||||||||||||||
Year ended 08/31/14 | $ | 9.98 | $ | 0.31 | $ | 1.92 | $ | 2.23 | $ | (0.29 | ) | $ | (0.17 | ) | $ | (0.46 | ) | $ | 11.75 | 22.91 | % | $ | 224,786 | 1.14 | %(d) | 1.14 | %(d) | 2.80 | %(d) | 109 | % | |||||||||||||||||||||||||
Year ended 08/31/13 | 8.66 | 0.12 | 1.31 | 1.43 | (0.11 | ) | — | (0.11 | ) | 9.98 | 16.71 | 199,636 | 1.18 | 1.18 | 1.31 | 107 | ||||||||||||||||||||||||||||||||||||||||
Year ended 08/31/12 | 7.34 | 0.09 | 1.27 | 1.36 | (0.04 | ) | — | (0.04 | ) | 8.66 | 18.54 | 198,831 | 1.03 | 1.23 | 1.10 | 45 | ||||||||||||||||||||||||||||||||||||||||
Year ended 08/31/11 | 6.29 | 0.07 | 1.06 | 1.13 | (0.08 | ) | — | (0.08 | ) | 7.34 | 18.00 | 204,311 | 1.00 | 1.22 | 0.90 | 125 | ||||||||||||||||||||||||||||||||||||||||
Year ended 08/31/10 | 6.47 | 0.06 | (0.12 | ) | (0.06 | ) | (0.12 | ) | — | (0.12 | ) | 6.29 | (1.07 | ) | 1,265 | 1.00 | 1.31 | 0.93 | 71 | |||||||||||||||||||||||||||||||||||||
Class B | ||||||||||||||||||||||||||||||||||||||||||||||||||||||||
Year ended 08/31/14 | 9.84 | 0.22 | 1.90 | 2.12 | (0.20 | ) | (0.17 | ) | (0.37 | ) | 11.59 | 22.08 | 11,962 | 1.89 | (d) | 1.89 | (d) | 2.05 | (d) | 109 | ||||||||||||||||||||||||||||||||||||
Year ended 08/31/13 | 8.53 | 0.05 | 1.29 | 1.34 | (0.03 | ) | — | (0.03 | ) | 9.84 | 15.72 | 13,288 | 1.93 | 1.93 | 0.56 | 107 | ||||||||||||||||||||||||||||||||||||||||
Year ended 08/31/12 | 7.26 | 0.03 | 1.26 | 1.29 | (0.02 | ) | — | (0.02 | ) | 8.53 | 17.75 | 16,913 | 1.78 | 1.98 | 0.35 | 45 | ||||||||||||||||||||||||||||||||||||||||
Year ended 08/31/11 | 6.22 | 0.01 | 1.06 | 1.07 | (0.03 | ) | — | (0.03 | ) | 7.26 | 17.15 | 20,750 | 1.75 | 1.97 | 0.15 | 125 | ||||||||||||||||||||||||||||||||||||||||
Year ended 08/31/10 | 6.37 | 0.01 | (0.13 | ) | (0.12 | ) | (0.03 | ) | — | (0.03 | ) | 6.22 | (1.85 | ) | 173 | 1.75 | 2.06 | 0.18 | 71 | |||||||||||||||||||||||||||||||||||||
Class C | ||||||||||||||||||||||||||||||||||||||||||||||||||||||||
Year ended 08/31/14 | 9.82 | 0.22 | 1.89 | 2.11 | (0.20 | ) | (0.17 | ) | (0.37 | ) | 11.56 | 22.01 | 40,119 | 1.89 | (d) | 1.89 | (d) | 2.05 | (d) | 109 | ||||||||||||||||||||||||||||||||||||
Year ended 08/31/13 | 8.51 | 0.05 | 1.29 | 1.34 | (0.03 | ) | — | (0.03 | ) | 9.82 | 15.75 | 37,335 | 1.93 | 1.93 | 0.56 | 107 | ||||||||||||||||||||||||||||||||||||||||
Year ended 08/31/12 | 7.25 | 0.03 | 1.25 | 1.28 | (0.02 | ) | — | (0.02 | ) | 8.51 | 17.64 | 41,148 | 1.78 | 1.98 | 0.35 | 45 | ||||||||||||||||||||||||||||||||||||||||
Year ended 08/31/11 | 6.22 | 0.01 | 1.05 | 1.06 | (0.03 | ) | — | (0.03 | ) | 7.25 | 16.99 | 48,592 | 1.75 | 1.97 | 0.15 | 125 | ||||||||||||||||||||||||||||||||||||||||
Year ended 08/31/10 | 6.37 | 0.01 | (0.13 | ) | (0.12 | ) | (0.03 | ) | — | (0.03 | ) | 6.22 | (1.85 | ) | 219 | 1.75 | 2.06 | 0.18 | 71 | |||||||||||||||||||||||||||||||||||||
Class R | ||||||||||||||||||||||||||||||||||||||||||||||||||||||||
Year ended 08/31/14 | 9.93 | 0.28 | 1.91 | 2.19 | (0.26 | ) | (0.17 | ) | (0.43 | ) | 11.69 | 22.60 | 206 | 1.39 | (d) | 1.39 | (d) | 2.55 | (d) | 109 | ||||||||||||||||||||||||||||||||||||
Year ended 08/31/13 | 8.61 | 0.10 | 1.30 | 1.40 | (0.08 | ) | — | (0.08 | ) | 9.93 | 16.37 | 200 | 1.43 | 1.43 | 1.06 | 107 | ||||||||||||||||||||||||||||||||||||||||
Year ended 08/31/12 | 7.31 | 0.07 | 1.26 | 1.33 | (0.03 | ) | — | (0.03 | ) | 8.61 | 18.24 | 1,059 | 1.28 | 1.48 | 0.85 | 45 | ||||||||||||||||||||||||||||||||||||||||
Year ended 08/31/11 | 6.27 | 0.05 | 1.06 | 1.11 | (0.07 | ) | — | (0.07 | ) | 7.31 | 17.68 | 1,300 | 1.25 | 1.47 | 0.65 | 125 | ||||||||||||||||||||||||||||||||||||||||
Year ended 08/31/10 | 6.45 | 0.05 | (0.12 | ) | (0.07 | ) | (0.11 | ) | — | (0.11 | ) | 6.27 | (1.30 | ) | 1,335 | 1.25 | 1.56 | 0.68 | 71 | |||||||||||||||||||||||||||||||||||||
Class Y | ||||||||||||||||||||||||||||||||||||||||||||||||||||||||
Year ended 08/31/14 | 10.02 | 0.33 | 1.94 | 2.27 | (0.32 | ) | (0.17 | ) | (0.49 | ) | 11.80 | 23.24 | 5,383 | 0.89 | (d) | 0.89 | (d) | 3.05 | (d) | 109 | ||||||||||||||||||||||||||||||||||||
Year ended 08/31/13 | 8.71 | 0.15 | 1.30 | 1.45 | (0.14 | ) | — | (0.14 | ) | 10.02 | 16.90 | 4,189 | 0.93 | 0.93 | 1.56 | 107 | ||||||||||||||||||||||||||||||||||||||||
Year ended 08/31/12 | 7.37 | 0.11 | 1.27 | 1.38 | (0.04 | ) | — | (0.04 | ) | 8.71 | 18.89 | 4,269 | 0.78 | 0.98 | 1.35 | 45 | ||||||||||||||||||||||||||||||||||||||||
Year ended 08/31/11 | 6.32 | 0.09 | 1.06 | 1.15 | (0.10 | ) | — | (0.10 | ) | 7.37 | 18.24 | 3,846 | 0.75 | 0.97 | 1.15 | 125 | ||||||||||||||||||||||||||||||||||||||||
Year ended 08/31/10 | 6.50 | 0.08 | (0.13 | ) | (0.05 | ) | (0.13 | ) | — | (0.13 | ) | 6.32 | (0.85 | ) | 142 | 0.75 | 1.06 | 1.18 | 71 | |||||||||||||||||||||||||||||||||||||
Investor Class | ||||||||||||||||||||||||||||||||||||||||||||||||||||||||
Year ended 08/31/14 | 10.01 | 0.31 | 1.92 | 2.23 | (0.29 | ) | (0.17 | ) | (0.46 | ) | 11.78 | 22.85 | 65,428 | 1.14 | (d) | 1.14 | (d) | 2.80 | (d) | 109 | ||||||||||||||||||||||||||||||||||||
Year ended 08/31/13 | 8.69 | 0.12 | 1.31 | 1.43 | (0.11 | ) | — | (0.11 | ) | 10.01 | 16.65 | 64,369 | 1.18 | 1.18 | 1.31 | 107 | ||||||||||||||||||||||||||||||||||||||||
Year ended 08/31/12 | 7.36 | 0.09 | 1.28 | 1.37 | (0.04 | ) | — | (0.04 | ) | 8.69 | 18.63 | 63,296 | 1.03 | 1.23 | 1.10 | 45 | ||||||||||||||||||||||||||||||||||||||||
Year ended 08/31/11 | 6.32 | 0.07 | 1.05 | 1.12 | (0.08 | ) | — | (0.08 | ) | 7.36 | 17.76 | 63,890 | 1.00 | 1.22 | 0.90 | 125 | ||||||||||||||||||||||||||||||||||||||||
Year ended 08/31/10 | 6.50 | 0.06 | (0.12 | ) | (0.06 | ) | (0.12 | ) | — | (0.12 | ) | 6.32 | (1.07 | ) | 69,635 | 1.00 | 1.31 | 0.93 | 71 | |||||||||||||||||||||||||||||||||||||
Class R5 | ||||||||||||||||||||||||||||||||||||||||||||||||||||||||
Year ended 08/31/14 | 10.03 | 0.35 | 1.94 | 2.29 | (0.33 | ) | (0.17 | ) | (0.50 | ) | 11.82 | 23.48 | 16,272 | 0.75 | (d) | 0.75 | (d) | 3.19 | (d) | 109 | ||||||||||||||||||||||||||||||||||||
Year ended 08/31/13 | 8.71 | 0.16 | 1.31 | 1.47 | (0.15 | ) | — | (0.15 | ) | 10.03 | 17.12 | 13,000 | 0.76 | 0.76 | 1.73 | 107 | ||||||||||||||||||||||||||||||||||||||||
Year ended 08/31/12 | 7.37 | 0.11 | 1.28 | 1.39 | (0.05 | ) | — | (0.05 | ) | 8.71 | 18.90 | 11,397 | 0.76 | 0.77 | 1.37 | 45 | ||||||||||||||||||||||||||||||||||||||||
Year ended 08/31/11 | 6.32 | 0.09 | 1.06 | 1.15 | (0.10 | ) | — | (0.10 | ) | 7.37 | 18.24 | 11,645 | 0.74 | 0.77 | 1.18 | 125 | ||||||||||||||||||||||||||||||||||||||||
Year ended 08/31/10 | 6.50 | 0.08 | (0.12 | ) | (0.04 | ) | (0.14 | ) | — | (0.14 | ) | 6.32 | (0.83 | ) | 11,793 | 0.75 | 0.91 | 1.18 | 71 | |||||||||||||||||||||||||||||||||||||
| (a) | Calculated using average shares outstanding. |
| (b) | Includes adjustments in accordance with accounting principles generally accepted in the United States of America and as such, the net asset value for financial reporting purposes and the returns based upon those net asset values may differ from the net asset value and returns for shareholder transactions. Does not include sales charges and is not annualized for periods less than one year, if applicable. |
| (c) | Portfolio turnover is calculated at the fund level and is not annualized for periods less than one year, if applicable. For the period ended August 31, 2011, the portfolio turnover calculation excludes the value of securities purchased of $286,080,448 and sold of $155,521,831 in the effort to realign the Fund’s portfolio holdings after the reorganization of Invesco Select Equity Fund and Invesco Van Kampen Equity Premium Income Fund into the Fund. |
| (d) | Ratios are based on average daily net assets (000’s omitted) of $211,745, $12,888, $38,802, $204, $4,552, $62,850 and $14,593 for Class A, Class B, Class C, Class R, Class Y, Investor Class, and Class R5 shares, respectively. |
22 Invesco Low Volatility Equity Yield Fund
Report of Independent Registered Public Accounting Firm
To the Board of Trustees of AIM Counselor Series Trust (Invesco Counselor Series Trust) and Shareholders of Invesco Low Volatility Equity Yield Fund:
In our opinion, the accompanying statement of assets and liabilities, including the schedule of investments, and the related statements of operations and of changes in net assets and the financial highlights present fairly, in all material respects, the financial position of Invesco Low Volatility Equity Yield Fund (one of the funds constituting AIM Counselor Series Trust (Invesco Counselor Series Trust), hereafter referred to as the “Fund”) at August 31, 2014, the results of its operations for the year then ended, the changes in its net assets for each of the two years in the period then ended and the financial highlights for each of the five years in the period then ended, in conformity with accounting principles generally accepted in the United States of America. These financial statements and financial highlights (hereafter referred to as “financial statements”) are the responsibility of the Fund’s management. Our responsibility is to express an opinion on these financial statements based on our audits. We conducted our audits of these financial statements in accordance with the standards of the Public Company Accounting Oversight Board (United States). Those standards require that we plan and perform the audit to obtain reasonable assurance about whether the financial statements are free of material misstatement. An audit includes examining, on a test basis, evidence supporting the amounts and disclosures in the financial statements, assessing the accounting principles used and significant estimates made by management, and evaluating the overall financial statement presentation. We believe that our audits, which included confirmation of securities at August 31, 2014 by correspondence with the custodian and brokers, provide a reasonable basis for our opinion.
PRICEWATERHOUSECOOPERS LLP
October 27, 2014
Houston, Texas
23 Invesco Low Volatility Equity Yield Fund
Calculating your ongoing Fund expenses
Example
As a shareholder of the Fund, you incur two types of costs: (1) transaction costs, which may include sales charges (loads) on purchase payments or contingent deferred sales charges on redemptions, if any; and (2) ongoing costs, including management fees, distribution and/or service (12b-1) fees, and other Fund expenses. This example is intended to help you understand your ongoing costs (in dollars) of investing in the Fund and to compare these costs with ongoing costs of investing in other mutual funds. The example is based on an investment of $1,000 invested at the beginning of the period and held for the entire period March 1, 2014 through August 31, 2014.
Actual expenses
The table below provides information about actual account values and actual expenses. You may use the information in this table, together with the amount you invested, to estimate the expenses that you paid over the period. Simply divide your account value by $1,000 (for example, an $8,600 account value divided by $1,000 = 8.6), then multiply the result by the number in the table under the heading entitled “Actual Expenses Paid During Period” to estimate the expenses you paid on your account during this period.
Hypothetical example for comparison purposes
The table below also provides information about hypothetical account values and hypothetical expenses based on the Fund’s actual expense ratio and an assumed rate of return of 5% per year before expenses, which is not the Fund’s actual return.
The hypothetical account values and expenses may not be used to estimate the actual ending account balance or expenses you paid for the period. You may use this information to compare the ongoing costs of investing in the Fund and other funds. To do so, compare this 5% hypothetical example with the 5% hypothetical examples that appear in the shareholder reports of the other funds.
Please note that the expenses shown in the table are meant to highlight your ongoing costs only and do not reflect any transaction costs, such as sales charges (loads) on purchase payments or contingent deferred sales charges on redemptions, if any. Therefore, the hypothetical information is useful in comparing ongoing costs only, and will not help you determine the relative total costs of owning different funds. In addition, if these transaction costs were included, your costs would have been higher.
| Class | Beginning Account Value (03/01/14) | ACTUAL | HYPOTHETICAL (5% annual return before expenses) | Annualized Expense Ratio | ||||||||||||||||||||
| Ending Account Value (08/31/14)1 | Expenses Paid During Period2 | Ending Account Value (08/31/14) | Expenses Paid During Period2 | |||||||||||||||||||||
| A | $ | 1,000.00 | $ | 1,106.30 | $ | 6.21 | $ | 1,019.31 | $ | 5.96 | 1.17 | % | ||||||||||||
| B | 1,000.00 | 1,101.60 | 10.17 | 1,015.53 | 9.75 | 1.92 | ||||||||||||||||||
| C | 1,000.00 | 1,101.80 | 10.17 | 1,015.53 | 9.75 | 1.92 | ||||||||||||||||||
| R | 1,000.00 | 1,104.50 | 7.53 | 1,018.05 | 7.22 | 1.42 | ||||||||||||||||||
| Y | 1,000.00 | 1,107.30 | 4.89 | 1,020.57 | 4.69 | 0.92 | ||||||||||||||||||
| Investor | 1,000.00 | 1,106.00 | 6.21 | 1,019.31 | 5.96 | 1.17 | ||||||||||||||||||
| R5 | 1,000.00 | 1,108.90 | 3.93 | 1,021.48 | 3.77 | 0.74 | ||||||||||||||||||
| 1 | The actual ending account value is based on the actual total return of the Fund for the period March 1, 2014 through August 31, 2014, after actual expenses and will differ from the hypothetical ending account value which is based on the Fund’s expense ratio and a hypothetical annual return of 5% before expenses. |
| 2 | Expenses are equal to the Fund’s annualized expense ratio as indicated above multiplied by the average account value over the period, multiplied by 184/365 to reflect the most recent fiscal half year. |
24 Invesco Low Volatility Equity Yield Fund
Approval of Investment Advisory and Sub-Advisory Contracts
The Board of Trustees (the Board) of AIM Counselor Series Trust (Invesco Counselor Series Trust) is required under the Investment Company Act of 1940, as amended, to approve annually the renewal of Invesco Low Volatility Equity Yield Fund’s (the Fund) investment advisory agreements. During contract renewal meetings held on June 16-17, 2014, the Board as a whole, and the disinterested or “independent” Trustees, who comprise over 75% of the Board, voting separately, approved the continuance for the Fund of the Master Investment Advisory Agreement with Invesco Advisers, Inc. (Invesco Advisers) and the Master Intergroup Sub-Advisory Contract for Mutual Funds with Invesco Asset Management Deutschland GmbH, Invesco Asset Management Limited, Invesco Asset Management (Japan) Limited, Invesco Australia Limited, Invesco Hong Kong Limited, Invesco Senior Secured Management, Inc. and Invesco Canada Ltd. (collectively, the Affiliated Sub-Advisers and the sub-advisory contracts) for another year, effective July 1, 2014.
In evaluating the fairness and reasonableness of compensation under the Fund’s investment advisory agreement and sub-advisory contracts, the Board considered, among other things, the factors discussed below. The Board determined that the continuation of the Fund’s investment advisory agreement and the sub-advisory contracts are in the best interest of the Fund and its shareholders and that the compensation payable to Invesco Advisers and the Affiliated Sub-Advisers under the agreements is fair and reasonable.
The Board’s Fund Evaluation Process
The Board’s Investments Committee has established three Sub-Committees, each of which is primarily responsible for overseeing the management of a number of the funds advised by Invesco Advisers (the Invesco Funds). The Sub-Committees meet throughout the year to review the performance of their assigned Invesco Funds, including reviewing materials prepared under the direction of the independent Senior Officer, an officer of the Invesco Funds who reports directly to the independent Trustees. Over the course of each year, the Sub-Committees meet with portfolio managers for their assigned Invesco Funds and other members of management to review the performance, investment objective(s), policies, strategies, limitations and investment risks of these funds. The Sub-Committees meet regularly and at designated contract renewal meetings each year to conduct a review of the performance, fees, expenses and other matters related to their assigned Invesco Funds. Each Sub-Committee recommends to the Investments Committee, which in turn recommends to the full Board, whether and on what terms to approve the continuance of each Invesco Fund’s
investment advisory agreement and sub-advisory contracts for another year.
During the contract renewal process, the Trustees receive comparative performance and fee data regarding the Invesco Funds prepared by Invesco Advisers and Lipper Inc. (Lipper), an independent provider of investment company data. The Trustees also receive an independent written evaluation from the Senior Officer. The Senior Officer’s evaluation is prepared as part of his responsibility to manage the process by which the Invesco Funds’ proposed management fees are negotiated during the annual contract renewal process to ensure they are negotiated in a manner that is at arms’ length and reasonable. In addition to meetings with Invesco Advisers and fund counsel, the independent Trustees also discuss the continuance of the investment advisory agreement and sub-advisory contracts in separate sessions with the Senior Officer and with independent legal counsel.
The Trustees recognized that the advisory fee rates for the Invesco Funds are, in many cases, the result of years of review and negotiation. The Trustees’ deliberations and conclusions in a particular year may be based in part on their deliberations and conclusions regarding these arrangements throughout the year and in prior years. The Trustees’ review and conclusions are based on the comprehensive consideration of all information presented to them and are not the result of any single determinative factor. Moreover, one Trustee may have weighed a particular piece of information or factor differently than another Trustee.
The discussion below serves as the Senior Officer’s independent written evaluation with respect to the Fund’s investment advisory agreement as well as a discussion of the material factors and related conclusions that formed the basis for the Board’s approval of the Fund’s investment advisory agreement and sub-advisory contracts. Unless otherwise stated, this information is current as of June 17, 2014, and may not reflect consideration of factors that became known to the Board after that date.
Factors and Conclusions and Summary of Independent Written Fee Evaluation
| A. | Nature, Extent and Quality of Services Provided by Invesco Advisers and the Affiliated Sub-Advisers |
The Board reviewed the advisory services provided to the Fund by Invesco Advisers under the Fund’s investment advisory agreement, the performance of Invesco Advisers in providing these services, and the credentials and experience of the officers and employees of Invesco Advisers who provide these services, including the Fund’s portfolio manager or managers, with whom the Sub-Committees met during the year. The Board’s review of the
qualifications of Invesco Advisers to provide advisory services included the Board’s consideration of Invesco Advisers’ investment process oversight, independent credit analysis and investment risk management. The Board also considered non-advisory services that Invesco Advisers and its affiliates provide to the Invesco Funds such as various back office support functions, equity and fixed income trading operations, internal audit, distribution and legal and compliance.
In determining whether to continue the Fund’s investment advisory agreement, the Board considered the benefits of reapproving an existing relationship and the greater uncertainty that may be associated with entering into a new relationship. The Board concluded that the nature, extent and quality of the services provided to the Fund by Invesco Advisers are appropriate and satisfactory and consistent with the terms of the Fund’s investment advisory agreement.
The Board reviewed the services that may be provided by the Affiliated Sub-Advisers under the sub-advisory contracts and the credentials and experience of the officers and employees of the Affiliated Sub-Advisers who provide these services. The Board noted that the Affiliated Sub-Advisers have offices and personnel that are located in financial centers around the world. As a result, the Affiliated Sub-Advisers can provide research and investment analysis on the markets and economies of various countries in which the Fund may invest, make recommendations regarding securities and assist with security trades. The Board concluded that the sub-advisory contracts benefit the Fund and its shareholders by permitting Invesco Advisers to use the resources and talents of the Affiliated Sub-Advisers in managing the Fund. The Board concluded that the nature, extent and quality of the services that may be provided by the Affiliated Sub-Advisers are appropriate and satisfactory and consistent with the terms of the Fund’s sub-advisory contracts.
| B. | Fund Performance |
The Board considered Fund performance as a relevant factor in considering whether to approve the investment advisory agreement. The Board did not view Fund performance as a relevant factor in considering whether to approve the sub-advisory contracts for the Fund, as no Affiliated Sub-Adviser currently manages assets of the Fund.
The Board compared the Fund’s performance during the past one, three and five calendar years to the performance of funds in the Lipper performance universe and against the Lipper Equity Income Funds Index. The Board noted that performance of Class A shares of the Fund was in the fourth quintile of its performance universe for the one and five year periods and the third quintile for the three year period (the first quintile being the best performing funds
25 Invesco Low Volatility Equity Yield Fund
and the fifth quintile being the worst performing funds). The Board noted that performance of Class A shares of the Fund was below the performance of the Index for the on, three and five year periods. The Trustees also reviewed more recent Fund performance and this review did not change their conclusions.
| C. | Advisory and Sub-Advisory Fees |
The Board compared the Fund’s contractual management fee rate to the contractual management fee rates of funds in the Fund’s Lipper expense group at a common asset level. The Board noted that the contractual management fee rate for Class A shares of the Fund was below the median contractual management fee rate of funds in the expense group. The Board noted that the term “contractual management fee” may include both advisory and certain administrative services fees, but that Lipper does not provide information on a fund by fund basis as to what is included. The Board noted that Invesco Advisers does not charge the Invesco Funds for the administrative services included in the term as defined by Lipper. The Board also reviewed the methodology used by Lipper in providing expense group information, which includes using each fund’s contractual management fee schedule (including any applicable breakpoints) as reported in the most recent prospectus or statement of additional information for each fund in the expense group.
The Board noted that Invesco Advisers has contractually agreed to waive fees and/or limit expenses of the Fund through at least June 30, 2015 in an amount necessary to limit total annual operating expenses to a specified percentage of average daily net assets for each class of the Fund.
The Board also compared the Fund’s effective advisory fee rate (the advisory fee rate after advisory fee waivers and before other expense limitations/waivers) to the effective advisory fee rates of other mutual funds advised by Invesco Advisers and its affiliates that are managed using an investment process substantially similar to the investment process used for the Fund. The Board noted that the Fund’s rate was below the rate of one mutual funds advised by Invesco Advisers with a similar investment process. The Board noted that Invesco Advisers and the Affiliated Sub-Advisers do not manage other client accounts using an investment process substantially similar to the investment process used for the Fund.
The Board also considered the services that may be provided by the Affiliated Sub-Advisers pursuant to the sub-advisory contracts, as well as the fees payable by Invesco Advisers to the Affiliated Sub-Advisers pursuant to the sub-advisory contracts. The Board also noted that the sub-advisory fees are not paid directly by the Fund, but rather, are payable by Invesco Advisers to the Affiliated Sub-Advisers.
| D. | Economies of Scale and Breakpoints |
The Board considered the extent to which there are economies of scale in the provision of advisory services to the Fund. The Board also
considered whether the Fund benefits from economies of scale through contractual breakpoints in the Fund’s advisory fee schedule and was assisted in this review by a report from the Senior Officer. The Board also noted that the Fund shares directly in economies of scale through lower fees charged by third party service providers based on the combined size of the Invesco Funds and other clients advised by Invesco Advisers.
| E. | Profitability and Financial Resources |
The Board reviewed information from Invesco Advisers concerning the costs of the advisory and other services that Invesco Advisers and its affiliates provide to the Fund and the profitability of Invesco Advisers and its affiliates in providing these services for the year ended December 31, 2013. The Board received information from Invesco Advisers about the methodology used to prepare the profitability information. The Board considered the profitability of Invesco Advisers in managing the Fund and the Invesco Funds. The Board noted that Invesco Advisers continues to operate at a net profit from services Invesco Advisers and its subsidiaries provide to the Invesco Funds and the Fund. The Board did not deem the level of profits realized by Invesco Advisers and its affiliates from providing services to the Fund to be excessive given the nature, quality and extent of the services provided to the Invesco Funds. The Board received and accepted information from Invesco Advisers demonstrating that Invesco Advisers and each Affiliated Sub-Adviser are financially sound and have the resources necessary to perform their obligations under the investment advisory agreement and sub-advisory contracts.
| F. | Collateral Benefits to Invesco Advisers and its Affiliates |
The Board considered various other benefits received by Invesco Advisers and its affiliates from the relationship with the Fund, including the fees received for their provision of transfer agency and distribution services to the Fund. The Board considered comparative information regarding fees charged for these services, including information provided by Lipper and other independent sources. The Board considered the performance of Invesco Advisers and its affiliates in providing these services and the organizational structure employed to provide these services. The Board also considered that these services are provided to the Fund pursuant to written contracts that are reviewed and approved on an annual basis by the Board; that the services are required for the operation of the Fund; that Invesco Advisers and its affiliates can provide services, the nature and quality of which are at least equal to those provided by others offering the same or similar services; and that the fees for such services are fair and reasonable in light of the usual and customary charges by others for services of the same nature and quality.
The Board considered the benefits realized by Invesco Advisers and the Affiliated Sub-Advisers as a result of portfolio brokerage transactions
executed through “soft dollar” arrangements. The Board noted that soft dollar arrangements shift the payment obligation for research services from Invesco Advisers and the Affiliated Sub-Advisers to the Invesco Funds and that the research received may be used with other clients of Invesco Advisers and may reduce Invesco Advisers’ and the Affiliated Sub-Advisers’ expenses. The Board also considered that it receives periodic reports from the Chief Compliance Officer of the Invesco Funds demonstrating that these arrangements are consistent with regulatory requirements. The Board did not deem the soft dollar arrangements to be inappropriate.
The Board considered that the Fund’s uninvested cash and cash collateral from any securities lending arrangements may be invested in money market funds advised by Invesco Advisers pursuant to procedures approved by the Board. The Board noted that Invesco Advisers receives advisory fees from these affiliated money market funds attributable to such investments, although Invesco Advisers has contractually agreed to waive through varying periods the advisory fees payable by the Invesco Funds with respect to investments in the affiliated money market funds. The waiver is in an amount equal to 100% of the net advisory fee Invesco Advisers receives from the affiliated money market funds with respect to the Fund’s investment in the affiliated money market funds of uninvested cash, but not cash collateral. The Board concluded that the amount of advisory fees received by Invesco Advisors from the Fund’s investment of uninvested cash and cash collateral from any securities lending arrangements in the affiliated money market funds are fair and reasonable.
The Board also considered the Fund may use an affiliated broker to execute certain trades for the Fund to among other things, control information leakage, and were advised that such trades would be executed in compliance with rules under the Investment Company Act of 1940, as amended.
26 Invesco Low Volatility Equity Yield Fund
Tax Information
Form 1099-DIV, Form 1042-S and other year-end tax information provide shareholders with actual calendar year amounts that should be included in their tax returns. Shareholders should consult their tax advisors.
The following distribution information is being provided as required by the Internal Revenue Code or to meet a specific state’s requirement.
The Fund designates the following amounts or, if subsequently determined to be different, the maximum amount allowable for its fiscal year ended August 31, 2014:
Federal and State Income Tax | ||||
Long-Term Capital Gain Distributions | $ | 5,394,957 | ||
Qualified Dividend Income* | 100 | % | ||
Corporate Dividends Received Deduction* | 93.37 | % | ||
U.S. Treasury Obligations* | 0 | % | ||
| * | The above percentages are based on ordinary income dividends paid to shareholders during the Fund’s fiscal year. |
27 Invesco Low Volatility Equity Yield Fund
Trustees and Officers
The address of each trustee and officer is AIM Counselor Series Trust (Invesco Counselor Series Trust) (the “Trust”), 11 Greenway Plaza, Suite 1000, Houston, Texas 77046-1173. The trustees serve for the life of the Trust, subject to their earlier death, incapacitation, resignation, retirement or removal as more specifically provided in the Trust’s organizational documents. Each officer serves for a one year term or until their successors are elected and qualified. Column two below includes length of time served with predecessor entities, if any.
Name, Year of Birth and Position(s) Held with the Trust | Trustee and/ or Officer Since | Principal Occupation(s) During Past 5 Years | Number of Funds in Fund Complex Overseen by Trustee | Other Directorship(s) Held by Trustee During Past 5 Years | ||||
| Interested Persons | ||||||||
Martin L. Flanagan1 — 1960 Trustee | 2007 | Executive Director, Chief Executive Officer and President, Invesco Ltd. (ultimate parent of Invesco and a global investment management firm); Advisor to the Board, Invesco Advisers, Inc. (formerly known as Invesco Institutional (N.A.), Inc.); Trustee, The Invesco Funds; Vice Chair, Investment Company Institute; and Member of Executive Board, SMU Cox School of Business.
Formerly: Chairman and Chief Executive Officer, Invesco Advisers, Inc. (registered investment adviser); Director, Chairman, Chief Executive Officer and President, IVZ Inc. (holding company), INVESCO Group Services, Inc. (service provider) and Invesco North American Holdings, Inc. (holding company); Director, Chief Executive Officer and President, Invesco Holding Company Limited (parent of Invesco and a global investment management firm); Director, Invesco Ltd.; Chairman, Investment Company Institute and President, Co-Chief Executive Officer, Co-President, Chief Operating Officer and Chief Financial Officer, Franklin Resources, Inc. (global investment management organization). | 141 | None | ||||
Philip A. Taylor2 — 1954 Trustee, President and Principal Executive Officer | 2006 | Head of North American Retail and Senior Managing Director, Invesco Ltd.; Director, Co-Chairman, Co-President and Co-Chief Executive Officer, Invesco Advisers, Inc. (formerly known as Invesco Institutional (N.A.), Inc.) (registered investment adviser); Director, Chairman, Chief Executive Officer and President, Invesco Management Group, Inc. (formerly known as Invesco Aim Management Group, Inc.) (financial services holding company); Director and President, INVESCO Funds Group, Inc. (registered investment adviser and registered transfer agent); Director and Chairman, Invesco Investment Services, Inc. (formerly known as Invesco Aim Investment Services, Inc.) (registered transfer agent) and IVZ Distributors, Inc. (formerly known as INVESCO Distributors, Inc.) (registered broker dealer); Director, President and Chairman, Invesco Inc. (holding company) and Invesco Canada Holdings Inc. (holding company); Chief Executive Officer, Invesco Corporate Class Inc. (corporate mutual fund company) and Invesco Canada Fund Inc. (corporate mutual fund company); Director, Chairman and Chief Executive Officer, Invesco Canada Ltd. (formerly known as Invesco Trimark Ltd./Invesco Trimark Ltèe) (registered investment adviser and registered transfer agent); Trustee, President and Principal Executive Officer, The Invesco Funds (other than AIM Treasurer’s Series Trust (Invesco Treasurer’s Series Trust) and Short-Term Investments Trust); Trustee and Executive Vice President, The Invesco Funds (AIM Treasurer’s Series Trust (Invesco Treasurer’s Series Trust) and Short-Term Investments Trust only); Director, Invesco Investment Advisers LLC (formerly known as Van Kampen Asset Management); Director, Chief Executive Officer and President, Van Kampen Exchange Corp.
Formerly: Director and Chairman, Van Kampen Investor Services Inc.; Director, Chief Executive Officer and President, 1371 Preferred Inc. (holding company) and Van Kampen Investments Inc.; Director and President, AIM GP Canada Inc. (general partner for limited partnerships) and Van Kampen Advisors, Inc.; Director and Chief Executive Officer, Invesco Trimark Dealer Inc. (registered broker dealer); Director, Invesco Distributors, Inc. (formerly known as Invesco Aim Distributors, Inc.) (registered broker dealer); Manager, Invesco PowerShares Capital Management LLC; Director, Chief Executive Officer and President, Invesco Advisers, Inc.; Director, Chairman, Chief Executive Officer and President, Invesco Aim Capital Management, Inc.; President, Invesco Trimark Dealer Inc. and Invesco Trimark Ltd./Invesco Trimark Ltèe; Director and President, AIM Trimark Corporate Class Inc. and AIM Trimark Canada Fund Inc.; Senior Managing Director, Invesco Holding Company Limited; Director and Chairman, Fund Management Company (former registered broker dealer); President and Principal Executive Officer, The Invesco Funds (AIM Treasurer’s Series Trust (Invesco Treasurer’s Series Trust), and Short-Term Investments Trust only); President, AIM Trimark Global Fund Inc. and AIM Trimark Canada Fund Inc. | 141 | None | ||||
Wayne W. Whalen3 — 1939 Trustee | 2010 | Of Counsel, and prior to 2010, partner in the law firm of Skadden, Arps, Slate, Meagher & Flom LLP, legal counsel to certain funds in the Fund Complex
| 141 | Director of the Mutual fund Directors Forum, a nonprofit membership organization for investment directors; Chairman and Director of the Abraham Lincoln Presidential Library Foundation; and Director of the Stevenson Center for Democracy |
| 1 | Mr. Flanagan is considered an interested person (within the meaning of Section 2(a)(19) of the 1940 Act) of the Trust because he is an officer of the Adviser to the Trust, and an officer and a director of Invesco Ltd., ultimate parent of the Adviser. |
| 2 | Mr. Taylor is considered an interested person (within the meaning of Section 2(a)(19) of the 1940 Act) of the Trust because he is an officer and a director of the Adviser. |
| 3 | Mr. Whalen is retiring effective December 31, 2014. He has been deemed to be an interested person of the Trust because of his prior service as counsel to the predecessor funds of certain Invesco open-end funds and his affiliation with the law firm that served as counsel to such predecessor funds and the Invesco closed-end funds. |
T-1 Invesco Low Volatility Equity Yield Fund
Trustees and Officers—(continued)
Name, Year of Birth and Position(s) Held with the Trust | Trustee and/ or Officer Since | Principal Occupation(s) During Past 5 Years | Number of Funds in Fund Complex Overseen by Trustee | Other Directorship(s) Past 5 Years | ||||
| Independent Trustees | ||||||||
Bruce L. Crockett — 1944 Trustee and Chair | 2003 | Chairman, Crockett Technologies Associates (technology consulting company)
Formerly: Director, Captaris (unified messaging provider); Director, President and Chief Executive Officer, COMSAT Corporation; Chairman, Board of Governors of INTELSAT (international communications company); ACE Limited (insurance company); and Investment Company Institute | 141 | ALPS (Attorneys Liability Protection Society) (insurance company) | ||||
David C. Arch — 1945 Trustee | 2010 | Chairman of Blistex Inc., a consumer health care products manufacturer | 141 | Board member of the Illinois Manufacturers’ Association; Member of the Board of Visitors, Institute for the Humanities, University of Michigan; Member of the Audit Committee of the Edward-Elmhurst Hospital | ||||
Frank S. Bayley — 1939 Trustee | 2003 | Retired. Formerly: Director, Badgley Funds Inc. (registered investment company) (2 portfolios) and General Partner and Of Counsel, law firm of Baker & McKenzie, LLP | 141 | Director and Chairman, C.D. Stimson Company (a real estate investment company); Trustee, The Curtis Institute of Music | ||||
James T. Bunch — 1942 Trustee | 2000 | Managing Member, Grumman Hill Group LLC (family office private equity investments)
Formerly: Founder, Green Manning & Bunch Ltd. (investment banking firm) (1988-2010); Executive Committee, United States Golf Association; and Director, Policy Studies, Inc. and Van Gilder Insurance Corporation | 141 | Chairman, Board of Governors, Western Golf Association; Chairman, Evans Scholars Foundation; and Director, Denver Film Society | ||||
Rodney F. Dammeyer — 1940 Trustee | 2010 | Chairman of CAC, LLC, (private company offering capital investment and management advisory services)
Formerly: Prior to 2001, Managing Partner at Equity Group Corporate Investments; Prior to 1995, Chief Executive Officer of Itel Corporation (formerly Anixter International); Prior to 1985, experience includes Senior Vice President and Chief Financial Officer of Household International, Inc., Executive Vice President and Chief Financial Officer of Northwest Industries, Inc. and Partner of Arthur Andersen & Co.; From 1987 to 2010, Director/Trustee of investment companies in the Van Kampen Funds complex | 141 | Director of Quidel Corporation and Stericycle, Inc. | ||||
Albert R. Dowden — 1941 Trustee | 2003 | Director of a number of public and private business corporations, including the Boss Group, Ltd. (private investment and management); Nature’s Sunshine Products, Inc. and Reich & Tang Funds (5 portfolios) (registered investment company)
Formerly: Director, Homeowners of America Holding Corporation/Homeowners of America Insurance Company (property casualty company); Director, Continental Energy Services, LLC (oil and gas pipeline service); Director, CompuDyne Corporation (provider of product and services to the public security market) and Director, Annuity and Life Re (Holdings), Ltd. (reinsurance company); Director, President and Chief Executive Officer, Volvo Group North America, Inc.; Senior Vice President, AB Volvo; Director of various public and private corporations; Chairman, DHJ Media, Inc.; Director, Magellan Insurance Company; and Director, The Hertz Corporation, Genmar Corporation (boat manufacturer), National Media Corporation; Advisory Board of Rotary Power International (designer, manufacturer, and seller of rotary power engines); and Chairman, Cortland Trust, Inc. (registered investment company) | 141 | Director of: Nature’s Sunshine Products, Inc., Reich & Tang Funds, Homeowners of America Holding Corporation/ Homeowners of America Insurance Company, the Boss Group | ||||
Jack M. Fields — 1952 Trustee | 2003 | Chief Executive Officer, Twenty First Century Group, Inc. (government affairs company); Owner and Chief Executive Officer, Dos Angeles Ranch, L.P. (cattle, hunting, corporate entertainment); and Discovery Global Education Fund (non-profit)
Formerly: Chief Executive Officer, Texana Timber LP (sustainable forestry company); Director of Cross Timbers Quail Research Ranch (non-profit); and member of the U.S. House of Representatives | 141 | Insperity, Inc. (formerly known as Administaff) | ||||
Prema Mathai-Davis — 1950 Trustee | 2003 | Retired. Formerly: Chief Executive Officer, YWCA of the U.S.A. | 141 | None | ||||
Larry Soll — 1942 Trustee | 1997 | Retired. Formerly: Chairman, Chief Executive Officer and President, Synergen Corp. (a biotechnology company) | 141 | None | ||||
Hugo F. Sonnenschein — 1940 Trustee | 2010 | President Emeritus and Honorary Trustee of the University of Chicago and the Adam Smith Distinguished Service Professor in the Department of Economics at the University of Chicago. Prior to 2000, President of the University of Chicago | 141 | Trustee of the University of Rochester and a member of its investment committee; Member of the National Academy of Sciences and the American Philosophical Society; Fellow of the American Academy of Arts and Sciences |
T-2 Invesco Low Volatility Equity Yield Fund
Trustees and Officers—(continued)
Name, Year of Birth and Position(s) Held with the Trust | Trustee and/ or Officer Since | Principal Occupation(s) During Past 5 Years | Number of Funds in Fund Complex Overseen by Trustee | Other Directorship(s) Past 5 Years | ||||
| Independent Trustees—(continued) | ||||||||
Raymond Stickel, Jr. — 1944 Trustee | 2005 | Retired. Formerly: Director, Mainstay VP Series Funds, Inc. (25 portfolios) and Partner, Deloitte & Touche | 141 | None | ||||
Suzanne H. Woolsey — 1941 Trustee | 2014 | Chief Executive Officer of Woolsey Partners LLC | 141 | Emeritus Chair of the Board of Trustees of the Institute for Defense Analyses; Trustee of Colorado College; Trustee of California Institute of Technology; Prior to 2014, Director of Fluor Corp.; Prior to 2010, Trustee of the German Marshall Fund of the United States; Prior to 2010 Trustee of the Rocky Mountain Institute | ||||
| Other Officers | ||||||||
Russell C. Burk — 1958 Senior Vice President and Senior Officer | 2005 | Senior Vice President and Senior Officer, The Invesco Funds | N/A | N/A | ||||
John M. Zerr — 1962 Senior Vice President, Chief Legal Officer and Secretary | 2006 | Director, Senior Vice President, Secretary and General Counsel, Invesco Management Group, Inc. (formerly known as Invesco Aim Management Group, Inc.) and Van Kampen Exchange Corp.; Senior Vice President, Invesco Advisers, Inc. (formerly known as Invesco Institutional (N.A.), Inc.) (registered investment adviser); Senior Vice President and Secretary, Invesco Distributors, Inc. (formerly known as Invesco Aim Distributors, Inc.); Director, Vice President and Secretary, Invesco Investment Services, Inc. (formerly known as Invesco Aim Investment Services, Inc.) and IVZ Distributors, Inc. (formerly known as INVESCO Distributors, Inc.); Director and Vice President, INVESCO Funds Group, Inc.; Senior Vice President, Chief Legal Officer and Secretary, The Invesco Funds; Manager, Invesco PowerShares Capital Management LLC; Director, Secretary and General Counsel, Invesco Investment Advisers LLC (formerly known as Van Kampen Asset Management); Secretary and General Counsel, Invesco Capital Markets, Inc. (formerly known as Van Kampen Funds Inc.) and Chief Legal Officer, PowerShares Exchange-Traded Fund Trust, PowerShares Exchange-Traded Fund Trust II, PowerShares India Exchange-Traded Fund Trust and PowerShares Actively Managed Exchange-Traded Fund Trust
Formerly: Director and Vice President, Van Kampen Advisors Inc.; Director, Vice President, Secretary and General Counsel, Van Kampen Investor Services Inc.; Director, Invesco Distributors, Inc. (formerly known as Invesco Aim Distributors, Inc.); Director, Senior Vice President, General Counsel and Secretary, Invesco Aim Advisers, Inc. and Van Kampen Investments Inc.; Director, Vice President and Secretary, Fund Management Company; Director, Senior Vice President, Secretary, General Counsel and Vice President, Invesco Aim Capital Management, Inc.; Chief Operating Officer and General Counsel, Liberty Ridge Capital, Inc. (an investment adviser); Vice President and Secretary, PBHG Funds (an investment company) and PBHG Insurance Series Fund (an investment company); Chief Operating Officer, General Counsel and Secretary, Old Mutual Investment Partners (a broker-dealer); General Counsel and Secretary, Old Mutual Fund Services (an administrator) and Old Mutual Shareholder Services (a shareholder servicing center); Executive Vice President, General Counsel and Secretary, Old Mutual Capital, Inc. (an investment adviser); and Vice President and Secretary, Old Mutual Advisors Funds (an investment company) | N/A | N/A | ||||
Sheri Morris — 1964 Vice President, Treasurer and Principal Financial Officer | 2003 | Vice President, Treasurer and Principal Financial Officer, The Invesco Funds; Vice President, Invesco Advisers, Inc. (formerly known as Invesco Institutional (N.A.), Inc.) (registered investment adviser); and Vice President, PowerShares Exchange-Traded Fund Trust, PowerShares Exchange-Traded Fund Trust II, PowerShares India Exchange-Traded Fund Trust and PowerShares Actively Managed Exchange-Traded Fund Trust
Formerly: Vice President, Invesco Aim Advisers, Inc., Invesco Aim Capital Management, Inc. and Invesco Aim Private Asset Management, Inc.; Assistant Vice President and Assistant Treasurer, The Invesco Funds and Assistant Vice President, Invesco Advisers, Inc., Invesco Aim Capital Management, Inc. and Invesco Aim Private Asset Management, Inc.; and Treasurer, PowerShares Exchange-Traded Fund Trust, PowerShares Exchange-Traded Fund Trust II, PowerShares India Exchange-Traded Fund Trust and PowerShares Actively Managed Exchange-Traded Fund Trust | N/A | N/A | ||||
T-3 Invesco Low Volatility Equity Yield Fund
Trustees and Officers—(continued)
Name, Year of Birth and Position(s) Held with the Trust | Trustee and/ or Officer Since | Principal Occupation(s) During Past 5 Years | Number of Funds in Fund Complex Overseen by Trustee | Other Directorship(s) Past 5 Years | ||||
| Other Officers—(continued) | ||||||||
Karen Dunn Kelley — 1960 Vice President | 2003 | Senior Managing Director, Investments; Director, Co-President, Co-Chief Executive Officer, and Co-Chairman, Invesco Advisers, Inc. (formerly known as Invesco Institutional (N.A.), Inc.) (registered investment adviser); Chairman, Invesco Senior Secured Management, Inc.; Senior Vice President, Invesco Management Group, Inc. (formerly known as Invesco Aim Management Group, Inc.); Executive Vice President, Invesco Distributors, Inc. (formerly known as Invesco Aim Distributors, Inc.); Director, Invesco Mortgage Capital Inc. and Invesco Management Company Limited; Director and President, INVESCO Asset Management (Bermuda) Ltd., Vice President, The Invesco Funds (other than AIM Treasurer’s Series Trust (Invesco Treasurer’s Series Trust) and Short-Term Investments Trust); and President and Principal Executive Officer, The Invesco Funds (AIM Treasurer’s Series Trust (Invesco Treasurer’s Series Trust) and Short-Term Investments Trust only)
Formerly: Director, INVESCO Global Asset Management Limited and INVESCO Management S.A.; Senior Vice President, Van Kampen Investments Inc. and Invesco Advisers, Inc. (formerly known as Invesco Institutional (N.A.), Inc.) (registered investment adviser); Vice President, Invesco Advisers, Inc. (formerly known as Invesco Institutional (N.A.), Inc.); Director of Cash Management and Senior Vice President, Invesco Advisers, Inc. and Invesco Aim Capital Management, Inc.; Director and President, Fund Management Company; Chief Cash Management Officer, Director of Cash Management, Senior Vice President, and Managing Director, Invesco Aim Capital Management, Inc.; Director of Cash Management, Senior Vice President, and Vice President, Invesco Advisers, Inc. and The Invesco Funds (AIM Treasurer’s Series Trust (Invesco Treasurer’s Series Trust), and Short-Term Investments Trust only) | N/A | N/A | ||||
Crissie M. Wisdom — 1969 Anti-Money Laundering Compliance Officer | 2013 | Anti-Money Laundering Compliance Officer, Invesco Advisers, Inc. (formerly known as Invesco Institutional (N.A.), Inc.) (registered investment adviser), Invesco Capital Markets, Inc. (formerly known as Van Kampen Funds Inc.), Invesco Distributors, Inc., Invesco Investment Services, Inc., Invesco Management Group, Inc., Van Kampen Exchange Corp., The Invesco Funds, and PowerShares Exchange-Traded Fund Trust, PowerShares Exchange-Traded Fund Trust II, PowerShares India Exchange-Traded Fund Trust, and PowerShares Actively Managed Exchange-Traded Fund Trust; and Fraud Prevention Manager and Controls and Risk Analysis Manager for Invesco Investment Services, Inc. | N/A | N/A | ||||
Todd L. Spillane — 1958 Chief Compliance Officer | 2006 | Senior Vice President, Invesco Management Group, Inc. (formerly known as Invesco Aim Management Group, Inc.) and Van Kampen Exchange Corp.; Senior Vice President and Chief Compliance Officer, Invesco Advisers, Inc. (registered investment adviser) (formerly known as Invesco Institutional (N.A.), Inc.); Chief Compliance Officer, The Invesco Funds; Vice President, Invesco Distributors, Inc. (formerly known as Invesco Aim Distributors, Inc.) and Invesco Investment Services, Inc. (formerly known as Invesco Aim Investment Services, Inc.)
Formerly: Chief Compliance Officer, Invesco Funds (Chicago); Senior Vice President, Van Kampen Investments Inc.; Senior Vice President and Chief Compliance Officer, Invesco Aim Advisers, Inc. and Invesco Aim Capital Management, Inc.; Chief Compliance Officer, INVESCO Private Capital Investments, Inc. (holding company), Invesco Private Capital, Inc. (registered investment adviser), Invesco Global Asset Management (N.A.), Inc., Invesco Senior Secured Management, Inc. (registered investment adviser), Van Kampen Investor Services Inc., PowerShares Exchange-Traded Fund Trust, PowerShares Exchange-Traded Fund Trust II, PowerShares India Exchange-Traded Fund Trust and PowerShares Actively Managed Exchange-Traded Fund Trust; and Vice President, Invesco Aim Capital Management, Inc. and Fund Management Company | N/A | N/A |
The Statement of Additional Information of the Trust includes additional information about the Fund’s Trustees and is available upon request, without charge, by calling 1.800.959.4246. Please refer to the Fund’s prospectus for information on the Fund’s sub-advisers.
Office of the Fund 11 Greenway Plaza, Suite 1000 Houston, TX 77046-1173 | Investment Adviser Invesco Advisers, Inc. 1555 Peachtree Street, N.E. Atlanta, GA 30309 | Distributor Invesco Distributors, Inc. 11 Greenway Plaza, Suite 1000 Houston, TX 77046-1173 | Auditors PricewaterhouseCoopers LLP 1201 Louisiana Street, Suite 2900 Houston, TX 77002-5678 | |||
Counsel to the Fund Stradley Ronon Stevens & Young, LLP 2005 Market Street, Suite 2600 Philadelphia, PA 19103-7018 | Counsel to the Independent Trustees Goodwin Procter LLP 901 New York Avenue, N.W. Washington, D.C. 20001 | Transfer Agent Invesco Investment Services, Inc. 11 Greenway Plaza, Suite 1000 Houston, TX 77046-1173 | Custodian State Street Bank and Trust Company 225 Franklin Street Boston, MA 02110-2801 | |||
T-4 Invesco Low Volatility Equity Yield Fund

Invesco mailing information
Send general correspondence to Invesco Investment Services, Inc., P.O. Box 219078, Kansas City, MO 64121-9078.
Important notice regarding delivery of security holder documents
To reduce Fund expenses, only one copy of most shareholder documents may be mailed to shareholders with multiple accounts at the same address (Householding). Mailing of your shareholder documents may be householded indefinitely unless you instruct us otherwise. If you do not want the mailing of these documents to be combined with those for other members of your household, please contact Invesco Investment Services, Inc. at 800 959 4246 or contact your financial institution. We will begin sending you individual copies for each account within 30 days after receiving your request.
Fund holdings and proxy voting information
The Fund provides a complete list of its holdings four times in each fiscal year, at the quarter ends. For the second and fourth quarters, the lists appear in the Fund’s semiannual and annual reports to shareholders. For the first and third quarters, the Fund files the lists with the Securities and Exchange Commission (SEC) on Form N-Q. The most recent list of portfolio holdings is available at invesco.com/completeqtrholdings. Shareholders can also look up the Fund’s Forms N-Q on the SEC website at sec.gov. Copies of the Fund’s Forms N-Q may be reviewed and copied at the SEC Public Reference Room in Washington, D.C. You can obtain information on the operation of the Public Reference Room, including information about duplicating fee charges, by calling 202 551 8090 or 800 732 0330, or by electronic request at the following email address: publicinfo@sec.gov. The SEC file numbers for the Fund are shown below.
A description of the policies and procedures that the Fund uses to determine how to vote proxies relating to portfolio securities is available without charge, upon request, from our Client Services department at 800 959 4246 or at invesco.com/proxyguidelines. The information is also available on the SEC website, sec.gov.
Information regarding how the Fund voted proxies related to its portfolio securities during the most recent 12-month period ended June 30 is available at invesco.com/proxysearch. The information is also available on the SEC website, sec.gov. Invesco Advisers, Inc. is an investment adviser; it provides investment advisory services to individual and institutional clients and does not sell securities. Invesco Distributors, Inc. is the US distributor for Invesco Ltd.’s retail mutual funds, exchange-traded funds and institutional money market funds. Both are wholly owned, indirect subsidiaries of Invesco Ltd. |  |
| SEC file numbers: 811-09913 and 333-36074 | LVEY-AR-1 | Invesco Distributors, Inc. |

Letters to Shareholders
Philip Taylor
| Dear Shareholders: This annual report includes information about your Fund, including performance data and a complete list of its investments as of the close of the reporting period. Inside, your Fund’s portfolio managers discuss how they managed your Fund and the factors that affected its performance during the reporting period. I hope you find this report of interest. During the reporting period covered by this report, the US economy showed signs of continued improvement. After contracting in the first quarter of 2014, the economy expanded strongly in the second quarter and unemployment trended lower. Much of the credit for this improvement goes to the US Federal Reserve (the Fed), which undertook an extraordinary asset purchase program following the global financial crisis. The Fed’s goal was to jumpstart the economy by encouraging banks to lend more, businesses to hire more and consumers to spend more. Signs of a stronger US economy prompted the Fed to reduce, or “taper,” its asset purchase program. Despite this, | |
| interest rates remained near historical low levels due largely to heavy investor demand for bonds. While signs of economic improvement were evident in the US, European economies remained relatively stagnant. During the reporting period, high unemployment persisted, worries about potential deflation grew, and uncertainty about Russian-Ukrainian tensions weighed on European markets. | ||

Extended periods of market strength can lull investors into complacency – just as prolonged periods of market weakness or volatility can discourage investors from initiating long-term investment plans. That’s why Invesco has always encouraged investors to work with a professional financial adviser who can stress the importance of starting to save and invest early and the importance of adhering to a disciplined investment plan – when times are good and when they’re uncertain. A financial adviser who knows your unique financial situation, investment goals and risk tolerance can be an invaluable partner as you seek to achieve your financial goals. He or she can offer a long-term perspective when markets are volatile and time-tested advice and guidance when your financial situation or investment goals change.
Timely information when and where you want it
Invesco’s efforts to help investors achieve their financial objectives include providing individual investors and financial professionals with timely information about the markets, the economy and investing – whenever and wherever they want it.
Our website, invesco.com/us, offers a wide range of market insights and investment perspectives. On the website, you’ll find detailed information about our funds, including prices, performance, holdings and portfolio manager commentaries. You can access information about your individual Invesco account whenever it’s convenient for you; just complete a simple, secure online registration. Use the “Login” box on our home page to get started.
Invesco’s mobile app for iPad® (available free from the App StoreSM) allows you to obtain the same detailed information about your Fund and the same investment insights from our investment leaders, market strategists, economists and retirement experts on the go. You also can watch portfolio manager videos and have instant access to Invesco news and updates wherever you may be.
In addition to the resources accessible on our website and through our mobile app, you can obtain timely updates to help you stay informed about the markets, the economy and investing by connecting with Invesco on Twitter, LinkedIn or Facebook. You can access our blog at blog.invesco.us.com or by clicking the “Intentional Investing Forum” link on our home page. Our goal is to provide you the information you want, when and where you want it.
Have questions?
For questions about your account, feel free to contact an Invesco client services representative at 800 959 4246. For Invesco-related questions or comments, please email me directly at phil@invesco.com.
All of us at Invesco look forward to serving your investment management needs for many years to come. Thank you for investing with us.
Sincerely,

Philip Taylor
Senior Managing Director, Invesco Ltd.
iPad is a trademark of Apple Inc., registered in the US and other countries. App Store is a service mark of Apple Inc. Invesco Distributors, Inc. is not affiliated with Apple Inc.
2 Invesco Pennsylvania Tax Free Income Fund
Bruce Crockett
| Dear Fellow Shareholders: There are a variety of factors that can impact investment performance, many of which are uncontrollable by us as investors. These factors can include various economic trends and geopolitical developments. While the members of the Invesco Funds Board, which I chair, can’t dictate the performance of the Invesco funds, be assured that your Board works diligently throughout the year to focus on how your investments are managed. Our job is to represent you and your interests on a variety of fund management-related matters. We regularly monitor how the portfolio management teams of the Invesco funds are performing in light of ever-changing and often unpredictable economic and market conditions. We review the investment strategies and investment process employed by each fund’s management team as explained in the fund’s prospectus. | |
Perhaps our most significant responsibility is conducting the annual review of the funds’ advisory |

and sub-advisory contracts with Invesco Advisers and its affiliates. This annual review, which is required by the Investment Company Act of 1940, focuses on the nature and quality of the services Invesco provides as the adviser to the Invesco funds and the reasonableness of the fees that it charges for those services. Each year, we spend months carefully reviewing information from Invesco that allows us to evaluate the quality of its services and the reasonableness of its fees. We also use information from a variety of independent sources, including materials provided by the independent senior officer of the Invesco funds, who reports directly to the independent trustees on the Board. Additionally, we meet with legal counsel and review performance and fee data prepared for us by Lipper Inc., an independent, third-party firm widely recognized as a leader in its field.
After a careful review, the members of the Invesco Funds Board approved the continuation of advisory and sub-advisory contracts with Invesco Advisers and its affiliates. Be assured that your Board will continue working on behalf of fund shareholders, keeping your needs and interests uppermost in our minds.
As always, please contact me at bruce@brucecrockett.com with any questions or concerns you may have. On behalf of the Board, we look forward to continuing to represent your interests and serving your needs.
Sincerely,

Bruce L. Crockett
Independent Chair
Invesco Funds Board of Trustees
3 Invesco Pennsylvania Tax Free Income Fund
Management’s Discussion of Fund Performance
Performance summary
Invesco Pennsylvania Tax Free Income Fund posted positive returns for the fiscal year ended August 31, 2014. At net asset value (NAV), the Fund outperformed the Barclays Pennsylvania Municipal Index, its style-specific benchmark, and the S&P Municipal Bond Index, its broad market benchmark. The Fund’s overweight allocation at the long end of the yield curve (20+ years) was the primary contributor to its relative performance versus its benchmarks.
Your Fund’s long-term performance appears later in this report.
Fund vs. Indexes
Total returns, 8/31/13 to 8/31/14, at net asset value (NAV). Performance shown does not include applicable contingent deferred sales charges (CDSC) or front-end sales charges, which would have reduced performance.
Class A Shares | 11.33 | % | ||
Class B Shares | 11.32 | |||
Class C Shares | 10.56 | |||
Class Y Shares | 11.60 | |||
S&P Municipal Bond Indexq (Broad Market Index)* | 10.55 | |||
Barclays Municipal Bond Indexq (Former Broad Market Index)* | 10.14 | |||
Barclays Pennsylvania Municipal Indexq (Style-Specific Index)* | 10.35 | |||
Lipper Pennsylvania Municipal Debt Funds Indexn (Peer Group Index)* | 11.03 |
Source(s): qFactSet Research Systems Inc.; nLipper Inc.
| * | The Fund has elected to use the S&P Municipal Bond Index as its broad market benchmark, rather than the Barclays Municipal Bond Index because the adviser believes the S&P Municipal Bond Index more closely reflects the performance of the broad US municipal bond market. |
How we invest
Our investment objective is to provide Pennsylvania investors with a high level of current income exempt from federal and Pennsylvania state income taxes and, where possible under local law, local income and personal property taxes, through investment in a varied portfolio of medium- and lower-grade municipal securities.
We invest primarily in medium-grade and lower-grade securities. However, at times, conditions in the Pennsylvania municipal market may be such that we elect to invest in higher-grade securities. Generally, and depending on market conditions, higher-grade municipal securities may better protect NAV against declines, but may produce lower yields than
Portfolio Composition
By security type, based on total investments
Revenue Bonds | 83.5 | % | ||
General Obligation Bonds | 7.5 | |||
Pre-Refunded Bonds | 6.8 | |||
Other | 2.2 |
lower-rated municipal securities, since yields on higher-grade securities are usually lower than yields on medium-grade or lower-grade securities. As a result, we may not invest in the highest-yielding Pennsylvania municipal securities permitted by our investment policies if we determine that they may subject the Fund to undue risk.
The Fund’s investment in medium-grade and lower-grade securities involves special risks as compared to investing in higher-grade securities. We do not purchase securities that are in default, rated in categories lower than B- by Standard & Poor’s or B3 by Moody’s at the time of purchase or unrated securities of comparable quality.† Under normal market conditions, the Fund may invest up to 20% of its total assets in municipal securities that are subject to the federal alternative minimum tax.
We actively manage the Fund’s portfolio and adjust its average maturity based on our expectations about the direction of interest rates and other economic factors. We select securities that we believe offer higher yields with reasonable credit
Top Five Fixed Income Holdings
1. Pennsylvania (State of) Higher Educational Facilities Authority (Trustees | ||||
of the University of Pennsylvania); Series 2005 C | 3.8 | % | ||
2. Delaware Valley Regional Financial Authority; Series 2002 | 3.1 | |||
3. Pennsylvania (Commonwealth of); First Series 2014 | 2.7 | |||
4. Westmoreland (County of) Industrial Development Authority (Redstone | ||||
Presbyterian Senior Care Obligated Group); Series 2005 A | 2.1 | |||
5. Dauphin (County of) General Authority (Pinnacle Health System); Series 2009 A | 2.0 |
risk considered in relation to the investment policies of the Fund. In selecting securities for investment, we use our research capabilities to assess potential investments and consider a number of factors, including general market and economic conditions, credit, interest rate and prepayment risks.
Market conditions and your Fund
Pennsylvania benefits from a highly diversified economy in terms of a mix of industries and no one single employment sector dominates. Its economy tends to track the national economy, but with less volatility, outperforming the US in areas such as growth in real estate, personal income and employment during periods of national economic contractions. Pennsylvania’s economic performance is largely dependent upon job growth. Pennsylvania’s seasonally adjusted unemployment rate as of July 2014 was 5.7%,1 the first gain in the state unemployment rate since 2012, and below the nation’s 6.2%.2 Pennsylvania was one of only 10 states to earn an A for academic achievement during the 2013 school year. Also, the state is investing in its future through increased educational funding, which totals $12 billion for the 2014-15 state budget, representing 41% of total state spending.3 However, the state’s two pension systems, which continue to consume a great portion of the state budget, need significant attention. Pennsylvania’s two pension systems’ debts outweigh their assets by more than a combined $41 billion.4 Changes in legislation over the last decade artificially suppressed the employer contribution rate to provide short-term budgetary relief to the state. Ratings agencies cited growing pension liabilities as a major factor for pressured budgetary performance. Fitch and S&P both rated the state AA with negative outlooks.5 Moody’s downgraded Pennsylvania’s general obligation rating to Aa3 from Aa2 in July 2014 with a stable outlook.6 Pennsylvania’s Governor Tom Corbett proposed a bold pension reform plan to not only address budgetary relief, but also tackle the long-term pension debt the state carries.
Throughout the reporting period, fundamentals for municipal debt issuers improved on the whole. State fundamentals improved as more governors across
Total Net Assets | $ | 127.9 million | ||
Total Number of Holdings | 131 |
The Fund’s holdings are subject to change, and there is no assurance that the Fund will continue to hold any particular security.
4 Invesco Pennsylvania Tax Free Income Fund
the nation exercised fiscal restraint. State budgets are expected to continue their trend of moderate growth in 2015. Local governments experienced a credit rally in 2014 driven by property tax revenues. Rebounding home prices, a rising stock market and a growing economy lifted tax collection by local governments.
Income from municipal bonds became attractive after a volatile 2013 drove yields higher. 2013 marked the second consecutive year of negative annual total returns for municipal bonds as investment-grade municipal bonds, as measured by the Barclays Municipal Bond Index, finished the year down -2.55%; while high yield municipal bonds, as measured by the Barclays High Yield Municipal Bond Index, also finished the year down -5.51%.7 Further adding to the volatility, the asset class experienced an unprecedented $67.6 billion outflow from March through December 2013.8 However, investors who showed conviction through the 2013 sell-off and stayed the course were rewarded with strong positive returns during the first eight months of 2014.
During the fiscal year, investment-grade municipal bonds returned 10.14%, as measured by the Barclays Municipal Bond Index, and high yield municipal bonds returned 14.74%, as measured by the Barclays High Yield Municipal Bond Index.7 The Barclays Pennsylvania Municipal Index returned 10.35% over the reporting period. Municipal bonds posted positive returns as Treasury and municipal rates moved lower and investors showed renewed interest in tax-exempt bonds. The rally in Treasuries was driven primarily by softer-than-expected, but still positive, economic data. Despite the Federal Reserve’s continued reduction of quantitative easing, the market expected interest rate increases based on expectations of gradual improvement in unemployment rate and low inflation projections. Through the first half of 2014, municipal bonds rallied along with Treasuries, primarily due to a positive shift in investor sentiment for the asset class. The long end of the yield curve outperformed as long municipal rates followed Treasuries lower and the yield curve flattened.
The municipal bonds asset class added $14.7 billion during the first eight months of 2014, a stark reversal of the outflows in 2013.9 The influx of investors back into the asset class at the start of 2014 allowed municipal bond prices to recover from oversold valuations in 2013. Positive municipal bond performance in the first quarter of 2014 was an impetus for continued interest from investors.
The level of issuance, however, dwindled as the first half of 2014 saw $152
billion in bond issuance, the second-lowest first half issuance in at least a decade, and 22% below the 10-year average.10 This continued the downward trend from 2013, when issuance was curtailed in the second half of the year as higher interest rates made refinancing transactions uneconomic for many issuers.
For the reporting period, the Fund’s overweight allocation to long-duration bonds (20+ years) was the primary contributor to its relative performance versus its style-specific benchmark. Further contributing to relative performance was security selection in revenue bonds, particularly the hospital and education industries.
The Fund had a small off-index allocation to Puerto Rico revenue bonds, which detracted from relative performance. The market punished Puerto Rico bonds after they were downgraded, but overall, investor fears seemed to subside during the first quarter of 2014 as most municipal bond participants came to realize that the issues that plagued Puerto Rico were not characteristic of the broader municipal market. Puerto Rico bonds are held in single-state municipal funds as a tool to diversify risk and because of their triple tax-exempt status (federal, state and local). As of the end of the reporting period, the Fund did not hold any positions in Puerto Rico bonds.
During the reporting period, leverage positively contributed to Fund performance. The Fund achieved a leveraged position through the use of inverse floating rate securities. The Fund uses leverage because we believe that, over time, leveraging provides opportunities for additional income and total return for shareholders. However, the use of leverage also can expose shareholders to additional volatility. For more information about the Fund’s use of leverage, see the Notes to Financial Statements later in this report.
Thank you for investing in Invesco Pennsylvania Tax Free Income Fund and for sharing our long-term investment horizon.
| † | A credit rating is an assessment provided by a nationally recognized statistical rating organization (NRSRO) of the creditworthiness of an issuer with respect to debt obligations, including specific securities, money market instruments or other debts. Ratings are measured on a scale that generally ranges from AAA (highest) to D (lowest); ratings are subject to change without notice. “Non-Rated” indicates the debtor was not rated, and should not be interpreted as indicating low quality. For more information on rating methodologies, please visit the following NRSRO websites: standardandpoors.com and select Understanding Ratings” under Rating Resources on the homepage; moodys.com and select “Rating Methodologies” under Research and Ratings on the homepage; and fitchratings.com and select “Ratings Definitions” on the homepage. |
| 1 | Pennsylvania Department of Labor and Industry |
| 2 | National Conference of State Legislatures |
| 3 | Pennsylvania Department of Education |
| 4 | Keystone Research Center |
| 5 | Janney Capital Markets |
| 6 | Moody’s |
| 7 | Barclays |
| 8 | Morningstar |
| 9 | Investment Company Institute |
| 10 | Bond Buyer |
The views and opinions expressed in management’s discussion of Fund performance are those of Invesco Advisers, Inc. These views and opinions are subject to change at any time based on factors such as market and economic conditions. These views and opinions may not be relied upon as investment advice or recommendations, or as an offer for a particular security. The information is not a complete analysis of every aspect of any market, country, industry, security or the Fund. Statements of fact are from sources considered reliable, but Invesco Advisers, Inc. makes no representation or warranty as to their completeness or accuracy. Although historical performance is no guarantee of future results, these insights may help you understand our investment management philosophy.
See important Fund and, if applicable, index disclosures later in this report.
 | Thomas Byron Portfolio Manager, is manager of Invesco Pennsylvania Tax Free Income Fund. He joined Invesco in | |
| 2010. Mr. Byron earned a BS in finance from Marquette University and an MBA in finance from DePaul University. | ||
 | Robert Stryker Chartered Financial Analyst, Portfolio Manager, is manager of Invesco Pennsylvania Tax Free Income | |
| Fund. He joined Invesco in 2010. Mr. Stryker earned a BS in finance from the University of Illinois at Chicago. | ||
 | Julius Williams Portfolio Manager, is manager of Invesco Pennsylvania Tax Free Income Fund. He joined Invesco in | |
| 2010. Mr. Williams earned a BA in economics and sociology and a Master of Education degree in educational psychology from the University of Virginia. | ||
 | Robert Wimmel Portfolio Manager, is manager of Invesco Pennsylvania Tax Free Income Fund. He joined Invesco in | |
| 2010. Mr. Wimmel earned a BA in anthropology from the University of Cincinnati and an MA in economics from the University of Illinois at Chicago. | ||
5 Invesco Pennsylvania Tax Free Income Fund
Your Fund’s Long-Term Performance
Results of a $10,000 Investment – Oldest Share Class(es)
Fund and index data from 8/31/04
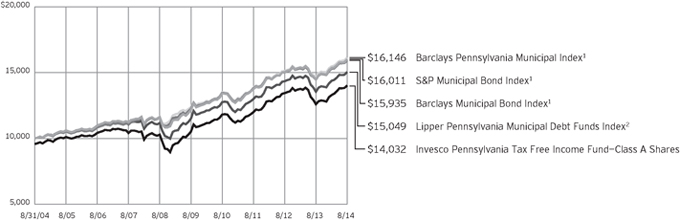
| 1 | Source: FactSet Research Systems Inc. |
| 2 | Source: Lipper Inc. |
Past performance cannot guarantee comparable future results.
The Fund has elected to use the S&P Municipal Bond Index as its broad market benchmark, rather than the Barclays Municipal Bond Index because the adviser believes the S&P Municipal Bond Index
more closely reflects the performance of the broad US municipal bond market.
The data shown in the chart include reinvested distributions, applicable sales charges and Fund expenses including management fees. Index results include reinvested dividends, but they do not reflect sales charges. Performance of the
peer group, if applicable, reflects fund expenses and management fees; performance of a market index does not. Performance shown in the chart and table(s) does not reflect deduction of taxes a shareholder would pay on Fund distributions or sale of Fund shares.
6 Invesco Pennsylvania Tax Free Income Fund
Average Annual Total Returns
As of 8/31/14, including maximum applicable sales charges
Class A Shares | ||||
Inception (5/1/87) | 5.75 | % | ||
10 Years | 3.45 | |||
5 Years | 5.00 | |||
1 Year | 6.62 | |||
Class B Shares | ||||
Inception (5/3/93) | 4.26 | % | ||
10 Years | 3.55 | |||
5 Years | 5.55 | |||
1 Year | 6.32 | |||
Class C Shares | ||||
Inception (8/13/93) | 3.66 | % | ||
10 Years | 3.13 | |||
5 Years | 5.14 | |||
1 Year | 9.56 | |||
Class Y Shares | ||||
10 Years | 4.01 | % | ||
5 Years | 6.16 | |||
1 Year | 11.60 | |||
Average Annual Total Returns
As of 6/30/14, the most recent calendar quarter end, including maximum applicable sales charges
Class A Shares | ||||
Inception (5/1/87) | 5.72 | % | ||
10 Years | 3.60 | |||
5 Years | 5.55 | |||
1 Year | 0.49 | |||
Class B Shares | ||||
Inception (5/3/93) | 4.21 | % | ||
10 Years | 3.69 | |||
5 Years | 6.11 | |||
1 Year | -0.10 | |||
Class C Shares | ||||
Inception (8/13/93) | 3.62 | % | ||
10 Years | 3.28 | |||
5 Years | 5.67 | |||
1 Year | 3.12 | |||
Class Y Shares | ||||
10 Years | 4.16 | % | ||
5 Years | 6.70 | |||
1 Year | 5.16 | |||
Effective June 1, 2010, Class A, Class B and Class C shares of the predecessor fund, Van Kampen Pennsylvania Tax Free Income Fund, advised by Van Kampen Asset Management were reorganized into Class A, Class B and Class C shares, respectively, of Invesco Van Kampen Pennsylvania Tax Free Income Fund (renamed Invesco Pennsylvania Tax Free Income Fund). Returns shown above for Class A, Class B and Class C shares are blended returns of the predecessor fund and Invesco Pennsylvania Tax Free Income Fund. Share class returns will differ from the predecessor fund because of different expenses.
Class Y shares incepted on June 1, 2010. Performance shown prior to that date is that of the predecessor fund’s Class A shares and includes the 12b-1 fees applicable to Class A shares. Class A shares performance reflects any applicable fee waivers or expense reimbursements.
The performance data quoted represent past performance and cannot guarantee comparable future results; current performance may be lower or higher. Please visit invesco.com/performance for the most recent month-end performance. Performance figures reflect reinvested distributions, changes in net asset value and the effect of the maximum sales charge unless otherwise stated.
Investment return and principal value will fluctuate so that you may have a gain or loss when you sell shares.
The total annual Fund operating expense ratio set forth in the most recent Fund prospectus as of the date of this report for Class A, Class B, Class C and Class Y shares was 1.03%, 1.03%, 1.78% and 0.78%, respectively. The expense ratios presented above may vary from the expense ratios presented in other sections of this report that are based on expenses incurred during the period covered by this report.
Class A share performance reflects the maximum 4.25% sales charge, and Class B and Class C share performance reflects the applicable contingent deferred sales charge (CDSC) for the period involved. For shares purchased prior to June 1, 2010, the CDSC on Class B shares declines from 4% at the time of purchase to 0% at the beginning of the seventh year. For shares purchased on or after June 1, 2010, the CDSC on Class B shares declines from 5% at the time of purchase to 0% at the beginning of the seventh year. The CDSC on Class C shares is 1% for the first year after purchase. Class Y shares do not have a front-end sales charge or a CDSC; therefore, performance is at net asset value.
The performance of the Fund’s share classes will differ primarily due to different sales charge structures and class expenses.
7 Invesco Pennsylvania Tax Free Income Fund
Invesco Pennsylvania Tax Free Income Fund’s investment objective is to provide only Pennsylvania investors with a high level of current income exempt from federal and Pennsylvania state income taxes and, where possible under local law, local income and personal property taxes, through investment in a varied portfolio of medium- and lower-grade municipal securities.
| n | Unless otherwise stated, information presented in this report is as of August 31, 2014, and is based on total net assets. |
| n | Unless otherwise noted, all data provided by Invesco. |
| n | To access your Fund’s reports/prospectus, visit invesco.com/fundreports. |
About share classes
| n | Class B shares may not be purchased for new or additional investments. Please see the prospectus for more information. |
| n | Class Y shares are available to only certain investors. Please see the prospectus for more information. |
Principal risks of investing in the Fund
| n | Alternative minimum tax risk. A portion of the Fund’s otherwise tax-exempt income may be taxable to those shareholders subject to the federal alternative minimum tax. |
| n | Call risk. If interest rates fall, it is possible that issuers of debt securities with high interest rates will prepay or call their securities before their maturity dates. In this event, the proceeds from the called securities would likely be reinvested by the Fund in securities bearing the new, lower interest rates, resulting in a possible decline in the Fund’s income and distributions to shareholders. |
| n | Credit risk. The issuer of instruments in which the Fund invests may be unable to meet interest and/or principal payments, thereby causing its instruments to decrease in value and lowering the issuer’s credit rating. |
| n | Derivatives risk. The value of a derivative instrument depends largely on (and is derived from) the value of an underlying security, currency, commodity, interest rate, index or other asset (each referred to as an underlying asset). In addition to risks relating to the underlying assets, the use of derivatives may include other, possibly greater, risks, including counterparty, leverage and liquidity risks. Counterparty risk is the risk that the counterparty to the derivative contract will default on its obligation to pay the Fund the amount owed or otherwise perform under the derivative contract. |
Derivatives create leverage risk because they do not require payment up front equal to the economic exposure created by owning the derivative. As a result, an adverse change in the value of the underlying asset could result in the Fund sustaining a loss that is substantially greater than the amount invested in the derivative, which may make the Fund’s returns more volatile and increase the risk of loss. Derivative instruments may also be less liquid than more traditional investments and the Fund may be unable to sell or close out its derivative positions at a desirable time or price. This risk may be more acute under adverse market conditions, during which the Fund may be most in need of liquidating its derivative positions. Derivatives may also be harder to value, less tax efficient and subject to changing government regulation that could impact the Fund’s ability to use certain derivatives or their cost. Also, derivatives used for hedging or to gain or limit exposure to a particular market segment may not provide the expected benefits, particularly during adverse market conditions.
| n | High yield bond (junk bond) risk. Junk bonds involve a greater risk of default or price changes due to changes in the credit quality of the issuer. The values of junk bonds fluctuate more than those of high-quality bonds in response to company, political, regulatory or economic developments. Values of junk bonds can decline significantly over short periods of time. |
| n | Income risk. The income you receive from the Fund is based primarily on prevailing interest rates, which can vary widely over the short- and long-term. If interest rates drop, your income from the Fund may drop as well. |
| n | Interest rate risk. Interest rate risk refers to the risk that bond prices generally fall as interest rates rise; conversely, bond prices generally rise as interest |
This report must be accompanied or preceded by a currently effective Fund prospectus, which contains more complete information, including sales charges and expenses. Investors should read it carefully before investing.
NOT FDIC INSURED | MAY LOSE VALUE | NO BANK GUARANTEE
rates fall. Specific bonds differ in their sensitivity to changes in interest rates depending on their individual characteristics, including duration.
| n | Inverse floating rate obligations risk. Inverse floating rate obligations, including tender option bonds, may be subject to greater price volatility than a fixed income security with similar qualities. When short-term interest rates rise, they may decrease in value and produce less or no income. Additionally, these securities may lose principal. Similar to derivatives, inverse floating rate obligations have the following risks: counterparty, leverage, correlation, liquidity, market, interest rate, and management risks. |
| n | Leverage risk. Leverage exists when the Fund purchases or sells an instrument or enters into a transaction without investing cash in an amount equal to the full economic exposure of the asset or transaction and the Fund could lose more than it invested. Leverage created from certain types of transactions or instruments may impair the Fund’s liquidity, cause it to liquidate positions at an unfavorable time, increase volatility or otherwise not achieve its intended objective. |
| n | Liquidity risk. The Fund may hold illiquid securities that it is unable to sell at the preferred time or price and could lose its entire investment in such securities. |
| n | Management risk. The investment techniques and risk analysis used by the Fund’s portfolio managers may not produce the desired results. |
| n | Market risk. The prices of and the income generated by the Fund’s securities may decline in response to, among other things, investor sentiment, general economic and market conditions, regional or global instability, and currency and interest rate fluctuations. |
| n | Medium- and lower-grade municipal securities risk. Securities which are in the medium- and lower-grade categories generally offer higher yields than are offered by higher-grade securities of similar maturity, but they also generally involve more volatility and greater risks, such as greater credit risk, market risk, liquidity risk, management risk, and regulatory risk. Furthermore, |
8 Invesco Pennsylvania Tax Free Income Fund
many medium- and lower-grade securities are not listed for trading on any national securities exchange and many issuers of medium- and lower-grade securities choose not to have a rating assigned to their obligations by any nationally recognized statistical rating organization. As a result, the Fund’s portfolio may consist of a higher portion of unlisted or unrated securities as compared with an investment company that invests solely in higher-grade securities. Unrated securities are usually not as attractive to as many buyers as are rated securities, a factor which may make unrated securities less marketable. These factors may have the effect of limiting the availability of the securities for purchase by the Fund and may also limit the ability of the Fund to sell such securities at their fair value either to meet redemption requests or in response to changes in the economy or the financial markets.
| n | Municipal issuer focus risk. The Fund generally considers investments in municipal securities not to be subject to industry concentration policies (issuers of municipal securities as a group is not an industry) and the Fund may invest in municipal securities issued by entities having similar characteristics. The issuers may be located in the same geographic area or may pay their interest obligations from revenue of similar projects, such as hospitals, airports, utility systems and housing finance agencies. This may make the Fund’s investments more susceptible to similar social, economic, political or regulatory occurrences. As the similarity in issuers increases, the potential for fluctuation in the Fund’s net asset value also increases. |
| n | Municipal securities risk. The Fund may invest in municipal securities. Constitutional amendments, legislative enactments, executive orders, administrative regulations, voter initiatives, and the issuer’s regional economic conditions may affect the municipal security’s value, interest payments, repayment of principal and the Fund’s ability to sell it. Failure of a municipal security issuer to comply with applicable tax requirements may make income paid thereon taxable, resulting in a decline in the security’s value. In addition, there could be changes in applicable tax laws or tax treatments that reduce or eliminate the current federal income tax exemption on municipal securities or otherwise adversely affect the current federal or state tax status of municipal securities. |
| n | Pennsylvania and US territories municipal securities risk. The Fund is more susceptible to political, economic, regulatory or other factors affecting issuers of Pennsylvania municipal securities than a fund that does not limit its investments to such issuers. As with Pennsylvania municipal securities, events in any of the territories where the Fund is invested may affect the Fund’s investments and its performance. |
| n | Reinvestment risk. Reinvestment risk is the risk that a bond’s cash flows (coupon income and principal repayment) will be reinvested at an interest rate below that on the original bond. |
| n | Variable-rate demand notes risk. The absence of an active secondary market for certain variable and floating rate notes could make it difficult to dispose of the instruments, and a portfolio could suffer a loss if the issuer defaults during periods in which a portfolio is not entitled to exercise its demand rights. |
| n | When-issued and delayed delivery risk. When-issued and delayed delivery transactions are subject to market risk as the value or yield of a security at delivery may be more or less than the purchase price or the yield generally available on securities when delivery occurs. In addition, the Fund is subject to counterparty risk because it relies on the buyer or seller, as the case may be, to consummate the transaction, and failure by the other party to complete the transaction may result in the Fund missing the opportunity of obtaining a price or yield considered to be advantageous. |
| n | Zero coupon or pay-in-kind securities risk. The value, interest rates, and liquidity of non-cash paying instruments, such as zero coupon and pay-in-kind securities, are subject to greater fluctuation than other types of securities. The higher yields and interest rates on pay-in-kind securities reflect the payment deferral and increased credit risk associated with such instruments and that such investments may represent a higher credit risk than coupon loans. Pay-in-kind securities may have a potential variability in valuations because their continuing accruals require continuing judgments about the collectability of the deferred payments and the value of any associated collateral. |
About indexes used in this report
| n | The S&P Municipal Bond Index is a broad, market value-weighted index that seeks to measure the performance of the US municipal bond market. |
| n | The Barclays Municipal Bond Index is an unmanaged index considered representative of the tax-exempt bond market. |
| n | The Barclays Pennsylvania Municipal Index is an unmanaged index considered representative of Pennsylvania investment-grade municipal bonds. |
| n | The Lipper Pennsylvania Municipal Debt Funds Index is an unmanaged index considered representative of funds that limit assets to those securities that are exempt from taxation in Pennsylvania. |
| n | The Barclays High Yield Municipal Bond Index is an unmanaged index considered representative of noninvestment-grade bonds. |
| n | The Fund is not managed to track the performance of any particular index, including the index(es) described here, and consequently, the performance of the Fund may deviate significantly from the performance of the index(es). |
| n | A direct investment cannot be made in an index. Unless otherwise indicated, index results include reinvested dividends, and they do not reflect sales charges. Performance of the peer group, if applicable, reflects fund expenses; performance of a market index does not. |
Other information
| n | The returns shown in management’s discussion of Fund performance are based on net asset values (NAVs) calculated for shareholder transactions. Generally accepted accounting principles require adjustments to be made to the net assets of the Fund at period end for financial reporting purposes, and as such, the NAVs for shareholder transactions and the returns based on those NAVs may differ from the NAVs and returns reported in the Financial Highlights. |
9 Invesco Pennsylvania Tax Free Income Fund
Schedule of Investments
August 31, 2014
| Interest Rate | Maturity Date | Principal Amount (000) | Value | |||||||||||||
Municipal Obligations–104.73% | ||||||||||||||||
| Pennsylvania–99.99% | ||||||||||||||||
Allegheny (County of) Higher Education Building Authority (Chatham University); Series 2012 A, University RB | 5.00 | % | 09/01/35 | $ | 1,000 | $ | 1,055,650 | |||||||||
Allegheny (County of) Higher Education Building Authority (Duquesne University); | ||||||||||||||||
Series 1998, Ref. University RB (INS–AMBAC)(a) | 5.50 | % | 03/01/20 | 1,750 | 2,024,995 | |||||||||||
Series 2011 A, University RB | 5.50 | % | 03/01/31 | 550 | 622,209 | |||||||||||
Allegheny (County of) Higher Education Building Authority (Robert Morris University); Series 2008 A, University RB | 6.00 | % | 10/15/38 | 1,000 | 1,071,170 | |||||||||||
Allegheny (County of) Hospital Development Authority (Ohio Valley General Hospital); Series 2005 A, RB | 5.00 | % | 04/01/25 | 1,600 | 1,540,704 | |||||||||||
Allegheny (County of) Hospital Development Authority (University of Pittsburgh Medical Center); Series 2009, RB | 5.63 | % | 08/15/39 | 1,250 | 1,438,775 | |||||||||||
Allegheny (County of) Industrial Development Authority (Residential Resources, Inc.); Series 2006, Lease RB | 5.10 | % | 09/01/26 | 980 | 989,751 | |||||||||||
Allegheny (County of) Redevelopment Authority (Pittsburgh Mills); Series 2004, Tax Allocation RB | 5.60 | % | 07/01/23 | 1,220 | 1,247,743 | |||||||||||
Allegheny (County of) Residential Finance Authority; Series 2006 TT, Single Family Mortgage RB (CEP–GNMA)(b) | 5.00 | % | 05/01/35 | 850 | 862,333 | |||||||||||
Allegheny (County of); Series 2008 C 61, Unlimited Tax GO Bonds (INS–AGC)(a) | 5.00 | % | 12/01/33 | 500 | 557,545 | |||||||||||
Allegheny Valley Joint School District; Series 2004 A, Unlimited Tax GO Bonds(c)(d) | 5.00 | % | 11/01/14 | 1,500 | 1,510,710 | |||||||||||
Beaver (County of) Industrial Development Authority (FirstEnergy Generation Corp.); Series 2008 A, Ref. PCR | 2.15 | % | 03/01/17 | 700 | 702,555 | |||||||||||
Beaver (County of) Industrial Development Authority; Series 2008 A, Ref. PCR(c) | 2.70 | % | 04/02/18 | 230 | 233,349 | |||||||||||
Beaver (County of); | ||||||||||||||||
Series 2009, Unlimited Tax GO Notes(c)(d) | 5.55 | % | 11/15/17 | 65 | 75,285 | |||||||||||
Series 2009, Unlimited Tax GO Notes (INS–AGM)(a) | 5.55 | % | 11/15/31 | 1,325 | 1,484,000 | |||||||||||
Berks (County of) Industrial Development Authority (One Douglassville); Series 2007 A, Ref. RB(b) | 6.13 | % | 11/01/34 | 450 | 452,169 | |||||||||||
Berks (County of) Municipal Authority (Albright College); Series 2004, RB | 5.50 | % | 10/01/18 | 1,895 | 1,896,687 | |||||||||||
Berks (County of) Municipal Authority (Reading Hospital Medical Center); Series 2012 A, RB | 5.00 | % | 11/01/40 | 1,000 | 1,094,830 | |||||||||||
Bethlehem (City of); | ||||||||||||||||
Series 2014, Gtd. Ref. Water RB | 5.00 | % | 11/15/30 | 425 | 479,018 | |||||||||||
Series 2014, Gtd. Ref. Water RB | 5.00 | % | 11/15/31 | 425 | 476,740 | |||||||||||
Bethlehem Area School District; Series 2010, Unlimited Tax GO Bonds (INS–AGM)(a) | 5.25 | % | 01/15/26 | 1,000 | 1,124,750 | |||||||||||
Bucks (County of) Industrial Development Authority (Lutheran Community Telford Center); Series 2007, RB | 5.75 | % | 01/01/37 | 2,000 | 2,019,180 | |||||||||||
Central Bradford Progress Authority (Guthrie Healthcare System); Series 2011, RB | 5.38 | % | 12/01/41 | 1,100 | 1,244,254 | |||||||||||
Centre (County of) Hospital Authority (Mt. Nittany Medical Center); | ||||||||||||||||
Series 2009, RB(c)(d) | 6.13 | % | 11/15/14 | 1,000 | 1,012,680 | |||||||||||
Series 2011, RB | 6.25 | % | 11/15/41 | 500 | 572,190 | |||||||||||
Chartiers Valley Industrial & Commercial Development Authority (Asbury Health Center); | ||||||||||||||||
Series 2006, Ref. First Mortgage RB | 5.25 | % | 12/01/15 | 500 | 515,835 | |||||||||||
Series 2006, Ref. First Mortgage RB | 5.75 | % | 12/01/22 | 900 | 928,773 | |||||||||||
Chester (County of) Industrial Development Authority (University Student Housing, LLC at West Chester University of Pennsylvania); Series 2013, Student Housing RB | 5.00 | % | 08/01/45 | 250 | 263,475 | |||||||||||
Cumberland (County of) Municipal Authority (Asbury Pennsylvania Obligated Group); Series 2010, RB | 6.00 | % | 01/01/40 | 870 | 916,501 | |||||||||||
Cumberland (County of) Municipal Authority (Association of Independent Colleges & Universities of Pennsylvania Financing Program-Dickinson College); Series 2009, RB | 5.00 | % | 11/01/39 | 750 | 811,807 | |||||||||||
Cumberland (County of) Municipal Authority (Diakon Lutheran Ministries); Series 2007, RB | 5.00 | % | 01/01/36 | 1,000 | 1,020,490 | |||||||||||
Cumberland (County of) Municipal Authority (Messiah Village); Series 2008 A, RB | 5.63 | % | 07/01/28 | 1,000 | 1,053,420 | |||||||||||
Dauphin (County of) General Authority (Pinnacle Health System); Series 2009 A, Health System RB | 6.00 | % | 06/01/36 | 2,215 | 2,567,473 | |||||||||||
Dauphin (County of) General Authority (Riverfront Office); Series 1998, Office & Parking RB | 6.00 | % | 01/01/25 | 1,000 | 1,000,400 | |||||||||||
Delaware (County of) Authority (Cabrini College); Series 1999, College RB (INS–Radian)(a) | 5.75 | % | 07/01/23 | 220 | 220,363 | |||||||||||
Delaware (County of) Authority (Neumann College); Series 2008, College RB | 6.25 | % | 10/01/38 | 150 | 158,808 | |||||||||||
See accompanying Notes to Financial Statements which are an integral part of the financial statements.
10 Invesco Pennsylvania Tax Free Income Fund
| Interest Rate | Maturity Date | Principal Amount (000) | Value | |||||||||||||
| Pennsylvania–(continued) | ||||||||||||||||
Delaware (County of) Industrial Development Authority (Aqua Pennsylvania, Inc.); Series 2005 A, Water Facilities RB (INS–NATL)(a)(b) | 5.00 | % | 11/01/38 | $ | 1,500 | $ | 1,552,455 | |||||||||
Delaware River Port Authority (Port District); | ||||||||||||||||
Series 2012, Ref. RB | 5.00 | % | 01/01/25 | 540 | 616,869 | |||||||||||
Series 2012, Ref. RB | 5.00 | % | 01/01/27 | 535 | 601,640 | |||||||||||
Delaware River Port Authority; Series 2010 D, RB | 5.00 | % | 01/01/40 | 1,000 | 1,076,210 | |||||||||||
Delaware Valley Regional Financial Authority; | ||||||||||||||||
Series 2002, RB | 5.75 | % | 07/01/17 | 3,535 | 3,982,001 | |||||||||||
Series 2002, RB | 5.75 | % | 07/01/32 | 1,000 | 1,226,660 | |||||||||||
Doylestown (City of) Hospital Authority; Series 2013 A, RB (INS–AGM)(a) | 5.00 | % | 07/01/24 | 1,000 | 1,132,650 | |||||||||||
East Hempfield (Township of) Industrial Development Authority (Student Services Inc. Student Housing); | ||||||||||||||||
Series 2013, RB | 5.00 | % | 07/01/35 | 500 | 523,365 | |||||||||||
Series 2014, RB | 5.00 | % | 07/01/39 | 250 | 260,855 | |||||||||||
Erie (City of) Higher Education Building Authority (Mercyhurst College); | ||||||||||||||||
Series 2004 B, Ref. College RB | 5.00 | % | 03/15/23 | 1,000 | 1,001,540 | |||||||||||
Series 2008, College RB | 5.50 | % | 03/15/38 | 500 | 525,360 | |||||||||||
Franklin (County of) Industrial Development Authority (Chambersburg Hospital); Series 2010, RB | 5.38 | % | 07/01/42 | 1,000 | 1,069,840 | |||||||||||
Geisinger Authority (Geisinger Health System Foundation); | ||||||||||||||||
Series 2002, VRD Health System RB(e) | 0.01 | % | 11/15/32 | 1,600 | 1,600,000 | |||||||||||
Series 2011 A1, Health System RB | 5.13 | % | 06/01/41 | 500 | 548,955 | |||||||||||
Series 2013 A, VRD Health System RB(e) | 0.01 | % | 10/01/43 | 900 | 900,000 | |||||||||||
Lancaster (County of) Hospital Authority (Brethren Village); Series 2008 A, RB | 6.50 | % | 07/01/40 | 350 | 365,495 | |||||||||||
Lehigh (County of) Authority; Series 2013 A, Water & Sewer RB | 5.00 | % | 12/01/38 | 930 | 1,015,969 | |||||||||||
Lehigh (County of) General Purpose Authority (Bible Fellowship Church Homes, Inc.); Series 2013, RB | 5.25 | % | 07/01/42 | 825 | 828,358 | |||||||||||
Lehigh (County of) General Purpose Authority (Kidspeace Obligation Group); | ||||||||||||||||
Series 2014-A, RB | 7.50 | % | 02/01/44 | 690 | 632,312 | |||||||||||
Series 2014-B, Conv. CAB RB(f) | 7.50 | % | 02/01/44 | 172 | 25,449 | |||||||||||
Series 2014-C, RB | 0.00 | % | 02/01/44 | 516 | 5 | |||||||||||
Lycoming (County of) Authority (Pennsylvania College of Technology); Series 2011, RB | 5.00 | % | 07/01/30 | 750 | 822,405 | |||||||||||
Lycoming (County of) Authority (Susquehanna Health System); Series 2009 A, Heath System RB | 5.75 | % | 07/01/39 | 1,250 | 1,334,525 | |||||||||||
Monroe (County of) Hospital Authority (Pocono Medical Center); Series 2007, RB | 5.13 | % | 01/01/37 | 1,500 | 1,542,990 | |||||||||||
Montgomery (County of) Higher Education & Health Authority (Abington Memorial Hospital Obligated Group); Series 2012, RB | 5.00 | % | 06/01/31 | 1,400 | 1,535,506 | |||||||||||
Montgomery (County of) Industrial Development Authority (ACTS Retirement-Life Communities, Inc.); | ||||||||||||||||
Series 2009 A-1, RB | 6.25 | % | 11/15/29 | 1,000 | 1,139,090 | |||||||||||
Series 2012, Ref. RB | 5.00 | % | 11/15/28 | 900 | 970,308 | |||||||||||
Montgomery (County of) Industrial Development Authority (Philadelphia Presbytery Homes, Inc.); Series 2010, RB | 6.63 | % | 12/01/30 | 1,500 | 1,715,775 | |||||||||||
Montgomery (County of) Industrial Development Authority (Whitemarsh Community); Series 2008, Mortgage RB | 7.00 | % | 02/01/36 | 500 | 537,655 | |||||||||||
Montgomery (County of) Industrial Development Authority (Whitemarsh Continuing Care); Series 2005, Mortgage RB | 6.13 | % | 02/01/28 | 1,100 | 1,110,087 | |||||||||||
Northampton (County of) General Purpose Authority (Lehigh University); Series 2009, Higher Education RB | 5.50 | % | 11/15/33 | 1,000 | 1,109,720 | |||||||||||
Northampton (County of) General Purpose Authority (St. Luke’s Hospital); | ||||||||||||||||
Series 2008 A, Hospital RB | 5.50 | % | 08/15/35 | 1,000 | 1,054,050 | |||||||||||
Series 2010 C, Hospital RB(c) | 4.50 | % | 08/15/16 | 1,000 | 1,057,810 | |||||||||||
Northampton (County of) Industrial Development Authority (Morningstar Senior Living, Inc.); Series 2012, RB | 5.00 | % | 07/01/32 | 535 | 549,980 | |||||||||||
Pennsylvania (Commonwealth of); First Series 2014, Unlimited Tax GO Bonds(g) | 5.00 | % | 06/15/34 | 3,000 | 3,463,110 | |||||||||||
Pennsylvania (State of) Economic Development Financing Agency (Forum Place); Series 2012, Governmental Lease RB | 5.00 | % | 03/01/34 | 500 | 543,110 | |||||||||||
Pennsylvania (State of) Economic Development Financing Authority (Amtrak); Series 2012 A, Ref. Exempt Facilities RB(b) | 5.00 | % | 11/01/41 | 1,200 | 1,289,376 | |||||||||||
See accompanying Notes to Financial Statements which are an integral part of the financial statements.
11 Invesco Pennsylvania Tax Free Income Fund
| Interest Rate | Maturity Date | Principal Amount (000) | Value | |||||||||||||
| Pennsylvania–(continued) | ||||||||||||||||
Pennsylvania (State of) Economic Development Financing Authority (Philadelphia Biosolids Facility); Series 2009, Sewage Sludge Disposal RB | 6.25 | % | 01/01/32 | $ | 1,000 | $ | 1,101,840 | |||||||||
Pennsylvania (State of) Economic Development Financing Authority (Shippingport); Series 2006 A, Exempt Facilities RB(c) | 2.55 | % | 12/03/18 | 1,500 | 1,515,420 | |||||||||||
Pennsylvania (State of) Economic Development Financing Authority (Waste Management, Inc.); Series 2005 A, Solid Waste Disposal RB(b) | 5.10 | % | 10/01/27 | 1,300 | 1,350,791 | |||||||||||
Pennsylvania (State of) Higher Educational Facilities Authority (AICUP Financing Program-Del Valley College); Series 2012, RB | 5.00 | % | 11/01/42 | 535 | 555,148 | |||||||||||
Pennsylvania (State of) Higher Educational Facilities Authority (Edinboro University Foundation); | ||||||||||||||||
Series 2008, RB | 5.88 | % | 07/01/38 | 750 | 780,120 | |||||||||||
Series 2010, RB | 6.00 | % | 07/01/43 | 500 | 531,570 | |||||||||||
Pennsylvania (State of) Higher Educational Facilities Authority (La Salle University); Series 2012, RB | 5.00 | % | 05/01/42 | 1,180 | 1,260,228 | |||||||||||
Pennsylvania (State of) Higher Educational Facilities Authority (Shippensburg University Student Services); Series 2012, RB | 5.00 | % | 10/01/35 | 1,300 | 1,344,122 | |||||||||||
Pennsylvania (State of) Higher Educational Facilities Authority (St. Joseph’s University); Series 2010 A, RB | 5.00 | % | 11/01/34 | 500 | 536,265 | |||||||||||
Pennsylvania (State of) Higher Educational Facilities Authority (Temple University); First Series 2012, RB | 5.00 | % | 04/01/42 | 570 | 625,142 | |||||||||||
Pennsylvania (State of) Higher Educational Facilities Authority (Trustees of the University of Pennsylvania); Series 2005 C, RB(g) | 5.00 | % | 07/15/38 | 4,700 | 4,855,617 | |||||||||||
Pennsylvania (State of) Turnpike Commission; | ||||||||||||||||
Series 2008 B-1, Sub. RB | 5.50 | % | 06/01/33 | 1,000 | 1,114,510 | |||||||||||
Series 2009 C, Sub. Conv. CAB RB (INS–AGM)(a)(f) | 6.25 | % | 06/01/33 | 2,000 | 2,311,740 | |||||||||||
Series 2009 E, Sub. Conv. CAB RB(f) | 6.38 | % | 12/01/38 | 1,435 | 1,515,030 | |||||||||||
Series 2010 A 1, Motor License Fund Special RB | 5.00 | % | 12/01/38 | 500 | 539,305 | |||||||||||
Series 2010 A-2, Motor License Fund Special Conv. CAB RB(f) | 5.50 | % | 12/01/34 | 1,000 | 1,041,900 | |||||||||||
Series 2010 B 2, Conv. CAB RB(f) | 5.00 | % | 12/01/30 | 625 | 644,862 | |||||||||||
Series 2010 B 2, Conv. CAB RB(f) | 5.13 | % | 12/01/35 | 500 | 511,650 | |||||||||||
Philadelphia (City of) Authority for Industrial Development (The Children’s Hospital of Philadelphia); Series 2014 A, Hospital RB(g) | 5.00 | % | 07/01/42 | 1,500 | 1,717,440 | |||||||||||
Philadelphia (City of) Hospitals & Higher Education Facilities Authority (Children’s Hospital of Philadelphia); | ||||||||||||||||
Series 2002 B, VRD RB(e) | 0.04 | % | 07/01/25 | 200 | 200,000 | |||||||||||
Series 2011, VRD RB(e) | 0.04 | % | 07/01/41 | 200 | 200,000 | |||||||||||
Philadelphia (City of) Hospitals & Higher Education Facilities Authority (Jefferson Health System); Series 2010 B, RB(c)(d) | 5.00 | % | 05/15/20 | 1,500 | 1,793,880 | |||||||||||
Philadelphia (City of) Industrial Development Authority (Architecture & Design Charter High School); Series 2013, RB | 6.13 | % | 03/15/43 | 585 | 606,417 | |||||||||||
Philadelphia (City of) Industrial Development Authority (Discovery Charter School); Series 2012, RB | 6.25 | % | 04/01/42 | 1,000 | 1,054,200 | |||||||||||
Philadelphia (City of) Industrial Development Authority (First Philadelphia Preparatory Charter School); Series 2014 A, RB | 7.00 | % | 06/15/33 | 875 | 951,160 | |||||||||||
Philadelphia (City of) Industrial Development Authority (Independence Charter School); Series 2007 A, RB | 5.50 | % | 09/15/37 | 1,235 | 1,254,291 | |||||||||||
Philadelphia (City of) Industrial Development Authority (MaST Charter School); Series 2010, RB | 6.00 | % | 08/01/35 | 700 | 768,698 | |||||||||||
Philadelphia (City of) Industrial Development Authority (New Foundations Charter School); Series 2012, RB | 6.63 | % | 12/15/41 | 750 | 817,102 | |||||||||||
Philadelphia (City of) Industrial Development Authority (Performing Arts Charter School); Series 2013, RB(h) | 6.50 | % | 06/15/33 | 945 | 965,998 | |||||||||||
Philadelphia (City of) Industrial Development Authority (Please Touch Museum); Series 2006, RB(i) | 5.25 | % | 09/01/31 | 1,250 | 384,250 | |||||||||||
Philadelphia (City of); | ||||||||||||||||
Ninth Series 2010, Gas Works RB | 5.25 | % | 08/01/40 | 1,000 | 1,141,420 | |||||||||||
Series 2005 A, Airport RB (INS–NATL)(a)(b) | 5.00 | % | 06/15/25 | 1,000 | 1,034,900 | |||||||||||
Series 2009 A, Ref. Unlimited Tax GO Bonds (INS–AGC)(a) | 5.50 | % | 08/01/24 | 1,000 | 1,137,940 | |||||||||||
Series 2010 C, Water & Wastewater RB (INS–AGM)(a) | 5.00 | % | 08/01/35 | 1,250 | 1,358,175 | |||||||||||
Series 2011, Unlimited Tax GO Bonds | 6.00 | % | 08/01/36 | 500 | 573,080 | |||||||||||
Philadelphia School District; Series 2008 E, Limited Tax GO Bonds (INS–BHAC)(a) | 5.13 | % | 09/01/23 | 1,500 | 1,718,370 | |||||||||||
Pittsburgh (City of) & Allegheny (County of) Sports & Exhibition Authority (Regional Asset District); Series 2010, Ref. Sales Tax RB (INS–AGM)(a) | 5.00 | % | 02/01/31 | 1,000 | 1,092,150 | |||||||||||
See accompanying Notes to Financial Statements which are an integral part of the financial statements.
12 Invesco Pennsylvania Tax Free Income Fund
| Interest Rate | Maturity Date | Principal Amount (000) | Value | |||||||||||||
| Pennsylvania–(continued) | ||||||||||||||||
Pittsburgh (City of) Water & Sewer Authority; Series 2013 A, Ref. First Lien RB | 5.00 | % | 09/01/31 | $ | 500 | $ | 565,545 | |||||||||
Radnor Township School District; | ||||||||||||||||
Series 2005 B, Unlimited Tax GO Bonds(c)(d) | 5.00 | % | 08/15/15 | 435 | 455,354 | |||||||||||
Series 2005 B, Unlimited Tax GO Bonds(c)(d) | 5.00 | % | 08/15/15 | 130 | 136,083 | |||||||||||
Series 2005 B, Unlimited Tax GO Bonds(c)(d) | 5.00 | % | 08/15/15 | 435 | 455,354 | |||||||||||
State Public School Building Authority (Harrisburg School District); Series 2009 A, RB (INS–AGC)(a) | 5.00 | % | 11/15/33 | 1,000 | 1,060,780 | |||||||||||
Susquehanna Area Regional Airport Authority; Series 2012 A, Airport System RB(b) | 5.00 | % | 01/01/27 | 1,185 | 1,286,637 | |||||||||||
Union (County of) Hospital Authority (Evangelical Community Hospital); Series 2011, Ref. & Improvement RB | 7.00 | % | 08/01/41 | 1,000 | 1,186,440 | |||||||||||
Washington (County of) Industrial Development Authority (Washington Jefferson College); Series 2010, College RB | 5.25 | % | 11/01/30 | 500 | 548,005 | |||||||||||
Washington (County of) Redevelopment Authority (Victory Centre Tanger Outlet Development); Series 2006 A, Tax Allocation RB | 5.45 | % | 07/01/35 | 1,400 | 1,427,482 | |||||||||||
Westmoreland (County of) Industrial Development Authority (Redstone Presbyterian Senior Care Obligated Group); | ||||||||||||||||
Series 2005 A, Retirement Community RB(c)(d) | 5.75 | % | 01/01/16 | 2,500 | 2,677,175 | |||||||||||
Series 2005 A, Retirement Community RB(c)(d) | 5.88 | % | 01/01/16 | 900 | 965,286 | |||||||||||
Westmoreland (County of) Municipal Authority; Series 2013, RB | 5.00 | % | 08/15/31 | 750 | 837,412 | |||||||||||
Wilkes-Barre (City of) Finance Authority (University of Scranton); Series 2010, RB | 5.00 | % | 11/01/40 | 850 | 910,197 | |||||||||||
| 127,924,583 | ||||||||||||||||
| Guam–3.64% | ||||||||||||||||
Guam (Territory of) (Section 30); Series 2009 A, Limited Obligation RB | 5.75 | % | 12/01/34 | 1,250 | 1,384,825 | |||||||||||
Guam (Territory of) Power Authority; | ||||||||||||||||
Series 2010 A, RB | 5.50 | % | 10/01/40 | 410 | 459,352 | |||||||||||
Series 2012 A, Ref. RB | 5.00 | % | 10/01/34 | 520 | 568,885 | |||||||||||
Guam (Territory of) Waterworks Authority; | ||||||||||||||||
Series 2010, Water & Wastewater System RB | 5.63 | % | 07/01/40 | 1,000 | 1,090,060 | |||||||||||
Series 2014-A, Water and Wastewater System Ref. RB | 5.00 | % | 07/01/29 | 285 | 312,964 | |||||||||||
Guam (Territory of); Series 2011 A, Business Privilege Tax RB | 5.13 | % | 01/01/42 | 785 | 841,936 | |||||||||||
| 4,658,022 | ||||||||||||||||
| Virgin Islands–1.10% | ||||||||||||||||
Virgin Islands (Government of) Public Finance Authority (Matching Fund Loan Note–Diageo); Series 2009 A, Sub. RB | 6.63 | % | 10/01/29 | 750 | 859,485 | |||||||||||
Virgin Islands (Government of) Public Finance Authority (Matching Fund Loan Note); Series 2010 A, Sr. Lien RB | 5.00 | % | 10/01/29 | 500 | 547,535 | |||||||||||
| 1,407,020 | ||||||||||||||||
TOTAL INVESTMENTS(j)–104.73% (Cost $126,437,219) | 133,989,625 | |||||||||||||||
FLOATING RATE NOTE OBLIGATIONS–(4.80)% | ||||||||||||||||
Notes with interest and fee rates ranging from 0.57% to 0.58% at 08/31/14 and maturities of collateral ranging from 06/15/34 to 07/01/42 (See Note 1J)(k) | (6,135,000 | ) | ||||||||||||||
OTHER ASSETS LESS LIABILITIES–0.07% | 79,236 | |||||||||||||||
NET ASSETS–100.00% | $ | 127,933,861 | ||||||||||||||
See accompanying Notes to Financial Statements which are an integral part of the financial statements.
13 Invesco Pennsylvania Tax Free Income Fund
Investment Abbreviations:
| AGC | – Assured Guaranty Corp. | |
| AGM | – Assured Guaranty Municipal Corp. | |
| AMBAC | – American Municipal Bond Assurance Corp. | |
| BHAC | – Berkshire Hathaway Assurance Corp. | |
| CAB | – Capital Appreciation Bonds | |
| CEP | – Credit Enhancement Provider | |
| Conv. | – Convertible | |
| GNMA | – Government National Mortgage Association | |
| GO | – General Obligation | |
| Gtd. | – Guaranteed | |
| INS | – Insurer | |
| NATL | – National Public Finance Guarantee Corp. | |
| PCR | – Pollution Control Revenue Bonds | |
| Radian | – Radian Asset Assurance, Inc. | |
| RB | – Revenue Bonds | |
| Ref. | – Refunding | |
| Sr. | – Senior | |
| Sub. | – Subordinated | |
| VRD | – Variable Rate Demand |
Notes to Schedule of Investments:
| (a) | Principal and/or interest payments are secured by the bond insurance company listed. |
| (b) | Security subject to the alternative minimum tax. |
| (c) | Security has an irrevocable call by the issuer or mandatory put by the holder. Maturity date reflects such call or put. |
| (d) | Advance refunded; secured by an escrow fund of U.S. Government obligations or other highly rated collateral. |
| (e) | Demand security payable upon demand by the Fund at specified time intervals no greater than thirteen months. Interest rate is redetermined periodically. Rate shown is the rate in effect on August 31, 2014. |
| (f) | Convertible CAB. The interest rate shown represents the coupon rate at which the bond will accrue at a specified future date. |
| (g) | Underlying security related to Dealer Trusts entered into by the Fund. See Note 1J. |
| (h) | Security purchased or received in transaction exempt from registration under the Securities Act of 1933, as amended (the “1933 Act”). The security may be resold pursuant to an exemption from registration under the 1933 Act, typically to qualified institutional buyers. The value of this security at August 31, 2014 represented less than 1% of the Fund’s Net Assets. |
| (i) | Defaulted security. Currently, the issuer is partially or fully in default with respect to interest payments. The value of this security at August 31, 2014 represented less than 1% of the Fund’s Net Assets. |
| (j) | This table provides a listing of those entities that have either issued, guaranteed, backed or otherwise enhanced the credit quality of more than 5% of the securities held in the portfolio. In instances where the entity has guaranteed, backed or otherwise enhanced the credit quality of a security, it is not primarily responsible for the issuer’s obligations but may be called upon to satisfy the issuer’s obligations. |
| Entity | Percentage | |||
Assured Guaranty Municipal Corp. | 6.4 | % | ||
| (k) | Floating rate note obligations related to securities held. The interest and fee rates shown reflect the rates in effect at August 31, 2014. At August 31, 2014, the Fund’s investments with a value of $10,036,167 are held by Dealer Trusts and serve as collateral for the $6,135,000 in the floating rate note obligations outstanding at that date. |
See accompanying Notes to Financial Statements which are an integral part of the financial statements.
14 Invesco Pennsylvania Tax Free Income Fund
Statement of Assets and Liabilities
August 31, 2014
Assets: | ||||
Investments, at value (Cost $126,437,219) | $ | 133,989,625 | ||
Cash | 273,191 | |||
Receivable for: | ||||
Investments sold | 1,878,995 | |||
Fund shares sold | 106,280 | |||
Interest | 1,490,088 | |||
Investment for trustee deferred compensation and retirement plans | 32,800 | |||
Other assets | 1,731 | |||
Total assets | 137,772,710 | |||
Liabilities: | ||||
Floating rate note obligations | 6,135,000 | |||
Payable for: | ||||
Investments purchased | 3,303,025 | |||
Fund shares reacquired | 128,297 | |||
Dividends | 141,494 | |||
Accrued fees to affiliates | 44,951 | |||
Accrued trustees’ and officers’ fees and benefits | 3,357 | |||
Accrued other operating expenses | 47,029 | |||
Trustee deferred compensation and retirement plans | 35,696 | |||
Total liabilities | 9,838,849 | |||
Net assets applicable to shares outstanding | $ | 127,933,861 | ||
Net assets consist of: | ||||
Shares of beneficial interest | $ | 129,532,510 | ||
Undistributed net investment income | 454,309 | |||
Undistributed net realized gain (loss) | (9,605,364 | ) | ||
Net unrealized appreciation | 7,552,406 | |||
| $ | 127,933,861 | |||
Net Assets: | ||||
Class A | $ | 113,872,122 | ||
Class B | $ | 1,544,011 | ||
Class C | $ | 9,804,499 | ||
Class Y | $ | 2,713,229 | ||
Shares outstanding, $0.01 par value per share, |
| |||
Class A | 6,902,415 | |||
Class B | 93,395 | |||
Class C | 593,181 | |||
Class Y | 164,311 | |||
Class A: | ||||
Net asset value per share | $ | 16.50 | ||
Maximum offering price per share | ||||
(Net asset value of $16.50 ¸ 95.75%) | $ | 17.23 | ||
Class B: | ||||
Net asset value and offering price per share | $ | 16.53 | ||
Class C: | ||||
Net asset value and offering price per share | $ | 16.53 | ||
Class Y: | ||||
Net asset value and offering price per share | $ | 16.51 | ||
See accompanying Notes to Financial Statements which are an integral part of the financial statements.
15 Invesco Pennsylvania Tax Free Income Fund
Statement of Operations
For the year ended August 31, 2014
Investment income: |
| |||
Interest | $ | 6,452,373 | ||
Expenses: | ||||
Advisory fees | 771,866 | |||
Administrative services fees | 50,000 | |||
Custodian fees | 4,726 | |||
Distribution fees: | ||||
Class A | 285,565 | |||
Class B | 3,952 | |||
Class C | 98,449 | |||
Interest, facilities and maintenance fees | 24,210 | |||
Transfer agent fees | 93,182 | |||
Trustees’ and officers’ fees and benefits | 27,538 | |||
Other | 109,124 | |||
Total expenses | 1,468,612 | |||
Less: Expense offset arrangement(s) | (163 | ) | ||
Net expenses | 1,468,449 | |||
Net investment income | 4,983,924 | |||
Realized and unrealized gain (loss) from: | ||||
Net realized gain (loss) from investment securities | (2,475,247 | ) | ||
Change in net unrealized appreciation of investment securities | 11,214,093 | |||
Net realized and unrealized gain | 8,738,846 | |||
Net increase in net assets resulting from operations | $ | 13,722,770 | ||
See accompanying Notes to Financial Statements which are an integral part of the financial statements.
16 Invesco Pennsylvania Tax Free Income Fund
Statement of Changes in Net Assets
For the years ended August 31, 2014 and 2013
| 2014 | 2013 | |||||||
Operations: | ||||||||
Net investment income | $ | 4,983,924 | $ | 5,512,379 | ||||
Net realized gain (loss) | (2,475,247 | ) | (50,752 | ) | ||||
Change in net unrealized appreciation (depreciation) | 11,214,093 | (14,712,745 | ) | |||||
Net increase (decrease) in net assets resulting from operations | 13,722,770 | (9,251,118 | ) | |||||
Distributions to shareholders from net investment income: | ||||||||
Class A | (4,337,929 | ) | (5,070,822 | ) | ||||
Class B | (59,962 | ) | (82,884 | ) | ||||
Class C | (310,949 | ) | (363,194 | ) | ||||
Class Y | (99,215 | ) | (89,080 | ) | ||||
Total distributions from net investment income | (4,808,055 | ) | (5,605,980 | ) | ||||
Share transactions–net: | ||||||||
Class A | (12,996,752 | ) | (5,082,518 | ) | ||||
Class B | (282,934 | ) | (517,802 | ) | ||||
Class C | (1,740,082 | ) | 1,080,821 | |||||
Class Y | (14,839 | ) | 1,535,814 | |||||
Net increase (decrease) in net assets resulting from share transactions | (15,034,607 | ) | (2,983,685 | ) | ||||
Net increase (decrease) in net assets | (6,119,892 | ) | (17,840,783 | ) | ||||
Net assets: | ||||||||
Beginning of year | 134,053,753 | 151,894,536 | ||||||
End of year (includes undistributed net investment income of $454,309 and $275,396, respectively) | $ | 127,933,861 | $ | 134,053,753 | ||||
Notes to Financial Statements
August 31, 2014
NOTE 1—Significant Accounting Policies
Invesco Pennsylvania Tax Free Income Fund (the “Fund”) is a series portfolio of AIM Counselor Series Trust (Invesco Counselor Series Trust) (the “Trust”). The Trust is a Delaware statutory trust registered under the Investment Company Act of 1940, as amended (the “1940 Act”), as an open-end series management investment company consisting of thirteen separate portfolios, each authorized to issue an unlimited number of shares of beneficial interest. The assets, liabilities and operations of each portfolio are accounted for separately. Information presented in these financial statements pertains only to the Fund. Matters affecting each portfolio or class will be voted on exclusively by the shareholders of such portfolio or class.
The Fund’s investment objective is to provide only Pennsylvania investors with a high level of current income exempt from federal and Pennsylvania state income taxes and, where possible under local law, local income and personal property taxes, through investment in a varied portfolio of medium- and lower-grade municipal securities.
The Fund currently consists of four different classes of shares: Class A, Class B, Class C and Class Y. Class A shares are sold with a front-end sales charge unless certain waiver criteria are met and under certain circumstances load waived shares may be subject to contingent deferred sales charges (“CDSC”). Class C shares are sold with a CDSC. Class Y shares are sold at net asset value. Effective November 30, 2010, new or additional investments in Class B shares are no longer permitted. Existing shareholders of Class B shares may continue to reinvest dividends and capital gains distributions in Class B shares until they convert to Class A shares. Also, shareholders in Class B shares will be able to exchange those shares for Class B shares of other Invesco Funds offering such shares until they convert to Class A shares. Generally, Class B shares will automatically convert to Class A shares on or about the month-end, which is at least eight years after the date of purchase. Redemption of Class B shares prior to conversion date will be subject to a CDSC.
The following is a summary of the significant accounting policies followed by the Fund in the preparation of its financial statements.
| A. | Security Valuations — Securities, including restricted securities, are valued according to the following policy. |
Securities are fair valued using an evaluated quote provided by an independent pricing service approved by the Board of Trustees. Evaluated quotes provided by the pricing service may be determined without exclusive reliance on quoted prices, and may reflect appropriate factors such as institution-size trading in similar groups of securities, developments related to specific securities, dividend rate (for unlisted equities), yield (for debt obligations), quality, type of issue, coupon rate (for debt obligations), maturity (for debt obligations), individual trading characteristics and other market data. Debt obligations are subject to interest rate and credit risks. In addition, all debt obligations involve some risk of default with respect to interest and/or principal payments.
Securities for which market quotations either are not readily available or became unreliable are valued at fair value as determined in good faith by or under the supervision of the Trust’s officers following procedures approved by the Board of Trustees. Some of the factors which may be considered in determining fair value are fundamental analytical data relating to the investment; the nature and duration of any restrictions on
17 Invesco Pennsylvania Tax Free Income Fund
transferability or disposition; trading in similar securities by the same issuer or comparable companies; relevant political, economic or issuer specific news; and other relevant factors under the circumstances.
The Fund may invest in securities that are subject to interest rate risk, meaning the risk that the prices will generally fall as interest rates rise and, conversely, the prices will generally rise as interest rates fall. Specific securities differ in their sensitivity to changes in interest rates depending on their individual characteristics. Changes in interest rates may result in increased market volatility, which may affect the value and/or liquidity of certain of the Fund’s investments.
Valuations change in response to many factors including the historical and prospective earnings of the issuer, the value of the issuer’s assets, general economic conditions, interest rates, investor perceptions and market liquidity. Because of the inherent uncertainties of valuation, the values reflected in the financial statements may materially differ from the value received upon actual sale of those investments.
| B. | Securities Transactions and Investment Income — Securities transactions are accounted for on a trade date basis. Realized gains or losses on sales are computed on the basis of specific identification of the securities sold. Interest income (net of withholding tax, if any) is recorded on the accrual basis from settlement date. Dividend income (net of withholding tax, if any) is recorded on the ex-dividend date. Bond premiums and discounts are amortized and/or accreted for financial reporting purposes. |
The Fund may periodically participate in litigation related to Fund investments. As such, the Fund may receive proceeds from litigation settlements. Any proceeds received are included in the Statement of Operations as realized gain (loss) for investments no longer held and as unrealized gain (loss) for investments still held.
Brokerage commissions and mark ups are considered transaction costs and are recorded as an increase to the cost basis of securities purchased and/or a reduction of proceeds on a sale of securities. Such transaction costs are included in the determination of net realized and unrealized gain (loss) from investment securities reported in the Statement of Operations and the Statement of Changes in Net Assets and the net realized and unrealized gains (losses) on securities per share in the Financial Highlights. Transaction costs are included in the calculation of the Fund’s net asset value and, accordingly, they reduce the Fund’s total returns. These transaction costs are not considered operating expenses and are not reflected in net investment income reported in the Statement of Operations and Statement of Changes in Net Assets, or the net investment income per share and ratios of expenses and net investment income reported in the Financial Highlights, nor are they limited by any expense limitation arrangements between the Fund and the investment adviser.
The Fund allocates realized and unrealized capital gains and losses to a class based on the relative net assets of each class. The Fund allocates income to a class based on the relative value of the settled shares of each class.
| C. | Country Determination — For the purposes of making investment selection decisions and presentation in the Schedule of Investments, the investment adviser may determine the country in which an issuer is located and/or credit risk exposure based on various factors. These factors include the laws of the country under which the issuer is organized, where the issuer maintains a principal office, the country in which the issuer derives 50% or more of its total revenues and the country that has the primary market for the issuer’s securities, as well as other criteria. Among the other criteria that may be evaluated for making this determination are the country in which the issuer maintains 50% or more of its assets, the type of security, financial guarantees and enhancements, the nature of the collateral and the sponsor organization. Country of issuer and/or credit risk exposure has been determined to be the United States of America, unless otherwise noted. |
| D. | Distributions — Distributions from net investment income are declared daily and paid monthly. Distributions from net realized capital gain, if any, are generally declared and paid annually and recorded on the ex-dividend date. The Fund may elect to treat a portion of the proceeds from redemptions as distributions for federal income tax purposes. |
| E. | Federal Income Taxes — The Fund intends to comply with the requirements of Subchapter M of the Internal Revenue Code of 1986, as amended (the “Internal Revenue Code”), necessary to qualify as a regulated investment company and to distribute substantially all of the Fund’s taxable and tax-exempt earnings to shareholders. As such, the Fund will not be subject to federal income taxes on otherwise taxable income (including net realized capital gain) that is distributed to shareholders. Therefore, no provision for federal income taxes is recorded in the financial statements. |
The Fund recognizes the tax benefits of uncertain tax positions only when the position is more likely than not to be sustained. Management has analyzed the Fund’s uncertain tax positions and concluded that no liability for unrecognized tax benefits should be recorded related to uncertain tax positions. Management is not aware of any tax positions for which it is reasonably possible that the total amounts of unrecognized tax benefits will change materially in the next 12 months.
In addition, the Fund intends to invest in such municipal securities to allow it to qualify to pay shareholders “exempt-interest dividends”, as defined in the Internal Revenue Code.
The Fund files tax returns in the U.S. Federal jurisdiction and certain other jurisdictions. Generally, the Fund is subject to examinations by such taxing authorities for up to three years after the filing of the return for the tax period.
| F. | Expenses — Fees provided for under the Rule 12b-1 plan of a particular class of the Fund and which are directly attributable to that class are charged to the operations of such class. All other expenses are allocated among the classes based on relative net assets. Prior to June 1, 2010, incremental transfer agency fees which were unique to each class of shares were charged to the operations of such class. |
| G. | Interest, Facilities and Maintenance Fees — Interest, Facilities and Maintenance Fees include interest and related borrowing costs such as commitment fees and other expenses associated with lines of credit and interest and administrative expenses related to establishing and maintaining floating rate note obligations, if any. |
| H. | Accounting Estimates — The preparation of financial statements in conformity with accounting principles generally accepted in the United States of America (“GAAP”) requires management to make estimates and assumptions that affect the reported amounts of assets and liabilities at the date of the financial statements and the reported amounts of revenues and expenses during the reporting period including estimates and assumptions related to taxation. Actual results could differ from those estimates by a significant amount. In addition, the Fund monitors for material events or transactions that may occur or become known after the period-end date and before the date the financial statements are released to print. |
| I. | Indemnifications — Under the Trust’s organizational documents, each Trustee, officer, employee or other agent of the Trust is indemnified against certain liabilities that may arise out of the performance of their duties to the Fund. Additionally, in the normal course of business, the Fund enters into contracts, including the Fund’s servicing agreements, that contain a variety of indemnification clauses. The Fund’s maximum |
18 Invesco Pennsylvania Tax Free Income Fund
| exposure under these arrangements is unknown as this would involve future claims that may be made against the Fund that have not yet occurred. The risk of material loss as a result of such indemnification claims is considered remote. |
| J. | Floating Rate Note Obligations — The Fund invests in inverse floating rate securities, such as Residual Interest Bonds (“RIBs”) or Tender Option Bonds (“TOBs”) for investment purposes and to enhance the yield of the Fund. Inverse floating rate investments tend to underperform the market for fixed rate bonds in a rising interest rate environment, but tend to outperform the market for fixed rate bonds when interest rates decline or remain relatively stable. Such transactions may be purchased in the secondary market without first owning the underlying bond or by the sale of fixed rate bonds by the Fund to special purpose trusts established by a broker dealer (“Dealer Trusts”) in exchange for cash and residual interests in the Dealer Trusts’ assets and cash flows, which are in the form of inverse floating rate securities. The Dealer Trusts finance the purchases of the fixed rate bonds by issuing floating rate notes to third parties and allowing the Fund to retain residual interests in the bonds. The floating rate notes issued by the Dealer Trusts have interest rates that reset weekly and the floating rate note holders have the option to tender their notes to the Dealer Trusts for redemption at par at each reset date. The residual interests held by the Fund (inverse floating rate investments) include the right of the Fund (1) to cause the holders of the floating rate notes to tender their notes at par at the next interest rate reset date, and (2) to transfer the municipal bond from the Dealer Trusts to the Fund, thereby collapsing the Dealer Trusts. |
Recently published final rules implementing section 619 of the Dodd-Frank Wall Street Reform and Consumer Protection Act (the “Volcker Rule”) prohibit banking entities from engaging in proprietary trading of certain instruments and limit such entities’ investments in, and relationships with, “covered funds.” These rules may preclude banking entities from sponsoring and/or providing services for existing TOB trust programs. There can be no assurances that TOB trusts can be restructured substantially similar to their present form, that new sponsors of TOB trusts would begin providing these services, or that alternative forms of leverage will be available to the Fund in order to maintain current levels of leverage. Any alternative forms of leverage may be less advantageous to the Fund, and may adversely affect the Fund’s net asset value, distribution rate and ability to achieve its investment objective. The ultimate impact of these rules on the TOBs market and the municipal market generally is not yet certain.
TOBs are presently classified as private placement securities. Private placement securities are subject to restrictions on resale because they have not been registered under the Securities Act of 1933, as amended (the “1933 Act”), or are otherwise not readily marketable. As a result of the absence of a public trading market for these securities, they may be less liquid than publicly traded securities. Although these securities may be resold in privately negotiated transactions, the prices realized from these sales could be less than those originally paid by the Fund or less than what may be considered the fair value of such securities.
The Fund accounts for the transfer of bonds to the Dealer Trusts as secured borrowings, with the securities transferred remaining in the Fund’s investment assets, and the related floating rate notes reflected as Fund liabilities under the caption Floating rate note obligations on the Statement of Assets and Liabilities. The Fund records the interest income from the fixed rate bonds under the caption Interest and records the expenses related to floating rate obligations and any administrative expenses of the Dealer Trusts as a component of Interest, facilities and maintenance fees on the Statement of Operations.
The Fund generally invests in inverse floating rate securities that include embedded leverage, thus exposing the Fund to greater risks and increased costs. The primary risks associated with inverse floating rate securities are varying degrees of liquidity and the changes in the value of such securities in response to changes in market rates of interest to a greater extent than the value of an equal principal amount of a fixed rate security having similar credit quality, redemption provisions and maturity which may cause the Fund’s net asset value to be more volatile than if it had not invested in inverse floating rate securities. In certain instances, the short-term floating rate interests created by the special purpose trust may not be able to be sold to third parties or, in the case of holders tendering (or putting) such interests for repayment of principal, may not be able to be remarketed to third parties. In such cases, the special purpose trust holding the long-term fixed rate bonds may be collapsed. In the case of RIBs or TOBs created by the contribution of long-term fixed income bonds by the Fund, the Fund will then be required to repay the principal amount of the tendered securities. During times of market volatility, illiquidity or uncertainty, the Fund could be required to sell other portfolio holdings at a disadvantageous time to raise cash to meet that obligation.
| K. | Other Risks — The value of, payment of interest on, repayment of principal for and the ability to sell a municipal security may be affected by constitutional amendments, legislative enactments, executive orders, administrative regulations, voter initiatives and the economics of the regions in which the issuers are located. |
Since many municipal securities are issued to finance similar projects, especially those relating to education, health care, transportation and utilities, conditions in those sectors can affect the overall municipal securities market and a Fund’s investments in municipal securities.
There is some risk that a portion or all of the interest received from certain tax-free municipal securities could become taxable as a result of determinations by the Internal Revenue Service.
NOTE 2—Advisory Fees and Other Fees Paid to Affiliates
The Trust has entered into a master investment advisory agreement with Invesco Advisers, Inc. (the “Adviser” or “Invesco”). Under the terms of the investment advisory agreement, the Fund pays an advisory fee to the Adviser based on the annual rate of the Fund’s average daily net assets as follows:
| Average Daily Net Assets | Rate | |||
First $500 million | 0.60% | |||
Over $500 million | 0.50% | |||
Under the terms of a master sub-advisory agreement between the Adviser and each of Invesco Asset Management Deutschland GmbH, Invesco Asset Management Limited, Invesco Asset Management (Japan) Limited, Invesco Australia Limited, Invesco Hong Kong Limited, Invesco Senior Secured Management, Inc. and Invesco Canada Ltd. (collectively, the “Affiliated Sub-Advisers”) the Adviser, not the Fund, may pay 40% of the fees paid to the Adviser to any such Affiliated Sub-Adviser(s) that provide(s) discretionary investment management services to the Fund based on the percentage of assets allocated to such Sub-Adviser(s).
The Adviser has contractually agreed, through at least June 30, 2015, to waive advisory fees and/or reimburse expenses to the extent necessary to limit total annual fund operating expenses after fee waiver and/or expense reimbursement (excluding certain items discussed below) of Class A,
19 Invesco Pennsylvania Tax Free Income Fund
Class B, Class C and Class Y shares to 1.50%, 2.25%, 2.25% and 1.25% of average daily net assets, respectively. In determining the Adviser’s obligation to waive advisory fees and/or reimburse expenses, the following expenses are not taken into account, and could cause total annual fund operating expenses after fee waiver and/or reimbursement to exceed the numbers reflected above: (1) interest, facilities and maintenance fees; (2) taxes; (3) dividend expense on short sales; (4) extraordinary or non-routine items, including litigation expenses; and (5) expenses that the Fund has incurred but did not actually pay because of an expense offset arrangement. Unless Invesco continues the fee waiver agreement, it will terminate on June 30, 2015. The fee waiver agreement cannot be terminated during its term. The Adviser did not waive fees and/or reimburse expenses during the period under this expense limitation.
The Trust has entered into a master administrative services agreement with Invesco pursuant to which the Fund has agreed to pay Invesco for certain administrative costs incurred in providing accounting services to the Fund. For the year ended August 31, 2014, expenses incurred under the agreement are shown in the Statement of Operations as Administrative services fees.
The Trust has entered into a transfer agency and service agreement with Invesco Investment Services, Inc. (“IIS”) pursuant to which the Fund has agreed to pay IIS a fee for providing transfer agency and shareholder services to the Fund and reimburse IIS for certain expenses incurred by IIS in the course of providing such services. IIS may make payments to intermediaries that provide omnibus account services, sub-accounting services and/or networking services. All fees payable by IIS to intermediaries that provide omnibus account services or sub-accounting are charged back to the Fund, subject to certain limitations approved by the Trust’s Board of Trustees. For the year ended August 31, 2014, the expenses incurred under the agreement are shown in the Statement of Operations as Transfer agent fees.
Shares of the Fund are distributed by Invesco Distributors, Inc. (“IDI”). The Fund has adopted a distribution plan pursuant to Rule 12b-1 under the 1940 Act, and a service plan (collectively, the “Plans”) for Class A shares, Class B shares and Class C shares to compensate IDI for the sale, distribution, shareholder servicing and maintenance of shareholder accounts for these shares. Under the Plans, the Fund will incur annual fees of up to 0.25% of Class A average daily net assets and up to 1.00% each of Class B and Class C average daily net assets.
With respect to Class B and Class C shares, the Fund is authorized to reimburse in future years any distribution related expenses that exceed the maximum annual reimbursement rate for such class, so long as such reimbursement does not cause the Fund to exceed the Class B and Class C maximum annual reimbursement rate, respectively. With respect to Class A shares, distribution related expenses that exceed the maximum annual reimbursement rate for such class are not carried forward to future years and the Fund will not reimburse IDI for any such expenses.
For the year ended August 31, 2014, expenses incurred under these agreements are shown in the Statement of Operations as Distribution fees.
Front-end sales commissions and CDSC (collectively, the “sales charges”) are not recorded as expenses of the Fund. Front-end sales commissions are deducted from proceeds from the sales of Fund shares prior to investment in Class A shares of the Fund. CDSC are deducted from redemption proceeds prior to remittance to the shareholder. During the year ended August 31, 2014, IDI advised the Fund that IDI retained $6,387 in front-end sales commissions from the sale of Class A shares and $0, $1,059 and $28 from Class A, Class B and Class C shares, respectively, for CDSC imposed on redemptions by shareholders.
Certain officers and trustees of the Trust are officers and directors of the Adviser, IIS and/or IDI.
NOTE 3—Additional Valuation Information
GAAP defines fair value as the price that would be received to sell an asset or paid to transfer a liability in an orderly transaction between market participants at the measurement date, under current market conditions. GAAP establishes a hierarchy that prioritizes the inputs to valuation methods, giving the highest priority to readily available unadjusted quoted prices in an active market for identical assets (Level 1) and the lowest priority to significant unobservable inputs (Level 3), generally when market prices are not readily available or are unreliable. Based on the valuation inputs, the securities or other investments are tiered into one of three levels. Changes in valuation methods may result in transfers in or out of an investment’s assigned level:
| Level 1 — | Prices are determined using quoted prices in an active market for identical assets. |
| Level 2 — | Prices are determined using other significant observable inputs. Observable inputs are inputs that other market participants may use in pricing a security. These may include quoted prices for similar securities, interest rates, prepayment speeds, credit risk, yield curves, loss severities, default rates, discount rates, volatilities and others. |
| Level 3 — | Prices are determined using significant unobservable inputs. In situations where quoted prices or observable inputs are unavailable (for example, when there is little or no market activity for an investment at the end of the period), unobservable inputs may be used. Unobservable inputs reflect the Fund’s own assumptions about the factors market participants would use in determining fair value of the securities or instruments and would be based on the best available information. |
As of August 31, 2014, all of the securities in this Fund were valued based on Level 2 inputs (see the Schedule of Investments for security categories). The level assigned to the securities valuations may not be an indication of the risk or liquidity associated with investing in those securities. Because of the inherent uncertainties of valuation, the values reflected in the financial statements may materially differ from the value received upon actual sale of those investments.
NOTE 4—Expense Offset Arrangement(s)
The expense offset arrangement is comprised of transfer agency credits which result from balances in demand deposit accounts used by the transfer agent for clearing shareholder transactions. For the year ended August 31, 2014, the Fund received credits from this arrangement, which resulted in the reduction of the Fund’s total expenses of $163.
20 Invesco Pennsylvania Tax Free Income Fund
NOTE 5—Trustees’ and Officers’ Fees and Benefits
Trustees’ and Officers’ Fees and Benefits include amounts accrued by the Fund to pay remuneration to certain Trustees and Officers of the Fund. Trustees have the option to defer compensation payable by the Fund, and Trustees’ and Officers’ Fees and Benefits also include amounts accrued by the Fund to fund such deferred compensation amounts. Those Trustees who defer compensation have the option to select various Invesco Funds in which their deferral accounts shall be deemed to be invested. Finally, certain current Trustees were eligible to participate in a retirement plan that provided for benefits to be paid upon retirement to Trustees over a period of time based on the number of years of service. The Fund may have certain former Trustees who also participate in a retirement plan and receive benefits under such plan. Trustees’ and Officers’ Fees and Benefits include amounts accrued by the Fund to fund such retirement benefits. Obligations under the deferred compensation and retirement plans represent unsecured claims against the general assets of the Fund.
NOTE 6—Cash Balances and Borrowings
The Fund is permitted to temporarily carry a negative or overdrawn balance in its account with State Street Bank and Trust Company (“SSB”), the custodian bank. Such balances, if any at period end, are shown in the Statement of Assets and Liabilities under the payable caption Amount due custodian. To compensate the custodian bank for such overdrafts, the overdrawn Fund may either (1) leave funds as a compensating balance in the account so the custodian bank can be compensated by earning the additional interest; or (2) compensate by paying the custodian bank at a rate agreed upon by the custodian bank and Invesco, not to exceed the contractually agreed upon rate.
Inverse floating rate obligations resulting from the transfer of bonds to Dealer Trusts are accounted for as secured borrowings. The average floating rate notes outstanding and average annual interest and fee rate related to inverse floating rate note obligations during the year ended August 31, 2014 were $3,827,308 and 0.63%, respectively.
NOTE 7—Distributions to Shareholders and Tax Components of Net Assets
Tax Character of Distributions to Shareholders Paid During the Years Ended August 31, 2014 and 2013:
| 2014 | 2013 | |||||||
Ordinary income — tax-exempt | $ | 4,808,055 | $ | 5,605,980 | ||||
Tax Components of Net Assets at Period-End:
| 2014 | ||||
Undistributed ordinary income | $ | 214,927 | ||
Net unrealized appreciation — investments | 7,748,423 | |||
Temporary book/tax differences | (30,498 | ) | ||
Post-October deferrals | (1,920,462 | ) | ||
Capital loss carryforward | (7,611,039 | ) | ||
Shares of beneficial interest | 129,532,510 | |||
Total net assets | $ | 127,933,861 | ||
The difference between book-basis and tax-basis unrealized appreciation (depreciation) is due to differences in the timing of recognition of gains and losses on investments for tax and book purposes. The Fund’s net unrealized appreciation difference is attributable primarily to TOBs and book to tax accretion and amortization differences.
The temporary book/tax differences are a result of timing differences between book and tax recognition of income and/or expenses. The Fund’s temporary book/tax differences are the result of the trustee deferral of compensation and retirement plan benefits.
Capital loss carryforward is calculated and reported as of a specific date. Results of transactions and other activity after that date may affect the amount of capital loss carryforward actually available for the Fund to utilize. Capital losses generated in years beginning after December 22, 2010 can be carried forward for an unlimited period, whereas previous losses expire in 8 tax years. Capital losses with an expiration period may not be used to offset capital gains until all net capital losses without an expiration date have been utilized. Capital loss carryforwards with no expiration date will retain their character as either short-term or long-term capital losses instead of as short-term capital losses as under prior law. The ability to utilize capital loss carryforward in the future may be limited under the Internal Revenue Code and related regulations based on the results of future transactions.
The Fund has a capital loss carryforward as of August 31, 2014, which expires as follows:
| Capital Loss Carryforward* | ||||||||||||
| Expiration | Short-Term | Long-Term | Total | |||||||||
August 31, 2017 | $ | 5,564,499 | $ | — | $ | 5,564,499 | ||||||
August 31, 2018 | 1,085,533 | — | 1,085,533 | |||||||||
Not subject to expiration | 424,414 | 536,593 | 961,007 | |||||||||
| $ | 7,074,446 | $ | 536,593 | $ | 7,611,039 | |||||||
| * | Capital loss carryforward as of the date listed above is reduced for limitations, if any, to the extent required by the Internal Revenue Code and may be further limited depending upon a variety of factors, including the realization of net unrealized gains or losses as of the date of any reorganization. |
21 Invesco Pennsylvania Tax Free Income Fund
NOTE 8—Investment Securities
The aggregate amount of investment securities (other than short-term securities, U.S. Treasury obligations and money market funds, if any) purchased and sold by the Fund during the year ended August 31, 2014 was $12,383,919 and $23,020,111, respectively. Cost of investments on a tax basis includes the adjustments for financial reporting purposes as of the most recently completed federal income tax reporting period-end.
| Unrealized Appreciation (Depreciation) of Investment Securities on a Tax Basis | ||||
Aggregate unrealized appreciation of investment securities | $ | 10,087,809 | ||
Aggregate unrealized (depreciation) of investment securities | (2,339,386 | ) | ||
Net unrealized appreciation of investment securities | $ | 7,748,423 | ||
Cost of investments for tax purposes is $126,241,202.
NOTE 9—Reclassification of Permanent Differences
Primarily as a result of differing book/tax treatment of book to tax accretion and amortization differences and net operating losses, on August 31, 2014, undistributed net investment income was increased by $3,044, undistributed net realized gain (loss) was increased by $29,812 and shares of beneficial interest was decreased by $32,856. This reclassification had no effect on the net assets of the Fund.
NOTE 10—Share Information
| Summary of Share Activity | ||||||||||||||||
| Years ended August 31, | ||||||||||||||||
| 2014(a) | 2013 | |||||||||||||||
| Shares | Amount | Shares | Amount | |||||||||||||
Sold: | ||||||||||||||||
Class A | 269,977 | $ | 4,297,667 | 450,184 | $ | 7,639,044 | ||||||||||
Class B | 715 | 11,620 | 5,503 | 93,969 | ||||||||||||
Class C | 36,704 | 581,058 | 184,917 | 3,140,149 | ||||||||||||
Class Y | 44,355 | 709,714 | 101,607 | 1,723,234 | ||||||||||||
Issued as reinvestment of dividends: | ||||||||||||||||
Class A | 168,578 | 2,690,022 | 180,058 | 3,021,259 | ||||||||||||
Class B | 1,644 | 26,235 | 2,552 | 43,042 | ||||||||||||
Class C | 12,381 | 197,653 | 14,232 | 238,987 | ||||||||||||
Class Y | 3,026 | 48,313 | 2,657 | 44,358 | ||||||||||||
Automatic conversion of Class B shares to Class A shares: | ||||||||||||||||
Class A | 14,675 | 232,134 | 22,964 | 390,112 | ||||||||||||
Class B | (14,640 | ) | (232,134 | ) | (22,918 | ) | (390,112 | ) | ||||||||
Reacquired: | ||||||||||||||||
Class A | (1,280,624 | ) | (20,216,575 | ) | (964,811 | ) | (16,132,933 | ) | ||||||||
Class B | (5,707 | ) | (88,655 | ) | (15,957 | ) | (264,701 | ) | ||||||||
Class C | (159,172 | ) | (2,518,793 | ) | (141,067 | ) | (2,298,315 | ) | ||||||||
Class Y | (49,444 | ) | (772,866 | ) | (13,921 | ) | (231,778 | ) | ||||||||
Net increase (decrease) in share activity | (957,532 | ) | $ | (15,034,607 | ) | (194,000 | ) | $ | (2,983,685 | ) | ||||||
| (a) | There are entities that are record owners of more than 5% of the outstanding shares of the Fund and in the aggregate own 54% of the outstanding shares of the Fund. IDI has an agreement with these entities to sell Fund shares. The Fund, Invesco and/or Invesco affiliates may make payments to these entities, which are considered to be related to the Fund, for providing services to the Fund, Invesco and/or Invesco affiliates including but not limited to services such as securities brokerage, distribution, third party record keeping and account servicing. The Fund has no knowledge as to whether all or any portion of the shares owned of record by these entities are also owned beneficially. |
22 Invesco Pennsylvania Tax Free Income Fund
NOTE 11—Financial Highlights
The following schedule presents financial highlights for a share of the Fund outstanding throughout the periods indicated.
| Net asset value, beginning of period | Net investment income(a) | Net gains (losses) on securities (both realized and unrealized) | Total from investment operations | Dividends from net investment income | Net asset value, end of period | Total return | Net assets, end of period (000’s omitted) | Ratio of expenses to average net assets with fee waivers and/or expenses absorbed | Supplemental Ratio: assets (excluding interest, facilities fees(b) | Ratio of net investment income to average net assets | Portfolio turnover(c) | |||||||||||||||||||||||||||||||||||||
Class A |
| |||||||||||||||||||||||||||||||||||||||||||||||
Year ended 08/31/14 | $ | 15.39 | $ | 0.62 | $ | 1.09 | $ | 1.71 | $ | (0.60 | ) | $ | 16.50 | 11.33 | %(d) | $ | 113,872 | 1.09 | %(e) | 1.07 | %(e) | 3.93 | %(e) | 10 | % | |||||||||||||||||||||||
Year ended 08/31/13 | 17.05 | 0.63 | (1.65 | ) | (1.02 | ) | (0.64 | ) | 15.39 | (6.24 | )(d) | 118,936 | 1.03 | 1.01 | 3.72 | 17 | ||||||||||||||||||||||||||||||||
Year ended 08/31/12 | 15.85 | 0.68 | 1.19 | 1.87 | (0.67 | ) | 17.05 | 12.04 | (d) | 137,146 | 1.03 | 1.01 | 4.13 | 11 | ||||||||||||||||||||||||||||||||||
Year ended 08/31/11 | 16.29 | 0.70 | (0.47 | ) | 0.23 | (0.67 | ) | 15.85 | 1.58 | (d) | 130,344 | 1.02 | 1.00 | 4.47 | 13 | |||||||||||||||||||||||||||||||||
Period ended 08/31/10 | 15.93 | 0.66 | 0.38 | 1.04 | (0.68 | ) | 16.29 | 6.74 | (d) | 141,406 | 1.14 | (f) | 1.10 | (f) | 4.54 | (f) | 15 | |||||||||||||||||||||||||||||||
Year ended 09/30/09 | 14.76 | 0.73 | 1.18 | 1.91 | (0.74 | ) | 15.93 | 13.60 | (g) | 141,191 | 1.21 | 1.13 | 5.05 | 17 | ||||||||||||||||||||||||||||||||||
Class B |
| |||||||||||||||||||||||||||||||||||||||||||||||
Year ended 08/31/14 | 15.42 | 0.63 | 1.08 | 1.71 | (0.60 | ) | 16.53 | 11.32 | (d)(h) | 1,544 | 1.09 | (e)(h) | 1.07 | (e)(h) | 3.93 | (e)(h) | 10 | |||||||||||||||||||||||||||||||
Year ended 08/31/13 | 17.09 | 0.63 | (1.66 | ) | (1.03 | ) | (0.64 | ) | 15.42 | (6.28 | )(d)(h) | 1,717 | 1.03 | (h) | 1.01 | (h) | 3.72 | (h) | 17 | |||||||||||||||||||||||||||||
Year ended 08/31/12 | 15.86 | 0.71 | 1.19 | 1.90 | (0.67 | ) | 17.09 | 12.22 | (d) | 2,430 | 0.86 | 0.84 | 4.30 | 11 | ||||||||||||||||||||||||||||||||||
Year ended 08/31/11 | 16.23 | 0.70 | (0.45 | ) | 0.25 | (0.62 | ) | 15.86 | 1.68 | (d)(h) | 3,062 | 1.02 | (h) | 1.00 | (h) | 4.47 | (h) | 13 | ||||||||||||||||||||||||||||||
Period ended 08/31/10 | 15.89 | 0.59 | 0.38 | 0.97 | (0.63 | ) | 16.23 | 6.27 | (d)(h) | 4,682 | 1.64 | (f)(h) | 1.60 | (f)(h) | 4.05 | (f)(h) | 15 | |||||||||||||||||||||||||||||||
Year ended 09/30/09 | 14.72 | 0.68 | 1.18 | 1.86 | (0.69 | ) | 15.89 | 13.21 | (i)(j) | 5,364 | 1.57 | (j) | 1.49 | (j) | 4.70 | (j) | 17 | |||||||||||||||||||||||||||||||
Class C |
| |||||||||||||||||||||||||||||||||||||||||||||||
Year ended 08/31/14 | 15.41 | 0.51 | 1.09 | 1.60 | (0.48 | ) | 16.53 | 10.56 | (d)(k) | 9,804 | 1.81 | (e)(k) | 1.79 | (e)(k) | 3.21 | (e)(k) | 10 | |||||||||||||||||||||||||||||||
Year ended 08/31/13 | 17.08 | 0.50 | (1.66 | ) | (1.16 | ) | (0.51 | ) | 15.41 | (7.00 | )(d) | 10,838 | 1.78 | 1.76 | 2.97 | 17 | ||||||||||||||||||||||||||||||||
Year ended 08/31/12 | 15.88 | 0.56 | 1.19 | 1.75 | (0.55 | ) | 17.08 | 11.19 | (d) | 11,020 | 1.78 | 1.76 | 3.38 | 11 | ||||||||||||||||||||||||||||||||||
Year ended 08/31/11 | 16.31 | 0.58 | (0.45 | ) | 0.13 | (0.56 | ) | 15.88 | 0.89 | (d) | 9,670 | 1.77 | 1.75 | 3.72 | 13 | |||||||||||||||||||||||||||||||||
Period ended 08/31/10 | 15.95 | 0.55 | 0.38 | 0.93 | (0.57 | ) | 16.31 | 6.01 | (d) | 11,083 | 1.89 | (f) | 1.85 | (f) | 3.79 | (f) | 15 | |||||||||||||||||||||||||||||||
Year ended 09/30/09 | 14.78 | 0.62 | 1.18 | 1.80 | (0.63 | ) | 15.95 | 12.74 | (l) | 6,776 | 1.96 | 1.89 | 4.28 | 17 | ||||||||||||||||||||||||||||||||||
Class Y |
| |||||||||||||||||||||||||||||||||||||||||||||||
Year ended 08/31/14 | 15.40 | 0.66 | 1.09 | 1.75 | (0.64 | ) | 16.51 | 11.60 | (d) | 2,713 | 0.84 | (e) | 0.82 | (e) | 4.18 | (e) | 10 | |||||||||||||||||||||||||||||||
Year ended 08/31/13 | 17.06 | 0.67 | (1.65 | ) | (0.98 | ) | (0.68 | ) | 15.40 | (6.00 | )(d) | 2,562 | 0.78 | 0.76 | 3.97 | 17 | ||||||||||||||||||||||||||||||||
Year ended 08/31/12 | 15.86 | 0.73 | 1.18 | 1.91 | (0.71 | ) | 17.06 | 12.31 | (d) | 1,298 | 0.78 | 0.76 | 4.38 | 11 | ||||||||||||||||||||||||||||||||||
Year ended 08/31/11 | 16.30 | 0.74 | (0.47 | ) | 0.27 | (0.71 | ) | 15.86 | 1.84 | (d) | 179 | 0.77 | 0.75 | 4.72 | 13 | |||||||||||||||||||||||||||||||||
Period ended 08/31/10(m) | 15.94 | 0.19 | 0.36 | 0.55 | (0.19 | ) | 16.30 | 3.49 | (d) | 167 | 0.85 | (f) | 0.81 | (f) | 4.75 | (f) | 15 | |||||||||||||||||||||||||||||||
| (a) | Calculated using average shares outstanding. |
| (b) | For the year ended September 30, 2009, ratio does not exclude facilities and maintenance fees. |
| (c) | Portfolio turnover is calculated at the fund level and is not annualized for periods less than one year, if applicable. |
| (d) | Includes adjustments in accordance with accounting principles generally accepted in the United States of America and as such, the net asset value for financial reporting purposes and the returns based upon those net asset values may differ from the net asset value and returns for shareholder transactions. Does not include sales charges and is not annualized for periods less than one year, if applicable. |
| (e) | Ratios are based on average daily net assets (000’s omitted) of $114,409, $1,581, $10,196 and $2,459 for Class A, Class B, Class C and Class Y shares, respectively. |
| (f) | Annualized. |
| (g) | Assumes reinvestment of all distributions for the period and does not include payment of the maximum sales charge of 4.75% or contingent deferred sales charge (CDSC). On purchases of $1 million or more, a CDSC of 1% may be imposed on certain redemptions made within eighteen months of purchase. If the sales charges were included, total returns would be lower. These returns include combined Rule 12b-1 fees and service fees of up to 0.25% and do not reflect the deduction of taxes that a shareholder would pay on Fund distributions or the redemption of Fund shares. |
| (h) | The total return, ratio of expenses to average net assets and ratio of net investment income to average net assets reflect actual 12b-1 fees of 0.25%, 0.25%, 0.25% and 0.74% for the years ended August 31, 2014, August 31, 2013 and August 31, 2011 and the period ended August 31, 2010, respectively. |
| (i) | Assumes reinvestment of all distributions for the period and does not include payment of the maximum CDSC of 5%, charged on certain redemptions made within one year of purchase and declining to 0% after the fifth year. If the sales charge was included, total returns would be lower. These returns include combined Rule 12b-1 fees and service fees of up to 1% and do not reflect the deduction of taxes that a shareholder would pay on Fund distributions or the redemption of Fund shares. |
| (j) | The total return, ratio of expenses to average net assets and ratio of net investment income (loss) to average net assets reflect actual 12b-1 fees of less than 1%. |
| (k) | The total return, ratio of expenses to average net assets and ratio of net investment income to average net assets reflect actual 12b-1 fees of 0.97% for the year ended August 31, 2014. |
| (l) | Assumes reinvestment of all distributions for the period and does not include payment of the maximum CDSC of 1%, charged on certain redemptions made within one year of purchase. If the sales charge was included, total returns would be lower. These returns include combined Rule 12b-1 fees and service fees of up to 1% and do not reflect the deduction of taxes that a shareholder would pay on Fund distributions or the redemption of Fund shares. |
| (m) | Commencement date of June 1, 2010. |
23 Invesco Pennsylvania Tax Free Income Fund
Report of Independent Registered Public Accounting Firm
To the Board of Trustees of AIM Counselor Series Trust (Invesco Counselor Series Trust)
and Shareholders of Invesco Pennsylvania Tax Free Income Fund:
In our opinion, the accompanying statement of assets and liabilities, including the schedule of investments, and the related statements of operations and of changes in net assets and the financial highlights present fairly, in all material respects, the financial position of Invesco Pennsylvania Tax Free Income Fund (one of the funds constituting AIM Counselor Series Trust (Invesco Counselor Series Trust, hereafter referred to as the “Fund”) at August 31, 2014, the results of its operations for the year then ended, the changes in its net assets for each of the two years in the period then ended and the financial highlights for each of the four years in the period then ended and the eleven month period ended August 31, 2010, in conformity with accounting principles generally accepted in the United States of America. These financial statements and financial highlights (hereafter referred to as “financial statements”) are the responsibility of the Fund’s management. Our responsibility is to express an opinion on these financial statements based on our audits. We conducted our audits of these financial statements in accordance with the standards of the Public Company Accounting Oversight Board (United States). Those standards require that we plan and perform the audit to obtain reasonable assurance about whether the financial statements are free of material misstatement. An audit includes examining, on a test basis, evidence supporting the amounts and disclosures in the financial statements, assessing the accounting principles used and significant estimates made by management, and evaluating the overall financial statement presentation. We believe that our audits, which included confirmation of securities at August 31, 2014 by correspondence with the custodian and brokers, provide a reasonable basis for our opinion. The financial highlights of the Fund for the year ended September 30, 2009 were audited by another independent registered public accounting firm whose report dated November 20, 2009 expressed an unqualified opinion on such financial statement.
PRICEWATERHOUSECOOPERS LLP
October 27, 2014
Houston, Texas
24 Invesco Pennsylvania Tax Free Income Fund
Calculating your ongoing Fund expenses
Example
As a shareholder of the Fund, you incur two types of costs: (1) transaction costs, which may include sales charges (loads) on purchase payments or contingent deferred sales charges on redemptions, if any; and (2) ongoing costs, including management fees, distribution and/or service (12b-1) fees, and other Fund expenses. This example is intended to help you understand your ongoing costs (in dollars) of investing in the Fund and to compare these costs with ongoing costs of investing in other mutual funds. The example is based on an investment of $1,000 invested at the beginning of the period and held for the entire period March 1, 2014 through August 31, 2014.
Actual expenses
The table below provides information about actual account values and actual expenses. You may use the information in this table, together with the amount you invested, to estimate the expenses that you paid over the period. Simply divide your account value by $1,000 (for example, an $8,600 account value divided by $1,000 = 8.6), then multiply the result by the number in the table under the heading entitled “Actual Expenses Paid During Period” to estimate the expenses you paid on your account during this period.
Hypothetical example for comparison purposes
The table below also provides information about hypothetical account values and hypothetical expenses based on the Fund’s actual expense ratio and an assumed rate of return of 5% per year before expenses, which is not the Fund’s actual return.
The hypothetical account values and expenses may not be used to estimate the actual ending account balance or expenses you paid for the period. You may use this information to compare the ongoing costs of investing in the Fund and other funds. To do so, compare this 5% hypothetical example with the 5% hypothetical examples that appear in the shareholder reports of the other funds.
Please note that the expenses shown in the table are meant to highlight your ongoing costs only and do not reflect any transaction costs, such as sales charges (loads) on purchase payments or contingent deferred sales charges on redemptions, if any. Therefore, the hypothetical information is useful in comparing ongoing costs only, and will not help you determine the relative total costs of owning different funds. In addition, if these transaction costs were included, your costs would have been higher.
| Class | Beginning Account Value (03/01/14) | ACTUAL | HYPOTHETICAL (5% annual return before | Annualized Expense Ratio | ||||||||||||||||||||
| Ending Account Value (08/31/14)1 | Expenses Paid During Period2 | Ending Account Value (08/31/14) | Expenses Paid During Period2 | |||||||||||||||||||||
| A | $ | 1,000.00 | $ | 1,055.80 | $ | 5.75 | $ | 1,019.61 | $ | 5.65 | 1.11 | % | ||||||||||||
| B | 1,000.00 | 1,055.00 | 5.75 | 1,019.61 | 5.65 | 1.11 | ||||||||||||||||||
| C | 1,000.00 | 1,051.80 | 9.26 | 1,016.18 | 9.10 | 1.79 | ||||||||||||||||||
| Y | 1,000.00 | 1,056.40 | 4.46 | 1,020.87 | 4.38 | 0.86 | ||||||||||||||||||
| 1 | The actual ending account value is based on the actual total return of the Fund for the period March 1, 2014 through August 31, 2014, after actual expenses and will differ from the hypothetical ending account value which is based on the Fund’s expense ratio and a hypothetical annual return of 5% before expenses. |
| 2 | Expenses are equal to the Fund’s annualized expense ratio as indicated above multiplied by the average account value over the period, multiplied by 184/365 to reflect the most recent fiscal half year. |
25 Invesco Pennsylvania Tax Free Income Fund
Approval of Investment Advisory and Sub-Advisory Contracts
The Board of Trustees (the Board) of AIM Counselor Series Trust (Invesco Counselor Series Trust) is required under the Investment Company Act of 1940, as amended, to approve annually the renewal of Invesco Pennsylvania Tax Free Income Fund’s (the Fund) investment advisory agreements. During contract renewal meetings held on June 16-17, 2014, the Board as a whole, and the disinterested or “independent” Trustees, who comprise over 75% of the Board, voting separately, approved the continuance for the Fund of the Master Investment Advisory Agreement with Invesco Advisers, Inc. (Invesco Advisers) and the Master Intergroup Sub-Advisory Contract for Mutual Funds with Invesco Asset Management Deutschland GmbH, Invesco Asset Management Limited, Invesco Asset Management (Japan) Limited, Invesco Australia Limited, Invesco Hong Kong Limited, Invesco Senior Secured Management, Inc. and Invesco Canada Ltd. (collectively, the Affiliated Sub-Advisers and the sub-advisory contracts) for another year, effective July 1, 2014.
In evaluating the fairness and reasonableness of compensation under the Fund’s investment advisory agreement and sub-advisory contracts, the Board considered, among other things, the factors discussed below. The Board determined that continuation of the Fund’s investment advisory agreement and the sub-advisory contracts are in the best interest of the Fund and its shareholders and that the compensation payable to Invesco Advisers and the Affiliated Sub-Advisers under the agreements is fair and reasonable.
The Board’s Fund Evaluation Process
The Board’s Investments Committee has established three Sub-Committees, each of which is primarily responsible for overseeing the management of a number of the funds advised by Invesco Advisers (the Invesco Funds). The Sub-Committees meet throughout the year to review the performance of their assigned Invesco Funds, including reviewing materials prepared under the direction of the independent Senior Officer, an officer of the Invesco Funds who reports directly to the independent Trustees. Over the course of each year, the Sub-Committees meet with portfolio managers for their assigned Invesco Funds and other members of management to review the performance, investment objective(s), policies, strategies, limitations and investment risks of these funds. The Sub-Committees meet regularly and at designated contract renewal meetings each year to conduct a review of the performance, fees, expenses and other matters related to their assigned Invesco Funds. Each Sub-Committee recommends to the Investments Committee, which in turn recommends to the full Board, whether and on what terms to approve the continuance of each Invesco Fund’s
investment advisory agreement and sub-advisory contracts for another year.
During the contract renewal process, the Trustees receive comparative performance and fee data regarding the Invesco Funds prepared by Invesco Advisers and Lipper Inc. (Lipper), an independent provider of investment company data. The Trustees also receive an independent written evaluation from the Senior Officer. The Senior Officer’s evaluation is prepared as part of his responsibility to manage the process by which the Invesco Funds’ proposed management fees are negotiated during the annual contract renewal process to ensure they are negotiated in a manner that is at arms’ length and reasonable. In addition to meetings with Invesco Advisers and fund counsel, the independent Trustees also discuss the continuance of the investment advisory agreement and sub-advisory contracts in separate sessions with the Senior Officer and with independent legal counsel.
The Trustees recognized that the advisory fee rates for the Invesco Funds are, in many cases, the result of years of review and negotiation. The Trustees’ deliberations and conclusions in a particular year may be based in part on their deliberations and conclusions regarding these arrangements throughout the year and in prior years. The Trustees’ review and conclusions are based on the comprehensive consideration of all information presented to them and are not the result of any single determinative factor. Moreover, one Trustee may have weighed a particular piece of information or factor differently than another Trustee.
The discussion below serves as the Senior Officer’s independent written evaluation with respect to the Fund’s investment advisory agreement as well as a discussion of the material factors and related conclusions that formed the basis for the Board’s approval of the Fund’s investment advisory agreement and sub-advisory contracts. Unless otherwise stated, this information is current as of June 17, 2014, and may not reflect consideration of factors that became known to the Board after that date.
Factors and Conclusions and Summary of Independent Written Fee Evaluation
| A. | Nature, Extent and Quality of Services Provided by Invesco Advisers and the Affiliated Sub-Advisers |
The Board reviewed the advisory services provided to the Fund by Invesco Advisers under the Fund’s investment advisory agreement, the performance of Invesco Advisers in providing these services, and the credentials and experience of the officers and employees of Invesco Advisers who provide these services, including the Fund’s portfolio manager or managers, with whom the Sub-Committees met during the year. The Board’s review of the
qualifications of Invesco Advisers to provide advisory services included the Board’s consideration of Invesco Advisers’ investment process oversight, independent credit analysis and investment risk management. The Board also considered non-advisory services that Invesco Advisers and its affiliates provide to the Invesco Funds such as various back office support functions, equity and fixed income trading operations, internal audit, distribution and legal and compliance.
In determining whether to continue the Fund’s investment advisory agreement, the Board considered the benefits of reapproving an existing relationship and the greater uncertainty that may be associated with entering into a new relationship. The Board concluded that the nature, extent and quality of the services provided to the Fund by Invesco Advisers are appropriate and satisfactory and consistent with the terms of the Fund’s investment advisory agreement.
The Board reviewed the services that may be provided by the Affiliated Sub-Advisers under the sub-advisory contracts and the credentials and experience of the officers and employees of the Affiliated Sub-Advisers who provide these services. The Board concluded that the sub-advisory contracts benefit the Fund and its shareholders by permitting Invesco Advisers to use the resources and talents of the Affiliated Sub-Advisers in managing the Fund. The Board concluded that the nature, extent and quality of the services that may be provided by the Affiliated Sub-Advisers are appropriate and satisfactory and consistent with the terms of the Fund’s sub-advisory contracts.
| B. | Fund Performance |
The Board considered Fund performance as a relevant factor in considering whether to approve the investment advisory agreement. The Board did not view Fund performance as a relevant factor in considering whether to approve the sub-advisory contracts for the Fund, as no Affiliated Sub-Adviser currently manages assets of the Fund.
The Board compared the Fund’s performance during the past one, three and five calendar years to the performance of funds in the Lipper performance universe and against the Lipper Pennsylvania Municipal Debt Funds Index. The Board noted that performance of Class A shares of the Fund was in the fifth quintile of its performance universe for the one year period, the third quintile for the three year period, and the first quintile for the five year period (the first quintile being the best performing funds and the fifth quintile being the worst performing funds). The Board noted that performance of Class A shares of the Fund was below the performance of the Index for the one and three year periods and above the Index for the five year period. The Trustees also reviewed
26 Invesco Pennsylvania Tax Free Income Fund
more recent Fund performance and this review did not change their conclusions.
| C. | Advisory and Sub-Advisory Fees |
The Board compared the Fund’s contractual management fee rate to the contractual management fee rates of funds in the Fund’s Lipper expense group at a common asset level. The Board noted that the contractual management fee rate for Class A shares of the Fund was above the median contractual management fee rate of funds in its expense group. The Board noted that the term “contractual management fee” may include both advisory and certain administrative services fees, but that Lipper does not provide information on a fund by fund basis as to what is included. The Board noted that Invesco Advisers does not charge the Invesco Funds for the administrative services included in the term as defined by Lipper. The Board also reviewed the methodology used by Lipper in providing expense group information, which includes using each fund’s contractual management fee schedule (including any applicable breakpoints) as reported in the most recent prospectus or statement of additional information for each fund in the expense group.
The Board noted that Invesco Advisers has contractually agreed to waive fees and/or limit expenses of the Fund through at least June 30, 2015 in an amount necessary to limit total annual operating expenses to a specified percentage of average daily net assets for each class of the Fund.
The Board noted that Invesco Advisers and the Affiliated Sub-Advisers do not manage other mutual funds or client accounts using an investment process substantially similar to the investment process used for the Fund.
The Board also considered the services that may be provided by the Affiliated Sub-Advisers pursuant to the sub-advisory contracts, as well as the fees payable by Invesco Advisers to the Affiliated Sub-Advisers pursuant to the sub-advisory contracts. The Board also noted that the sub-advisory fees are not paid directly by the Fund, but rather, are payable by Invesco Advisers to the Affiliated Sub-Advisers.
| D. | Economies of Scale and Breakpoints |
The Board considered the extent to which there are economies of scale in the provision of advisory services to the Fund. he Board also considered whether the Fund benefits from economies of scale through contractual breakpoints in the Fund’s advisory fee schedule and was assisted in this review by a report from the Senior Officer. The Board also noted that the Fund shares directly in economies of scale through lower fees charged by third party service providers based on the combined size of the Invesco Funds and other clients advised by Invesco Advisers.
| E. | Profitability and Financial Resources |
The Board reviewed information from Invesco Advisers concerning the costs of the advisory and other services that Invesco Advisers and its affiliates provide to the Fund and the profitability of Invesco Advisers and its affiliates
in providing these services for the year ended December 31, 2013. The Board received information from Invesco Advisers about the methodology used to prepare the profitability information. The Board considered the profitability of Invesco Advisers in managing the Fund and the Invesco Funds. The Board noted that Invesco Advisers continues to operate at a net profit from services Invesco Advisers and its subsidiaries provide to the Invesco Funds and the Fund. The Board did not deem the level of profits realized by Invesco Advisers and its affiliates from providing services to the Fund to be excessive given the nature, quality and extent of the services provided to the Invesco Funds. The Board received and accepted information from Invesco Advisers demonstrating that Invesco Advisers and each Affiliated Sub-Adviser are financially sound and have the resources necessary to perform their obligations under the investment advisory agreement and sub-advisory contracts.
| F. | Collateral Benefits to Invesco Advisers and its Affiliates |
The Board considered various other benefits received by Invesco Advisers and its affiliates from the relationship with the Fund, including the fees received for their provision of, transfer agency and distribution services to the Fund. The Board considered comparative information regarding fees charged for these services, including information provided by Lipper and other independent sources. The Board considered the performance of Invesco Advisers and its affiliates in providing these services and the organizational structure employed to provide these services. The Board also considered that these services are provided to the Fund pursuant to written contracts that are reviewed and approved on an annual basis by the Board; that the services are required for the operation of the Fund; that Invesco Advisers and its affiliates can provide services, the nature and quality of which are at least equal to those provided by others offering the same or similar services; and that the fees for such services are fair and reasonable in light of the usual and customary charges by others for services of the same nature and quality.
The Board considered the benefits realized by Invesco Advisers and the Affiliated Sub-Advisers as a result of portfolio brokerage transactions executed through “soft dollar” arrangements. Invesco Advisers noted that the Fund does not execute brokerage transactions through “soft dollar” arrangements to any significant degree.
The Board considered that the Fund’s uninvested cash and cash collateral from any securities lending arrangements may be invested in money market funds advised by Invesco Advisers pursuant to procedures approved by the Board. The Board noted that Invesco Advisers receives advisory fees from these affiliated money market funds attributable to such investments, although Invesco Advisers has contractually agreed to waive through varying periods the advisory fees payable by the Invesco Funds with respect to
investments in the affiliated money market funds. The waiver is in an amount equal to 100% of the net advisory fee Invesco Advisers receives from the affiliated money market funds with respect to the Fund’s investment in the affiliated money market funds of uninvested cash, but not cash collateral. The Board concluded that the amount of advisory fees received by Invesco Advisors from the Fund’s investment of uninvested cash and cash collateral from any securities lending arrangements in the affiliated money market funds are fair and reasonable.
27 Invesco Pennsylvania Tax Free Income Fund
Tax Information
Form 1099-DIV, Form 1042-S and other year–end tax information provide shareholders with actual calendar year amounts that should be included in their tax returns. Shareholders should consult their tax advisors.
The following distribution information is being provided as required by the Internal Revenue Code or to meet a specific state’s requirement.
The Fund designates the following amounts or, if subsequently determined to be different, the maximum amount allowable for its fiscal year ended August 31, 2014:
Federal and State Income Tax | ||||
Qualified Dividend Income* | 0 | % | ||
Corporate Dividends Received Deduction* | 0 | % | ||
U.S. Treasury Obligations* | 0 | % | ||
Tax-Exempt Interest Dividends* | 100 | % | ||
| * | The above percentages are based on ordinary income dividends paid to shareholders during the Fund’s fiscal year. |
28 Invesco Pennsylvania Tax Free Income Fund
Trustees and Officers
The address of each trustee and officer is AIM Counselor Series Trust (Invesco Counselor Series Trust) (the “Trust”), 11 Greenway Plaza, Suite 1000, Houston, Texas 77046-1173. The trustees serve for the life of the Trust, subject to their earlier death, incapacitation, resignation, retirement or removal as more specifically provided in the Trust’s organizational documents. Each officer serves for a one year term or until their successors are elected and qualified. Column two below includes length of time served with predecessor entities, if any.
Name, Year of Birth and Position(s) Held with the Trust | Trustee and/ or Officer Since | Principal Occupation(s) During Past 5 Years | Number of Funds in Fund Complex Overseen by Trustee | Other Directorship(s) Held by Trustee During Past 5 Years | ||||
| Interested Persons | ||||||||
Martin L. Flanagan1 — 1960 Trustee | 2007 | Executive Director, Chief Executive Officer and President, Invesco Ltd. (ultimate parent of Invesco and a global investment management firm); Advisor to the Board, Invesco Advisers, Inc. (formerly known as Invesco Institutional (N.A.), Inc.); Trustee, The Invesco Funds; Vice Chair, Investment Company Institute; and Member of Executive Board, SMU Cox School of Business.
Formerly: Chairman and Chief Executive Officer, Invesco Advisers, Inc. (registered investment adviser); Director, Chairman, Chief Executive Officer and President, IVZ Inc. (holding company), INVESCO Group Services, Inc. (service provider) and Invesco North American Holdings, Inc. (holding company); Director, Chief Executive Officer and President, Invesco Holding Company Limited (parent of Invesco and a global investment management firm); Director, Invesco Ltd.; Chairman, Investment Company Institute and President, Co-Chief Executive Officer, Co-President, Chief Operating Officer and Chief Financial Officer, Franklin Resources, Inc. (global investment management organization). | 141 | None | ||||
Philip A. Taylor2 — 1954 Trustee, President and Principal Executive Officer | 2006 | Head of North American Retail and Senior Managing Director, Invesco Ltd.; Director, Co-Chairman, Co-President and Co-Chief Executive Officer, Invesco Advisers, Inc. (formerly known as Invesco Institutional (N.A.), Inc.) (registered investment adviser); Director, Chairman, Chief Executive Officer and President, Invesco Management Group, Inc. (formerly known as Invesco Aim Management Group, Inc.) (financial services holding company); Director and President, INVESCO Funds Group, Inc. (registered investment adviser and registered transfer agent); Director and Chairman, Invesco Investment Services, Inc. (formerly known as Invesco Aim Investment Services, Inc.) (registered transfer agent) and IVZ Distributors, Inc. (formerly known as INVESCO Distributors, Inc.) (registered broker dealer); Director, President and Chairman, Invesco Inc. (holding company) and Invesco Canada Holdings Inc. (holding company); Chief Executive Officer, Invesco Corporate Class Inc. (corporate mutual fund company) and Invesco Canada Fund Inc. (corporate mutual fund company); Director, Chairman and Chief Executive Officer, Invesco Canada Ltd. (formerly known as Invesco Trimark Ltd./Invesco Trimark Ltèe) (registered investment adviser and registered transfer agent); Trustee, President and Principal Executive Officer, The Invesco Funds (other than AIM Treasurer’s Series Trust (Invesco Treasurer’s Series Trust) and Short-Term Investments Trust); Trustee and Executive Vice President, The Invesco Funds (AIM Treasurer’s Series Trust (Invesco Treasurer’s Series Trust) and Short-Term Investments Trust only); Director, Invesco Investment Advisers LLC (formerly known as Van Kampen Asset Management); Director, Chief Executive Officer and President, Van Kampen Exchange Corp.
Formerly: Director and Chairman, Van Kampen Investor Services Inc.; Director, Chief Executive Officer and President, 1371 Preferred Inc. (holding company) and Van Kampen Investments Inc.; Director and President, AIM GP Canada Inc. (general partner for limited partnerships) and Van Kampen Advisors, Inc.; Director and Chief Executive Officer, Invesco Trimark Dealer Inc. (registered broker dealer); Director, Invesco Distributors, Inc. (formerly known as Invesco Aim Distributors, Inc.) (registered broker dealer); Manager, Invesco PowerShares Capital Management LLC; Director, Chief Executive Officer and President, Invesco Advisers, Inc.; Director, Chairman, Chief Executive Officer and President, Invesco Aim Capital Management, Inc.; President, Invesco Trimark Dealer Inc. and Invesco Trimark Ltd./Invesco Trimark Ltèe; Director and President, AIM Trimark Corporate Class Inc. and AIM Trimark Canada Fund Inc.; Senior Managing Director, Invesco Holding Company Limited; Director and Chairman, Fund Management Company (former registered broker dealer); President and Principal Executive Officer, The Invesco Funds (AIM Treasurer’s Series Trust (Invesco Treasurer’s Series Trust), and Short-Term Investments Trust only); President, AIM Trimark Global Fund Inc. and AIM Trimark Canada Fund Inc. | 141 | None | ||||
Wayne W. Whalen3 — 1939 Trustee | 2010 | Of Counsel, and prior to 2010, partner in the law firm of Skadden, Arps, Slate, Meagher & Flom LLP, legal counsel to certain funds in the Fund Complex
| 141 | Director of the Mutual fund Directors Forum, a nonprofit membership organization for investment directors; Chairman and Director of the Abraham Lincoln Presidential Library Foundation; and Director of the Stevenson Center for Democracy |
| 1 | Mr. Flanagan is considered an interested person (within the meaning of Section 2(a)(19) of the 1940 Act) of the Trust because he is an officer of the Adviser to the Trust, and an officer and a director of Invesco Ltd., ultimate parent of the Adviser. |
| 2 | Mr. Taylor is considered an interested person (within the meaning of Section 2(a)(19) of the 1940 Act) of the Trust because he is an officer and a director of the Adviser. |
| 3 | Mr. Whalen is retiring effective December 31, 2014. He has been deemed to be an interested person of the Trust because of his prior service as counsel to the predecessor funds of certain Invesco open-end funds and his affiliation with the law firm that served as counsel to such predecessor funds and the Invesco closed-end funds. |
T-1 Invesco Pennsylvania Tax Free Income Fund
Trustees and Officers—(continued)
Name, Year of Birth and Position(s) Held with the Trust | Trustee and/ or Officer Since | Principal Occupation(s) During Past 5 Years | Number of Funds in Fund Complex Overseen by Trustee | Other Directorship(s) Past 5 Years | ||||
| Independent Trustees | ||||||||
Bruce L. Crockett — 1944 Trustee and Chair | 2003 | Chairman, Crockett Technologies Associates (technology consulting company)
Formerly: Director, Captaris (unified messaging provider); Director, President and Chief Executive Officer, COMSAT Corporation; Chairman, Board of Governors of INTELSAT (international communications company); ACE Limited (insurance company); and Investment Company Institute | 141 | ALPS (Attorneys Liability Protection Society) (insurance company) | ||||
David C. Arch — 1945 Trustee | 2010 | Chairman of Blistex Inc., a consumer health care products manufacturer | 141 | Board member of the Illinois Manufacturers’ Association; Member of the Board of Visitors, Institute for the Humanities, University of Michigan; Member of the Audit Committee of the Edward-Elmhurst Hospital | ||||
Frank S. Bayley — 1939 Trustee | 2003 | Retired. Formerly: Director, Badgley Funds Inc. (registered investment company) (2 portfolios) and General Partner and Of Counsel, law firm of Baker & McKenzie, LLP | 141 | Director and Chairman, C.D. Stimson Company (a real estate investment company); Trustee, The Curtis Institute of Music | ||||
James T. Bunch — 1942 Trustee | 2000 | Managing Member, Grumman Hill Group LLC (family office private equity investments)
Formerly: Founder, Green Manning & Bunch Ltd. (investment banking firm) (1988-2010); Executive Committee, United States Golf Association; and Director, Policy Studies, Inc. and Van Gilder Insurance Corporation | 141 | Chairman, Board of Governors, Western Golf Association; Chairman, Evans Scholars Foundation; and Director, Denver Film Society | ||||
Rodney F. Dammeyer — 1940 Trustee | 2010 | Chairman of CAC, LLC, (private company offering capital investment and management advisory services)
Formerly: Prior to 2001, Managing Partner at Equity Group Corporate Investments; Prior to 1995, Chief Executive Officer of Itel Corporation (formerly Anixter International); Prior to 1985, experience includes Senior Vice President and Chief Financial Officer of Household International, Inc., Executive Vice President and Chief Financial Officer of Northwest Industries, Inc. and Partner of Arthur Andersen & Co.; From 1987 to 2010, Director/Trustee of investment companies in the Van Kampen Funds complex | 141 | Director of Quidel Corporation and Stericycle, Inc. | ||||
Albert R. Dowden — 1941 Trustee | 2003 | Director of a number of public and private business corporations, including the Boss Group, Ltd. (private investment and management); Nature’s Sunshine Products, Inc. and Reich & Tang Funds (5 portfolios) (registered investment company)
Formerly: Director, Homeowners of America Holding Corporation/Homeowners of America Insurance Company (property casualty company); Director, Continental Energy Services, LLC (oil and gas pipeline service); Director, CompuDyne Corporation (provider of product and services to the public security market) and Director, Annuity and Life Re (Holdings), Ltd. (reinsurance company); Director, President and Chief Executive Officer, Volvo Group North America, Inc.; Senior Vice President, AB Volvo; Director of various public and private corporations; Chairman, DHJ Media, Inc.; Director, Magellan Insurance Company; and Director, The Hertz Corporation, Genmar Corporation (boat manufacturer), National Media Corporation; Advisory Board of Rotary Power International (designer, manufacturer, and seller of rotary power engines); and Chairman, Cortland Trust, Inc. (registered investment company) | 141 | Director of: Nature’s Sunshine Products, Inc., Reich & Tang Funds, Homeowners of America Holding Corporation/ Homeowners of America Insurance Company, the Boss Group | ||||
Jack M. Fields — 1952 Trustee | 2003 | Chief Executive Officer, Twenty First Century Group, Inc. (government affairs company); Owner and Chief Executive Officer, Dos Angeles Ranch, L.P. (cattle, hunting, corporate entertainment); and Discovery Global Education Fund (non-profit)
Formerly: Chief Executive Officer, Texana Timber LP (sustainable forestry company); Director of Cross Timbers Quail Research Ranch (non-profit); and member of the U.S. House of Representatives | 141 | Insperity, Inc. (formerly known as Administaff) | ||||
Prema Mathai-Davis — 1950 Trustee | 2003 | Retired. Formerly: Chief Executive Officer, YWCA of the U.S.A. | 141 | None | ||||
Larry Soll — 1942 Trustee | 1997 | Retired. Formerly: Chairman, Chief Executive Officer and President, Synergen Corp. (a biotechnology company) | 141 | None | ||||
Hugo F. Sonnenschein — 1940 Trustee | 2010 | President Emeritus and Honorary Trustee of the University of Chicago and the Adam Smith Distinguished Service Professor in the Department of Economics at the University of Chicago. Prior to 2000, President of the University of Chicago | 141 | Trustee of the University of Rochester and a member of its investment committee; Member of the National Academy of Sciences and the American Philosophical Society; Fellow of the American Academy of Arts and Sciences |
T-2 Invesco Pennsylvania Tax Free Income Fund
Trustees and Officers—(continued)
Name, Year of Birth and Position(s) Held with the Trust | Trustee and/ or Officer Since | Principal Occupation(s) During Past 5 Years | Number of Funds in Fund Complex Overseen by Trustee | Other Directorship(s) Past 5 Years | ||||
| Independent Trustees—(continued) | ||||||||
Raymond Stickel, Jr. — 1944 Trustee | 2005 | Retired. Formerly: Director, Mainstay VP Series Funds, Inc. (25 portfolios) and Partner, Deloitte & Touche | 141 | None | ||||
Suzanne H. Woolsey — 1941 Trustee | 2014 | Chief Executive Officer of Woolsey Partners LLC | 141 | Emeritus Chair of the Board of Trustees of the Institute for Defense Analyses; Trustee of Colorado College; Trustee of California Institute of Technology; Prior to 2014, Director of Fluor Corp.; Prior to 2010, Trustee of the German Marshall Fund of the United States; Prior to 2010 Trustee of the Rocky Mountain Institute | ||||
| Other Officers | ||||||||
Russell C. Burk — 1958 Senior Vice President and Senior Officer | 2005 | Senior Vice President and Senior Officer, The Invesco Funds | N/A | N/A | ||||
John M. Zerr — 1962 Senior Vice President, Chief Legal Officer and Secretary | 2006 | Director, Senior Vice President, Secretary and General Counsel, Invesco Management Group, Inc. (formerly known as Invesco Aim Management Group, Inc.) and Van Kampen Exchange Corp.; Senior Vice President, Invesco Advisers, Inc. (formerly known as Invesco Institutional (N.A.), Inc.) (registered investment adviser); Senior Vice President and Secretary, Invesco Distributors, Inc. (formerly known as Invesco Aim Distributors, Inc.); Director, Vice President and Secretary, Invesco Investment Services, Inc. (formerly known as Invesco Aim Investment Services, Inc.) and IVZ Distributors, Inc. (formerly known as INVESCO Distributors, Inc.); Director and Vice President, INVESCO Funds Group, Inc.; Senior Vice President, Chief Legal Officer and Secretary, The Invesco Funds; Manager, Invesco PowerShares Capital Management LLC; Director, Secretary and General Counsel, Invesco Investment Advisers LLC (formerly known as Van Kampen Asset Management); Secretary and General Counsel, Invesco Capital Markets, Inc. (formerly known as Van Kampen Funds Inc.) and Chief Legal Officer, PowerShares Exchange-Traded Fund Trust, PowerShares Exchange-Traded Fund Trust II, PowerShares India Exchange-Traded Fund Trust and PowerShares Actively Managed Exchange-Traded Fund Trust
Formerly: Director and Vice President, Van Kampen Advisors Inc.; Director, Vice President, Secretary and General Counsel, Van Kampen Investor Services Inc.; Director, Invesco Distributors, Inc. (formerly known as Invesco Aim Distributors, Inc.); Director, Senior Vice President, General Counsel and Secretary, Invesco Aim Advisers, Inc. and Van Kampen Investments Inc.; Director, Vice President and Secretary, Fund Management Company; Director, Senior Vice President, Secretary, General Counsel and Vice President, Invesco Aim Capital Management, Inc.; Chief Operating Officer and General Counsel, Liberty Ridge Capital, Inc. (an investment adviser); Vice President and Secretary, PBHG Funds (an investment company) and PBHG Insurance Series Fund (an investment company); Chief Operating Officer, General Counsel and Secretary, Old Mutual Investment Partners (a broker-dealer); General Counsel and Secretary, Old Mutual Fund Services (an administrator) and Old Mutual Shareholder Services (a shareholder servicing center); Executive Vice President, General Counsel and Secretary, Old Mutual Capital, Inc. (an investment adviser); and Vice President and Secretary, Old Mutual Advisors Funds (an investment company) | N/A | N/A | ||||
Sheri Morris — 1964 Vice President, Treasurer and Principal Financial Officer | 2003 | Vice President, Treasurer and Principal Financial Officer, The Invesco Funds; Vice President, Invesco Advisers, Inc. (formerly known as Invesco Institutional (N.A.), Inc.) (registered investment adviser); and Vice President, PowerShares Exchange-Traded Fund Trust, PowerShares Exchange-Traded Fund Trust II, PowerShares India Exchange-Traded Fund Trust and PowerShares Actively Managed Exchange-Traded Fund Trust
Formerly: Vice President, Invesco Aim Advisers, Inc., Invesco Aim Capital Management, Inc. and Invesco Aim Private Asset Management, Inc.; Assistant Vice President and Assistant Treasurer, The Invesco Funds and Assistant Vice President, Invesco Advisers, Inc., Invesco Aim Capital Management, Inc. and Invesco Aim Private Asset Management, Inc.; and Treasurer, PowerShares Exchange-Traded Fund Trust, PowerShares Exchange-Traded Fund Trust II, PowerShares India Exchange-Traded Fund Trust and PowerShares Actively Managed Exchange-Traded Fund Trust | N/A | N/A | ||||
T-3 Invesco Pennsylvania Tax Free Income Fund
Trustees and Officers—(continued)
Name, Year of Birth and Position(s) Held with the Trust | Trustee and/ or Officer Since | Principal Occupation(s) During Past 5 Years | Number of Funds in Fund Complex Overseen by Trustee | Other Directorship(s) Past 5 Years | ||||
| Other Officers—(continued) | ||||||||
Karen Dunn Kelley — 1960 Vice President | 2003 | Senior Managing Director, Investments; Director, Co-President, Co-Chief Executive Officer, and Co-Chairman, Invesco Advisers, Inc. (formerly known as Invesco Institutional (N.A.), Inc.) (registered investment adviser); Chairman, Invesco Senior Secured Management, Inc.; Senior Vice President, Invesco Management Group, Inc. (formerly known as Invesco Aim Management Group, Inc.); Executive Vice President, Invesco Distributors, Inc. (formerly known as Invesco Aim Distributors, Inc.); Director, Invesco Mortgage Capital Inc. and Invesco Management Company Limited; Director and President, INVESCO Asset Management (Bermuda) Ltd., Vice President, The Invesco Funds (other than AIM Treasurer’s Series Trust (Invesco Treasurer’s Series Trust) and Short-Term Investments Trust); and President and Principal Executive Officer, The Invesco Funds (AIM Treasurer’s Series Trust (Invesco Treasurer’s Series Trust) and Short-Term Investments Trust only)
Formerly: Director, INVESCO Global Asset Management Limited and INVESCO Management S.A.; Senior Vice President, Van Kampen Investments Inc. and Invesco Advisers, Inc. (formerly known as Invesco Institutional (N.A.), Inc.) (registered investment adviser); Vice President, Invesco Advisers, Inc. (formerly known as Invesco Institutional (N.A.), Inc.); Director of Cash Management and Senior Vice President, Invesco Advisers, Inc. and Invesco Aim Capital Management, Inc.; Director and President, Fund Management Company; Chief Cash Management Officer, Director of Cash Management, Senior Vice President, and Managing Director, Invesco Aim Capital Management, Inc.; Director of Cash Management, Senior Vice President, and Vice President, Invesco Advisers, Inc. and The Invesco Funds (AIM Treasurer’s Series Trust (Invesco Treasurer’s Series Trust), and Short-Term Investments Trust only) | N/A | N/A | ||||
Crissie M. Wisdom — 1969 Anti-Money Laundering Compliance Officer | 2013 | Anti-Money Laundering Compliance Officer, Invesco Advisers, Inc. (formerly known as Invesco Institutional (N.A.), Inc.) (registered investment adviser), Invesco Capital Markets, Inc. (formerly known as Van Kampen Funds Inc.), Invesco Distributors, Inc., Invesco Investment Services, Inc., Invesco Management Group, Inc., Van Kampen Exchange Corp., The Invesco Funds, and PowerShares Exchange-Traded Fund Trust, PowerShares Exchange-Traded Fund Trust II, PowerShares India Exchange-Traded Fund Trust, and PowerShares Actively Managed Exchange-Traded Fund Trust; and Fraud Prevention Manager and Controls and Risk Analysis Manager for Invesco Investment Services, Inc. | N/A | N/A | ||||
Todd L. Spillane — 1958 Chief Compliance Officer | 2006 | Senior Vice President, Invesco Management Group, Inc. (formerly known as Invesco Aim Management Group, Inc.) and Van Kampen Exchange Corp.; Senior Vice President and Chief Compliance Officer, Invesco Advisers, Inc. (registered investment adviser) (formerly known as Invesco Institutional (N.A.), Inc.); Chief Compliance Officer, The Invesco Funds; Vice President, Invesco Distributors, Inc. (formerly known as Invesco Aim Distributors, Inc.) and Invesco Investment Services, Inc. (formerly known as Invesco Aim Investment Services, Inc.)
Formerly: Chief Compliance Officer, Invesco Funds (Chicago); Senior Vice President, Van Kampen Investments Inc.; Senior Vice President and Chief Compliance Officer, Invesco Aim Advisers, Inc. and Invesco Aim Capital Management, Inc.; Chief Compliance Officer, INVESCO Private Capital Investments, Inc. (holding company), Invesco Private Capital, Inc. (registered investment adviser), Invesco Global Asset Management (N.A.), Inc., Invesco Senior Secured Management, Inc. (registered investment adviser), Van Kampen Investor Services Inc., PowerShares Exchange-Traded Fund Trust, PowerShares Exchange-Traded Fund Trust II, PowerShares India Exchange-Traded Fund Trust and PowerShares Actively Managed Exchange-Traded Fund Trust; and Vice President, Invesco Aim Capital Management, Inc. and Fund Management Company | N/A | N/A |
The Statement of Additional Information of the Trust includes additional information about the Fund’s Trustees and is available upon request, without charge, by calling 1.800.959.4246. Please refer to the Fund’s prospectus for information on the Fund’s sub-advisers.
Office of the Fund 11 Greenway Plaza, Suite 1000 Houston, TX 77046-1173 | Investment Adviser Invesco Advisers, Inc. 1555 Peachtree Street, N.E. Atlanta, GA 30309 | Distributor Invesco Distributors, Inc. 11 Greenway Plaza, Suite 1000 Houston, TX 77046-1173 | Auditors PricewaterhouseCoopers LLP 1201 Louisiana Street, Suite 2900 Houston, TX 77002-5678 | |||
Counsel to the Fund Stradley Ronon Stevens & Young, LLP 2005 Market Street, Suite 2600 Philadelphia, PA 19103-7018 | Counsel to the Independent Trustees Goodwin Procter LLP 901 New York Avenue, N.W. Washington, D.C. 20001 | Transfer Agent Invesco Investment Services, Inc. 11 Greenway Plaza, Suite 1000 Houston, TX 77046-1173 | Custodian State Street Bank and Trust Company 225 Franklin Street Boston, MA 02110-2801 | |||
T-4 Invesco Pennsylvania Tax Free Income Fund

Invesco mailing information
Send general correspondence to Invesco Investment Services, Inc., P.O. Box 219078, Kansas City, MO 64121-9078.
Important notice regarding delivery of security holder documents
To reduce Fund expenses, only one copy of most shareholder documents may be mailed to shareholders with multiple accounts at the same address (Householding). Mailing of your shareholder documents may be householded indefinitely unless you instruct us otherwise. If you do not want the mailing of these documents to be combined with those for other members of your household, please contact Invesco Investment Services, Inc. at 800 959 4246 or contact your financial institution. We will begin sending you individual copies for each account within 30 days after receiving your request.
Fund holdings and proxy voting information
The Fund provides a complete list of its holdings four times in each fiscal year, at the quarter ends. For the second and fourth quarters, the lists appear in the Fund’s semiannual and annual reports to shareholders. For the first and third quarters, the Fund files the lists with the Securities and Exchange Commission (SEC) on Form N-Q. The most recent list of portfolio holdings is available at invesco.com/completeqtrholdings. Shareholders can also look up the Fund’s Forms N-Q on the SEC website at sec.gov. Copies of the Fund’s Forms N-Q may be reviewed and copied at the SEC Public Reference Room in Washington, D.C. You can obtain information on the operation of the Public Reference Room, including information about duplicating fee charges, by calling 202 551 8090 or 800 732 0330, or by electronic request at the following email address: publicinfo@sec.gov. The SEC file numbers for the Fund are shown below.
A description of the policies and procedures that the Fund uses to determine how to vote proxies relating to portfolio securities is available without charge, upon request, from our Client Services department at 800 959 4246 or at invesco.com/proxyguidelines. The information is also available on the SEC website, sec.gov.
Information regarding how the Fund voted proxies related to its portfolio securities during the most recent 12-month period ended June 30 is available at invesco.com/proxysearch. The information is also available on the SEC website, sec.gov. Invesco Advisers, Inc. is an investment adviser; it provides investment advisory services to individual and institutional clients and does not sell securities. Invesco Distributors, Inc. is the US distributor for Invesco Ltd.’s retail mutual funds, exchange-traded funds and institutional money market funds. Both are wholly owned, indirect subsidiaries of Invesco Ltd. |  |
| SEC file numbers: 811-09913 and 333-36074 | VK-PTFI-AR-1 | Invesco Distributors, Inc. |

Letters to Shareholders
Philip Taylor | Dear Shareholders: This annual report includes information about your Fund, including performance data and a complete list of its investments as of the close of the reporting period. Inside, your Fund’s portfolio managers discuss how they managed your Fund and the factors that affected its performance during the reporting period. I hope you find this report of interest. During the reporting period covered by this report, the US economy showed signs of continued improvement. After contracting in the first quarter of 2014, the economy expanded strongly in the second quarter and unemployment trended lower. Much of the credit for this improvement goes to the US Federal Reserve (the Fed), which undertook an extraordinary asset purchase program following the global financial crisis. The Fed’s goal was to jumpstart the economy by encouraging banks to lend more, businesses to hire more and consumers to spend more. Signs of a stronger US economy prompted the Fed to reduce, or “taper,” its |

asset purchase program. Despite this, interest rates remained near historical low levels due largely to heavy investor demand for bonds. While signs of economic improvement were evident in the US, European economies remained relatively stagnant. During the reporting period, high unemployment persisted, worries about potential deflation grew, and uncertainty about Russian-Ukrainian tensions weighed on European markets.
Extended periods of market strength can lull investors into complacency – just as prolonged periods of market weakness or volatility can discourage investors from initiating long-term investment plans. That’s why Invesco has always encouraged investors to work with a professional financial adviser who can stress the importance of starting to save and invest early and the importance of adhering to a disciplined investment plan – when times are good and when they’re uncertain. A financial adviser who knows your unique financial situation, investment goals and risk tolerance can be an invaluable partner as you seek to achieve your financial goals. He or she can offer a long-term perspective when markets are volatile and time-tested advice and guidance when your financial situation or investment goals change.
Timely information when and where you want it
Invesco’s efforts to help investors achieve their financial objectives include providing individual investors and financial professionals with timely information about the markets, the economy and investing – whenever and wherever they want it.
Our website, invesco.com/us, offers a wide range of market insights and investment perspectives. On the website, you’ll find detailed information about our funds, including prices, performance, holdings and portfolio manager commentaries. You can access information about your individual Invesco account whenever it’s convenient for you; just complete a simple, secure online registration. Use the “Login” box on our home page to get started.
Invesco’s mobile app for iPad® (available free from the App StoreSM) allows you to obtain the same detailed information about your Fund and the same investment insights from our investment leaders, market strategists, economists and retirement experts on the go. You also can watch portfolio manager videos and have instant access to Invesco news and updates wherever you may be.
In addition to the resources accessible on our website and through our mobile app, you can obtain timely updates to help you stay informed about the markets, the economy and investing by connecting with Invesco on Twitter, LinkedIn or Facebook. You can access our blog at blog.invesco.us.com or by clicking the “Intentional Investing Forum” link on our home page. Our goal is to provide you the information you want, when and where you want it.
Have questions?
For questions about your account, feel free to contact an Invesco client services representative at 800 959 4246. For Invesco-related questions or comments, please email me directly at phil@invesco.com.
All of us at Invesco look forward to serving your investment management needs for many years to come. Thank you for investing with us.
Sincerely,

Philip Taylor
Senior Managing Director, Invesco Ltd.
iPad is a trademark of Apple Inc., registered in the US and other countries. App Store is a service mark of Apple Inc. Invesco Distributors, Inc. is not affiliated with Apple Inc.
2 Invesco S&P 500 Index Fund
Bruce Crockett | Dear Fellow Shareholders: There are a variety of factors that can impact investment performance, many of which are uncontrollable by us as investors. These factors can include various economic trends and geopolitical developments. While the members of the Invesco Funds Board, which I chair, can’t dictate the performance of the Invesco funds, be assured that your Board works diligently throughout the year to focus on how your investments are managed. Our job is to represent you and your interests on a variety of fund management-related matters. We regularly monitor how the portfolio management teams of the Invesco funds are performing in light of ever-changing and often unpredictable economic and market conditions. We review the investment strategies and investment process employed by each fund’s management team as explained in the fund’s prospectus. |

Perhaps our most significant responsibility is conducting the annual review of the funds’ advisory and sub-advisory contracts with Invesco Advisers and its affiliates. This annual review, which is required by the Investment Company Act of 1940, focuses on the nature and quality of the services Invesco provides as the adviser to the Invesco funds and the reasonableness of the fees that it charges for those services. Each year, we spend months carefully reviewing information from Invesco that allows us to evaluate the quality of its services and the reasonableness of its fees. We also use information from a variety of independent sources, including materials provided by the independent senior officer of the Invesco funds, who reports directly to the independent trustees on the Board. Additionally, we meet with legal counsel and review performance and fee data prepared for us by Lipper Inc., an independent, third-party firm widely recognized as a leader in its field.
After a careful review, the members of the Invesco Funds Board approved the continuation of advisory and sub-advisory contracts with Invesco Advisers and its affiliates. Be assured that your Board will continue working on behalf of fund shareholders, keeping your needs and interests uppermost in our minds.
As always, please contact me at bruce@brucecrockett.com with any questions or concerns you may have. On behalf of the Board, we look forward to continuing to represent your interests and serving your needs.
Sincerely,

Bruce L. Crockett
Independent Chair
Invesco Funds Board of Trustees
3 Invesco S&P 500 Index Fund
Management’s Discussion of Fund Performance
Performance summary
For the fiscal year ended August 31, 2014, Invesco S&P 500 Index Fund sought to provide investment results that, before expenses, corresponded to the total return of the S&P 500 Index. The consumer discretionary, consumer staples, energy, financials, health care, industrials and information technology (IT) sectors contributed the most to the Fund’s overall positive performance for the reporting period.
Your Fund’s long-term performance appears later in this report.
Fund vs. Indexes
Total returns, 8/31/13 to 8/31/14, at net asset value (NAV). Performance shown does not include applicable contingent deferred sales charges (CDSC) or front-end sales charges, which would have reduced performance.
Class A Shares | 24.54 | % | ||
Class B Shares | 23.60 | |||
Class C Shares | 23.59 | |||
Class Y Shares | 24.83 | |||
S&P 500 Indexq (Broad Market/Style-Specific Index) | 25.25 | |||
Lipper S&P 500 Objective Funds Index¢ (Peer Group Index) | 24.89 |
Source(s): qFactSet Research Systems Inc.; nLipper Inc.
How we invest
The Fund normally invests at least 80% of its net assets in common stocks of companies included in the S&P 500 Index. The Fund’s assets are managed by investing in stocks in approximately the same proportion as they are represented in the S&P 500 Index. For example, if the common stock of a specific company represents 5% of the S&P 500 Index, the Fund typically invests 5% of its assets in that stock. The S&P 500 Index is a well-known stock market index that includes common stocks of 500 companies representing a significant portion of the market value of all common stocks publicly traded in the US.
The Fund may invest in foreign companies, including those in emerging market countries, which are included in the S&P 500 Index. Buy and sell decisions for the Fund are a function of changes in the S&P 500 Index rather than independent decisions made by the investment team.
Market conditions and your Fund
US equity market indexes generally rose during the fiscal year ended August 31, 2014. Corporate earnings were resilient in the face of modest economic growth, driven by strong profitability across many sectors, and fundamentals for corporations and consumers remained relatively positive. However, the fiscal year began amid uncertainty created by a two-week federal government shutdown. Despite this and the announcement by the US Federal Reserve (the Fed) in December that it would begin reducing the scope of its asset purchase program in early 2014, US equities rallied through the end of 2013. The market turned volatile in the first months of 2014 as investors began to worry that stocks may have risen too far, too fast. While political upheaval in Ukraine and signs of economic sluggishness in the US and China contributed to investor uncertainty, economic data remained strong enough that
the Fed continued to reduce its asset purchase program on schedule. The continued “good but not great” economic environment and historically low interest rates generally led stocks higher throughout the end of the fiscal year.
The Fund stayed true to its process by maintaining the same exposure to all constituents of the S&P 500 Index as the index itself. On an absolute basis, all sectors in the Fund posted positive returns for the fiscal year. Sectors that contributed the most to overall Fund performance were the consumer discretionary, consumer staples, energy, financials, health care, industrials and information technology (IT) sectors. The telecommunication services, materials and utilities sectors, while generating positive performance overall, contributed the least to Fund performance.
During the reporting period, IT holdings were some of the largest contributors to the Fund’s performance. These holdings included Apple, Microsoft and Google. Apple announced upbeat earnings during the fiscal year and expanded its share repurchase program. The company expects to utilize a total of over $130 billion of cash under the expanded program by the end of the 2015 calendar year. Apple also announced a dividend increase and stock split during the fiscal year, resulting in generally high investor confidence in the company.
Many Fund holdings in the energy sector were also strong performers during the fiscal year. A top contributor in this sector was Exxon Mobil. During the fiscal year, Exxon Mobil and NK Rosneft (not a Fund holding) signed documents establishing a joint venture to implement a pilot project for tight oil reserves development in Western Siberia as part of an agreement on strategic cooperation.
Portfolio Composition
By sector
| Information Technology | 19.1 | % | ||
| Financials | 15.6 | |||
| Health Care | 13.5 | |||
| Consumer Discretionary | 12.0 | |||
| Energy | 10.2 | |||
| Industrials | 10.1 | |||
| Consumer Staples | 9.3 | |||
| Materials | 3.4 | |||
| Utilities | 3.0 | |||
| Telecommunication Services | 2.5 | |||
| Money Market Funds | ||||
| Plus Other Assets Less Liabilities | 1.3 |
Top 10 Equity Holdings
1. | Apple Inc. | 3.4 | % | |||
2. | Exxon Mobil Corp. | 2.4 | ||||
3. | Microsoft Corp. | 1.9 | ||||
4. | Johnson & Johnson | 1.6 | ||||
5. | General Electric Co. | 1.4 | ||||
6. | Berkshire Hathaway Inc.-Class B | 1.4 | ||||
7. | Wells Fargo & Co. | 1.4 | ||||
8. | Chevron Corp. | 1.4 | ||||
9. | JPMorgan Chase & Co. | 1.3 | ||||
10. | Procter & Gamble Co. (The) | 1.3 |
Total Net Assets | $ | 715.2 million | ||
Total Number of Holdings* | 502 | |||
The Fund’s holdings are subject to change, and there is no assurance that the Fund will continue to hold any particular security.
*Excluding money market fund holdings.
4 Invesco S&P 500 Index Fund
The plan is to conduct the pilot work program within the 2014–2015 timeframe.
Several Fund holdings in the consumer staples sector struggled during the reporting period, including Whole Foods Market. The company delivered disappointing earnings during the fiscal year, which caused a drop in its share price. Also lagging in performance was retailer Coach.
During the reporting period, the Fund invested in S&P 500 futures contracts, a derivative instrument, to gain exposure to the equity market. These futures contracts were a slight contributor to the Fund’s performance.
We welcome new investors who joined the Fund during the fiscal year and thank all of our shareholders for your investment in Invesco S&P 500 Index Fund.
The views and opinions expressed in management’s discussion of Fund performance are those of Invesco Advisers, Inc. These views and opinions are subject to change at any time based on factors such as market and economic conditions. These views and opinions may not be relied upon as investment advice or recommendations, or as an offer for a particular security. The information is not a complete analysis of every aspect of any market, country, industry, security or the Fund. Statements of fact are from sources considered reliable, but Invesco Advisers, Inc. makes no representation or warranty as to their completeness or accuracy. Although historical performance is no guarantee of future results, these insights may help you understand our investment management philosophy.
See important Fund and, if applicable, index disclosures later in this report.
 | Anthony Munchak Chartered Financial Analyst, Portfolio Manager, is manager of Invesco S&P 500 Index Fund. He joined |
Invesco in 2000. Mr. Munchak earned a BS and an MS in finance from Boston College and an MBA from Bentley College.
 | Glen Murphy Chartered Financial Analyst, Portfolio Manager, is manager of Invesco S&P 500 Index Fund. He joined |
Invesco in 1995. Mr. Murphy earned a BA in business administration from the University of Massachu-setts Amherst and an MS in finance from Boston College.
 | Francis Orlando Chartered Financial Analyst, Portfolio Manager, is manager of Invesco S&P 500 Index Fund. He joined |
Invesco in 1987. Mr. Orlando earned a BA in business administration from Merrimack College and an MBA from Boston University.
 | Daniel Tsai Chartered Financial Analyst, Portfolio Manager, is manager of Invesco S&P 500 Index Fund. He joined |
Invesco in 2000. Mr. Tsai earned a BS in mechanical engineering from National Taiwan University, an MS in mechanical engineering from the University of Michigan and an MS in computer science from Wayne State University.
 | Anne Unflat Portfolio Manager, is manager of Invesco S&P 500 Index Fund. She joined Invesco in 1988. Ms. Unflat |
earned a BA in economics from Queens College and an MBA in finance from St. John’s University.
5 Invesco S&P 500 Index Fund
Your Fund’s Long-Term Performance
Results of a $10,000 Investment – Oldest Share Class(es)
Fund and index data from 8/31/04
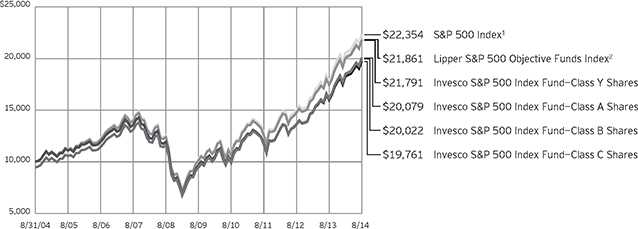
| 1 | Source: FactSet Research Systems Inc. |
| 2 | Source: Lipper Inc. |
Past performance cannot guarantee comparable future results.
The data shown in the chart include reinvested distributions, applicable sales charges and Fund expenses including management fees. Results for Class B shares are calculated as if a hypothetical
shareholder had liquidated his entire investment in the Fund at the close of the reporting period and paid the contingent deferred sales charges, if applicable. Index results include reinvested dividends, but they do not reflect sales charges. Performance of the peer group,
if applicable, reflects fund expenses and management fees; performance of a market index does not. Performance shown in the chart and table(s) does not reflect deduction of taxes a shareholder would pay on Fund distributions or sale of Fund shares.
continued from page 8
About indexes used in this report
| n | The S&P 500® Index is an unmanaged index considered representative of the US stock market. |
| n | The Lipper S&P 500 Objective Funds Index is an unmanaged index considered representative of S&P 500 funds tracked by Lipper. |
| n | A direct investment cannot be made in an index. Unless otherwise indicated, index results include reinvested dividends, and they do not reflect sales charges. |
Performance of the peer group, if applicable, reflects fund expenses; performance of a market index does not. |
Other information
| n | The returns shown in management’s discussion of Fund performance are based on net asset values (NAVs) calculated for shareholder transactions. Generally accepted accounting principles require adjustments to be made to the net assets of the Fund at period end |
for financial reporting purposes, and as such, the NAVs for shareholder transactions and the returns based on those NAVs may differ from the NAVs and returns reported in the Financial Highlights. |
| n | Industry classifications used in this report are generally according to the Global Industry Classification Standard, which was developed by and is the exclusive property and a service mark of MSCI Inc. and Standard & Poor’s. |
6 Invesco S&P 500 Index Fund
Average Annual Total Returns
As of 8/31/14, including maximum applicable sales charges
Class A Shares | ||||
Inception (9/26/97) | 5.51 | % | ||
10 Years | 7.22 | |||
5 Years | 14.94 | |||
1 Year | 17.68 | |||
Class B Shares | ||||
Inception (9/26/97) | 5.48 | % | ||
10 Years | 7.19 | |||
5 Years | 15.17 | |||
1 Year | 18.60 | |||
Class C Shares | ||||
Inception (9/26/97) | 5.07 | % | ||
10 Years | 7.05 | |||
5 Years | 15.40 | |||
1 Year | 22.59 | |||
Class Y Shares | ||||
Inception (9/26/97) | 6.12 | % | ||
10 Years | 8.10 | |||
5 Years | 16.55 | |||
1 Year | 24.83 | |||
Average Annual Total Returns
As of 6/30/14, the most recent calendar quarter end, including maximum applicable sales charges
Class A Shares | ||||
Inception (9/26/97) | 5.41 | % | ||
10 Years | 6.64 | |||
5 Years | 16.87 | |||
1 Year | 17.05 | |||
Class B Shares | ||||
Inception (9/26/97) | 5.38 | % | ||
10 Years | 6.59 | |||
5 Years | 17.11 | |||
1 Year | 17.95 | |||
Class C Shares | ||||
Inception (9/26/97) | 4.98 | % | ||
10 Years | 6.46 | |||
5 Years | 17.33 | |||
1 Year | 21.92 | |||
Class Y Shares | ||||
Inception (9/26/97) | 6.03 | % | ||
10 Years | 7.51 | |||
5 Years | 18.50 | |||
1 Year | 24.24 | |||
Effective June 1, 2010, Class A, Class B, Class C and Class I shares of the predecessor fund, Morgan Stanley S&P 500 Index Fund, advised by Morgan Stanley Investment Advisors Inc. were reorganized into Class A, Class B, Class C and Class Y shares, respectively, of Invesco S&P 500 Index Fund. Returns shown above for Class A, Class B, Class C and Class Y shares are blended returns of the predecessor fund and Invesco S&P 500 Index Fund. Share class returns will differ from the predecessor fund because of different expenses.
The performance data quoted represent past performance and cannot guarantee comparable future results; current performance may be lower or higher. Please visit invesco.com/performance for the most recent month-end performance. Performance figures reflect reinvested distributions, changes in net asset value and the effect of the maximum sales charge unless otherwise stated. Investment return and principal value will fluctuate so that you may have a gain or loss when you sell shares.
The total annual Fund operating expense ratio set forth in the most recent Fund prospectus as of the date of this report for Class A, Class B, Class C and Class Y shares was 0.62%,
1.37%, 1.36% and 0.37%, respectively. The expense ratios presented above may vary from the expense ratios presented in other sections of this report that are based on expenses incurred during the period covered by this report.
Class A share performance reflects the maximum 5.50% sales charge, and Class B and Class C share performance reflects the applicable contingent deferred sales charge (CDSC) for the period involved. The CDSC on Class B shares declines from 5% beginning at the time of purchase to 0% at the beginning of the seventh year. The CDSC on Class C shares is 1% for the first year after purchase. Class Y shares do not have a front-end sales charge or a CDSC; therefore, performance is at net asset value.
The performance of the Fund’s share classes will differ primarily due to different sales charge structures and class expenses.
7 Invesco S&P 500 Index Fund
Invesco S&P 500 Index Fund’s investment objective is total return through growth of capital and current income.
| n | Unless otherwise stated, information presented in this report is as of August 31, 2014, and is based on total net assets. |
| n | Unless otherwise noted, all data provided by Invesco. |
| n | To access your Fund’s reports/prospectus, visit invesco.com/fundreports. |
About share classes
| n | Class B shares may not be purchased for new or additional investments. Please see the prospectus for more information. |
| n | Class Y shares are available only to certain investors. Please see the prospectus for more information. |
Principal risks of investing in the Fund
| n | Depositary receipts risk. Depositary receipts involve many of the same risks as those associated with direct investment in foreign securities. In addition, the underlying issuers of certain depositary receipts, particularly unsponsored or unregistered depositary receipts, are under no obligation to distribute shareholder communications to the holders of such receipts or to pass through to them any voting rights with respect to the deposited securities. |
| n | Derivatives risk. The value of a derivative instrument depends largely on (and is derived from) the value of an underlying security, currency, commodity, interest rate, index or other asset (each referred to as an underlying asset). In addition to risks relating to the underlying assets, the use of derivatives may include other, possibly greater, risks, including counterparty, leverage and liquidity risks. Counterparty risk is the risk that the counterparty to the derivative contract will default on its obligation to pay the Fund the amount owed or otherwise perform under the derivative contract. Derivatives create leverage risk because they do not require payment up front equal to the economic exposure created by owning the derivative. As a result, an adverse change in the value of the underlying asset could result in the Fund sustaining a loss that is substantially greater than the amount invested in the derivative, which may make the Fund’s returns more volatile and increase the risk of loss. Derivative instruments may also be less liquid |
than more traditional investments and the Fund may be unable to sell or close out its derivative positions at a desirable time or price. This risk may be more acute under adverse market conditions, during which the Fund may be most in need of liquidating its derivative positions. Derivatives may also be harder to value, less tax efficient and subject to changing government regulation that could impact the Fund’s ability to use certain derivatives or their cost. Also, derivatives used for hedging or to gain or limit exposure to a particular market segment may not provide the expected benefits, particularly during adverse market conditions. |
| n | Developing/emerging markets securities risk. The prices of securities issued by foreign companies and governments located in developing/emerging market countries may be affected more negatively by inflation, devaluation of their currencies, higher transaction costs, delays in settlement, adverse political developments, the introduction of capital controls, withholding taxes, nationalization of private assets, expropriation, social unrest, war or lack of timely information than those in developed countries. |
| n | Equity risk. Equity risk is the risk that the value of securities held by the Fund will fall due to general market and economic conditions, perceptions regarding the industries in which the issuers of securities held by the Fund participate or factors relating to specific companies in which the Fund invests, either directly or through derivative instruments. For example, an adverse event, such as an unfavorable earnings report, may depress the value of securities held by the Fund; the price of securities may be particularly sensitive to general movements in the stock market; or a drop in the stock market may depress the price of most or all of the securities held by the Fund. In addition, securities of an issuer in the Fund’s portfolio may decline in price if the issuer fails to |
make anticipated dividend payments because, among other reasons, the issuer of the security experiences a decline in its financial condition. |
| n | Foreign securities risk. The Fund’s foreign investments may be affected by changes in a foreign country’s exchange rates, political and social instability, changes in economic or taxation policies, difficulties when enforcing obligations, decreased liquidity, and increased volatility. Foreign companies may be subject to less regulation resulting in less publicly available information about the companies. |
| n | Indexing risk. The Fund is operated as a passively managed index fund. As such, the adverse performance of a particular stock ordinarily will not result in the elimination of the stock from the Fund’s portfolio. The Fund will remain invested in common stocks even when stock prices are generally falling. Ordinarily, the Adviser will not sell the Fund’s portfolio securities except to reflect additions or deletions of the stocks that comprise the S&P 500 Index, or as may be necessary to raise cash to pay Fund shareholders who sell Fund shares. The Fund’s ability to correlate its performance, before expenses, with the S&P 500 Index may be affected by, among other things, changes in securities markets, the manner in which the S&P 500 Index is calculated and the timing of purchases and sales, and also depends to some extent on the size of the Fund’s portfolio, the size of cash flows into and out of the Fund and differences between how and when the Fund and the Index are valued. |
| n | Management risk. The investment techniques and risk analysis used by the Fund’s portfolio managers may not produce the desired results. |
| n | Market risk. The prices of and the income generated by the Fund’s securities may decline in response to, among other things, investor sentiment, general economic and market conditions, regional or global instability, and currency and interest rate fluctuations. |
This report must be accompanied or preceded by a currently effective Fund prospectus, which contains more complete information, including sales charges and expenses. Investors should read it carefully before investing.
| NOT FDIC INSURED | MAY LOSE VALUE | NO BANK GUARANTEE |
continued on page 6
8 Invesco S&P 500 Index Fund
Schedule of Investments(a)
August 31, 2014
| Shares | Value | |||||||
Common Stocks & Other Equity Interests–98.70% |
| |||||||
| Advertising–0.15% | ||||||||
Interpublic Group of Cos., Inc. (The) | 16,841 | $ | 328,905 | |||||
Omnicom Group Inc. | 10,294 | 741,271 | ||||||
| 1,070,176 | ||||||||
| Aerospace & Defense–2.55% | ||||||||
Boeing Co. (The) | 26,605 | 3,373,514 | ||||||
General Dynamics Corp. | 12,936 | 1,594,362 | ||||||
Honeywell International Inc. | 31,059 | 2,957,749 | ||||||
L-3 Communications Holdings, Inc. | 3,394 | 373,170 | ||||||
Lockheed Martin Corp. | 10,571 | 1,839,354 | ||||||
Northrop Grumman Corp. | 8,448 | 1,074,754 | ||||||
Precision Castparts Corp. | 5,733 | 1,399,196 | ||||||
Raytheon Co. | 12,417 | 1,196,254 | ||||||
Rockwell Collins, Inc. | 5,354 | 412,151 | ||||||
Textron Inc. | 11,051 | 419,938 | ||||||
United Technologies Corp. | 33,446 | 3,611,499 | ||||||
| 18,251,941 | ||||||||
| Agricultural & Farm Machinery–0.17% | ||||||||
Deere & Co. | 14,426 | 1,213,082 | ||||||
| Agricultural Products–0.18% | ||||||||
Archer-Daniels-Midland Co. | 25,994 | 1,296,061 | ||||||
| Air Freight & Logistics–0.71% | ||||||||
C.H. Robinson Worldwide, Inc. | 5,924 | 404,373 | ||||||
Expeditors International of Washington, Inc. | 7,827 | 323,255 | ||||||
FedEx Corp. | 11,015 | 1,628,898 | ||||||
United Parcel Service, Inc.–Class B | 27,952 | 2,720,568 | ||||||
| 5,077,094 | ||||||||
| Airlines–0.31% | ||||||||
Delta Air Lines, Inc. | 33,636 | 1,331,313 | ||||||
Southwest Airlines Co. | 27,436 | 878,226 | ||||||
| 2,209,539 | ||||||||
| Aluminum–0.11% | ||||||||
Alcoa Inc. | 46,489 | 772,182 | ||||||
| Apparel Retail–0.50% | ||||||||
Gap, Inc. (The) | 10,311 | 475,852 | ||||||
L Brands, Inc. | 9,724 | 620,877 | ||||||
Ross Stores, Inc. | 8,423 | 635,263 | ||||||
TJX Cos., Inc. (The) | 27,772 | 1,655,489 | ||||||
Urban Outfitters, Inc.(b) | 4,020 | 159,956 | ||||||
| 3,547,437 | ||||||||
| Apparel, Accessories & Luxury Goods–0.45% | ||||||||
Coach, Inc. | 10,830 | 398,869 | ||||||
Fossil Group, Inc.(b) | 1,929 | 195,388 | ||||||
Michael Kors Holdings Ltd.(b) | 7,119 | 570,374 | ||||||
PVH Corp. | 3,303 | 385,592 | ||||||
| Shares | Value | |||||||
| Apparel, Accessories & Luxury Goods–(continued) | ||||||||
Ralph Lauren Corp. | 2,298 | $ | 388,822 | |||||
Under Armour, Inc.–Class A(b) | 6,422 | 439,008 | ||||||
VF Corp. | 13,651 | 875,302 | ||||||
| 3,253,355 | ||||||||
| Application Software–0.63% | ||||||||
Adobe Systems Inc.(b) | 18,339 | 1,318,574 | ||||||
Autodesk, Inc.(b) | 9,069 | 486,461 | ||||||
Citrix Systems, Inc.(b) | 6,469 | 454,512 | ||||||
Intuit Inc. | 11,285 | 938,687 | ||||||
salesforce.com, inc.(b) | 22,401 | 1,323,675 | ||||||
| 4,521,909 | ||||||||
| Asset Management & Custody Banks–1.30% | ||||||||
Affiliated Managers Group, Inc.(b) | 2,193 | 463,052 | ||||||
Ameriprise Financial, Inc. | 7,516 | 945,212 | ||||||
Bank of New York Mellon Corp. (The) | 45,224 | 1,771,876 | ||||||
BlackRock, Inc. | 4,959 | 1,639,098 | ||||||
Franklin Resources, Inc. | 15,940 | 900,929 | ||||||
Invesco Ltd.(c) | 17,201 | 702,489 | ||||||
Legg Mason, Inc. | 4,075 | 200,979 | ||||||
Northern Trust Corp. | 8,793 | 609,795 | ||||||
State Street Corp. | 17,041 | 1,227,463 | ||||||
T. Rowe Price Group Inc. | 10,446 | 846,074 | ||||||
| 9,306,967 | ||||||||
| Auto Parts & Equipment–0.37% | ||||||||
BorgWarner, Inc. | 9,099 | 565,867 | ||||||
Delphi Automotive PLC (United Kingdom) | 11,008 | 765,936 | ||||||
Johnson Controls, Inc. | 26,338 | 1,285,558 | ||||||
| 2,617,361 | ||||||||
| Automobile Manufacturers–0.64% | ||||||||
Ford Motor Co. | 156,815 | 2,730,149 | ||||||
General Motors Co. | 52,151 | 1,814,855 | ||||||
| 4,545,004 | ||||||||
| Automotive Retail–0.27% | ||||||||
AutoNation, Inc.(b) | 2,498 | 135,516 | ||||||
AutoZone, Inc.(b) | 1,308 | 704,803 | ||||||
CarMax, Inc.(b) | 8,707 | 456,247 | ||||||
O’Reilly Automotive, Inc.(b) | 4,224 | 658,860 | ||||||
| 1,955,426 | ||||||||
| Biotechnology–2.84% | ||||||||
Alexion Pharmaceuticals, Inc.(b) | 7,860 | 1,330,619 | ||||||
Amgen Inc. | 30,020 | 4,184,188 | ||||||
Biogen Idec Inc.(b) | 9,406 | 3,226,634 | ||||||
Celgene Corp.(b) | 31,758 | 3,017,645 | ||||||
Gilead Sciences, Inc.(b) | 60,900 | 6,551,622 | ||||||
Regeneron Pharmaceuticals, Inc.(b) | 3,159 | 1,107,293 | ||||||
Vertex Pharmaceuticals Inc.(b) | 9,408 | 880,307 | ||||||
| 20,298,308 | ||||||||
See accompanying Notes to Financial Statements which are an integral part of the financial statements.
9 Invesco S&P 500 Index Fund
| Shares | Value | |||||||
| Brewers–0.07% | ||||||||
Molson Coors Brewing Co.–Class B | 6,334 | $ | 468,399 | |||||
| Broadcasting–0.31% | ||||||||
CBS Corp.–Class B | 19,326 | 1,145,838 | ||||||
Discovery Communications, Inc.– | 8,647 | 378,047 | ||||||
Discovery Communications, Inc.– | 8,647 | 371,562 | ||||||
Scripps Networks Interactive Inc.–Class A | 4,218 | 336,217 | ||||||
| 2,231,664 | ||||||||
| Building Products–0.07% | ||||||||
Allegion PLC | 3,594 | 184,840 | ||||||
Masco Corp. | 14,171 | 332,593 | ||||||
| 517,433 | ||||||||
| Cable & Satellite–1.26% | ||||||||
Cablevision Systems Corp.–Class A | 8,584 | 158,890 | ||||||
Comcast Corp.–Class A | 103,101 | 5,642,718 | ||||||
DIRECTV(b) | 18,581 | 1,606,327 | ||||||
Time Warner Cable Inc. | 11,053 | 1,635,070 | ||||||
| 9,043,005 | ||||||||
| Casinos & Gaming–0.09% | ||||||||
Wynn Resorts Ltd. | 3,219 | 620,881 | ||||||
| Coal & Consumable Fuels–0.08% | ||||||||
CONSOL Energy Inc. | 9,118 | 367,273 | ||||||
Peabody Energy Corp. | 10,711 | 170,091 | ||||||
| 537,364 | ||||||||
| Commodity Chemicals–0.26% | ||||||||
LyondellBasell Industries N.V.–Class A | 16,519 | 1,888,948 | ||||||
| Communications Equipment–1.65% | ||||||||
Cisco Systems, Inc. | 203,153 | 5,076,793 | ||||||
F5 Networks, Inc.(b) | 3,037 | 377,165 | ||||||
Harris Corp. | 4,220 | 301,266 | ||||||
Juniper Networks, Inc. | 18,788 | 435,694 | ||||||
Motorola Solutions, Inc. | 9,016 | 535,550 | ||||||
QUALCOMM, Inc. | 66,936 | 5,093,830 | ||||||
| 11,820,298 | ||||||||
| Computer & Electronics Retail–0.08% | ||||||||
Best Buy Co., Inc. | 10,927 | 348,462 | ||||||
GameStop Corp.–Class A | 4,551 | 192,052 | ||||||
| 540,514 | ||||||||
| Construction & Engineering–0.15% | ||||||||
Fluor Corp. | 6,295 | 465,137 | ||||||
Jacobs Engineering Group, Inc.(b) | 5,200 | 280,332 | ||||||
Quanta Services, Inc.(b) | 8,596 | 312,379 | ||||||
| 1,057,848 | ||||||||
| Construction Machinery & Heavy Trucks–0.67% | ||||||||
Caterpillar Inc. | 24,755 | 2,700,028 | ||||||
Cummins Inc. | 6,781 | 983,991 | ||||||
Joy Global Inc. | 3,996 | 252,347 | ||||||
| Shares | Value | |||||||
| Construction Machinery & Heavy Trucks–(continued) | ||||||||
PACCAR Inc. | 14,088 | $ | 884,867 | |||||
| 4,821,233 | ||||||||
| Construction Materials–0.09% | ||||||||
Martin Marietta Materials, Inc. | 2,407 | 315,221 | ||||||
Vulcan Materials Co. | 5,178 | 328,181 | ||||||
| 643,402 | ||||||||
| Consumer Electronics–0.08% | ||||||||
Garmin Ltd. | 4,872 | 264,696 | ||||||
Harman International Industries, Inc. | 2,748 | 316,240 | ||||||
| 580,936 | ||||||||
| Consumer Finance–0.92% | ||||||||
American Express Co. | 36,080 | 3,230,964 | ||||||
Capital One Financial Corp. | 22,716 | 1,864,075 | ||||||
Discover Financial Services | 18,490 | 1,153,221 | ||||||
Navient Corp. | 16,764 | 300,746 | ||||||
| 6,549,006 | ||||||||
| Data Processing & Outsourced Services–1.78% | ||||||||
Alliance Data Systems Corp.(b) | 2,172 | 574,798 | ||||||
Automatic Data Processing, Inc. | 19,123 | 1,596,388 | ||||||
Computer Sciences Corp. | 5,723 | 342,178 | ||||||
Fidelity National Information Services, Inc. | 11,373 | 645,418 | ||||||
Fiserv, Inc.(b) | 9,882 | 637,093 | ||||||
MasterCard, Inc.–Class A | 39,848 | 3,020,877 | ||||||
Paychex, Inc. | 12,797 | 532,995 | ||||||
Total System Services, Inc. | 6,626 | 208,454 | ||||||
Visa Inc.–Class A | 19,935 | 4,236,586 | ||||||
Western Union Co. (The) | 21,371 | 373,351 | ||||||
Xerox Corp. | 43,321 | 598,263 | ||||||
| 12,766,401 | ||||||||
| Department Stores–0.24% | ||||||||
Kohl’s Corp. | 7,727 | 454,271 | ||||||
Macy’s, Inc. | 14,293 | 890,311 | ||||||
Nordstrom, Inc. | 5,525 | 382,606 | ||||||
| 1,727,188 | ||||||||
| Distillers & Vintners–0.17% | ||||||||
Brown-Forman Corp.–Class B | 6,464 | 598,954 | ||||||
Constellation Brands, Inc.–Class A(b) | 6,700 | 583,503 | ||||||
| 1,182,457 | ||||||||
| Distributors–0.07% | ||||||||
Genuine Parts Co. | 6,068 | 532,406 | ||||||
| Diversified Banks–4.90% | ||||||||
Bank of America Corp. | 417,024 | 6,709,916 | ||||||
Citigroup Inc. | 120,470 | 6,222,276 | ||||||
Comerica Inc. | 7,229 | 363,908 | ||||||
JPMorgan Chase & Co. | 150,092 | 8,922,969 | ||||||
U.S. Bancorp | 71,961 | 3,042,511 | ||||||
Wells Fargo & Co. | 190,079 | 9,777,664 | ||||||
| 35,039,244 | ||||||||
See accompanying Notes to Financial Statements which are an integral part of the financial statements.
10 Invesco S&P 500 Index Fund
| Shares | Value | |||||||
| Diversified Chemicals–0.81% | ||||||||
Dow Chemical Co. (The) | 47,749 | $ | 2,556,959 | |||||
E. I. du Pont de Nemours and Co. | 36,419 | 2,407,660 | ||||||
Eastman Chemical Co. | 5,944 | 490,202 | ||||||
FMC Corp. | 5,296 | 350,277 | ||||||
| 5,805,098 | ||||||||
| Diversified Metals & Mining–0.21% | ||||||||
Freeport-McMoRan Inc. | 41,192 | 1,498,153 | ||||||
| Diversified REIT’s–0.10% | ||||||||
Vornado Realty Trust | 6,926 | 733,256 | ||||||
| Diversified Support Services–0.07% | ||||||||
Cintas Corp. | 4,002 | 264,692 | ||||||
Iron Mountain Inc. | 6,772 | 243,657 | ||||||
| 508,349 | ||||||||
| Drug Retail–0.81% | ||||||||
CVS Caremark Corp. | 46,368 | 3,683,938 | ||||||
Walgreen Co. | 34,818 | 2,107,185 | ||||||
| 5,791,123 | ||||||||
| Education Services–0.02% | ||||||||
Graham Holdings Co.–Class B | 174 | 125,071 | ||||||
| Electric Utilities–1.68% | ||||||||
American Electric Power Co., Inc. | 19,358 | 1,039,525 | ||||||
Duke Energy Corp. | 28,047 | 2,075,198 | ||||||
Edison International | 12,963 | 766,632 | ||||||
Entergy Corp. | 7,149 | 553,404 | ||||||
Exelon Corp. | 34,054 | 1,138,085 | ||||||
FirstEnergy Corp. | 16,652 | 570,164 | ||||||
NextEra Energy, Inc. | 17,295 | 1,702,693 | ||||||
Northeast Utilities | 12,541 | 575,506 | ||||||
Pepco Holdings, Inc. | 9,990 | 275,324 | ||||||
Pinnacle West Capital Corp. | 4,382 | 249,555 | ||||||
PPL Corp. | 25,053 | 867,585 | ||||||
Southern Co. (The) | 35,327 | 1,568,519 | ||||||
Xcel Energy, Inc. | 19,906 | 637,987 | ||||||
| 12,020,177 | ||||||||
| Electrical Components & Equipment–0.60% | ||||||||
AMETEK, Inc. | 9,731 | 515,159 | ||||||
Eaton Corp. PLC | 18,903 | 1,319,619 | ||||||
Emerson Electric Co. | 27,855 | 1,783,277 | ||||||
Rockwell Automation, Inc. | 5,525 | 644,270 | ||||||
| 4,262,325 | ||||||||
| Electronic Components–0.24% | ||||||||
Amphenol Corp.–Class A | 6,193 | 637,941 | ||||||
Corning Inc. | 51,890 | 1,082,425 | ||||||
| 1,720,366 | ||||||||
| Electronic Equipment & Instruments–0.03% | ||||||||
FLIR Systems, Inc. | 5,659 | 191,218 | ||||||
| Shares | Value | |||||||
| Electronic Manufacturing Services–0.16% | ||||||||
Jabil Circuit, Inc. | 7,287 | $ | 157,254 | |||||
TE Connectivity Ltd. (Switzerland) | 16,196 | 1,015,165 | ||||||
| 1,172,419 | ||||||||
| Environmental & Facilities Services–0.23% | ||||||||
Republic Services, Inc. | 10,575 | 415,915 | ||||||
Stericycle, Inc.(b) | 3,407 | 404,922 | ||||||
Waste Management, Inc. | 17,167 | 806,334 | ||||||
| 1,627,171 | ||||||||
| Fertilizers & Agricultural Chemicals–0.50% | ||||||||
CF Industries Holdings, Inc. | 2,055 | 529,512 | ||||||
Monsanto Co. | 20,823 | 2,408,180 | ||||||
Mosaic Co. (The) | 12,827 | 612,617 | ||||||
| 3,550,309 | ||||||||
| Food Distributors–0.12% | ||||||||
Sysco Corp. | 23,196 | 877,505 | ||||||
| Food Retail–0.27% | ||||||||
Kroger Co. (The) | 20,206 | 1,030,102 | ||||||
Safeway Inc. | 9,090 | 316,150 | ||||||
Whole Foods Market, Inc. | 14,576 | 570,505 | ||||||
| 1,916,757 | ||||||||
| Footwear–0.32% | ||||||||
NIKE, Inc.–Class B | 29,251 | 2,297,666 | ||||||
| Gas Utilities–0.04% | ||||||||
AGL Resources Inc. | 4,712 | 251,197 | ||||||
| General Merchandise Stores–0.42% | ||||||||
Dollar General Corp.(b) | 12,027 | 769,608 | ||||||
Dollar Tree, Inc.(b) | 8,170 | 438,116 | ||||||
Family Dollar Stores, Inc. | 3,772 | 301,119 | ||||||
Target Corp. | 25,122 | 1,509,078 | ||||||
| 3,017,921 | ||||||||
| Gold–0.07% | ||||||||
Newmont Mining Corp. | 19,769 | 535,542 | ||||||
| Health Care Distributors–0.50% | ||||||||
AmerisourceBergen Corp. | 9,003 | 696,742 | ||||||
Cardinal Health, Inc. | 13,537 | 997,677 | ||||||
McKesson Corp. | 9,144 | 1,783,354 | ||||||
Patterson Cos. Inc. | 3,263 | 131,401 | ||||||
| 3,609,174 | ||||||||
| Health Care Equipment–2.02% | ||||||||
Abbott Laboratories | 59,562 | 2,515,899 | ||||||
Baxter International Inc. | 21,546 | 1,615,519 | ||||||
Becton, Dickinson and Co. | 7,620 | 892,835 | ||||||
Boston Scientific Corp.(b) | 52,453 | 665,104 | ||||||
C.R. Bard, Inc. | 2,994 | 444,429 | ||||||
CareFusion Corp.(b) | 8,199 | 376,416 | ||||||
Covidien PLC | 17,896 | 1,553,910 | ||||||
See accompanying Notes to Financial Statements which are an integral part of the financial statements.
11 Invesco S&P 500 Index Fund
| Shares | Value | |||||||
| Health Care Equipment–(continued) | ||||||||
Edwards Lifesciences Corp.(b) | 4,147 | $ | 411,631 | |||||
Intuitive Surgical, Inc.(b) | 1,526 | 717,235 | ||||||
Medtronic, Inc. | 39,617 | 2,529,546 | ||||||
St. Jude Medical, Inc. | 11,304 | 741,429 | ||||||
Stryker Corp. | 11,736 | 977,726 | ||||||
Varian Medical Systems, Inc.(b) | 4,077 | 346,627 | ||||||
Zimmer Holdings, Inc. | 6,654 | 660,809 | ||||||
| 14,449,115 | ||||||||
| Health Care Facilities–0.03% | ||||||||
Tenet Healthcare Corp.(b) | 3,843 | 235,115 | ||||||
| Health Care REIT’s–0.33% | ||||||||
HCP, Inc. | 18,170 | 787,306 | ||||||
Health Care REIT, Inc. | 12,113 | 818,597 | ||||||
Ventas, Inc. | 11,718 | 770,810 | ||||||
| 2,376,713 | ||||||||
| Health Care Services–0.49% | ||||||||
DaVita HealthCare Partners Inc.(b) | 7,030 | 525,001 | ||||||
Express Scripts Holding Co.(b) | 30,640 | 2,265,215 | ||||||
Laboratory Corp. of America Holdings(b) | 3,373 | 361,687 | ||||||
Quest Diagnostics Inc. | 5,778 | 365,227 | ||||||
| 3,517,130 | ||||||||
| Health Care Supplies–0.04% | ||||||||
DENTSPLY International Inc. | 5,598 | 267,053 | ||||||
| Health Care Technology–0.09% | ||||||||
Cerner Corp.(b) | 11,757 | 677,909 | ||||||
| Home Entertainment Software–0.07% | ||||||||
Electronic Arts Inc.(b) | 12,473 | 471,978 | ||||||
| Home Furnishings–0.08% | ||||||||
Leggett & Platt, Inc. | 5,542 | 194,469 | ||||||
Mohawk Industries, Inc.(b) | 2,424 | 353,952 | ||||||
| 548,421 | ||||||||
| Home Improvement Retail–1.00% | ||||||||
Home Depot, Inc. (The) | 54,255 | 5,072,842 | ||||||
Lowe’s Cos., Inc. | 39,550 | 2,076,771 | ||||||
| 7,149,613 | ||||||||
| Homebuilding–0.11% | ||||||||
D.R. Horton, Inc. | 11,350 | 246,068 | ||||||
Lennar Corp.–Class A | 7,015 | 274,848 | ||||||
PulteGroup Inc. | 13,548 | 260,392 | ||||||
| 781,308 | ||||||||
| Homefurnishing Retail–0.07% | ||||||||
Bed Bath & Beyond Inc.(b) | 8,090 | 519,863 | ||||||
| Hotel and Resort REIT’s–0.10% | ||||||||
Host Hotels & Resorts Inc. | 30,017 | 684,988 | ||||||
| Shares | Value | |||||||
| Hotels, Resorts & Cruise Lines–0.32% | ||||||||
Carnival Corp. | 17,403 | $ | 659,226 | |||||
Marriott International Inc.–Class A | 8,724 | 605,446 | ||||||
Starwood Hotels & Resorts | 7,611 | 643,434 | ||||||
Wyndham Worldwide Corp. | 5,058 | 409,394 | ||||||
| 2,317,500 | ||||||||
| Household Appliances–0.07% | ||||||||
Whirlpool Corp. | 3,107 | 475,433 | ||||||
| Household Products–1.85% | ||||||||
Clorox Co. (The) | 5,123 | 453,898 | ||||||
Colgate-Palmolive Co. | 34,468 | 2,231,114 | ||||||
Kimberly-Clark Corp. | 14,979 | 1,617,732 | ||||||
Procter & Gamble Co. (The) | 107,311 | 8,918,617 | ||||||
| 13,221,361 | ||||||||
| Housewares & Specialties–0.05% | ||||||||
Newell Rubbermaid Inc. | 11,011 | 369,089 | ||||||
| Human Resource & Employment Services–0.04% | ||||||||
Robert Half International, Inc. | 5,483 | 275,301 | ||||||
| Hypermarkets & Super Centers–0.97% | ||||||||
Costco Wholesale Corp. | 17,361 | 2,102,070 | ||||||
Wal-Mart Stores, Inc. | 63,880 | 4,822,940 | ||||||
| 6,925,010 | ||||||||
| Independent Power Producers & Energy Traders–0.11% | ||||||||
AES Corp. (The) | 26,175 | 397,336 | ||||||
NRG Energy, Inc. | 13,373 | 411,621 | ||||||
| 808,957 | ||||||||
| Industrial Conglomerates–2.28% | ||||||||
3M Co. | 24,649 | 3,549,456 | ||||||
Danaher Corp. | 23,857 | 1,827,685 | ||||||
General Electric Co.(d) | 397,676 | 10,331,622 | ||||||
Roper Industries, Inc. | 3,936 | 592,604 | ||||||
| 16,301,367 | ||||||||
| Industrial Gases–0.41% | ||||||||
Air Products and Chemicals, Inc. | 8,453 | 1,126,024 | ||||||
Airgas, Inc. | 2,653 | 292,838 | ||||||
Praxair, Inc. | 11,606 | 1,526,770 | ||||||
| 2,945,632 | ||||||||
| Industrial Machinery–0.79% | ||||||||
Dover Corp. | 6,575 | 577,745 | ||||||
Flowserve Corp. | 5,472 | 415,270 | ||||||
Illinois Tool Works Inc. | 15,052 | 1,327,737 | ||||||
Ingersoll-Rand PLC | 9,953 | 599,171 | ||||||
Pall Corp. | 4,378 | 369,372 | ||||||
Parker Hannifin Corp. | 5,883 | 679,486 | ||||||
Pentair PLC (United Kingdom) | 7,721 | 525,568 | ||||||
Snap-on Inc. | 2,325 | 290,509 | ||||||
Stanley Black & Decker Inc. | 6,169 | 564,464 | ||||||
Xylem, Inc. | 7,270 | 270,880 | ||||||
| 5,620,202 | ||||||||
See accompanying Notes to Financial Statements which are an integral part of the financial statements.
12 Invesco S&P 500 Index Fund
| Shares | Value | |||||||
| Industrial REIT’s–0.11% | ||||||||
Prologis, Inc. | 19,825 | $ | 811,635 | |||||
| Insurance Brokers–0.30% | ||||||||
Aon PLC | 11,757 | 1,024,740 | ||||||
Marsh & McLennan Cos., Inc. | 21,795 | 1,157,315 | ||||||
| 2,182,055 | ||||||||
| Integrated Oil & Gas–4.33% | ||||||||
Chevron Corp. | 75,493 | 9,772,569 | ||||||
Exxon Mobil Corp. | 170,303 | 16,938,336 | ||||||
Hess Corp. | 10,466 | 1,058,113 | ||||||
Occidental Petroleum Corp. | 31,154 | 3,231,604 | ||||||
| 31,000,622 | ||||||||
| Integrated Telecommunication Services–2.36% | ||||||||
AT&T Inc. | 205,822 | 7,195,537 | ||||||
CenturyLink Inc. | 22,713 | 931,006 | ||||||
Frontier Communications Corp. | 39,747 | 270,279 | ||||||
Verizon Communications Inc. | 164,227 | 8,181,789 | ||||||
Windstream Holdings Inc. | 23,899 | 270,059 | ||||||
| 16,848,670 | ||||||||
| Internet Retail–1.33% | ||||||||
Amazon.com, Inc.(b) | 14,781 | 5,011,350 | ||||||
Expedia, Inc. | 4,091 | 351,417 | ||||||
Netflix Inc.(b) | 2,380 | 1,136,783 | ||||||
Priceline Group Inc. (The)(b) | 2,078 | 2,585,676 | ||||||
TripAdvisor Inc.(b) | 4,387 | 434,708 | ||||||
| 9,519,934 | ||||||||
| Internet Software & Services–3.18% | ||||||||
Akamai Technologies, Inc.(b) | 7,098 | 428,861 | ||||||
eBay Inc.(b) | 45,233 | 2,510,432 | ||||||
Facebook Inc.–Class A(b) | 68,188 | 5,101,826 | ||||||
Google Inc.–Class A(b) | 11,233 | 6,541,650 | ||||||
Google Inc.–Class C(b) | 11,233 | 6,420,783 | ||||||
VeriSign, Inc.(b) | 4,913 | 280,409 | ||||||
Yahoo! Inc.(b) | 37,164 | 1,431,186 | ||||||
| 22,715,147 | ||||||||
| Investment Banking & Brokerage–0.90% | ||||||||
Charles Schwab Corp. (The) | 46,439 | 1,323,976 | ||||||
E*TRADE Financial Corp.(b) | 11,481 | 255,567 | ||||||
Goldman Sachs Group, Inc. (The) | 16,492 | 2,953,882 | ||||||
Morgan Stanley | 55,505 | 1,904,377 | ||||||
| 6,437,802 | ||||||||
| IT Consulting & Other Services–1.49% | ||||||||
Accenture PLC–Class A | 25,150 | 2,038,659 | ||||||
Cognizant Technology Solutions Corp.–Class A(b) | 24,129 | 1,103,419 | ||||||
International Business Machines Corp. | 37,731 | 7,255,671 | ||||||
Teradata Corp.(b) | 6,252 | 285,529 | ||||||
| 10,683,278 | ||||||||
| Shares | Value | |||||||
| Leisure Products–0.10% | ||||||||
Hasbro, Inc. | 4,629 | $ | 243,740 | |||||
Mattel, Inc. | 13,437 | 463,442 | ||||||
| 707,182 | ||||||||
| Life & Health Insurance–0.98% | ||||||||
Aflac, Inc. | 17,996 | 1,102,075 | ||||||
Lincoln National Corp. | 10,411 | 573,021 | ||||||
MetLife, Inc. | 44,637 | 2,443,429 | ||||||
Principal Financial Group, Inc. | 10,850 | 589,047 | ||||||
Prudential Financial, Inc. | 18,280 | 1,639,716 | ||||||
Torchmark Corp. | 5,262 | 287,042 | ||||||
Unum Group | 10,243 | 371,514 | ||||||
| 7,005,844 | ||||||||
| Life Sciences Tools & Services–0.45% | ||||||||
Agilent Technologies, Inc. | 13,263 | 758,113 | ||||||
PerkinElmer, Inc. | 4,531 | 203,215 | ||||||
Thermo Fisher Scientific, Inc. | 15,820 | 1,901,722 | ||||||
Waters Corp.(b) | 3,350 | 346,491 | ||||||
| 3,209,541 | ||||||||
| Managed Health Care–1.07% | ||||||||
Aetna Inc. | 14,173 | 1,164,029 | ||||||
Cigna Corp. | 10,653 | 1,007,774 | ||||||
Humana Inc. | 6,177 | 795,227 | ||||||
UnitedHealth Group Inc. | 38,858 | 3,368,211 | ||||||
WellPoint, Inc. | 11,049 | 1,287,319 | ||||||
| 7,622,560 | ||||||||
| Metal & Glass Containers–0.08% | ||||||||
Ball Corp. | 5,508 | 353,063 | ||||||
Owens-Illinois, Inc.(b) | 6,548 | 201,613 | ||||||
| 554,676 | ||||||||
| Motorcycle Manufacturers–0.08% | ||||||||
Harley-Davidson, Inc. | 8,687 | 552,146 | ||||||
| Movies & Entertainment–1.73% | ||||||||
Time Warner Inc. | 34,981 | 2,694,586 | ||||||
Twenty-First Century Fox, Inc.–Class A | 75,930 | 2,689,441 | ||||||
Viacom Inc.–Class B | 15,511 | 1,258,718 | ||||||
Walt Disney Co. (The) | 63,872 | 5,740,815 | ||||||
| 12,383,560 | ||||||||
| Multi-Line Insurance–0.68% | ||||||||
American International Group, Inc. | 57,369 | 3,216,106 | ||||||
Assurant, Inc. | 2,872 | 191,706 | ||||||
Genworth Financial Inc.–Class A(b) | 19,680 | 279,259 | ||||||
Hartford Financial Services Group, Inc. (The) | 17,833 | 660,713 | ||||||
Loews Corp. | 12,083 | 528,510 | ||||||
| 4,876,294 | ||||||||
| Multi-Sector Holdings–1.41% | ||||||||
Berkshire Hathaway Inc.–Class B(b) | 71,403 | 9,800,062 | ||||||
Leucadia National Corp. | 12,569 | 313,345 | ||||||
| 10,113,407 | ||||||||
See accompanying Notes to Financial Statements which are an integral part of the financial statements.
13 Invesco S&P 500 Index Fund
| Shares | Value | |||||||
| Multi-Utilities–1.13% | ||||||||
Ameren Corp. | 9,667 | $ | 386,583 | |||||
CenterPoint Energy, Inc. | 17,042 | 423,323 | ||||||
CMS Energy Corp. | 10,686 | 326,350 | ||||||
Consolidated Edison, Inc. | 11,664 | 675,229 | ||||||
Dominion Resources, Inc. | 23,064 | 1,619,554 | ||||||
DTE Energy Co. | 7,070 | 553,228 | ||||||
Integrys Energy Group, Inc. | 3,135 | 212,835 | ||||||
NiSource Inc. | 12,496 | 495,716 | ||||||
PG&E Corp. | 18,431 | 856,673 | ||||||
Public Service Enterprise Group Inc. | 20,084 | 750,941 | ||||||
SCANA Corp. | 5,572 | 289,410 | ||||||
Sempra Energy | 9,050 | 959,029 | ||||||
TECO Energy, Inc. | 8,092 | 146,465 | ||||||
Wisconsin Energy Corp. | 8,971 | 406,655 | ||||||
| 8,101,991 | ||||||||
| Office REIT’s–0.10% | ||||||||
Boston Properties, Inc. | 6,071 | 737,141 | ||||||
| Office Services & Supplies–0.03% | ||||||||
Pitney Bowes Inc. | 8,042 | 217,616 | ||||||
| Oil & Gas Drilling–0.30% | ||||||||
Diamond Offshore Drilling, Inc. | 2,757 | 121,143 | ||||||
Ensco PLC–Class A | 9,307 | 469,817 | ||||||
Helmerich & Payne, Inc. | 4,267 | 448,248 | ||||||
Nabors Industries Ltd. | 10,401 | 283,011 | ||||||
Noble Corp. PLC | 10,095 | 287,304 | ||||||
Transocean Ltd. | 13,497 | 521,659 | ||||||
| 2,131,182 | ||||||||
| Oil & Gas Equipment & Services–1.64% | ||||||||
Baker Hughes Inc. | 17,261 | 1,193,426 | ||||||
Cameron International Corp.(b) | 8,061 | 599,174 | ||||||
FMC Technologies, Inc.(b) | 9,317 | 576,163 | ||||||
Halliburton Co. | 33,490 | 2,264,259 | ||||||
National Oilwell Varco Inc. | 17,019 | 1,470,952 | ||||||
Schlumberger Ltd. | 51,618 | 5,659,398 | ||||||
| 11,763,372 | ||||||||
| Oil & Gas Exploration & Production–2.67% | ||||||||
Anadarko Petroleum Corp. | 20,028 | 2,256,955 | ||||||
Apache Corp. | 15,295 | 1,557,490 | ||||||
Cabot Oil & Gas Corp. | 16,548 | 555,020 | ||||||
Chesapeake Energy Corp. | 20,090 | 546,448 | ||||||
Cimarex Energy Co. | 3,450 | 500,802 | ||||||
ConocoPhillips | 48,686 | 3,954,277 | ||||||
Denbury Resources Inc. | 13,946 | 240,150 | ||||||
Devon Energy Corp. | 15,219 | 1,147,817 | ||||||
EOG Resources, Inc. | 21,672 | 2,381,319 | ||||||
EQT Corp. | 6,000 | 594,360 | ||||||
Marathon Oil Corp. | 26,811 | 1,117,751 | ||||||
Murphy Oil Corp. | 6,670 | 416,675 | ||||||
Newfield Exploration Co.(b) | 5,435 | 243,597 | ||||||
| Shares | Value | |||||||
| Oil & Gas Exploration & Production–(continued) | ||||||||
Noble Energy, Inc. | 14,209 | $ | 1,025,037 | |||||
Pioneer Natural Resources Co. | 5,691 | 1,187,427 | ||||||
QEP Resources Inc. | 7,142 | 254,041 | ||||||
Range Resources Corp. | 6,688 | 525,610 | ||||||
Southwestern Energy Co.(b) | 14,034 | 577,920 | ||||||
| 19,082,696 | ||||||||
| Oil & Gas Refining & Marketing–0.63% | ||||||||
Marathon Petroleum Corp. | 11,445 | 1,041,609 | ||||||
Phillips 66 | 22,439 | 1,952,642 | ||||||
Tesoro Corp. | 5,178 | 335,224 | ||||||
Valero Energy Corp. | 21,161 | 1,145,656 | ||||||
| 4,475,131 | ||||||||
| Oil & Gas Storage & Transportation–0.63% | ||||||||
Kinder Morgan Inc. | 26,451 | 1,064,917 | ||||||
ONEOK, Inc. | 8,204 | 575,921 | ||||||
Spectra Energy Corp. | 26,597 | 1,108,031 | ||||||
Williams Cos., Inc. (The) | 29,287 | 1,740,819 | ||||||
| 4,489,688 | ||||||||
| Packaged Foods & Meats–1.41% | ||||||||
Campbell Soup Co. | 7,088 | 317,684 | ||||||
ConAgra Foods, Inc. | 16,701 | 537,772 | ||||||
General Mills, Inc. | 24,368 | 1,300,764 | ||||||
Hershey Co. (The) | 5,904 | 539,744 | ||||||
Hormel Foods Corp. | 5,327 | 269,972 | ||||||
JM Smucker Co. (The) | 4,146 | 425,380 | ||||||
Kellogg Co. | 10,138 | 658,666 | ||||||
Keurig Green Mountain Inc. | 5,053 | 673,666 | ||||||
Kraft Foods Group, Inc. | 23,643 | 1,392,573 | ||||||
McCormick & Co., Inc. | 5,206 | 362,806 | ||||||
Mead Johnson Nutrition Co. | 8,044 | 769,006 | ||||||
Mondelez International Inc.–Class A | 67,052 | 2,426,612 | ||||||
Tyson Foods, Inc.–Class A | 10,914 | 415,387 | ||||||
| 10,090,032 | ||||||||
| Paper Packaging–0.13% | ||||||||
Avery Dennison Corp. | 3,738 | 179,910 | ||||||
Bemis Co., Inc. | 3,955 | 161,127 | ||||||
MeadWestvaco Corp. | 6,656 | 286,208 | ||||||
Sealed Air Corp. | 7,747 | 279,666 | ||||||
| 906,911 | ||||||||
| Paper Products–0.12% | ||||||||
International Paper Co. | 17,178 | 832,274 | ||||||
| Personal Products–0.14% | ||||||||
Avon Products, Inc. | 17,233 | 241,951 | ||||||
Estee Lauder Cos. Inc. (The)–Class A | 9,985 | 767,148 | ||||||
| 1,009,099 | ||||||||
| Pharmaceuticals–5.96% | ||||||||
AbbVie Inc. | 63,057 | 3,485,791 | ||||||
Actavis PLC(b) | 10,506 | 2,384,652 | ||||||
See accompanying Notes to Financial Statements which are an integral part of the financial statements.
14 Invesco S&P 500 Index Fund
| Shares | Value | |||||||
| Pharmaceuticals–(continued) | ||||||||
Allergan, Inc. | 11,783 | $ | 1,928,642 | |||||
Bristol-Myers Squibb Co. | 65,719 | 3,328,667 | ||||||
Eli Lilly and Co. | 39,066 | 2,483,035 | ||||||
Hospira, Inc.(b) | 6,661 | 357,962 | ||||||
Johnson & Johnson | 112,195 | 11,637,987 | ||||||
Mallinckrodt PLC(b) | 4,488 | 365,727 | ||||||
Merck & Co., Inc. | 115,893 | 6,966,328 | ||||||
Mylan Inc.(b) | 14,820 | 720,252 | ||||||
Perrigo Co. PLC | 5,329 | 792,636 | ||||||
Pfizer Inc. | 252,964 | 7,434,612 | ||||||
Zoetis Inc. | 19,868 | 704,122 | ||||||
| 42,590,413 | ||||||||
| Property & Casualty Insurance–0.82% | ||||||||
ACE Ltd. | 13,391 | 1,423,865 | ||||||
Allstate Corp. (The) | 17,210 | 1,058,243 | ||||||
Chubb Corp. (The) | 9,696 | 891,547 | ||||||
Cincinnati Financial Corp. | 5,868 | 282,192 | ||||||
Progressive Corp. (The) | 21,622 | 540,983 | ||||||
Travelers Cos., Inc. (The) | 13,779 | 1,305,009 | ||||||
XL Group PLC | 10,766 | 367,982 | ||||||
| 5,869,821 | ||||||||
| Publishing–0.09% | ||||||||
Gannett Co., Inc. | 9,029 | 304,819 | ||||||
News Corp.–Class A(b) | 19,760 | 348,270 | ||||||
| 653,089 | ||||||||
| Railroads–0.96% | ||||||||
CSX Corp. | 39,883 | 1,232,783 | ||||||
Kansas City Southern | 4,380 | 505,277 | ||||||
Norfolk Southern Corp. | 12,327 | 1,318,989 | ||||||
Union Pacific Corp. | 35,932 | 3,782,562 | ||||||
| 6,839,611 | ||||||||
| Real Estate Services–0.05% | ||||||||
CBRE Group, Inc.–Class A(b) | 11,109 | 353,044 | ||||||
| Regional Banks–0.92% | ||||||||
BB&T Corp. | 28,492 | 1,063,606 | ||||||
Fifth Third Bancorp | 33,728 | 688,220 | ||||||
Huntington Bancshares Inc. | 32,818 | 323,093 | ||||||
KeyCorp | 35,012 | 476,513 | ||||||
M&T Bank Corp. | 5,253 | 649,429 | ||||||
PNC Financial Services Group, Inc. (The) | 21,186 | 1,795,514 | ||||||
Regions Financial Corp. | 54,687 | 555,073 | ||||||
SunTrust Banks, Inc. | 21,110 | 803,869 | ||||||
Zions Bancorp. | 7,352 | 214,237 | ||||||
| 6,569,554 | ||||||||
| Research & Consulting Services–0.16% | ||||||||
Dun & Bradstreet Corp. (The) | 1,433 | 168,206 | ||||||
Equifax Inc. | 4,855 | 382,380 | ||||||
Nielsen N.V. | 12,066 | 566,981 | ||||||
| 1,117,567 | ||||||||
| Shares | Value | |||||||
| Residential REIT’s–0.32% | ||||||||
Apartment Investment & Management Co.–Class A | 5,758 | $ | 197,327 | |||||
AvalonBay Communities, Inc. | 4,846 | 746,769 | ||||||
Equity Residential | 13,352 | 887,507 | ||||||
Essex Property Trust, Inc. | 2,478 | 479,369 | ||||||
| 2,310,972 | ||||||||
| Restaurants–1.17% | ||||||||
Chipotle Mexican Grill, Inc.(b) | 1,240 | 841,526 | ||||||
Darden Restaurants, Inc. | 5,263 | 249,045 | ||||||
McDonald’s Corp. | 39,197 | 3,673,543 | ||||||
Starbucks Corp. | 29,845 | 2,322,240 | ||||||
Yum! Brands, Inc. | 17,487 | 1,266,583 | ||||||
| 8,352,937 | ||||||||
| Retail REIT’s–0.47% | ||||||||
General Growth Properties, Inc. | 20,684 | 508,206 | ||||||
Kimco Realty Corp. | 16,282 | 382,464 | ||||||
Macerich Co. (The) | 5,585 | 364,645 | ||||||
Simon Property Group, Inc. | 12,319 | 2,094,599 | ||||||
| 3,349,914 | ||||||||
| Security & Alarm Services–0.15% | ||||||||
ADT Corp. (The) | 6,909 | 254,666 | ||||||
Tyco International Ltd. | 18,293 | 816,233 | ||||||
| 1,070,899 | ||||||||
| Semiconductor Equipment–0.29% | ||||||||
Applied Materials, Inc. | 48,278 | 1,115,463 | ||||||
KLA-Tencor Corp. | 6,556 | 501,010 | ||||||
Lam Research Corp. | 6,399 | 460,152 | ||||||
| 2,076,625 | ||||||||
| Semiconductors–2.10% | ||||||||
Altera Corp. | 12,422 | 438,993 | ||||||
Analog Devices, Inc. | 12,457 | 636,802 | ||||||
Avago Technologies Ltd. (Singapore) | 9,981 | 819,340 | ||||||
Broadcom Corp.–Class A | 22,039 | 867,896 | ||||||
First Solar, Inc.(b) | 2,809 | 195,731 | ||||||
Intel Corp. | 197,415 | 6,893,732 | ||||||
Linear Technology Corp. | 9,414 | 424,666 | ||||||
Microchip Technology Inc. | 7,953 | 388,345 | ||||||
Micron Technology, Inc.(b) | 42,448 | 1,383,805 | ||||||
NVIDIA Corp. | 22,126 | 430,351 | ||||||
Texas Instruments Inc. | 42,808 | 2,062,489 | ||||||
Xilinx, Inc. | 10,658 | 450,300 | ||||||
| 14,992,450 | ||||||||
| Soft Drinks–1.85% | ||||||||
Coca-Cola Co. (The) | 149,899 | 6,253,786 | ||||||
Coca-Cola Enterprises, Inc. | 9,273 | 443,064 | ||||||
Dr Pepper Snapple Group, Inc. | 7,772 | 489,014 | ||||||
Monster Beverage Corp.(b) | 5,379 | 475,558 | ||||||
PepsiCo, Inc. | 60,112 | 5,559,759 | ||||||
| 13,221,181 | ||||||||
See accompanying Notes to Financial Statements which are an integral part of the financial statements.
15 Invesco S&P 500 Index Fund
| Shares | Value | |||||||
| Specialized Consumer Services–0.05% | ||||||||
H&R Block, Inc. | 10,826 | $ | 362,996 | |||||
| Specialized Finance–0.50% | ||||||||
CME Group Inc.–Class A | 12,558 | 961,315 | ||||||
Intercontinental Exchange, Inc. | 4,574 | 864,486 | ||||||
McGraw Hill Financial, Inc. | 10,799 | 876,123 | ||||||
Moody’s Corp. | 7,422 | 694,477 | ||||||
NASDAQ OMX Group, Inc. (The) | 4,699 | 204,265 | ||||||
| 3,600,666 | ||||||||
| Specialized REIT’s–0.64% | ||||||||
American Tower Corp. | 15,696 | 1,547,626 | ||||||
Crown Castle International Corp. | 13,189 | 1,048,657 | ||||||
Plum Creek Timber Co., Inc. | 7,031 | 285,670 | ||||||
Public Storage | 5,756 | 1,008,336 | ||||||
Weyerhaeuser Co. | 20,877 | 708,774 | ||||||
| 4,599,063 | ||||||||
| Specialty Chemicals–0.55% | ||||||||
Ecolab Inc. | 10,687 | 1,227,081 | ||||||
International Flavors & Fragrances Inc. | 3,247 | 329,863 | ||||||
PPG Industries, Inc. | 5,468 | 1,125,643 | ||||||
Sherwin-Williams Co. (The) | 3,365 | 733,940 | ||||||
Sigma-Aldrich Corp. | 4,748 | 493,792 | ||||||
| 3,910,319 | ||||||||
| Specialty Stores–0.19% | ||||||||
PetSmart, Inc. | 3,933 | 281,485 | ||||||
Staples, Inc. | 25,692 | 300,082 | ||||||
Tiffany & Co. | 4,446 | 448,779 | ||||||
Tractor Supply Co. | 5,448 | 364,744 | ||||||
| 1,395,090 | ||||||||
| Steel–0.12% | ||||||||
Allegheny Technologies, Inc. | 4,301 | 181,373 | ||||||
Nucor Corp. | 12,669 | 688,180 | ||||||
| 869,553 | ||||||||
| Systems Software–2.89% | ||||||||
CA, Inc. | 12,626 | 356,558 | ||||||
Microsoft Corp. | 298,104 | 13,542,865 | ||||||
Oracle Corp. | 136,157 | 5,654,600 | ||||||
Red Hat, Inc.(b) | 7,531 | 458,789 | ||||||
Symantec Corp. | 27,430 | 666,000 | ||||||
| 20,678,812 | ||||||||
| Shares | Value | |||||||
| Technology Hardware, Storage & Peripherals–4.59% | ||||||||
Apple Inc. | 239,121 | $ | 24,509,902 | |||||
EMC Corp. | 81,190 | 2,397,541 | ||||||
Hewlett-Packard Co. | 74,213 | 2,820,094 | ||||||
NetApp, Inc. | 13,179 | 555,626 | ||||||
SanDisk Corp. | 8,977 | 879,387 | ||||||
Seagate Technology PLC | 12,979 | 812,226 | ||||||
Western Digital Corp. | 8,274 | 852,305 | ||||||
| 32,827,081 | ||||||||
| Thrifts & Mortgage Finance–0.05% | ||||||||
Hudson City Bancorp, Inc. | 18,876 | 186,306 | ||||||
People’s United Financial Inc. | 12,348 | 184,603 | ||||||
| 370,909 | ||||||||
| Tires & Rubber–0.04% | ||||||||
Goodyear Tire & Rubber Co. (The) | 10,982 | 285,203 | ||||||
| Tobacco–1.44% | ||||||||
Altria Group, Inc. | 78,785 | 3,394,058 | ||||||
Lorillard, Inc. | 14,400 | 859,680 | ||||||
Philip Morris International Inc. | 62,376 | 5,338,138 | ||||||
Reynolds American Inc. | 12,295 | 718,889 | ||||||
| 10,310,765 | ||||||||
| Trading Companies & Distributors–0.15% | ||||||||
Fastenal Co. | 10,779 | 488,073 | ||||||
W.W. Grainger, Inc. | 2,398 | 590,388 | ||||||
| 1,078,461 | ||||||||
| Trucking–0.03% | ||||||||
Ryder System, Inc. | 2,089 | 188,720 | ||||||
Total Common Stocks & Other Equity Interests |
| 705,861,525 | ||||||
Money Market Funds–1.14% |
| |||||||
Liquid Assets Portfolio–Institutional Class(e) | 4,088,428 | 4,088,428 | ||||||
Premier Portfolio–Institutional Class(e) | 4,088,429 | 4,088,429 | ||||||
Total Money Market Funds |
| 8,176,857 | ||||||
TOTAL INVESTMENTS–99.84% |
| 714,038,382 | ||||||
OTHER ASSETS LESS LIABILITIES–0.16% | 1,122,326 | |||||||
NET ASSETS–100.00% |
| $ | 715,160,708 | |||||
Investment Abbreviations:
| REIT | – Real Estate Investment Trust |
Notes to Schedule of Investments:
| (a) | Industry and/or sector classifications used in this report are generally according to the Global Industry Classification Standard, which was developed by and is the exclusive property and a service mark of MSCI Inc. and Standard & Poor’s. |
| (b) | Non-income producing security. |
| (c) | The Fund’s Adviser is a subsidiary of Invesco Ltd. and therefore, Invesco Ltd. is considered to be affiliated with the Fund. See Note 5. |
| (d) | All or a portion of the value was pledged as collateral to cover margin requirements for open futures contracts. See Note 1I and Note 4. |
| (e) | The money market fund and the Fund are affiliated by having the same investment adviser. |
See accompanying Notes to Financial Statements which are an integral part of the financial statements.
16 Invesco S&P 500 Index Fund
Statement of Assets and Liabilities
August 31, 2014
Assets: | ||||
Investments, at value (Cost $330,388,919) | $ | 705,159,036 | ||
Investments in affiliates, at value (Cost $8,574,950) | 8,879,346 | |||
Total investments, at value (Cost $338,963,869) | 714,038,382 | |||
Receivable for: | ||||
Variation margin — futures contracts | 22,418 | |||
Fund shares sold | 1,366,546 | |||
Dividends | 1,493,730 | |||
Investment for trustee deferred compensation and retirement plans | 65,511 | |||
Other assets | 27,082 | |||
Total assets | 717,013,669 | |||
Liabilities: |
| |||
Payable for: | ||||
Fund shares reacquired | 1,068,668 | |||
Accrued fees to affiliates | 636,815 | |||
Accrued trustees’ and officers’ fees and benefits | 4,082 | |||
Accrued other operating expenses | 67,212 | |||
Trustee deferred compensation and retirement plans | 76,184 | |||
Total liabilities | 1,852,961 | |||
Net assets applicable to shares outstanding | $ | 715,160,708 | ||
Net assets consist of: |
| |||
Shares of beneficial interest | $ | 405,924,318 | ||
Undistributed net investment income | 5,900,382 | |||
Undistributed net realized gain (loss) | (71,926,942 | ) | ||
Net unrealized appreciation | 375,262,950 | |||
| $ | 715,160,708 | |||
Net Assets: | ||||
Class A | $ | 557,688,093 | ||
Class B | $ | 8,149,798 | ||
Class C | $ | 124,452,389 | ||
Class Y | $ | 24,870,428 | ||
Shares outstanding, $0.01 par value per share, |
| |||
Class A | 25,706,858 | |||
Class B | 383,785 | |||
Class C | 5,928,533 | |||
Class Y | 1,133,526 | |||
Class A: | ||||
Net asset value per share | $ | 21.69 | ||
Maximum offering price per share | ||||
(Net asset value of $21.69 ¸ 94.50%) | $ | 22.95 | ||
Class B: | ||||
Net asset value and offering price per share | $ | 21.24 | ||
Class C: | ||||
Net asset value and offering price per share | $ | 20.99 | ||
Class Y: | ||||
Net asset value and offering price per share | $ | 21.94 | ||
See accompanying Notes to Financial Statements which are an integral part of the financial statements.
17 Invesco S&P 500 Index Fund
Statement of Operations
For the year ended August 31, 2014
Investment income: |
| |||
Dividends (net of foreign withholding taxes of $1,240) | $ | 13,464,321 | ||
Dividends from affiliates | 19,693 | |||
Total investment income | 13,484,014 | |||
Expenses: | ||||
Advisory fees | 794,449 | |||
Administrative services fees | 167,269 | |||
Custodian fees | 21,910 | |||
Distribution fees: | ||||
Class A | 1,272,300 | |||
Class B | 95,464 | |||
Class C | 1,094,929 | |||
Transfer agent fees | 935,608 | |||
Trustees’ and officers’ fees and benefits | 43,593 | |||
Other | 325,610 | |||
Total expenses | 4,751,132 | |||
Less: Fees waived and expense offset arrangement(s) | (10,074 | ) | ||
Net expenses | 4,741,058 | |||
Net investment income | 8,742,956 | |||
Realized and unrealized gain from: | ||||
Net realized gain from: | ||||
Investment securities | 10,803,147 | |||
Futures contracts | 1,041,848 | |||
| 11,844,995 | ||||
Change in net unrealized appreciation of: | ||||
Investment securities | 120,759,527 | |||
Futures contracts | 270,294 | |||
| 121,029,821 | ||||
Net realized and unrealized gain | 132,874,816 | |||
Net increase in net assets resulting from operations | $ | 141,617,772 | ||
See accompanying Notes to Financial Statements which are an integral part of the financial statements.
18 Invesco S&P 500 Index Fund
Statement of Changes in Net Assets
For the years ended August 31, 2014 and 2013
| 2014 | 2013 | |||||||
Operations: |
| |||||||
Net investment income | $ | 8,742,956 | $ | 8,488,186 | ||||
Net realized gain | 11,844,995 | 3,025,005 | ||||||
Change in net unrealized appreciation | 121,029,821 | 79,565,143 | ||||||
Net increase in net assets resulting from operations | 141,617,772 | 91,078,334 | ||||||
Distributions to shareholders from net investment income: | ||||||||
Class A | (7,179,915 | ) | (7,761,631 | ) | ||||
Class B | (81,335 | ) | (194,940 | ) | ||||
Class C | (813,327 | ) | (920,398 | ) | ||||
Class Y | (436,370 | ) | (330,633 | ) | ||||
Total distributions from net investment income | (8,510,947 | ) | (9,207,602 | ) | ||||
Share transactions–net: | ||||||||
Class A | (14,239,028 | ) | (8,062,305 | ) | ||||
Class B | (4,900,844 | ) | (11,116,271 | ) | ||||
Class C | 10,893,429 | 611,425 | ||||||
Class Y | (2,285,605 | ) | 5,284,880 | |||||
Net increase (decrease) in net assets resulting from share transactions | (10,532,048 | ) | (13,282,271 | ) | ||||
Net increase in net assets | 122,574,777 | 68,588,461 | ||||||
Net assets: | ||||||||
Beginning of year | 592,585,931 | 523,997,470 | ||||||
End of year (includes undistributed net investment income of $5,900,382 and $5,590,262, respectively) | $ | 715,160,708 | $ | 592,585,931 | ||||
Notes to Financial Statements
August 31, 2014
NOTE 1—Significant Accounting Policies
Invesco S&P 500 Index Fund (the “Fund”) is a series portfolio of AIM Counselor Series Trust (Invesco Counselor Series Trust) (the “Trust”). The Trust is a Delaware statutory trust registered under the Investment Company Act of 1940, as amended (the “1940 Act”), as an open-end series management investment company consisting of thirteen separate portfolios, each authorized to issue an unlimited number of shares of beneficial interest. The assets, liabilities and operations of each portfolio are accounted for separately. Information presented in these financial statements pertains only to the Fund. Matters affecting each portfolio or class will be voted on exclusively by the shareholders of such portfolio or class.
The Fund’s investment objective is total return through growth of capital and current income.
The Fund currently consists of four different classes of shares: Class A, Class B, Class C and Class Y. Class A shares are sold with a front-end sales charge unless certain waiver criteria are met and under certain circumstances load waived shares may be subject to contingent deferred sales charges (“CDSC”). Class C shares are sold with a CDSC. Class Y shares are sold at net asset value. Effective November 30, 2010, new or additional investments in Class B shares are no longer permitted. Existing shareholders of Class B shares may continue to reinvest dividends and capital gains distributions in Class B shares until they convert to Class A shares. Also, shareholders in Class B shares will be able to exchange those shares for Class B shares of other Invesco Funds offering such shares until they convert to Class A shares. Generally, Class B shares will automatically convert to Class A shares on or about the month-end, which is at least eight years after the date of purchase. Redemption of Class B shares prior to conversion date will be subject to a CDSC.
The following is a summary of the significant accounting policies followed by the Fund in the preparation of its financial statements.
| A. | Security Valuations — Securities, including restricted securities, are valued according to the following policy. |
A security listed or traded on an exchange (except convertible securities) is valued at its last sales price or official closing price as of the close of the customary trading session on the exchange where the security is principally traded, or lacking any sales or official closing price on a particular day, the security may be valued at the closing bid price on that day. Securities traded in the over-the-counter market are valued based on prices furnished by independent pricing services or market makers. When such securities are valued by an independent pricing service they may be considered fair valued. Futures contracts are valued at the final settlement price set by an exchange on which they are principally traded. Listed options are valued at the mean between the last bid and ask prices from the exchange on which they are principally traded. Options not listed on an exchange are valued by an independent source at the mean between the last bid and ask prices. For purposes of determining net asset value per share, futures and option contracts generally are valued 15 minutes after the close of the customary trading session of the New York Stock Exchange (“NYSE”).
19 Invesco S&P 500 Index Fund
Investments in open-end and closed-end registered investment companies that do not trade on an exchange are valued at the end of day net asset value per share. Investments in open-end and closed-end registered investment companies that trade on an exchange are valued at the last sales price or official closing price as of the close of the customary trading session on the exchange where the security is principally traded.
Debt obligations (including convertible securities) and unlisted equities are fair valued using an evaluated quote provided by an independent pricing service. Evaluated quotes provided by the pricing service may be determined without exclusive reliance on quoted prices, and may reflect appropriate factors such as institution-size trading in similar groups of securities, developments related to specific securities, dividend rate (for unlisted equities), yield (for debt obligations), quality, type of issue, coupon rate (for debt obligations), maturity (for debt obligations), individual trading characteristics and other market data. Debt obligations are subject to interest rate and credit risks. In addition, all debt obligations involve some risk of default with respect to interest and/or principal payments.
Foreign securities’ (including foreign exchange contracts) prices are converted into U.S. dollar amounts using the applicable exchange rates as of the close of the NYSE. If market quotations are available and reliable for foreign exchange-traded equity securities, the securities will be valued at the market quotations. Because trading hours for certain foreign securities end before the close of the NYSE, closing market quotations may become unreliable. If between the time trading ends on a particular security and the close of the customary trading session on the NYSE, events occur that the Adviser determines are significant and make the closing price unreliable, the Fund may fair value the security. If the event is likely to have affected the closing price of the security, the security will be valued at fair value in good faith using procedures approved by the Board of Trustees. Adjustments to closing prices to reflect fair value may also be based on a screening process of an independent pricing service to indicate the degree of certainty, based on historical data, that the closing price in the principal market where a foreign security trades is not the current value as of the close of the NYSE. Foreign securities’ prices meeting the approved degree of certainty that the price is not reflective of current value will be priced at the indication of fair value from the independent pricing service. Multiple factors may be considered by the independent pricing service in determining adjustments to reflect fair value and may include information relating to sector indices, American Depositary Receipts and domestic and foreign index futures. Foreign securities may have additional risks including exchange rate changes, potential for sharply devalued currencies and high inflation, political and economic upheaval, the relative lack of issuer information, relatively low market liquidity and the potential lack of strict financial and accounting controls and standards.
Securities for which market prices are not provided by any of the above methods may be valued based upon quotes furnished by independent sources. The last bid price may be used to value equity securities. The mean between the last bid and asked prices is used to value debt obligations, including corporate loans.
Securities for which market quotations are not readily available or became unreliable are valued at fair value as determined in good faith by or under the supervision of the Trust’s officers following procedures approved by the Board of Trustees. Issuer specific events, market trends, bid/ask quotes of brokers and information providers and other market data may be reviewed in the course of making a good faith determination of a security’s fair value.
The Fund may invest in securities that are subject to interest rate risk, meaning the risk that the prices will generally fall as interest rates rise and, conversely, the prices will generally rise as interest rates fall. Specific securities differ in their sensitivity to changes in interest rates depending on their individual characteristics. Changes in interest rates may result in increased market volatility, which may affect the value and/or liquidity of certain of the Fund’s investments.
Valuations change in response to many factors including the historical and prospective earnings of the issuer, the value of the issuer’s assets, general economic conditions, interest rates, investor perceptions and market liquidity. Because of the inherent uncertainties of valuation, the values reflected in the financial statements may materially differ from the value received upon actual sale of those investments.
| B. | Securities Transactions and Investment Income — Securities transactions are accounted for on a trade date basis. Realized gains or losses on sales are computed on the basis of specific identification of the securities sold. Interest income (net of withholding tax, if any) is recorded on the accrual basis from settlement date. Dividend income (net of withholding tax, if any) is recorded on the ex-dividend date. |
The Fund may periodically participate in litigation related to Fund investments. As such, the Fund may receive proceeds from litigation settlements. Any proceeds received are included in the Statement of Operations as realized gain (loss) for investments no longer held and as unrealized gain (loss) for investments still held.
Brokerage commissions and mark ups are considered transaction costs and are recorded as an increase to the cost basis of securities purchased and/or a reduction of proceeds on a sale of securities. Such transaction costs are included in the determination of net realized and unrealized gain (loss) from investment securities reported in the Statement of Operations and the Statement of Changes in Net Assets and the net realized and unrealized gains (losses) on securities per share in the Financial Highlights. Transaction costs are included in the calculation of the Fund’s net asset value and, accordingly, they reduce the Fund’s total returns. These transaction costs are not considered operating expenses and are not reflected in net investment income reported in the Statement of Operations and Statement of Changes in Net Assets, or the net investment income per share and ratios of expenses and net investment income reported in the Financial Highlights, nor are they limited by any expense limitation arrangements between the Fund and the investment adviser.
The Fund allocates income and realized and unrealized capital gains and losses to a class based on the relative net assets of each class.
| C. | Country Determination — For the purposes of making investment selection decisions and presentation in the Schedule of Investments, the investment adviser may determine the country in which an issuer is located and/or credit risk exposure based on various factors. These factors include the laws of the country under which the issuer is organized, where the issuer maintains a principal office, the country in which the issuer derives 50% or more of its total revenues and the country that has the primary market for the issuer’s securities, as well as other criteria. Among the other criteria that may be evaluated for making this determination are the country in which the issuer maintains 50% or more of its assets, the type of security, financial guarantees and enhancements, the nature of the collateral and the sponsor organization. Country of issuer and/or credit risk exposure has been determined to be the United States of America, unless otherwise noted. |
| D. | Distributions — Distributions from net investment income and net realized capital gain, if any, are generally declared and paid annually and recorded on the ex-dividend date. The Fund may elect to treat a portion of the proceeds from redemptions as distributions for federal income tax purposes. |
| E. | Federal Income Taxes — The Fund intends to comply with the requirements of Subchapter M of the Internal Revenue Code of 1986, as amended (the “Internal Revenue Code”), necessary to qualify as a regulated investment company and to distribute substantially all of the Fund’s |
20 Invesco S&P 500 Index Fund
| taxable earnings to shareholders. As such, the Fund will not be subject to federal income taxes on otherwise taxable income (including net realized capital gain) that is distributed to shareholders. Therefore, no provision for federal income taxes is recorded in the financial statements. |
The Fund recognizes the tax benefits of uncertain tax positions only when the position is more likely than not to be sustained. Management has analyzed the Fund’s uncertain tax positions and concluded that no liability for unrecognized tax benefits should be recorded related to uncertain tax positions. Management is not aware of any tax positions for which it is reasonably possible that the total amounts of unrecognized tax benefits will change materially in the next 12 months.
The Fund files tax returns in the U.S. Federal jurisdiction and certain other jurisdictions. Generally, the Fund is subject to examinations by such taxing authorities for up to three years after the filing of the return for the tax period.
| F. | Expenses — Fees provided for under the Rule 12b-1 plan of a particular class of the Fund and which are directly attributable to that class are charged to the operations of such class. All other expenses are allocated among the classes based on relative net assets. |
| G. | Accounting Estimates — The preparation of financial statements in conformity with accounting principles generally accepted in the United States of America (“GAAP”) requires management to make estimates and assumptions that affect the reported amounts of assets and liabilities at the date of the financial statements and the reported amounts of revenues and expenses during the reporting period including estimates and assumptions related to taxation. Actual results could differ from those estimates by a significant amount. In addition, the Fund monitors for material events or transactions that may occur or become known after the period-end date and before the date the financial statements are released to print. |
| H. | Indemnifications — Under the Trust’s organizational documents, each Trustee, officer, employee or other agent of the Trust is indemnified against certain liabilities that may arise out of the performance of their duties to the Fund. Additionally, in the normal course of business, the Fund enters into contracts, including the Fund’s servicing agreements, that contain a variety of indemnification clauses. The Fund’s maximum exposure under these arrangements is unknown as this would involve future claims that may be made against the Fund that have not yet occurred. The risk of material loss as a result of such indemnification claims is considered remote. |
| I. | Futures Contracts — The Fund may enter into futures contracts to manage exposure to interest rate, equity and market price movements and/or currency risks. A futures contract is an agreement between two parties to purchase or sell a specified underlying security, currency or commodity (or delivery of a cash settlement price, in the case of an index future) for a fixed price at a future date. The Fund currently invests only in exchange-traded futures and they are standardized as to maturity date and underlying financial instrument. Initial margin deposits required upon entering into futures contracts are satisfied by the segregation of specific securities or cash as collateral at the futures commission merchant (broker). During the period the futures contracts are open, changes in the value of the contracts are recognized as unrealized gains or losses by recalculating the value of the contracts on a daily basis. Subsequent or variation margin payments are received or made depending upon whether unrealized gains or losses are incurred. These amounts are reflected as receivables or payables on the Statement of Assets and Liabilities. When the contracts are closed or expire, the Fund recognizes a realized gain or loss equal to the difference between the proceeds from, or cost of, the closing transaction and the Fund’s basis in the contract. The net realized gain (loss) and the change in unrealized gain (loss) on futures contracts held during the period is included on the Statement of Operations. The primary risks associated with futures contracts are market risk and the absence of a liquid secondary market. If the Fund were unable to liquidate a futures contract and/or enter into an offsetting closing transaction, the Fund would continue to be subject to market risk with respect to the value of the contracts and continue to be required to maintain the margin deposits on the futures contracts. Futures contracts have minimal counterparty risk since the exchange’s clearinghouse, as counterparty to all exchange-traded futures, guarantees the futures against default. Risks may exceed amounts recognized in the Statement of Assets and Liabilities. |
| J. | Collateral — To the extent the Fund has designated or segregated a security as collateral and that security is subsequently sold, it is the Fund’s practice to replace such collateral no later than the next business day. |
NOTE 2—Advisory Fees and Other Fees Paid to Affiliates
The Trust has entered into a master investment advisory agreement with Invesco Advisers, Inc. (the “Adviser” or “Invesco”). Under the terms of the investment advisory agreement, the Fund pays an advisory fee to the Adviser based on the annual rate of the Fund’s average daily net assets as follows:
| Average Daily Net Assets | Rate | |||
First $2 billion | 0.12% | |||
Over $2 billion | 0.10% | |||
Under the terms of a master sub-advisory agreement between the Adviser and each of Invesco Asset Management Deutschland GmbH, Invesco Asset Management Limited, Invesco Asset Management (Japan) Limited, Invesco Australia Limited, Invesco Hong Kong Limited, Invesco Senior Secured Management, Inc. and Invesco Canada Ltd. (collectively, the “Affiliated Sub-Advisers”) the Adviser, not the Fund, may pay 40% of the fees paid to the Adviser to any such Affiliated Sub-Adviser(s) that provide(s) discretionary investment management services to the Fund based on the percentage of assets allocated to such Sub-Adviser(s).
The Adviser has contractually agreed, through at least June 30, 2015, to waive advisory fees and/or reimburse expenses to the extent necessary to limit total annual fund operating expenses after fee waiver and/or reimbursement (excluding certain items discussed below) of Class A, Class B, Class C and Class Y shares to 2.00%, 2.75%, 2.75% and 1.75% of average daily net assets, respectively. In determining the Adviser’s obligation to waive advisory fees and/or reimburse expenses, the following expenses are not taken into account, and could cause total annual fund operating expenses after fee waiver and/or reimbursement to exceed the numbers reflected above: (1) interest; (2) taxes; (3) dividend expense on short sales; (4) extraordinary or non-routine items, including litigation expenses; and (5) expenses that the Fund has incurred but did not actually pay because of an expense offset arrangement. Unless Invesco continues the fee waiver agreement, it will terminate on June 30, 2015. The fee waiver agreement cannot be terminated during its term. The Adviser did not waive fees and/or reimburse expenses during the period under this expense limitation.
21 Invesco S&P 500 Index Fund
Further, the Adviser has contractually agreed, through at least June 30, 2016, to waive the advisory fee payable by the Fund in an amount equal to 100% of the net advisory fees the Adviser receives from the affiliated money market funds on investments by the Fund of uninvested cash in such affiliated money market funds.
For the year ended August 31, 2014, the Adviser waived advisory fees of $9,454.
The Trust has entered into a master administrative services agreement with Invesco pursuant to which the Fund has agreed to pay Invesco for certain administrative costs incurred in providing accounting services to the Fund. For the year ended August 31, 2014, expenses incurred under the agreement are shown in the Statement of Operations as Administrative services fees.
The Trust has entered into a transfer agency and service agreement with Invesco Investment Services, Inc. (“IIS”) pursuant to which the Fund has agreed to pay IIS a fee for providing transfer agency and shareholder services to the Fund and reimburse IIS for certain expenses incurred by IIS in the course of providing such services. IIS may make payments to intermediaries that provide omnibus account services, sub-accounting services and/or networking services. All fees payable by IIS to intermediaries that provide omnibus account services or sub-accounting are charged back to the Fund, subject to certain limitations approved by the Trust’s Board of Trustees. For the year ended August 31, 2014, the expenses incurred under the agreement are shown in the Statement of Operations as Transfer agent fees.
Shares of the Fund are distributed by Invesco Distributors, Inc. (“IDI”), an affiliate of the Adviser. The Fund has adopted a Plan of Distribution (the “Plan”) pursuant to Rule 12b-1 under the 1940 Act. The Plan provides that the Fund will reimburse IDI for distribution related expenses that IDI incurs up to a maximum of the following annual rates: (1) Class A — up to 0.25% of the average daily net assets of Class A shares; (2) Class B — up to 1.00% of the average daily net assets of Class B shares; and (3) Class C — up to 1.00% of the average daily net assets of Class C shares.
In the case of Class B shares, provided that the Plan continues in effect, any cumulative expenses incurred by IDI, but not yet reimbursed to IDI, may be recovered through the payment of future distribution fees from the Fund pursuant to the Plan and contingent deferred sales charges paid by investors upon redemption of Class B shares.
For the year ended August 31, 2014, expenses incurred under these agreements are shown in the Statement of Operations as Distribution fees.
Front-end sales commissions and CDSC (collectively, the “sales charges”) are not recorded as expenses of the Fund. Front-end sales commissions are deducted from proceeds from the sales of Fund shares prior to investment in Class A shares of the Fund. CDSC are deducted from redemption proceeds prior to remittance to the shareholder. During the year ended August 31, 2014, IDI advised the Fund that IDI retained $54,556 in front-end sales commissions from the sale of Class A shares and $0, $5,002 and $10,341 from Class A, Class B and Class C shares, respectively, for CDSC imposed on redemptions by shareholders.
Certain officers and trustees of the Trust are officers and directors of the Adviser, IIS and/or IDI.
NOTE 3—Additional Valuation Information
GAAP defines fair value as the price that would be received to sell an asset or paid to transfer a liability in an orderly transaction between market participants at the measurement date, under current market conditions. GAAP establishes a hierarchy that prioritizes the inputs to valuation methods, giving the highest priority to readily available unadjusted quoted prices in an active market for identical assets (Level 1) and the lowest priority to significant unobservable inputs (Level 3), generally when market prices are not readily available or are unreliable. Based on the valuation inputs, the securities or other investments are tiered into one of three levels. Changes in valuation methods may result in transfers in or out of an investment’s assigned level:
| Level 1 — | Prices are determined using quoted prices in an active market for identical assets. |
| Level 2 — | Prices are determined using other significant observable inputs. Observable inputs are inputs that other market participants may use in pricing a security. These may include quoted prices for similar securities, interest rates, prepayment speeds, credit risk, yield curves, loss severities, default rates, discount rates, volatilities and others. |
| Level 3 — | Prices are determined using significant unobservable inputs. In situations where quoted prices or observable inputs are unavailable (for example, when there is little or no market activity for an investment at the end of the period), unobservable inputs may be used. Unobservable inputs reflect the Fund’s own assumptions about the factors market participants would use in determining fair value of the securities or instruments and would be based on the best available information. |
The following is a summary of the tiered valuation input levels, as of August 31, 2014. The level assigned to the securities valuations may not be an indication of the risk or liquidity associated with investing in those securities. Because of the inherent uncertainties of valuation, the values reflected in the financial statements may materially differ from the value received upon actual sale of those investments.
| Level 1 | Level 2 | Level 3 | Total | |||||||||||||
Equity Securities | $ | 714,038,382 | $ | — | $ | — | $ | 714,038,382 | ||||||||
Futures Contracts* | 188,437 | — | — | 188,437 | ||||||||||||
Total Investments | $ | 714,226,819 | $ | — | $ | — | $ | 714,226,819 | ||||||||
| * | Unrealized appreciation. |
NOTE 4—Derivative Investments
Value of Derivative Investments at Period-End
The table below summarizes the value of the Fund’s derivative investments, detailed by primary risk exposure, held as of August 31, 2014:
| Value | ||||||||
| Risk Exposure/Derivative Type | Assets | Liabilities | ||||||
Market Risk: | ||||||||
Futures Contracts(a) | $ | 188,437 | $ | — | ||||
| (a) | Includes cumulative appreciation (depreciation) of futures contracts. Only current day’s variation margin receivable (payable) is reported within the Statement of Assets and Liabilities. |
22 Invesco S&P 500 Index Fund
Effect of Derivative Investments for the year ended August 31, 2014
The table below summarizes the gains on derivative investments, detailed by primary risk exposure, recognized in earnings during the period:
| Location of Gain on Statement of Operations | ||||
| Futures Contracts | ||||
Realized Gain: | ||||
Market Risk | $ | 1,041,848 | ||
Change in Unrealized Appreciation: | ||||
Market Risk | 270,294 | |||
Total | $ | 1,312,142 | ||
The table below summarizes the average notional value of futures contracts outstanding during the period.
| Futures Contracts | ||||
Average notional value | $ | 8,229,264 | ||
| Open Futures Contracts at Period-End | ||||||||||||||||||||
| Futures Contracts—Market Risk | Type of Contract | Number of Contracts | Expiration Month | Notional Value | Unrealized Appreciation | |||||||||||||||
E-Mini S&P 500 Index | Long | 96 | September-2014 | $ | 9,606,720 | $ | 188,437 | |||||||||||||
Offsetting Assets and Liabilities
Accounting Standards Update (“ASU”) No. 2011-11, Disclosures about Offsetting Assets and Liabilities, which was subsequently clarified in Financial Accounting Standards Board ASU 2013-01 “Clarifying the Scope of Disclosures about Offsetting Assets and Liabilities” is intended to enhance disclosures about financial instruments and derivative instruments that are subject to offsetting arrangements on the Statement of Assets and Liabilities and to enable investors to better understand the effect of those arrangements on its financial position. In order for an arrangement to be eligible for netting, the Fund must have a basis to conclude that such netting arrangements are legally enforceable. The Fund enters into netting agreements and collateral agreements in an attempt to reduce the Fund’s Counterparty credit risk by providing for a single net settlement with a Counterparty of all financial transactions covered by the agreement in an event of default as defined under such agreement.
There were no derivative instruments subject to a netting agreement for which the Fund is not currently netting. The following tables present derivative instruments that are either subject to an enforceable netting agreement or offset by collateral arrangements as of August 31, 2014.
| Assets: | ||||||||||||||||||||||||
| Gross amounts presented in Statement of Assets & Liabilities(a) | Gross amounts offset in Statement of Assets & Liabilities | Net amounts of assets presented in Statement of Assets and Liabilities | Collateral Received | |||||||||||||||||||||
| Counterparty | Financial Instruments | Cash | Net Amount | |||||||||||||||||||||
Goldman Sachs & Co. | $ | 188,437 | $ | — | $ | 188,437 | $ | — | $ | — | $ | 188,437 | ||||||||||||
| (a) | Includes cumulative appreciation (depreciation) of futures contracts. |
NOTE 5—Investments in Affiliates
The Fund’s Adviser is a subsidiary of Invesco Ltd. and therefore, Invesco Ltd. is considered to be affiliated with the Fund. The following is a summary of the transactions in, and earnings from, investments in Invesco Ltd. for the year ended August 31, 2014.
Value 08/31/13 | Purchases at Cost | Proceeds from Sales | Change in Unrealized Appreciation | Realized Gain | Value 08/31/14 | Dividend Income | ||||||||||||||||||||||
Invesco Ltd. | $ | 544,689 | $ | 3,724 | $ | (29,441 | ) | $ | 176,784 | $ | 6,733 | $ | 702,489 | $ | 16,563 | |||||||||||||
NOTE 6—Expense Offset Arrangement(s)
The expense offset arrangement is comprised of transfer agency credits which result from balances in demand deposit accounts used by the transfer agent for clearing shareholder transactions. For the year ended August 31, 2014, the Fund received credits from this arrangement, which resulted in the reduction of the Fund’s total expenses of $620.
NOTE 7—Trustees’ and Officers’ Fees and Benefits
Trustees’ and Officers’ Fees and Benefits include amounts accrued by the Fund to pay remuneration to certain Trustees and Officers of the Fund. Trustees have the option to defer compensation payable by the Fund, and Trustees’ and Officers’ Fees and Benefits also include amounts accrued by the Fund to fund such deferred compensation amounts. Those Trustees who defer compensation have the option to select various Invesco Funds in which their deferral accounts shall be deemed to be invested. Finally, certain current Trustees were eligible to participate in a retirement plan that provided for benefits to be paid upon retirement to Trustees over a period of time based on the number of years of service. The Fund may have certain former Trustees who also participate in a retirement plan and receive benefits under such plan. Trustees’ and Officers’ Fees and Benefits include amounts accrued by the Fund to fund such retirement benefits. Obligations under the deferred compensation and retirement plans represent unsecured claims against the general assets of the Fund.
23 Invesco S&P 500 Index Fund
NOTE 8—Cash Balances
The Fund is permitted to temporarily carry a negative or overdrawn balance in its account with State Street Bank and Trust Company, the custodian bank. Such balances, if any at period end, are shown in the Statement of Assets and Liabilities under the payable caption Amount due custodian. To compensate the custodian bank for such overdrafts, the overdrawn Fund may either (1) leave funds as a compensating balance in the account so the custodian bank can be compensated by earning the additional interest; or (2) compensate by paying the custodian bank at a rate agreed upon by the custodian bank and Invesco, not to exceed the contractually agreed upon rate.
NOTE 9—Distributions to Shareholders and Tax Components of Net Assets
Tax Character of Distributions to Shareholders Paid During the Years Ended August 31, 2014 and 2013:
| 2014 | 2013 | |||||||
Ordinary income | $ | 8,510,947 | $ | 9,207,602 | ||||
Tax Components of Net Assets at Period-End:
| 2014 | ||||
Undistributed ordinary income | $ | 5,968,802 | ||
Net unrealized appreciation — investments | 351,222,032 | |||
Temporary book/tax differences | (68,420 | ) | ||
Capital loss carryforward | (47,886,024 | ) | ||
Shares of beneficial interest | 405,924,318 | |||
Total net assets | $ | 715,160,708 | ||
The difference between book-basis and tax-basis unrealized appreciation (depreciation) is due to differences in the timing of recognition of gains and losses on investments for tax and book purposes. The Fund’s net unrealized appreciation difference is attributable primarily to wash sales.
The temporary book/tax differences are a result of timing differences between book and tax recognition of income and/or expenses. The Fund’s temporary book/tax differences are the result of the trustee deferral of compensation and retirement plan benefits.
Capital loss carryforward is calculated and reported as of a specific date. Results of transactions and other activity after that date may affect the amount of capital loss carryforward actually available for the Fund to utilize. Capital losses generated in years beginning after December 22, 2010 can be carried forward for an unlimited period, whereas previous losses expire in 8 tax years. Capital losses with an expiration period may not be used to offset capital gains until all net capital losses without an expiration date have been utilized. Capital loss carryforwards with no expiration date will retain their character as either short-term or long-term capital losses instead of as short-term capital losses as under prior law. The ability to utilize capital loss carryforward in the future may be limited under the Internal Revenue Code and related regulations based on the results of future transactions.
The Fund utilized $8,172,733 of capital loss carryforward in the current period to offset net realized capital gain for federal income tax purposes. The Fund has a capital loss carryforward as of August 31, 2014, which expires as follows:
| Capital Loss Carryforward* | ||||||||||||
| Expiration | Short-Term | Long-Term | Total | |||||||||
August 31, 2017 | $ | 12,322,416 | $ | — | $ | 12,322,416 | ||||||
August 31, 2018 | 19,847,353 | — | 19,847,353 | |||||||||
August 31, 2019 | 10,267,726 | — | 10,267,726 | |||||||||
Not subject to expiration | — | 5,448,529 | 5,448,529 | |||||||||
| $ | 42,437,495 | $ | 5,448,529 | $ | 47,886,024 | |||||||
| * | Capital loss carryforward as of the date listed above is reduced for limitations, if any, to the extent required by the Internal Revenue Code and may be further limited depending upon a variety of factors, including the realization of net unrealized gains or losses as of the date of any reorganization. |
NOTE 10—Investment Securities
The aggregate amount of investment securities (other than short-term securities, U.S. Treasury obligations and money market funds, if any) purchased and sold by the Fund during the year ended August 31, 2014 was $28,274,992 and $39,906,166, respectively. Cost of investments on a tax basis includes the adjustments for financial reporting purposes as of the most recently completed federal income tax reporting period-end.
| Unrealized Appreciation (Depreciation) of Investment Securities on a Tax Basis | ||||
Aggregate unrealized appreciation of investment securities | $ | 356,689,090 | ||
Aggregate unrealized (depreciation) of investment securities | (5,467,058 | ) | ||
Net unrealized appreciation of investment securities | $ | 351,222,032 | ||
Cost of investments for tax purposes is $362,816,350.
24 Invesco S&P 500 Index Fund
NOTE 11—Reclassification of Permanent Differences
Primarily as a result of differing book/tax treatment of fair fund settlements, real estate investment trusts distributions and return of capital dividends, on August 31, 2014, undistributed net investment income was increased by $78,111, undistributed net realized gain (loss) was decreased by $87,374 and shares of beneficial interest was increased by $9,263. This reclassification had no effect on the net assets of the Fund.
NOTE 12—Share Information
| Summary of Share Activity | ||||||||||||||||
| Years ended August 31, | ||||||||||||||||
| 2014(a) | 2013 | |||||||||||||||
| Shares | Amount | Shares | Amount | |||||||||||||
Sold: | ||||||||||||||||
Class A | 3,235,124 | $ | 64,183,686 | 3,609,161 | $ | 59,967,499 | ||||||||||
Class B | 42,427 | 815,218 | 48,627 | 807,977 | �� | |||||||||||
Class C | 1,352,961 | 26,035,607 | 879,159 | 14,382,285 | ||||||||||||
Class Y | 848,531 | 17,239,541 | 745,535 | 12,266,779 | ||||||||||||
Issued as reinvestment of dividends: | ||||||||||||||||
Class A | 341,048 | 6,486,732 | 466,707 | 7,079,950 | ||||||||||||
Class B | 3,781 | 70,771 | 11,362 | 169,870 | ||||||||||||
Class C | 39,586 | 732,740 | 56,433 | 834,081 | ||||||||||||
Class Y | 21,684 | 416,553 | 20,998 | 321,482 | ||||||||||||
Automatic conversion of Class B shares to Class A shares: | ||||||||||||||||
Class A | 196,646 | 3,877,345 | 604,257 | 9,883,567 | ||||||||||||
Class B | (200,486 | ) | (3,877,345 | ) | (615,612 | ) | (9,883,567 | ) | ||||||||
Reacquired: | ||||||||||||||||
Class A | (4,501,173 | ) | (88,786,791 | ) | (5,154,351 | ) | (84,993,321 | ) | ||||||||
Class B | (99,776 | ) | (1,909,488 | ) | (137,855 | ) | (2,210,551 | ) | ||||||||
Class C | (823,310 | ) | (15,874,918 | ) | (904,350 | ) | (14,604,941 | ) | ||||||||
Class Y | (998,411 | ) | (19,941,699 | ) | (445,668 | ) | (7,303,381 | ) | ||||||||
Net increase (decrease) in share activity | (541,368 | ) | $ | (10,532,048 | ) | (815,597 | ) | $ | (13,282,271 | ) | ||||||
| (a) | There are entities that are record owners of more than 5% of the outstanding shares of the Fund and own, in the aggregate, 61% of the outstanding shares of the Fund. IDI has an agreement with these entities to sell Fund shares. The Fund, Invesco and/or Invesco affiliates may make payments to these entities, which are considered to be related to the Fund, for providing services to the Fund, Invesco and/or Invesco affiliates including but not limited to services such as, securities brokerage, distribution, third party record keeping and account servicing. The Fund has no knowledge as to whether all or any portion of the shares owned of record by these entities are also owned beneficially. |
25 Invesco S&P 500 Index Fund
NOTE 13—Financial Highlights
The following schedule presents financial highlights for a share of the Fund outstanding throughout the periods indicated.
| Net asset value, beginning of period | Net investment income(a) | Net gains on securities (both realized and unrealized) | Total from investment operations | Dividends from net investment income | Net asset value, end of period | Total return(b) | Net assets, end of period (000’s omitted) | Ratio of expenses to average net assets with fee waivers and/or expenses absorbed | Ratio of expenses to average net assets without fee waivers and/or expenses absorbed | Ratio of net investment income to average net assets | Portfolio turnover(c) | |||||||||||||||||||||||||||||||||||||
Class A | ||||||||||||||||||||||||||||||||||||||||||||||||
Year ended 08/31/14 | $ | 17.67 | $ | 0.29 | $ | 4.01 | $ | 4.30 | $ | (0.28 | ) | $ | 21.69 | 24.54 | %(d) | $ | 557,688 | 0.59 | %(d)(e) | 0.59 | %(d)(e) | 1.45 | %(d)(e) | 5 | % | |||||||||||||||||||||||
Year ended 08/31/13 | 15.26 | 0.27 | 2.43 | 2.70 | (0.29 | ) | 17.67 | 18.04 | 467,234 | 0.62 | 0.62 | 1.64 | 6 | |||||||||||||||||||||||||||||||||||
Year ended 08/31/12 | 13.25 | 0.22 | 2.03 | 2.25 | (0.24 | ) | 15.26 | 17.26 | 410,772 | 0.65 | 0.67 | 1.55 | 3 | |||||||||||||||||||||||||||||||||||
Year ended 08/31/11 | 11.36 | 0.19 | 1.85 | 2.04 | (0.15 | ) | 13.25 | 17.94 | 369,597 | 0.61 | 0.61 | 1.42 | 4 | |||||||||||||||||||||||||||||||||||
Year ended 08/31/10 | 11.09 | 0.18 | 0.33 | 0.51 | (0.24 | ) | 11.36 | 4.44 | 335,583 | 0.60 | 0.69 | 1.47 | 7 | |||||||||||||||||||||||||||||||||||
Class B | ||||||||||||||||||||||||||||||||||||||||||||||||
Year ended 08/31/14 | 17.32 | 0.13 | 3.94 | 4.07 | (0.15 | ) | 21.24 | 23.60 | 8,150 | 1.35 | (e) | 1.35 | (e) | 0.69 | (e) | 5 | ||||||||||||||||||||||||||||||||
Year ended 08/31/13 | 14.96 | 0.14 | 2.40 | 2.54 | (0.18 | ) | 17.32 | 17.14 | 11,045 | 1.37 | 1.37 | 0.89 | 6 | |||||||||||||||||||||||||||||||||||
Year ended 08/31/12 | 12.92 | 0.11 | 2.01 | 2.12 | (0.08 | ) | 14.96 | 16.47 | 19,912 | 1.40 | 1.42 | 0.80 | 3 | |||||||||||||||||||||||||||||||||||
Year ended 08/31/11 | 11.10 | 0.09 | 1.80 | 1.89 | (0.07 | ) | 12.92 | 17.02 | 37,840 | 1.36 | 1.36 | 0.67 | 4 | |||||||||||||||||||||||||||||||||||
Year ended 08/31/10 | 10.83 | 0.08 | 0.33 | 0.41 | (0.14 | ) | 11.10 | 3.68 | 64,102 | 1.35 | 1.44 | 0.72 | 7 | |||||||||||||||||||||||||||||||||||
Class C | ||||||||||||||||||||||||||||||||||||||||||||||||
Year ended 08/31/14 | 17.12 | 0.13 | 3.89 | 4.02 | (0.15 | ) | 20.99 | 23.59 | 124,452 | 1.35 | (e) | 1.35 | (e) | 0.69 | (e) | 5 | ||||||||||||||||||||||||||||||||
Year ended 08/31/13 | 14.79 | 0.14 | 2.37 | 2.51 | (0.18 | ) | 17.12 | 17.14 | (f) | 91,761 | 1.36 | (f) | 1.36 | (f) | 0.90 | (f) | 6 | |||||||||||||||||||||||||||||||
Year ended 08/31/12 | 12.79 | 0.11 | 1.99 | 2.10 | (0.10 | ) | 14.79 | 16.50 | 78,797 | 1.40 | 1.42 | 0.80 | 3 | |||||||||||||||||||||||||||||||||||
Year ended 08/31/11 | 10.99 | 0.10 | 1.77 | 1.87 | (0.07 | ) | 12.79 | 17.01 | (f) | 68,753 | 1.27 | (f) | 1.27 | (f) | 0.76 | (f) | 4 | |||||||||||||||||||||||||||||||
Year ended 08/31/10 | 10.74 | 0.08 | 0.33 | 0.41 | (0.16 | ) | 10.99 | 3.71 | 66,933 | 1.35 | 1.44 | 0.72 | 7 | |||||||||||||||||||||||||||||||||||
Class Y | ||||||||||||||||||||||||||||||||||||||||||||||||
Year ended 08/31/14 | 17.87 | 0.34 | 4.05 | 4.39 | (0.32 | ) | 21.94 | 24.83 | 24,870 | 0.35 | (e) | 0.35 | (e) | 1.69 | (e) | 5 | ||||||||||||||||||||||||||||||||
Year ended 08/31/13 | 15.43 | 0.32 | 2.45 | 2.77 | (0.33 | ) | 17.87 | 18.33 | 22,546 | 0.37 | 0.37 | 1.89 | 6 | |||||||||||||||||||||||||||||||||||
Year ended 08/31/12 | 13.40 | 0.26 | 2.06 | 2.32 | (0.29 | ) | 15.43 | 17.64 | 14,518 | 0.40 | 0.42 | 1.80 | 3 | |||||||||||||||||||||||||||||||||||
Year ended 08/31/11 | 11.48 | 0.23 | 1.86 | 2.09 | (0.17 | ) | 13.40 | 18.21 | 16,824 | 0.36 | 0.36 | 1.67 | 4 | |||||||||||||||||||||||||||||||||||
Year ended 08/31/10 | 11.20 | 0.21 | 0.33 | 0.54 | (0.26 | ) | 11.48 | 4.72 | 23,168 | 0.35 | 0.44 | 1.72 | 7 | |||||||||||||||||||||||||||||||||||
| (a) | Calculated using average shares outstanding. |
| (b) | Includes adjustments in accordance with accounting principles generally accepted in the United States of America and as such, the net asset value for financial reporting purposes and the returns based upon those net asset values may differ from the net asset value and returns for shareholder transactions. Does not include sales charges and is not annualized for periods less than one year, if applicable. |
| (c) | Portfolio turnover is calculated at the fund level and is not annualized for periods less than one year, if applicable. |
| (d) | The total return, ratio of expenses to average net assets and ratio of net investment income to average net assets reflect actual 12b-1 fees of 0.24% for the year ended August 31, 2014. |
| (e) | Ratios are based on average daily net assets (000’s omitted) of $519,288, $9,546, $109,493 and $23,713 for Class A, Class B, Class C and Class Y shares, respectively. |
| (f) | The total return, ratio of expenses to average net assets and ratio of net investment income to average net assets reflect actual 12b-1 fees of 0.99% and 0.91% for the years ended August 31, 2013 and 2011, respectively. |
26 Invesco S&P 500 Index Fund
Report of Independent Registered Public Accounting Firm
To the Board of Trustees of AIM Counselor Series Trust (Invesco Counselor Series Trust)
and Shareholders of Invesco S&P 500 Index Fund:
In our opinion, the accompanying statement of assets and liabilities, including the schedule of investments, and the related statements of operations and of changes in net assets and the financial highlights present fairly, in all material respects, the financial position of Invesco S&P 500 Index Fund (one of the funds constituting AIM Counselor Series Trust (Invesco Counselor Series Trust), hereafter referred to as the “Fund”) at August 31, 2014, the results of its operations for the year then ended, the changes in its net assets for each of the two years in the period then ended and the financial highlights for each of the five years in the period then ended, in conformity with accounting principles generally accepted in the United States of America. These financial statements and financial highlights (hereafter referred to as “financial statements”) are the responsibility of the Fund’s management. Our responsibility is to express an opinion on these financial statements based on our audits. We conducted our audits of these financial statements in accordance with the standards of the Public Company Accounting Oversight Board (United States). Those standards require that we plan and perform the audit to obtain reasonable assurance about whether the financial statements are free of material misstatement. An audit includes examining, on a test basis, evidence supporting the amounts and disclosures in the financial statements, assessing the accounting principles used and significant estimates made by management, and evaluating the overall financial statement presentation. We believe that our audits, which included confirmation of securities at August 31, 2014 by correspondence with the custodian and brokers, provide a reasonable basis for our opinion.
PRICEWATERHOUSECOOPERS LLP
October 27, 2014
Houston, Texas
27 Invesco S&P 500 Index Fund
Calculating your ongoing Fund expenses
Example
As a shareholder of the Fund, you incur two types of costs: (1) transaction costs, which may include sales charges (loads) on purchase payments or contingent deferred sales charges on redemptions, if any; and (2) ongoing costs, including management fees, distribution and/or service (12b-1) fees, and other Fund expenses. This example is intended to help you understand your ongoing costs (in dollars) of investing in the Fund and to compare these costs with ongoing costs of investing in other mutual funds. The example is based on an investment of $1,000 invested at the beginning of the period and held for the entire period March 1, 2014 through August 31, 2014.
Actual expenses
The table below provides information about actual account values and actual expenses. You may use the information in this table, together with the amount you invested, to estimate the expenses that you paid over the period. Simply divide your account value by $1,000 (for example, an $8,600 account value divided by $1,000 = 8.6), then multiply the result by the number in the table under the heading entitled “Actual Expenses Paid During Period” to estimate the expenses you paid on your account during this period.
Hypothetical example for comparison purposes
The table below also provides information about hypothetical account values and hypothetical expenses based on the Fund’s actual expense ratio and an assumed rate of return of 5% per year before expenses, which is not the Fund’s actual return.
The hypothetical account values and expenses may not be used to estimate the actual ending account balance or expenses you paid for the period. You may use this information to compare the ongoing costs of investing in the Fund and other funds. To do so, compare this 5% hypothetical example with the 5% hypothetical examples that appear in the shareholder reports of the other funds.
Please note that the expenses shown in the table are meant to highlight your ongoing costs only and do not reflect any transaction costs, such as sales charges (loads) on purchase payments or contingent deferred sales charges on redemptions, if any. Therefore, the hypothetical information is useful in comparing ongoing costs only, and will not help you determine the relative total costs of owning different funds. In addition, if these transaction costs were included, your costs would have been higher.
| Class | Beginning Account Value | ACTUAL | HYPOTHETICAL (5% annual return before expenses) | Annualized Expense Ratio | ||||||||||||||||||||
Ending Account Value | Expenses Paid During | Ending Account Value (08/31/14) | Expenses Period2 | |||||||||||||||||||||
A | $ | 1,000.00 | $ | 1,085.00 | $ | 3.15 | $ | 1,022.18 | $ | 3.06 | 0.60 | % | ||||||||||||
B | 1,000.00 | 1,081.50 | 7.14 | 1,018.35 | 6.92 | 1.36 | ||||||||||||||||||
C | 1,000.00 | 1,080.80 | 7.13 | 1,018.35 | 6.92 | 1.36 | ||||||||||||||||||
Y | 1,000.00 | 1,086.70 | 1.89 | 1,023.39 | 1.84 | 0.36 | ||||||||||||||||||
| 1 | The actual ending account value is based on the actual total return of the Fund for the period March 1, 2014 through August 31, 2014, after actual expenses and will differ from the hypothetical ending account value which is based on the Fund’s expense ratio and a hypothetical annual return of 5% before expenses. |
| 2 | Expenses are equal to the Fund’s annualized expense ratio as indicated above multiplied by the average account value over the period, multiplied by 184/365 to reflect the most recent fiscal half year. |
28 Invesco S&P 500 Index Fund
Approval of Investment Advisory and Sub-Advisory Contracts
The Board of Trustees (the Board) of AIM Counselor Series Trust (Invesco Counselor Series Trust) is required under the Investment Company Act of 1940, as amended, to approve annually the renewal of Invesco S&P 500 Index Fund’s (the Fund) investment advisory agreements. During contract renewal meetings held on June 16-17, 2014, the Board as a whole, and the disinterested or “independent” Trustees, who comprise over 75% of the Board, voting separately, approved the continuance for the Fund of the Master Investment Advisory Agreement with Invesco Advisers, Inc. (Invesco Advisers) and the Master Intergroup Sub-Advisory Contract for Mutual Funds with Invesco Asset Management Deutschland GmbH, Invesco Asset Management Limited, Invesco Asset Management (Japan) Limited, Invesco Australia Limited, Invesco Hong Kong Limited, Invesco Senior Secured Management, Inc. and Invesco Canada Ltd. (collectively, the Affiliated Sub-Advisers and the sub-advisory contracts) for another year, effective July 1, 2014.
In evaluating the fairness and reasonableness of compensation under the Fund’s investment advisory agreement and sub-advisory contracts, the Board considered, among other things, the factors discussed below. The Board determined that the continuation of the Fund’s investment advisory agreement and the sub-advisory contracts are in the best interest of the Fund and its shareholders and that the compensation payable to Invesco Advisers and the Affiliated Sub-Advisers under the agreements is fair and reasonable.
The Board’s Fund Evaluation Process
The Board’s Investments Committee has established three Sub-Committees, each of which is primarily responsible for overseeing the management of a number of the funds advised by Invesco Advisers (the Invesco Funds). The Sub-Committees meet throughout the year to review the performance of their assigned Invesco Funds, including reviewing materials prepared under the direction of the independent Senior Officer, an officer of the Invesco Funds who reports directly to the independent Trustees. Over the course of each year, the Sub-Committees meet with portfolio managers for their assigned Invesco Funds and other members of management to review the performance, investment objective(s), policies, strategies, limitations and investment risks of these funds. The Sub-Committees meet regularly and at designated contract renewal meetings each year to conduct a review of the performance, fees, expenses and other matters related to their assigned Invesco Funds. Each Sub-Committee recommends to the Investments Committee, which in turn recommends to the full Board, whether and on what terms to approve the continuance of each Invesco Fund’s
investment advisory agreement and sub-advisory contracts for another year.
During the contract renewal process, the Trustees receive comparative performance and fee data regarding the Invesco Funds prepared by Invesco Advisers and Lipper Inc. (Lipper), an independent provider of investment company data. The Trustees also receive an independent written evaluation from the Senior Officer. The Senior Officer’s evaluation is prepared as part of his responsibility to manage the process by which the Invesco Funds’ proposed management fees are negotiated during the annual contract renewal process to ensure they are negotiated in a manner that is at arms’ length and reasonable. In addition to meetings with Invesco Advisers and fund counsel, the independent Trustees also discuss the continuance of the investment advisory agreement and sub-advisory contracts in separate sessions with the Senior Officer and with independent legal counsel.
The Trustees recognized that the advisory fee rates for the Invesco Funds are, in many cases, the result of years of review and negotiation. The Trustees’ deliberations and conclusions in a particular year may be based in part on their deliberations and conclusions regarding these arrangements throughout the year and in prior years. The Trustees’ review and conclusions are based on the comprehensive consideration of all information presented to them and are not the result of any single determinative factor. Moreover, one Trustee may have weighed a particular piece of information or factor differently than another Trustee.
The discussion below serves as the Senior Officer’s independent written evaluation with respect to the Fund’s investment advisory agreement as well as a discussion of the material factors and related conclusions that formed the basis for the Board’s approval of the Fund’s investment advisory agreement and sub-advisory contracts. Unless otherwise stated, this information is current as of June 17, 2014, and may not reflect consideration of factors that became known to the Board after that date.
Factors and Conclusions and Summary of Independent Written Fee Evaluation
| A. | Nature, Extent and Quality of Services Provided by Invesco Advisers and the Affiliated Sub-Advisers |
The Board reviewed the advisory services provided to the Fund by Invesco Advisers under the Fund’s investment advisory agreement, the performance of Invesco Advisers in providing these services, and the credentials and experience of the officers and employees of Invesco Advisers who provide these services, including the Fund’s portfolio manager or managers, with whom the Sub-Committees met during the year. The Board’s review of the
qualifications of Invesco Advisers to provide advisory services included the Board’s consideration of Invesco Advisers’ investment process oversight, independent credit analysis and investment risk management. The Board also considered non-advisory services that Invesco Advisers and its affiliates provide to the Invesco Funds such as various back office support functions, equity and fixed income trading operations, internal audit, distribution and legal and compliance.
In determining whether to continue the Fund’s investment advisory agreement, the Board considered the benefits of reapproving an existing relationship and the greater uncertainty that may be associated with entering into a new relationship. The Board concluded that the nature, extent and quality of the services provided to the Fund by Invesco Advisers are appropriate and satisfactory and consistent with the terms of the Fund’s investment advisory agreement.
The Board reviewed the services that may be provided by the Affiliated Sub-Advisers under the sub-advisory contracts and the credentials and experience of the officers and employees of the Affiliated Sub-Advisers who provide these services. The Board noted that the Affiliated Sub-Advisers have offices and personnel that are located in financial centers around the world. As a result, the Affiliated Sub-Advisers can provide research and investment analysis on the markets and economies of various countries in which the Fund may invest, make recommendations regarding securities and assist with security trades. The Board concluded that the sub-advisory contracts benefit the Fund and its shareholders by permitting Invesco Advisers to use the resources and talents of the Affiliated Sub-Advisers in managing the Fund. The Board concluded that the nature, extent and quality of the services that may be provided by the Affiliated Sub-Advisers are appropriate and satisfactory and consistent with the terms of the Fund’s sub-advisory contracts.
| B. | Fund Performance |
The Board considered Fund performance as a relevant factor in considering whether to approve the investment advisory agreement. The Board did not view Fund performance as a relevant factor in considering whether to approve the sub-advisory contracts for the Fund, as no Affiliated Sub-Adviser currently manages assets of the Fund.
The Board compared the Fund’s performance during the past one, three and five calendar years to the performance of funds in the Lipper performance universe and against the Lipper S&P 500 Funds Index. The Board noted that performance of Class A shares of the Fund was in the third quintile of the performance universe for the one, three and five year periods (the first quintile being the best performing funds and the fifth quintile being the worst performing
29 Invesco S&P 500 Index Fund
funds). The Board noted that performance of Class A shares of the Fund was below the performance of the Index for the one, three and five year periods. The Trustees also reviewed more recent Fund performance and this review did not change their conclusions.
| C. | Advisory and Sub-Advisory Fees |
The Board compared the Fund’s contractual management fee rate to the contractual management fee rates of funds in the Fund’s Lipper expense group at a common asset level. The Board noted that the contractual management fee rate for Class A shares of the Fund was below the median contractual management fee rate of funds in the expense group. The Board noted that the term “contractual management fee” may include both advisory and certain administrative services fees, but that Lipper does not provide information on a fund by fund basis as to what is included. The Board noted that Invesco Advisers does not charge the Invesco Funds for the administrative services included in the term as defined by Lipper. The Board also reviewed the methodology used by Lipper in providing expense group information, which includes using each fund’s contractual management fee schedule (including any applicable breakpoints) as reported in the most recent prospectus or statement of additional information for each fund in the expense group.
The Board noted that Invesco Advisers has contractually agreed to waive fees and/or limit expenses of the Fund through at least June 30, 2015 in an amount necessary to limit total annual operating expenses to a specified percentage of average daily net assets for each class of the Fund.
The Board also compared the Fund’s effective advisory fee rate (the advisory fee rate after advisory fee waivers and before other expense limitations/waivers) to the effective advisory fee rates of other mutual funds advised by Invesco Advisers and its affiliates that are managed using an investment process substantially similar to the investment process used for the Fund. The Board noted that the Fund’s effective advisory fee rate was the same as the effective advisory fee rate of the other mutual Fund managed by Invesco Advisers using a similar investment process. The Board noted that Invesco Advisers and the Affiliated Sub-Advisers do not manage other client accounts using an investment process substantially similar to the investment process used for the Fund.
The Board also considered the services that may be provided by the Affiliated Sub-Advisers pursuant to the sub-advisory contracts, as well as the fees payable by Invesco Advisers to the Affiliated Sub-Advisers pursuant to the sub-advisory contracts. The Board also noted that the sub-advisory fees are not paid directly by the Fund, but rather, are payable by Invesco Advisers to the Affiliated Sub-Advisers.
| D. | Economies of Scale and Breakpoints |
The Board considered the extent to which there are economies of scale in the provision of advisory services to the Fund. The Board also
considered whether the Fund benefits from economies of scale through contractual breakpoints in the Fund’s advisory fee schedule and was assisted in this review by a report from the Senior Officer. The Board also noted that the Fund shares directly in economies of scale through lower fees charged by third party service providers based on the combined size of the Invesco Funds and other clients advised by Invesco Advisers.
| E. | Profitability and Financial Resources |
The Board reviewed information from Invesco Advisers concerning the costs of the advisory and other services that Invesco Advisers and its affiliates provide to the Fund and the profitability of Invesco Advisers and its affiliates in providing these services for the year ended December 31, 2013. The Board received information from Invesco Advisers about the methodology used to prepare the profitability information. The Board considered the profitability of Invesco Advisers in managing the Fund and the Invesco Funds. The Board noted that Invesco Advisers continues to operate at a net profit from services Invesco Advisers and its subsidiaries provide to the Invesco Funds. The Board noted that although Invesco Advisers received a minimal amount of revenues from advising the Fund, Invesco Advisers and its subsidiaries did not make a profit from managing the Fund. The Board received and accepted information from Invesco Advisers demonstrating that Invesco Advisers and each Affiliated Sub-Adviser are financially sound and have the resources necessary to perform their obligations under the investment advisory agreement and sub-advisory contracts.
| F. | Collateral Benefits to Invesco Advisers and its Affiliates |
The Board considered various other benefits received by Invesco Advisers and its affiliates from the relationship with the Fund, including the fees received for their provision of transfer agency and distribution services to the Fund. The Board considered comparative information regarding fees charged for these services, including information provided by Lipper and other independent sources. The Board considered the performance of Invesco Advisers and its affiliates in providing these services and the organizational structure employed to provide these services. The Board also considered that these services are provided to the Fund pursuant to written contracts that are reviewed and approved on an annual basis by the Board; that the services are required for the operation of the Fund; that Invesco Advisers and its affiliates can provide services, the nature and quality of which are at least equal to those provided by others offering the same or similar services; and that the fees for such services are fair and reasonable in light of the usual and customary charges by others for services of the same nature and quality.
The Board considered the benefits realized by Invesco Advisers and the Affiliated Sub-Advisers as a result of portfolio brokerage transactions executed through “soft dollar” arrangements.
The Board noted that soft dollar arrangements shift the payment obligation for research services from Invesco Advisers and the Affiliated Sub-Advisers to the Invesco Funds and that the research received may be used with other clients of Invesco Advisers and may reduce Invesco Advisers’ and the Affiliated Sub-Advisers’ expenses. The Board also considered that it receives periodic reports from the Chief Compliance Officer of the Invesco Funds demonstrating that these arrangements are consistent with regulatory requirements. The Board did not deem the soft dollar arrangements to be inappropriate.
The Board considered that the Fund’s uninvested cash and cash collateral from any securities lending arrangements may be invested in money market funds advised by Invesco Advisers pursuant to procedures approved by the Board. The Board noted that Invesco Advisers receives advisory fees from these affiliated money market funds attributable to such investments, although Invesco Advisers has contractually agreed to waive through varying periods the advisory fees payable by the Invesco Funds with respect to investments in the affiliated money market funds. The waiver is in an amount equal to 100% of the net advisory fee Invesco Advisers receives from the affiliated money market funds with respect to the Fund’s investment in the affiliated money market funds of uninvested cash, but not cash collateral. The Board concluded that the amount of advisory fees received by Invesco Advisors from the Fund’s investment of uninvested cash and cash collateral from any securities lending arrangements in the affiliated money market funds are fair and reasonable.
The Board also considered the Fund may use an affiliated broker to execute certain trades for the Fund to among other things, control information leakage, and were advised that such trades would be executed in compliance with rules under the Investment Company Act of 1940, as amended.
30 Invesco S&P 500 Index Fund
Tax Information
Form 1099-DIV, Form 1042-S and other year-end tax information provide shareholders with actual calendar year amounts that should be included in their tax returns. Shareholders should consult their tax advisors.
The following distribution information is being provided as required by the Internal Revenue Code or to meet a specific state’s requirement.
The Fund designates the following amounts or, if subsequently determined to be different, the maximum amount allowable for its fiscal year ended August 31, 2014:
Federal and State Income Tax | ||||
Qualified Dividend Income* | 100 | % | ||
Corporate Dividends Received Deduction* | 100 | % | ||
U.S. Treasury Obligations* | 0 | % | ||
| * | The above percentages are based on ordinary income dividends paid to shareholders during the Fund’s fiscal year. |
31 Invesco S&P 500 Index Fund
Trustees and Officers
The address of each trustee and officer is AIM Counselor Series Trust (Invesco Counselor Series Trust) (the “Trust”), 11 Greenway Plaza, Suite 1000, Houston, Texas 77046-1173. The trustees serve for the life of the Trust, subject to their earlier death, incapacitation, resignation, retirement or removal as more specifically provided in the Trust’s organizational documents. Each officer serves for a one year term or until their successors are elected and qualified. Column two below includes length of time served with predecessor entities, if any.
Name, Year of Birth and Position(s) Held with the Trust | Trustee and/ or Officer Since | Principal Occupation(s) During Past 5 Years | Number of Funds in Fund Complex Overseen by Trustee | Other Directorship(s) Held by Trustee During Past 5 Years | ||||
| Interested Persons | ||||||||
Martin L. Flanagan1 — 1960 Trustee | 2007 | Executive Director, Chief Executive Officer and President, Invesco Ltd. (ultimate parent of Invesco and a global investment management firm); Advisor to the Board, Invesco Advisers, Inc. (formerly known as Invesco Institutional (N.A.), Inc.); Trustee, The Invesco Funds; Vice Chair, Investment Company Institute; and Member of Executive Board, SMU Cox School of Business.
Formerly: Chairman and Chief Executive Officer, Invesco Advisers, Inc. (registered investment adviser); Director, Chairman, Chief Executive Officer and President, IVZ Inc. (holding company), INVESCO Group Services, Inc. (service provider) and Invesco North American Holdings, Inc. (holding company); Director, Chief Executive Officer and President, Invesco Holding Company Limited (parent of Invesco and a global investment management firm); Director, Invesco Ltd.; Chairman, Investment Company Institute and President, Co-Chief Executive Officer, Co-President, Chief Operating Officer and Chief Financial Officer, Franklin Resources, Inc. (global investment management organization). | 141 | None | ||||
Philip A. Taylor2 — 1954 Trustee, President and Principal Executive Officer | 2006 | Head of North American Retail and Senior Managing Director, Invesco Ltd.; Director, Co-Chairman, Co-President and Co-Chief Executive Officer, Invesco Advisers, Inc. (formerly known as Invesco Institutional (N.A.), Inc.) (registered investment adviser); Director, Chairman, Chief Executive Officer and President, Invesco Management Group, Inc. (formerly known as Invesco Aim Management Group, Inc.) (financial services holding company); Director and President, INVESCO Funds Group, Inc. (registered investment adviser and registered transfer agent); Director and Chairman, Invesco Investment Services, Inc. (formerly known as Invesco Aim Investment Services, Inc.) (registered transfer agent) and IVZ Distributors, Inc. (formerly known as INVESCO Distributors, Inc.) (registered broker dealer); Director, President and Chairman, Invesco Inc. (holding company) and Invesco Canada Holdings Inc. (holding company); Chief Executive Officer, Invesco Corporate Class Inc. (corporate mutual fund company) and Invesco Canada Fund Inc. (corporate mutual fund company); Director, Chairman and Chief Executive Officer, Invesco Canada Ltd. (formerly known as Invesco Trimark Ltd./Invesco Trimark Ltèe) (registered investment adviser and registered transfer agent); Trustee, President and Principal Executive Officer, The Invesco Funds (other than AIM Treasurer’s Series Trust (Invesco Treasurer’s Series Trust) and Short-Term Investments Trust); Trustee and Executive Vice President, The Invesco Funds (AIM Treasurer’s Series Trust (Invesco Treasurer’s Series Trust) and Short-Term Investments Trust only); Director, Invesco Investment Advisers LLC (formerly known as Van Kampen Asset Management); Director, Chief Executive Officer and President, Van Kampen Exchange Corp.
Formerly: Director and Chairman, Van Kampen Investor Services Inc.; Director, Chief Executive Officer and President, 1371 Preferred Inc. (holding company) and Van Kampen Investments Inc.; Director and President, AIM GP Canada Inc. (general partner for limited partnerships) and Van Kampen Advisors, Inc.; Director and Chief Executive Officer, Invesco Trimark Dealer Inc. (registered broker dealer); Director, Invesco Distributors, Inc. (formerly known as Invesco Aim Distributors, Inc.) (registered broker dealer); Manager, Invesco PowerShares Capital Management LLC; Director, Chief Executive Officer and President, Invesco Advisers, Inc.; Director, Chairman, Chief Executive Officer and President, Invesco Aim Capital Management, Inc.; President, Invesco Trimark Dealer Inc. and Invesco Trimark Ltd./Invesco Trimark Ltèe; Director and President, AIM Trimark Corporate Class Inc. and AIM Trimark Canada Fund Inc.; Senior Managing Director, Invesco Holding Company Limited; Director and Chairman, Fund Management Company (former registered broker dealer); President and Principal Executive Officer, The Invesco Funds (AIM Treasurer’s Series Trust (Invesco Treasurer’s Series Trust), and Short-Term Investments Trust only); President, AIM Trimark Global Fund Inc. and AIM Trimark Canada Fund Inc. | 141 | None | ||||
Wayne W. Whalen3 — 1939 Trustee | 2010 | Of Counsel, and prior to 2010, partner in the law firm of Skadden, Arps, Slate, Meagher & Flom LLP, legal counsel to certain funds in the Fund Complex
| 141 | Director of the Mutual fund Directors Forum, a nonprofit membership organization for investment directors; Chairman and Director of the Abraham Lincoln Presidential Library Foundation; and Director of the Stevenson Center for Democracy |
| 1 | Mr. Flanagan is considered an interested person (within the meaning of Section 2(a)(19) of the 1940 Act) of the Trust because he is an officer of the Adviser to the Trust, and an officer and a director of Invesco Ltd., ultimate parent of the Adviser. |
| 2 | Mr. Taylor is considered an interested person (within the meaning of Section 2(a)(19) of the 1940 Act) of the Trust because he is an officer and a director of the Adviser. |
| 3 | Mr. Whalen is retiring effective December 31, 2014. He has been deemed to be an interested person of the Trust because of his prior service as counsel to the predecessor funds of certain Invesco open-end funds and his affiliation with the law firm that served as counsel to such predecessor funds and the Invesco closed-end funds. |
T-1 Invesco S&P 500 Index Fund
Trustees and Officers—(continued)
Name, Year of Birth and Position(s) Held with the Trust | Trustee and/ or Officer Since | Principal Occupation(s) During Past 5 Years | Number of Funds in Fund Complex Overseen by Trustee | Other Directorship(s) Past 5 Years | ||||
| Independent Trustees | ||||||||
Bruce L. Crockett — 1944 Trustee and Chair | 2003 | Chairman, Crockett Technologies Associates (technology consulting company)
Formerly: Director, Captaris (unified messaging provider); Director, President and Chief Executive Officer, COMSAT Corporation; Chairman, Board of Governors of INTELSAT (international communications company); ACE Limited (insurance company); and Investment Company Institute | 141 | ALPS (Attorneys Liability Protection Society) (insurance company) | ||||
David C. Arch — 1945 Trustee | 2010 | Chairman of Blistex Inc., a consumer health care products manufacturer | 141 | Board member of the Illinois Manufacturers’ Association; Member of the Board of Visitors, Institute for the Humanities, University of Michigan; Member of the Audit Committee of the Edward-Elmhurst Hospital | ||||
Frank S. Bayley — 1939 Trustee | 2003 | Retired. Formerly: Director, Badgley Funds Inc. (registered investment company) (2 portfolios) and General Partner and Of Counsel, law firm of Baker & McKenzie, LLP | 141 | Director and Chairman, C.D. Stimson Company (a real estate investment company); Trustee, The Curtis Institute of Music | ||||
James T. Bunch — 1942 Trustee | 2000 | Managing Member, Grumman Hill Group LLC (family office private equity investments)
Formerly: Founder, Green Manning & Bunch Ltd. (investment banking firm) (1988-2010); Executive Committee, United States Golf Association; and Director, Policy Studies, Inc. and Van Gilder Insurance Corporation | 141 | Chairman, Board of Governors, Western Golf Association; Chairman, Evans Scholars Foundation; and Director, Denver Film Society | ||||
Rodney F. Dammeyer — 1940 Trustee | 2010 | Chairman of CAC, LLC, (private company offering capital investment and management advisory services)
Formerly: Prior to 2001, Managing Partner at Equity Group Corporate Investments; Prior to 1995, Chief Executive Officer of Itel Corporation (formerly Anixter International); Prior to 1985, experience includes Senior Vice President and Chief Financial Officer of Household International, Inc., Executive Vice President and Chief Financial Officer of Northwest Industries, Inc. and Partner of Arthur Andersen & Co.; From 1987 to 2010, Director/Trustee of investment companies in the Van Kampen Funds complex | 141 | Director of Quidel Corporation and Stericycle, Inc. | ||||
Albert R. Dowden — 1941 Trustee | 2003 | Director of a number of public and private business corporations, including the Boss Group, Ltd. (private investment and management); Nature’s Sunshine Products, Inc. and Reich & Tang Funds (5 portfolios) (registered investment company)
Formerly: Director, Homeowners of America Holding Corporation/Homeowners of America Insurance Company (property casualty company); Director, Continental Energy Services, LLC (oil and gas pipeline service); Director, CompuDyne Corporation (provider of product and services to the public security market) and Director, Annuity and Life Re (Holdings), Ltd. (reinsurance company); Director, President and Chief Executive Officer, Volvo Group North America, Inc.; Senior Vice President, AB Volvo; Director of various public and private corporations; Chairman, DHJ Media, Inc.; Director, Magellan Insurance Company; and Director, The Hertz Corporation, Genmar Corporation (boat manufacturer), National Media Corporation; Advisory Board of Rotary Power International (designer, manufacturer, and seller of rotary power engines); and Chairman, Cortland Trust, Inc. (registered investment company) | 141 | Director of: Nature’s Sunshine Products, Inc., Reich & Tang Funds, Homeowners of America Holding Corporation/ Homeowners of America Insurance Company, the Boss Group | ||||
Jack M. Fields — 1952 Trustee | 2003 | Chief Executive Officer, Twenty First Century Group, Inc. (government affairs company); Owner and Chief Executive Officer, Dos Angeles Ranch, L.P. (cattle, hunting, corporate entertainment); and Discovery Global Education Fund (non-profit)
Formerly: Chief Executive Officer, Texana Timber LP (sustainable forestry company); Director of Cross Timbers Quail Research Ranch (non-profit); and member of the U.S. House of Representatives | 141 | Insperity, Inc. (formerly known as Administaff) | ||||
Prema Mathai-Davis — 1950 Trustee | 2003 | Retired. Formerly: Chief Executive Officer, YWCA of the U.S.A. | 141 | None | ||||
Larry Soll — 1942 Trustee | 1997 | Retired. Formerly: Chairman, Chief Executive Officer and President, Synergen Corp. (a biotechnology company) | 141 | None | ||||
Hugo F. Sonnenschein — 1940 Trustee | 2010 | President Emeritus and Honorary Trustee of the University of Chicago and the Adam Smith Distinguished Service Professor in the Department of Economics at the University of Chicago. Prior to 2000, President of the University of Chicago | 141 | Trustee of the University of Rochester and a member of its investment committee; Member of the National Academy of Sciences and the American Philosophical Society; Fellow of the American Academy of Arts and Sciences |
T-2 Invesco S&P 500 Index Fund
Trustees and Officers—(continued)
Name, Year of Birth and Position(s) Held with the Trust | Trustee and/ or Officer Since | Principal Occupation(s) During Past 5 Years | Number of Funds in Fund Complex Overseen by Trustee | Other Directorship(s) Past 5 Years | ||||
| Independent Trustees—(continued) | ||||||||
Raymond Stickel, Jr. — 1944 Trustee | 2005 | Retired. Formerly: Director, Mainstay VP Series Funds, Inc. (25 portfolios) and Partner, Deloitte & Touche | 141 | None | ||||
Suzanne H. Woolsey — 1941 Trustee | 2014 | Chief Executive Officer of Woolsey Partners LLC | 141 | Emeritus Chair of the Board of Trustees of the Institute for Defense Analyses; Trustee of Colorado College; Trustee of California Institute of Technology; Prior to 2014, Director of Fluor Corp.; Prior to 2010, Trustee of the German Marshall Fund of the United States; Prior to 2010 Trustee of the Rocky Mountain Institute | ||||
| Other Officers | ||||||||
Russell C. Burk — 1958 Senior Vice President and Senior Officer | 2005 | Senior Vice President and Senior Officer, The Invesco Funds | N/A | N/A | ||||
John M. Zerr — 1962 Senior Vice President, Chief Legal Officer and Secretary | 2006 | Director, Senior Vice President, Secretary and General Counsel, Invesco Management Group, Inc. (formerly known as Invesco Aim Management Group, Inc.) and Van Kampen Exchange Corp.; Senior Vice President, Invesco Advisers, Inc. (formerly known as Invesco Institutional (N.A.), Inc.) (registered investment adviser); Senior Vice President and Secretary, Invesco Distributors, Inc. (formerly known as Invesco Aim Distributors, Inc.); Director, Vice President and Secretary, Invesco Investment Services, Inc. (formerly known as Invesco Aim Investment Services, Inc.) and IVZ Distributors, Inc. (formerly known as INVESCO Distributors, Inc.); Director and Vice President, INVESCO Funds Group, Inc.; Senior Vice President, Chief Legal Officer and Secretary, The Invesco Funds; Manager, Invesco PowerShares Capital Management LLC; Director, Secretary and General Counsel, Invesco Investment Advisers LLC (formerly known as Van Kampen Asset Management); Secretary and General Counsel, Invesco Capital Markets, Inc. (formerly known as Van Kampen Funds Inc.) and Chief Legal Officer, PowerShares Exchange-Traded Fund Trust, PowerShares Exchange-Traded Fund Trust II, PowerShares India Exchange-Traded Fund Trust and PowerShares Actively Managed Exchange-Traded Fund Trust
Formerly: Director and Vice President, Van Kampen Advisors Inc.; Director, Vice President, Secretary and General Counsel, Van Kampen Investor Services Inc.; Director, Invesco Distributors, Inc. (formerly known as Invesco Aim Distributors, Inc.); Director, Senior Vice President, General Counsel and Secretary, Invesco Aim Advisers, Inc. and Van Kampen Investments Inc.; Director, Vice President and Secretary, Fund Management Company; Director, Senior Vice President, Secretary, General Counsel and Vice President, Invesco Aim Capital Management, Inc.; Chief Operating Officer and General Counsel, Liberty Ridge Capital, Inc. (an investment adviser); Vice President and Secretary, PBHG Funds (an investment company) and PBHG Insurance Series Fund (an investment company); Chief Operating Officer, General Counsel and Secretary, Old Mutual Investment Partners (a broker-dealer); General Counsel and Secretary, Old Mutual Fund Services (an administrator) and Old Mutual Shareholder Services (a shareholder servicing center); Executive Vice President, General Counsel and Secretary, Old Mutual Capital, Inc. (an investment adviser); and Vice President and Secretary, Old Mutual Advisors Funds (an investment company) | N/A | N/A | ||||
Sheri Morris — 1964 Vice President, Treasurer and Principal Financial Officer | 2003 | Vice President, Treasurer and Principal Financial Officer, The Invesco Funds; Vice President, Invesco Advisers, Inc. (formerly known as Invesco Institutional (N.A.), Inc.) (registered investment adviser); and Vice President, PowerShares Exchange-Traded Fund Trust, PowerShares Exchange-Traded Fund Trust II, PowerShares India Exchange-Traded Fund Trust and PowerShares Actively Managed Exchange-Traded Fund Trust
Formerly: Vice President, Invesco Aim Advisers, Inc., Invesco Aim Capital Management, Inc. and Invesco Aim Private Asset Management, Inc.; Assistant Vice President and Assistant Treasurer, The Invesco Funds and Assistant Vice President, Invesco Advisers, Inc., Invesco Aim Capital Management, Inc. and Invesco Aim Private Asset Management, Inc.; and Treasurer, PowerShares Exchange-Traded Fund Trust, PowerShares Exchange-Traded Fund Trust II, PowerShares India Exchange-Traded Fund Trust and PowerShares Actively Managed Exchange-Traded Fund Trust | N/A | N/A | ||||
T-3 Invesco S&P 500 Index Fund
Trustees and Officers—(continued)
Name, Year of Birth and Position(s) Held with the Trust | Trustee and/ or Officer Since | Principal Occupation(s) During Past 5 Years | Number of Funds in Fund Complex Overseen by Trustee | Other Directorship(s) Past 5 Years | ||||
| Other Officers—(continued) | ||||||||
Karen Dunn Kelley — 1960 Vice President | 2003 | Senior Managing Director, Investments; Director, Co-President, Co-Chief Executive Officer, and Co-Chairman, Invesco Advisers, Inc. (formerly known as Invesco Institutional (N.A.), Inc.) (registered investment adviser); Chairman, Invesco Senior Secured Management, Inc.; Senior Vice President, Invesco Management Group, Inc. (formerly known as Invesco Aim Management Group, Inc.); Executive Vice President, Invesco Distributors, Inc. (formerly known as Invesco Aim Distributors, Inc.); Director, Invesco Mortgage Capital Inc. and Invesco Management Company Limited; Director and President, INVESCO Asset Management (Bermuda) Ltd., Vice President, The Invesco Funds (other than AIM Treasurer’s Series Trust (Invesco Treasurer’s Series Trust) and Short-Term Investments Trust); and President and Principal Executive Officer, The Invesco Funds (AIM Treasurer’s Series Trust (Invesco Treasurer’s Series Trust) and Short-Term Investments Trust only)
Formerly: Director, INVESCO Global Asset Management Limited and INVESCO Management S.A.; Senior Vice President, Van Kampen Investments Inc. and Invesco Advisers, Inc. (formerly known as Invesco Institutional (N.A.), Inc.) (registered investment adviser); Vice President, Invesco Advisers, Inc. (formerly known as Invesco Institutional (N.A.), Inc.); Director of Cash Management and Senior Vice President, Invesco Advisers, Inc. and Invesco Aim Capital Management, Inc.; Director and President, Fund Management Company; Chief Cash Management Officer, Director of Cash Management, Senior Vice President, and Managing Director, Invesco Aim Capital Management, Inc.; Director of Cash Management, Senior Vice President, and Vice President, Invesco Advisers, Inc. and The Invesco Funds (AIM Treasurer’s Series Trust (Invesco Treasurer’s Series Trust), and Short-Term Investments Trust only) | N/A | N/A | ||||
Crissie M. Wisdom — 1969 Anti-Money Laundering Compliance Officer | 2013 | Anti-Money Laundering Compliance Officer, Invesco Advisers, Inc. (formerly known as Invesco Institutional (N.A.), Inc.) (registered investment adviser), Invesco Capital Markets, Inc. (formerly known as Van Kampen Funds Inc.), Invesco Distributors, Inc., Invesco Investment Services, Inc., Invesco Management Group, Inc., Van Kampen Exchange Corp., The Invesco Funds, and PowerShares Exchange-Traded Fund Trust, PowerShares Exchange-Traded Fund Trust II, PowerShares India Exchange-Traded Fund Trust, and PowerShares Actively Managed Exchange-Traded Fund Trust; and Fraud Prevention Manager and Controls and Risk Analysis Manager for Invesco Investment Services, Inc. | N/A | N/A | ||||
Todd L. Spillane — 1958 Chief Compliance Officer | 2006 | Senior Vice President, Invesco Management Group, Inc. (formerly known as Invesco Aim Management Group, Inc.) and Van Kampen Exchange Corp.; Senior Vice President and Chief Compliance Officer, Invesco Advisers, Inc. (registered investment adviser) (formerly known as Invesco Institutional (N.A.), Inc.); Chief Compliance Officer, The Invesco Funds; Vice President, Invesco Distributors, Inc. (formerly known as Invesco Aim Distributors, Inc.) and Invesco Investment Services, Inc. (formerly known as Invesco Aim Investment Services, Inc.)
Formerly: Chief Compliance Officer, Invesco Funds (Chicago); Senior Vice President, Van Kampen Investments Inc.; Senior Vice President and Chief Compliance Officer, Invesco Aim Advisers, Inc. and Invesco Aim Capital Management, Inc.; Chief Compliance Officer, INVESCO Private Capital Investments, Inc. (holding company), Invesco Private Capital, Inc. (registered investment adviser), Invesco Global Asset Management (N.A.), Inc., Invesco Senior Secured Management, Inc. (registered investment adviser), Van Kampen Investor Services Inc., PowerShares Exchange-Traded Fund Trust, PowerShares Exchange-Traded Fund Trust II, PowerShares India Exchange-Traded Fund Trust and PowerShares Actively Managed Exchange-Traded Fund Trust; and Vice President, Invesco Aim Capital Management, Inc. and Fund Management Company | N/A | N/A |
The Statement of Additional Information of the Trust includes additional information about the Fund’s Trustees and is available upon request, without charge, by calling 1.800.959.4246. Please refer to the Fund’s prospectus for information on the Fund’s sub-advisers.
Office of the Fund 11 Greenway Plaza, Suite 1000 Houston, TX 77046-1173 | Investment Adviser Invesco Advisers, Inc. 1555 Peachtree Street, N.E. Atlanta, GA 30309 | Distributor Invesco Distributors, Inc. 11 Greenway Plaza, Suite 1000 Houston, TX 77046-1173 | Auditors PricewaterhouseCoopers LLP 1201 Louisiana Street, Suite 2900 Houston, TX 77002-5678 | |||
Counsel to the Fund Stradley Ronon Stevens & Young, LLP 2005 Market Street, Suite 2600 Philadelphia, PA 19103-7018 | Counsel to the Independent Trustees Goodwin Procter LLP 901 New York Avenue, N.W. Washington, D.C. 20001 | Transfer Agent Invesco Investment Services, Inc. 11 Greenway Plaza, Suite 1000 Houston, TX 77046-1173 | Custodian State Street Bank and Trust Company 225 Franklin Street Boston, MA 02110-2801 | |||
T-4 Invesco S&P 500 Index Fund

Invesco mailing information
Send general correspondence to Invesco Investment Services, Inc., P.O. Box 219078, Kansas City, MO 64121-9078.
Important notice regarding delivery of security holder documents
To reduce Fund expenses, only one copy of most shareholder documents may be mailed to shareholders with multiple accounts at the same address (Householding). Mailing of your shareholder documents may be householded indefinitely unless you instruct us otherwise. If you do not want the mailing of these documents to be combined with those for other members of your household, please contact Invesco Investment Services, Inc. at 800 959 4246 or contact your financial institution. We will begin sending you individual copies for each account within 30 days after receiving your request.
Fund holdings and proxy voting information
The Fund provides a complete list of its holdings four times in each fiscal year, at the quarter ends. For the second and fourth quarters, the lists appear in the Fund’s semiannual and annual reports to shareholders. For the first and third quarters, the Fund files the lists with the Securities and Exchange Commission (SEC) on Form N-Q. The most recent list of portfolio holdings is available at invesco.com/completeqtrholdings. Shareholders can also look up the Fund’s Forms N-Q on the SEC website at sec.gov. Copies of the Fund’s Forms N-Q may be reviewed and copied at the SEC Public Reference Room in Washington, D.C. You can obtain information on the operation of the Public Reference Room, including information about duplicating fee charges, by calling 202 551 8090 or 800 732 0330, or by electronic request at the following email address: publicinfo@sec.gov. The SEC file numbers for the Fund are shown below.
A description of the policies and procedures that the Fund uses to determine how to vote proxies relating to portfolio securities is available without charge, upon request, from our Client Services department at 800 959 4246 or at invesco.com/proxyguidelines. The information is also available on the SEC website, sec.gov.
Information regarding how the Fund voted proxies related to its portfolio securities during the most recent 12-month period ended June 30 is available at invesco.com/proxysearch. The information is also available on the SEC website, sec.gov. Invesco Advisers, Inc. is an investment adviser; it provides investment advisory services to individual and institutional clients and does not sell securities. Invesco Distributors, Inc. is the US distributor for Invesco Ltd.’s retail mutual funds, exchange-traded funds and institutional money market funds. Both are wholly owned, indirect subsidiaries of Invesco Ltd. |  |
| SEC file numbers: 811-09913 and 333-36074 | MS-SPI-AR-1 | Invesco Distributors, Inc. |
Letters to Shareholders
Philip Taylor | Dear Shareholders: This annual report includes information about your Fund, including performance data and a complete list of its investments as of the close of the reporting period. Inside, your Fund’s portfolio managers discuss how they managed your Fund and the factors that affected its performance during the reporting period. I hope you find this report of interest. During the reporting period covered by this report, the US economy showed signs of continued improvement. After contracting in the first quarter of 2014, the economy expanded strongly in the second quarter and unemployment trended lower. Much of the credit for this improvement goes to the US Federal Reserve (the Fed), which undertook an extraordinary asset purchase program following the global financial crisis. The Fed’s goal was to jumpstart the economy by encouraging banks to lend more, businesses to hire more and consumers to spend more. Signs of a stronger US |

economy prompted the Fed to reduce, or “taper,” its asset purchase program. Despite this, interest rates remained near historical low levels due largely to heavy investor demand for bonds. While signs of economic improvement were evident in the US, European economies remained relatively stagnant. During the reporting period, high unemployment persisted, worries about potential deflation grew, and uncertainty about Russian-Ukrainian tensions weighed on European markets.
Extended periods of market strength can lull investors into complacency – just as prolonged periods of market weakness or volatility can discourage investors from initiating long-term investment plans. That’s why Invesco has always encouraged investors to work with a professional financial adviser who can stress the importance of starting to save and invest early and the importance of adhering to a disciplined investment plan – when times are good and when they’re uncertain. A financial adviser who knows your unique financial situation, investment goals and risk tolerance can be an invaluable partner as you seek to achieve your financial goals. He or she can offer a long-term perspective when markets are volatile and time-tested advice and guidance when your financial situation or investment goals change.
Timely information when and where you want it
Invesco’s efforts to help investors achieve their financial objectives include providing individual investors and financial professionals with timely information about the markets, the economy and investing – whenever and wherever they want it.
Our website, invesco.com/us, offers a wide range of market insights and investment perspectives. On the website, you’ll find detailed information about our funds, including prices, performance, holdings and portfolio manager commentaries. You can access information about your individual Invesco account whenever it’s convenient for you; just complete a simple, secure online registration. Use the “Login” box on our home page to get started.
Invesco’s mobile app for iPad® (available free from the App StoreSM) allows you to obtain the same detailed information about your Fund and the same investment insights from our investment leaders, market strategists, economists and retirement experts on the go. You also can watch portfolio manager videos and have instant access to Invesco news and updates wherever you may be.
In addition to the resources accessible on our website and through our mobile app, you can obtain timely updates to help you stay informed about the markets, the economy and investing by connecting with Invesco on Twitter, LinkedIn or Facebook. You can access our blog at blog.invesco.us.com or by clicking the “Intentional Investing Forum” link on our home page. Our goal is to provide you the information you want, when and where you want it.
Have questions?
For questions about your account, feel free to contact an Invesco client services representative at 800 959 4246. For Invesco-related questions or comments, please email me directly at phil@invesco.com.
All of us at Invesco look forward to serving your investment management needs for many years to come. Thank you for investing with us.
Sincerely,

Philip Taylor
Senior Managing Director, Invesco Ltd.
iPad is a trademark of Apple Inc., registered in the US and other countries. App Store is a service mark of Apple Inc. Invesco Distributors, Inc. is not affiliated with Apple Inc.
2 Invesco Small Cap Discovery Fund
Bruce Crockett | Dear Fellow Shareholders: There are a variety of factors that can impact investment performance, many of which are uncontrollable by us as investors. These factors can include various economic trends and geopolitical developments. While the members of the Invesco Funds Board, which I chair, can’t dictate the performance of the Invesco funds, be assured that your Board works diligently throughout the year to focus on how your investments are managed. Our job is to represent you and your interests on a variety of fund management-related matters. We regularly monitor how the portfolio management teams of the Invesco funds are performing in light of ever-changing and often unpredictable economic and market conditions. We review the investment strategies and investment process employed by each fund’s management team as explained in the fund’s prospectus. Perhaps our most significant responsibility is conducting the annual review of the funds’ advisory |

and sub-advisory contracts with Invesco Advisers and its affiliates. This annual review, which is required by the Investment Company Act of 1940, focuses on the nature and quality of the services Invesco provides as the adviser to the Invesco funds and the reasonableness of the fees that it charges for those services. Each year, we spend months carefully reviewing information from Invesco that allows us to evaluate the quality of its services and the reasonableness of its fees. We also use information from a variety of independent sources, including materials provided by the independent senior officer of the Invesco funds, who reports directly to the independent trustees on the Board. Additionally, we meet with legal counsel and review performance and fee data prepared for us by Lipper Inc., an independent, third-party firm widely recognized as a leader in its field.
After a careful review, the members of the Invesco Funds Board approved the continuation of advisory and sub-advisory contracts with Invesco Advisers and its affiliates. Be assured that your Board will continue working on behalf of fund shareholders, keeping your needs and interests uppermost in our minds.
As always, please contact me at bruce@brucecrockett.com with any questions or concerns you may have. On behalf of the Board, we look forward to continuing to represent your interests and serving your needs.
Sincerely,

Bruce L. Crockett
Independent Chair
Invesco Funds Board of Trustees
3 Invesco Small Cap Discovery Fund
Management’s Discussion of Fund Performance
Performance summary
For the fiscal year ended August 31, 2014, Invesco Small Cap Discovery Fund posted positive double-digit returns at net asset value (NAV), but underperformed the Russell 2000 Growth Index, its style-specific benchmark.
Your Fund’s long-term performance appears later in this report.
Fund vs. Indexes
Total returns, 8/31/13 to 8/31/14, at NAV. Performance shown does not include applicable contingent deferred sales charges (CDSC) or front-end sales charges, which would have reduced performance.
Class A Shares | 13.15 | % | ||
Class B Shares | 13.11 | |||
Class C Shares | 12.21 | |||
Class Y Shares | 13.42 | |||
Class R5 Shares | 13.59 | |||
Class R6 Shares | �� | 13.67 | ||
S&P 500 Indexq (Broad Market Index) | 25.25 | |||
Russell 2000 Growth Indexq (Style-Specific Index) | 17.30 | |||
Lipper Small-Cap Growth Funds Indexn (Peer Group Index) | 13.51 |
Source(s): qFactSet Research Systems Inc.; nLipper Inc.
How we invest
We utilize a bottom-up disciplined style of growth investing that emphasizes the analysis of individual stocks. Our investment process seeks to identify small cap companies with growth rates that are higher and/or more sustainable than what is implied by current valuations and market expectations.
We conduct in-depth fundamental research in reviewing companies, approaching them from as many perspectives as possible (suppliers, distributors, customers, etc). Our stock selection process includes the development and analysis of a fully integrated financial model, which allows us to build a more complete understanding of the financial health of each investment candidate. We believe that stock prices are driven by expected earnings growth, the expected long-term sustainability of that growth and the market’s valuation of those factors. We generally seek companies that
appear to be positioned to produce an attractive level of future earnings through the development of new products, services or markets or as a result of changing markets or industry conditions.
Risk management plays an important role in portfolio construction, as our target portfolio attempts to maximize the relationship between risk and return.
We consider selling a stock for any of the following reasons:
| n | Investment thesis plays out or is no longer valid |
| n | Fundamentals deteriorate |
| n | Macroeconomic conditions change |
| n | Risk-reward becomes unfavorable or a higher conviction investment idea arises with better risk-reward. |
Market conditions and your Fund
US equity market indexes generally rose during the fiscal year ended August 31, 2014. Corporate earnings were resilient in the face of modest economic growth,
driven by strong profitability across many sectors, and fundamentals for corporations and consumers remained relatively positive. However, the fiscal year began amid uncertainty created by a two-week federal government shutdown. Despite this and the announcement by the US Federal Reserve (the Fed) in December that it would begin reducing the scope of its asset purchase program in early 2014, US equities rallied through the end of 2013. The market turned volatile in the first months of 2014 as investors began to worry that stocks may have risen too far, too fast. While political upheaval in Ukraine and signs of economic sluggishness in the US and China contributed to investor uncertainty, economic data remained strong enough that the Fed continued to reduce its asset purchase program on schedule. The continued “good but not great” economic environment and historically low interest rates generally led stocks higher throughout the end of the fiscal year.
The Fund lagged its style-specific benchmark in the information technology (IT), energy and health care sectors, although some of this was offset by strong stock selection and outperformance in other sectors, especially consumer discretionary and financials.
The area of greatest challenge for the Fund was the IT sector. Internet service company Infoblox was one of the largest detractors from Fund performance. Consecutive earnings reports, which did not meet the expectations set by company management, led investors to question the company’s credibility. We sold our positions in Infoblox during the reporting period. Another detractor from performance was Commvault Systems, which provides data and information management software to companies around the globe.
| Portfolio Composition | |||||
| By sector | |||||
Information Technology | 23.6 | % | |||
Health Care | 22.8 | ||||
Industrials | 20.3 | ||||
Consumer Discretionary | 15.4 | ||||
Financials | 6.0 | ||||
Energy | 4.1 | ||||
Materials | 3.4 | ||||
Consumer Staples | 2.4 | ||||
Money Market Funds Plus Other Assets Less Liabilities | 2.0 | ||||
| Top 10 Equity Holdings* | |||||
| Portfolio Composition | |||||
1. Guidewire Software Inc. | 1.6 | % | |||
2. Team Health Holdings, Inc. | 1.5 | ||||
3. Pacira Pharmaceuticals, Inc. | 1.5 | ||||
4. Medivation Inc. | 1.4 | ||||
5. Brunswick Corp. | 1.4 | ||||
6. A.O. Smith Corp. | 1.4 | ||||
7. Cubist Pharmaceuticals, Inc. | 1.4 | ||||
8. Tenet Healthcare Corp. | 1.4 | ||||
9. PTC Inc. | 1.4 | ||||
10. Harman International Industries, Inc. | 1.3 | ||||
Total Net Assets | $ | 863.2 million | ||
Total Number of Holdings* | 107 | |||
The Fund’s holdings are subject to change, and there is no assurance that the Fund will continue to hold any particular security.
*Excluding money market fund holdings.
4 Invesco Small Cap Discovery Fund
Within the Fund’s style-specific index, the energy sector had the highest returns during the reporting period. The Fund’s performance versus its style-specific benchmark lagged due to not owning certain index constituents which outperformed. One stock the Fund did hold was Stone Energy, a diversified exploration and production company with oil and natural gas assets, on- and off-shore. The stock underperformed during the reporting period and was the largest detractor in the sector.
Health care stocks generally were strong during the reporting period and some of the Fund’s top overall contributors included Medivation, Team Health and Tenet Healthcare. However, relative performance in the health care sector trailed the Fund’s style-specific benchmark. In particular, Ariad Pharmaceuticals, a biotechnology company specializing in creating cancer drugs, was a large detractor. The stock suffered dramatically when an investigation was launched into reported side effects of the company’s leading product for leukemia. We sold our position in Ariad during the reporting period.
The Fund strongly outperformed its style-specific index in the consumer discretionary sector due to stock selection. One of the top contributors to Fund performance was automotive electronics manufacturer Harman International. The company benefited as new management implemented a revamped business model which brings its infotainment products to a wider audience of car manufacturers enhancing the product’s profitability. Auto parts manufacturer Tenneco also contributed to performance.
As we’ve discussed, the Fund produced significant positive performance during the reporting period. However, stocks remain volatile and we caution investors against making investment decisions based on short-term performance. We thank you for your commitment to the Invesco Small Cap Discovery Fund.
The views and opinions expressed in management’s discussion of Fund performance are those of Invesco Advisers, Inc. These views and opinions are subject to change at any time based on factors such as market and economic conditions. These views and opinions may not be relied upon as investment advice or recommendations, or as an offer for a particular security. The information is not a complete analysis of every aspect of any market, country, industry, security or the Fund. Statements of fact are from sources considered reliable, but Invesco Advisers, Inc. makes no representation or warranty as to their completeness or accuracy. Although historical performance is no guarantee of future results, these insights may help you understand our investment management philosophy.
See important Fund and, if applicable, index disclosures later in this report.
 | Matthew Hart Chartered Financial Analyst, Portfolio Manager, is lead manager of Invesco Small Cap Discovery | |
| Fund. He joined Invesco in 2010. Mr. Hart earned a BBA from Southern Methodist University. | ||
 | Justin Speer Portfolio manager, is manager of Invesco Small Cap Discovery Fund. He joined Invesco in 2010. Mr. | |
| Speer earned a BS with an emphasis in finance and accounting from Texas Christian University. | ||
5 Invesco Small Cap Discovery Fund
Your Fund’s Long-Term Performance
Results of a $10,000 Investment – Oldest Share Class(es)
Fund and index data from 8/31/04
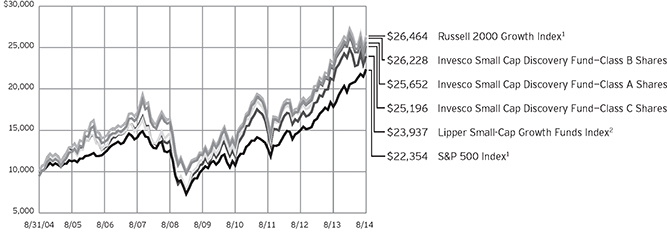
| 1 | Source: FactSet Research Systems Inc. |
| 2 | Source: Lipper Inc. |
Past performance cannot guarantee comparable future results.
The data shown in the chart include reinvested distributions, applicable sales charges and Fund expenses including management fees. Results for Class B shares are calculated as if a hypothetical
shareholder had liquidated his entire investment in the Fund at the close of the reporting period and paid the contingent deferred sales charges, if applicable. Index results include reinvested dividends, but they do not reflect sales charges. Performance of the peer group,
if applicable, reflects fund expenses and management fees; performance of a market index does not. Performance shown in the chart and table(s) does not reflect deduction of taxes a shareholder would pay on Fund distributions or sale of Fund shares.
continued from page 8
Other information
| n | The returns shown in management’s discussion of Fund performance are based on net asset values (NAVs) calculated for shareholder transactions. Generally accepted accounting principles require adjustments to be made to |
the net assets of the Fund at period end for financial reporting purposes, and as such, the NAVs for shareholder transactions and the returns based on those NAVs may differ from the NAVs and returns reported in the Financial Highlights. |
| n | Industry classifications used in this report are generally according to the Global Industry Classification Standard, which was developed by and is the exclusive property and a service mark of MSCI Inc. and Standard & Poor’s. |
6 Invesco Small Cap Discovery Fund
| Average Annual Total Returns | ||||
| As of 8/31/14, including maximum applicable sales charges | ||||
Class A Shares | ||||
Inception (11/27/00) | 4.02 | % | ||
10 Years | 9.88 | |||
5 Years | 15.03 | |||
1 Year | 6.92 | |||
Class B Shares | ||||
Inception (11/27/00) | 4.01 | % | ||
10 Years | 10.12 | |||
5 Years | 16.08 | |||
1 Year | 8.34 | |||
Class C Shares | ||||
Inception (11/27/00) | 3.67 | % | ||
10 Years | 9.68 | |||
5 Years | 15.46 | |||
1 Year | 11.27 | |||
Class Y Shares | ||||
Inception (2/2/06) | 7.51 | % | ||
5 Years | 16.64 | |||
1 Year | 13.42 | |||
Class R5 Shares | ||||
10 Years | 10.59 | % | ||
5 Years | 16.53 | |||
1 Year | 13.59 | |||
Class R6 Shares | ||||
10 Years | 10.60 | % | ||
5 Years | 16.55 | |||
1 Year | 13.67 | |||
Effective June 1, 2010, Class A, Class B, Class C and Class I shares of the predecessor fund, Van Kampen Small Cap Growth Fund, advised by Van Kampen Asset Management were reorganized into Class A, Class B, Class C and Class Y shares, respectively, of Invesco Van Kampen Small Cap Growth Fund (renamed Invesco Small Cap Discovery Fund). Returns shown above for Class A, Class B, Class C and Class Y shares are blended returns of the predecessor fund and Invesco Small Cap Discovery Fund. Share class returns will differ from the predecessor fund because of different expenses.
Class R5 shares incepted on September 24, 2012. Performance shown prior to that date is that of the Fund’s and the predecessor fund’s Class A shares and includes the 12b-1 fees applicable to Class A shares. Class A share performance reflects any applicable fee waivers or expense reimbursements.
Class R6 shares incepted on September 24, 2012. Performance shown prior to that date is that of the Fund’s and
| Average Annual Total Returns | ||||
| As of 6/30/14, the most recent calendar quarter end, including maximum applicable sales charges | ||||
Class A Shares | ||||
Inception (11/27/00) | 4.14 | % | ||
10 Years | 8.86 | |||
5 Years | 16.55 | |||
1 Year | 14.67 | |||
Class B Shares | ||||
Inception (11/27/00) | 4.13 | % | ||
10 Years | 9.08 | |||
5 Years | 17.58 | |||
1 Year | 16.28 | |||
Class C Shares | ||||
Inception (11/27/00) | 3.81 | % | ||
10 Years | 8.67 | |||
5 Years | 17.00 | |||
1 Year | 19.42 | |||
Class Y Shares | ||||
Inception (2/2/06) | 7.79 | % | ||
5 Years | 18.18 | |||
1 Year | 21.64 | |||
Class R5 Shares | ||||
10 Years | 9.55 | % | ||
5 Years | 18.03 | |||
1 Year | 21.70 | |||
Class R6 Shares | ||||
10 Years | 9.56 | % | ||
5 Years | 18.05 | |||
1 Year | 21.79 | |||
the predecessor fund’s Class A shares and includes the 12b-1 fees applicable to Class A shares. Class A share performance reflects any applicable fee waivers or expense reimbursements.
The performance data quoted represent past performance and cannot guarantee comparable future results; current performance may be lower or higher. Please visit invesco.com/performance for the most recent month-end performance. Performance figures reflect reinvested distributions, changes in net asset value and the effect of the maximum sales charge unless otherwise stated. Investment return and principal value will fluctuate so that you may have a gain or loss when you sell shares.
The net annual Fund operating expense ratio set forth in the most recent Fund prospectus as of the date of this report for Class A, Class B, Class C, Class Y, Class R5 and Class R6 shares was 1.33%, 1.33%, 2.08%, 1.08%, 0.94% and 0.84%, respectively.1 The total annual Fund operating
expense ratio set forth in the most recent Fund prospectus as of the date of this report for Class A, Class B, Class C, Class Y, Class R5 and Class R6 shares was 1.34%, 1.34%, 2.09%, 1.09%, 0.95% and 0.85%, respectively. The expense ratios presented above may vary from the expense ratios presented in other sections of this report that are based on expenses incurred during the period covered by this report.
Class A share performance reflects the maximum 5.50% sales charge, and Class B and Class C share performance reflects the applicable contingent deferred sales charge (CDSC) for the period involved. For shares purchased prior to June 1, 2010, the CDSC on Class B shares declines from 5% at the time of purchase to 0% at the beginning of the sixth year. For shares purchased on or after June 1, 2010, the CDSC on Class B shares declines from 5% at the time of purchase to 0% at the beginning of the seventh year. The CDSC on Class C shares is 1% for the first year after purchase. Class Y, Class R5 and Class R6 shares do not have a front-end sales charge or a CDSC; therefore, performance is at net asset value.
The performance of the Fund’s share classes will differ primarily due to different sales charge structures and class expenses.
| 1 | Total annual Fund operating expenses after any contractual fee waivers and/or expense reimbursements by the adviser in effect through at least June 30, 2016. See current prospectus for more information. |
7 Invesco Small Cap Discovery Fund
Invesco Small Cap Discovery Fund’s investment objective is to seek capital appreciation.
| n | Unless otherwise stated, information presented in this report is as of August 31, 2014, and is based on total net assets. |
| n | Unless otherwise noted, all data provided by Invesco. |
| n | To access your Fund’s reports/prospectus, visit invesco.com/fundreports. |
About share classes
| n | Class B shares may not be purchased for new or additional investments. Please see the prospectus for more information. |
| n | Class Y shares are available only to certain investors. Please see the prospectus for more information. |
| n | Class R5 shares and Class R6 shares are primarily intended for employer sponsored retirement and benefit plans that meet certain standards and for institutional investors. Please see the prospectus for more information. |
Principal risks of investing in the Fund
| n | Equity risk. Equity risk is the risk that the value of securities held by the Fund will fall due to general market and economic conditions, perceptions regarding the industries in which the issuers of securities held by the Fund participate or factors relating to specific companies in which the Fund invests, either directly or through derivative instruments. For example, an adverse event, such as an unfavorable earnings report, may depress the value of securities held by the Fund; the price of securities may be particularly sensitive to general movements in the stock market; or a drop in the stock market may depress the price of most or all of the securities held by the Fund. In addition, securities of an issuer in the Fund’s portfolio may decline in price if the issuer fails to make anticipated dividend payments because, among other reasons, the issuer of the security experiences a decline in its financial condition. |
| n | Foreign securities risk. The Fund’s foreign investments may be affected by changes in a foreign country’s exchange rates, political and social instability, changes in economic or taxation policies, difficulties when enforcing obligations, decreased liquidity, and increased volatility. Foreign companies may be subject to less regulation resulting in less publicly available information about the companies. |
| n | Growth investing risk. Growth stocks tend to be more expensive relative to their earnings or assets compared with other types of stock. As a result they tend to be more sensitive to changes in their earnings and can be more volatile. |
| n | Management risk. The investment techniques and risk analysis used by the Fund’s portfolio managers may not produce the desired results. |
| n | Market risk. The prices of and the income generated by the Fund’s securities may decline in response to, among other things, investor sentiment, general economic and market conditions, regional or global instability, and currency and interest rate fluctuations. |
| n | Real estate investment trusts (REITs) risk/real estate risk. Investments in real estate related instruments may be affected by economic, legal, cultural, environmental or technological factors that affect property values, rents or occupancies of real estate related to the Fund’s holdings. Real estate companies, including REITs or similar structures, tend to be small- and mid-cap companies, and their shares may be more volatile and less liquid. The value of investments in real estate related companies may be affected by the quality of management, the ability to repay loans, the utilization of leverage and financial covenants related thereto, whether the company carries adequate insurance and environmental factors. If a real estate related company defaults, the Fund may own real estate directly, which involves the following additional risks: environmental liabilities; difficulty in valuing and selling the real estate; and economic or regulatory changes. |
| n | Small- and mid-capitalization risks. Stocks of small- and mid-sized companies tend to be more vulnerable to adverse developments and may have little or no operating history or track record of success, and limited product lines, markets, management and financial resources. The securities of small- and mid-sized companies may be more |
volatile due to less market interest and less publicly available information about the issuer. They also may be illiquid or restricted as to resale, or may trade less frequently and in smaller volumes, all of which may cause difficulty when establishing or closing a position at a desirable price. |
| n | Unseasoned issuer risk. Investments in unseasoned companies or companies with special circumstances often involve much greater risks than are inherent in other types of investments and securities of such companies may be more likely to experience fluctuations in price. In addition, investments made in anticipation of future events may, if the events are delayed or never achieved, cause stock prices to fall. |
About indexes used in this report
| n | The S&P 500® Index is an unmanaged index considered representative of the US stock market. |
| n | The Russell 2000® Growth Index is an unmanaged index considered representative of small-cap growth stocks. The Russell 2000 Growth Index is a trademark/service mark of the Frank Russell Co. Russell® is a trademark of the Frank Russell Co. |
| n | The Lipper Small-Cap Growth Funds Index is an unmanaged index considered representative of small-cap growth funds tracked by Lipper. |
| n | The Fund is not managed to track the performance of any particular index, including the index(es) described here, and consequently, the performance of the Fund may deviate significantly from the performance of the index(es). |
| n | A direct investment cannot be made in an index. Unless otherwise indicated, index results include reinvested dividends, and they do not reflect sales charges. Performance of the peer group, if applicable, reflects fund expenses; performance of a market index does not. |
continued on page 6
| This report must be accompanied or preceded by a currently effective Fund prospectus, which contains more complete information, including sales charges and expenses. Investors should read it carefully before investing. |
| NOT FDIC INSURED | MAY LOSE VALUE | NO BANK GUARANTEE |
8 Invesco Small Cap Discovery Fund
Schedule of Investments(a)
August 31, 2014
| Shares | Value | |||||||
Common Stocks–98.01% |
| |||||||
| Aerospace & Defense–1.20% | ||||||||
TASER International, Inc.(b) | 658,957 | $ | 10,325,856 | |||||
| Apparel, Accessories & Luxury Goods–0.77% | ||||||||
G-III Apparel Group, Ltd.(b) | 80,576 | 6,650,743 | ||||||
| Application Software–7.36% | ||||||||
Aspen Technology, Inc.(b) | 96,766 | 3,976,115 | ||||||
Bottomline Technologies (de), Inc.(b) | 74,396 | 2,094,991 | ||||||
Cadence Design Systems, Inc.(b) | 646,101 | 11,397,222 | ||||||
Guidewire Software Inc.(b) | 296,025 | 13,483,939 | ||||||
Manhattan Associates, Inc.(b) | 284,895 | 8,227,767 | ||||||
PTC Inc.(b) | 302,388 | 11,699,392 | ||||||
Qlik Technologies Inc.(b) | 205,478 | 5,800,644 | ||||||
Ultimate Software Group, Inc. (The)(b) | 46,483 | 6,832,536 | ||||||
| 63,512,606 | ||||||||
| Asset Management & Custody Banks–1.13% | ||||||||
Affiliated Managers Group, Inc.(b) | 46,274 | 9,770,755 | ||||||
| Auto Parts & Equipment–2.14% | ||||||||
Gentherm Inc.(b) | 186,655 | 9,118,097 | ||||||
Tenneco Inc.(b) | 145,634 | 9,332,227 | ||||||
| 18,450,324 | ||||||||
| Biotechnology–5.96% | ||||||||
Clovis Oncology Inc.(b)(c) | 113,354 | 5,391,116 | ||||||
Cubist Pharmaceuticals, Inc.(b)(c) | 171,686 | 11,851,485 | ||||||
Intercept Pharmaceuticals Inc.(b)(c) | 12,528 | 3,629,612 | ||||||
Medivation Inc.(b) | 134,887 | 12,309,788 | ||||||
NPS Pharmaceuticals, Inc.(b) | 371,347 | 11,207,252 | ||||||
Synageva BioPharma Corp.(b)(c) | 97,816 | 7,059,381 | ||||||
| 51,448,634 | ||||||||
| Broadcasting–0.65% | ||||||||
Nexstar Broadcasting Group, Inc.–Class A | 122,480 | 5,589,987 | ||||||
| Building Products–3.95% | ||||||||
A.O. Smith Corp. | 241,801 | 11,867,593 | ||||||
Lennox International Inc. | 132,350 | 11,085,636 | ||||||
Owens Corning Inc. | 116,163 | 4,181,868 | ||||||
Trex Co., Inc.(b) | 186,147 | 6,999,127 | ||||||
| 34,134,224 | ||||||||
| Commodity Chemicals–0.77% | ||||||||
Methanex Corp. (Canada) | 100,092 | 6,688,147 | ||||||
| Communications Equipment–1.38% | ||||||||
ARRIS Group Inc.(b) | 246,215 | 7,536,641 | ||||||
Finisar Corp.(b)(c) | 215,304 | 4,372,824 | ||||||
| 11,909,465 | ||||||||
| Construction & Engineering–3.19% | ||||||||
Dycom Industries, Inc.(b) | 293,155 | 9,149,368 | ||||||
Foster Wheeler AG | 301,710 | 9,847,814 | ||||||
| Shares | Value | |||||||
| Construction & Engineering–(continued) | ||||||||
MasTec Inc.(b) | 281,291 | $ | 8,579,375 | |||||
| 27,576,557 | ||||||||
| Construction Machinery & Heavy Trucks–0.48% | ||||||||
Manitowoc Co., Inc. (The) | 140,656 | 4,138,100 | ||||||
| Consumer Electronics–1.34% | ||||||||
Harman International Industries, Inc. | 100,732 | 11,592,239 | ||||||
| Data Processing & Outsourced Services–2.85% | ||||||||
Euronet Worldwide, Inc.(b) | 163,790 | 8,730,007 | ||||||
Jack Henry & Associates, Inc. | 114,070 | 6,594,387 | ||||||
WEX Inc.(b) | 81,405 | 9,251,678 | ||||||
| 24,576,072 | ||||||||
| Electronic Components–1.04% | ||||||||
Belden Inc. | 123,189 | 9,001,420 | ||||||
| Electronic Equipment & Instruments–1.09% | ||||||||
Cognex Corp.(b) | 224,390 | 9,419,892 | ||||||
| Electronic Manufacturing Services–0.54% | ||||||||
IPG Photonics Corp.(b)(c) | 67,833 | 4,658,770 | ||||||
| Environmental & Facilities Services–0.75% | ||||||||
Clean Harbors, Inc.(b) | 107,471 | 6,506,294 | ||||||
| Footwear–0.76% | ||||||||
Steven Madden, Ltd.(b) | 193,529 | 6,578,051 | ||||||
| General Merchandise Stores–1.54% | ||||||||
Burlington Stores, Inc.(b) | 125,054 | 4,460,676 | ||||||
Tuesday Morning Corp.(b) | 501,534 | 8,816,968 | ||||||
| 13,277,644 | ||||||||
| Health Care Equipment–3.12% | ||||||||
DexCom Inc.(b) | 181,862 | 8,038,300 | ||||||
Insulet Corp.(b) | 168,959 | 6,101,110 | ||||||
Thoratec Corp.(b) | 158,055 | 3,951,375 | ||||||
Wright Medical Group, Inc.(b) | 296,758 | 8,855,259 | ||||||
| 26,946,044 | ||||||||
| Health Care Facilities–4.56% | ||||||||
Acadia Healthcare Co., Inc.(b) | 218,805 | 11,205,004 | ||||||
Capital Senior Living Corp.(b) | 418,696 | 9,575,577 | ||||||
Tenet Healthcare Corp.(b) | 192,666 | 11,787,306 | ||||||
VCA, Inc.(b) | 166,448 | 6,782,756 | ||||||
| 39,350,643 | ||||||||
| Health Care Services–1.54% | ||||||||
Team Health Holdings, Inc.(b) | 226,827 | 13,273,916 | ||||||
| Health Care Supplies–0.83% | ||||||||
Align Technology, Inc.(b) | 131,154 | 7,142,647 | ||||||
See accompanying Notes to Financial Statements which are an integral part of the financial statements.
9 Invesco Small Cap Discovery Fund
| Shares | Value | |||||||
| Home Furnishings–0.47% | ||||||||
La-Z-Boy Inc. | 189,712 | $ | 4,048,454 | |||||
| Homebuilding–0.74% | ||||||||
Taylor Morrison Home Corp.–Class A(b) | 320,299 | 6,354,732 | ||||||
| Housewares & Specialties–0.73% | ||||||||
Jarden Corp.(b) | 104,744 | 6,262,644 | ||||||
| Human Resource & Employment Services–1.74% | ||||||||
On Assignment, Inc.(b) | 189,945 | 5,614,774 | ||||||
TrueBlue, Inc.(b) | 346,347 | 9,399,858 | ||||||
| 15,014,632 | ||||||||
| Industrial Conglomerates–1.00% | ||||||||
Carlisle Cos. Inc. | 104,530 | 8,665,537 | ||||||
| Industrial Machinery–2.92% | ||||||||
EnPro Industries, Inc.(b) | 120,236 | 8,164,024 | ||||||
ITT Corp. | 145,565 | 6,966,741 | ||||||
Woodward Inc. | 192,538 | 10,056,260 | ||||||
| 25,187,025 | ||||||||
| Internet Software & Services–5.00% | ||||||||
Cornerstone OnDemand, Inc.(b) | 175,319 | 6,563,943 | ||||||
CoStar Group Inc.(b) | 58,196 | 8,423,871 | ||||||
Dealertrack Technologies Inc.(b) | 156,644 | 7,011,386 | ||||||
Marketo, Inc.(b)(c) | 321,124 | 9,402,511 | ||||||
Wix.com Ltd. (Israel)(b)(c) | 272,983 | 4,493,300 | ||||||
Yelp Inc.(b)(c) | 88,303 | 7,277,933 | ||||||
| 43,172,944 | ||||||||
| Investment Banking & Brokerage–1.84% | ||||||||
Evercore Partners Inc.–Class A | 176,305 | 9,032,105 | ||||||
Stifel Financial Corp.(b) | 143,977 | 6,893,619 | ||||||
| 15,925,724 | ||||||||
| IT Consulting & Other Services–0.55% | ||||||||
InterXion Holding N.V. (Netherlands)(b) | 171,475 | 4,730,995 | ||||||
| Leisure Products–1.39% | ||||||||
Brunswick Corp. | 278,092 | 11,957,956 | ||||||
| Life Sciences Tools & Services–4.32% | ||||||||
Bruker Corp.(b) | 481,697 | 9,662,842 | ||||||
Fluidigm Corp.(b) | 321,747 | 8,757,953 | ||||||
PAREXEL International Corp.(b) | 176,064 | 9,937,052 | ||||||
Techne Corp. | 93,461 | 8,927,395 | ||||||
| 37,285,242 | ||||||||
| Marine–0.55% | ||||||||
Kirby Corp.(b) | 39,503 | 4,712,313 | ||||||
| Movies & Entertainment–1.94% | ||||||||
Cinemark Holdings, Inc. | 294,583 | 10,395,834 | ||||||
Lions Gate Entertainment Corp. | 195,332 | 6,330,710 | ||||||
| 16,726,544 | ||||||||
| Shares | Value | |||||||
| Office Services & Supplies–1.01% | ||||||||
Steelcase Inc.–Class A | 553,942 | $ | 8,696,889 | |||||
| Oil & Gas Equipment & Services–1.69% | ||||||||
Dril-Quip, Inc.(b) | 56,208 | 5,703,426 | ||||||
Superior Energy Services, Inc. | 247,327 | 8,864,199 | ||||||
| 14,567,625 | ||||||||
| Oil & Gas Exploration & Production–2.40% | ||||||||
Diamondback Energy Inc.(b) | 105,797 | 9,135,571 | ||||||
PDC Energy, Inc.(b) | 120,221 | 7,224,080 | ||||||
Stone Energy Corp.(b) | 123,027 | 4,329,320 | ||||||
| 20,688,971 | ||||||||
| Packaged Foods & Meats–2.38% | ||||||||
B&G Foods Inc. | 148,994 | 4,499,619 | ||||||
TreeHouse Foods, Inc.(b) | 114,210 | 9,424,609 | ||||||
WhiteWave Foods Co.–Class A(b) | 189,236 | 6,627,045 | ||||||
| 20,551,273 | ||||||||
| Pharmaceuticals–2.53% | ||||||||
Impax Laboratories, Inc.(b) | 367,649 | 9,058,871 | ||||||
Pacira Pharmaceuticals, Inc.(b)(c) | 118,194 | 12,795,683 | ||||||
| 21,854,554 | ||||||||
| Regional Banks–3.00% | ||||||||
East West Bancorp, Inc. | 233,303 | 8,128,277 | ||||||
Signature Bank(b) | 63,178 | 7,484,066 | ||||||
SVB Financial Group(b) | 92,523 | 10,299,660 | ||||||
| 25,912,003 | ||||||||
| Restaurants–2.40% | ||||||||
Fiesta Restaurant Group, Inc.(b) | 126,294 | 6,199,772 | ||||||
Jack in the Box Inc. | 117,358 | 6,976,933 | ||||||
Texas Roadhouse, Inc. | 283,152 | 7,529,012 | ||||||
| 20,705,717 | ||||||||
| Semiconductors–5.14% | ||||||||
Atmel Corp.(b) | 1,001,241 | 8,870,995 | ||||||
Cavium Inc.(b) | 179,304 | 10,073,299 | ||||||
Integrated Device Technology, Inc.(b) | 651,691 | 10,720,317 | ||||||
Power Integrations, Inc. | 129,106 | 7,717,957 | ||||||
Silicon Laboratories Inc.(b) | 154,248 | 6,992,062 | ||||||
| 44,374,630 | ||||||||
| Specialty Chemicals–1.79% | ||||||||
Cytec Industries Inc. | 70,502 | 7,264,526 | ||||||
PolyOne Corp. | 209,389 | 8,212,237 | ||||||
| 15,476,763 | ||||||||
| Specialty Stores–0.52% | ||||||||
Tractor Supply Co. | 67,472 | 4,517,250 | ||||||
| Steel–0.81% | ||||||||
Commercial Metals Co. | 405,532 | 7,007,593 | ||||||
| Systems Software–0.67% | ||||||||
CommVault Systems, Inc.(b) | 104,463 | 5,760,090 | ||||||
See accompanying Notes to Financial Statements which are an integral part of the financial statements.
10 Invesco Small Cap Discovery Fund
| Shares | Value | |||||||
| Trading Companies & Distributors–0.83% | ||||||||
WESCO International, Inc.(b)(c) | 85,254 | $ | 7,160,484 | |||||
| Trucking–0.71% | ||||||||
Werner Enterprises, Inc. | 247,212 | 6,155,579 | ||||||
Total Common Stocks |
| 845,993,193 | ||||||
Money Market Funds–2.29% |
| |||||||
Liquid Assets Portfolio– | 9,904,996 | 9,904,996 | ||||||
Premier Portfolio– | 9,904,997 | 9,904,997 | ||||||
Total Money Market Funds |
| 19,809,993 | ||||||
TOTAL INVESTMENTS (excluding investments purchased with cash collateral from securities on loan)–100.30% |
| 865,803,186 | ||||||
| Shares | Value | |||||||
Investments Purchased with Cash |
| |||||||
Money Market Funds–3.53% |
| |||||||
Liquid Assets Portfolio–Institutional Class | 30,464,565 | $ | 30,464,565 | |||||
TOTAL INVESTMENTS–103.83% |
| 896,267,751 | ||||||
OTHER ASSETS LESS LIABILITIES–(3.83)% |
| (33,086,801 | ) | |||||
NET ASSETS–100.00% |
| $ | 863,180,950 | |||||
Notes to Schedule of Investments:
| (a) | Industry and/or sector classifications used in this report are generally according to the Global Industry Classification Standard, which was developed by and is the exclusive property and a service mark of MSCI Inc. and Standard & Poor’s. |
| (b) | Non-income producing security. |
| (c) | All or a portion of this security was out on loan at August 31, 2014. |
| (d) | The money market fund and the Fund are affiliated by having the same investment adviser. |
| (e) | The security has been segregated to satisfy the commitment to return the cash collateral received in securities lending transactions upon the borrower’s return of the securities loaned. See Note 1I. The following table presents the Fund’s gross and net amount of assets available for offset by the Fund as of August 31, 2014. |
| Counterparty | Gross Amount of Securities on Loan at Value | Cash Collateral Received for Securities Loaned* | Net Amount | |||||||||
Brown Brothers Harriman | $ | 30,037,728 | $ | (30,037,728 | ) | $ | — | |||||
| * | Amount does not include excess collateral received. |
See accompanying Notes to Financial Statements which are an integral part of the financial statements.
11 Invesco Small Cap Discovery Fund
Statement of Assets and Liabilities
August 31, 2014
Assets: | ||||
Investments, at value (Cost $651,054,938)* | $ | 845,993,193 | ||
Investments in affiliated money market funds, at value and cost | 50,274,558 | |||
Total investments, at value (Cost $701,329,496) | 896,267,751 | |||
Receivable for: | ||||
Investments sold | 1,259,273 | |||
Fund shares sold | 807,352 | |||
Dividends | 288,981 | |||
Investment for trustee deferred compensation and retirement plans | 106,280 | |||
Other assets | 32,598 | |||
Total assets | 898,762,235 | |||
Liabilities: | ||||
Payable for: | ||||
Investments purchased | 2,136,229 | |||
Fund shares reacquired | 2,132,170 | |||
Collateral upon return of securities loaned | 30,464,565 | |||
Accrued fees to affiliates | 646,329 | |||
Accrued trustees’ and officers’ fees and benefits | 4,406 | |||
Accrued other operating expenses | 73,401 | |||
Trustee deferred compensation and retirement plans | 124,185 | |||
Total liabilities | 35,581,285 | |||
Net assets applicable to shares outstanding | $ | 863,180,950 | ||
Net assets consist of: | ||||
Shares of beneficial interest | $ | 565,759,624 | ||
Undistributed net investment income (loss) | (4,993,149 | ) | ||
Undistributed net realized gain | 107,476,220 | |||
Net unrealized appreciation | 194,938,255 | |||
| $ | 863,180,950 | |||
Net Assets: | ||||
Class A | $ | 527,759,073 | ||
Class B | $ | 10,216,343 | ||
Class C | $ | 55,961,379 | ||
Class Y | $ | 114,973,323 | ||
Class R5 | $ | 45,125,611 | ||
Class R6 | $ | 109,145,221 | ||
Shares outstanding, $0.01 par value per share, |
| |||
Class A | 44,619,321 | |||
Class B | 950,713 | |||
Class C | 5,490,369 | |||
Class Y | 9,424,235 | |||
Class R5 | 3,688,318 | |||
Class R6 | 8,910,213 | |||
Class A: | ||||
Net asset value per share | $ | 11.83 | ||
Maximum offering price per share | ||||
(Net asset value of $11.83 ¸ 94.50%) | $ | 12.52 | ||
Class B: | ||||
Net asset value and offering price per share | $ | 10.75 | ||
Class C: | ||||
Net asset value and offering price per share | $ | 10.19 | ||
Class Y: | ||||
Net asset value and offering price per share | $ | 12.20 | ||
Class R5: | ||||
Net asset value and offering price per share | $ | 12.23 | ||
Class R6: | ||||
Net asset value and offering price per share | $ | 12.25 | ||
| * | At August 31, 2014, securities with an aggregate value of $30,037,728 were on loan to brokers. |
See accompanying Notes to Financial Statements which are an integral part of the financial statements.
12 Invesco Small Cap Discovery Fund
Statement of Operations
For the year ended August 31, 2014
Investment income: |
| |||
Dividends (net of foreign withholding taxes of $24,001) | $ | 4,107,649 | ||
Dividends from affiliated money market funds (includes securities lending income of $283,995) | 295,791 | |||
Total investment income | 4,403,440 | |||
Expenses: | ||||
Advisory fees | 7,238,017 | |||
Administrative services fees | 239,299 | |||
Custodian fees | 34,408 | |||
Distribution fees: | ||||
Class A | 1,431,312 | |||
Class B | 29,970 | |||
Class C | 581,886 | |||
Transfer agent fees — A, B, C and Y | 1,863,471 | |||
Transfer agent fees — R5 | 47,679 | |||
Transfer agent fees — R6 | 862 | |||
Trustees’ and officers’ fees and benefits | 51,936 | |||
Other | 232,061 | |||
Total expenses | 11,750,901 | |||
Less: Fees waived and expense offset arrangement(s) | (41,029 | ) | ||
Net expenses | 11,709,872 | |||
Net investment income (loss) | (7,306,432 | ) | ||
Realized and unrealized gain (loss) from: | ||||
Net realized gain from investment securities (includes net gains (losses) from securities sold to affiliates of $(112,437)) | 145,820,748 | |||
Change in net unrealized appreciation (depreciation) of investment securities | (25,746,767 | ) | ||
Net realized and unrealized gain | 120,073,981 | |||
Net increase in net assets resulting from operations | $ | 112,767,549 | ||
See accompanying Notes to Financial Statements which are an integral part of the financial statements.
13 Invesco Small Cap Discovery Fund
Statement of Changes in Net Assets
For the years ended August 31, 2014 and 2013
| 2014 | 2013 | |||||||
Operations: | ||||||||
Net investment income (loss) | $ | (7,306,432 | ) | $ | (5,883,310 | ) | ||
Net realized gain | 145,820,748 | 129,642,296 | ||||||
Change in net unrealized appreciation (depreciation) | (25,746,767 | ) | 67,156,020 | |||||
Net increase in net assets resulting from operations | 112,767,549 | 190,915,006 | ||||||
Distributions to shareholders from net realized gains: | ||||||||
Class A | (83,192,368 | ) | (58,971,398 | ) | ||||
Class B | (1,952,149 | ) | (1,402,434 | ) | ||||
Class C | (9,359,747 | ) | (5,257,156 | ) | ||||
Class Y | (24,205,240 | ) | (19,373,899 | ) | ||||
Class R5 | (6,651,766 | ) | (981 | ) | ||||
Class R6 | (10,227,636 | ) | (981 | ) | ||||
Total distributions from net realized gains | (135,588,906 | ) | (85,006,849 | ) | ||||
Share transactions–net: | ||||||||
Class A | 1,500,037 | (135,546,440 | ) | |||||
Class B | (1,951,636 | ) | (2,685,853 | ) | ||||
Class C | 5,350,077 | (469,868 | ) | |||||
Class Y | (42,967,605 | ) | (68,806,533 | ) | ||||
Class R5 | 1,899,903 | 43,871,511 | ||||||
Class R6 | 39,545,974 | 64,674,752 | ||||||
Net increase (decrease) in net assets resulting from share transactions | 3,376,750 | (98,962,431 | ) | |||||
Net increase (decrease) in net assets | (19,444,607 | ) | 6,945,726 | |||||
Net assets: | ||||||||
Beginning of year | 882,625,557 | 875,679,831 | ||||||
End of year (includes undistributed net investment income (loss) of $(4,993,149) and $(5,110,520), respectively) | $ | 863,180,950 | $ | 882,625,557 | ||||
Notes to Financial Statements
August 31, 2014
NOTE 1—Significant Accounting Policies
Invesco Small Cap Discovery Fund (the “Fund”) is a series portfolio of AIM Counselor Series Trust (Invesco Counselor Series Trust) (the “Trust”). The Trust is a Delaware statutory trust registered under the Investment Company Act of 1940, as amended (the “1940 Act”), as an open-end series management investment company consisting of thirteen separate portfolios, each authorized to issue an unlimited number of shares of beneficial interest. The assets, liabilities and operations of each portfolio are accounted for separately. Information presented in these financial statements pertains only to the Fund. Matters affecting each portfolio or class will be voted on exclusively by the shareholders of such portfolio or class.
The Fund’s investment objective is to seek capital appreciation.
The Fund currently consists of six different classes of shares: Class A, Class B, Class C, Class Y, Class R5 and Class R6. Class A shares are sold with a front-end sales charge unless certain waiver criteria are met and under certain circumstances load waived shares may be subject to contingent deferred sales charges (“CDSC”). Class C shares are sold with a CDSC. Class Y, Class R5 and Class R6 shares are sold at net asset value. Effective November 30, 2010, new or additional investments in Class B shares are no longer permitted. Existing shareholders of Class B shares may continue to reinvest dividends and capital gains distributions in Class B shares until they convert to Class A shares. Also, shareholders in Class B shares will be able to exchange those shares for Class B shares of other Invesco Funds offering such shares until they convert to Class A shares. Generally, Class B shares will automatically convert to Class A shares on or about the month-end, which is at least eight years after the date of purchase. Redemption of Class B shares prior to the conversion date will be subject to a CDSC.
The following is a summary of the significant accounting policies followed by the Fund in the preparation of its financial statements.
| A. | Security Valuations — Securities, including restricted securities, are valued according to the following policy. |
A security listed or traded on an exchange (except convertible securities) is valued at its last sales price or official closing price as of the close of the customary trading session on the exchange where the security is principally traded, or lacking any sales or official closing price on a particular day, the security may be valued at the closing bid price on that day. Securities traded in the over-the-counter market are valued based on prices furnished by independent pricing services or market makers. When such securities are valued by an independent pricing service they may be considered fair valued. Futures contracts are valued at the final settlement price set by an exchange on which they are principally traded. Listed options are valued at the mean between the last bid and ask prices from the exchange on which they are principally traded. Options not
14 Invesco Small Cap Discovery Fund
listed on an exchange are valued by an independent source at the mean between the last bid and ask prices. For purposes of determining net asset value per share, futures and option contracts generally are valued 15 minutes after the close of the customary trading session of the New York Stock Exchange (“NYSE”).
Investments in open-end and closed-end registered investment companies that do not trade on an exchange are valued at the end of day net asset value per share. Investments in open-end and closed-end registered investment companies that trade on an exchange are valued at the last sales price or official closing price as of the close of the customary trading session on the exchange where the security is principally traded.
Debt obligations (including convertible securities) and unlisted equities are fair valued using an evaluated quote provided by an independent pricing service. Evaluated quotes provided by the pricing service may be determined without exclusive reliance on quoted prices, and may reflect appropriate factors such as institution-size trading in similar groups of securities, developments related to specific securities, dividend rate (for unlisted equities), yield (for debt obligations), quality, type of issue, coupon rate (for debt obligations), maturity (for debt obligations), individual trading characteristics and other market data. Debt obligations are subject to interest rate and credit risks. In addition, all debt obligations involve some risk of default with respect to interest and/or principal payments.
Foreign securities’ (including foreign exchange contracts) prices are converted into U.S. dollar amounts using the applicable exchange rates as of the close of the NYSE. If market quotations are available and reliable for foreign exchange-traded equity securities, the securities will be valued at the market quotations. Because trading hours for certain foreign securities end before the close of the NYSE, closing market quotations may become unreliable. If between the time trading ends on a particular security and the close of the customary trading session on the NYSE, events occur that the Adviser determines are significant and make the closing price unreliable, the Fund may fair value the security. If the event is likely to have affected the closing price of the security, the security will be valued at fair value in good faith using procedures approved by the Board of Trustees. Adjustments to closing prices to reflect fair value may also be based on a screening process of an independent pricing service to indicate the degree of certainty, based on historical data, that the closing price in the principal market where a foreign security trades is not the current value as of the close of the NYSE. Foreign securities’ prices meeting the approved degree of certainty that the price is not reflective of current value will be priced at the indication of fair value from the independent pricing service. Multiple factors may be considered by the independent pricing service in determining adjustments to reflect fair value and may include information relating to sector indices, American Depositary Receipts and domestic and foreign index futures. Foreign securities may have additional risks including exchange rate changes, potential for sharply devalued currencies and high inflation, political and economic upheaval, the relative lack of issuer information, relatively low market liquidity and the potential lack of strict financial and accounting controls and standards.
Securities for which market prices are not provided by any of the above methods may be valued based upon quotes furnished by independent sources. The last bid price may be used to value equity securities. The mean between the last bid and asked prices is used to value debt obligations, including corporate loans.
Securities for which market quotations are not readily available or became unreliable are valued at fair value as determined in good faith by or under the supervision of the Trust’s officers following procedures approved by the Board of Trustees. Issuer specific events, market trends, bid/ask quotes of brokers and information providers and other market data may be reviewed in the course of making a good faith determination of a security’s fair value.
The Fund may invest in securities that are subject to interest rate risk, meaning the risk that the prices will generally fall as interest rates rise and, conversely, the prices will generally rise as interest rates fall. Specific securities differ in their sensitivity to changes in interest rates depending on their individual characteristics. Changes in interest rates may result in increased market volatility, which may affect the value and/or liquidity of certain of the Fund’s investments.
Valuations change in response to many factors including the historical and prospective earnings of the issuer, the value of the issuer’s assets, general economic conditions, interest rates, investor perceptions and market liquidity. Because of the inherent uncertainties of valuation, the values reflected in the financial statements may materially differ from the value received upon actual sale of those investments.
| B. | Securities Transactions and Investment Income — Securities transactions are accounted for on a trade date basis. Realized gains or losses on sales are computed on the basis of specific identification of the securities sold. Interest income (net of withholding tax, if any) is recorded on the accrual basis from settlement date. Dividend income (net of withholding tax, if any) is recorded on the ex-dividend date. |
The Fund may periodically participate in litigation related to Fund investments. As such, the Fund may receive proceeds from litigation settlements. Any proceeds received are included in the Statement of Operations as realized gain (loss) for investments no longer held and as unrealized gain (loss) for investments still held.
Brokerage commissions and mark ups are considered transaction costs and are recorded as an increase to the cost basis of securities purchased and/or a reduction of proceeds on a sale of securities. Such transaction costs are included in the determination of net realized and unrealized gain (loss) from investment securities reported in the Statement of Operations and the Statement of Changes in Net Assets and the net realized and unrealized gains (losses) on securities per share in the Financial Highlights. Transaction costs are included in the calculation of the Fund’s net asset value and, accordingly, they reduce the Fund’s total returns. These transaction costs are not considered operating expenses and are not reflected in net investment income reported in the Statement of Operations and Statement of Changes in Net Assets, or the net investment income per share and ratios of expenses and net investment income reported in the Financial Highlights, nor are they limited by any expense limitation arrangements between the Fund and the investment adviser.
The Fund allocates income and realized and unrealized capital gains and losses to a class based on the relative net assets of each class.
| C. | Country Determination — For the purposes of making investment selection decisions and presentation in the Schedule of Investments, the investment adviser may determine the country in which an issuer is located and/or credit risk exposure based on various factors. These factors include the laws of the country under which the issuer is organized, where the issuer maintains a principal office, the country in which the issuer derives 50% or more of its total revenues and the country that has the primary market for the issuer’s securities, as well as other criteria. Among the other criteria that may be evaluated for making this determination are the country in which the issuer maintains 50% or more of its assets, the type of security, financial guarantees and enhancements, the nature of the collateral and the sponsor organization. Country of issuer and/or credit risk exposure has been determined to be the United States of America, unless otherwise noted. |
15 Invesco Small Cap Discovery Fund
| D. | Distributions — Distributions from net investment income and net realized capital gain, if any, are generally declared and paid annually and recorded on the ex-dividend date. The Fund may elect to treat a portion of the proceeds from redemptions as distributions for federal income tax purposes. |
| E. | Federal Income Taxes — The Fund intends to comply with the requirements of Subchapter M of the Internal Revenue Code of 1986, as amended (the “Internal Revenue Code”), necessary to qualify as a regulated investment company and to distribute substantially all of the Fund’s taxable earnings to shareholders. As such, the Fund will not be subject to federal income taxes on otherwise taxable income (including net realized capital gain) that is distributed to shareholders. Therefore, no provision for federal income taxes is recorded in the financial statements. |
The Fund recognizes the tax benefits of uncertain tax positions only when the position is more likely than not to be sustained. Management has analyzed the Fund’s uncertain tax positions and concluded that no liability for unrecognized tax benefits should be recorded related to uncertain tax positions. Management is not aware of any tax positions for which it is reasonably possible that the total amounts of unrecognized tax benefits will change materially in the next 12 months.
The Fund files tax returns in the U.S. Federal jurisdiction and certain other jurisdictions. Generally, the Fund is subject to examinations by such taxing authorities for up to three years after the filing of the return for the tax period.
| F. | Expenses — Fees provided for under the Rule 12b-1 plan of a particular class of the Fund are charged to the operations of such class. Transfer agency fees and expenses and other shareholder recordkeeping fees and expenses attributable to Class R5 and Class R6 are allocated to each share class based on relative net assets. Sub-accounting fees attributable to Class R5 are charged to the operations of the class. Transfer agency fees and expenses and other shareholder recordkeeping fees and expenses relating to all other classes are allocated among those classes based on relative net assets. All other expenses are allocated among the classes based on relative net assets. Prior to June 1, 2010, incremental transfer agency fees which were unique to each class of shares were charged to the operations of such class. |
| G. | Accounting Estimates — The preparation of financial statements in conformity with accounting principles generally accepted in the United States of America (“GAAP”) requires management to make estimates and assumptions that affect the reported amounts of assets and liabilities at the date of the financial statements and the reported amounts of revenues and expenses during the reporting period including estimates and assumptions related to taxation. Actual results could differ from those estimates by a significant amount. In addition, the Fund monitors for material events or transactions that may occur or become known after the period-end date and before the date the financial statements are released to print. |
| H. | Indemnifications — Under the Trust’s organizational documents, each Trustee, officer, employee or other agent of the Trust is indemnified against certain liabilities that may arise out of the performance of their duties to the Fund. Additionally, in the normal course of business, the Fund enters into contracts, including the Fund’s servicing agreements, that contain a variety of indemnification clauses. The Fund’s maximum exposure under these arrangements is unknown as this would involve future claims that may be made against the Fund that have not yet occurred. The risk of material loss as a result of such indemnification claims is considered remote. |
| I. | Securities Lending — The Fund may lend portfolio securities having a market value up to one-third of the Fund’s total assets. Such loans are secured by collateral equal to no less than the market value of the loaned securities determined daily by the securities lending provider. Such collateral will be cash or debt securities issued or guaranteed by the U.S. Government or any of its sponsored agencies. Cash collateral received in connection with these loans is invested in short-term money market instruments or affiliated money market funds and is shown as such on the Schedule of Investments. It is the Fund’s policy to obtain additional collateral from or return excess collateral to the borrower by the end of the next business day, following the valuation date of the securities loaned. Therefore, the value of the collateral held may be temporarily less than the value of the securities on loan. Lending securities entails a risk of loss to the Fund if, and to the extent that, the market value of the securities loaned were to increase and the borrower did not increase the collateral accordingly, and the borrower failed to return the securities. Upon the failure of the borrower to return the securities, collateral may be liquidated and the securities may be purchased on the open market to replace the loaned securities. The Fund could experience delays and costs in gaining access to the collateral. The Fund bears the risk of any deficiency in the amount of the collateral available for return to the borrower due to any loss on the collateral invested. Dividends received on cash collateral investments for securities lending transactions, which are net of compensation to counterparties, is included in Dividends from affiliated money market funds on the Statement of Operations. The aggregate value of securities out on loan is shown as a footnote on the Statement of Assets and Liabilities, if any. |
NOTE 2—Advisory Fees and Other Fees Paid to Affiliates
The Trust has entered into a master investment advisory agreement with Invesco Advisers, Inc. (the “Adviser” or “Invesco”). Under the terms of the investment advisory agreement, the Fund pays an advisory fee to the Adviser based on the annual rate of the Fund’s average daily net assets as follows:
| Average Daily Net Assets | Rate | |||
First $500 million | 0.80% | |||
Next $500 million | 0.75% | |||
Over $1 billion | 0.70% | |||
Under the terms of a master sub-advisory agreement between the Adviser and each of Invesco Asset Management Deutschland GmbH, Invesco Asset Management Limited, Invesco Asset Management (Japan) Limited, Invesco Australia Limited, Invesco Hong Kong Limited, Invesco Senior Secured Management, Inc. and Invesco Canada Ltd. (collectively, the “Affiliated Sub-Advisers”) the Adviser, not the Fund, may pay 40% of the fees paid to the Adviser to any such Affiliated Sub-Adviser(s) that provide(s) discretionary investment management services to the Fund based on the percentage of assets allocated to such Sub-Adviser(s).
The Adviser has contractually agreed, through at least June 30, 2015, to waive advisory fees and/or reimburse expenses to the extent necessary to limit total annual fund operating expenses after fee waiver and/or expense reimbursement (excluding certain items discussed below) of Class A, Class B, Class C, Class Y, Class R5 and Class R6 shares to 2.00%, 2.75%, 2.75%, 1.75%, 1.75% and 1.75% of average daily net assets, respectively. In determining the Adviser’s obligation to waive advisory fees and/or reimburse expenses, the following expenses are not taken into account, and could cause total annual fund operating expenses after fee waiver and/or reimbursement to exceed the numbers reflected above:
16 Invesco Small Cap Discovery Fund
(1) interest; (2) taxes; (3) dividend expense on short sales; (4) extraordinary or non-routine items, including litigation expenses; and (5) expenses that the Fund has incurred but did not actually pay because of an expense offset arrangement. Unless Invesco continues the fee waiver agreement, it will terminate on June 30, 2015. The fee waiver agreement cannot be terminated during its term. The Adviser did not waive fees and/or reimburse expenses during the period under this expense limitation.
Further, the Adviser has contractually agreed, through at least June 30, 2016, to waive the advisory fee payable by the Fund in an amount equal to 100% of the net advisory fees the Adviser receives from the affiliated money market funds on investments by the Fund of uninvested cash (excluding investments of cash collateral from securities lending) in such affiliated money market funds.
For the year ended August 31, 2014, the Adviser waived advisory fees of $39,999.
The Trust has entered into a master administrative services agreement with Invesco pursuant to which the Fund has agreed to pay Invesco for certain administrative costs incurred in providing accounting services to the Fund. For the year ended August 31, 2014, expenses incurred under the agreement are shown in the Statement of Operations as Administrative services fees.
The Trust has entered into a transfer agency and service agreement with Invesco Investment Services, Inc. (“IIS”) pursuant to which the Fund has agreed to pay IIS a fee for providing transfer agency and shareholder services to the Fund and reimburse IIS for certain expenses incurred by IIS in the course of providing such services. IIS may make payments to intermediaries that provide omnibus account services, sub-accounting services and/or networking services. All fees payable by IIS to intermediaries that provide omnibus account services or sub-accounting are charged back to the Fund, subject to certain limitations approved by the Trust’s Board of Trustees. For the year ended August 31, 2014, the expenses incurred under the agreement are shown in the Statement of Operations as Transfer agent fees.
Shares of the Fund are distributed by Invesco Distributors, Inc. (“IDI”). The Fund has adopted a distribution plan pursuant to Rule 12b-1 under the 1940 Act, and a service plan (collectively, the “Plans”) for Class A shares, Class B shares and Class C shares to compensate IDI for the sale, distribution, shareholder servicing and maintenance of shareholder accounts for these shares. Under the Plans, the Fund will incur annual fees of up to 0.25% of Class A average daily net assets and up to 1.00% each of Class B and Class C average daily net assets.
With respect to Class B and Class C shares, the Fund is authorized to reimburse in future years any distribution related expenses that exceed the maximum annual reimbursement rate for such class, so long as such reimbursement does not cause the Fund to exceed the Class B and Class C maximum annual reimbursement rate, respectively. With respect to Class A shares, distribution related expenses that exceed the maximum annual reimbursement rate for such class are not carried forward to future years and the Fund will not reimburse IDI for any such expenses.
For the year ended August 31, 2014, expenses incurred under these agreements are shown in the Statement of Operations as Distribution fees.
Front-end sales commissions and CDSC (collectively, the “sales charges”) are not recorded as expenses of the Fund. Front-end sales commissions are deducted from proceeds from the sales of Fund shares prior to investment in Class A shares of the Fund. CDSC are deducted from redemption proceeds prior to remittance to the shareholder. During the year ended August 31, 2014, IDI advised the Fund that IDI retained $142,155 in front-end sales commissions from the sale of Class A shares and $2,532, $3,926 and $3,895 from Class A, Class B and Class C shares, respectively, for CDSC imposed on redemptions by shareholders.
For the year ended August 31, 2014, the Fund incurred $17,581 in brokerage commissions with Invesco Capital Markets, Inc., an affiliate of the Adviser and IDI, for portfolio transactions executed on behalf of the Fund.
Certain officers and trustees of the Trust are officers and directors of the Adviser, IIS and/or IDI.
NOTE 3—Additional Valuation Information
GAAP defines fair value as the price that would be received to sell an asset or paid to transfer a liability in an orderly transaction between market participants at the measurement date, under current market conditions. GAAP establishes a hierarchy that prioritizes the inputs to valuation methods, giving the highest priority to readily available unadjusted quoted prices in an active market for identical assets (Level 1) and the lowest priority to significant unobservable inputs (Level 3), generally when market prices are not readily available or are unreliable. Based on the valuation inputs, the securities or other investments are tiered into one of three levels. Changes in valuation methods may result in transfers in or out of an investment’s assigned level:
| Level 1 — | Prices are determined using quoted prices in an active market for identical assets. |
| Level 2 — | Prices are determined using other significant observable inputs. Observable inputs are inputs that other market participants may use in pricing a security. These may include quoted prices for similar securities, interest rates, prepayment speeds, credit risk, yield curves, loss severities, default rates, discount rates, volatilities and others. |
| Level 3 — | Prices are determined using significant unobservable inputs. In situations where quoted prices or observable inputs are unavailable (for example, when there is little or no market activity for an investment at the end of the period), unobservable inputs may be used. Unobservable inputs reflect the Fund’s own assumptions about the factors market participants would use in determining fair value of the securities or instruments and would be based on the best available information. |
As of August 31, 2014, all of the securities in this Fund were valued based on Level 1 inputs (see the Schedule of Investments for security categories). The level assigned to the securities valuations may not be an indication of the risk or liquidity associated with investing in those securities. Because of the inherent uncertainties of valuation, the values reflected in the financial statements may materially differ from the value received upon actual sale of those investments.
NOTE 4—Security Transactions with Affiliated Funds
The Fund is permitted to purchase or sell securities from or to certain other Invesco Funds under specified conditions outlined in procedures adopted by the Board of Trustees of the Trust. The procedures have been designed to ensure that any purchase or sale of securities by the Fund from or to another fund or portfolio that is or could be considered an affiliate by virtue of having a common investment adviser (or affiliated investment advisers), common Trustees and/or common officers complies with Rule 17a-7 of the 1940 Act. Further, as defined under the procedures, each transaction is effected at the current market price. Pursuant to these procedures, for the year ended August 31, 2014, the Fund engaged in securities purchases of $183,285 and securities sales of $929,400, which resulted in net realized gains (losses) of $(112,437).
17 Invesco Small Cap Discovery Fund
NOTE 5—Expense Offset Arrangement(s)
The expense offset arrangement is comprised of transfer agency credits which result from balances in demand deposit accounts used by the transfer agent for clearing shareholder transactions. For the year ended August 31, 2014, the Fund received credits from this arrangement, which resulted in the reduction of the Fund’s total expenses of $1,030.
NOTE 6—Trustees’ and Officers’ Fees and Benefits
Trustees’ and Officers’ Fees and Benefits include amounts accrued by the Fund to pay remuneration to certain Trustees and Officers of the Fund. Trustees have the option to defer compensation payable by the Fund, and Trustees’ and Officers’ Fees and Benefits also include amounts accrued by the Fund to fund such deferred compensation amounts. Those Trustees who defer compensation have the option to select various Invesco Funds in which their deferral accounts shall be deemed to be invested. Finally, certain current Trustees were eligible to participate in a retirement plan that provided for benefits to be paid upon retirement to Trustees over a period of time based on the number of years of service. The Fund may have certain former Trustees who also participate in a retirement plan and receive benefits under such plan. Trustees’ and Officers’ Fees and Benefits include amounts accrued by the Fund to fund such retirement benefits. Obligations under the deferred compensation and retirement plans represent unsecured claims against the general assets of the Fund.
NOTE 7—Cash Balances
The Fund is permitted to temporarily carry a negative or overdrawn balance in its account with State Street Bank and Trust Company, the custodian bank. Such balances, if any at period end, are shown in the Statement of Assets and Liabilities under the payable caption Amount due custodian. To compensate the custodian bank for such overdrafts, the overdrawn Fund may either (1) leave funds as a compensating balance in the account so the custodian bank can be compensated by earning the additional interest; or (2) compensate by paying the custodian bank at a rate agreed upon by the custodian bank and Invesco, not to exceed the contractually agreed upon rate.
NOTE 8—Distributions to Shareholders and Tax Components of Net Assets
Tax Character of Distributions to Shareholders Paid During the Years Ended August 31, 2014 and 2013:
| 2014 | 2013 | |||||||
Ordinary income | $ | 26,321,533 | $ | — | ||||
Long-term capital gain | 109,267,373 | 85,006,849 | ||||||
Total distributions | $ | 135,588,906 | $ | 85,006,849 | ||||
Tax Components of Net Assets at Period-End:
| 2014 | ||||
Undistributed long-term gain | $ | 115,029,655 | ||
Net unrealized appreciation — investments | 192,931,459 | |||
Temporary book/tax differences | (112,786 | ) | ||
Post-October Capital loss deferral | (5,546,639 | ) | ||
Late-Year ordinary loss deferral | (4,880,363 | ) | ||
Shares of beneficial interest | 565,759,624 | |||
Total net assets | $ | 863,180,950 | ||
The difference between book-basis and tax-basis unrealized appreciation is due to differences in the timing of recognition of gains and losses on investments for tax and book purposes. The Fund’s net unrealized appreciation difference is attributable primarily to wash sales.
The temporary book/tax differences are a result of timing differences between book and tax recognition of income and/or expenses. The Fund’s temporary book/tax differences are the result of the trustee deferral of compensation and retirement plan benefits.
Capital loss carryforward is calculated and reported as of a specific date. Results of transactions and other activity after that date may affect the amount of capital loss carryforward actually available for the Fund to utilize. Capital losses generated in years beginning after December 22, 2010 can be carried forward for an unlimited period, whereas previous losses expire in 8 tax years. Capital losses with an expiration period may not be used to offset capital gains until all net capital losses without an expiration date have been utilized. Capital loss carryforwards with no expiration date will retain their character as either short-term or long-term capital losses instead of as short-term capital losses as under prior law. The ability to utilize capital loss carryforward in the future may be limited under the Internal Revenue Code and related regulations based on the results of future transactions.
The Fund does not have a capital loss carryforward as of August 31, 2014.
18 Invesco Small Cap Discovery Fund
NOTE 9—Investment Securities
The aggregate amount of investment securities (other than short-term securities, U.S. Treasury obligations and money market funds, if any) purchased and sold by the Fund during the year ended August 31, 2014 was $714,107,973 and $834,936,418, respectively. Cost of investments on a tax basis includes the adjustments for financial reporting purposes as of the most recently completed federal income tax reporting period-end.
| Unrealized Appreciation (Depreciation) of Investment Securities on a Tax Basis | ||||
Aggregate unrealized appreciation of investment securities | $ | 207,876,077 | ||
Aggregate unrealized (depreciation) of investment securities | (14,944,618 | ) | ||
Net unrealized appreciation of investment securities | $ | 192,931,459 | ||
Cost of investments for tax purposes is $703,336,292.
NOTE 10—Reclassification of Permanent Differences
Primarily as a result of differing book/tax treatment of net operating losses, on August 31, 2014, undistributed net investment income (loss) was increased by $7,423,803, undistributed net realized gain was decreased by $3,167,038 and shares of beneficial interest was decreased by $4,256,765. This reclassification had no effect on the net assets of the Fund.
NOTE 11—Share Information
| Summary of Share Activity | ||||||||||||||||
| Years ended August 31, | ||||||||||||||||
| 2014(a) | 2013 | |||||||||||||||
| Shares | Amount | Shares | Amount | |||||||||||||
Sold: | ||||||||||||||||
Class A | 11,162,845 | $ | 136,194,937 | 10,723,043 | $ | 120,331,339 | ||||||||||
Class B | 39,041 | 438,517 | 30,854 | 327,642 | ||||||||||||
Class C | 1,160,335 | 12,325,902 | 681,254 | 6,809,246 | ||||||||||||
Class Y | 3,179,180 | 39,762,440 | 4,691,321 | 53,193,049 | ||||||||||||
Class R5(b) | 326,211 | 4,170,947 | 3,527,315 | 44,000,899 | ||||||||||||
Class R6(b) | 3,554,223 | 41,450,915 | 5,622,923 | 66,633,393 | ||||||||||||
Issued as reinvestment of dividends: | ||||||||||||||||
Class A | 7,095,938 | 80,255,054 | 5,757,455 | 56,653,360 | ||||||||||||
Class B | 182,437 | 1,873,622 | 145,907 | 1,323,375 | ||||||||||||
Class C | 906,196 | 8,880,723 | 566,705 | 4,975,669 | ||||||||||||
Class Y | 2,050,361 | 23,866,200 | 1,902,498 | 19,139,132 | ||||||||||||
Class R5 | 570,336 | 6,650,122 | — | — | ||||||||||||
Class R6 | 876,263 | 10,225,992 | — | — | ||||||||||||
Automatic conversion of Class B shares to Class A shares: | ||||||||||||||||
Class A | 205,429 | 2,466,712 | 203,114 | 2,258,894 | ||||||||||||
Class B | (225,501 | ) | (2,466,712 | ) | (219,824 | ) | (2,258,894 | ) | ||||||||
Reacquired: | ||||||||||||||||
Class A | (18,171,031 | ) | (217,416,666 | ) | (28,300,197 | ) | (314,790,033 | ) | ||||||||
Class B | (161,282 | ) | (1,797,063 | ) | (204,268 | ) | (2,077,976 | ) | ||||||||
Class C | (1,521,901 | ) | (15,856,548 | ) | (1,238,776 | ) | (12,254,783 | ) | ||||||||
Class Y | (8,846,264 | ) | (106,596,245 | ) | (12,205,730 | ) | (141,138,714 | ) | ||||||||
Class R5 | (725,066 | ) | (8,921,166 | ) | (10,478 | ) | (129,388 | ) | ||||||||
Class R6 | (983,764 | ) | (12,130,933 | ) | (159,432 | ) | (1,958,641 | ) | ||||||||
Net increase (decrease) in share activity | 673,986 | $ | 3,376,750 | (8,486,316 | ) | $ | (98,962,431 | ) | ||||||||
| (a) | There are entities that are record owners of more than 5% of the outstanding shares of the Fund and in the aggregate own 37% of the outstanding shares of the Fund. IDI has an agreement with these entities to sell Fund shares. The Fund, Invesco and/or Invesco affiliates may make payments to these entities, which are considered to be related to the Fund, for providing services to the Fund, Invesco and/or Invesco affiliates including but not limited to services such as securities brokerage, distribution, third party record keeping and account servicing. The Fund has no knowledge as to whether all or any portion of the shares owned of record by these entities are also owned beneficially. |
| (b) | Commencement date of September 24, 2012. |
19 Invesco Small Cap Discovery Fund
NOTE 12—Financial Highlights
The following schedule presents financial highlights for a share of the Fund outstanding throughout the periods indicated.
| Net asset value, beginning of period | Net investment income (loss)(a) | Net gains (losses) on securities (both realized and unrealized) | Total from investment operations | Distributions from net realized gains | Net asset value, end of period(b) | Total return | Net assets, end of period (000’s omitted) | Ratio of with fee waivers | Ratio of expenses to average net assets without fee waivers and/or expenses absorbed | Ratio of net investment income (loss) to average net assets | Portfolio turnover(c) | |||||||||||||||||||||||||||||||||||||
Class A |
| |||||||||||||||||||||||||||||||||||||||||||||||
Year ended 08/31/14 | $ | 12.20 | $ | (0.10 | ) | $ | 1.62 | $ | 1.52 | $ | (1.89 | ) | $ | 11.83 | 13.15 | %(d) | $ | 527,759 | 1.32 | %(e) | 1.32 | %(e) | (0.85 | )%(e) | 79 | % | ||||||||||||||||||||||
Year ended 08/31/13 | 10.85 | (0.08 | ) | 2.56 | 2.48 | (1.13 | ) | 12.20 | 25.31 | (d) | 540,979 | 1.32 | 1.33 | (0.72 | ) | 70 | ||||||||||||||||||||||||||||||||
Year ended 08/31/12 | 10.56 | (0.08 | ) | 1.47 | 1.39 | (1.10 | ) | 10.85 | 14.33 | (d) | 607,073 | 1.38 | 1.43 | (0.80 | ) | 78 | ||||||||||||||||||||||||||||||||
Year ended 08/31/11 | 8.74 | (0.11 | ) | 1.93 | 1.82 | — | 10.56 | 20.82 | (d) | 820,988 | 1.38 | 1.42 | (1.01 | ) | 114 | |||||||||||||||||||||||||||||||||
Five months ended 08/31/10 | 9.62 | (0.04 | ) | (0.84 | ) | (0.88 | ) | — | 8.74 | (9.15 | )(d) | 691,456 | 1.34 | (f) | 1.34 | (f) | (1.04 | )(f) | 63 | |||||||||||||||||||||||||||||
Year ended 03/31/10 | 6.93 | (0.09 | ) | 2.78 | 2.69 | — | 9.62 | 38.82 | (g) | 748,998 | 1.39 | 1.39 | (1.04 | ) | 234 | |||||||||||||||||||||||||||||||||
Class B |
| |||||||||||||||||||||||||||||||||||||||||||||||
Year ended 08/31/14 | 11.25 | (0.09 | ) | 1.48 | 1.39 | (1.89 | ) | 10.75 | 13.11 | (d)(h) | 10,216 | 1.32 | (e)(h) | 1.32 | (e)(h) | (0.85 | )(e)(h) | 79 | ||||||||||||||||||||||||||||||
Year ended 08/31/13 | 10.09 | (0.07 | ) | 2.36 | 2.29 | (1.13 | ) | 11.25 | 25.34 | (d)(h) | 12,554 | 1.32 | (h) | 1.33 | (h) | (0.72 | )(h) | 70 | ||||||||||||||||||||||||||||||
Year ended 08/31/12 | 9.89 | (0.08 | ) | 1.38 | 1.30 | (1.10 | ) | 10.09 | 14.40 | (d)(h) | 13,754 | 1.38 | (h) | 1.43 | (h) | (0.80 | )(h) | 78 | ||||||||||||||||||||||||||||||
Year ended 08/31/11 | 8.18 | (0.11 | ) | 1.82 | 1.71 | — | 9.89 | 20.90 | (d)(h) | 16,910 | 1.40 | (h) | 1.44 | (h) | (1.03 | )(h) | 114 | |||||||||||||||||||||||||||||||
Five months ended 08/31/10 | 9.03 | (0.05 | ) | (0.80 | ) | (0.85 | ) | — | 8.18 | (9.41 | )(d)(h) | 19,249 | 1.63 | (f)(h) | 1.63 | (f)(h) | (1.33 | )(f)(h) | 63 | |||||||||||||||||||||||||||||
Year ended 03/31/10 | 6.51 | (0.09 | ) | 2.61 | 2.52 | — | 9.03 | 38.71 | (i)(j) | 23,169 | 1.53 | (j) | 1.53 | (j) | (1.19 | )(j) | 234 | |||||||||||||||||||||||||||||||
Class C |
| |||||||||||||||||||||||||||||||||||||||||||||||
Year ended 08/31/14 | 10.83 | (0.17 | ) | 1.42 | 1.25 | (1.89 | ) | 10.19 | 12.21 | (d) | 55,961 | 2.07 | (e) | 2.07 | (e) | (1.60 | )(e) | 79 | ||||||||||||||||||||||||||||||
Year ended 08/31/13 | 9.82 | (0.15 | ) | 2.29 | 2.14 | (1.13 | ) | 10.83 | 24.43 | (d) | 53,560 | 2.07 | 2.08 | (1.47 | ) | 70 | ||||||||||||||||||||||||||||||||
Year ended 08/31/12 | 9.73 | (0.15 | ) | 1.34 | 1.19 | (1.10 | ) | 9.82 | 13.43 | (d) | 48,486 | 2.13 | 2.18 | (1.55 | ) | 78 | ||||||||||||||||||||||||||||||||
Year ended 08/31/11 | 8.10 | (0.17 | ) | 1.80 | 1.63 | — | 9.73 | 20.12 | (d)(k) | 51,212 | 2.06 | (k) | 2.10 | (k) | (1.69 | )(k) | 114 | |||||||||||||||||||||||||||||||
Five months ended 08/31/10 | 8.95 | (0.07 | ) | (0.78 | ) | (0.85 | ) | — | 8.10 | (9.50 | )(d) | 53,673 | 2.09 | (f) | 2.09 | (f) | (1.79 | )(f) | 63 | |||||||||||||||||||||||||||||
Year ended 03/31/10 | 6.50 | (0.14 | ) | 2.59 | 2.45 | — | 8.95 | 37.69 | (l) | 62,523 | 2.14 | 2.14 | (1.79 | ) | 234 | |||||||||||||||||||||||||||||||||
Class Y(m) |
| |||||||||||||||||||||||||||||||||||||||||||||||
Year ended 08/31/14 | 12.50 | (0.07 | ) | 1.66 | 1.59 | (1.89 | ) | 12.20 | 13.42 | (d) | 114,973 | 1.07 | (e) | 1.07 | (e) | (0.60 | )(e) | 79 | ||||||||||||||||||||||||||||||
Year ended 08/31/13 | 11.06 | (0.05 | ) | 2.62 | 2.57 | (1.13 | ) | 12.50 | 25.67 | (d) | 163,072 | 1.07 | 1.08 | (0.47 | ) | 70 | ||||||||||||||||||||||||||||||||
Year ended 08/31/12 | 10.72 | (0.06 | ) | 1.50 | 1.44 | (1.10 | ) | 11.06 | 14.60 | (d) | 206,367 | 1.13 | 1.18 | (0.55 | ) | 78 | ||||||||||||||||||||||||||||||||
Year ended 08/31/11 | 8.84 | (0.09 | ) | 1.97 | 1.88 | — | 10.72 | 21.27 | (d) | 233,467 | 1.13 | 1.17 | (0.76 | ) | 114 | |||||||||||||||||||||||||||||||||
Five months ended 08/31/10 | 9.73 | (0.03 | ) | (0.86 | ) | (0.89 | ) | — | 8.84 | (9.15 | )(d) | 199,603 | 1.09 | (f) | 1.09 | (f) | (0.80 | )(f) | 63 | |||||||||||||||||||||||||||||
Year ended 03/31/10 | 6.99 | (0.06 | ) | 2.80 | 2.74 | — | 9.73 | 39.20 | (n) | 267,593 | 1.14 | 1.14 | (0.76 | ) | 234 | |||||||||||||||||||||||||||||||||
Class R5 |
| |||||||||||||||||||||||||||||||||||||||||||||||
Year ended 08/31/14 | 12.52 | (0.05 | ) | 1.65 | 1.60 | (1.89 | ) | 12.23 | 13.49 | (d) | 45,126 | 0.94 | (e) | 0.94 | (e) | (0.47 | )(e) | 79 | ||||||||||||||||||||||||||||||
Year ended 08/31/13(o) | 11.48 | (0.04 | ) | 2.21 | 2.17 | (1.13 | ) | 12.52 | 21.25 | (d) | 44,037 | 0.93 | (f) | 0.94 | (f) | (0.33 | )(f) | 70 | ||||||||||||||||||||||||||||||
Class R6 |
| |||||||||||||||||||||||||||||||||||||||||||||||
Year ended 08/31/14 | 12.52 | (0.04 | ) | 1.66 | 1.62 | (1.89 | ) | 12.25 | 13.67 | (d) | 109,145 | 0.84 | (e) | 0.84 | (e) | (0.37 | )(e) | 79 | ||||||||||||||||||||||||||||||
Year ended 08/31/13(o) | 11.48 | (0.03 | ) | 2.20 | 2.17 | (1.13 | ) | 12.52 | 21.25 | (d) | 68,425 | 0.83 | (f) | 0.84 | (f) | (0.23 | )(f) | 70 | ||||||||||||||||||||||||||||||
| (a) | Calculated using average shares outstanding. |
| (b) | Includes redemption fees added to shares of beneficial interest which were less than $0.005 per share, for fiscal years prior to August 31, 2013. |
| (c) | Portfolio turnover is calculated at the fund level and is not annualized for periods less than one year, if applicable. |
| (d) | Includes adjustments in accordance with accounting principles generally accepted in the United States of America and as such, the net asset value for financial reporting purposes and the returns based upon those net asset values may differ from the net asset value and returns for shareholder transactions. Does not include sales charges and is not annualized for periods less than one year, if applicable. |
| (e) | Ratios are based on average daily net assets (000’s) of $572,525, $11,988, $58,189, $156,042, $48,364 and $84,629 for Class A, Class B, Class C, Class Y, Class R5 and Class R6, respectively. |
| (f) | Annualized. |
| (g) | Assumes reinvestment of all distributions for the period and does not include payment of the maximum sales charge of 5.75% or contingent deferred sales charge (CDSC). On purchases of $1 million or more, a CDSC of 1% may be imposed on certain redemptions made within eighteen months of purchase. If the sales charges were included, total returns would be lower. These returns include combined Rule 12b-1 fees and service fees of up to 0.25% and do not reflect the deduction of taxes that a shareholder would pay on Fund distributions or the redemption of Fund shares. |
| (h) | The total return, ratio of expenses to average net assets and ratio of net investment income (loss) to average net assets reflect actual 12b-1 fees of 0.25%, 0.25%, 0.25%, 0.27% and 0.54% for the years ended August 31, 2014, August 31, 2013, August 31, 2012, August 31, 2011 and the five months ended August 31, 2010, respectively. |
| (i) | Assumes reinvestment of all distributions for the period and does not include payment of the maximum CDSC of 5%, charged on certain redemptions made within one year of purchase and declining to 0% after the fifth year. If the sales charge was included, total returns would be lower. These returns include combined Rule 12b-1 fees and service fees of up to 1% and do not reflect the deduction of taxes that a shareholder would pay on Fund distributions or the redemption of Fund shares. |
| (j) | The total return, ratio of expenses to average net assets and ratio of net investment income (loss) to average net assets reflect actual 12b-1 fees of less than 1%. |
| (k) | The total return, ratio of expenses to average net assets and ratio of net investment income (loss) to average net assets reflect actual 12b-1 fees of 0.93% for the year ended August 31, 2011. |
| (l) | Assumes reinvestment of all distributions for the period and does not include payment of the maximum CDSC of 1%, charged on certain redemptions made within one year of purchase. If the sales charge was included, total returns would be lower. These returns include combined Rule 12b-1 fees and service fees of up to 1% and do not reflect the deduction of taxes that a shareholder would pay on Fund distributions or the redemption of Fund shares. |
| (m) | On June 1, 2010, the Fund’s former Class I shares were reorganized into Class Y shares. |
| (n) | Assumes reinvestment of all distributions for the period. These returns do not reflect the deduction of taxes that a shareholder would pay on Fund distributions or the redemption on Fund shares. |
| (o) | Commencement date of September 24, 2012 for Class R5 and Class R6 shares. |
20 Invesco Small Cap Discovery Fund
Report of Independent Registered Public Accounting Firm
To the Board of Trustees of AIM Counselor Series Trust (Invesco Counselor Series Trust)
and Shareholders of Invesco Small Cap Discovery Fund:
In our opinion, the accompanying statement of assets and liabilities, including the schedule of investments, and the related statements of operations and of changes in net assets and the financial highlights present fairly, in all material respects, the financial position of Invesco Small Cap Discovery Fund (one of the funds constituting AIM Counselor Series Trust (Invesco Counselor Series Trust), hereafter referred to as the “Fund”) at August 31, 2014, the results of its operations for the year then ended, the changes in its net assets for each of the two years in the period then ended and the financial highlights for each of the four years in the period then ended and the five month period ended August 31, 2010, in conformity with accounting principles generally accepted in the United States of America. These financial statements and financial highlights (hereafter referred to as “financial statements”) are the responsibility of the Fund’s management. Our responsibility is to express an opinion on these financial statements based on our audits. We conducted our audits of these financial statements in accordance with the standards of the Public Company Accounting Oversight Board (United States). Those standards require that we plan and perform the audit to obtain reasonable assurance about whether the financial statements are free of material misstatement. An audit includes examining, on a test basis, evidence supporting the amounts and disclosures in the financial statements, assessing the accounting principles used and significant estimates made by management, and evaluating the overall financial statement presentation. We believe that our audits, which included confirmation of securities at August 31, 2014 by correspondence with the custodian and brokers, provide a reasonable basis for our opinion. The financial highlights of the Fund for the year ended March 31, 2010 were audited by another independent registered public accounting firm whose report dated May 18, 2010 expressed an unqualified opinion on such financial statement.
PRICEWATERHOUSECOOPERS LLP
October 27, 2014
Houston, Texas
21 Invesco Small Cap Discovery Fund
Calculating your ongoing Fund expenses
Example
As a shareholder of the Fund, you incur two types of costs: (1) transaction costs, which may include sales charges (loads) on purchase payments or contingent deferred sales charges on redemptions, if any; and (2) ongoing costs, including management fees, distribution and/or service (12b-1) fees, and other Fund expenses. This example is intended to help you understand your ongoing costs (in dollars) of investing in the Fund and to compare these costs with ongoing costs of investing in other mutual funds. The example is based on an investment of $1,000 invested at the beginning of the period and held for the entire period March 1, 2014 through August 31, 2014.
Actual expenses
The table below provides information about actual account values and actual expenses. You may use the information in this table, together with the amount you invested, to estimate the expenses that you paid over the period. Simply divide your account value by $1,000 (for example, an $8,600 account value divided by $1,000 = 8.6), then multiply the result by the number in the table under the heading entitled “Actual Expenses Paid During Period” to estimate the expenses you paid on your account during this period.
Hypothetical example for comparison purposes
The table below also provides information about hypothetical account values and hypothetical expenses based on the Fund’s actual expense ratio and an assumed rate of return of 5% per year before expenses, which is not the Fund’s actual return.
The hypothetical account values and expenses may not be used to estimate the actual ending account balance or expenses you paid for the period. You may use this information to compare the ongoing costs of investing in the Fund and other funds. To do so, compare this 5% hypothetical example with the 5% hypothetical examples that appear in the shareholder reports of the other funds.
Please note that the expenses shown in the table are meant to highlight your ongoing costs only and do not reflect any transaction costs, such as sales charges (loads) on purchase payments or contingent deferred sales charges on redemptions, if any. Therefore, the hypothetical information is useful in comparing ongoing costs only, and will not help you determine the relative total costs of owning different funds. In addition, if these transaction costs were included, your costs would have been higher.
| Class | Beginning Account Value (03/01/14) | ACTUAL | HYPOTHETICAL (5% annual return before | Annualized Expense Ratio | ||||||||||||||||||||
| Ending Account Value (08/31/14)1 | Expenses Paid During Period2 | Ending Account Value (08/31/14) | Expenses Paid During Period2 | |||||||||||||||||||||
| A | $ | 1,000.00 | $ | 961.80 | $ | 6.63 | $ | 1,018.45 | $ | 6.82 | 1.34 | % | ||||||||||||
| B | 1,000.00 | 962.40 | 6.63 | 1,018.45 | 6.82 | 1.34 | ||||||||||||||||||
| C | 1,000.00 | 957.70 | 10.31 | 1,014.67 | 10.61 | 2.09 | ||||||||||||||||||
| Y | 1,000.00 | 963.70 | 5.40 | 1,019.71 | 5.55 | 1.09 | ||||||||||||||||||
| R5 | 1,000.00 | 964.50 | 4.61 | 1,020.52 | 4.74 | 0.93 | ||||||||||||||||||
| R6 | 1,000.00 | 964.60 | 4.16 | 1,020.97 | 4.28 | 0.84 | ||||||||||||||||||
| 1 | The actual ending account value is based on the actual total return of the Fund for the period March 1, 2014 through August 31, 2014, after actual expenses and will differ from the hypothetical ending account value which is based on the Fund’s expense ratio and a hypothetical annual return of 5% before expenses. |
| 2 | Expenses are equal to the Fund’s annualized expense ratio as indicated above multiplied by the average account value over the period, multiplied by 184/365 to reflect the most recent fiscal half year. |
22 Invesco Small Cap Discovery Fund
Approval of Investment Advisory and Sub-Advisory Contracts
The Board of Trustees (the Board) of AIM Counselor Series Trust (Invesco Counselor Series Trust) is required under the Investment Company Act of 1940, as amended, to approve annually the renewal of Invesco Small Cap Discovery Fund’s (the Fund) investment advisory agreements. During contract renewal meetings held on June 16-17, 2014, the Board as a whole, and the disinterested or “independent” Trustees, who comprise over 75% of the Board, voting separately, approved the continuance for the Fund of the Master Investment Advisory Agreement with Invesco Advisers, Inc. (Invesco Advisers) and the Master Intergroup Sub-Advisory Contract for Mutual Funds with Invesco Asset Management Deutschland GmbH, Invesco Asset Management Limited, Invesco Asset Management (Japan) Limited, Invesco Australia Limited, Invesco Hong Kong Limited, Invesco Senior Secured Management, Inc. and Invesco Canada Ltd. (collectively, the Affiliated Sub-Advisers and the sub-advisory contracts) for another year, effective July 1, 2014.
In evaluating the fairness and reasonableness of compensation under the Fund’s investment advisory agreement and sub-advisory contracts, the Board considered, among other things, the factors discussed below. The Board determined that continuation of the Fund’s investment advisory agreement and the sub-advisory contracts are in the best interest of the Fund and its shareholders and that the compensation payable to Invesco Advisers and the Affiliated Sub-Advisers under the agreements is fair and reasonable.
The Board’s Fund Evaluation Process
The Board’s Investments Committee has established three Sub-Committees, each of which is primarily responsible for overseeing the management of a number of the funds advised by Invesco Advisers (the Invesco Funds). The Sub-Committees meet throughout the year to review the performance of their assigned Invesco Funds, including reviewing materials prepared under the direction of the independent Senior Officer, an officer of the Invesco Funds who reports directly to the independent Trustees. Over the course of each year, the Sub-Committees meet with portfolio managers for their assigned Invesco Funds and other members of management to review the performance, investment objective(s), policies, strategies, limitations and investment risks of these funds. The Sub-Committees meet regularly and at designated contract renewal meetings each year to conduct a review of the performance, fees, expenses and other matters related to their assigned Invesco Funds. Each Sub-Committee recommends to the Investments Committee, which in turn recommends to the full Board, whether and on what terms to approve the continuance of each Invesco Fund’s
investment advisory agreement and sub-advisory contracts for another year.
During the contract renewal process, the Trustees receive comparative performance and fee data regarding the Invesco Funds prepared by Invesco Advisers and Lipper Inc. (Lipper), an independent provider of investment company data. The Trustees also receive an independent written evaluation from the Senior Officer. The Senior Officer’s evaluation is prepared as part of his responsibility to manage the process by which the Invesco Funds’ proposed management fees are negotiated during the annual contract renewal process to ensure they are negotiated in a manner that is at arms’ length and reasonable. In addition to meetings with Invesco Advisers and fund counsel, the independent Trustees also discuss the continuance of the investment advisory agreement and sub-advisory contracts in separate sessions with the Senior Officer and with independent legal counsel.
The Trustees recognized that the advisory fee rates for the Invesco Funds are, in many cases, the result of years of review and negotiation. The Trustees’ deliberations and conclusions in a particular year may be based in part on their deliberations and conclusions regarding these arrangements throughout the year and in prior years. The Trustees’ review and conclusions are based on the comprehensive consideration of all information presented to them and are not the result of any single determinative factor. Moreover, one Trustee may have weighed a particular piece of information or factor differently than another Trustee.
The discussion below serves as the Senior Officer’s independent written evaluation with respect to the Fund’s investment advisory agreement as well as a discussion of the material factors and related conclusions that formed the basis for the Board’s approval of the Fund’s investment advisory agreement and sub-advisory contracts. Unless otherwise stated, this information is current as of June 17, 2014, and may not reflect consideration of factors that became known to the Board after that date.
Factors and Conclusions and Summary of Independent Written Fee Evaluation
| A. | Nature, Extent and Quality of Services Provided by Invesco Advisers and the Affiliated Sub-Advisers |
The Board reviewed the advisory services provided to the Fund by Invesco Advisers under the Fund’s investment advisory agreement, the performance of Invesco Advisers in providing these services, and the credentials and experience of the officers and employees of Invesco Advisers who provide these services, including the Fund’s portfolio manager or managers, with whom the Sub-Committees met during the year. The Board’s review of the
qualifications of Invesco Advisers to provide advisory services included the Board’s consideration of Invesco Advisers’ investment process oversight, independent credit analysis and investment risk management. The Board also considered non-advisory services that Invesco Advisers and its affiliates provide to the Invesco Funds such as various back office support functions, equity and fixed income trading operations, internal audit, distribution and legal and compliance.
In determining whether to continue the Fund’s investment advisory agreement, the Board considered the benefits of reapproving an existing relationship and the greater uncertainty that may be associated with entering into a new relationship. The Board concluded that the nature, extent and quality of the services provided to the Fund by Invesco Advisers are appropriate and satisfactory and consistent with the terms of the Fund’s investment advisory agreement.
The Board reviewed the services that may be provided by the Affiliated Sub-Advisers under the sub-advisory contracts and the credentials and experience of the officers and employees of the Affiliated Sub-Advisers who provide these services. The Board noted that the Affiliated Sub-Advisers have offices and personnel that are located in financial centers around the world. As a result, the Affiliated Sub-Advisers can provide research and investment analysis on the markets and economies of various countries in which the Fund may invest, make recommendations regarding securities and assist with security trades. The Board concluded that the sub-advisory contracts benefit the Fund and its shareholders by permitting Invesco Advisers to use the resources and talents of the Affiliated Sub-Advisers in managing the Fund. The Board concluded that the nature, extent and quality of the services that may be provided by the Affiliated Sub-Advisers are appropriate and satisfactory and consistent with the terms of the Fund’s sub-advisory contracts.
| B. | Fund Performance |
The Board considered Fund performance as a relevant factor in considering whether to approve the investment advisory agreement. The Board did not view Fund performance as a relevant factor in considering whether to approve the sub-advisory contracts for the Fund, as no Affiliated Sub-Adviser currently manages assets of the Fund.
The Board compared the Fund’s performance during the past one, three and five calendar years to the performance of funds in the Lipper performance universe and against the Lipper Small-Cap Growth Funds Index. The Board noted that performance of Class A shares of the Fund was in the fourth quintile of the performance universe for the one and three year periods and the fifth quintile for the five year period (the first quintile being the best performing funds
23 Invesco Small Cap Discovery Fund
and the fifth quintile being the worst performing funds). The Board noted that performance of Class A shares of the Fund was below the performance of the Index for the one, three and five year periods. Invesco Advisers noted that the Fund had performed as expected in a low quality market environment, but that research had been strengthened. The Trustees also reviewed more recent Fund performance and this review did not change their conclusions.
| C. | Advisory and Sub-Advisory Fees |
The Board compared the Fund’s contractual management fee rate to the contractual management fee rates of funds in the Fund’s Lipper expense group at a common asset level. The Board noted that the contractual management fee rate for Class A shares of the Fund was below the median contractual management fee rate of funds in the expense group. The Board noted that the term “contractual management fee” may include both advisory and certain administrative services fees, but that Lipper does not provide information on a fund by fund basis as to what is included. The Board noted that Invesco Advisers does not charge the Invesco Funds for the administrative services included in the term as defined by Lipper. The Board also reviewed the methodology used by Lipper in providing expense group information, which includes using each fund’s contractual management fee schedule (including any applicable breakpoints) as reported in the most recent prospectus or statement of additional information for each fund in the expense group.
The Board noted that Invesco Advisers has contractually agreed to waive fees and/or limit expenses of the Fund through at least June 30, 2015 in an amount necessary to limit total annual operating expenses to a specified percentage of average daily net assets for each class of the Fund.
The Board also compared the Fund’s effective advisory fee rate (the advisory fee rate after advisory fee waivers and before other expense limitations/waivers) to the effective advisory fee rates of other mutual funds advised by Invesco Advisers and its affiliates that are managed using an investment process substantially similar to the investment process used for the Fund. The Board noted that Invesco Advisers sub-advises one mutual fund with a similar investment process and that the sub-advisory effective fee rate is below the effective advisory fee rate of the Fund. The Board note that Invesco Advisers and the Affiliated Sub-Advisers do not manage other accounts using an investment process substantially similar to the investment process used for the Fund.
The Board also considered the services that may be provided by the Affiliated Sub-Advisers pursuant to the sub-advisory contracts, as well as the fees payable by Invesco Advisers to the Affiliated Sub-Advisers pursuant to the sub-advisory contracts. The Board also noted that the sub-advisory fees are not paid directly by the Fund, but rather, are payable by Invesco Advisers to the Affiliated Sub-Advisers.
| D. | Economies of Scale and Breakpoints |
The Board considered the extent to which there are economies of scale in the provision of advisory services to the Fund. The Board also considered whether the Fund benefits from economies of scale through contractual breakpoints in the Fund’s advisory fee schedule and was assisted in this review by a report from the Senior Officer. The Board also noted that the Fund shares directly in economies of scale through lower fees charged by third party service providers based on the combined size of the Invesco Funds and other clients advised by Invesco Advisers.
| E. | Profitability and Financial Resources |
The Board reviewed information from Invesco Advisers concerning the costs of the advisory and other services that Invesco Advisers and its affiliates provide to the Fund and the profitability of Invesco Advisers and its affiliates in providing these services for the year ended December 31, 2013. The Board received information from Invesco Advisers about the methodology used to prepare the profitability information. The Board considered the profitability of Invesco Advisers in managing the Fund and the Invesco Funds. The Board noted that Invesco Advisers continues to operate at a net profit from services Invesco Advisers and its subsidiaries provide to the Invesco Funds and the Fund. The Board did not deem the level of profits realized by Invesco Advisers and its affiliates from providing services to the Fund to be excessive given the nature, quality and extent of the services provided to the Invesco Funds. The Board received and accepted information from Invesco Advisers demonstrating that Invesco Advisers and each Affiliated Sub-Adviser are financially sound and have the resources necessary to perform their obligations under the investment advisory agreement and sub-advisory contracts.
| F. | Collateral Benefits to Invesco Advisers and its Affiliates |
The Board considered various other benefits received by Invesco Advisers and its affiliates from the relationship with the Fund, including the fees received for their provision of transfer agency and distribution services to the Fund. The Board considered comparative information regarding fees charged for these services, including information provided by Lipper and other independent sources. The Board considered the performance of Invesco Advisers and its affiliates in providing these services and the organizational structure employed to provide these services. The Board also considered that these services are provided to the Fund pursuant to written contracts that are reviewed and approved on an annual basis by the Board; that the services are required for the operation of the Fund; that Invesco Advisers and its affiliates can provide services, the nature and quality of which are at least equal to those provided by others offering the same or similar services; and that the fees for such services are fair and reasonable in light of the
usual and customary charges by others for services of the same nature and quality.
The Board considered the benefits realized by Invesco Advisers and the Affiliated Sub-Advisers as a result of portfolio brokerage transactions executed through “soft dollar” arrangements. The Board noted that soft dollar arrangements shift the payment obligation for research services from Invesco Advisers and the Affiliated Sub-Advisers to the Invesco Funds and that the research received may be used with other clients of Invesco Advisers and may reduce Invesco Advisers’ and the Affiliated Sub-Advisers’ expenses. The Board also considered that it receives periodic reports from the Chief Compliance Officer of the Invesco Funds demonstrating that these arrangements are consistent with regulatory requirements. The Board did not deem the soft dollar arrangements to be inappropriate.
The Board considered that the Fund’s uninvested cash and cash collateral from any securities lending arrangements may be invested in money market funds advised by Invesco Advisers pursuant to procedures approved by the Board. The Board noted that Invesco Advisers receives advisory fees from these affiliated money market funds attributable to such investments, although Invesco Advisers has contractually agreed to waive through varying periods the advisory fees payable by the Invesco Funds with respect to investments in the affiliated money market funds. The waiver is in an amount equal to 100% of the net advisory fee Invesco Advisers receives from the affiliated money market funds with respect to the Fund’s investment in the affiliated money market funds of uninvested cash, but not cash collateral. The Board concluded that the amount of advisory fees received by Invesco Advisors from the Fund’s investment of uninvested cash and cash collateral from any securities lending arrangements in the affiliated money market funds are fair and reasonable.
The Board also considered the Fund may use an affiliated broker to execute certain trades for the Fund to among other things, control information leakage, and were advised that such trades would be executed in compliance with rules under the Investment Company Act of 1940, as amended.
| 24 Invesco Small Cap Discovery Fund |
Tax Information
Form 1099-DIV, Form 1042-S and other year–end tax information provide shareholders with actual calendar year amounts that should be included in their tax returns. Shareholders should consult their tax advisors.
The following distribution information is being provided as required by the Internal Revenue Code or to meet a specific state’s requirement.
The Fund designates the following amounts or, if subsequently determined to be different, the maximum amount allowable for its fiscal year ended August 31, 2014:
Federal and State Income Tax | ||||
Long-Term Capital Gain Distributions | $ | 109,267,373 | ||
Qualified Dividend Income* | 17.85 | % | ||
Corporate Dividends Received Deduction* | 16.87 | % | ||
U.S. Treasury Obligations* | 0.00 | % | ||
| * | The above percentages are based on ordinary income dividends paid to shareholders during the Fund’s fiscal year. |
Non-Resident Alien Shareholders | ||||
Qualified Short-Term Gains | $ | 26,321,532 | ||
25 Invesco Small Cap Discovery Fund
Trustees and Officers
The address of each trustee and officer is AIM Counselor Series Trust (Invesco Counselor Series Trust) (the “Trust”), 11 Greenway Plaza, Suite 1000, Houston, Texas 77046-1173. The trustees serve for the life of the Trust, subject to their earlier death, incapacitation, resignation, retirement or removal as more specifically provided in the Trust’s organizational documents. Each officer serves for a one year term or until their successors are elected and qualified. Column two below includes length of time served with predecessor entities, if any.
Name, Year of Birth and Position(s) Held with the Trust | Trustee and/ or Officer Since | Principal Occupation(s) During Past 5 Years | Number of Funds in Fund Complex Overseen by Trustee | Other Directorship(s) Held by Trustee During Past 5 Years | ||||
| Interested Persons | ||||||||
Martin L. Flanagan1 — 1960 Trustee | 2007 | Executive Director, Chief Executive Officer and President, Invesco Ltd. (ultimate parent of Invesco and a global investment management firm); Advisor to the Board, Invesco Advisers, Inc. (formerly known as Invesco Institutional (N.A.), Inc.); Trustee, The Invesco Funds; Vice Chair, Investment Company Institute; and Member of Executive Board, SMU Cox School of Business.
Formerly: Chairman and Chief Executive Officer, Invesco Advisers, Inc. (registered investment adviser); Director, Chairman, Chief Executive Officer and President, IVZ Inc. (holding company), INVESCO Group Services, Inc. (service provider) and Invesco North American Holdings, Inc. (holding company); Director, Chief Executive Officer and President, Invesco Holding Company Limited (parent of Invesco and a global investment management firm); Director, Invesco Ltd.; Chairman, Investment Company Institute and President, Co-Chief Executive Officer, Co-President, Chief Operating Officer and Chief Financial Officer, Franklin Resources, Inc. (global investment management organization). | 141 | None | ||||
Philip A. Taylor2 — 1954 Trustee, President and Principal Executive Officer | 2006 | Head of North American Retail and Senior Managing Director, Invesco Ltd.; Director, Co-Chairman, Co-President and Co-Chief Executive Officer, Invesco Advisers, Inc. (formerly known as Invesco Institutional (N.A.), Inc.) (registered investment adviser); Director, Chairman, Chief Executive Officer and President, Invesco Management Group, Inc. (formerly known as Invesco Aim Management Group, Inc.) (financial services holding company); Director and President, INVESCO Funds Group, Inc. (registered investment adviser and registered transfer agent); Director and Chairman, Invesco Investment Services, Inc. (formerly known as Invesco Aim Investment Services, Inc.) (registered transfer agent) and IVZ Distributors, Inc. (formerly known as INVESCO Distributors, Inc.) (registered broker dealer); Director, President and Chairman, Invesco Inc. (holding company) and Invesco Canada Holdings Inc. (holding company); Chief Executive Officer, Invesco Corporate Class Inc. (corporate mutual fund company) and Invesco Canada Fund Inc. (corporate mutual fund company); Director, Chairman and Chief Executive Officer, Invesco Canada Ltd. (formerly known as Invesco Trimark Ltd./Invesco Trimark Ltèe) (registered investment adviser and registered transfer agent); Trustee, President and Principal Executive Officer, The Invesco Funds (other than AIM Treasurer’s Series Trust (Invesco Treasurer’s Series Trust) and Short-Term Investments Trust); Trustee and Executive Vice President, The Invesco Funds (AIM Treasurer’s Series Trust (Invesco Treasurer’s Series Trust) and Short-Term Investments Trust only); Director, Invesco Investment Advisers LLC (formerly known as Van Kampen Asset Management); Director, Chief Executive Officer and President, Van Kampen Exchange Corp.
Formerly: Director and Chairman, Van Kampen Investor Services Inc.; Director, Chief Executive Officer and President, 1371 Preferred Inc. (holding company) and Van Kampen Investments Inc.; Director and President, AIM GP Canada Inc. (general partner for limited partnerships) and Van Kampen Advisors, Inc.; Director and Chief Executive Officer, Invesco Trimark Dealer Inc. (registered broker dealer); Director, Invesco Distributors, Inc. (formerly known as Invesco Aim Distributors, Inc.) (registered broker dealer); Manager, Invesco PowerShares Capital Management LLC; Director, Chief Executive Officer and President, Invesco Advisers, Inc.; Director, Chairman, Chief Executive Officer and President, Invesco Aim Capital Management, Inc.; President, Invesco Trimark Dealer Inc. and Invesco Trimark Ltd./Invesco Trimark Ltèe; Director and President, AIM Trimark Corporate Class Inc. and AIM Trimark Canada Fund Inc.; Senior Managing Director, Invesco Holding Company Limited; Director and Chairman, Fund Management Company (former registered broker dealer); President and Principal Executive Officer, The Invesco Funds (AIM Treasurer’s Series Trust (Invesco Treasurer’s Series Trust), and Short-Term Investments Trust only); President, AIM Trimark Global Fund Inc. and AIM Trimark Canada Fund Inc. | 141 | None | ||||
Wayne W. Whalen3 — 1939 Trustee | 2010 | Of Counsel, and prior to 2010, partner in the law firm of Skadden, Arps, Slate, Meagher & Flom LLP, legal counsel to certain funds in the Fund Complex
| 141 | Director of the Mutual fund Directors Forum, a nonprofit membership organization for investment directors; Chairman and Director of the Abraham Lincoln Presidential Library Foundation; and Director of the Stevenson Center for Democracy |
| 1 | Mr. Flanagan is considered an interested person (within the meaning of Section 2(a)(19) of the 1940 Act) of the Trust because he is an officer of the Adviser to the Trust, and an officer and a director of Invesco Ltd., ultimate parent of the Adviser. |
| 2 | Mr. Taylor is considered an interested person (within the meaning of Section 2(a)(19) of the 1940 Act) of the Trust because he is an officer and a director of the Adviser. |
| 3 | Mr. Whalen is retiring effective December 31, 2014. He has been deemed to be an interested person of the Trust because of his prior service as counsel to the predecessor funds of certain Invesco open-end funds and his affiliation with the law firm that served as counsel to such predecessor funds and the Invesco closed-end funds. |
T-1 Invesco Small Cap Discovery Fund
Trustees and Officers—(continued)
Name, Year of Birth and Position(s) Held with the Trust | Trustee and/ or Officer Since | Principal Occupation(s) During Past 5 Years | Number of Funds in Fund Complex Overseen by Trustee | Other Directorship(s) Past 5 Years | ||||
| Independent Trustees | ||||||||
Bruce L. Crockett — 1944 Trustee and Chair | 2003 | Chairman, Crockett Technologies Associates (technology consulting company)
Formerly: Director, Captaris (unified messaging provider); Director, President and Chief Executive Officer, COMSAT Corporation; Chairman, Board of Governors of INTELSAT (international communications company); ACE Limited (insurance company); and Investment Company Institute | 141 | ALPS (Attorneys Liability Protection Society) (insurance company) | ||||
David C. Arch — 1945 Trustee | 2010 | Chairman of Blistex Inc., a consumer health care products manufacturer | 141 | Board member of the Illinois Manufacturers’ Association; Member of the Board of Visitors, Institute for the Humanities, University of Michigan; Member of the Audit Committee of the Edward-Elmhurst Hospital | ||||
Frank S. Bayley — 1939 Trustee | 2003 | Retired. Formerly: Director, Badgley Funds Inc. (registered investment company) (2 portfolios) and General Partner and Of Counsel, law firm of Baker & McKenzie, LLP | 141 | Director and Chairman, C.D. Stimson Company (a real estate investment company); Trustee, The Curtis Institute of Music | ||||
James T. Bunch — 1942 Trustee | 2000 | Managing Member, Grumman Hill Group LLC (family office private equity investments)
Formerly: Founder, Green Manning & Bunch Ltd. (investment banking firm) (1988-2010); Executive Committee, United States Golf Association; and Director, Policy Studies, Inc. and Van Gilder Insurance Corporation | 141 | Chairman, Board of Governors, Western Golf Association; Chairman, Evans Scholars Foundation; and Director, Denver Film Society | ||||
Rodney F. Dammeyer — 1940 Trustee | 2010 | Chairman of CAC, LLC, (private company offering capital investment and management advisory services)
Formerly: Prior to 2001, Managing Partner at Equity Group Corporate Investments; Prior to 1995, Chief Executive Officer of Itel Corporation (formerly Anixter International); Prior to 1985, experience includes Senior Vice President and Chief Financial Officer of Household International, Inc., Executive Vice President and Chief Financial Officer of Northwest Industries, Inc. and Partner of Arthur Andersen & Co.; From 1987 to 2010, Director/Trustee of investment companies in the Van Kampen Funds complex | 141 | Director of Quidel Corporation and Stericycle, Inc. | ||||
Albert R. Dowden — 1941 Trustee | 2003 | Director of a number of public and private business corporations, including the Boss Group, Ltd. (private investment and management); Nature’s Sunshine Products, Inc. and Reich & Tang Funds (5 portfolios) (registered investment company)
Formerly: Director, Homeowners of America Holding Corporation/Homeowners of America Insurance Company (property casualty company); Director, Continental Energy Services, LLC (oil and gas pipeline service); Director, CompuDyne Corporation (provider of product and services to the public security market) and Director, Annuity and Life Re (Holdings), Ltd. (reinsurance company); Director, President and Chief Executive Officer, Volvo Group North America, Inc.; Senior Vice President, AB Volvo; Director of various public and private corporations; Chairman, DHJ Media, Inc.; Director, Magellan Insurance Company; and Director, The Hertz Corporation, Genmar Corporation (boat manufacturer), National Media Corporation; Advisory Board of Rotary Power International (designer, manufacturer, and seller of rotary power engines); and Chairman, Cortland Trust, Inc. (registered investment company) | 141 | Director of: Nature’s Sunshine Products, Inc., Reich & Tang Funds, Homeowners of America Holding Corporation/ Homeowners of America Insurance Company, the Boss Group | ||||
Jack M. Fields — 1952 Trustee | 2003 | Chief Executive Officer, Twenty First Century Group, Inc. (government affairs company); Owner and Chief Executive Officer, Dos Angeles Ranch, L.P. (cattle, hunting, corporate entertainment); and Discovery Global Education Fund (non-profit)
Formerly: Chief Executive Officer, Texana Timber LP (sustainable forestry company); Director of Cross Timbers Quail Research Ranch (non-profit); and member of the U.S. House of Representatives | 141 | Insperity, Inc. (formerly known as Administaff) | ||||
Prema Mathai-Davis — 1950 Trustee | 2003 | Retired. Formerly: Chief Executive Officer, YWCA of the U.S.A. | 141 | None | ||||
Larry Soll — 1942 Trustee | 1997 | Retired. Formerly: Chairman, Chief Executive Officer and President, Synergen Corp. (a biotechnology company) | 141 | None | ||||
Hugo F. Sonnenschein — 1940 Trustee | 2010 | President Emeritus and Honorary Trustee of the University of Chicago and the Adam Smith Distinguished Service Professor in the Department of Economics at the University of Chicago. Prior to 2000, President of the University of Chicago | 141 | Trustee of the University of Rochester and a member of its investment committee; Member of the National Academy of Sciences and the American Philosophical Society; Fellow of the American Academy of Arts and Sciences |
T-2 Invesco Small Cap Discovery Fund
Trustees and Officers—(continued)
Name, Year of Birth and Position(s) Held with the Trust | Trustee and/ or Officer Since | Principal Occupation(s) During Past 5 Years | Number of Funds in Fund Complex Overseen by Trustee | Other Directorship(s) Past 5 Years | ||||
| Independent Trustees—(continued) | ||||||||
Raymond Stickel, Jr. — 1944 Trustee | 2005 | Retired. Formerly: Director, Mainstay VP Series Funds, Inc. (25 portfolios) and Partner, Deloitte & Touche | 141 | None | ||||
Suzanne H. Woolsey — 1941 Trustee | 2014 | Chief Executive Officer of Woolsey Partners LLC | 141 | Emeritus Chair of the Board of Trustees of the Institute for Defense Analyses; Trustee of Colorado College; Trustee of California Institute of Technology; Prior to 2014, Director of Fluor Corp.; Prior to 2010, Trustee of the German Marshall Fund of the United States; Prior to 2010 Trustee of the Rocky Mountain Institute | ||||
| Other Officers | ||||||||
Russell C. Burk — 1958 Senior Vice President and Senior Officer | 2005 | Senior Vice President and Senior Officer, The Invesco Funds | N/A | N/A | ||||
John M. Zerr — 1962 Senior Vice President, Chief Legal Officer and Secretary | 2006 | Director, Senior Vice President, Secretary and General Counsel, Invesco Management Group, Inc. (formerly known as Invesco Aim Management Group, Inc.) and Van Kampen Exchange Corp.; Senior Vice President, Invesco Advisers, Inc. (formerly known as Invesco Institutional (N.A.), Inc.) (registered investment adviser); Senior Vice President and Secretary, Invesco Distributors, Inc. (formerly known as Invesco Aim Distributors, Inc.); Director, Vice President and Secretary, Invesco Investment Services, Inc. (formerly known as Invesco Aim Investment Services, Inc.) and IVZ Distributors, Inc. (formerly known as INVESCO Distributors, Inc.); Director and Vice President, INVESCO Funds Group, Inc.; Senior Vice President, Chief Legal Officer and Secretary, The Invesco Funds; Manager, Invesco PowerShares Capital Management LLC; Director, Secretary and General Counsel, Invesco Investment Advisers LLC (formerly known as Van Kampen Asset Management); Secretary and General Counsel, Invesco Capital Markets, Inc. (formerly known as Van Kampen Funds Inc.) and Chief Legal Officer, PowerShares Exchange-Traded Fund Trust, PowerShares Exchange-Traded Fund Trust II, PowerShares India Exchange-Traded Fund Trust and PowerShares Actively Managed Exchange-Traded Fund Trust
Formerly: Director and Vice President, Van Kampen Advisors Inc.; Director, Vice President, Secretary and General Counsel, Van Kampen Investor Services Inc.; Director, Invesco Distributors, Inc. (formerly known as Invesco Aim Distributors, Inc.); Director, Senior Vice President, General Counsel and Secretary, Invesco Aim Advisers, Inc. and Van Kampen Investments Inc.; Director, Vice President and Secretary, Fund Management Company; Director, Senior Vice President, Secretary, General Counsel and Vice President, Invesco Aim Capital Management, Inc.; Chief Operating Officer and General Counsel, Liberty Ridge Capital, Inc. (an investment adviser); Vice President and Secretary, PBHG Funds (an investment company) and PBHG Insurance Series Fund (an investment company); Chief Operating Officer, General Counsel and Secretary, Old Mutual Investment Partners (a broker-dealer); General Counsel and Secretary, Old Mutual Fund Services (an administrator) and Old Mutual Shareholder Services (a shareholder servicing center); Executive Vice President, General Counsel and Secretary, Old Mutual Capital, Inc. (an investment adviser); and Vice President and Secretary, Old Mutual Advisors Funds (an investment company) | N/A | N/A | ||||
Sheri Morris — 1964 Vice President, Treasurer and Principal Financial Officer | 2003 | Vice President, Treasurer and Principal Financial Officer, The Invesco Funds; Vice President, Invesco Advisers, Inc. (formerly known as Invesco Institutional (N.A.), Inc.) (registered investment adviser); and Vice President, PowerShares Exchange-Traded Fund Trust, PowerShares Exchange-Traded Fund Trust II, PowerShares India Exchange-Traded Fund Trust and PowerShares Actively Managed Exchange-Traded Fund Trust
Formerly: Vice President, Invesco Aim Advisers, Inc., Invesco Aim Capital Management, Inc. and Invesco Aim Private Asset Management, Inc.; Assistant Vice President and Assistant Treasurer, The Invesco Funds and Assistant Vice President, Invesco Advisers, Inc., Invesco Aim Capital Management, Inc. and Invesco Aim Private Asset Management, Inc.; and Treasurer, PowerShares Exchange-Traded Fund Trust, PowerShares Exchange-Traded Fund Trust II, PowerShares India Exchange-Traded Fund Trust and PowerShares Actively Managed Exchange-Traded Fund Trust | N/A | N/A | ||||
T-3 Invesco Small Cap Discovery Fund
Trustees and Officers—(continued)
Name, Year of Birth and Position(s) Held with the Trust | Trustee and/ or Officer Since | Principal Occupation(s) During Past 5 Years | Number of Funds in Fund Complex Overseen by Trustee | Other Directorship(s) Past 5 Years | ||||
| Other Officers—(continued) | ||||||||
Karen Dunn Kelley — 1960 Vice President | 2003 | Senior Managing Director, Investments; Director, Co-President, Co-Chief Executive Officer, and Co-Chairman, Invesco Advisers, Inc. (formerly known as Invesco Institutional (N.A.), Inc.) (registered investment adviser); Chairman, Invesco Senior Secured Management, Inc.; Senior Vice President, Invesco Management Group, Inc. (formerly known as Invesco Aim Management Group, Inc.); Executive Vice President, Invesco Distributors, Inc. (formerly known as Invesco Aim Distributors, Inc.); Director, Invesco Mortgage Capital Inc. and Invesco Management Company Limited; Director and President, INVESCO Asset Management (Bermuda) Ltd., Vice President, The Invesco Funds (other than AIM Treasurer’s Series Trust (Invesco Treasurer’s Series Trust) and Short-Term Investments Trust); and President and Principal Executive Officer, The Invesco Funds (AIM Treasurer’s Series Trust (Invesco Treasurer’s Series Trust) and Short-Term Investments Trust only)
Formerly: Director, INVESCO Global Asset Management Limited and INVESCO Management S.A.; Senior Vice President, Van Kampen Investments Inc. and Invesco Advisers, Inc. (formerly known as Invesco Institutional (N.A.), Inc.) (registered investment adviser); Vice President, Invesco Advisers, Inc. (formerly known as Invesco Institutional (N.A.), Inc.); Director of Cash Management and Senior Vice President, Invesco Advisers, Inc. and Invesco Aim Capital Management, Inc.; Director and President, Fund Management Company; Chief Cash Management Officer, Director of Cash Management, Senior Vice President, and Managing Director, Invesco Aim Capital Management, Inc.; Director of Cash Management, Senior Vice President, and Vice President, Invesco Advisers, Inc. and The Invesco Funds (AIM Treasurer’s Series Trust (Invesco Treasurer’s Series Trust), and Short-Term Investments Trust only) | N/A | N/A | ||||
Crissie M. Wisdom — 1969 Anti-Money Laundering Compliance Officer | 2013 | Anti-Money Laundering Compliance Officer, Invesco Advisers, Inc. (formerly known as Invesco Institutional (N.A.), Inc.) (registered investment adviser), Invesco Capital Markets, Inc. (formerly known as Van Kampen Funds Inc.), Invesco Distributors, Inc., Invesco Investment Services, Inc., Invesco Management Group, Inc., Van Kampen Exchange Corp., The Invesco Funds, and PowerShares Exchange-Traded Fund Trust, PowerShares Exchange-Traded Fund Trust II, PowerShares India Exchange-Traded Fund Trust, and PowerShares Actively Managed Exchange-Traded Fund Trust; and Fraud Prevention Manager and Controls and Risk Analysis Manager for Invesco Investment Services, Inc. | N/A | N/A | ||||
Todd L. Spillane — 1958 Chief Compliance Officer | 2006 | Senior Vice President, Invesco Management Group, Inc. (formerly known as Invesco Aim Management Group, Inc.) and Van Kampen Exchange Corp.; Senior Vice President and Chief Compliance Officer, Invesco Advisers, Inc. (registered investment adviser) (formerly known as Invesco Institutional (N.A.), Inc.); Chief Compliance Officer, The Invesco Funds; Vice President, Invesco Distributors, Inc. (formerly known as Invesco Aim Distributors, Inc.) and Invesco Investment Services, Inc. (formerly known as Invesco Aim Investment Services, Inc.)
Formerly: Chief Compliance Officer, Invesco Funds (Chicago); Senior Vice President, Van Kampen Investments Inc.; Senior Vice President and Chief Compliance Officer, Invesco Aim Advisers, Inc. and Invesco Aim Capital Management, Inc.; Chief Compliance Officer, INVESCO Private Capital Investments, Inc. (holding company), Invesco Private Capital, Inc. (registered investment adviser), Invesco Global Asset Management (N.A.), Inc., Invesco Senior Secured Management, Inc. (registered investment adviser), Van Kampen Investor Services Inc., PowerShares Exchange-Traded Fund Trust, PowerShares Exchange-Traded Fund Trust II, PowerShares India Exchange-Traded Fund Trust and PowerShares Actively Managed Exchange-Traded Fund Trust; and Vice President, Invesco Aim Capital Management, Inc. and Fund Management Company | N/A | N/A |
The Statement of Additional Information of the Trust includes additional information about the Fund’s Trustees and is available upon request, without charge, by calling 1.800.959.4246. Please refer to the Fund’s prospectus for information on the Fund’s sub-advisers.
Office of the Fund 11 Greenway Plaza, Suite 1000 Houston, TX 77046-1173 | Investment Adviser Invesco Advisers, Inc. 1555 Peachtree Street, N.E. Atlanta, GA 30309 | Distributor Invesco Distributors, Inc. 11 Greenway Plaza, Suite 1000 Houston, TX 77046-1173 | Auditors PricewaterhouseCoopers LLP 1201 Louisiana Street, Suite 2900 Houston, TX 77002-5678 | |||
Counsel to the Fund Stradley Ronon Stevens & Young, LLP 2005 Market Street, Suite 2600 Philadelphia, PA 19103-7018 | Counsel to the Independent Trustees Goodwin Procter LLP 901 New York Avenue, N.W. Washington, D.C. 20001 | Transfer Agent Invesco Investment Services, Inc. 11 Greenway Plaza, Suite 1000 Houston, TX 77046-1173 | Custodian State Street Bank and Trust Company 225 Franklin Street Boston, MA 02110-2801 | |||
T-4 Invesco Small Cap Discovery Fund

Invesco mailing information
Send general correspondence to Invesco Investment Services, Inc., P.O. Box 219078, Kansas City, MO 64121-9078.
Important notice regarding delivery of security holder documents
To reduce Fund expenses, only one copy of most shareholder documents may be mailed to shareholders with multiple accounts at the same address (Householding). Mailing of your shareholder documents may be householded indefinitely unless you instruct us otherwise. If you do not want the mailing of these documents to be combined with those for other members of your household, please contact Invesco Investment Services, Inc. at 800 959 4246 or contact your financial institution. We will begin sending you individual copies for each account within 30 days after receiving your request.
Fund holdings and proxy voting information
The Fund provides a complete list of its holdings four times in each fiscal year, at the quarter ends. For the second and fourth quarters, the lists appear in the Fund’s semiannual and annual reports to shareholders. For the first and third quarters, the Fund files the lists with the Securities and Exchange Commission (SEC) on Form N-Q. The most recent list of portfolio holdings is available at invesco.com/completeqtrholdings. Shareholders can also look up the Fund’s Forms N-Q on the SEC website at sec.gov. Copies of the Fund’s Forms N-Q may be reviewed and copied at the SEC Public Reference Room in Washington, D.C. You can obtain information on the operation of the Public Reference Room, including information about duplicating fee charges, by calling 202 551 8090 or 800 732 0330, or by electronic request at the following email address: publicinfo@sec.gov. The SEC file numbers for the Fund are shown below.
A description of the policies and procedures that the Fund uses to determine how to vote proxies relating to portfolio securities is available without charge, upon request, from our Client Services department at 800 959 4246 or at invesco.com/proxyguidelines. The information is also available on the SEC website, sec.gov.
Information regarding how the Fund voted proxies related to its portfolio securities during the most recent 12-month period ended June 30 is available at invesco.com/proxysearch. The information is also available on the SEC website, sec.gov. Invesco Advisers, Inc. is an investment adviser; it provides investment advisory services to individual and institutional clients and does not sell securities. Invesco Distributors, Inc. is the US distributor for Invesco Ltd.’s retail mutual funds, exchange-traded funds and institutional money market funds. Both are wholly owned, indirect subsidiaries of Invesco Ltd. |  |
| SEC file numbers: 811-09913 and 333-36074 VK-SCD-AR-1 Invesco Distributors, Inc. |

Letters to Shareholders
Philip Taylor | Dear Shareholders: This annual report includes information about your Fund, including performance data and a complete list of its investments as of the close of the reporting period. Inside, your Fund’s portfolio managers discuss how they managed your Fund and the factors that affected its performance during the reporting period. I hope you find this report of interest. During the reporting period covered by this report, the US economy showed signs of continued improvement. After contracting in the first quarter of 2014, the economy expanded strongly in the second quarter and unemployment trended lower. Much of the credit for this improvement goes to the US Federal Reserve (the Fed), which undertook an extraordinary asset purchase program following the global financial crisis. The Fed’s goal was to jumpstart the economy by encouraging banks to lend more, businesses to hire more and consumers to spend more. Signs of a stronger US economy prompted the Fed to reduce, or “taper,” its |

asset purchase program. Despite this, interest rates remained near historical low levels due largely to heavy investor demand for bonds. While signs of economic improvement were evident in the US, European economies remained relatively stagnant. During the reporting period, high unemployment persisted, worries about potential deflation grew, and uncertainty about Russian-Ukrainian tensions weighed on European markets.
Extended periods of market strength can lull investors into complacency – just as prolonged periods of market weakness or volatility can discourage investors from initiating long-term investment plans. That’s why Invesco has always encouraged investors to work with a professional financial adviser who can stress the importance of starting to save and invest early and the importance of adhering to a disciplined investment plan – when times are good and when they’re uncertain. A financial adviser who knows your unique financial situation, investment goals and risk tolerance can be an invaluable partner as you seek to achieve your financial goals. He or she can offer a long-term perspective when markets are volatile and time-tested advice and guidance when your financial situation or investment goals change.
Timely information when and where you want it
Invesco’s efforts to help investors achieve their financial objectives include providing individual investors and financial professionals with timely information about the markets, the economy and investing – whenever and wherever they want it.
Our website, invesco.com/us, offers a wide range of market insights and investment perspectives. On the website, you’ll find detailed information about our funds, including prices, performance, holdings and portfolio manager commentaries. You can access information about your individual Invesco account whenever it’s convenient for you; just complete a simple, secure online registration. Use the “Login” box on our home page to get started.
Invesco’s mobile app for iPad® (available free from the App StoreSM) allows you to obtain the same detailed information about your Fund and the same investment insights from our investment leaders, market strategists, economists and retirement experts on the go. You also can watch portfolio manager videos and have instant access to Invesco news and updates wherever you may be.
In addition to the resources accessible on our website and through our mobile app, you can obtain timely updates to help you stay informed about the markets, the economy and investing by connecting with Invesco on Twitter, LinkedIn or Facebook. You can access our blog at blog.invesco.us.com or by clicking the “Intentional Investing Forum” link on our home page. Our goal is to provide you the information you want, when and where you want it.
Have questions?
For questions about your account, feel free to contact an Invesco client services representative at 800 959 4246. For Invesco-related questions or comments, please email me directly at phil@invesco.com.
All of us at Invesco look forward to serving your investment management needs for many years to come. Thank you for investing with us.
Sincerely,

Philip Taylor
Senior Managing Director, Invesco Ltd.
iPad is a trademark of Apple Inc., registered in the US and other countries. App Store is a service mark of Apple Inc. Invesco Distributors, Inc. is not affiliated with Apple Inc.
2 Invesco Strategic Real Return Fund
Bruce Crockett | Dear Fellow Shareholders: There are a variety of factors that can impact investment performance, many of which are uncontrollable by us as investors. These factors can include various economic trends and geopolitical developments. While the members of the Invesco Funds Board, which I chair, can’t dictate the performance of the Invesco funds, be assured that your Board works diligently throughout the year to focus on how your investments are managed. Our job is to represent you and your interests on a variety of fund management-related matters. We regularly monitor how the portfolio management teams of the Invesco funds are performing in light of ever-changing and often unpredictable economic and market conditions. We review the investment strategies and investment process employed by each fund’s management team as explained in the fund’s prospectus. Perhaps our most significant responsibility is conducting the annual review of the funds’ |

advisory and sub-advisory contracts with Invesco Advisers and its affiliates. This annual review, which is required by the Investment Company Act of 1940, focuses on the nature and quality of the services Invesco provides as the adviser to the Invesco funds and the reasonableness of the fees that it charges for those services. Each year, we spend months carefully reviewing information from Invesco that allows us to evaluate the quality of its services and the reasonableness of its fees. We also use information from a variety of independent sources, including materials provided by the independent senior officer of the Invesco funds, who reports directly to the independent trustees on the Board. Additionally, we meet with legal counsel and review performance and fee data prepared for us by Lipper Inc., an independent, third-party firm widely recognized as a leader in its field.
After a careful review, the members of the Invesco Funds Board approved the continuation of advisory and sub-advisory contracts with Invesco Advisers and its affiliates. Be assured that your Board will continue working on behalf of fund shareholders, keeping your needs and interests uppermost in our minds.
As always, please contact me at bruce@brucecrockett.com with any questions or concerns you may have. On behalf of the Board, we look forward to continuing to represent your interests and serving your needs.
Sincerely,

Bruce L. Crockett
Independent Chair
Invesco Funds Board of Trustees
3 Invesco Strategic Real Return Fund
Management’s Discussion of Fund Performance
Performance summary
From the Fund’s inception on April 30, 2014, to the close of its fiscal year on August 31, 2014, Invesco Strategic Real Return Fund’s Class A shares, at net asset value (NAV), returned 2.44% while the Fund’s style specific benchmark, the Custom Invesco Strategic Real Return Index, returned 2.41%.
Additional performance information for your Fund appears later in this report.
Fund vs. Indexes
Total returns, 4/30/14 to 8/31/14, at net asset value (NAV). Performance shown does not include applicable contingent deferred sales charges (CDSC) or front-end sales charges, which would have reduced performance.
Class A Shares | 2.44 | % | ||
Class C Shares | 2.14 | |||
Class R Shares | 2.37 | |||
Class Y Shares | 2.50 | |||
Class R5 Shares | 2.50 | |||
Class R6 Shares | 2.50 | |||
Bank of America Merrill Lynch Current 10-Year U.S. Treasury Indexq | ||||
(Broad Market Index) | 3.79 | |||
Custom Invesco Strategic Real Return Indexn (Style-Specific Index) | 2.41 | |||
Lipper Inflation Protected Bond Fund Index¿ (Peer Group Index) | 2.33 |
Source(s): qBloomberg LP; nInvesco, Bloomberg LP, FactSet Research Systems Inc.,
S&P Dow Jones Indices LLC; ¿Lipper Inc.
How we invest
The Fund allocates its investments in three main asset classes: Treasury Inflation Protected Securities (TIPS), bank loans and high yield bonds. For the TIPS portion of the Fund, we select securities to match the returns of the Bank of America Merrill Lynch U.S. Inflation-Linked Treasury Index. Our goal is to have the Fund’s high yield allocation outperform the Bank of America Merrill Lynch U.S. High Yield Constrained Index and for the Fund’s bank loan allocation to outperform the S&P/LSTA Leveraged Loan Index. The Fund’s bank loan position is represented by a position in Invesco Floating Rate Fund. The Fund principally invests in individual high yield securities rated B or above.1
At its inception, the Fund’s initial allocation was:
| n | TIPS - 45% |
| n | Bank loans - 30% |
| n | High yield securities - 25% |
Tactical asset allocation decisions between the three asset classes are determined by portfolio managers with input from the Invesco Strategy Team (IST). The IST consists of the most senior investment professionals across the Invesco Fixed Income platform and includes the leaders of sector teams as well as senior macroeconomic strategists. The IST has a formalized monthly process to update tactical views and positioning recommendations through interaction with analysts and portfolio managers across the IFI platform.
Within each asset class allocation, asset or security selection is the responsibility of the sector manager based on the fundamental bottom-up process for each fixed income sector.
Market conditions and your Fund
For most of the reporting period, we positioned the Fund to be neutral with respect to its target allocation weights. We made a slight adjustment in late July by reducing the Fund’s TIPS allocation from approximately 45% to 41% with bank loans and high yield securities splitting the TIPS reduction. This was based on our view that we were at a low point in yields and that rates would likely rise.
TIPS typically have a longer duration than either high yield securities or bank loans, so reducing interest rate exposure seemed prudent. At the end of July, the Fund had a duration that was approximately 0.3 years short of the duration of the Custom Invesco Strategic Real Return Index. This difference was driven primarily by the Fund’s underweight position in TIPS.
During the reporting period, five-year Treasury rates fell approximately five basis points (0.05%) while 10-year Treasury rates fell about 31 basis points (0.31%).2 This large decline in 10-year yields produced positive returns for bonds with long durations. Over the reporting period, the Bank of America Merrill Lynch Current 10-Year U.S. Treasury Index returned 3.79%. TIPS had similar performance, posting a return of 3.29%.
High yield securities, as measured by the Bank of America Merrill Lynch U.S. High Yield Constrained Index, posted strong performance as well, despite negative returns in July. The index’s return for the reporting period was 2.05%.
Portfolio Composition
By security type
U.S. Treasury Securities | 40.5 | % | ||
Common Stocks | 31.9 | |||
| U.S. Dollar Denominated Bonds and Notes | 26.4 | |||
Money Market Funds Plus Other Assets Less Liabilities | 1.2 |
Top 10 Fixed Income Issuers*
1. U.S. Treasury | 40.5 | % | ||
2. Sanchez Energy Corp. | 1.1 | |||
3. International Lease Finance | 1.0 | |||
4. Berry Plastics Corp. | 0.9 | |||
5. Aircastle Ltd. | 0.9 | |||
6. MGM Resorts International | 0.9 | |||
7. TransDigm Inc. | 0.9 | |||
8. Reynolds Group Issuer Inc./ | 0.9 | |||
9. Halcon Resources Corp. | 0.9 | |||
10. ArcelorMittal | 0.9 |
Total Net Assets | $15.5 million | |
Total Number of Holdings | 76 | |
The Fund’s holdings are subject to change, and there is no assurance that the Fund will continue to hold any particular security.
*Excluding money market fund holdings.
4 Invesco Strategic Real Return Fund
Bank loans, as measured by the S&P/ LSTA Leveraged Loan Index, returned 1.40% for the reporting period.
As rates have recently started to rise, we have started to move TIPS and high yield securities back to their baseline allocations. At the close of the reporting period, we remained slightly overweight in bank loans, as they may provide a buffer against higher interest rates.
We thank you for your investment in Invesco Strategic Real Return Fund.
| 1 | Source: Standard & Poor’s. A credit rating is an assessment provided by a nationally recognized statistical rating organization (NRSRO) of the creditworthiness of an issuer with respect to debt obligations, including specific securities, money market instruments or other debts. Ratings are measured on a scale that generally ranges from AAA (highest) to D (lowest); ratings are subject to change without notice. “Non-Rated” indicates the debtor was not rated, and should not be interpreted as indicating low quality. For more information on Standard and Poor’s rating methodology, please visit standardandpoors.com and select “Understanding Ratings” under Rating Resources on the homepage. |
| 2 | Source: Bloomberg LP |
The views and opinions expressed in management’s discussion of Fund performance are those of Invesco Advisers, Inc. These views and opinions are subject to change at any time based on factors such as market and economic conditions. These views and opinions may not be relied upon as investment advice or recommendations, or as an offer for a particular security. The information is not a complete analysis of every aspect of any market, country, industry, security or the Fund. Statements of fact are from sources considered reliable, but Invesco Advisers, Inc. makes no representation or warranty as to their completeness or accuracy. Although historical performance is no guarantee of future results, these insights may help you understand our investment management philosophy.
See important Fund and, if applicable, index disclosures later in this report.
| Erik Jensen Portfolio Manager, is co-lead manager of Invesco Strategic Real Return Fund. He joined Invesco and/or | |
| its investment advisory affiliates in 1987. Mr. Jensen earned a BES degree from Johns Hopkins University and an SM degree in management from the Massachusetts Institute of Technology. | ||
| Robert Young Chartered Financial Analyst, Portfolio Manager, is co-lead manager of Invesco Strategic | |
| Real Return Fund. He joined Invesco in 2001. Mr. Young earned a BA in economics from Cornell University and an MBA in finance and international business from Fordham University. | ||
| Darren Hughes Chartered Financial Analyst, Portfolio Manager, is manager of Invesco Strategic Real Return Fund. He | |
| joined Invesco in 1992. Mr. Hughes earned a BBA in finance and economics from Baylor University. | ||
| Thomas Ewald Portfolio Manager, is manager of Invesco Strategic Real Return Fund. He joined Invesco in 2000. | |
| Mr. Ewald earned a BA from Harvard College and an MBA from the University of Virginia Darden School of Business. | ||


5 Invesco Strategic Real Return Fund
Your Fund’s Performance
Cumulative Total Returns
As of 8/31/14, including maximum applicable sales charges
Class A Shares | ||||
Inception (4/30/14) | -0.16 | % | ||
Class C Shares | ||||
Inception (4/30/14) | 1.14 | % | ||
Class R Shares | ||||
Inception (4/30/14) | 2.37 | % | ||
Class Y Shares | ||||
Inception (4/30/14) | 2.50 | % | ||
Class R5 Shares | ||||
Inception (4/30/14) | 2.50 | % | ||
Class R6 Shares | ||||
Inception (4/30/14) | 2.50 | % | ||
The performance data quoted represent past performance and cannot guarantee comparable future results; current performance may be lower or higher. Please visit invesco.com/performance for the most recent month-end performance. Performance figures reflect reinvested distributions, changes in net asset value and the effect of the maximum sales charge unless otherwise stated. Performance figures do not reflect deduction of taxes a shareholder would pay on Fund distributions or sale of Fund shares. Investment return and principal
Cumulative Total Returns
As of 6/30/14, the most recent calendar quarter end, including maximum applicable sales charges
Class A Shares | ||||
Inception (4/30/14) | -0.54 | % | ||
Class C Shares | ||||
Inception (4/30/14) | 0.88 | % | ||
Class R Shares | ||||
Inception (4/30/14) | 0.92 | % | ||
Class Y Shares | ||||
Inception (4/30/14) | 1.07 | % | ||
Class R5 Shares | ||||
Inception (4/30/14) | 1.07 | % | ||
Class R6 Shares | ||||
Inception (4/30/14) | 1.07 | % | ||
value will fluctuate so that you may have a gain or loss when you sell shares.
The net annual Fund operating expense ratio set forth in the most recent Fund prospectus as of the date of this report for Class A, Class C, Class R, Class Y, Class R5 and Class R6 shares was 0.82%, 1.57%, 1.07%, 0.57%, 0.57%, and 0.57%, respectively.1,2 The total annual Fund operating expense ratio set forth in the most recent Fund prospectus as of the date of this report for Class A, Class C, Class R, Class Y, Class R5 and Class R6 shares was 1.85%, 2.60%, 2.10%,
1.60%, 1.57% and 1.52%, respectively. The expense ratios presented above may vary from the expense ratios presented in other sections of this report that are based on expenses incurred during the period covered by this report.
Class A share performance reflects the maximum 2.50% sales charge, and Class C share performance reflects the applicable contingent deferred sales charge (CDSC) for the period involved. The CDSC on Class C shares is 1% for the first year after purchase. Class R, Class Y, Class R5 and Class R6 shares do not have a front-end sales charge or a CDSC; therefore, performance is at net asset value.
The performance of the Fund’s share classes will differ primarily due to different sales charge structures and class expenses.
Had the adviser not waived fees and/or expenses, performance would have been lower.
| 1 | Total annual Fund operating expenses after any contractual fee waivers and/or expense reimbursements by the adviser in effect through at least April 30, 2015. See current prospectus for more information. |
| 2 | Total annual Fund operating expenses after any contractual fee waivers by the adviser in effect through at least June 30, 2016. See current prospectus for more information. |
Invesco Strategic Real Return Fund’s investment objective is to seek to mitigate the effects of unanticipated inflation and to provide current income.
| n | Unless otherwise stated, information presented in this report is as of August 31, 2014, and is based on total net assets. |
| n | Unless otherwise noted, all data provided by Invesco. |
| n | To access your Fund’s reports/prospectus, visit invesco.com/fundreports. |
About share classes
| n | Class R shares are generally available only to employer sponsored retirement and benefit plans. Please see the prospectus for more information. |
| n | Class Y shares are available only to certain investors. Please see the prospectus for more information. |
| n | Class R5 shares and Class R6 shares are primarily intended for employer sponsored retirement and benefit plans that meet certain standards and for institutional investors. Please see the prospectus for more information. |
Principal risks of investing in the Fund
| n | Asset-backed securities risk. The Fund may invest in asset-backed securities |
that are subject to prepayment or call risk, which is the risk that the borrower’s payments may be received earlier or later than expected due to changes in prepayment rates on underlying loans. Faster prepayments often happen when interest rates are falling. As a result, the Fund may reinvest these early payments at lower interest rates, thereby reducing the Fund’s income. Conversely, when interest rates rise, prepayments may happen more slowly, causing the security to lengthen in duration. Longer duration securities tend to be more volatile. Securities may be prepaid at a price less than the original purchase value. |
| n | Collateralized loan obligations risk. In addition to the normal interest rate, default and other risk of fixed income |
securities, collateralized loan obligations carry additional risks, including the possibility that distributions from collateral securities will not be adequate to make interest or other payments, the quality of the collateral may decline in value or default, the Fund may invest in collateralized loan obligations that are subordinate to other classes, values may be volatile, and disputes with the issuer may produce unexpected investment results. |
| n | Convertible securities risk. The Fund may own convertible securities, the value of which may be affected by market interest rates, the risk that the issuer will default, the value of the underlying stock or the right of the issuer to buy back the convertible securities. |
continued on page 7
6 Invesco Strategic Real Return Fund
| n | Credit risk. The issuer of instruments in which the Fund invests may be unable to meet interest and/or principal payments, thereby causing its instruments to decrease in value and lowering the issuer’s credit rating. |
| n | Defaulted securities risk. Defaulted securities involve the substantial risk that principal will not be repaid. Defaulted securities and any securities received in an exchange for such securities may be subject to restrictions on resale. |
| n | Derivatives risk. The value of a derivative instrument depends largely on (and is derived from) the value of an underlying security, currency, commodity, interest rate, index or other asset (each referred to as an underlying asset). In addition to risks relating to the underlying assets, the use of derivatives may include other, possibly greater, risks, including counterparty, leverage and liquidity risks. Counter-party risk is the risk that the counter-party to the derivative contract will default on its obligation to pay the Fund the amount owed or otherwise perform under the derivative contract. Derivatives create leverage risk because they do not require payment up front equal to the economic exposure created by owning the derivative. As a result, an adverse change in the value of the underlying asset could result in the Fund sustaining a loss that is substantially greater than the amount invested in the derivative, which may make the Fund’s returns more volatile and increase the risk of loss. Derivative instruments may also be less liquid than more traditional investments and the Fund may be unable to sell or close out its derivative positions at a desirable time or price. This risk may be more acute under adverse market conditions, during which the Fund may be most in need of liquidating its derivative positions. Derivatives may also be harder to value, less tax efficient and subject to changing government regulation that could impact the Fund’s ability to use certain derivatives or their cost. Also, derivatives used for hedging or to gain or limit exposure to a particular market segment may not provide the expected benefits, particularly during adverse market conditions. |
| n | Emerging markets securities risk. The prices of securities issued by foreign companies and governments located in emerging markets countries may be |
affected more negatively by inflation, devaluation of their currencies, higher transaction costs, delays in settlement, adverse political developments, the introduction of capital controls, withholding taxes, nationalization of private assets, expropriation, social unrest, war or lack of timely information than those in developed countries. |
| n | Exchange-traded funds risk. An investment by the Fund in exchange-traded funds generally presents the same primary risks as an investment in a mutual fund. In addition, an exchange-traded fund may be subject to the following: (1) a discount of the exchange-traded fund’s shares to its net asset value; (2) failure to develop an active trading market for the exchange-traded fund’s shares; (3) the listing exchange halting trading of the exchange-traded fund’s shares; (4) failure of the exchange-traded fund’s shares to track the referenced asset; and (5) holding troubled securities in the referenced index or basket of investments. Exchange-traded funds may involve duplication of management fees and certain other expenses, as the Fund indirectly bears its proportionate share of any expenses paid by the exchange-traded funds in which it invests. Further, certain of the exchange-traded funds in which the Fund may invest are leveraged. The more the Fund invests in such leveraged exchange-traded funds, the more this leverage will magnify any losses on those investments. |
| n | Floating rate risk. The Fund may invest in senior secured floating rate loans and debt securities that require collateral. There is a risk that the value of the collateral may not be sufficient to cover the amount owed, collateral securing a loan may be found invalid, and collateral may be used to pay other outstanding obligations of the borrower under applicable law or may be difficult to sell. There is also the risk that the collateral may be difficult to liquidate, or that a majority of the collateral may be illiquid. |
| n | Foreign securities risk. The Fund’s foreign investments may be affected by changes in a foreign country’s exchange rates, political and social instability, changes in economic or taxation policies, difficulties when enforcing obligations, decreased liquidity, and increased volatility. Foreign companies may be subject to less regulation resulting in less publicly available |
information about the companies. |
| n | High yield bond (junk bond) risk. High yield bonds (commonly referred to as junk bonds) involve a greater risk of default or price changes due to changes in the credit quality of the issuer. The values of junk bonds fluctuate more than those of high-quality bonds in response to company, political, regulatory or economic developments. Values of junk bonds can decline significantly over short periods of time. |
| n | Income risk. The income you receive from the Fund is based primarily on prevailing interest rates, which can vary widely over the short- and long-term. If interest rates drop, your income from the Fund may drop as well. |
| n | Indexing risk. The TIPS Portfolio does not utilize an investing strategy that seeks returns in excess of the underlying index. Therefore, it would not necessarily sell a security unless that security is removed from the underlying index. |
| n | Industry focus risk. To the extent a Fund invests in securities issued or guaranteed by companies in the banking and financial services industries, the Fund’s performance will depend on the overall condition of those industries, which may be affected by the following factors: the supply of short-term financing; changes in government regulation and interest rates; and overall economy. |
| n | Inflation-indexed security risk. The risk that the value of an inflation indexed security (such as Treasury Inflation-Protected Securities (TIPS)) tends to decrease when real interest rates increase and increase when real interest rates decrease. Interest payments on inflation-indexed securities will vary along with changes in the Consumer Price Index. |
| n | Interest rate risk. Interest rate risk refers to the risk that bond prices generally fall as interest rates rise; conversely, bond prices generally rise as interest rates fall. Specific bonds differ in their sensitivity to changes in interest rates depending on their individual characteristics, including duration. |
| n | Liquidity risk. The Fund may hold illiquid securities that it is unable to sell at the preferred time or price and could lose its entire investment in such securities. The Fund’s significant use of derivative instruments may cause liquidity risk to |
continued on page 8
7 Invesco Strategic Real Return Fund
continued from page 7
be greater than other mutual funds that invest in more traditional assets such as stocks and bonds, which trade on markets with more market participants.
| n | Management risk. The investment techniques and risk analysis used by the Fund’s portfolio managers may not produce the desired results. Because the Fund’s investment process relies heavily on its asset allocation process, market movements that are counter to the portfolio managers’ expectations may have a significant adverse effect on the Fund’s net asset value. |
| n | Market risk. The prices of and the income generated by the Fund’s securities may decline in response to, among other things, investor sentiment, general economic and market conditions, regional or global instability, and currency and interest rate fluctuations. |
| n | Preferred securities risk. Preferred securities may include provisions that permit the issuer, in its discretion, to defer or omit distributions for a certain period of time. If the Fund owns a security that is deferring or omitting its distributions, the Fund may be required to report the distribution on its tax returns, even though it may not have received this income. Further, preferred securities may lose substantial value due to the omission or deferment of dividend payments. |
| n | Prepayment risk. An issuer’s ability to prepay principal on a loan or debt security prior to maturity can limit the Fund’s potential gains. Prepayments may require the Fund to replace the loan or debt security with a lower yielding security, adversely affecting the Fund’s yield. |
| n | Reinvestment risk. Reinvestment risk is the risk that a bond’s cash flows (coupon income and principal repayment) will be reinvested at an interest rate below that on the original bond. |
| n | Sampling risk. The TIPS Portfolio’s use of a representative sampling approach will result in its holding a smaller number of bonds than are in the underlying index. As a result, an adverse development respecting an issuer of bonds held by the TIPS Portfolio could result |
in a greater decline in NAV than would be the case if the Fund held all of the bonds in the underlying index. To the extent the assets in the TIPS Portfolio are smaller, these risks will be greater. |
| n | When-issued and delayed delivery risk. When-issued and delayed delivery transactions are subject to market risk as the value or yield of a security at delivery may be more or less than the purchase price or the yield generally available on securities when delivery occurs. In addition, the Fund is subject to counterparty risk because it relies on the buyer or seller, as the case may be, to consummate the transaction, and failure by the other party to complete the transaction may result in the Fund missing the opportunity of obtaining a price or yield considered to be advantageous. |
About indexes used in this report
| n | The Bank of America Merrill Lynch Current 10-Year U.S. Treasury Index is an unmanaged index that tracks the performance of the direct sovereign debt of the US government having a maturity of approximately 10 years. |
| n | The Custom Invesco Strategic Real Return Index consists of 45% Bank of America Merrill Lynch U.S. Inflation Linked Treasury Index, 30% S&P/LSTA Leveraged Loan Index and 25% Bank of America Merrill Lynch U.S. High Yield Constrained Index. |
| n | The Lipper Inflation Protected Bond Fund Index is an index based on the total return of certain mutual funds within the Fund’s designated category as determined by Lipper. |
| n | The Bank of America Merrill Lynch U.S. Inflation-Linked Treasury Index is an unmanaged index comprised of US Treasury inflation protected securities with at least $1 billion in outstanding face value and a remaining term to final maturity of greater than one year. |
| n | The S&P/LSTA Leveraged Loan Index is a broad index designed to reflect the performance of US dollar facilities in the leverage loan market. |
| n | The Bank of America Merrill Lynch U.S. High Yield Constrained Index contains all the securities in the Bank of |
America Merrill Lynch U.S. High Yield Index but caps issuer exposure at 2%. |
| n | The Bank of America Merrill Lynch U.S. High Yield Index tracks the performance of below-investment-grade, but not in default, US dollar-denominated corporate bonds publicly issued in the US domestic market, and includes issues with a credit rating of BBB or below, as rated by Moody’s and S&P. |
| n | The Fund is not managed to track the performance of any particular index, including the index(es) described here, and consequently, the performance of the Fund may deviate significantly from the performance of the index(es). |
| n | A direct investment cannot be made in an index. Unless otherwise indicated, index results include reinvested dividends, and they do not reflect sales charges. Performance of the peer group, if applicable, reflects fund expenses; performance of a market index does not. |
| n | Merrill Lynch, Pierce, Fenner & Smith Incorporated and its affiliates (“BofAML”) indices and related information, the name “Bank of America Merrill Lynch,” and related trademarks, are intellectual property licensed from BofAML, and may not be copied, used or distributed without BofAML’s prior written approval. The licensee’s products have not been passed on as to their legality or suitability, and are not regulated, issued, endorsed, sold, guaranteed or promoted by BofAML. BOFAML MAKES NO WARRANTIES AND BEARS NO LIABILITY WITH RESPECT TO THE INDICES, ANY RELATED INFORMATION, ITS TRADEMARKS, OR THE PRODUCT(S) (INCLUDING WITHOUT LIMITATION, THEIR QUALITY, ACCURACY, SUITABILITY AND/OR COMPLETENESS). |
Other information
| n | The returns shown in management’s discussion of Fund performance are based on net asset values (NAVs) calculated for shareholder transactions. Generally accepted accounting principles require adjustments to be made to the net assets of the Fund at period end for financial reporting purposes, and as such, the NAVs for shareholder transactions and the returns based on those NAVs may differ from the NAVs and returns reported in the Financial Highlights. |
This report must be accompanied or preceded by a currently effective Fund prospectus, which contains more complete information, including sales charges and expenses. Investors should read it carefully before investing.
NOT FDIC INSURED | MAY LOSE VALUE | NO BANK GUARANTEE
8 Invesco Strategic Real Return Fund
Schedule of Investments(a)
August 31, 2014
Principal Amount | Value | |||||||
U.S. Treasury Securities–40.48% |
| |||||||
| U.S. Treasury Bills–0.06% | ||||||||
0.04%, 11/13/14(b)(c) | $ | 10,000 | $ | 10,000 | ||||
| U.S. Treasury Inflation-Indexed Bonds–13.22%(d) | ||||||||
2.38%, 01/15/25 | 212,387 | 257,514 | ||||||
2.00%, 01/15/26 | 160,886 | 190,422 | ||||||
2.38%, 01/15/27 | 42,541 | 52,546 | ||||||
1.75%, 01/15/28 | 118,299 | 137,767 | ||||||
3.63%, 04/15/28 | 165,015 | 233,847 | ||||||
2.50%, 01/15/29 | 104,332 | 133,294 | ||||||
3.88%, 04/15/29 | 189,894 | 280,266 | ||||||
3.38%, 04/15/32 | 44,304 | 64,861 | ||||||
2.13%, 02/15/40 | 28,667 | 37,545 | ||||||
2.13%, 02/15/41 | 174,107 | 230,046 | ||||||
0.75%, 02/15/42 | 163,465 | 159,989 | ||||||
0.63%, 02/15/43 | 159,619 | 150,989 | ||||||
1.38%, 02/15/44 | 107,361 | 122,681 | ||||||
| 2,051,767 | ||||||||
| U.S. Treasury Inflation-Indexed Notes–27.20%(d) | ||||||||
2.00%, 01/15/16 | 135,672 | 141,970 | ||||||
0.13%, 04/15/16 | 154,385 | 157,027 | ||||||
2.50%, 07/15/16 | 158,119 | 169,252 | ||||||
2.38%, 01/15/17 | 135,892 | 146,564 | ||||||
0.13%, 04/15/17 | 283,279 | 289,814 | ||||||
2.63%, 07/15/17 | 106,930 | 117,902 | ||||||
1.63%, 01/15/18 | 125,124 | 134,684 | ||||||
0.13%, 04/15/18 | 222,674 | 227,332 | ||||||
1.38%, 07/15/18 | 110,508 | 119,128 | ||||||
2.13%, 01/15/19 | 108,772 | 120,767 | ||||||
0.13%, 04/15/19 | 109,835 | 111,839 | ||||||
1.88%, 07/15/19 | 111,605 | 123,913 | ||||||
1.38%, 01/15/20 | 139,953 | 151,650 | ||||||
1.25%, 07/15/20 | 237,114 | 257,009 | ||||||
1.13%, 01/15/21 | 266,893 | 286,245 | ||||||
0.63%, 07/15/21 | 253,754 | 265,099 | ||||||
0.13%, 01/15/22 | 171,620 | 171,919 | ||||||
0.13%, 07/15/22 | 284,969 | 285,693 | ||||||
0.13%, 01/15/23 | 283,910 | 282,061 | ||||||
0.38%, 07/15/23 | 281,597 | 286,588 | ||||||
0.63%, 01/15/24 | 277,794 | 287,582 | ||||||
0.13%, 07/15/24 | 90,324 | 89,513 | ||||||
| 4,223,551 | ||||||||
Total U.S. Treasury Securities |
| 6,285,318 | ||||||
| Shares | ||||||||
Common Stocks–31.90% |
| |||||||
| Fixed Income Funds–31.90% | ||||||||
Invesco Floating Rate Fund–Class R6 | 622,968 | 4,952,598 | ||||||
Principal Amount | ||||||||
U.S. Dollar Denominated Bonds and Notes–26.39% |
| |||||||
| Aerospace & Defense–0.89% | ||||||||
TransDigm Inc., Sr. Unsec. Gtd. Sub. Global Notes, 7.50%, 07/15/21 | $ | 125,000 | 137,656 | |||||
Principal Amount | Value | |||||||
| Alternative Carriers–0.51% | ||||||||
Level 3 Financing Inc., Sr. Unsec. Gtd. Notes, 6.13%, 01/15/21(f) | $ | 75,000 | $ | 79,500 | ||||
| Apparel Retail–0.37% | ||||||||
Men’s Wearhouse Inc. (The), Sr. Unsec. Gtd. Notes, 7.00%, 07/01/22(f) | 55,000 | 58,025 | ||||||
| Auto Parts & Equipment–0.84% | ||||||||
Dana Holding Corp., Sr. Unsec. Notes, 5.38%, 09/15/21 | 125,000 | 130,313 | ||||||
| Broadcasting–0.87% | ||||||||
Clear Channel Worldwide Holdings Inc., Series B, Sr. Unsec. Gtd. Global Notes, 6.50%, 11/15/22 | 125,000 | 134,687 | ||||||
| Building Products–0.84% | ||||||||
Gibraltar Industries Inc., Sr. Unsec. Gtd. Sub. Global Notes, 6.25%, 02/01/21 | 125,000 | 130,313 | ||||||
| Cable & Satellite–2.51% | ||||||||
CCO Holdings LLC/CCO Holdings Capital Corp., Sr. Unsec. Gtd. Global Notes, 5.25%, 03/15/21 | 125,000 | 128,438 | ||||||
DISH DBS Corp., Sr. Unsec. Gtd. Global Notes, 5.13%, 05/01/20 | 125,000 | 129,062 | ||||||
Intelsat Luxembourg S.A. (Luxembourg), Sr. Unsec. Gtd. Global Bonds, 7.75%, 06/01/21 | 125,000 | 132,813 | ||||||
| 390,313 | ||||||||
| Casinos & Gaming–0.90% | ||||||||
MGM Resorts International, Sr. Unsec. Gtd. Global Notes, 6.75%, 10/01/20 | 125,000 | 139,375 | ||||||
| Coal & Consumable Fuels–0.85% | ||||||||
CONSOL Energy Inc., Sr. Unsec. Gtd. Global Notes, 6.38%, 03/01/21 | 125,000 | 132,813 | ||||||
| Construction Machinery & Heavy Trucks–1.38% | ||||||||
Meritor Inc., Sr. Unsec. Gtd. Notes, 6.25%, 02/15/24 | 125,000 | 129,062 | ||||||
Navistar International Corp., Sr. Unsec. Gtd. Notes, 8.25%, 11/01/21 | 82,000 | 85,485 | ||||||
| 214,547 | ||||||||
| Construction Materials–0.10% | ||||||||
Unifrax I LLC/Unifrax Holding Co., Sr. Unsec. Gtd. Notes, | 15,000 | 15,525 | ||||||
| Data Processing & Outsourced Services–0.62% | ||||||||
First Data Corp., Sr. Unsec. Gtd. Sub. Global Notes, 11.75%, 08/15/21 | 81,000 | 96,086 | ||||||
| Health Care Facilities–0.87% | ||||||||
Tenet Healthcare Corp., Sr. Unsec. Global Notes, 6.75%, 02/01/20 | 125,000 | 134,687 | ||||||
| Health Care Services–0.85% | ||||||||
MPH Acquisition Holdings LLC, Sr. Unsec. Gtd. Notes, 6.63%, 04/01/22(f) | 125,000 | 131,406 | ||||||
| Household Products–0.88% | ||||||||
Reynolds Group Issuer Inc./LLC, Sr. Unsec. Gtd. Global Notes, 8.25%, 02/15/21 | 125,000 | 136,875 | ||||||
| Independent Power Producers & Energy Traders–0.06% | ||||||||
Calpine Corp., Sr. Unsec. Global Notes, 5.38%, 01/15/23 | 9,000 | 9,135 | ||||||
See accompanying Notes to Financial Statements which are an integral part of the financial statements.
9 Invesco Strategic Real Return Fund
Principal Amount | Value | |||||||
| Internet Software & Services–1.19% | ||||||||
CyrusOne L.P./CyrusOne Finance Corp., Sr. Unsec. Gtd. Global Notes, 6.38%, 11/15/22 | $ | 75,000 | $ | 79,781 | ||||
EarthLink Holdings Corp., Sr. Unsec. Gtd. Global Notes, 8.88%, 05/15/19 | 102,000 | 104,933 | ||||||
| 184,714 | ||||||||
| Metal & Glass Containers–1.01% | ||||||||
Ball Corp., Sr. Unsec. Gtd. Notes, 5.00%, 03/15/22 | 10,000 | 10,388 | ||||||
Berry Plastics Corp., Sec. Gtd. Notes, 5.50%, 05/15/22 | 145,000 | 146,087 | ||||||
| 156,475 | ||||||||
| Oil & Gas Equipment & Services–0.82% | ||||||||
Exterran Partners L.P./EXLP Finance Corp., Sr. Unsec. Gtd. Global Notes, 6.00%, 04/01/21 | 125,000 | 126,875 | ||||||
| Oil & Gas Exploration & Production–2.07% | ||||||||
Approach Resources Inc., Sr. Unsec. Gtd. Global Notes, 7.00%, 06/15/21 | 9,000 | 9,405 | ||||||
Baytex Energy Corp. (Canada), Sr. Unsec. Gtd. Notes, | 12,000 | 12,115 | ||||||
Halcon Resources Corp., Sr. Unsec. Gtd. Global Notes, 9.75%, 07/15/20 | 125,000 | 135,937 | ||||||
Sanchez Energy Corp., Sr. Unsec. Gtd. Notes, 6.13%, 01/15/23(f) | 157,000 | 163,280 | ||||||
| 320,737 | ||||||||
| Oil & Gas Storage & Transportation–0.49% | ||||||||
Energy Transfer Equity L.P., Sr. Sec. Gtd. Notes, 7.50%, 10/15/20 | 65,000 | 75,725 | ||||||
| Semiconductor Equipment–0.85% | ||||||||
Amkor Technology Inc., Sr. Unsec. Global Notes, 6.38%, 10/01/22 | 125,000 | 132,813 | ||||||
| Specialized Finance–1.78% | ||||||||
Aircastle Ltd., Sr. Unsec. Global Notes, 7.63%, 04/15/20 | 125,000 | 144,531 | ||||||
CIT Group Inc., Sr. Unsec. Global Notes, 5.00%, 08/15/22 | 125,000 | 132,813 | ||||||
| 277,344 | ||||||||
Principal Amount | Value | |||||||
| Specialized REIT’s–0.82% | ||||||||
Crown Castle International Corp., Sr. Unsec. Notes, 4.88%, 04/15/22 | $ | 125,000 | $ | 127,969 | ||||
| Specialty Stores–0.36% | ||||||||
Michaels Stores Inc., Sr. Unsec. Gtd. Sub. Notes, 5.88%, 12/15/20(f) | 55,000 | 56,031 | ||||||
| Steel–0.87% | ||||||||
ArcelorMittal (Luxembourg), Sr. Unsec. Global Notes, 6.00%, 03/01/21 | 125,000 | 134,875 | ||||||
| Trading Companies & Distributors–0.99% | ||||||||
International Lease Finance Corp., Sr. Unsec. Notes, 8.25%, 12/15/20 | 125,000 | 154,063 | ||||||
| Wireless Telecommunication Services–1.80% | ||||||||
Sprint Capital Corp., Sr. Unsec. Gtd. Global Notes, 6.88%, 11/15/28 | 20,000 | 19,800 | ||||||
Sprint Communications Inc., Sr. Unsec. Global Notes, 6.00%, 11/15/22 | 125,000 | 125,625 | ||||||
T-Mobile USA, Inc., Sr. Unsec. Gtd. Notes, 6.84%, 04/28/23 | 125,000 | 133,437 | ||||||
| 278,862 | ||||||||
Total U.S. Dollar Denominated Bonds and Notes |
| 4,097,739 | ||||||
| Shares | ||||||||
Money Market Funds–0.97% |
| |||||||
Liquid Assets Portfolio–Institutional Class(g) | 74,839 | 74,839 | ||||||
Premier Portfolio–Institutional Class(g) | 74,840 | 74,840 | ||||||
Total Money Market Funds |
| 149,679 | ||||||
TOTAL INVESTMENTS–99.74% |
| 15,485,334 | ||||||
OTHER ASSETS LESS LIABILITIES–0.26% |
| 41,051 | ||||||
NET ASSETS–100.00% |
| $ | 15,526,385 | |||||
Investment Abbreviations:
| Gtd. | – Guaranteed | |
| REIT | – Real Estate Investment Trust | |
| Sec. | – Secured | |
| Sr. | – Senior | |
| Sub. | – Subordinated | |
| Unsec. | – Unsecured |
Notes to Schedule of Investments:
| (a) | Industry and/or sector classifications used in this report are generally according to the Global Industry Classification Standard, which was developed by and is the exclusive property and a service mark of MSCI Inc. and Standard & Poor’s. |
| (b) | Security traded on a discount basis. The interest rate shown represents the discount rate at the time of purchase by the Fund. |
| (c) | All or a portion of the value was pledged as collateral to cover margin requirements for open futures contracts. See Note 1M and Note 4. |
| (d) | Principal amount of security and interest payments are adjusted for inflation. See Note 1I. |
| (e) | Invesco Floating Rate Fund and the Fund are affiliated by either having the same investment adviser or an investment adviser under common control with the Fund’s investment adviser. The value of this security as of August 31, 2014 represented 31.90% of the Fund’s Net Assets. See Note 5. |
| (f) | Security purchased or received in a transaction exempt from registration under the Securities Act of 1933, as amended (the “1933 Act”). The security may be resold pursuant to an exemption from registration under the 1933 Act, typically to qualified institutional buyers. The aggregate value of these securities at August 31, 2014 was $515,882, which represented 3.32% of the Fund’s Net Assets. |
| (g) | The money market fund and the Fund are affiliated by having the same investment adviser. |
See accompanying Notes to Financial Statements which are an integral part of the financial statements.
10 Invesco Strategic Real Return Fund
Statement of Assets and Liabilities
August 31, 2014
Assets: |
| |||
Investments, at value (Cost $10,233,535) | $ | 10,383,057 | ||
Investments in affiliates, at value (Cost $5,109,258) | 5,102,277 | |||
Total investments, at value (Cost $15,342,793) | 15,485,334 | |||
Receivable for: | ||||
Variation margin | 250 | |||
Fund shares sold | 4,000 | |||
Dividends and interest | 99,972 | |||
Investment for trustee deferred compensation and retirement plans | 871 | |||
Other assets | 62,114 | |||
Total assets | 15,652,541 | |||
Liabilities: |
| |||
Payable for: | ||||
Investments purchased | 69,406 | |||
Accrued fees to affiliates | 6,436 | |||
Accrued trustees’ and officers’ fees and benefits | 2,900 | |||
Accrued other operating expenses | 46,543 | |||
Trustee deferred compensation and retirement plans | 871 | |||
Total liabilities | 126,156 | |||
Net assets applicable to shares outstanding | $ | 15,526,385 | ||
Net assets consist of: |
| |||
Shares of beneficial interest | $ | 15,335,977 | ||
Undistributed net investment income | 45,161 | |||
Undistributed net realized gain | 2,433 | |||
Net unrealized appreciation | 142,814 | |||
| $ | 15,526,385 | |||
Net Assets: |
| |||
Class A | $ | 7,879,516 | ||
Class C | $ | 53,932 | ||
Class R | $ | 10,117 | ||
Class Y | $ | 7,562,578 | ||
Class R5 | $ | 10,121 | ||
Class R6 | $ | 10,121 | ||
Shares outstanding, $0.01 par value per share, |
| |||
Class A | 779,532 | |||
Class C | 5,340 | |||
Class R | 1,001 | |||
Class Y | 748,001 | |||
Class R5 | 1,001 | |||
Class R6 | 1,001 | |||
Class A: | ||||
Net asset value per share | $ | 10.11 | ||
Maximum offering price per share | ||||
(Net asset value of $10.11 ¸ 97.50%) | $ | 10.37 | ||
Class C: | ||||
Net asset value and offering price per share | $ | 10.10 | ||
Class R: | ||||
Net asset value and offering price per share | $ | 10.11 | ||
Class Y: | ||||
Net asset value and offering price per share | $ | 10.11 | ||
Class R5: | ||||
Net asset value and offering price per share | $ | 10.11 | ||
Class R6: | ||||
Net asset value and offering price per share | $ | 10.11 | ||
See accompanying Notes to Financial Statements which are an integral part of the financial statements.
11 Invesco Strategic Real Return Fund
Statement of Operations
For the period April 30, 2014 (commencement date) through August 31, 2014
Investment income: |
| |||
Interest | $ | 178,138 | ||
Dividends from affiliates | 70,749 | |||
Total investment income | 248,887 | |||
Expenses: | ||||
Advisory fees | 20,724 | |||
Administrative services fees | 16,986 | |||
Custodian fees | 2,180 | |||
Distribution fees: | ||||
Class A | 6,494 | |||
Class C | 40 | |||
Class R | 17 | |||
Transfer agent fees — A, C, R and Y | 2,217 | |||
Transfer agent fees — R5 | 3 | |||
Transfer agent fees — R6 | 3 | |||
Trustees’ and officers’ fees and benefits | 7,178 | |||
Registration and filing fees | 30,136 | |||
Reports to shareholders | 8,421 | |||
Professional services fees | 40,731 | |||
Other | 7,352 | |||
Total expenses | 142,482 | |||
Less: Fees waived and expenses reimbursed | (118,051 | ) | ||
Net expenses | 24,431 | |||
Net investment income | 224,456 | |||
Realized and unrealized gain (loss) from: | ||||
Net realized gain (loss) from: | ||||
Investment securities | 12,964 | |||
Futures contracts | (8,909 | ) | ||
| 4,055 | ||||
Change in net unrealized appreciation of: | ||||
Investment securities | 142,541 | |||
Futures contracts | 273 | |||
| 142,814 | ||||
Net realized and unrealized gain | 146,869 | |||
Net increase in net assets resulting from operations | $ | 371,325 | ||
See accompanying Notes to Financial Statements which are an integral part of the financial statements.
12 Invesco Strategic Real Return Fund
Statement of Changes in Net Assets
For the period April 30, 2014 (commencement date) through August 31, 2014
April 30, 2014 (Commencement date) to August 31, 2014 | ||||
Operations: |
| |||
Net investment income | $ | 224,456 | ||
Net realized gain | 4,055 | |||
Change in net unrealized appreciation | 142,814 | |||
Net increase in net assets resulting from operations | 371,325 | |||
Distributions to shareholders from net investment income: | ||||
Class A | (101,299 | ) | ||
Class C | (114 | ) | ||
Class R | (127 | ) | ||
Class Y | (104,346 | ) | ||
Class R5 | (140 | ) | ||
Class R6 | (140 | ) | ||
Total distributions from net investment income | (206,166 | ) | ||
Share transactions–net: | ||||
Class A | 7,797,368 | |||
Class C | 53,818 | |||
Class R | 10,010 | |||
Class Y | 7,480,010 | |||
Class R5 | 10,010 | |||
Class R6 | 10,010 | |||
Net increase in net assets resulting from share transactions | 15,361,226 | |||
Net increase in net assets | 15,526,385 | |||
Net assets: | ||||
Beginning of year | — | |||
End of year (includes undistributed net investment income of $45,161) | $ | 15,526,385 | ||
Notes to Financial Statements
August 31, 2014
NOTE 1—Significant Accounting Policies
Invesco Strategic Real Return Fund (the “Fund”) is a series portfolio of AIM Counselor Series Trust (Invesco Counselor Series Trust) (the “Trust”). The Trust is a Delaware statutory trust registered under the Investment Company Act of 1940, as amended (the “1940 Act”), as an open-end series management investment company consisting of thirteen separate portfolios, each authorized to issue an unlimited number of shares of beneficial interest. The assets, liabilities and operations of each portfolio are accounted for separately. Information presented in these financial statements pertains only to the Fund. Matters affecting each portfolio or class will be voted on exclusively by the shareholders of such portfolio or class.
The Fund’s investment objective is to seek to mitigate the effects of unanticipated inflation and to provide current income.
The Fund currently consists of six different classes of shares: Class A, Class C, Class R, Class Y, Class R5 and Class R6. Class A shares are sold with a front-end sales charge unless certain waiver criteria are met and under certain circumstances load waived shares may be subject to contingent deferred sales charges (“CDSC”). Class C shares are sold with a CDSC. Class R, Class Y, Class R5 and Class R6 shares are sold at net asset value.
The following is a summary of the significant accounting policies followed by the Fund in the preparation of its financial statements.
| A. | Security Valuations — Securities, including restricted securities, are valued according to the following policy. |
Debt obligations (including convertible securities) and unlisted equities are fair valued using an evaluated quote provided by an independent pricing service. Evaluated quotes provided by the pricing service may be determined without exclusive reliance on quoted prices, and may reflect appropriate factors such as institution-size trading in similar groups of securities, developments related to specific securities, dividend rate (for unlisted equities), yield (for debt obligations), quality, type of issue, coupon rate (for debt obligations), maturity (for debt obligations), individual trading characteristics and other market data. Debt obligations are subject to interest rate and credit risks. In addition, all debt obligations involve some risk of default with respect to interest and/or principal payments.
A security listed or traded on an exchange (except convertible securities) is valued at its last sales price or official closing price as of the close of the customary trading session on the exchange where the security is principally traded, or lacking any sales or official closing price on a particular day, the security may be valued at the closing bid price on that day. Securities traded in the over-the-counter market are valued based on prices furnished by independent pricing services or market makers. When such securities are valued by an independent pricing service they may be considered fair valued. Futures contracts are valued at the final settlement price set by an exchange on which they are principally traded. Listed options are valued at the mean between the last bid and ask prices from the exchange on which they are principally traded. Options not
13 Invesco Strategic Real Return Fund
listed on an exchange are valued by an independent source at the mean between the last bid and ask prices. For purposes of determining net asset value per share, futures and option contracts generally are valued 15 minutes after the close of the customary trading session of the New York Stock Exchange (“NYSE”).
Investments in open-end and closed-end registered investment companies that do not trade on an exchange are valued at the end of day net asset value per share. Investments in open-end and closed-end registered investment companies that trade on an exchange are valued at the last sales price or official closing price as of the close of the customary trading session on the exchange where the security is principally traded.
Foreign securities’ (including foreign exchange contracts) prices are converted into U.S. dollar amounts using the applicable exchange rates as of the close of the NYSE. If market quotations are available and reliable for foreign exchange-traded equity securities, the securities will be valued at the market quotations. Because trading hours for certain foreign securities end before the close of the NYSE, closing market quotations may become unreliable. If between the time trading ends on a particular security and the close of the customary trading session on the NYSE, events occur that the Adviser determines are significant and make the closing price unreliable, the Fund may fair value the security. If the event is likely to have affected the closing price of the security, the security will be valued at fair value in good faith using procedures approved by the Board of Trustees. Adjustments to closing prices to reflect fair value may also be based on a screening process of an independent pricing service to indicate the degree of certainty, based on historical data, that the closing price in the principal market where a foreign security trades is not the current value as of the close of the NYSE. Foreign securities’ prices meeting the approved degree of certainty that the price is not reflective of current value will be priced at the indication of fair value from the independent pricing service. Multiple factors may be considered by the independent pricing service in determining adjustments to reflect fair value and may include information relating to sector indices, American Depositary Receipts and domestic and foreign index futures. Foreign securities may have additional risks including exchange rate changes, potential for sharply devalued currencies and high inflation, political and economic upheaval, the relative lack of issuer information, relatively low market liquidity and the potential lack of strict financial and accounting controls and standards.
Securities for which market prices are not provided by any of the above methods may be valued based upon quotes furnished by independent sources. The last bid price may be used to value equity securities. The mean between the last bid and asked prices is used to value debt obligations, including corporate loans.
Securities for which market quotations are not readily available or became unreliable are valued at fair value as determined in good faith by or under the supervision of the Trust’s officers following procedures approved by the Board of Trustees. Issuer specific events, market trends, bid/ask quotes of brokers and information providers and other market data may be reviewed in the course of making a good faith determination of a security’s fair value.
The Fund may invest in securities that are subject to interest rate risk, meaning the risk that the prices will generally fall as interest rates rise and, conversely, the prices will generally rise as interest rates fall. Specific securities differ in their sensitivity to changes in interest rates depending on their individual characteristics. Changes in interest rates may result in increased market volatility, which may affect the value and/or liquidity of certain of the Fund’s investments.
Valuations change in response to many factors including the historical and prospective earnings of the issuer, the value of the issuer’s assets, general economic conditions, interest rates, investor perceptions and market liquidity. Because of the inherent uncertainties of valuation, the values reflected in the financial statements may materially differ from the value received upon actual sale of those investments.
| B. | Securities Transactions and Investment Income — Securities transactions are accounted for on a trade date basis. Realized gains or losses on sales are computed on the basis of specific identification of the securities sold. Interest income (net of withholding tax, if any) is recorded on the accrual basis from settlement date. Dividend income (net of withholding tax, if any) is recorded on the ex-dividend date. Bond premiums and discounts are amortized and/or accreted for financial reporting purposes. |
The Fund may periodically participate in litigation related to Fund investments. As such, the Fund may receive proceeds from litigation settlements. Any proceeds received are included in the Statement of Operations as realized gain (loss) for investments no longer held and as unrealized gain (loss) for investments still held.
Brokerage commissions and mark ups are considered transaction costs and are recorded as an increase to the cost basis of securities purchased and/or a reduction of proceeds on a sale of securities. Such transaction costs are included in the determination of net realized and unrealized gain (loss) from investment securities reported in the Statement of Operations and the Statement of Changes in Net Assets and the net realized and unrealized gains (losses) on securities per share in the Financial Highlights. Transaction costs are included in the calculation of the Fund’s net asset value and, accordingly, they reduce the Fund’s total returns. These transaction costs are not considered operating expenses and are not reflected in net investment income reported in the Statement of Operations and Statement of Changes in Net Assets, or the net investment income per share and ratios of expenses and net investment income reported in the Financial Highlights, nor are they limited by any expense limitation arrangements between the Fund and the investment adviser.
The Fund allocates realized and unrealized capital gains and losses to a class based on the relative net assets of each class. The Fund allocates income to a class based on the relative value of the settled shares of each class.
| C. | Country Determination — For the purposes of making investment selection decisions and presentation in the Schedule of Investments, the investment adviser may determine the country in which an issuer is located and/or credit risk exposure based on various factors. These factors include the laws of the country under which the issuer is organized, where the issuer maintains a principal office, the country in which the issuer derives 50% or more of its total revenues and the country that has the primary market for the issuer’s securities, as well as other criteria. Among the other criteria that may be evaluated for making this determination are the country in which the issuer maintains 50% or more of its assets, the type of security, financial guarantees and enhancements, the nature of the collateral and the sponsor organization. Country of issuer and/or credit risk exposure has been determined to be the United States of America, unless otherwise noted. |
| D. | Distributions — Distributions from net investment income, if any, are declared daily and paid monthly. Distributions from net realized capital gain, if any, are generally declared and paid annually and recorded on the ex-dividend date. The Fund may elect to treat a portion of the proceeds from redemptions as distributions for federal income tax purposes. |
| E. | Federal Income Taxes — The Fund intends to comply with the requirements of Subchapter M of the Internal Revenue Code of 1986, as amended (the “Internal Revenue Code”), necessary to qualify as a regulated investment company and to distribute substantially all of the Fund’s |
14 Invesco Strategic Real Return Fund
| taxable earnings to shareholders. As such, the Fund will not be subject to federal income taxes on otherwise taxable income (including net realized capital gain) that is distributed to shareholders. Therefore, no provision for federal income taxes is recorded in the financial statements. |
The Fund recognizes the tax benefits of uncertain tax positions only when the position is more likely than not to be sustained. Management has analyzed the Fund’s uncertain tax positions and concluded that no liability for unrecognized tax benefits should be recorded related to uncertain tax positions. Management is not aware of any tax positions for which it is reasonably possible that the total amounts of unrecognized tax benefits will change materially in the next 12 months.
The Fund files tax returns in the U.S. Federal jurisdiction and certain other jurisdictions. Generally, the Fund is subject to examinations by such taxing authorities for up to three years after the filing of the return for the tax period.
| F. | Expenses — Fees provided for under the Rule 12b-1 plan of a particular class of the Fund are charged to the operations of such class. Transfer agency fees and expenses and other shareholder recordkeeping fees and expenses attributable to Class R5 and Class R6 are allocated to each share class based on relative net assets. Sub-accounting fees attributable to Class R5 are charged to the operations of the class. Transfer agency fees and expenses and other shareholder recordkeeping fees and expenses relating to all other classes are allocated among those classes based on relative net assets. All other expenses are allocated among the classes based on relative net assets. |
| G. | Accounting Estimates — The preparation of financial statements in conformity with accounting principles generally accepted in the United States of America (“GAAP”) requires management to make estimates and assumptions that affect the reported amounts of assets and liabilities at the date of the financial statements and the reported amounts of revenues and expenses during the reporting period including estimates and assumptions related to taxation. Actual results could differ from those estimates by a significant amount. In addition, the Fund monitors for material events or transactions that may occur or become known after the period-end date and before the date the financial statements are released to print. |
| H. | Indemnifications — Under the Trust’s organizational documents, each Trustee, officer, employee or other agent of the Trust is indemnified against certain liabilities that may arise out of the performance of their duties to the Fund. Additionally, in the normal course of business, the Fund enters into contracts, including the Fund’s servicing agreements, that contain a variety of indemnification clauses. The Fund’s maximum exposure under these arrangements is unknown as this would involve future claims that may be made against the Fund that have not yet occurred. The risk of material loss as a result of such indemnification claims is considered remote. |
| I. | Treasury Inflation-Protected Securities — The Fund may invest in Treasury Inflation-Protected Securities (“TIPS”). TIPS are fixed income securities whose principal value is periodically adjusted to the rate of inflation. The principal value of TIPS will be adjusted upward or downward, and any increase or decrease in the principal amount of TIPS will be included as interest income in the Statement of Operations, even though investors do not receive their principal until maturity. |
| J. | Foreign Currency Translations — Foreign currency is valued at the close of the NYSE based on quotations posted by banks and major currency dealers. Portfolio securities and other assets and liabilities denominated in foreign currencies are translated into U.S. dollar amounts at date of valuation. Purchases and sales of portfolio securities (net of foreign taxes withheld on disposition) and income items denominated in foreign currencies are translated into U.S. dollar amounts on the respective dates of such transactions. The Fund does not separately account for the portion of the results of operations resulting from changes in foreign exchange rates on investments and the fluctuations arising from changes in market prices of securities held. The combined results of changes in foreign exchange rates and the fluctuation of market prices on investments (net of estimated foreign tax withholding) are included with the net realized and unrealized gain or loss from investments in the Statement of Operations. Reported net realized foreign currency gains or losses arise from (1) sales of foreign currencies, (2) currency gains or losses realized between the trade and settlement dates on securities transactions, and (3) the difference between the amounts of dividends, interest, and foreign withholding taxes recorded on the Fund’s books and the U.S. dollar equivalent of the amounts actually received or paid. Net unrealized foreign currency gains and losses arise from changes in the fair values of assets and liabilities, other than investments in securities at fiscal period end, resulting from changes in exchange rates. |
The Fund may invest in foreign securities, which may be subject to foreign taxes on income, gains on investments or currency repatriation, a portion of which may be recoverable. Foreign taxes, if any, are recorded based on the tax regulations and rates that exist in the foreign markets in which the Fund invests and are shown in the Statement of Operations.
| K. | Forward Foreign Currency Contracts — The Fund may engage in foreign currency transactions either on a spot (i.e. for prompt delivery and settlement) basis at the rate prevailing in the currency exchange market at the time or through forward foreign currency contracts to manage or minimize currency or exchange rate risk. |
The Fund may also enter into forward foreign currency contracts for the purchase or sale of a security denominated in a foreign currency in order to “lock in” the U.S. dollar price of that security, or the Fund may also enter into forward foreign currency contracts that do not provide for physical settlement of the two currencies, but instead are settled by a single cash payment calculated as the difference between the agreed upon exchange rate and the spot rate at settlement based upon an agreed upon notional amount (non-deliverable forwards). The Fund will set aside liquid assets in an amount equal to daily mark-to-market obligation for forward foreign currency contracts.
A forward foreign currency contract is an obligation to purchase or sell a specific currency for an agreed-upon price at a future date. The use of forward foreign currency contracts does not eliminate fluctuations in the price of the underlying securities the Fund owns or intends to acquire but establishes a rate of exchange in advance. Fluctuations in the value of these contracts are measured by the difference in the contract date and reporting date exchange rates and are recorded as unrealized appreciation (depreciation) until the contracts are closed. When the contracts are closed, realized gains (losses) are recorded. Realized and unrealized gains (losses) on the contracts are included in the Statement of Operations. The primary risks associated with forward foreign currency contracts include failure of the counterparty to meet the terms of the contract and the value of the foreign currency changing unfavorably. These risks may be in excess of the amounts reflected in the Statement of Assets and Liabilities.
| L. | Futures Contracts — The Fund may enter into futures contracts to manage exposure to interest rate, equity and market price movements and/or currency risks. A futures contract is an agreement between two parties to purchase or sell a specified underlying security, currency or commodity (or delivery of a cash settlement price, in the case of an index future) for a fixed price at a future date. The Fund currently invests only in exchange-traded futures and they are standardized as to maturity date and underlying financial instrument. Initial margin deposits required upon entering into futures contracts are satisfied by the segregation of specific securities or cash as collateral at the futures commission |
15 Invesco Strategic Real Return Fund
| merchant (broker). During the period the futures contracts are open, changes in the value of the contracts are recognized as unrealized gains or losses by recalculating the value of the contracts on a daily basis. Subsequent or variation margin payments are received or made depending upon whether unrealized gains or losses are incurred. These amounts are reflected as receivables or payables on the Statement of Assets and Liabilities. When the contracts are closed or expire, the Fund recognizes a realized gain or loss equal to the difference between the proceeds from, or cost of, the closing transaction and the Fund’s basis in the contract. The net realized gain (loss) and the change in unrealized gain (loss) on futures contracts held during the period is included on the Statement of Operations. The primary risks associated with futures contracts are market risk and the absence of a liquid secondary market. If the Fund were unable to liquidate a futures contract and/or enter into an offsetting closing transaction, the Fund would continue to be subject to market risk with respect to the value of the contracts and continue to be required to maintain the margin deposits on the futures contracts. Futures contracts have minimal counterparty risk since the exchange’s clearinghouse, as counterparty to all exchange-traded futures, guarantees the futures against default. Risks may exceed amounts recognized in the Statement of Assets and Liabilities. |
| M. | Leverage Risk — Leverage exists when a Fund can lose more than it originally invests because it purchases or sells an instrument or enters into a transaction without investing an amount equal to the full economic exposure of the instrument or transaction. |
| N. | Collateral — To the extent the Fund has designated or segregated a security as collateral and that security is subsequently sold, it is the Fund’s practice to replace such collateral no later than the next business day. |
NOTE 2—Advisory Fees and Other Fees Paid to Affiliates
The Trust has entered into a master investment advisory agreement with Invesco Advisers, Inc. (the “Adviser” or “Invesco”). Under the terms of the investment advisory agreement, the Fund pays an advisory fee to the Adviser based on the annual rate of the Fund’s average daily net assets as follows:
| Average Daily Net Assets | Rate | |||
First $1 billion | 0.40% | |||
Next $2.5 billion | 0.35% | |||
Over $3.5 billion | 0.33% | |||
Under the terms of a master sub-advisory agreement between the Adviser and each of Invesco Asset Management Deutschland GmbH, Invesco Asset Management Limited, Invesco Asset Management (Japan) Limited, Invesco Australia Limited, Invesco Hong Kong Limited, Invesco Senior Secured Management, Inc., Invesco Canada Ltd. and Invesco PowerShares Capital Management LLC (collectively, the “Affiliated Sub-Advisers”) the Adviser, not the Fund, may pay 40% of the fees paid to the Adviser to any such Affiliated Sub-Adviser(s) that provide(s) discretionary investment management services to the Fund based on the percentage of assets allocated to such Sub-Adviser(s).
The Adviser has contractually agreed, through at least April 30, 2015, to waive advisory fees and/or reimburse expenses of all shares to the extent necessary to limit total annual fund operating expenses after fee waiver and/or expense reimbursement (excluding certain items discussed below) of Class A, Class C, Class R, Class Y, Class R5 and Class R6 shares to 0.78%, 1.53%, 1.03%, 0.53%, 0.53% and 0.53%, respectively, of average daily net assets. In determining the Adviser’s obligation to waive advisory fees and/or reimburse expenses, the following expenses are not taken into account, and could cause the total annual fund operating expenses after fee waiver and/or expense reimbursement to exceed the numbers reflected above: (1) interest; (2) taxes; (3) dividend expense on short sales; (4) extraordinary or non-routine items, including litigation expenses; and (5) expenses that the Fund has incurred but did not actually pay because of an expense offset arrangement. Unless Invesco continues the fee waiver agreement, it will terminate on April 30, 2015. The fee waiver agreement cannot be terminated during its term. To the extent that the annualized expense ratio does not exceed the expense limitation, the Adviser will retain its ability to be reimbursed for such fee waivers or reimbursements prior to the end of each fiscal year.
Further, the Adviser has contractually agreed, through at least June 30, 2016, to waive the advisory fee payable by the Fund in an amount equal to 100% of the net advisory fees the Adviser receives from the affiliated underlying funds on investments by the Fund of uninvested cash in such affiliated underlying funds.
For the period April 30, 2014 (commencement date) through August 31, 2014, the Adviser waived advisory fees and reimbursed fund level expenses of $115,827 and reimbursed class level expenses of $1,113, $2, $2, $1,101, $3 and $3 of Class A, Class C, Class R, Class Y, Class R5 and Class R6 shares, respectively.
The Trust has entered into a master administrative services agreement with Invesco pursuant to which the Fund has agreed to pay Invesco for certain administrative costs incurred in providing accounting services to the Fund. For the period April 30, 2014 (commencement date) through August 31, 2014, expenses incurred under the agreement are shown in the Statement of Operations as Administrative services fees.
The Trust has entered into a transfer agency and service agreement with Invesco Investment Services, Inc. (“IIS”) pursuant to which the Fund has agreed to pay IIS a fee for providing transfer agency and shareholder services to the Fund and reimburse IIS for certain expenses incurred by IIS in the course of providing such services. IIS may make payments to intermediaries that provide omnibus account services, sub-accounting services and/or networking services. All fees payable by IIS to intermediaries that provide omnibus account services or sub-accounting are charged back to the Fund, subject to certain limitations approved by the Trust’s Board of Trustees. For the period April 30, 2014 (commencement date) through August 31, 2014, expenses incurred under the agreement are shown in the Statement of Operations as Transfer agent fees.
The Trust has entered into master distribution agreements with Invesco Distributors, Inc. (“IDI”) to serve as the distributor for the Class A, Class C, Class R, Class Y, Class R5 and Class R6 shares of the Fund. The Trust has adopted plans pursuant to Rule 12b-1 under the 1940 Act with respect to the Fund’s Class A, Class C and Class R shares (collectively the “Plans”). The Fund, pursuant to the Plans, pays IDI compensation at the annual rate of 0.25% of the Fund’s average daily net assets of Class A shares, 1.00% of the average daily net assets of Class C shares and 0.50% of the average daily net assets of Class R shares. Of the Plan payments, up to 0.25% of the average daily net assets of each class of shares may be paid to furnish continuing personal shareholder services to customers who purchase and own shares of such classes. Any amounts not paid as a service fee under the Plans would constitute an asset-based sales charge. Rules of the Financial Industry Regulatory Authority (“FINRA”) impose a cap on the total sales
16 Invesco Strategic Real Return Fund
charges, including asset-based sales charges, that may be paid by any class of shares of the Fund. For the period April 30, 2014 (commencement date) through August 31, 2014, expenses incurred under the Plans are shown in the Statement of Operations as Distribution fees.
Front-end sales commissions and CDSC (collectively, the “sales charges”) are not recorded as expenses of the Fund. Front-end sales commissions are deducted from proceeds from the sales of Fund shares prior to investment in Class A shares of the Fund. CDSC are deducted from redemption proceeds prior to remittance to the shareholder. During the period April 30, 2014 (commencement date) through August 31, 2014, IDI advised the Fund that IDI retained $42 in front-end sales commissions from the sale of Class A shares.
Certain officers and trustees of the Trust are officers and directors of the Adviser, IIS and/or IDI.
NOTE 3—Additional Valuation Information
GAAP defines fair value as the price that would be received to sell an asset or paid to transfer a liability in an orderly transaction between market participants at the measurement date, under current market conditions. GAAP establishes a hierarchy that prioritizes the inputs to valuation methods, giving the highest priority to readily available unadjusted quoted prices in an active market for identical assets (Level 1) and the lowest priority to significant unobservable inputs (Level 3), generally when market prices are not readily available or are unreliable. Based on the valuation inputs, the securities or other investments are tiered into one of three levels. Changes in valuation methods may result in transfers in or out of an investment’s assigned level:
| Level 1 — | Prices are determined using quoted prices in an active market for identical assets. |
| Level 2 — | Prices are determined using other significant observable inputs. Observable inputs are inputs that other market participants may use in pricing a security. These may include quoted prices for similar securities, interest rates, prepayment speeds, credit risk, yield curves, loss severities, default rates, discount rates, volatilities and others. |
| Level 3 — | Prices are determined using significant unobservable inputs. In situations where quoted prices or observable inputs are unavailable (for example, when there is little or no market activity for an investment at the end of the period), unobservable inputs may be used. Unobservable inputs reflect the Fund’s own assumptions about the factors market participants would use in determining fair value of the securities or instruments and would be based on the best available information. |
The following is a summary of the tiered valuation input levels, as of August 31, 2014. The level assigned to the securities valuations may not be an indication of the risk or liquidity associated with investing in those securities. Because of the inherent uncertainties of valuation, the values reflected in the financial statements may materially differ from the value received upon actual sale of those investments.
| Level 1 | Level 2 | Level 3 | Total | |||||||||||||
Equity Securities | $ | 5,102,277 | $ | — | $ | — | $ | 5,102,277 | ||||||||
U.S. Treasury Securities | — | 6,285,318 | — | 6,285,318 | ||||||||||||
Corporate Debt Securities | — | 4,097,739 | — | 4,097,739 | ||||||||||||
| 5,102,277 | 10,383,057 | — | 15,485,334 | |||||||||||||
Futures Contracts* | 273 | — | — | 273 | ||||||||||||
Total Investments | $ | 5,102,550 | $ | 10,383,057 | $ | — | $ | 15,485,607 | ||||||||
| * | Unrealized appreciation. |
NOTE 4—Derivative Investments
Value of Derivative Investments at Period-End
The table below summarizes the value of the Fund’s derivative investments, detailed by primary risk exposure, held as of August 31, 2014:
| Value | ||||||||
| Risk Exposure/Derivative Type | Assets | Liabilities | ||||||
Interest rate risk: | ||||||||
Futures contracts(a) | $ | 273 | $ | — | ||||
| (a) | Includes cumulative appreciation of futures contracts. Only current day’s variation margin receivable is reported within the Statement of Assets and Liabilities. |
17 Invesco Strategic Real Return Fund
Effect of Derivative Investments for the Period April 30, 2014 (commencement date) through August 31, 2014
The table below summarizes the gains (losses) on derivative investments, detailed by primary risk exposure, recognized in earnings during the period:
| Location of Gain (Loss) on Statement of Operations | ||||
| Futures Contracts | ||||
Realized Gain (Loss): | ||||
Interest rate risk | $ | (8,909 | ) | |
Change in Unrealized Appreciation: | ||||
Interest rate risk | 273 | |||
Total | $ | (8,636 | ) | |
The table below summarizes the average notional value of futures contracts outstanding for the period April 30 (commencement date) through August 31, 2014.
| Futures Contracts | ||||
Average notional value | $ | 501,078 | ||
| Open Futures Contracts at Period-End | ||||||||||||||||||||
| Futures Contracts | Type of Contract | Number of Contracts | Expiration Month | Notional Value | Unrealized Appreciation | |||||||||||||||
U.S. Treasury 10 Year Notes | Short | 4 | December-2014 | $ | (503,125 | ) | $ | 273 | ||||||||||||
Total Futures Contracts — Interest Rate Risk |
| $ | 273 | |||||||||||||||||
Offsetting Assets and Liabilities
Accounting Standards Update (“ASU”) No. 2011-11, Disclosures about Offsetting Assets and Liabilities, which was subsequently clarified in Financial Accounting Standards Board ASU 2013-01 “Clarifying the Scope of Disclosures about Offsetting Assets and Liabilities” is intended to enhance disclosures about financial instruments and derivative instruments that are subject to offsetting arrangements on the Statement of Assets and Liabilities and to enable investors to better understand the effect of those arrangements on its financial position. In order for an arrangement to be eligible for netting, the Fund must have a basis to conclude that such netting arrangements are legally enforceable. The Fund enters into netting agreements and collateral agreements in an attempt to reduce the Fund’s Counterparty credit risk by providing for a single net settlement with a Counterparty of all financial transactions covered by the agreement in an event of default as defined under such agreement.
There were no derivative instruments subject to a netting agreement for which the Fund is not currently netting. The following tables present derivative instruments that are either subject to an enforceable netting agreement or offset by collateral arrangements as of August 31, 2014.
| Assets: | ||||||||||||||||||||||||
| Gross amounts presented in Statement of Assets & Liabilities | Gross amounts offset in Statement of Assets & Liabilities | Net amounts of assets presented in the Statement of Assets & Liabilities | Collateral Received | Net | ||||||||||||||||||||
| Counterparty | Financial Instruments | Cash | ||||||||||||||||||||||
Bank of America Securities LLC | $ | 273 | $ | — | $ | 273 | $ | — | $ | — | $ | 273 | ||||||||||||
NOTE 5—Investments in Affiliates
The Fund’s Adviser and the adviser for Invesco Floating Rate Fund are subsidiaries of Invesco Ltd. and therefore, Invesco Floating Rate Fund is considered to be affiliated with the Fund. The following is a summary of the transactions in, and earnings from, investments in Invesco Floating Rate Fund for the period April 30, 2014 (commencement date) to August 31, 2014.
Value (commencement date) | Purchases at Cost | Proceeds from Sales | Change in Unrealized Appreciation (Depreciation) | Realized Gain (Loss) | Value 08/31/14 | Dividend Income | ||||||||||||||||||||||
Invesco Floating Rate Fund | $ | — | $ | 4,959,579 | $ | — | $ | (6,981 | ) | $ | — | $ | 4,952,598 | $ | 70,675 | |||||||||||||
NOTE 6—Trustees’ and Officers’ Fees and Benefits
Trustees’ and Officers’ Fees and Benefits include amounts accrued by the Fund to pay remuneration to certain Trustees and Officers of the Fund. Trustees have the option to defer compensation payable by the Fund, and Trustees’ and Officers’ Fees and Benefits also include amounts accrued by the Fund to fund such deferred compensation amounts. Those Trustees who defer compensation have the option to select various Invesco Funds in which their deferral accounts shall be deemed to be invested. Trustees’ and Officers’ Fees and Benefits include amounts accrued by the Fund to fund such retirement benefits. Obligations under the deferred compensation and retirement plans represent unsecured claims against the general assets of the Fund.
18 Invesco Strategic Real Return Fund
NOTE 7—Cash Balances
The Fund is permitted to temporarily carry a negative or overdrawn balance in its account with State Street Bank and Trust Company, the custodian bank. Such balances, if any at period end, are shown in the Statement of Assets and Liabilities under the payable caption Amount due custodian. To compensate the custodian bank for such overdrafts, the overdrawn Fund may either (1) leave funds as a compensating balance in the account so the custodian bank can be compensated by earning the additional interest; or (2) compensate by paying the custodian bank at a rate agreed upon by the custodian bank and Invesco, not to exceed the contractually agreed upon rate. A Fund may not purchase additional securities when any borrowings from banks exceeds 5% of the Fund’s total assets.
NOTE 8—Distributions to Shareholders and Tax Components of Net Assets
Tax Character of Distributions to Shareholders Paid During the Period April 30, 2014 (Commencement Date) through August 31, 2014:
| 2014 | ||||
Ordinary income | $ | 206,166 | ||
Tax Components of Net Assets at Period-End:
| 2014 | ||||
Undistributed ordinary income | $ | 65,789 | ||
Net unrealized appreciation — investments | 125,311 | |||
Temporary book/tax differences | (692 | ) | ||
Shares of beneficial interest | 15,335,977 | |||
Total net assets | $ | 15,526,385 | ||
The difference between book-basis and tax-basis unrealized appreciation is due to differences in the timing of recognition of gains and losses on investments for tax and book purposes. The Fund’s net unrealized appreciation difference is attributable primarily to wash sales and bond premium amortization.
The temporary book/tax differences are a result of timing differences between book and tax recognition of income and/or expenses. The Fund’s temporary book/tax differences are the result of the trustee deferral of compensation and retirement plan benefits.
Capital loss carryforward is calculated and reported as of a specific date. Results of transactions and other activity after that date may affect the amount of capital loss carryforward actually available for the Fund to utilize. Capital loss carryforwards will retain their character as either short-term or long-term capital losses. The ability to utilize capital loss carryforward in the future may be limited under the Internal Revenue Code and related regulations based on the results of future transactions.
The Fund did not have a capital loss carryforward as of August 31, 2014.
NOTE 9—Investment Securities
The aggregate amount of investment securities (other than short-term securities, U.S. Treasury obligations and money market funds, if any) purchased and sold by the Fund during the period April 30, 2014 (commencement date) through August 31, 2014 was $9,419,940 and $396,849, respectively. During the same period, purchases and sales of U.S. Treasury obligations were $7,470,230 and $1,397,353, respectively. Cost of investments on a tax basis includes the adjustments for financial reporting purposes as of the most recently completed federal income tax reporting period-end.
| Unrealized Appreciation (Depreciation) of Investment Securities on a Tax Basis | ||||
Aggregate unrealized appreciation of investment securities | $ | 159,176 | ||
Aggregate unrealized (depreciation) of investment securities | (33,865 | ) | ||
Net unrealized appreciation of investment securities | $ | 125,311 | ||
Cost of investments for tax purposes is $15,360,023.
NOTE 10—Reclassification of Permanent Differences
Primarily as a result of differing book/tax treatment of stock issuance cost and bond premium amortization, on August 31, 2014, undistributed net investment income was increased by $26,871, undistributed net realized gain was decreased by $1,622 and shares of beneficial interest was decreased by $25,249. This reclassification had no effect on the net assets of the Fund.
19 Invesco Strategic Real Return Fund
NOTE 11—Share Information
| Summary of Share Activity | ||||||||
| April 30, 2014 (commencement date) to August 31, 2014(a) | ||||||||
| Shares | Amount | |||||||
Sold: | ||||||||
Class A | 783,367 | $ | 7,836,144 | |||||
Class C | 5,340 | 53,818 | ||||||
Class R | 1,001 | 10,010 | ||||||
Class Y | 748,001 | 7,480,010 | ||||||
Class R5 | 1,001 | 10,010 | ||||||
Class R6 | 1,001 | 10,010 | ||||||
Issued as reinvestment of dividends: | ||||||||
Class A | 165 | 1,666 | ||||||
Reacquired: | ||||||||
Class A | (4,000 | ) | (40,442 | ) | ||||
Net increase in share activity | 1,535,876 | $ | 15,361,226 | |||||
| (a) | 98% of the outstanding shares of the Fund are owned by the Adviser. |
NOTE 12—Financial Highlights
The following schedule presents financial highlights for a share of the Fund outstanding throughout the periods indicated.
| Net asset value, beginning of period | Net investment income(a) | Net gains on securities (both realized and unrealized) | Total from investment operations | Dividends from net investment income | Net asset value, end of period | Total return(b) | Net assets, end of period (000’s omitted) | Ratio of expenses to average net assets with fee waivers and/or expenses absorbed | Ratio of expenses to average net assets without fee waivers and/or expenses absorbed | Ratio of net investment income to average net assets | Portfolio turnover(c) | |||||||||||||||||||||||||||||||||||||
Class A |
| |||||||||||||||||||||||||||||||||||||||||||||||
Period ended 08/31/14(d) | $ | 10.00 | $ | 0.14 | $ | 0.10 | $ | 0.24 | $ | (0.13 | ) | $ | 10.11 | 2.44 | % | $ | 7,880 | 0.59 | %(e) | 2.87 | %(e) | 4.21 | %(e) | 13 | % | |||||||||||||||||||||||
Class C | ||||||||||||||||||||||||||||||||||||||||||||||||
Period ended 08/31/14(d) | 10.00 | 0.12 | 0.09 | 0.21 | (0.11 | ) | 10.10 | 2.14 | 54 | 1.34 | (e) | 3.62 | (e) | 3.46 | (e) | 13 | ||||||||||||||||||||||||||||||||
Class R |
| |||||||||||||||||||||||||||||||||||||||||||||||
Period ended 08/31/14(d) | 10.00 | 0.14 | 0.10 | 0.24 | (0.13 | ) | 10.11 | 2.37 | 10 | 0.84 | (e) | 3.12 | (e) | 3.96 | (e) | 13 | ||||||||||||||||||||||||||||||||
Class Y | ||||||||||||||||||||||||||||||||||||||||||||||||
Period ended 08/31/14(d) | 10.00 | 0.15 | 0.10 | 0.25 | (0.14 | ) | 10.11 | 2.50 | 7,563 | 0.34 | (e) | 2.62 | (e) | 4.46 | (e) | 13 | ||||||||||||||||||||||||||||||||
Class R5 | ||||||||||||||||||||||||||||||||||||||||||||||||
Period ended 08/31/14(d) | 10.00 | 0.15 | 0.10 | 0.25 | (0.14 | ) | 10.11 | 2.50 | 10 | 0.34 | (e) | 2.68 | (e) | 4.46 | (e) | 13 | ||||||||||||||||||||||||||||||||
Class R6 | ||||||||||||||||||||||||||||||||||||||||||||||||
Period ended 08/31/14(d) | 10.00 | 0.15 | 0.10 | 0.25 | (0.14 | ) | 10.11 | 2.50 | 10 | 0.34 | (e) | 2.68 | (e) | 4.46 | (e) | 13 | ||||||||||||||||||||||||||||||||
| (a) | Calculated using average shares outstanding. |
| (b) | Includes adjustments in accordance with accounting principles generally accepted in the United States of America and as such, the net asset value for financial reporting purposes and the returns based upon those net asset values may differ from the net asset value and returns for shareholder transactions. Does not include sales charges and is not annualized for periods less than one year, if applicable. |
| (c) | Portfolio turnover is calculated at the fund level and is not annualized for periods less than one year, if applicable. |
| (d) | Commencement date of April 30, 2014. |
| (e) | Ratios are annualized and based on average daily net assets (000’s omitted) of $7,646, $11, $10, $7,562, $10 and $10 for Class A, Class C, Class R, Class Y, Class R5 and Class R6 shares, respectively. |
20 Invesco Strategic Real Return Fund
Report of Independent Registered Public Accounting Firm
To the Board of Trustees of AIM Counselor Series Trust (Invesco Counselor Series Trust)
and Shareholders of Invesco Strategic Real Return Fund:
In our opinion, the accompanying statement of assets and liabilities, including the schedule of investments, and the related statements of operations and of changes in net assets and the financial highlights present fairly, in all material respects, the financial position of Invesco Strategic Real Return Fund (one of the funds constituting AIM Counselor Series Trust (Invesco Counselor Series Trust), hereafter referred to as the “Fund”) at August 31, 2014, the results of its operations, the changes in its net assets and the financial highlights for the period April 30, 2014 (commencement of operations) through August 31, 2014, in conformity with accounting principles generally accepted in the United States of America. These financial statements and financial highlights (hereafter referred to as “financial statements”) are the responsibility of the Fund’s management. Our responsibility is to express an opinion on these financial statements based on our audit. We conducted our audit of these financial statements in accordance with the standards of the Public Company Accounting Oversight Board (United States). Those standards require that we plan and perform the audit to obtain reasonable assurance about whether the financial statements are free of material misstatement. An audit includes examining, on a test basis, evidence supporting the amounts and disclosures in the financial statements, assessing the accounting principles used and significant estimates made by management, and evaluating the overall financial statement presentation. We believe that our audit, which included confirmation of securities at August 31, 2014 by correspondence with the custodian, provides a reasonable basis for our opinion.
PRICEWATERHOUSECOOPERS LLP
October 27, 2014
Houston, Texas
21 Invesco Strategic Real Return Fund
Calculating your ongoing Fund expenses
Example
As a shareholder of the Fund, you incur two types of costs: (1) transaction costs, which may include sales charges (loads) on purchase payments or contingent deferred sales charges on redemptions, if any; and (2) ongoing costs, including management fees, distribution and/or service (12b-1) fees, and other Fund expenses. This example is intended to help you understand your ongoing costs (in dollars) of investing in the Fund and to compare these costs with ongoing costs of investing in other mutual funds. The actual ending account value and expenses in the example below are based on an investment of $1,000 invested as of the close of business on April 30, 2014 (commencement date) and held through August 31, 2014.
Actual expenses
The table below provides information about actual account values and actual expenses. You may use the information in this table, together with the amount you invested, to estimate the expenses that you paid over the period. Simply divide your account value by $1,000 (for example, an $8,600 account value divided by $1,000 = 8.6), then multiply the result by the number in the table under the heading entitled “Actual Expenses Paid During Period” to estimate the expenses you paid on your account during this period. Because the actual ending account value and expense information in the example is not based upon a six month period, the ending account value and expense information may not provide a meaningful comparison to mutual funds that provide such information for a full six month period.
Hypothetical example for comparison purposes
The table below also provides information about hypothetical account values and hypothetical expenses based on the Fund’s actual expense ratio and an assumed rate of return of 5% per year before expenses, which is not the Fund’s actual return.
The hypothetical account values and expenses may not be used to estimate the actual ending account balance or expenses you paid for the period. You may use this information to compare the ongoing costs of investing in the Fund and other funds. To do so, compare this 5% hypothetical example with the 5% hypothetical examples that appear in the shareholder reports of the other funds.
Please note that the expenses shown in the table are meant to highlight your ongoing costs only and do not reflect any transaction costs, such as sales charges (loads) on purchase payments or contingent deferred sales charges on redemptions, if any. Therefore, the hypothetical information is useful in comparing ongoing costs only, and will not help you determine the relative total costs of owning different funds. In addition, if these transaction costs were included, your costs would have been higher.
| Class | Beginning Account Value (04/30/14) | ACTUAL | HYPOTHETICAL (5% annual return before expenses) | Annualized Ratio | ||||||||||||||||||||
| Ending Account Value (08/31/14)1 | Expenses Paid During Period2 | Ending Account Value (08/31/14) | Expenses Paid During Period3 | |||||||||||||||||||||
| A | $ | 1,000.00 | $ | 1,024.40 | $ | 2.03 | $ | 1,022.23 | $ | 3.01 | 0.59 | % | ||||||||||||
| C | 1,000.00 | 1,021.40 | 4.60 | 1,018.45 | 6.82 | 1.34 | ||||||||||||||||||
| R | 1,000.00 | 1,023.70 | 2.89 | 1,020.97 | 4.28 | 0.84 | ||||||||||||||||||
| Y | 1,000.00 | 1,025.00 | 1.17 | 1,023.49 | 1.73 | 0.34 | ||||||||||||||||||
| R5 | 1,000.00 | 1,025.00 | 1.17 | 1,023.49 | 1.73 | 0.34 | ||||||||||||||||||
| R6 | 1,000.00 | 1,025.00 | 1.17 | 1,023.49 | 1.73 | 0.34 | ||||||||||||||||||
| 1 | The actual ending account value is based on the actual total return of the Fund for the period April 30, 2014 (commencement date) through August 31, 2014, after actual expenses and will differ from the hypothetical ending account value which is based on the Fund’s expense ratio and a hypothetical annual return of 5% before expenses. |
| 2 | Actual expenses are equal to the Fund’s annualized expense ratio as indicated above multiplied by the average account value over the period, multiplied by 124 (as of close of business April 30, 2014 (commencement date) through August 31, 2014)/365. Because the Fund has not been in existence for a full six month period, the actual ending account value and expense information shown may not provide a meaningful comparison to fund expense information of classes that show such data for a full six month period and, because the actual ending account value and expense information in the expense example covers a short time period, return and expense data may not be indicative of return and expense data for longer time periods. |
| 3 | Hypothetical expenses are equal to the annualized expense ratio indicated above multiplied by the average account value over the period, multiplied by 184/365 to reflect a one-half year period. The hypothetical ending account value and expenses may be used to compare ongoing costs of investing in the Fund and other funds because such data is based on a full six month period. |
22 Invesco Strategic Real Return Fund
Initial Approval of Investment Advisory and Sub-Advisory Contracts
The Board of Trustees (the Board) of AIM Counselor Series Trust (Invesco Counselor Series Trust) (the Company) is required under the Investment Company Act of 1940, as amended, to approve the Invesco Strategic Real Return Fund (the Fund) investment advisory agreements before the Fund can commence operations. During meetings held on March 25-26, 2014, the Board as a whole and the disinterested or “independent” Trustees voting separately approved (i) an amendment to the Company’s Master Investment Advisory Agreement with Invesco Advisers, Inc. (Invesco Advisers) to add the Fund, and (ii) (a) an amendment to the Master Intergroup Sub-Advisory Contract for Mutual Funds with Invesco Asset Management Deutschland GmbH, Invesco Asset Management Limited, Invesco Asset Management (Japan) Limited, Invesco Australia Limited, Invesco Hong Kong Limited, Invesco Senior Secured Management, Inc. (ISSM) and Invesco Canada Ltd. to add the Fund, and (b) an amendment to the Sub-Advisory Contract with Invesco PowerShares Capital Management LLC to add the Fund (the sub-advisers, the Affiliated Sub-Advisers; and the contracts, the sub-advisory contracts). In doing so, the Board followed a process similar to the process that it follows in annually reviewing and approving investment advisory agreements and sub-advisory contracts for the series portfolios of funds advised by Invesco Advisers and considered the information provided in most recent annual review process as well as the information provided with respect to the Fund. The Board (i) determined that the investment advisory agreement and sub-advisory contracts are in the best interest of the Fund and its shareholders and that the compensation payable to Invesco Advisers and the Affiliated Sub-Advisers under the Fund’s agreements is fair and reasonable and (ii) approved submission of the agreements to the initial shareholder of the Fund.
The Board’s Fund Evaluation Process
The Board’s Investments Committee has established three Sub-Committees that are responsible for overseeing the management of a number of the funds advised by Invesco Advisers (the Invesco Funds). The Fund will be assigned to one of the Sub-Committees. The Sub-Committees meet throughout the year to review the performance, fees, expenses and other matters related to their assigned Invesco Funds. Over the course of each year, the Sub-Committees meet with portfolio managers for their assigned Invesco Funds and other members of management and review with these individuals the performance, investment objective(s), policies, strategies, limitations and investment risks of these funds.
In evaluating the fairness and reasonableness of compensation under the Fund’s investment
advisory agreement and sub-advisory contracts, the Board considered, among other things, the factors discussed below. The Board was assisted in its review by the Senior Officer, an independent officer of the Funds, and by independent legal counsel. The discussion below serves as a summary of the material factors and related conclusions that formed the basis for the Board’s approval of the Fund’s investment advisory agreement and sub-advisory contracts. The Trustees’ review and conclusions are based on the comprehensive consideration of all information presented to them and are not the result of any single determinative factor. Moreover, one Trustee may have weighed a particular piece of information or factor differently than another Trustee.
Factors and Conclusions and Summary of Evaluation of Investment Advisory and Sub-Advisory Agreements
| A. | Nature, Extent and Quality of Services Provided by Invesco Advisers and the Affiliated Sub-Advisers |
The Board reviewed the advisory services to be provided to the Fund by Invesco Advisers under the Fund’s investment advisory agreement and the credentials and experience of the officers and employees of Invesco Advisers who will provide these services. The Board’s review of the qualifications of Invesco Advisers to provide these services included the Board’s consideration of Invesco Advisers’ investment process oversight, independent credit analysis and investment risk management. The Board also considered non-advisory services that Invesco Advisers and its affiliates provide to the Invesco Funds and will provide to the Fund, such as various back office support functions, equity and fixed income trading operations, internal audit, distribution and legal and compliance. In determining whether to approve the Fund’s investment advisory agreement, the Board considered the existing relationship between Invesco Advisers and the Invesco Funds, as well as the Board’s knowledge of Invesco Advisers’ operations. The Board concluded that the nature, extent and quality of the advisory services to be provided to the Fund by Invesco Advisers are appropriate.
The Board reviewed the services that may be provided by the Affiliated Sub-Advisers under the sub-advisory contracts and the credentials and experience of the officers and employees of the Affiliated Sub-Advisers who may provide these services. The Board noted that the Affiliated Sub-Advisers have offices and personnel that are located in financial centers around the world. As a result, the Affiliated Sub-Advisers can provide research and investment analysis on the markets and economies of various countries in which the Fund may invest, make recommendations regarding securities and assist with security
trades. The Board noted that ISSM will manage a portion of the Fund’s assets. The Board concluded that the sub-advisory contracts will benefit the Fund and its shareholders by permitting Invesco Advisers to use the resources and talents of the Affiliated Sub-Advisers in managing the Fund. The Board concluded that the nature, extent and quality of the services that may be provided by the Affiliated Sub-Advisers are appropriate.
| B. | Fund Performance |
The Board did not consider the performance of the Fund because the Fund is new and has no performance history. The Board did review performance expectations for the Fund in different market environments.
| C. | Advisory and Sub-Advisory Fees and Fee Waivers |
The Board considered the proposed advisory fee schedule of the Fund and the proposed fee waivers and expense limitations that will be in place for the Fund through May 31, 2015. The Board also considered the services to be provided by the Affiliated Sub-Advisers pursuant to the sub-advisory contracts and the services to be provided by Invesco Advisers pursuant to the Fund’s investment advisory agreement, as well as the allocation of fees between Invesco Advisers and the Affiliated Sub-Advisers pursuant to the sub-advisory contracts. The Board noted that the sub-advisory fees will have no direct effect on the Fund or its shareholders, as they are paid by Invesco Advisers to the Affiliated Sub-Advisers.
The Board also considered comparative advisory fee data provided by Invesco Advisers for comparable registered funds managed by third-party advisers. The Board noted that Invesco Advisers does not manage other funds or client accounts with investment strategies comparable to those of the Fund. The Board noted that the advisory fee is at or below the Lipper Treasury Inflation-Protected classification median fee and that the advisory fee is at or below the fees of four key competitors identified by Invesco Advisers at all breakpoints and above the fees of one key competitor at certain breakpoints and below the fees of that competitor at other breakpoints.
Based upon the information provided and considerations described above, the Board concluded that the compensation payable to Invesco Advisers and the Affiliated Sub-Advisers is fair and reasonable.
| D. | Economies of Scale and Breakpoints |
The Board considered the extent to which there may be economies of scale in the provision of advisory services to the Fund. The Board also considered whether the Fund would benefit from such economies of scale through contractual breakpoints in the Fund’s advisory fee schedule and through expense waivers. The Board also noted that the Fund will share directly in economies of scale through lower
23 Invesco Strategic Real Return Fund
fees charged by third party service providers based on the combined size of all of the Invesco Funds and other clients advised by Invesco Advisers.
| E. | Profitability and Financial Resources |
The Board considered information from Invesco Advisers concerning the costs of the advisory and other services that Invesco Advisers and its affiliates provide to the Invesco Funds and the profitability of Invesco Advisers and its affiliates in providing these services. The Board received information from Invesco Advisers demonstrating that Invesco Advisers and each Affiliated Sub-Adviser are financially sound and have the resources necessary to perform their obligations under the Fund’s investment advisory agreement and sub-advisory contracts.
| F. | Collateral Benefits to Invesco Advisers and its Affiliates |
The Board considered various other benefits to be received by Invesco Advisers and its affiliates resulting from Invesco Advisers’ relationship with the Fund, including the fees to be received by Invesco Advisers and its affiliates for their provision of transfer agency and distribution services to the Fund. The Board considered the performance of Invesco Advisers and its affiliates in providing these services to other Invesco Funds and the organizational structure employed by Invesco Advisers and its affiliates to provide these services. The Board also considered that these services will be provided to the Fund pursuant to written contracts that are reviewed and approved on an annual basis by the Board; that the services are required for the operation of the Fund; that Invesco Advisers and its affiliates can provide services, the nature and quality of which are at least equal to those provided by others offering the same or similar services; and that the fees for such services are fair and reasonable in light of the usual and customary charges by others for services of the same nature and quality.
The Board considered the fact that the Fund’s uninvested cash and cash collateral from any securities lending arrangements may be invested in money market funds advised by Invesco Advisers pursuant to procedures approved by the Board. The Board noted that Invesco Advisers receives advisory fees from these affiliated money market funds attributable to such investments, although Invesco Advisers has contractually agreed to waive through varying periods the advisory fees payable by the Invesco Funds with respect to investments in the affiliated money market funds. This waiver is in an amount equal to 100% of the net advisory fee Invesco Advisers or its affiliates receive from the affiliated money market funds with respect to the Fund’s investment in the affiliated money market funds of uninvested cash, but not cash collateral from securities lending arrangements. The Board concluded that the Fund’s investment of uninvested cash and cash collateral from any securities lending arrangements in the affiliated money market funds is fair and reasonable.
24 Invesco Strategic Real Return Fund
Tax Information
Form 1099-DIV, Form 1042-S and other year–end tax information provide shareholders with actual calendar year amounts that should be included in their tax returns. Shareholders should consult their tax advisors.
The following distribution information is being provided as required by the Internal Revenue Code or to meet a specific state’s requirement.
The Fund designates the following amounts or, if subsequently determined to be different, the maximum amount allowable the fiscal period April 30, 2014 (commencement date) through August 31, 2014:
Federal and State Income Tax | ||||
Qualified Dividend Income* | 0 | % | ||
Corporate Dividends Received Deduction* | 0 | % | ||
U.S. Treasury Obligations* | 9.80 | % | ||
Tax-Exempt Interest Dividends* | 0 | % | ||
| * | The above percentages are based on ordinary income dividends paid to shareholders during the period April 30, 2014 (commencement date) through August 31, 2014. |
25 Invesco Strategic Real Return Fund
Trustees and Officers
The address of each trustee and officer is AIM Counselor Series Trust (Invesco Counselor Series Trust) (the “Trust”), 11 Greenway Plaza, Suite 1000, Houston, Texas 77046-1173. The trustees serve for the life of the Trust, subject to their earlier death, incapacitation, resignation, retirement or removal as more specifically provided in the Trust’s organizational documents. Each officer serves for a one year term or until their successors are elected and qualified. Column two below includes length of time served with predecessor entities, if any.
Name, Year of Birth and Position(s) Held with the Trust | Trustee and/ or Officer Since | Principal Occupation(s) During Past 5 Years | Number of Funds in Fund Complex Overseen by Trustee | Other Directorship(s) Held by Trustee During Past 5 Years | ||||
| Interested Persons | ||||||||
Martin L. Flanagan1 — 1960 Trustee | 2007 | Executive Director, Chief Executive Officer and President, Invesco Ltd. (ultimate parent of Invesco and a global investment management firm); Advisor to the Board, Invesco Advisers, Inc. (formerly known as Invesco Institutional (N.A.), Inc.); Trustee, The Invesco Funds; Vice Chair, Investment Company Institute; and Member of Executive Board, SMU Cox School of Business.
Formerly: Chairman and Chief Executive Officer, Invesco Advisers, Inc. (registered investment adviser); Director, Chairman, Chief Executive Officer and President, IVZ Inc. (holding company), INVESCO Group Services, Inc. (service provider) and Invesco North American Holdings, Inc. (holding company); Director, Chief Executive Officer and President, Invesco Holding Company Limited (parent of Invesco and a global investment management firm); Director, Invesco Ltd.; Chairman, Investment Company Institute and President, Co-Chief Executive Officer, Co-President, Chief Operating Officer and Chief Financial Officer, Franklin Resources, Inc. (global investment management organization). | 141 | None | ||||
Philip A. Taylor2 — 1954 Trustee, President and Principal Executive Officer | 2006 | Head of North American Retail and Senior Managing Director, Invesco Ltd.; Director, Co-Chairman, Co-President and Co-Chief Executive Officer, Invesco Advisers, Inc. (formerly known as Invesco Institutional (N.A.), Inc.) (registered investment adviser); Director, Chairman, Chief Executive Officer and President, Invesco Management Group, Inc. (formerly known as Invesco Aim Management Group, Inc.) (financial services holding company); Director and President, INVESCO Funds Group, Inc. (registered investment adviser and registered transfer agent); Director and Chairman, Invesco Investment Services, Inc. (formerly known as Invesco Aim Investment Services, Inc.) (registered transfer agent) and IVZ Distributors, Inc. (formerly known as INVESCO Distributors, Inc.) (registered broker dealer); Director, President and Chairman, Invesco Inc. (holding company) and Invesco Canada Holdings Inc. (holding company); Chief Executive Officer, Invesco Corporate Class Inc. (corporate mutual fund company) and Invesco Canada Fund Inc. (corporate mutual fund company); Director, Chairman and Chief Executive Officer, Invesco Canada Ltd. (formerly known as Invesco Trimark Ltd./Invesco Trimark Ltèe) (registered investment adviser and registered transfer agent); Trustee, President and Principal Executive Officer, The Invesco Funds (other than AIM Treasurer’s Series Trust (Invesco Treasurer’s Series Trust) and Short-Term Investments Trust); Trustee and Executive Vice President, The Invesco Funds (AIM Treasurer’s Series Trust (Invesco Treasurer’s Series Trust) and Short-Term Investments Trust only); Director, Invesco Investment Advisers LLC (formerly known as Van Kampen Asset Management); Director, Chief Executive Officer and President, Van Kampen Exchange Corp.
Formerly: Director and Chairman, Van Kampen Investor Services Inc.; Director, Chief Executive Officer and President, 1371 Preferred Inc. (holding company) and Van Kampen Investments Inc.; Director and President, AIM GP Canada Inc. (general partner for limited partnerships) and Van Kampen Advisors, Inc.; Director and Chief Executive Officer, Invesco Trimark Dealer Inc. (registered broker dealer); Director, Invesco Distributors, Inc. (formerly known as Invesco Aim Distributors, Inc.) (registered broker dealer); Manager, Invesco PowerShares Capital Management LLC; Director, Chief Executive Officer and President, Invesco Advisers, Inc.; Director, Chairman, Chief Executive Officer and President, Invesco Aim Capital Management, Inc.; President, Invesco Trimark Dealer Inc. and Invesco Trimark Ltd./Invesco Trimark Ltèe; Director and President, AIM Trimark Corporate Class Inc. and AIM Trimark Canada Fund Inc.; Senior Managing Director, Invesco Holding Company Limited; Director and Chairman, Fund Management Company (former registered broker dealer); President and Principal Executive Officer, The Invesco Funds (AIM Treasurer’s Series Trust (Invesco Treasurer’s Series Trust), and Short-Term Investments Trust only); President, AIM Trimark Global Fund Inc. and AIM Trimark Canada Fund Inc. | 141 | None | ||||
Wayne W. Whalen3 — 1939 Trustee | 2010 | Of Counsel, and prior to 2010, partner in the law firm of Skadden, Arps, Slate, Meagher & Flom LLP, legal counsel to certain funds in the Fund Complex
| 141 | Director of the Mutual fund Directors Forum, a nonprofit membership organization for investment directors; Chairman and Director of the Abraham Lincoln Presidential Library Foundation; and Director of the Stevenson Center for Democracy |
| 1 | Mr. Flanagan is considered an interested person (within the meaning of Section 2(a)(19) of the 1940 Act) of the Trust because he is an officer of the Adviser to the Trust, and an officer and a director of Invesco Ltd., ultimate parent of the Adviser. |
| 2 | Mr. Taylor is considered an interested person (within the meaning of Section 2(a)(19) of the 1940 Act) of the Trust because he is an officer and a director of the Adviser. |
| 3 | Mr. Whalen is retiring effective December 31, 2014. He has been deemed to be an interested person of the Trust because of his prior service as counsel to the predecessor funds of certain Invesco open-end funds and his affiliation with the law firm that served as counsel to such predecessor funds and the Invesco closed-end funds. |
T-1 Invesco Strategic Real Return Fund
Trustees and Officers—(continued)
Name, Year of Birth and Position(s) Held with the Trust | Trustee and/ or Officer Since | Principal Occupation(s) During Past 5 Years | Number of Funds in Fund Complex Overseen by Trustee | Other Directorship(s) Past 5 Years | ||||
| Independent Trustees | ||||||||
Bruce L. Crockett — 1944 Trustee and Chair | 2003 | Chairman, Crockett Technologies Associates (technology consulting company)
Formerly: Director, Captaris (unified messaging provider); Director, President and Chief Executive Officer, COMSAT Corporation; Chairman, Board of Governors of INTELSAT (international communications company); ACE Limited (insurance company); and Investment Company Institute | 141 | ALPS (Attorneys Liability Protection Society) (insurance company) | ||||
David C. Arch — 1945 Trustee | 2010 | Chairman of Blistex Inc., a consumer health care products manufacturer | 141 | Board member of the Illinois Manufacturers’ Association; Member of the Board of Visitors, Institute for the Humanities, University of Michigan; Member of the Audit Committee of the Edward-Elmhurst Hospital | ||||
Frank S. Bayley — 1939 Trustee | 2003 | Retired. Formerly: Director, Badgley Funds Inc. (registered investment company) (2 portfolios) and General Partner and Of Counsel, law firm of Baker & McKenzie, LLP | 141 | Director and Chairman, C.D. Stimson Company (a real estate investment company); Trustee, The Curtis Institute of Music | ||||
James T. Bunch — 1942 Trustee | 2000 | Managing Member, Grumman Hill Group LLC (family office private equity investments)
Formerly: Founder, Green Manning & Bunch Ltd. (investment banking firm) (1988-2010); Executive Committee, United States Golf Association; and Director, Policy Studies, Inc. and Van Gilder Insurance Corporation | 141 | Chairman, Board of Governors, Western Golf Association; Chairman, Evans Scholars Foundation; and Director, Denver Film Society | ||||
Rodney F. Dammeyer — 1940 Trustee | 2010 | Chairman of CAC, LLC, (private company offering capital investment and management advisory services)
Formerly: Prior to 2001, Managing Partner at Equity Group Corporate Investments; Prior to 1995, Chief Executive Officer of Itel Corporation (formerly Anixter International); Prior to 1985, experience includes Senior Vice President and Chief Financial Officer of Household International, Inc., Executive Vice President and Chief Financial Officer of Northwest Industries, Inc. and Partner of Arthur Andersen & Co.; From 1987 to 2010, Director/Trustee of investment companies in the Van Kampen Funds complex | 141 | Director of Quidel Corporation and Stericycle, Inc. | ||||
Albert R. Dowden — 1941 Trustee | 2003 | Director of a number of public and private business corporations, including the Boss Group, Ltd. (private investment and management); Nature’s Sunshine Products, Inc. and Reich & Tang Funds (5 portfolios) (registered investment company)
Formerly: Director, Homeowners of America Holding Corporation/Homeowners of America Insurance Company (property casualty company); Director, Continental Energy Services, LLC (oil and gas pipeline service); Director, CompuDyne Corporation (provider of product and services to the public security market) and Director, Annuity and Life Re (Holdings), Ltd. (reinsurance company); Director, President and Chief Executive Officer, Volvo Group North America, Inc.; Senior Vice President, AB Volvo; Director of various public and private corporations; Chairman, DHJ Media, Inc.; Director, Magellan Insurance Company; and Director, The Hertz Corporation, Genmar Corporation (boat manufacturer), National Media Corporation; Advisory Board of Rotary Power International (designer, manufacturer, and seller of rotary power engines); and Chairman, Cortland Trust, Inc. (registered investment company) | 141 | Director of: Nature’s Sunshine Products, Inc., Reich & Tang Funds, Homeowners of America Holding Corporation/ Homeowners of America Insurance Company, the Boss Group | ||||
Jack M. Fields — 1952 Trustee | 2003 | Chief Executive Officer, Twenty First Century Group, Inc. (government affairs company); Owner and Chief Executive Officer, Dos Angeles Ranch, L.P. (cattle, hunting, corporate entertainment); and Discovery Global Education Fund (non-profit)
Formerly: Chief Executive Officer, Texana Timber LP (sustainable forestry company); Director of Cross Timbers Quail Research Ranch (non-profit); and member of the U.S. House of Representatives | 141 | Insperity, Inc. (formerly known as Administaff) | ||||
Prema Mathai-Davis — 1950 Trustee | 2003 | Retired. Formerly: Chief Executive Officer, YWCA of the U.S.A. | 141 | None | ||||
Larry Soll — 1942 Trustee | 1997 | Retired. Formerly: Chairman, Chief Executive Officer and President, Synergen Corp. (a biotechnology company) | 141 | None | ||||
Hugo F. Sonnenschein — 1940 Trustee | 2010 | President Emeritus and Honorary Trustee of the University of Chicago and the Adam Smith Distinguished Service Professor in the Department of Economics at the University of Chicago. Prior to 2000, President of the University of Chicago | 141 | Trustee of the University of Rochester and a member of its investment committee; Member of the National Academy of Sciences and the American Philosophical Society; Fellow of the American Academy of Arts and Sciences |
T-2 Invesco Strategic Real Return Fund
Trustees and Officers—(continued)
Name, Year of Birth and Position(s) Held with the Trust | Trustee and/ or Officer Since | Principal Occupation(s) During Past 5 Years | Number of Funds in Fund Complex Overseen by Trustee | Other Directorship(s) Past 5 Years | ||||
| Independent Trustees—(continued) | ||||||||
Raymond Stickel, Jr. — 1944 Trustee | 2005 | Retired. Formerly: Director, Mainstay VP Series Funds, Inc. (25 portfolios) and Partner, Deloitte & Touche | 141 | None | ||||
Suzanne H. Woolsey — 1941 Trustee | 2014 | Chief Executive Officer of Woolsey Partners LLC | 141 | Emeritus Chair of the Board of Trustees of the Institute for Defense Analyses; Trustee of Colorado College; Trustee of California Institute of Technology; Prior to 2014, Director of Fluor Corp.; Prior to 2010, Trustee of the German Marshall Fund of the United States; Prior to 2010 Trustee of the Rocky Mountain Institute | ||||
| Other Officers | ||||||||
Russell C. Burk — 1958 Senior Vice President and Senior Officer | 2005 | Senior Vice President and Senior Officer, The Invesco Funds | N/A | N/A | ||||
John M. Zerr — 1962 Senior Vice President, Chief Legal Officer and Secretary | 2006 | Director, Senior Vice President, Secretary and General Counsel, Invesco Management Group, Inc. (formerly known as Invesco Aim Management Group, Inc.) and Van Kampen Exchange Corp.; Senior Vice President, Invesco Advisers, Inc. (formerly known as Invesco Institutional (N.A.), Inc.) (registered investment adviser); Senior Vice President and Secretary, Invesco Distributors, Inc. (formerly known as Invesco Aim Distributors, Inc.); Director, Vice President and Secretary, Invesco Investment Services, Inc. (formerly known as Invesco Aim Investment Services, Inc.) and IVZ Distributors, Inc. (formerly known as INVESCO Distributors, Inc.); Director and Vice President, INVESCO Funds Group, Inc.; Senior Vice President, Chief Legal Officer and Secretary, The Invesco Funds; Manager, Invesco PowerShares Capital Management LLC; Director, Secretary and General Counsel, Invesco Investment Advisers LLC (formerly known as Van Kampen Asset Management); Secretary and General Counsel, Invesco Capital Markets, Inc. (formerly known as Van Kampen Funds Inc.) and Chief Legal Officer, PowerShares Exchange-Traded Fund Trust, PowerShares Exchange-Traded Fund Trust II, PowerShares India Exchange-Traded Fund Trust and PowerShares Actively Managed Exchange-Traded Fund Trust
Formerly: Director and Vice President, Van Kampen Advisors Inc.; Director, Vice President, Secretary and General Counsel, Van Kampen Investor Services Inc.; Director, Invesco Distributors, Inc. (formerly known as Invesco Aim Distributors, Inc.); Director, Senior Vice President, General Counsel and Secretary, Invesco Aim Advisers, Inc. and Van Kampen Investments Inc.; Director, Vice President and Secretary, Fund Management Company; Director, Senior Vice President, Secretary, General Counsel and Vice President, Invesco Aim Capital Management, Inc.; Chief Operating Officer and General Counsel, Liberty Ridge Capital, Inc. (an investment adviser); Vice President and Secretary, PBHG Funds (an investment company) and PBHG Insurance Series Fund (an investment company); Chief Operating Officer, General Counsel and Secretary, Old Mutual Investment Partners (a broker-dealer); General Counsel and Secretary, Old Mutual Fund Services (an administrator) and Old Mutual Shareholder Services (a shareholder servicing center); Executive Vice President, General Counsel and Secretary, Old Mutual Capital, Inc. (an investment adviser); and Vice President and Secretary, Old Mutual Advisors Funds (an investment company) | N/A | N/A | ||||
Sheri Morris — 1964 Vice President, Treasurer and Principal Financial Officer | 2003 | Vice President, Treasurer and Principal Financial Officer, The Invesco Funds; Vice President, Invesco Advisers, Inc. (formerly known as Invesco Institutional (N.A.), Inc.) (registered investment adviser); and Vice President, PowerShares Exchange-Traded Fund Trust, PowerShares Exchange-Traded Fund Trust II, PowerShares India Exchange-Traded Fund Trust and PowerShares Actively Managed Exchange-Traded Fund Trust
Formerly: Vice President, Invesco Aim Advisers, Inc., Invesco Aim Capital Management, Inc. and Invesco Aim Private Asset Management, Inc.; Assistant Vice President and Assistant Treasurer, The Invesco Funds and Assistant Vice President, Invesco Advisers, Inc., Invesco Aim Capital Management, Inc. and Invesco Aim Private Asset Management, Inc.; and Treasurer, PowerShares Exchange-Traded Fund Trust, PowerShares Exchange-Traded Fund Trust II, PowerShares India Exchange-Traded Fund Trust and PowerShares Actively Managed Exchange-Traded Fund Trust | N/A | N/A | ||||
T-3 Invesco Strategic Real Return Fund
Trustees and Officers—(continued)
Name, Year of Birth and Position(s) Held with the Trust | Trustee and/ or Officer Since | Principal Occupation(s) During Past 5 Years | Number of Funds in Fund Complex Overseen by Trustee | Other Directorship(s) Past 5 Years | ||||
| Other Officers—(continued) | ||||||||
Karen Dunn Kelley — 1960 Vice President | 2003 | Senior Managing Director, Investments; Director, Co-President, Co-Chief Executive Officer, and Co-Chairman, Invesco Advisers, Inc. (formerly known as Invesco Institutional (N.A.), Inc.) (registered investment adviser); Chairman, Invesco Senior Secured Management, Inc.; Senior Vice President, Invesco Management Group, Inc. (formerly known as Invesco Aim Management Group, Inc.); Executive Vice President, Invesco Distributors, Inc. (formerly known as Invesco Aim Distributors, Inc.); Director, Invesco Mortgage Capital Inc. and Invesco Management Company Limited; Director and President, INVESCO Asset Management (Bermuda) Ltd., Vice President, The Invesco Funds (other than AIM Treasurer’s Series Trust (Invesco Treasurer’s Series Trust) and Short-Term Investments Trust); and President and Principal Executive Officer, The Invesco Funds (AIM Treasurer’s Series Trust (Invesco Treasurer’s Series Trust) and Short-Term Investments Trust only)
Formerly: Director, INVESCO Global Asset Management Limited and INVESCO Management S.A.; Senior Vice President, Van Kampen Investments Inc. and Invesco Advisers, Inc. (formerly known as Invesco Institutional (N.A.), Inc.) (registered investment adviser); Vice President, Invesco Advisers, Inc. (formerly known as Invesco Institutional (N.A.), Inc.); Director of Cash Management and Senior Vice President, Invesco Advisers, Inc. and Invesco Aim Capital Management, Inc.; Director and President, Fund Management Company; Chief Cash Management Officer, Director of Cash Management, Senior Vice President, and Managing Director, Invesco Aim Capital Management, Inc.; Director of Cash Management, Senior Vice President, and Vice President, Invesco Advisers, Inc. and The Invesco Funds (AIM Treasurer’s Series Trust (Invesco Treasurer’s Series Trust), and Short-Term Investments Trust only) | N/A | N/A | ||||
Crissie M. Wisdom — 1969 Anti-Money Laundering Compliance Officer | 2013 | Anti-Money Laundering Compliance Officer, Invesco Advisers, Inc. (formerly known as Invesco Institutional (N.A.), Inc.) (registered investment adviser), Invesco Capital Markets, Inc. (formerly known as Van Kampen Funds Inc.), Invesco Distributors, Inc., Invesco Investment Services, Inc., Invesco Management Group, Inc., Van Kampen Exchange Corp., The Invesco Funds, and PowerShares Exchange-Traded Fund Trust, PowerShares Exchange-Traded Fund Trust II, PowerShares India Exchange-Traded Fund Trust, and PowerShares Actively Managed Exchange-Traded Fund Trust; and Fraud Prevention Manager and Controls and Risk Analysis Manager for Invesco Investment Services, Inc. | N/A | N/A | ||||
Todd L. Spillane — 1958 Chief Compliance Officer | 2006 | Senior Vice President, Invesco Management Group, Inc. (formerly known as Invesco Aim Management Group, Inc.) and Van Kampen Exchange Corp.; Senior Vice President and Chief Compliance Officer, Invesco Advisers, Inc. (registered investment adviser) (formerly known as Invesco Institutional (N.A.), Inc.); Chief Compliance Officer, The Invesco Funds; Vice President, Invesco Distributors, Inc. (formerly known as Invesco Aim Distributors, Inc.) and Invesco Investment Services, Inc. (formerly known as Invesco Aim Investment Services, Inc.)
Formerly: Chief Compliance Officer, Invesco Funds (Chicago); Senior Vice President, Van Kampen Investments Inc.; Senior Vice President and Chief Compliance Officer, Invesco Aim Advisers, Inc. and Invesco Aim Capital Management, Inc.; Chief Compliance Officer, INVESCO Private Capital Investments, Inc. (holding company), Invesco Private Capital, Inc. (registered investment adviser), Invesco Global Asset Management (N.A.), Inc., Invesco Senior Secured Management, Inc. (registered investment adviser), Van Kampen Investor Services Inc., PowerShares Exchange-Traded Fund Trust, PowerShares Exchange-Traded Fund Trust II, PowerShares India Exchange-Traded Fund Trust and PowerShares Actively Managed Exchange-Traded Fund Trust; and Vice President, Invesco Aim Capital Management, Inc. and Fund Management Company | N/A | N/A |
The Statement of Additional Information of the Trust includes additional information about the Fund’s Trustees and is available upon request, without charge, by calling 1.800.959.4246. Please refer to the Fund’s prospectus for information on the Fund’s sub-advisers.
Office of the Fund 11 Greenway Plaza, Suite 1000 Houston, TX 77046-1173 | Investment Adviser Invesco Advisers, Inc. 1555 Peachtree Street, N.E. Atlanta, GA 30309 | Distributor Invesco Distributors, Inc. 11 Greenway Plaza, Suite 1000 Houston, TX 77046-1173 | Auditors PricewaterhouseCoopers LLP 1201 Louisiana Street, Suite 2900 Houston, TX 77002-5678 | |||
Counsel to the Fund Stradley Ronon Stevens & Young, LLP 2005 Market Street, Suite 2600 Philadelphia, PA 19103-7018 | Counsel to the Independent Trustees Goodwin Procter LLP 901 New York Avenue, N.W. Washington, D.C. 20001 | Transfer Agent Invesco Investment Services, Inc. 11 Greenway Plaza, Suite 1000 Houston, TX 77046-1173 | Custodian State Street Bank and Trust Company 225 Franklin Street Boston, MA 02110-2801 | |||
T-4 Invesco Strategic Real Return Fund

Invesco mailing information
Send general correspondence to Invesco Investment Services, Inc., P.O. Box 219078, Kansas City, MO 64121-9078.
Important notice regarding delivery of security holder documents
To reduce Fund expenses, only one copy of most shareholder documents may be mailed to shareholders with multiple accounts at the same address (Householding). Mailing of your shareholder documents may be householded indefinitely unless you instruct us otherwise. If you do not want the mailing of these documents to be combined with those for other members of your household, please contact Invesco Investment Services, Inc. at 800 959 4246 or contact your financial institution. We will begin sending you individual copies for each account within 30 days after receiving your request.
Fund holdings and proxy voting information
The Fund provides a complete list of its holdings four times in each fiscal year, at the quarter ends. For the second and fourth quarters, the lists appear in the Fund’s semiannual and annual reports to shareholders. For the first and third quarters, the Fund files the lists with the Securities and Exchange Commission (SEC) on Form N-Q. The most recent list of portfolio holdings is available at invesco.com/completeqtrholdings. Shareholders can also look up the Fund’s Forms N-Q on the SEC website at sec.gov. Copies of the Fund’s Forms N-Q may be reviewed and copied at the SEC Public Reference Room in Washington, D.C. You can obtain information on the operation of the Public Reference Room, including information about duplicating fee charges, by calling 202 551 8090 or 800 732 0330, or by electronic request at the following email address: publicinfo@sec.gov. The SEC file numbers for the Fund are shown below.
A description of the policies and procedures that the Fund uses to determine how to vote proxies relating to portfolio securities is available without charge, upon request, from our Client Services department at 800 959 4246 or at invesco.com/proxyguidelines. The information is also available on the SEC website, sec.gov.
Information regarding how the Fund voted proxies related to its portfolio securities during the most recent 12-month period ended June 30 is available at invesco.com/proxysearch. The information is also available on the SEC website, sec.gov. |  | |
Invesco Advisers, Inc. is an investment adviser; it provides investment advisory services to individual and institutional clients and does not sell securities. Invesco Distributors, Inc. is the US distributor for Invesco Ltd.’s retail mutual funds, exchange-traded funds and institutional money market funds. Both are wholly owned, indirect subsidiaries of Invesco Ltd. |
| SEC file numbers: 811-09913 and 333-36074 | SRR-AR-1 | Invesco Distributors, Inc. |
| ITEM 2. | CODE OF ETHICS. |
There were no amendments to the Code of Ethics (the “Code”) that applies to the Registrant’s Principal Executive Officer (“PEO”) and Principal Financial Officer (“PFO”) during the period covered by the report. The Registrant did not grant any waivers, including implicit waivers, from any provisions of the Code to the PEO or PFO during the period covered by this report.
| ITEM 3. | AUDIT COMMITTEE FINANCIAL EXPERT. |
The Board of Trustees has determined that the Registrant has at least one audit committee financial expert serving on its Audit Committee. The Audit Committee financial expert is Raymond Stickel, Jr. Mr. Stickel is “independent” within the meaning of that term as used in Form N-CSR.
| ITEM 4. | PRINCIPAL ACCOUNTANT FEES AND SERVICES. |
| Item 4. | Principal Accountant Fees and Services |
(a) to (d)
Fees Billed by PWC Related to the Registrant
PWC billed the Registrant aggregate fees for services rendered to the Registrant for the last two fiscal years as follows:
| Fees Billed for Services Rendered to the Registrant for fiscal year end 2014 | (e)(2) Percentage of Fees Billed Applicable to Non-Audit Services Provided for fiscal year end 2014 Pursuant to Waiver of Pre-Approval Requirement(1) | Fees Billed for Services Rendered to the Registrant for fiscal year end 2013 | (e)(2) Percentage of Fees Billed Applicable to Non-Audit Services Provided for fiscal year end 2013 Pursuant to Waiver of Pre-Approval Requirement(1) | |||||||||||||
Audit Fees | $ | 374,875 | N/A | $ | 470,602 | N/A | ||||||||||
Audit-Related Fees(2) | $ | 6,500 | 0 | % | $ | 0 | 0 | % | ||||||||
Tax Fees(3) | $ | 177,710 | 0 | % | $ | 124,450 | 0 | % | ||||||||
All Other Fees | $ | 0 | 0 | % | $ | 0 | 0 | % | ||||||||
|
|
|
| |||||||||||||
Total Fees | $ | 559,085 | 0 | % | $ | 595,052 | 0 | % | ||||||||
(g) PWC billed the Registrant aggregate non-audit fees of $184,210 for the fiscal year ended 2014, and $124,450 for the fiscal year ended 2013, for non-audit services rendered to the Registrant.
| (1) | With respect to the provision of non-audit services, the pre-approval requirement is waived pursuant to a de minimis exception if (i) such services were not recognized as non-audit services by the Registrant at the time of engagement, (ii) the aggregate amount of all such services provided is no more than 5% of the aggregate audit and non-audit fees paid by the Registrant to PWC during a fiscal year; and (iii) such services are promptly brought to the attention of the Registrant’s Audit Committee and approved by the Registrant’s Audit Committee prior to the completion of the audit. |
| (2) | Audit-related fees for the fiscal year end 2014 include fees billed for agreed upon procedures related to fund mergers. |
| (3) | Tax fees for the fiscal year end 2014 include fees billed for reviewing tax returns, consultation services and fund mergers. Tax fees for the fiscal year end 2013 includes fees billed for reviewing tax returns and fund mergers. |
Fees Billed by PWC Related to Invesco and Invesco Affiliates
PWC billed Invesco Advisers, Inc. (“Invesco”), the Registrant’s adviser, and any entity controlling, controlled by or under common control with Invesco that provides ongoing services to the Registrant (“Invesco Affiliates”) aggregate fees for pre-approved non-audit services rendered to Invesco and Invesco Affiliates for the last two fiscal years as follows:
| Fees Billed for Non- Audit Services Rendered to Invesco and Invesco Affiliates for fiscal year end 2014 That Were Required to be Pre-Approved by the Registrant’s Audit Committee | (e)(2) Percentage of Fees Billed Applicable to Non-Audit Services Provided for fiscal year end 2014 Pursuant to Waiver of Pre- Approval Requirement(1) | Fees Billed for Non- Audit Services Rendered to Invesco and Invesco Affiliates for fiscal year end 2013 That Were Required to be Pre-Approved by the Registrant’s Audit Committee | (e)(2) Percentage of Fees Billed Applicable to Non-Audit Services Provided for fiscal year end 2013 Pursuant to Waiver of Pre- Approval Requirement(1) | |||||||||||||
Audit-Related Fees | $ | 574,000 | 0 | % | $ | 0 | 0 | % | ||||||||
Tax Fees | $ | 0 | 0 | % | $ | 0 | 0 | % | ||||||||
All Other Fees | $ | 0 | 0 | % | $ | 0 | 0 | % | ||||||||
|
|
|
| |||||||||||||
Total Fees(2) | $ | 574,000 | 0 | % | $ | 0 | 0 | % | ||||||||
| (1) | With respect to the provision of non-audit services, the pre-approval requirement is waived pursuant to a de minimis exception if (i) such services were not recognized as non-audit services by the Registrant at the time of engagement, (ii) the aggregate amount of all such services provided is no more than 5% of the aggregate audit and non-audit fees paid by the Registrant, Invesco and Invesco Affiliates to PWC during a fiscal year; and (iii) such services are promptly brought to the attention of the Registrant’s Audit Committee and approved by the Registrant’s Audit Committee prior to the completion of the audit. |
| (2) | Audit-Related fees for the year end 2014 include fees billed related to reviewing controls at a service organization. |
(g) Including the fees for services not required to be pre-approved by the registrant’s audit committee, PWC billed Invesco and Invesco Affiliates aggregate non-audit fees of $2,684,926 for the fiscal year ended 2014, and $7,055 for the fiscal year ended 2013, for non-audit services rendered to Invesco and Invesco Affiliates.
(h) The Audit Committee also has considered whether the provision of non-audit services that were rendered to Invesco and Invesco Affiliates that were not required to be pre-approved pursuant to SEC regulations, if any, is compatible with maintaining PWC’s independence. To the extent that such services were provided, the Audit Committee determined that the provision of such services is compatible with PWC maintaining independence with respect to the Registrant.
(f) Not applicable.
(e)(1)
PRE-APPROVAL OF AUDIT AND NON-AUDIT SERVICES
POLICIES AND PROCEDURES
As adopted by the Audit Committees of
the Invesco Funds (the “Funds”)
Last Amended May 4, 2010
Statement of Principles
Under the Sarbanes-Oxley Act of 2002 and rules adopted by the Securities and Exchange Commission (“SEC”) (“Rules”), the Audit Committees of the Funds’ (the “Audit Committees”) Board of Trustees (the “Board”) are responsible for the appointment, compensation and oversight of the work of independent accountants (an “Auditor”). As part of this responsibility and to assure that the Auditor’s independence is not impaired, the Audit Committees pre-approve the audit and non-audit services provided to the Funds by each Auditor, as well as all non-audit services provided by the Auditor to the Funds’ investment adviser and to affiliates of the adviser that provide ongoing services to the Funds (“Service Affiliates”) if the services directly impact the Funds’ operations or financial reporting. The SEC Rules also specify the types of services that an Auditor may not provide to its audit client. The following policies and procedures comply with the requirements for pre-approval and provide a mechanism by which management of the Funds may request and secure pre-approval of audit and non-audit services in an orderly manner with minimal disruption to normal business operations.
Proposed services either may be pre-approved without consideration of specific case-by-case services by the Audit Committees (“general pre-approval”) or require the specific pre-approval of the Audit Committees (“specific pre-approval”). As set forth in these policies and procedures, unless a type of service has received general pre-approval, it will require specific pre-approval by the Audit Committees. Additionally, any fees exceeding 110% of estimated pre-approved fee levels provided at the time the service was pre-approved will also require specific approval by the Audit Committees before payment is made. The Audit Committees will also consider the impact of additional fees on the Auditor’s independence when determining whether to approve any additional fees for previously pre-approved services.
The Audit Committees will annually review and generally pre-approve the services that may be provided by each Auditor without obtaining specific pre-approval from the Audit Committee generally on an annual basis. The term of any general pre-approval runs from the date of such pre-approval through September 30th of the following year, unless the Audit Committees consider a different period and state otherwise. The Audit Committees will add to or subtract from the list of general pre-approved services from time to time, based on subsequent determinations.
The purpose of these policies and procedures is to set forth the guidelines to assist the Audit Committees in fulfilling their responsibilities.
Delegation
The Audit Committees may from time to time delegate pre-approval authority to one or more of its members who are Independent Trustees. All decisions to pre-approve a service by a delegated member shall be reported to the Audit Committees at the next quarterly meeting.
Audit Services
The annual audit services engagement terms will be subject to specific pre-approval of the Audit Committees. Audit services include the annual financial statement audit and other procedures such as tax provision work that is required to be performed by the independent auditor to be able to form an opinion on the Funds’ financial statements. The Audit Committees will obtain, review and consider sufficient information concerning the proposed Auditor to make a reasonable evaluation of the Auditor’s qualifications and independence.
In addition to the annual Audit services engagement, the Audit Committees may grant either general or specific pre-approval of other audit services, which are those services that only the independent auditor reasonably can provide. Other Audit services may include services such as issuing consents for the
inclusion of audited financial statements with SEC registration statements, periodic reports and other documents filed with the SEC or other documents issued in connection with securities offerings.
Non-Audit Services
The Audit Committees may provide either general or specific pre-approval of any non-audit services to the Funds and its Service Affiliates if the Audit Committees believe that the provision of the service will not impair the independence of the Auditor, is consistent with the SEC’s Rules on auditor independence, and otherwise conforms to the Audit Committees’ general principles and policies as set forth herein.
Audit-Related Services
“Audit-related services” are assurance and related services that are reasonably related to the performance of the audit or review of the Fund’s financial statements or that are traditionally performed by the independent auditor. Audit-related services include, among others, accounting consultations related to accounting, financial reporting or disclosure matters not classified as “Audit services”; assistance with understanding and implementing new accounting and financial reporting guidance from rulemaking authorities; and agreed-upon procedures related to mergers, compliance with ratings agency requirements and interfund lending activities.
Tax Services
“Tax services” include, but are not limited to, the review and signing of the Funds’ federal tax returns, the review of required distributions by the Funds and consultations regarding tax matters such as the tax treatment of new investments or the impact of new regulations. The Audit Committees will scrutinize carefully the retention of the Auditor in connection with a transaction initially recommended by the Auditor, the major business purpose of which may be tax avoidance or the tax treatment of which may not be supported in the Internal Revenue Code and related regulations. The Audit Committees will consult with the Funds’ Treasurer (or his or her designee) and may consult with outside counsel or advisors as necessary to ensure the consistency of Tax services rendered by the Auditor with the foregoing policy.
No Auditor shall represent any Fund or any Service Affiliate before a tax court, district court or federal court of claims.
Under rules adopted by the Public Company Accounting Oversight Board and approved by the SEC, in connection with seeking Audit Committees’ pre-approval of permissible Tax services, the Auditor shall:
| 1. | Describe in writing to the Audit Committees, which writing may be in the form of the proposed engagement letter: |
| a. | The scope of the service, the fee structure for the engagement, and any side letter or amendment to the engagement letter, or any other agreement between the Auditor and the Fund, relating to the service; and |
| b. | Any compensation arrangement or other agreement, such as a referral agreement, a referral fee or fee-sharing arrangement, between the Auditor and any person (other than the Fund) with respect to the promoting, marketing, or recommending of a transaction covered by the service; |
| 2. | Discuss with the Audit Committees the potential effects of the services on the independence of the Auditor; and |
| 3. | Document the substance of its discussion with the Audit Committees. |
All Other Auditor Services
The Audit Committees may pre-approve non-audit services classified as “All other services” that are not categorically prohibited by the SEC, as listed in Exhibit 1 to this policy.
Pre-Approval Fee Levels or Established Amounts
Pre-approval of estimated fees or established amounts for services to be provided by the Auditor under general or specific pre-approval policies will be set periodically by the Audit Committees. Any proposed
fees exceeding 110% of the maximum estimated pre-approved fees or established amounts for pre-approved audit and non-audit services will be reported to the Audit Committees at the quarterly Audit Committees meeting and will require specific approval by the Audit Committees before payment is made. The Audit Committees will always factor in the overall relationship of fees for audit and non-audit services in determining whether to pre-approve any such services and in determining whether to approve any additional fees exceeding 110% of the maximum pre-approved fees or established amounts for previously pre-approved services.
Procedures
Generally on an annual basis, Invesco Advisers, Inc. (“Invesco”) will submit to the Audit Committees for general pre-approval, a list of non-audit services that the Funds or Service Affiliates of the Funds may request from the Auditor. The list will describe the non-audit services in reasonable detail and will include an estimated range of fees and such other information as the Audit Committee may request.
Each request for services to be provided by the Auditor under the general pre-approval of the Audit Committees will be submitted to the Funds’ Treasurer (or his or her designee) and must include a detailed description of the services to be rendered. The Treasurer or his or her designee will ensure that such services are included within the list of services that have received the general pre-approval of the Audit Committees. The Audit Committees will be informed at the next quarterly scheduled Audit Committees meeting of any such services for which the Auditor rendered an invoice and whether such services and fees had been pre-approved and if so, by what means.
Each request to provide services that require specific approval by the Audit Committees shall be submitted to the Audit Committees jointly by the Fund’s Treasurer or his or her designee and the Auditor, and must include a joint statement that, in their view, such request is consistent with the policies and procedures and the SEC Rules.
Each request to provide tax services under either the general or specific pre-approval of the Audit Committees will describe in writing: (i) the scope of the service, the fee structure for the engagement, and any side letter or amendment to the engagement letter, or any other agreement between the Auditor and the audit client, relating to the service; and (ii) any compensation arrangement or other agreement between the Auditor and any person (other than the audit client) with respect to the promoting, marketing, or recommending of a transaction covered by the service. The Auditor will discuss with the Audit Committees the potential effects of the services on the Auditor’s independence and will document the substance of the discussion.
Non-audit services pursuant to the de minimis exception provided by the SEC Rules will be promptly brought to the attention of the Audit Committees for approval, including documentation that each of the conditions for this exception, as set forth in the SEC Rules, has been satisfied.
On at least an annual basis, the Auditor will prepare a summary of all the services provided to any entity in the investment company complex as defined in section 2-01(f)(14) of Regulation S-X in sufficient detail as to the nature of the engagement and the fees associated with those services.
The Audit Committees have designated the Funds’ Treasurer to monitor the performance of all services provided by the Auditor and to ensure such services are in compliance with these policies and procedures. The Funds’ Treasurer will report to the Audit Committees on a periodic basis as to the results of such monitoring. Both the Funds’ Treasurer and management of Invesco will immediately report to the chairman of the Audit Committees any breach of these policies and procedures that comes to the attention of the Funds’ Treasurer or senior management of Invesco.
Exhibit 1 to Pre-Approval of Audit and Non-Audit Services Policies and Procedures
Conditionally Prohibited Non-Audit Services (not prohibited if the Fund can reasonably conclude that the results of the service would not be subject to audit procedures in connection with the audit of the Fund’s financial statements)
| • | Bookkeeping or other services related to the accounting records or financial statements of the audit client |
| • | Financial information systems design and implementation |
| • | Appraisal or valuation services, fairness opinions, or contribution-in-kind reports |
| • | Actuarial services |
| • | Internal audit outsourcing services |
Categorically Prohibited Non-Audit Services
| • | Management functions |
| • | Human resources |
| • | Broker-dealer, investment adviser, or investment banking services |
| • | Legal services |
| • | Expert services unrelated to the audit |
| • | Any service or product provided for a contingent fee or a commission |
| • | Services related to marketing, planning, or opining in favor of the tax treatment of confidential transactions or aggressive tax position transactions, a significant purpose of which is tax avoidance |
| • | Tax services for persons in financial reporting oversight roles at the Fund |
| • | Any other service that the Public Company Oversight Board determines by regulation is impermissible. |
| ITEM 5. | AUDIT COMMITTEE OF LISTED REGISTRANTS. |
Not applicable.
| ITEM 6. | SCHEDULE OF INVESTMENTS. |
Investments in securities of unaffiliated issuers is included as part of the reports to stockholders filed under Item 1 of this Form.
| ITEM 7. | DISCLOSURE OF PROXY VOTING POLICIES AND PROCEDURES FOR CLOSED-END MANAGEMENT INVESTMENT COMPANIES. |
Not applicable.
| ITEM 8. | PORTFOLIO MANAGERS OF CLOSED-END MANAGEMENT COMPANIES. |
Not applicable.
| ITEM 9. | PURCHASES OF EQUITY SECURITIES BY CLOSED-END MANAGEMENT INVESTMENT COMPANY AND AFFILIATED PURCHASERS. |
Not applicable.
| ITEM 10. | SUBMISSION OF MATTERS TO A VOTE OF SECURITY HOLDERS. |
None
| ITEM 11. | CONTROLS AND PROCEDURES. |
| (a) | As of August 20, 2014, an evaluation was performed under the supervision and with the participation of the officers of the Registrant, including the PEO and PFO, to assess the effectiveness of the Registrant’s disclosure controls and procedures, as that term is defined in Rule 30a-3(c) under the Investment Company Act of 1940 (the “Act”), as amended. Based on that evaluation, the Registrant’s officers, including the PEO and PFO, concluded that, as of August 20, 2014, the Registrant’s disclosure controls and procedures were reasonably designed to ensure: (1) that information required to be disclosed by the Registrant on Form N-CSR is recorded, processed, summarized and reported within the time periods specified by the rules and forms of the Securities and Exchange Commission; and (2) that material information relating to the Registrant is made known to the PEO and PFO as appropriate to allow timely decisions regarding required disclosure. |
| (b) | There have been no changes in the Registrant’s internal control over financial reporting (as defined in Rule 30a-3(d) under the Act) that occurred during the second fiscal quarter of the period covered by this report that have materially affected, or are reasonably likely to materially affect, the Registrant’s internal control over financial reporting. |
| ITEM 12. | EXHIBITS. |
12(a) (1) | Code of Ethics. | |
12(a) (2) | Certifications of principal executive officer and principal financial officer as required by Rule 30a-2(a) under the Investment Company Act of 1940. | |
12(a) (3) | Not applicable. | |
12(b) | Certifications of principal executive officer and principal financial officer as required by Rule 30a-2(b) under the Investment Company Act of 1940. | |
SIGNATURES
Pursuant to the requirements of the Securities Exchange Act of 1934 and the Investment Company Act of 1940, the Registrant has duly caused this report to be signed on its behalf by the undersigned, thereunto duly authorized.
Registrant: AIM Counselor Series Trust (Invesco Counselor Series Trust)
| By: | /s/ Philip A. Taylor | |
| Philip A. Taylor | ||
| Principal Executive Officer | ||
| Date: | November 7, 2014 | |
Pursuant to the requirements of the Securities and Exchange Act of 1934 and the Investment Company Act of 1940, this report has been signed below by the following persons on behalf of the Registrant and in the capacities and on the dates indicated.
| By: | /s/ Philip A. Taylor | |
| Philip A. Taylor | ||
| Principal Executive Officer | ||
| Date: | November 7, 2014 | |
| By: | /s/ Sheri Morris | |
| Sheri Morris | ||
| Principal Financial Officer | ||
| Date: | November 7, 2014 | |
EXHIBIT INDEX
| 12(a) (1) | Code of Ethics. | |
| 12(a) (2) | Certifications of principal executive officer and principal financial officer as required by Rule 30a-2(a) under the Investment Company Act of 1940. | |
| 12(a) (3) | Not applicable. | |
| 12(b) | Certifications of principal executive officer and principal financial officer as required by Rule 30a-2(b) under the Investment Company Act of 1940. | |