UNITED STATES
SECURITIES AND EXCHANGE COMMISSION
Washington, D.C. 20549
FORMN-CSR
CERTIFIED SHAREHOLDER REPORT OF REGISTERED
MANAGEMENT INVESTMENT COMPANIES
Investment Company Act file number811-09913
AIM Counselor Series Trust (Invesco Counselor Series Trust)
(Exact name of registrant as specified in charter)
11 Greenway Plaza, Suite 1000 Houston, Texas 77046
(Address of principal executive offices) (Zip code)
Sheri Morris 11 Greenway Plaza, Suite 1000 Houston, Texas 77046
(Name and address of agent for service)
Registrant’s telephone number, including area code: (713)626-1919
Date of fiscal year end: August 31
Date of reporting period: 08/31/19
| Item 1. | Reports to Stockholders. |

Shareholder Report
Annual Report 8/31/2019
Annual Report 7/31/2019
Invesco
Oppenheimer
Senior Floating Rate
Fund*
Beginning on January 1, 2021, as permitted by regulations adopted by the Securities and Exchange Commission, paper copies of the Fund’s shareholder reports will no longer be sent by mail, unless you specifically request paper copies of the reports from the Fund or from your financial intermediary, such as a broker-dealer or bank. Instead, the reports will be made available on the Fund’s website, and you will be notified by mail each time a report is posted and provided with a website link to access the report.
If you already elected to receive shareholder reports electronically, you will not be affected by this change and you need not take any action. You may elect to receive shareholder reports and other communications from the Fund electronically by contacting your financial intermediary (such as a broker-dealer or bank) or, if you are a direct investor, by enrolling at invesco. com/edelivery.
You may elect to receive all future reports in paper free of charge. If you invest through a financial intermediary, you can contact your financial intermediary to request that you continue to receive paper copies of your shareholder reports. If you invest directly with the Fund, you can call 800 959 4246 to let the Fund know you wish to continue receiving paper copies of your shareholder reports. Your election to receive reports in paper will apply to all funds held with your financial intermediary or all funds held with the fund complex if you invest directly with the Fund.
*Prior to the close of business on May 24, 2019, the Fund’s name was Oppenheimer Senior Floating Rate Fund. See Important Update on the following page for more information.
Important Update
On October 18, 2018, Massachusetts Mutual Life Insurance Company, an indirect corporate parent of OppenheimerFunds, Inc. and its subsidiaries OFI Global Asset Management, Inc., OFI SteelPath, Inc. and OFI Advisors, LLC, announced that it had entered into an agreement whereby Invesco Ltd., a global investment management company would acquire OppenheimerFunds and its subsidiaries (together, “OppenheimerFunds”). After the close of business on May 24, 2019 Invesco Ltd. completed the acquisition of OppenheimerFunds. This Fund was included in that acquisition and as of that date, became part of the Invesco family of funds. Please visit invesco.com for more information or call Invesco’s Client Services team at 800-959-4246.
Class A Shares
AVERAGE ANNUAL TOTAL RETURNS AT 8/31/19
Class A Shares of the Fund | ||||||
| Without Sales Charge | With Sales Charge | J.P. Morgan Leveraged Loan Index | ||||
| 1-Year | -1.08% | -4.26% | 3.61% | |||
| 5-Year | 2.79 | 2.12 | 4.20 | |||
| 10-Year | 5.44 | 5.09 | 5.78 | |||
AVERAGE ANNUAL TOTAL RETURNS AT 7/31/19
Class A Shares of the Fund | ||||||
| Without Sales Charge | With Sales Charge | J.P. Morgan Leveraged Loan Index | ||||
| 1-Year | 0.58% | -2.65% | 4.34% | |||
| 5-Year | 3.05 | 2.38 | 4.29 | |||
| 10-Year | 5.84 | 5.49 | 6.02 | |||
3 INVESCO OPPENHEIMER SENIOR FLOATING RATE FUND
Performance quoted is past performance and cannot guarantee comparable future results; current performance may be lower or higher. Visit invesco.com for the most recent month-end performance. Performance figures reflect reinvested distributions and changes in net asset value (NAV). Investment return and principal value will vary so that you may have a gain or a loss when you sell shares. Fund returns include changes in share price, reinvested distributions and a 3.25% maximum applicable sales charge except where “without sales charge” is indicated. As the result of a reorganization after the close of business on May 24, 2019, the returns of the fund for periods on or prior to May 24, 2019 reflect performance of the Oppenheimer predecessor fund. Share class returns will differ from those of the predecessor fund as they have different expenses. Returns for periods of less than one year are not annualized. Returns do not consider capital gains or income taxes on an individual’s investment. See Fund prospectus and summary prospectus for more information on share classes and sales charges. Fund literature is available at invesco.com.
4 INVESCO OPPENHEIMER SENIOR FLOATING RATE FUND
For the one-year period ended July 31, 2019, the Fund’s Class A shares (without sales charge) returned 0.58%, underperforming the J.P. Morgan Leveraged Loan Index (the “Index”), which returned 4.34%. For the one-year period ended August 31, 2019, the Fund’s Class A shares (without sales charge) returned -1.08%, underperforming the Index, which returned 3.61%. Please note that the fiscal year-end for Invesco Oppenheimer Senior Floating Rate Fund has changed from July 31 to August 31. Therefore, the period covered by this discussion is from July 31, 2018, the date of the last annual report, through August 31, 2019, the Fund’s new fiscal year-end.
MARKET OVERVIEW
During the twelve-month period ending July 31, 2019 the markets saw increased volatility as growing trade tensions with China, a slowing global economy and a reversal in Fed policy from a tightening stance to one of easing heightened investor uncertainty. At the end of that time period the Federal
Reserve cut interest rates 25 basis points, and the yield of the UST 10 year Note dropped 122 basis points from a high of 3.23% in November 2018 to 2.01%. Commodity prices also experienced increased volatility with Oil and Natural Gas trading down 14% and 20% respectively.
COMPARISON OF CHANGE IN VALUE OF $10,000 HYPOTHETICAL INVESTMENTS AT AUGUST 31, 2019 IN:

5 INVESCO OPPENHEIMER SENIOR FLOATING RATE FUND
COMPARISON OF CHANGE IN VALUE OF $10,000 HYPOTHETICAL INVESTMENTS AT JULY 31, 2019 IN:

The J.P. Morgan Leveraged Loan Index returned 4.34% for the period and continued to demonstrate less sensitivity to the increased volatility across equity and commodity markets and a declining interest rate environment. In comparison, high yield, as represented by the J.P. Morgan Domestic High Yield Index, returned 6.42% as dissipated fears of rising rates spurred renewed investor appetite for the asset class.
FUND REVIEW
The primary detractors from relative performance for the period ended July 31, 2019 were security selection in the Diversified Media and Metals & Mining sectors. The loans of a Company in the Diversified Media sector experienced significant pressure as the issuer’s equity sponsor unexpectedly ceased the funding it had been providing to Company. The secured creditors have organized an Ad-Hoc committee and are working towards restructuring the Company’s
balance sheet to maximize recoveries on the loans. In the Metals and Mining sector the securities of two coal producers experienced pressure as the Coal industry has been out of favor and commodity prices have declined. We are constructive on each of these Companies, as our valuations exceed currently depressed trading levels.
During the period ended July 31, 2109, the Fund experienced its strongest outperformance versus the Index from security selection in the Gaming sector, as it was announced that one of our Gaming Companies was being acquired at a premium, which resulted in substantial price appreciation. Another strong driver of performance relative to the Index was from security selection and sector allocation the Cable and Satellite sector.
6 INVESCO OPPENHEIMER SENIOR FLOATING RATE FUND
STRATEGY & OUTLOOK
At the period ended July 31, 2019, relative to the Index, the Fund had modest overweights in the Broadcasting, Metals and Mining, and Telecommunications sectors and modest underweights in the Technology, Healthcare, and Retail sectors. As a result of the elevated volatility in the markets, the team identified attractive opportunities in some lower single B rated loans, as they experienced more price pressure than larger double B rated loans.
At period ended July 31, 2019, the overall credit quality of the loan market is also solid with defaults of approximately 1.5%. While
select sectors, such as Healthcare and Retail, are experiencing challenges specific to their industries, we believe credit fundamentals can continue to remain solid.
For the one month period ending 8/31/2019 the fund had a negative gross return of -1.31% compared to the Benchmark return of -0.22%, generating a negative excess return of -1.09%. The main drivers of positive attribution came from security selection in the Technology and Automotive sectors. The main detractors from attribution came from security selection in the Metals & Mining and Diversified Media sectors.
7 INVESCO OPPENHEIMER SENIOR FLOATING RATE FUND
TOP FIVE DEBT HOLDINGS – 8/31/19
| Avaya, Inc., Sr. Sec. Credit Facilities 1st Lien Exit Term Loan, Tranche B, 6.43%-6.445%, [LIBOR6+425], 12/15/24 | 1.7 | % | ||
| CenturyLink, Inc., Sr. Sec. Credit Facilities 1st Lien Term Loan, Tranche B, 4.862% [LIBOR4+275], 1/31/25 | 1.4 | |||
| Murray Energy Corp., Sr. Sec. Credit Facilities 1st Lien Term Loan, Tranche B2, 9.362% [LIBOR4+725], 10/17/22 | 1.4 | |||
| Tesla, Inc., 5.30% Sr. Unsec. Nts., 8/15/25 | 1.4 | |||
| Caesars Growth Properties Holdings LLC, Sr. Sec. Credit Facilities 1st Lien Term Loan, 4.862% [LIBOR4+275], 12/23/24 | 1.3 |
Portfolio holdings and allocations are subject to change. Percentages are as of August 31, 2019, and are based on net assets.
TOP FIVE DEBT HOLDINGS – 7/31/19
Avaya, Inc., Sr. Sec. Credit Facilities 1st Lien Exit Term Loan, Tranche B, 6.575%, [LIBOR12+425], 12/15/24 | 1.6 | % | ||
| Murray Energy Corp., Sr. Sec. Credit Facilities 1st Lien Term Loan, Tranche B2, 9.772% [LIBOR4+725], 10/17/22 | 1.5 | |||
| CenturyLink, Inc., Sr. Sec. Credit Facilities 1st Lien Term Loan, Tranche B, 5.152% [LIBOR4+275], 1/31/25 | 1.4 | |||
| Caesars Growth Properties Holdings LLC, Sr. Sec. Credit Facilities 1st Lien Term Loan, 5.152% [LIBOR4+275], 12/23/24 | 1.3 | |||
| Tesla, Inc., 5.30% Sr. Unsec. Nts., 8/15/25 | 1.2 |
Portfolio holdings and allocations are subject to change. Percentages are as of July 31, 2019, and are based on net assets.
8 INVESCO OPPENHEIMER SENIOR FLOATING RATE FUND
CREDIT RATING BREAKDOWN 8/31/19 | NRSRO ONLY TOTAL | ||||
| BBB | 1.8% | ||||
| BB | 31.0 | ||||
| B | 50.4 | ||||
| CCC | 4.6 | ||||
| CC | 0.1 | ||||
| D | 0.0* | ||||
| Unrated | 12.1 | ||||
| * | Less than 0.05%. |
The percentages above are based on the market value of the Fund’s securities as of August 31, 2019, and are subject to change. Except for securities labeled “Unrated,” all securities have been rated by at least one Nationally Recognized Statistical Rating Organization (“NRSRO”), such as S&P Global Ratings (“S&P”). For securities rated only by an NRSRO other than S&P, Invesco Advisers, Inc. (the “Adviser”) converts that rating to the equivalent S&P rating. If two or more NRSROs have assigned a rating to a security, the highest S&P equivalent rating is used. For securities not rated by an NRSRO, the Adviser uses its own credit analysis to assign ratings in categories similar to those of S&P. The use of similar categories is not an indication that the Adviser’s credit analysis process is consistent or comparable with any NRSRO’s process were that NRSRO to rate the same security. Fund assets invested in Invesco Oppenheimer Institutional Government Money Market Fund are assigned that fund’s S&P rating, which is currently AAA. For the purposes of this table, “investment-grade” securities are securities rated within the NRSROs’ four highest rating categories (AAA, AA, A and BBB). Unrated securities do not necessarily indicate low credit quality, and may or may not be the equivalent of investment-grade. Please consult the Fund’s prospectus and Statement of Additional Information for further information.
CREDIT RATING BREAKDOWN 7/31/19 | NRSRO ONLY TOTAL | ||||
| BBB | 1.8% | ||||
| BB | 30.7 | ||||
| B | 49.7 | ||||
| CCC | 4.3 | ||||
| CC | 0.3 | ||||
| C | 0.0* | ||||
| Unrated | 13.2 | ||||
| * | Less than 0.05%. |
The percentages above are based on the market value of the Fund’s securities as of July 31, 2019, and are subject to change. Except for securities labeled “Unrated,” all securities have been rated by at least one Nationally Recognized Statistical Rating Organization (“NRSRO”), such as S&P Global Ratings (“S&P”). For securities rated only by an NRSRO other than S&P, Invesco Advisers, Inc. (the “Adviser”) converts that rating to the equivalent S&P rating. If two or more NRSROs have assigned a rating to a security, the highest S&P equivalent rating is used. For securities not rated by an NRSRO, the Adviser uses its own credit analysis to assign ratings in categories similar to those of S&P. The use of similar categories is not an indication that the Adviser’s credit analysis process is consistent or comparable with any NRSRO’s process were that NRSRO to rate the same security. Fund assets invested in Invesco Oppenheimer Institutional Government Money Market Fund are assigned that fund’s S&P rating, which is currently AAA. For the purposes of this table, “investment-grade” securities are securities rated within the NRSROs’ four highest rating categories (AAA, AA, A and BBB). Unrated securities do not necessarily indicate low credit quality, and may or may not be the equivalent of investment-grade. Please consult the Fund’s prospectus and Statement of Additional Information for further information.
For more current Fund holdings, please visit invesco.com.
9 INVESCO OPPENHEIMER SENIOR FLOATING RATE FUND
Share Class Performance
AVERAGE ANNUAL TOTAL RETURNS WITHOUT SALES CHARGE AS OF 8/31/19
Inception Date | 1-Year | 5-Year | 10-Year | |||||||||||||||||
| Class A (OOSAX) | 9/8/99 | -1.08 | % | 2.79 | % | 5.44 | % | |||||||||||||
| Class C (OOSCX) | 9/8/99 | -1.94 | 2.00 | 4.75 | ||||||||||||||||
| Class R (OOSNX) | 10/26/12 | -1.45 | 2.53 | 3.14 | 1 | |||||||||||||||
| Class Y (OOSYX) | 11/28/05 | -0.97 | 3.04 | 5.71 | ||||||||||||||||
| Class R5 (SFRRX)2 | 5/24/19 | -1.05 | 2.80 | 5.44 | ||||||||||||||||
| Class R6 (OOSIX)3 | 10/26/12 | -0.74 | 3.15 | 3.76 | 1 | |||||||||||||||
AVERAGE ANNUAL TOTAL RETURNS WITH SALES CHARGE AS OF 8/31/19
|
| |||||||||||||||||||
Inception Date | 1-Year | 5-Year | 10-Year | |||||||||||||||||
| Class A (OOSAX) | 9/8/99 | -4.26 | % | 2.12 | % | 5.09 | % | |||||||||||||
| Class C (OOSCX) | 9/8/99 | -2.88 | 2.00 | 4.75 | ||||||||||||||||
| Class R (OOSNX) | 10/26/12 | -1.45 | 2.53 | 3.14 | 1 | |||||||||||||||
| Class Y (OOSYX) | 11/28/05 | -0.97 | 3.04 | 5.71 | ||||||||||||||||
| Class R5 (SFRRX)2 | 5/24/19 | -1.05 | 2.80 | 5.44 | ||||||||||||||||
| Class R6 (OOSIX)3 | 10/26/12 | -0.74 | 3.15 | 3.76 | 1 | |||||||||||||||
AVERAGE ANNUAL TOTAL RETURNS WITHOUT SALES CHARGE AS OF 7/31/19
|
| |||||||||||||||||||
Inception Date | 1-Year | 5-Year | 10-Year | |||||||||||||||||
| Class A (OOSAX) | 9/8/99 | 0.58 | % | 3.05 | % | 5.84 | % | |||||||||||||
| Class C (OOSCX) | 9/8/99 | -0.17 | 2.31 | 5.16 | ||||||||||||||||
| Class R (OOSNX) | 10/26/12 | 0.20 | 2.80 | 3.40 | 1 | |||||||||||||||
| Class Y (OOSYX) | 11/28/05 | 0.82 | 3.31 | 6.11 | ||||||||||||||||
| Class R5 (SFRRX)2 | 5/24/19 | 0.58 | 3.05 | 5.84 | ||||||||||||||||
| Class R6 (OOSIX)3 | 10/26/12 | 0.93 | 3.41 | 4.02 | 1 | |||||||||||||||
AVERAGE ANNUAL TOTAL RETURNS WITH SALES CHARGE AS OF 7/31/19
|
| |||||||||||||||||||
Inception Date | 1-Year | 5-Year | 10-Year | |||||||||||||||||
| Class A (OOSAX) | 9/8/99 | -2.65 | % | 2.38 | % | 5.49 | % | |||||||||||||
| Class C (OOSCX) | 9/8/99 | -1.12 | 2.31 | 5.16 | ||||||||||||||||
| Class R (OOSNX) | 10/26/12 | 0.20 | 2.80 | 3.40 | 1 | |||||||||||||||
| Class Y (OOSYX) | 11/28/05 | 0.82 | 3.31 | 6.11 | ||||||||||||||||
| Class R5 (SFRRX)2 | 5/24/19 | 0.58 | 3.05 | 5.84 | ||||||||||||||||
| Class R6 (OOSIX)3 | 10/26/12 | 0.93 | 3.41 | 4.02 | 1 | |||||||||||||||
1. Shows performance since inception.
10 INVESCO OPPENHEIMER SENIOR FLOATING RATE FUND
2. Class R5 shares’ performance shown prior to the inception date (after the close of business on May 24, 2019) is that of the predecessor fund’s Class A shares at net asset value (NAV) and includes the 12b-1 fees applicable to Class A shares. Class A shares’ performance reflects any applicable fee waivers and/or expense reimbursements.
3. Pursuant to the closing of the transaction described in the Notes to Financial Statements, after the close of business on May 24, 2019, Class I shares were reorganized as Class R6 shares.
Performance quoted is past performance and cannot guarantee comparable future results; current performance may be lower or higher.Visit invesco.com for the most recent month-end performance. Performance figures reflect reinvested distributions and changes in net asset value (NAV). Investment return and principal value will vary so that you may have a gain or a loss when you sell shares. Performance shown at NAV does not include the applicable front-end sales charge, which would have reduced the performance. The current maximum initial sales charge for Class A shares is 3.25%, and the contingent deferred sales charge for Class C shares is 1% for the 1-year period. Class R, Class Y, Class R5 and Class R6 shares have no sales charge; therefore, performance is at NAV. Effective after the close of business on May 24, 2019, Class A, Class C, Class R, Class Y, and Class I shares of the predecessor fund were reorganized into Class A, Class C, Class R, Class Y, and Class R6 shares, respectively, of the Fund. Class R5 shares’ performance shown prior to the inception date is that of the predecessor fund’s Class A shares at NAV and includes the 12b-1 fees applicable to Class A shares. Class A shares’ performance reflects any applicable fee waivers and/or expense reimbursements. Returns shown for Class A, Class C, Class R, Class Y, Class R5, and Class R6 shares are blended returns of the predecessor fund and the Fund. Share class returns will differ from those of the predecessor fund because of different expenses. See Fund prospectuses and summary prospectuses for more information on share classes, sales charges and new fee agreements, if any. Fund literature is available at invesco.com.
The Fund’s performance is compared to the performance of the J.P. Morgan Leveraged Loan Index, which tracks the performance of U.S. dollar denominated senior floating rate bank loans. The index is unmanaged and cannot be purchased directly by investors. While index comparisons may be useful to provide a benchmark for the Fund’s performance, it must be noted that the Fund’s investments are not limited to the investments comprising the index. Index performance includes reinvestment of income, but does not reflect transaction costs, fees, expenses or taxes. Index performance is shown for illustrative purposes only as a benchmark for the Fund’s performance, and does not predict or depict performance of the Fund. The Fund’s performance reflects the effects of the Fund’s business and operating expenses.
The views and opinions expressed in management’s discussion of Fund performance are those of Invesco Advisers, Inc. These views and opinions are subject to change at any time based on factors such as market and economic conditions. These views and opinions may not be relied upon as investment advice or recommendations, or as an offer for a particular security. The information is not a complete analysis of every aspect of any market, country, industry, security or the Fund. Statements of fact are from sources considered reliable, but Invesco Advisers, Inc. makes no representation or warranty as to their completeness or accuracy. Although historical performance is no guarantee of future results, these insights may help you understand our investment management philosophy.
Before investing, investors should carefully read the prospectus and/or summary prospectus and carefully consider the investment objectives, risks, charges and expenses. For this and more complete information about the fund(s), investors
11 INVESCO OPPENHEIMER SENIOR FLOATING RATE FUND
should ask their advisors for a prospectus/summary prospectus or visit invesco.com/fundprospectus.
Shares of Invesco funds are not deposits or obligations of any bank, are not guaranteed by any bank, are not insured by the FDIC or any other agency, and involve investment risks, including the possible loss of the principal amount invested.
12 INVESCO OPPENHEIMER SENIOR FLOATING RATE FUND
Fund Expenses. As a shareholder of the Fund, you incur two types of costs: (1) transaction costs, which may include sales charges (loads) on purchase payments and/or contingent deferred sales charges on redemptions; and (2) ongoing costs, including management fees; distribution and service fees; and other Fund expenses. These examples are intended to help you understand your ongoing costs (in dollars) of investing in the Fund and to compare these costs with the ongoing costs of investing in other mutual funds.
The examples are based on an investment of $1,000.00 invested at the beginning of the period and held for the entire 6-month period ended August 31, 2019.
Actual Expenses. The first section of the table provides information about actual account values and actual expenses. You may use the information in this section for the class of shares you hold, together with the amount you invested, to estimate the expense that you paid over the period. Simply divide your account value by $1,000.00 (for example, an $8,600.00 account value divided by $1,000.00 = 8.60), then multiply the result by the number in the first section under the heading entitled “Expenses Paid During 6 Months Ended August 31, 2019” to estimate the expenses you paid on your account during this period.
Hypothetical Example for Comparison Purposes.The second section of the table provides information about hypothetical account values and hypothetical expenses based on the Fund’s actual expense ratio for each class of shares, and an assumed rate of return of 5% per year for each class before expenses, which is not the Fund’s actual return. The hypothetical account values and expenses may not be used to estimate the actual ending account balance or expenses you paid for the period. You may use this information to compare the ongoing costs of investing in the Fund and other funds. To do so, compare this 5% hypothetical example for the class of shares you hold with the 5% hypothetical examples that appear in the shareholder reports of the other funds.
Please note that the expenses shown in the table are meant to highlight your ongoing costs only and do not reflect any transactional costs, such as front-end or contingent deferred sales charges (loads). Therefore, the “hypothetical” section of the table is useful in comparing ongoing costs only, and will not help you determine the relative total costs of owning different funds. In addition, if these transactional costs were included, your costs would have been higher.
13 INVESCO OPPENHEIMER SENIOR FLOATING RATE FUND
| Actual | Beginning Account Value March 1, 2019 | Ending Account Value August 31, 2019 | Expenses Paid During 6 Months Ended | |||||||||
| Class A | $ | 1,000.00 | $ | 986.50 | $ | 5.57 | ||||||
| Class C | 1,000.00 | 981.50 | 9.33 | |||||||||
| Class R | 1,000.00 | 984.00 | 6.82 | |||||||||
| Class Y | 1,000.00 | 987.60 | 4.32 | |||||||||
| Class R5 | 1,000.00 | 986.80 | 2.16 | |||||||||
| Class R6 | 1,000.00 | 988.20 | 3.77 | |||||||||
| Hypothetical | ||||||||||||
| (5% return before expenses) | ||||||||||||
| Class A | 1,000.00 | 1,019.61 | 5.67 | |||||||||
| Class C | 1,000.00 | 1,015.83 | 9.49 | |||||||||
| Class R | 1,000.00 | 1,018.35 | 6.94 | |||||||||
| Class Y | 1,000.00 | 1,020.87 | 4.39 | |||||||||
| Class R5 | 1,000.00 | 1,021.17 | 4.08 | |||||||||
| Class R6 | 1,000.00 | 1,021.42 | 3.83 | |||||||||
1. Actual expenses paid for Class A, C, R, Y, and R6 are equal to the Fund’s annualized expense ratio for that class, multiplied by the average account value over the period, multiplied by 184/365 (to reflect the one-half year period). Actual expenses paid for Class R5 are equal to the Fund’s annualized expense ratio for that class, multiplied by the average account value over the period, multiplied by 99/365 to reflect the period from after the close of business on May 24, 2019 (inception of offering) to August 31, 2019.
2.Hypothetical expenses paid for all classes are equal to the Fund’s annualized expense ratio for that class, multiplied by the average account value over the period, multiplied by 184/365 (to reflect the one-half year period).
Those annualized expense ratios, excluding indirect expenses from affiliated funds, based on the 6-month period ended August 31, 2019 for Classes A, C, R, Y and R6 and for the period from after the close of business on May 24, 2019 (inception of offering) to August 31, 2019 for Class R5 are as follows:
| Class | Expense Ratios | |||||||
| Class A | 1.11 | % | ||||||
| Class C | 1.86 | |||||||
| Class R | 1.36 | |||||||
| Class Y | 0.86 | |||||||
| Class R5 | 0.80 | |||||||
| Class R6 | 0.75 | |||||||
The expense ratios reflect voluntary and/or contractual waivers and/or reimbursements of expenses by the Fund’s Manager. Some of these undertakings may be modified or terminated at any time, as indicated in the Fund’s prospectus. The “Financial Highlights” tables in the Fund’s financial statements, included in this report, also show the gross expense ratios, without such waivers or reimbursements and reduction to custodian expenses, if applicable.
14 INVESCO OPPENHEIMER SENIOR FLOATING RATE FUND
Fund Expenses. As a shareholder of the Fund, you incur two types of costs: (1) transaction costs, which may include sales charges (loads) on purchase payments and/or contingent deferred sales charges on redemptions; and (2) ongoing costs, including management fees; distribution and service fees; and other Fund expenses. These examples are intended to help you understand your ongoing costs (in dollars) of investing in the Fund and to compare these costs with the ongoing costs of investing in other mutual funds.
The examples are based on an investment of $1,000.00 invested at the beginning of the period and held for the entire 6-month period ended July 31, 2019.
Actual Expenses. The first section of the table provides information about actual account values and actual expenses. You may use the information in this section for the class of shares you hold, together with the amount you invested, to estimate the expense that you paid over the period. Simply divide your account value by $1,000.00 (for example, an $8,600.00 account value divided by $1,000.00 = 8.60), then multiply the result by the number in the first section under the heading entitled “Expenses Paid During 6 Months Ended July 31, 2019” to estimate the expenses you paid on your account during this period.
Hypothetical Example for Comparison Purposes.The second section of the table provides information about hypothetical account values and hypothetical expenses based on the Fund’s actual expense ratio for each class of shares, and an assumed rate of return of 5% per year for each class before expenses, which is not the Fund’s actual return. The hypothetical account values and expenses may not be used to estimate the actual ending account balance or expenses you paid for the period. You may use this information to compare the ongoing costs of investing in the Fund and other funds. To do so, compare this 5% hypothetical example for the class of shares you hold with the 5% hypothetical examples that appear in the shareholder reports of the other funds.
Please note that the expenses shown in the table are meant to highlight your ongoing costs only and do not reflect any transactional costs, such as front-end or contingent deferred sales charges (loads). Therefore, the “hypothetical” section of the table is useful in comparing ongoing costs only, and will not help you determine the relative total costs of owning different funds. In addition, if these transactional costs were included, your costs would have been higher.
15 INVESCO OPPENHEIMER SENIOR FLOATING RATE FUND
| Actual | Beginning Account Value February 1, 2019 | Ending Account Value July 31, 2019 | Expenses Paid During 6 Months Ended July 31, 20191,2 | |||||||||
| Class A | $ | 1,000.00 | $ | 1,017.10 | $ | 5.52 | ||||||
| Class C | 1,000.00 | 1,013.30 | 9.28 | |||||||||
| Class R | 1,000.00 | 1,015.80 | 6.77 | |||||||||
| Class Y | 1,000.00 | 1,018.30 | 4.26 | |||||||||
| Class R5 | 1,000.00 | 1,017.10 | 1.45 | |||||||||
| Class R6 | 1,000.00 | 1,018.80 | 3.71 | |||||||||
| Hypothetical | ||||||||||||
| (5% return before expenses) | ||||||||||||
| Class A | 1,000.00 | 1,019.34 | 5.52 | |||||||||
| Class C | 1,000.00 | 1,015.62 | 9.29 | |||||||||
| Class R | 1,000.00 | 1,018.10 | 6.78 | |||||||||
| Class Y | 1,000.00 | 1,020.58 | 4.27 | |||||||||
| Class R5 | 1,000.00 | 1,020.98 | 3.87 | |||||||||
| Class R6 | 1,000.00 | 1,021.12 | 3.72 | |||||||||
1. Actual expenses paid for Class A, C, R, Y, and R6 are equal to the Fund’s annualized expense ratio for that class, multiplied by the average account value over the period, multiplied by 181/365 (to reflect the one-half year period). Actual expenses paid for Class R5 are equal to the Fund’s annualized expense ratio for that class, multiplied by the average account value over the period, multiplied by 68/365 to reflect the period from after the close of business on May 24, 2019 (inception of offering) to July 31, 2019.
2.Hypothetical expenses paid for all classes are equal to the Fund’s annualized expense ratio for that class, multiplied by the average account value over the period, multiplied by 181/365 (to reflect the one-half year period).
Those annualized expense ratios, excluding indirect expenses from affiliated funds, based on the 6-month period ended July 31, 2019 for Classes A, C, R, Y and R6 and for the period from after the close of business on May 24, 2019 (inception of offering) to July 31, 2019 for Class R5 are as follows:
| Class | Expense Ratios | |||||||
| Class A | 1.10 | % | ||||||
| Class C | 1.85 | |||||||
| Class R | 1.35 | |||||||
| Class Y | 0.85 | |||||||
| Class R5 | 0.77 | |||||||
| Class R6 | 0.74 | |||||||
The expense ratios reflect voluntary and/or contractual waivers and/or reimbursements of expenses by the Fund’s Manager. Some of these undertakings may be modified or terminated at any time, as indicated in the Fund’s prospectus. The “Financial Highlights” tables in the Fund’s financial statements, included in this report, also show the gross expense ratios, without such waivers or reimbursements and reduction to custodian expenses, if applicable.
16 INVESCO OPPENHEIMER SENIOR FLOATING RATE FUND
SCHEDULE OF INVESTMENTSAugust 31, 2019
| Principal Amount | Value | |||||||
| Corporate Loans*—88.6% | ||||||||
| Consumer Discretionary—28.9% | ||||||||
| Auto Components—0.1% | ||||||||
| Tower Automotive Holdings USA LLC, Sr. Sec. Credit Facilities 1st Lien Term Loan, Tranche B, 5.00%, [LIBOR12+275], 3/7/241 | $ | 13,250,835 | $ | 13,275,681 | ||||
| Distributors—1.3% | ||||||||
| Albertson’s LLC, Sr. Sec. Credit Facilities 1st Lien Term Loan: | ||||||||
| Tranche B7, 4.862%, [LIBOR12+275], 11/17/251 | 22,259,473 | 22,363,870 | ||||||
| Tranche B8, 4.862%, [LIBOR12+275], 8/17/261 | 11,510,224 | 11,569,847 | ||||||
| Alphabet Holdings Co., Inc., Sr. Sec. Credit Facilities 1st Lien Term Loan, 5.612%, [LIBOR4+350], 9/26/241 | 12,138,485 | 11,331,822 | ||||||
| Bass Pro Group LLC, Sr. Sec. Credit Facilities 1st Lien Term Loan, Tranche B, 7.112%, [LIBOR12+500], 9/25/241 | 44,001,225 | 41,969,689 | ||||||
| Belk, Inc., Sr. Sec. Credit Facilities 1st Lien Term Loan, Tranche B, 6.944%, [LIBOR4+475], 12/12/221 | 5,117,946 | 4,021,835 | ||||||
| Jo-Ann Stores LLC, Sr. Sec. Credit Facilities 1st Lien Term Loan, Tranche B, 7.259%, [LIBOR4+500], 10/20/231 | 6,905,544 | 5,366,194 | ||||||
| Petco Animal Supplies, Inc., Sr. Sec. Credit Facilities 1st Lien Term Loan, Tranche B1, 5.506%, [LIBOR4+325], 1/26/231 | 15,811,367 | 11,410,510 | ||||||
| United Natural Foods, Inc., Sr. Sec. Credit Facilities 1st Lien Term Loan, Tranche B, 6.362%, [LIBOR12+425], 10/22/251 | 35,120,950 | 29,179,714 | ||||||
| 137,213,481 | ||||||||
| Diversified Consumer Services—1.1% | ||||||||
| 4L Technologies, Inc., Sr. Sec. Credit Facilities 1st Lien Term Loan, Tranche B, 6.612%, [LIBOR4+450], 5/8/201 | 82,100,753 | 45,771,170 | ||||||
| IQOR US, Inc., Sr. Sec. Credit Facilities 1st Lien Term Loan, Tranche B, 7.319%, [LIBOR4+500], 4/1/211 | 69,279,276 | 63,910,132 | ||||||
| IQOR US, Inc., Sr. Sec. Credit Facilities 2nd Lien Term Loan, 11.069%, [LIBOR4+875], 4/1/221 | 7,155,000 | 5,449,713 | ||||||
| 115,131,015 | ||||||||
| Hotels, Restaurants & Leisure—6.9% | ||||||||
| 24 Hour Fitness Worldwide, Inc., Sr. Sec. Credit Facilities 1st Lien Term Loan, Tranche B, 5.734%, [LIBOR12+350], 5/30/251 | 6,380,488 | 6,219,380 | ||||||
| Caesars Growth Properties Holdings LLC, Sr. Sec. Credit Facilities 1st Lien Term Loan, 4.862%, [LIBOR4+275], 12/23/241 | 143,076,934 | 141,190,464 | ||||||
| CDS US Intermediate Holdings, Inc., Sr. Sec. Credit Facilities 1st Lien Term Loan, Tranche B, 6.08%, [LIBOR4+375], 7/8/221 | 15,325,867 | 14,712,833 | ||||||
| CEOC LLC, Sr. Sec. Credit Facilities 1st Lien Exit Term Loan, Tranche B, 4.112%, [LIBOR12+200], 10/7/241 | 9,303,132 | 9,300,249 | ||||||
| Churchill Downs, Inc., Sr. Sec. Credit Facilities 1st Lien Term Loan, Tranche B, 4.12%, [LIBOR12+200], 12/27/241 | 15,213,176 | 15,251,209 | ||||||
| CityCenter Holdings LLC, Sr. Sec. Credit Facilities 1st Lien Term Loan, Tranche B, 4.362%, [LIBOR12+225], 4/18/241 | 34,226,200 | 34,268,983 | ||||||
| Delta 2 Lux Sarl, Sr. Sec. Credit Facilities 1st Lien Term Loan, Tranche B3, 4.612%, [LIBOR12+250], 2/1/241 | 39,013,490 | 38,324,707 | ||||||
17 INVESCO OPPENHEIMER SENIOR FLOATING RATE FUND
SCHEDULE OF INVESTMENTSContinued
| Principal Amount | Value | |||||||
| Hotels, Restaurants & Leisure (Continued) | ||||||||
| Eldorado Resorts, Inc., Sr. Sec. Credit Facilities 1st Lien Term Loan, Tranche B, 4.375%-4.50%, [LIBOR4+225], 4/17/241 | $ | 27,030,780 | $ | 27,009,696 | ||||
| Everi Payments, Inc., Sr. Sec. Credit Facilities 1st Lien Term Loan, Tranche B, 5.112%, [LIBOR12+300], 5/9/241 | 41,942,977 | 42,005,891 | ||||||
| Four Seasons Hotels Ltd., Sr. Sec. Credit Facilities 1st Lien Term Loan, 4.112%, [LIBOR12+200], 11/30/231 | 7,406,651 | 7,426,167 | ||||||
| Gateway Casinos & Entertainment Ltd., Sr. Sec. Credit Facilities 1st Lien Term Loan, Tranche B, 5.33%, [LIBOR4+300], 12/1/231 | 8,476,856 | 8,396,326 | ||||||
| GVC Holdings plc, Sr. Sec. Credit Facilities 1st Lien Term Loan, Tranche B2, 4.652%, [LIBOR4+275], 3/29/241 | 22,645,564 | 22,684,514 | ||||||
| LTI Holdings, Inc., Sr. Sec. Credit Facilities 1st Lien Term Loan, 5.612%, [LIBOR12+350], 9/6/251 | 9,105,546 | 8,619,902 | ||||||
| Nascar Holdings Inc., Sr. Sec. Credit Facilities 1st Lien Term Loan, Tranche B, 5.275%, 7/26/261 | 16,985,000 | 17,094,723 | ||||||
| Scientific Games International, Inc., Sr. Sec. Credit Facilities 1st Lien Term Loan, Tranche B5, 4.862%-4.896%, [LIBOR6+275], 8/14/241 | 114,519,234 | 113,349,993 | ||||||
| SeaWorld Parks & Entertainment, Inc., Sr. Sec. Credit Facilities 1st Lien Term Loan, Tranche B5, 5.112%, [LIBOR4+300], 4/1/241 | 26,884,401 | 26,913,839 | ||||||
| Stars Group Holdings BV, Sr. Sec. Credit Facilities 1st Lien Term Loan, Tranche B, 6.101%, [LIBOR4+350], 7/10/251 | 70,774,900 | 71,079,586 | ||||||
| Station Casinos LLC, Sr. Sec. Credit Facilities 1st Lien Term Loan, Tranche B, 4.62%, [LIBOR12+250], 6/8/231 | 61,636,676 | 61,839,152 | ||||||
| Topgolf International, Inc., Sr. Sec. Credit Facilities 1st Lien Term Loan, 7.701%, [LIBOR12+550], 2/8/261 | 3,236,888 | 3,261,164 | ||||||
| Town Sports International LLC, Sr. Sec. Credit Facilities 1st Lien Term Loan, Tranche B, 5.612%, [LIBOR12+350], 11/15/201 | 32,147,279 | 30,057,706 | ||||||
| Weight Watchers International, Inc., Sr. Sec. Credit Facilities 1st Lien Term Loan, Tranche B, 6.98%-7.07%, [LIBOR12+475], 11/29/241 | 10,612,513 | 10,627,477 | ||||||
| Wyndham Hotels & Resorts, Inc., Sr. Sec. Credit Facilities 1st Lien Term Loan, Tranche B, 3.862%, [LIBOR4+200], 5/30/251 | 5,538,150 | 5,561,992 | ||||||
| 715,195,953 | ||||||||
| Household Durables—3.8% | ||||||||
| ABG Intermediate Holdings 2 LLC, Sr. Sec. Credit Facilities 1st Lien Term Loan, 5.612%, [LIBOR4+350], 9/27/241 | 33,903,974 | 33,829,894 | ||||||
| American Greetings Corp., Sr. Sec. Credit Facilities 1st Lien Term Loan, Tranche B, 6.612%, [LIBOR12+450], 4/6/241 | 27,309,263 | 27,172,716 | ||||||
| Callaway Golf Co., Sr. Sec. Credit Facilities 1st Lien Term Loan, Tranche B, 6.713%, [LIBOR12+450], 12/14/251 | 2,491,775 | 2,528,890 | ||||||
| Coty, Inc., Sr. Sec. Credit Facilities 1st Lien Term Loan, Tranche B, 4.463%, [LIBOR4+225], 4/7/251 | 51,816,897 | 50,301,253 | ||||||
| Hanesbrands, Inc., Sr. Sec. Credit Facilities 1st Lien Term Loan, Tranche B, 3.862%, [LIBOR12+175], 12/16/241 | 4,458,421 | 4,503,005 | ||||||
| International Textile Group, Inc., Sr. Sec. Credit Facilities 1st Lien Term Loan, 7.23%, [LIBOR4+500], 5/1/241 | 17,951,700 | 16,156,530 | ||||||
18 INVESCO OPPENHEIMER SENIOR FLOATING RATE FUND
| Principal Amount | Value | |||||||
| Household Durables (Continued) | ||||||||
| Lifetime Brands, Inc., Sr. Sec. Credit Facilities 1st Lien Term Loan, Tranche B, 5.612%-5.902%, [LIBOR12+350], 2/28/251 | $ | 7,895,063 | $ | 7,658,211 | ||||
| PetSmart, Inc., Sr. Sec. Credit Facilities 1st Lien Term Loan, Tranche B, 6.21%, [LIBOR12+400], 3/11/221 | 38,267,435 | 37,238,997 | ||||||
| Revlon Consumer Products Corp., Sr. Sec. Credit Facilities 1st Lien Term Loan, Tranche B, 5.624%, [LIBOR4+350], 9/7/231 | 86,395,119 | 69,288,885 | ||||||
| Rodan & Fields LLC, Sr. Sec. Credit Facilities 1st Lien Term Loan, Tranche B, 6.195%, [LIBOR12+400], 6/16/251 | 34,255,166 | 29,921,888 | ||||||
| Serta Simmons Bedding LLC, Sr. Sec. Credit Facilities 1st Lien Term Loan, Tranche B, 5.682%-5.701%, [LIBOR4+350], 11/8/231 | 125,466,729 | 84,271,611 | ||||||
| SIWF Holdings, Inc., Sr. Sec. Credit Facilities 1st Lien Term Loan, 6.395%, [LIBOR12+425], 6/15/251 | 27,324,000 | 27,067,837 | ||||||
| Varsity Brands Holdings Co., Inc., Sr. Sec. Credit Facilities 1st Lien Term Loan, 5.612%, [LIBOR12+350], 12/16/241 | 4,663,558 | 4,550,700 | ||||||
| 394,490,417 | ||||||||
| Media—15.5% | ||||||||
| Acosta, Inc., Sr. Sec. Credit Facilities 1st Lien Term Loan, Tranche B, 5.362%, [LIBOR4+325], 9/26/211 | 91,812 | 31,970 | ||||||
| Altice Financing SA, Sr. Sec. Credit Facilities 1st Lien Term Loan: | ||||||||
| Tranche B, 4.945%, [LIBOR4+275], 7/15/251 | 43,787,956 | 42,574,592 | ||||||
| Tranche B13, 6.197%, [LIBOR4+400], 8/14/261 | 43,402,025 | 43,117,308 | ||||||
| Camelot Finance LP, Sr. Sec. Credit Facilities 1st Lien Term Loan, Tranche B, 5.362%, [LIBOR12+325], 10/3/231 | 9,586,540 | 9,629,487 | ||||||
| CBS Radio, Inc., Sr. Sec. Credit Facilities 1st Lien Term Loan, Tranche B1, 4.89%, [LIBOR4+275], 11/18/241 | 25,749,820 | 25,768,618 | ||||||
| Checkout Holding Corp., Sr. Sec. Credit Facilities 1st Lien Exit Term Loan, 9.682%, [LIBOR12+750], 2/15/231 | 21,858,736 | 18,142,751 | ||||||
| Checkout Holding Corp., Sr. Sec. Credit Facilities 1st Lien Exit Term Loan, 9.50% PIK Rate, 3.314% Cash Rate,[LIBOR4+100], 8/15/231,3 | 15,655,183 | 7,436,212 | ||||||
| CSC Holdings LLC, Sr. Sec. Credit Facilities 1st Lien Term Loan: | ||||||||
| Tranche B, 4.445%, [LIBOR12+225], 7/17/251 | 46,776,136 | 46,659,196 | ||||||
| Tranche B, 4.445%, [LIBOR4+225], 1/15/261 | 22,551,675 | 22,485,937 | ||||||
| Deluxe Entertainment Services Group, Inc., Sr. Sec. Credit Facilities 1st Lien Term Loan, 9.668%-11.75%, [LIBOR6+750], 2/28/201,2 | 6,624,301 | 6,127,478 | ||||||
| Deluxe Entertainment Services Group, Inc., Sr. Sec. Credit Facilities 1st Lien Term Loan, Tranche B, 7.756%, [LIBOR4+550], 2/28/201 | 53,164,830 | 9,011,439 | ||||||
| Deluxe Entertainment Services Group, Inc., Sr. Sec. Credit Facilities 1st Lien Term Loan, Delayed Draw, 0.50%, 2/28/201,2,4 | 466,226 | 431,259 | ||||||
| EW Scripps Co. (The), Sr. Sec. Credit Facilities 1st Lien Term Loan, Tranche B, 4.862%, [LIBOR12+275], 5/1/261 | 16,344,038 | 16,373,048 | ||||||
| Harland Clarke Holdings Corp., Sr. Sec. Credit Facilities 1st Lien Term Loan, Tranche B7, 7.08%, [LIBOR4+475], 11/3/231 | 13,870,582 | 10,898,810 | ||||||
| iHeartCommunications, Inc., Sr. Sec. Credit Facilities 1st Lien Exit Term Loan, 6.23%, [LIBOR12+400], 5/1/261,5 | 84,300,453 | 84,685,285 | ||||||
19 INVESCO OPPENHEIMER SENIOR FLOATING RATE FUND
SCHEDULE OF INVESTMENTSContinued
| Principal Amount | Value | |||||||
| Media (Continued) | ||||||||
| Intelsat Jackson Holdings SA, Sr. Sec. Credit Facilities 1st Lien Term Loan, Tranche B3, 5.895%, [LIBOR4+375], 11/27/231 | $ | 51,785,000 | $ | 51,849,731 | ||||
| ION Media Networks, Inc., Sr. Sec. Credit Facilities 1st Lien Term Loan, Tranche B4, 5.125%, [LIBOR12+300], 12/18/241 | 71,413,815 | 71,395,604 | ||||||
| Liberty Cablevision of Puerto Rico LLC, Sr. Sec. Credit Facilities 1st Lien Term Loan, 5.695%, [LIBOR4+350], 1/7/221 | 34,670,000 | 34,453,313 | ||||||
| Lions Gate Capital Holdings LLC, Sr. Sec. Credit Facilities 1st Lien Term Loan, Tranche B, 4.362%, [LIBOR4+225], 3/24/251 | 21,652,237 | 21,631,992 | ||||||
| MacDonald Dettwiler & Associates Ltd., Sr. Sec. Credit Facilities 1st Lien Term Loan, Tranche B, 4.87%, [LIBOR4+250], 10/4/241 | 24,415,619 | 21,465,358 | ||||||
| MediArena Acquisition BV, Sr. Sec. Credit Facilities 1st Lien Term Loan, 8.07%, [LIBOR4+575], 8/13/211 | 44,479,414 | 44,118,242 | ||||||
| Metro-Goldwyn-Mayer, Inc., Sr. Sec. Credit Facilities 1st Lien Term Loan, Tranche B, 4.62%, [LIBOR4+250], 7/3/251,2 | 23,596,675 | 23,567,179 | ||||||
| Metro-Goldwyn-Mayer, Inc., Sr. Sec. Credit Facilities 2nd Lien Term Loan, Tranche B, 6.62%, [LIBOR4+450], 7/3/261 | 5,094,275 | 4,979,654 | ||||||
| Mission Broadcasting, Inc., Sr. Sec. Credit Facilities 1st Lien Term Loan, Tranche B3, 4.48%, [LIBOR12+225], 1/17/241 | 14,899,936 | 14,861,345 | ||||||
| Monarchy Enterprises Holdings BV, Sr. Sec. Credit Facilities 1st Lien Term Loan, 8.612%, [LIBOR4+650], 10/13/221,2 | 111,945,000 | 111,385,275 | ||||||
| NEP Group, Inc., Sr. Sec. Credit Facilities 1st Lien Term Loan, Tranche B, 5.362%, [LIBOR4+325], 10/20/251 | 61,052,950 | 59,740,312 | ||||||
| Nexstar Broadcasting, Inc., Sr. Sec. Credit Facilities 1st Lien Term Loan: | ||||||||
| Tranche B, 4.366%, [LIBOR4+225], 7/19/241 | 74,796,186 | 74,602,463 | ||||||
| Tranche B, 5.253%, [LIBOR4+275], 6/19/261 | 28,970,000 | 29,021,711 | ||||||
| Radiate Holdco LLC, Sr. Sec. Credit Facilities 1st Lien Term Loan, 5.112%, [LIBOR12+300], 2/1/241 | 86,694,643 | 86,008,455 | ||||||
| Red Ventures LLC, Sr. Sec. Credit Facilities 1st Lien Term Loan, Tranche B, 5.112%, [LIBOR12+300], 11/8/241 | 45,639,500 | 45,678,750 | ||||||
| SFR Group SA, Sr. Sec. Credit Facilities 1st Lien Term Loan: | ||||||||
| Tranche B, 4.862%, [LIBOR4+275], 7/31/251 | 15,269,434 | 14,792,265 | ||||||
| Tranche B12, 5.885%, [LIBOR12+368.75], 1/31/261 | 48,038,334 | 47,305,269 | ||||||
| Sinclair Television Group Inc., Sr. Sec. Credit Facilities 1st Lien Term Loan: | ||||||||
| Tranche B, 5.42%, [LIBOR12+325], 7/18/261 | 17,530,000 | 17,570,144 | ||||||
| Tranche B, 4.70%, [LIBOR4+250], 9/30/261 | 11,178,164 | 11,189,789 | ||||||
| Sinclair Television Group, Inc., Sr. Sec. Credit Facilities 1st Lien Term Loan, Tranche B2, 4.37%, [LIBOR12+225], 1/3/241 | 47,540,441 | 47,516,671 | ||||||
| SpeedCast International Ltd., Sr. Sec. Credit Facilities 1st Lien Term Loan, Tranche B, 5.08%, [LIBOR4+250], 5/3/251 | 21,906,227 | 20,400,174 | ||||||
| Technicolor SA, Sr. Sec. Credit Facilities 1st Lien Term Loan, Tranche B, 4.874%, [LIBOR4+275], 12/6/231 | 18,057,563 | 16,184,091 | ||||||
| Telenet Financing USD LLC, Sr. Sec. Credit Facilities 1st Lien Term Loan, Tranche B, 4.445%, [LIBOR12+225], 8/15/261 | 33,480,000 | 33,442,335 | ||||||
| Tribune Media Co., Sr. Sec. Credit Facilities 1st Lien Term Loan, Tranche B, 5.112%, [LIBOR12+300], 1/26/241 | 34,690,025 | 34,704,421 | ||||||
| Univision Communications, Inc., Sr. Sec. Credit Facilities 1st Lien Term Loan, Tranche C5, 4.862%, [LIBOR12+275], 3/15/241 | 103,948,831 | 99,623,520 | ||||||
20 INVESCO OPPENHEIMER SENIOR FLOATING RATE FUND
| Principal Amount | Value | |||||||
| Media (Continued) | ||||||||
| Virgin Media Bristol LLC, Sr. Sec. Credit Facilities 1st Lien Term Loan, Tranche K, 4.695%, [LIBOR12+250], 1/15/261 | $ | 71,510,000 | $ | 71,585,443 | ||||
| WideOpenWest Finance LLC, Sr. Sec. Credit Facilities 1st Lien Term Loan, Tranche B, 5.395%, [LIBOR12+325], 8/18/231 | 69,902,675 | 67,368,703 | ||||||
| William Morris Endeavor Entertainment LLC, Sr. Sec. Credit Facilities 1st Lien Term Loan, Tranche B1, 4.87%, [LIBOR6+275], 5/18/251 | 6,842,614 | 6,674,970 | ||||||
| Ziggo Secured Finance Partnership, Sr. Sec. Credit Facilities 1st Lien Term Loan, Tranche E, 4.695%, [LIBOR12+250], 4/15/251 | 85,455,000 | 84,996,534 | ||||||
| 1,611,487,103 | ||||||||
| Multiline Retail—0.2% | ||||||||
Neiman Marcus Group Ltd. LLC, Sr. Sec. Credit Facilities 1st Lien Term Loan, 1.00% PIK Rate, 7.729% Cash Rate, [LIBOR12+650], 10/25/231,3
|
| 24,822,205
|
|
| 20,369,846
|
| ||
| Consumer Staples—2.4% | ||||||||
| Beverages—2.4% | ||||||||
| Dole Food Co., Inc., Sr. Sec. Credit Facilities 1st Lien Term Loan, Tranche B, 4.862%-4.917%, [LIBOR12+275], 4/6/241 | 38,972,255 | 38,558,174 | ||||||
| Hearthside Group Holdings LLC, Sr. Sec. Credit Facilities 1st Lien Term Loan, 5.80%, [LIBOR12+368.75], 5/23/251 | 26,247,558 | 25,592,025 | ||||||
| Hostess Brands LLC, Sr. Sec. Credit Facilities 1st Lien Term Loan, 4.362%-4.833%, [LIBOR12+225], 8/3/221 | 21,684,389 | 21,678,534 | ||||||
| IRB Holding Corp., Sr. Sec. Credit Facilities 1st Lien Term Loan, 5.55%, [LIBOR12+325], 2/5/251 | 51,825,705 | 51,538,332 | ||||||
| KFC Holding Co., Sr. Sec. Credit Facilities 1st Lien Term Loan, Tranche B, 3.932%, [LIBOR12+175], 4/3/251 | 5,474,529 | 5,476,226 | ||||||
| Nomad Foods Europe Midco Ltd., Sr. Sec. Credit Facilities 1st Lien Term Loan, 4.445%, [LIBOR12+225], 5/15/241 | 34,616,376 | 34,486,565 | ||||||
| NPC International, Inc., Sr. Sec. Credit Facilities 1st Lien Term Loan, 5.612%, [LIBOR12+350], 4/19/241 | 10,988,208 | 8,015,898 | ||||||
| Sigma US Corp., Sr. Sec. Credit Facilities 1st Lien Term Loan, Tranche B, 5.32%, [LIBOR4+325], 7/2/251 | 47,818,060 | 47,638,742 | ||||||
| Sunshine Investments BV, Sr. Sec. Credit Facilities 1st Lien Term Loan, Tranche B3, 5.768%, [LIBOR4+325], 3/28/251 | 20,295,000 | 20,345,738 | ||||||
| 253,330,234 | ||||||||
| Energy—3.8% | ||||||||
| Energy Equipment & Services—3.4% | ||||||||
| AL Midcoast Holdings LLC, Sr. Sec. Credit Facilities 1st Lien Term Loan, Tranche B, 7.83%, [LIBOR4+550], 8/1/251 | 19,845,078 | 19,485,386 | ||||||
| Ascent Resources - Marcellus LLC, Sr. Sec. Credit Facilities 1st Lien Term Loan, 8.695%, [LIBOR12+650], 3/30/231,2,5 | 8,041,514 | 7,800,268 | ||||||
| BCP Renaissance Parent LLC, Sr. Sec. Credit Facilities 1st Lien Term Loan, Tranche B, 6.083%, [LIBOR4+350], 10/31/241 | 23,140,679 | 22,178,952 | ||||||
| Bison Midstream Holdings LLC, Sr. Sec. Credit Facilities 1st Lien Term Loan, Tranche B, 6.169%, [LIBOR12+400], 5/21/251 | 5,392,546 | 4,871,248 | ||||||
| Eastern Power LLC, Sr. Sec. Credit Facilities 1st Lien Term Loan, Tranche B, 5.984%, [LIBOR12+375], 10/2/231 | 52,429,263 | 52,678,564 | ||||||
21 INVESCO OPPENHEIMER SENIOR FLOATING RATE FUND
SCHEDULE OF INVESTMENTSContinued
| Principal Amount | Value | |||||||
| Energy Equipment & Services (Continued) | ||||||||
| Fieldwood Energy LLC, Sr. Sec. Credit Facilities 1st Lien Term Loan, 7.506%, [LIBOR12+525], 4/11/221 | $ | 53,347,646 | $ | 47,279,351 | ||||
| GIP III Stetson I LP, Sr. Sec. Credit Facilities 1st Lien Term Loan, Tranche B, 6.432%, [LIBOR4+425], 7/18/251 | 9,569,844 | 9,179,586 | ||||||
| HGIM Corp., Sr. Sec. Credit Facilities 1st Lien Term Loan, Tranche B, 8.034%, [LIBOR4+600], 7/2/231 | 9,039,390 | 8,203,247 | ||||||
| Larchmont Resources LLC, Sr. Sec. Credit Facilities 1st Lien Term Loan, Tranche A, 9.61%, [LIBOR4+700], 8/7/201,2,5 | 6,029,707 | 5,682,999 | ||||||
| Limetree Bay Terminals LLC, Sr. Sec. Credit Facilities 1st Lien Term Loan, 6.112%-6.24%, [LIBOR12+400], 2/15/241 | 40,006,688 | 38,406,421 | ||||||
| McDermott Technology Americas, Inc., Sr. Sec. Credit Facilities 1st Lien Term Loan, Tranche B, 7.112%, [LIBOR12+500], 5/12/251 | 29,193,222 | 26,876,156 | ||||||
| Seadrill Operating LP, Sr. Sec. Credit Facilities 1st Lien Term Loan, Tranche B, 8.33%, [LIBOR4+600], 2/21/211 | 73,700,851 | 43,962,558 | ||||||
| Sheridan Investment Partners II LP, Sr. Sec. Credit Facilities 1st Lien Term Loan, Tranche B, 6.13%, [LIBOR4+350], 12/16/201,6 | 39,113,792 | 22,099,292 | ||||||
| Sheridan Production Partners II-A LP, Sr. Sec. Credit Facilities 1st Lien Term Loan, Tranche B, 6.13%, [LIBOR4+350], 12/16/201,6 | 5,425,437 | 3,065,372 | ||||||
| Sheridan Production Partners II-M LP, Sr. Sec. Credit Facilities 1st Lien Term Loan, Tranche B, 6.13%, [LIBOR4+350], 12/16/201,6 | 2,011,513 | 1,136,505 | ||||||
| Ultra Resources, Inc., Sr. Sec. Credit Facilities 1st Lien Exit Term Loan, 0.25% PIK Rate, 6.02% Cash Rate,[LIBOR4+400], 4/12/241,3 | 51,541,565 | 35,578,111 | ||||||
| 348,484,016 | ||||||||
| Oil, Gas & Consumable Fuels—0.4% | ||||||||
| Southcross Energy Partners LP, Sr. Sec. Credit Facilities Debtor in Possession 1st Lien Term Loan, 10.50%, [PRIME12+525], 10/1/191 | 9,468,049 | 9,657,410 | ||||||
| Southcross Energy Partners LP, Sr. Sec. Credit Facilities 1st Lien Term Loan, Tranche B, 10.50%, [PRIME4+525], 8/4/211,6 | 30,015,621 | 22,661,794 | ||||||
| Southcross Energy Partners LP, Sr. Sec. Credit Facilities Debtor in Possession 1st Lien Term Loan, 15.652% PIK Rate, 12.20% Cash Rate, [LIBOR12+1,000], 10/1/191,3 | 9,306,001 | 9,492,121 | ||||||
| Southcross Energy Partners LP, Sr. Sec. Credit Facilities Debtor in Possession 1st Lien Term Loan, 15.652% PIK Rate, 10.50% Cash Rate, [PRIME12+525], 10/1/191,3 | 2,067,606 | 2,010,747 | ||||||
| 43,822,072 | ||||||||
| Financials—4.8% | ||||||||
| Commercial Banks—4.3% | ||||||||
| Acrisure LLC, Sr. Sec. Credit Facilities 1st Lien Term Loan, Tranche B, 5.862%-6.362%, [LIBOR4+375], 11/22/231 | 51,404,298 | 50,992,705 | ||||||
| Alliant Holdings Intermediate LLC, Sr. Sec. Credit Facilities 1st Lien Term Loan, Tranche B, 5.269%, [LIBOR12+300], 5/9/251 | 36,290,114 | 35,363,264 | ||||||
| AmWINS Group, Inc., Sr. Sec. Credit Facilities 1st Lien Term Loan, 4.862%-4.979%, [LIBOR12+275], 1/25/241 | 23,804,058 | 23,816,912 | ||||||
22 INVESCO OPPENHEIMER SENIOR FLOATING RATE FUND
| Principal Amount | Value | |||||||
| Commercial Banks (Continued) | ||||||||
| Amynta Agency Borrower, Inc., Sec. Credit Facilities 1st Lien Term Loan, 6.612%, [LIBOR12+450], 2/28/251,2 | $ | 11,635,345 | $ | 11,140,843 | ||||
| Aretec Group, Inc., Sr. Sec. Credit Facilities 1st Lien Term Loan, 6.362%, [LIBOR4+425], 10/1/251 | 72,981,363 | 71,293,669 | ||||||
| DTZ US Borrower LLC, Sr. Sec. Credit Facilities 1st Lien Term Loan, Tranche B, 5.362%, [LIBOR12+325], 8/21/251 | 35,295,750 | 35,345,341 | ||||||
| Focus Financial Partners LLC, Sr. Sec. Credit Facilities 1st Lien Term Loan, 4.612%, [LIBOR12+250], 7/3/241 | 11,890,495 | 11,938,235 | ||||||
| GGP Nimbus LP, Sr. Sec. Credit Facilities 1st Lien Term Loan, Tranche B, 4.612%, [LIBOR12+250], 8/27/251 | 42,674,988 | 41,661,457 | ||||||
| HUB International Ltd., Sr. Sec. Credit Facilities 1st Lien Term Loan, Tranche B, 5.267%, [LIBOR4+300], 4/25/251 | 56,453,455 | 55,426,849 | ||||||
| Hyperion Insurance Group Ltd., Sr. Sec. Credit Facilities 1st Lien Term Loan, Tranche B, 5.75%, [LIBOR12+350], 12/20/241 | 8,323,824 | 8,327,487 | ||||||
| iStar, Inc., Sr. Sec. Credit Facilities 1st Lien Term Loan, Tranche B, 4.919%-4.979%, [LIBOR12+275], 6/28/231 | 13,942,494 | 13,977,350 | ||||||
| NFP Corp., Sr. Sec. Credit Facilities 1st Lien Term Loan, Tranche B, 5.112%, [LIBOR12+300], 1/8/241 | 28,222,852 | 27,698,048 | ||||||
| Uniti Group, Inc., Sr. Sec. Credit Facilities 1st Lien Term Loan, 7.112%, [LIBOR12+500], 10/24/221 | 19,781,626 | 19,173,341 | ||||||
| USI, Inc., Sr. Sec. Credit Facilities 1st Lien Term Loan, Tranche B, 5.33%, [LIBOR4+300], 5/16/241 | 46,150,508 | 45,131,505 | ||||||
| 451,287,006 | ||||||||
| Consumer Finance—0.3% | ||||||||
| PGX Holdings, Inc., Sr. Sec. Credit Facilities 1st Lien Term Loan, 7.37%, [LIBOR12+525], 9/29/201 | 24,243,000 | 22,545,990 | ||||||
| PGX Holdings, Inc., Sr. Sec. Credit Facilities 2nd Lien Term Loan, 11.24%, [LIBOR12+900], 9/29/211,2 | 9,177,907 | 8,260,117 | ||||||
| 30,806,107 | ||||||||
| Insurance—0.2% | ||||||||
| AssuredPartners, Inc., Sr. Sec. Credit Facilities 1st Lien Term Loan, Tranche B, 5.612%, [LIBOR12+325], 10/22/241 | 22,762,711 | 22,689,529 | ||||||
| Health Care—7.4% | ||||||||
| Health Care Equipment & Supplies—7.4% | ||||||||
| 21st Century Oncology, Inc., Sr. Sec. Credit Facilities 1st Lien Exit Term Loan, Tranche B, 8.455%, [LIBOR4+612.5], 1/16/231 | 10,100,750 | 9,147,543 | ||||||
| Acadia Healthcare Co., Inc., Sr. Sec. Credit Facilities 1st Lien Term Loan, Tranche B4, 4.612%, [LIBOR12+250], 2/16/231 | 11,845,337 | 11,870,508 | ||||||
| Alliance HealthCare Services, Inc., Sr. Sec. Credit Facilities 1st Lien Term Loan, 6.612%, [LIBOR4+450], 10/24/231 | 19,137,732 | 17,989,468 | ||||||
| Amneal Pharmaceuticals LLC, Sr. Sec. Credit Facilities 1st Lien Term Loan, Tranche B, 5.625%, [LIBOR12+350], 5/4/251 | 22,102,215 | 20,168,271 | ||||||
| Ardent Health Partners LLC, Sr. Sec. Credit Facilities 1st Lien Term Loan, Tranche B, 6.612%, [LIBOR12+450], 6/30/251 | 38,664,450 | 38,773,677 | ||||||
| Bausch Health Cos., Inc., Sr. Sec. Credit Facilities 1st Lien Term Loan, Tranche B, 5.201%, [LIBOR4+300], 6/2/251 | 13,152,826 | 13,192,350 | ||||||
23 INVESCO OPPENHEIMER SENIOR FLOATING RATE FUND
SCHEDULE OF INVESTMENTSContinued
| Principal Amount | Value | |||||||
| Health Care Equipment & Supplies (Continued) | ||||||||
| Carestream Dental Equipment, Inc., Sr. Sec. Credit Facilities 1st Lien Term Loan, 5.362%, [LIBOR4+325], 9/1/241 | $ | 7,088,738 | $ | 6,952,882 | ||||
| Change Healthcare Holdings LLC, Sr. Sec. Credit Facilities 1st Lien Term Loan, Tranche B, 4.612%, [LIBOR12+275], 3/1/241 | 75,469,738 | 74,762,209 | ||||||
| Concentra, Inc., Sr. Sec. Credit Facilities 1st Lien Term Loan, Tranche B, 5.21%, [LIBOR12+275], 6/1/221 | 10,834,021 | 10,865,603 | ||||||
| Endo International plc, Sr. Sec. Credit Facilities 1st Lien Term Loan, Tranche B, 6.375%, [LIBOR12+425], 4/29/241 | 32,287,287 | 29,576,446 | ||||||
| Enterprise Merger Sub, Inc., Sr. Sec. Credit Facilities 1st Lien Term Loan, 5.862%, [LIBOR4+375], 10/10/251 | 96,554,738 | 75,145,173 | ||||||
| Gentiva Health Services, Inc., Sr. Sec. Credit Facilities 1st Lien Term Loan, 5.875%, [LIBOR4+375], 7/2/251 | 47,431,626 | 47,520,798 | ||||||
| GoodRX, Inc., Sr. Sec. Credit Facilities 1st Lien Term Loan, 4.932%, [LIBOR4+300], 10/10/251 | 26,622,178 | 26,469,100 | ||||||
| Jaguar Holding Co. II, Sr. Sec. Credit Facilities 1st Lien Term Loan, 4.612%-4.902%, [LIBOR4+250], 8/18/221 | 15,487,057 | 15,422,553 | ||||||
| Kinetic Concepts, Inc., Sr. Sec. Credit Facilities 1st Lien Term Loan, Tranche B, 5.58%, [LIBOR4+325], 2/2/241 | 8,320,262 | 8,341,063 | ||||||
| LifeCare Holdings LLC, Sr. Sec. Credit Facilities 1st Lien Exit Term Loan, Tranche B, 5.703%, [LIBOR4+525], 11/30/211,6 | 36,100,973 | 2,707,573 | ||||||
| LifeScan Global Corp., Sr. Sec. Credit Facilities 1st Lien Term Loan, 8.66%, [LIBOR4+600], 10/1/241 | 34,908,875 | 32,971,432 | ||||||
| Mallinckrodt International Finance SA, Sr. Sec. Credit Facilities 1st Lien Term Loan, Tranche B, 5.08%, [LIBOR4+275], 9/24/241 | 15,507,286 | 12,153,835 | ||||||
| MPH Acquisition Holdings LLC, Sr. Sec. Credit Facilities 1st Lien Term Loan, Tranche B, 5.08%, [LIBOR4+300], 6/7/231 | 69,883,837 | 65,166,678 | ||||||
| New Trident Holdco, Inc., Sr. Sec. Credit Facilities 1st Lien Term Loan, 3.00% PIK Rate, Tranche B, 8/1/221,2,3,6 | 13,611,397 | 272,228 | ||||||
| One Call Corp., Sr. Sec. Credit Facilities 1st Lien Term Loan, Tranche B, 7.408%, [LIBOR12+525], 11/27/221 | 23,616,860 | 19,922,474 | ||||||
| Ortho-Clinical Diagnostics SA, Sr. Sec. Credit Facilities 1st Lien Term Loan, Tranche B, 5.563%, [LIBOR4+325], 6/30/251 | 55,759,951 | 52,745,568 | ||||||
| PAREXEL International Corp., Sr. Sec. Credit Facilities 1st Lien Term Loan, Tranche B, 4.862%, [LIBOR4+300], 9/27/241 | 14,580,908 | 13,777,646 | ||||||
| Select Medical Corp., Sr. Sec. Credit Facilities 1st Lien Term Loan, Tranche B, 4.85%, [LIBOR12+250], 3/6/251 | 43,858,935 | 43,749,287 | ||||||
| Sotera Health Holdings LLC, Sr. Sec. Credit Facilities 1st Lien Term Loan, Tranche B, 5.112%, [LIBOR12+300], 5/15/221 | 2,230,075 | 2,193,145 | ||||||
| Surgery Center Holdings, Inc., Sr. Sec. Credit Facilities 1st Lien Term Loan, 5.37%, [LIBOR4+325], 9/2/241 | 44,784,166 | 42,796,868 | ||||||
| Team Health Holdings, Inc., Sr. Sec. Credit Facilities 1st Lien Term Loan, Tranche B, 4.862%, [LIBOR12+275], 2/6/241 | 44,599,707 | 36,070,013 | ||||||
| US Anesthesia Partners, Inc., Sr. Sec. Credit Facilities 1st Lien Term Loan, 5.112%, [LIBOR12+300], 6/23/241 | 1,767,939 | 1,701,200 | ||||||
| VVC Holding Corp., Sr. Sec. Credit Facilities 1st Lien Term Loan, Tranche B, 6.681%, [LIBOR4+450], 2/11/261 | 27,750,450 | 27,672,471 | ||||||
24 INVESCO OPPENHEIMER SENIOR FLOATING RATE FUND
| Principal Amount | Value | |||||||
| Health Care Equipment & Supplies (Continued) | ||||||||
| Wink Holdco, Inc., Sr. Sec. Credit Facilities 1st Lien Term Loan, 5.112%, [LIBOR4+300], 12/2/241 | $ | 12,196,046 | $ | 11,906,451 | ||||
| 772,004,513 | ||||||||
| Industrials—15.4% | ||||||||
| Aerospace & Defense—0.2% | ||||||||
| Genuine Financial Holdings LLC, Sr. Sec. Credit Facilities 1st Lien Term Loan, 5.862%, [LIBOR4+375], 7/11/251 | 23,608,631 | 23,057,724 | ||||||
| Commercial Services & Supplies—7.7% | ||||||||
| Access CIG LLC, Sr. Sec. Credit Facilities 1st Lien Term Loan, 6.069%, [LIBOR4+375], 2/27/251 | 554,869 | 546,199 | ||||||
| AI Aqua Merger Sub, Inc., Sr. Sec. Credit Facilities 1st Lien Term Loan, Tranche B1, 5.652%, [LIBOR12+325], 12/13/231 | 49,117,037 | 47,025,369 | ||||||
| Asurion LLC, Sr. Sec. Credit Facilities 1st Lien Term Loan: | ||||||||
| Tranche B4, 5.112%, [LIBOR12+300], 8/4/221 | 57,822,984 | 57,920,994 | ||||||
| Tranche B6, 5.112%, [LIBOR12+300], 11/3/231 | 70,531,547 | 70,651,098 | ||||||
| Tranche B7, 5.112%, [LIBOR12+300], 11/3/241 | 10,756,350 | 10,774,259 | ||||||
| Asurion LLC, Sr. Sec. Credit Facilities 2nd Lien Term Loan, 8.612%, [LIBOR12+650], 8/4/251 | 5,452,261 | 5,541,924 | ||||||
| ATS Consolidated, Inc., Sr. Sec. Credit Facilities 1st Lien Term Loan, Tranche B, 5.862%, [LIBOR12+375], 2/28/251 | 29,131,970 | 29,277,630 | ||||||
| Belron Finance US LLC, Sr. Sec. Credit Facilities 1st Lien Term Loan, Tranche B, 4.709%, [LIBOR4+250], 11/7/241 | 6,916,102 | 6,937,715 | ||||||
| Blackhawk Network Holdings, Inc., Sr. Sec. Credit Facilities 1st Lien Term Loan, 5.112%, [LIBOR4+300], 6/15/251 | 40,283,100 | 40,044,020 | ||||||
| Boing US Holdco, Inc., Sr. Sec. Credit Facilities 1st Lien Term Loan, 5.463%, [LIBOR4+325], 10/3/241 | 31,360,550 | 30,713,739 | ||||||
| Casmar Australia Pty Ltd., Sr. Sec. Credit Facilities 1st Lien Term Loan, Tranche B, 6.616%, [LIBOR4+450], 12/8/231 | 30,797,978 | 28,488,130 | ||||||
| CM Acquisition Co., Sr. Sec. Credit Facilities 2nd Lien Term Loan, 12.262%, [LIBOR4+1,000], 7/26/231 | 9,377,286 | 9,471,058 | ||||||
| Crossmark Holdings, Inc., Sr. Sec. Credit Facilities 2nd Lien Term Loan, 12.00%, [PRIME4+650], 12/21/201,2,5,6 | 9,500,000 | 112,813 | ||||||
| First Advantage, Sr. Sec. Credit Facilities 1st Lien Term Loan, Tranche B, 7.362%, [LIBOR4+525], 6/30/221 | 14,330,577 | 14,360,456 | ||||||
| First American Payment Systems LP, Sr. Sec. Credit Facilities 1st Lien Term Loan, 7.063%, [LIBOR4+475], 1/5/241 | 13,475,000 | 13,416,047 | ||||||
| Garda World Security Corp., Sr. Sec. Credit Facilities 1st Lien Term Loan, Tranche B, 6.02%, [LIBOR4+350], 5/24/241 | 51,603,545 | 51,697,980 | ||||||
| Global Tel*Link Corp., Sr. Sec. Credit Facilities 1st Lien Term Loan, 6.362%, [LIBOR4+425], 11/29/251 | 39,815,819 | 38,153,509 | ||||||
| IG Investments Holdings LLC, Sr. Sec. Credit Facilities 1st Lien Term Loan, 6.112%-6.33%, [LIBOR12+400], 5/23/251 | 41,469,812 | 41,202,124 | ||||||
| Inmar, Inc., Sr. Sec. Credit Facilities 1st Lien Term Loan, 6.33%, [LIBOR6+400], 5/1/241 | 61,618,984 | 58,473,951 | ||||||
| IQOR US, Inc., Sr. Sec. Credit Facilities 1st Lien Term Loan, 7.819%, [LIBOR4+550], 4/1/211 | 18,085,000 | 16,683,412 | ||||||
| Monitronics International, Inc., Sr. Sec. Credit Facilities 1st Lien Term Loan, Tranche B2, 10.00%, [PRIME4+450], 9/30/221 | 22,256,702 | 21,011,773 | ||||||
25 INVESCO OPPENHEIMER SENIOR FLOATING RATE FUND
SCHEDULE OF INVESTMENTSContinued
| Principal Amount | Value | |||||||
| Commercial Services & Supplies (Continued) | ||||||||
| North American Lifting Holdings, Inc., Sr. Sec. Credit Facilities 1st Lien Term Loan, 6.83%, [LIBOR4+450], 11/27/201 | $ | 23,613,813 | $ | 22,027,319 | ||||
| Securus Technologies Holdings LLC, Sr. Sec. Credit Facilities 1st Lien Term Loan, 6.83%, [LIBOR12+450], 11/1/241 | 43,777,997 | 39,334,530 | ||||||
| Staples, Inc., Sr. Sec. Credit Facilities 1st Lien Term Loan, Tranche B, 7.197%, [LIBOR12+500], 4/16/261 | 53,356,275 | 51,379,158 | ||||||
| Travelport Finance Luxembourg Sarl, Sr. Sec. Credit Facilities 1st Lien Term Loan, 7.541%, [LIBOR4+500], 3/18/261 | 70,505,000 | 65,111,367 | ||||||
| TruGreen LP, Sr. Sec. Credit Facilities 1st Lien Term Loan, Tranche B, 5.984%, [LIBOR12+375], 3/19/261 | 4,588,500 | 4,617,201 | ||||||
| US Ecology, Inc., Sr. Sec. Credit Facilities 1st Lien Term Loan, Tranche B, 4.787%, 8/14/261 | 8,110,000 | 8,153,105 | ||||||
| Ventia Deco LLC, Sr. Sec. Credit Facilities 1st Lien Term Loan, 5.842%, [LIBOR4+350], 6/25/261,2 | 16,552,261 | 16,572,952 | ||||||
| 799,699,832 | ||||||||
| Industrial Conglomerates—3.1% | ||||||||
| Energy Acquisition Co., Inc., Sr. Sec. Credit Facilities 1st Lien Term Loan, 6.58%, [LIBOR4+425], 6/22/251,2 | 7,667,886 | 7,016,117 | ||||||
| Gates Global LLC, Sr. Sec. Credit Facilities 1st Lien Term Loan, Tranche B, 4.862%, [LIBOR4+300], 4/1/241 | 27,370,025 | 26,749,409 | ||||||
| GrafTech Finance, Inc., Sr. Sec. Credit Facilities 1st Lien Term Loan, Tranche B, 5.612%, [LIBOR12+350], 2/12/251 | 28,231,653 | 27,537,578 | ||||||
| Space Exploration Technologies Corp., Sr. Sec. Credit Facilities 1st Lien Term Loan, 6.362%, [LIBOR12+425], 11/21/251,2 | 45,765,025 | 45,879,437 | ||||||
| Titan Acquisition Ltd., Sr. Sec. Credit Facilities 1st Lien Term Loan, 5.112%, [LIBOR12+300], 3/28/251 | 22,758,545 | 21,886,210 | ||||||
| TransDigm, Inc., Sr. Sec. Credit Facilities 1st Lien Term Loan: | ||||||||
| Tranche E, 4.83%, [LIBOR12+250], 5/30/251 | 40,432,123 | 40,092,291 | ||||||
| Tranche F, 4.83%, [LIBOR12+250], 6/9/231 | 34,138,007 | 33,955,028 | ||||||
| Tranche G, 4.83%, [LIBOR4+250], 8/22/241 | 20,954,890 | 20,788,613 | ||||||
| Vertiv Intermediate Holding II Corp., Sr. Sec. Credit Facilities 1st Lien Term Loan, Tranche B, 6.33%, [LIBOR12+400], 11/30/231 | 78,416,918 | 73,973,423 | ||||||
| WP CPP Holdings LLC, Sr. Sec. Credit Facilities 1st Lien Term Loan, 6.01%, [LIBOR4+375], 4/30/251 | 27,035,150 | 27,052,182 | ||||||
| 324,930,288 | ||||||||
| Professional Services—0.4% | ||||||||
| AVSC Holding Corp., Sr. Sec. Credit Facilities 1st Lien Term Loan, Tranche B, 5.387%-5.58%, [LIBOR4+325], 3/3/251 | 38,639,092 | 37,576,517 | ||||||
| 37,576,517 | ||||||||
| Road & Rail—2.1% | ||||||||
| American Airlines, Inc., Sr. Sec. Credit Facilities 1st Lien Term Loan, Tranche B, 4.061%, [LIBOR12+175], 6/27/251 | 17,899,200 | 17,585,964 | ||||||
| Arctic LNG Carriers Ltd., Sr. Sec. Credit Facilities 1st Lien Term Loan, Tranche B, 6.83%, [LIBOR12+450], 5/18/231 | 27,054,256 | 26,637,215 | ||||||
| Daseke Cos., Inc., Sr. Sec. Credit Facilities 1st Lien Term Loan, 7.112%, [LIBOR12+500], 2/27/241,2 | 12,706,620 | 12,388,955 | ||||||
26 INVESCO OPPENHEIMER SENIOR FLOATING RATE FUND
| Principal Amount | Value | |||||||
| Road & Rail (Continued) | ||||||||
| Kenan Advantage Group, Inc. (The), Sr. Sec. Credit Facilities 1st Lien Term Loan: | ||||||||
| Tranche B1, 5.112%, [LIBOR12+300], 7/29/221 | $ | 15,323,927 | $ | 14,825,899 | ||||
| Tranche B2, 5.112%, [LIBOR12+300], 7/29/221 | 1,688,231 | 1,633,363 | ||||||
| Kestrel Bidco, Inc., Sr. Sec. Credit Facilities 1st Lien Term Loan, 5.266%, 8/7/261 | 20,759,000 | 20,840,168 | ||||||
| Western Express, Inc., Sr. Sec. Credit Facilities 2nd Lien Term Loan, 10.374%, [LIBOR4+825], 2/23/221,2 | 111,734,302 | 119,008,204 | ||||||
| 212,919,768 | ||||||||
| Transportation Infrastructure—1.9% | ||||||||
| American Axle & Manufacturing, Inc., Sr. Sec. Credit Facilities 1st Lien Term Loan, Tranche B, 4.40%-4.52%, [LIBOR12+225], 4/6/241 | 2,313,713 | 2,272,610 | ||||||
| Mavis Tire Express Services Corp., Sr. Sec. Credit Facilities 1st Lien Term Loan, 5.362%, [LIBOR4+325], 3/20/251 | 29,335,678 | 28,840,785 | ||||||
| Mavis Tire Express Services Corp., Sr. Sec. Credit Facilities 1st Lien Term Loan, Delayed Draw, 2.00%, 3/20/251,4 | 2,802,620 | 2,755,340 | ||||||
| Navistar, Inc., Sr. Sec. Credit Facilities 1st Lien Term Loan, Tranche B, 5.70%, [LIBOR12+350], 11/6/241 | 43,290,602 | 43,236,705 | ||||||
| Octavius Corp., Sr. Sec. Credit Facilities 1st Lien Term Loan, Tranche B, 5.953%, [LIBOR4+350], 11/8/231 | 4,965,000 | 4,909,144 | ||||||
| Panther BF Aggregator 2 LP, Sr. Sec. Credit Facilities 1st Lien Term Loan, Tranche B, 5.612%, [LIBOR12+350], 4/30/261 | 25,195,000 | 24,880,062 | ||||||
| Superior Industries International, Inc., Sr. Sec. Credit Facilities 1st Lien Term Loan, Tranche B, 6.112%, [LIBOR12+400], 5/22/241 | 30,600,619 | 29,453,096 | ||||||
| Tenneco, Inc., Sr. Sec. Credit Facilities 1st Lien Term Loan, Tranche B, 5.112%, [LIBOR4+275], 10/1/251 | 45,854,575 | 42,848,349 | ||||||
| TI Group Automotive Systems LLC, Sr. Sec. Credit Facilities 1st Lien Term Loan, Tranche B, 4.612%, [LIBOR12+275], 6/30/221 | 23,250,458 | 23,116,768 | ||||||
| 202,312,859 | ||||||||
| Information Technology—10.3% | ||||||||
| Internet Software & Services—9.6% | ||||||||
| Almonde, Inc., Sr. Sec. Credit Facilities 1st Lien Term Loan, Tranche B, 5.734%, [LIBOR4+350], 6/13/241 | 35,452,723 | 34,280,833 | ||||||
| American Teleconferencing Services Ltd., Sr. Sec. Credit Facilities 1st Lien Term Loan, 8.723%, [LIBOR6+650], 12/8/211 | 10,051,074 | 6,261,819 | ||||||
| Avaya, Inc., Sr. Sec. Credit Facilities 1st Lien Exit Term Loan, Tranche B, 6.43%-6.445%, [LIBOR6+425], 12/15/241 | 181,131,085 | 178,300,912 | ||||||
| Banff Merger Sub, Inc., Sr. Sec. Credit Facilities 1st Lien Term Loan, Tranche B, 6.58%, [LIBOR4+425], 10/2/251 | 67,605,886 | 64,028,520 | ||||||
| Blackboard, Inc., Sr. Sec. Credit Facilities 1st Lien Term Loan, Tranche B4, 7.30%, [LIBOR4+500], 6/30/211 | 9,984,098 | 9,971,618 | ||||||
| Colorado Buyer, Inc., Sr. Sec. Credit Facilities 1st Lien Term Loan, 5.21%, [LIBOR4+300], 5/1/241 | 35,230,823 | 33,116,973 | ||||||
| Infor US, Inc., Sr. Sec. Credit Facilities 1st Lien Term Loan, Tranche B, 5.08%, [LIBOR4+275], 2/1/221 | 47,403,445 | 47,433,072 | ||||||
27 INVESCO OPPENHEIMER SENIOR FLOATING RATE FUND
SCHEDULE OF INVESTMENTSContinued
| Principal Amount | Value | |||||||
| Internet Software & Services (Continued) | ||||||||
| Internap Corp., Sr. Sec. Credit Facilities 1st Lien Term Loan, 0.75% PIK Rate, 8.57% Cash Rate, [LIBOR12+575], 4/6/221,3 | $ | 22,119,719 | $ | 16,092,095 | ||||
| Lighthouse Network LLC, Sr. Sec. Credit Facilities 1st Lien Term Loan, 6.756%, [LIBOR4+450], 11/29/241 | 15,036,025 | 15,054,895 | ||||||
| MA FinanceCo LLC, Sr. Sec. Credit Facilities 1st Lien Term Loan: Tranche B, 4.612%, [LIBOR12+275], 6/21/241 | 12,179,189 | 11,874,709 | ||||||
| Tranche B2, 4.484%, [LIBOR4+250], 11/19/211 | 8,425,905 | 8,383,775 | ||||||
| McAfee LLC, Sr. Sec. Credit Facilities 1st Lien Term Loan, Tranche B, 6.152%, [LIBOR12+375], 9/30/241 | 52,183,924 | 52,291,684 | ||||||
| Mitchell International, Inc., Sr. Sec. Credit Facilities 1st Lien Term Loan, Tranche B, 5.362%, [LIBOR12+325], 11/29/241 | 16,081,767 | 15,108,821 | ||||||
| Plantronics, Inc., Sr. Sec. Credit Facilities 1st Lien Term Loan, 4.612%, [LIBOR12+250], 7/2/251 | 43,131,357 | 43,023,529 | ||||||
| Quest Software US Holdings, Inc., Sr. Sec. Credit Facilities 1st Lien Term Loan, 6.506%, [LIBOR4+425], 5/16/251 | 37,883,612 | 36,995,810 | ||||||
| Riverbed Technology, Inc., Sr. Sec. Credit Facilities 1st Lien Term Loan, Tranche B, 5.49%, [LIBOR12+325], 4/24/221 | 58,473,111 | 49,178,517 | ||||||
| Seattle SpinCo, Inc., Sr. Sec. Credit Facilities 1st Lien Term Loan, Tranche B, 4.612%, [LIBOR12+275], 6/21/241 | 82,250,573 | 80,194,308 | ||||||
| Shutterfly, Inc., Sr. Sec. Credit Facilities 1st Lien Term Loan, Tranche B2, 4.87%, [LIBOR12+275], 8/17/241 | 15,215,752 | 15,224,806 | ||||||
| SolarWinds Holdings, Inc., Sr. Sec. Credit Facilities 1st Lien Term Loan, 4.862%, [LIBOR12+300], 2/5/241 | 6,083,255 | 6,086,114 | ||||||
| Solera LLC, Sr. Sec. Credit Facilities 1st Lien Term Loan, Tranche B, 4.862%, [LIBOR12+275], 3/3/231 | 35,463,706 | 35,330,895 | ||||||
| SS&C Technologies Holdings Europe Sarl, Sr. Sec. Credit Facilities 1st Lien Term Loan, Tranche B4, 4.362%, [LIBOR4+250], 4/16/251 | 26,322,614 | 26,386,841 | ||||||
| SS&C Technologies, Inc., Sr. Sec. Credit Facilities 1st Lien Term Loan, Tranche B1, 4.362%, [LIBOR4+250], 4/16/251 | 38,953,580 | 39,048,627 | ||||||
| Sungard AS New Holdings III LLC, Sr. Sec. Credit Facilities 1st Lien Term Loan, 2.50% PIK Rate, 6.388% Cash Rate, 11/3/221,3 | 2,517,028 | 2,080,751 | ||||||
| Tempo Acquisition LLC, Sr. Sec. Credit Facilities 1st Lien Term Loan, Tranche B, 5.112%, [LIBOR12+300], 5/1/241 | 55,104,967 | 55,185,420 | ||||||
| TIBCO Software, Inc., Sec. Credit Facilities 1st Lien Term Loan, 6.25%, [LIBOR12+400], 6/30/261 | 6,539,000 | 6,547,174 | ||||||
| TTM Technologies, Inc., Sr. Sec. Credit Facilities 1st Lien Term Loan, 4.73%, [LIBOR4+250], 9/28/241 | 27,434,702 | 27,423,180 | ||||||
| Veritas US, Inc., Sr. Sec. Credit Facilities 1st Lien Term Loan, Tranche B1, 6.612%-6.83%, [LIBOR12+450], 1/27/231 | 51,398,730 | 48,982,990 | ||||||
| Xperi Corp., Sr. Sec. Credit Facilities 1st Lien Term Loan, Tranche B, 4.612%, [LIBOR12+250], 12/1/231 | 35,444,809 | 35,090,361 | ||||||
| 998,979,049 | ||||||||
28 INVESCO OPPENHEIMER SENIOR FLOATING RATE FUND
| Principal Amount | Value | |||||||
| IT Services—0.7% | ||||||||
| Pi US Mergerco, Inc., Sr. Sec. Credit Facilities 1st Lien Term Loan: | ||||||||
| Tranche B, 5.362%, [LIBOR12+350], 1/3/251 | $ | 23,150,089 | $ | 22,952,387 | ||||
| Tranche B1, 5.362%, [LIBOR12+350], 1/3/251 | 46,994,569 | 46,593,235 | ||||||
| 69,545,622 | ||||||||
| Materials—7.8% | ||||||||
| Chemicals—2.5% | ||||||||
| Alpha 3 BV, Sr. Sec. Credit Facilities 1st Lien Term Loan, Tranche B1, 5.33%, [LIBOR4+300], 1/31/241 | 34,084,635 | 33,195,367 | ||||||
| Consolidated Energy Finance SA, Sr. Sec. Credit Facilities 1st Lien Term Loan, Tranche B, 4.825%, [LIBOR12+250], 5/7/251,2 | 22,383,900 | 21,544,504 | ||||||
| Cyanco Intermediate Corp., Sr. Sec. Credit Facilities 1st Lien Term Loan, 5.612%, [LIBOR4+350], 3/16/251 | 14,476,382 | 14,455,247 | ||||||
| Hexicon, Inc., Sec. Credit Facilities 1st Lien Exit Term Loan, Tranche B, 5.82%, [LIBOR4+350], 7/1/261,2 | 8,645,000 | 8,645,000 | ||||||
| Momentive Performance Materials USA LLC, Sr. Sec. Credit Facilities 1st Lien Term Loan, Tranche B, 5.59%, [LIBOR4+325], 5/15/241 | 18,720,000 | 18,415,800 | ||||||
| New Arclin US Holding Corp., Sr. Sec. Credit Facilities 1st Lien Term Loan, 5.612%, [LIBOR4+350], 2/14/241,2 | 32,733,230 | 32,487,730 | ||||||
| OCI Partners LP, Sr. Sec. Credit Facilities 1st Lien Term Loan, Tranche B, 6.33%, [LIBOR4+425], 3/13/251,2 | 7,456,624 | 7,447,304 | ||||||
| Polar US Borrower LLC, Sr. Sec. Credit Facilities 1st Lien Term Loan, 7.063%-7.351%, [LIBOR4+475], 10/15/251,2 | 8,291,018 | 7,969,741 | ||||||
| Starfruit US Holdco LLC, Sr. Sec. Credit Facilities 1st Lien Term Loan, Tranche B, 5.463%, [LIBOR12+325], 10/1/251 | 66,164,175 | 64,110,108 | ||||||
| Tronox Finance LLC, Sr. Sec. Credit Facilities 1st Lien Term Loan, Tranche B, 4.862%, [LIBOR4+300], 9/23/241 | 47,296,467 | 47,015,763 | ||||||
| 255,286,564 | ||||||||
| Construction Materials—1.0% | ||||||||
| Pisces Midco, Inc., Sr. Sec. Credit Facilities 1st Lien Term Loan, Tranche B, 5.951%, [LIBOR4+375], 4/12/251 | 30,414,272 | 29,615,897 | ||||||
| Quikrete Holdings, Inc., Sr. Sec. Credit Facilities 1st Lien Term Loan, 4.862%, [LIBOR12+275], 11/15/231 | 65,094,501 | 64,531,759 | ||||||
| VC GB Holdings, Inc., Sr. Sec. Credit Facilities 1st Lien Term Loan, 5.112%, [LIBOR12+325], 2/28/241,2 | 12,859,553 | 12,714,883 | ||||||
| 106,862,539 | ||||||||
| Containers & Packaging—2.3% | ||||||||
| Ball Metalpack Finco LLC, Sr. Sec. Credit Facilities 1st Lien Term Loan, Tranche B, 6.624%, [LIBOR12+450], 7/31/251 | 10,063,350 | 9,799,187 | ||||||
| Berry Global Inc., Sr. Sec. Credit Facilities 1st Lien Term Loan, 4.701%, [LIBOR12+250], 7/1/261 | 20,480,000 | 20,501,606 | ||||||
| BWAY Corp., Sr. Sec. Credit Facilities 1st Lien Term Loan, 5.59%, [LIBOR12+325], 4/3/241 | 80,897,595 | 78,833,089 | ||||||
| Clearwater Paper Corp., Sr. Sec. Credit Facilities 1st Lien Term Loan, Tranche B, 5.438%, [LIBOR4+325], 7/26/261,2 | 9,685,000 | 9,721,319 | ||||||
| Flex Acquisition Co., Inc., Sr. Sec. Credit Facilities 1st Lien Term Loan, 5.569%, [LIBOR4+325], 6/29/251 | 53,661,735 | 51,299,277 | ||||||
29 INVESCO OPPENHEIMER SENIOR FLOATING RATE FUND
SCHEDULE OF INVESTMENTSContinued
| Principal Amount | Value | |||||||
| Containers & Packaging (Continued) | ||||||||
| Plastipak Holdings, Inc., Sr. Sec. Credit Facilities 1st Lien Term Loan, Tranche B, 4.62%, [LIBOR12+250], 10/14/241 | $ | 28,278,134 | $ | 28,228,647 | ||||
| Reynolds Group Holdings, Inc., Sr. Sec. Credit Facilities 1st Lien Term Loan, 4.862%, [LIBOR12+300], 2/5/231 | 45,214,967 | 45,243,227 | ||||||
| 243,626,352 | ||||||||
| Metals & Mining—2.0% | ||||||||
| Covia Holdings Corp., Sr. Sec. Credit Facilities 1st Lien Term Loan, 6.313%, [LIBOR4+375], 6/1/251 | 9,936,064 | 8,240,028 | ||||||
| Murray Energy Corp., Sr. Sec. Credit Facilities 1st Lien Term Loan: | ||||||||
| Tranche B2, 9.362%, [LIBOR4+725], 10/17/221 | 292,631,424 | 145,061,784 | ||||||
| Tranche B3, 9.862%, [LIBOR12+775], 10/17/221 | 76,534,272 | 37,884,465 | ||||||
| Peabody Energy Corp., Sr. Sec. Credit Facilities 1st Lien Term Loan, Tranche B, 4.862%, [LIBOR12+275], 3/31/251 | 17,137,237 | 16,933,818 | ||||||
| 208,120,095 | ||||||||
| Paper & Forest Products—0.0% | ||||||||
| Thor Industries, Inc., Sr. Sec. Credit Facilities 1st Lien Term Loan, Tranche B, 6.00%, [LIBOR4+375], 2/1/261 | 4,307,747 | 4,198,266 | ||||||
| Telecommunication Services—5.7% | ||||||||
| Diversified Telecommunication Services—5.7% | ||||||||
| CenturyLink, Inc., Sr. Sec. Credit Facilities 1st Lien Term Loan, Tranche B, 4.862%, [LIBOR4+275], 1/31/251 | 148,083,203 | 146,209,210 | ||||||
| Cincinnati Bell, Inc., Sr. Sec. Credit Facilities 1st Lien Term Loan, Tranche B, 5.484%, [LIBOR12+325], 10/2/241 | 31,866,663 | 31,804,045 | ||||||
| Consolidated Communications, Inc., Sr. Sec. Credit Facilities 1st Lien Term Loan, Tranche B, 5.12%, [LIBOR12+300], 10/5/231 | 55,695,163 | 53,482,673 | ||||||
| Digicel International Finance Ltd, Sr. Sec. Credit Facilities 1st Lien Term Loan, Tranche B, 5.34%, [LIBOR4+325], 5/27/241 | 47,270,412 | 40,463,473 | ||||||
| Frontier Communications Corp., Sr. Sec. Credit Facilities 1st Lien Term Loan, Tranche B, 5.87%, [LIBOR12+375], 6/15/241 | 32,048,677 | 31,750,464 | ||||||
| Fusion Connect, Inc., Sr. Sec. Credit Debtor in Possession Facilities 1st Lien Term Loan, 12.20%-12.22%, [LIBOR12+1,000], 10/7/191,2 | 8,056,960 | 7,976,390 | ||||||
| Fusion Connect, Inc., Sr. Sec. Credit Facilities 1st Lien Term Loan, 11.597% PIK Rate, [LIBOR4+750], 5/4/231,3,6 | 66,889,193 | 42,140,192 | ||||||
| Global Tel*Link Corp., Sr. Sec. Credit Facilities 2nd Lien Term Loan, 10.362%, [LIBOR4+825], 11/29/261 | 18,000,000 | 17,190,090 | ||||||
| IPC Corp., Sr. Sec. Credit Facilities 1st Lien Term Loan, Tranche B, 7.09%, [LIBOR4+450], 8/6/211 | 29,937,875 | 24,998,125 | ||||||
| IPC Corp., Sr. Sec. Credit Facilities 2nd Lien Term Loan, 12.09% PIK Rate, [LIBOR4+950], 2/4/221,3 | 28,787,789 | 9,260,024 | ||||||
| MLN US Holdco LLC, Sr. Sec. Credit Facilities 1st Lien Term Loan, 6.612%, [LIBOR12+450], 11/30/251 | 1,000,000 | 961,785 | ||||||
| NeuStar, Inc., Sr. Sec. Credit Facilities 1st Lien Term Loan, Tranche B4, 5.612%, [LIBOR12+350], 8/8/241 | 31,552,353 | 30,684,663 | ||||||
| Sprint Communications, Inc., Sr. Sec. Credit Facilities 1st Lien Term Loan, Tranche B, 4.625%, [LIBOR12+250], 2/2/241 | 134,202,864 | 133,531,850 | ||||||
30 INVESCO OPPENHEIMER SENIOR FLOATING RATE FUND
| Principal Amount | Value | |||||||
| Diversified Telecommunication Services (Continued) | ||||||||
| Windstream Services LLC, Sr. Sec. Credit Facilities Term Loan, Tranche B6, 10.25%, [PRIME4+500], 3/29/211,6 | $ | 23,680,082 | $ | 24,145,514 | ||||
| 594,598,498 | ||||||||
| Utilities—2.1% | ||||||||
| Electric Utilities—2.1% | ||||||||
| Brookfield WEC Holdings, Inc., Sr. Sec. Credit Facilities 1st Lien Term Loan, 5.612%, [LIBOR4+375], 8/1/251 | 17,609,156 | 17,653,179 | ||||||
| Calpine Construction Finance Co. LP, Sr. Sec. Credit Facilities 1st Lien Term Loan, 4.612%, [LIBOR12+250], 1/15/251 | 13,390,075 | 13,373,338 | ||||||
| Calpine Corp., Sr. Sec. Credit Facilities 1st Lien Term Loan: | ||||||||
| Tranche B10, 4.612%, [LIBOR12+250], 8/12/261 | 1,282,342 | 1,280,739 | ||||||
| Tranche B5, 4.83%, [LIBOR4+250], 1/15/241 | 11,241,910 | 11,246,407 | ||||||
| EFS Cogen Holdings I LLC, Sr. Sec. Credit Facilities 1st Lien Term Loan, Tranche B, 5.49%-5.58%, [LIBOR12+325], 6/28/231 | 31,976,391 | 31,912,438 | ||||||
| Exgen Renewables IV LLC, Sr. Sec. Credit Facilities 1st Lien Term Loan, Tranche B, 5.53%, [LIBOR4+300], 11/28/241 | 4,388,214 | 4,246,694 | ||||||
| Frontera Generation Holdings LLC, Sr. Sec. Credit Facilities 1st Lien Term Loan, Tranche B, 6.451%, [LIBOR12+425], 5/2/251 | 43,589,229 | 41,627,713 | ||||||
| Kestrel Acquisition LLC., Sr. Sec. Credit Facilities 1st Lien Term Loan, Tranche B, 6.66%, [LIBOR12+425], 6/2/251 | 22,374,000 | 21,507,007 | ||||||
| Lightstone Holdco LLC, Sr. Sec. Credit Facilities 1st Lien Term Loan: | ||||||||
| Tranche B, 5.862%, [LIBOR12+375], 1/30/241 | 41,740,112 | 40,320,948 | ||||||
| Tranche C, 5.862%, [LIBOR12+375], 1/30/241 | 2,347,323 | 2,267,514 | ||||||
| MRP Generation Holdings LLC, Sr. Sec. Credit Facilities 1st Lien Term Loan, Tranche B, 9.33%, [LIBOR4+700], 10/18/221,2 | 9,131,775 | 9,063,287 | ||||||
| Sandy Creek Energy Associates LP, Sr. Sec. Credit Facilities 1st Lien Term Loan, Tranche B, 6.33%, [LIBOR4+400], 11/9/201 | 33,617,812 | 29,436,597 | ||||||
| 223,935,861 | ||||||||
| Total Corporate Loans (Cost $9,894,470,484) | 9,235,236,807 | |||||||
| Corporate Bonds and Notes—2.1% | ||||||||
| Erickson Air-Crane, Inc., 6.00% Sub. Nts., 11/2/202,6 | 1,803,397 | — | ||||||
| iHeartCommunications, Inc., 8.375% Sr. Unsec. Nts., 5/1/275 | 2,747,186 | 2,977,263 | ||||||
| Peabody Energy Corp., 6.375% Sr. Sec. Nts., 3/31/257 | 57,120,000 | 59,654,700 | ||||||
| Tesla, Inc., 5.30% Sr. Unsec. Nts., 8/15/257 | 158,820,000 | 142,342,425 | ||||||
| United States Steel Corp., 6.25% Sr. Unsec. Nts., 3/15/26 | 19,100,000 | 16,963,283 | ||||||
| Total Corporate Bonds and Notes (Cost $223,565,128) | 221,937,671 | |||||||
| Shares | ||||||||
| Common Stocks—4.1% | ||||||||
| Arch Coal, Inc., Cl. A5 | 3,019,769 | 231,193,515 | ||||||
| Ascent Resources - Marcellus LLC, Cl. A5,8 | 5,777,075 | 15,670,316 | ||||||
| Avaya Holdings Corp.8 | 4,425,100 | 62,482,412 | ||||||
| Caesars Entertainment Corp.8 | 100 | 1,151 | ||||||
| Catalina Marketing Corp. (Pacifico, Inc.)2,8 | 243,609 | 1,278,947 | ||||||
| Clear Channel Outdoor Holdings, Inc., Cl. A8 | 11,111,684 | 28,890,378 | ||||||
| Crossmark Holdings, Inc.2,5,8 | 125,030 | 9,377,250 | ||||||
| Everyware Global, Inc.2,5,8 | 1,397,654 | 2,096,481 | ||||||
31 INVESCO OPPENHEIMER SENIOR FLOATING RATE FUND
SCHEDULE OF INVESTMENTSContinued
| Shares | Value | |||||||
| Common Stocks (Continued) | ||||||||
| Gymboree Corp. (The)2 | 635,688 | $ | 476,766 | |||||
| Gymboree Holding Corp.2 | 1,798,615 | 1,799 | ||||||
| Harvey Gulf International Marine LLC2,8 | 116,269 | 1,453,363 | ||||||
| iHeartMedia, Inc.5,8 | 247,990 | 3,312,403 | ||||||
| iHeartMedia, Inc., Cl. A5,8 | 4,725,378 | 65,210,216 | ||||||
| Larchmont Resources LLC2,5,8 | 8,017 | 2,004,322 | ||||||
| Millennium Corporate Claim Litigation Trust2,5,8 | 70,485 | — | ||||||
| Millennium Lender Claim Litigation Trust2,5,8 | 140,969 | — | ||||||
| New Millennium Holdco, Inc.5,8 | 1,431,369 | 125,245 | ||||||
| Quicksilver Resources, Inc.2,5,8 | 145,955,000 | — | ||||||
| Sabine Oil & Gas Holdings, Inc.5 | 17,931 | 941,378 | ||||||
| Sunguard Equity8 | 37,093 | 1,100,419 | ||||||
| Templar Energy, Cl. A2,5,8 | 1,799,429 | — | ||||||
| Total Common Stocks (Cost $653,219,782) | 425,616,361 | |||||||
| Units | ||||||||
| Rights, Warrants and Certificates—0.0% | ||||||||
| Ascent Resources - Marcellus LLC Wts., Exp. 4/3/232,5,8 | 1,495,722 | 44,872 | ||||||
| Media General, Inc. Rts., Exp. 12/31/492,5,8,9 | 6,554,344 | 380,151 | ||||||
| Sabine Oil Tranche 1 Wts., Strike Price $4.49, Exp. 8/11/262,5,8 | 55,832 | 586,237 | ||||||
| Sabine Oil Tranche 2 Wts., Strike Price $2.72, Exp. 8/11/262,5,8 | 11,734 | 146,675 | ||||||
| Total Rights, Warrants and Certificates (Cost $6,003,562) | 1,157,935 | |||||||
| Shares | Value | |||||||
| Investment Company—3.3% | ||||||||
| Invesco Government & Agency Portfolio, Institutional Class, 2.02%10(Cost $344,557,088) | 344,557,088 | $ | 344,560,878 | |||||
| Total Investments, at Value (Cost $11,121,816,044) | 98.1 | % | 10,228,509,652 | |||||
| Net Other Assets (Liabilities) | 1.9 | 193,646,568 | ||||||
| Net Assets | 100.0 | % | $ | 10,422,156,220 | ||||
Footnotes to Schedule of Investments
*Variable rate senior loan interests often require prepayments from excess cash flow or permit the borrower to repay at its election. The degree to which borrowers repay, whether as a contractual requirement or at their election, cannot be predicted with accuracy. As a result, the actual remaining maturity may be substantially less than the stated maturities shown. However, it is anticipated that the variable rate senior loan interests will have an expected average life of three to five years.
1. Variable rate senior loan interests are, at present, not readily marketable, not registered under the Securities Act of 1933, as amended (the “1933 Act”), and may be subject to contractual and legal restrictions on sale. Variable rate senior loan interests in the Fund’s portfolio generally have variable rates which adjust to a base, such as the London Interbank Offered Rate (“LIBOR”), on set dates, typically every 30 days but not greater than one year; and/or have interest rates that float at a margin above a widely recognized base lending rate such as the Prime Rate of a designated U.S. bank.
2. The value of this security was determined using significant unobservable inputs. See Note 3 of the accompanying Notes.
3. Interest or dividend is paid-in-kind, when applicable.
32 INVESCO OPPENHEIMER SENIOR FLOATING RATE FUND
Footnotes to Schedule of Investments (Continued)
4. All or a portion of this holding is subject to unfunded loan commitments. The state interest rate reflects the weighted average of the reference rate and spread for the funded portion, if any, and the commitment fees on the portion of the loan that is unfunded. See Note 9.
5. Is or was an affiliate, as defined in the Investment Company Act of 1940, as amended, at or during the reporting period, by virtue of the Fund owning at least 5% of the voting securities of the issuer or as a result of the Fund and the issuer having the same investment adviser. Transactions during the reporting period in which the issuer was an affiliate are as follows:
Shares / Principal July | Gross Additions | Gross Reductions | Shares / Principal August 31, 2019 | |||||||||||||
| ||||||||||||||||
| Corporate Loans | ||||||||||||||||
| Commercial Services & Supplies | ||||||||||||||||
| Crossmark Holdings, Inc., Sr. Sec. Credit Facilities 2nd Lien Term Loan, 12.00% [PRIME4+650], 12/21/20 | 9,500,000 | — | — | 9,500,000 | ||||||||||||
| Energy Equipment & Services | ||||||||||||||||
| Ascent Resources - Marcellus LLC, Sr. Sec. Credit Facilities 1st Lien Term Loan, 8.695% [LIBOR12+650], 3/30/23 | 8,041,514 | — | — | 8,041,514 | ||||||||||||
| Larchmont Resources LLC, Sr. Sec. Credit Facilities 1st Lien Term Loan, 9.61% [LIBOR4+700], 8/7/20 | 6,029,707 | — | — | 6,029,707 | ||||||||||||
| Media | ||||||||||||||||
| iHeartCommunications, Inc, Sr. Sec. Credit Facilities 1st Lien Exit Term Loan, 6.579% [LIBOR12+400], 5/1/26 | 106,919,412 | — | 22,618,959 | 84,300,453 | ||||||||||||
| Corporate Bonds and Notes | ||||||||||||||||
| iHeartCommunications, Inc., 8.375% Sr. Unsec. Nts., 5/1/27 | 39,273,475 | — | 36,526,289 | 2,747,186 | ||||||||||||
| Common Stocks | ||||||||||||||||
| Arch Coal, Inc., Cl. A | 3,019,769 | — | — | 3,019,769 | ||||||||||||
| Ascent Resources - Marcellus LLC, Cl. A | 5,777,075 | — | — | 5,777,075 | ||||||||||||
| Crossmark Holdings, Inc. | — | 125,030 | — | 125,030 | ||||||||||||
| Everyware Global, Inc. | 1,397,654 | — | — | 1,397,654 | ||||||||||||
| iHeartMedia, Inc., Cl. A | 4,725,378 | — | — | 4,725,378 | ||||||||||||
| iHeartMedia, Inc. | 247,990 | — | — | 247,990 | ||||||||||||
| Larchmont Resources LLC | 8,017 | — | — | 8,017 | ||||||||||||
| Millennium Corporate Claim Litigation Trust | 70,485 | — | — | 70,485 | ||||||||||||
| Millennium Lender Claim Litigation Trust | 140,969 | — | — | 140,969 | ||||||||||||
| New Millennium Holdco, Inc. | 1,431,369 | — | — | 1,431,369 | ||||||||||||
| Quicksilver Resources, Inc. | 145,955,000 | — | — | 145,955,000 | ||||||||||||
| Sabine Oil & Gas Holdings, Inc. | 17,931 | — | — | 17,931 | ||||||||||||
| Templar Energy, Cl. A | 1,799,429 | — | — | 1,799,429 | ||||||||||||
33 INVESCO OPPENHEIMER SENIOR FLOATING RATE FUND
SCHEDULE OF INVESTMENTSContinued
Footnotes to Schedule of Investments (Continued)
Shares / Principal July | Gross Additions | Gross Reductions | Shares / Principal August 31, 2019 | |||||||||||||
| ||||||||||||||||
| Rights, Warrants and Certificates | ||||||||||||||||
| Ascent Resources - Marcellus LLC Wts., Exp. 4/3/23 | 1,495,722 | — | — | 1,495,722 | ||||||||||||
| Media General, Inc. Rts., Exp. 12/31/49 | 6,554,344 | — | — | 6,554,344 | ||||||||||||
| Sabine Oil Tranche 1 Wts., Strike Price $4.49, Exp. 8/11/26 | 55,832 | — | — | 55,832 | ||||||||||||
| Sabine Oil Tranche 2 Wts., Strike Price $2.72, Exp. 8/11/26 | 11,734 | — | — | 11,734 | ||||||||||||
| Value | Income | Realized Gain (Loss) | Change in Gain (Loss) | |||||||||||||
| ||||||||||||||||
| Corporate Loans | ||||||||||||||||
| Commercial Services & Supplies | ||||||||||||||||
| Crossmark Holdings, Inc., Sr. Sec. Credit Facilities 2nd Lien Term Loan, 12.00% [PRIME4+650], 12/21/20 | $ | 112,813 | $ | — | $ | — | $ | 5,938 | ||||||||
| Energy Equipment & Services | ||||||||||||||||
| Ascent Resources - Marcellus LLC, Sr. Sec. Credit Facilities 1st Lien Term Loan, 8.695% [LIBOR12+650], 3/30/23 | 7,800,268 | 60,617 | — | (40,208) | ||||||||||||
| Larchmont Resources LLC, Sr. Sec. Credit Facilities 1st Lien Term Loan, 9.61% [LIBOR4+700], 8/7/20 | 5,682,999 | 55,095 | — | (5,197) | ||||||||||||
| Media | ||||||||||||||||
| iHeartCommunications, Inc., Sr. Sec. Credit Facilities 1st Lien Exit Term Loan, 6.23% [LIBOR12+400], 5/1/26 | 84,685,285 | 481,594 | (149,646) | (402,267) | ||||||||||||
| Corporate Bonds and Notes | ||||||||||||||||
| iHeartCommunications, Inc., 8.375% Sr. Unsec. Nts., 5/1/27 | 2,977,263 | 188,704 | 888,113 | (321,166) | ||||||||||||
| Common Stocks | ||||||||||||||||
| Arch Coal, Inc., Cl. A | 231,193,515 | 1,358,896 | — | (38,049,089) | ||||||||||||
| Ascent Resources - Marcellus LLC, Cl. A | 15,670,316 | — | — | 938,775 | ||||||||||||
| Crossmark Holdings, Inc. | 9,377,250 | — | — | (812,695) | ||||||||||||
| Everyware Global, Inc. | 2,096,481 | — | — | 384,355 | ||||||||||||
| iHeartMedia, Inc., Cl. A | 65,210,216 | — | — | (5,481,439) | ||||||||||||
| iHeartMedia, Inc. | 3,312,403 | — | — | (299,076) | ||||||||||||
| Larchmont Resources LLC | 2,004,322 | — | — | — | ||||||||||||
| Millennium Corporate Claim Litigation Trust | — | — | — | — | ||||||||||||
| Millennium Lender Claim Litigation Trust | — | — | — | — | ||||||||||||
34 INVESCO OPPENHEIMER SENIOR FLOATING RATE FUND
Footnotes to Schedule of Investments (Continued)
| Value | Income | Realized Gain (Loss) | Change in Gain (Loss) | |||||||||||||
| ||||||||||||||||
| New Millennium Holdco, Inc. | $ | 125,245 | $ | — | $ | — | $ | 34,353 | ||||||||
| Quicksilver Resources, Inc. | — | — | — | — | ||||||||||||
| Sabine Oil & Gas Holdings, Inc. | 941,378 | — | — | 421,379 | ||||||||||||
| Templar Energy, Cl. A | — | — | — | (1,799,429) | ||||||||||||
| Rights, Warrants and Certificates | ||||||||||||||||
| Ascent Resources - Marcellus LLC Wts., Exp. 4/3/23 | 44,872 | — | — | — | ||||||||||||
| Media General, Inc. Rts., Exp. 12/31/49 | 380,151 | — | — | — | ||||||||||||
| Sabine Oil Tranche 1 Wts., Strike Price $4.49, Exp. 8/11/26 | 586,237 | — | — | 530,404 | ||||||||||||
| Sabine Oil Tranche 2 Wts., Strike Price $2.72, Exp. 8/11/26 | 146,675 | — | — | 134,941 | ||||||||||||
|
| |||||||||||||||
| Total | $ | 432,347,689 | $ | 2,144,906 | $ | 738,467 | $ | (44,760,421) | ||||||||
|
| |||||||||||||||
6. This security is not accruing income because its issuer has missed or is expected to miss interest and/or principal payments. The rate shown is the contractual interest rate.
7. Security purchased or received in a transaction exempt from registration under the Securities Act of 1933, as amended (the “1933 Act”). The security may be resold pursuant to an exemption from registration under the 1933 Act, typically to qualified institutional buyers. The aggregate value of these securities at August 31, 2019 was $201,997,125, which represented 1.94% of the Fund’s Net Assets.
8. Non-income producing security.
9. Security received as the result of issuer reorganization.
10. The money market fund and the Fund are affiliated by having the same investment adviser. The rate shown is the 7-day SEC standardized yield as of August 31, 2019.
Glossary:
| Definitions | ||
| LIBOR4 | London Interbank Offered Rate-Quarterly | |
| LIBOR6 | London Interbank Offered Rate-Bi-Monthly | |
| LIBOR12 | London Interbank Offered Rate-Monthly | |
| PRIME4 | United States Prime Rate-Quarterly | |
| PRIME12 | United States Prime Rate-Monthly |
See accompanying Notes to Financial Statements.
35 INVESCO OPPENHEIMER SENIOR FLOATING RATE FUND
SCHEDULE OF INVESTMENTSJuly 31, 2019
| Principal Amount | Value | |||||||
| Corporate Loans*—87.8% | ||||||||
| Consumer Discretionary—28.5% | ||||||||
| Auto Components—0.1% | ||||||||
| Tower Automotive Holdings USA LLC, Sr. Sec. Credit Facilities 1st Lien Term Loan, Tranche B, 5.125%, [LIBOR12+275], 3/7/241 | $ | 13,250,835 | $ | 13,292,244 | ||||
| Distributors—1.4% | ||||||||
| Albertson’s LLC, Sr. Sec. Credit Facilities 1st Lien Term Loan: | ||||||||
| Tranche B6, 5.439%, [LIBOR4+300], 6/22/231 | 19,283,773 | 19,344,035 | ||||||
| Tranche B7, 5.439%, [LIBOR12+300], 11/17/251 | 29,530,901 | 29,609,896 | ||||||
| Alphabet Holdings Co., Inc., Sr. Sec. Credit Facilities 1st Lien Term Loan, 5.902%, [LIBOR4+350], 9/26/241 | 15,138,485 | 14,356,355 | ||||||
| Bass Pro Group LLC, Sr. Sec. Credit Facilities 1st Lien Term Loan, Tranche B, 7.402%, [LIBOR12+500], 9/25/241 | 44,001,225 | 41,738,242 | ||||||
| Belk, Inc., Sr. Sec. Credit Facilities 1st Lien Term Loan, Tranche B, 7.285%, [LIBOR4+475], 12/12/221 | 7,805,881 | 6,356,212 | ||||||
| Jo-Ann Stores LLC, Sr. Sec. Credit Facilities 1st Lien Term Loan, Tranche B, 7.259%, [LIBOR4+500], 10/20/231 | 6,905,544 | 5,984,827 | ||||||
| Petco Animal Supplies, Inc., Sr. Sec. Credit Facilities 1st Lien Term Loan, Tranche B1, 5.833%, [LIBOR4+325], 1/26/231 | 15,811,367 | 12,315,869 | ||||||
| United Natural Foods, Inc., Sr. Sec. Credit Facilities 1st Lien Term Loan, Tranche B, 6.652%, [LIBOR12+425], 10/22/251 | 35,120,950 | 29,743,230 | ||||||
| 159,448,666 | ||||||||
| Diversified Consumer Services—1.1% | ||||||||
| 4L Technologies, Inc., Sr. Sec. Credit Facilities 1st Lien Term Loan, Tranche B, 6.902%, [LIBOR4+450], 5/8/201 | 82,100,753 | 49,348,710 | ||||||
| IQOR US, Inc., Sr. Sec. Credit Facilities 1st Lien Term Loan, Tranche B, 7.319%, [LIBOR4+500], 4/1/211 | 69,279,276 | 66,161,709 | ||||||
| IQOR US, Inc., Sr. Sec. Credit Facilities 2nd Lien Term Loan, 11.069%, [LIBOR4+875], 4/1/221 | 7,155,000 | 5,759,775 | ||||||
| 121,270,194 | ||||||||
| Hotels, Restaurants & Leisure—6.7% | ||||||||
| 24 Hour Fitness Worldwide, Inc., Sr. Sec. Credit Facilities 1st Lien Term Loan, Tranche B, 5.902%, [LIBOR12+350], 5/30/251 | 6,380,488 | 6,395,450 | ||||||
| Caesars Growth Properties Holdings LLC, Sr. Sec. Credit Facilities 1st Lien Term Loan, 5.152%, [LIBOR4+275], 12/23/241 | 143,076,934 | 142,160,526 | ||||||
| CDS US Intermediate Holdings, Inc., Sr. Sec. Credit Facilities 1st Lien Term Loan, Tranche B, 6.08%, [LIBOR4+375], 7/8/221 | 15,325,867 | 15,008,392 | ||||||
| CEOC LLC, Sr. Sec. Credit Facilities 1st Lien Exit Term Loan, Tranche B, 4.402%, [LIBOR12+200], 10/7/241 | 9,303,132 | 9,294,713 | ||||||
| Churchill Downs, Inc., Sr. Sec. Credit Facilities 1st Lien Term Loan, Tranche B, 4.41%, [LIBOR12+200], 12/27/241 | 15,213,176 | 15,270,225 | ||||||
| CityCenter Holdings LLC, Sr. Sec. Credit Facilities 1st Lien Term Loan, Tranche B, 4.652%, [LIBOR12+225], 4/18/241 | 34,226,200 | 34,338,462 | ||||||
| Delta 2 Lux Sarl, Sr. Sec. Credit Facilities 1st Lien Term Loan, Tranche B3, 4.902%, [LIBOR12+250], 2/1/241 | 59,013,490 | 58,433,977 | ||||||
36 INVESCO OPPENHEIMER SENIOR FLOATING RATE FUND
| Principal Amount | Value | |||||||
| Hotels, Restaurants & Leisure (Continued) | ||||||||
| Eldorado Resorts, Inc., Sr. Sec. Credit Facilities 1st Lien Term Loan, Tranche B, 4.375%-4.563%, [LIBOR4+225], 4/17/241 | $ | 28,679,455 | $ | 28,679,599 | ||||
| Everi Payments, Inc., Sr. Sec. Credit Facilities 1st Lien Term Loan, Tranche B, 5.402%, [LIBOR12+300], 5/9/241 | 42,103,268 | 42,208,316 | ||||||
| Four Seasons Hotels Ltd., Sr. Sec. Credit Facilities 1st Lien Term Loan, 4.402%, [LIBOR12+200], 11/30/231 | 7,406,651 | 7,428,056 | ||||||
| Gateway Casinos & Entertainment Ltd., Sr. Sec. Credit Facilities 1st Lien Term Loan, Tranche B, 5.33%, [LIBOR4+300], 12/1/231 | 8,476,856 | 8,421,248 | ||||||
| GVC Holdings plc, Sr. Sec. Credit Facilities 1st Lien Term Loan, Tranche B2, 4.652%, [LIBOR4+275], 3/29/241 | 22,645,564 | 22,716,444 | ||||||
| LTI Holdings, Inc., Sr. Sec. Credit Facilities 1st Lien Term Loan, 5.902%, [LIBOR12+350], 9/6/251 | 13,820,546 | 13,227,437 | ||||||
| Nascar Holdings Inc., Sr. Sec. Credit Facilities 1st Lien Term Loan, Tranche B, 5.275%, 7/26/261 | 16,985,000 | 17,080,626 | ||||||
| Scientific Games International, Inc., Sr. Sec. Credit Facilities 1st Lien Term Loan, Tranche B5,5.152%-5.231%, [LIBOR12+275], 8/14/241 | 119,519,234 | 119,090,160 | ||||||
| SeaWorld Parks & Entertainment, Inc., Sr. Sec. Credit Facilities 1st Lien Term Loan, Tranche B5, 5.439%, [LIBOR4+300], 4/1/241 | 31,884,401 | 31,967,460 | ||||||
| Stars Group Holdings BV, Sr. Sec. Credit Facilities 1st Lien Term Loan, Tranche B, 6.101%, [LIBOR4+350], 7/10/251 | 70,774,900 | 71,128,775 | ||||||
| Station Casinos LLC, Sr. Sec. Credit Facilities 1st Lien Term Loan, Tranche B, 4.94%, [LIBOR12+250], 6/8/231 | 61,636,676 | 61,859,492 | ||||||
| Topgolf International, Inc., Sr. Sec. Credit Facilities 1st Lien Term Loan, 7.879%, [LIBOR12+550], 2/8/261 | 3,236,888 | 3,261,164 | ||||||
| Town Sports International LLC, Sr. Sec. Credit Facilities 1st Lien Term Loan, Tranche B, 5.939%, [LIBOR12+350], 11/15/201 | 32,147,279 | 31,665,070 | ||||||
| Weight Watchers International, Inc., Sr. Sec. Credit Facilities 1st Lien Term Loan, Tranche B, 7.07%, [LIBOR12+475], 11/29/241 | 10,612,513 | 10,552,871 | ||||||
| Wyndham Hotels & Resorts, Inc., Sr. Sec. Credit Facilities 1st Lien Term Loan, Tranche B, 4.152%, [LIBOR4+200], 5/30/251 | 5,538,150 | 5,559,361 | ||||||
| 755,747,824 | ||||||||
| Household Durables—3.6% | ||||||||
| ABG Intermediate Holdings 2 LLC, Sr. Sec. Credit Facilities 1st Lien Term Loan, 5.902%, [LIBOR4+350], 9/27/241 | 33,903,974 | 33,681,564 | ||||||
| American Greetings Corp., Sr. Sec. Credit Facilities 1st Lien Term Loan, Tranche B, 6.902%, [LIBOR12+450], 4/6/241 | 27,378,400 | 27,275,731 | ||||||
| Callaway Golf Co., Sr. Sec. Credit Facilities 1st Lien Term Loan, Tranche B, 6.86%, [LIBOR12+450], 12/14/251 | 2,491,775 | 2,525,775 | ||||||
| Coty, Inc., Sr. Sec. Credit Facilities 1st Lien Term Loan, Tranche B, 4.61%, [LIBOR4+225], 4/7/251 | 51,816,897 | 50,197,619 | ||||||
| Hanesbrands, Inc., Sr. Sec. Credit Facilities 1st Lien Term Loan, Tranche B, 4.152%, [LIBOR12+175], 12/16/241 | 4,458,421 | 4,483,500 | ||||||
| International Textile Group, Inc., Sr. Sec. Credit Facilities 1st Lien Term Loan, 7.402%, [LIBOR4+500], 5/1/241,2 | 17,951,700 | 16,515,564 | ||||||
37 INVESCO OPPENHEIMER SENIOR FLOATING RATE FUND
SCHEDULE OF INVESTMENTSContinued
| Principal Amount | Value | |||||||
| Household Durables (Continued) | ||||||||
| Lifetime Brands, Inc., Sr. Sec. Credit Facilities 1st Lien Term Loan, Tranche B, 5.902%, [LIBOR12+350], 2/28/251 | $ | 7,895,063 | $ | 7,885,194 | ||||
| PetSmart, Inc, Sr. Sec. Credit Facilities 1st Lien Term Loan, Tranche B, 6.38%, [LIBOR12+400], 3/11/221 | 38,267,435 | 37,634,874 | ||||||
| Revlon Consumer Products Corp., Sr. Sec. Credit Facilities 1st Lien Term Loan, Tranche B, 5.476%-6.129%, [LIBOR4+350], 9/7/231 | 86,395,119 | 70,772,289 | ||||||
| Rodan & Fields LLC, Sr. Sec. Credit Facilities 1st Lien Term Loan, Tranche B, 6.325%, [LIBOR12+400], 6/16/251 | 34,255,166 | 31,885,908 | ||||||
| Serta Simmons Bedding LLC, Sr. Sec. Credit Facilities 1st Lien Term Loan, Tranche B, 5.814%-5.879%, [LIBOR4+350], 11/8/231 | 125,466,729 | 86,415,210 | ||||||
| SIWF Holdings, Inc., Sr. Sec. Credit Facilities 1st Lien Term Loan, 6.52%, [LIBOR12+425], 6/15/251 | 27,324,000 | 27,306,922 | ||||||
| Varsity Brands Holdings Co., Inc., Sr. Sec. Credit Facilities 1st Lien Term Loan, 5.73%, [LIBOR12+350], 12/16/241 | 4,663,558 | 4,602,349 | ||||||
| 401,182,499 | ||||||||
| Media—15.4% | ||||||||
| Acosta, Inc., Sr. Sec. Credit Facilities 1st Lien Term Loan, Tranche B, 5.652%, [LIBOR4+325], 9/26/211 | 91,812 | 32,823 | ||||||
| Altice Financing SA, Sr. Sec. Credit Facilities 1st Lien Term Loan: | ||||||||
| Tranche B, 5.144%, [LIBOR4+275], 7/15/251 | 43,787,956 | 42,054,610 | ||||||
| Tranche B13, 6.325%, [LIBOR4+400], 8/14/261 | 43,402,025 | 43,266,611 | ||||||
| Camelot Finance LP, Sr. Sec. Credit Facilities 1st Lien Term Loan, Tranche B, 5.652%, [LIBOR12+325], 10/3/231 | 9,586,540 | 9,644,490 | ||||||
| CBS Radio, Inc., Sr. Sec. Credit Facilities 1st Lien Term Loan, Tranche B1, 5.152%, [LIBOR4+275], 11/18/241 | 25,749,820 | 25,765,914 | ||||||
| Checkout Holding Corp., Sr. Sec. Credit Facilities 1st Lien Exit Term Loan, 9.894%, [LIBOR12+750], 2/15/231 | 21,858,736 | 18,543,531 | ||||||
| Checkout Holding Corp., Sr. Sec. Credit Facilities 1st Lien Exit Term Loan, 9.50% PIK Rate, 3.394% Cash Rate, [LIBOR4+100], 8/15/231,3 | 15,520,029 | 7,372,014 | ||||||
| CSC Holdings LLC, Sr. Sec. Credit Facilities 1st Lien Term Loan: | ||||||||
| Tranche B, 4.644%, [LIBOR12+225], 7/17/251 | 46,776,136 | 46,717,666 | ||||||
| Tranche B, 4.644%, [LIBOR4+225], 1/15/261 | 22,551,675 | 22,523,485 | ||||||
| Deluxe Entertainment Services Group, Inc., Sr. Sec. Credit Facilities 1st Lien Term Loan, Tranche B, 8.083%, [LIBOR4+550], 2/28/201 | 53,164,830 | 22,661,509 | ||||||
| EW Scripps Co. (The), Sr. Sec. Credit Facilities 1st Lien Term Loan, Tranche B, 5.152%, [LIBOR12+275], 5/1/261 | 16,344,038 | 16,395,113 | ||||||
| Harland Clarke Holdings Corp., Sr. Sec. Credit Facilities 1st Lien Term Loan, Tranche B7, 7.08%, [LIBOR4+475], 11/3/231 | 15,725,582 | 12,187,326 | ||||||
| iHeartCommunications, Inc, Sr. Sec. Credit Facilities 1st Lien Exit Term Loan, 6.579%, [LIBOR12+400], 5/1/261,4 | 106,919,412 | 107,854,956 | ||||||
| Intelsat Jackson Holdings SA, Sr. Sec. Credit Facilities 1st Lien Term Loan, Tranche B3, 5.991%, [LIBOR4+375], 11/27/231 | 51,785,000 | 52,006,899 | ||||||
| ION Media Networks, Inc., Sr. Sec. Credit Facilities 1st Lien Term Loan, Tranche B, 5.313%, [LIBOR12+300], 12/18/241 | 71,413,815 | 71,402,389 | ||||||
38 INVESCO OPPENHEIMER SENIOR FLOATING RATE FUND
| Principal Amount | Value | |||||||
| Media (Continued) | ||||||||
| Liberty Cablevision of Puerto Rico LLC, Sr. Sec. Credit Facilities 1st Lien Term Loan, 5.825%, [LIBOR4+350], 1/7/221 | $ | 41,525,000 | $ | 41,473,094 | ||||
| Lions Gate Capital Holdings LLC, Sr. Sec. Credit Facilities 1st Lien Term Loan, Tranche B, 4.652%, [LIBOR4+225], 3/24/251 | 21,652,237 | 21,665,769 | ||||||
| MacDonald Dettwiler & Associates Ltd., Sr. Sec. Credit Facilities 1st Lien Term Loan, Tranche B, 5.16%, [LIBOR4+250], 10/4/241 | 24,415,619 | 22,192,699 | ||||||
| MediArena Acquisition BV, Sr. Sec. Credit Facilities 1st Lien Term Loan, 8.07%, [LIBOR4+575], 8/13/211 | 47,479,414 | 47,324,631 | ||||||
| Metro-Goldwyn-Mayer, Inc., Sr. Sec. Credit Facilities 1st Lien Term Loan, Tranche B, 4.91%, [LIBOR4+250], 7/3/251 | 23,596,675 | 23,537,683 | ||||||
| Metro-Goldwyn-Mayer, Inc., Sr. Sec. Credit Facilities 2nd Lien Term Loan, Tranche B, 6.91%, [LIBOR4+450], 7/3/261 | 5,094,275 | 4,966,918 | ||||||
| Mission Broadcasting, Inc., Sr. Sec. Credit Facilities 1st Lien Term Loan, Tranche B3, 4.652%, [LIBOR12+225], 1/17/241 | 14,899,936 | 14,858,067 | ||||||
| Monarchy Enterprises Holdings BV, Sr. Sec. Credit Facilities 1st Lien Term Loan, 8.939%, [LIBOR4+650], 10/13/221,2 | 111,945,000 | 111,385,275 | ||||||
| NEP Group, Inc., Sr. Sec. Credit Facilities 1st Lien Term Loan, Tranche B, 5.689%, [LIBOR4+325], 10/20/251 | 71,052,950 | 71,134,661 | ||||||
| Nexstar Broadcasting, Inc., Sr. Sec. Credit Facilities 1st Lien Term Loan: | ||||||||
| Tranche B, 4.678%, [LIBOR4+225], 7/19/241 | 74,796,186 | 74,586,008 | ||||||
| Tranche B, 5.253%, [LIBOR4+275], 6/19/261 | 28,970,000 | 29,012,296 | ||||||
| Radiate Holdco LLC, Sr. Sec. Credit Facilities 1st Lien Term Loan, 5.402%, [LIBOR12+300], 2/1/241 | 96,694,643 | 95,767,825 | ||||||
| Red Ventures LLC, Sr. Sec. Credit Facilities 1st Lien Term Loan, Tranche B, 5.439%, [LIBOR12+300], 11/8/241 | 45,639,500 | 45,860,623 | ||||||
| SFR Group SA, Sr. Sec. Credit Facilities 1st Lien Term Loan: | ||||||||
| Tranche B, 5.189%, [LIBOR4+275], 7/31/251 | 15,269,434 | 14,763,634 | ||||||
| Tranche B12, 6.082%, [LIBOR12+368.75], 1/31/261 | 48,038,334 | 47,617,999 | ||||||
| Sinclair Television Group Inc., Sr. Sec. Credit Facilities 1st Lien Term Loan, Tranche B, 5.42%-5.56%, [LIBOR12+325], 7/18/261 | 23,549,011 | 23,632,375 | ||||||
| Sinclair Television Group, Inc., Sr. Sec. Credit Facilities 1st Lien Term Loan, Tranche B2, 4.69%, [LIBOR12+225], 1/3/241 | 47,540,441 | 47,570,154 | ||||||
| SpeedCast International Ltd., Sr. Sec. Credit Facilities 1st Lien Term Loan, Tranche B, 5.08%, [LIBOR4+250], 5/3/251 | 21,906,227 | 20,400,174 | ||||||
| Technicolor SA, Sr. Sec. Credit Facilities 1st Lien Term Loan, Tranche B, 5.274%, [LIBOR4+275], 12/6/231 | 18,103,864 | 16,248,218 | ||||||
| Telenet Financing USD LLC, Sr. Sec. Credit Facilities 1st Lien Term Loan, Tranche B, 4.575%, [LIBOR12+225], 8/15/261 | 33,480,000 | 33,398,811 | ||||||
| Tribune Media Co., Sr. Sec. Credit Facilities 1st Lien Term Loan, Tranche B, 5.402%, [LIBOR12+300], 1/26/241 | 34,690,025 | 34,704,594 | ||||||
| Univision Communications, Inc., Sr. Sec. Credit Facilities 1st Lien Term Loan, Tranche C5, 5.152%, [LIBOR12+275], 3/15/241 | 103,948,831 | 101,910,395 | ||||||
| UPC Financing Partnership, Sr. Sec. Credit Facilities 1st Lien Term Loan, 4.854%, [LIBOR12+250], 1/15/261 | 58,374,554 | 58,424,465 | ||||||
| Virgin Media Bristol LLC, Sr. Sec. Credit Facilities 1st Lien Term Loan, Tranche K, 4.825%, [LIBOR12+250], 1/15/261 | 71,510,000 | 71,748,486 | ||||||
39 INVESCO OPPENHEIMER SENIOR FLOATING RATE FUND
SCHEDULE OF INVESTMENTSContinued
| Principal Amount | Value | |||||||
| Media (Continued) | ||||||||
| WideOpenWest Finance LLC, Sr. Sec. Credit Facilities 1st Lien Term Loan, Tranche B, 5.654%, [LIBOR12+325], 8/18/231 | $ | 72,902,675 | $ | 71,748,262 | ||||
| William Morris Endeavor Entertainment LLC, Sr. Sec. Credit Facilities 1st Lien Term Loan, Tranche B1, 5.16%, [LIBOR6+275], 5/18/251 | 6,842,614 | 6,681,813 | ||||||
| Ziggo Secured Finance Partnership, Sr. Sec. Credit Facilities 1st Lien Term Loan, Tranche E, 4.825%, [LIBOR12+250], 4/15/251 | 85,455,000 | 85,051,225 | ||||||
| 1,736,095,490 | ||||||||
| Multiline Retail—0.2% | ||||||||
| Neiman Marcus Group Ltd. LLC, Sr. Sec. Credit Facilities 1st Lien Term Loan, 1.00% PIK Rate, 7.88% Cash Rate,[LIBOR12+650], 10/25/231,3 | 24,800,159 | 21,410,722 | ||||||
| Consumer Staples—2.3% | ||||||||
| Beverages—2.3% | ||||||||
| Dole Food Co., Inc., Sr. Sec. Credit Facilities 1st Lien Term Loan, Tranche B, 5.159%-6.75%, [LIBOR12+275], 4/6/241 | 38,972,255 | 38,692,239 | ||||||
| Hearthside Group Holdings LLC, Sr. Sec. Credit Facilities 1st Lien Term Loan, 6.09%, [LIBOR12+368.75], 5/23/251 | 26,247,558 | 25,818,673 | ||||||
| Hostess Brands LLC, Sr. Sec. Credit Facilities 1st Lien Term Loan, 4.652%-4.833%, [LIBOR12+225], 8/3/221 | 21,684,389 | 21,679,944 | ||||||
| IRB Holding Corp., Sr. Sec. Credit Facilities 1st Lien Term Loan, 5.55%, [LIBOR12+325], 2/5/251 | 51,825,705 | 51,691,477 | ||||||
| KFC Holding Co., Sr. Sec. Credit Facilities 1st Lien Term Loan, Tranche B, 4.05%, [LIBOR12+175], 4/3/251 | 5,474,529 | 5,479,674 | ||||||
| Nomad Foods Europe Midco Ltd., Sr. Sec. Credit Facilities 1st Lien Term Loan, 4.644%, [LIBOR12+225], 5/15/241 | 34,616,376 | 34,587,644 | ||||||
| NPC International, Inc., Sr. Sec. Credit Facilities 1st Lien Term Loan, 5.939%, [LIBOR12+350], 4/19/241 | 15,488,208 | 12,529,960 | ||||||
| Sigma US Corp., Sr. Sec. Credit Facilities 1st Lien Term Loan, Tranche B, 5.32%, [LIBOR4+325], 7/2/251 | 47,818,060 | 47,802,997 | ||||||
| Sunshine Investments BV, Sr. Sec. Credit Facilities 1st Lien Term Loan, Tranche B3, 5.768%, [LIBOR4+325], 3/28/251 | 20,295,000 | 20,333,155 | ||||||
| 258,615,763 | ||||||||
| Energy—3.9% | ||||||||
| Energy Equipment & Services—3.5% | ||||||||
| AL Midcoast Holdings LLC, Sr. Sec. Credit Facilities 1st Lien Term Loan, Tranche B, 7.83%, [LIBOR4+550], 8/1/251 | 26,700,078 | 26,716,766 | ||||||
| Ascent Resources - Marcellus LLC, Sr. Sec. Credit Facilities 1st Lien Term Loan, 8.825%, [LIBOR12+650], 3/30/231,4 | 8,041,514 | 7,840,476 | ||||||
| BCP Renaissance Parent LLC, Sr. Sec. Credit Facilities 1st Lien Term Loan, Tranche B, 6.083%, [LIBOR4+350], 10/31/241 | 23,140,679 | 23,169,605 | ||||||
| Bison Midstream Holdings LLC, Sr. Sec. Credit Facilities 1st Lien Term Loan, Tranche B, 6.272%, [LIBOR12+400], 5/21/251 | 14,547,546 | 13,805,621 | ||||||
| Delek US Holdings, Inc., Sr. Sec. Credit Facilities 1st Lien Term Loan, Tranche B, 4.689%, [LIBOR12+225], 3/31/251 | 5,059,085 | 5,066,472 | ||||||
| Eastern Power LLC, Sr. Sec. Credit Facilities 1st Lien Term Loan, Tranche B, 6.189%, [LIBOR12+375], 10/2/231 | 52,857,870 | 53,109,738 | ||||||
40 INVESCO OPPENHEIMER SENIOR FLOATING RATE FUND
| Principal Amount | Value | |||||||
| Energy Equipment & Services (Continued) | ||||||||
| Fieldwood Energy LLC, Sr. Sec. Credit Facilities 1st Lien Term Loan, 7.652%, [LIBOR12+525], 4/11/221 | $ | 53,347,646 | $ | 49,255,081 | ||||
| GIP III Stetson I LP, Sr. Sec. Credit Facilities 1st Lien Term Loan, Tranche B, 6.55%, [LIBOR4+425], 7/18/251 | 16,757,731 | 16,851,993 | ||||||
| HGIM Corp., Sr. Sec. Credit Facilities 1st Lien Term Loan, Tranche B, 8.743%, [LIBOR4+600], 7/2/231 | 9,039,390 | 8,621,319 | ||||||
| Larchmont Resources LLC, Sr. Sec. Credit Facilities 1st Lien Term Loan, Tranche A, 9.61%, [LIBOR4+700], 8/7/201,2,4 | 6,029,707 | 5,682,999 | ||||||
| Limetree Bay Terminals LLC, Sr. Sec. Credit Facilities 1st Lien Term Loan, 6.402%, [LIBOR12+400], 2/15/241 | 40,006,688 | 38,711,472 | ||||||
| McDermott Technology Americas, Inc., Sr. Sec. Credit Facilities 1st Lien Term Loan, Tranche B, 7.402%, [LIBOR12+500], 5/12/251 | 29,193,222 | 27,967,107 | ||||||
| Seadrill Operating LP, Sr. Sec. Credit Facilities 1st Lien Term Loan, Tranche B, 8.33%, [LIBOR4+600], 2/21/211 | 73,700,851 | 48,852,978 | ||||||
| Sheridan Investment Partners II LP, Sr. Sec. Credit Facilities 1st Lien Term Loan, Tranche B, 6.13%, [LIBOR4+350], 12/16/201,5 | 39,113,792 | 23,174,922 | ||||||
| Sheridan Production Partners II-A LP, Sr. Sec. Credit Facilities 1st Lien Term Loan, Tranche B, 6.13%, [LIBOR4+350], 12/16/201,5 | 5,425,437 | 3,214,571 | ||||||
| Sheridan Production Partners II-M LP, Sr. Sec. Credit Facilities 1st Lien Term Loan, Tranche B, 6.13%, [LIBOR4+350], 12/16/201,5 | 2,011,513 | 1,191,821 | ||||||
| Ultra Resources, Inc., Sr. Sec. Credit Facilities 1st Lien Exit Term Loan, 0.25% PIK Rate, 6.154% Cash Rate, [LIBOR4+400], 4/12/241,3 | 51,529,398 | 39,081,956 | ||||||
| 392,314,897 | ||||||||
| Oil, Gas & Consumable Fuels—0.4% | ||||||||
| Southcross Energy Partners LP, Sr. Sec. Credit Facilities Debtor in Possession 1st Lien Term Loan, 10.75%, [PRIME12+525], 10/1/191 | 9,374,989 | 9,562,489 | ||||||
| Southcross Energy Partners LP, Sr. Sec. Credit Facilities 1st Lien Term Loan, Tranche B, 10.75%, [PRIME4+525], 8/4/211,2,5 | 30,015,621 | 23,337,145 | ||||||
| Southcross Energy Partners LP, Sr. Sec. Credit Facilities Debtor in Possession 1st Lien Term Loan, 10.75%, [PRIME12+525], 10/1/191,5 | 2,047,135 | 1,975,485 | ||||||
| Southcross Energy Partners LP, Sr. Sec. Credit Facilities Debtor in Possession 1st Lien Term Loan, 12.41%, [PRIME12+525], 10/1/191 | 9,306,001 | 9,492,121 | ||||||
| 44,367,240 | ||||||||
| Financials—4.8% | ||||||||
| Commercial Banks—4.3% | ||||||||
| Acrisure LLC, Sr. Sec. Credit Facilities 1st Lien Term Loan, Tranche B, 6.379%-6.879%, [LIBOR4+375], 11/22/231 | 51,404,298 | 51,020,921 | ||||||
| Alliant Holdings Intermediate LLC, Sr. Sec. Credit Facilities 1st Lien Term Loan, Tranche B, 5.269%, [LIBOR12+300], 5/9/251 | 45,050,114 | 44,511,540 | ||||||
| AmWINS Group, Inc., Sr. Sec. Credit Facilities 1st Lien Term Loan, 5.11%-5.152%, [LIBOR12+275], 1/25/241 | 23,804,058 | 23,856,189 | ||||||
41 INVESCO OPPENHEIMER SENIOR FLOATING RATE FUND
SCHEDULE OF INVESTMENTSContinued
| Principal Amount | Value | |||||||
| Commercial Banks (Continued) | ||||||||
| Amynta Agency Borrower, Inc., Sec. Credit Facilities 1st Lien Term Loan, 6.902%, [LIBOR12+450], 2/28/251 | $ | 15,245,345 | $ | 14,845,154 | ||||
| Aretec Group, Inc., Sr. Sec. Credit Facilities 1st Lien Term Loan, 6.652%, [LIBOR4+425], 10/1/251 | 74,981,363 | 73,481,736 | ||||||
| Capital Automotive LP, Sr. Sec. Credit Facilities 1st Lien Term Loan, Tranche B, 4.91%, [LIBOR12+250], 3/25/241 | 2,812,715 | 2,812,462 | ||||||
| DTZ US Borrower LLC, Sr. Sec. Credit Facilities 1st Lien Term Loan, Tranche B, 5.652%, [LIBOR12+325], 8/21/251 | 35,295,750 | 35,483,347 | ||||||
| Focus Financial Partners LLC, Sr. Sec. Credit Facilities 1st Lien Term Loan, 4.902%, [LIBOR12+250], 7/3/241 | 11,890,495 | 11,921,470 | ||||||
| GGP Nimbus LP, Sr. Sec. Credit Facilities 1st Lien Term Loan, Tranche B, 4.902%, [LIBOR12+250], 8/27/251 | 42,674,988 | 41,925,188 | ||||||
| HUB International Ltd., Sr. Sec. Credit Facilities 1st Lien Term Loan, Tranche B, 5.515%, [LIBOR4+300], 4/25/251 | 64,798,455 | 64,222,721 | ||||||
| Hyperion Insurance Group Ltd., Sr. Sec. Credit Facilities 1st Lien Term Loan, Tranche B, 5.938%, [LIBOR12+350], 12/20/241 | 11,323,824 | 11,348,283 | ||||||
| iStar, Inc., Sr. Sec. Credit Facilities 1st Lien Term Loan, Tranche B, 5.048%-5.13%, [LIBOR12+275], 6/28/231 | 13,942,494 | 14,003,493 | ||||||
| NFP Corp., Sr. Sec. Credit Facilities 1st Lien Term Loan, Tranche B, 5.439%, [LIBOR12+300], 1/8/241 | 35,177,852 | 34,745,517 | ||||||
| Uniti Group, Inc., Sr. Sec. Credit Facilities 1st Lien Term Loan, 7.402%, [LIBOR12+500], 10/24/221 | 19,781,626 | 19,283,623 | ||||||
| USI, Inc., Sr. Sec. Credit Facilities 1st Lien Term Loan, Tranche B, 5.33%, [LIBOR4+300], 5/16/241 | 46,150,508 | 45,578,473 | ||||||
| 489,040,117 | ||||||||
| Consumer Finance—0.3% | ||||||||
| PGX Holdings, Inc., Sr. Sec. Credit Facilities 1st Lien Term Loan, 7.66%, [LIBOR12+525], 9/29/201 | 24,243,000 | 22,545,990 | ||||||
| PGX Holdings, Inc., Sr. Sec. Credit Facilities 2nd Lien Term Loan, 11.44%, [LIBOR12+900], 9/29/211,2 | 9,177,907 | 8,902,570 | ||||||
| 31,448,560 | ||||||||
| Insurance—0.2% | ||||||||
| AssuredPartners, Inc., Sr. Sec. Credit Facilities 1st Lien Term Loan, Tranche B, 5.902%, [LIBOR12+325], 10/22/241 | 22,762,711 | 22,695,675 | ||||||
| Health Care—7.4% | ||||||||
| Health Care Equipment & Supplies—7.4% | ||||||||
| 21st Century Oncology, Inc., Sr. Sec. Credit Facilities 1st Lien Exit Term Loan, Tranche B, 8.455%, [LIBOR4+612.5], 1/16/231 | 10,100,750 | 8,846,591 | ||||||
| Acadia Healthcare Co., Inc., Sr. Sec. Credit Facilities 1st Lien Term Loan, Tranche B4, 4.902%, [LIBOR12+250], 2/16/231 | 11,845,337 | 11,876,016 | ||||||
| Alliance HealthCare Services, Inc., Sr. Sec. Credit Facilities 1st Lien Term Loan, 6.902%, [LIBOR4+450], 10/24/231 | 19,137,732 | 18,252,612 | ||||||
| Amneal Pharmaceuticals LLC, Sr. Sec. Credit Facilities 1st Lien Term Loan, Tranche B, 5.938%, [LIBOR12+350], 5/4/251 | 27,102,215 | 25,200,182 | ||||||
| Ardent Health Partners LLC, Sr. Sec. Credit Facilities 1st Lien Term Loan, Tranche B, 6.902%, [LIBOR12+450], 6/30/251 | 38,664,450 | 38,825,487 | ||||||
42 INVESCO OPPENHEIMER SENIOR FLOATING RATE FUND
| Principal Amount | Value | |||||||
| Health Care Equipment & Supplies (Continued) | ||||||||
| Bausch Health Cos., Inc., Sr. Sec. Credit Facilities 1st Lien Term Loan, Tranche B, 5.379%, [LIBOR4+300], 6/2/251 | $ | 13,416,034 | $ | 13,479,761 | ||||
| Carestream Dental Equipment, Inc., Sr. Sec. Credit Facilities 1st Lien Term Loan, 5.652%, [LIBOR4+325], 9/1/241 | 7,088,738 | 6,976,487 | ||||||
| Change Healthcare Holdings LLC, Sr. Sec. Credit Facilities 1st Lien Term Loan, Tranche B, 5.152%, [LIBOR12+275], 3/1/241 | 87,406,493 | 87,358,420 | ||||||
| Concentra, Inc., Sr. Sec. Credit Facilities 1st Lien Term Loan, Tranche B, 5.21%, [LIBOR12+275], 6/1/221 | 10,834,021 | 10,864,519 | ||||||
| CVS Holdings I LP, Sr. Sec. Credit Facilities 1st Lien Term Loan, 5.16%, [LIBOR4+300], 2/6/251 | 24,600,770 | 24,605,936 | ||||||
| Endo International plc, Sr. Sec. Credit Facilities 1st Lien Term Loan, Tranche B, 6.75%, [LIBOR12+425], 4/29/241 | 32,287,287 | 29,553,038 | ||||||
| Enterprise Merger Sub, Inc., Sr. Sec. Credit Facilities 1st Lien Term Loan, 6.152%, [LIBOR4+375], 10/10/251 | 96,554,738 | 83,243,219 | ||||||
| Gentiva Health Services, Inc., Sr. Sec. Credit Facilities 1st Lien Term Loan, 6.188%, [LIBOR4+375], 7/2/251 | 47,431,626 | 47,757,719 | ||||||
| GoodRX, Inc., Sr. Sec. Credit Facilities 1st Lien Term Loan, 5.064%, [LIBOR4+300], 10/10/251 | 26,622,178 | 26,598,883 | ||||||
| Jaguar Holding Co. II, Sr. Sec. Credit Facilities 1st Lien Term Loan, 4.902%, [LIBOR4+250], 8/18/221 | 15,487,057 | 15,484,346 | ||||||
| Kinetic Concepts, Inc., Sr. Sec. Credit Facilities 1st Lien Term Loan, Tranche B, 5.58%, [LIBOR4+325], 2/2/241 | 8,320,262 | 8,354,708 | ||||||
| LifeCare Holdings LLC, Sr. Sec. Credit Facilities 1st Lien Exit Term Loan, Tranche B, 5.703%, [LIBOR4+525], 11/30/211,5 | 36,100,973 | 2,707,573 | ||||||
| LifeScan Global Corp., Sr. Sec. Credit Facilities 1st Lien Term Loan, 8.66%, [LIBOR4+600], 10/1/241 | 34,908,875 | 33,352,463 | ||||||
| Mallinckrodt International Finance SA, Sr. Sec. Credit Facilities 1st Lien Term Loan, Tranche B, 5.08%, [LIBOR4+275], 9/24/241 | 15,507,286 | 13,273,849 | ||||||
| MPH Acquisition Holdings LLC, Sr. Sec. Credit Facilities 1st Lien Term Loan, Tranche B, 5.351%, [LIBOR4+300], 6/7/231 | 69,883,837 | 67,996,974 | ||||||
| New Trident Holdco, Inc., Sr. Sec. Credit Facilities 1st Lien Term Loan, 3.00% PIK Rate, Tranche B, 4/30/221,2,3,5 | 13,611,397 | 34,029 | ||||||
| One Call Corp., Sr. Sec. Credit Facilities 1st Lien Term Loan, Tranche B, 7.575%, [LIBOR12+525], 11/27/221 | 23,616,860 | 20,649,992 | ||||||
| Ortho-Clinical Diagnostics SA, Sr. Sec. Credit Facilities 1st Lien Term Loan, Tranche B, 5.563%, [LIBOR4+325], 6/30/251 | 55,759,951 | 54,261,681 | ||||||
| PAREXEL International Corp., Sr. Sec. Credit Facilities 1st Lien Term Loan, Tranche B, 5.152%, [LIBOR4+300], 9/27/241 | 14,580,908 | 14,097,988 | ||||||
| Select Medical Corp., Sr. Sec. Credit Facilities 1st Lien Term Loan, 4.803%, 3/6/251 | 15,393,000 | 15,383,456 | ||||||
| Select Medical Corp., Sr. Sec. Credit Facilities 1st Lien Term Loan, Tranche B, 4.99%, [LIBOR12+250], 3/6/251 | 28,465,935 | 28,448,286 | ||||||
| Sotera Health Holdings LLC, Sr. Sec. Credit Facilities 1st Lien Term Loan, Tranche B, 5.402%, [LIBOR12+300], 5/15/221 | 2,230,075 | 2,211,120 | ||||||
| Surgery Center Holdings, Inc., Sr. Sec. Credit Facilities 1st Lien Term Loan, 5.69%, [LIBOR4+325], 9/2/241 | 44,784,166 | 43,272,700 | ||||||
| Team Health Holdings, Inc., Sr. Sec. Credit Facilities 1st Lien Term Loan, Tranche B, 5.152%, [LIBOR12+275], 2/6/241 | 44,599,707 | 39,210,501 | ||||||
43 INVESCO OPPENHEIMER SENIOR FLOATING RATE FUND
SCHEDULE OF INVESTMENTSContinued
| Principal Amount | Value | |||||||
| Health Care Equipment & Supplies (Continued) | ||||||||
| US Anesthesia Partners, Inc., Sr. Sec. Credit Facilities 1st Lien Term Loan, 5.402%, [LIBOR12+300], 6/23/241 | $ | 1,767,939 | $ | 1,708,271 | ||||
| VVC Holding Corp., Sr. Sec. Credit Facilities 1st Lien Term Loan, Tranche B, 7.045%, [LIBOR4+450], 2/11/261 | 27,750,450 | 27,893,642 | ||||||
| Wink Holdco, Inc., Sr. Sec. Credit Facilities 1st Lien Term Loan, 5.402%, [LIBOR4+300], 12/2/241 | 12,196,046 | 12,049,327 | ||||||
| 833,829,776 | ||||||||
| Industrials—15.3% | ||||||||
| Aerospace & Defense—0.2% | ||||||||
| Genuine Financial Holdings LLC, Sr. Sec. Credit Facilities 1st Lien Term Loan, 6.152%, [LIBOR4+375], 7/11/251 | 23,608,631 | 23,382,461 | ||||||
| Commercial Services & Supplies—7.7% | ||||||||
| Access CIG LLC, Sr. Sec. Credit Facilities 1st Lien Term Loan, 6.069%, [LIBOR4+375], 2/27/251 | 554,869 | 552,963 | ||||||
| AI Aqua Merger Sub, Inc., Sr. Sec. Credit Facilities 1st Lien Term Loan, Tranche B1, 5.652%, [LIBOR12+325], 12/13/231 | 49,117,037 | 47,137,129 | ||||||
| Asurion LLC, Sr. Sec. Credit Facilities 1st Lien Term Loan: | ||||||||
| Tranche B4, 5.402%, [LIBOR12+300], 8/4/221 | 58,470,106 | 58,642,593 | ||||||
| Tranche B6, 5.402%, [LIBOR12+300], 11/3/231 | 70,531,547 | 70,766,770 | ||||||
| Tranche B7, 5.402%, [LIBOR12+300], 11/3/241 | 10,756,350 | 10,791,900 | ||||||
| Asurion LLC, Sr. Sec. Credit Facilities 2nd Lien Term Loan, 8.902%, [LIBOR12+650], 8/4/251 | 7,452,261 | 7,591,991 | ||||||
| ATS Consolidated, Inc., Sr. Sec. Credit Facilities 1st Lien Term Loan, Tranche B, 6.152%, [LIBOR12+375], 2/28/251 | 39,131,970 | 39,360,109 | ||||||
| Belron Finance US LLC, Sr. Sec. Credit Facilities 1st Lien Term Loan, Tranche B, 4.815%, [LIBOR4+250], 11/7/241 | 6,916,102 | 6,935,571 | ||||||
| Blackhawk Network Holdings, Inc., Sr. Sec. Credit Facilities 1st Lien Term Loan, 5.402%, [LIBOR4+300], 6/15/251 | 40,283,100 | 40,262,153 | ||||||
| Boing US Holdco, Inc., Sr. Sec. Credit Facilities 1st Lien Term Loan, 5.652%, [LIBOR4+325], 10/3/241 | 31,360,550 | 31,027,344 | ||||||
| Casmar Australia Pty Ltd., Sr. Sec. Credit Facilities 1st Lien Term Loan, Tranche B, 6.741%, [LIBOR4+450], 12/8/231 | 30,797,978 | 28,642,120 | ||||||
| Ceridian HCM Holding, Inc., Sr. Sec. Credit Facilities 1st Lien Term Loan, Tranche B, 5.402%, [LIBOR12+325], 4/30/251 | 25,556,875 | 25,748,679 | ||||||
| Crossmark Holdings, Inc., Sr. Sec. Credit Facilities 1st Lien Term Loan, 8.00%, [PRIME4+250], 12/20/191,5 | 50,008,086 | 17,940,401 | ||||||
| Crossmark Holdings, Inc., Sr. Sec. Credit Facilities 2nd Lien Term Loan, 12.00%, [PRIME4+650], 12/21/201,5 | 9,500,000 | 106,875 | ||||||
| First Advantage, Sr. Sec. Credit Facilities 1st Lien Term Loan, Tranche B, 7.689%, [LIBOR4+525], 6/30/221 | 15,555,577 | 15,594,466 | ||||||
| First American Payment Systems LP, Sr. Sec. Credit Facilities 1st Lien Term Loan, 7.352%, [LIBOR12+475], 1/5/241 | 13,475,000 | 13,441,380 | ||||||
| Garda World Security Corp., Sr. Sec. Credit Facilities 1st Lien Term Loan, Tranche B, 6.02%, [LIBOR4+350], 5/24/241 | 56,603,545 | 56,785,526 | ||||||
| Global Tel*Link Corp., Sr. Sec. Credit Facilities 1st Lien Term Loan, 6.689%, [LIBOR4+425], 11/29/251 | 39,815,819 | 37,944,476 | ||||||
| IG Investments Holdings LLC, Sr. Sec. Credit Facilities 1st Lien Term Loan, 6.33%-6.402%, [LIBOR4+400], 5/23/251 | 42,419,812 | 42,393,300 | ||||||
44 INVESCO OPPENHEIMER SENIOR FLOATING RATE FUND
| Principal Amount | Value | |||||||
| Commercial Services & Supplies (Continued) | ||||||||
| Inmar, Inc., Sr. Sec. Credit Facilities 1st Lien Term Loan, 6.33%, [LIBOR6+400], 5/1/241 | $ | 61,618,984 | $ | 58,538,034 | ||||
| IQOR US, Inc., Sr. Sec. Credit Facilities 1st Lien Term Loan, 7.819%, [LIBOR4+550], 4/1/211 | 18,085,000 | 17,271,175 | ||||||
| Monitronics International, Inc., Sr. Sec. Credit Facilities 1st Lien Term Loan, Tranche B2, 10.00%, [PRIME4+450], 9/30/221 | 26,315,675 | 24,942,392 | ||||||
| North American Lifting Holdings, Inc., Sr. Sec. Credit Facilities 1st Lien Term Loan, 6.83%, [LIBOR4+450], 11/27/201 | 23,613,813 | 22,132,046 | ||||||
| Securus Technologies Holdings LLC, Sr. Sec. Credit Facilities 1st Lien Term Loan, 6.83%, [LIBOR12+450], 11/1/241 | 43,777,997 | 39,947,422 | ||||||
| Sinclair Television Group Inc., Sr. Sec. Credit Facilities 1st Lien Term Loan, Tranche B, 4.70%, [LIBOR4+250], 9/12/231 | 5,159,153 | 5,177,416 | ||||||
| Staples, Inc., Sr. Sec. Credit Facilities 1st Lien Term Loan, Tranche B, 7.601%, [LIBOR12+500], 4/12/261 | 53,356,275 | 52,222,721 | ||||||
| Travelport Finance Luxembourg Sarl, Sr. Sec. Credit Facilities 1st Lien Term Loan, 7.541%, [LIBOR4+500], 5/29/261 | 70,505,000 | 68,676,100 | ||||||
| TruGreen LP, Sr. Sec. Credit Facilities 1st Lien Term Loan, Tranche B, 6.075%, [LIBOR12+375], 3/19/261 | 4,588,500 | 4,614,310 | ||||||
| Ventia Deco LLC, Sr. Sec. Credit Facilities 1st Lien Term Loan, 5.979%, [LIBOR4+350], 6/25/261 | 16,552,261 | 16,635,023 | ||||||
| 861,822,385 | ||||||||
| Industrial Conglomerates—3.4% | ||||||||
| Apex Tool Group LLC, Sr. Sec. Credit Facilities 1st Lien Term Loan, Tranche B, 6.152%, [LIBOR12+375], 2/1/221 | 29,948,188 | 28,795,182 | ||||||
| Energy Acquisition Co., Inc., Sr. Sec. Credit Facilities 1st Lien Term Loan, 6.58%, [LIBOR4+425], 6/22/251,2 | 7,667,886 | 7,169,474 | ||||||
| Gates Global LLC, Sr. Sec. Credit Facilities 1st Lien Term Loan, Tranche B, 5.189%, [LIBOR4+300], 4/1/241 | 27,370,025 | 27,301,600 | ||||||
| GrafTech Finance, Inc., Sr. Sec. Credit Facilities 1st Lien Term Loan, Tranche B, 5.902%, [LIBOR12+350], 2/12/251 | 28,231,653 | 27,878,757 | ||||||
| Robertshaw US Holdings Corp., Sr. Sec. Credit Facilities 1st Lien Term Loan, 5.938%, [LIBOR12+350], 2/28/251 | 7,694,215 | 7,222,945 | ||||||
| Space Exploration Technologies Corp., Sr. Sec. Credit Facilities 1st Lien Term Loan, 6.689%, [LIBOR12+425], 11/21/251,2 | 45,765,025 | 45,879,437 | ||||||
| Titan Acquisition Ltd., Sr. Sec. Credit Facilities 1st Lien Term Loan, 5.402%, [LIBOR12+300], 3/28/251 | 27,533,545 | 26,205,051 | ||||||
| TransDigm, Inc., Sr. Sec. Credit Facilities 1st Lien Term Loan: | ||||||||
| Tranche E, 4.83%, [LIBOR12+250], 5/30/251 | 40,432,123 | 40,172,145 | ||||||
| Tranche F, 4.83%, [LIBOR12+250], 6/9/231 | 34,138,007 | 34,019,378 | ||||||
| Tranche G, 4.83%, [LIBOR4+250], 8/22/241 | 20,954,890 | 20,806,529 | ||||||
| Vectra Co., Sr. Sec. Credit Facilities 1st Lien Term Loan, 5.652%, [LIBOR12+325], 3/8/251 | 5,226,158 | 5,034,540 | ||||||
| Vertiv Intermediate Holding II Corp., Sr. Sec. Credit Facilities 1st Lien Term Loan, Tranche B, 6.33%, [LIBOR12+400], 11/30/231 | 78,416,918 | 74,790,136 | ||||||
| WP CPP Holdings LLC, Sr. Sec. Credit Facilities 1st Lien Term Loan, 6.34%, [LIBOR4+375], 4/30/251 | 37,035,150 | 37,096,999 | ||||||
| 382,372,173 | ||||||||
45 INVESCO OPPENHEIMER SENIOR FLOATING RATE FUND
SCHEDULE OF INVESTMENTSContinued
| Principal Amount | Value | |||||||
| Professional Services—0.3% | ||||||||
| AVSC Holding Corp., Sr. Sec. Credit Facilities 1st Lien Term Loan, Tranche B, 5.575%-5.652%, [LIBOR4+375], 3/3/251 | $ | 38,639,092 | $ | 37,709,435 | ||||
| 37,709,435 | ||||||||
| Road & Rail—1.7% | ||||||||
| American Airlines, Inc., Sr. Sec. Credit Facilities 1st Lien Term Loan, Tranche B, 4.061%, [LIBOR12+175], 6/27/251 | 17,899,200 | 17,574,867 | ||||||
| Arctic LNG Carriers Ltd., Sr. Sec. Credit Facilities 1st Lien Term Loan, Tranche B, 6.83%, [LIBOR12+450], 5/18/231 | 27,054,256 | 26,665,351 | ||||||
| Daseke Cos., Inc., Sr. Sec. Credit Facilities 1st Lien Term Loan, 7.402%, [LIBOR12+500], 2/27/241 | 12,706,620 | 12,714,562 | ||||||
| Kenan Advantage Group, Inc. (The), Sr. Sec. Credit Facilities 1st Lien Term Loan: | ||||||||
| Tranche B1, 5.402%, [LIBOR12+300], 7/29/221 | 15,323,927 | 14,830,726 | ||||||
| Tranche B2, 5.402%, [LIBOR12+300], 7/29/221 | 1,688,231 | 1,633,895 | ||||||
| Western Express, Inc., Sr. Sec. Credit Facilities 2nd Lien Term Loan, 10.772%, [LIBOR4+825], 2/23/221,2 | 111,734,302 | 121,008,249 | ||||||
| 194,427,650 | ||||||||
| Transportation Infrastructure—2.0% | ||||||||
| American Axle & Manufacturing, Inc., Sr. Sec. Credit Facilities 1st Lien Term Loan, Tranche B, 4.52%-4.53%, [LIBOR12+225], 4/6/241 | 7,313,713 | 7,201,740 | ||||||
| Mavis Tire Express Services Corp., Sr. Sec. Credit Facilities 1st Lien Term Loan, 5.652%, [LIBOR4+325], 3/20/251 | 29,335,678 | 28,914,125 | ||||||
| Mavis Tire Express Services Corp., Sr. Sec. Credit Facilities 1st Lien Term Loan, Delayed Draw, 2.00%, 3/20/251,6 | 2,802,620 | 2,762,346 | ||||||
| Navistar, Inc., Sr. Sec. Credit Facilities 1st Lien Term Loan, Tranche B, 5.83%, [LIBOR12+350], 11/6/241 | 43,290,602 | 43,480,215 | ||||||
| Octavius Corp., Sr. Sec. Credit Facilities 1st Lien Term Loan, Tranche B, 5.953%-6.101%, [LIBOR4+350], 11/8/231,2 | 4,965,000 | 4,977,412 | ||||||
| Panther BF Aggregator 2 LP, Sr. Sec. Credit Facilities 1st Lien Term Loan, Tranche B, 5.902%, [LIBOR12+350], 4/30/261 | 25,195,000 | 25,234,430 | ||||||
| Superior Industries International, Inc., Sr. Sec. Credit Facilities 1st Lien Term Loan, Tranche B, 6.439%, [LIBOR12+400], 5/22/241 | 30,600,619 | 29,223,591 | ||||||
| Tenneco, Inc., Sr. Sec. Credit Facilities 1st Lien Term Loan, Tranche B, 5.402%, [LIBOR4+275], 10/1/251 | 45,854,575 | 42,845,369 | ||||||
| TI Group Automotive Systems LLC, Sr. Sec. Credit Facilities 1st Lien Term Loan, Tranche B, 4.902%, [LIBOR12+275], 6/30/221 | 33,250,458 | 33,240,150 | ||||||
| 217,879,378 | ||||||||
| Information Technology—10.0% | ||||||||
| Internet Software & Services—9.3% | ||||||||
| Almonde, Inc., Sr. Sec. Credit Facilities 1st Lien Term Loan, Tranche B, 6.101%, [LIBOR4+350], 6/13/241 | 35,547,919 | 34,948,226 | ||||||
| Avaya, Inc., Sr. Sec. Credit Facilities 1st Lien Exit Term Loan, Tranche B, 6.575%, [LIBOR12+425], 12/15/241 | 181,131,085 | 174,735,347 | ||||||
| Banff Merger Sub, Inc., Sr. Sec. Credit Facilities 1st Lien Term Loan, Tranche B, 6.58%, [LIBOR4+425], 10/2/251 | 67,605,886 | 65,162,609 | ||||||
46 INVESCO OPPENHEIMER SENIOR FLOATING RATE FUND
| Principal Amount | Value | |||||||
| Internet Software & Services (Continued) | ||||||||
| Blackboard, Inc., Sr. Sec. Credit Facilities 1st Lien Term Loan, Tranche B4, 7.30%, [LIBOR4+500], 6/30/211 | $ | 9,984,098 | $ | 9,960,186 | ||||
| Colorado Buyer, Inc., Sr. Sec. Credit Facilities 1st Lien Term Loan, 5.38%, [LIBOR4+300], 5/1/241 | 35,230,823 | 33,260,187 | ||||||
| Ensono LP, Sr. Sec. Credit Facilities 1st Lien Term Loan, 7.652%, [LIBOR4+525], 6/27/251 | 4,968,387 | 4,962,201 | ||||||
| Infor US, Inc., Sr. Sec. Credit Facilities 1st Lien Term Loan, Tranche B, 5.08%, [LIBOR4+275], 2/1/221 | 47,403,445 | 47,479,528 | ||||||
| Internap Corp., Sr. Sec. Credit Facilities 1st Lien Term Loan, 0.75% PIK Rate, 8.658% Cash Rate,[LIBOR12+575], 4/6/221,3 | 22,104,522 | 19,065,150 | ||||||
| Lighthouse Network LLC, Sr. Sec. Credit Facilities 1st Lien Term Loan, 7.083%, [LIBOR4+450], 11/29/241 | 15,036,025 | 15,073,615 | ||||||
| MA FinanceCo LLC, Sr. Sec. Credit Facilities 1st Lien Term Loan: | ||||||||
| Tranche B, 4.902%, [LIBOR12+275], 6/21/241 | 12,179,189 | 12,108,184 | ||||||
| Tranche B2, 4.652%, [LIBOR4+250], 11/19/211 | 8,425,905 | 8,425,905 | ||||||
| McAfee LLC, Sr. Sec. Credit Facilities 1st Lien Term Loan, Tranche B, 6.152%, [LIBOR12+375], 9/30/241 | 52,183,924 | 52,241,848 | ||||||
| Mitchell International, Inc., Sr. Sec. Credit Facilities 1st Lien Term Loan, Tranche B, 5.652%, [LIBOR12+325], 11/29/241 | 16,081,767 | 15,306,385 | ||||||
| Plantronics, Inc., Sr. Sec. Credit Facilities 1st Lien Term Loan, 4.902%, [LIBOR12+250], 7/2/251 | 53,131,357 | 53,211,054 | ||||||
| Premiere Global Services, Inc., Sr. Sec. Credit Facilities 1st Lien Term Loan, 9.06%, [LIBOR4+650], 12/8/211 | 10,051,074 | 6,399,217 | ||||||
| Quest Software US Holdings, Inc., Sr. Sec. Credit Facilities 1st Lien Term Loan, 6.833%, [LIBOR4+425], 5/16/251 | 39,883,612 | 39,353,958 | ||||||
| Riverbed Technology, Inc., Sr. Sec. Credit Facilities 1st Lien Term Loan, Tranche B, 5.66%, [LIBOR12+325], 4/24/221 | 60,333,111 | 51,283,144 | ||||||
| Seattle SpinCo, Inc., Sr. Sec. Credit Facilities 1st Lien Term Loan, Tranche B, 4.939%, [LIBOR12+275], 6/21/241 | 82,250,573 | 81,771,052 | ||||||
| Shutterfly, Inc., Sr. Sec. Credit Facilities 1st Lien Term Loan, Tranche B2, 4.94%, [LIBOR12+275], 8/17/241 | 15,215,752 | 15,238,348 | ||||||
| SolarWinds Holdings, Inc., Sr. Sec. Credit Facilities 1st Lien Term Loan, 5.189%, [LIBOR12+300], 2/5/241 | 10,083,255 | 10,099,035 | ||||||
| Solera LLC, Sr. Sec. Credit Facilities 1st Lien Term Loan, Tranche B, 5.189%, [LIBOR12+275], 3/3/231 | 35,463,706 | 35,411,929 | ||||||
| SS&C Technologies Holdings Europe Sarl, Sr. Sec. Credit Facilities 1st Lien Term Loan, Tranche B4, 4.689%, [LIBOR4+250], 4/16/251 | 26,520,874 | 26,554,158 | ||||||
| SS&C Technologies, Inc., Sr. Sec. Credit Facilities 1st Lien Term Loan, Tranche B1, 4.689%, [LIBOR4+250], 4/16/251 | 38,953,580 | 39,002,467 | ||||||
| Sungard AS New Holdings III LLC, Sr. Sec. Credit Facilities 1st Lien Term Loan, 2.50% PIK Rate, 6.388% Cash Rate, 11/3/221,3 | 2,511,273 | 2,318,746 | ||||||
| Tempo Acquisition LLC, Sr. Sec. Credit Facilities 1st Lien Term Loan, Tranche B, 5.402%, [LIBOR12+300], 5/1/241 | 65,104,967 | 65,284,005 | ||||||
| TIBCO Software, Inc., Sec. Credit Facilities 1st Lien Term Loan, 6.39%, [LIBOR12+400], 6/30/261 | 6,539,000 | 6,559,434 | ||||||
| TTM Technologies, Inc., Sr. Sec. Credit Facilities 1st Lien Term Loan, 4.902%, [LIBOR4+250], 9/28/241 | 27,434,702 | 27,389,024 | ||||||
47 INVESCO OPPENHEIMER SENIOR FLOATING RATE FUND
SCHEDULE OF INVESTMENTSContinued
| Principal Amount | Value | |||||||
| Internet Software & Services (Continued) | ||||||||
| Veritas US, Inc., Sr. Sec. Credit Facilities 1st Lien Term Loan, Tranche B1, 6.83%-6.902%, [LIBOR4+450], 1/27/231 | $ | 60,708,730 | $ | 57,180,035 | ||||
| Xperi Corp., Sr. Sec. Credit Facilities 1st Lien Term Loan, Tranche B, 4.902%, [LIBOR12+250], 12/1/231 | 35,444,809 | 35,112,691 | ||||||
| 1,044,897,668 | ||||||||
| IT Services—0.7% | ||||||||
| Pi US Mergerco, Inc., Sr. Sec. Credit Facilities 1st Lien Term Loan, Tranche B, 5.652%, [LIBOR12+350], 1/3/251 | 82,144,657 | 81,939,295 | ||||||
|
| 81,939,295
|
| ||||||
| Materials—8.1% | ||||||||
| Chemicals—2.4% | ||||||||
| Alpha 3 BV, Sr. Sec. Credit Facilities 1st Lien Term Loan, Tranche B1, 5.33%, [LIBOR4+300], 1/31/241 | 34,084,635 | 33,415,724 | ||||||
| Consolidated Energy Finance SA, Sr. Sec. Credit Facilities 1st Lien Term Loan, Tranche B, 4.901%, [LIBOR12+250], 5/7/251,2 | 22,383,900 | 21,880,262 | ||||||
| Cyanco Intermediate Corp., Sr. Sec. Credit Facilities 1st Lien Term Loan, 5.902%, [LIBOR4+350], 3/16/251 | 22,476,382 | 22,588,764 | ||||||
| Hexicon, Inc., Sec. Credit Facilities 1st Lien Exit Term Loan, Tranche B, 5.82%, [LIBOR4+350], 7/1/261,2 | 8,645,000 | 8,645,000 | ||||||
| Momentive Performance Materials USA LLC, Sr. Sec. Credit Facilities 1st Lien Term Loan, Tranche B, 5.59%, [LIBOR4+325], 5/15/241 | 18,720,000 | 18,655,697 | ||||||
| New Arclin US Holding Corp., Sr. Sec. Credit Facilities 1st Lien Term Loan, 5.939%, [LIBOR4+350], 2/14/241 | 32,733,230 | 32,763,999 | ||||||
| OCI Partners LP, Sr. Sec. Credit Facilities 1st Lien Term Loan, Tranche B, 6.33%, [LIBOR4+425], 3/13/251,2 | 7,456,624 | 7,475,266 | ||||||
| Polar US Borrower LLC, Sr. Sec. Credit Facilities 1st Lien Term Loan, 7.063%-7.351%, [LIBOR4+475], 10/15/251,2 | 8,291,018 | 8,135,562 | ||||||
| Starfruit US Holdco LLC, Sr. Sec. Credit Facilities 1st Lien Term Loan, Tranche B, 5.61%, [LIBOR12+325], 10/1/251 | 66,164,175 | 65,158,149 | ||||||
| Tronox Finance LLC, Sr. Sec. Credit Facilities 1st Lien Term Loan, Tranche B, 5.402%, [LIBOR4+300], 9/23/241 | 47,296,467 | 47,023,093 | ||||||
| 265,741,516 | ||||||||
| Construction Materials—1.1% | ||||||||
| Pisces Midco, Inc., Sr. Sec. Credit Facilities 1st Lien Term Loan, Tranche B, 6.119%, [LIBOR4+375], 4/12/251 | 30,414,272 | 29,780,591 | ||||||
| Quikrete Holdings, Inc., Sr. Sec. Credit Facilities 1st Lien Term Loan, 5.152%, [LIBOR12+275], 11/15/231 | 85,094,501 | 84,556,703 | ||||||
| VC GB Holdings, Inc., Sr. Sec. Credit Facilities 1st Lien Term Loan, 5.402%, [LIBOR12+325], 2/28/241,2 | 12,859,553 | 12,698,809 | ||||||
| 127,036,103 | ||||||||
| Containers & Packaging—2.3% | ||||||||
| Ball Metalpack Finco LLC, Sr. Sec. Credit Facilities 1st Lien Term Loan, Tranche B, 7.022%, [LIBOR12+450], 7/31/251 | 10,063,350 | 9,943,848 | ||||||
| Berry Global Inc., Sr. Sec. Credit Facilities 1st Lien Term Loan, 4.70%, [LIBOR12+250], 7/1/261 | 20,480,000 | 20,489,625 | ||||||
48 INVESCO OPPENHEIMER SENIOR FLOATING RATE FUND
| Principal Amount | Value | |||||||
| Containers & Packaging (Continued) | ||||||||
| BWAY Corp., Sr. Sec. Credit Facilities 1st Lien Term Loan, 5.59%, [LIBOR12+325], 4/3/241 | $ | 80,897,595 | $ | 79,760,175 | ||||
| Clearwater Paper Corp., Sr. Sec. Credit Facilities 1st Lien Term Loan, Tranche B, 5.588%, [LIBOR4+325], 7/24/261,2 | 9,685,000 | 9,769,744 | ||||||
| Flex Acquisition Co., Inc., Sr. Sec. Credit Facilities 1st Lien Term Loan, 5.569%, [LIBOR4+325], 6/29/251 | 53,661,735 | 51,582,343 | ||||||
| Plastipak Holdings, Inc., Sr. Sec. Credit Facilities 1st Lien Term Loan, Tranche B, 4.91%, [LIBOR12+250], 10/14/241 | 28,278,134 | 28,260,460 | ||||||
| Pro Mach Group, Inc., Sr. Sec. Credit Facilities 1st Lien Term Loan, Tranche B, 5.144%, [LIBOR4+300], 3/7/251 | 10,530,357 | 10,282,472 | ||||||
| Reynolds Group Holdings, Inc., Sr. Sec. Credit Facilities 1st Lien Term Loan, 5.189%, [LIBOR12+300], 2/5/231 | 45,214,967 | 45,278,720 | ||||||
| 255,367,387 | ||||||||
| Metals & Mining—2.2% | ||||||||
| Covia Holdings Corp., Sr. Sec. Credit Facilities 1st Lien Term Loan, 6.313%, [LIBOR4+375], 6/1/251 | 13,656,064 | 11,675,935 | ||||||
| Murray Energy Corp., Sr. Sec. Credit Facilities 1st Lien Term Loan: | ||||||||
| Tranche B2, 9.772%, [LIBOR4+725], 10/17/221 | 268,101,424 | 171,987,064 | ||||||
| Tranche B3, 10.272%, [LIBOR12+775], 10/17/221 | 76,534,272 | 48,981,934 | ||||||
| Peabody Energy Corp., Sr. Sec. Credit Facilities 1st Lien Term Loan, Tranche B, 5.152%, [LIBOR12+275], 3/31/251 | 17,137,237 | 17,118,472 | ||||||
| 249,763,405 | ||||||||
| Paper & Forest Products—0.1% | ||||||||
| Thor Industries, Inc., Sr. Sec. Credit Facilities 1st Lien Term Loan, Tranche B, 6.188%, [LIBOR4+375], 2/1/261 | 10,181,849 | 10,080,031 | ||||||
| Telecommunication Services—5.4% | ||||||||
| Diversified Telecommunication Services—5.4% | ||||||||
| CenturyLink, Inc., Sr. Sec. Credit Facilities 1st Lien Term Loan, Tranche B, 5.152%, [LIBOR4+275], 1/31/251 | 158,083,203 | 157,303,062 | ||||||
| Cincinnati Bell, Inc., Sr. Sec. Credit Facilities 1st Lien Term Loan, Tranche B, 5.652%, [LIBOR12+325], 10/2/241 | 31,866,663 | 31,468,329 | ||||||
| Consolidated Communications, Inc., Sr. Sec. Credit Facilities 1st Lien Term Loan, Tranche B, 5.41%, [LIBOR12+300], 10/5/231 | 55,695,163 | 52,154,622 | ||||||
| Digicel International Finance Ltd, Sr. Sec. Credit Facilities 1st Lien Term Loan, Tranche B, 5.78%, [LIBOR4+325], 5/27/241 | 51,900,412 | 44,699,230 | ||||||
| Frontier Communications Corp., Sr. Sec. Credit Facilities 1st Lien Term Loan, Tranche B, 6.16%, [LIBOR12+375], 6/15/241 | 32,048,677 | 31,731,555 | ||||||
| Fusion Connect Inc., Sr. Sec. Credit Debtor in Possession Facilities 1st Lien Term Loan, 12.36%-12.38%, [LIBOR12+1,000], 10/7/191,2 | 8,056,960 | 7,976,390 | ||||||
| Fusion Connect, Inc., Sr. Sec. Credit Facilities 1st Lien Term Loan, 11.836% PIK Rate, [LIBOR4+750], 5/4/231,2,3,5 | 66,248,937 | 44,718,033 | ||||||
| Global Tel*Link Corp., Sr. Sec. Credit Facilities 2nd Lien Term Loan, 10.689%, [LIBOR4+825], 11/29/261 | 18,000,000 | 17,375,670 | ||||||
| IPC Corp., Sr. Sec. Credit Facilities 1st Lien Term Loan, Tranche B, 7.09%, [LIBOR4+450], 8/6/211 | 29,937,875 | 25,921,110 | ||||||
49 INVESCO OPPENHEIMER SENIOR FLOATING RATE FUND
SCHEDULE OF INVESTMENTSContinued
| Principal Amount | Value | |||||||
| Diversified Telecommunication Services (Continued) | ||||||||
| IPC Corp., Sr. Sec. Credit Facilities 2nd Lien Term Loan, 12.09%, [LIBOR4+950], 2/4/221 | $ | 27,925,000 | $ | 8,028,437 | ||||
| MLN US Holdco LLC, Sr. Sec. Credit Facilities 1st Lien Term Loan, 7.003%, [LIBOR12+450], 11/30/251 | 1,000,000 | 976,425 | ||||||
| NeuStar, Inc., Sr. Sec. Credit Facilities 1st Lien Term Loan, Tranche B4, 5.902%, [LIBOR12+350], 8/8/241 | 31,552,353 | 30,743,982 | ||||||
| Sprint Communications, Inc., Sr. Sec. Credit Facilities 1st Lien Term Loan, Tranche B, 5.00%, [LIBOR12+250], 2/2/241 | 134,202,864 | 134,085,437 | ||||||
| Windstream Services LLC, Sr. Sec. Credit Facilities Term Loan, Tranche B6, 10.50%, [PRIME4+500], 3/29/211,5 | 23,680,082 | 24,355,557 | ||||||
| 611,537,839 | ||||||||
| Utilities—2.1% | ||||||||
| Electric Utilities—2.1% | ||||||||
| Brookfield WEC Holdings, Inc., Sr. Sec. Credit Facilities 1st Lien Term Loan, 5.939%, [LIBOR4+375], 8/1/251 | 17,609,156 | 17,686,196 | ||||||
| Calpine Construction Finance Co. LP, Sr. Sec. Credit Facilities 1st Lien Term Loan, 4.939%, [LIBOR12+250], 1/15/251 | 13,390,075 | 13,386,728 | ||||||
| Calpine Corp., Sr. Sec. Credit Facilities 1st Lien Term Loan: | ||||||||
| Tranche B5, 4.83%, [LIBOR4+250], 1/15/241 | 11,241,910 | 11,267,879 | ||||||
| Tranche B7, 4.83%, [LIBOR4+250], 5/31/231 | 1,282,342 | 1,285,195 | ||||||
| EFS Cogen Holdings I LLC, Sr. Sec. Credit Facilities 1st Lien Term Loan, Tranche B, 5.86%, [LIBOR4+325], 6/28/231 | 31,976,391 | 31,999,254 | ||||||
| Exgen Renewables IV LLC, Sr. Sec. Credit Facilities 1st Lien Term Loan, Tranche B, 5.53%, [LIBOR4+300], 11/28/241 | 4,388,214 | 4,254,746 | ||||||
| Frontera Generation Holdings LLC, Sr. Sec. Credit Facilities 1st Lien Term Loan, Tranche B, 6.662%, [LIBOR12+425], 5/2/251 | 43,589,229 | 42,635,932 | ||||||
| Kestrel Acquisition LLC., Sr. Sec. Credit Facilities 1st Lien Term Loan, Tranche B, 6.66%, [LIBOR12+425], 6/2/251 | 22,374,000 | 21,973,170 | ||||||
| Lightstone Holdco LLC, Sr. Sec. Credit Facilities 1st Lien Term Loan: | ||||||||
| Tranche B, 6.189%, [LIBOR12+375], 1/30/241 | 41,740,112 | 41,195,195 | ||||||
| Tranche C, 6.189%, [LIBOR12+375], 1/30/241 | 2,347,323 | 2,316,679 | ||||||
| MRP Generation Holdings LLC, Sr. Sec. Credit Facilities 1st Lien Term Loan, Tranche B, 9.33%, [LIBOR4+700], 10/18/221,2 | 9,131,775 | 9,086,116 | ||||||
| Sandy Creek Energy Associates LP, Sr. Sec. Credit Facilities 1st Lien Term Loan, Tranche B, 6.601%, [LIBOR4+400], 11/9/201 | 42,952,812 | 38,895,275 | ||||||
| 235,982,365 | ||||||||
| Total Corporate Loans (Cost $10,409,671,292) | 9,880,698,758 | |||||||
| Corporate Bonds and Notes—2.4% | ||||||||
| Erickson Air-Crane, Inc., 6.00% Sub. Nts., 11/2/202,5 | 1,803,397 | — | ||||||
| iHeartCommunications, Inc., 8.375% Sr. Unsec. Nts., 5/1/274 | 39,273,475 | 41,531,700 | ||||||
| Peabody Energy Corp., 6.375% Sr. Sec. Nts., 3/31/257 | 57,120,000 | 58,976,400 | ||||||
| Tesla, Inc., 5.30% Sr. Unsec. Nts., 8/15/257 | 158,820,000 | 139,364,550 | ||||||
| Transocean Sentry Ltd., 5.375% Sr. Sec. Nts., 5/15/237 | 12,220,000 | 12,267,047 | ||||||
| United States Steel Corp., 6.25% Sr. Unsec. Nts., 3/15/26 | 22,830,000 | 20,917,987 | ||||||
| Total Corporate Bonds and Notes (Cost $277,510,181) | 273,057,684 | |||||||
50 INVESCO OPPENHEIMER SENIOR FLOATING RATE FUND
| Shares | Value | |||||||
| Common Stocks—4.1% | ||||||||
| Arch Coal, Inc., Cl. A4 | 3,019,769 | $ | 269,242,604 | |||||
| Ascent Resources - Marcellus LLC, Cl. A4,8 | 5,777,075 | 14,731,541 | ||||||
| Avaya Holdings Corp.8 | 4,425,100 | 53,278,204 | ||||||
| Caesars Entertainment Corp.8 | 100 | 1,184 | ||||||
| Catalina Marketing Corp. (Pacifico, Inc.)2,8 | 243,609 | 1,278,947 | ||||||
| Clear Channel Outdoor Holdings, Inc., Cl. A8 | 11,111,684 | 33,668,403 | ||||||
| Everyware Global, Inc.4,8 | 1,397,654 | 1,712,126 | ||||||
| Gymboree Corp. (The)2,4 | 635,688 | 476,766 | ||||||
| Gymboree Holding Corp.2,4 | 1,798,615 | 1,799 | ||||||
| Harvey Gulf International Marine LLC2,8 | 116,269 | 1,744,035 | ||||||
| iHeartMedia, Inc.2,4,8 | 247,990 | 3,611,478 | ||||||
| iHeartMedia, Inc., Cl. A4,8 | 4,725,378 | 70,691,655 | ||||||
| Larchmont Resources LLC2,4,8 | 8,017 | 2,004,322 | ||||||
| Millennium Corporate Claim Litigation Trust2,4,8 | 70,485 | — | ||||||
| Millennium Lender Claim Litigation Trust2,4,8 | 140,969 | — | ||||||
| New Millennium Holdco, Inc.2,4,8 | 1,431,369 | 90,892 | ||||||
| Quicksilver Resources, Inc.2,4,8 | 145,955,000 | — | ||||||
| Sabine Oil2,4 | 17,931 | 519,999 | ||||||
| Sunguard Equity2,8 | 37,093 | 1,020,058 | ||||||
| Templar Energy, Cl. A2,4,8 | 1,799,429 | 1,799,429 | ||||||
| Total Common Stocks (Cost $643,029,837) | 455,873,442 | |||||||
| Units | ||||||||
| Rights, Warrants and Certificates—0.0% | ||||||||
| Ascent Resources - Marcellus LLC Wts., Exp. 4/3/232,4,8 | 1,495,722 | 44,872 | ||||||
| Media General, Inc. Rts., Exp. 12/31/492,4,8,9 | 6,554,344 | 380,151 | ||||||
| Sabine Oil Tranche 1 Wts., Strike Price $4.49, Exp. 8/11/262,4,8 | 55,832 | 55,832 | ||||||
| Sabine Oil Tranche 2 Wts., Strike Price $2.72, Exp. 8/11/262,4,8 | 11,734 | 11,734 | ||||||
| Total Rights, Warrants and Certificates (Cost $6,003,562) | 492,589 | |||||||
| Shares | Value | |||||||
| Investment Company—4.8% | ||||||||
| Invesco Oppenheimer Institutional Government Money Market Fund, 2.23%10(Cost $537,649,475) | 537,649,475 | $ | 537,649,475 | |||||
| Total Investments, at Value (Cost $11,873,864,347) | 99.1 | % | 11,147,771,948 | |||||
| Net Other Assets (Liabilities) | 0.9 | 104,451,553 | ||||||
| Net Assets | 100.0 | % | $ | 11,252,223,501 | ||||
Footnotes to Schedule of Investments
*Variable rate senior loan interests often require prepayments from excess cash flow or permit the borrower to repay at its election. The degree to which borrowers repay, whether as a contractual requirement or at their election, cannot be predicted with accuracy. As a result, the actual remaining maturity may be substantially less than the stated maturities shown. However, it is anticipated that the variable rate senior loan interests will have an expected average life of three to five years.
1. Variable rate senior loan interests are, at present, not readily marketable, not registered under the Securities Act of 1933, as amended (the “1933 Act”), and may be subject to contractual and legal restrictions on sale. Variable rate senior loan interests in the Fund’s portfolio generally have variable rates which adjust to a base, such as the London Interbank Offered Rate (“LIBOR”), on set dates, typically every 30 days but not greater than one year; and/or have interest rates that float at a margin above a widely recognized base lending rate such as the Prime Rate of a designated U.S. bank.
51 INVESCO OPPENHEIMER SENIOR FLOATING RATE FUND
SCHEDULE OF INVESTMENTSContinued
Footnotes to Schedule of Investments (Continued)
2. The value of this security was determined using significant unobservable inputs. See Note 3 of the accompanying Notes.
3. Interest or dividend is paid-in-kind, when applicable.
4. Is or was an affiliate, as defined in the Investment Company Act of 1940, as amended, at or during the reporting period, by virtue of the Fund owning at least 5% of the voting securities of the issuer or as a result of the Fund and the issuer having the same investment adviser. Transactions during the reporting period in which the issuer was an affiliate are as follows:
Shares / Principal July 31, 2018 | Gross Additions | Gross Reductions | Shares / Principal July 31, 2019 | |||||||||||||
| ||||||||||||||||
| Corporate Loans | ||||||||||||||||
| Energy Equipment & Services | ||||||||||||||||
| Ascent Resources - Marcellus LLC, Sr. Sec. Credit Facilities 1st Lien Term Loan, 8.825% [LIBOR12+650], 3/30/23 | 8,041,514 | — | — | 8,041,514 | ||||||||||||
| Larchmont Resources LLC, Sr. Sec. Credit Facilities 1st Lien Term Loan, 9.61% [LIBOR4+700], 8/7/20 | 7,049,908 | 208,564 | 1,228,765 | 6,029,707 | ||||||||||||
| Media | ||||||||||||||||
| iHeartCommunications, Inc, Sr. Sec. Credit Facilities 1st Lien Exit Term Loan, 6.579% [LIBOR12+400], 5/1/26 | — | 116,914,412 | 9,995,000 | 106,919,412 | ||||||||||||
| Corporate Bonds and Notes | ||||||||||||||||
| iHeartCommunications, Inc., 8.375% Sr. Unsec. Nts., 5/1/27 | — | 48,435,971 | 9,162,496 | 39,273,475 | ||||||||||||
| Common Stocks | ||||||||||||||||
| Arch Coal, Inc., Cl. A | 2,961,034 | 418,815 | 360,080 | 3,019,769 | ||||||||||||
| Ascent Resources - Marcellus LLC, Cl. A | 5,777,075 | — | — | 5,777,075 | ||||||||||||
| Everyware Global, Inc. | 1,397,654 | — | — | 1,397,654 | ||||||||||||
| Gymboree Corp. (The)a | 635,688 | — | — | 635,688 | ||||||||||||
| Gymboree Holding Corp.a | 1,798,615 | — | — | 1,798,615 | ||||||||||||
| iHeartMedia, Inc. | — | 247,990 | — | 247,990 | ||||||||||||
| iHeartMedia, Inc., Cl. A | — | 4,725,378 | — | 4,725,378 | ||||||||||||
| J.G. Wentworth Co., Cl. A | 2,944,486 | 47,120 | 2,991,606 | — | ||||||||||||
| Larchmont Resources LLC | 8,017 | — | — | 8,017 | ||||||||||||
| Millennium Corporate Claim Litigation Trust | 70,485 | — | — | 70,485 | ||||||||||||
| Millennium Lender Claim Litigation Trust | 140,969 | — | — | 140,969 | ||||||||||||
| New Millennium Holdco, Inc. | 1,431,369 | — | — | 1,431,369 | ||||||||||||
| Quicksilver Resources, Inc. | 145,955,000 | — | — | 145,955,000 | ||||||||||||
| Sabine Oil | 17,596 | 335 | b | — | 17,931 | |||||||||||
| Templar Energy, Cl. A | 1,799,429 | — | — | 1,799,429 | ||||||||||||
| Rights, Warrants and Certificates | ||||||||||||||||
| Ascent Resources - Marcellus LLC Wts., Exp. 4/3/23 | 1,495,722 | — | — | 1,495,722 | ||||||||||||
| Media General, Inc. Rts., Exp. 12/31/49 | 6,554,344 | — | — | 6,554,344 | ||||||||||||
52 INVESCO OPPENHEIMER SENIOR FLOATING RATE FUND
Footnotes to Schedule of Investments (Continued)
Shares / Principal July 31, 2018 | Gross Additions | Gross Reductions | Shares / Principal July 31, 2019 | |||||||||||||
| ||||||||||||||||
| Sabine Oil Tranche 1 Wts., Strike Price $4.49, Exp. 8/11/26 | 55,793 | 39 | b | — | 55,832 | |||||||||||
| Sabine Oil Tranche 2 Wts., Strike Price $2.72, Exp. 8/11/26 | 9,937 | 1,797 | b | — | 11,734 | |||||||||||
| Value | Income | Realized Gain (Loss) | Change in Gain (Loss) | |||||||||||||
| ||||||||||||||||
| Corporate Loans | ||||||||||||||||
| Energy Equipment & Services | ||||||||||||||||
| Ascent Resources - Marcellus LLC, Sr. Sec. Credit Facilities 1st Lien Term Loan, 8.825% [LIBOR12+650], 3/30/23 | $ | 7,840,476 | $ | 722,480 | $ | — | $ | (233,204) | ||||||||
| Larchmont Resources LLC, Sr. Sec. Credit Facilities 1st Lien Term Loan, 9.61% [LIBOR4+700], 8/7/20 | 5,682,999 | 726,978 | c | 18,582 | (353,009) | |||||||||||
| Media | ||||||||||||||||
| iHeartCommunications, Inc, Sr. Sec. Credit Facilities 1st Lien Exit Term Loan, 6.579% [LIBOR12+400], 5/1/26 | 107,854,956 | 1,913,199 | (26,722) | 251,598 | ||||||||||||
| Corporate Bonds and Notes | ||||||||||||||||
| iHeartCommunications, Inc., 8.375% Sr. Unsec. Nts., 5/1/27 | 41,531,700 | 856,386 | 29,745 | 424,873 | ||||||||||||
| Common Stocks | ||||||||||||||||
| Arch Coal, Inc., Cl. A | 269,242,604 | 5,187,726 | 18,680,019 | (3,222,917) | ||||||||||||
| Ascent Resources - Marcellus LLC, Cl. A | 14,731,541 | — | — | (4,477,233) | ||||||||||||
| Everyware Global, Inc. | 1,712,126 | — | — | (11,216,174) | ||||||||||||
| Gymboree Corp. (The)a | —d | 14,987 | — | (7,628,256) | ||||||||||||
| Gymboree Holding Corp.a | —d | 42,403 | — | (22,930,542) | ||||||||||||
| iHeartMedia, Inc. | 3,611,478 | — | — | (366,282) | ||||||||||||
| iHeartMedia, Inc., Cl. A | 70,691,655 | — | — | (17,318,510) | ||||||||||||
| J.G. Wentworth Co., Cl. A | — | — | (14,813,606) | 18,565,335 | ||||||||||||
| Larchmont Resources LLC | 2,004,322 | — | — | (200,432) | ||||||||||||
| Millennium Corporate Claim Litigation Trust | — | — | — | (705) | ||||||||||||
| Millennium Lender Claim Litigation Trust | — | — | — | (1,410) | ||||||||||||
| New Millennium Holdco, Inc. | 90,892 | — | — | 76,578 | ||||||||||||
| Quicksilver Resources, Inc. | — | — | — | (1,936,065) | ||||||||||||
| Sabine Oil | 519,999 | 717,240 | 1,390 | (378,787) | ||||||||||||
| Templar Energy, Cl. A | 1,799,429 | — | — | (89,971) | ||||||||||||
| Rights, Warrants and Certificates | ||||||||||||||||
| Ascent Resources - Marcellus LLC Wts., Exp. 4/3/23 | 44,872 | — | — | — | ||||||||||||
53 INVESCO OPPENHEIMER SENIOR FLOATING RATE FUND
SCHEDULE OF INVESTMENTSContinued
Footnotes to Schedule of Investments (Continued)
| Value | Income | Realized Gain (Loss) | Change in Gain (Loss) | |||||||||||||
| ||||||||||||||||
| Media General, Inc. Rts., Exp. 12/31/49 | $ | 380,151 | $ | — | $ | — | $ | (13,109) | ||||||||
| Sabine Oil Tranche 1 Wts., Strike Price $ 4.49, Exp. 8/11/26 | 55,832 | — | 120 | (306,944) | ||||||||||||
| Sabine Oil Tranche 2 Wts., Strike Price $ 2.72, Exp. 8/11/26 | 11,734 | — | — | (42,920) | ||||||||||||
|
| |||||||||||||||
| Total | $ | 527,806,766 | $ | 10,181,399 | $ | 3,889,528 | $ | (51,398,086) | ||||||||
|
| |||||||||||||||
a. No longer an affiliate as July 31, 2019.
b. All or a portion is the result of a corporate action.
c. All or a portion of the transactions were the result of non-cash interest or dividends.
d. The security is no longer an affiliated, therefore, the value has been excluded from this table.
5. This security is not accruing income because its issuer has missed or is expected to miss interest and/or principal payments. The rate shown is the contractual interest rate.
6. All or a portion of this holding is subject to unfunded loan commitments. The state interest rate reflects the weighted average of the reference rate and spread for the funded portion, if any, and the commitment fees on the portion of the loan that is unfunded. See Note 9.
7. Security purchased or received in a transaction exempt from registration under the Securities Act of 1933, as amended (the “1933 Act”). The security may be resold pursuant to an exemption from registration under the 1933 Act, typically to qualified institutional buyers. The aggregate value of these securities at July 31, 2019 was $210,607,997, which represented 1.87% of the Fund’s Net Assets.
8. Non-income producing security.
9. Security received as the result of issuer reorganization.
10. The money market fund and the Fund are affiliated by having the same investment adviser. The rate shown is the 7-day SEC standardized yield as of July 31, 2019.
Glossary:
| Definitions | ||
| LIBOR4 | London Interbank Offered Rate-Quarterly | |
| LIBOR6 | London Interbank Offered Rate-Bi-Monthly | |
| LIBOR12 | London Interbank Offered Rate-Monthly | |
| PRIME4 | United States Prime Rate-Quarterly | |
| PRIME12 | United States Prime Rate-Monthly |
See accompanying Notes to Financial Statements.
54 INVESCO OPPENHEIMER SENIOR FLOATING RATE FUND
STATEMENT OF ASSETS AND LIABILITIES
August 31, 2019
| July 31, 2019
| |||||||
| Assets | ||||||||
| Investments, at value—see accompanying schedule of investments: | ||||||||
| Unaffiliated companies (cost $10,201,006,479 and $10,718,701,702) | $ | 9,451,601,085 | $ | 10,082,315,707 | ||||
Affiliated companies (cost $920,809,565 and $1,155,162,645) | 776,908,567 | 1,065,456,241 | ||||||
|
|
| ||||||
| 10,228,509,652 | 11,147,771,948 | |||||||
Cash | 73,654,510 | 44,917,222 | ||||||
Receivables and other assets: | ||||||||
Investments sold | 275,039,470 | 329,989,033 | ||||||
Interest and dividends | 34,972,206 | 41,584,692 | ||||||
Shares of beneficial interest sold | 6,034,646 | 8,038,053 | ||||||
Other | 2,829,060 | 3,235,085 | ||||||
|
|
| ||||||
Total assets | 10,621,039,544 | 11,575,536,033 | ||||||
| Liabilities | ||||||||
Payables and other liabilities: | ||||||||
Investments purchased | 128,245,756 | 253,104,480 | ||||||
Shares of beneficial interest redeemed | 57,014,769 | 53,779,872 | ||||||
Dividends | 5,272,944 | 5,882,689 | ||||||
Transfer and shareholder servicing agent fees | 2,719,765 | 2,156,333 | ||||||
Distribution and service plan fees | 2,103,806 | 2,221,960 | ||||||
Trustees’ compensation | 556,491 | 541,675 | ||||||
Advisory fees | 333,595 | 183,712 | ||||||
Shareholder communications | 261,376 | 187,250 | ||||||
Administration fees | 8,055 | 311 | ||||||
Other | 2,366,767 | 5,254,250 | ||||||
|
|
| ||||||
Total liabilities | 198,883,324 | 323,312,532 | ||||||
Net Assets | $ | 10,422,156,220 | $ | 11,252,223,501 | ||||
|
|
| ||||||
| Composition of Net Assets | ||||||||
Shares of beneficial interest | $ | 12,125,243,995 | $ | 12,752,845,214 | ||||
Total accumulated loss | (1,703,087,775 | ) | (1,500,621,713 | ) | ||||
|
|
| ||||||
Net Assets | $ | 10,422,156,220 | $ | 11,252,223,501 | ||||
|
|
|
|
|
| |||
55 INVESCO OPPENHEIMER SENIOR FLOATING RATE FUND
STATEMENT OF ASSETS AND LIABILITIESContinued
August 31, 2019
| July 31, 2019
| |||||||
| Net Asset Value Per Share | ||||||||
| Class A Shares: | ||||||||
| Net asset value and redemption price per share (based on net assets and shares of beneficial interest outstanding of $2,962,351,822 and 388,451,555 at August 31, 2019 and $3,104,335,566 and 399,663,833 at July 31, 2019) | $7.63 | $7.77 | ||||||
| Maximum offering price per share (net asset value plus sales charge of 3.25% of offering price) | $7.89 | $8.03 | ||||||
| Class C Shares: | ||||||||
| Net asset value, redemption price (excludes applicable contingent deferred sales charge) and offering price per share (based on net assets and shares of beneficial interest outstanding of $1,640,439,744 and 214,850,966 at August 31, 2019 and $1,734,118,379 and 222,988,210 at July 31, 2019) | $7.64 | $7.78 | ||||||
| Class R Shares: | ||||||||
| Net asset value, redemption price and offering price per share (based on net assets and shares of beneficial interest outstanding of $87,586,428 and 11,489,154 at August 31, 2019 and $91,419,394 and 11,773,659 at July 31, 2019) | $7.62 | $7.76 | ||||||
| Class Y Shares: | ||||||||
| Net asset value, redemption price and offering price per share (based on net assets and shares of beneficial interest outstanding of $4,734,606,571 and 622,133,719 at August 31, 2019 and $5,266,307,970 and 679,415,686 at July 31, 2019) | $7.61 | $7.75 | ||||||
| Class R5 Shares: | ||||||||
| Net asset value, redemption price and offering price per share (based on net assets and shares of beneficial interest outstanding of $9,695 and 1,271 at August 31, 2019 and $9,874 and 1,271 at July 31, 2019) | $7.63 | $7.77 | ||||||
| Class R6 Shares: | ||||||||
| Net asset value, redemption price and offering price per share (based on net assets and shares of beneficial interest outstanding of $997,161,960 and 131,046,827 at August 31, 2019 and $1,056,032,318 and 136,259,237 at July 31, 2019) | $7.61 | $7.75 | ||||||
See accompanying Notes to Financial Statements.
56 INVESCO OPPENHEIMER SENIOR FLOATING RATE FUND
OPERATIONS
One Month Ended
| Year Ended
| |||||||
| Investment Income | ||||||||
Interest: | ||||||||
Unaffiliated companies | $ | 54,964,097 | $ | 831,784,513 | ||||
Affiliated companies | 786,010 | 4,219,043 | ||||||
Dividend — affiliated companies | 2,236,306 | 17,099,947 | ||||||
Other income affiliated companies | — | 57,390 | ||||||
Other income | 220,854 | 2,934,494 | ||||||
Total investment income | 58,207,267 | 856,095,387 | ||||||
| Expenses | ||||||||
Advisory fees | 5,335,479 | 80,822,932 | ||||||
Administration fees | 128,827 | 136,811 | ||||||
Distribution and service plan fees: | ||||||||
Class A | 639,651 | 8,501,108 | ||||||
Class C | 1,426,397 | 22,496,044 | ||||||
Class R | 37,790 | 471,774 | ||||||
Transfer and shareholder servicing agent fees: | ||||||||
Class A | 294,240 | 4,655,540 | ||||||
Class C | 164,036 | 3,065,166 | ||||||
Class R | 8,692 | 128,362 | ||||||
Class Y | 488,564 | 9,222,363 | ||||||
Class R5 | — | 1 | ||||||
Class R6 | 6,072 | 325,256 | ||||||
Shareholder communications: | ||||||||
Class A | 20,620 | 86,869 | ||||||
Class C | 11,505 | 48,642 | ||||||
Class R | 609 | 2,479 | ||||||
Class Y | 34,394 | 156,715 | ||||||
Class R6 | 6,998 | 25,222 | ||||||
Borrowing fees | 980,995 | 13,255,134 | ||||||
Custodian fees and expenses | 237,460 | 3,009,910 | ||||||
Trustees’ compensation | 9,732 | 321,112 | ||||||
Interest expense on borrowings | — | 251,754 | ||||||
Other | 116,419 | 1,019,863 | ||||||
Total expenses | 9,948,480 | 148,003,057 | ||||||
Less waivers and reimbursements of expenses | (114,093) | (516,240 | ) | |||||
Net expenses | 9,834,387 | 147,486,817 | ||||||
| Net Investment Income | 48,372,880 | 708,608,570 | ||||||
57 INVESCO OPPENHEIMER SENIOR FLOATING RATE FUND
OPERATIONSContinued
One Month Ended
| Year Ended
| |||||||
| Realized and Unrealized Gain (Loss) | ||||||||
Net realized gain (loss) on investment transactions in: | ||||||||
Unaffiliated companies | $ | (36,708,025) | $ | (111,517,131 | ) | |||
Affiliated companies | 738,467 | 3,889,528 | ||||||
Net realized loss | (35,969,558) | (107,627,603 | ) | |||||
Net change in unrealized appreciation/(depreciation) on investment transactions in: | ||||||||
Unaffiliated companies | (122,457,362) | (509,956,345 | ) | |||||
Affiliated companies | (44,756,631) | (51,398,086 | ) | |||||
Net change in unrealized appreciation/(depreciation) | (167,213,993) | (561,354,431 | ) | |||||
| Net Increase (Decrease) in Net Assets Resulting from Operations | $ | (154,810,671) | $ | 39,626,536 | ||||
See accompanying Notes to Financial Statements.
58 INVESCO OPPENHEIMER SENIOR FLOATING RATE FUND
STATEMENT OF CHANGES IN NET ASSETS
| One Month Ended August 31, 2019 | Year Ended July 31, 2019 | Year Ended July 31, 2018 | ||||||||||
| Operations | ||||||||||||
Net investment income | $ | 48,372,880 | $ | 708,608,570 | $ | 666,877,947 | ||||||
Net realized gain (loss) | (35,969,558 | ) | (107,627,603 | ) | (76,789,287 | ) | ||||||
Net change in unrealized appreciation/(depreciation) | (167,213,993 | ) | (561,354,431 | ) | (13,498,727 | ) | ||||||
Net increase (decrease) in net assets resulting from operations | (154,810,671 | ) | 39,626,536 | 576,589,933 | ||||||||
| Dividends and/or Distributions to Shareholders1 | ||||||||||||
Distributions to shareholders from distributable earnings: | ||||||||||||
Class A | (13,230,205 | ) | (173,957,910 | ) | (162,453,297 | ) | ||||||
Class B | — | — | (240,866 | ) | ||||||||
Class C | (6,303,802 | ) | (97,522,785 | ) | (88,603,441 | ) | ||||||
Class R | (371,738 | ) | (4,594,642 | ) | (2,901,255 | ) | ||||||
Class Y | (22,956,925 | ) | (360,279,687 | ) | (300,110,636 | ) | ||||||
Class R5 | (45 | ) | (99 | ) | — | |||||||
Class R6 | (4,792,676 | ) | (67,164,393 | ) | (53,268,033 | ) | ||||||
Total distributions from distributable earnings | (47,655,391 | ) | (703,519,516 | ) | (607,577,528 | ) | ||||||
| Beneficial Interest Transactions | ||||||||||||
Net increase (decrease) in net assets resulting from beneficial interest transactions: | ||||||||||||
Class A | (85,901,446 | ) | (630,794,380 | ) | (123,393,923 | ) | ||||||
Class B | — | — | (14,385,390 | ) | ||||||||
Class C | (62,354,730 | ) | (658,765,768 | ) | (306,825,616 | ) | ||||||
Class R | (2,179,551 | ) | 7,563,685 | 22,745,659 | ||||||||
Class Y | (437,348,597 | ) | (1,896,436,154 | ) | 793,404,794 | |||||||
Class R5 | — | 10,000 | — | |||||||||
Class R6 | (39,816,895 | ) | (258,217,849 | ) | 275,932,060 | |||||||
Total beneficial interest transactions | (627,601,219 | ) | (3,436,640,466 | ) | 647,477,584 | |||||||
| Net Assets | ||||||||||||
Total increase (decrease) | (830,067,281 | ) | (4,100,533,446 | ) | 616,489,989 | |||||||
Beginning of period | 11,252,223,501 | 15,352,756,947 | 14,736,266,958 | |||||||||
End of period | $ | 10,422,156,220 | $ | 11,252,223,501 | $ | 15,352,756,947 | ||||||
1.The Securities Exchange Commission eliminated the requirement to disclose the distribution components separately, except for tax return of capital. For the year ended July 31, 2018, distributions to shareholders from distributable earnings consisted of distributions from net investment income.
See accompanying Notes to Financial Statements.
59 INVESCO OPPENHEIMER SENIOR FLOATING RATE FUND
| Class A | One Month Ended August 31, | Year Ended July 31, 2019 | Year Ended July 31, 2018 | Year Ended July 31, 2017 | Year Ended July 31, 2016 | Year Ended July 31, 2015 | ||||||||||||||||||
| Per Share Operating Data | ||||||||||||||||||||||||
| Net asset value, beginning of period | $7.77 | $8.13 | $8.15 | $7.85 | $8.08 | $8.40 | ||||||||||||||||||
| Income (loss) from investment operations: | ||||||||||||||||||||||||
| Net investment income1 | 0.03 | 0.41 | 0.37 | 0.37 | 0.37 | 0.36 | ||||||||||||||||||
| Net realized and unrealized gain (loss) | (0.14) | (0.37) | (0.05) | 0.27 | (0.21) | (0.32) | ||||||||||||||||||
| Total from investment operations | (0.11) | 0.04 | 0.32 | 0.64 | 0.16 | 0.04 | ||||||||||||||||||
| Dividends and/or distributions to shareholders: | ||||||||||||||||||||||||
| Dividends from net investment income | (0.03) | (0.40) | (0.34) | (0.34) | (0.39) | (0.36) | ||||||||||||||||||
| Net asset value, end of period | $7.63 | $7.77 | $8.13 | $8.15 | $7.85 | $8.08 | ||||||||||||||||||
| Total Return, at Net Asset Value2 | (1.37)% | 0.58% | 3.96% | 8.30% | 2.12% | 0.51% | ||||||||||||||||||
| Ratios/Supplemental Data | ||||||||||||||||||||||||
| Net assets, end of period (in thousands) | $2,962,352 | $3,104,336 | $3,899,006 | $4,030,774 | $3,883,693 | $5,065,599 | ||||||||||||||||||
| Average net assets (in thousands) | $3,011,946 | $3,419,069 | $3,932,849 | $4,213,255 | $4,268,537 | $5,637,843 | ||||||||||||||||||
| Ratios to average net assets:3 | ||||||||||||||||||||||||
| Net investment income | 5.25% | 5.12% | 4.53% | 4.63% | 4.83% | 4.41% | ||||||||||||||||||
| Expenses excluding specific expenses listed below | 1.01% | 1.00% | 0.99% | 0.97% | 0.97% | 0.97% | ||||||||||||||||||
| Interest and fees from borrowings | 0.11% | 0.10% | 0.13% | 0.15% | 0.14% | 0.11% | ||||||||||||||||||
| Total expenses4 | 1.12% | 1.10% | 1.12% | 1.12% | 1.11% | 1.08% | ||||||||||||||||||
| Expenses after payments, waivers and/or reimbursements and reduction to custodian expenses | 1.11% | 1.10%5 | 1.11% | 1.11% | 1.11%5 | 1.08%5 | ||||||||||||||||||
Portfolio turnover rate6 | 1% | 25% | 66% | 77% | 28% | 39% | ||||||||||||||||||
60 INVESCO OPPENHEIMER SENIOR FLOATING RATE FUND
1. Per share amounts calculated based on the average shares outstanding during the period.
2. Assumes an initial investment on the business day before the first day of the fiscal period, with all dividends and distributions reinvested in additional shares on the reinvestment date, and redemption at the net asset value calculated on the last business day of the fiscal period. Sales charges are not reflected in the total returns. Total returns are not annualized for periods less than one full year. Returns do not reflect the deduction of taxes that a shareholder would pay on fund distributions or the redemption of fund shares.
3. Annualized for periods less than one full year.
4. Total expenses including indirect expenses from affiliated fund fees and expenses were as follows:
| One Month Ended August 31, 2019 | 1.12 | % | ||||
| Year Ended July 31, 2019 | 1.10 | % | ||||
| Year Ended July 31, 2018 | 1.13 | % | ||||
| Year Ended July 31, 2017 | 1.13 | % | ||||
| Year Ended July 31, 2016 | 1.11 | % | ||||
| Year Ended July 31, 2015 | 1.08 | % |
5. Waiver was less than 0.005%.
6. Portfolio turnover is calculated at the fund level and is not annualized for periods less than one year, if applicable.
See accompanying Notes to Financial Statements.
61 INVESCO OPPENHEIMER SENIOR FLOATING RATE FUND
FINANCIAL HIGHLIGHTSContinued
| Class C | One Month Ended August 31, 2019 | Year Ended July 31, 2019 | Year Ended July 31, 2018 | Year Ended July 31, 2017 | Year Ended July 31, 2016 | Year Ended July 31, 2015 | ||||||||||||||||||
| Per Share Operating Data | ||||||||||||||||||||||||
| Net asset value, beginning of period | $7.78 | $8.14 | $8.16 | $7.86 | $8.09 | $8.40 | ||||||||||||||||||
| Income (loss) from investment operations: | ||||||||||||||||||||||||
| Net investment income1 | 0.03 | 0.35 | 0.31 | 0.32 | 0.32 | 0.30 | ||||||||||||||||||
| Net realized and unrealized gain (loss) | (0.14) | (0.36) | (0.06) | 0.26 | (0.22) | (0.31) | ||||||||||||||||||
| Total from investment operations | (0.11) | (0.01) | 0.25 | 0.58 | 0.10 | (0.01) | ||||||||||||||||||
| Dividends and/or distributions to shareholders: | ||||||||||||||||||||||||
| Dividends from net investment income | (0.03) | (0.35) | (0.27) | (0.28) | (0.33) | (0.30) | ||||||||||||||||||
| Net asset value, end of period | $7.64 | $7.78 | $8.14 | $8.16 | $7.86 | $8.09 | ||||||||||||||||||
| Total Return, at Net Asset Value2 | (1.43)% | (0.17)% | 3.18% | 7.48% | 1.37% | (0.12)% | ||||||||||||||||||
| Ratios/Supplemental Data | ||||||||||||||||||||||||
| Net assets, end of period (in thousands) | $1,640,440 | $1,734,118 | $2,497,209 | $2,809,704 | $2,833,205 | $3,537,526 | ||||||||||||||||||
| Average net assets (in thousands) | $1,678,491 | $2,247,989 | $2,618,471 | $2,877,196 | $3,063,608 | $3,843,616 | ||||||||||||||||||
| Ratios to average net assets:3 | ||||||||||||||||||||||||
| Net investment income | 4.50% | 4.37% | 3.78% | 3.89% | 4.09% | 3.65% | ||||||||||||||||||
| Expenses excluding specific expenses listed below | 1.76% | 1.75% | 1.74% | 1.72% | 1.72% | 1.73% | ||||||||||||||||||
| Interest and fees from borrowings | 0.11% | 0.10% | 0.13% | 0.15% | 0.14% | 0.11% | ||||||||||||||||||
| Total expenses4 | 1.87% | 1.85% | 1.87% | 1.87% | 1.86% | 1.84% | ||||||||||||||||||
| Expenses after payments, waivers and/or reimbursements and reduction to custodian expenses | 1.86% | 1.85%5 | 1.86% | 1.86% | 1.86%5 | 1.84%5 | ||||||||||||||||||
Portfolio turnover rate6 | 1% | 25% | 66% | 77% | 28% | 39% | ||||||||||||||||||
62 INVESCO OPPENHEIMER SENIOR FLOATING RATE FUND
1. Per share amounts calculated based on the average shares outstanding during the period.
2. Assumes an initial investment on the business day before the first day of the fiscal period, with all dividends and distributions reinvested in additional shares on the reinvestment date, and redemption at the net asset value calculated on the last business day of the fiscal period. Sales charges are not reflected in the total returns. Total returns are not annualized for periods less than one full year. Returns do not reflect the deduction of taxes that a shareholder would pay on fund distributions or the redemption of fund shares.
3. Annualized for periods less than one full year.
4. Total expenses including indirect expenses from affiliated fund fees and expenses were as follows:
| One Month Ended August 31, 2019 | 1.87 | % | ||||
| Year Ended July 31, 2019 | 1.85 | % | ||||
| Year Ended July 31, 2018 | 1.88 | % | ||||
| Year Ended July 31, 2017 | 1.88 | % | ||||
| Year Ended July 31, 2016 | 1.86 | % | ||||
| Year Ended July 31, 2015 | 1.84 | % |
5. Waiver was less than 0.005%.
6. Portfolio turnover is calculated at the fund level and is not annualized for periods less than one year, if applicable.
See accompanying Notes to Financial Statements.
63 INVESCO OPPENHEIMER SENIOR FLOATING RATE FUND
FINANCIAL HIGHLIGHTSContinued
| Class R | One Month Ended August 31, 2019 | Year Ended July 31, 2019 | Year Ended July 31, 2018 | Year Ended July 31, 2017 | Year Ended July 31, 2016 | Year Ended July 31, 2015 | ||||||||||||||||||
| Per Share Operating Data | ||||||||||||||||||||||||
| Net asset value, beginning of period | $7.76 | $8.13 | $8.14 | $7.85 | $8.08 | $8.39 | ||||||||||||||||||
| Income (loss) from investment operations: | ||||||||||||||||||||||||
| Net investment income1 | 0.03 | 0.39 | 0.35 | 0.35 | 0.36 | 0.34 | ||||||||||||||||||
| Net realized and unrealized gain (loss) | (0.14) | (0.38) | (0.04) | 0.26 | (0.22) | (0.31) | ||||||||||||||||||
| Total from investment operations | (0.11) | 0.01 | 0.31 | 0.61 | 0.14 | 0.03 | ||||||||||||||||||
| Dividends and/or distributions to shareholders: | ||||||||||||||||||||||||
| Dividends from net investment income | (0.03) | (0.38) | (0.32) | (0.32) | (0.37) | (0.34) | ||||||||||||||||||
| Net asset value, end of period | $7.62 | $7.76 | $8.13 | $8.14 | $7.85 | $8.08 | ||||||||||||||||||
| Total Return, at Net Asset Value2 | (1.39)% | 0.20% | 3.82% | 7.90% | 1.87% | 0.37% | ||||||||||||||||||
| Ratios/Supplemental Data | ||||||||||||||||||||||||
| Net assets, end of period (in thousands) | $87,586 | $91,419 | $88,230 | $65,597 | $42,546 | $33,417 | ||||||||||||||||||
| Average net assets (in thousands) | $88,980 | $94,680 | $74,894 | $52,459 | $36,727 | $27,664 | ||||||||||||||||||
| Ratios to average net assets:3 | ||||||||||||||||||||||||
| Net investment income | 5.00% | 4.87% | 4.29% | 4.34% | 4.63% | 4.14% | ||||||||||||||||||
| Expenses excluding specific expenses listed below | 1.26% | 1.25% | 1.24% | 1.22% | 1.23% | 1.23% | ||||||||||||||||||
| Interest and fees from borrowings | 0.11% | 0.10% | 0.13% | 0.15% | 0.14% | 0.11% | ||||||||||||||||||
| Total expenses4 | 1.37% | 1.35% | 1.37% | 1.37% | 1.37% | 1.34% | ||||||||||||||||||
| Expenses after payments, waivers and/or reimbursements and reduction to custodian expenses | 1.36% | 1.35%5 | 1.36% | 1.36% | 1.37%5 | 1.34%5 | ||||||||||||||||||
Portfolio turnover rate6 | 1% | 25% | 66% | 77% | 28% | 39% | ||||||||||||||||||
64 INVESCO OPPENHEIMER SENIOR FLOATING RATE FUND
1. Per share amounts calculated based on the average shares outstanding during the period.
2. Assumes an initial investment on the business day before the first day of the fiscal period, with all dividends and distributions reinvested in additional shares on the reinvestment date, and redemption at the net asset value calculated on the last business day of the fiscal period. Sales charges are not reflected in the total returns. Total returns are not annualized for periods less than one full year. Returns do not reflect the deduction of taxes that a shareholder would pay on fund distributions or the redemption of fund shares.
3. Annualized for periods less than one full year.
4. Total expenses including indirect expenses from affiliated fund fees and expenses were as follows:
| One Month Ended August 31, 2019 | 1.37 | % | ||||
| Year Ended July 31, 2019 | 1.35 | % | ||||
| Year Ended July 31, 2018 | 1.38 | % | ||||
| Year Ended July 31, 2017 | 1.38 | % | ||||
| Year Ended July 31, 2016 | 1.37 | % | ||||
| Year Ended July 31, 2015 | 1.34 | % | ||||
5. Waiver was less than 0.005%.
6. Portfolio turnover is calculated at the fund level and is not annualized for periods less than one year, if applicable.
See accompanying Notes to Financial Statements.
65 INVESCO OPPENHEIMER SENIOR FLOATING RATE FUND
FINANCIAL HIGHLIGHTSContinued
| Class Y | One Month Ended August 31, 2019 | Year Ended July 31, 2019 | Year Ended July 31, 2018 | Year Ended July 31, 2017 | Year Ended July 31, 2016 | Year Ended July 31, 2015 | ||||||||||||||||||
| Per Share Operating Data | ||||||||||||||||||||||||
| Net asset value, beginning of period | $7.75 | $8.11 | $8.13 | $7.83 | $8.07 | $8.38 | ||||||||||||||||||
| Income (loss) from investment operations: | ||||||||||||||||||||||||
| Net investment income1 | 0.04 | 0.43 | 0.39 | 0.39 | 0.39 | 0.38 | ||||||||||||||||||
| Net realized and unrealized gain (loss) | (0.14) | (0.37) | (0.05) | 0.27 | (0.23) | (0.31) | ||||||||||||||||||
| Total from investment operations | (0.10) | 0.06 | 0.34 | 0.66 | 0.16 | 0.07 | ||||||||||||||||||
| Dividends and/or distributions to shareholders: | ||||||||||||||||||||||||
| Dividends from net investment income | (0.04) | (0.42) | (0.36) | (0.36) | (0.40) | (0.38) | ||||||||||||||||||
| Net asset value, end of period | $7.61 | $7.75 | $8.11 | $8.13 | $7.83 | $8.07 | ||||||||||||||||||
| Total Return, at Net Asset Value2 | (1.35)% | 0.82% | 4.21% | 8.58% | 2.24% | 0.87% | ||||||||||||||||||
| Ratios/Supplemental Data | ||||||||||||||||||||||||
| Net assets, end of period (in thousands) | $4,734,607 | $5,266,308 | $7,495,276 | $6,715,590 | $4,102,232 | $6,035,847 | ||||||||||||||||||
| Average net assets (in thousands) | $4,987,706 | $6,758,520 | $6,857,395 | $5,364,472 | $4,648,275 | $6,814,415 | ||||||||||||||||||
| Ratios to average net assets:3 | ||||||||||||||||||||||||
| Net investment income | 5.50% | 5.37% | 4.78% | 4.82% | 5.06% | 4.66% | ||||||||||||||||||
| Expenses excluding specific expenses listed below | 0.76% | 0.75% | 0.74% | 0.72% | 0.73% | 0.72% | ||||||||||||||||||
| Interest and fees from borrowings | 0.11% | 0.10% | 0.13% | 0.15% | 0.14% | 0.11% | ||||||||||||||||||
| Total expenses4 | 0.87% | 0.85% | 0.87% | 0.87% | 0.87% | 0.83% | ||||||||||||||||||
| Expenses after payments, waivers and/or reimbursements and reduction to custodian expenses | 0.86% | 0.85%5 | 0.86% | 0.86% | 0.87%5 | 0.83%5 | ||||||||||||||||||
Portfolio turnover rate6 | 1% | 25% | 66% | 77% | 28% | 39% | ||||||||||||||||||
66 INVESCO OPPENHEIMER SENIOR FLOATING RATE FUND
1. Per share amounts calculated based on the average shares outstanding during the period.
2. Assumes an initial investment on the business day before the first day of the fiscal period, with all dividends and distributions reinvested in additional shares on the reinvestment date, and redemption at the net asset value calculated on the last business day of the fiscal period. Sales charges are not reflected in the total returns. Total returns are not annualized for periods less than one full year. Returns do not reflect the deduction of taxes that a shareholder would pay on fund distributions or the redemption of fund shares.
3. Annualized for periods less than one full year.
4. Total expenses including indirect expenses from affiliated fund fees and expenses were as follows:
| One Month Ended August 31, 2019 | 0.87 | % | ||||
| Year Ended July 31, 2019 | 0.85 | % | ||||
| Year Ended July 31, 2018 | 0.88 | % | ||||
| Year Ended July 31, 2017 | 0.88 | % | ||||
| Year Ended July 31, 2016 | 0.87 | % | ||||
| Year Ended July 31, 2015 | 0.83 | % | ||||
5. Waiver was less than 0.005%.
6. Portfolio turnover is calculated at the fund level and is not annualized for periods less than one year, if applicable.
See accompanying Notes to Financial Statements.
67 INVESCO OPPENHEIMER SENIOR FLOATING RATE FUND
FINANCIAL HIGHLIGHTSContinued
| Class R5 | One Month Ended August 31, 2019 | Period Ended | ||||||
| Per Share Operating Data | ||||||||
| Net asset value, beginning of period | $7.77 | $7.87 | ||||||
| Income (loss) from investment operations: | ||||||||
| Net investment income2 | 0.04 | 0.08 | ||||||
| Net realized and unrealized gain (loss) | (0.14) | (0.10) | ||||||
| Total from investment operations | (0.10) | (0.02) | ||||||
| Dividends and/or distributions to shareholders: | ||||||||
| Dividends from net investment income | (0.04) | (0.08) | ||||||
| Net asset value, end of period | $7.63 | $7.77 | ||||||
| Total Return, at Net Asset Value3 | (1.34)% | (0.28)% | ||||||
| Ratios/Supplemental Data | ||||||||
| Net assets, end of period (in thousands) | $10 | $10 | ||||||
| Average net assets (in thousands) | $10 | $10 | ||||||
| Ratios to average net assets:4 | ||||||||
| Net investment income | 5.55% | 5.45% | ||||||
| Expenses excluding specific expenses listed below | 0.71% | 0.67% | ||||||
| Interest and fees from borrowings | 0.11% | 0.10% | ||||||
| Total expenses5 | 0.82% | 0.77% | ||||||
| Expenses after payments, waivers and/or reimbursements and reduction to custodian expenses | 0.80% | 0.77% | ||||||
Portfolio turnover rate6 | 1% | 25% | ||||||
1. For the period from after the close of business on May 24, 2019 (inception of offering) to July 31, 2019.
2. Per share amounts calculated based on the average shares outstanding during the period.
3. Assumes an initial investment on the business day before the first day of the fiscal period, with all dividends and distributions reinvested in additional shares on the reinvestment date, and redemption at the net asset value calculated on the last business day of the fiscal period. Sales charges are not reflected in the total returns. Total returns are not annualized for periods less than one full year. Returns do not reflect the deduction of taxes that a shareholder would pay on fund distributions or the redemption of fund shares.
4. Annualized for periods less than one full year.
5. Total expenses including indirect expenses from affiliated fund fees and expenses were as follows:
| One Month Ended August 31, 2019 | 0.82 | % | ||||
| Period Ended July 31, 2019 | 0.77 | % | ||||
6. Portfolio turnover is calculated at the fund level and is not annualized for periods less than one year, if applicable.
See accompanying Notes to Financial Statements.
68 INVESCO OPPENHEIMER SENIOR FLOATING RATE FUND
| Class R6 | One Month Ended August 31, 2019 | Year Ended July 31, 2019 | Year Ended July 31, 2018 | Year Ended July 31, 2017 | Year Ended July 31, 2016 | Year Ended July 31, 2015 | ||||||||||||||||||
| Per Share Operating Data | ||||||||||||||||||||||||
| Net asset value, beginning of period | $7.75 | $8.11 | $8.13 | $7.83 | $8.06 | $8.37 | ||||||||||||||||||
| Income (loss) from investment operations: | ||||||||||||||||||||||||
| Net investment income1 | 0.04 | 0.43 | 0.40 | 0.40 | 0.40 | 0.39 | ||||||||||||||||||
| Net realized and unrealized gain (loss) | (0.14) | (0.36) | (0.06) | 0.27 | (0.22) | (0.31) | ||||||||||||||||||
| Total from investment operations | (0.10) | 0.07 | 0.34 | 0.67 | 0.18 | 0.08 | ||||||||||||||||||
| Dividends and/or distributions to shareholders: | ||||||||||||||||||||||||
| Dividends from net investment income | (0.04) | (0.43) | (0.36) | (0.37) | (0.41) | (0.39) | ||||||||||||||||||
| Net asset value, end of period | $7.61 | $7.75 | $8.11 | $8.13 | $7.83 | $8.06 | ||||||||||||||||||
| Total Return, at Net Asset Value2 | (1.34)% | 0.93% | 4.31% | 8.65% | 2.44% | 0.94% | ||||||||||||||||||
| Ratios/Supplemental Data | ||||||||||||||||||||||||
| Net assets, end of period (in thousands) | $997,162 | $1,056,032 | $1,373,036 | $1,100,191 | $915,631 | $1,165,355 | ||||||||||||||||||
| Average net assets (in thousands) | $1,020,586 | $1,235,152 | $1,190,927 | $1,129,050 | $1,014,977 | $1,184,063 | ||||||||||||||||||
| Ratios to average net assets:3 | ||||||||||||||||||||||||
| Net investment income | 5.61% | 5.48% | 4.88% | 4.91% | 5.15% | 4.72% | ||||||||||||||||||
| Expenses excluding specific expenses listed below | 0.65% | 0.64% | 0.65% | 0.65% | 0.66% | 0.65% | ||||||||||||||||||
| Interest and fees from borrowings | 0.11% | 0.10% | 0.13% | 0.15% | 0.14% | 0.11% | ||||||||||||||||||
| Total expenses4 | 0.76% | 0.74% | 0.78% | 0.80% | 0.80% | 0.76% | ||||||||||||||||||
| Expenses after payments, waivers and/or reimbursements and reduction to custodian expenses | 0.75% | 0.74%5 | 0.77% | 0.79% | 0.80%5 | 0.76%5 | ||||||||||||||||||
Portfolio turnover rate6 | 1% | 25% | 66% | 77% | 28% | 39% | ||||||||||||||||||
69 INVESCO OPPENHEIMER SENIOR FLOATING RATE FUND
FINANCIAL HIGHLIGHTSContinued
1. Per share amounts calculated based on the average shares outstanding during the period.
2. Assumes an initial investment on the business day before the first day of the fiscal period, with all dividends and distributions reinvested in additional shares on the reinvestment date, and redemption at the net asset value calculated on the last business day of the fiscal period. Sales charges are not reflected in the total returns. Total returns are not annualized for periods less than one full year. Returns do not reflect the deduction of taxes that a shareholder would pay on fund distributions or the redemption of fund shares.
3. Annualized for periods less than one full year.
4. Total expenses including indirect expenses from affiliated fund fees and expenses were as follows:
| One Month Ended August 31, 2019 | 0.76 | % | ||||
| Year Ended July 31, 2019 | 0.74 | % | ||||
| Year Ended July 31, 2018 | 0.79 | % | ||||
| Year Ended July 31, 2017 | 0.81 | % | ||||
| Year Ended July 31, 2016 | 0.80 | % | ||||
| Year Ended July 31, 2015 | 0.76 | % | ||||
5. Waiver was less than 0.005%.
6. Portfolio turnover is calculated at the fund level and is not annualized for periods less than one year, if applicable.
See accompanying Notes to Financial Statements.
70 INVESCO OPPENHEIMER SENIOR FLOATING RATE FUND
NOTES TO FINANCIAL STATEMENTSAugust 31, 2019 and July 31, 2019
Note 1 - Significant Accounting Policies
Invesco Oppenheimer Senior Floating Rate Fund (the “Fund”) is a series portfolio AIM Counselor Series Trust (Invesco Counselor Series Trust) (the “Trust”). The Trust is a Delaware statutory trust registered under the Investment Company Act of 1940, as amended (the “1940 Act”), as an open-end series management investment company authorized to issue an unlimited number of shares of beneficial interest. Information presented in these financial statements pertains only to the Fund. Matters affecting the Fund or each class will be voted on exclusively by the shareholders of such Fund or each class.
Prior to the close of business on May 24, 2019, the Fund operated as Oppenheimer Senior Floating Rate Fund (the “Acquired Fund” or “Predecessor Fund”). The Acquired Fund was reorganized after the close of business on May 24, 2019 (the “Reorganization Date”) through the transfer of all of its assets and liabilities to the Fund (the “Reorganization”).
Upon closing of the Reorganization, holders of the Acquired Fund’s Class A, Class C, Class R, and Class Y shares received the corresponding class of shares of the Fund and holders of the Acquired Fund’s Class I shares received Class R6 shares of the Fund. Information for the Acquired Fund’s Class I shares prior to the Reorganization is included with Class R6 shares throughout this report. Class R5 shares commenced operations on the Reorganization Date.
Effective August 31, 2019, the Fund changed fiscal year end from July 31 to August 31.
The Fund’s investment objective is to seek income.
The Fund currently consists of six different classes of shares: Class A, Class C, Class R, Class Y, Class R5 and Class R6. Class Y shares are available only to certain investors. Class A shares are sold with a front-end sales charge unless certain waiver criteria are met and under certain circumstances load waived shares may be subject to contingent deferred sales charges (“CDSC”). Class C shares are sold with a CDSC. Class R, Class Y, Class R5 and Class R6 shares are sold at net asset value.
The Fund is an investment company and accordingly follows the investment company accounting and reporting guidance in accordance with Financial Accounting Standards Board Accounting Standards Codification Topic 946, Financial Services – Investment Companies.
The following is a summary of the significant accounting policies followed by the Fund in the preparation of its financial statements.
| A. | Security Valuations - Securities, including restricted securities, are valued according to the following policy. |
Debt obligations (including convertible securities) and unlisted equities are fair valued using an evaluated quote provided by an independent pricing service. Evaluated quotes provided by the pricing service may be determined without exclusive reliance on quoted prices, and may reflect appropriate factors such as institution-size trading in similar groups of securities, developments related to specific securities, dividend rate (for unlisted equities), yield (for debt obligations), quality, type of issue, coupon rate (for debt obligations), maturity (for debt obligations), individual trading characteristics and other market data. Pricing services generally value debt obligations assuming orderly transactions of institutional round lot size, but a fund may hold or transact in the same securities in smaller, odd lot sizes. Odd lots often trade at lower prices than institutional round lots. Debt obligations are
71 INVESCO OPPENHEIMER SENIOR FLOATING RATE FUND
NOTES TO FINANCIAL STATEMENTSContinued
subject to interest rate and credit risks. In addition, all debt obligations involve some risk of default with respect to interest and/or principal payments.
A security listed or traded on an exchange (except convertible securities) is valued at its last sales price or official closing price as of the close of the customary trading session on the exchange where the security is principally traded, or lacking any sales or official closing price on a particular day, the security may be valued at the closing bid price on that day. Securities traded in the over-the-counter market are valued based on prices furnished by independent pricing services or market makers. When such securities are valued by an independent pricing service they may be considered fair valued. Futures contracts are valued at the final settlement price set by an exchange on which they are principally traded. Listed options are valued at the mean between the last bid and asked prices from the exchange on which they are principally traded. Options not listed on an exchange are valued by an independent source at the mean between the last bid and asked prices. For purposes of determining net asset value (“NAV”) per share, futures and option contracts generally are valued 15 minutes after the close of the customary trading session of the New York Stock Exchange (“NYSE”).
Investments in open-end and closed-end registered investment companies that do not trade on an exchange are valued at the end-of-day net asset value per share. Investments in open-end and closed-end registered investment companies that trade on an exchange are valued at the last sales price or official closing price as of the close of the customary trading session on the exchange where the security is principally traded.
Swap agreements are fair valued using an evaluated quote, if available, provided by an independent pricing service. Evaluated quotes provided by the pricing service are valued based on a model which may include end-of-day net present values, spreads, ratings, industry, company performance and returns of referenced assets. Centrally cleared swap agreements are valued at the daily settlement price determined by the relevant exchange or clearinghouse.
Foreign securities’ (including foreign exchange contracts) prices are converted into U.S. dollar amounts using the applicable exchange rates as of the close of the NYSE. If market quotations are available and reliable for foreign exchange-traded equity securities, the securities will be valued at the market quotations. Because trading hours for certain foreign securities end before the close of the NYSE, closing market quotations may become unreliable. If between the time trading ends on a particular security and the close of the customary trading session on the NYSE, events occur that the investment adviser determines are significant and make the closing price unreliable, the Fund may fair value the security. If the event is likely to have affected the closing price of the security, the security will be valued at fair value in good faith using procedures approved by the Board of Trustees. Adjustments to closing prices to reflect fair value may also be based on a screening process of an independent pricing service to indicate the degree of certainty, based on historical data, that the closing price in the principal market where a foreign security trades is not the current value as of the close of the NYSE. Foreign securities’ prices meeting the approved degree of certainty that the price is not reflective of current value will be priced at the indication of fair value from the independent pricing service. Multiple
72 INVESCO OPPENHEIMER SENIOR FLOATING RATE FUND
factors may be considered by the independent pricing service in determining adjustments to reflect fair value and may include information relating to sector indices, American Depositary Receipts and domestic and foreign index futures. Foreign securities may have additional risks including exchange rate changes, potential for sharply devalued currencies and high inflation, political and economic upheaval, the relative lack of issuer information, relatively low market liquidity and the potential lack of strict financial and accounting controls and standards.
Securities for which market prices are not provided by any of the above methods may be valued based upon quotes furnished by independent sources. The last bid price may be used to value equity securities. The mean between the last bid and asked prices is used to value debt obligations, including corporate loans.
Securities for which market quotations are not readily available or became unreliable are valued at fair value as determined in good faith by or under the supervision of the Trust’s officers following procedures approved by the Board of Trustees. Issuer specific events, market trends, bid/asked quotes of brokers and information providers and other market data may be reviewed in the course of making a good faith determination of a security’s fair value.
The Fund may invest in securities that are subject to interest rate risk, meaning the risk that the prices will generally fall as interest rates rise and, conversely, the prices will generally rise as interest rates fall. Specific securities differ in their sensitivity to changes in interest rates depending on their individual characteristics. Changes in interest rates may result in increased market volatility, which may affect the value and/or liquidity of certain Fund investments.
Valuations change in response to many factors including the historical and prospective earnings of the issuer, the value of the issuer’s assets, general economic conditions, interest rates, investor perceptions and market liquidity. Because of the inherent uncertainties of valuation, the values reflected in the financial statements may materially differ from the value received upon actual sale of those investments.
| B. | Securities Transactions and Investment Income -Securities transactions are accounted for on a trade date basis. Realized gains or losses on sales are computed on the basis of specific identification of the securities sold. Interest income (net of withholding tax, if any) is recorded on the accrual basis from settlement date. Bond premiums and discounts are amortized and/or accreted over the lives of the respective securities. Pay-in-kind interest income and non-cash dividend income received in the form of securities in-lieu of cash are recorded at the fair value of the securities received. Paydown gains and losses on mortgage and asset-backed securities are recorded as adjustments to interest income. Dividend income (net of withholding tax, if any) is recorded on the ex-dividend date. |
The Fund may periodically participate in litigation related to Fund investments. As such, the Fund may receive proceeds from litigation settlements. Any proceeds received are included in the Statement of Operations as realized gain (loss) for investments no longer held and as unrealized gain (loss) for investments still held.
Brokerage commissions and mark ups are considered transaction costs and are recorded as an increase to the cost basis of securities purchased and/or a reduction of proceeds on
73 INVESCO OPPENHEIMER SENIOR FLOATING RATE FUND
NOTES TO FINANCIAL STATEMENTSContinued
a sale of securities. Such transaction costs are included in the determination of net realized and unrealized gain (loss) from investment transactions reported in the Statement of Operations and the Statement of Changes in Net Assets and the net realized and unrealized gains (losses) on securities per share in the Financial Highlights. Transaction costs are included in the calculation of the Fund’s net asset value and, accordingly, they reduce the Fund’s total returns. These transaction costs are not considered operating expenses and are not reflected in net investment income reported in the Statement of Operations and the Statement of Changes in Net Assets, or the net investment income per share and the ratios of expenses and net investment income reported in the Financial Highlights, nor are they limited by any expense limitation arrangements between the Fund and the investment adviser.
The Fund allocates income and realized and unrealized capital gains and losses to a class based on the relative net assets of each class. The fund allocates income to a class based on the relative value of the settled shares of each class.
| C. | Country Determination- For the purposes of making investment selection decisions and presentation in the Schedule of Investments, the investment adviser may determine the country in which an issuer is located and/or credit risk exposure based on various factors. These factors include the laws of the country under which the issuer is organized, where the issuer maintains a principal office, the country in which the issuer derives 50% or more of its total revenues and the country that has the primary market for the issuer’s securities, as well as other criteria. Among the other criteria that may be evaluated for making this determination are the country in which the issuer maintains 50% or more of its assets, the type of security, financial guarantees and enhancements, the nature of the collateral and the sponsor organization. Country of issuer and/or credit risk exposure has been determined to be the United States of America, unless otherwise noted. |
| D. | Distributions -Dividends and distributions to shareholders, which are determined in accordance with income tax regulations and may differ from accounting principals generally accepted in the United States of America (“GAAP”), are recorded on the ex-dividend date. Income distributions, if any, are declared daily and paid monthly. Capital gain distributions, if any, are declared and paid annually or at other times as determined necessary by the Adviser. |
| E. | Federal Income Taxes -The Fund intends to comply with provisions of the Internal Revenue Code applicable to regulated investment companies and to distribute substantially all of its investment company taxable income, including any net realized gain on investments not offset by capital loss carryforwards, if any, to shareholders. Therefore, no federal income or excise tax provision is required. The Fund files income tax returns in U.S. federal and applicable state jurisdictions. The statute of limitations on the Fund’s tax return filings generally remains open for the three preceding fiscal reporting period ends. The Fund has analyzed its tax positions for the one month ended August 31, 2019 and the fiscal year ended July 31, 2019, including open tax years, and does not believe there are any uncertain tax positions requiring recognition in the Fund’s financial statements. |
The tax components of capital shown in the following table for the one month ended
74 INVESCO OPPENHEIMER SENIOR FLOATING RATE FUND
August 31, 2019 represent distribution requirements the Fund must satisfy under the income tax regulations, losses the Fund may be able to offset against income and gains realized in future years and unrealized appreciation or depreciation of securities and other investments for federal income tax purposes.
Undistributed Net Investment Income | Undistributed Long-Term Gain | Accumulated Loss Carryforward1,2,3 | Net Unrealized Depreciation Based on cost of Securities and Other Investments for Federal Income Tax Purposes | |||||||||
| $9,304,751 | $— | $805,500,622 | $906,356,649 | |||||||||
1.At period end, the Fund had $805,500,622 of net capital loss carryforward available to offset future realized capital gains, if any, and thereby reduce future taxable gain distributions.
2. During the reporting period, the Fund did not utilize any capital loss carryforward.
3.During the previous reporting period ended July 31, 2019, the Fund did not utilize any capital loss carryforward.
The tax components of capital shown in the following table for the fiscal year ended July 31, 2019 represent distribution requirements the Fund must satisfy under the income tax regulations, losses the Fund may be able to offset against income and gains realized in future years and unrealized appreciation or depreciation of securities and other investments for federal income tax purposes.
Undistributed Net Investment Income | Undistributed Long-Term Gain | Accumulated Loss Carryforward1,2,3,4 | Net Unrealized Depreciation Based on cost of Securities and Other Investments for Federal Income Tax Purposes | |||||||||
| $7,117,585 | $— | $765,476,716 | $741,732,927 | |||||||||
1.At period end, the Fund had $765,476,716 of net capital loss carryforward available to offset future realized capital gains, if any, and thereby reduce future taxable gain distributions.
2. During the reporting period, the Fund did not utilize any capital loss carryforward.
3.During the previous reporting period, the Fund did not utilize any capital loss carryforward.
4.During the reporting period, $29,853,127 of unused capital loss carryforward expired.
Net investment income (loss) and net realized gain (loss) may differ for financial statement and tax purposes. The character of dividends and distributions made during the fiscal year from net investment income or net realized gains are determined in accordance with federal income tax requirements, which may differ from the character of net investment income or net realized gains presented in those financial statements in accordance with U.S. GAAP. Also, due to timing of dividends and distributions, the fiscal year in which amounts are distributed may differ from the fiscal year in which the income or net realized gain was recorded by the Fund.
Accordingly, for the year fiscal year ended July 31, 2019 the following amounts have been reclassified for the reporting period. Net assets of the Fund were unaffected by the
75 INVESCO OPPENHEIMER SENIOR FLOATING RATE FUND
NOTES TO FINANCIAL STATEMENTSContinued
reclassifications.
Reduction to Paid-in Capital | Reduction to Accumulated | |||
| $29,853,127 | $29,853,127 | |||
The tax character of distributions paid during the reporting periods:
| One Month Ended August 31, 2019 | Year Ended July 31, 2019 | Year Ended July 31, 2018 | ||||||||||
| Distributions paid from: | ||||||||||||
| Ordinary income | $ | 47,655,391 | $ | 703,519,516 | $ | 607,577,528 | ||||||
The aggregate cost of securities and other investments and the composition of unrealized appreciation and depreciation of securities and other investments for federal income tax purposes at period end are noted in the following table. The primary difference between book and tax appreciation or depreciation of securities and other investments, if applicable, is attributable to the tax deferral of losses or tax realization of financial statement unrealized gain or loss.
| One Month Ended August 31, 2019 | Year Ended July 31, 2019 | |||||||
| Federal tax cost of securities | $ | 11,134,866,301 | $ | 11,889,504,875 | ||||
| Gross unrealized appreciation | $ | 140,827,371 | $ | 190,513,582 | ||||
| Gross unrealized depreciation | (1,047,184,020 | ) | (932,246,509 | ) | ||||
| Net unrealized depreciation | $ | (906,356,649 | ) | $ | (741,732,927 | ) | ||
| F. | Expenses -Fees provided for under the Rule 12b-1 plan of a particular class of the Fund are charged to the operations of such class. Transfer agency fees and expenses and other shareholder recordkeeping fees and expenses attributable to Class R5 and Class R6 are allocated to each share class based on relative net assets. Sub-accounting fees attributable to Class R5 are charged to the operations of the class. Transfer agency fees and expenses and other shareholder recordkeeping fees and expenses relating to all other classes are allocated among those classes based on relative net assets. All other expenses are allocated among the classes based on relative net assets. |
| G. | Accounting Estimates -The financial statements are prepared on a basis in conformity with GAAP, which requires management to make estimates and assumptions that affect the reported amounts of assets and liabilities at the date of the financial statements and the reported amounts of revenues and expenses during the reporting period including estimates and assumptions related to taxation. Actual results could differ from those estimates by a significant amount. In addition, the Fund monitors for material events or transactions that may occur or become known after the period-end date and before the date the financial statements are released to print. |
| H. | Indemnifications -Under the Trust’s organizational documents, each Trustee, officer, employee or other agent of the Trust is indemnified against certain liabilities that may arise out of the performance of their duties to the Fund. Additionally, in the normal course of |
76 INVESCO OPPENHEIMER SENIOR FLOATING RATE FUND
business, the Fund enters into contracts, including the Fund’s servicing agreements, that contain a variety of indemnification clauses. The Fund’s maximum exposure under these arrangements is unknown as this would involve future claims that may be made against the Fund that have not yet occurred. The risk of material loss as a result of such indemnification claims is considered remote. |
| I. | Securities on a When-Issued or Delayed Delivery Basis -The Fund may purchase securities on a “when-issued” basis, and may purchase or sell securities on a “delayed delivery” basis, with payment and delivery scheduled for a future date. No income accrues to the Fund on the securities in connection with such transactions prior to the date the Fund actually takes delivery of the securities. These transactions are subject to market fluctuations and are subject to the risk that the value at delivery may be more or less than the trade date purchase price. Although the Fund will generally purchase these securities with the intention on acquiring such securities, they may sell such securities prior to the settlement date. |
| J. | Industry Focus -To the extent that the Fund invests a greater amount of its assets in securities of issuers in the banking and financial services industries, the Fund’s performance will depend to a greater extent on the overall condition of those industries. The value of these securities can be sensitive to changes in government regulation, interest rates and economic downturns in the U.S. and abroad. |
| K. | Bank Loan Risk -Although the resale, or secondary market for floating rate loans has grown substantially over the past decade, both in overall size and number of market participants, there is no organized exchange or board of trade on which floating rate loans are traded. Instead, the secondary market for floating rate loans is a private, unregulated interdealer or interbank resale market. Such a market may therefore be subject to irregular trading activity, wide bid/ask spreads, and extended trade settlement periods, which may impair the Fund’s ability to sell bank loans within its desired time frame or at an acceptable price and its ability to accurately value existing and prospective investments. Extended trade settlement periods may result in cash not being immediately available to the Fund. As a result, the Fund may have to sell other investments or engage in borrowing transactions to raise cash to meet its obligations. Similar to other asset classes, bank loan funds may be exposed to counterparty credit risk, or the risk than an entity with which the Fund has unsettled or open transactions may fail to or be unable to perform on its commitments. The Fund seeks to manage counterparty credit risk by entering into transactions only with counterparties that it believes have the financial resources to honor their obligations and by monitoring the financial stability of those counterparties. |
| L. | Other Risks- The Fund may invest all or substantially all of its assets in senior secured floating rate loans and senior secured debt securities that are determined to be rated below investment grade. These securities are generally considered to have speculative characteristics and are subject to greater risk of loss of principal and interest than higher rated securities. The value of lower quality debt securities and floating rate loans can be more volatile due to increased sensitivity to adverse issuer, political, regulatory, market or economic developments. |
The Fund invests in corporate loans from U.S. or non-U.S. companies (the
77 INVESCO OPPENHEIMER SENIOR FLOATING RATE FUND
NOTES TO FINANCIAL STATEMENTSContinued
“Borrowers”). The investment of the Fund in a corporate loan may take the form of participation interests or assignments. If the Fund purchases a participation interest from a syndicate of lenders (“Lenders”) or one of the participants in the syndicate (“Participant”), one or more of which administers the loan on behalf of all the Lenders (the “Agent Bank”), the Fund would be required to rely on the Lender that sold the participation interest not only for the enforcement of the Fund’s rights against the Borrower but also for the receipt and processing of payments due to the Fund under the corporate loans. As such, the Fund is subject to the credit risk of the Borrower and the Participant. Lenders and Participants interposed between the Fund and a Borrower, together with Agent Banks, are referred to as “Intermediate Participants”.
| M. | Leverage Risk- The Fund may utilize leverage to seek to enhance the yield of the Fund by borrowing. There are risks associated with borrowing in an effort to increase the yield and distributions on the shares, including that the costs of the financial leverage may exceed the income from investments made with such leverage, the higher volatility of the net asset value of the shares, and that fluctuations in the interest rates on the borrowing may affect the yield and distributions to the shareholders. There can be no assurance that the Fund’s leverage strategy will be successful. |
Note 2 - Advisory Fees and Other Fees Paid to Affiliates
The Trust has entered into a master investment advisory agreement with Invesco Advisers, Inc. (the “Adviser” or “Invesco”). Under the terms of the investment advisory agreement, the Fund accrues daily and pays monthly an advisory fee to the Adviser based on the annual rate of the Fund’s average daily net assets as follows:
| Fee Schedule* | ||||
| Up to $200 million | 0.75 | % | ||
| Next $200 million | 0.72 | |||
| Next $200 million | 0.69 | |||
| Next $200 million | 0.66 | |||
| Next $4.2 billion | 0.60 | |||
| Next $5 billion | 0.58 | |||
| Next $10 billion | 0.56 | |||
| Over $20 billion | 0.55 | |||
*The advisory fee paid by the Fund shall be reduced by any amounts paid by the Fund under the administrative services agreement with the Adviser.
For the one month ended August 31, 2019, the effective annualized advisory fee incurred by the Fund was 0.58% and for the year ended July 31, 3019 the effective annualized advisory fee incurred by the Fund was 0.59%.
For the period September 1, 2018 until the date of the Reorganization, the Acquired Fund paid $67,870,981 in advisory fees to OFI Global Asset Management, Inc. based on the annual rates above of the Acquired Fund’s average daily net assets.
Under the terms of a master sub-advisory agreement between the Adviser and each of Invesco Asset Management Deutschland GmbH, Invesco Asset Management Limited, Invesco
78 INVESCO OPPENHEIMER SENIOR FLOATING RATE FUND
Asset Management (Japan) Limited, Invesco Hong Kong Limited, Invesco Senior Secured Management, Inc. and Invesco Canada Ltd. and separate sub-advisory agreements with Invesco Capital Management LLC, and Invesco Asset Management (India) Private Limited (collectively, the “Affiliated Sub-Advisers”) the Adviser, not the Fund, will pay 40% of the fees paid to the Adviser to any such Affiliated Sub-Adviser(s) that provide(s) discretionary investment management services to the Fund based on the percentage of assets allocated to such Sub-Adviser(s). Invesco has also entered into a Sub-Advisory Agreement with OppenheimerFunds, Inc. to provide discretionary management services to the Funds.
Effective on the Reorganization Date, the Adviser has contractually agreed, through at least May 31, 2021, to waive advisory fees and/or reimburse expenses of all shares to the extent necessary to limit the total annual fund operating expenses after fee waiver and/or expense reimbursement (excluding certain items discussed below) of Class A, Class C, Class R, Class Y, Class R5 and Class R6 shares to 1.00%, 1.75%, 1.25%, 0.75%, 0.69% and 0.64%, respectively, of the Fund’s average daily net assets (the “expense limits”). In determining the Adviser’s obligation to waive advisory fees and/or reimburse expenses, the following expenses are not taken into account, and could cause total annual fund operating expenses after fee waivers and/or expense reimbursement to exceed the numbers reflected above: (1) interest; (2) taxes; (3) dividend expenses on short sales; (4) extraordinary or non-routine items, including litigation expenses; and (5) expenses that the Fund has incurred but did not actually pay because of an expense offset arrangement. Unless Invesco continues the fee waiver agreement, it will terminate May 31, 2021. During its term, the fee waiver agreement cannot be terminated or amended to increase the expense limits or reduce the advisory fee waiver without approval of the Board of Trustees.
Further, the Adviser has contractually agreed, through at least June 30, 2021, to waive the advisory fee payable by the Fund in an amount equal to 100% of the net advisory fees the Adviser receives from the affiliated money market funds on investments by the Fund of uninvested cash in such affiliated money market funds.
For the one month ended August 31, 2019, the Adviser waived advisory fees of $37,349 and reimbursed fund expenses of $23,268, $12,613, $693, $30,873, $9,297 for Class A, Class C, Class R, Class Y and Class R6 respectively.
For the year ended July 31, 2019, the Adviser waived advisory fees of $516,240.
The Trust has entered into a master administrative services agreement with Invesco pursuant to which the Fund has agreed to pay Invesco for certain administrative costs incurred in providing accounting services to the Fund. For the one month ended August 31, 2019 and the year ended July 31, 2019, expenses incurred under the agreement are shown in the Statement of Operations as Administration fees. Additionally, Invesco has entered into service agreements whereby Deutsche Bank Trust Company Americas (the Custodian) serves as custodian to the Fund. Prior to the Reorganization, the Acquired Fund paid administrative fees to OFI Global Asset Management, Inc.
The Trust has entered into a transfer agency and service agreement with Invesco Investment Services, Inc. (“IIS”) pursuant to which the Fund has agreed to pay IIS a fee for providing transfer agency and shareholder services to the Fund and reimburse IIS for certain expenses incurred by IIS in the course of providing such services. IIS may make payments
79 INVESCO OPPENHEIMER SENIOR FLOATING RATE FUND
NOTES TO FINANCIAL STATEMENTSContinued
to intermediaries that provide omnibus account services, sub-accounting services and/or networking services. All fees payable by IIS to intermediaries that provide omnibus account services or sub-accounting services are charged back to the Fund, subject to certain limitations approved by the Trust’s Board of Trustees. Prior to the Reorganization, the Acquired Fund paid transfer agent fees to OFI Global Asset Management, Inc. and Shareholder Services, Inc. For the one month ended August 31, 2019 and the year ended July 31, 2019, expenses incurred under these agreements are shown in the Statement of Operations as Transfer and shareholder servicing agent fees.
The Trust has entered into master distribution agreements with Invesco Distributors, Inc. (“IDI”) to serve as the distributor for the Class A, Class C, Class R, Class Y, Class R5 and Class R6 shares of the Fund. The Trust has adopted plans pursuant to Rule 12b-1 under the 1940 Act with respect to the Fund’s Class A, Class C and Class R shares (collectively the “Plan”). The Fund, pursuant to the Class A Plan, reimbursed IDI in an amount up to an annual rate of 0.25% of the average daily net assets of Class A shares. The Fund pursuant to the Class C and Class R Plan, pays IDI compensation at the annual rate of 1.00% of the average daily net assets of Class C and 0.50% of the average daily net assets of Class R shares. The fees are accrued daily and paid monthly. Of the Plan payments, up to 0.25% of the average daily net assets of each class of shares may be paid to furnish continuing personal shareholder services to customers who purchase and own shares of such classes. Any amounts not paid as a service fee under the Plan would constitute an asset-based sales charge. Rules of the Financial Industry Regulatory Authority (“FINRA”) impose a cap on the total sales charges, including asset-based sales charges, that may be paid by any class of shares of the Fund plans. Prior to the Reorganization, the Acquired Fund paid distribution fees to OppenheimerFunds Distributor, Inc. For the one month ended August 31, 2019 and the year ended July 31, 2019, expenses incurred under the plans are shown in the Statement of Operations as Distribution and service plan fees.
Front-end sales commissions and CDSC (collectively, the “sales charges”) are not recorded as expenses of the Fund. Front-end sales commissions are deducted from proceeds from the sales of Fund shares prior to investment in Class A shares of the Fund. CDSC are deducted from redemption proceeds prior to remittance to the shareholder. During the one month ended August 31, 2019, IDI advised the Fund that IDI retained $7,091 in front-end sales commissions from the sale of Class A shares and $2,993 and $14,269 from Class A and Class C shares, respectively, for CDSC imposed on redemptions by shareholders. During the year ended July 31, 2019, IDI advised the Fund that IDI retained $17,425 in front-end sales commissions from the sale of Class A shares and $12,257 and $27,284 from Class A and Class C shares, respectively, for CDSC imposed on redemptions by shareholders. From the period September 1, 2018 to date of the Reorganization, OppenheimerFunds Distributor, Inc. retained $331,323 in front–end sales commissions from the sale of Class A shares and $33,729 and $162,104 from Class A and Class C shares, respectively, for CDSC imposed on redemption by shareholders.
Certain officers and trustees of the Trust are officers and directors of the Adviser, IIS and/or IDI.
80 INVESCO OPPENHEIMER SENIOR FLOATING RATE FUND
Note 3 – Additional Valuation Information
GAAP defines fair value as the price that would be received to sell an asset or paid to transfer a liability in an orderly transaction between market participants at the measurement date, under current market conditions. GAAP establishes a hierarchy that prioritizes the inputs to valuation methods, giving the highest priority to readily available unadjusted quoted prices in an active market for identical assets (Level 1) and the lowest priority to significant unobservable inputs (Level 3), generally when market prices are not readily available or are unreliable. Based on the valuation inputs, the securities or other investments are tiered into one of three levels. Changes in valuation methods may result in transfers in or out of an investment’s assigned level:
Level 1 — Prices are determined using quoted prices in an active market for identical assets.
Level 2 — Prices are determined using other significant observable inputs. Observable inputs are inputs that other market participants may use in pricing a security. These may include quoted prices for similar securities, interest rates, prepayment speeds, credit risk, yield curves, loss severities, default rates, discount rates, volatilities and others.
Level 3 — Prices are determined using significant unobservable inputs. In situations where quoted prices or observable inputs are unavailable (for example, when there is little or no market activity for an investment at the end of the period), unobservable inputs may be used. Unobservable inputs reflect the Fund’s own assumptions about the factors market participants would use in determining fair value of the securities or instruments and would be based on the best available information.
The level assigned to the securities valuations may not be an indication of the risk or liquidity associated with investing in those securities. Because of the inherent uncertainties of valuation, the values reflected in the financial statements may materially differ from the value received upon actual sale of those investments.
The following is a summary of the tiered valuation input levels, as of August 31, 2019:
| Level 1— Unadjusted Quoted Prices | Level 2— Other Significant | Level 3— Significant Unobservable Inputs | Value | |||||||||||||
| ||||||||||||||||
| Assets Table | ||||||||||||||||
| Investments, at Value: | ||||||||||||||||
| Corporate Loans | $ | — | $ | 8,742,020,525 | $ | 493,216,282 | $ | 9,235,236,807 | ||||||||
| Corporate Bonds and Notes | — | 221,937,671 | 0 | 221,937,671 | ||||||||||||
| Common Stocks | 387,777,672 | 21,149,761 | 16,688,928 | 425,616,361 | ||||||||||||
| Rights, Warrants and Certificates | — | — | 1,157,935 | 1,157,935 | ||||||||||||
| Investment Company | 344,560,878 | — | — | 344,560,878 | ||||||||||||
|
| |||||||||||||||
| Total Assets | $ | 732,338,550 | $ | 8,985,107,957 | $ | 511,063,145 | $ | 10,228,509,652 | ||||||||
|
| |||||||||||||||
The following is a summary of the tiered valuation input levels, as of July 31, 2019:
81 INVESCO OPPENHEIMER SENIOR FLOATING RATE FUND
NOTES TO FINANCIAL STATEMENTSContinued
| Level 1— Unadjusted Quoted Prices | Level 2— Other Significant | Level 3— Significant Unobservable Inputs | Value | |||||||||||||
| ||||||||||||||||
| Assets Table | ||||||||||||||||
| Investments, at Value: | ||||||||||||||||
| Corporate Loans | $ | — | $ | 9,405,421,422 | $ | 475,277,336 | $ | 9,880,698,758 | ||||||||
| Corporate Bonds and Notes | — | 273,057,684 | 0 | 273,057,684 | ||||||||||||
| Common Stocks | 426,882,050 | 16,443,667 | 12,547,725 | 455,873,442 | ||||||||||||
| Rights, Warrants and Certificates | — | — | 492,589 | 492,589 | ||||||||||||
| Investment Company | 537,649,475 | — | — | 537,649,475 | ||||||||||||
|
| |||||||||||||||
| Total Assets | $ | 964,531,525 | $ | 9,694,922,773 | $ | 488,317,650 | $ | 11,147,771,948 | ||||||||
|
| |||||||||||||||
The following is a reconciliation of assets in which significant unobservable inputs (level 3) were used in determining fair value for the one month reporting period ended August 31, 2019:
| Value as of July 31, 2019 | Realized gain (loss) | Change in unrealized appreciation/ depreciation | Accretion/ (amortization) of premium/ discounta | |||||||||||||
| ||||||||||||||||
| Assets Table | ||||||||||||||||
| Investments, at Value: | ||||||||||||||||
| Corporate Loans | $ | 475,277,336 | $ | (121,838 | ) | $ | (4,461,398 | ) | $ | 6,151 | ||||||
| Corporate Bonds and Notes | 0 | — | — | — | ||||||||||||
| Common Stocks | 12,547,725 | — | (2,518,441 | ) | — | |||||||||||
| Rights, Warrants and Certificates | 492,589 | — | 665,346 | — | ||||||||||||
|
| |||||||||||||||
| Total Assets | $ | 488,317,650 | $ | (121,838 | ) | $ | (6,314,493 | ) | $ | 6,151 | ||||||
|
| |||||||||||||||
a.Included in net investment income.
| Purchases | Sales | Transfers into Level 3 | Transfers out of Level 3 | Value as of August 31, | ||||||||||||||||
| ||||||||||||||||||||
| Assets Table | ||||||||||||||||||||
| Investments, at Value: | ||||||||||||||||||||
| Corporate Loans | $ | 7,090,526 | $ | (3,470,113 | ) | $ | 108,443,772 | $ | (89,548,154 | ) | $ | 493,216,282 | ||||||||
| Corporate Bonds and Notes | — | — | — | — | 0 | |||||||||||||||
| Common Stocks | 10,189,945 | — | 1,712,126 | (5,242,427 | ) | 16,688,928 | ||||||||||||||
| Rights, Warrants and Certificates | — | — | — | — | 1,157,935 | |||||||||||||||
|
| |||||||||||||||||||
| Total Assets | $ | 17,280,471 | $ | (3,470,113 | ) | $ | 110,155,898 | $ | (94,790,581 | ) | $ | 511,063,145 | ||||||||
|
| |||||||||||||||||||
The following is a reconciliation of assets in which significant unobservable inputs (level 3) were used in determining fair value for the year ended July 31, 2019:
| Value as of July 31, 2018 | Realized gain (loss) | Change in unrealized appreciation/ depreciation | Accretion/ (amortization) of premium/ discounta | |||||||||||||
| ||||||||||||||||
| Assets Table | ||||||||||||||||
| Investments, at Value: | ||||||||||||||||
| Corporate Loans | $ | 305,116,484 | $ | (1,831,721 | ) | $ | (30,614,451) | $ | 916,696 | |||||||
| Corporate Bonds and Notes | 2 | — | (2) | — | ||||||||||||
| Common Stocks | 33,708,463 | 10,880,671 | (56,928,505) | — | ||||||||||||
82 INVESCO OPPENHEIMER SENIOR FLOATING RATE FUND
| Value as of July 31, 2018 | Realized gain (loss) | Change in unrealized appreciation/ depreciation | Accretion/ (amortization) of premium/ discounta | |||||||||||||
| ||||||||||||||||
| Investments, at Value: (Continued) | ||||||||||||||||
| Rights, Warrants and Certificates | $ | 810,569 | $ | 120 | $ | (362,972 | ) | $ | — | |||||||
|
| |||||||||||||||
| Total Assets | $ | 339,635,518 | $ | 9,049,070 | $ | (87,905,930 | ) | $ | 916,696 | |||||||
|
| |||||||||||||||
a.Included in net investment income.
| Purchases | Sales | Transfers into Level 3 | Transfers out of Level 3 | Value as of July 31, 2019 | ||||||||||||||||
| ||||||||||||||||||||
| Assets Table | ||||||||||||||||||||
| Investments, at Value: | ||||||||||||||||||||
| Corporate Loans | $ | 108,611,721 | $ | (130,802,834 | ) | $ | 223,881,441 | $ | — | $ | 475,277,336 | |||||||||
| Corporate Bonds and Notes | — | — | — | — | 0 | |||||||||||||||
| Common Stocks | 12,460,747 | (24,017,522 | ) | 36,443,871 | — | 12,547,725 | ||||||||||||||
| Rights, Warrants and Certificates | — | — | 44,872 | — | 492,589 | |||||||||||||||
|
| |||||||||||||||||||
| Total Assets | $ | 121,072,468 | $ | (154,820,356 | ) | $ | 260,370,184 | $ | — | $ | 488,317,650 | |||||||||
|
| |||||||||||||||||||
The total change in unrealized appreciation/depreciation included in the Statement of Operations attributable to Level 3 investments still held for the one month reporting period at August 31, 2019:
| Change in unrealized appreciation/ depreciation | ||||
| ||||
| Assets Table | ||||
| Investments, at Value | ||||
| Corporate Loans | $ | (4,461,398) | ||
| Corporate Bonds and Notes | — | |||
| Common Stocks | (2,518,441) | |||
| Rights, Warrants and Certificates | 665,346 | |||
|
| |||
| Total | $ | (6,314,493) | ||
|
| |||
The total change in unrealized appreciation/depreciation included in the Statement of Operations attributable to Level 3 investments still held for the fiscal year reporting period at July 31, 2019:
| Change in unrealized appreciation/ depreciation | ||||
| ||||
| Assets Table | ||||
| Investments, at Value | ||||
| Corporate Loans | $ | (30,614,451) | ||
| Corporate Bonds and Notes | (2) | |||
| Common Stocks | (43,302,327) | |||
| Rights, Warrants and Certificates | (362,972) | |||
|
| |||
| Total | $ | (74,279,752) | ||
|
| |||
83 INVESCO OPPENHEIMER SENIOR FLOATING RATE FUND
NOTES TO FINANCIAL STATEMENTSContinued
The following table summarizes the valuation techniques and significant unobservable inputs used in determining fair value measurements for those investments classified as Level 3 for the one month reporting period at August 31, 2019:
| Value as of August 31, 2019 | Valuation Technique | Unobservable Input | Range of Unobservable Inputs | Unobservable Input Used | ||||||||||||||||
| ||||||||||||||||||||
| Assets Table | ||||||||||||||||||||
| Investments, at Value: | ||||||||||||||||||||
| Corporate Loans | $ | 374,208,077 | Broker Quote | N/A | N/A | N/A (a) | ||||||||||||||
| Corporate Loans | 119,008,205 | | Discounted Cash Flow Model | | | Illiquidity Discount | | N/A | 3.69% (b) | |||||||||||
| Implied rating | N/A | BB+ | ||||||||||||||||||
| | Yield to Maturity | | N/A | 3.81% | ||||||||||||||||
| Common Stocks | 16,688,928 | Broker Quote | N/A | N/A | N/A (a) | |||||||||||||||
| Rights, Warrants and Certificates | 380,152 | | Estimated Recovery | | | Auction Proceeds | | N/A | $0.058/share (c) | |||||||||||
| Rights, Warrants and Certificates | 777,783 | Broker Quote | N/A | N/A | N/A (a) | |||||||||||||||
|
| |||||||||||||||||||
| Total | $ | 511,063,145 | ||||||||||||||||||
|
| |||||||||||||||||||
(a) Securities classified as Level 3 whose unadjusted values were provided by a pricing service or broker-dealer for which such inputs are unobservable. The Manager periodically reviews pricing vendor and broker methodologies and inputs to confirm they are determined using unobservable inputs and have been appropriately classified. Such securities’ fair valuations could change significantly based on changes in unobservable inputs used by the pricing service or broker.
(b) The Fund fair values certain corporate loans using a discounted cash flow model which incorporates the Company’s EBITDA and leverage to determine an implied rating. The yield to maturity on other issues with similar leverage and rating is used as a basis for the discount rate, with an additional illiquidity discount applied. The illiquidity discount was determined based on the implied discount rate at origination. The Manager periodically reviews the financial statements and monitors such investments for additional market information or the occurrence of a significant event which would warrant a re-evaluation of the security’s fair valuation. Such security’s fair valuation could increase (decrease) significantly based on a decrease (increase) in the illiquidity discount. Such security’s fair valuation could also increase (decrease) based on an increase (decrease) in the implied rating or a decrease (increase) in the yield to maturity on other issues.
(c) The Fund fair values certain rights received following a merger at the estimated amount of future recovery proceeds from the sale of assets. The Manager monitors such investments for additional market information or the occurrence of a significant event which would warrant a re-evaluation of the security’s fair valuation. A significant increase (decrease) in the auction proceeds will result in a significant increase (decrease) to the fair value of the investment.
The following table summarizes the valuation techniques and significant unobservable inputs used in determining fair value measurements for those investments classified as Level 3 for the fiscal year end reporting period at July 31, 2019:
84 INVESCO OPPENHEIMER SENIOR FLOATING RATE FUND
Value as of July 31, 2019 | Valuation Technique | Unobservable Input | Range of Unobservable Inputs | Unobservable Input Used | ||||||||||||||||
| ||||||||||||||||||||
Assets Table | ||||||||||||||||||||
Investments, at Value: | ||||||||||||||||||||
Corporate Loans | $ | 354,269,087 | Broker Quote | N/A | N/A | N/A (a) | ||||||||||||||
Corporate Loans | 121,008,249 | | Discounted Cash Flow Model | | | Illiquidity Discount | | N/A | 3.69% (b) | |||||||||||
| Implied rating | N/A | BB+ | ||||||||||||||||||
| Yield to | ||||||||||||||||||||
| Maturity | N/A | 4.17% | ||||||||||||||||||
Common Stocks | 12,547,725 | Broker Quote | N/A | N/A | N/A (a) | |||||||||||||||
Rights, Warrants and Certificates | 380,151 | | Estimated Recovery Proceeds | | | Auction Proceeds | | N/A | $0.058/share (c) | |||||||||||
Rights, Warrants and Certificates | 112,438 | Broker Quote | N/A | N/A | N/A (a) | |||||||||||||||
|
| |||||||||||||||||||
Total | $ | 488,317,650 | ||||||||||||||||||
|
| |||||||||||||||||||
(a) Securities classified as Level 3 whose unadjusted values were provided by a pricing service or broker-dealer for which such inputs are unobservable. The Manager periodically reviews pricing vendor and broker methodologies and inputs to confirm they are determined using unobservable inputs and have been appropriately classified. Such securities’ fair valuations could change significantly based on changes in unobservable inputs used by the pricing service or broker.
(b) The Fund fair values certain corporate loans using a discounted cash flow model which incorporates the Company’s EBITDA and leverage to determine an implied rating. The yield to maturity on other issues with similar leverage and rating is used as a basis for the discount rate, with an additional illiquidity discount applied. The illiquidity discount was determined based on the implied discount rate at origination. The Manager periodically reviews the financial statements and monitors such investments for additional market information or the occurrence of a significant event which would warrant a re-evaluation of the security’s fair valuation. Such security’s fair valuation could increase (decrease) significantly based on a decrease (increase) in the illiquidity discount. Such security’s fair valuation could also increase (decrease) based on an increase (decrease) in the implied rating or a decrease (increase) in the yield to maturity on other issues.
(c) The Fund fair values certain rights received following a merger at the estimated amount of future recovery proceeds from the sale of assets. The Manager monitors such investments for additional market information or the occurrence of a significant event which would warrant a re-evaluation of the security’s fair valuation. A significant increase (decrease) in the auction proceeds will result in a significant increase (decrease) to the fair value of the investment.
Note 4 - Security Transactions with Affiliated Funds
The Fund is permitted to purchase or sell securities from or to certain other Invesco Funds under specified conditions outlined in procedures adopted by the Board of Trustees of the Trust. The procedures have been designed to ensure that any purchase or sale of securities by the Fund from or to another fund or portfolio that is or could be considered an affiliate by virtue of having a common investment adviser (or affiliated investment advisers), common Trustees and/or common officers complies with Rule 17a-7 of the 1940 Act. Further, as defined under the procedures, each transaction is effected at the current market price. Pursuant to these procedures for the period August 1, 2018 to May 24, 2019, the Predecessor Fund
85 INVESCO OPPENHEIMER SENIOR FLOATING RATE FUND
NOTES TO FINANCIAL STATEMENTSContinued
engaged in transactions with affiliates as listed: Securities purchases of $94,495,356. For the period May 25, 2019 to July 31, 2019 and August 1, 2019 to August 31, 2019, the Fund did not engage in transactions with affiliates.
Note 5 - Trustee and Officer Fees and Benefits
Certain Trustees have executed a Deferred Compensation Agreement pursuant to which they have the option to elect to defer receipt of all or a portion of the annual compensation they are entitled to receive from the Fund. For purposes of determining the amount owed to the Trustees under the plan, deferred amounts are treated as though equal dollar amounts had been invested in shares of the Fund or in other Invesco and/or Invesco Oppenheimer funds selected by the Trustees. The Fund purchases shares of the funds selected for deferral by the Trustees in amounts equal to his or her deemed investment, resulting in a Fund asset equal to the deferred compensation liability. Such assets are included as a component of “Other” within the asset section of the Statement of Assets and Liabilities. Deferral of Trustees’ fees under the plan will not affect the net assets of the Fund and will not materially affect the Fund’s assets, liabilities or net investment income per share. Amounts will be deferred until distributed in accordance with the compensation deferral plan.
Note 6 - Cash Balances
The Fund may borrow for leveraging in an amount up to 5% of the Fund’s total assets (excluding the amount borrowed) at the time the borrowing is made. In doing so, the Fund is permitted to temporarily carry a negative or overdrawn balance in its account with The Deutsche Bank Trust Company Americas, the custodian bank. Such balances, if any at period end, are shown in the Statement of Assets and Liabilities under the payable caption Amount due custodian. To compensate the custodian bank for such overdrafts, the overdrawn Fund may either (1) leave funds as a compensating balance in the account so the custodian bank can be compensated by earning the additional interest; or (2) compensate by paying the custodian bank at a rate agreed upon by the custodian bank and Invesco, not to exceed the contractually agreed upon rate. The Fund may not purchase additional securities when any borrowings from banks exceed 5% of the Fund’s total assets.
Note 7- Investment Transactions
The aggregate amount of investment securities (other than short-term securities, U.S. Treasury obligations and money market funds, if any) purchased and sold by the Fund the one month period ended August 31, 2019 was $61,331,745 and $593,630,384, respectively, and during year ended July 31, 2019 was $3,327,102,563 and $7,416,325,538, respectively.
Note 8 - Share Information
Transactions in shares of beneficial interest were as follows:
86 INVESCO OPPENHEIMER SENIOR FLOATING RATE FUND
One Month Ended August 31, 20191 |
Year Ended July 31, 20192
| Year Ended July 31, 2018
| ||||||||||||||||||||||
| Shares | Amount | Shares | Amount | Shares | Amount | |||||||||||||||||||
Class A | �� | |||||||||||||||||||||||
Sold | 3,334,455 | $ 25,513,333 | 121,894,575 | $ | 966,250,971 | 113,887,862 | $ | 926,101,627 | ||||||||||||||||
Dividends and/or distributions reinvested | 1,602,475 | 12,205,619 | 20,453,083 | 161,843,667 | 18,691,785 | 151,801,016 | ||||||||||||||||||
Redeemed | (16,149,208 | ) | (123,620,398 | ) | (222,198,045 | ) | (1,758,889,018 | ) | (147,859,223 | ) | (1,201,296,566) | |||||||||||||
|
| |||||||||||||||||||||||
Net decrease | (11,212,278 | ) | $ (85,901,446 | ) | (79,850,387 | ) | $ | (630,794,380 | ) | (15,279,576 | ) | $ | (123,393,923) | |||||||||||
|
| |||||||||||||||||||||||
| ||||||||||||||||||||||||
Class B | ||||||||||||||||||||||||
Sold | — | $ — | — | $ | — | 26,047 | $ | 211,878 | ||||||||||||||||
Dividends and/or distributions reinvested | — | — | — | — | 27,544 | 223,646 | ||||||||||||||||||
Redeemed3 | — | — | — | — | (1,822,074 | ) | (14,820,914) | |||||||||||||||||
|
| |||||||||||||||||||||||
Net decrease | — | $ — | — | $ | — | (1,768,483 | ) | $ | (14,385,390) | |||||||||||||||
|
| |||||||||||||||||||||||
| ||||||||||||||||||||||||
Class C | ||||||||||||||||||||||||
Sold | 645,497 | $ 4,944,837 | 23,005,819 | $ | 183,900,528 | 31,355,000 | $ | 255,178,689 | ||||||||||||||||
Dividends and/or distributions reinvested | 745,666 | 5,684,712 | 11,179,383 | 88,574,723 | 9,880,807 | 80,339,393 | ||||||||||||||||||
Redeemed | (9,528,407 | ) | (72,984,279 | ) | (117,970,043 | ) | (931,241,019 | ) | (78,982,795 | ) | (642,343,698) | |||||||||||||
|
| |||||||||||||||||||||||
Net decrease | (8,137,244 | ) | $ (62,354,730 | ) | (83,784,841 | ) | $ | (658,765,768 | ) | (37,746,988 | ) | $ | (306,825,616) | |||||||||||
|
| |||||||||||||||||||||||
| ||||||||||||||||||||||||
Class R | ||||||||||||||||||||||||
Sold | 173,093 | $ 1,322,516 | 4,028,061 | $ | 32,105,952 | 4,388,349 | $ | 35,653,807 | ||||||||||||||||
Dividends and/or distributions reinvested | 46,776 | 355,964 | 558,633 | 4,413,596 | 339,074 | 2,753,282 | ||||||||||||||||||
Redeemed | (504,374 | ) | (3,858,031 | ) | (3,668,309 | ) | (28,955,863 | ) | (1,928,149 | ) | (15,661,430) | |||||||||||||
|
| |||||||||||||||||||||||
Net increase (decrease) | (284,505 | ) | $ (2,179,551 | ) | 918,385 | $ | 7,563,685 | 2,799,274 | $ | 22,745,659 | ||||||||||||||
|
| |||||||||||||||||||||||
| ||||||||||||||||||||||||
Class Y | ||||||||||||||||||||||||
Sold | 10,956,625 | $ 83,742,171 | 291,223,580 | $ | 2,320,532,574 | 342,275,108 | $ | 2,777,278,627 | ||||||||||||||||
Dividends and/or distributions reinvested | 2,692,312 | 20,488,490 | 40,632,916 | 320,984,990 | 32,789,994 | 265,782,200 | ||||||||||||||||||
Redeemed | (70,930,904 | ) | (541,579,258 | ) | (576,193,211 | ) | (4,537,953,718 | ) | (277,451,475 | ) | (2,249,656,033) | |||||||||||||
|
| |||||||||||||||||||||||
Net increase (decrease) | (57,281,967 | ) | $ (437,348,597 | ) | (244,336,715 | ) | $ | (1,896,436,154 | ) | 97,613,627 | $ | 793,404,794 | ||||||||||||
|
| |||||||||||||||||||||||
87 INVESCO OPPENHEIMER SENIOR FLOATING RATE FUND
NOTES TO FINANCIAL STATEMENTSContinued
One Month Ended August 31, 20191 |
Year Ended July 31, 20192
|
Year Ended July 31, 2018
| ||||||||||||||||||||||
| Shares | Amount | Shares | Amount | Shares | Amount | |||||||||||||||||||
Class R54 | ||||||||||||||||||||||||
Sold | — | $ — | 1,271 | $ | 10,000 | — | $ | — | ||||||||||||||||
Dividends and/or distributions reinvested | — | — | — | — | — | — | ||||||||||||||||||
Redeemed | — | — | — | — | — | — | ||||||||||||||||||
|
| |||||||||||||||||||||||
Net increase | — | $ — | 1,271 | $ | 10,000 | — | $ | — | ||||||||||||||||
|
| |||||||||||||||||||||||
| ||||||||||||||||||||||||
Class R6 | ||||||||||||||||||||||||
Sold | 1,242,362 | $ 9,494,331 | 69,306,762 | $ | 549,913,906 | 84,967,842 | $ | 689,505,669 | ||||||||||||||||
Dividends and/or distributions reinvested | 479,068 | 3,645,710 | 5,494,978 | 43,372,060 | 4,117,781 | 33,364,407 | ||||||||||||||||||
Redeemed | (6,933,840 | ) | (52,956,936 | ) | (107,787,292 | ) | (851,503,815 | ) | (55,203,401 | ) | (446,938,016) | |||||||||||||
|
| |||||||||||||||||||||||
Net increase (decrease) | (5,212,410 | ) | $ (39,816,895 | ) | (32,985,552 | ) | $ | (258,217,849 | ) | 33,882,222 | $ | 275,932,060 | ||||||||||||
|
| |||||||||||||||||||||||
1.There are entities that are record owners of more than 5% of the outstanding shares of the Fund and own 37% of the outstanding shares of the Fund. IDI has an agreement with these entities to sell Fund shares. The Fund, Invesco and/or Invesco affiliates may make payments to these entities, which are considered to be related to the Fund, for providing services to the Fund, Invesco and/or Invesco affiliates, including but not limited to services such as securities brokerage, distribution, third party record keeping and account servicing. The Fund has no knowledge as to whether all or any portion of the shares owned of record by these entities are also owned beneficially.
2. There are entities that are record owners of more than 5% of the outstanding shares of the Fund and own 37% of the outstanding shares of the Fund. IDI has an agreement with these entities to sell Fund shares. The Fund, Invesco and/or Invesco affiliates may make payments to these entities, which are considered to be related to the Fund, for providing services to the Fund, Invesco and/or Invesco affiliates, including but not limited to services such as securities brokerage, distribution, third party record keeping and account servicing. The Fund has no knowledge as to whether all or any portion of the shares owned of record by these entities are also owned beneficially.
3. All outstanding Class B shares converted to Class A shares on June 1, 2018.
4. Commencement date after the close of business on May 24, 2019.
Note 9 - Unfunded Loan Commitments
As of August 31, 2019, the Fund had unfunded loan commitments, which could be extended at the option of the borrower, pursuant to the following loan agreements with the following borrowers:
| Borrower | Type | Principal Amount | Value | |||||||
Mavis Tire Express Services Corp. | Delayed Draw Term Loan | $2,802,620 | $2,755,340 | |||||||
Deluxe Entertainment Services Group, Inc. | Delayed Draw Term Loan | 466,226 | 431,259 | |||||||
| $3,186,599 | ||||||||||
As of July 31, 2019, the Fund had unfunded loan commitments, which could be extended at the option of the borrower, pursuant to the following loan agreements with the following borrowers:
88 INVESCO OPPENHEIMER SENIOR FLOATING RATE FUND
| Borrower | Type | Principal Amount | Value | |||||||
| Mavis Tire Express Services Corp. | Delayed Draw Term Loan | $2,802,620 | $2,762,346 | |||||||
Note 10 - Dividends
The Fund declared the following monthly dividends from net investment income subsequent to August 31, 2019:
| Share Class | Record Date | Amount Per Share Payable | ||||||
| Class A | Daily | 0.0311 | ||||||
| Class C | Daily | 0.0264 | ||||||
| Class R | Daily | 0.0296 | ||||||
| Class Y | Daily | 0.0326 | ||||||
| Class R5 | Daily | 0.0331 | ||||||
| Class R6 | Daily | 0.0333 | ||||||
The Fund declared the following monthly dividends from net investment income subsequent to July 31, 2019:
| Share Class | Record Date | Amount Per Share Payable August 30, 2019 | ||||||
| Class A | Daily | 0.0336 | ||||||
| Class C | Daily | 0.0288 | ||||||
| Class R | Daily | 0.0320 | ||||||
| Class Y | Daily | 0.0352 | ||||||
| Class R5 | Daily | 0.0356 | ||||||
| Class R6 | Daily | 0.0359 | ||||||
Note 11 - Borrowings
Borrowings.The Fund can borrow money from banks in amounts up to one third of its total assets (including the amount borrowed) less all liabilities and indebtedness other than borrowings (meaning that the value of those assets must be at least 300% of the amount borrowed). The Fund can use those borrowings for investment-related purposes such as purchasing senior loans and other portfolio securities. The Fund also may borrow to meet redemption obligations or for temporary and emergency purposes. When the Fund invests borrowed money in senior loans or other portfolio securities, it is using a speculative investment technique known as leverage and changes in the value of the Fund’s investments will have a larger effect on its share price than if it did not borrow because of the effect of leverage.
The Fund will pay interest and may pay other fees in connection with loans. If the Fund does borrow, it will be subject to greater expenses than funds that do not borrow. The interest on borrowed money and the other fees incurred in conjunction with loans are an expense that might reduce the Fund’s yield and return. Expenses incurred by the Fund with respect to
89 INVESCO OPPENHEIMER SENIOR FLOATING RATE FUND
NOTES TO FINANCIAL STATEMENTSContinued
interest on borrowings and related fees are disclosed separately or as other expenses on the Statement of Operations.
At period end August 31, 2019 and July 31, 2019, the Fund had no such borrowings outstanding.
Details of the borrowings for the one month reporting period ended August 31, 2019 are as follows:
| Fees Paid | $ | 581,250 |
Details of the borrowings for the reporting period ended July 31, 2019 are as follows:
| Average Daily Loan Balance | $ | 4,904,109 | ||
| Average Daily Interest Rate | 3.50 | % | ||
| Fees Paid | $ | 13,012,252 | ||
| Interest Paid | $ | 251,754 |
90 INVESCO OPPENHEIMER SENIOR FLOATING RATE FUND
REPORT OF INDEPENDENT REGISTERED PUBLIC ACCOUNTING FIRM
To the Board of Trustees of AIM Counselor Series Trust (Invesco Counselor Series Trust) and Shareholders of Invesco Oppenheimer Senior Floating Rate Fund
Opinion on the Financial Statements
We have audited the accompanying statement of assets and liabilities, including the schedule of investments, of Invesco Oppenheimer Senior Floating Rate Fund (one of the funds constituting AIM Counselor Series trust (Invesco Counselor Series Trust), referred to hereafter as the “Fund”) as of July 31, 2019 and August 31, 2019, the related statement of operations and the statement of changes in net assets, for the year ended July 31, 2019 and the period ended August 31, 2019, and the financial highlights for each of the periods ended July 31, 2019 and August 31, 2019, including the related notes (collectively referred to as the “financial statements”). In our opinion, the financial statements present fairly, in all material respects, the financial position of the Fund as of July 31, 2019 and August 31, 2019, the results of its operations and changes in its net assets for the year ended July 31, 2019 and the period ended August 31, 2019, and the financial highlights for each of the periods ended July 31, 2019 and August 31, 2019 in conformity with accounting principles generally accepted in the United States of America.
The financial statements of Invesco Oppenheimer Senior Floating Rate Fund (formerly known as Oppenheimer Senior Floating Rate Fund) as of and for the year ended July 31, 2018 and the financial highlights for each of the periods ended on or prior to July 31, 2018 (not presented herein, other than the statement of changes in net assets and the financial highlights) were audited by other auditors whose report dated September 26, 2018 expressed an unqualified opinion on those financial statements and financial highlights.
Basis for Opinion
These financial statements are the responsibility of the Fund’s management. Our responsibility is to express an opinion on the Fund’s financial statements based on our audits. We are a public accounting firm registered with the Public Company Accounting Oversight Board (United States) (PCAOB) and are required to be independent with respect to the Fund in accordance with the U.S. federal securities laws and the applicable rules and regulations of the Securities and Exchange Commission and the PCAOB.
We conducted our audits of these financial statements in accordance with the standards of the PCAOB. Those standards require that we plan and perform the audits to obtain reasonable assurance about whether the financial statements are free of material misstatement, whether due to error or fraud.
Our audits included performing procedures to assess the risks of material misstatement of the financial statements, whether due to error or fraud, and performing procedures that respond to those risks. Such procedures included examining, on a test basis, evidence regarding the amounts and disclosures in the financial statements. Our audits also included evaluating the accounting principles used and significant estimates made by management, as well as evaluating the overall presentation of the financial statements. Our procedures included confirmation of securities
91 INVESCO OPPENHEIMER SENIOR FLOATING RATE FUND
REPORT OF INDEPENDENT REGISTERED PUBLIC ACCOUNTING FIRM
owned as of July 31, 2019 and August 31, 2019 by correspondence with the custodian, transfer agent, brokers and agent banks; when replies were not received from brokers or agent banks, we performed other auditing procedures. We believe that our audits provides a reasonable basis for our opinion.
/s/PricewaterhouseCoopers LLP
Houston, TX
October 14, 2019
We have served as the auditor of one or more investment companies in the Invesco group of investment companies since at least 1995. We have not been able to determine the specific year we began serving as auditor.
92 INVESCO OPPENHEIMER SENIOR FLOATING RATE FUND
INDEPENDENT REGISTERED PUBLIC ACCOUNTING FIRM
The Audit Committee of the Board of Trustees appointed, and the Board of Trustees ratified and approved, PricewaterhouseCoopers LLP (“PWC”) as the independent registered public accounting firm of the Fund for the fiscal periods ending after May 24, 2019. Prior to the close of business on May 24, 2019, the Predecessor Fund was a separate series of an unaffiliated investment company and its financial statements were audited by a different independent registered public accounting firm (the “Prior Auditor”).
Effective after the close of business on May 24, 2019, the Prior Auditor resigned as the independent registered public accounting firm of the Fund. The Prior Auditor’s report on the financial statements of the Predecessor Fund for the past two fiscal years did not contain an adverse or disclaimer of opinion, and was not qualified or modified as to uncertainty, audit scope or accounting principles. During the Predecessor Fund’s two most recent fiscal years and through the close of business on May 24, 2019, there were no (1) disagreements with the Prior Auditor on any matter of accounting principles or practices, financial statement disclosure, or auditing scope or procedure, which disagreements, if not resolved to the Prior Auditor’s satisfaction, would have caused it to make reference to that matter in connection with its report; or (2) “reportable events,” as that term is defined in Item 304(a)(1)(v) of Regulation S-K under the Securities Exchange Act of 1934.
93 INVESCO OPPENHEIMER SENIOR FLOATING RATE FUND
FEDERAL INCOME TAX INFORMATIONUnaudited
In early 2019, if applicable, shareholders of record received information regarding all dividends and distributions paid to them by the Fund during calendar year 2018.
Dividends, if any, paid by the Fund during the reporting period which are not designated as capital gain distributions should be multiplied by the maximum amount allowable but not less than 2.73% and 0.84% for the one month ended August 31, 2019 and the fiscal year ended July 31, 2019, respectively, to arrive at the amount eligible for the corporate dividend-received deduction.
A portion, if any, of the dividends paid by the Fund during the reporting period which are not designated as capital gain distributions are eligible for lower individual income tax rates to the extent that the Fund has received qualified dividend income as stipulated by recent tax legislation. The maximum amount allowable but not less than $1,358,896 and $5,904,966 of the Fund’s fiscal year taxable income for the one month ended August 31, 2019 and fiscal year ended July 31, 2019, respectively, may be eligible for the lower individual income tax rates. In early 2019, shareholders of record received information regarding the percentage of distributions that are eligible for lower individual income tax rates.
Recent tax legislation allows a regulated investment company to designate distributions not designated as capital gain distributions, as either interest related dividends or short-term capital gain dividends, both of which are exempt from the U.S. withholding tax applicable to non U.S. taxpayers. For the reporting period, the maximum amount allowable but not less than $44,826,553 and $628,307,459 of the ordinary distributions to be paid by the Fund for the one month ended August 31, 2019 and the fiscal year ended July 31, 2019, respectively, qualifies as an interest related dividend.
The foregoing information is presented to assist shareholders in reporting distributions received from the Fund to the Internal Revenue Service. Because of the complexity of the federal regulations which may affect your individual tax return and the many variations in state and local tax regulations, we recommend that you consult your tax advisor for specific guidance.
94 INVESCO OPPENHEIMER SENIOR FLOATING RATE FUND
APPROVAL OF INVESTMENT ADVISORY AND SUB-ADVISORY CONTRACTSUnaudited
At meetings held on December 14, 2018, the Board of Trustees (the Board or the Trustees) of AIM Counselor Series Trust (Invesco Counselor Series Trust) (the Trust) as a whole, and the independent Trustees, who comprise over 75% of the Board, voting separately, approved (i) an amendment to the Trust’s Master Investment Advisory Agreement with Invesco Advisers, Inc. (Invesco Advisers and the investment advisory agreement) to add Invesco Oppenheimer Senior Floating Rate Fund (the Fund), (ii) an amendment to the Master Intergroup Sub-Advisory Contract for Mutual Funds with Invesco Asset Management Deutschland GmbH, Invesco Asset Management Limited, Invesco Asset Management (Japan) Limited, Invesco Hong Kong Limited, Invesco Senior Secured Management, Inc. and Invesco Canada Ltd. to add the Fund, (iii) an amendment to the separate sub-advisory contract with Invesco Capital Management LLC to add the Fund, (iv) an amendment to the separate sub-advisory contract with Invesco Asset Management (India) Private Limited to add the Fund, and (v) an initial sub-advisory contract with OppenheimerFunds, Inc. (collectively, the Affiliated Sub-Advisers and the sub-advisory contracts). Additionally, on March 26, 2019, the Board re-approved an initial sub-advisory contract with OppenheimerFunds, Inc. following its change of control as a result of the acquisition of OppenheimerFunds, Inc. and its subsidiaries, including the Oppenheimer mutual funds (each, an Oppenheimer Fund), by Invesco Ltd. (the OFI Transaction). After evaluating the factors discussed below, among others, the Board approved the Fund’s investment advisory agreement and the sub-advisory contracts and determined that the compensation payable by the Fund to Invesco Advisers and by Invesco Advisers to the Affiliated Sub-Advisers is fair and reasonable.
The Board’s Evaluation Process
The Board noted that it had previously approved establishing the Fund at the Board meeting held on October 23, 2018 and that the Fund was formed to acquire the assets and liabilities of an Oppenheimer Fund (the Acquired Fund) with the same investment objective and substantially similar principal investment strategies and risks. At the time of approval, the Fund had no assets and no performance history and the portfolio managers were not employed by Invesco Advisers or any of the Affiliated Sub-Advisers except OppenheimerFunds, Inc., which was not affiliated with Invesco at that time.
In approving the investment advisory agreement and sub-advisory contracts, the Board followed a process similar to the process that it follows in annually reviewing and approving investment advisory agreements and sub-advisory contracts for the series portfolios of funds advised by Invesco Advisers and considered the information provided in the most recent annual review process for those funds as well as the information provided with respect to the Fund. As part of the approval process, the Board reviewed and considered information provided in response to detailed requests for information submitted to management by the independent Trustees with assistance from legal counsel to the independent Trustees. The Board reviewed comparative investment performance and fee data prepared by Invesco Advisers and an independent mutual fund data provider. The Board was assisted in its review by the Senior Officer, an officer of the Invesco Funds who reports directly to the independent Trustees, and by independent legal counsel.
95 INVESCO OPPENHEIMER SENIOR FLOATING RATE FUND
APPROVAL OF INVESTMENT ADVISORY AND SUB-ADVISORY CONTRACTSUnaudited / Continued
The discussion below serves as a summary of the material factors and related conclusions that formed the basis for the Board’s approval of the Fund’s investment advisory agreement and sub-advisory contracts. The Trustees’ review and conclusions are based on the comprehensive consideration of all information presented to them and are not the result of any single determinative factor. Moreover, one Trustee may have weighed a particular piece of information or factor differently than another Trustee. This information is current as of December 14, 2018 and March 26, 2019 for the sub-advisory contract with OppenheimerFunds, Inc.
Factors and Conclusions and Summary of Independent Written Fee Evaluation
A. Nature, Extent and Quality of Services Provided by Invesco Advisers and the Affiliated Sub-Advisers
The Board reviewed the nature, extent and quality of the advisory services to be provided to the Fund by Invesco Advisers under the Fund’s investment advisory agreement, and the credentials and experience of the officers and employees of Invesco Advisers who will provide these services. The Board’s review included consideration of the investment process oversight and structure, credit analysis and investment risk management to be employed in providing advisory services to the Fund. The Board also considered non-advisory services that Invesco Advisers and its affiliates provide to the Invesco Funds and will provide to the Fund, such as various back office support functions, third party oversight, internal audit, valuation, portfolio trading and legal and compliance. The Board also received and reviewed information about Invesco Advisers’ role as administrator of the Invesco Funds’ liquidity risk management program. The Board also reviewed and considered the benefits to shareholders of investing in a fund that is part of the Invesco family of funds under the umbrella of Invesco Ltd., Invesco Advisers’ parent company, and noted Invesco Ltd.’s depth and experience in conducting an investment management business, as well as its commitment of financial and other resources to such business. The Board reviewed and considered information about the resources that Invesco Advisers intends to continue to commit to managing the Invesco family of funds, including the Fund, following the OFI Transaction. The Board concluded that the nature, extent and quality of the services to be provided to the Fund by Invesco Advisers are appropriate and satisfactory.
The Board reviewed the services that may be provided by the Affiliated Sub-Advisers under the sub-advisory contracts and the credentials and experience of the officers and employees of the Affiliated Sub-Advisers who provide these services. The Board noted the Affiliated Sub-Advisers’ expertise with respect to certain asset classes and that the Affiliated Sub-Advisers have offices and personnel that are located in financial centers around the world. As a result, the Board noted that the Affiliated Sub-Advisers can provide research and investment analysis on the markets and economies of various countries in which the Fund may invest, make recommendations regarding securities and assist with security trades. The Board concluded that the sub-advisory contracts may benefit the Fund and its shareholders by permitting Invesco Advisers to use the resources and talents of the Affiliated Sub-Advisers
96 INVESCO OPPENHEIMER SENIOR FLOATING RATE FUND
in managing the Fund. The Board concluded that the nature, extent and quality of the services that may be provided by the Affiliated Sub-Advisers are appropriate and satisfactory.
B. Fund Investment Performance
The Board noted that the Fund would continue the historical performance information of the Acquired Fund following the consummation of the OFI Transaction. The Board considered the performance of the Acquired Fund and the fact that, at the closing of the OFI Transaction, management anticipates that the Fund will be managed pursuant to substantially similar investment strategies and by substantially the same portfolio management team as managed the Acquired Fund. The Board did not view Fund performance as a relevant factor in considering whether to approve the sub-advisory contracts for the Fund, as no Affiliated Sub-Adviser currently manages assets of the Fund.
The Board compared the Fund’s investment performance over multiple time periods ending December 31, 2017 to the performance of funds in the Morningstar performance universe and against the Fund’s benchmark index. The Trustees also reviewed more recent Fund performance and this review did not change their conclusions.
C. Advisory and Sub-Advisory Fees and Fund Expenses
The Board compared the Fund’s contractual management fee rate to the contractual management fee rates of funds in the Fund’s Morningstar expense group. The Board also considered comparative information regarding the Fund’s total expense ratio and its various components.
The Board noted that Invesco Advisers has contractually agreed to waive fees and/or limit expenses of the Fund for at least two years from the closing date of the OFI Transaction in an amount necessary to limit total annual operating expenses to a specified percentage of average daily net assets for each class of the Fund.
The Board also considered the fees charged by Invesco Advisers and the Affiliated Sub-Advisers to other similarly managed client accounts. The Board noted that Invesco Advisers or the Affiliated Sub-Advisers may charge lower fees to large institutional clients. Invesco Advisers reviewed with the Board differences in the scope of services it provides to the Invesco Funds relative to certain other types of client accounts, including management of cash flows as a result of redemptions and purchases, necessary infrastructure such as officers, office space, technology, legal and distribution, oversight of service providers, costs and business risks associated with launching new funds and sponsoring and maintaining the product line, preparation of annual registration statement updates and financial information and compliance with federal and state laws and regulations.
The Board also considered the services that may be provided by the Affiliated Sub-Advisers pursuant to the sub-advisory contracts, as well as the fees payable by Invesco Advisers to the Affiliated Sub-Advisers pursuant to the sub-advisory contracts.
97 INVESCO OPPENHEIMER SENIOR FLOATING RATE FUND
APPROVAL OF INVESTMENT ADVISORY AND SUB-ADVISORY CONTRACTS Unaudited / Continued
D. Economies of Scale and Breakpoints
The Board considered the extent to which there may be economies of scale in the provision of advisory services to the Fund. The Board considered Invesco’s reinvestment in its business, including investments in business infrastructure and cybersecurity. The Board also considered that the Fund may benefit from economies of scale through contractual breakpoints in the Fund’s advisory fee schedule, which generally operate to reduce the Fund’s expense ratio as it grows in size. The Board noted that the Fund will share directly in economies of scale through lower fees charged by third party service providers based on the combined size of the Invesco Funds. The Board noted that the Fund may also benefit from economies of scale through initial fee setting, fee waivers and expense reimbursements.
E. Profitability and Financial Resources
The Board reviewed information from the 2018 contract renewal process provided by Invesco Advisers concerning the costs of the advisory and other services that Invesco Advisers and its affiliates provide to the Invesco Funds and the profitability of Invesco Advisers and its affiliates in providing these services. The Board considered the methodology used for calculating profitability and noted the periodic review of such methodology by an independent consultant. The Board noted that Invesco Advisers will continue to operate at a net profit from services Invesco Advisers and its affiliates provide to the Invesco Funds. The Board did not deem the level of profits realized by Invesco Advisers and its affiliates from providing services to the Invesco Funds, and the profits estimated to be realized by the Fund, to be excessive given the nature, extent and quality of the services provided. The Board received information from Invesco Advisers demonstrating that Invesco Advisers and the Affiliated Sub-Advisers are financially sound and have the resources necessary to perform their obligations under the investment advisory agreement and sub-advisory contracts.
F. Collateral Benefits to Invesco Advisers and its Affiliates
The Board considered various other benefits to be received by Invesco Advisers and its affiliates from the relationship with the Fund, including the fees to be received for providing administrative, transfer agency and distribution services to the Fund. The Board considered the performance of Invesco Advisers and its affiliates in providing these services to other Invesco Funds and the organizational structure employed to provide these services. The Board also considered that these services will be provided to the Fund pursuant to written contracts that are reviewed and approved on an annual basis by the Board; and that the services are required for the operation of the Fund.
The Board considered the benefits realized by Invesco Advisers and the Affiliated Sub- Advisers as a result of portfolio brokerage transactions executed through “soft dollar” arrangements. Invesco Advisers noted that the Fund will not execute brokerage transaction through “soft dollar” arrangements to any significant degree.
98 INVESCO OPPENHEIMER SENIOR FLOATING RATE FUND
The Board considered that the Fund’s uninvested cash and cash collateral from any securities lending arrangements may be invested in money market funds advised by Invesco Advisers pursuant to procedures approved by the Board. The Board considered that Invesco Advisers will receive advisory fees from these affiliated money market funds attributable to such investments, although Invesco Advisers has contractually agreed to waive through varying periods the advisory fees payable by the Invesco Funds with respect to certain investments in the affiliated money market funds. The waiver is in an amount equal to 100% of the net advisory fee Invesco Advisers will receive from the affiliated money market funds with respect to the Fund’s investment in the affiliated money market funds of uninvested cash, but not cash collateral. The Board concluded that the amount of advisory fees to be received by Invesco Advisers from the Fund’s investment of cash collateral from any securities lending arrangements in the affiliated money market funds is fair and reasonable.
99 INVESCO OPPENHEIMER SENIOR FLOATING RATE FUND
PORTFOLIO PROXY VOTING POLICIES AND GUIDELINES; UPDATES TO SCHEDULE OF INVESTMENTSUnaudited
Go paperless with eDelivery
Visit invesco.com/edelivery to enjoy the convenience and security of anytime electronic access to your investment documents.
With eDelivery, you can elect to have any or all of the following materials delivered straight to your inbox to download, save and print from your own computer:
| ● | Fund reports and prospectuses |
| ● | Quarterly statements |
| ● | Daily confirmations |
| ● | Tax forms |
Invesco mailing information
Send general correspondence to Invesco Investment Services, Inc., P.O. Box 219078, Kansas City, MO 64121-9078.
Important notice regarding delivery of security holder documents
To reduce Fund expenses, only one copy of most shareholder documents may be mailed to shareholders with multiple accounts at the same address (Householding). Mailing of your shareholder documents may be householded indefinitely unless you instruct us otherwise. If you do not want the mailing of these documents to be combined with those for other members of your household, please contact Invesco Investment Services, Inc. at 800 959 4246 or contact your financial institution. We will begin sending you individual copies for each account within 30 days after receiving your request.
Fund holdings and proxy voting information
The Fund provides a complete list of its holdings four times in each fiscal year, at the quarter ends. For the second and fourth quarters, the lists appear in the Fund’s semiannual and annual reports to shareholders. For the first and third quarters, the Fund files the lists with the Securities and Exchange Commission (SEC) on Form N-PORT. The most recent list of portfolio holdings is available at invesco. com/completeqtrholdings. Shareholders can also look up the Fund’s Forms N-PORT on the SEC website at sec.gov.
A description of the policies and procedures that the Fund uses to determine how to vote proxies relating to portfolio securities is available without charge, upon request, from our Client Services department at 800 959 4246 or at invesco.com/proxyguidelines. The information is also available on the SEC website, sec.gov.
Information regarding how the Fund voted proxies related to its portfolio securities during the most recent 12-month period ended June 30 is available at invesco.com/proxysearch. The information is also available on the SEC website, sec.gov.
Invesco Advisers, Inc. is an investment adviser; it provides investment advisory services to individual and institutional clients and does not sell securities. Invesco Distributors, Inc. is the US distributor for Invesco Ltd.’s retail mutual funds, exchange-traded funds and institutional money market funds. Both are wholly owned, indirect subsidiaries of Invesco Ltd.
100 INVESCO OPPENHEIMER SENIOR FLOATING RATE FUND
A Special Meeting (“Meeting”) of Shareholders of Invesco Oppenheimer Senior Floating Rate Fund was held on April 12, 2019. The Meeting was held for the following purpose:
(1) Approval of an Agreement and Plan of Reorganization that provides for the reorganization of Oppenheimer Senior Floating Rate Fund into Invesco Oppenheimer Senior Floating Rate Fund.
The results of the voting on the above matter was as follows:
| Matter | Votes For | Votes Against | Votes Abstain | Broker Non-Votes | ||||||||||||
| (1) Approval of an Agreement and Plan of Reorganization | 778,859,654 | 15,421,242 | 83,685,154 | 0 | ||||||||||||
101 INVESCO OPPENHEIMER SENIOR FLOATING RATE FUND
TRUSTEES AND OFFICERSUnaudited
The address of each trustee and officer is AIM Counselor Series Trust (Invesco Counselor Series Trust) (the “Trust”), 11 Greenway Plaza, Suite 1000, Houston, Texas 77046-1173. The trustees serve for the life of the Trust, subject to their earlier death, incapacitation, resignation, retirement or removal as more specifically provided in the Trust’s organizational documents. Each officer serves for a one year term or until their successors are elected and qualified. Column two below includes length of time served with predecessor entities, if any.
Name, Year of Birth and Position(s) Held with the Trust | Trustee and/or Officer Since | Principal Occupation(s) During Past 5 Years | Number of Funds in Fund Complex | Other Directorship(s) Held by Trustee During Past 5 Years | ||||
INTERESTED PERSONS
| ||||||||
| Martin L. Flanagan1— 1960 Trustee and Vice Chair | 2007 | Executive Director, Chief Executive Officer and President, Invesco Ltd. (ultimate parent of Invesco and a global investment management firm); Trustee and Vice Chair, The Invesco Funds; Vice Chair, Investment Company Institute; and Member of Executive Board, SMU Cox School of Business
Formerly: Advisor to the Board, Invesco Advisers, Inc. (formerly known as Invesco Institutional (N.A.), Inc.); Chairman and Chief Executive Officer, Invesco Advisers, Inc. (registered investment adviser); Director, Chairman, Chief Executive Officer and President, Invesco Holding Company (US), Inc. (formerly IVZ Inc.) (holding company), Invesco Group Services, Inc. (service provider) and Invesco North American Holdings, Inc. (holding company); Director, Chief Executive Officer and President, Invesco Holding Company Limited (parent of Invesco and a global investment management firm); Director, Invesco Ltd.; Chairman, Investment Company Institute and President, Co-Chief Executive Officer, Co-President, Chief Operating Officer and Chief Financial Officer, Franklin Resources, Inc. (global investment management organization)
| 240 | None | ||||
Philip A. Taylor2— 1954 Trustee | 2006 | Vice Chair, Invesco Ltd.; Trustee, The Invesco Funds
Formerly: Director, Invesco Canada Ltd. (formerly known as Invesco Trimark Ltd./ Invesco Trimark Ltèe) (registered investment adviser and registered transfer agent); Head of the Americas and Senior Managing Director, Invesco Ltd.; Director, Invesco Advisers, Inc. (formerly known as Invesco Institutional (N.A.), Inc.) (registered investment adviser);
| 240 | None | ||||
1 Mr. Flanagan is considered an interested person (within the meaning of Section 2(a)(19) of the 1940 Act) of the Trust because he is an officer of the Adviser to the Trust, and an officer and a director of Invesco Ltd., ultimate parent of the Adviser.
| ||||||||
2 Mr. Taylor is considered an interested person (within the meaning of Section 2(a)(19) of the 1940 Act) of the Trust because he is an officer of Invesco Ltd., ultimate parent of the Adviser.
| ||||||||
102 INVESCO OPPENHEIMER SENIOR FLOATING RATE FUND
Name, Year of Birth and Position(s) Held with the Trust | Trustee and/or Officer Since | Principal Occupation(s) During Past 5 Years | Number of Funds in Fund Complex | Other Directorship(s) Held by Trustee During Past 5 Years | ||||
INTERESTED PERSONS (CONTINUED) | ||||||||
| Philip A. Taylor (Continued) | Director and Chairman, Invesco Investment Services, Inc. (formerly known as Invesco AIM Investment Services, Inc.) (registered transfer agent); Chief Executive Officer, Invesco Corporate Class Inc. (corporate mutual fund company); Chairman and Chief Executive Officer, Invesco Canada Ltd. (formerly known as Invesco Trimark Ltd./ Invesco Trimark Ltèe) (registered investment adviser and registered transfer agent); Senior Vice President, The Invesco Funds; Director, Invesco Investment Advisers LLC (formerly known as Van Kampen Asset Management); Director, Chairman, Chief Executive Officer and President, Invesco Management Group, Inc. (formerly known as Invesco AIM Management Group, Inc.) (financial services holding company); Co-Chairman, Co-President and Co-Chief Executive Officer, Invesco Advisers, Inc. (formerly known as Invesco Institutional (N.A.), Inc.) (registered investment adviser); Director, Chief Executive Officer and President, Van Kampen Exchange Corp; President and Principal Executive Officer, The Invesco Funds (other than AIM Treasurer’s Series Trust (Invesco Treasurer’s Series Trust), Short-Term Investments Trust and Invesco Management Trust); Executive Vice President, The Invesco Funds (AIM Treasurer’s Series Trust (Invesco Treasurer’s Series Trust), Short-Term Investments Trust and Invesco Management Trust only); Director and President, INVESCO Funds Group, Inc. (registered investment adviser and registered transfer agent); Director and Chairman, IVZ Distributors, Inc. (formerly known as INVESCO Distributors, Inc.) (registered broker dealer); Director, President and Chairman, Invesco Inc. (holding company), Invesco Canada Holdings Inc. (holding company), Trimark Investments Ltd./ Placements Trimark Ltèe and Invesco Financial Services Ltd/Services Financiers Invesco Ltèe; Chief Executive Officer, Invesco Canada Fund Inc. (corporate mutual fund company); Director and Chairman, Van Kampen Investor Services Inc.; Director, Chief Executive Officer and President, 1371 Preferred Inc. (holding
| |||||||
103 INVESCO OPPENHEIMER SENIOR FLOATING RATE FUND
TRUSTEES AND OFFICERSUnaudited / Continued
Name, Year of Birth and Position(s) Held with the Trust | Trustee and/or Officer Since | Principal Occupation(s) During Past 5 Years | Number of Funds in Fund Complex | Other Directorship(s) Held by Trustee During Past 5 Years | ||||
INTERESTED PERSONS (CONTINUED) | ||||||||
| Philip A. Taylor (Continued) | company) and Van Kampen Investments Inc.; Director and President, AIM GP Canada Inc. (general partner for limited partnerships) and Van Kampen Advisors, Inc.; Director and Chief Executive Officer, Invesco Trimark Dealer Inc. (registered broker dealer); Director, Invesco Distributors, Inc. (formerly known as Invesco AIM Distributors, Inc.) (registered broker dealer); Manager, Invesco Capital Management LLC; Director, Chief Executive Officer and President, Invesco Advisers, Inc.; Director, Chairman, Chief Executive Officer and President, Invesco AIM Capital Management, Inc.; President, Invesco Trimark Dealer Inc. and Invesco Trimark Ltd./Invesco Trimark Ltèe; Director and President, AIM Trimark Corporate Class Inc. and AIM Trimark Canada Fund Inc.; Senior Managing Director, Invesco Holding Company Limited; Director and Chairman, Fund Management Company (former registered broker dealer); President and Principal Executive Officer, The Invesco Funds (AIM Treasurer’s Series Trust (Invesco Treasurer’s Series Trust), and Short-Term Investments Trust only); President, AIM Trimark Global Fund Inc. and AIM Trimark Canada Fund Inc.
| |||||||
104 INVESCO OPPENHEIMER SENIOR FLOATING RATE FUND
Name, Year of Birth and Position(s) Held with the Trust | Trustee and/or Officer Since | Principal Occupation(s) During Past 5 Years | Number of Funds in Fund Complex | Other Directorship(s) Held by Trustee During Past 5 Years | ||||
| INDEPENDENT TRUSTEES | ||||||||
Bruce L. Crockett – 1944 Trustee and Chair | 2003 | Chairman, Crockett Technologies Associates (technology consulting company)
Formerly: Director, Captaris (unified messaging provider); Director, President and Chief Executive Officer, COMSAT Corporation; Chairman, Board of Governors of INTELSAT (international communications company); ACE Limited (insurance company); Independent Directors Council and Investment Company Institute: Member of the Audit Committee, Investment Company Institute; Member of the Executive Committee and Chair of the Governance Committee, Independent Directors Council
| 240 | Director and Chairman of the Audit Committee, ALPS (Attorneys Liability Protection Society) (insurance company); Director and Member of the Audit Committee and Compensation Committee, Ferroglobe PLC (metallurgical company)
| ||||
David C. Arch – 1945 Trustee | 2010 | Chairman of Blistex Inc. (consumer health care products manufacturer); Member, World Presidents’ Organization | 240 | Board member of the Illinois Manufacturers’ Association
| ||||
Beth Ann Brown3– 1968 Trustee | 2019 | Independent Consultant
Formerly: Head of Intermediary Distribution, Managing Director, Strategic Relations, Managing Director, Head of National Accounts, Senior Vice President, National Account Manager and Senior Vice President, Key Account Manager, Columbia Management Investment Advisers LLC; Vice President, Key Account Manager, Liberty Funds Distributor, Inc.; and Trustee of certain Oppenheimer Funds | 240 | Director, Board of Directors of Caron Engineering Inc.; Advisor, Board of Advisors of Caron Engineering Inc.; President and Director, of Acton Shapleigh Youth Conservation Corps (non-profit); and Vice President and Director of Grahamtastic Connection (non-profit)
| ||||
Jack M. Fields – 1952 Trustee | 2003 | Chief Executive Officer, Twenty First Century Group, Inc. (government affairs company); and Chairman, Discovery Learning Alliance (non-profit)
Formerly: Owner and Chief Executive Officer, Dos Angeles Ranch L.P. (cattle, hunting, corporate entertainment); Director, Insperity, Inc. (formerly known as Administaff) (human resources provider); Chief Executive Officer, Texana Timber LP (sustainable forestry
| 240 | None | ||||
3 Mss. Brown and Krentzman and Messrs. Motley, Vandivort and Vaughn were appointed as Trustees of the Trust effective June 10, 2019.
| ||||||||
105 INVESCO OPPENHEIMER SENIOR FLOATING RATE FUND
TRUSTEES AND OFFICERSUnaudited / Continued
Name, Year of Birth and Position(s) Held with the Trust | Trustee and/or Officer Since | Principal Occupation(s) During Past 5 Years | Number of Funds in Fund Complex | Other Directorship(s) Held by Trustee During Past 5 Years | ||||
| INDEPENDENT TRUSTEES (CONTINUED) | ||||||||
| Jack M. Fields (Continued) | company); Director of Cross Timbers Quail Research Ranch (non-profit); and member of the U.S. House of Representatives
| |||||||
Cynthia Hostetler —1962 Trustee | 2017 | Non-Executive Director and Trustee of a number of public and private business corporations
Formerly: Director, Aberdeen Investment Funds (4 portfolios); Head of Investment Funds and Private Equity, Overseas Private Investment Corporation; President, First Manhattan Bancorporation, Inc.; Attorney, Simpson Thacher & Bartlett LLP | 240 | Vulcan Materials Company (construction materials company); Trilinc Global Impact Fund; Genesee & Wyoming, Inc. (railroads); Artio Global Investment LLC (mutual fund complex); Edgen Group, Inc. (specialized energy and infrastructure products distributor); Investment Company Institute (professional organization); Independent Directors Council (professional organization)
| ||||
Eli Jones – 1961 Trustee | 2016 | Professor and Dean, Mays Business School - Texas A&M University
Formerly: Professor and Dean, Walton College of Business, University of Arkansas and E.J. Ourso College of Business, Louisiana State University; Director, Arvest Bank
| 240 | Insperity, Inc. (formerly known as Administaff) (human resources provider) | ||||
Elizabeth Krentzman3– 1959 Trustee | 2019 | Formerly: Principal and Chief Regulatory Advisor for Asset Management Services and U.S. Mutual Fund Leader of Deloitte & Touche LLP; General Counsel of the Investment Company Institute (trade association); National Director of the Investment Management Regulatory Consulting Practice, Principal, Director and Senior Manager of Deloitte & Touche LLP; Assistant Director of the Division of Investment Management - Office of Disclosure and Investment Adviser Regulation of the U.S. Securities and Exchange Commission and various positions with the Division of Investment Management – Office of Regulatory Policy of the U.S. Securities and Exchange Commission; Associate at Ropes & Gray LLP.; Advisory Board Member of the
| 240 | Trustee of the University of Florida National Board Foundation and Audit Committee Member; Member of the Cartica Funds Board of Directors (private investment funds); Member of the University of Florida Law Center Association, Inc. Board of Trustees and Audit Committee Member
| ||||
106 INVESCO OPPENHEIMER SENIOR FLOATING RATE FUND
Name, Year of Birth and Position(s) Held with the Trust | Trustee and/or Officer Since | Principal Occupation(s) During Past 5 Years | Number of Funds in Fund Complex | Other Directorship(s) Held by Trustee During Past 5 Years | ||||
| INDEPENDENT TRUSTEES (CONTINUED) | ||||||||
| Elizabeth Krentzman (Continued) | Securities and Exchange Commission Historical Society; and Trustee of certain Oppenheimer Funds
| |||||||
| Anthony J. LaCava, Jr. – 1956 Trustee | 2019 | Formerly: Director and Member of the Audit Committee, Blue Hills Bank (publicly traded financial institution) and Managing Partner, KPMG LLP | 240 | Blue Hills Bank; Chairman of Bentley University; Member, Business School Advisory Council; and Nominating Committee, KPMG LLP
| ||||
Prema Mathai-Davis – 1950 Trustee | 2003 | Retired
Co-Owner & Partner of Quantalytics Research, LLC, (a FinTech Investment Research Platform for the Self-Directed Investor)
| 240 | None | ||||
Joel W. Motley3– 1952 Trustee | 2019 | Director of Office of Finance, Federal Home Loan Bank; Member of the Vestry of Trinity Wall Street; Managing Director of Carmona Motley Inc. (privately held financial advisor); Member of the Finance and Budget Committee of the Council on Foreign Relations, Member of the Investment Committee and Board of Human Rights Watch and Member of the Investment Committee and Board of Historic Hudson Valley (non-profit cultural organization).
Formerly: Managing Director of Public Capital Advisors, LLC (privately held financial advisor); Managing Director of Carmona Motley Hoffman, Inc. (privately held financial advisor); Trustee of certain Oppenheimer Funds; and Director of Columbia Equity Financial Corp. (privately held financial advisor)
| 240 | Director of Greenwall Foundation (bioethics research foundation); Member of Board and Investment Committee of The Greenwall Foundation; Director of Southern Africa Legal Services Foundation; Board Member and Investment Committee Member of Pulitzer Center for Crisis Reporting (non-profit journalism)
| ||||
Teresa M. Ressel — 1962 Trustee | 2017 | Non-executive director and trustee of a number of public and private business corporations
Formerly: Chief Financial Officer, Olayan America, The Olayan Group (international investor/commercial/industrial); Chief Executive Officer, UBS Securities LLC; Group Chief Operating Officer, Americas, UBS AG; Assistant Secretary for Management & Budget and CFO, US Department of the Treasury
| 240 | Atlantic Power Corporation (power generation company); ON Semiconductor Corp. (semiconductor supplier) | ||||
107 INVESCO OPPENHEIMER SENIOR FLOATING RATE FUND
TRUSTEES AND OFFICERSUnaudited / Continued
Name, Year of Birth and Position(s) Held with the Trust | Trustee and/or Officer Since | Principal Occupation(s) During Past 5 Years | Number of Funds in Fund Complex | Other Directorship(s) Held by Trustee During Past 5 Years | ||||
| INDEPENDENT TRUSTEES (CONTINUED) | ||||||||
Ann Barnett Stern – 1957 Trustee | 2017 | President and Chief Executive Officer, Houston Endowment Inc. (private philanthropic institution)
Formerly: Executive Vice President and General Counsel, Texas Children’s Hospital; Attorney, Beck, Redden and Secrest, LLP; Business Law Instructor, University of St. Thomas; Attorney, Andrews & Kurth LLP
| 240 | Federal Reserve Bank of Dallas | ||||
Raymond Stickel, Jr. – 1944 Trustee | 2005 | Retired
Formerly: Director, Mainstay VP Series Funds, Inc. (25 portfolios); Partner, Deloitte & Touche
| 240 | None | ||||
Robert C. Troccoli – 1949 Trustee | 2016 | Retired
Formerly: Adjunct Professor, University of Denver – Daniels College of Business, Senior Partner, KPMG LLP
| 240 | None | ||||
Daniel S. Vandivort3–1954 Trustee | 2019 | Treasurer, Chairman of the Audit and Finance Committee, and Trustee, Board of Trustees, Huntington Disease Foundation of America; and President, Flyway Advisory Services LLC (consulting and property management).
Formerly: Trustee and Governance Chair, of certain Oppenheimer Funds
| 240 | Chairman and Lead Independent Director, Chairman of the Audit Committee, and Director, Board of Directors, Value Line Funds | ||||
James D. Vaughn3– 1945 Trustee | 2019 | Retired
Formerly: Managing Partner, Deloitte & Touche LLP; Trustee and Chairman of the Audit Committee, Schroder Funds; Board Member, Mile High United Way, Boys and Girls Clubs, Boy Scouts, Colorado Business Committee for the Arts, Economic Club of Colorado and Metro Denver Network (economic development corporation); and Trustee of certain Oppenheimer Funds | 240 | Board member and Chairman of Audit Committee of AMG National Trust Bank; Trustee and Investment Committee member, University of South Dakota Foundation; Board member, Audit Committee Member and past Board Chair, Junior Achievement (non-profit)
| ||||
Christopher L. Wilson – 1957 Trustee and Vice Chair | 2017 | Non-executive director and trustee of a number of public and private business corporations
Formerly: Director, TD Asset Management USA Inc. (mutual fund complex) (22 portfolios);
| 240 | ISO New England, Inc. (non-profit organization managing regional electricity market) | ||||
108 INVESCO OPPENHEIMER SENIOR FLOATING RATE FUND
Name, Year of Birth and Position(s) Held with the Trust | Trustee and/or Officer Since | Principal Occupation(s) During Past 5 Years | Number of Funds in Fund Complex | Other Directorship(s) Held by Trustee During Past 5 Years | ||||
| INDEPENDENT TRUSTEES (CONTINUED) | ||||||||
Christopher L. Wilson (Continued) | Managing Partner, CT2, LLC (investing and consulting firm); President/Chief Executive Officer, Columbia Funds, Bank of America Corporation; President/Chief Executive Officer, CDC IXIS Asset Management Services, Inc.; Principal & Director of Operations, Scudder Funds, Scudder, Stevens & Clark, Inc.; Assistant Vice President, Fidelity Investments
| |||||||
109 INVESCO OPPENHEIMER SENIOR FLOATING RATE FUND
TRUSTEES AND OFFICERSUnaudited / Continued
Name, Year of Birth and Position(s) Held with the Trust | Trustee and/or Officer Since | Principal Occupation(s) During Past 5 Years | Number of Funds in Fund Complex Overseen by Trustee | Other Directorship(s) Held by Trustee During Past 5 Years | ||||
| OTHER OFFICERS | ||||||||
Sheri Morris — 1964 President, Principal Executive Officer and Treasurer | 2003 | President, Principal Executive Officer and Treasurer, The Invesco Funds; Vice President, Invesco Advisers, Inc. (formerly known as Invesco Institutional (N.A.), Inc.) (registered investment adviser); and Vice President, Invesco Exchange-Traded Fund Trust, Invesco Exchange-Traded Fund Trust II, Invesco India Exchange-Traded Fund Trust, Invesco Actively Managed Exchange-Traded Fund Trust, Invesco Actively Managed Exchange-Traded Commodity Fund Trust and Invesco Exchange- Traded Self-Indexed Fund Trust
Formerly: Vice President and Principal Financial Officer, The Invesco Funds; Vice President, Invesco AIM Advisers, Inc., Invesco AIM Capital Management, Inc. and Invesco AIM Private Asset Management, Inc.; Assistant Vice President and Assistant Treasurer, The Invesco Funds and Assistant Vice President, Invesco Advisers, Inc., Invesco AIM Capital Management, Inc. and Invesco AIM Private Asset Management, Inc.; and Treasurer, Invesco Exchange-Traded Fund Trust, Invesco Exchange-Traded Fund Trust II, Invesco India Exchange-Traded Fund Trust and Invesco Actively Managed Exchange-Traded Fund Trust
| N/A | N/A | ||||
Russell C. Burk — 1958 Senior Vice President and Senior Officer | 2005 | Senior Vice President and Senior Officer, The Invesco Funds
| N/A | N/A | ||||
Jeffrey H. Kupor – 1968 Senior Vice President, Chief Legal Officer and Secretary | 2018 | Head of Legal of the Americas, Invesco Ltd.; Senior Vice President and Secretary, Invesco Advisers, Inc. (formerly known as Invesco Institutional (N.A.), Inc.) (registered investment adviser); Senior Vice President and Secretary, Invesco Distributors, Inc. (formerly known as Invesco AIM Distributors, Inc.); Vice President and Secretary, Invesco Investment Services, Inc. (formerly known as Invesco AIM Investment Services, Inc.) Senior Vice President, Chief Legal Officer and Secretary, The Invesco Funds; Secretary and General Counsel, Invesco Investment Advisers LLC (formerly known as Van Kampen Asset Management); Secretary and General Counsel, Invesco Capital Markets, Inc. (formerly known as Van Kampen Funds Inc.) and Chief Legal Officer, Invesco Exchange-Traded Fund Trust, Invesco Exchange-Traded Fund Trust II, Invesco
| N/A | N/A | ||||
110 INVESCO OPPENHEIMER SENIOR FLOATING RATE FUND
Name, Year of Birth and Position(s) Held with the Trust | Trustee and/or Officer Since | Principal Occupation(s) During Past 5 Years | Number of Funds in Fund Complex Overseen by Trustee | Other Directorship(s) Held by Trustee During Past 5 Years | ||||
| OTHER OFFICERS (CONTINUED) | ||||||||
| Jeffrey H. Kupor (Continued) | India Exchange-Traded Fund Trust, Invesco Actively Managed Exchange-Traded Fund Trust, Invesco Actively Managed Exchange- Traded Commodity Fund Trust and Invesco Exchange-Traded Self-Indexed Fund Trust; Secretary, Invesco Indexing LLC; Secretary, W.L. Ross & Co., LLC; Secretary, Jemstep, Inc.
Formerly: Vice President, Jemstep, Inc.; Head of Legal, Worldwide Institutional, Invesco Ltd.; Secretary and General Counsel, INVESCO Private Capital Investments, Inc.; Senior Vice President, Secretary and General Counsel, Invesco Management Group, Inc. (formerly known as Invesco AIM Management Group, Inc.); Assistant Secretary, INVESCO Asset Management (Bermuda) Ltd.; Secretary and General Counsel, Invesco Private Capital, Inc.; Assistant Secretary and General Counsel, INVESCO Realty, Inc.; Secretary and General Counsel, Invesco Senior Secured Management, Inc.; and Secretary, Sovereign G./P. Holdings Inc.
| |||||||
| Andrew R. Schlossberg – 1974 Senior Vice President | 2019 | Head of the Americas and Senior Managing Director, Invesco Ltd.; Director and Senior Vice President, Invesco Advisers, Inc. (formerly known as Invesco Institutional (N.A.), Inc.) (registered investment adviser); Director and Chairman, Invesco Investment Services, Inc. (formerly known as Invesco AIM Investment Services, Inc.) (registered transfer agent); Senior Vice President, The Invesco Funds; Director, Invesco Investment Advisers LLC (formerly known as Van Kampen Asset Management); Director, President and Chairman, Invesco Insurance Agency, Inc.
Formerly: Director, Invesco UK Limited; Director and Chief Executive, Invesco Asset Management Limited and Invesco Fund Managers Limited; Assistant Vice President, The Invesco Funds; Senior Vice President, Invesco Advisers, Inc. (formerly known as Invesco Institutional (N.A.), Inc.) (registered investment adviser); Director and Chief Executive, Invesco Administration Services Limited and Invesco Global Investment Funds Limited; Director, Invesco Distributors, Inc.;
| N/A | N/A | ||||
111 INVESCO OPPENHEIMER SENIOR FLOATING RATE FUND
TRUSTEES AND OFFICERSUnaudited / Continued
Name, Year of Birth and Position(s) Held with the Trust | Trustee and/or Officer Since | Principal Occupation(s) During Past 5 Years | Number of Funds in Fund Complex Overseen by Trustee | Other Directorship(s) Held by Trustee During Past 5 Years | ||||
| OTHER OFFICERS (CONTINUED) | ||||||||
| Andrew R. Schlossberg (Continued) | Head of EMEA, Invesco Ltd.; President, Invesco Actively Managed Exchange-Traded Commodity Fund Trust, Invesco Actively Managed Exchange-Traded Fund Trust, Invesco Exchange-Traded Fund Trust, Invesco Exchange-Traded Fund Trust II and Invesco India Exchange-Traded Fund Trust; Managing Director and Principal Executive Officer, Invesco Capital Management LLC
| |||||||
John M. Zerr — 1962 Senior Vice President | 2006 | Chief Operating Officer of the Americas; Senior Vice President, Invesco Advisers, Inc. (formerly known as Invesco Institutional (N.A.), Inc.) (registered investment adviser); Senior Vice President, Invesco Distributors, Inc. (formerly known as Invesco AIM Distributors, Inc.); Director and Vice President, Invesco Investment Services, Inc. (formerly known as Invesco AIM Investment Services, Inc.) Senior Vice President, The Invesco Funds; Managing Director, Invesco Capital Management LLC; Director, Invesco Investment Advisers LLC (formerly known as Van Kampen Asset Management); Senior Vice President, Invesco Capital Markets, Inc. (formerly known as Van Kampen Funds Inc.); Manager, Invesco Indexing LLC; Manager, Invesco Specialized Products, LLC; Director and Senior Vice President, Invesco Insurance Agency, Inc.; Member, Invesco Canada Funds Advisory Board; Director, President and Chief Executive Officer, Invesco Corporate Class Inc. (corporate mutual fund company); and Director, Chairman, President and Chief Executive Officer, Invesco Canada Ltd. (formerly known as Invesco Trimark Ltd./Invesco Trimark Ltèe) (registered investment adviser and registered transfer agent)
Formerly: Director and Senior Vice President, Invesco Management Group, Inc. (formerly known as Invesco AIM Management Group, Inc.); Secretary and General Counsel, Invesco Management Group, Inc. (formerly known as Invesco AIM Management Group, Inc.); Secretary, Invesco Investment Services, Inc. (formerly known as Invesco AIM Investment Services, Inc.); Chief Legal Officer and Secretary, The Invesco Funds; Secretary and
| N/A | N/A | ||||
112 INVESCO OPPENHEIMER SENIOR FLOATING RATE FUND
Name, Year of Birth and Position(s) Held with the Trust | Trustee and/or Officer Since | Principal Occupation(s) During Past 5 Years | Number of Funds in Fund Complex Overseen by Trustee | Other Directorship(s) Held by Trustee During Past 5 Years | ||||
| OTHER OFFICERS (CONTINUED) | ||||||||
| John M. Zerr (Continued) | General Counsel, Invesco Investment Advisers LLC (formerly known as Van Kampen Asset Management); Secretary and General Counsel, Invesco Capital Markets, Inc. (formerly known as Van Kampen Funds Inc.); Chief Legal Officer, Invesco Exchange-Traded Fund Trust, Invesco Exchange-Traded Fund Trust II, Invesco India Exchange-Traded Fund Trust, Invesco Actively Managed Exchange-Traded Fund Trust, Invesco Actively Managed Exchange- Traded Commodity Fund Trust and Invesco Exchange-Traded Self-Indexed Fund Trust; Secretary, Invesco Indexing LLC; Director, Secretary, General Counsel and Senior Vice President, Van Kampen Exchange Corp.; Director, Vice President and Secretary, IVZ Distributors, Inc. (formerly known as INVESCO Distributors, Inc.); Director and Vice President, INVESCO Funds Group, Inc.; Director and Vice President, Van Kampen Advisors Inc.; Director, Vice President, Secretary and General Counsel, Van Kampen Investor Services Inc.; Director and Secretary, Invesco Distributors, Inc. (formerly known as Invesco AIM Distributors, Inc.); Director, Senior Vice President, General Counsel and Secretary, Invesco AIM Advisers, Inc. and Van Kampen Investments Inc.; Director, Vice President and Secretary, Fund Management Company; Director, Senior Vice President, Secretary, General Counsel and Vice President, Invesco AIM Capital Management, Inc.; Chief Operating Officer and General Counsel, Liberty Ridge Capital, Inc. (an investment adviser)
| |||||||
| Gregory G. McGreevey - 1962 Senior Vice President | 2012 | Senior Managing Director, Invesco Ltd.; Director, Chairman, President, and Chief Executive Officer, Invesco Advisers, Inc. (formerly known as Invesco Institutional (N.A.), Inc.) (registered investment adviser); Director, Invesco Mortgage Capital, Inc. and Invesco Senior Secured Management, Inc.; and Senior Vice President, The Invesco Funds; and President, SNW Asset Management Corporation
Formerly: Senior Vice President, Invesco Management Group, Inc. and Invesco Advisers, Inc.; Assistant Vice President, The Invesco Funds
| N/A | N/A | ||||
113 INVESCO OPPENHEIMER SENIOR FLOATING RATE FUND
TRUSTEES AND OFFICERSUnaudited / Continued
Name, Year of Birth and Position(s) Held with the Trust | Trustee and/or Officer Since | Principal Occupation(s) During Past 5 Years | Number of Funds in Fund Complex Overseen by Trustee | Other Directorship(s) Held by Trustee During Past 5 Years | ||||
| OTHER OFFICERS (CONTINUED) | ||||||||
Kelli Gallegos – 1970 Vice President, Principal Financial Officer and Assistant Treasurer | 2008 | Assistant Treasurer, Invesco Specialized Products, LLC; Vice President, Principal Financial Officer and Assistant Treasurer, The Invesco Funds; Principal Financial and Accounting Officer –Pooled Investments, Invesco Capital Management LLC; Vice President and Treasurer, Invesco Exchange- Traded Fund Trust, Invesco Exchange-Traded Fund Trust II, Invesco India Exchange-Traded Fund Trust, Invesco Actively Managed Exchange-Traded Fund Trust, Invesco Actively Managed Exchange-Traded Commodity Fund Trust and Invesco Exchange-Traded Self- Indexed Fund Trust
Formerly: Assistant Treasurer, Invesco Exchange-Traded Fund Trust, Invesco Exchange-Traded Fund Trust II, Invesco India Exchange-Traded Fund Trust, Invesco Actively Managed Exchange-Traded Fund Trust, Invesco Actively Managed Exchange-Traded Commodity Fund Trust and Invesco Exchange- Traded Self-Indexed Fund Trust; Assistant Treasurer, Invesco Capital Management LLC; Assistant Vice President, The Invesco Funds
| N/A | N/A | ||||
Crissie M. Wisdom – 1969 Anti-Money Laundering Compliance Officer | 2013 | Anti-Money Laundering Compliance Officer, Invesco Advisers, Inc. (formerly known as Invesco Institutional (N.A.), Inc.) (registered investment adviser), Invesco Capital Markets, Inc. (formerly known as Van Kampen Funds Inc.), Invesco Distributors, Inc., Invesco Investment Services, Inc., The Invesco Funds, and Invesco Exchange-Traded Fund Trust, Invesco Exchange-Traded Fund Trust II, Invesco India Exchange-Traded Fund Trust, Invesco Actively Managed Exchange-Traded Fund Trust, Invesco Actively Managed Exchange- Traded Commodity Fund Trust and Invesco Exchange-Traded Self-Indexed Fund Trust; Anti-Money Laundering Compliance Officer and Bank Secrecy Act Officer, INVESCO National Trust Company and Invesco Trust Company; and Fraud Prevention Manager and Controls and Risk Analysis Manager for Invesco Investment Services, Inc.
Formerly: Anti-Money Laundering Compliance Officer, Van Kampen Exchange Corp. and Invesco Management Group, Inc.
| N/A | N/A | ||||
114 INVESCO OPPENHEIMER SENIOR FLOATING RATE FUND
Name, Year of Birth and Position(s) Held with the Trust | Trustee and/or Officer Since | Principal Occupation(s) During Past 5 Years | Number of Funds in Fund Complex Overseen by Trustee | Other Directorship(s) Held by Trustee During Past 5 Years | ||||
| OTHER OFFICERS (CONTINUED) | ||||||||
| Robert R. Leveille – 1969 Chief Compliance Officer | 2016 | Chief Compliance Officer, Invesco Advisers, Inc. (registered investment adviser); and Chief Compliance Officer, The Invesco Funds
Formerly: Chief Compliance Officer, Putnam Investments and the Putnam Funds
| N/A | N/A | ||||
The Statement of Additional Information of the Trust includes additional information about the Fund’s Trustees and is available upon request, without charge, by calling 1.800.959.4246. Please refer to the Fund’s Statement of Additional Information for information on the Fund’s sub-advisers.
| Office of the Fund | Investment Adviser | Distributor | Auditors | |||
| 11 Greenway Plaza, | Invesco Advisers, Inc. | Invesco Distributors, Inc. | PricewaterhouseCoopers | |||
| Suite 1000 | 1555 Peachtree Street, N.E. | 11 Greenway Plaza, | LLP | |||
| Houston, TX 77046-1173 | Atlanta, GA 30309 | Suite 1000 | 1000 Louisiana Street, | |||
| Houston, TX | Suite 5800 | |||||
| 77046-1173 | Houston, TX 77002-5021 | |||||
| Counsel to the Fund | Counsel to the | Transfer Agent | Custodian | |||
Stradley Ronon Stevens & Young, LLP 2005 Market Street, Suite 2600 Philadelphia, PA 19103-7018 | Independent Trustees Goodwin Procter LLP 901 New York Avenue, N.W. Washington, D.C. 20001 | Invesco Investment Services, Inc. 11 Greenway Plaza, Suite 1000 Houston, TX 77046-1173 | The Deutsche Bank Trust Company Americas 60 Wall Street, 17th Floor, NYC60-1701 New York, NY 10005-2848 | |||
115 INVESCO OPPENHEIMER SENIOR FLOATING RATE FUND
| ||||
Invesco recognizes the importance of protecting your personal and financial information when you visit our website located atwww.invesco.com (the “Website”). The following information is designed to help you understand the information collection practices at this Website. We will not sell, share or rent your personally identifiable information to others in contravention of this Privacy Policy. When we refer to ourselves as “we” or “Invesco” in this Privacy Policy, we mean our entire company including our affiliates, such as subsidiaries.
By visiting this Website, you are accepting the practices described in this Privacy Policy. If you do not agree to this policy, you may not use this Website. This Privacy Policy is subject to change without notice, from time to time in our sole discretion. You acknowledge that by accessing the Website after we have posted changes to this Privacy Policy, you are agreeing to this Privacy Policy as modified. Please review the Terms of Use to learn of other terms and conditions applicable to your use of the Website.
Please note that this Privacy Policy is not an exclusive statement of our privacy principles across all products and services. Other privacy principles or policies may apply depending on the products or services you obtain from Invesco, or the jurisdiction in which you transact with Invesco.
This Privacy Policy was last updated on May 6, 2018.
Information We Collect and Use
We collect personal information you choose to submit to the Website in order to process transactions requested by you and meet our contractual obligations. For example, you can choose to provide your name, contact information, social security number, or tax identification number in connection with accessing your account, or you can choose to provide your personal information when you fill out a secure account question form. Any information collected about you from the Website can, from time to time, be associated with other identifying information we have about you.
In addition, we may gather information about you automatically through your use of the Website, e.g. your IP address, how you navigate the Website, the organization from which you are accessing the Website, and the websites that you access before and after you visit the Website.
When you access the Website, we may also collect information such as unique device identifiers, your screen resolution and other device settings, information about your location, and analytical information about how you use the device from which you are viewing the Website. Where applicable, we may ask your permission before collecting certain information, such as precise geolocation information.
From time to time, we use or augment the personal information we have about you with information obtained from third parties. For example, we use third party information to confirm contact or financial information or to better understand your interests by associating demographic information from third parties with the information you have provided.
How We Use Personal Information
We use your personal information to respond to your inquiries and provide the products and services you request. We also use your information from time to time to deliver the content and services we believe
116 INVESCO OPPENHEIMER SENIOR FLOATING RATE FUND
you will find the most relevant and to provide customer service and support.
We also use the information you provide to further develop and improve our products and services. We aggregate and/or de-identify data about visitors to the Website for various business purposes including product and service development and improvement activities.
How We Share Personal Information
We collaborate with other companies and individuals to perform services for us and on our behalf and we collaborate with our affiliates, other companies and individuals with respect to particular products or services (“Providers”). Examples of Providers include data analysis firms, customer service and support providers, email and SMS vendors, and web-hosting and development companies. Some Providers collect information for us or on our behalf on our Website. These Providers can be provided with access to personal information needed to perform their functions.
We reserve the right to disclose your personal information as required by law, when we believe disclosure is necessary to comply with a regulatory requirement, judicial proceeding, court order or legal process served on us, to protect the safety, rights or property of our customers, the public or Invesco or to enforce the Terms of Use.
If we sell or transfer a business unit (such as a subsidiary) or an asset (such as a website) to another company, we will share your personal information with such company. You will receive notice of such an event and the new entity will inform you of any changes to the practices in this Privacy Policy. If the new entity wishes to make additional use of your information, you have the right to decline such use at that time.
We occasionally disclose aggregate or de-identified data that is not personally identifiable with third parties.
Cookies and Other Tools
Invesco and its Providers collect information about you by using cookies, tracking pixels and other technologies. We use this information to better understand, customize and improve user experience with our websites, services and offerings as well as to manage our advertising. For example, we use web analytics services that use these technologies to gather information to help us understand how visitors engage with and navigate our Website, e.g., how and when pages in a site are visited and by how many visitors. We are also able to offer our visitors a more customized, relevant experience on our sites using these technologies by delivering content and functionality based on your preferences and interests.
Depending on their purpose, some cookies will only operate for the length of a single browsing session, while others have a longer life span to ensure that they fulfill their longer-term purposes. Your web browser can be set to allow you to control whether you will accept cookies or reject cookies, to notify you each time a cookie is sent to your browser, or to delete cookies that have already been set. If your browser is set to reject cookies, certain aspects of the Website that are cookie-enabled will not recognize you when you return to the website, and some Website functionality may be lost. The “Help” section of your browser may tell you how to prevent your browser from accepting cookies. To find out more about cookies, visitwww.aboutcookies.org.
117 INVESCO OPPENHEIMER SENIOR FLOATING RATE FUND
INVESCO’S PRIVACY NOTICEContinued
| ||||
Security
No data transmission over the internet can be 100% secure, so Invesco cannot ensure or warrant the security of any information you submit to us on this Website. However, Invesco seeks to protect your personal information from unauthorized access or use when you transact business on our Website using technical, administrative and procedural measures. Invesco makes no representation as to the reasonableness, efficacy, or appropriateness of the measures we use to safeguard such information.
Users are responsible for maintaining the secrecy of their own passwords. If you have reason to believe that your interaction with us is no longer secure (for example, if you feel that the security of any account you might have with us has been compromised), please immediately notify us by contacting us as specified below.
Transfer of Data to Other Countries
Any information you provide to Invesco through use of the Website may be stored and processed, transferred between and accessed from the United States, Canada and other countries which do not guarantee the same level of protection of personal information as the one in which you reside. However, Invesco will handle your personal information in accordance with this Privacy Policy regardless of where your personal information is stored/accessed.
Children’s Privacy
We are committed to protecting the privacy of children. We do not knowingly collect personal information from children under the age of 18. If you are under the age of 18, do not provide us with any personal information.
Contact Us
Please contact us if you have any questions or concerns about your personal information or require assistance in managing your choices.
Invesco Ltd.
1555 Peachtree St. NE
Atlanta, GA 30309
By phone:
(404) 439-3236
By fax:
(404) 962-8288
By email:
Anne.Gerry@invesco.com
Please update your account information by logging in or contact us by email or telephone as specified above to update your account information whenever such information ceases to be complete or accurate.
You may also contact us to:
118 INVESCO OPPENHEIMER SENIOR FLOATING RATE FUND
| ● | Request that we amend, rectify, delete or update the personal data we hold about you; |
| ● | Where possible (e.g. in relation to marketing) amend or update your choices around processing; |
| ● | Request a copy of personal data held by us. |
Disclaimer
Where the Website contains links to third-party websites/content/services that are not owned or controlled by Invesco, Invesco is not responsible for how these properties operate or treat your personal information so we recommend that you read the privacy policies and terms associated with these third party properties carefully.
119 INVESCO OPPENHEIMER SENIOR FLOATING RATE FUND
Explore High-Conviction Investing with Invesco

Go paperless with eDelivery
Visit invesco.com/edelivery to enjoy the convenience and security of anytime electronic access to your investment documents.
With eDelivery, you can elect to have any or all of the following materials delivered straight to your inbox to download, save and
print from your own computer:
| ∎ | Fund reports and prospectuses |
| ∎ | Quarterly statements |
| ∎ | Daily confirmations |
| ∎ | Tax forms |
Invesco mailing information
Send general correspondence to Invesco Investment Services, Inc., P.O. Box 219078, Kansas City, MO 64121-9078.
| ||||
| Invesco Distributors, Inc. | O-SFLR-AR-1 | 09272019 | ||

 | Shareholder Report | |
Annual Report 8/31/2019 | ||
Annual Report 7/31/2019 | ||
Invesco Oppenheimer Senior Floating Rate Plus Fund*
Beginning on January 1, 2021, as permitted by regulations adopted by the Securities and Exchange Commission, paper copies of the Fund’s shareholder reports will no longer be sent by mail, unless you specifically request paper copies of the reports from the Fund or from your financial intermediary, such as a broker-dealer or bank. Instead, the reports will be made available on the Fund’s website, and you will be notified by mail each time a report is posted and provided with a website link to access the report.
If you already elected to receive shareholder reports electronically, you will not be affected by this change and you need not take any action. You may elect to receive shareholder reports and other communications from the Fund electronically by contacting your financial intermediary (such as a broker-dealer or bank) or, if you are a direct investor, by enrolling at invesco.com/edelivery.
You may elect to receive all future reports in paper free of charge. If you invest through a financial intermediary, you can contact your financial intermediary to request that you continue to receive paper copies of your shareholder reports. If you invest directly with the Fund, you can call 800 959 4246 to let the Fund know you wish to continue receiving paper copies of your shareholder reports. Your election to receive reports in paper will apply to all funds held with your financial intermediary or all funds held with the fund complex if you invest directly with the Fund.
*Prior to the close of business on May 24, 2019, the Fund’s name was Oppenheimer Senior Floating Rate Plus Fund. See Important Update on the following page for more information. |
Important Update
On October 18, 2018, Massachusetts Mutual Life Insurance Company, an indirect corporate parent of OppenheimerFunds, Inc. and its subsidiaries OFI Global Asset Management, Inc., OFI SteelPath, Inc. and OFI Advisors, LLC, announced that it had entered into an agreement whereby Invesco Ltd., a global investment management company would acquire OppenheimerFunds and its subsidiaries (together, “OppenheimerFunds”). After the close of business on May 24, 2019 Invesco Ltd. completed the acquisition of OppenheimerFunds. This Fund was included in that acquisition and as of that date, became part of the Invesco family of funds. Please visit invesco.com for more information or call Invesco’s Client Services team at800-959-4246.
Class A Shares
AVERAGE ANNUAL TOTAL RETURNS AT 8/31/19
| Class A Shares of the Fund | ||||||
| Without Sales Charge | With Sales Charge | J.P. Morgan Leveraged Loan Index | ||||
1-Year | -0.44% | -3.72% | 3.61% | |||
5-Year | 2.62 | 1.94 | 4.20 | |||
Since Inception (8/23/13) | 3.06 | 2.49 | 4.27 | |||
AVERAGE ANNUAL TOTAL RETURNS AT 7/31/19
| ||||||
| Class A Shares of the Fund | ||||||
| Without Sales Charge | With Sales Charge | J.P. Morgan Leveraged Loan Index | ||||
1-Year | 1.39% | -1.95% | 4.34% | |||
5-Year | 2.93 | 2.25 | 4.29 | |||
Since Inception (8/23/13) | 3.36 | 2.78 | 4.37 | |||
3 INVESCO OPPENHEIMER SENIOR FLOATING RATE PLUS FUND
Performance quoted is past performance and cannot guarantee comparable future results; current performance may be lower or higher.Visit invesco.com for the most recentmonth-end performance. Performance figures reflect reinvested distributions and changes in net asset value (NAV). Investment return and principal value will vary so that you may have a gain or a loss when you sell shares. Fund returns include changes in share price, reinvested distributions and a 3.25% maximum applicable sales charge except where “without sales charge” is indicated. As the result of a reorganization after the close of business on May 24, 2019, the returns of the fund for periods on or prior to May 24, 2019 reflect performance of the Oppenheimer predecessor fund. Share class returns will differ from those of the predecessor fund as they have different expenses. Returns for periods of less than one year are not annualized. Returns do not consider capital gains or income taxes on an individual’s investment. See Fund prospectus and summary prospectus for more information on share classes and sales charges. Fund literature is available at invesco.com.
4 INVESCO OPPENHEIMER SENIOR FLOATING RATE PLUS FUND
For theone-year period ended July 31, 2019, the Fund’s Class A shares (without sales charge) returned 1.39%, underperforming the J.P. Morgan Leveraged Loan Index (the “Index”), which returned 4.34%. For theone-year period ended August 31, 2019, the Fund’s Class A shares (without sales charge) returned-0.44%, underperforming the Index, which returned 3.61%. Please note that the fiscalyear-end for Invesco Oppenheimer Senior Floating Rate Plus Fund has changed from July 31 to August 31. Therefore, the period covered by this discussion is from July 31, 2018, the date of the last annual report, through August 31, 2019, the Fund’s new fiscalyear-end.
MARKET OVERVIEW
During the twelve-month period ending July 31, 2019 the markets saw increased volatility as growing trade tensions with China, a slowing global economy and a reversal in Fed policy from a tightening stance to one of easing heightened investor uncertainty. At the end of that time period the Federal Reserve
cut interest rates 25 basis points, and the yield of the UST 10 year dropped 122 basis points from a high of 3.23% in November 2018 to 2.01%. Commodity prices also experienced increased volatility with Oil and Natural Gas trading down 14% and 20% respectively.
COMPARISON OF CHANGE IN VALUE OF $10,000 HYPOTHETICAL INVESTMENTS IN AT AUGUST 31, 2019:

5 INVESCO OPPENHEIMER SENIOR FLOATING RATE PLUS FUND
COMPARISON OF CHANGE IN VALUE OF $10,000 HYPOTHETICAL INVESTMENTS IN AT JULY 31, 2019:
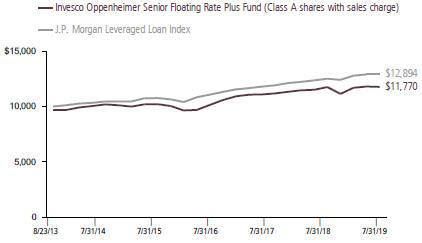
The J.P. Morgan Leveraged Loan Index returned 4.34% for the period and continued to demonstrate less sensitivity to the increased volatility across equity and commodity markets and a declining interest rate environment. In comparison, high yield, as represented by the J.P. Morgan Domestic High Yield Index, returned 6.42% as dissipated fears of rising rates spurred renewed investor appetite for the asset class.
FUND REVIEW
The primary detractors from relative performance for the period ended July 31, 2019, were security selection in the
Diversified Media and Metals & Mining sectors. The loans of a Company in the Diversified Media sector experienced significant pressure as the issuer’s equity sponsor unexpectedly ceased the funding it had been providing to Company. The secured creditors have organized an
Ad-Hoc committee and are working towards restructuring the Company’s balance sheet to maximize recoveries on the loans. In the Metals and Mining sector the securities of two coal producers experienced pressure as the Coal industry has been out of favor and commodity prices have declined. We are constructive on each of these Companies, as our valuations exceed currently depressed trading levels.
During the reporting period ended July 31, 2019, the Fund experienced its strongest outperformance versus the Index from security selection in the Gaming sector, as it was announced that one of our Gaming Companies was being acquired at a premium, which resulted in substantial price appreciation. Another strong driver of performance was from security selection and sector allocation the Cable and Satellite sector. Additional drivers of positive
6 INVESCO OPPENHEIMER SENIOR FLOATING RATE PLUS FUND
attribution came from this Fund’s use of modest financial leverage as well as having some exposure to High Yield bonds.
STRATEGY & OUTLOOK
At the end of the reporting period ended July 31, 2019, relative to the Index, the Fund had modest overweights in the Broadcasting, Metals and Mining, and Telecommunications sectors and modest underweights in the Technology, Healthcare, and Retail sectors. As a result of the elevated volatility in the markets, the team identified attractive opportunities in some lower single B rated loans, as they experienced more price pressure than larger double B rated loans.
At the period ended July 31, 2019, the overall credit quality of the loan market is also solid with defaults of approximately 1.5%. While select sectors, such as Healthcare and Retail, are experiencing challenges specific to their industries, we believe credit fundamentals can continue to remain solid.
For the one month period ending 8/31/2019 the Fund’s Class A shares (without sales charge) had a negative gross return of-1.37% compared to the Benchmark return of-0.22%, generating a negative excess return of-1.15%. The main drivers of positive attribution came from security selection in the Technology and Automotive sectors. The main detractors from attribution came from security selection in the Metals & Mining and Diversified Media sectors.
7 INVESCO OPPENHEIMER SENIOR FLOATING RATE PLUS FUND
TOP FIVE DEBT HOLDINGS – 8/31/19
| Tesla, Inc., 5.30% Sr. Unsec. Nts., 8/15/25 | 2.5% | |
| CenturyLink, Inc., Sr. Sec. Credit Facilities 1st Lien Term Loan, 4.862% [LIBOR4+275], 1/31/25 | 1.6 | |
| Murray Energy Corp., Sr. Sec. Credit Facilities 1st Lien Term Loan, 9.362% [LIBOR4+725], 10/17/22 | 1.6 | |
| Caesars Growth Properties Holdings LLC, Sr. Sec. Credit Facilities 1st Lien Term Loan, 4.862% [LIBOR4+275], 12/23/24 | 1.6 | |
| Peabody Energy Corp., 6.375% Sr. Sec. Nts., 3/31/25 | 1.3 |
Portfolio holdings and allocations are subject to change. Percentages are as of August 31, 2019, and are based on net assets.
TOP FIVE DEBT HOLDINGS – 7/31/19
| Tesla, Inc., 5.30% Sr. Unsec. Nts., 8/15/25 | 2.3% | |
| Murray Energy Corp., Sr. Sec. Credit Facilities 1st Lien Term Loan, 9.772% [LIBOR4+725], 10/17/22 | 1.6 | |
| CenturyLink, Inc., Sr. Sec. Credit Facilities 1st Lien Term Loan, 5.152% [LIBOR4+275], 1/31/25 | 1.6 | |
| Caesars Growth Properties Holdings LLC, Sr. Sec. Credit Facilities 1st Lien Term Loan, 5.152% [LIBOR4+275], 12/23/24 | 1.5 | |
| Peabody Energy Corp., 6.375% Sr. Sec. Nts., 3/31/25 | 1.3 |
Portfolio holdings and allocations are subject to change. Percentages are as of July 31, 2019, and are based on net assets.
8 INVESCO OPPENHEIMER SENIOR FLOATING RATE PLUS FUND
CREDIT RATING BREAKDOWN 8/31/19 | NRSRO ONLY TOTAL | |||
| BBB | 2.0% | |||
| BB | 30.6 | |||
| B | 54.1 | |||
| CCC | 4.4 | |||
| CC | 0.0* | |||
| Unrated | 8.9 | |||
* Less than 0.05%
The percentages above are based on the market value of the Fund’s securities as of August 31, 2019, and are subject to change. Except for securities labeled “Unrated,” all securities have been rated by at least one Nationally Recognized Statistical Rating Organization (“NRSRO”), such as S&P Global Ratings (“S&P”). For securities rated only by an NRSRO other than S&P, Invesco Advisers, Inc. (the “Adviser”) converts that rating to the equivalent S&P rating. If two or more NRSROs have assigned a rating to a security, the highest S&P equivalent rating is used. For securities not rated by an NRSRO, the Adviser uses its own credit analysis to assign ratings in categories similar to those of S&P. The use of similar categories is not an indication that the Adviser’s credit analysis process is consistent or comparable with any NRSRO’s process were that NRSRO to rate the same security. Fund assets invested in Invesco Oppenheimer Institutional Government Money Market Fund are assigned that fund’s S&P rating, which is currently AAA. For the purposes of this table, “investment-grade” securities are securities rated within the NRSROs’ four highest rating categories (AAA, AA, A and BBB). Unrated securities do not necessarily indicate low credit quality, and may or may not be the equivalent of investment-grade. Please consult the Fund’s prospectus and Statement of Additional Information for further information.
CREDIT RATING BREAKDOWN 7/31/19 | NRSRO ONLY TOTAL | |||
| BBB | 1.9% | |||
| BB | 31.4 | |||
| B | 54.1 | |||
| CCC | 4.5 | |||
| CC | 0.1 | |||
| Unrated | 8.0 | |||
The percentages above are based on the market value of the Fund’s securities as of July 31, 2019, and are subject to change. Except for securities labeled “Unrated,” all securities have been rated by at least one Nationally Recognized Statistical Rating Organization (“NRSRO”), such as S&P Global Ratings (“S&P”). For securities rated only by an NRSRO other than S&P, Invesco Advisers, Inc. (the “Adviser”) converts that rating to the equivalent S&P rating. If two or more NRSROs have assigned a rating to a security, the highest S&P equivalent rating is used. For securities not rated by an NRSRO, the Adviser uses its own credit analysis to assign ratings in categories similar to those of S&P. The use of similar categories is not an indication that the Adviser’s credit analysis process is consistent or comparable with any NRSRO’s process were that NRSRO to rate the same security. Fund assets invested in Invesco Oppenheimer Institutional Government Money Market Fund are assigned that fund’s S&P rating, which is currently AAA. For the purposes of this table, “investment-grade” securities are securities rated within the NRSROs’ four highest rating categories (AAA, AA, A and BBB). Unrated securities do not necessarily indicate low credit quality, and may or may not be the equivalent of investment-grade. Please consult the Fund’s prospectus and Statement of Additional Information for further information.
For more current Fund holdings, please visit invesco.com.
9 INVESCO OPPENHEIMER SENIOR FLOATING RATE PLUS FUND
Share Class Performance
| AVERAGE ANNUAL TOTAL RETURNS WITHOUT SALES CHARGE AS OF 8/31/19 |
| |||||||||||||||
Inception Date | 1-Year | 5-Year | Since Inception | |||||||||||||
| Class A (OSFAX) | 8/23/13 | -0.44 | % | 2.62 | % | 3.06 | % | |||||||||
| Class C (OSFCX) | 8/23/13 | -1.33 | 1.79 | 2.23 | ||||||||||||
| Class R (SFRPX)1 | 5/24/19 | -0.78 | 2.35 | 2.78 | ||||||||||||
| Class Y (OSFYX) | 8/23/13 | -0.17 | 2.62 | 3.05 | ||||||||||||
| Class R5 (SFPPX)1 | 5/24/19 | -0.48 | 2.91 | 3.35 | ||||||||||||
| Class R6 (OSFIX)2 | 8/23/13 | -0.14 | 3.07 | 3.48 | ||||||||||||
| AVERAGE ANNUAL TOTAL RETURNS WITH SALES CHARGE AS OF 8/31/19 |
| |||||||||||||||
Inception Date | 1-Year | 5-Year | Since Inception | |||||||||||||
| Class A (OSFAX) | 8/23/13 | -3.72 | % | 1.94 | % | 2.49 | % | |||||||||
| Class C (OSFCX) | 8/23/13 | -2.27 | 1.79 | 2.23 | ||||||||||||
| Class R (SFRPX)1 | 5/24/19 | -0.78 | 2.35 | 2.78 | ||||||||||||
| Class Y (OSFYX) | 8/23/13 | -0.17 | 2.62 | 3.05 | ||||||||||||
| Class R5 (SFPPX)1 | 5/24/19 | -0.48 | 2.91 | 3.35 | ||||||||||||
| Class R6 (OSFIX)2 | 8/23/13 | -0.14 | 3.07 | 3.48 | ||||||||||||
| AVERAGE ANNUAL TOTAL RETURNS WITHOUT SALES CHARGE AS OF 7/31/19 |
| |||||||||||||||
Inception Date | 1-Year | 5-Year | Since Inception | |||||||||||||
| Class A (OSFAX) | 8/23/13 | 1.39 | % | 2.93 | % | 3.36 | % | |||||||||
| Class C (OSFCX) | 8/23/13 | 0.51 | 2.09 | 2.54 | ||||||||||||
| Class R (SFRPX)1 | 5/24/19 | 1.08 | 2.66 | 3.10 | ||||||||||||
| Class Y (OSFYX) | 8/23/13 | 1.54 | 3.19 | 3.63 | ||||||||||||
| Class R5 (SFPPX)1 | 5/24/19 | 1.37 | 2.92 | 3.36 | ||||||||||||
| Class R6 (OSFIX)2 | 8/23/13 | 1.59 | 3.35 | 3.77 | ||||||||||||
| AVERAGE ANNUAL TOTAL RETURNS WITH SALES CHARGE AS OF 7/31/19 |
| |||||||||||||||
Inception Date | 1-Year | 5-Year | Since Inception | |||||||||||||
| Class A (OSFAX) | 8/23/13 | -1.95 | % | 2.25 | % | 2.78 | % | |||||||||
| Class C (OSFCX) | 8/23/13 | -0.45 | 2.09 | 2.54 | ||||||||||||
| Class R (SFRPX)1 | 5/24/19 | 1.08 | 2.66 | 3.10 | ||||||||||||
| Class Y (OSFYX) | 8/23/13 | 1.54 | 3.19 | 3.63 | ||||||||||||
| Class R5 (SFPPX)1 | 5/24/19 | 1.37 | 2.92 | 3.36 | ||||||||||||
| Class R6 (OSFIX)2 | 8/23/13 | 1.59 | 3.35 | 3.77 | ||||||||||||
10 INVESCO OPPENHEIMER SENIOR FLOATING RATE PLUS FUND
1. Class R and Class R5 shares’ performance shown prior to the inception date (after the close of business on May 24, 2019) is that of the predecessor fund’s Class A shares at net asset value (NAV) and includes the12b-1 fees applicable to Class A shares. Class A shares’ performance reflects any applicable fee waivers and/or expense reimbursements.
2. Pursuant to the closing of the transaction described in the Notes to Financial Statements, after the close of business on May 24, 2019, Class I shares were reorganized as Class R6 shares.
Performance quoted is past performance and cannot guarantee comparable future results; current performance may be lower or higher.Visit invesco.com for the most recentmonth-end performance. Performance figures reflect reinvested distributions and changes in net asset value (NAV). Investment return and principal value will vary so that you may have a gain or a loss when you sell shares. Performance shown at NAV does not include the applicablefront-end sales charge, which would have reduced the performance. The current maximum initial sales charge for Class A shares is 3.25%, and the contingent deferred sales charge for Class C shares is 1% for the1-year period. Class R, Class Y, Class R5 and Class R6 shares have no sales charge; therefore, performance is at NAV. Effective after the close of business on May 24, 2019, Class A, Class C, Class Y, and Class I shares of the predecessor fund were reorganized into Class A, Class C, Class R, Class Y, and Class R6 shares, respectively, of the Fund. Class R5 and Class R shares’ performance shown prior to the inception date is that of the predecessor fund’s Class A shares at NAV and includes the12b-1 fees applicable to Class A shares. Class A shares’ performance reflects any applicable fee waivers and/or expense reimbursements. Returns shown for Class A, Class C, Class R, Class Y, Class R5, and Class R6 shares are blended returns of the predecessor fund and the Fund. Share class returns will differ from those of the predecessor fund because of different expenses. See Fund prospectuses and summary prospectuses for more information on share classes, sales charges and new fee agreements, if any. Fund literature is available at invesco.com.
The Fund’s performance is compared to the performance of the J.P. Morgan Leveraged Loan Index, which tracks the performance of U.S. dollar denominated senior floating rate bank loans. The Index is unmanaged and cannot be purchased directly by investors. While index comparisons may be useful to provide a benchmark for the Fund’s performance, it must be noted that the Fund’s investments are not limited to the investments comprising the Index. Index performance includes reinvestment of income, but does not reflect transaction costs, fees, expenses or taxes. Index performance is shown for illustrative purposes only as a benchmark for the Fund’s performance, and does not predict or depict performance of the Fund. The Fund’s performance reflects the effects of the Fund’s business and operating expenses.
The views and opinions expressed in management’s discussion of Fund performance are those of Invesco Advisers, Inc. These views and opinions are subject to change at any time based on factors such as market and economic conditions. These views and opinions may not be relied upon as investment advice or recommendations, or as an offer for a particular security. The information is not a complete analysis of every aspect of any market, country, industry, security or the Fund. Statements of fact are from sources considered reliable, but Invesco Advisers, Inc. makes no representation or warranty as to their completeness or accuracy. Although historical performance is no guarantee of future results, these insights may help you understand our investment management philosophy.
11 INVESCO OPPENHEIMER SENIOR FLOATING RATE PLUS FUND
Before investing, investors should carefully read the prospectus and/or summary prospectus and carefully consider the investment objectives, risks, charges and expenses. For this and more complete information about the fund(s), investors should ask their advisors for a prospectus/summary prospectus or visit invesco. com/fundprospectus.
Shares of Invesco funds are not deposits or obligations of any bank, are not guaranteed by any bank, are not insured by the FDIC or any other agency, and involve investment risks, including the possible loss of the principal amount invested.
12 INVESCO OPPENHEIMER SENIOR FLOATING RATE PLUS FUND
Fund Expenses. As a shareholder of the Fund, you incur two types of costs: (1) transaction costs, which may include sales charges (loads) on purchase payments and/or contingent deferred sales charges on redemptions; and (2) ongoing costs, including management fees; distribution and service fees; and other Fund expenses. These examples are intended to help you understand your ongoing costs (in dollars) of investing in the Fund and to compare these costs with the ongoing costs of investing in other mutual funds.
The examples are based on an investment of $1,000.00 invested at the beginning of the period and held for the entire6-month period ended August 31, 2019.
Actual Expenses. The first section of the table provides information about actual account values and actual expenses. You may use the information in this section for the class of shares you hold, together with the amount you invested, to estimate the expense that you paid over the period. Simply divide your account value by $1,000.00 (for example, an $8,600.00 account value divided by $1,000.00 = 8.60), then multiply the result by the number in the first section under the heading entitled “Expenses Paid During 6 Months Ended August 31, 2019” to estimate the expenses you paid on your account during this period.
Hypothetical Example for Comparison Purposes.The second section of the table provides information about hypothetical account values and hypothetical expenses based on the Fund’s actual expense ratio for each class of shares, and an assumed rate of return of 5% per year for each class before expenses, which is not the Fund’s actual return. The hypothetical account values and expenses may not be used to estimate the actual ending account balance or expenses you paid for the period. You may use this information to compare the ongoing costs of investing in the Fund and other funds. To do so, compare this 5% hypothetical example for the class of shares you hold with the 5% hypothetical examples that appear in the shareholder reports of the other funds.
Please note that the expenses shown in the table are meant to highlight your ongoing costs only and do not reflect any transactional costs, such asfront-end or contingent deferred sales charges (loads). Therefore, the “hypothetical” section of the table is useful in comparing ongoing costs only, and will not help you determine the relative total costs of owning different funds. In addition, if these transactional costs were included, your costs would have been higher.
13 INVESCO OPPENHEIMER SENIOR FLOATING RATE PLUS FUND
| Actual | Beginning Value | Ending Account Value | Expenses Paid During 6 Months Ended | |||||||||
| Class A | $ | 1,000.00 | $ | 987.80 | $ | 8.00 | ||||||
| Class C | 1,000.00 | 984.30 | 12.53 | |||||||||
| Class R | 1,000.00 | 985.70 | 4.97 | |||||||||
| Class Y | 1,000.00 | 990.40 | 6.75 | |||||||||
| Class R5 | 1,000.00 | 987.40 | 3.70 | |||||||||
| Class R6 | 1,000.00 | 990.40 | 6.64 | |||||||||
| Hypothetical | ||||||||||||
| (5% return before expenses) | ||||||||||||
| Class A | 1,000.00 | 1,017.19 | 8.12 | |||||||||
| Class C | 1,000.00 | 1,012.65 | 12.71 | |||||||||
| Class R | 1,000.00 | 1,015.93 | 9.39 | |||||||||
| Class Y | 1,000.00 | 1,018.45 | 6.84 | |||||||||
| Class R5 | 1,000.00 | 1,018.30 | 6.99 | |||||||||
| Class R6 | 1,000.00 | 1,018.55 | 6.74 | |||||||||
1. Actual expenses paid for Class A, C, Y, and R6 are equal to the Fund’s annualized expense ratio for that class, multiplied by the average account value over the period, multiplied by 184/365 (to reflect theone-half year period). Actual expenses paid for Class R and R5 are equal to the Fund’s annualized expense ratio for that class, multiplied by the average account value over the period, multiplied by 99/365 to reflect the period from after the close of business on May 24, 2019 (inception of offering) to August 31, 2019.
2.Hypothetical expenses paid for all classes are equal to the Fund’s annualized expense ratio for that class, multiplied by the average account value over the period, multiplied by 184/365 (to reflect theone-half year period).
Those annualized expense ratios, excluding indirect expenses from affiliated funds, based on the6-month period ended August 31, 2019 for Classes A, C, Y and R6 and for the period from after the close of business on May 24, 2019 (inception of offering) to August 31, 2019 for Class R and R5 are as follows:
| Class | Expense Ratios | |||
| Class A | 1.59 | % | ||
| Class C | 2.49 | |||
| Class R | 1.84 | |||
| Class Y | 1.34 | |||
| Class R5 | 1.37 | |||
| Class R6 | 1.32 | |||
The expense ratios reflect voluntary and/or contractual waivers and/or reimbursements of expenses by the Fund’s Manager. Some of these undertakings may be modified or terminated at any time, as indicated in the Fund’s prospectus. The “Financial Highlights” tables in the Fund’s financial statements, included in this report, also show the gross expense ratios, without such waivers or reimbursements and reduction to custodian expenses, if applicable.
14 INVESCO OPPENHEIMER SENIOR FLOATING RATE PLUS FUND
Fund Expenses. As a shareholder of the Fund, you incur two types of costs: (1) transaction costs, which may include sales charges (loads) on purchase payments and/or contingent deferred sales charges on redemptions; and (2) ongoing costs, including management fees; distribution and service fees; and other Fund expenses. These examples are intended to help you understand your ongoing costs (in dollars) of investing in the Fund and to compare these costs with the ongoing costs of investing in other mutual funds.
The examples are based on an investment of $1,000.00 invested at the beginning of the period and held for the entire6-month period ended July 31, 2019.
Actual Expenses. The first section of the table provides information about actual account values and actual expenses. You may use the information in this section for the class of shares you hold, together with the amount you invested, to estimate the expense that you paid over the period. Simply divide your account value by $1,000.00 (for example, an $8,600.00 account value divided by $1,000.00 = 8.60), then multiply the result by the number in the first section under the heading entitled “Expenses Paid During 6 Months Ended July 31, 2019” to estimate the expenses you paid on your account during this period.
Hypothetical Example for Comparison Purposes.The second section of the table provides information about hypothetical account values and hypothetical expenses based on the Fund’s actual expense ratio for each class of shares, and an assumed rate of return of 5% per year for each class before expenses, which is not the Fund’s actual return. The hypothetical account values and expenses may not be used to estimate the actual ending account balance or expenses you paid for the period. You may use this information to compare the ongoing costs of investing in the Fund and other funds. To do so, compare this 5% hypothetical example for the class of shares you hold with the 5% hypothetical examples that appear in the shareholder reports of the other funds.
Please note that the expenses shown in the table are meant to highlight your ongoing costs only and do not reflect any transactional costs, such asfront-end or contingent deferred sales charges (loads). Therefore, the “hypothetical” section of the table is useful in comparing ongoing costs only, and will not help you determine the relative total costs of owning different funds. In addition, if these transactional costs were included, your costs would have been higher.
15 INVESCO OPPENHEIMER SENIOR FLOATING RATE PLUS FUND
| Actual | Beginning Value | Ending Account Value | Expenses Paid During 6 Months Ended | |||||||||
| Class A | $ | 1,000.00 | $ | 1,025.00 | $ | 9.48 | ||||||
| Class C | 1,000.00 | 1,020.40 | 14.02 | |||||||||
| Class R | 1,000.00 | 1,023.10 | 4.02 | |||||||||
| Class Y | 1,000.00 | 1,026.20 | 8.22 | |||||||||
| Class R5 | 1,000.00 | 1,024.80 | 3.14 | |||||||||
| Class R6 | 1,000.00 | 1,026.30 | 8.12 | |||||||||
| Hypothetical | ||||||||||||
| (5% return before expenses) | ||||||||||||
| Class A | 1,000.00 | 1,015.47 | 9.44 | |||||||||
| Class C | 1,000.00 | 1,011.01 | 13.96 | |||||||||
| Class R | 1,000.00 | 1,014.23 | 10.69 | |||||||||
| Class Y | 1,000.00 �� | 1,016.71 | 8.18 | |||||||||
| Class R5 | 1,000.00 | 1,016.56 | 8.33 | |||||||||
| Class R6 | 1,000.00 | 1,016.81 | 8.08 | |||||||||
1. Actual expenses paid for Class A, C, Y, and R6 are equal to the Fund’s annualized expense ratio for that class, multiplied by the average account value over the period, multiplied by 181/365 (to reflect theone-half year period). Actual expenses paid for Class R and R5 are equal to the Fund’s annualized expense ratio for that class, multiplied by the average account value over the period, multiplied by 68/365 to reflect the period from after the close of business on May 24, 2019 (inception of offering) to July 31, 2019.
2.Hypothetical expenses paid for all classes are equal to the Fund’s annualized expense ratio for that class, multiplied by the average account value over the period, multiplied by 181/365 (to reflect theone-half year period).
Those annualized expense ratios, excluding indirect expenses from affiliated funds, based on the6-month period ended July 31, 2019 for Classes A, C, Y and R6 and for the period from after the close of business on May 24, 2019 (inception of offering) to July 31, 2019 for Class R and R5 are as follows:
| Class | Expense Ratios | |||
| Class A | 1.88 | % | ||
| Class C | 2.78 | |||
| Class R | 2.13 | |||
| Class Y | 1.63 | |||
| Class R5 | 1.66 | |||
| Class R6 | 1.61 | |||
The expense ratios reflect voluntary and/or contractual waivers and/or reimbursements of expenses by the Fund’s Manager. Some of these undertakings may be modified or terminated at any time, as indicated in the Fund’s prospectus. The “Financial Highlights” tables in the Fund’s financial statements, included in this report, also show the gross expense ratios, without such waivers or reimbursements and reduction to custodian expenses, if applicable.
16 INVESCO OPPENHEIMER SENIOR FLOATING RATE PLUS FUND
SCHEDULE OF INVESTMENTSAugust 31, 2019
| Principal Amount | Value | |||||||
| Corporate Loans*—100.2% | ||||||||
| Consumer Discretionary—32.3% | ||||||||
| Distributors—1.4% | ||||||||
Albertson’s LLC, Sr. Sec. Credit Facilities 1st Lien Term Loan: Tranche B7, 4.862%, [LIBOR12+275], 11/17/251 | $ | 126,090 | $ | 126,681 | ||||
| Tranche B8, 4.862%, [LIBOR12+275], 8/17/261 | 64,198 | 64,531 | ||||||
| Alphabet Holdings Co., Inc., Sr. Sec. Credit Facilities 1st Lien Term Loan, 5.612%, [LIBOR4+350], 9/26/241 | 115,733 | 108,042 | ||||||
| Bass Pro Group LLC, Sr. Sec. Credit Facilities 1st Lien Term Loan, Tranche B, 7.112%, [LIBOR12+500], 9/25/241 | 340,391 | 324,675 | ||||||
| Belk, Inc., Sr. Sec. Credit Facilities 1st Lien Term Loan, Tranche B, 6.944%, [LIBOR4+475], 12/12/221 | 22,256 | 17,490 | ||||||
| Jo-Ann Stores LLC, Sr. Sec. Credit Facilities 1st Lien Term Loan, Tranche B, 7.259%, [LIBOR4+500], 10/20/231 | 48,980 | 38,062 | ||||||
| Petco Animal Supplies, Inc., Sr. Sec. Credit Facilities 1st Lien Term Loan, Tranche B1, 5.506%, [LIBOR4+325], 1/26/231 | 122,254 | 88,226 | ||||||
| United Natural Foods, Inc., Sr. Sec. Credit Facilities 1st Lien Term Loan, Tranche B, 6.362%, [LIBOR12+425], 10/22/251 | 273,325 | 227,088 | ||||||
|
| 994,795
|
| ||||||
| Diversified Consumer Services—1.2% | ||||||||
| 4L Technologies, Inc., Sr. Sec. Credit Facilities 1st Lien Term Loan, Tranche B, 6.612%, [LIBOR4+450], 5/8/201 | 627,374 | 349,761 | ||||||
| IQOR US, Inc., Sr. Sec. Credit Facilities 1st Lien Term Loan, Tranche B, 7.319%, [LIBOR4+500], 4/1/211 | 532,681 | 491,398 | ||||||
| IQOR US, Inc., Sr. Sec. Credit Facilities 2nd Lien Term Loan, 11.069%, [LIBOR4+875], 4/1/221 | 40,000 | 30,467 | ||||||
|
| 871,626
|
| ||||||
| Hotels, Restaurants & Leisure—7.9% | ||||||||
| 24 Hour Fitness Worldwide, Inc., Sr. Sec. Credit Facilities 1st Lien Term Loan, Tranche B, 5.734%, [LIBOR12+350], 5/30/251 | 48,565 | 47,339 | ||||||
| Caesars Growth Properties Holdings LLC, Sr. Sec. Credit Facilities 1st Lien Term Loan, 4.862%, [LIBOR4+275], 12/23/241 | 1,176,703 | 1,161,188 | ||||||
| CDS US Intermediate Holdings, Inc., Sr. Sec. Credit Facilities 1st Lien Term Loan, Tranche B, 6.08%, [LIBOR4+375], 7/8/221 | 118,952 | 114,194 | ||||||
| Churchill Downs, Inc., Sr. Sec. Credit Facilities 1st Lien Term Loan, Tranche B, 4.12%, [LIBOR12+200], 12/27/241 | 103,611 | 103,870 | ||||||
| CityCenter Holdings LLC, Sr. Sec. Credit Facilities 1st Lien Term Loan, Tranche B, 4.362%, [LIBOR12+225], 4/18/241 | 260,503 | 260,829 | ||||||
| Delta 2 Lux Sarl, Sr. Sec. Credit Facilities 1st Lien Term Loan, Tranche B3, 4.612%, [LIBOR12+250], 2/1/241 | 422,609 | 415,147 | ||||||
| Eldorado Resorts, Inc., Sr. Sec. Credit Facilities 1st Lien Term Loan, Tranche B,4.375%-4.50%, [LIBOR4+225], 4/17/241 | 196,284 | 196,131 | ||||||
| Everi Payments, Inc., Sr. Sec. Credit Facilities 1st Lien Term Loan, Tranche B, 5.112%, [LIBOR12+300], 5/9/241 | 327,815 | 328,307 | ||||||
| Four Seasons Hotels Ltd., Sr. Sec. Credit Facilities 1st Lien Term Loan, 4.112%, [LIBOR12+200], 11/30/231 | 58,500 | 58,654 | ||||||
17 INVESCO OPPENHEIMER SENIOR FLOATING RATE PLUS FUND
SCHEDULE OF INVESTMENTSContinued
| Principal Amount | Value | |||||||
| Hotels, Restaurants & Leisure (Continued) | ||||||||
| Gateway Casinos & Entertainment Ltd., Sr. Sec. Credit Facilities 1st Lien Term Loan, Tranche B, 5.33%, [LIBOR4+300], 12/1/231 | $ | 49,500 | $ | 49,030 | ||||
| GVC Holdings plc, Sr. Sec. Credit Facilities 1st Lien Term Loan, Tranche B2, 4.652%, [LIBOR4+275], 3/29/241 | 237,000 | 237,408 | ||||||
| LTI Holdings, Inc., Sr. Sec. Credit Facilities 1st Lien Term Loan, 5.612%, [LIBOR12+350], 9/6/251 | 73,264 | 69,356 | ||||||
| Nascar Holdings Inc., Sr. Sec. Credit Facilities 1st Lien Term Loan, Tranche B, 5.275%, 7/26/261 | 135,000 | 135,872 | ||||||
| Scientific Games International, Inc., Sr. Sec. Credit Facilities 1st Lien Term Loan, Tranche B5,4.862%-4.896%, [LIBOR6+275], 8/14/241 | 939,486 | 929,894 | ||||||
| SeaWorld Parks & Entertainment, Inc., Sr. Sec. Credit Facilities 1st Lien Term Loan, Tranche B5, 5.112%,[LIBOR4+300], 4/1/241 | 248,096 | 248,368 | ||||||
| Stars Group Holdings BV, Sr. Sec. Credit Facilities 1st Lien Term Loan, Tranche B, 6.101%, [LIBOR4+350], 7/10/251 | 539,552 | 541,874 | ||||||
| Station Casinos LLC, Sr. Sec. Credit Facilities 1st Lien Term Loan, Tranche B, 4.62%, [LIBOR12+250], 6/8/231 | 414,873 | 416,236 | ||||||
| Topgolf International, Inc., Sr. Sec. Credit Facilities 1st Lien Term Loan, 7.701%, [LIBOR12+550], 2/8/261 | 24,938 | 25,125 | ||||||
| Town Sports International LLC, Sr. Sec. Credit Facilities 1st Lien Term Loan, Tranche B, 5.612%, [LIBOR12+350], 11/15/201 | 213,430 | 199,557 | ||||||
| Weight Watchers International, Inc., Sr. Sec. Credit Facilities 1st Lien Term Loan, Tranche B,6.98%-7.07%, [LIBOR12+475], 11/29/241 | 79,961 | 80,074 | ||||||
| Wyndham Hotels & Resorts, Inc., Sr. Sec. Credit Facilities 1st Lien Term Loan, Tranche B, 3.862%, [LIBOR4+200], 5/30/251 | 79,400 | 79,742 | ||||||
|
| 5,698,195
|
| ||||||
| Household Durables—4.1% | ||||||||
| ABG Intermediate Holdings 2 LLC, Sr. Sec. Credit Facilities 1st Lien Term Loan, 5.612%, [LIBOR4+350], 9/27/241 | 257,942 | 257,379 | ||||||
| American Greetings Corp., Sr. Sec. Credit Facilities 1st Lien Term Loan, Tranche B, 6.612%, [LIBOR12+450], 4/6/241 | 232,436 | 231,274 | ||||||
| Callaway Golf Co., Sr. Sec. Credit Facilities 1st Lien Term Loan, Tranche B, 6.713%, [LIBOR12+450], 12/14/251 | 51,425 | 52,191 | ||||||
| Coty, Inc., Sr. Sec. Credit Facilities 1st Lien Term Loan, Tranche B, 4.463%, [LIBOR4+225], 4/7/251 | 386,010 | 374,719 | ||||||
| Hanesbrands, Inc., Sr. Sec. Credit Facilities 1st Lien Term Loan, Tranche B, 3.862%, [LIBOR12+175], 12/16/241 | 29,624 | 29,920 | ||||||
| International Textile Group, Inc., Sr. Sec. Credit Facilities 1st Lien Term Loan, 7.23%, [LIBOR4+500], 5/1/241 | 141,711 | 127,540 | ||||||
| Lifetime Brands, Inc., Sr. Sec. Credit Facilities 1st Lien Term Loan, Tranche B,5.612%-5.902%, [LIBOR12+350], 2/28/251 | 44,438 | 43,104 | ||||||
| PetSmart, Inc., Sr. Sec. Credit Facilities 1st Lien Term Loan, Tranche B, 6.21%, [LIBOR12+400], 3/11/221 | 280,906 | 273,357 | ||||||
| Revlon Consumer Products Corp., Sr. Sec. Credit Facilities 1st Lien Term Loan, Tranche B, 5.624%, [LIBOR12+350], 9/7/231 | 663,642 | 532,241 | ||||||
18 INVESCO OPPENHEIMER SENIOR FLOATING RATE PLUS FUND
| Principal Amount | Value | |||||||
| Household Durables (Continued) | ||||||||
| Rodan & Fields LLC, Sr. Sec. Credit Facilities 1st Lien Term Loan, Tranche B, 6.195%, [LIBOR12+400], 6/16/251 | $ | 207,850 | $ | 181,557 | ||||
| Serta Simmons Bedding LLC, Sr. Sec. Credit Facilities 1st Lien Term Loan, Tranche B,5.682%-5.701%, [LIBOR4+350], 11/8/231 | 961,001 | 645,471 | ||||||
| SIWF Holdings, Inc., Sr. Sec. Credit Facilities 1st Lien Term Loan, 6.395%, [LIBOR12+425], 6/15/251 | 173,250 | 171,626 | ||||||
| Varsity Brands Holdings Co., Inc., Sr. Sec. Credit Facilities 1st Lien Term Loan, 5.612%, [LIBOR12+350], 12/16/241 | 34,587 | 33,750 | ||||||
|
| 2,954,129
|
| ||||||
| Media—17.5% | ||||||||
| Acosta, Inc., Sr. Sec. Credit Facilities 1st Lien Term Loan, Tranche B, 5.362%, [LIBOR4+325], 9/26/211 | 3,815 | 1,329 | ||||||
Altice Financing SA, Sr. Sec. Credit Facilities 1st Lien Term Loan: Tranche B, 4.945%, [LIBOR4+275], 7/15/251 | 323,711 | 314,740 | ||||||
| Tranche B13, 6.197%, [LIBOR4+400], 8/14/261 | 307,675 | 305,657 | ||||||
| Camelot Finance LP, Sr. Sec. Credit Facilities 1st Lien Term Loan, Tranche B, 5.362%, [LIBOR12+325], 10/3/231 | 54,546 | 54,791 | ||||||
| CBS Radio, Inc., Sr. Sec. Credit Facilities 1st Lien Term Loan, Tranche B1, 4.89%, [LIBOR4+275], 11/18/241 | 186,165 | 186,301 | ||||||
| Checkout Holding Corp., Sr. Sec. Credit Facilities 1st Lien Exit Term Loan, 9.682%, [LIBOR12+750], 2/15/231 | 169,742 | 140,886 | ||||||
| Checkout Holding Corp., Sr. Sec. Credit Facilities 1st Lien Exit Term Loan, 9.50% PIK Rate, 3.314% Cash Rate, [LIBOR4+100], 8/15/231,3 | 101,726 | 48,320 | ||||||
CSC Holdings LLC, Sr. Sec. Credit Facilities 1st Lien Term Loan: Tranche B, 4.445%, [LIBOR12+225], 7/17/251 | 313,810 | 313,025 | ||||||
| Tranche B, 4.445%, [LIBOR4+225], 1/15/261 | 233,825 | 233,143 | ||||||
| Deluxe Entertainment Services Group, Inc., Sr. Sec. Credit Facilities 1st Lien Term Loan,9.668%-11.75%, [LIBOR6+750], 2/28/201,2 | 45,731 | 42,302 | ||||||
| Deluxe Entertainment Services Group, Inc., Sr. Sec. Credit Facilities 1st Lien Term Loan, Tranche B, 7.756%, [LIBOR4+550], 2/28/201 | 367,028 | 62,211 | ||||||
| Deluxe Entertainment Services Group, Inc., Sr. Sec. Credit Facilities 1st Lien Term Loan, Delayed Draw, 0.50%, 2/28/201,2,4 | 3,219 | 2,977 | ||||||
| EW Scripps Co. (The), Sr. Sec. Credit Facilities 1st Lien Term Loan, Tranche B, 6.112%, [LIBOR12+275], 5/1/261 | 119,700 | 119,912 | ||||||
| Harland Clarke Holdings Corp., Sr. Sec. Credit Facilities 1st Lien Term Loan, Tranche B7, 7.08%, [LIBOR4+475], 11/3/231 | 108,652 | 85,374 | ||||||
| iHeartCommunications, Inc., Sr. Sec. Credit Facilities 1st Lien Exit Term Loan, 6.23%, [LIBOR12+400], 5/1/261 | 529,833 | 532,252 | ||||||
Intelsat Jackson Holdings SA, Sr. Sec. Credit Facilities 1st Lien Term Loan: Tranche B3, 5.895%, [LIBOR4+375], 11/27/231 | 420,000 | 420,525 | ||||||
| Tranche B4, 6.645%, [LIBOR4+450], 1/2/241 | 50,000 | 50,414 | ||||||
| ION Media Networks, Inc., Sr. Sec. Credit Facilities 1st Lien Term Loan, Tranche B4, 5.125%, [LIBOR12+300], 12/18/241 | 676,737 | 676,565 | ||||||
19 INVESCO OPPENHEIMER SENIOR FLOATING RATE PLUS FUND
SCHEDULE OF INVESTMENTSContinued
| Principal Amount | Value | |||||||
| Media (Continued) | ||||||||
| Liberty Cablevision of Puerto Rico LLC, Sr. Sec. Credit Facilities 1st Lien Term Loan, 5.695%, [LIBOR4+350], 1/7/221 | $ | 320,000 | $ | 318,000 | ||||
| Lions Gate Capital Holdings LLC, Sr. Sec. Credit Facilities 1st Lien Term Loan, Tranche B, 4.362%, [LIBOR4+225], 3/24/251 | 194,370 | 194,188 | ||||||
| MacDonald Dettwiler & Associates Ltd., Sr. Sec. Credit Facilities 1st Lien Term Loan, Tranche B, 4.87%, [LIBOR4+250], 10/4/241 | 161,791 | 142,241 | ||||||
| MediArena Acquisition BV, Sr. Sec. Credit Facilities 1st Lien Term Loan, 8.07%, [LIBOR4+575], 8/13/211 | 359,289 | 356,372 | ||||||
| Metro-Goldwyn-Mayer, Inc., Sr. Sec. Credit Facilities 1st Lien Term Loan, Tranche B, 4.62%, [LIBOR4+250], 7/3/251,2 | 240,000 | 239,700 | ||||||
| Metro-Goldwyn-Mayer, Inc., Sr. Sec. Credit Facilities 2nd Lien Term Loan, Tranche B, 6.62%, [LIBOR4+450], 7/3/261 | 5,000 | 4,887 | ||||||
| Mission Broadcasting, Inc., Sr. Sec. Credit Facilities 1st Lien Term Loan, Tranche B3, 4.48%, [LIBOR12+225], 1/17/241 | 134,366 | 134,018 | ||||||
| Monarchy Enterprises Holdings BV, Sr. Sec. Credit Facilities 1st Lien Term Loan, 8.612%, [LIBOR4+650], 10/13/221,2 | 655,000 | 651,725 | ||||||
| NEP Group, Inc., Sr. Sec. Credit Facilities 1st Lien Term Loan, Tranche B, 5.362%, [LIBOR4+325], 10/20/251 | 557,200 | 545,220 | ||||||
Nexstar Broadcasting, Inc., Sr. Sec. Credit Facilities 1st Lien Term Loan: Tranche B, 4.366%, [LIBOR4+225], 7/19/241 | 674,505 | 672,758 | ||||||
| Tranche B, 5.253%, [LIBOR4+275], 6/19/261 | 105,000 | 105,187 | ||||||
| Radiate Holdco LLC, Sr. Sec. Credit Facilities 1st Lien Term Loan, 5.112%, [LIBOR12+300], 2/1/241 | 622,785 | 617,856 | ||||||
| Red Ventures LLC, Sr. Sec. Credit Facilities 1st Lien Term Loan, Tranche B, 5.112%, [LIBOR12+300], 11/8/241 | 293,848 | 294,100 | ||||||
| SFR Group SA, Sr. Sec. Credit Facilities 1st Lien Term Loan, Tranche B12, 5.885%, [LIBOR12+368.75], 1/31/261 | 454,153 | 447,223 | ||||||
Sinclair Television Group Inc., Sr. Sec. Credit Facilities 1st Lien Term Loan: Tranche B, 5.42%, [LIBOR12+325], 7/18/261 | 140,000 | 140,321 | ||||||
| Tranche B, 4.70%, [LIBOR4+250], 9/30/261 | 90,114 | 90,208 | ||||||
| Sinclair Television Group, Inc., Sr. Sec. Credit Facilities 1st Lien Term Loan, Tranche B2, 4.37%, [LIBOR12+225], 1/3/241 | 375,053 | 374,865 | ||||||
| SpeedCast International Ltd., Sr. Sec. Credit Facilities 1st Lien Term Loan, Tranche B, 5.08%, [LIBOR4+250], 5/3/251 | 168,547 | 156,959 | ||||||
| Technicolor SA, Sr. Sec. Credit Facilities 1st Lien Term Loan, Tranche B, 4.874%, [LIBOR4+275], 12/6/231 | 136,697 | 122,515 | ||||||
| Telenet Financing USD LLC, Sr. Sec. Credit Facilities 1st Lien Term Loan, Tranche B, 4.445%, [LIBOR12+225], 8/15/261 | 285,000 | 284,679 | ||||||
| Tribune Media Co., Sr. Sec. Credit Facilities 1st Lien Term Loan, Tranche B, 5.112%, [LIBOR12+300], 1/26/241 | 621,818 | 622,076 | ||||||
| Univision Communications, Inc., Sr. Sec. Credit Facilities 1st Lien Term Loan, Tranche C5, 4.862%, [LIBOR12+275], 3/15/241 | 820,982 | 786,821 | ||||||
| Virgin Media Bristol LLC, Sr. Sec. Credit Facilities 1st Lien Term Loan, Tranche K, 4.695%, [LIBOR12+250], 1/15/261 | 435,000 | 435,459 | ||||||
| WideOpenWest Finance LLC, Sr. Sec. Credit Facilities 1st Lien Term Loan, Tranche B, 5.395%, [LIBOR12+325], 8/18/231 | 541,635 | 522,001 | ||||||
20 INVESCO OPPENHEIMER SENIOR FLOATING RATE PLUS FUND
| Principal Amount | Value | |||||||
| Media (Continued) | ||||||||
| William Morris Endeavor Entertainment LLC, Sr. Sec. Credit Facilities 1st Lien Term Loan, Tranche B1, 4.87%, [LIBOR6+275], 5/18/251 | $ | 120,880 | $ | 117,919 | ||||
| Ziggo Secured Finance Partnership, Sr. Sec. Credit Facilities 1st Lien Term Loan, Tranche E, 4.695%, [LIBOR12+250], 4/15/251 | 705,000 | 701,218 | ||||||
|
| 12,669,240
|
| ||||||
| Multiline Retail—0.2% | ||||||||
| Neiman Marcus Group Ltd. LLC, Sr. Sec. Credit Facilities 1st Lien Term Loan, 1.00% PIK Rate, 7.729% Cash Rate, [LIBOR12+650], 10/25/231,3 | 196,629 | 161,360 | ||||||
| Consumer Staples—2.7% | ||||||||
| Beverages—2.7% | ||||||||
| Dole Food Co., Inc., Sr. Sec. Credit Facilities 1st Lien Term Loan, Tranche B,4.862%-4.917%, [LIBOR12+275], 4/6/241 | 300,830 | 297,634 | ||||||
| Hearthside Group Holdings LLC, Sr. Sec. Credit Facilities 1st Lien Term Loan, 5.80%, [LIBOR12+368.75], 5/23/251 | 196,739 | 191,825 | ||||||
| Hostess Brands LLC, Sr. Sec. Credit Facilities 1st Lien Term Loan,4.362%-4.833%, [LIBOR12+225], 8/3/221 | 164,402 | 164,357 | ||||||
| IRB Holding Corp., Sr. Sec. Credit Facilities 1st Lien Term Loan, 5.55%, [LIBOR12+325], 2/5/251 | 417,317 | 415,003 | ||||||
| KFC Holding Co., Sr. Sec. Credit Facilities 1st Lien Term Loan, Tranche B, 3.932%, [LIBOR12+175], 4/3/251 | 80,150 | 80,175 | ||||||
| Nomad Foods Europe Midco Ltd., Sr. Sec. Credit Facilities 1st Lien Term Loan, 4.445%, [LIBOR12+225], 5/15/241 | 279,781 | 278,732 | ||||||
| NPC International, Inc., Sr. Sec. Credit Facilities 1st Lien Term Loan, 5.612%, [LIBOR12+350], 4/19/241 | 89,858 | 65,551 | ||||||
| Sigma US Corp., Sr. Sec. Credit Facilities 1st Lien Term Loan, Tranche B, 5.32%, [LIBOR4+325], 7/2/251 | 366,486 | 365,112 | ||||||
| Sunshine Investments BV, Sr. Sec. Credit Facilities 1st Lien Term Loan, Tranche B3, 5.768%, [LIBOR4+325], 3/28/251 | 128,700 | 129,022 | ||||||
|
| 1,987,411
|
| ||||||
| Energy—4.0% | ||||||||
| Energy Equipment & Services—3.6% | ||||||||
| AL Midcoast Holdings LLC, Sr. Sec. Credit Facilities 1st Lien Term Loan, Tranche B, 7.83%, [LIBOR4+550], 8/1/251 | 158,800 | 155,922 | ||||||
| Ascent Resources - Marcellus LLC, Sr. Sec. Credit Facilities 1st Lien Term Loan, 8.695%, [LIBOR12+650], 3/30/231,2 | 47,499 | 46,074 | ||||||
| BCP Renaissance Parent LLC, Sr. Sec. Credit Facilities 1st Lien Term Loan, Tranche B, 6.083%, [LIBOR4+350], 10/31/241 | 187,976 | 180,164 | ||||||
| Bison Midstream Holdings LLC, Sr. Sec. Credit Facilities 1st Lien Term Loan, Tranche B, 6.169%, [LIBOR12+400], 5/21/251 | 43,751 | 39,522 | ||||||
| Eastern Power LLC, Sr. Sec. Credit Facilities 1st Lien Term Loan, Tranche B, 5.984%, [LIBOR12+375], 10/2/231 | 438,408 | 440,492 | ||||||
| Fieldwood Energy LLC, Sr. Sec. Credit Facilities 1st Lien Term Loan, 7.506%, [LIBOR12+525], 4/11/221 | 403,752 | 357,826 | ||||||
| GIP III Stetson I LP, Sr. Sec. Credit Facilities 1st Lien Term Loan, Tranche B, 6.432%, [LIBOR4+425], 7/18/251 | 75,996 | 72,897 | ||||||
21 INVESCO OPPENHEIMER SENIOR FLOATING RATE PLUS FUND
SCHEDULE OF INVESTMENTSContinued
| Principal Amount | Value | |||||||
| Energy Equipment & Services (Continued) | ||||||||
| HGIM Corp., Sr. Sec. Credit Facilities 1st Lien Term Loan, Tranche B, 8.034%, [LIBOR4+600], 7/2/231 | $ | 51,052 | $ | 46,330 | ||||
| Larchmont Resources LLC, Sr. Sec. Credit Facilities 1st Lien Term Loan, Tranche A, 9.61%, [LIBOR4+700], 8/7/201,2 | 58,843 | 55,460 | ||||||
| Limetree Bay Terminals LLC, Sr. Sec. Credit Facilities 1st Lien Term Loan,6.112%-6.24%, [LIBOR12+400], 2/15/241 | 304,739 | 292,550 | ||||||
| McDermott Technology Americas, Inc., Sr. Sec. Credit Facilities 1st Lien Term Loan, Tranche B, 7.112%, [LIBOR12+500], 5/12/251 | 207,523 | 191,052 | ||||||
| Seadrill Operating LP, Sr. Sec. Credit Facilities 1st Lien Term Loan, Tranche B, 8.33%, [LIBOR4+600], 2/21/211 | 563,497 | 336,126 | ||||||
| Sheridan Investment Partners II LP, Sr. Sec. Credit Facilities 1st Lien Term Loan, Tranche B, 6.13%, [LIBOR4+350], 12/16/201,5 | 232,460 | 131,340 | ||||||
| Sheridan Production PartnersII-A LP, Sr. Sec. Credit Facilities 1st Lien Term Loan, Tranche B, 6.13%, [LIBOR4+350], 12/16/201,5 | 41,273 | 23,319 | ||||||
| Sheridan Production PartnersII-M LP, Sr. Sec. Credit Facilities 1st Lien Term Loan, Tranche B, 6.13%, [LIBOR4+350], 12/16/201,5 | 19,615 | 11,082 | ||||||
| Ultra Resources, Inc., Sr. Sec. Credit Facilities 1st Lien Exit Term Loan, 0.25% PIK Rate, 6.02% Cash Rate, [LIBOR4+400], 4/12/241,3 | 394,446 | 272,278 | ||||||
|
| 2,652,434
|
| ||||||
| Oil, Gas & Consumable Fuels—0.4% | ||||||||
| Southcross Energy Partners LP, Sr. Sec. Credit Facilities Debtor in Possession 1st Lien Term Loan, 10.50%, [PRIME12+525], 10/1/191 | 59,684 | 60,877 | ||||||
| Southcross Energy Partners LP, Sr. Sec. Credit Facilities 1st Lien Term Loan, Tranche B, 7.053%, [PRIME4+525], 8/4/211,5 | 189,209 | 142,853 | ||||||
| Southcross Energy Partners LP, Sr. Sec. Credit Facilities Debtor in Possession 1st Lien Term Loan, 15.652% PIK Rate, 12.20% Cash Rate, [LIBOR12+1,000], 10/1/191,3 | 58,662 | 59,836 | ||||||
| Southcross Energy Partners LP, Sr. Sec. Credit Facilities Debtor in Possession 1st Lien Term Loan, 15.652% PIK Rate, 10.50% Cash Rate, [PRIME12+525], 10/1/191,3 | 13,034 | 12,675 | ||||||
|
| 276,241
|
| ||||||
| Financials—6.0% | ||||||||
| Commercial Banks—4.9% | ||||||||
| Acrisure LLC, Sr. Sec. Credit Facilities 1st Lien Term Loan, Tranche B,5.862%-6.362%, [LIBOR4+375], 11/22/231 | 355,701 | 352,742 | ||||||
| Alliant Holdings Intermediate LLC, Sr. Sec. Credit Facilities 1st Lien Term Loan, Tranche B, 5.269%, [LIBOR12+300], 5/9/251 | 287,848 | 280,496 | ||||||
| AmWINS Group, Inc., Sr. Sec. Credit Facilities 1st Lien Term Loan,4.862%-4.979%, [LIBOR12+275], 1/25/241 | 176,600 | 176,695 | ||||||
| Amynta Agency Borrower, Inc., Sec. Credit Facilities 1st Lien Term Loan, 6.612%, [LIBOR12+450], 2/28/251,2 | 49,479 | 47,376 | ||||||
| Aretec Group, Inc., Sr. Sec. Credit Facilities 1st Lien Term Loan, 6.362%, [LIBOR4+425], 10/1/251 | 591,875 | 578,188 | ||||||
22 INVESCO OPPENHEIMER SENIOR FLOATING RATE PLUS FUND
| Principal Amount | Value | |||||||
| Commercial Banks (Continued) | ||||||||
| DTZ US Borrower LLC, Sr. Sec. Credit Facilities 1st Lien Term Loan, Tranche B, 5.362%, [LIBOR12+325], 8/21/251 | $ | 302,713 | $ | 303,138 | ||||
| Focus Financial Partners LLC, Sr. Sec. Credit Facilities 1st Lien Term Loan, 4.612%, [LIBOR12+250], 7/3/241 | 91,888 | 92,257 | ||||||
| GGP Nimbus LP, Sr. Sec. Credit Facilities 1st Lien Term Loan, Tranche B, 4.612%, [LIBOR12+250], 8/27/251 | 317,600 | 310,057 | ||||||
| HUB International Ltd., Sr. Sec. Credit Facilities 1st Lien Term Loan, Tranche B, 5.267%, [LIBOR4+300], 4/25/251 | 445,173 | 437,077 | ||||||
| Hyperion Insurance Group Ltd., Sr. Sec. Credit Facilities 1st Lien Term Loan, Tranche B, 5.75%, [LIBOR12+350], 12/20/241 | 87,534 | 87,573 | ||||||
| iStar, Inc., Sr. Sec. Credit Facilities 1st Lien Term Loan, Tranche B,4.919%-4.979%, [LIBOR12+275], 6/28/231 | 154,041 | 154,426 | ||||||
| NFP Corp., Sr. Sec. Credit Facilities 1st Lien Term Loan, Tranche B, 5.112%, [LIBOR12+300], 1/8/241 | 222,396 | 218,261 | ||||||
| Uniti Group, Inc., Sr. Sec. Credit Facilities 1st Lien Term Loan, 7.112%, [LIBOR12+500], 10/24/221 | 150,201 | 145,582 | ||||||
| USI, Inc., Sr. Sec. Credit Facilities 1st Lien Term Loan, Tranche B, 5.33%, [LIBOR4+300], 5/16/241 | 362,696 | 354,688 | ||||||
|
| 3,538,556
|
| ||||||
| Consumer Finance—0.9% | ||||||||
| PGX Holdings, Inc., Sr. Sec. Credit Facilities 1st Lien Term Loan, 7.37%, [LIBOR12+525], 9/29/201 | 630,672 | 586,525 | ||||||
| PGX Holdings, Inc., Sr. Sec. Credit Facilities 2nd Lien Term Loan, 11.24%, [LIBOR12+900], 9/29/211,2 | 31,112 | 28,001 | ||||||
|
| 614,526
|
| ||||||
| Insurance—0.2% | ||||||||
| AssuredPartners, Inc., Sr. Sec. Credit Facilities 1st Lien Term Loan, Tranche B, 5.612%, [LIBOR12+325], 10/22/241 | 175,921 | 175,356 | ||||||
| Health Care—8.0% | ||||||||
| Health Care Equipment & Supplies—8.0% | ||||||||
| 21st Century Oncology, Inc., Sr. Sec. Credit Facilities 1st Lien Exit Term Loan, Tranche B, 8.455%, [LIBOR4+612.5], 1/16/231 | 41,764 | 37,823 | ||||||
Acadia Healthcare Co., Inc., Sr. Sec. Credit Facilities 1st Lien Term Loan: Tranche B, 4.612%, [LIBOR12+250], 2/11/221 | 14,848 | 14,880 | ||||||
| Tranche B4, 4.612%, [LIBOR12+250], 2/16/231 | 115,512 | 115,758 | ||||||
| Alliance HealthCare Services, Inc., Sr. Sec. Credit Facilities 1st Lien Term Loan, 6.612%, [LIBOR4+450], 10/24/231 | 125,551 | 118,018 | ||||||
| Amneal Pharmaceuticals LLC, Sr. Sec. Credit Facilities 1st Lien Term Loan, Tranche B, 5.625%, [LIBOR12+350], 5/4/251 | 121,852 | 111,190 | ||||||
| Ardent Health Partners LLC, Sr. Sec. Credit Facilities 1st Lien Term Loan, Tranche B, 6.612%, [LIBOR12+450], 6/30/251 | 232,650 | 233,307 | ||||||
| Bausch Health Cos., Inc., Sr. Sec. Credit Facilities 1st Lien Term Loan, Tranche B, 5.201%, [LIBOR4+300], 6/2/251 | 192,597 | 193,176 | ||||||
| Carestream Dental Equipment, Inc., Sr. Sec. Credit Facilities 1st Lien Term Loan, 5.362%, [LIBOR4+325], 9/1/241 | 39,300 | 38,547 | ||||||
| Change Healthcare Holdings LLC, Sr. Sec. Credit Facilities 1st Lien Term Loan, Tranche B, 4.612%, [LIBOR12+275], 3/1/241 | 517,354 | 512,503 | ||||||
23 INVESCO OPPENHEIMER SENIOR FLOATING RATE PLUS FUND
SCHEDULE OF INVESTMENTSContinued
| Principal Amount | Value | |||||||
| Health Care Equipment & Supplies (Continued) | ||||||||
| Concentra, Inc., Sr. Sec. Credit Facilities 1st Lien Term Loan, Tranche B, 5.21%, [LIBOR12+275], 6/1/221 | $ | 92,225 | $ | 92,494 | ||||
| Endo International plc, Sr. Sec. Credit Facilities 1st Lien Term Loan, Tranche B, 6.375%, [LIBOR12+425], 4/29/241 | 248,920 | 228,021 | ||||||
| Enterprise Merger Sub, Inc., Sr. Sec. Credit Facilities 1st Lien Term Loan, 5.862%, [LIBOR4+375], 10/10/251 | 676,600 | 526,574 | ||||||
| Gentiva Health Services, Inc., Sr. Sec. Credit Facilities 1st Lien Term Loan, 5.875%, [LIBOR4+375], 7/2/251 | 441,687 | 442,517 | ||||||
| GoodRX, Inc., Sr. Sec. Credit Facilities 1st Lien Term Loan, 4.932%, [LIBOR4+300], 10/10/251 | 172,198 | 171,208 | ||||||
| Jaguar Holding Co. II, Sr. Sec. Credit Facilities 1st Lien Term Loan,4.612%-4.902%, [LIBOR4+250], 8/18/221 | 199,358 | 198,528 | ||||||
| Kinetic Concepts, Inc., Sr. Sec. Credit Facilities 1st Lien Term Loan, Tranche B, 5.58%, [LIBOR4+325], 2/2/241 | 88,200 | 88,421 | ||||||
| LifeScan Global Corp., Sr. Sec. Credit Facilities 1st Lien Term Loan, 8.66%, [LIBOR4+600], 10/1/241 | 217,125 | 205,075 | ||||||
| Mallinckrodt International Finance SA, Sr. Sec. Credit Facilities 1st Lien Term Loan, Tranche B, 5.08%, [LIBOR4+275], 9/24/241 | 99,260 | 77,795 | ||||||
| MPH Acquisition Holdings LLC, Sr. Sec. Credit Facilities 1st Lien Term Loan, Tranche B, 5.08%, [LIBOR4+300], 6/7/231 | 359,374 | �� | 335,116 | |||||
| One Call Corp., Sr. Sec. Credit Facilities 1st Lien Term Loan, Tranche B, 7.408%, [LIBOR12+525], 11/27/221 | 136,445 | 115,100 | ||||||
| Ortho-Clinical Diagnostics SA, Sr. Sec. Credit Facilities 1st Lien Term Loan, Tranche B, 5.563%, [LIBOR4+325], 6/30/251 | 362,231 | 342,649 | ||||||
| PAREXEL International Corp., Sr. Sec. Credit Facilities 1st Lien Term Loan, Tranche B, 4.862%, [LIBOR4+300], 9/27/241 | 93,551 | 88,397 | ||||||
| Select Medical Corp., Sr. Sec. Credit Facilities 1st Lien Term Loan, Tranche B, 4.85%, [LIBOR12+250], 3/6/251 | 313,090 | 312,307 | ||||||
| Sotera Health Holdings LLC, Sr. Sec. Credit Facilities 1st Lien Term Loan, Tranche B, 5.112%, [LIBOR12+300], 5/15/221 | 14,736 | 14,492 | ||||||
| Surgery Center Holdings, Inc., Sr. Sec. Credit Facilities 1st Lien Term Loan, 5.37%, [LIBOR4+325], 9/2/241 | 286,053 | 273,359 | ||||||
| Team Health Holdings, Inc., Sr. Sec. Credit Facilities 1st Lien Term Loan, Tranche B, 4.862%, [LIBOR12+275], 2/6/241 | 363,555 | 294,025 | ||||||
| US Anesthesia Partners, Inc., Sr. Sec. Credit Facilities 1st Lien Term Loan, 5.112%, [LIBOR12+300], 6/23/241 | 355,441 | 342,023 | ||||||
| VVC Holding Corp., Sr. Sec. Credit Facilities 1st Lien Term Loan, Tranche B, 6.681%, [LIBOR4+450], 2/11/261 | 219,450 | 218,833 | ||||||
| Wink Holdco, Inc., Sr. Sec. Credit Facilities 1st Lien Term Loan, 5.112%, [LIBOR4+300], 12/2/241 | 86,464 | 84,411 | ||||||
|
| 5,826,547
|
| ||||||
| Industrials—18.5% | ||||||||
| Aerospace & Defense—0.3% | ||||||||
| Genuine Financial Holdings LLC, Sr. Sec. Credit Facilities 1st Lien Term Loan, 5.862%, [LIBOR4+375], 7/11/251 | 213,388 | 208,408 | ||||||
24 INVESCO OPPENHEIMER SENIOR FLOATING RATE PLUS FUND
| Principal Amount | Value | |||||||
| Commercial Services & Supplies—10.4% | ||||||||
| AI Aqua Merger Sub, Inc., Sr. Sec. Credit Facilities 1st Lien Term Loan, Tranche B1, 5.652%, [LIBOR12+325], 12/13/231 | $ | 695,700 | $ | 665,374 | ||||
Asurion LLC, Sr. Sec. Credit Facilities 1st Lien Term Loan: Tranche B4, 5.112%, [LIBOR12+300], 8/4/221 | 296,958 | 297,461 | ||||||
| Tranche B6, 5.112%, [LIBOR12+300], 11/3/231 | 445,668 | 446,423 | ||||||
| Tranche B7, 5.112%, [LIBOR12+300], 11/3/241 | 64,350 | 64,457 | ||||||
| Asurion LLC, Sr. Sec. Credit Facilities 2nd Lien Term Loan, 8.612%, [LIBOR12+650], 8/4/251 | 11,174 | 11,357 | ||||||
| ATS Consolidated, Inc., Sr. Sec. Credit Facilities 1st Lien Term Loan, Tranche B, 5.862%, [LIBOR12+375], 2/28/251 | 222,312 | 223,423 | ||||||
| Belron Finance US LLC, Sr. Sec. Credit Facilities 1st Lien Term Loan, Tranche B, 4.709%, [LIBOR4+250], 11/7/241 | 147,750 | 148,212 | ||||||
| Blackhawk Network Holdings, Inc., Sr. Sec. Credit Facilities 1st Lien Term Loan, 5.112%, [LIBOR4+300], 6/15/251 | 646,492 | 642,656 | ||||||
| Boing US Holdco, Inc., Sr. Sec. Credit Facilities 1st Lien Term Loan, 5.463%, [LIBOR4+325], 10/3/241 | 238,497 | 233,578 | ||||||
| Casmar Australia Pty Ltd., Sr. Sec. Credit Facilities 1st Lien Term Loan, Tranche B, 6.616%, [LIBOR4+450], 12/8/231 | 383,632 | 354,860 | ||||||
| Ceridian HCM Holding, Inc., Sr. Sec. Credit Facilities 1st Lien Term Loan, Tranche B, 5.112%, [LIBOR12+325], 4/30/251 | 173,688 | 174,013 | ||||||
| CM Acquisition Co., Sr. Sec. Credit Facilities 2nd Lien Term Loan, 12.262%, [LIBOR4+1,000], 7/26/231 | 54,286 | 54,829 | ||||||
| First Advantage, Sr. Sec. Credit Facilities 1st Lien Term Loan, Tranche B, 7.362%, [LIBOR4+525], 6/30/221 | 88,072 | 88,256 | ||||||
| First American Payment Systems LP, Sr. Sec. Credit Facilities 1st Lien Term Loan, 7.352%, [LIBOR12+475], 1/5/241 | 77,583 | 77,244 | ||||||
| Garda World Security Corp., Sr. Sec. Credit Facilities 1st Lien Term Loan, Tranche B, 6.02%, [LIBOR4+350], 5/24/241 | 576,038 | 577,092 | ||||||
| Global Tel*Link Corp., Sr. Sec. Credit Facilities 1st Lien Term Loan, 6.362%, [LIBOR4+425], 11/29/251 | 213,109 | 204,211 | ||||||
| IG Investments Holdings LLC, Sr. Sec. Credit Facilities 1st Lien Term Loan,6.112%-6.33%, [LIBOR12+400], 5/23/251 | 299,546 | 297,612 | ||||||
| Inmar, Inc., Sr. Sec. Credit Facilities 1st Lien Term Loan, 6.33%, [LIBOR6+400], 5/1/241 | 448,693 | 425,792 | ||||||
| IQOR US, Inc., Sr. Sec. Credit Facilities 1st Lien Term Loan, 7.819%, [LIBOR4+550], 4/1/211 | 115,000 | 106,088 | ||||||
| Monitronics International, Inc., Sr. Sec. Credit Facilities 1st Lien Term Loan, Tranche B2, 10.00%, [PRIME4+450], 9/30/221 | 164,000 | 154,826 | ||||||
| North American Lifting Holdings, Inc., Sr. Sec. Credit Facilities 1st Lien Term Loan, 6.83%, [LIBOR4+450], 11/27/201 | 184,618 | 172,214 | ||||||
| Securus Technologies Holdings LLC, Sr. Sec. Credit Facilities 1st Lien Term Loan, 6.83%, [LIBOR12+450], 11/1/241 | 323,877 | 291,004 | ||||||
| Staples, Inc., Sr. Sec. Credit Facilities 1st Lien Term Loan, Tranche B, 7.197%, [LIBOR12+500], 4/16/261 | 892,763 | 859,681 | ||||||
| Travelport Finance Luxembourg Sarl, Sr. Sec. Credit Facilities 1st Lien Term Loan, 7.541%, [LIBOR4+500], 3/18/261 | 840,000 | 775,740 | ||||||
| TruGreen LP, Sr. Sec. Credit Facilities 1st Lien Term Loan, Tranche B, 5.984%, [LIBOR12+375], 3/19/261 | 39,900 | 40,150 | ||||||
| US Ecology, Inc., Sr. Sec. Credit Facilities 1st Lien Term Loan, Tranche B, 4.787%, 8/14/261 | 65,000 | 65,345 | ||||||
25 INVESCO OPPENHEIMER SENIOR FLOATING RATE PLUS FUND
SCHEDULE OF INVESTMENTSContinued
| Principal Amount | Value | |||||||
| Commercial Services & Supplies (Continued) | ||||||||
| Ventia Deco LLC, Sr. Sec. Credit Facilities 1st Lien Term Loan, 5.842%, [LIBOR4+350], 6/25/261,2 | $ | 58,015 | $ | 58,088 | ||||
|
| 7,509,986
|
| ||||||
| Industrial Conglomerates—3.4% | ||||||||
| Energy Acquisition Co., Inc., Sr. Sec. Credit Facilities 1st Lien Term Loan, 6.58%, [LIBOR4+425], 6/22/251,2 | 58,826 | 53,826 | ||||||
| Gates Global LLC, Sr. Sec. Credit Facilities 1st Lien Term Loan, Tranche B, 4.862%, [LIBOR4+300], 4/1/241 | 229,954 | 224,740 | ||||||
| GrafTech Finance, Inc., Sr. Sec. Credit Facilities 1st Lien Term Loan, Tranche B, 5.612%, [LIBOR12+350], 2/12/251 | 222,111 | 216,650 | ||||||
| Space Exploration Technologies Corp., Sr. Sec. Credit Facilities 1st Lien Term Loan, 6.362%, [LIBOR12+425], 11/21/251,2 | 303,475 | 304,234 | ||||||
| Titan Acquisition Ltd., Sr. Sec. Credit Facilities 1st Lien Term Loan, 5.112%, [LIBOR12+300], 3/28/251 | 177,213 | 170,420 | ||||||
TransDigm, Inc., Sr. Sec. Credit Facilities 1st Lien Term Loan: Tranche E, 4.83%, [LIBOR12+250], 5/30/251 | 335,750 | 332,928 | ||||||
| Tranche F, 4.83%, [LIBOR12+250], 6/9/231 | 279,877 | 278,377 | ||||||
| Tranche G, 4.83%, [LIBOR4+250], 8/22/241 | 93,575 | 92,832 | ||||||
| Vertiv Intermediate Holding II Corp., Sr. Sec. Credit Facilities 1st Lien Term Loan, Tranche B, 6.33%, [LIBOR12+400], 11/30/231 | 584,192 | 551,089 | ||||||
| WP CPP Holdings LLC, Sr. Sec. Credit Facilities 1st Lien Term Loan, 6.01%, [LIBOR4+375], 4/30/251 | 258,838 | 259,001 | ||||||
|
| 2,484,097
|
| ||||||
| Professional Services—0.3% | ||||||||
| AVSC Holding Corp., Sr. Sec. Credit Facilities 1st Lien Term Loan, Tranche B,5.384%-5.58%, [LIBOR4+375], 3/3/251 | 206,336 | 200,662 | ||||||
|
| 200,662
|
| ||||||
| Road & Rail—2.8% | ||||||||
| American Airlines, Inc., Sr. Sec. Credit Facilities 1st Lien Term Loan, Tranche B, 4.061%, [LIBOR12+175], 6/27/251 | 108,900 | 106,994 | ||||||
| Arctic LNG Carriers Ltd., Sr. Sec. Credit Facilities 1st Lien Term Loan, Tranche B, 6.83%, [LIBOR12+450], 5/18/231 | 654,311 | 644,225 | ||||||
| Daseke Cos., Inc., Sr. Sec. Credit Facilities 1st Lien Term Loan, 7.112%, [LIBOR12+500], 2/27/241,2 | 570,267 | 556,010 | ||||||
Kenan Advantage Group, Inc. (The), Sr. Sec. Credit Facilities 1st Lien Term Loan: Tranche B1, 5.112%, [LIBOR12+300], 7/29/221 | 90,558 | 87,615 | ||||||
| Tranche B2, 5.112%, [LIBOR12+300], 7/29/221 | 8,228 | 7,960 | ||||||
| Kestrel Bidco, Inc., Sr. Sec. Credit Facilities 1st Lien Term Loan, 5.266%, 8/7/261 | 165,000 | 165,645 | ||||||
| Western Express, Inc., Sr. Sec. Credit Facilities 2nd Lien Term Loan, 10.374%, [LIBOR4+825], 2/23/221,2 | 408,628 | 435,230 | ||||||
|
| 2,003,679
|
| ||||||
| Transportation Infrastructure—1.3% | ||||||||
| Mavis Tire Express Services Corp., Sr. Sec. Credit Facilities 1st Lien Term Loan, 5.362%, [LIBOR4+325], 3/20/251 | 140,737 | 138,363 | ||||||
26 INVESCO OPPENHEIMER SENIOR FLOATING RATE PLUS FUND
| Principal Amount | Value | |||||||
| Transportation Infrastructure (Continued) | ||||||||
| Mavis Tire Express Services Corp., Sr. Sec. Credit Facilities 1st Lien Term Loan, Delayed Draw, 2.00%, 3/20/251,4 | $ | 14,882 | $ | 14,631 | ||||
| Navistar, Inc., Sr. Sec. Credit Facilities 1st Lien Term Loan, Tranche B, 5.70%, [LIBOR12+350], 11/6/241 | 271,271 | 270,933 | ||||||
| Octavius Corp., Sr. Sec. Credit Facilities 1st Lien Term Loan, Tranche B, 5.953%, [LIBOR4+350], 11/8/231 | 35,000 | 34,606 | ||||||
| Panther BF Aggregator 2 LP, Sr. Sec. Credit Facilities 1st Lien Term Loan, Tranche B, 5.612%, [LIBOR12+350], 4/30/261 | 35,000 | 34,563 | ||||||
| Superior Industries International, Inc., Sr. Sec. Credit Facilities 1st Lien Term Loan, Tranche B, 6.112%, [LIBOR12+400], 5/22/241 | 175,497 | 168,916 | ||||||
| Tenneco, Inc., Sr. Sec. Credit Facilities 1st Lien Term Loan, Tranche B, 5.112%, [LIBOR4+275], 10/1/251 | 328,350 | 306,823 | ||||||
|
| 968,835
|
| ||||||
| Information Technology—11.1% | ||||||||
| Internet Software & Services—10.4% | ||||||||
| Almonde, Inc., Sr. Sec. Credit Facilities 1st Lien Term Loan, Tranche B, 5.734%, [LIBOR4+350], 6/13/241 | 269,898 | 260,976 | ||||||
| American Teleconferencing Services Ltd., Sr. Sec. Credit Facilities 1st Lien Term Loan, 8.723%, [LIBOR6+650], 12/8/211 | 61,402 | 38,253 | ||||||
| Avaya, Inc., Sr. Sec. Credit Facilities 1st Lien Exit Term Loan, Tranche B,6.43%-6.445%, [LIBOR6+425], 12/15/241 | 1,445,863 | 1,423,271 | ||||||
| Banff Merger Sub, Inc., Sr. Sec. Credit Facilities 1st Lien Term Loan, Tranche B, 6.58%, [LIBOR4+425], 10/2/251 | 432,825 | 409,922 | ||||||
| Blackboard, Inc., Sr. Sec. Credit Facilities 1st Lien Term Loan, Tranche B4, 7.30%, [LIBOR4+500], 6/30/211 | 62,898 | 62,820 | ||||||
| Colorado Buyer, Inc., Sr. Sec. Credit Facilities 1st Lien Term Loan, 5.21%, [LIBOR4+300], 5/1/241 | 271,714 | 255,411 | ||||||
| Infor US, Inc., Sr. Sec. Credit Facilities 1st Lien Term Loan, Tranche B, 5.08%, [LIBOR4+275], 2/1/221 | 558,988 | 559,337 | ||||||
| Informatica LLC, Sr. Sec. Credit Facilities 1st Lien Term Loan, Tranche B, 5.362%, [LIBOR4+325], 8/5/221 | 180,380 | 180,775 | ||||||
| Internap Corp., Sr. Sec. Credit Facilities 1st Lien Term Loan, 0.75% PIK Rate, 8.57% Cash Rate, [LIBOR12+575], 4/6/221,3 | 108,229 | 78,737 | ||||||
| Lighthouse Network LLC, Sr. Sec. Credit Facilities 1st Lien Term Loan, 6.756%, [LIBOR4+450], 11/29/241 | 88,650 | 88,761 | ||||||
MA FinanceCo LLC, Sr. Sec. Credit Facilities 1st Lien Term Loan: Tranche B, 4.612%, [LIBOR12+275], 6/21/241 | 79,335 | 77,352 | ||||||
| Tranche B2, 4.484%, [LIBOR4+250], 11/19/211 | 46,603 | 46,370 | ||||||
| McAfee LLC, Sr. Sec. Credit Facilities 1st Lien Term Loan, Tranche B, 6.152%, [LIBOR12+375], 9/30/241 | 301,247 | 301,869 | ||||||
| Mitchell International, Inc., Sr. Sec. Credit Facilities 1st Lien Term Loan, Tranche B, 5.362%, [LIBOR12+325], 11/29/241 | 123,492 | 116,020 | ||||||
| Plantronics, Inc., Sr. Sec. Credit Facilities 1st Lien Term Loan, 4.612%, [LIBOR12+250], 7/2/251 | 330,865 | 330,038 | ||||||
| Quest Software US Holdings, Inc., Sr. Sec. Credit Facilities 1st Lien Term Loan, 6.506%, [LIBOR4+425], 5/16/251 | 248,125 | 242,310 | ||||||
27 INVESCO OPPENHEIMER SENIOR FLOATING RATE PLUS FUND
SCHEDULE OF INVESTMENTSContinued
| Principal Amount | Value | |||||||
| Internet Software & Services (Continued) | ||||||||
| Riverbed Technology, Inc., Sr. Sec. Credit Facilities 1st Lien Term Loan, Tranche B, 5.49%, [LIBOR12+325], 4/24/221 | $ | 348,485 | $ | 293,091 | ||||
| Seattle SpinCo, Inc., Sr. Sec. Credit Facilities 1st Lien Term Loan, Tranche B, 4.612%, [LIBOR12+275], 6/21/241 | 528,324 | 515,116 | ||||||
| Shutterfly, Inc., Sr. Sec. Credit Facilities 1st Lien Term Loan, Tranche B2, 4.87%, [LIBOR12+275], 8/17/241 | 101,101 | 101,161 | ||||||
| SolarWinds Holdings, Inc., Sr. Sec. Credit Facilities 1st Lien Term Loan, 4.862%, [LIBOR12+300], 2/5/241 | 147,771 | 147,840 | ||||||
| Solera LLC, Sr. Sec. Credit Facilities 1st Lien Term Loan, Tranche B, 4.862%, [LIBOR12+275], 3/3/231 | 226,360 | 225,513 | ||||||
| SS&C Technologies Holdings Europe Sarl, Sr. Sec. Credit Facilities 1st Lien Term Loan, Tranche B4, 4.362%, [LIBOR4+250], 4/16/251 | 155,341 | 155,720 | ||||||
| SS&C Technologies, Inc., Sr. Sec. Credit Facilities 1st Lien Term Loan, Tranche B1, 4.362%, [LIBOR4+250], 4/16/251 | 229,430 | 229,990 | ||||||
| Sungard AS New Holdings III LLC, Sr. Sec. Credit Facilities 1st Lien Term Loan, 2.50% PIK Rate, 6.388% Cash Rate, 11/3/221,3 | 15,288 | 12,638 | ||||||
| Tempo Acquisition LLC, Sr. Sec. Credit Facilities 1st Lien Term Loan, Tranche B, 5.112%, [LIBOR12+300], 5/1/241 | 567,607 | 568,436 | ||||||
| TIBCO Software, Inc., Sec. Credit Facilities 1st Lien Term Loan, 6.25%, [LIBOR12+400], 6/30/261 | 50,000 | 50,063 | ||||||
| TTM Technologies, Inc., Sr. Sec. Credit Facilities 1st Lien Term Loan, 4.73%, [LIBOR4+250], 9/28/241 | 182,047 | 181,971 | ||||||
| Veritas US, Inc., Sr. Sec. Credit Facilities 1st Lien Term Loan, Tranche B1,6.612%-6.83%, [LIBOR12+450], 1/27/231 | 412,865 | 393,447 | ||||||
| Xperi Corp., Sr. Sec. Credit Facilities 1st Lien Term Loan, Tranche B, 4.612%, [LIBOR12+250], 12/1/231 | 224,131 | 221,889 | ||||||
|
| 7,569,097
|
| ||||||
| IT Services—0.7% | ||||||||
| Pi US Mergerco, Inc., Sr. Sec. Credit Facilities 1st Lien Term Loan: | ||||||||
| Tranche B, 5.362%, [LIBOR12+350], 1/3/251 | 159,785 | 158,420 | ||||||
| Tranche B1, 5.362%, [LIBOR12+350], 1/3/251 | 324,363 | 321,593 | ||||||
|
| 480,013
|
| ||||||
| Materials—9.6% | ||||||||
| Chemicals—3.4% | ||||||||
| Alpha 3 BV, Sr. Sec. Credit Facilities 1st Lien Term Loan, Tranche B1, 5.33%, [LIBOR4+300], 1/31/241 | 457,075 | 445,150 | ||||||
| Consolidated Energy Finance SA, Sr. Sec. Credit Facilities 1st Lien Term Loan, Tranche B, 4.825%, [LIBOR12+250], 5/7/251,2 | 323,246 | 311,125 | ||||||
| Cyanco Intermediate Corp., Sr. Sec. Credit Facilities 1st Lien Term Loan, 5.612%, [LIBOR4+350], 3/16/251 | 135,378 | 135,180 | ||||||
| Hexicon, Inc., Sec. Credit Facilities 1st Lien Exit Term Loan, Tranche B, 5.82%, [LIBOR4+350], 7/1/261,2 | 65,000 | 65,000 | ||||||
| Momentive Performance Materials USA LLC, Sr. Sec. Credit Facilities 1st Lien Term Loan, Tranche B, 5.59%, [LIBOR4+325], 5/15/241 | 140,000 | 137,725 | ||||||
28 INVESCO OPPENHEIMER SENIOR FLOATING RATE PLUS FUND
| Principal Amount | Value | |||||||
| Chemicals (Continued) | ||||||||
| New Arclin US Holding Corp., Sr. Sec. Credit Facilities 1st Lien Term Loan, 5.612%, [LIBOR4+350], 2/14/241,2 | $ | 250,860 | $ | 248,978 | ||||
| OCI Partners LP, Sr. Sec. Credit Facilities 1st Lien Term Loan, Tranche B, 6.33%, [LIBOR4+425], 3/13/251,2 | 133,399 | 133,233 | ||||||
| Polar US Borrower LLC, Sr. Sec. Credit Facilities 1st Lien Term Loan,7.063%-7.351%, [LIBOR4+475], 10/15/251,2 | 64,463 | 61,965 | ||||||
| Starfruit US Holdco LLC, Sr. Sec. Credit Facilities 1st Lien Term Loan, Tranche B, 5.463%, [LIBOR12+325], 10/1/251 | 558,600 | 541,258 | ||||||
| Tronox Finance LLC, Sr. Sec. Credit Facilities 1st Lien Term Loan, Tranche B, 4.862%, [LIBOR4+300], 9/23/241 | 375,614 | 373,384 | ||||||
|
| 2,452,998
|
| ||||||
| Construction Materials—1.2% | ||||||||
| Pisces Midco, Inc., Sr. Sec. Credit Facilities 1st Lien Term Loan, Tranche B, 5.951%, [LIBOR4+375], 4/12/251 | 212,850 | 207,263 | ||||||
| Quikrete Holdings, Inc., Sr. Sec. Credit Facilities 1st Lien Term Loan, 4.862%, [LIBOR12+275], 11/15/231 | 598,342 | 593,169 | ||||||
| VC GB Holdings, Inc., Sr. Sec. Credit Facilities 1st Lien Term Loan, 5.112%, [LIBOR12+325], 2/28/241,2 | 92,552 | 91,511 | ||||||
|
| 891,943
|
| ||||||
| Containers & Packaging—2.7% | ||||||||
| Ball Metalpack Finco LLC, Sr. Sec. Credit Facilities 1st Lien Term Loan, Tranche B, 6.624%, [LIBOR12+450], 7/31/251 | 59,400 | 57,841 | ||||||
| Berry Global Inc., Sr. Sec. Credit Facilities 1st Lien Term Loan, 4.701%, [LIBOR12+250], 7/1/261 | 170,000 | 170,179 | ||||||
| BWAY Corp., Sr. Sec. Credit Facilities 1st Lien Term Loan, 5.59%, [LIBOR12+325], 4/3/241 | 617,085 | 601,337 | ||||||
| Clearwater Paper Corp., Sr. Sec. Credit Facilities 1st Lien Term Loan, Tranche B, 5.438%, [LIBOR4+325], 7/26/261,2 | 75,000 | 75,281 | ||||||
| Flex Acquisition Co., Inc., Sr. Sec. Credit Facilities 1st Lien Term Loan, 5.569%, [LIBOR4+325], 6/29/251 | 411,579 | 393,460 | ||||||
| Plastipak Holdings, Inc., Sr. Sec. Credit Facilities 1st Lien Term Loan, Tranche B, 4.62%, [LIBOR12+250], 10/14/241 | 217,369 | 216,988 | ||||||
| Pro Mach Group, Inc., Sr. Sec. Credit Facilities 1st Lien Term Loan, Tranche B, 4.932%, [LIBOR4+300], 3/7/251 | 77,917 | 75,158 | ||||||
| Reynolds Group Holdings, Inc., Sr. Sec. Credit Facilities 1st Lien Term Loan, 4.862%, [LIBOR12+300], 2/5/231 | 351,479 | 351,699 | ||||||
|
| 1,941,943
|
| ||||||
| Metals & Mining—2.2% | ||||||||
| Covia Holdings Corp., Sr. Sec. Credit Facilities 1st Lien Term Loan, 6.313%, [LIBOR4+375], 6/1/251 | 77,752 | 64,480 | ||||||
Murray Energy Corp., Sr. Sec. Credit Facilities 1st Lien Term Loan: Tranche B2, 9.362%, [LIBOR4+725], 10/17/221 | 2,378,670 | 1,179,143 | ||||||
| Tranche B3, 9.862%, [LIBOR12+775], 10/17/221 | 483,999 | 239,580 | ||||||
| Peabody Energy Corp., Sr. Sec. Credit Facilities 1st Lien Term Loan, Tranche B, 4.862%, [LIBOR12+275], 3/31/251 | 107,283 | 106,009 | ||||||
| 1,589,212 | ||||||||
29 INVESCO OPPENHEIMER SENIOR FLOATING RATE PLUS FUND
SCHEDULE OF INVESTMENTSContinued
| Principal Amount | Value | |||||||
| Paper & Forest Products—0.1% | ||||||||
| Thor Industries, Inc., Sr. Sec. Credit Facilities 1st Lien Term Loan, Tranche B, 6.00%, [LIBOR4+375], 2/1/261 | $ | 93,431 | $ | 91,056 | ||||
| Telecommunication Services—5.7% | ||||||||
| Diversified Telecommunication Services—5.7% | ||||||||
| CenturyLink, Inc., Sr. Sec. Credit Facilities 1st Lien Term Loan, Tranche B, 4.862%, [LIBOR4+275], 1/31/251 | 1,201,618 | 1,186,411 | ||||||
| Cincinnati Bell, Inc., Sr. Sec. Credit Facilities 1st Lien Term Loan, Tranche B, 5.484%, [LIBOR12+325], 10/2/241 | 208,425 | 208,015 | ||||||
| Consolidated Communications, Inc., Sr. Sec. Credit Facilities 1st Lien Term Loan, Tranche B, 5.12%, [LIBOR12+300], 10/5/231 | 368,536 | 353,896 | ||||||
| Digicel International Finance Ltd, Sr. Sec. Credit Facilities 1st Lien Term Loan, Tranche B, 5.34%, [LIBOR4+325], 5/27/241 | 355,077 | 303,946 | ||||||
| Frontier Communications Corp., Sr. Sec. Credit Facilities 1st Lien Term Loan, Tranche B, 5.87%, [LIBOR12+375], 6/15/241 | 243,478 | 241,212 | ||||||
| Fusion Connect, Inc., Sr. Sec. Credit Debtor in Possession Facilities 1st Lien Term Loan,12.20%-12.22%, [LIBOR12+1,000], 10/7/191,2 | 45,487 | 45,033 | ||||||
| Fusion Connect, Inc., Sr. Sec. Credit Facilities 1st Lien Term Loan, 11.597% PIK Rate, [LIBOR4+750], 5/4/231,3,5 | 377,638 | 237,912 | ||||||
| IPC Corp., Sr. Sec. Credit Facilities 1st Lien Term Loan, Tranche B, 7.09%, [LIBOR4+450], 8/6/211 | 222,747 | 185,994 | ||||||
| IPC Corp., Sr. Sec. Credit Facilities 2nd Lien Term Loan, 12.09% PIK Rate, [LIBOR4+950], 2/4/221,3 | 123,708 | 39,792 | ||||||
| NeuStar, Inc., Sr. Sec. Credit Facilities 1st Lien Term Loan, Tranche B4, 5.612%, [LIBOR12+350], 8/8/241 | 203,010 | 197,427 | ||||||
| Sprint Communications, Inc., Sr. Sec. Credit Facilities 1st Lien Term Loan, Tranche B, 4.625%, [LIBOR12+250], 2/2/241 | 886,291 | 881,860 | ||||||
| Windstream Services LLC, Sr. Sec. Credit Facilities Term Loan, Tranche B6, 10.25%, [PRIME4+500], 3/29/211,5 | 209,201 | 213,313 | ||||||
|
| 4,094,811
|
| ||||||
| Utilities—2.3% | ||||||||
| Electric Utilities—2.3% | ||||||||
| Brookfield WEC Holdings, Inc., Sr. Sec. Credit Facilities 1st Lien Term Loan, 5.612%, [LIBOR4+375], 8/1/251 | 134,150 | 134,486 | ||||||
| Calpine Construction Finance Co. LP, Sr. Sec. Credit Facilities 1st Lien Term Loan, 4.612%, [LIBOR12+250], 1/15/251 | 83,935 | 83,830 | ||||||
Calpine Corp., Sr. Sec. Credit Facilities 1st Lien Term Loan: Tranche B10, 4.612%, [LIBOR12+250], 8/12/261 | 35,212 | 35,168 | ||||||
| Tranche B5, 4.83%, [LIBOR4+250], 1/15/241 | 174,559 | 174,629 | ||||||
| Compass Power Generation LLC, Sr. Sec. Credit Facilities 1st Lien Term Loan, Tranche B, 5.902%, [LIBOR12+350], 12/20/241 | 47,475 | 47,659 | ||||||
| EFS Cogen Holdings I LLC, Sr. Sec. Credit Facilities 1st Lien Term Loan, Tranche B,5.49%-5.58%, [LIBOR12+325], 6/28/231 | 187,901 | 187,525 | ||||||
| Exgen Renewables IV LLC, Sr. Sec. Credit Facilities 1st Lien Term Loan, Tranche B, 5.53%, [LIBOR4+300], 11/28/241 | 28,100 | 27,193 | ||||||
30 INVESCO OPPENHEIMER SENIOR FLOATING RATE PLUS FUND
| Principal Amount | Value | |||||||
| Electric Utilities (Continued) | ||||||||
| Frontera Generation Holdings LLC, Sr. Sec. Credit Facilities 1st Lien Term Loan, Tranche B, 6.451%, [LIBOR12+425], 5/2/251 | $ | 272,386 | $ | 260,129 | ||||
| Kestrel Acquisition LLC., Sr. Sec. Credit Facilities 1st Lien Term Loan, Tranche B, 6.66%, [LIBOR12+425], 6/2/251 | 123,750 | 118,955 | ||||||
Lightstone Holdco LLC, Sr. Sec. Credit Facilities 1st Lien Term Loan: Tranche B, 5.862%, [LIBOR12+375], 1/30/241 | 245,101 | 236,768 | ||||||
| Tranche C, 5.862%, [LIBOR12+375], 1/30/241 | 17,295 | 16,707 | ||||||
| MRP Generation Holdings LLC, Sr. Sec. Credit Facilities 1st Lien Term Loan, Tranche B, 9.33%, [LIBOR4+700], 10/18/221,2 | 38,900 | 38,608 | ||||||
| Sandy Creek Energy Associates LP, Sr. Sec. Credit Facilities 1st Lien Term Loan, Tranche B, 6.33%, [LIBOR4+400], 11/9/201 | 71,971 | 63,020 | ||||||
| Talent Energy Supply LLC, Sr. Sec. Credit Facilities 1st Lien Term Loan, Tranche B, 6.088%, 7/8/261,2 | 220,000 | 217,250 | ||||||
| 1,641,927 | ||||||||
| Total Corporate Loans (Cost $76,634,649) |
| 72,549,083
|
| |||||
| Corporate Bonds and Notes—5.5% | ||||||||
| Diamond Sports Group LLC/Diamond Sports Finance Co., 5.375% Sr. Sec. Nts., 8/15/266 | 295,000 | 310,487 | ||||||
| iHeartCommunications, Inc., 8.375% Sr. Unsec. Nts., 5/1/27 | 15,798 | 17,121 | ||||||
| Peabody Energy Corp., 6.375% Sr. Sec. Nts., 3/31/256 | 910,000 | 950,381 | ||||||
| Revlon Consumer Products Corp., 5.75% Sr. Unsec. Nts., 2/15/21 | 400,000 | 366,000 | ||||||
| Tesla, Inc., 5.30% Sr. Unsec. Nts., 8/15/256 | 1,975,000 | 1,770,094 | ||||||
| Transocean, Inc., 7.25% Sr. Unsec. Nts., 11/1/256 | 500,000 | 456,875 | ||||||
| United States Steel Corp., 6.25% Sr. Unsec. Nts., 3/15/26 | 150,000 | 133,220 | ||||||
| Total Corporate Bonds and Notes (Cost $4,081,100) |
| 4,004,178
|
| |||||
| Shares | ||||||||
| Common Stocks—4.3% | ||||||||
| Arch Coal, Inc., Cl. A | 24,098 | 1,844,943 | ||||||
| Ascent Resources - Marcellus LLC, Cl. A7 | 34,124 | 92,561 | ||||||
| Avaya Holdings Corp.7 | 33,510 | 473,161 | ||||||
| Caesars Entertainment Corp.7 | 100 | 1,151 | ||||||
| Catalina Marketing Corp. (Pacifico, Inc.)2,7 | 1,583 | 8,311 | ||||||
| Clear Channel Outdoor Holdings, Inc., Cl. A7 | 63,867 | 166,054 | ||||||
| Crossmark Holdings, Inc.2,7 | 724 | 54,300 | ||||||
| Everyware Global, Inc.2,7 | 5,211 | 7,816 | ||||||
| Gymboree Corp. (The)2 | 3,550 | 2,662 | ||||||
| Gymboree Holding Corp.2 | 10,048 | 10 | ||||||
| Harvey Gulf International Marine LLC2,7 | 657 | 8,213 | ||||||
| iHeartMedia, Inc.7 | 2,010 | 26,848 | ||||||
| iHeartMedia, Inc., Cl. A7 | 27,160 | 374,808 | ||||||
| Larchmont Resources LLC2,7 | 78 | 19,560 | ||||||
| Millennium Corporate Claim Litigation Trust2,7 | 274 | — | ||||||
| Millennium Lender Claim Litigation Trust2,7 | 548 | — | ||||||
| New Millennium Holdco, Inc.7 | �� | 5,562 | 487 | |||||
| Quicksilver Resources, Inc.2,7 | 571,500 | — | ||||||
| Sabine Oil & Gas Holdings, Inc. | 94 | 4,935 | ||||||
| Sunguard Equity7 | 225 | 6,675 | ||||||
31 INVESCO OPPENHEIMER SENIOR FLOATING RATE PLUS FUND
SCHEDULE OF INVESTMENTSContinued
| Shares | Value | |||||||
| Common Stocks (Continued) | ||||||||
| Templar Energy, Cl. A2,7 | 7,400 | $ | — | |||||
|
|
| ||||||
| Total Common Stocks (Cost $4,454,449) | 3,092,495 | |||||||
| Units | ||||||||
| Rights, Warrants and Certificates—0.0% | ||||||||
| Ascent Resources - Marcellus LLC Wts., Strike Price $0, Exp. 4/3/232,7 | 8,835 | 265 | ||||||
| Media General, Inc. Rts., Strike Price $0, Exp. 12/31/492,7,8 | 30,400 | 1,763 | ||||||
| Sabine Oil Tranche 1 Wts., Strike Price $4.49, Exp. 8/11/262,7 | 298 | 3,129 | ||||||
| Sabine Oil Tranche 2 Wts., Strike Price $2.72, Exp. 8/11/262,7 | 62 | 775 | ||||||
|
|
| ||||||
| Total Rights, Warrants and Certificates (Cost $40,764) | 5,932 | |||||||
| Shares | Value | |||||||
| Investment Company—1.7% | ||||||||
| Invesco Government & Agency Portfolio, Institutional Class, 2.02%9(Cost $1,225,501) | 1,225,501 | $ | 1,225,514 | |||||
| Total Investments, at Value (Cost $86,436,463) | 111.7% | 80,877,202 | ||||||
| Net Other Assets (Liabilities) | (11.7) | (8,480,050 | ) | |||||
|
|
| ||||||
| Net Assets | 100.0% | $ | 72,397,152 | |||||
|
|
| ||||||
Footnotes to Statement of Investments
* Variable rate senior loan interests often require prepayments from excess cash flow or permit the borrower to repay at its election. The degree to which borrowers repay, whether as a contractual requirement or at their election, cannot be predicted with accuracy. As a result, the actual remaining maturity may be substantially less than the stated maturities shown. However, it is anticipated that the variable rate senior loan interests will have an expected average life of three to five years.
1. Variable rate senior loan interests are, at present, not readily marketable, not registered under the Securities Act of 1933, as amended (the “1933 Act”), and may be subject to contractual and legal restrictions on sale. Variable rate senior loan interests in the Fund’s portfolio generally have variable rates which adjust to a base, such as the London Interbank Offered Rate (“LIBOR”), on set dates, typically every 30 days but not greater than one year; and/ or have interest rates that float at a margin above a widely recognized base lending rate such as the Prime Rate of a designated U.S. bank.
2. The value of this security was determined using significant unobservable inputs. See Note 3 of the accompanying Notes.
3. Interest or dividend ispaid-in-kind, when applicable.
4. All or a portion of this holding is subject to unfunded loan commitments. The stated interest rate reflects the weighted average of the reference rate and spread for the funded portion, if any, and the commitment fees on the portion of the loan that is unfunded. See Note 9.
5. This security is not accruing income because its issuer has missed or is expected to miss interest and/or principal payments. The rate shown is the contractual interest rate.
6. Security purchased or received in a transaction exempt from registration under the Securities Act of 1933, as amended (the “1933 Act”). The security may be resold pursuant to an exemption from registration under the 1933 Act, typically to qualified institutional buyers. The aggregate value of these securities at August 31, 2019 was $3,487,837, which represented 4.82% of the Fund’s Net Assets.
7.Non-income producing security.
8. Security received as the result of issuer reorganization.
9. The money market fund and the Fund are affiliated by having the same investment adviser. The rate shown is the7-day SEC standardized yield as of August 31, 2019.
32 INVESCO OPPENHEIMER SENIOR FLOATING RATE PLUS FUND
| Glossary: | ||
| Definitions | ||
| LIBOR4 | London Interbank Offered Rate-Quarterly | |
| LIBOR6 | London Interbank OfferedRate-Bi-Monthly | |
| LIBOR12 | London Interbank Offered Rate-Monthly | |
| PRIME4 | United States Prime Rate-Quarterly | |
| PRIME12 | United States Prime Rate-Monthly | |
See accompanying Notes to Financial Statements.
33 INVESCO OPPENHEIMER SENIOR FLOATING RATE PLUS FUND
SCHEDULE OF INVESTMENTSJuly 31, 2019
| Principal Amount | Value | |||||||
| Corporate Loans*—99.1% | ||||||||
| Consumer Discretionary—32.2% | ||||||||
| Distributors—1.5% | ||||||||
Albertson’s LLC, Sr. Sec. Credit Facilities 1st Lien Term Loan: Tranche B6, 5.439%, [LIBOR4+300], 6/22/231 | $ | 107,555 | $ | 107,891 | ||||
| Tranche B7, 5.439%, [LIBOR12+300], 11/17/251 | 167,279 | 167,727 | ||||||
| Alphabet Holdings Co., Inc., Sr. Sec. Credit Facilities 1st Lien Term Loan, 5.902%, [LIBOR4+350], 9/26/241 | 115,733 | 109,754 | ||||||
| Bass Pro Group LLC, Sr. Sec. Credit Facilities 1st Lien Term Loan, Tranche B, 7.402%, [LIBOR12+500], 9/25/241 | 340,391 | 322,884 | ||||||
| Belk, Inc., Sr. Sec. Credit Facilities 1st Lien Term Loan, Tranche B, 7.285%, [LIBOR4+475], 12/12/221 | 33,945 | 27,641 | ||||||
| Jo-Ann Stores LLC, Sr. Sec. Credit Facilities 1st Lien Term Loan, Tranche B, 7.259%, [LIBOR4+500], 10/20/231 | 48,980 | 42,450 | ||||||
| Petco Animal Supplies, Inc., Sr. Sec. Credit Facilities 1st Lien Term Loan, Tranche B1, 5.833%, [LIBOR4+325], 1/26/231 | 122,254 | 95,227 | ||||||
| United Natural Foods, Inc., Sr. Sec. Credit Facilities 1st Lien Term Loan, Tranche B, 6.652%, [LIBOR12+425], 10/22/251 | 273,325 | 231,473 | ||||||
| 1,105,047 | ||||||||
| Diversified Consumer Services—1.2% | ||||||||
| 4L Technologies, Inc., Sr. Sec. Credit Facilities 1st Lien Term Loan, Tranche B, 6.902%, [LIBOR4+450], 5/8/201 | 627,374 | 377,099 | ||||||
| IQOR US, Inc., Sr. Sec. Credit Facilities 1st Lien Term Loan, Tranche B, 7.319%, [LIBOR4+500], 4/1/211 | 532,681 | 508,711 | ||||||
| IQOR US, Inc., Sr. Sec. Credit Facilities 2nd Lien Term Loan, 11.069%, [LIBOR4+875], 4/1/221 | 40,000 | 32,200 | ||||||
| 918,010 | ||||||||
| Hotels, Restaurants & Leisure—7.7% | ||||||||
| 24 Hour Fitness Worldwide, Inc., Sr. Sec. Credit Facilities 1st Lien Term Loan, Tranche B, 5.902%, [LIBOR12+350], 5/30/251 | 48,565 | 48,679 | ||||||
| Caesars Growth Properties Holdings LLC, Sr. Sec. Credit Facilities 1st Lien Term Loan, 5.152%, [LIBOR4+275], 12/23/241 | 1,176,703 | 1,169,166 | ||||||
| CDS US Intermediate Holdings, Inc., Sr. Sec. Credit Facilities 1st Lien Term Loan, Tranche B, 6.08%, [LIBOR4+375], 7/8/221 | 118,952 | 116,488 | ||||||
| Churchill Downs, Inc., Sr. Sec. Credit Facilities 1st Lien Term Loan, Tranche B, 4.41%, [LIBOR12+200], 12/27/241 | 103,611 | 104,000 | ||||||
| CityCenter Holdings LLC, Sr. Sec. Credit Facilities 1st Lien Term Loan, Tranche B, 4.652%, [LIBOR12+225], 4/18/241 | 260,503 | 261,358 | ||||||
| Delta 2 Lux Sarl, Sr. Sec. Credit Facilities 1st Lien Term Loan, Tranche B3, 4.902%, [LIBOR12+250], 2/1/241 | 422,609 | 418,459 | ||||||
| Eldorado Resorts, Inc., Sr. Sec. Credit Facilities 1st Lien Term Loan, Tranche B,4.375%-4.563%, [LIBOR4+225], 4/17/241 | 208,256 | 208,257 | ||||||
| Everi Payments, Inc., Sr. Sec. Credit Facilities 1st Lien Term Loan, Tranche B, 5.402%, [LIBOR12+300], 5/9/241 | 329,068 | 329,889 | ||||||
| Four Seasons Hotels Ltd., Sr. Sec. Credit Facilities 1st Lien Term Loan, 4.402%, [LIBOR12+200], 11/30/231 | 58,500 | 58,669 | ||||||
34 INVESCO OPPENHEIMER SENIOR FLOATING RATE PLUS FUND
| Principal Amount | Value | |||||||
| Hotels, Restaurants & Leisure (Continued) | ||||||||
| Gateway Casinos & Entertainment Ltd., Sr. Sec. Credit Facilities 1st Lien Term Loan, Tranche B, 5.33%, [LIBOR4+300], 12/1/231 | $ | 49,500 | $ | 49,175 | ||||
| GVC Holdings plc, Sr. Sec. Credit Facilities 1st Lien Term Loan, Tranche B2, 4.652%, [LIBOR4+275], 3/29/241 | 237,000 | 237,742 | ||||||
| LTI Holdings, Inc., Sr. Sec. Credit Facilities 1st Lien Term Loan, 5.902%, [LIBOR12+350], 9/6/251 | 108,264 | 103,618 | ||||||
| Nascar Holdings Inc., Sr. Sec. Credit Facilities 1st Lien Term Loan, Tranche B, 5.275%, 7/26/261 | 135,000 | 135,760 | ||||||
| Scientific Games International, Inc., Sr. Sec. Credit Facilities 1st Lien Term Loan, Tranche B5,5.152%-5.231%, [LIBOR12+275], 8/14/241 | 939,486 | 936,113 | ||||||
| SeaWorld Parks & Entertainment, Inc., Sr. Sec. Credit Facilities 1st Lien Term Loan, Tranche B5, 5.439%, [LIBOR4+300], 4/1/241 | 248,096 | 248,743 | ||||||
| Stars Group Holdings BV, Sr. Sec. Credit Facilities 1st Lien Term Loan, Tranche B, 6.101%, [LIBOR4+350], 7/10/251 | 539,552 | 542,249 | ||||||
| Station Casinos LLC, Sr. Sec. Credit Facilities 1st Lien Term Loan, Tranche B, 4.94%, [LIBOR12+250], 6/8/231 | 414,873 | 416,373 | ||||||
| Topgolf International, Inc., Sr. Sec. Credit Facilities 1st Lien Term Loan, 7.879%, [LIBOR12+550], 2/8/261 | 24,938 | 25,125 | ||||||
| Town Sports International LLC, Sr. Sec. Credit Facilities 1st Lien Term Loan, Tranche B, 5.939%, [LIBOR12+350], 11/15/201 | 213,430 | 210,228 | ||||||
| Weight Watchers International, Inc., Sr. Sec. Credit Facilities 1st Lien Term Loan, Tranche B, 7.07%, [LIBOR12+475], 11/29/241 | 79,961 | 79,511 | ||||||
| Wyndham Hotels & Resorts, Inc., Sr. Sec. Credit Facilities 1st Lien Term Loan, Tranche B, 4.152%, [LIBOR4+200], 5/30/251 | 79,400 | 79,704 | ||||||
| 5,779,306 | ||||||||
| Household Durables—4.0% | ||||||||
| ABG Intermediate Holdings 2 LLC, Sr. Sec. Credit Facilities 1st Lien Term Loan, 5.902%, [LIBOR4+350], 9/27/241 | 257,942 | 256,250 | ||||||
| American Greetings Corp., Sr. Sec. Credit Facilities 1st Lien Term Loan, Tranche B, 6.902%, [LIBOR12+450], 4/6/241 | 233,024 | 232,150 | ||||||
| Callaway Golf Co., Sr. Sec. Credit Facilities 1st Lien Term Loan, Tranche B, 6.86%, [LIBOR12+450], 12/14/251 | 51,425 | 52,127 | ||||||
| Coty, Inc., Sr. Sec. Credit Facilities 1st Lien Term Loan, Tranche B, 4.61%, [LIBOR4+225], 4/7/251 | 386,010 | 373,947 | ||||||
| Hanesbrands, Inc., Sr. Sec. Credit Facilities 1st Lien Term Loan, Tranche B, 4.152%, [LIBOR12+175], 12/16/241 | 29,624 | 29,791 | ||||||
| International Textile Group, Inc., Sr. Sec. Credit Facilities 1st Lien Term Loan, 7.402%, [LIBOR4+500], 5/1/241,2 | 141,711 | 130,374 | ||||||
| Lifetime Brands, Inc., Sr. Sec. Credit Facilities 1st Lien Term Loan, Tranche B, 5.902%, [LIBOR12+350], 2/28/251 | 44,438 | 44,382 | ||||||
| PetSmart, Inc, Sr. Sec. Credit Facilities 1st Lien Term Loan, Tranche B, 6.38%, [LIBOR12+400], 3/11/221 | 280,906 | 276,263 | ||||||
35 INVESCO OPPENHEIMER SENIOR FLOATING RATE PLUS FUND
SCHEDULE OF INVESTMENTSContinued
| Principal Amount | Value | |||||||
| Household Durables (Continued) | ||||||||
| Revlon Consumer Products Corp., Sr. Sec. Credit Facilities 1st Lien Term Loan, Tranche B,5.476%-6.129%, [LIBOR12+350], 9/7/231 | $ | 663,642 | $ | 543,636 | ||||
| Rodan & Fields LLC, Sr. Sec. Credit Facilities 1st Lien Term Loan, Tranche B, 6.325%, [LIBOR12+400], 6/16/251 | 207,850 | 193,474 | ||||||
| Serta Simmons Bedding LLC, Sr. Sec. Credit Facilities 1st Lien Term Loan, Tranche B,5.814%-5.879%, [LIBOR4+350], 11/8/231 | 961,001 | 661,889 | ||||||
| SIWF Holdings, Inc., Sr. Sec. Credit Facilities 1st Lien Term Loan, 6.52%, [LIBOR12+425], 6/15/251 | 173,250 | 173,142 | ||||||
| Varsity Brands Holdings Co., Inc., Sr. Sec. Credit Facilities 1st Lien Term Loan, 5.73%, [LIBOR12+350], 12/16/241 | 34,587 | 34,133 | ||||||
| 3,001,558 | ||||||||
| Media—17.6% | ||||||||
| Acosta, Inc., Sr. Sec. Credit Facilities 1st Lien Term Loan, Tranche B, 5.652%, [LIBOR4+325], 9/26/211 | 3,815 | 1,364 | ||||||
Altice Financing SA, Sr. Sec. Credit Facilities 1st Lien Term Loan: Tranche B, 5.144%, [LIBOR4+275], 7/15/251 | 323,711 | 310,896 | ||||||
| Tranche B13, 6.325%, [LIBOR4+400], 8/14/261 | 307,675 | 306,715 | ||||||
| Camelot Finance LP, Sr. Sec. Credit Facilities 1st Lien Term Loan, Tranche B, 5.652%, [LIBOR12+325], 10/3/231 | 54,546 | 54,876 | ||||||
| CBS Radio, Inc., Sr. Sec. Credit Facilities 1st Lien Term Loan, Tranche B1, 5.152%, [LIBOR4+275], 11/18/241 | 186,165 | 186,281 | ||||||
| Checkout Holding Corp., Sr. Sec. Credit Facilities 1st Lien Exit Term Loan, 9.894%, [LIBOR12+750], 2/15/231 | 169,742 | 143,998 | ||||||
| Checkout Holding Corp., Sr. Sec. Credit Facilities 1st Lien Exit Term Loan, 9.50% PIK Rate, 3.394% Cash Rate, [LIBOR4+100], 8/15/231,3 | 100,848 | 47,903 | ||||||
CSC Holdings LLC, Sr. Sec. Credit Facilities 1st Lien Term Loan: Tranche B, 4.644%, [LIBOR12+225], 7/17/251 | 313,810 | 313,417 | ||||||
| Tranche B, 4.644%, [LIBOR4+225], 1/15/261 | 233,825 | 233,533 | ||||||
| Deluxe Entertainment Services Group, Inc., Sr. Sec. Credit Facilities 1st Lien Term Loan, Tranche B, 8.083%, [LIBOR4+550], 2/28/201 | 367,028 | 156,446 | ||||||
| EW Scripps Co. (The), Sr. Sec. Credit Facilities 1st Lien Term Loan, Tranche B, 5.152%, [LIBOR12+275], 5/1/261 | 119,700 | 120,074 | ||||||
| Harland Clarke Holdings Corp., Sr. Sec. Credit Facilities 1st Lien Term Loan, Tranche B7, 7.08%, [LIBOR4+475], 11/3/231 | 123,652 | 95,831 | ||||||
| iHeartCommunications, Inc, Sr. Sec. Credit Facilities 1st Lien Exit Term Loan, 6.579%, [LIBOR12+400], 5/1/261 | 671,994 | 677,874 | ||||||
Intelsat Jackson Holdings SA, Sr. Sec. Credit Facilities 1st Lien Term Loan: Tranche B3, 5.991%, [LIBOR4+375], 11/27/231 | 420,000 | 421,800 | ||||||
| Tranche B4, 6.904%, [LIBOR4+450], 1/2/241 | 50,000 | 50,613 | ||||||
| ION Media Networks, Inc., Sr. Sec. Credit Facilities 1st Lien Term Loan, Tranche B, 5.313%, [LIBOR12+300], 12/18/241 | 676,737 | 676,629 | ||||||
| Liberty Cablevision of Puerto Rico LLC, Sr. Sec. Credit Facilities 1st Lien Term Loan, 5.825%, [LIBOR4+350], 1/7/221 | 335,000 | 334,581 | ||||||
| Lions Gate Capital Holdings LLC, Sr. Sec. Credit Facilities 1st Lien Term Loan, Tranche B, 4.652%, [LIBOR4+225], 3/24/251 | 194,370 | 194,492 | ||||||
36 INVESCO OPPENHEIMER SENIOR FLOATING RATE PLUS FUND
| Principal Amount | Value | |||||||
| Media (Continued) | ||||||||
| MacDonald Dettwiler & Associates Ltd., Sr. Sec. Credit Facilities 1st Lien Term Loan, Tranche B, 5.16%, [LIBOR4+250], 10/4/241 | $ | 161,791 | $ | 147,060 | ||||
| MediArena Acquisition BV, Sr. Sec. Credit Facilities 1st Lien Term Loan, 8.07%, [LIBOR4+575], 8/13/211 | 359,289 | 358,118 | ||||||
| Metro-Goldwyn-Mayer, Inc., Sr. Sec. Credit Facilities 1st Lien Term Loan, Tranche B, 4.91%, [LIBOR4+250], 7/3/251 | 240,000 | 239,400 | ||||||
| Metro-Goldwyn-Mayer, Inc., Sr. Sec. Credit Facilities 2nd Lien Term Loan, Tranche B, 6.91%, [LIBOR4+450], 7/3/261 | 5,000 | 4,875 | ||||||
| Mission Broadcasting, Inc., Sr. Sec. Credit Facilities 1st Lien Term Loan, Tranche B3, 4.652%, [LIBOR12+225], 1/17/241 | 134,366 | 133,989 | ||||||
| Monarchy Enterprises Holdings BV, Sr. Sec. Credit Facilities 1st Lien Term Loan, 8.939%, [LIBOR4+650], 10/13/221,2 | 655,000 | 651,725 | ||||||
| NEP Group, Inc., Sr. Sec. Credit Facilities 1st Lien Term Loan, Tranche B, 5.689%, [LIBOR4+325], 10/20/251 | 557,200 | 557,841 | ||||||
Nexstar Broadcasting, Inc., Sr. Sec. Credit Facilities 1st Lien Term Loan: Tranche B, 4.678%, [LIBOR4+225], 7/19/241 | 674,505 | 672,610 | ||||||
| Tranche B, 5.253%, [LIBOR4+275], 6/19/261 | 105,000 | 105,153 | ||||||
| Radiate Holdco LLC, Sr. Sec. Credit Facilities 1st Lien Term Loan, 5.402%, [LIBOR12+300], 2/1/241 | 622,785 | 616,816 | ||||||
| Red Ventures LLC, Sr. Sec. Credit Facilities 1st Lien Term Loan, Tranche B, 5.439%, [LIBOR12+300], 11/8/241 | 293,848 | 295,271 | ||||||
| SFR Group SA, Sr. Sec. Credit Facilities 1st Lien Term Loan, Tranche B12, 6.082%, [LIBOR12+368.75], 1/31/261 | 454,153 | 450,180 | ||||||
| Sinclair Television Group Inc., Sr. Sec. Credit Facilities 1st Lien Term Loan, Tranche B,5.42%-5.56%, [LIBOR12+325], 7/18/261 | 188,523 | 189,191 | ||||||
| Sinclair Television Group, Inc., Sr. Sec. Credit Facilities 1st Lien Term Loan, Tranche B2, 4.69%, [LIBOR12+225], 1/3/241 | 375,053 | 375,287 | ||||||
| SpeedCast International Ltd., Sr. Sec. Credit Facilities 1st Lien Term Loan, Tranche B, 5.08%, [LIBOR4+250], 5/3/251 | 168,547 | 156,959 | ||||||
| Technicolor SA, Sr. Sec. Credit Facilities 1st Lien Term Loan, Tranche B, 5.274%, [LIBOR4+275], 12/6/231 | 137,047 | 123,000 | ||||||
| Telenet Financing USD LLC, Sr. Sec. Credit Facilities 1st Lien Term Loan, Tranche B, 4.575%, [LIBOR12+225], 8/15/261 | 285,000 | 284,309 | ||||||
| Tribune Media Co., Sr. Sec. Credit Facilities 1st Lien Term Loan, Tranche B, 5.402%, [LIBOR12+300], 1/26/241 | 621,818 | 622,079 | ||||||
| Univision Communications, Inc., Sr. Sec. Credit Facilities 1st Lien Term Loan, Tranche C5, 5.152%, [LIBOR12+275], 3/15/241 | 820,982 | 804,883 | ||||||
| UPC Financing Partnership, Sr. Sec. Credit Facilities 1st Lien Term Loan, 4.854%, [LIBOR12+250], 1/15/261 | 402,339 | 402,683 | ||||||
| Virgin Media Bristol LLC, Sr. Sec. Credit Facilities 1st Lien Term Loan, Tranche K, 4.825%, [LIBOR12+250], 1/15/261 | 435,000 | 436,451 | ||||||
| WideOpenWest Finance LLC, Sr. Sec. Credit Facilities 1st Lien Term Loan, Tranche B, 5.654%, [LIBOR12+325], 8/18/231 | 541,635 | 533,058 | ||||||
| William Morris Endeavor Entertainment LLC, Sr. Sec. Credit Facilities 1st Lien Term Loan, Tranche B1, 5.16%, [LIBOR6+275], 5/18/251 | 120,880 | 118,039 | ||||||
37 INVESCO OPPENHEIMER SENIOR FLOATING RATE PLUS FUND
SCHEDULE OF INVESTMENTSContinued
| Principal Amount | Value | |||||||
| Media (Continued) | ||||||||
| Ziggo Secured Finance Partnership, Sr. Sec. Credit Facilities 1st Lien Term Loan, Tranche E, 4.825%, [LIBOR12+250], 4/15/251 | $ | 705,000 | $ | 701,669 | ||||
|
|
| ||||||
| 13,307,969 | ||||||||
| Multiline Retail—0.2% | ||||||||
| Neiman Marcus Group Ltd. LLC, Sr. Sec. Credit Facilities 1st Lien Term Loan, 1.00% PIK Rate, 7.88% Cash Rate, [LIBOR12+650], 10/25/231,3 | 196,454 | 169,605 | ||||||
| Consumer Staples—2.7% | ||||||||
| Beverages—2.7% | ||||||||
| Dole Food Co., Inc., Sr. Sec. Credit Facilities 1st Lien Term Loan, Tranche B,5.159%-6.75%, [LIBOR12+275], 4/6/241 | 300,830 | 298,668 | ||||||
| Hearthside Group Holdings LLC, Sr. Sec. Credit Facilities 1st Lien Term Loan, 6.09%, [LIBOR12+368.75], 5/23/251 | 196,739 | 193,524 | ||||||
| Hostess Brands LLC, Sr. Sec. Credit Facilities 1st Lien Term Loan,4.652%-4.833%, [LIBOR12+225], 8/3/221 | 164,402 | 164,368 | ||||||
| IRB Holding Corp., Sr. Sec. Credit Facilities 1st Lien Term Loan, 5.55%, [LIBOR12+325], 2/5/251 | 417,317 | 416,237 | ||||||
| KFC Holding Co., Sr. Sec. Credit Facilities 1st Lien Term Loan, Tranche B, 4.05%, [LIBOR12+175], 4/3/251 | 80,150 | 80,225 | ||||||
| Nomad Foods Europe Midco Ltd., Sr. Sec. Credit Facilities 1st Lien Term Loan, 4.644%, [LIBOR12+225], 5/15/241 | 279,781 | 279,549 | ||||||
| NPC International, Inc., Sr. Sec. Credit Facilities 1st Lien Term Loan, 5.939%, [LIBOR12+350], 4/19/241 | 129,858 | 105,055 | ||||||
| Sigma US Corp., Sr. Sec. Credit Facilities 1st Lien Term Loan, Tranche B, 5.32%, [LIBOR4+325], 7/2/251 | 366,486 | 366,371 | ||||||
| Sunshine Investments BV, Sr. Sec. Credit Facilities 1st Lien Term Loan, Tranche B3, 5.768%, [LIBOR4+325], 3/28/251 | 128,700 | 128,942 | ||||||
|
|
| ||||||
| 2,032,939 | ||||||||
| Energy—4.2% | ||||||||
| Energy Equipment & Services—3.8% | ||||||||
| AL Midcoast Holdings LLC, Sr. Sec. Credit Facilities 1st Lien Term Loan, Tranche B, 7.83%, [LIBOR4+550], 8/1/251 | 158,800 | 158,899 | ||||||
| Ascent Resources - Marcellus LLC, Sr. Sec. Credit Facilities 1st Lien Term Loan, 8.825%, [LIBOR12+650], 3/30/231 | 47,499 | 46,312 | ||||||
| BCP Renaissance Parent LLC, Sr. Sec. Credit Facilities 1st Lien Term Loan, Tranche B, 6.083%, [LIBOR4+350], 10/31/241 | 187,976 | 188,211 | ||||||
| Bison Midstream Holdings LLC, Sr. Sec. Credit Facilities 1st Lien Term Loan, Tranche B, 6.272%, [LIBOR12+400], 5/21/251 | 98,751 | 93,715 | ||||||
| Eastern Power LLC, Sr. Sec. Credit Facilities 1st Lien Term Loan, Tranche B, 6.189%, [LIBOR12+375], 10/2/231 | 441,992 | 444,098 | ||||||
| Fieldwood Energy LLC, Sr. Sec. Credit Facilities 1st Lien Term Loan, 7.652%, [LIBOR12+525], 4/11/221 | 403,752 | 372,778 | ||||||
| GIP III Stetson I LP, Sr. Sec. Credit Facilities 1st Lien Term Loan, Tranche B, 6.55%, [LIBOR4+425], 7/18/251 | 127,885 | 128,605 | ||||||
| HGIM Corp., Sr. Sec. Credit Facilities 1st Lien Term Loan, Tranche B, 8.743%, [LIBOR4+600], 7/2/231 | 51,052 | 48,691 | ||||||
38 INVESCO OPPENHEIMER SENIOR FLOATING RATE PLUS FUND
| Principal Amount | Value | |||||||
| Energy Equipment & Services (Continued) | ||||||||
| Larchmont Resources LLC, Sr. Sec. Credit Facilities 1st Lien Term Loan, Tranche A, 9.61%, [LIBOR4+700], 8/7/201,2 | $ | 58,843 | $ | 55,460 | ||||
| Limetree Bay Terminals LLC, Sr. Sec. Credit Facilities 1st Lien Term Loan, 6.402%, [LIBOR12+400], 2/15/241 | 304,739 | 294,873 | ||||||
| McDermott Technology Americas, Inc., Sr. Sec. Credit Facilities 1st Lien Term Loan, Tranche B, 7.402%, [LIBOR12+500], 5/12/251 | 207,523 | 198,807 | ||||||
| Seadrill Operating LP, Sr. Sec. Credit Facilities 1st Lien Term Loan, Tranche B, 8.33%, [LIBOR4+600], 2/21/211 | 563,497 | 373,517 | ||||||
| Sheridan Investment Partners II LP, Sr. Sec. Credit Facilities 1st Lien Term Loan, Tranche B, 6.13%, [LIBOR4+350], 12/16/201,4 | 232,460 | 137,733 | ||||||
| Sheridan Production PartnersII-A LP, Sr. Sec. Credit Facilities 1st Lien Term Loan, Tranche B, 6.13%, [LIBOR4+350], 12/16/201,4 | 41,273 | 24,454 | ||||||
| Sheridan Production PartnersII-M LP, Sr. Sec. Credit Facilities 1st Lien Term Loan, Tranche B, 6.13%, [LIBOR4+350], 12/16/201,4 | 19,615 | 11,622 | ||||||
| Ultra Resources, Inc., Sr. Sec. Credit Facilities 1st Lien Exit Term Loan, 0.25% PIK Rate, 6.154% Cash Rate, [LIBOR4+400], 4/12/241,3 | 394,353 | 299,093 | ||||||
| 2,876,868 | ||||||||
| Oil, Gas & Consumable Fuels—0.4% | ||||||||
| Southcross Energy Partners LP, Sr. Sec. Credit Facilities Debtor in Possession 1st Lien Term Loan, 10.75%, [PRIME12+525], 10/1/191 | 59,097 | 60,279 | ||||||
| Southcross Energy Partners LP, Sr. Sec. Credit Facilities 1st Lien Term Loan, Tranche B, 10.75%, [PRIME4+525], 8/4/211,2,4 | 189,209 | 147,110 | ||||||
| Southcross Energy Partners LP, Sr. Sec. Credit Facilities Debtor in Possession 1st Lien Term Loan, 12.41%, [LIBOR12+1,000], 10/1/191 | 58,662 | 59,835 | ||||||
| Southcross Energy Partners LP, Sr. Sec. Credit Facilities Debtor in Possession 1st Lien Term Loan, 10.75%, [PRIME12+525], 10/1/191,4 | 12,905 | 12,453 | ||||||
| 279,677 | ||||||||
| Financials—6.0% | ||||||||
| Commercial Banks—5.0% | ||||||||
| Acrisure LLC, Sr. Sec. Credit Facilities 1st Lien Term Loan, Tranche B,6.379%-6.879%, [LIBOR4+375], 11/22/231 | 355,701 | 352,886 | ||||||
| Alliant Holdings Intermediate LLC, Sr. Sec. Credit Facilities 1st Lien Term Loan, Tranche B, 5.269%, [LIBOR12+300], 5/9/251 | 327,848 | 323,928 | ||||||
| AmWINS Group, Inc., Sr. Sec. Credit Facilities 1st Lien Term Loan,5.11%-5.152%, [LIBOR12+275], 1/25/241 | 176,600 | 176,987 | ||||||
| Amynta Agency Borrower, Inc., Sec. Credit Facilities 1st Lien Term Loan, 6.902%, [LIBOR12+450], 2/28/251 | 69,479 | 67,655 | ||||||
| Aretec Group, Inc., Sr. Sec. Credit Facilities 1st Lien Term Loan, 6.652%, [LIBOR4+425], 10/1/251 | 591,875 | 580,038 | ||||||
| Capital Automotive LP, Sr. Sec. Credit Facilities 1st Lien Term Loan, Tranche B, 4.91%, [LIBOR12+250], 3/25/241 | 21,417 | 21,415 | ||||||
39 INVESCO OPPENHEIMER SENIOR FLOATING RATE PLUS FUND
SCHEDULE OF INVESTMENTSContinued
| Principal Amount | Value | |||||||
| Commercial Banks (Continued) | ||||||||
| DTZ US Borrower LLC, Sr. Sec. Credit Facilities 1st Lien Term Loan, Tranche B, 5.652%, [LIBOR12+325], 8/21/251 | $ | 302,713 | $ | 304,321 | ||||
| Focus Financial Partners LLC, Sr. Sec. Credit Facilities 1st Lien Term Loan, 4.902%, [LIBOR12+250], 7/3/241 | 91,888 | 92,127 | ||||||
| GGP Nimbus LP, Sr. Sec. Credit Facilities 1st Lien Term Loan, Tranche B, 4.902%, [LIBOR12+250], 8/27/251 | 317,600 | 312,020 | ||||||
| HUB International Ltd., Sr. Sec. Credit Facilities 1st Lien Term Loan, Tranche B, 5.515%, [LIBOR4+300], 4/25/251 | 500,173 | 495,729 | ||||||
| Hyperion Insurance Group Ltd., Sr. Sec. Credit Facilities 1st Lien Term Loan, Tranche B, 5.938%, [LIBOR12+350], 12/20/241 | 87,534 | 87,724 | ||||||
| iStar, Inc., Sr. Sec. Credit Facilities 1st Lien Term Loan, Tranche B,5.048%-5.13%, [LIBOR12+275], 6/28/231 | 154,041 | 154,715 | ||||||
| NFP Corp., Sr. Sec. Credit Facilities 1st Lien Term Loan, Tranche B, 5.439%, [LIBOR12+300], 1/8/241 | 267,396 | 264,110 | ||||||
| Uniti Group, Inc., Sr. Sec. Credit Facilities 1st Lien Term Loan, 7.402%, [LIBOR12+500], 10/24/221 | 150,201 | 146,419 | ||||||
| USI, Inc., Sr. Sec. Credit Facilities 1st Lien Term Loan, Tranche B, 5.33%, [LIBOR4+300], 5/16/241 | 362,696 | 358,200 | ||||||
| 3,738,274 | ||||||||
| Consumer Finance—0.8% | ||||||||
| PGX Holdings, Inc., Sr. Sec. Credit Facilities 1st Lien Term Loan, 7.66%, [LIBOR12+525], 9/29/201 | 630,672 | 586,526 | ||||||
| PGX Holdings, Inc., Sr. Sec. Credit Facilities 2nd Lien Term Loan, 11.44%, [LIBOR12+900], 9/29/211,2 | 31,112 | 30,178 | ||||||
| 616,704 | ||||||||
| Insurance—0.2% | ||||||||
| AssuredPartners, Inc., Sr. Sec. Credit Facilities 1st Lien Term Loan, Tranche B, 5.902%, [LIBOR12+325], 10/22/241 | 175,921 | 175,403 | ||||||
| Health Care—8.1% | ||||||||
| Health Care Equipment & Supplies—8.1% | ||||||||
| 21st Century Oncology, Inc., Sr. Sec. Credit Facilities 1st Lien Exit Term Loan, Tranche B, 8.455%, [LIBOR4+612.5], 1/16/231 | 41,764 | 36,578 | ||||||
Acadia Healthcare Co., Inc., Sr. Sec. Credit Facilities 1st Lien Term Loan: Tranche B, 4.902%, [LIBOR12+250], 2/11/221 | 14,848 | 14,886 | ||||||
| Tranche B4, 4.902%, [LIBOR12+250], 2/16/231 | 115,512 | 115,812 | ||||||
| Alliance HealthCare Services, Inc., Sr. Sec. Credit Facilities 1st Lien Term Loan, 6.902%, [LIBOR4+450], 10/24/231 | 125,551 | 119,745 | ||||||
| Amneal Pharmaceuticals LLC, Sr. Sec. Credit Facilities 1st Lien Term Loan, Tranche B, 5.938%, [LIBOR12+350], 5/4/251 | 121,852 | 113,301 | ||||||
| Ardent Health Partners LLC, Sr. Sec. Credit Facilities 1st Lien Term Loan, Tranche B, 6.902%, [LIBOR12+450], 6/30/251 | 232,650 | 233,619 | ||||||
| Bausch Health Cos., Inc., Sr. Sec. Credit Facilities 1st Lien Term Loan, Tranche B, 5.379%, [LIBOR4+300], 6/2/251 | 196,451 | 197,384 | ||||||
| Carestream Dental Equipment, Inc., Sr. Sec. Credit Facilities 1st Lien Term Loan, 5.652%, [LIBOR4+325], 9/1/241 | 39,300 | 38,678 | ||||||
40 INVESCO OPPENHEIMER SENIOR FLOATING RATE PLUS FUND
| Principal Amount | Value | |||||||
| Health Care Equipment & Supplies (Continued) | ||||||||
| Change Healthcare Holdings LLC, Sr. Sec. Credit Facilities 1st Lien Term Loan, Tranche B, 5.152%, [LIBOR12+275], 3/1/241 | $ | 523,775 | $ | 523,487 | ||||
| Concentra, Inc., Sr. Sec. Credit Facilities 1st Lien Term Loan, Tranche B, 5.21%, [LIBOR12+275], 6/1/221 | 92,225 | 92,485 | ||||||
| CVS Holdings I LP, Sr. Sec. Credit Facilities 1st Lien Term Loan, 5.16%, [LIBOR4+300], 2/6/251 | 137,901 | 137,930 | ||||||
| Endo International plc, Sr. Sec. Credit Facilities 1st Lien Term Loan, Tranche B, 6.75%, [LIBOR12+425], 4/29/241 | 248,920 | 227,840 | ||||||
| Enterprise Merger Sub, Inc., Sr. Sec. Credit Facilities 1st Lien Term Loan, 6.152%, [LIBOR4+375], 10/10/251 | 676,600 | 583,321 | ||||||
| Gentiva Health Services, Inc., Sr. Sec. Credit Facilities 1st Lien Term Loan, 6.188%, [LIBOR4+375], 7/2/251 | 441,687 | 444,723 | ||||||
| GoodRX, Inc., Sr. Sec. Credit Facilities 1st Lien Term Loan, 5.064%, [LIBOR4+300], 10/10/251 | 172,198 | 172,048 | ||||||
| Jaguar Holding Co. II, Sr. Sec. Credit Facilities 1st Lien Term Loan, 4.902%, [LIBOR4+250], 8/18/221 | 199,358 | 199,323 | ||||||
| Kinetic Concepts, Inc., Sr. Sec. Credit Facilities 1st Lien Term Loan, Tranche B, 5.58%, [LIBOR4+325], 2/2/241 | 88,200 | 88,565 | ||||||
| LifeScan Global Corp., Sr. Sec. Credit Facilities 1st Lien Term Loan, 8.66%, [LIBOR4+600], 10/1/241 | 217,125 | 207,444 | ||||||
| Mallinckrodt International Finance SA, Sr. Sec. Credit Facilities 1st Lien Term Loan, Tranche B, 5.08%, [LIBOR4+275], 9/24/241 | 99,260 | 84,964 | ||||||
| MPH Acquisition Holdings LLC, Sr. Sec. Credit Facilities 1st Lien Term Loan, Tranche B, 5.351%, [LIBOR4+300], 6/7/231 | 359,374 | 349,671 | ||||||
| One Call Corp., Sr. Sec. Credit Facilities 1st Lien Term Loan, Tranche B, 7.575%, [LIBOR12+525], 11/27/221 | 136,445 | 119,304 | ||||||
| Ortho-Clinical Diagnostics SA, Sr. Sec. Credit Facilities 1st Lien Term Loan, Tranche B, 5.563%, [LIBOR4+325], 6/30/251 | 362,231 | 352,498 | ||||||
| PAREXEL International Corp., Sr. Sec. Credit Facilities 1st Lien Term Loan, Tranche B, 5.152%, [LIBOR4+300], 9/27/241 | 93,551 | 90,453 | ||||||
| Select Medical Corp., Sr. Sec. Credit Facilities 1st Lien Term Loan, 4.803%, 3/6/251 | 155,000 | 154,904 | ||||||
| Select Medical Corp., Sr. Sec. Credit Facilities 1st Lien Term Loan, Tranche B, 4.99%, [LIBOR12+250], 3/6/251 | 158,090 | 157,992 | ||||||
| Sotera Health Holdings LLC, Sr. Sec. Credit Facilities 1st Lien Term Loan, Tranche B, 5.402%, [LIBOR12+300], 5/15/221 | 14,736 | 14,611 | ||||||
| Surgery Center Holdings, Inc., Sr. Sec. Credit Facilities 1st Lien Term Loan, 5.69%, [LIBOR4+325], 9/2/241 | 286,053 | 276,398 | ||||||
| Team Health Holdings, Inc., Sr. Sec. Credit Facilities 1st Lien Term Loan, Tranche B, 5.152%, [LIBOR12+275], 2/6/241 | 363,555 | 319,625 | ||||||
| US Anesthesia Partners, Inc., Sr. Sec. Credit Facilities 1st Lien Term Loan, 5.402%, [LIBOR12+300], 6/23/241 | 355,441 | 343,445 | ||||||
| VVC Holding Corp., Sr. Sec. Credit Facilities 1st Lien Term Loan, Tranche B, 7.045%, [LIBOR4+450], 2/11/261 | 219,450 | 220,582 | ||||||
| Wink Holdco, Inc., Sr. Sec. Credit Facilities 1st Lien Term Loan, 5.402%, [LIBOR4+300], 12/2/241 | 86,464 | 85,423 | ||||||
| 6,117,039 | ||||||||
41 INVESCO OPPENHEIMER SENIOR FLOATING RATE PLUS FUND
SCHEDULE OF INVESTMENTSContinued
| Principal Amount | Value | |||||||
| Industrials—18.1% | ||||||||
| Aerospace & Defense—0.3% | ||||||||
| Genuine Financial Holdings LLC, Sr. Sec. Credit Facilities 1st Lien Term Loan, 6.152%, [LIBOR4+375], 7/11/251 | $
| 213,388
|
| $
| ��211,343
|
| ||
| Commercial Services & Supplies—10.0% | ||||||||
| AI Aqua Merger Sub, Inc., Sr. Sec. Credit Facilities 1st Lien Term Loan, Tranche B1, 5.652%, [LIBOR12+325], 12/13/231 | 695,700 | 667,656 | ||||||
Asurion LLC, Sr. Sec. Credit Facilities 1st Lien Term Loan: Tranche B4, 5.402%, [LIBOR12+300], 8/4/221 | 300,281 | 301,167 | ||||||
| Tranche B6, 5.402%, [LIBOR12+300], 11/3/231 | 445,668 | 447,154 | ||||||
| Tranche B7, 5.402%, [LIBOR12+300], 11/3/241 | 64,350 | 64,563 | ||||||
| Asurion LLC, Sr. Sec. Credit Facilities 2nd Lien Term Loan, 8.902%, [LIBOR12+650], 8/4/251 | 11,174 | 11,383 | ||||||
| ATS Consolidated, Inc., Sr. Sec. Credit Facilities 1st Lien Term Loan, Tranche B, 6.152%, [LIBOR12+375], 2/28/251 | 222,312 | 223,608 | ||||||
| Belron Finance US LLC, Sr. Sec. Credit Facilities 1st Lien Term Loan, Tranche B, 4.815%, [LIBOR4+250], 11/7/241 | 147,750 | 148,166 | ||||||
| Blackhawk Network Holdings, Inc., Sr. Sec. Credit Facilities 1st Lien Term Loan, 5.402%, [LIBOR4+300], 6/15/251 | 646,492 | 646,156 | ||||||
| Boing US Holdco, Inc., Sr. Sec. Credit Facilities 1st Lien Term Loan, 5.652%, [LIBOR4+325], 10/3/241 | 238,497 | 235,963 | ||||||
| Casmar Australia Pty Ltd., Sr. Sec. Credit Facilities 1st Lien Term Loan, Tranche B, 6.741%, [LIBOR4+450], 12/8/231 | 383,632 | 356,778 | ||||||
| Ceridian HCM Holding, Inc., Sr. Sec. Credit Facilities 1st Lien Term Loan, Tranche B, 5.402%, [LIBOR12+325], 4/30/251 | 173,688 | 174,991 | ||||||
| Crossmark Holdings, Inc., Sr. Sec. Credit Facilities 1st Lien Term Loan, 8.00%, [PRIME4+250], 12/20/191,4 | 289,500 | 103,858 | ||||||
| First Advantage, Sr. Sec. Credit Facilities 1st Lien Term Loan, Tranche B, 7.689%, [LIBOR4+525], 6/30/221 | 88,072 | 88,292 | ||||||
| First American Payment Systems LP, Sr. Sec. Credit Facilities 1st Lien Term Loan, 7.352%, [LIBOR12+475], 1/5/241 | 77,583 | 77,390 | ||||||
| Garda World Security Corp., Sr. Sec. Credit Facilities 1st Lien Term Loan, Tranche B, 6.02%, [LIBOR4+350], 5/24/241 | 576,038 | 577,890 | ||||||
| Global Tel*Link Corp., Sr. Sec. Credit Facilities 1st Lien Term Loan, 6.689%, [LIBOR4+425], 11/29/251 | 213,109 | 203,093 | ||||||
| IG Investments Holdings LLC, Sr. Sec. Credit Facilities 1st Lien Term Loan,6.33%-6.402%, [LIBOR4+400], 5/23/251 | 299,546 | 299,359 | ||||||
| Inmar, Inc., Sr. Sec. Credit Facilities 1st Lien Term Loan, 6.33%, [LIBOR6+400], 5/1/241 | 448,693 | 426,258 | ||||||
| IQOR US, Inc., Sr. Sec. Credit Facilities 1st Lien Term Loan, 7.819%, [LIBOR4+550], 4/1/211 | 115,000 | 109,825 | ||||||
| Monitronics International, Inc., Sr. Sec. Credit Facilities 1st Lien Term Loan, Tranche B2, 10.00%, [PRIME4+450], 9/30/221 | 193,908 | 183,789 | ||||||
| North American Lifting Holdings, Inc., Sr. Sec. Credit Facilities 1st Lien Term Loan, 6.83%, [LIBOR4+450], 11/27/201 | 184,618 | 173,033 | ||||||
| Securus Technologies Holdings LLC, Sr. Sec. Credit Facilities 1st Lien Term Loan, 6.83%, [LIBOR12+450], 11/1/241 | 323,877 | 295,538 | ||||||
| Sinclair Television Group Inc., Sr. Sec. Credit Facilities 1st Lien Term Loan, Tranche B, 4.70%, [LIBOR4+250], 9/12/231 | 41,591 | 41,739 | ||||||
42 INVESCO OPPENHEIMER SENIOR FLOATING RATE PLUS FUND
| Principal Amount | Value | |||||||
| Commercial Services & Supplies (Continued) | ||||||||
| Staples, Inc., Sr. Sec. Credit Facilities 1st Lien Term Loan, Tranche B, 7.601%, [LIBOR12+500], 4/12/261 | $ | 778,050 | $ | 761,520 | ||||
| Travelport Finance Luxembourg Sarl, Sr. Sec. Credit Facilities 1st Lien Term Loan, 7.541%, [LIBOR4+500], 5/29/261 | 840,000 | 818,210 | ||||||
| TruGreen LP, Sr. Sec. Credit Facilities 1st Lien Term Loan, Tranche B, 6.075%, [LIBOR12+375], 3/19/261 | 39,900 | 40,125 | ||||||
| Ventia Deco LLC, Sr. Sec. Credit Facilities 1st Lien Term Loan, 5.979%, [LIBOR4+350], 6/25/261 | 58,015 | 58,305 | ||||||
|
| 7,535,809
|
| ||||||
| Industrial Conglomerates—3.8% | ||||||||
| Apex Tool Group LLC, Sr. Sec. Credit Facilities 1st Lien Term Loan, Tranche B, 6.152%, [LIBOR12+375], 2/1/221 | 276,608 | 265,959 | ||||||
| Energy Acquisition Co., Inc., Sr. Sec. Credit Facilities 1st Lien Term Loan, 6.58%, [LIBOR4+425], 6/22/251,2 | 58,826 | 55,002 | ||||||
| Gates Global LLC, Sr. Sec. Credit Facilities 1st Lien Term Loan, Tranche B, 5.189%, [LIBOR4+300], 4/1/241 | 229,954 | 229,379 | ||||||
| GrafTech Finance, Inc., Sr. Sec. Credit Facilities 1st Lien Term Loan, Tranche B, 5.902%, [LIBOR12+350], 2/12/251 | 222,111 | 219,335 | ||||||
| Robertshaw US Holdings Corp., Sr. Sec. Credit Facilities 1st Lien Term Loan, 5.938%, [LIBOR12+350], 2/28/251 | 36,956 | 34,692 | ||||||
| Space Exploration Technologies Corp., Sr. Sec. Credit Facilities 1st Lien Term Loan, 6.689%, [LIBOR12+425], 11/21/251,2 | 303,475 | 304,234 | ||||||
| Titan Acquisition Ltd., Sr. Sec. Credit Facilities 1st Lien Term Loan, 5.402%, [LIBOR12+300], 3/28/251 | 212,213 | 201,973 | ||||||
TransDigm, Inc., Sr. Sec. Credit Facilities 1st Lien Term Loan: Tranche E, 4.83%, [LIBOR12+250], 5/30/251 | 335,750 | 333,591 | ||||||
| Tranche F, 4.83%, [LIBOR12+250], 6/9/231 | 279,877 | 278,905 | ||||||
| Tranche G, 4.83%, [LIBOR4+250], 8/22/241 | 93,575 | 92,912 | ||||||
| Vectra Co., Sr. Sec. Credit Facilities 1st Lien Term Loan, 5.652%, [LIBOR12+325], 3/8/251 | 43,514 | �� | 41,918 | |||||
| Vertiv Intermediate Holding II Corp., Sr. Sec. Credit Facilities 1st Lien Term Loan, Tranche B, 6.33%, [LIBOR12+400], 11/30/231 | 584,192 | 557,173 | ||||||
| WP CPP Holdings LLC, Sr. Sec. Credit Facilities 1st Lien Term Loan, 6.34%, [LIBOR4+375], 4/30/251 | 258,838 | 259,270 | ||||||
|
| 2,874,343
|
| ||||||
| Professional Services—0.3% | ||||||||
| AVSC Holding Corp., Sr. Sec. Credit Facilities 1st Lien Term Loan, Tranche B,5.575%-5.652%, [LIBOR4+375], 3/3/251 | 206,336 | 201,372 | ||||||
|
| 201,372
|
| ||||||
| Road & Rail—2.4% | ||||||||
| American Airlines, Inc., Sr. Sec. Credit Facilities 1st Lien Term Loan, Tranche B, 4.061%, [LIBOR12+175], 6/27/251 | 108,900 | 106,927 | ||||||
| Arctic LNG Carriers Ltd., Sr. Sec. Credit Facilities 1st Lien Term Loan, Tranche B, 6.83%, [LIBOR12+450], 5/18/231 | 654,311 | 644,906 | ||||||
| Daseke Cos., Inc., Sr. Sec. Credit Facilities 1st Lien Term Loan, 7.402%, [LIBOR12+500], 2/27/241 | 570,267 | 570,623 | ||||||
43 INVESCO OPPENHEIMER SENIOR FLOATING RATE PLUS FUND
SCHEDULE OF INVESTMENTSContinued
| Principal Amount | Value | |||||||
| Road & Rail (Continued) | ||||||||
| Kenan Advantage Group, Inc. (The), Sr. Sec. Credit Facilities 1st Lien Term Loan: | ||||||||
| Tranche B1, 5.402%, [LIBOR12+300], 7/29/221 | $ | 90,558 | $ | 87,643 | ||||
| Tranche B2, 5.402%, [LIBOR12+300], 7/29/221 | 8,228 | 7,963 | ||||||
| Western Express, Inc., Sr. Sec. Credit Facilities 2nd Lien Term Loan, 10.772%, [LIBOR4+825], 2/23/221,2 | 408,628 | 442,544 | ||||||
|
| 1,860,606
|
| ||||||
| Transportation Infrastructure—1.3% | ||||||||
| Mavis Tire Express Services Corp., Sr. Sec. Credit Facilities 1st Lien Term Loan, 5.652%, [LIBOR4+325], 3/20/251 | 140,737 | 138,715 | ||||||
| Mavis Tire Express Services Corp., Sr. Sec. Credit Facilities 1st Lien Term Loan, Delayed Draw, 2.00%, 3/20/251,5 | 14,882 | 14,668 | ||||||
| Navistar, Inc., Sr. Sec. Credit Facilities 1st Lien Term Loan, Tranche B, 5.83%, [LIBOR12+350], 11/6/241 | 271,271 | 272,459 | ||||||
| Octavius Corp., Sr. Sec. Credit Facilities 1st Lien Term Loan, Tranche B,5.953%-6.101%, [LIBOR4+350], 11/8/231,2 | 35,000 | 35,087 | ||||||
| Panther BF Aggregator 2 LP, Sr. Sec. Credit Facilities 1st Lien Term Loan, Tranche B, 5.902%, [LIBOR12+350], 4/30/261 | 35,000 | 35,055 | ||||||
| Superior Industries International, Inc., Sr. Sec. Credit Facilities 1st Lien Term Loan, Tranche B, 6.439%, [LIBOR12+400], 5/22/241 | 175,497 | 167,600 | ||||||
| Tenneco, Inc., Sr. Sec. Credit Facilities 1st Lien Term Loan, Tranche B, 5.402%, [LIBOR4+275], 10/1/251 | 328,350 | 306,802 | ||||||
|
| 970,386
|
| ||||||
| Information Technology—10.8% | ||||||||
| Internet Software & Services—10.2% | ||||||||
| Almonde, Inc., Sr. Sec. Credit Facilities 1st Lien Term Loan, Tranche B, 6.101%, [LIBOR4+350], 6/13/241 | 270,622 | 266,057 | ||||||
| Avaya, Inc., Sr. Sec. Credit Facilities 1st Lien Exit Term Loan, Tranche B, 6.575%, [LIBOR12+425], 12/15/241 | 1,445,863 | 1,394,809 | ||||||
| Banff Merger Sub, Inc., Sr. Sec. Credit Facilities 1st Lien Term Loan, Tranche B, 6.58%, [LIBOR4+425], 10/2/251 | 432,825 | 417,183 | ||||||
| Blackboard, Inc., Sr. Sec. Credit Facilities 1st Lien Term Loan, Tranche B4, 7.30%, [LIBOR4+500], 6/30/211 | 62,898 | 62,748 | ||||||
| Colorado Buyer, Inc., Sr. Sec. Credit Facilities 1st Lien Term Loan, 5.38%, [LIBOR4+300], 5/1/241 | 271,714 | 256,515 | ||||||
| Ensono LP, Sr. Sec. Credit Facilities 1st Lien Term Loan, 7.652%, [LIBOR4+525], 6/27/251 | 39,858 | 39,809 | ||||||
| Infor US, Inc., Sr. Sec. Credit Facilities 1st Lien Term Loan, Tranche B, 5.08%, [LIBOR4+275], 2/1/221 | 558,988 | 559,885 | ||||||
| Informatica LLC, Sr. Sec. Credit Facilities 1st Lien Term Loan, Tranche B, 5.652%, [LIBOR4+325], 8/5/221 | 180,380 | 181,439 | ||||||
| Internap Corp., Sr. Sec. Credit Facilities 1st Lien Term Loan, 0.75% PIK Rate, 8.658% Cash Rate, [LIBOR12+575], 4/6/221,3 | 108,155 | 93,284 | ||||||
| Lighthouse Network LLC, Sr. Sec. Credit Facilities 1st Lien Term Loan, 7.083%, [LIBOR4+450], 11/29/241 | 88,650 | 88,872 | ||||||
44 INVESCO OPPENHEIMER SENIOR FLOATING RATE PLUS FUND
| Principal Amount | Value | |||||||
| Internet Software & Services (Continued) | ||||||||
MA FinanceCo LLC, Sr. Sec. Credit Facilities 1st Lien Term Loan: Tranche B, 4.902%, [LIBOR12+275], 6/21/241 | $ | 79,335 | $ | 78,873 | ||||
| Tranche B2, 4.652%, [LIBOR4+250], 11/19/211 | 46,603 | 46,603 | ||||||
| McAfee LLC, Sr. Sec. Credit Facilities 1st Lien Term Loan, Tranche B, 6.152%, [LIBOR12+375], 9/30/241 | 301,247 | 301,582 | ||||||
| Mitchell International, Inc., Sr. Sec. Credit Facilities 1st Lien Term Loan, Tranche B, 5.652%, [LIBOR12+325], 11/29/241 | 123,492 | 117,537 | ||||||
| Plantronics, Inc., Sr. Sec. Credit Facilities 1st Lien Term Loan, 4.902%, [LIBOR12+250], 7/2/251 | 330,865 | 331,361 | ||||||
| Premiere Global Services, Inc., Sr. Sec. Credit Facilities 1st Lien Term Loan, 9.238%, [LIBOR4+650], 12/8/211 | 61,402 | 39,093 | ||||||
| Quest Software US Holdings, Inc., Sr. Sec. Credit Facilities 1st Lien Term Loan, 6.833%, [LIBOR4+425], 5/16/251 | 248,125 | 244,830 | ||||||
| Riverbed Technology, Inc., Sr. Sec. Credit Facilities 1st Lien Term Loan, Tranche B, 5.66%, [LIBOR12+325], 4/24/221 | 363,485 | 308,962 | ||||||
| Seattle SpinCo, Inc., Sr. Sec. Credit Facilities 1st Lien Term Loan, Tranche B, 4.939%, [LIBOR12+275], 6/21/241 | 528,324 | 525,243 | ||||||
| Shutterfly, Inc., Sr. Sec. Credit Facilities 1st Lien Term Loan, Tranche B2, 4.94%, [LIBOR12+275], 8/17/241 | 101,101 | 101,251 | ||||||
| SolarWinds Holdings, Inc., Sr. Sec. Credit Facilities 1st Lien Term Loan, 5.189%, [LIBOR12+300], 2/5/241 | 147,771 | 148,002 | ||||||
| Solera LLC, Sr. Sec. Credit Facilities 1st Lien Term Loan, Tranche B, 5.189%, [LIBOR12+275], 3/3/231 | 226,360 | 226,030 | ||||||
| SS&C Technologies Holdings Europe Sarl, Sr. Sec. Credit Facilities 1st Lien Term Loan, Tranche B4, 4.689%, [LIBOR4+250], 4/16/251 | 156,511 | 156,708 | ||||||
| SS&C Technologies, Inc., Sr. Sec. Credit Facilities 1st Lien Term Loan, Tranche B1, 4.689%, [LIBOR4+250], 4/16/251 | 229,430 | 229,718 | ||||||
| Sungard AS New Holdings III LLC, Sr. Sec. Credit Facilities 1st Lien Term Loan, 2.50% PIK Rate, 6.388% Cash Rate 11/3/221,3 | 15,253 | 14,083 | ||||||
| Tempo Acquisition LLC, Sr. Sec. Credit Facilities 1st Lien Term Loan, Tranche B, 5.402%, [LIBOR12+300], 5/1/241 | 567,607 | 569,168 | ||||||
| TIBCO Software, Inc., Sec. Credit Facilities 1st Lien Term Loan, 6.39%, [LIBOR12+400], 6/30/261 | 50,000 | 50,156 | ||||||
| TTM Technologies, Inc., Sr. Sec. Credit Facilities 1st Lien Term Loan, 4.902%, [LIBOR4+250], 9/28/241 | 182,047 | 181,744 | ||||||
| Veritas US, Inc., Sr. Sec. Credit Facilities 1st Lien Term Loan, Tranche B1,6.83%-6.902%, [LIBOR4+450], 1/27/231 | 482,865 | 454,798 | ||||||
| Xperi Corp., Sr. Sec. Credit Facilities 1st Lien Term Loan, Tranche B, 4.902%, [LIBOR12+250], 12/1/231 | 224,131 | 222,031 | ||||||
|
| 7,708,374
|
| ||||||
| IT Services—0.6% | ||||||||
| Pi US Mergerco, Inc., Sr. Sec. Credit Facilities 1st Lien Term Loan, Tranche B, 5.652%, [LIBOR12+350], 1/3/251 | 484,148 | 482,937 | ||||||
| 482,937 | ||||||||
45 INVESCO OPPENHEIMER SENIOR FLOATING RATE PLUS FUND
SCHEDULE OF INVESTMENTSContinued
| Principal Amount | Value | |||||||
| Materials—9.5% | ||||||||
| Chemicals—3.3% | ||||||||
| Alpha 3 BV, Sr. Sec. Credit Facilities 1st Lien Term Loan, Tranche B1, 5.33%, [LIBOR4+300], 1/31/241 | $ | 457,075 | $ | 448,105 | ||||
| Consolidated Energy Finance SA, Sr. Sec. Credit Facilities 1st Lien Term Loan, Tranche B, 4.901%, [LIBOR12+250], 5/7/251,2 | 323,246 | 315,973 | ||||||
| Cyanco Intermediate Corp., Sr. Sec. Credit Facilities 1st Lien Term Loan, 5.902%, [LIBOR4+350], 3/16/251 | 135,378 | 136,055 | ||||||
| Hexicon, Inc., Sec. Credit Facilities 1st Lien Exit Term Loan, Tranche B, 5.82%, [LIBOR4+350], 7/1/261,2 | 65,000 | 65,000 | ||||||
| Momentive Performance Materials USA LLC, Sr. Sec. Credit Facilities 1st Lien Term Loan, Tranche B, 5.59%, [LIBOR4+325], 5/15/241 | 140,000 | 139,519 | ||||||
| New Arclin US Holding Corp., Sr. Sec. Credit Facilities 1st Lien Term Loan, 5.939%, [LIBOR4+350], 2/14/241 | 250,860 | 251,096 | ||||||
| OCI Partners LP, Sr. Sec. Credit Facilities 1st Lien Term Loan, Tranche B, 6.33%, [LIBOR4+425], 3/13/251,2 | 133,399 | 133,733 | ||||||
| Polar US Borrower LLC, Sr. Sec. Credit Facilities 1st Lien Term Loan,7.063%-7.351%, [LIBOR4+475], 10/15/251,2 | 64,463 | 63,254 | ||||||
| Starfruit US Holdco LLC, Sr. Sec. Credit Facilities 1st Lien Term Loan, Tranche B, 5.61%, [LIBOR12+325], 10/1/251 | 558,600 | 550,106 | ||||||
| Tronox Finance LLC, Sr. Sec. Credit Facilities 1st Lien Term Loan, Tranche B, 5.402%, [LIBOR4+300], 9/23/241 | 375,614 | 373,443 | ||||||
|
| 2,476,284
|
| ||||||
| Construction Materials—1.2% | ||||||||
| Pisces Midco, Inc., Sr. Sec. Credit Facilities 1st Lien Term Loan, Tranche B, 6.119%, [LIBOR4+375], 4/12/251 | 212,850 | 208,415 | ||||||
| Quikrete Holdings, Inc., Sr. Sec. Credit Facilities 1st Lien Term Loan, 5.152%, [LIBOR12+275], 11/15/231 | 598,342 | 594,561 | ||||||
| VC GB Holdings, Inc., Sr. Sec. Credit Facilities 1st Lien Term Loan, 5.402%, [LIBOR12+325], 2/28/241,2 | 92,552 | 91,395 | ||||||
|
| 894,371
|
| ||||||
| Containers & Packaging—2.6% | ||||||||
| Ball Metalpack Finco LLC, Sr. Sec. Credit Facilities 1st Lien Term Loan, Tranche B, 7.022%, [LIBOR12+450], 7/31/251 | 59,400 | 58,695 | ||||||
| Berry Global Inc., Sr. Sec. Credit Facilities 1st Lien Term Loan, 4.70%, [LIBOR12+250], 7/1/261 | 170,000 | 170,080 | ||||||
| BWAY Corp., Sr. Sec. Credit Facilities 1st Lien Term Loan, 5.59%, [LIBOR12+325], 4/3/241 | 617,085 | 608,409 | ||||||
| Clearwater Paper Corp., Sr. Sec. Credit Facilities 1st Lien Term Loan, Tranche B, 5.588%, [LIBOR4+325], 7/24/261,2 | 75,000 | 75,656 | ||||||
| Flex Acquisition Co., Inc., Sr. Sec. Credit Facilities 1st Lien Term Loan, 5.569%, [LIBOR4+325], 6/29/251 | 411,579 | 395,630 | ||||||
| Plastipak Holdings, Inc., Sr. Sec. Credit Facilities 1st Lien Term Loan, Tranche B, 4.91%, [LIBOR12+250], 10/14/241 | 217,369 | 217,233 | ||||||
| Pro Mach Group, Inc., Sr. Sec. Credit Facilities 1st Lien Term Loan, Tranche B, 5.144%, [LIBOR4+300], 3/7/251 | 77,917 | 76,083 | ||||||
46 INVESCO OPPENHEIMER SENIOR FLOATING RATE PLUS FUND
| Principal Amount | Value | |||||||
| Containers & Packaging (Continued) | ||||||||
| Reynolds Group Holdings, Inc., Sr. Sec. Credit Facilities 1st Lien Term Loan, 5.189%, [LIBOR12+300], 2/5/231 | $ | 351,479 | $ | 351,975 | ||||
|
| 1,953,761
|
| ||||||
| Metals & Mining—2.3% | ||||||||
| Covia Holdings Corp., Sr. Sec. Credit Facilities 1st Lien Term Loan, 6.313%, [LIBOR4+375], 6/1/251 | 107,752 | 92,127 | ||||||
Murray Energy Corp., Sr. Sec. Credit Facilities 1st Lien Term Loan: Tranche B2, 9.772%, [LIBOR4+725], 10/17/221 | 1,908,670 | 1,224,412 | ||||||
| Tranche B3, 10.272%, [LIBOR12+775], 10/17/221 | 483,999 | 309,760 | ||||||
| Peabody Energy Corp., Sr. Sec. Credit Facilities 1st Lien Term Loan, Tranche B, 5.152%, [LIBOR12+275], 3/31/251 | 107,283 | 107,166 | ||||||
|
| 1,733,465
|
| ||||||
| Paper & Forest Products—0.1% | ||||||||
| Thor Industries, Inc., Sr. Sec. Credit Facilities 1st Lien Term Loan, Tranche B, 6.188%, [LIBOR4+375], 2/1/261 |
| 102,205
|
|
| 101,183
|
| ||
| Telecommunication Services—5.5% | ||||||||
| Diversified Telecommunication Services—5.5% | ||||||||
| CenturyLink, Inc., Sr. Sec. Credit Facilities 1st Lien Term Loan, Tranche B, 5.152%, [LIBOR4+275], 1/31/251 | 1,201,618 | 1,195,688 | ||||||
| Cincinnati Bell, Inc., Sr. Sec. Credit Facilities 1st Lien Term Loan, Tranche B, 5.652%, [LIBOR12+325], 10/2/241 | 208,425 | 205,820 | ||||||
| Consolidated Communications, Inc., Sr. Sec. Credit Facilities 1st Lien Term Loan, Tranche B, 5.41%, [LIBOR12+300], 10/5/231 | 368,536 | 345,109 | ||||||
| Digicel International Finance Ltd, Sr. Sec. Credit Facilities 1st Lien Term Loan, Tranche B, 5.78%, [LIBOR4+325], 5/27/241 | 395,077 | 340,260 | ||||||
| Frontier Communications Corp., Sr. Sec. Credit Facilities 1st Lien Term Loan, Tranche B, 6.16%, [LIBOR12+375], 6/15/241 | 243,478 | 241,068 | ||||||
| Fusion Connect Inc., Sr. Sec. Credit Debtor in Possession Facilities 1st Lien Term Loan,12.36%-12.38%, [LIBOR12+1,000], 10/7/191,2 | 45,487 | 45,033 | ||||||
| Fusion Connect, Inc., Sr. Sec. Credit Facilities 1st Lien Term Loan, 11.836% PIK Rate, [LIBOR4+750], 5/4/231,2,3,4 | 374,024 | 252,466 | ||||||
| IPC Corp., Sr. Sec. Credit Facilities 1st Lien Term Loan, Tranche B, 7.09%, [LIBOR4+450], 8/6/211 | 222,747 | 192,860 | ||||||
| IPC Corp., Sr. Sec. Credit Facilities 2nd Lien Term Loan, 12.09%, [LIBOR4+950], 2/4/221 | 120,000 | 34,500 | ||||||
| NeuStar, Inc., Sr. Sec. Credit Facilities 1st Lien Term Loan, Tranche B4, 5.902%, [LIBOR12+350], 8/8/241 | 203,010 | 197,808 | ||||||
| Sprint Communications, Inc., Sr. Sec. Credit Facilities 1st Lien Term Loan, Tranche B, 5.00%, [LIBOR12+250], 2/2/241 | 886,291 | 885,516 | ||||||
| Windstream Services LLC, Sr. Sec. Credit Facilities Term Loan, Tranche B6, 10.50%, [PRIME4+500], 3/29/211,4 | 209,201 | 215,168 | ||||||
| 4,151,296 | ||||||||
47 INVESCO OPPENHEIMER SENIOR FLOATING RATE PLUS FUND
SCHEDULE OF INVESTMENTSContinued
| Principal Amount | Value | |||||||
| Utilities—2.0% | ||||||||
| Electric Utilities—2.0% | ||||||||
| Brookfield WEC Holdings, Inc., Sr. Sec. Credit Facilities 1st Lien Term Loan, 5.939%, [LIBOR4+375], 8/1/251 | $ | 134,150 | $ | 134,737 | ||||
| Calpine Construction Finance Co. LP, Sr. Sec. Credit Facilities 1st Lien Term Loan, 4.939%, [LIBOR12+250], 1/15/251 | 83,935 | 83,914 | ||||||
Calpine Corp., Sr. Sec. Credit Facilities 1st Lien Term Loan: Tranche B5, 4.83%, [LIBOR4+250], 1/15/241 | 174,559 | 174,962 | ||||||
| Tranche B7, 4.83%, [LIBOR4+250], 5/31/231 | 35,212 | 35,291 | ||||||
| Compass Power Generation LLC, Sr. Sec. Credit Facilities 1st Lien Term Loan, Tranche B, 5.902%, [LIBOR12+350], 12/20/241 | 47,475 | 47,784 | ||||||
| EFS Cogen Holdings I LLC, Sr. Sec. Credit Facilities 1st Lien Term Loan, Tranche B, 5.86%, [LIBOR4+325], 6/28/231 | 187,901 | 188,035 | ||||||
| Exgen Renewables IV LLC, Sr. Sec. Credit Facilities 1st Lien Term Loan, Tranche B, 5.53%, [LIBOR4+300], 11/28/241 | 28,100 | 27,245 | ||||||
| Frontera Generation Holdings LLC, Sr. Sec. Credit Facilities 1st Lien Term Loan, Tranche B, 6.662%, [LIBOR12+425], 5/2/251 | 272,386 | 266,429 | ||||||
| Kestrel Acquisition LLC., Sr. Sec. Credit Facilities 1st Lien Term Loan, Tranche B, 6.66%, [LIBOR12+425], 6/2/251 | 123,750 | 121,533 | ||||||
Lightstone Holdco LLC, Sr. Sec. Credit Facilities 1st Lien Term Loan: Tranche B, 6.189%, [LIBOR12+375], 1/30/241 | 245,101 | 241,902 | ||||||
| Tranche C, 6.189%, [LIBOR12+375], 1/30/241 | 17,295 | 17,069 | ||||||
| MRP Generation Holdings LLC, Sr. Sec. Credit Facilities 1st Lien Term Loan, Tranche B, 9.33%, [LIBOR4+700], 10/18/221,2 | 38,900 | 38,705 | ||||||
| Sandy Creek Energy Associates LP, Sr. Sec. Credit Facilities 1st Lien Term Loan, Tranche B, 6.601%, [LIBOR4+400], 11/9/201 | 141,971 | 128,560 | ||||||
| 1,506,166 | ||||||||
| Total Corporate Loans (Cost $77,852,251) |
| 74,780,095
|
| |||||
| Corporate Bonds and Notes—5.7% | ||||||||
| Diamond Sports Group LLC/Diamond Sports Finance Co., 5.375% Sr. Sec. Nts., 8/15/266 | 295,000 | 300,386 | ||||||
| iHeartCommunications, Inc., 8.375% Sr. Unsec. Nts., 5/1/27 | 225,739 | 238,719 | ||||||
| Peabody Energy Corp., 6.375% Sr. Sec. Nts., 3/31/256 | 910,000 | 939,575 | ||||||
| Revlon Consumer Products Corp., 5.75% Sr. Unsec. Nts., 2/15/21 | 400,000 | 374,000 | ||||||
| Tesla, Inc., 5.30% Sr. Unsec. Nts., 8/15/256 | 1,975,000 | 1,733,062 | ||||||
| Transocean Sentry Ltd., 5.375% Sr. Sec. Nts., 5/15/236 | 95,000 | 95,366 | ||||||
| Transocean, Inc., 7.25% Sr. Unsec. Nts., 11/1/256 | 500,000 | 471,875 | ||||||
| United States Steel Corp., 6.25% Sr. Unsec. Nts., 3/15/26 | 180,000 | 164,925 | ||||||
| Total Corporate Bonds and Notes (Cost $4,419,401) |
| 4,317,908
|
| |||||
| Shares | ||||||||
| Common Stocks—4.4% | ||||||||
| Arch Coal, Inc., Cl. A | 24,098 | 2,148,578 | ||||||
| Ascent Resources - Marcellus LLC, Cl. A7 | 34,124 | 87,016 | ||||||
| Avaya Holdings Corp.7 | 33,510 | 403,460 | ||||||
| Caesars Entertainment Corp.7 | 100 | 1,184 | ||||||
| Catalina Marketing Corp. (Pacifico, Inc.)2,7 | 1,583 | 8,311 | ||||||
| Clear Channel Outdoor Holdings, Inc., Cl. A7 | 63,867 | 193,517 | ||||||
48 INVESCO OPPENHEIMER SENIOR FLOATING RATE PLUS FUND
| Shares | Value | |||||||
| Common Stocks (Continued) | ||||||||
| Everyware Global, Inc.7 | 5,211 | $ | 6,383 | |||||
| Gymboree Corp. (The)2,8 | 3,550 | 2,662 | ||||||
| Gymboree Holding Corp.2,8 | 10,048 | 10 | ||||||
| Harvey Gulf International Marine LLC2,7 | 657 | 9,855 | ||||||
| iHeartMedia, Inc.2,7 | 2,010 | 29,272 | ||||||
| iHeartMedia, Inc., Cl. A7 | 27,160 | 406,314 | ||||||
| Larchmont Resources LLC2,7 | 78 | 19,560 | ||||||
| Millennium Corporate Claim Litigation Trust2,7 | 274 | — | ||||||
| Millennium Lender Claim Litigation Trust2,7 | 548 | — | ||||||
| New Millennium Holdco, Inc.2,7 | 5,562 | 353 | ||||||
| Quicksilver Resources, Inc.2,7 | 571,500 | — | ||||||
| Sabine Oil2 | 94 | 2,726 | ||||||
| Sunguard Equity2,7 | 225 | 6,188 | ||||||
| Templar Energy, Cl. A2,7 | 7,400 | 7,400 | ||||||
| Total Common Stocks (Cost $4,395,442) | 3,332,789 | |||||||
| Units | ||||||||
| Rights, Warrants and Certificates—0.0% | ||||||||
| Ascent Resources - Marcellus LLC Wts., Exp. 4/3/232,7 | 8,835 | 265 | ||||||
| Media General, Inc. Rts., Exp. 12/31/492,7,9 | 30,400 | 1,763 | ||||||
| Sabine Oil Tranche 1 Wts., Strike Price $4.49, Exp. 8/11/262,7 | 298 | 298 | ||||||
| Sabine Oil Tranche 2 Wts., Strike Price $2.72, Exp. 8/11/262,7 | 62 | 62 | ||||||
| Total Rights, Warrants and Certificates (Cost $40,764) | 2,388 | |||||||
| Shares | Value | |||||||
| Investment Company—0.4% | ||||||||
| Invesco Oppenheimer Institutional Government Money Market Fund, 2.23%10(Cost $310,587) | 310,587 | $ | 310,587 | |||||
| Total Investments, at Value (Cost $87,018,445) | 109.6% | 82,743,767 | ||||||
| Net Other Assets (Liabilities) | (9.6) | (7,264,609 | ) | |||||
| Net Assets | 100.0% | $ | 75,479,158 | |||||
Footnotes to Statement of Investments
* Variable rate senior loan interests often require prepayments from excess cash flow or permit the borrower to repay at its election. The degree to which borrowers repay, whether as a contractual requirement or at their election, cannot be predicted with accuracy. As a result, the actual remaining maturity may be substantially less than the stated maturities shown. However, it is anticipated that the variable rate senior loan interests will have an expected average life of three to five years.
1. Variable rate senior loan interests are, at present, not readily marketable, not registered under the Securities Act of 1933, as amended (the “1933 Act”), and may be subject to contractual and legal restrictions on sale. Variable rate senior loan interests in the Fund’s portfolio generally have variable rates which adjust to a base, such as the London Interbank Offered Rate (“LIBOR”), on set dates, typically every 30 days but not greater than one year; and/ or have interest rates that float at a margin above a widely recognized base lending rate such as the Prime Rate of a designated U.S. bank.
2. The value of this security was determined using significant unobservable inputs. See Note 3 of the accompanying Notes.
3. Interest or dividend ispaid-in-kind, when applicable.
4. This security is not accruing income because its issuer has missed or is expected to miss interest and/or principal payments. The rate shown is the contractual interest rate.
49 INVESCO OPPENHEIMER SENIOR FLOATING RATE PLUS FUND
SCHEDULE OF INVESTMENTSContinued
Footnotes to Statement of Investments (Continued)
5. All or a portion of this holding is subject to unfunded loan commitments. The stated interest rate reflects the weighted average of the reference rate and spread for the funded portion, if any, and the commitment fees on the portion of the loan that is unfunded. See Note 9.
6. Security purchased or received in a transaction exempt from registration under the Securities Act of 1933, as amended (the “1933 Act”). The security may be resold pursuant to an exemption from registration under the 1933 Act, typically to qualified institutional buyers. The aggregate value of these securities at July 31, 2019 was $3,540,264, which represented 4.69% of the Fund’s Net Assets.
7.Non-income producing security.
8. Is or was an affiliate, as defined in the Investment Company Act of 1940, as amended, at or during the reporting period, by virtue of the Fund owning at least 5% of the voting securities of the issuer or as a result of the Fund and the issuer having the same investment adviser. Transactions during the reporting period in which the issuer was an affiliate are as follows:
| Shares July 31, 2018 | Gross Additions | Gross Reductions | Shares July 31, 2019 | |||||||||||||
| Common Stocks | ||||||||||||||||
| Gymboree Corp. (The)a | 3,550 | — | — | 3,550 | ||||||||||||
| Gymboree Holding Corp.a | 10,048 | — | — | 10,048 | ||||||||||||
| Value | Income | Realized Gain (Loss) | Change in Unrealized Gain (Loss) | |||||||||||||
| Common Stocks | ||||||||||||||||
| Gymboree Corp. (The)a | $ | — | b | $ | 84 | $ | — | $ | (42,600 | ) | ||||||
| Gymboree Holding Corp.a | — | b | 237 | — | (128,102 | ) | ||||||||||
| Total | $ | — | $ | 321 | $ | — | $ | (170,702 | ) | |||||||
a. No longer an affiliate as of July 31, 2019.
b. The security is no longer an affiliate, therefore, the value has been excluded from the table.
9. Security received as the result of issuer reorganization.
10. The money market fund and the Fund are affiliated by having the same investment adviser. The rate shown is the7-day SEC standardized yield as of July 31, 2019.
Glossary:
| Definitions | ||
| LIBOR4 | London Interbank Offered Rate-Quarterly | |
| LIBOR6 | London Interbank OfferedRate-Bi-Monthly | |
| LIBOR12 | London Interbank Offered Rate-Monthly | |
| PRIME4 | United States Prime Rate-Quarterly | |
| PRIME12 | United States Prime Rate-Monthly |
See accompanying Notes to Financial Statements.
50 INVESCO OPPENHEIMER SENIOR FLOATING RATE PLUS FUND
STATEMENT OF ASSETS AND LIABILITIES
August 31, 2019
|
| July 31, 2019
| ||||||||
| Assets | ||||||||||
| Investments, at value—see accompanying schedule of investments: | ||||||||||
| Unaffiliated companies (cost $85,210,962 and $86,707,858) | $ | 79,651,688 | $ | 82,433,180 | ||||||
| Affiliated companies (cost $1,225,501 and $310,587) | 1,225,514 | 310,587 | ||||||||
| 80,877,202 | 82,743,767 | |||||||||
| Cash | 504,741 | 413,111 | ||||||||
| Receivables and other assets: | ||||||||||
| Investments sold | 842,624 | 2,745,859 | ||||||||
| Interest and dividends | 292,583 | 334,221 | ||||||||
| Shares of beneficial interest sold | 68,904 | 57,673 | ||||||||
| Other | 26,681 | 19,208 | ||||||||
| Total assets |
| 82,612,735
|
|
| 86,313,839
|
| ||||
| Liabilities | ||||||||||
| Payables and other liabilities: | ||||||||||
| Payable for borrowings | 8,250,000 | 7,250,000 | ||||||||
| Investments purchased | 1,503,407 | 3,147,917 | ||||||||
| Shares of beneficial interest redeemed | 139,410 | 210,118 | ||||||||
| Dividends | 32,603 | 32,536 | ||||||||
| Due to manager | 30,694 | — | ||||||||
| Interest expense on borrowings | 26,893 | 16,864 | ||||||||
| Transfer and shareholder servicing agent fees | 19,043 | 17,909 | ||||||||
| Distribution and service plan fees | 17,613 | 18,458 | ||||||||
| Trustees’ compensation | 15,740 | 14,444 | ||||||||
| Shareholder communications | 10,256 | 7,250 | ||||||||
| Advisory fees | 3,105 | 1,655 | ||||||||
| Administration fees | 56 | 2 | ||||||||
| Other | 166,763 | 117,528 | ||||||||
| Total liabilities |
| 10,215,583
|
|
| 10,834,681
|
| ||||
| Net Assets | $ | 72,397,152 | $ | 75,479,158 | ||||||
| Composition of Net Assets | ||||||||||
| Shares of beneficial interest | $ | 81,016,487 | $ | 82,597,620 | ||||||
| Total accumulated loss | (8,619,335 | ) | (7,118,462 | ) | ||||||
| Net Assets | $ | 72,397,152 | $ | 75,479,158 | ||||||
51 INVESCO OPPENHEIMER SENIOR FLOATING RATE PLUS FUND
STATEMENT OF ASSETS AND LIABILITIESContinued
August 31, 2019
| July 31, 2019
| |||||||
| Net Asset Value Per Share | ||||||||
| Class A Shares: | ||||||||
| Net asset value and redemption price per share (based on net assets and shares of beneficial interest outstanding of $33,819,489 and 3,830,074 at August 31, 2019 and $35,079,346 and 3,893,481 at July 31, 2019) | $8.83 | $9.01 | ||||||
| Maximum offering price per share (net asset value plus sales charge of 3.25% of offering price) | $9.13 | $9.31 | ||||||
| Class C Shares: | ||||||||
| Net asset value, redemption price (excludes applicable contingent deferred sales charge) and offering price per share (based on net assets and shares of beneficial interest outstanding of $12,054,491 and 1,365,542 at August 31, 2019 and $12,486,233 and 1,386,353 at July 31, 2019) | $8.83 | $9.01 | ||||||
| Class R Shares: | ||||||||
| Net asset value, redemption price and offering price per share (based on net assets and shares of beneficial interest outstanding of $9,704 and 1,099 at August 31, 2019 and $9,897 and 1,099 at July 31, 2019) | $8.83 | $9.01 | ||||||
| Class Y Shares: | ||||||||
| Net asset value, redemption price and offering price per share (based on net assets and shares of beneficial interest outstanding of $25,903,387 and 2,933,040 at August 31, 2019 and $27,285,130 and 3,027,270 at July 31, 2019) | $8.83 | $9.01 | ||||||
| Class R5 Shares: | ||||||||
| Net asset value, redemption price and offering price per share (based on net assets and shares of beneficial interest outstanding of $9,704 and 1,099 at August 31, 2019 and $9,897 and 1,099 at July 31, 2019) | $8.83 | $9.01 | ||||||
| Class R6 Shares: | ||||||||
| Net asset value, redemption price and offering price per share (based on net assets and shares of beneficial interest outstanding of $600,377 and 67,732 at August 31, 2019 and $608,655 and 67,300 at July 31, 2019) | $8.86 | $9.04 | ||||||
See accompanying Notes to Financial Statements.
52 INVESCO OPPENHEIMER SENIOR FLOATING RATE PLUS FUND
OPERATIONS
One Month Ended August 31, 2019 | Year Ended July 31, 2019 | |||||||
| Investment Income | ||||||||
| Interest | $ | 438,997 | $ | 5,824,722 | ||||
| Dividends: | ||||||||
| Unaffiliated companies | 10,844 | 41,140 | ||||||
| Affiliated companies | 1,472 | 16,128 | ||||||
| Other income affiliated companies | — | 321 | ||||||
| Other income | 1,509 | 17,800 | ||||||
| Total investment income | 452,822 | 5,900,111 | ||||||
| Expenses | ||||||||
| Advisory fees | 48,884 | 626,635 | ||||||
| Administration fees | 875 | 925 | ||||||
| Distribution and service plan fees: | ||||||||
| Class A | 7,287 | 76,166 | ||||||
| Class C | 10,322 | 150,804 | ||||||
| Class R | 4 | 9 | ||||||
| Transfer and shareholder servicing agent fees: | ||||||||
| Class A | 3,818 | 42,755 | ||||||
| Class C | 1,352 | 20,921 | ||||||
| Class R | 1 | 2 | ||||||
| Class Y | 2,909 | 44,028 | ||||||
| Class R5 | 1 | 2 | ||||||
| Class R6 | 26 | 207 | ||||||
| Shareholder communications: | ||||||||
| Class A | 1,411 | 12,175 | ||||||
| Class C | 498 | 6,719 | ||||||
| Class R | — | 1 | ||||||
| Class Y | 1,072 | 11,368 | ||||||
| Class R5 | 1 | 1 | ||||||
| Class R6 | 25 | 441 | ||||||
| Legal, auditing and other professional fees | 61,073 | 111,806 | ||||||
| Interest expense on borrowings | 27,172 | 634,467 | ||||||
| Custodian fees and expenses | 3,557 | 49,815 | ||||||
| Borrowing fees | 3,185 | 37,500 | ||||||
| Trustees’ compensation | 1,228 | 8,844 | ||||||
| Other | 2,840 | 14,035 | ||||||
| Total expenses | 177,541 | 1,849,626 | ||||||
| Less waivers and reimbursements of expenses | (75,237 | ) | (225,911 | ) | ||||
| Net expenses | 102,304 | 1,623,715 | ||||||
| Net Investment Income | 350,518 | 4,276,396 | ||||||
53 INVESCO OPPENHEIMER SENIOR FLOATING RATE PLUS FUND
STATEMENT OF OPERATIONSContinued
One Month Ended August 31, 2019 | Year Ended July 31, 2019 | |||||||
| Realized and Unrealized Gain (Loss) | ||||||||
| Net realized gain (loss) on investment transactions in unaffiliated companies (includes net gains (losses) from securities sold to affiliates of $0 and $(33,198), respectively) | $ | (191,621 | ) | $ | (135,570 | ) | ||
| Net change in unrealized appreciation/(depreciation) on investment transactions in: | ||||||||
| Investment transactions in: | ||||||||
Unaffiliated companies | (1,284,596 | ) | (3,245,585 | ) | ||||
Affiliated companies | 13 | (170,702 | ) | |||||
|
|
| ||||||
| Net change in unrealized appreciation/(depreciation) | (1,284,583 | ) | (3,416,287 | ) | ||||
| Net Increase (Decrease) in Net Assets Resulting from Operations | $ | (1,125,686) | $ | 724,539 | ||||
|
|
| ||||||
See accompanying Notes to Financial Statements.
54 INVESCO OPPENHEIMER SENIOR FLOATING RATE PLUS FUND
STATEMENT OF CHANGES IN NET ASSETS
One Month Ended August 31, 2019 | Year Ended July 31, 2019 | Year Ended July 31, 2018 | ||||||||||
| Operations | ||||||||||||
| Net investment income | $ | 350,518 | $ | 4,276,396 | $ | 3,499,480 | ||||||
| Net realized gain (loss) | (191,621 | ) | (135,570 | ) | (214,452 | ) | ||||||
| Net change in unrealized appreciation/(depreciation) | (1,284,583 | ) | (3,416,287 | ) | (636,503 | ) | ||||||
| Net increase (decrease) in net assets resulting from operations | (1,125,686 | ) | 724,539 | 2,648,525 | ||||||||
| Dividends and/or Distributions to Shareholders1 | ||||||||||||
| Distributions to shareholders from distributable earnings: | ||||||||||||
| Class A | (175,738 | ) | (1,703,212 | ) | (1,353,270 | ) | ||||||
| Class C | (51,801 | ) | (699,123 | ) | (550,276 | ) | ||||||
| Class R | (44 | ) | (95 | ) | — | |||||||
| Class Y | (144,386 | ) | (1,828,572 | ) | (1,208,557 | ) | ||||||
| Class R5 | (48 | ) | (104 | ) | — | |||||||
| Class R6 | (3,170 | ) | (35,466 | ) | (25,428 | ) | ||||||
| Total distributions from distributable earnings | (375,187 | ) | (4,266,572 | ) | (3,137,531 | ) | ||||||
| Beneficial Interest Transactions | ||||||||||||
| Net increase (decrease) in net assets resulting from beneficial interest transactions: | ||||||||||||
| Class A | (558,323 | ) | 6,745,519 | 1,021,202 | ||||||||
| Class C | (184,709 | ) | (1,779,194 | ) | 82,173 | |||||||
| Class R | — | 10,000 | — | |||||||||
| Class Y | (841,937 | ) | 62,127 | 3,188,797 | ||||||||
| Class R5 | — | 10,000 | — | |||||||||
| Class R6 | 3,836 | (30,160 | ) | 280,778 | ||||||||
| Total beneficial interest transactions | (1,581,133 | ) | 5,018,292 | 4,572,950 | ||||||||
| Net Assets | ||||||||||||
| Total increase (decrease) | (3,082,006 | ) | 1,476,259 | 4,083,944 | ||||||||
| Beginning of period | 75,479,158 | 74,002,899 | 69,918,955 | |||||||||
| End of period | $ | 72,397,152 | $ | 75,479,158 | $ | 74,002,899 | ||||||
1. The Securities Exchange Commission eliminated the requirement to disclose the distribution components separately, except for tax return of capital. For the year ended July 31, 2018, distributions to shareholders from distributable earnings consisted of distributions from net investment income.
See accompanying Notes to Financial Statements.
55 INVESCO OPPENHEIMER SENIOR FLOATING RATE PLUS FUND
CASH FLOWS
One Month Ended August 31, 2019 | Year Ended July 31, 2019 | |||||||
| Cash Flows from Operating Activities | ||||||||
| Net increase/decrease in net assets from operations | $ | (1,125,686 | ) | $ | 724,539 | |||
| Adjustments to reconcile net change in net assets from operations to net cash provided by operating activities: | ||||||||
Purchase of investment securities | (909,364 | ) | (41,306,282 | ) | ||||
Proceeds from disposition of investment securities | 2,287,216 | 48,429,588 | ||||||
Short-term investment securities, net | (48,579 | ) | (249,337 | ) | ||||
Premium amortization | 2,395 | 30,350 | ||||||
Discount accretion | (26,380 | ) | (248,650 | ) | ||||
Net realized loss on investment transactions | 191,621 | 135,570 | ||||||
Net change in unrealized appreciation/depreciation on investment transactions | 1,284,583 | 3,416,287 | ||||||
| Change in assets: | ||||||||
Decrease/Increase in other assets | (7,473 | ) | 35,810 | |||||
Decrease/Increase in interest receivable | 41,638 | (18,312 | ) | |||||
Decrease/Increase in receivable for securities sold | 1,903,235 | (184,693 | ) | |||||
| Change in liabilities: | ||||||||
Increase in other liabilities | 96,053 | 57,198 | ||||||
Decrease in payable for securities purchased | (1,644,510 | ) | (2,890,434 | ) | ||||
|
|
| ||||||
| Net cash provided by operating activities | 2,044,749 | 7,931,634 | ||||||
| Cash Flows from Financing Activities | ||||||||
| Proceeds from borrowings | 1,000,000 | 20,750,000 | ||||||
| Payments on borrowings | — | (30,000,000 | ) | |||||
| Proceeds from shares sold | 1,670,771 | 41,591,142 | ||||||
| Payments on shares redeemed | (3,675,216 | ) | (40,161,103 | ) | ||||
| Cash distributions paid | (33,747 | ) | (340,443 | ) | ||||
|
|
| ||||||
| Net cash used in financing activities | (1,038,192 | ) | (8,160,404 | ) | ||||
| Net increase in cash | 1,006,557 | (228,770 | ) | |||||
| Cash and cash equivalents, beginning balance | 723,698 | 952,468 | ||||||
|
|
| ||||||
| Cash and cash equivalents, ending balance | $ | 1,730,255 | $ | 723,698 | ||||
|
|
| ||||||
Supplemental disclosure of cash flow information:
Noncash financing activities not included herein consist of reinvestment of dividends and distributions of $341,373 and 3,914,613.
Cash paid for interest on borrowings—$17,143 and $670,436.
See accompanying Notes to Financial Statements.
56 INVESCO OPPENHEIMER SENIOR FLOATING RATE PLUS FUND
| Class A | One Month Ended August 31, 2019 | Year Ended July 31, 2019 | Year Ended July 31, 2018 | Year Ended July 31, 2017 | Year Ended July 31, 2016 | Year Ended July 31, 2015 | ||||||||||||||||||
| Per Share Operating Data | ||||||||||||||||||||||||
| Net asset value, beginning of period | $9.01 | $9.39 | $9.46 | $9.13 | $9.58 | $10.09 | ||||||||||||||||||
| Income (loss) from investment operations: | ||||||||||||||||||||||||
| Net investment income1 | 0.04 | 0.51 | 0.47 | 0.45 | 0.49 | 0.52 | ||||||||||||||||||
| Net realized and unrealized gain (loss) | (0.17) | (0.39) | (0.12) | 0.30 | (0.44) | (0.47) | ||||||||||||||||||
| Total from investment operations | (0.13) | 0.12 | 0.35 | 0.75 | 0.05 | 0.05 | ||||||||||||||||||
| Dividends and/or distributions to shareholders: | ||||||||||||||||||||||||
| Dividends from net investment income | (0.05) | (0.50) | (0.42) | (0.42) | (0.50) | (0.52) | ||||||||||||||||||
| Distributions from net realized gain | 0.00 | 0.00 | 0.00 | 0.00 | 0.00 | (0.04) | ||||||||||||||||||
| Total dividends and/or distributions to shareholders | (0.05) | (0.50) | (0.42) | (0.42) | (0.50) | (0.56) | ||||||||||||||||||
| Net asset value, end of period | $8.83 | $9.01 | $9.39 | $9.46 | $9.13 | $9.58 | ||||||||||||||||||
| Total Return, at Net Asset Value2 | (1.49)% | 1.39% | 3.84% | 8.35% | 0.77% | 0.49% | ||||||||||||||||||
| Ratios/Supplemental Data | ||||||||||||||||||||||||
| Net assets, end of period (in thousands) | $33,819 | $35,079 | $29,757 | $28,945 | $18,042 | $28,356 | ||||||||||||||||||
| Average net assets (in thousands) | $34,335 | $30,950 | $30,028 | $29,187 | $20,543 | $32,625 | ||||||||||||||||||
| Ratios to average net assets:3 | ||||||||||||||||||||||||
| Net investment income | 5.69% | 5.52% | 5.02% | 4.82% | 5.38% | 5.31% | ||||||||||||||||||
| Expenses excluding specific expenses listed below | 2.33% | 1.45% | 1.45% | 1.54% | 1.57% | 1.50% | ||||||||||||||||||
| Interest and fees from borrowings | 0.49% | 0.86% | 0.45% | 0.31% | 0.48% | 0.80% | ||||||||||||||||||
| Total expenses4 | 2.82% | 2.31% | 1.90% | 1.85% | 2.05% | 2.30% | ||||||||||||||||||
| Expenses after payments, waivers and/or reimbursements and reduction to custodian expenses | 1.59% | 2.00% | 1.74% | 1.61% | 1.78% | 2.10% | ||||||||||||||||||
| Portfolio turnover rate5 | 1% | 44% | 77% | 84% | 69% | 68% | ||||||||||||||||||
57 INVESCO OPPENHEIMER SENIOR FLOATING RATE PLUS FUND
FINANCIAL HIGHLIGHTSContinued
1. Per share amounts calculated based on the average shares outstanding during the period.
2. Assumes an initial investment on the business day before the first day of the fiscal period, with all dividends and distributions reinvested in additional shares on the reinvestment date, and redemption at the net asset value calculated on the last business day of the fiscal period. Sales charges are not reflected in the total returns. Total returns are not annualized for periods less than one full year. Returns do not reflect the deduction of taxes that a shareholder would pay on fund distributions or the redemption of fund shares.
3. Annualized for periods less than one full year.
4. Total expenses including indirect expenses from affiliated fund fees and expenses were as follows:
One Month Ended August 31, 2019 | 2.82 | % | ||||
Year Ended July 31, 2019 | 2.31 | % | ||||
Year Ended July 31, 2018 | 1.90 | % | ||||
Year Ended July 31, 2017 | 1.85 | % | ||||
Year Ended July 31, 2016 | 2.05 | % | ||||
Year Ended July 31, 2015 | 2.30 | % | ||||
5. Portfolio turnover is calculated at the fund level and is not annualized for periods less than one year, if applicable.
See accompanying Notes to Financial Statements.
58 INVESCO OPPENHEIMER SENIOR FLOATING RATE PLUS FUND
| Class C | One Month Ended August 31, 2019 | Year Ended July 31, 2019 | Year Ended July 31, 2018 | Year Ended July 31, 2017 | Year Ended July 31, 2016 | Year Ended July 31, 2015 | ||||||||||||||||||
| Per Share Operating Data | ||||||||||||||||||||||||
| Net asset value, beginning of period | $9.01 | $9.39 | $9.45 | $9.13 | $9.57 | $10.09 | ||||||||||||||||||
| Income (loss) from investment operations: | ||||||||||||||||||||||||
| Net investment income1 | 0.04 | 0.43 | 0.40 | 0.38 | 0.41 | 0.44 | ||||||||||||||||||
| Net realized and unrealized gain (loss) | (0.18) | (0.39) | (0.11) | 0.29 | (0.42) | (0.48) | ||||||||||||||||||
| Total from investment operations | (0.14) | 0.04 | 0.29 | 0.67 | (0.01) | (0.04) | ||||||||||||||||||
| Dividends and/or distributions to shareholders: | ||||||||||||||||||||||||
| Dividends from net investment income | (0.04) | (0.42) | (0.35) | (0.35) | (0.43) | (0.44) | ||||||||||||||||||
| Distributions from net realized gain | 0.00 | 0.00 | 0.00 | 0.00 | 0.00 | (0.04) | ||||||||||||||||||
| Total dividends and/or distributions to shareholders | (0.04) | (0.42) | (0.35) | (0.35) | (0.43) | (0.48) | ||||||||||||||||||
| Net asset value, end of period | $8.83 | $9.01 | $9.39 | $9.45 | $9.13 | $9.57 | ||||||||||||||||||
| Total Return, at Net Asset Value2 | (1.58)% | 0.51% | 3.12% | 7.50% | (0.03)% | (0.42)% | ||||||||||||||||||
| Ratios/Supplemental Data | ||||||||||||||||||||||||
| Net assets, end of period (in thousands) | $12,054 | $12,486 | $14,889 | $14,909 | $11,401 | $11,473 | ||||||||||||||||||
| Average net assets (in thousands) | $12,153 | $15,100 | $14,808 | $13,786 | $11,049 | $8,305 | ||||||||||||||||||
| Ratios to average net assets:3 | ||||||||||||||||||||||||
| Net investment income | 4.79% | 4.64% | 4.22% | 4.05% | 4.60% | 4.48% | ||||||||||||||||||
| Expenses excluding specific expenses listed below | 3.08% | 2.21% | 2.21% | 2.31% | 2.33% | 2.37% | ||||||||||||||||||
| Interest and fees from borrowings | 0.49% | 0.86% | 0.45% | 0.31% | 0.48% | 0.80% | ||||||||||||||||||
| Total expenses4 | 3.57% | 3.07% | 2.66% | 2.62% | 2.81% | 3.17% | ||||||||||||||||||
| Expenses after payments, waivers and/or reimbursements and reduction to custodian expenses | 2.49% | 2.88% | 2.53% | 2.41% | 2.56% | 2.90% | ||||||||||||||||||
| Portfolio turnover rate5 | 1% | 44% | 77% | 84% | 69% | 68% | ||||||||||||||||||
59 INVESCO OPPENHEIMER SENIOR FLOATING RATE PLUS FUND
FINANCIAL HIGHLIGHTSContinued
1. Per share amounts calculated based on the average shares outstanding during the period.
2. Assumes an initial investment on the business day before the first day of the fiscal period, with all dividends and distributions reinvested in additional shares on the reinvestment date, and redemption at the net asset value calculated on the last business day of the fiscal period. Sales charges are not reflected in the total returns. Total returns are not annualized for periods less than one full year. Returns do not reflect the deduction of taxes that a shareholder would pay on fund distributions or the redemption of fund shares.
3. Annualized for periods less than one full year.
4. Total expenses including indirect expenses from affiliated fund fees and expenses were as follows:
One Month Ended August 31, 2019 | 3.57 | % | ||||
Year Ended July 31, 2019 | 3.07 | % | ||||
Year Ended July 31, 2018 | 2.66 | % | ||||
Year Ended July 31, 2017 | 2.62 | % | ||||
Year Ended July 31, 2016 | 2.81 | % | ||||
Year Ended July 31, 2015 | 3.17 | % | ||||
5. Portfolio turnover is calculated at the fund level and is not annualized for periods less than one year, if applicable.
See accompanying Notes to Financial Statements.
60 INVESCO OPPENHEIMER SENIOR FLOATING RATE PLUS FUND
One Month Ended August 31, 2019 | Period Ended July 31, 20191 | |||||||
| Class R | ||||||||
| Per Share Operating Data | ||||||||
Net asset value, beginning of period | $9.01 | $9.10 | ||||||
Income (loss) from investment operations: | ||||||||
Net investment income2 | 0.04 | 0.09 | ||||||
Net realized and unrealized gain (loss) | (0.18 | ) | (0.09 | ) | ||||
Total from investment operations | (0.14 | ) | 0.00 | |||||
Dividends and/or distributions to shareholders: | ||||||||
Dividends from net investment income | (0.04 | ) | (0.09 | ) | ||||
Dividends from net investment income | 0.00 | 0.00 | ||||||
Total dividends and/or distributions to shareholders | (0.04 | ) | (0.09 | ) | ||||
Net asset value, end of period | $8.83 | $9.01 | ||||||
| Total Return, at Net Asset Value3 | (1.55)% | (0.03)% | ||||||
| Ratios/Supplemental Data | ||||||||
Net assets, end of period (in thousands) | $10 | $10 | ||||||
Average net assets (in thousands) | $10 | $10 | ||||||
Ratios to average net assets:4 | ||||||||
Net investment income | 5.45% | 5.49% | ||||||
Expenses excluding specific expenses listed below | 2.60% | 1.68% | ||||||
Interest and fees from borrowings | 0.49% | 0.86% | ||||||
Total expenses5 | 3.09% | 2.54% | ||||||
Expenses after payments, waivers and/or reimbursements and reduction to custodian expenses | 1.84% | 2.03% | ||||||
Portfolio turnover rate6 | 1% | 44% | ||||||
1. For the period from after the close of business on May 24, 2019 (inception of offering) to July 31, 2019.
2. Per share amounts calculated based on the average shares outstanding during the period.
3. Assumes an initial investment on the business day before the first day of the fiscal period, with all dividends and distributions reinvested in additional shares on the reinvestment date, and redemption at the net asset value calculated on the last business day of the fiscal period. Sales charges are not reflected in the total returns. Total returns are not annualized for periods less than one full year. Returns do not reflect the deduction of taxes that a shareholder would pay on fund distributions or the redemption of fund shares.
4. Annualized for periods less than one full year.
5. Total expenses including indirect expenses from affiliated fund fees and expenses were as follows:
One Month Ended August 31, 2019 | 3.09 | % | ||||
Period Ended July 31, 2019 | 2.54 | % | ||||
6. Portfolio turnover is calculated at the fund level and is not annualized for periods less than one year, if applicable.
See accompanying Notes to Financial Statements.
61 INVESCO OPPENHEIMER SENIOR FLOATING RATE PLUS FUND
FINANCIAL HIGHLIGHTSContinued
| Class Y | One Month Ended August 31, 2019 | Year Ended July 31, 2019 | Year Ended July 31, 2018 | Year Ended July 31, 2017 | Year Ended July 31, 2016 | Year Ended July 31, 2015 | ||||||||||||||||||
| Per Share Operating Data | ||||||||||||||||||||||||
Net asset value, beginning of period | $9.01 | $9.40 | $9.46 | $9.13 | $9.58 | $10.09 | ||||||||||||||||||
Income (loss) from investment operations: | ||||||||||||||||||||||||
Net investment income1 | 0.04 | 0.53 | 0.50 | 0.48 | 0.51 | 0.53 | ||||||||||||||||||
Net realized and unrealized gain (loss) | (0.17 | ) | (0.39 | ) | (0.11 | ) | 0.30 | (0.43 | ) | (0.46 | ) | |||||||||||||
Total from investment operations | (0.13 | ) | 0.14 | 0.39 | 0.78 | 0.08 | 0.07 | |||||||||||||||||
Dividends and/or distributions to shareholders: | ||||||||||||||||||||||||
Dividends from net investment income | (0.05 | ) | (0.53 | ) | (0.45 | ) | (0.45 | ) | (0.53 | ) | (0.54 | ) | ||||||||||||
Distributions from net realized gain | 0.00 | 0.00 | 0.00 | 0.00 | 0.00 | (0.04 | ) | |||||||||||||||||
Total dividends and/or distributions to shareholders | (0.05 | ) | (0.53 | ) | (0.45 | ) | (0.45 | ) | (0.53 | ) | (0.58 | ) | ||||||||||||
Net asset value, end of period | $8.83 | $9.01 | $9.40 | $9.46 | $9.13 | $9.58 | ||||||||||||||||||
| Total Return, at Net Asset Value2 | (1.46)% | 1.54% | 4.21% | 8.62% | 1.02% | 0.76% | ||||||||||||||||||
| Ratios/Supplemental Data | ||||||||||||||||||||||||
Net assets, end of period (in thousands) | $25,903 | $27,285 | $28,691 | $25,676 | $11,222 | $11,605 | ||||||||||||||||||
Average net assets (in thousands) | $26,152 | $31,801 | $25,358 | $20,176 | $9,530 | $6,307 | ||||||||||||||||||
Ratios to average net assets:3 | ||||||||||||||||||||||||
Net investment income | 5.94% | 5.76% | 5.27% | 5.06% | 5.65% | 5.50% | ||||||||||||||||||
Expenses excluding specific expenses listed below | 2.08% | 1.21% | 1.21% | 1.28% | 1.29% | 1.22% | ||||||||||||||||||
Interest and fees from borrowings | 0.49% | 0.86% | 0.45% | 0.31% | 0.48% | 0.80% | ||||||||||||||||||
Total expenses4 | 2.57% | 2.07% | 1.66% | 1.59% | 1.77% | 2.02% | ||||||||||||||||||
Expenses after payments, waivers and/or reimbursements and reduction to custodian expenses | 1.34% | 1.76% | 1.48% | 1.36% | 1.51% | 1.80% | ||||||||||||||||||
Portfolio turnover rate5 | 1% | 44% | 77% | 84% | 69% | 68% | ||||||||||||||||||
62 INVESCO OPPENHEIMER SENIOR FLOATING RATE PLUS FUND
1. Per share amounts calculated based on the average shares outstanding during the period.
2. Assumes an initial investment on the business day before the first day of the fiscal period, with all dividends and distributions reinvested in additional shares on the reinvestment date, and redemption at the net asset value calculated on the last business day of the fiscal period. Sales charges are not reflected in the total returns. Total returns are not annualized for periods less than one full year. Returns do not reflect the deduction of taxes that a shareholder would pay on fund distributions or the redemption of fund shares.
3. Annualized for periods less than one full year.
4. Total expenses including indirect expenses from affiliated fund fees and expenses were as follows:
One Month Ended August 31, 2019 | 2.57 | % | ||||
Year Ended July 31, 2019 | 2.07 | % | ||||
Year Ended July 31, 2018 | 1.66 | % | ||||
Year Ended July 31, 2017 | 1.59 | % | ||||
Year Ended July 31, 2016 | 1.77 | % | ||||
Year Ended July 31, 2015 | 2.02 | % | ||||
5. Portfolio turnover is calculated at the fund level and is not annualized for periods less than one year, if applicable.
See accompanying Notes to Financial Statements.
63 INVESCO OPPENHEIMER SENIOR FLOATING RATE PLUS FUND
FINANCIAL HIGHLIGHTSContinued
| Class R5 | One Month Ended August 31, 2019 | Period Ended | ||||
| Per Share Operating Data | ||||||
Net asset value, beginning of period | $9.01 | $9.10 | ||||
Income (loss) from investment operations: | ||||||
Net investment income2 | 0.04 | 0.10 | ||||
Net realized and unrealized gain (loss) | (0.18) | (0.10) | ||||
Total from investment operations | (0.14) | 0.00 | ||||
Dividends and/or distributions to shareholders: | ||||||
Dividends from net investment income | (0.04) | (0.09) | ||||
Dividends from net investment income | 0.00 | 0.00 | ||||
Total dividends and/or distributions to shareholders | (0.04) | (0.09) | ||||
Net asset value, end of period | $8.83 | $9.01 | ||||
| Total Return, at Net Asset Value3 | (1.51)% | 0.05% | ||||
| Ratios/Supplemental Data | ||||||
Net assets, end of period (in thousands) | $10 | $10 | ||||
Average net assets (in thousands) | $10 | $10 | ||||
Ratios to average net assets:4 | ||||||
Net investment income | 5.92% | 5.90% | ||||
Expenses excluding specific expenses listed below | 2.07% | 1.19% | ||||
Interest and fees from borrowings | 0.49% | 0.86% | ||||
Total expenses5 | 2.56% | 2.05% | ||||
Expenses after payments, waivers and/or reimbursements and reduction to custodian expenses | 1.37% | 1.62% | ||||
Portfolio turnover rate6 | 1% | 44% | ||||
1. For the period from after the close of business on May 24, 2019 (inception of offering) to July 31, 2019.
2. Per share amounts calculated based on the average shares outstanding during the period.
3. Assumes an initial investment on the business day before the first day of the fiscal period, with all dividends and distributions reinvested in additional shares on the reinvestment date, and redemption at the net asset value calculated on the last business day of the fiscal period. Sales charges are not reflected in the total returns. Total returns are not annualized for periods less than one full year. Returns do not reflect the deduction of taxes that a shareholder would pay on fund distributions or the redemption of fund shares.
4. Annualized for periods less than one full year.
5. Total expenses including indirect expenses from affiliated fund fees and expenses were as follows:
One Month Ended August 31, 2019 | 2.56 | % | ||||
Period Ended July 31, 2019 | 2.05 | % | ||||
6. Portfolio turnover is calculated at the fund level and is not annualized for periods less than one year, if applicable.
See accompanying Notes to Financial Statements.
64 INVESCO OPPENHEIMER SENIOR FLOATING RATE PLUS FUND
| Class R6 | One Month Ended August 31, 2019 | Year Ended July 31, 2019 | Year Ended July 31, 2018 | Year Ended July 31, 2017 | Year Ended July 31, 2016 | Year Ended July 31, 2015 | ||||||
| Per Share Operating Data | ||||||||||||
Net asset value, beginning of period | $9.04 | $9.43 | $9.49 | $9.14 | $9.58 | $10.09 | ||||||
Income (loss) from investment operations: | ||||||||||||
Net investment income1 | 0.05 | 0.53 | 0.51 | 0.48 | 0.53 | 0.54 | ||||||
Net realized and unrealized gain (loss) | (0.18) | (0.39) | (0.11) | 0.32 | (0.44) | (0.45) | ||||||
Total from investment operations | (0.13) | 0.14 | 0.40 | 0.80 | 0.09 | 0.09 | ||||||
| Dividends and/or distributions to shareholders: | ||||||||||||
Dividends from net investment income | (0.05) | (0.53) | (0.46) | (0.45) | (0.53) | (0.56) | ||||||
Distributions from net realized gain | 0.00 | 0.00 | 0.00 | 0.00 | 0.00 | (0.04) | ||||||
Total dividends and/or distributions to shareholders | (0.05) | (0.53) | (0.46) | (0.45) | (0.53) | (0.60) | ||||||
Net asset value, end of period | $8.86 | $9.04 | $9.43 | $9.49 | $9.14 | $9.58 | ||||||
| Total Return, at Net Asset Value2 | (1.47)% | 1.59% | 4.31% | 8.95% | 1.23% | 0.88% | ||||||
| Ratios/Supplemental Data | ||||||||||||
Net assets, end of period (in thousands) | $600 | $609 | $666 | $389 | $12 | $31 | ||||||
Average net assets (in thousands) | $600 | $614 | $525 | $680 | $12 | $13 | ||||||
Ratios to average net assets:3 | ||||||||||||
Net investment income | 5.97% | 5.80% | 5.38% | 5.07% | 5.77% | 5.63% | ||||||
Expenses excluding specific expenses listed below | 2.00% | 1.14% | 1.10% | 1.07% | 1.08% | 0.91% | ||||||
Interest and fees from borrowings | 0.49% | 0.86% | 0.45% | 0.31% | 0.48% | 0.80% | ||||||
Total expenses4 | 2.49% | 2.00% | 1.55% | 1.38% | 1.56% | 1.71% | ||||||
Expenses after payments, waivers and/or reimbursements and reduction to custodian expenses | 1.32% | 1.72% | 1.38% | 1.26% | 1.40% | 1.58% | ||||||
Portfolio turnover rate5 | 1% | 44% | 77% | 84% | 69% | 68% |
65 INVESCO OPPENHEIMER SENIOR FLOATING RATE PLUS FUND
FINANCIAL HIGHLIGHTSContinued
1. Per share amounts calculated based on the average shares outstanding during the period.
2. Assumes an initial investment on the business day before the first day of the fiscal period, with all dividends and distributions reinvested in additional shares on the reinvestment date, and redemption at the net asset value calculated on the last business day of the fiscal period. Sales charges are not reflected in the total returns. Total returns are not annualized for periods less than one full year. Returns do not reflect the deduction of taxes that a shareholder would pay on fund distributions or the redemption of fund shares.
3. Annualized for periods less than one full year.
4. Total expenses including indirect expenses from affiliated fund fees and expenses were as follows:
One Month Ended August 31, 2019 | 2.49% | |||
Year Ended July 31, 2019 | 2.00% | |||
Year Ended July 31, 2018 | 1.55% | |||
Year Ended July 31, 2017 | 1.38% | |||
Year Ended July 31, 2016 | 1.56% | |||
Year Ended July 31, 2015 | 1.71% |
5. Portfolio turnover is calculated at the fund level and is not annualized for periods less than one year, if applicable.
See accompanying Notes to Financial Statements.
66 INVESCO OPPENHEIMER SENIOR FLOATING RATE PLUS FUND
NOTES TO FINANCIAL STATEMENTSAugust 31, 2019 and July 31, 2019
Note 1 - Significant Accounting Policies
Invesco Oppenheimer Senior Floating Rate Plus Fund (the “Fund”) is a series portfolio of AIM Counselor Series Trust (Invesco Counselor Series Trust) (the “Trust”). The Trust is a Delaware statutory trust registered under the Investment Company Act of 1940, as amended (the “1940 Act”), as anopen-end series management investment company authorized to issue an unlimited number of shares of beneficial interest. Information presented in these financial statements pertains only to the Fund. Matters affecting the Fund or each class will be voted on exclusively by the shareholders of such Fund or each class.
Prior to the close of business on May 24, 2019, the Fund operated as Oppenheimer Senior Floating Rate Plus Fund(the “Acquired Fund” or “Predecessor Fund”). The Acquired Fund was reorganized after the close of business on May 24, 2019 (the “Reorganization Date”) through the transfer of all of its assets and liabilities to the Fund (the “Reorganization”).
Upon closing of the Reorganization, holders of the Acquired Fund’s Class A, Class C and Class Y shares received the corresponding class of shares of the Fund and holders of the Acquired Fund’s Class I shares received Class R6 shares of the Fund. Information for the Acquired Fund’s Class I shares prior to the Reorganization is included with Class R6 shares throughout this report. Class R and Class R5 shares commenced operations on the Reorganization Date.
Effective August 31, 2019, the Fund changed fiscal year end from July 31 to August 31.
The Fund’s investment objective is to seekincome.
The Fund currently consists of six different classes of shares: Class A, Class C, Class R, Class Y, Class R5 and Class R6. Class Y shares are available only to certain investors. Class A shares are sold with afront-end sales charge unless certain waiver criteria are met and under certain circumstances load waived shares may be subject to contingent deferred sales charges (“CDSC”). Class C shares are sold with a CDSC. Class R, Class Y, Class R5 and Class R6 shares are sold at net asset value.
The Fund is an investment company and accordingly follows the investment company accounting and reporting guidance in accordance with Financial Accounting Standards Board Accounting Standards Codification Topic 946, Financial Services – Investment Companies.
The following is a summary of the significant accounting policies followed by the Fund in the preparation of its financial statements.
A. Security Valuations - Securities, including restricted securities, are valued according to the following policy.
Debt obligations (including convertible securities) and unlisted equities are fair valued using an evaluated quote provided by an independent pricing service. Evaluated quotes provided by the pricing service may be determined without exclusive reliance on quoted prices, and may reflect appropriate factors such asinstitution-size trading in similar groups of securities, developments related to specific securities, dividend rate (for unlisted equities), yield (for debt obligations), quality, type of issue, coupon rate (for debt obligations), maturity (for debt obligations), individual trading characteristics and other market data. Pricing services generally value debt obligations assuming orderly transactions of institutional round lot size, but a fund may hold or transact in the same securities in smaller, odd lot
67 INVESCO OPPENHEIMER SENIOR FLOATING RATE PLUS FUND
NOTES TO FINANCIAL STATEMENTSContinued
sizes. Odd lots often trade at lower prices than institutional round lots. Debt obligations are subject to interest rate and credit risks. In addition, all debt obligations involve some risk of default with respect to interest and/or principal payments.
A security listed or traded on an exchange (except convertible securities) is valued at its last sales price or official closing price as of the close of the customary trading session on the exchange where the security is principally traded, or lacking any sales or official closing price on a particular day, the security may be valued at the closing bid price on that day. Securities traded in theover-the-counter market are valued based on prices furnished by independent pricing services or market makers. When such securities are valued by an independent pricing service they may be considered fair valued. Futures contracts are valued at the final settlement price set by an exchange on which they are principally traded. Listed options are valued at the mean between the last bid and asked prices from the exchange on which they are principally traded. Options not listed on an exchange are valued by an independent source at the mean between the last bid and asked prices. For purposes of determining net asset value (“NAV”) per share, futures and option contracts generally are valued 15 minutes after the close of the customary trading session of the New York Stock Exchange (“NYSE”).
Investments inopen-end andclosed-end registered investment companies that do not trade on an exchange are valued at theend-of-day net asset value per share. Investments inopen-end andclosed-end registered investment companies that trade on an exchange are valued at the last sales price or official closing price as of the close of the customary trading session on the exchange where the security is principally traded.
Swap agreements are fair valued using an evaluated quote, if available, provided by an independent pricing service. Evaluated quotes provided by the pricing service are valued based on a model which may includeend-of-day net present values, spreads, ratings, industry, company performance and returns of referenced assets. Centrally cleared swap agreements are valued at the daily settlement price determined by the relevant exchange or clearinghouse.
Foreign securities’ (including foreign exchange contracts) prices are converted into U.S. dollar amounts using the applicable exchange rates as of the close of the NYSE. If market quotations are available and reliable for foreign exchange-traded equity securities, the securities will be valued at the market quotations. Because trading hours for certain foreign securities end before the close of the NYSE, closing market quotations may become unreliable. If between the time trading ends on a particular security and the close of the customary trading session on the NYSE, events occur that the investment adviser determines are significant and make the closing price unreliable, the Fund may fair value the security. If the event is likely to have affected the closing price of the security, the security will be valued at fair value in good faith using procedures approved by the Board of Trustees. Adjustments to closing prices to reflect fair value may also be based on a screening process of an independent pricing service to indicate the degree of certainty, based on historical data, that the closing price in the principal market where a foreign security trades is not the current value as of the close of the NYSE. Foreign securities’ prices meeting the approved degree of certainty that the price is not reflective of current value
68 INVESCO OPPENHEIMER SENIOR FLOATING RATE PLUS FUND
will be priced at the indication of fair value from the independent pricing service. Multiple factors may be considered by the independent pricing service in determining adjustments to reflect fair value and may include information relating to sector indices, American Depositary Receipts and domestic and foreign index futures. Foreign securities may have additional risks including exchange rate changes, potential for sharply devalued currencies and high inflation, political and economic upheaval, the relative lack of issuer information, relatively low market liquidity and the potential lack of strict financial and accounting controls and standards.
Securities for which market prices are not provided by any of the above methods may be valued based upon quotes furnished by independent sources. The last bid price may be used to value equity securities. The mean between the last bid and asked prices is used to value debt obligations, including corporate loans.
Securities for which market quotations are not readily available or became unreliable are valued at fair value as determined in good faith by or under the supervision of the Trust’s officers following procedures approved by the Board of Trustees. Issuer specific events, market trends, bid/asked quotes of brokers and information providers and other market data may be reviewed in the course of making a good faith determination of a security’s fair value.
The Fund may invest in securities that are subject to interest rate risk, meaning the risk that the prices will generally fall as interest rates rise and, conversely, the prices will generally rise as interest rates fall. Specific securities differ in their sensitivity to changes in interest rates depending on their individual characteristics. Changes in interest rates may result in increased market volatility, which may affect the value and/or liquidity of certain Fund investments.
Valuations change in response to many factors including the historical and prospective earnings of the issuer, the value of the issuer’s assets, general economic conditions, interest rates, investor perceptions and market liquidity. Because of the inherent uncertainties of valuation, the values reflected in the financial statements may materially differ from the value received upon actual sale of those investments.
| B. | Securities Transactions and Investment Income -Securities transactions are accounted for on a trade date basis. Realized gains or losses on sales are computed on the basis of specific identification of the securities sold. Interest income (net of withholding tax, if any) is recorded on the accrual basis from settlement date. Bond premiums and discounts are amortized and/or accreted over the lives of the respective securities.Pay-in-kind interest income andnon-cash dividend income received in the form of securitiesin-lieu of cash are recorded at the fair value of the securities received. Paydown gains and losses on mortgage and asset-backed securities are recorded as adjustments to interest income. Dividend income (net of withholding tax, if any) is recorded on theex-dividend date. |
The Fund may periodically participate in litigation related to Fund investments. As such, the Fund may receive proceeds from litigation settlements. Any proceeds received are included in the Statement of Operations as realized gain (loss) for investments no longer held and as unrealized gain (loss) for investments still held.
Brokerage commissions and mark ups are considered transaction costs and are recorded
69 INVESCO OPPENHEIMER SENIOR FLOATING RATE PLUS FUND
NOTES TO FINANCIAL STATEMENTSContinued
as an increase to the cost basis of securities purchased and/or a reduction of proceeds on a sale of securities. Such transaction costs are included in the determination of net realized and unrealized gain (loss) from investment transactions reported in the Statement of Operations and the Statement of Changes in Net Assets and the net realized and unrealized gains (losses) on securities per share in the Financial Highlights. Transaction costs are included in the calculation of the Fund’s net asset value and, accordingly, they reduce the Fund’s total returns. These transaction costs are not considered operating expenses and are not reflected in net investment income reported in the Statement of Operations and the Statement of Changes in Net Assets, or the net investment income per share and the ratios of expenses and net investment income reported in the Financial Highlights, nor are they limited by any expense limitation arrangements between the Fund and the investment adviser.
The Fund allocates income and realized and unrealized capital gains and losses to a class based on the relative net assets of each class. The Fund allocates income to a class based on the relative value of the settled shares of each class.
| C. | Country Determination- For the purposes of making investment selection decisions and presentation in the Schedule of Investments, the investment adviser may determine the country in which an issuer is located and/or credit risk exposure based on various factors. These factors include the laws of the country under which the issuer is organized, where the issuer maintains a principal office, the country in which the issuer derives 50% or more of its total revenues and the country that has the primary market for the issuer’s securities, as well as other criteria. Among the other criteria that may be evaluated for making this determination are the country in which the issuer maintains 50% or more of its assets, the type of security, financial guarantees and enhancements, the nature of the collateral and the sponsor organization. Country of issuer and/or credit risk exposure has been determined to be the United States of America, unless otherwise noted. |
| D. | Distributions -Dividends and distributions to shareholders, which are determined in accordance with income tax regulations and may differ from accounting principals generally accepted in the United States of America (“GAAP”), are recorded on theex-dividend date. Income distributions, if any, are declared daily and paid monthly. Capital gain distributions, if any, are declared and paid annually or at other times as determined necessary by the Adviser. |
| E. | Federal Income Taxes -The Fund intends to comply with provisions of the Internal Revenue Code applicable to regulated investment companies and to distribute substantially all of its investment company taxable income, including any net realized gain on investments not offset by capital loss carryforwards, if any, to shareholders. Therefore, no federal income or excise tax provision is required. The Fund files income tax returns in U.S. federal and applicable state jurisdictions. The statute of limitations on the Fund’s tax return filings generally remains open for the three preceding fiscal reporting period ends. The Fund has analyzed its tax positions for the one month ended August 31, 2019 and the fiscal year ended July 31, 2019, including open tax years, and does not believe there are any uncertain tax positions requiring recognition in the Fund’s financial statements. |
70 INVESCO OPPENHEIMER SENIOR FLOATING RATE PLUS FUND
The tax components of capital shown in the following table for the one month ended August 31, 2019 represent distribution requirements the Fund must satisfy under the income tax regulations, losses the Fund may be able to offset against income and gains realized in future years and unrealized appreciation or depreciation of securities and other investments for federal income tax purposes.
Undistributed Net Investment Income | Undistributed Long-Term Gain | Accumulated Loss Carryforward1,2,3 | Net Unrealized Depreciation Based on cost of Securities and Other Investments for Federal Income Tax Purposes | |||||||||
| $68,070 | $— | $3,064,941 | $5,578,652 | |||||||||
1.At period end, the Fund had $3,064,941 of net capital loss carryforward available to offset future realized capital gains, if any, and thereby reduce future taxable gain distributions.
2. During the reporting period, the Fund did not utilize any capital loss carryforward.
3.During the previous reporting period ended July 31, 2019, the Fund did not utilize any capital loss carryforward.
The tax components of capital shown in the following table for the fiscal year ended July
31, 2019 represent distribution requirements the Fund must satisfy under the income tax regulations, losses the Fund may be able to offset against income and gains realized in future years and unrealized appreciation or depreciation of securities and other investments for federal income tax purposes.
Undistributed Net Investment Income | Undistributed Long-Term Gain | Accumulated Loss Carryforward1,2,3 | Net Unrealized Depreciation Based on cost of Securities and Other Investments for Federal Income Tax Purposes | |||||||||
| $52,831 | $— | $2,839,300 | $4,319,007 | |||||||||
1.At period end, the Fund had $2,839,300 of net capital loss carryforward available to offset future realized capital gains, if any, and thereby reduce future taxable gain distributions.
2. During the reporting period, the Fund did not utilize any capital loss carryforward.
3.During the previous reporting period, the Fund utilized $125,990 of capital loss carryforward to offset capital gains realized in that fiscal year.
Net investment income (loss) and net realized gain (loss) may differ for financial statement and tax purposes. The character of dividends and distributions made during the fiscal year from net investment income or net realized gains are determined in accordance with federal income tax requirements, which may differ from the character of net investment income or net realized gains presented in those financial statements in accordance with U.S. GAAP. Also, due to timing of dividends and distributions, the fiscal year in which amounts are distributed may differ from the fiscal year in which the income or net realized gain was recorded by the Fund.
71 INVESCO OPPENHEIMER SENIOR FLOATING RATE PLUS FUND
NOTES TO FINANCIAL STATEMENTSContinued
The tax character of distributions paid during the reporting periods:
| One Month Ended August 31, 2019 | Year Ended July 31, 2019 | Year Ended July 31, 2018 | ||||||||||
| Distributions paid from: | ||||||||||||
| Ordinary income | $ | 375,187 | $ | 4,266,572 | $ | 3,137,531 | ||||||
The aggregate cost of securities and other investments and the composition of unrealized appreciation and depreciation of securities and other investments for federal income tax purposes at period end are noted in the following table. The primary difference between book and tax appreciation or depreciation of securities and other investments, if applicable, is attributable to the tax deferral of losses or tax realization of financial statement unrealized gain or loss.
One Month Ended August 31, 2019 | Year Ended July 31, 2019 | |||||||
|
| |||||||
| Federal tax cost of securities | $ | 86,455,854 | $ | 87,062,774 | ||||
|
| |||||||
| Gross unrealized appreciation | $ | 484,077 | $ | 874,154 | ||||
| Gross unrealized depreciation | (6,062,729) | (5,193,161) | ||||||
|
| |||||||
| Net unrealized depreciation | $ | (5,578,652) | $ | (4,319,007) | ||||
|
| |||||||
| F. | Expenses -Fees provided for under the Rule12b-1 plan of a particular class of the Fund are charged to the operations of such class. Transfer agency fees and expenses and other shareholder recordkeeping fees and expenses attributable to Class R5 and Class R6 are allocated to each share class based on relative net assets.Sub-accounting fees attributable to Class R5 are charged to the operations of the class. Transfer agency fees and expenses and other shareholder recordkeeping fees and expenses relating to all other classes are allocated among those classes based on relative net assets. All other expenses are allocated among the classes based on relative net assets. |
| G. | Accounting Estimates -The financial statements are prepared on a basis in conformity with GAAP, which requires management to make estimates and assumptions that affect the reported amounts of assets and liabilities at the date of the financial statements and the reported amounts of revenues and expenses during the reporting period including estimates and assumptions related to taxation. Actual results could differ from those estimates by a significant amount. In addition, the Fund monitors for material events or transactions that may occur or become known after theperiod-end date and before the date the financial statements are released to print. |
| H. | Indemnifications -Under the Trust’s organizational documents, each Trustee, officer, employee or other agent of the Trust is indemnified against certain liabilities that may arise out of the performance of their duties to the Fund. Additionally, in the normal course of business, the Fund enters into contracts, including the Fund’s servicing agreements, that contain a variety of indemnification clauses. The Fund’s maximum exposure under these arrangements is unknown as this would involve future claims that may be made against the Fund that have not yet occurred. The risk of material loss as a result of such indemnification claims is considered remote. |
72 INVESCO OPPENHEIMER SENIOR FLOATING RATE PLUS FUND
| I. | Cash and Cash Equivalents -For the purposes of the Statement of Cash Flows, the Fund defines Cash and Cash Equivalents as cash (including foreign currency), money market funds and other investments held in lieu of cash and excludes investments made with cash collateral received. |
| J. | Securities on a When-Issued or Delayed Delivery Basis -The Fund may purchase securities on a “when-issued” basis, and may purchase or sell securities on a “delayed delivery” basis, with payment and delivery scheduled for a future date. No income accrues to the Fund on the securities in connection with such transactions prior to the date the Fund actually takes delivery of the securities. These transactions are subject to market fluctuations and are subject to the risk that the value at delivery may be more or less than the trade date purchase price. Although the Fund will generally purchase these securities with the intention on acquiring such securities, they may sell such securities prior to the settlement date. |
| K. | Industry Focus -To the extent that the Fund invests a greater amount of its assets in securities of issuers in the banking and financial services industries, the Fund’s performance will depend to a greater extent on the overall condition of those industries. The value of these securities can be sensitive to changes in government regulation, interest rates and economic downturns in the U.S. and abroad. |
| L. | Bank Loan Risk -Although the resale, or secondary market for floating rate loans has grown substantially over the past decade, both in overall size and number of market participants, there is no organized exchange or board of trade on which floating rate loans are traded. Instead, the secondary market for floating rate loans is a private, unregulated interdealer or interbank resale market. Such a market may therefore be subject to irregular trading activity, wide bid/ask spreads, and extended trade settlement periods, which may impair the Fund’s ability to sell bank loans within its desired time frame or at an acceptable price and its ability to accurately value existing and prospective investments. Extended trade settlement periods may result in cash not being immediately available to the Fund. As a result, the Fund may have to sell other investments or engage in borrowing transactions to raise cash to meet its obligations. Similar to other asset classes, bank loan funds may be exposed to counterparty credit risk, or the risk than an entity with which the Fund has unsettled or open transactions may fail to or be unable to perform on its commitments. The Fund seeks to manage counterparty credit risk by entering into transactions only with counterparties that it believes have the financial resources to honor their obligations and by monitoring the financial stability of those counterparties. |
| M. | Other Risks- The Fund may invest all or substantially all of its assets in senior secured floating rate loans and senior secured debt securities that are determined to be rated below investment grade. These securities are generally considered to have speculative characteristics and are subject to greater risk of loss of principal and interest than higher rated securities. The value of lower quality debt securities and floating rate loans can be more volatile due to increased sensitivity to adverse issuer, political, regulatory, market or economic developments. |
The Fund invests in corporate loans from U.S. ornon-U.S. companies (the “Borrowers”). The investment of the Fund in a corporate loan may take the form of
73 INVESCO OPPENHEIMER SENIOR FLOATING RATE PLUS FUND
NOTES TO FINANCIAL STATEMENTSContinued
participation interests or assignments. If the Fund purchases a participation interest from a syndicate of lenders (“Lenders”) or one of the participants in the syndicate (“Participant”), one or more of which administers the loan on behalf of all the Lenders (the “Agent Bank”), the Fund would be required to rely on the Lender that sold the participation interest not only for the enforcement of the Fund’s rights against the Borrower but also for the receipt and processing of payments due to the Fund under the corporate loans. As such, the Fund is subject to the credit risk of the Borrower and the Participant. Lenders and Participants interposed between the Fund and a Borrower, together with Agent Banks, are referred to as “Intermediate Participants”.
| N. | Leverage Risk- The Fund may utilize leverage to seek to enhance the yield of the Fund by borrowing. There are risks associated with borrowing in an effort to increase the yield and distributions on the shares, including that the costs of the financial leverage may exceed the income from investments made with such leverage, the higher volatility of the net asset value of the shares, and that fluctuations in the interest rates on the borrowing may affect the yield and distributions to the shareholders. There can be no assurance that the Fund’s leverage strategy will be successful. |
Note 2 - Advisory Fees and Other Fees Paid to Affiliates
The Trust has entered into a master investment advisory agreement with Invesco Advisers, Inc. (the “Adviser” or “Invesco”). Under the terms of the investment advisory agreement, the Fund accrues daily and pays monthly an advisory fee to the Adviser based on the annual rate of the Fund’s average daily net assets as follows:
| Fee Schedule* | ||||
| Up to $200 million | 0.80 | % | ||
| Next $200 million | 0.77 | |||
| Next $200 million | 0.74 | |||
| Next $200 million | 0.71 | |||
| Next $4.2 billion | 0.65 | |||
| Over $5 billion | 0.63 | |||
*The advisory fee paid by the Fund shall be reduced by any amounts paid by the Fund under the administrative services agreement with the Adviser.
For the one month ended August 31, 2019, the effective annualized advisory fees incurred by the funds was 0.79% and for the year ended July 31, 2019, the effective annualized advisory fees incurred by the Fund was 0.80%.
From the period September 1, 2018 until the date of the Reorganization, the Acquired Fund paid $509,891in advisory fees to OFI Global Asset Management, Inc. based on the annual rates above of the Acquired Fund’s average daily net assets.
Under the terms of a mastersub-advisory agreement between the Adviser and each of Invesco Asset Management Deutschland GmbH, Invesco Asset Management Limited, Invesco Asset Management (Japan) Limited, Invesco Hong Kong Limited, Invesco Senior Secured Management, Inc. and Invesco Canada Ltd. and separatesub-advisory agreements with Invesco Capital Management LLC, and Invesco Asset Management (India) Private Limited
74 INVESCO OPPENHEIMER SENIOR FLOATING RATE PLUS FUND
(collectively, the “AffiliatedSub-Advisers”) the Adviser, not the Fund, will pay 40% of the fees paid to the Adviser to any such AffiliatedSub-Adviser(s) that provide(s) discretionary investment management services to the Fund based on the percentage of assets allocated to suchSub-Adviser(s). Invesco has also entered into aSub-Advisory Agreement with OppenheimerFunds, Inc. to provide discretionary management services to the Funds.
Effective on the Reorganization Date, the Adviser has contractually agreed, through at least May 31, 2021, to waive advisory fees and/or reimburse expenses of all shares to the extent necessary to limit the total annual fund operating expenses after fee waiver and/or expense reimbursement (excluding certain items discussed below) ofClass A, Class C, Class R, Class Y, Class R5 and Class R6 shares to 1.10%, 2.00%, 1.35%, 0.85%, 0.88% and 0.83%, respectively, of the Fund’s average daily net assets (the “expense limits”). In determining the Adviser’s obligation to waive advisory fees and/or reimburse expenses, the following expenses are not taken into account, and could cause total annual fund operating expenses after fee waivers and/or expense reimbursement to exceed the numbers reflected above: (1) interest; (2) taxes; (3) dividend expenses on short sales; (4) extraordinary ornon-routine items, including litigation expenses; and (5) expenses that the Fund has incurred but did not actually pay because of an expense offset arrangement. Unless Invesco continues the fee waiver agreement, it will terminate May 31, 2021. During its term, the fee waiver agreement cannot be terminated or amended to increase the expense limits or reduce the advisory fee waiver without approval of the Board of Trustees.
Further, the Adviser has contractually agreed, through at least June 30, 2021, to waive the advisory fee payable by the Fund in an amount equal to 100% of the net advisory fees the Adviser receives from the affiliated money market funds on investments by the Fund of uninvested cash in such affiliated money market funds.
For the one month ended August 31, 2019, the Adviser waived advisory fees of $73 and reimbursed fund expenses of $35,907, $11,185, $10, $27,451, $11, $600 for Class A, Class C, Class R, Class Y, Class R5 and Class R6 respectively.
For the yearended July 31, 2019, the Adviser waived advisory fees of $709 and reimbursed fund expenses of $96,841, $28,602, $9, $98,050, $8, $1,692 for Class A, Class C, Class R, Class Y, Class R5 and Class R6 respectively.
Prior to the Reorganization, the OFI Global Asset Management, Inc. had contractually agreed to waive fees and/or reimburse expenses of Class A, Class C, Class Y, and Class R6 shares to 1.10%, 2.00%, 0.85% and 0.83%, respectively, of the Acquired Fund’s average daily net assets. Prior to October 29, 2018, the limit was 1.30% for Class A shares, 2.10% for Class C shares, 1.05% for Class Y shares and 0.95% for Class I shares.
The Trust has entered into a master administrative services agreement with Invesco pursuant to which the Fund has agreed to pay Invesco for certain administrative costs incurred in providing accounting services to the Fund. For the one month ended August 31, 2019 and the year ended July 31, 2019, expenses incurred under the agreement are shown in the Statement of Operations as Administration fees. Additionally, Invesco has entered into service agreements whereby Deutsche Bank Trust Company Americas (the Custodian) serves as custodian to the Fund. Prior to the Reorganization, the Acquired Fund paid administrative fees to OFI Global Asset Management, Inc.
75 INVESCO OPPENHEIMER SENIOR FLOATING RATE PLUS FUND
NOTES TO FINANCIAL STATEMENTSContinued
The Trust has entered into a transfer agency and service agreement with Invesco Investment Services, Inc. (“IIS”) pursuant to which the Fund has agreed to pay IIS a fee for providing transfer agency and shareholder services to the Fund and reimburse IIS for certain expenses incurred by IIS in the course of providing such services. IIS may make payments to intermediaries that provide omnibus account services,sub-accounting services and/or networking services. All fees payable by IIS to intermediaries that provide omnibus account services orsub-accounting services are charged back to the Fund, subject to certain limitations approved by the Trust’s Board of Trustees. Prior to the Reorganization, the Acquired Fund paid transfer agent fees to OFI Global Asset Management, Inc. and Shareholder Services, Inc. For the one month ended August 31, 2019 and the yearended July 31, 2019, expenses incurred under these agreements are shown in the Statement of Operations as Transfer and shareholder servicing agent fees.
The Trust has entered into master distribution agreements with Invesco Distributors, Inc. (“IDI”) to serve as the distributor for theClass A, Class C, Class R, Class Y, Class R5 and Class R6 shares of the Fund. The Trust has adopted plans pursuant to Rule12b-1 under the 1940 Act with respect to the Fund’s Class A, Class C and Class R shares(collectively the “Plan”). The Fund, pursuant to the Class A Plan, reimbursed IDI in an amount up to an annual rate of 0.25% of the average daily net assets of Class A shares. The Fund pursuant to the Class C and Class R Plan, pays IDI compensation at the annual rate of 1.00% of the average daily net assets of Class C and 0.50% of the average daily net assets of Class R shares. The fees are accrued daily and paid monthly. Of the Plan payments, up to 0.25% of the average daily net assets of each class of shares may be paid to furnish continuing personal shareholder services to customers who purchase and own shares of such classes. Any amounts not paid as a service fee under the Plan would constitute an asset-based sales charge. Rules of the Financial Industry Regulatory Authority (“FINRA”) impose a cap on the total sales charges, including asset-based sales charges, that may be paid by any class of shares of the Fund plans. Prior to the Reorganization, the Acquired Fund paid distribution fees to OppenheimerFunds Distributor, Inc. For the one month ended August 31, 2019 and the yearended July 31, 2019, expenses incurred under the plans are shown in the Statement of Operations as Distribution and service plan fees.
Front-end sales commissions and CDSC (collectively, the “sales charges”) are not recorded as expenses of the Fund.Front-end sales commissions are deducted from proceeds from the sales of Fund shares prior to investment in Class A shares of the Fund. CDSC are deducted from redemption proceeds prior to remittance to the shareholder. During theone month ended August 31, 2019, IDI advised the Fund that IDI retained $260 infront-end sales commissions from the sale of Class A shares and $684 from Class C shares for CDSC imposed on redemptions by shareholders. During theyear ended July 31, 2019, IDI advised the Fund that IDI retained $1,162 infront-end sales commissions from the sale of Class A shares $200 from Class C shares for CDSC imposed on redemptions by shareholders. From the period September 1, 2018 to the date of the Reorganization, OppenheimerFunds Distributor, Inc. retained $10,325 in front–end sales commissions from the sale of Class A shares and $113 and $1,322 from Class A and Class C shares, respectively, for CDSC imposed on redemption by shareholders.
76 INVESCO OPPENHEIMER SENIOR FLOATING RATE PLUS FUND
Certain officers and trustees of the Trust are officers and directors of the Adviser, IIS and/or IDI.
Note 3 - Additional Valuation Information
GAAP defines fair value as the price that would be received to sell an asset or paid to transfer a liability in an orderly transaction between market participants at the measurement date, under current market conditions. GAAP establishes a hierarchy that prioritizes the inputs to valuation methods, giving the highest priority to readily available unadjusted quoted prices in an active market for identical assets (Level 1) and the lowest priority to significant unobservable inputs (Level 3), generally when market prices are not readily available or are unreliable. Based on the valuation inputs, the securities or other investments are tiered into one of three levels. Changes in valuation methods may result in transfers in or out of an investment’s assigned level:
Level 1 — Prices are determined using quoted prices in an active market for identical assets.
Level 2 — Prices are determined using other significant observable inputs. Observable inputs are inputs that other market participants may use in pricing a security. These may include quoted prices for similar securities, interest rates, prepayment speeds, credit risk, yield curves, loss severities, default rates, discount rates, volatilities and others.
Level 3 — Prices are determined using significant unobservable inputs. In situations where quoted prices or observable inputs are unavailable (for example, when there is little or no market activity for an investment at the end of the period), unobservable inputs may be used. Unobservable inputs reflect the Fund’s own assumptions about the factors market participants would use in determining fair value of the securities or instruments and would be based on the best available information.
The level assigned to the securities valuations may not be an indication of the risk or liquidity associated with investing in those securities. Because of the inherent uncertainties of valuation, the values reflected in the financial statements may materially differ from the value received upon actual sale of those investments.
The following is a summary of the tiered valuation input levels, as of August 31, 2019:
| Level 1— Unadjusted Quoted Prices | Level 2— Other Significant | Level 3— Significant Unobservable Inputs | Value | |||||||||||||
| Assets Table | ||||||||||||||||
| Investments, at Value: | ||||||||||||||||
| Corporate Loans | $ | — | $ | 68,740,096 | $ | 3,808,987 | $ | 72,549,083 | ||||||||
| Corporate Bonds and Notes | — | 4,004,178 | — | 4,004,178 | ||||||||||||
| Common Stocks | 2,860,117 | 131,506 | 100,872 | 3,092,495 | ||||||||||||
| Rights, Warrants and Certificates | — | — | 5,932 | 5,932 | ||||||||||||
| Investment Company | 1,225,514 | — | — | 1,225,514 | ||||||||||||
|
| |||||||||||||||
| Total Assets | $ | 4,085,631 | $ | 72,875,780 | $ | 3,915,791 | $ | 80,877,202 | ||||||||
|
| |||||||||||||||
77 INVESCO OPPENHEIMER SENIOR FLOATING RATE PLUS FUND
NOTES TO FINANCIAL STATEMENTSContinued
The following is a summary of the tiered valuation input levels, as of July 31, 2019:
| Level 1— Unadjusted Quoted Prices | Level 2— Other Significant Observable Inputs | Level 3— Significant Unobservable Inputs | Value | |||||||||||||
| Assets Table | ||||||||||||||||
| Investments, at Value: | ||||||||||||||||
| Corporate Loans | $ | — | $ | 71,847,166 | $ | 2,932,929 | $ | 74,780,095 | ||||||||
| Corporate Bonds and Notes | — | 4,317,908 | — | 4,317,908 | ||||||||||||
| Common Stocks | 3,153,053 | 93,399 | 86,337 | 3,332,789 | ||||||||||||
| Rights, Warrants and Certificates | — | — | 2,388 | 2,388 | ||||||||||||
| Investment Company | 310,587 | — | — | 310,587 | ||||||||||||
|
| |||||||||||||||
| Total Assets | $ | 3,463,640 | $ | 76,258,473 | $ | 3,021,654 | $ | 82,743,767 | ||||||||
|
| |||||||||||||||
The following is a reconciliation of assets in which significant unobservable inputs (level 3) were used in determining fair value for the one month reporting period ended August 31, 2019:
Value as of July 31, 2019 | Realized gain (loss) | Change in unrealized appreciation/ depreciation | Accretion/ (amortization) of premium/ discounta | |||||||||||||
| Assets Table | ||||||||||||||||
| Investments, at Value: | ||||||||||||||||
| Corporate Loans | $ | 2,932,929 | $ | (675 | ) | $ | (38,671 | ) | $ | 75 | ||||||
| Common Stocks | 86,337 | — | (12,315 | ) | — | |||||||||||
| Rights, Warrants and Certificates | 2,388 | — | 3,544 | — | ||||||||||||
|
| |||||||||||||||
| Total Assets | $ | 3,021,654 | $ | (675 | ) | $ | (47,442 | ) | $ | 75 | ||||||
|
| |||||||||||||||
a.Included in net investment income.
| Value as of | ||||||||||||||||||||||||||||
| Transfers into Transfers out of | August 31, | |||||||||||||||||||||||||||
| Purchases | Sales | Level 3 | Level 3 | 2019 | ||||||||||||||||||||||||
| Assets Table | ||||||||||||||||||||||||||||
| Investments, at Value: | ||||||||||||||||||||||||||||
| Corporate Loans | $ | 266,200 | $ | (19,225 | ) | $ | 1,233,391 | $ | (565,037 | ) | $ | 3,808,987 | ||||||||||||||||
| Common Stocks | 59,006 | — | 6,383 | (38,539 | ) | 100,872 | ||||||||||||||||||||||
| Rights, Warrants and Certificates | — | — | — | — | 5,932 | |||||||||||||||||||||||
|
| |||||||||||||||||||||||||||
| Total Assets | $ | 325,206 | $ | (19,225 | ) | $ | 1,239,774 | $ | (603,576 | ) | $ | 3,915,791 | ||||||||||||||||
|
| |||||||||||||||||||||||||||
The following is a reconciliation of assets in which significant unobservable inputs (level 3) were used in determining fair value for the year ended July 31, 2019:
78 INVESCO OPPENHEIMER SENIOR FLOATING RATE PLUS FUND
| Value as of July 31, 2018 | Realized gain (loss) | Change in unrealized appreciation/ depreciation | Accretion/ (amortization) of premium/ | |||||||||||||||||
| Assets Table | ||||||||||||||||||||
| Investments, at Value: | ||||||||||||||||||||
| Corporate Loans | $ | 1,400,059 | $ | (212 | ) | $ | (133,866 | ) | $ | 7,356 | ||||||||||
| Common Stocks | 44,868 | 1,399 | (246,737 | ) | — | |||||||||||||||
| Rights, Warrants and Certificates | 4,052 | — | (1,929 | ) | — | |||||||||||||||
|
| |||||||||||||||||||
| Total Assets | $ | 1,448,979 | $ | 1,187 | $ | (382,532 | ) | $ | 7,356 | |||||||||||
|
| |||||||||||||||||||
| a.Included in net investment income. | ||||||||||||||||||||
| Transfers into | Transfers out of | Value as of | ||||||||||||||||||
| Purchases | Sales | Level 3 | Level 3 | July 31, 2019 | ||||||||||||||||
| Assets Table | ||||||||||||||||||||
| Investments, at Value: | ||||||||||||||||||||
| Corporate Loans | $ | 1,005,196 | $ | (558,926 | ) | $ | 1,213,322 | $ | — | $ | 2,932,929 | |||||||||
| Common Stocks | 86,076 | (3,194 | ) | 203,925 | — | 86,337 | ||||||||||||||
| Rights, Warrants and Certificates | — | — | 265 | — | 2,388 | |||||||||||||||
|
| |||||||||||||||||||
| Total Assets | $ | 1,091,272 | $ | (562,120 | ) | $ | 1,417,512 | $ | — | $ | 3,021,654 | |||||||||
|
| |||||||||||||||||||
The total change in unrealized appreciation/depreciation included in the Statement of Operations attributable to Level 3 investments still held for the one month reporting period at August 31, 2019:
| Change in unrealized appreciation/ depreciation | ||||
| Assets Table | ||||
| Investments, at Value | ||||
| Corporate Loans | $ | (38,671 | ) | |
| Common Stocks | (12,315 | ) | ||
| Rights, Warrants and Certificates | 3,544 | |||
|
| |||
| Total | $ | (47,442 | ) | |
|
| |||
The total change in unrealized appreciation/depreciation included in the Statement of Operations attributable to Level 3 investments still held for the fiscal year reporting period at July 31, 2019:
| Change in unrealized appreciation/ depreciation | ||||
| Assets Table | ||||
| Investments, at Value | ||||
| Corporate Loans | $ | (133,866 | ) | |
| Common Stocks | (246,737 | ) | ||
| Rights, Warrants and Certificates | (1,929 | ) | ||
|
| |||
| Total | $ | (382,532 | ) | |
|
| |||
79 INVESCO OPPENHEIMER SENIOR FLOATING RATE PLUS FUND
NOTES TO FINANCIAL STATEMENTSContinued
The following table summarizes the valuation techniques and significant unobservable inputs used in determining fair value measurements for those investments classified as Level 3 for the one month reporting period at August 31, 2019:
| Value as of August 31, 2019 | Valuation Technique | Unobservable Input | Range of Inputs | Unobservable Inputs Used | ||||||||
| Assets Table | ||||||||||||
| Investments, at Value: | ||||||||||||
| Corporate Loans | $ | 3,373,757 | Broker Quote | N/A | N/A | N/A (a) | ||||||
| Corporate Loans | 435,230 | Discounted Cash Flow Model | Illiquidity Discount | N/A | 3.69% (b) | |||||||
| Implied Rating | N/A | BB+ | ||||||||||
| Yield to Maturity | N/A | 3.81% | ||||||||||
| Common Stocks | 100,872 | Broker Quote | N/A | N/A | N/A (a) | |||||||
| Rights, Warrants and Certificates | 1,763 | Estimated Recovery Proceeds | Auction Proceeds | N/A | $0.058/share (c) | |||||||
| Rights, Warrants and Certificates | 4,169 | Broker Quote | N/A | N/A | N/A (a) | |||||||
|
| |||||||||||
| Total | $ | 3,915,791 | ||||||||||
|
| |||||||||||
(a) Securities classified as Level 3 whose unadjusted values were provided by a pricing service or broker-dealer for which such inputs are unobservable. The Manager periodically reviews pricing vendor and broker methodologies and inputs to confirm they are determined using unobservable inputs and have been appropriately classified. Such securities’ fair valuations could change significantly based on changes in unobservable inputs used by the pricing service or broker.
(b) The Fund fair values certain corporate loans using a discounted cash flow model which incorporates the Company’s EBITDA and leverage to determine an implied rating. The yield to maturity on other issues with similar leverage and rating is used as a basis for the discount rate, with an additional illiquidity discount applied. The illiquidity discount was determined based on the implied discount rate at origination. The Manager periodically reviews the financial statements and monitors such investments for additional market information or the occurrence of a significant event which would warrant are-evaluation of the security’s fair valuation. Such security’s fair valuation could increase (decrease) significantly based on a decrease (increase) in the illiquidity discount. Such security’s fair valuation could also increase (decrease) based on an increase (decrease) in the implied rating or a decrease (increase) in the yield to maturity on other issues.
(c) The Fund fair values certain rights received following a merger at the estimated amount of future recovery proceeds from the sale of assets. The Manager monitors such investments for additional market information or the occurrence of a significant event which would warrant are-evaluation of the security’s fair valuation. A significant increase (decrease) in the auction proceeds will result in a significant increase (decrease) to the fair value of the investment.
The following table summarizes the valuation techniques and significant unobservable inputs used in determining fair value measurements for those investments classified as Level 3 for the fiscal year reporting period at July 31, 2019:
80 INVESCO OPPENHEIMER SENIOR FLOATING RATE PLUS FUND
| Value as of July 31, 2019 | Valuation Technique | Unobservable Input | Range of Unobservable Inputs | Unobservable Inputs Used | ||||||||||||||||
| Assets Table | ||||||||||||||||||||
| Investments, at Value: | ||||||||||||||||||||
| Corporate Loans | $ | 2,490,385 | Broker Quote | N/A | N/A | N/A (a) | ||||||||||||||
| Corporate Loans | 442,544 | Discounted Cash Flow Model | Illiquidity Discount | N/A | 3.69% (b) | |||||||||||||||
| Implied Rating | N/A | BB+ | ||||||||||||||||||
| Yield to Maturity | N/A | 4.17% | ||||||||||||||||||
| Common Stocks | 86,337 | Broker Quote | N/A | N/A | N/A (a) | |||||||||||||||
| Rights, Warrants and Certificates | 1,763 | Estimated Recovery Proceeds | Auction Proceeds | N/A | $0.058/share (c) | |||||||||||||||
| Rights, Warrants and Certificates | 625 | Broker Quote | N/A | N/A | N/A (a) | |||||||||||||||
|
| |||||||||||||||||||
| Total | $ | 3,021,654 | ||||||||||||||||||
|
| |||||||||||||||||||
(a) Securities classified as Level 3 whose unadjusted values were provided by a pricing service or broker-dealer for which such inputs are unobservable. The Manager periodically reviews pricing vendor and broker methodologies and inputs to confirm they are determined using unobservable inputs and have been appropriately classified. Such securities’ fair valuations could change significantly based on changes in unobservable inputs used by the pricing service or broker.
(b) The Fund fair values certain corporate loans using a discounted cash flow model which incorporates the Company’s EBITDA and leverage to determine an implied rating. The yield to maturity on other issues with similar leverage and rating is used as a basis for the discount rate, with an additional illiquidity discount applied. The illiquidity discount was determined based on the implied discount rate at origination. The Manager periodically reviews the financial statements and monitors such investments for additional market information or the occurrence of a significant event which would warrant are-evaluation of the security’s fair valuation. Such security’s fair valuation could increase (decrease) significantly based on a decrease (increase) in the illiquidity discount. Such security’s fair valuation could also increase (decrease) based on an increase (decrease) in the implied rating or a decrease (increase) in the yield to maturity on other issues.
(c) The Fund fair values certain rights received following a merger at the estimated amount of future recovery proceeds from the sale of assets. The Manager monitors such investments for additional market information or the occurrence of a significant event which would warrant are-evaluation of the security’s fair valuation. A significant increase (decrease) in the auction proceeds will result in a significant increase (decrease) to the fair value of the investment.
Note 4 - Security Transactions with Affiliated Funds
The Fund is permitted to purchase or sell securities from or to certain other Invesco Funds under specified conditions outlined in procedures adopted by the Board of Trustees of the Trust. The procedures have been designed to ensure that any purchase or sale of securities by the Fund from or to another fund or portfolio that is or could be considered an affiliate by virtue of having a common investment adviser (or affiliated investment advisers), common Trustees and/or common officers complies with Rule17a-7 of the 1940 Act. Further, as defined under the procedures, each transaction is effected at the current market price. Pursuant to these procedures for the period August 1, 2018 to May 24, 2019, the Predecessor Fund engaged in transactions with affiliates as listed: Securities purchases of $2,250,222
81 INVESCO OPPENHEIMER SENIOR FLOATING RATE PLUS FUND
NOTES TO FINANCIAL STATEMENTSContinued
and securities sales of $1,315,592, which resulted in net realized lossesof $33,198. For the periods May 25, 2019 to July 31, 2019 and August 1, 2019 to August 31, 2019, the Fund did not engage in transactions with affiliates.
Note 5 - Trustee and Officer Fees and Benefits
Certain Trustees have executed a Deferred Compensation Agreement pursuant to which they have the option to elect to defer receipt of all or a portion of the annual compensation they are entitled to receive from the Fund. For purposes of determining the amount owed to the Trustees under the plan, deferred amounts are treated as though equal dollar amounts had been invested in shares of the Fund or in other Invesco and/or Invesco Oppenheimer funds selected by the Trustees. The Fund purchases shares of the funds selected for deferral by the Trustees in amounts equal to his or her deemed investment, resulting in a Fund asset equal to the deferred compensation liability. Such assets are included as a component of “Other” within the asset section of the Statement of Assets and Liabilities. Deferral of Trustees’ fees under the plan will not affect the net assets of the Fund and will not materially affect the Fund’s assets, liabilities or net investment income per share. Amounts will be deferred until distributed in accordance with the compensation deferral plan.
Note 6 - Cash Balances
The Fund may borrow for leveraging in an amount up to 5% of the Fund’s total assets (excluding the amount borrowed) at the time the borrowing is made. In doing so, the Fund is permitted to temporarily carry a negative or overdrawn balance in its account with The Deutsche Bank Trust Company Americas, the custodian bank. Such balances, if any at period end, are shown in the Statement of Assets and Liabilities under the payable caption Amount due custodian. To compensate the custodian bank for such overdrafts, the overdrawn Fund may either (1) leave funds as a compensating balance in the account so the custodian bank can be compensated by earning the additional interest; or (2) compensate by paying the custodian bank at a rate agreed upon by the custodian bank and Invesco, not to exceed the contractually agreed upon rate. The Fund may not purchase additional securities when any borrowings from banks exceed 5% of the Fund’s total assets.
Note 7 - Investment Transactions
The aggregate amount of investment securities (other than short-term securities, U.S. Treasury obligations and money market funds, if any) purchased and sold by the Fund during the one month period ending August 31, 2019 was $909,364 and $2,287,216, respectively, and during theyearended July 31, 2019 was $41,306,282 and $48,429,588, respectively.
82 INVESCO OPPENHEIMER SENIOR FLOATING RATE PLUS FUND
Note 8 - Share Information
Transactions in shares of beneficial interest were as follows:
| One Month Ended | Year Ended July 31, 20192 | Year Ended July 31, 2018 | ||||||||||||||||||||||
| August 31, 20191 | ||||||||||||||||||||||||
| Shares | Amount | Shares | Amount | Shares | Amount | |||||||||||||||||||
| Class A | ||||||||||||||||||||||||
| Sold | 94,298 | $ | 837,033 | 1,911,763 | $ | 17,543,698 | 1,482,165 | $ | 13,940,548 | |||||||||||||||
| Dividends and/or distributions reinvested | 18,887 | 166,764 | 174,472 | 1,593,095 | 134,185 | 1,260,814 | ||||||||||||||||||
| Redeemed | (176,592 | ) | (1,562,120 | ) | (1,360,979 | ) | (12,391,274 | ) | (1,508,561 | ) | (14,180,160 | ) | ||||||||||||
|
| |||||||||||||||||||||||
| Net increase (decrease) | (63,407 | ) | $ | (558,323 | ) | 725,256 | $ | 6,745,519 | 107,789 | $ | 1,021,202 | |||||||||||||
|
| |||||||||||||||||||||||
| ||||||||||||||||||||||||
| Class C | ||||||||||||||||||||||||
| Sold | 13,150 | $ | 116,566 | 557,993 | $ | 5,103,507 | 406,955 | $ | 3,825,849 | |||||||||||||||
| Dividends and/or distributions reinvested | 5,636 | 49,762 | 72,544 | 662,123 | 55,406 | 520,392 | ||||||||||||||||||
| Redeemed | (39,597 | ) | (351,037 | ) | (829,995 | ) | (7,544,824 | ) | (453,526 | ) | (4,264,068 | ) | ||||||||||||
|
| |||||||||||||||||||||||
| Net increase (decrease) | (20,811 | ) | $ | (184,709 | ) | (199,458 | ) | $ | (1,779,194 | ) | 8,835 | $ | 82,173 | |||||||||||
|
| |||||||||||||||||||||||
| ||||||||||||||||||||||||
| Class R3 | ||||||||||||||||||||||||
| Sold | — | $ | — | 1,099 | $ | 10,000 | — | $ | — | |||||||||||||||
| Dividends and/or distributions reinvested | — | — | — | — | — | — | ||||||||||||||||||
| Redeemed | — | — | — | — | — | — | ||||||||||||||||||
|
| |||||||||||||||||||||||
| Net increase | — | $ | — | 1,099 | $ | 10,000 | — | $ | — | |||||||||||||||
|
| |||||||||||||||||||||||
| ||||||||||||||||||||||||
| Class Y | ||||||||||||||||||||||||
| Sold | 82,151 | $ | 726,846 | 2,012,539 | $ | 18,569,095 | 1,500,593 | $ | 14,124,067 | |||||||||||||||
| Dividends and/or distributions reinvested | 13,770 | 121,724 | 177,832 | 1,624,465 | 117,340 | 1,102,852 | ||||||||||||||||||
| Redeemed | (190,151 | ) | (1,690,507 | ) | (2,216,737 | ) | (20,131,433 | ) | (1,278,322 | ) | (12,038,122 | ) | ||||||||||||
|
| |||||||||||||||||||||||
| Net increase (decrease) | (94,230 | ) | $ | (841,937 | ) | (26,366 | ) | $ | 62,127 | 339,611 | $ | 3,188,797 | ||||||||||||
|
| |||||||||||||||||||||||
| ||||||||||||||||||||||||
| Class R53 | ||||||||||||||||||||||||
| Sold | — | $ | — | 1,099 | $ | 10,000 | — | $ | — | |||||||||||||||
| Dividends and/or distributions reinvested | — | — | — | — | — | — | ||||||||||||||||||
| Redeemed | — | — | — | — | — | — | ||||||||||||||||||
|
| |||||||||||||||||||||||
| Net increase | — | $ | — | 1,099 | $ | 10,000 | — | $ | — | |||||||||||||||
|
| |||||||||||||||||||||||
83 INVESCO OPPENHEIMER SENIOR FLOATING RATE PLUS FUND
NOTES TO FINANCIAL STATEMENTSContinued
| One Month Ended | Year Ended July 31, 20192 | Year Ended July 31, 2018 | ||||||||||||||||||||||
| August 31, 20191 | ||||||||||||||||||||||||
| Shares | Amount | Shares | Amount | Shares | Amount | |||||||||||||||||||
| Class R6 | ||||||||||||||||||||||||
| Sold | 175 | $ | 1,557 | 18,051 | $ | 166,436 | 32,282 | $ | 305,208 | |||||||||||||||
| Dividends and/or distributions reinvested | 352 | 3,123 | 3,807 | 34,930 | 2,648 | 24,970 | ||||||||||||||||||
| Redeemed | (95 | ) | (844 | ) | (25,260 | ) | (231,526 | ) | (5,238 | ) | (49,400 | ) | ||||||||||||
|
| |||||||||||||||||||||||
| Net increase (decrease) | 432 | $ | 3,836 | (3,402 | ) | $ | (30,160 | ) | 29,692 | $ | 280,778 | |||||||||||||
|
| |||||||||||||||||||||||
1.There are entities that are record owners of more than 5% of the outstanding shares of the Fund and own 42% of the outstanding shares of the Fund. IDI has an agreement with these entities to sell Fund shares. The Fund, Invesco and/or Invesco affiliates may make payments to these entities, which are considered to be related to the Fund, for providing services to the Fund, Invesco and/or Invesco affiliates, including but not limited to services such as securities brokerage, distribution, third party record keeping and account servicing. The Fund has no knowledge as to whether all or any portion of the shares owned of record by these entities are also owned beneficially.
In addition, 6% of the outstanding shares of the Fund are owned by the Adviser or an affiliate of the Adviser.
2.There are entities that are record owners of more than 5% of the outstanding shares of the Fund and own 42% of the outstanding shares of the Fund. IDI has an agreement with these entities to sell Fund shares. The Fund, Invesco and/or Invesco affiliates may make payments to these entities, which are considered to be related to the Fund, for providing services to the Fund, Invesco and/or Invesco affiliates, including but not limited to services such as securities brokerage, distribution, third party record keeping and account servicing. The Fund has no knowledge as to whether all or any portion of the shares owned of record by these entities are also owned beneficially.
In addition, 6% of the outstanding shares of the Fund are owned by the Adviser or an affiliate of the Adviser.
3. Commencement date after the close of business on May 24, 2019.
Note 9 - Unfunded Loan Commitments
As ofAugust 31, 2019, the Fund had unfunded loan commitments, which could be extended at the option of the borrower, pursuant to the following loan agreements with the following borrowers:
| Borrower | Type | Principal Amount | Value | |||
| Mavis Tire Express Services Corp. | Delayed Draw Term Loan | $14,882 | $14,631 | |||
| Deluxe Entertainment Services Group, Inc., | Delayed Draw Term Loan | 3,219 | 2,977 | |||
| ||||||
| $17,608 | ||||||
|
As ofJuly 31, 2019, the Fund had unfunded loan commitments, which could be extended at the option of the borrower, pursuant to the following loan agreements with the following borrowers:
| Borrower | Type | Principal Amount | Value | |||
| Mavis Tire Express Services Corp. | Delayed Draw Term Loan | $14,882 | $14,668 |
Note 10 - Dividends
The Fund declared the following monthly dividends from net investment income subsequent to August 31, 2019:
84 INVESCO OPPENHEIMER SENIOR FLOATING RATE PLUS FUND
| Amount Per Share | ||||
| Payable | ||||
| Share Class | Record Date | September 30, 2019 | ||
| Class A | Daily | 0.0357 | ||
| Class C | Daily | 0.0301 | ||
| Class R | Daily | 0.0373 | ||
| Class Y | Daily | 0.0359 | ||
| Class R5 | Daily | 0.0406 | ||
| Class R6 | Daily | 0.0384 |
The Fund declared the following monthly dividends from net investment income subsequent to July 31, 2019:
| Amount Per Share | ||||
| Payable | ||||
| Share Class | Record Date | August 30, 2019 | ||
| Class A | Daily | 0.0454 | ||
| Class C | Daily | 0.0378 | ||
| Class R | Daily | 0.0402 | ||
| Class Y | Daily | 0.0489 | ||
| Class R5 | Daily | 0.0438 | ||
| Class R6 | Daily | 0.0470 |
Note 11 - Borrowings
Borrowings.The Fund has entered into a Loan and Security Agreement (the “Agreement”) with Deutsche Bank (the “Bank”), that enables it to borrow up to $50 million. To secure loans under the Agreement, the Fund has granted a security interest in its senior loans and other portfolio securities to the Bank. Interest is charged to the Fund, based on its borrowings, at a spread above three-month LIBOR (3.838% and 3.966% at August 31, 2019 and July 31, 2019, respectively). The Fund pays additional fees annually under the Agreement for management and administration of the facility as well as ongoing commitment fees all of which are based on the total facility size. Total fees and interest that are included in expenses on the Fund’s Statement of Operations related to its participation in the loan facility during the one month reporting period ended August 31, 2019 and the reporting year ended July 31, 2019 equal to 0.49% and 0.86%, respectively, of the Fund’s average net assets on an annualized basis. Under the Agreement, the Fund has the right to prepay loans and terminate its participation in the loan facility at any time upon prior notice to the lenders.
The Fund can borrow money from the Bank in amounts up to one third of its total assets (including the amount borrowed) less all liabilities and indebtedness other than borrowings (meaning that the value of those assets must be at least 300% of the amount borrowed). The Fund can use those borrowings for investment-related purposes such as purchasing senior loans and other portfolio securities. The Fund also may borrow to meet redemption obligations or for temporary and emergency purposes. When the Fund invests borrowed money in senior loans or other portfolio securities, it is using a speculative investment technique known as
85 INVESCO OPPENHEIMER SENIOR FLOATING RATE PLUS FUND
NOTES TO FINANCIAL STATEMENTSContinued
leverage and changes in the value of the Fund’s investments will have a larger effect on its share price than if it did not borrow because of the effect of leverage.
The Fund will pay interest and may pay other fees in connection with loans. If the Fund does borrow, it will be subject to greater expenses than funds that do not borrow. The interest on borrowed money and the other fees incurred in conjunction with loans are an expense that might reduce the Fund’s yield and return. Expenses incurred by the Fund with respect to interest on borrowings and related fees are disclosed separately or as other expenses on the Statement of Operations.
At August 31, 2019, the Fund had borrowings outstanding at an interest rate of 3.838%.
Details of the borrowings for one month reporting period ended August 31, 2019 are as follows:
Average Daily Loan Balance | $ | 8,153,225 | ||
Average Daily Interest Rate | 3.866 | % | ||
Fees Paid | $ | — | ||
Interest Paid | $ | 17,143 |
At July 31, 2019, the Fund had borrowings outstanding at an interest rate of 3.966%.
Details of the borrowings for the reporting period ended July 31, 2019 are as follows:
Average Daily Loan Balance | $ | 14,638,356 | ||
Average Daily Interest Rate | 4.236 | % | ||
Fees Paid | $ | — | ||
Interest Paid | $ | 670,436 |
86 INVESCO OPPENHEIMER SENIOR FLOATING RATE PLUS FUND
REPORT OF INDEPENDENT REGISTERED PUBLIC ACCOUNTING FIRM
To the Board of Trustees of AIM Counselor Series Trust (Invesco Counselor Series Trust) and Shareholders of Invesco Oppenheimer Senior Floating Rate Plus Fund
Opinion on the Financial Statements
We have audited the accompanying statement of assets and liabilities, including the schedule of investments, of Invesco Oppenheimer Senior Floating Rate Plus Fund (one of the funds constituting AIM Counselor Series trust (Invesco Counselor Series Trust), referred to hereafter as the “Fund”) as of July 31, 2019 and August 31, 2019, the related statement of operations, the statement of changes in net assets and the statement of cash flows, for the year ended July 31, 2019 and the period ended August 31, 2019, and the financial highlights for each of the periods ended July 31, 2019 and August 31, 2019, including the related notes (collectively referred to as the “financial statements”). In our opinion, the financial statements present fairly, in all material respects, the financial position of the Fund as of July 31, 2019 and August 31, 2019, the results of its operations, changes in its net assets and its cash flows for the year ended July 31, 2019 and the period ended August 31, 2019, and the financial highlights for each of the periods ended July 31, 2019 and August 31, 2019 in conformity with accounting principles generally accepted in the United States of America.
The financial statements of Invesco Oppenheimer Senior Floating Rate Plus Fund (formerly known as Oppenheimer Senior Floating Rate Plus Fund) as of and for the year ended July 31, 2018 and the financial highlights for each of the periods ended on or prior to July 31, 2018 (not presented herein, other than the statement of changes in net assets and the financial highlights) were audited by other auditors whose report dated September 26, 2018 expressed an unqualified opinion on those financial statements and financial highlights.
Basis for Opinion
These financial statements are the responsibility of the Fund’s management. Our responsibility is to express an opinion on the Fund’s financial statements based on our audits. We are a public accounting firm registered with the Public Company Accounting Oversight Board (United States) (PCAOB) and are required to be independent with respect to the Fund in accordance with the U.S. federal securities laws and the applicable rules and regulations of the Securities and Exchange Commission and the PCAOB.
We conducted our audits of these financial statements in accordance with the standards of the PCAOB. Those standards require that we plan and perform the audits to obtain reasonable assurance about whether the financial statements are free of material misstatement, whether due to error or fraud.
Our audits included performing procedures to assess the risks of material misstatement of the financial statements, whether due to error or fraud, and performing procedures that respond to those risks. Such procedures included examining, on a test basis, evidence regarding the amounts and disclosures in the financial statements. Our audits also included evaluating the accounting principles used and significant estimates made by management, as well as evaluating the overall
87 INVESCO OPPENHEIMER SENIOR FLOATING RATE PLUS FUND
REPORT OF INDEPENDENT REGISTERED PUBLIC ACCOUNTING FIRM
presentation of the financial statements. Our procedures included confirmation of securities owned as of July 31, 2019 and August 31, 2019 by correspondence with the custodian, transfer agent, brokers and agent banks; when replies were not received from brokers or agent banks, we performed other auditing procedures. We believe that our audits provides a reasonable basis for our opinion.
/s/PricewaterhouseCoopers LLP
Houston, TX
October 14, 2019
We have served as the auditor of one or more investment companies in the Invesco group of investment companies since at least 1995. We have not been able to determine the specific year we began serving as auditor.
88 INVESCO OPPENHEIMER SENIOR FLOATING RATE PLUS FUND
INDEPENDENT REGISTERED PUBLIC ACCOUNTING FIRM
The Audit Committee of the Board of Trustees appointed, and the Board of Trustees ratified and approved, PricewaterhouseCoopers LLP (“PWC”) as the independent registered public accounting firm of the Fund for the fiscal periods ending after May 24, 2019. Prior to the close of business on May 24, 2019, the Predecessor Fund was a separate series of an unaffiliated investment company and its financial statements were audited by a different independent registered public accounting firm (the “Prior Auditor”).
Effective after the close of business on May 24, 2019, the Prior Auditor resigned as the independent registered public accounting firm of the Fund. The Prior Auditor’s report on the financial statements of the Predecessor Fund for the past two fiscal years did not contain an adverse or disclaimer of opinion, and was not qualified or modified as to uncertainty, audit scope or accounting principles. During the Predecessor Fund’s two most recent fiscal years and through the close of business on May 24, 2019, there were no (1) disagreements with the Prior Auditor on any matter of accounting principles or practices, financial statement disclosure, or auditing scope or procedure, which disagreements, if not resolved to the Prior Auditor’s satisfaction, would have caused it to make reference to that matter in connection with its report; or (2) “reportable events,” as that term is defined in Item 304(a)(1)(v) of RegulationS-K under the Securities Exchange Act of 1934.
89 INVESCO OPPENHEIMER SENIOR FLOATING RATE PLUS FUND
FEDERAL INCOME TAX INFORMATIONUnaudited
In early 2019, if applicable, shareholders of record received information regarding all dividends and distributions paid to them by the Fund during calendar year 2018.
Dividends, if any, paid by the Fund during the reporting period which are not designated as capital gain distributions should be multiplied by the maximum amount allowable but not less than 2.78% and 0.96% for the one month ended August 31, 2019 and the fiscal year ended July 31, 2019, respectively, to arrive at the amount eligible for the corporate dividend-received deduction.
A portion, if any, of the dividends paid by the Fund during the reporting period which are not designated as capital gain distributions are eligible for lower individual income tax rates to the extent that the Fund has received qualified dividend income as stipulated by recent tax legislation. The maximum amount allowable but not less than $10,844 and $41,140 of the Fund’s fiscal year taxable income for the one month ended August 31, 2019 and fiscal year ended July 31, 2019, respectively, may be eligible for the lower individual income tax rates. In early 2019, shareholders of record received information regarding the percentage of distributions that are eligible for lower individual income tax rates.
Recent tax legislation allows a regulated investment company to designate distributions not designated as capital gain distributions, as either interest related dividends or short-term capital gain dividends, both of which are exempt from the U.S. withholding tax applicable to non U.S. taxpayers. For the reporting period, the maximum amount allowable but not less than $343,196 and $3,783,009 of the ordinary distributions to be paid by the Fund for the one month ended August 31, 2019 and the fiscal year ended July 31, 2019, respectively, qualifies as an interest related dividend.
The foregoing information is presented to assist shareholders in reporting distributions received from the Fund to the Internal Revenue Service. Because of the complexity of the federal regulations which may affect your individual tax return and the many variations in state and local tax regulations, we recommend that you consult your tax advisor for specific guidance.
90 INVESCO OPPENHEIMER SENIOR FLOATING RATE PLUS FUND
APPROVAL OF INVESTMENT ADVISORY ANDSUB-ADVISORY CONTRACTSUnaudited
At meetings held on December 14, 2018, the Board of Trustees (the Board or the Trustees) of AIM Counselor Series Trust (Invesco Counselor Series Trust) (the Trust) as a whole, and the independent Trustees, who comprise over 75% of the Board, voting separately, approved (i) an amendment to the Trust’s Master Investment Advisory Agreement with Invesco Advisers, Inc. (Invesco Advisers and the investment advisory agreement) to add Invesco Oppenheimer Senior Floating Rate Plus Fund (the Fund), (ii) an amendment to the Master IntergroupSub-Advisory Contract for Mutual Funds with Invesco Asset Management Deutschland GmbH, Invesco Asset Management Limited, Invesco Asset Management (Japan) Limited, Invesco Hong Kong Limited, Invesco Senior Secured Management, Inc. and Invesco Canada Ltd. to add the Fund, (iii) an amendment to the separatesub-advisory contract with Invesco Capital Management LLC to add the Fund, (iv) an amendment to the separatesub-advisory contract with Invesco Asset Management (India) Private Limited to add the Fund, and (v) an initialsub-advisory contract with OppenheimerFunds, Inc. (collectively, the AffiliatedSub-Advisers and thesub-advisory contracts). Additionally, on March 26, 2019, the Boardre-approved an initialsub-advisory contract with OppenheimerFunds, Inc. following its change of control as a result of the acquisition of OppenheimerFunds, Inc. and its subsidiaries, including the Oppenheimer mutual funds (each, an Oppenheimer Fund), by Invesco Ltd. (the OFI Transaction). After evaluating the factors discussed below, among others, the Board approved the Fund’s investment advisory agreement and thesub-advisory contracts and determined that the compensation payable by the Fund to Invesco Advisers and by Invesco Advisers to the AffiliatedSub-Advisers is fair and reasonable.
The Board’s Evaluation Process
The Board noted that it had previously approved establishing the Fund at the Board meeting held on October 23, 2018 and that the Fund was formed to acquire the assets and liabilities of an Oppenheimer Fund (the Acquired Fund) with the same investment objective and substantially similar principal investment strategies and risks. At the time of approval, the Fund had no assets and no performance history and the portfolio managers were not employed by Invesco Advisers or any of the AffiliatedSub-Advisers except OppenheimerFunds, Inc., which was not affiliated with Invesco at that time.
In approving the investment advisory agreement andsub-advisory contracts, the Board followed a process similar to the process that it follows in annually reviewing and approving investment advisory agreements andsub-advisory contracts for the series portfolios of funds advised by Invesco Advisers and considered the information provided in the most recent annual review process for those funds as well as the information provided with respect to the Fund. As part of the approval process, the Board reviewed and considered information provided in response to detailed requests for information submitted to management by the independent Trustees with assistance from legal counsel to the independent Trustees. The Board reviewed comparative investment performance and fee data prepared by Invesco Advisers and an independent mutual fund data provider. The Board was assisted in its review by the Senior Officer, an officer of the Invesco Funds who reports directly to the independent Trustees, and by independent legal counsel.
91 INVESCO OPPENHEIMER SENIOR FLOATING RATE PLUS FUND
APPROVAL OF INVESTMENT ADVISORY ANDSUB-ADVISORY CONTRACTSUnaudited / Continued
The discussion below serves as a summary of the material factors and related conclusions that formed the basis for the Board’s approval of the Fund’s investment advisory agreement andsub-advisory contracts. The Trustees’ review and conclusions are based on the comprehensive consideration of all information presented to them and are not the result of any single determinative factor. Moreover, one Trustee may have weighed a particular piece of information or factor differently than another Trustee. This information is current as of December 14, 2018 and March 26, 2019 for thesub-advisory contract with OppenheimerFunds, Inc.
Factors and Conclusions and Summary of Independent Written Fee Evaluation
A. Nature, Extent and Quality of Services Provided by Invesco Advisers and the AffiliatedSub-Advisers
The Board reviewed the nature, extent and quality of the advisory services to be provided to the Fund by Invesco Advisers under the Fund’s investment advisory agreement, and the credentials and experience of the officers and employees of Invesco Advisers who will provide these services. The Board’s review included consideration of the investment process oversight and structure, credit analysis and investment risk management to be employed in providing advisory services to the Fund. The Board also considerednon-advisory services that Invesco Advisers and its affiliates provide to the Invesco Funds and will provide to the Fund, such as various back office support functions, third party oversight, internal audit, valuation, portfolio trading and legal and compliance. The Board also received and reviewed information about Invesco Advisers’ role as administrator of the Invesco Funds’ liquidity risk management program. The Board also reviewed and considered the benefits to shareholders of investing in a fund that is part of the Invesco family of funds under the umbrella of Invesco Ltd., Invesco Advisers’ parent company, and noted Invesco Ltd.’s depth and experience in conducting an investment management business, as well as its commitment of financial and other resources to such business. The Board reviewed and considered information about the resources that Invesco Advisers intends to continue to commit to managing the Invesco family of funds, including the Fund, following the OFI Transaction. The Board concluded that the nature, extent and quality of the services to be provided to the Fund by Invesco Advisers are appropriate and satisfactory.
The Board reviewed the services that may be provided by the AffiliatedSub-Advisers under thesub-advisory contracts and the credentials and experience of the officers and employees of the AffiliatedSub-Advisers who provide these services. The Board noted the AffiliatedSub-Advisers’ expertise with respect to certain asset classes and that the AffiliatedSub-Advisers have offices and personnel that are located in financial centers around the world. As a result, the Board noted that the AffiliatedSub-Advisers can provide research and investment analysis on the markets and economies of various countries in which the Fund may invest, make recommendations regarding securities and assist with security trades. The Board concluded that thesub-advisory contracts may benefit the Fund and its shareholders by permitting Invesco Advisers to use the resources and talents of the AffiliatedSub-Advisers
92 INVESCO OPPENHEIMER SENIOR FLOATING RATE PLUS FUND
in managing the Fund. The Board concluded that the nature, extent and quality of the services that may be provided by the AffiliatedSub-Advisers are appropriate and satisfactory.
B. Fund Investment Performance
The Board noted that the Fund would continue the historical performance information of the Acquired Fund following the consummation of the OFI Transaction. The Board considered the performance of the Acquired Fund and the fact that, at the closing of the OFI Transaction, management anticipates that the Fund will be managed pursuant to substantially similar investment strategies and by substantially the same portfolio management team as managed the Acquired Fund. The Board did not view Fund performance as a relevant factor in considering whether to approve thesub-advisory contracts for the Fund, as no Affiliated Sub- Adviser currently manages assets of the Fund.
The Board compared the Fund’s investment performance over multiple time periods ending December 31, 2017 to the performance of funds in the Morningstar performance universe and against the Fund’s benchmark index. The Trustees also reviewed more recent Fund performance and this review did not change their conclusions.
C. Advisory andSub-Advisory Fees and Fund Expenses
The Board compared the Fund’s contractual management fee rate to the contractual management fee rates of funds in the Fund’s Morningstar expense group. The Board also considered comparative information regarding the Fund’s total expense ratio and its various components.
The Board noted that Invesco Advisers has contractually agreed to waive fees and/or limit expenses of the Fund for at least two years from the closing date of the OFI Transaction in an amount necessary to limit total annual operating expenses to a specified percentage of average daily net assets for each class of the Fund.
The Board also considered the fees charged by Invesco Advisers and the Affiliated Sub- Advisers to other similarly managed client accounts. The Board noted that Invesco Advisers or the AffiliatedSub-Advisers may charge lower fees to large institutional clients. Invesco Advisers reviewed with the Board differences in the scope of services it provides to the Invesco Funds relative to certain other types of client accounts, including management of cash flows as a result of redemptions and purchases, necessary infrastructure such as officers, office space, technology, legal and distribution, oversight of service providers, costs and business risks associated with launching new funds and sponsoring and maintaining the product line, preparation of annual registration statement updates and financial information and compliance with federal and state laws and regulations.
The Board also considered the services that may be provided by the AffiliatedSub-Advisers pursuant to thesub-advisory contracts, as well as the fees payable by Invesco Advisers to the AffiliatedSub-Advisers pursuant to thesub-advisory contracts.
93 INVESCO OPPENHEIMER SENIOR FLOATING RATE PLUS FUND
APPROVAL OF INVESTMENT ADVISORY ANDSUB-ADVISORY CONTRACTSUnaudited / Continued
D. Economies of Scale and Breakpoints
The Board considered the extent to which there may be economies of scale in the provision of advisory services to the Fund. The Board considered Invesco’s reinvestment in its business, including investments in business infrastructure and cybersecurity. The Board also considered that the Fund may benefit from economies of scale through contractual breakpoints in the Fund’s advisory fee schedule, which generally operate to reduce the Fund’s expense ratio as it grows in size. The Board noted that the Fund will share directly in economies of scale through lower fees charged by third party service providers based on the combined size of the Invesco Funds. The Board noted that the Fund may also benefit from economies of scale through initial fee setting, fee waivers and expense reimbursements.
E. Profitability and Financial Resources
The Board reviewed information from the 2018 contract renewal process provided by Invesco Advisers concerning the costs of the advisory and other services that Invesco Advisers and its affiliates provide to the Invesco Funds and the profitability of Invesco Advisers and its affiliates in providing these services. The Board considered the methodology used for calculating profitability and noted the periodic review of such methodology by an independent consultant. The Board noted that Invesco Advisers will continue to operate at a net profit from services Invesco Advisers and its affiliates provide to the Invesco Funds. The Board did not deem the level of profits realized by Invesco Advisers and its affiliates from providing services to the Invesco Funds, and the profits estimated to be realized by the Fund, to be excessive given the nature, extent and quality of the services provided. The Board received information from Invesco Advisers demonstrating that Invesco Advisers and the AffiliatedSub-Advisers are financially sound and have the resources necessary to perform their obligations under the investment advisory agreement andsub-advisory contracts.
F. Collateral Benefits to Invesco Advisers and its Affiliates
The Board considered various other benefits to be received by Invesco Advisers and its affiliates from the relationship with the Fund, including the fees to be received for providing administrative, transfer agency and distribution services to the Fund. The Board considered the performance of Invesco Advisers and its affiliates in providing these services to other Invesco Funds and the organizational structure employed to provide these services. The Board also considered that these services will be provided to the Fund pursuant to written contracts that are reviewed and approved on an annual basis by the Board; and that the services are required for the operation of the Fund.
The Board considered the benefits realized by Invesco Advisers and the Affiliated Sub- Advisers as a result of portfolio brokerage transactions executed through “soft dollar” arrangements. Invesco Advisers noted that the Fund will not execute brokerage transaction through “soft dollar” arrangements to any significant degree.
94 INVESCO OPPENHEIMER SENIOR FLOATING RATE PLUS FUND
The Board considered that the Fund’s uninvested cash and cash collateral from any securities lending arrangements may be invested in money market funds advised by Invesco Advisers pursuant to procedures approved by the Board. The Board considered that Invesco Advisers will receive advisory fees from these affiliated money market funds attributable to such investments, although Invesco Advisers has contractually agreed to waive through varying periods the advisory fees payable by the Invesco Funds with respect to certain investments in the affiliated money market funds. The waiver is in an amount equal to 100% of the net advisory fee Invesco Advisers will receive from the affiliated money market funds with respect to the Fund’s investment in the affiliated money market funds of uninvested cash, but not cash collateral. The Board concluded that the amount of advisory fees to be received by Invesco Advisers from the Fund’s investment of cash collateral from any securities lending arrangements in the affiliated money market funds is fair and reasonable.
95 INVESCO OPPENHEIMER SENIOR FLOATING RATE PLUS FUND
PORTFOLIO PROXY VOTING POLICIES AND GUIDELINES; UPDATES TO SCHEDULE OF
INVESTMENTSUnaudited
Go paperless with eDelivery
Visit invesco.com/edelivery to enjoy the convenience and security of anytime electronic access to your investment documents.
With eDelivery, you can elect to have any or all of the following materials delivered straight to your inbox to download, save and print from your own computer:
● Fund reports and prospectuses
● Quarterly statements
● Daily confirmations
● Tax forms
Invesco mailing information
Send general correspondence to Invesco Investment Services, Inc., P.O. Box 219078, Kansas City, MO 64121-9078.
Important notice regarding delivery of security holder documents
To reduce Fund expenses, only one copy of most shareholder documents may be mailed to shareholders with multiple accounts at the same address (Householding). Mailing of your shareholder documents may be householded indefinitely unless you instruct us otherwise. If you do not want the mailing of these documents to be combined with those for other members of your household, please contact Invesco Investment Services, Inc. at 800 959 4246 or contact your financial institution. We will begin sending you individual copies for each account within 30 days after receiving your request.
Fund holdings and proxy voting information
The Fund provides a complete list of its holdings four times in each fiscal year, at the quarter ends.
For the second and fourth quarters, the lists appear in the Fund’s semiannual and annual reports to shareholders. For the first and third quarters, the Fund files the lists with the Securities and Exchange Commission (SEC) on FormN-PORT. The most recent list of portfolio holdings is available at invesco. com/completeqtrholdings. Shareholders can also look up the Fund’s FormsN-PORT on the SEC website at sec.gov.
A description of the policies and procedures that the Fund uses to determine how to vote proxies relating to portfolio securities is available without charge, upon request, from our Client Services department at 800 959 4246 or at invesco.com/proxyguidelines. The information is also available on the SEC website, sec.gov.
Information regarding how the Fund voted proxies related to its portfolio securities during the most recent12-month period ended June 30 is available at invesco.com/proxysearch. The information is also available on the SEC website, sec.gov.
Invesco Advisers, Inc. is an investment adviser; it provides investment advisory services to individual and institutional clients and does not sell securities. Invesco Distributors, Inc. is the US distributor for Invesco Ltd.’s retail mutual funds, exchange-traded funds and institutional money market funds. Both are wholly owned, indirect subsidiaries of Invesco Ltd.
96 INVESCO OPPENHEIMER SENIOR FLOATING RATE PLUS FUND
A Special Meeting (“Meeting”) of Shareholders of Invesco Oppenheimer Senior Floating Rate Plus Fund was held on April 12, 2019. The Meeting was held for the following purpose:
(1) Approval of an Agreement and Plan of Reorganization that provides for the reorganization of Oppenheimer Senior Floating Rate Plus Fund into Invesco Oppenheimer Senior Floating Rate Plus Fund.
The results of the voting on the above matter was as follows:
| Matter | Votes For | Votes Against | Votes Abstain | Broker Non-Votes | ||||||||||||
| (1) Approval of an Agreement and Plan of Reorganization | 3,742,841 | 198,568 | 325,934 | 0 | ||||||||||||
97 INVESCO OPPENHEIMER SENIOR FLOATING RATE PLUS FUND
TRUSTEES AND OFFICERSUnaudited
The address of each trustee and officer is AIM Counselor Series Trust (Invesco Counselor Series Trust) (the “Trust”), 11 Greenway Plaza, Suite 1000, Houston, Texas 77046-1173. The trustees serve for the life of the Trust, subject to their earlier death, incapacitation, resignation, retirement or removal as more specifically provided in the Trust’s organizational documents. Each officer serves for a one year term or until their successors are elected and qualified. Column two below includes length of time served with predecessor entities, if any.
Name, Year of Birth and Position(s) Held with the Trust | Trustee and/or Officer Since | Principal Occupation(s) During Past 5 Years | Number of Funds in Fund Complex Overseen by Trustee | Other Directorship(s) Held by Trustee During Past 5 Years | ||||
INTERESTED PERSONS
| ||||||||
Martin L. Flanagan1— 1960 Trustee and Vice Chair | 2007 | Executive Director, Chief Executive Officer and President, Invesco Ltd. (ultimate parent of Invesco and a global investment management firm); Trustee and Vice Chair, The Invesco Funds; Vice Chair, Investment Company Institute; and Member of Executive Board, SMU Cox School of Business
Formerly: Advisor to the Board, Invesco Advisers, Inc. (formerly known as Invesco Institutional (N.A.), Inc.); Chairman and Chief Executive Officer, Invesco Advisers, Inc. (registered investment adviser); Director, Chairman, Chief Executive Officer and President, Invesco Holding Company (US), Inc. (formerly IVZ Inc.) (holding company), Invesco Group Services, Inc. (service provider) and Invesco North American Holdings, Inc. (holding company); Director, Chief Executive Officer and President, Invesco Holding Company Limited (parent of Invesco and a global investment management firm); Director, Invesco Ltd.; Chairman, Investment Company Institute and President,Co-Chief Executive Officer,Co-President, Chief Operating Officer and Chief Financial Officer, Franklin Resources, Inc. (global investment management organization)
| 240 | None | ||||
Philip A. Taylor2— 1954 Trustee | 2006 | Vice Chair, Invesco Ltd.; Trustee, The Invesco Funds
Formerly: Director, Invesco Canada Ltd. (formerly known as Invesco Trimark Ltd./ Invesco Trimark Ltèe) (registered investment adviser and registered transfer agent); Head of the Americas and Senior Managing Director, Invesco Ltd.; Director, Invesco Advisers, Inc. (formerly known as Invesco Institutional (N.A.), Inc.) (registered investment adviser);
| 240 | None | ||||
1 Mr. Flanagan is considered an interested person (within the meaning of Section 2(a)(19) of the 1940 Act) of the Trust because he is an officer of the Adviser to the Trust, and an officer and a director of Invesco Ltd., ultimate parent of the Adviser.
| ||||||||
2 Mr. Taylor is considered an interested person (within the meaning of Section 2(a)(19) of the 1940 Act) of the Trust because he is an officer of Invesco Ltd., ultimate parent of the Adviser.
| ||||||||
98 INVESCO OPPENHEIMER SENIOR FLOATING RATE PLUS FUND
Name, Year of Birth and Position(s) Held with the Trust | Trustee and/or Officer Since | Principal Occupation(s) During Past 5 Years | Number of Funds in Fund Complex Overseen by Trustee | Other Directorship(s) Held by Trustee During Past 5 Years | ||||
INTERESTED PERSONS (CONTINUED) | ||||||||
| Philip A. Taylor (Continued) | Director and Chairman, Invesco Investment Services, Inc. (formerly known as Invesco AIM Investment Services, Inc.) (registered transfer agent); Chief Executive Officer, Invesco Corporate Class Inc. (corporate mutual fund company); Chairman and Chief Executive Officer, Invesco Canada Ltd. (formerly known as Invesco Trimark Ltd./ Invesco Trimark Ltèe) (registered investment adviser and registered transfer agent); Senior Vice President, The Invesco Funds; Director, Invesco Investment Advisers LLC (formerly known as Van Kampen Asset Management); Director, Chairman, Chief Executive Officer and President, Invesco Management Group, Inc. (formerly known as Invesco AIM Management Group, Inc.) (financial services holding company);Co-Chairman,Co-President andCo-Chief Executive Officer, Invesco Advisers, Inc. (formerly known as Invesco Institutional (N.A.), Inc.) (registered investment adviser); Director, Chief Executive Officer and President, Van Kampen Exchange Corp; President and Principal Executive Officer, The Invesco Funds (other than AIM Treasurer’s Series Trust (Invesco Treasurer’s Series Trust), Short-Term Investments Trust and Invesco Management Trust); Executive Vice President, The Invesco Funds (AIM Treasurer’s Series Trust (Invesco Treasurer’s Series Trust), Short-Term Investments Trust and Invesco Management Trust only); Director and President, INVESCO Funds Group, Inc. (registered investment adviser and registered transfer agent); Director and Chairman, IVZ Distributors, Inc. (formerly known as INVESCO Distributors, Inc.) (registered broker dealer); Director, President and Chairman, Invesco Inc. (holding company), Invesco Canada Holdings Inc. (holding company), Trimark Investments Ltd./ Placements Trimark Ltèe and Invesco Financial Services Ltd/Services Financiers Invesco Ltèe; Chief Executive Officer, Invesco Canada Fund Inc. (corporate mutual fund company); Director and Chairman, Van Kampen Investor Services Inc.; Director, Chief Executive Officer and President, 1371 Preferred Inc. (holding
| |||||||
99 INVESCO OPPENHEIMER SENIOR FLOATING RATE PLUS FUND
TRUSTEES AND OFFICERSUnaudited / Continued
Name, Year of Birth and Position(s) Held with the Trust | Trustee and/or Officer Since | Principal Occupation(s) During Past 5 Years | Number of Funds in Fund Complex Overseen by Trustee | Other Directorship(s) Held by Trustee During Past 5 Years | ||||
| INTERESTED PERSONS (CONTINUED) | ||||||||
| Philip A. Taylor (Continued) | company) and Van Kampen Investments Inc.; Director and President, AIM GP Canada Inc. (general partner for limited partnerships) and Van Kampen Advisors, Inc.; Director and Chief Executive Officer, Invesco Trimark Dealer Inc. (registered broker dealer); Director, Invesco Distributors, Inc. (formerly known as Invesco AIM Distributors, Inc.) (registered broker dealer); Manager, Invesco Capital Management LLC; Director, Chief Executive Officer and President, Invesco Advisers, Inc.; Director, Chairman, Chief Executive Officer and President, Invesco AIM Capital Management, Inc.; President, Invesco Trimark Dealer Inc. and Invesco Trimark Ltd./Invesco Trimark Ltèe; Director and President, AIM Trimark Corporate Class Inc. and AIM Trimark Canada Fund Inc.; Senior Managing Director, Invesco Holding Company Limited; Director and Chairman, Fund Management Company (former registered broker dealer); President and Principal Executive Officer, The Invesco Funds (AIM Treasurer’s Series Trust (Invesco Treasurer’s Series Trust), and Short-Term Investments Trust only); President, AIM Trimark Global Fund Inc. and AIM Trimark Canada Fund Inc.
| |||||||
100 INVESCO OPPENHEIMER SENIOR FLOATING RATE PLUS FUND
Name, Year of Birth and Position(s) Held with the Trust | Trustee and/or Officer Since | Principal Occupation(s) During Past 5 Years | Number of Funds in Fund Complex Overseen by Trustee | Other Directorship(s) Held by Trustee During Past 5 Years | ||||
| INDEPENDENT TRUSTEES | ||||||||
Bruce L. Crockett – 1944 Trustee and Chair | 2003 | Chairman, Crockett Technologies Associates (technology consulting company)
Formerly: Director, Captaris (unified messaging provider); Director, President and Chief Executive Officer, COMSAT Corporation; Chairman, Board of Governors of INTELSAT (international communications company); ACE Limited (insurance company); Independent Directors Council and Investment Company Institute: Member of the Audit Committee, Investment Company Institute; Member of the Executive Committee and Chair of the Governance Committee, Independent Directors Council
| 240 | Director and Chairman of the Audit Committee, ALPS (Attorneys Liability Protection Society) (insurance company); Director and Member of the Audit Committee and Compensation Committee, Ferroglobe PLC (metallurgical company) | ||||
David C. Arch – 1945 Trustee | 2010 | Chairman of Blistex Inc. (consumer health care products manufacturer); Member, World Presidents’ Organization | 240 | Board member of the Illinois Manufacturers’ Association
| ||||
Beth Ann Brown3– 1968 Trustee | 2019 | Independent Consultant
Formerly: Head of Intermediary Distribution, Managing Director, Strategic Relations, Managing Director, Head of National Accounts, Senior Vice President, National Account Manager and Senior Vice President, Key Account Manager, Columbia Management Investment Advisers LLC; Vice President, Key Account Manager, Liberty Funds Distributor, Inc.; and Trustee of certain Oppenheimer Funds | 240 | Director, Board of Directors of Caron Engineering Inc.; Advisor, Board of Advisors of Caron Engineering Inc.; President and Director, of Acton Shapleigh Youth Conservation Corps (non -profit); and Vice President and Director of Grahamtastic Connection (non-profit)
| ||||
Jack M. Fields – 1952 Trustee | 2003 | Chief Executive Officer, Twenty First Century Group, Inc. (government affairs company); and Chairman, Discovery Learning Alliance(non-profit)
Formerly: Owner and Chief Executive Officer, Dos Angeles Ranch L.P. (cattle, hunting, corporate entertainment); Director, Insperity, Inc. (formerly known as Administaff) (human resources provider); Chief Executive Officer, Texana Timber LP (sustainable forestry
| 240 | None | ||||
3 Mss. Brown and Krentzman and Messrs. Motley, Vandivort and Vaughn were appointed as Trustees of the Trust effective June 10, 2019.
| ||||||||
101 INVESCO OPPENHEIMER SENIOR FLOATING RATE PLUS FUND
TRUSTEES AND OFFICERSUnaudited / Continued
Name, Year of Birth and Position(s) Held with the Trust | Trustee and/or Officer Since | Principal Occupation(s) During Past 5 Years | Number of Funds in Fund Complex Overseen by Trustee | Other Directorship(s) Held by Trustee During Past 5 Years | ||||
| INDEPENDENT TRUSTEES (CONTINUED) | ||||||||
| Jack M. Fields (Continued) | company); Director of Cross Timbers Quail Research Ranch(non-profit); and member of the U.S. House of Representatives
| |||||||
Cynthia Hostetler —1962 Trustee | 2017 | Non-Executive Director and Trustee of a number of public and private business corporations
Formerly: Director, Aberdeen Investment Funds (4 portfolios); Head of Investment Funds and Private Equity, Overseas Private Investment Corporation; President, First Manhattan Bancorporation, Inc.; Attorney, Simpson Thacher & Bartlett LLP | 240 | Vulcan Materials Company (construction materials company); Trilinc Global Impact Fund; Genesee & Wyoming, Inc. (railroads); Artio Global Investment LLC (mutual fund complex); Edgen Group, Inc. (specialized energy and infrastructure products distributor); Investment Company Institute (professional organization); Independent Directors Council (professional organization)
| ||||
Eli Jones – 1961 Trustee | 2016 | Professor and Dean, Mays Business School - Texas A&M University
Formerly: Professor and Dean, Walton College of Business, University of Arkansas and E.J. Ourso College of Business, Louisiana State University; Director, Arvest Bank
| 240 | Insperity, Inc. (formerly known as Administaff) (human resources provider) | ||||
Elizabeth Krentzman3– 1959 Trustee | 2019 | Formerly: Principal and Chief Regulatory Advisor for Asset Management Services and U.S. Mutual Fund Leader of Deloitte & Touche LLP; General Counsel of the Investment Company Institute (trade association); National Director of the Investment Management Regulatory Consulting Practice, Principal, Director and Senior Manager of Deloitte & Touche LLP; Assistant Director of the Division of Investment Management - Office of Disclosure and Investment Adviser Regulation of the U.S. Securities and Exchange Commission and various positions with the Division of Investment Management – Office of Regulatory Policy of the U.S. Securities and Exchange Commission; Associate at Ropes & Gray LLP.; Advisory Board Member of the | 240 | Trustee of the University of Florida National Board Foundation and Audit Committee Member; Member of the Cartica Funds Board of Directors (private investment funds); Member of the University of Florida Law Center Association, Inc. Board of Trustees and Audit Committee Member
| ||||
102 INVESCO OPPENHEIMER SENIOR FLOATING RATE PLUS FUND
Name, Year of Birth and Position(s) Held with the Trust | Trustee and/or Officer Since | Principal Occupation(s) During Past 5 Years | Number of Funds in Fund Complex Overseen by Trustee | Other Directorship(s) Held by Trustee During Past 5 Years | ||||
| INDEPENDENT TRUSTEES (CONTINUED) | ||||||||
| Elizabeth Krentzman (Continued) | Securities and Exchange Commission Historical Society; and Trustee of certain Oppenheimer Funds
| |||||||
Anthony J. LaCava, Jr. – 1956 Trustee | 2019 | Formerly: Director and Member of the Audit Committee, Blue Hills Bank (publicly traded financial institution) and Managing Partner, KPMG LLP | 240 | Blue Hills Bank; Chairman of Bentley University; Member, Business School Advisory Council; and Nominating Committee, KPMG LLP
| ||||
Prema Mathai-Davis – 1950 Trustee | 2003 | Retired
Co-Owner & Partner of Quantalytics Research, LLC, (a FinTech Investment Research Platform for the Self-Directed Investor)
| 240 | None | ||||
Joel W. Motley3– 1952 Trustee | 2019 | Director of Office of Finance, Federal Home Loan Bank; Member of the Vestry of Trinity Wall Street; Managing Director of Carmona Motley Hoffman, Inc. (privately held financial advisor); Member of the Finance and Budget Committee of the Council on Foreign Relations, Member of the Investment Committee and Board of Human Rights Watch and Member of the Investment Committee and Board of Historic Hudson Valley (non-profit cultural organization).
Formerly: Managing Director of Public Capital Advisors, LLC (privately held financial advisor); Managing Director of Carmona Motley Hoffman, Inc. (privately held financial advisor); Trustee of certain Oppenheimer Funds; and Director of Columbia Equity Financial Corp. (privately held financial advisor)
| 240 | Director of Greenwall Foundation (bioethics research foundation); Member of Board and Investment Committee of The Greenwall Foundation; Director of Southern Africa Legal Services Foundation; Board Member and Investment Committee Member of Pulitzer Center for Crisis Reporting(non-profit journalism) | ||||
Teresa M. Ressel — 1962 Trustee | 2017 | Non-executive director and trustee of a number of public and private business corporations
Formerly: Chief Financial Officer, Olayan America, The Olayan Group (international investor/commercial/industrial); Chief Executive Officer, UBS Securities LLC; Group Chief Operating Officer, Americas, UBS AG; Assistant Secretary for Management & Budget and CFO, US Department of the Treasury
| 240 | Atlantic Power Corporation (power generation company); ON Semiconductor Corp. (semiconductor supplier) | ||||
103 INVESCO OPPENHEIMER SENIOR FLOATING RATE PLUS FUND
TRUSTEES AND OFFICERSUnaudited / Continued
Name, Year of Birth and Position(s) Held with the Trust | Trustee and/or Officer Since | Principal Occupation(s) During Past 5 Years | Number of Funds in Fund Complex Overseen by Trustee | Other Directorship(s) Held by Trustee During Past 5 Years | ||||
| INDEPENDENT TRUSTEES (CONTINUED) | ||||||||
Ann Barnett Stern – 1957 Trustee | 2017 | President and Chief Executive Officer, Houston Endowment Inc. (private philanthropic institution)
Formerly: Executive Vice President and General Counsel, Texas Children’s Hospital; Attorney, Beck, Redden and Secrest, LLP; Business Law Instructor, University of St. Thomas; Attorney, Andrews & Kurth LLP
| 240 | Federal Reserve Bank of Dallas | ||||
Raymond Stickel, Jr. – 1944 Trustee | 2005 | Retired
Formerly: Director, Mainstay VP Series Funds, Inc. (25 portfolios); Partner, Deloitte & Touche
| 240 | None | ||||
Robert C. Troccoli – 1949 Trustee | 2016 | Retired
Formerly: Adjunct Professor, University of Denver – Daniels College of Business, Senior Partner, KPMG LLP
| 240 | None | ||||
Daniel S. Vandivort3–1954 Trustee | 2019 | Treasurer, Chairman of the Audit and Finance Committee, and Trustee, Board of Trustees, Huntington Disease Foundation of America; and President, Flyway Advisory Services LLC (consulting and property management).
Formerly: Trustee and Governance Chair, of certain Oppenheimer Funds
| 240 | Chairman and Lead Independent Director, Chairman of the Audit Committee, and Director, Board of Directors, Value Line Funds | ||||
James D. Vaughn3– 1945 Trustee | 2019 | Retired
Formerly: Managing Partner, Deloitte & Touche LLP; Trustee and Chairman of the Audit Committee, Schroder Funds; Board Member, Mile High United Way, Boys and Girls Clubs, Boy Scouts, Colorado Business Committee for the Arts, Economic Club of Colorado and Metro Denver Network (economic development corporation); and Trustee of certain Oppenheimer Funds | 240 | Board member and Chairman of Audit Committee of AMG National Trust Bank; Trustee and Investment Committee member, University of South Dakota Foundation; Board member, Audit Committee Member and past Board Chair, Junior Achievement(non-profit)
| ||||
Christopher L. Wilson – 1957 Trustee and Vice Chair | 2017 | Non-executive director and trustee of a number of public and private business corporations
Formerly: Director, TD Asset Management USA Inc. (mutual fund complex) (22 portfolios);
| 240 | ISO New England, Inc.(non-profit organization managing regional electricity market) | ||||
104 INVESCO OPPENHEIMER SENIOR FLOATING RATE PLUS FUND
Name, Year of Birth and Position(s) Held with the Trust | Trustee and/or Officer Since | Principal Occupation(s) During Past 5 Years | Number of Funds in Fund Complex Overseen by Trustee | Other Directorship(s) Held by Trustee During Past 5 Years | ||||
INDEPENDENT TRUSTEES
| ||||||||
Christopher L. Wilson (Continued) | Managing Partner, CT2, LLC (investing and consulting firm); President/Chief Executive Officer, Columbia Funds, Bank of America Corporation; President/Chief Executive Officer, CDC IXIS Asset Management Services, Inc.; Principal & Director of Operations, Scudder Funds, Scudder, Stevens & Clark, Inc.; Assistant Vice President, Fidelity Investments
| |||||||
105 INVESCO OPPENHEIMER SENIOR FLOATING RATE PLUS FUND
TRUSTEES AND OFFICERSUnaudited / Continued
Name, Year of Birth and Position(s) Held with the Trust | Trustee and/or Officer Since | Principal Occupation(s) During Past 5 Years | Number of Funds in Fund Complex Overseen by Trustee | Other Directorship(s) Held by Trustee During Past 5 Years | ||||
OTHER OFFICERS
| ||||||||
Sheri Morris — 1964 President, Principal Executive Officer and Treasurer | 2003 | President, Principal Executive Officer and Treasurer, The Invesco Funds; Vice President, Invesco Advisers, Inc. (formerly known as Invesco Institutional (N.A.), Inc.) (registered investment adviser); and Vice President, Invesco Exchange-Traded Fund Trust, Invesco Exchange-Traded Fund Trust II, Invesco India Exchange-Traded Fund Trust, Invesco Actively Managed Exchange-Traded Fund Trust, Invesco Actively Managed Exchange-Traded Commodity Fund Trust and Invesco Exchange- Traded Self-Indexed Fund Trust
Formerly: Vice President and Principal Financial Officer, The Invesco Funds; Vice President, Invesco AIM Advisers, Inc., Invesco AIM Capital Management, Inc. and Invesco AIM Private Asset Management, Inc.; Assistant Vice President and Assistant Treasurer, The Invesco Funds and Assistant Vice President, Invesco Advisers, Inc., Invesco AIM Capital Management, Inc. and Invesco AIM Private Asset Management, Inc.; and Treasurer, Invesco Exchange-Traded Fund Trust, Invesco Exchange-Traded Fund Trust II, Invesco India Exchange-Traded Fund Trust and Invesco Actively Managed Exchange-Traded Fund Trust
| N/A | N/A | ||||
Russell C. Burk — 1958 Senior Vice President and Senior Officer
| 2005 | Senior Vice President and Senior Officer, The Invesco Funds | N/A | N/A | ||||
Jeffrey H. Kupor – 1968 Senior Vice President, Chief Legal Officer and Secretary | 2018 | Head of Legal of the Americas, Invesco Ltd.; Senior Vice President and Secretary, Invesco Advisers, Inc. (formerly known as Invesco Institutional (N.A.), Inc.) (registered investment adviser); Senior Vice President and Secretary, Invesco Distributors, Inc. (formerly known as Invesco AIM Distributors, Inc.); Vice President and Secretary, Invesco Investment Services, Inc. (formerly known as Invesco AIM Investment Services, Inc.) Senior Vice President, Chief Legal Officer and Secretary, The Invesco Funds; Secretary and General Counsel, Invesco Investment Advisers LLC (formerly known as Van Kampen Asset Management); Secretary and General Counsel, Invesco Capital Markets, Inc. (formerly known as Van Kampen Funds Inc.) and Chief Legal Officer, Invesco Exchange-Traded Fund Trust, Invesco Exchange-Traded Fund Trust II, Invesco
| N/A | N/A | ||||
106 INVESCO OPPENHEIMER SENIOR FLOATING RATE PLUS FUND
Name, Year of Birth and Position(s) Held with the Trust | Trustee and/or Officer Since | Principal Occupation(s) During Past 5 Years | Number of Funds in Fund Complex Overseen by Trustee | Other Directorship(s) Held by Trustee During Past 5 Years | ||||
OTHER OFFICERS
| ||||||||
| Jeffrey H. Kupor (Continued) | India Exchange-Traded Fund Trust, Invesco Actively Managed Exchange-Traded Fund Trust, Invesco Actively Managed Exchange- Traded Commodity Fund Trust and Invesco Exchange-Traded Self-Indexed Fund Trust; Secretary, Invesco Indexing LLC; Secretary, W.L. Ross & Co., LLC; Secretary, Jemstep, Inc.
Formerly: Vice President, Jemstep, Inc.; Head of Legal, Worldwide Institutional, Invesco Ltd.; Secretary and General Counsel, INVESCO Private Capital Investments, Inc.; Senior Vice President, Secretary and General Counsel, Invesco Management Group, Inc. (formerly known as Invesco AIM Management Group, Inc.); Assistant Secretary, INVESCO Asset Management (Bermuda) Ltd.; Secretary and General Counsel, Invesco Private Capital, Inc.; Assistant Secretary and General Counsel, INVESCO Realty, Inc.; Secretary and General Counsel, Invesco Senior Secured Management, Inc.; and Secretary, Sovereign G./P. Holdings Inc.
| |||||||
Andrew R. Schlossberg – 1974 Senior Vice President | 2019 | Head of the Americas and Senior Managing Director, Invesco Ltd.; Director and Senior Vice President, Invesco Advisers, Inc. (formerly known as Invesco Institutional (N.A.), Inc.) (registered investment adviser); Director and Chairman, Invesco Investment Services, Inc. (formerly known as Invesco AIM Investment Services, Inc.) (registered transfer agent); Senior Vice President, The Invesco Funds; Director, Invesco Investment Advisers LLC (formerly known as Van Kampen Asset Management); Director, President and Chairman, Invesco Insurance Agency, Inc.
Formerly: Director, Invesco UK Limited; Director and Chief Executive, Invesco Asset Management Limited and Invesco Fund Managers Limited; Assistant Vice President, The Invesco Funds; Senior Vice President, Invesco Advisers, Inc. (formerly known as Invesco Institutional (N.A.), Inc.) (registered investment adviser); Director and Chief Executive, Invesco Administration Services Limited and Invesco Global Investment Funds Limited; Director, Invesco Distributors, Inc.;
| N/A | N/A | ||||
107 INVESCO OPPENHEIMER SENIOR FLOATING RATE PLUS FUND
TRUSTEES AND OFFICERSUnaudited / Continued
Name, Year of Birth and Position(s) Held with the Trust | Trustee and/or Officer Since | Principal Occupation(s) During Past 5 Years | Number of Funds in Fund Complex Overseen by Trustee | Other Directorship(s) Held by Trustee During Past 5 Years | ||||
OTHER OFFICERS
| ||||||||
| Andrew R. Schlossberg (Continued) | Head of EMEA, Invesco Ltd.; President, Invesco Actively Managed Exchange-Traded Commodity Fund Trust, Invesco Actively Managed Exchange-Traded Fund Trust, Invesco Exchange-Traded Fund Trust, Invesco Exchange-Traded Fund Trust II and Invesco India Exchange-Traded Fund Trust; Managing Director and Principal Executive Officer, Invesco Capital Management LLC
| |||||||
John M. Zerr — 1962 Senior Vice President | 2006 | Chief Operating Officer of the Americas; Senior Vice President, Invesco Advisers, Inc. (formerly known as Invesco Institutional (N.A.), Inc.) (registered investment adviser); Senior Vice President, Invesco Distributors, Inc. (formerly known as Invesco AIM Distributors, Inc.); Director and Vice President, Invesco Investment Services, Inc. (formerly known as Invesco AIM Investment Services, Inc.) Senior Vice President, The Invesco Funds; Managing Director, Invesco Capital Management LLC; Director, Invesco Investment Advisers LLC (formerly known as Van Kampen Asset Management); Senior Vice President, Invesco Capital Markets, Inc. (formerly known as Van Kampen Funds Inc.); Manager, Invesco Indexing LLC; Manager, Invesco Specialized Products, LLC; Director and Senior Vice President, Invesco Insurance Agency, Inc.; Member, Invesco Canada Funds Advisory Board; Director, President and Chief Executive Officer, Invesco Corporate Class Inc. (corporate mutual fund company); and Director, Chairman, President and Chief Executive Officer, Invesco Canada Ltd. (formerly known as Invesco Trimark Ltd./Invesco Trimark Ltèe) (registered investment adviser and registered transfer agent)
Formerly: Director and Senior Vice President, Invesco Management Group, Inc. (formerly known as Invesco AIM Management Group, Inc.); Secretary and General Counsel, Invesco Management Group, Inc. (formerly known as Invesco AIM Management Group, Inc.); Secretary, Invesco Investment Services, Inc. (formerly known as Invesco AIM Investment Services, Inc.); Chief Legal Officer and Secretary, The Invesco Funds; Secretary and
| N/A | N/A | ||||
108 INVESCO OPPENHEIMER SENIOR FLOATING RATE PLUS FUND
Name, Year of Birth and Position(s) Held with the Trust | Trustee and/or Officer Since | Principal Occupation(s) During Past 5 Years | Number of Funds in Fund Complex Overseen by Trustee | Other Directorship(s) Held by Trustee During Past 5 Years | ||||
OTHER OFFICERS
| ||||||||
| John M. Zerr (Continued) | General Counsel, Invesco Investment Advisers LLC (formerly known as Van Kampen Asset Management); Secretary and General Counsel, Invesco Capital Markets, Inc. (formerly known as Van Kampen Funds Inc.); Chief Legal Officer, Invesco Exchange-Traded Fund Trust, Invesco Exchange-Traded Fund Trust II, Invesco India Exchange-Traded Fund Trust, Invesco Actively Managed Exchange-Traded Fund Trust, Invesco Actively Managed Exchange- Traded Commodity Fund Trust and Invesco Exchange-Traded Self-Indexed Fund Trust; Secretary, Invesco Indexing LLC; Director, Secretary, General Counsel and Senior Vice President, Van Kampen Exchange Corp.; Director, Vice President and Secretary, IVZ Distributors, Inc. (formerly known as INVESCO Distributors, Inc.); Director and Vice President, INVESCO Funds Group, Inc.; Director and Vice President, Van Kampen Advisors Inc.; Director, Vice President, Secretary and General Counsel, Van Kampen Investor Services Inc.; Director and Secretary, Invesco Distributors, Inc. (formerly known as Invesco AIM Distributors, Inc.); Director, Senior Vice President, General Counsel and Secretary, Invesco AIM Advisers, Inc. and Van Kampen Investments Inc.; Director, Vice President and Secretary, Fund Management Company; Director, Senior Vice President, Secretary, General Counsel and Vice President, Invesco AIM Capital Management, Inc.; Chief Operating Officer and General Counsel, Liberty Ridge Capital, Inc. (an investment adviser)
| |||||||
Gregory G. McGreevey – 1962 Senior Vice President | 2012 | Senior Managing Director, Invesco Ltd.; Director, Chairman, President, and Chief Executive Officer, Invesco Advisers, Inc. (formerly known as Invesco Institutional (N.A.), Inc.) (registered investment adviser); Director, Invesco Mortgage Capital, Inc. and Invesco Senior Secured Management, Inc.; and Senior Vice President, The Invesco Funds; and President, SNW Asset Management Corporation
Formerly: Senior Vice President, Invesco Management Group, Inc. and Invesco Advisers, Inc.; Assistant Vice President, The Invesco Funds
| N/A | N/A | ||||
109 INVESCO OPPENHEIMER SENIOR FLOATING RATE PLUS FUND
TRUSTEES AND OFFICERSUnaudited / Continued
Name, Year of Birth and Position(s) Held with the Trust | Trustee and/or Officer Since | Principal Occupation(s) During Past 5 Years | Number of Funds in Fund Complex Overseen by Trustee | Other Directorship(s) Held by Trustee During Past 5 Years | ||||
OTHER OFFICERS
| ||||||||
Kelli Gallegos – 1970 Vice President, Principal Financial Officer and Assistant Treasurer | 2008 | Assistant Treasurer, Invesco Specialized Products, LLC; Vice President, Principal Financial Officer and Assistant Treasurer, The Invesco Funds; Principal Financial and Accounting Officer –Pooled Investments, Invesco Capital Management LLC; Vice President and Treasurer, Invesco Exchange- Traded Fund Trust, Invesco Exchange-Traded Fund Trust II, Invesco India Exchange-Traded Fund Trust, Invesco Actively Managed Exchange-Traded Fund Trust, Invesco Actively Managed Exchange-Traded Commodity Fund Trust and Invesco Exchange-Traded Self- Indexed Fund Trust
Formerly: Assistant Treasurer, Invesco Exchange-Traded Fund Trust, Invesco Exchange-Traded Fund Trust II, Invesco India Exchange-Traded Fund Trust, Invesco Actively Managed Exchange-Traded Fund Trust, Invesco Actively Managed Exchange-Traded Commodity Fund Trust and Invesco Exchange- Traded Self-Indexed Fund Trust; Assistant Treasurer, Invesco Capital Management LLC; Assistant Vice President, The Invesco Funds
| N/A | N/A | ||||
Crissie M. Wisdom – 1969 Anti-Money Laundering Compliance Officer | 2013 | Anti-Money Laundering Compliance Officer, Invesco Advisers, Inc. (formerly known as Invesco Institutional (N.A.), Inc.) (registered investment adviser), Invesco Capital Markets, Inc. (formerly known as Van Kampen Funds Inc.), Invesco Distributors, Inc., Invesco Investment Services, Inc., The Invesco Funds, and Invesco Exchange-Traded Fund Trust, Invesco Exchange-Traded Fund Trust II, Invesco India Exchange-Traded Fund Trust, Invesco Actively Managed Exchange-Traded Fund Trust, Invesco Actively Managed Exchange- Traded Commodity Fund Trust and Invesco Exchange-Traded Self-Indexed Fund Trust; Anti-Money Laundering Compliance Officer and Bank Secrecy Act Officer, INVESCO National Trust Company and Invesco Trust Company; and Fraud Prevention Manager and Controls and Risk Analysis Manager for Invesco Investment Services, Inc.
Formerly: Anti-Money Laundering Compliance Officer, Van Kampen Exchange Corp. and Invesco Management Group, Inc.
| N/A | N/A | ||||
110 INVESCO OPPENHEIMER SENIOR FLOATING RATE PLUS FUND
Name, Year of Birth and Position(s) Held with the Trust | Trustee and/or Officer Since | Principal Occupation(s) During Past 5 Years | Number of Funds in Fund Complex Overseen by Trustee | Other Directorship(s) Held by Trustee During Past 5 Years | ||||
OTHER OFFICERS
| ||||||||
Robert R. Leveille – 1969 Chief Compliance Officer | 2016 | Chief Compliance Officer, Invesco Advisers, Inc. (registered investment adviser); and Chief Compliance Officer, The Invesco Funds
Formerly: Chief Compliance Officer, Putnam Investments and the Putnam Funds
| N/A | N/A | ||||
The Statement of Additional Information of the Trust includes additional information about the Fund’s Trustees and is available upon request, without charge, by calling 1.800.959.4246. Please refer to the Fund’s Statement of Additional Information for information on the Fund’ssub-advisers.
| Office of the Fund | Investment Adviser | Distributor | Auditors | |||
| 11 Greenway Plaza, | Invesco Advisers, Inc. | Invesco Distributors, Inc. | PricewaterhouseCoopers | |||
| Suite 1000 | 1555 Peachtree Street, N.E. | 11 Greenway Plaza, | LLP | |||
| Houston, TX 77046-1173 | Atlanta, GA 30309 | Suite 1000 | 1000 Louisiana Street, | |||
| Houston, TX | Suite 5800 | |||||
| 77046-1173 | Houston, TX 77002-5021 | |||||
| Counsel to the Fund | Counsel to the | Transfer Agent | Custodian | |||
| Stradley Ronon Stevens & Young, | Independent Trustees | Invesco Investment | The Deutsche Bank Trust | |||
| LLP | Goodwin Procter LLP | Services, Inc. | Company Americas | |||
| 2005 Market Street, | 901 New York Avenue, N.W. | 11 Greenway Plaza, | 60 Wall Street, 17th | |||
| Suite 2600 | Washington, D.C. 20001 | Suite 1000 | Floor, NYC60-1701 | |||
| Philadelphia, PA 19103-7018 | Houston, TX | New York, NY | ||||
| 77046-1173 | 10005-2848 | |||||
111 INVESCO OPPENHEIMER SENIOR FLOATING RATE PLUS FUND
| ||||
Invesco recognizes the importance of protecting your personal and financial information when you visit our website located atwww.invesco.com (the “Website”). The following information is designed to help you understand the information collection practices at this Website. We will not sell, share or rent your personally identifiable information to others in contravention of this Privacy Policy. When we refer to ourselves as “we” or “Invesco” in this Privacy Policy, we mean our entire company including our affiliates, such as subsidiaries.
By visiting this Website, you are accepting the practices described in this Privacy Policy. If you do not agree to this policy, you may not use this Website. This Privacy Policy is subject to change without notice, from time to time in our sole discretion. You acknowledge that by accessing the Website after we have posted changes to this Privacy Policy, you are agreeing to this Privacy Policy as modified. Please review the Terms of Use to learn of other terms and conditions applicable to your use of the Website.
Please note that this Privacy Policy is not an exclusive statement of our privacy principles across all products and services. Other privacy principles or policies may apply depending on the products or services you obtain from Invesco, or the jurisdiction in which you transact with Invesco.
This Privacy Policy was last updated on May 6, 2018.
Information We Collect and Use
We collect personal information you choose to submit to the Website in order to process transactions requested by you and meet our contractual obligations. For example, you can choose to provide your name, contact information, social security number, or tax identification number in connection with accessing your account, or you can choose to provide your personal information when you fill out a secure account question form. Any information collected about you from the Website can, from time to time, be associated with other identifying information we have about you.
In addition, we may gather information about you automatically through your use of the Website, e.g. your IP address, how you navigate the Website, the organization from which you are accessing the Website, and the websites that you access before and after you visit the Website.
When you access the Website, we may also collect information such as unique device identifiers, your screen resolution and other device settings, information about your location, and analytical information about how you use the device from which you are viewing the Website. Where applicable, we may ask your permission before collecting certain information, such as precise geolocation information.
From time to time, we use or augment the personal information we have about you with information obtained from third parties. For example, we use third party information to confirm contact or financial information or to better understand your interests by associating demographic information from third parties with the information you have provided.
How We Use Personal Information
We use your personal information to respond to your inquiries and provide the products and services you request. We also use your information from time to time to deliver the content and services we believe
112 INVESCO OPPENHEIMER SENIOR FLOATING RATE PLUS FUND
you will find the most relevant and to provide customer service and support.
We also use the information you provide to further develop and improve our products and services. We aggregate and/orde-identify data about visitors to the Website for various business purposes including product and service development and improvement activities.
How We Share Personal Information
We collaborate with other companies and individuals to perform services for us and on our behalf and we collaborate with our affiliates, other companies and individuals with respect to particular products or services (“Providers”). Examples of Providers include data analysis firms, customer service and support providers, email and SMS vendors, andweb-hosting and development companies. Some Providers collect information for us or on our behalf on our Website. These Providers can be provided with access to personal information needed to perform their functions.
We reserve the right to disclose your personal information as required by law, when we believe disclosure is necessary to comply with a regulatory requirement, judicial proceeding, court order or legal process served on us, to protect the safety, rights or property of our customers, the public or Invesco or to enforce the Terms of Use.
If we sell or transfer a business unit (such as a subsidiary) or an asset (such as a website) to another company, we will share your personal information with such company. You will receive notice of such an event and the new entity will inform you of any changes to the practices in this Privacy Policy. If the new entity wishes to make additional use of your information, you have the right to decline such use at that time.
We occasionally disclose aggregate orde-identified data that is not personally identifiable with third parties.
Cookies and Other Tools
Invesco and its Providers collect information about you by using cookies, tracking pixels and other technologies. We use this information to better understand, customize and improve user experience with our websites, services and offerings as well as to manage our advertising. For example, we use web analytics services that use these technologies to gather information to help us understand how visitors engage with and navigate our Website, e.g., how and when pages in a site are visited and by how many visitors. We are also able to offer our visitors a more customized, relevant experience on our sites using these technologies by delivering content and functionality based on your preferences and interests.
Depending on their purpose, some cookies will only operate for the length of a single browsing session, while others have a longer life span to ensure that they fulfill their longer-term purposes. Your web browser can be set to allow you to control whether you will accept cookies or reject cookies, to notify you each time a cookie is sent to your browser, or to delete cookies that have already been set. If your browser is set to reject cookies, certain aspects of the Website that are cookie-enabled will not recognize you when you return to the website, and some Website functionality may be lost. The “Help” section of your browser may tell you how to prevent your browser from accepting cookies. To find out more about cookies, visitwww.aboutcookies.org.
113 INVESCO OPPENHEIMER SENIOR FLOATING RATE PLUS FUND
INVESCO’S PRIVACY NOTICEContinued
| ||||
Security
No data transmission over the internet can be 100% secure, so Invesco cannot ensure or warrant the security of any information you submit to us on this Website. However, Invesco seeks to protect your personal information from unauthorized access or use when you transact business on our Website using technical, administrative and procedural measures. Invesco makes no representation as to the reasonableness, efficacy, or appropriateness of the measures we use to safeguard such information.
Users are responsible for maintaining the secrecy of their own passwords. If you have reason to believe that your interaction with us is no longer secure (for example, if you feel that the security of any account you might have with us has been compromised), please immediately notify us by contacting us as specified below.
Transfer of Data to Other Countries
Any information you provide to Invesco through use of the Website may be stored and processed, transferred between and accessed from the United States, Canada and other countries which do not guarantee the same level of protection of personal information as the one in which you reside. However, Invesco will handle your personal information in accordance with this Privacy Policy regardless of where your personal information is stored/accessed.
Children’s Privacy
We are committed to protecting the privacy of children. We do not knowingly collect personal information from children under the age of 18. If you are under the age of 18, do not provide us with any personal information.
Contact Us
Please contact us if you have any questions or concerns about your personal information or require assistance in managing your choices.
Invesco Ltd.
1555 Peachtree St. NE
Atlanta, GA 30309
By phone:
(404)439-3236
By fax:
(404)962-8288
By email:
Anne.Gerry@invesco.com
Please update your account information by logging in or contact us by email or telephone as specified above to update your account information whenever such information ceases to be complete or accurate.
You may also contact us to:
114 INVESCO OPPENHEIMER SENIOR FLOATING RATE PLUS FUND
● Request that we amend, rectify, delete or update the personal data we hold about you;
● Where possible (e.g. in relation to marketing) amend or update your choices around processing;
● Request a copy of personal data held by us.
Disclaimer
Where the Website contains links to third-party websites/content/services that are not owned or controlled by Invesco, Invesco is not responsible for how these properties operate or treat your personal information so we recommend that you read the privacy policies and terms associated with these third party properties carefully.
115 INVESCO OPPENHEIMER SENIOR FLOATING RATE PLUS FUND
THIS PAGE INTENTIONALLY LEFT BLANK.
THIS PAGE INTENTIONALLY LEFT BLANK.
THIS PAGE INTENTIONALLY LEFT BLANK.
THIS PAGE INTENTIONALLY LEFT BLANK.
Explore High-Conviction Investing with Invesco

Go paperless with eDelivery
Visit invesco.com/edelivery to enjoy the convenience and security of anytime electronic access to your investment documents.
With eDelivery, you can elect to have any or all of the following materials delivered straight to your inbox to download, save and print from your own computer:
| ∎ | Fund reports and prospectuses |
| ∎ | Quarterly statements |
| ∎ | Daily confirmations |
| ∎ | Tax forms |
Invesco mailing information
Send general correspondence to Invesco Investment Services, Inc., P.O. Box 219078, Kansas City, MO 64121-9078.
| ||||
| Invesco Distributors, Inc. | O-SFLRP-AR-1 | 09272019 | ||

| ITEM 2. | CODE OF ETHICS. |
There were no amendments to the Code of Ethics (the “Code”) that applies to the Registrant’s Principal Executive Officer (“PEO”) and Principal Financial Officer (“PFO”) during the period covered by the report. The Registrant did not grant any waivers, including implicit waivers, from any provisions of the Code to the PEO or PFO during the period covered by this report.
| ITEM 3. | AUDIT COMMITTEE FINANCIAL EXPERT. |
The Board of Trustees has determined that the Registrant has at least one audit committee financial expert serving on its Audit Committee. The Audit Committee financial experts are David C. Arch, Bruce L. Crockett, Cynthia Hostetler, Elizabeth Krentzman, Anthony J. LaCava, Jr., Teresa M. Ressel, Raymond Stickel, Jr., Robert C. Troccoli and James Vaughn. David C. Arch, Bruce L. Crockett, Cynthia Hostetler, Elizabeth Krentzman, Anthony J. LaCava, Jr., Teresa M. Ressel, Raymond Stickel, Jr., Robert C. Troccoli and James Vaughn are “independent” within the meaning of that term as used in FormN-CSR.
| ITEM 4. | PRINCIPAL ACCOUNTANT FEES AND SERVICES. |
PricewaterhouseCoopers LLP (“PwC”) informed the Audit Committee that it has identified an issue related to its independence under Rule2-01(c)(1)(ii)(A) of RegulationS-X (referred to as the Loan Rule). The Loan Rule prohibits accounting firms, such as PricewaterhouseCoopers LLP, from being deemed independent if they have certain financial relationships with their audit clients or certain affiliates of those clients. The Trust is required under various securities laws to have its financial statements audited by an independent accounting firm.
The Loan Rule specifically provides that an accounting firm would not be independent if it or certain affiliates and covered persons receives a loan from a lender that is a record or beneficial owner of more than ten percent of an audit client’s equity securities (referred to as a “more than ten percent owner”). For purposes of the Loan Rule, audit clients include the Funds as well as all registered investment companies advised by the Adviser and its affiliates, including other subsidiaries of the Adviser’s parent company, Invesco Ltd. (collectively, the Invesco Fund Complex). PwC informed the Trust it and certain affiliates and covered persons have relationships with lenders who hold, as record owner, more than ten percent of the shares of certain funds within the Invesco Fund Complex.
On June 20, 2016, the SEC Staff issued a“no-action” letter to another mutual fund complex (see Fidelity Management & Research Company et al.,No-Action Letter) related to the audit independence issue described above. In that letter, the SEC confirmed that it would not recommend enforcement action against a fund that relied on audit services performed by an audit firm that was not in compliance with the Loan Rule in certain specified circumstances. On June 18, 2019, the SEC adopted amendments to the Loan Rule (the “Amendments”) addressing many of the issues that led to the issuance of theno-action letter. The Amendments become effective and supersede theno-action letter on October 3, 2019, 90 days after publication in the Federal Register. In connection with prior independence determinations, PwC communicated, as contemplated by theno-action letter, that it believes that it remains objective and impartial and that a reasonable investor possessing all the facts would conclude that PwC is able to exhibit the requisite objectivity and impartiality to report on the Funds’ financial statements as the independent registered public accounting firm. PwC also represented that it has complied with PCAOB Rule 3526(b)(1) and (2), which are conditions to the Funds relying on the no action letter, and affirmed that it is an independent accountant within the meaning of PCAOB Rule 3520. Therefore, the Adviser, the Funds and PwC concluded that PwC could continue as the Funds’ independent registered public accounting firm. The Invesco Fund Complex relied upon theno-action letter in reaching this conclusion.
If in the future the independence of PwC is called into question under the Loan Rule by circumstances that are not addressed in the SEC’sno-action letter, the Funds will need to take other action in order for the Funds’ filings with the SEC containing financial statements to be deemed compliant with applicable securities laws. Such additional actions could result in additional costs, impair the ability of the Funds to issue new shares or have other material adverse effects on the Funds. The SECno-action relief was initially set to expire 18 months from issuance but has been extended by the SEC without an expiration date, except that theno-action letter will be withdrawn upon the effectiveness of the Amendments.
During the reporting period, PwC advised the Audit Committee of the following matters for consideration under the SEC’s auditor independence rules. PwC advised the Audit Committee that a PwC Senior Associate, two PwC Managers, a PwC Senior Manager and a PwC Director each held financial interests in investment companies within the Invesco Fund Complex that were inconsistent with the requirements of Rule2-01(c)(1) of RegulationS-X. PwC noted, among other things, that during the time of its audit, the engagement team was not aware of the investments (or with respect to the PwC Senior Associate and one PwC Manager. was not aware until after the investments were confirmed as SEC exceptions), the individuals were not in the chain of command of the audit or the audit partners of Invesco or the affiliate of the Registrant, the services each individual provided were not relied upon by the audit engagement team with respect to the audit of the Registrant or its affiliates (or with respect to the PwC Senior Associate, the services were performed by an individual who did not have decision-making responsibilities for matters that materially affected the audit and were reviewed by team members at least two levels higher than the PwC Senior Associate), and the investments were not material to the net worth of each individual or their respective immediate family members which they considered in reaching their conclusion. PwC advised the Audit Committee that it believes its objectivity and impartiality had not been adversely affected by these matters as they related to the audit of the Registrant.
On May 24, 2019, certain investment advisor subsidiaries of Invesco Ltd. assumed management responsibility from Oppenheimer Funds, Inc. (“OFI”) for 83open-end mutual funds and 20 exchange-traded funds (collectively, the “Oppenheimer Funds”). Assumption of management responsibility for the Oppenheimer Funds was accomplished through the reorganization of each Oppenheimer Fund into a new Invesco shell fund (collectively, the “New Invesco Funds”) that did not havepre-existing assets (together, the “Reorganizations”). The Reorganizations were part of the acquisition by Invesco Ltd. (together with its subsidiaries, “Invesco”) of the asset management business of OFI (including the Oppenheimer Funds) from Massachusetts Mutual Life Insurance Company (“MassMutual”), which was also consummated on May 24, 2019 (the “Acquisition”). Subsequent to the Acquisition, MassMutual became a significant shareholder of Invesco, and the Invesco Ltd. board of directors expanded by one director with the addition of a director selected by MassMutual.
Prior to the consummation of the Acquisition and the Reorganizations on May 24, 2019, PwC completed an independence assessment to evaluate the services and relationships with OFI and its affiliates, which became affiliates of Invesco upon the closing of the Acquisition. The assessment identified the following relationship and services that are inconsistent with the auditor independence rules under Rule2-01 of RegulationS-X (“Rule2-01”) if provided to an affiliate of an audit client. A retired PwC partner who receives a benefit from PwC that is not fully funded, served as a member of Audit Committee of the Boards of Trustees of certain Oppenheimer Funds prior to the Acquisition (the“Pre-Reorganization Relationship”). Additionally, PwC provided certainnon-audit services including, expert legal services to one Oppenheimer Fund, custody of client assets in connection with payroll services, anon-audit service performed pursuant to a success-based fee,non-audit services in which PwC acted as an advocate on behalf of a MassMutual foreign affiliate and certain employee activities undertaken in connection with the provision of non-audit services for MassMutual and certain MassMutual foreign affiliates (collectively, the“Pre-Reorganization Services”).
PwC and the Audit Committees of the New Invesco Funds each considered the impact that thePre-Reorganization Relationship and Services have on PwC’s independence with respect to the New Invesco Funds. On the basis of the nature of the relationship and services performed, and in particular the mitigating factors described below, PwC
concluded that a reasonable investor, possessing knowledge of all the relevant facts and circumstances regarding thePre-Reorganization Relationship and Services, would conclude that thePre-Reorganization Relationship and Services do not impair PwC’s ability to exhibit the requisite objectivity and impartiality to report on the financial statements of the New Invesco Funds for the years ending May 31, 2019 – April 30, 2020 (“PwC’s Conclusion”).
The Audit Committees of the Boards of Trustees of the New Invesco Funds, based upon PwC’s Conclusion and the concurrence of Invesco, considered the relevant facts and circumstances including the mitigating factors described below and, after careful consideration, concluded that PwC is capable of exercising objective and impartial judgment in connection with its audits of the financial statements of the New Invesco Funds that the respective Boards of Trustees oversee.
Mitigating factors that PwC and the Audit Committees considered in reaching their respective conclusions included, among others, the following factors:
| • | none of thePre-Reorganization Relationship or Services created a mutuality of interest between PwC and the New Invesco Funds; |
| • | PwC will not act in a management or employee capacity for the New Invesco Funds or their affiliates during any portion of PwC’s professional engagement period; |
| • | other than the expert legal services,Pre-Reorganization Services that have been provided to OFI, MassMutual and their affiliates do not have any impact on the financial statements of the New Invesco Funds; |
| • | as it relates to the expert legal services, while the service provided by PwC related to litigation involving one Oppenheimer Fund, the impact of the litigation on the Oppenheimer Fund’s financial statements was based upon OFI’s decision, and OFI management represented that the PwC service was not considered a significant component of its decision; |
| • | while certain employees of OFI who were involved in the financial reporting process of the Oppenheimer Funds will be employed by Invesco subsequent to the Reorganizations, existing officers of other Invesco Funds will serve as Principal Executive Officer and Principal Financial Officer or equivalent roles for the New Invesco Funds, and are ultimately responsible for the accuracy of all financial statement assertions for the entirety of the financial reporting periods for the New Invesco Funds; |
| • | thePre-Reorganization Services giving rise to the lack of independence were provided to, or entered into with, OFI, MassMutual and their affiliates at a time when PwC had no independence restriction with respect to these entities; |
| • | with the exception of the expert legal service provided to one Oppenheimer Fund, none of thePre-Reorganization Services affected the operations or financial reporting of the New Invesco Funds; |
| • | thePre-Reorganization Services provided by PwC to OFI, MassMutual and their affiliates were performed by persons who were not, and will not be, part of the audit engagement team for the New Invesco Funds; and |
| • | the fees associated with thePre-Reorganization Services were not material to MassMutual, Invesco or PwC. |
(a) to (d)
Fees Billed by PwC Related to the Registrant
PwC billed the series of the Registrant with a fiscal year end of August 31, 2019 and July 31, 2019, respectively (each a “Fund”) aggregate fees for services rendered to these Funds as shown in the following tables. Each Fund is newly organized and was created, respectively, for the purpose of acquiring the assets and liabilities of a corresponding predecessor fund (each, a “Reorganization”). Each Reorganization was consummated after the close of business on May 24, 2019, prior to which each Fund had not yet commenced operations. Accordingly, the information shown in the following tables has been provided for the periods since each Fund’s commencement of operations. The Audit Committeepre-approved all audit andnon-audit services provided to the Funds.
| Fees Billed for Services Rendered to the Registrant for fiscal year end August 31, 2019 | Fees Billed for Services Rendered to the Registrant for fiscal year end July 31, 2019 | |||||||
Audit Fees | $ | 117,113 | $ | 156,150 | ||||
Audit-Related Fees | $ | 0 | $ | 0 | ||||
Tax Fees(1) | $ | 9,600 | $ | 9,600 | ||||
All Other Fees | $ | 0 | $ | 0 | ||||
|
|
|
| |||||
Total Fees | $ | 126,713 | $ | 165,750 | ||||
(g) PwC billed the Registrant aggregatenon-audit fees of $9,600 for the fiscal year ended August 31, 2019 and $9,600 for the fiscal year ended July 31, 2019.
| (1) | Tax Fees for the fiscal years ended August 31, 2019 and July 31, 2019 include fees billed for reviewing tax returns and/or services related to tax compliance. |
Fees Billed by PwC Related to Invesco and Invesco Affiliates
PwC billed Invesco Advisers, Inc. (“Invesco”), each Fund’s adviser, and any entity controlling, controlled by or under common control with Invesco that provides ongoing services to each Fund (“Invesco Affiliates”) aggregate fees forpre-approvednon-audit services rendered to Invesco and Invesco Affiliates for the periods since each Fund’s commencement of operations as shown in the following tables. The Audit Committeepre-approved allnon-audit services provided to Invesco and Invesco Affiliates.
| Fees Billed for Non-Audit Services Rendered to Invesco and Affiliates for fiscal year end August 31, 2019 That Were Required to bePre-Approved by the Registrant’s Audit Committee | Fees Billed for Non-Audit Services Rendered to Invesco and Affiliates for fiscal year end July 31, 2019 That Were Required to bePre-Approved by the Registrant’s Audit Committee | |||||||
Audit-Related Fees(1) | $ | 690,000 | $ | 690,000 | ||||
Tax Fees | $ | 0 | $ | 0 | ||||
All Other Fees | $ | 0 | $ | 0 | ||||
|
|
|
| |||||
Total Fees | $ | 690,000 | $ | 690,000 | ||||
| (1) | Audit-Related Fees for the fiscal years ended August 31, 2019 and July 31, 2019 include fees billed related to reviewing controls at a service organization. |
(e)(2) There were no amounts that werepre-approved by the Audit Committee pursuant to the de minimis exception under Rule2-01 of RegulationS-X.
(f) Not applicable.
(g) Including the fees for services not required to bepre-approved by the registrant’s audit committee, PwC billed Invesco and Invesco Affiliates aggregatenon-audit fees of $3,901,000 for the fiscal year ended August 31, 2019 and $3,901,000 for the fiscal year ended July 31, 2019 fornon-audit services rendered to Invesco and Invesco Affiliates.
PwC provided audit services to the Investment Company complex of approximately $34 million.
(h) The Audit Committee also has considered whether the provision ofnon-audit services that were rendered to Invesco and Invesco Affiliates that were not required to bepre-approved pursuant to SEC regulations, if any, is compatible with maintaining PwC’s independence.
(e)(1)
PRE-APPROVAL OF AUDIT ANDNON-AUDIT SERVICES
POLICIES AND PROCEDURES
As adopted by the Audit Committees
of the Invesco Funds (the “Funds”)
Last Amended March 29, 2017
| I. | Statement of Principles |
The Audit Committees (the “Audit Committee”) of the Boards of Trustees of the Funds (the “Board”) have adopted these policies and procedures (the “Procedures”) with respect to thepre-approval of audit andnon-audit services to be provided by the Funds’ independent auditor (the “Auditor”) to the Funds, and to the Funds’ investment adviser(s) and any entity controlling, controlled by, or under common control with the investment adviser(s) that provides ongoing services to the Funds (collectively, “Service Affiliates”).
Under Section 202 of the Sarbanes-Oxley Act of 2002, all audit andnon-audit services provided to the Funds by the Auditor must be preapproved by the Audit Committee. Rule2-01 of RegulationS-X requires that the Audit Committee alsopre-approve a Service Affiliate’s engagement of the Auditor fornon-audit services if the engagement relates directly to the operations and financial reporting of the Funds (a “Service Affiliate’s Covered Engagement”).
These Procedures set forth the procedures and the conditions pursuant to which the Audit Committee maypre-approve audit andnon-audit services for the Funds and a Service Affiliate’s Covered Engagement pursuant to rules and regulations of the Securities and Exchange Commission (“SEC”) and other organizations and regulatory bodies applicable to the Funds (“Applicable Rules”).1 They address both generalpre-approvals without consideration of specificcase-by-case services (“general pre-approvals”) and pre-approvals on acase-by-case basis (“specific pre-approvals”). Any services requiringpre-approval that are not within the scope of generalpre-approvals hereunder are subject to specificpre-approval. These Procedures also address the delegation by the Audit Committee ofpre-approval authority to the Audit Committee Chair or Vice Chair.
| II. | Pre-Approval of Fund Audit Services |
The annual Fund audit services engagement, including terms and fees, is subject to specificpre-approval by the Audit Committee. Audit services include the annual financial statement audit and other procedures required to be performed by an independent auditor to be able to form an opinion on the Funds’ financial statements. The Audit Committee will receive, review and consider
| 1 | Applicable Rules include, for example, New York Stock Exchange (“NYSE”) rules applicable toclosed-end funds managed by Invesco and listed on NYSE. |
sufficient information concerning a proposed Fund audit engagement to make a reasonable evaluation of the Auditor’s qualifications and independence. The Audit Committee will oversee the Fund audit services engagement as necessary, including approving any changes in terms, audit scope, conditions and fees.
In addition to approving the Fund audit services engagement at least annually and specifically approving any changes, the Audit Committee may generally or specificallypre-approve engagements for other audit services, which are those services that only an independent auditor reasonably can provide. Other audit services may include services associated with SEC registration statements, periodic reports and other documents filed with the SEC.
| III. | General and SpecificPre-Approval ofNon-Audit Fund Services |
The Audit Committee will consider, at least annually, the list of GeneralPre-ApprovedNon-Audit Services which list may be terminated or modified at any time by the Audit Committee. To inform the Audit Committee’s review and approval of GeneralPre-ApprovedNon-Audit Services, the Funds’ Treasurer (or his or her designee) and Auditor shall provide such information regarding independence or other matters as the Audit Committee may request.
Any services or fee ranges that are not within the scope of GeneralPre-ApprovedNon-Audit Services have not received generalpre-approval and require specificpre-approval. Each request for specificpre-approval by the Audit Committee for services to be provided by the Auditor to the Funds must be submitted to the Audit Committee by the Funds’ Treasurer (or his or her designee)and must include detailed information about the services to be provided, the fees or fee ranges to be charged, and other relevant information sufficient to allow the Audit Committee to consider whether topre-approve such engagement, including evaluating whether the provision of such services will impair the independence of the Auditor and is otherwise consistent with Applicable Rules.
| IV. | Non-Audit Service Types |
The Audit Committee may provide either general or specificpre-approval of audit-related, tax or other services, each as described in more detail below.
| a. | Audit-Related Services |
“Audit-related services” are assurance and related services that are reasonably related to the performance of the audit or review of the Fund’s financial statements or that are traditionally performed by an independent auditor. Audit-related services include, among others, accounting consultations related to accounting, financial reporting or disclosure matters not classified as “Audit services”; assistance with understanding and implementing new accounting and financial reporting guidance from rulemaking authorities; services related to mergers, acquisitions or dispositions; compliance with ratings agency requirements and interfund lending activities; and assistance with internal control reporting requirements.
| b. | Tax Services |
“Tax services” include, but are not limited to, the review and signing of the Funds’ federal tax returns, the review of required distributions by the Funds and consultations regarding tax matters such as the tax treatment of new investments or the impact of new regulations. The Audit Committee will not approve proposed services of the Auditor which the Audit Committee believes
are to be provided in connection with a service or transaction initially recommended by the Auditor, the sole business purpose of which may be tax avoidance and the tax treatment of which may not be supported in the Internal Revenue Code and related regulations. The Audit Committee will consult with the Funds’ Treasurer (or his or her designee) and may consult with outside counsel or advisers as necessary to ensure the consistency of tax services rendered by the Auditor with the foregoing policy. The Auditor shall not represent any Fund or any Service Affiliate before a tax court, district court or federal court of claims.
Each request to provide tax services under either the general or specificpre-approval of the Audit Committee will include a description from the Auditor in writing of (i) the scope of the service, the fee structure for the engagement, and any side letter or other amendment to the engagement letter, or any other agreement (whether oral, written, or otherwise) between the Auditor and the Funds, relating to the service; and (ii) any compensation arrangement or other agreement, such as a referral agreement, a referral fee orfee-sharing arrangement, between the Auditor (or an affiliate of the Auditor) and any person (other than the Funds or Service Affiliates receiving the services) with respect to the promoting, marketing, or recommending of a transaction covered by the service. The Auditor will also discuss with the Audit Committee the potential effects of the services on the independence of the Auditor, and document the substance of its discussion with the Audit Committee.
| c. | Other Services |
The Audit Committee maypre-approve other non-audit services so long as the Audit Committee believes that the service will not impair the independence of the Auditor.Appendix I includes a list of services that the Auditor is prohibited from performing by the SEC rules.Appendix I also includes a list of services that would impair the Auditor’s independence unless the Audit Committee reasonably concludes that the results of the services will not be subject to audit procedures during an audit of the Funds’ financial statements.
| V. | Pre-Approval of Service Affiliate’s Covered Engagements |
Rule2-01 of RegulationS-X requires that the Audit Committeepre-approve a Service Affiliate’s engagement of the Auditor fornon-audit services if the engagement relates directly to the operations and financial reporting of the Funds, defined above as a “Service Affiliate’s Covered Engagement”.
The Audit Committee may provide either general or specificpre-approval of any Service Affiliate’s Covered Engagement, including for audit-related, tax or other services, as described above, if the Audit Committee believes that the provision of the services to a Service Affiliate will not impair the independence of the Auditor with respect to the Funds. Any Service Affiliate’s Covered Engagements that are not within the scope of GeneralPre-ApprovedNon-Audit Services have not received generalpre-approval and require specificpre-approval.
Each request for specificpre-approval by the Audit Committee of a Service Affiliate’s Covered Engagement must be submitted to the Audit Committee by the Funds’ Treasurer (or his or her designee)and must include detailed information about the services to be provided, the fees or fee ranges to be charged, a description of the current status of thepre-approval process involving other
audit committees in the Invesco investment company complex (as defined in Rule2-201 of RegulationS-X) with respect to the proposed engagement, and other relevant information sufficient to allow the Audit Committee to consider whether the provision of such services will impair the independence of the Auditor from the Funds. Additionally, the Funds’ Treasurer (or his or her designee) and the Auditor will provide the Audit Committee with a statement that the proposed engagement requirespre-approval by the Audit Committee, the proposed engagement, in their view, will not impair the independence of the Auditor and is consistent with Applicable Rules, and the description of the proposed engagement provided to the Audit Committee is consistent with that presented to or approved by the Invesco audit committee.
Information about all Service Affiliate engagements of the Auditor fornon-audit services, whether or not subject topre-approval by the Audit Committee, shall be provided to the Audit Committee at least quarterly, to allow the Audit Committee to consider whether the provision of such services is compatible with maintaining the Auditor’s independence from the Funds. The Funds’ Treasurer and Auditor shall provide the Audit Committee with sufficiently detailed information about the scope of services provided and the fees for such services, to ensure that the Audit Committee can adequately consider whether the provision of such services is compatible with maintaining the Auditor’s independence from the Funds.
| VI. | Pre-Approved Fee Levels or Established Amounts |
Pre-approved fee levels or ranges for audit andnon-audit services to be provided by the Auditor to the Funds, and for a Service Affiliate’s Covered Engagement, under generalpre-approval or specificpre-approval will be set periodically by the Audit Committee. Any proposed fees exceeding 110% of the maximumpre-approved fee levels or ranges for such services or engagements will be promptly presented to the Audit Committee and will require specificpre-approval by the Audit Committee before payment of any additional fees is made.
| VII. | Delegation |
The Audit Committee hereby delegates, subject to the dollar limitations set forth below, specific authority to its Chair, or in his or her absence, Vice Chair, topre-approve audit andnon-audit services proposed to be provided by the Auditor to the Funds and/or a Service Affiliate’s Covered Engagement, between Audit Committee meetings. Such delegation does not preclude the Chair or Vice Chair from declining, on a case by case basis, to exercise his or her delegated authority and instead convening the Audit Committee to consider andpre-approve any proposed services or engagements.
Notwithstanding the foregoing, the Audit Committee mustpre-approve: (a) anynon-audit services to be provided to the Funds for which the fees are estimated to exceed $500,000; (b) any Service Affiliate’s Covered Engagement for which the fees are estimated to exceed $500,000; or (c) any cost increase to any previously approved service or engagement that exceeds the greater of $250,000 or 50% of the previously approved fees up to a maximum increase of $500,000.
| VIII. | Compliance with Procedures |
Notwithstanding anything herein to the contrary, failure topre-approve any services or engagements that are not required to bepre-approved pursuant to the de minimis exception provided for in Rule2-01(c)(7)(i)(C) of RegulationS-X shall not constitute a violation of these Procedures. The Audit Committee has designated the Funds’ Treasurer to ensure services and engagements arepre-approved in compliance with these Procedures. The Funds’ Treasurer will immediately report to the Chair of the Audit Committee, or the Vice Chair in his or her absence, any breach of these Procedures that comes to the attention of the Funds’ Treasurer or any services or engagements that are not required to bepre-approved pursuant to the de minimis exception provided for in Rule2-01(c)(7)(i)(C) of RegulationS-X.
On at least an annual basis, the Auditor will provide the Audit Committee with a summary of allnon-audit services provided to any entity in the investment company complex (as defined in section2-01(f)(14) of RegulationS-X, including the Funds and Service Affiliates) that were notpre-approved, including the nature of services provided and the associated fees.
| IX. | Amendments to Procedures |
All material amendments to these Procedures must be approved in advance by the Audit Committee.Non-material amendments to these Procedures may be made by the Legal and Compliance Departments and will be reported to the Audit Committee at the next regularly scheduled meeting of the Audit Committee.
Appendix I
Non-Audit Services That May Impair the Auditor’s Independence
The Auditor is not independent if, at any point during the audit and professional engagement, the Auditor provides the followingnon-audit services:
| • | Management functions; |
| • | Human resources; |
| • | Broker-dealer, investment adviser, or investment banking services; |
| • | Legal services; |
| • | Expert services unrelated to the audit; |
| • | Any service or product provided for a contingent fee or a commission; |
| • | Services related to marketing, planning, or opining in favor of the tax treatment of confidential transactions or aggressive tax position transactions, a significant purpose of which is tax avoidance; |
| • | Tax services for persons in financial reporting oversight roles at the Fund; and |
| • | Any other service that the Public Company Oversight Board determines by regulation is impermissible. |
An Auditor is not independent if, at any point during the audit and professional engagement, the Auditor provides the followingnon-audit services unless it is reasonable to conclude that the results of the services will not be subject to audit procedures during an audit of the Funds’ financial statements:
| • | Bookkeeping or other services related to the accounting records or financial statements of the audit client; |
| • | Financial information systems design and implementation; |
| • | Appraisal or valuation services, fairness opinions, orcontribution-in-kind reports; |
| • | Actuarial services; and |
| • | Internal audit outsourcing services. |
| ITEM 5. | AUDIT COMMITTEE OF LISTED REGISTRANTS. |
Not applicable.
| ITEM 6. | SCHEDULE OF INVESTMENTS. |
Investments in securities of unaffiliated issuers is included as part of the reports to stockholders filed under Item 1 of this Form.
| ITEM 7. | DISCLOSURE OF PROXY VOTING POLICIES AND PROCEDURES FORCLOSED-END MANAGEMENT INVESTMENT COMPANIES. |
Not applicable.
| ITEM 8. | PORTFOLIO MANAGERS OFCLOSED-END MANAGEMENT COMPANIES. |
Not applicable.
| ITEM 9. | PURCHASES OF EQUITY SECURITIES BYCLOSED-END MANAGEMENT INVESTMENT COMPANY AND AFFILIATED PURCHASERS. |
Not applicable.
| ITEM 10. | SUBMISSION OF MATTERS TO A VOTE OF SECURITY HOLDERS. |
None
| ITEM 11. | CONTROLS AND PROCEDURES. |
| (a) | As of September 19, 2019, an evaluation was performed under the supervision and with the participation of the officers of the Registrant, including the Principal Executive Officer (“PEO”) and Principal Financial Officer (“PFO”), to assess the effectiveness of the Registrant’s disclosure controls and procedures, as that term is defined in Rule30a-3(c) under the Investment Company Act of 1940 (“Act”), as amended. Based on that evaluation, |
| the Registrant’s officers, including the PEO and PFO, concluded that, as of September 19, 2019, the Registrant’s disclosure controls and procedures were reasonably designed so as to ensure: (1) that information required to be disclosed by the Registrant on FormN-CSR is recorded, processed, summarized and reported within the time periods specified by the rules and forms of the Securities and Exchange Commission; and (2) that material information relating to the Registrant is made known to the PEO and PFO as appropriate to allow timely decisions regarding required disclosure. |
| (b) | There have been no changes in the Registrant’s internal control over financial reporting (as defined in Rule30a-3(d) under the Act) that occurred during the period covered by this report that have materially affected, or are reasonably likely to materially affect, the Registrant’s internal control over financial reporting. |
| ITEM 12. | DISCLOSURE OF SECURITIES LENDING ACTIVITIES FORCLOSED-END MANAGEMENT INVESTMENT COMPANIES. |
Not applicable.
| ITEM 13. | EXHIBITS. |
| 13(a) (1) | Code of Ethics. |
| 13(a) (2) | Certifications of principal executive officer and principal financial officer as required by Rule30a-2(a) under the Investment Company Act of 1940. |
| 13(a) (3) | Not applicable. |
| 13(a) (4) | Registrant’s Independent Public Accountant, attached as Exhibit 99.ACCT |
| 13(b) | Certifications of principal executive officer and principal financial officer as required by Rule30a-2(b) under the Investment Company Act of 1940. |
SIGNATURES
Pursuant to the requirements of the Securities Exchange Act of 1934 and the Investment Company Act of 1940, the Registrant has duly caused this report to be signed on its behalf by the undersigned, thereunto duly authorized.
Registrant: AIM Counselor Series Trust (Invesco Counselor Series Trust)
| By: | /s/ Sheri Morris | |
| Sheri Morris | ||
| Principal Executive Officer | ||
| Date: | October 14, 2019 | |
Pursuant to the requirements of the Securities and Exchange Act of 1934 and the Investment Company Act of 1940, this report has been signed below by the following persons on behalf of the Registrant and in the capacities and on the dates indicated.
| By: | /s/ Sheri Morris | |
| Sheri Morris | ||
| Principal Executive Officer | ||
| Date: | October 14, 2019 | |
| By: | /s/ Kelli Gallegos | |
| Kelli Gallegos | ||
| Principal Financial Officer | ||
| Date: | October 14, 2019 | |