UNITED STATES
SECURITIES AND EXCHANGE COMMISSION
Washington, D.C. 20549
FORMN-CSR
CERTIFIED SHAREHOLDER REPORT OF REGISTERED
MANAGEMENT INVESTMENT COMPANIES
| | |
Investment Company Act file number | | 811-09913 |
|
AIM Counselor Series Trust (Invesco Counselor Series Trust) |
(Exact name of registrant as specified in charter) |
|
11 Greenway Plaza, Suite 1000 Houston, Texas 77046 |
(Address of principal executive offices) (Zip code) |
|
Sheri Morris 11 Greenway Plaza, Suite 1000 Houston, Texas 77046 |
(Name and address of agent for service) |
Registrant’s telephone number, including area code: (713)626-1919
Date of fiscal year end: 08/31
Date of reporting period: 08/31/19
Item 1. Reports to Stockholders.
| Annual Report to Shareholders | August 31, 2019 |
Invesco American Franchise Fund
Nasdaq:
A: VAFAX ■ C: VAFCX ■ R: VAFRX ■ Y: VAFIX ■ R5: VAFNX ■ R6: VAFFX

Beginning on January 1, 2021, as permitted by regulations adopted by the Securities and Exchange Commission, paper copies of the Fund’s shareholder reports will no longer be sent by mail, unless you specifically request paper copies of the reports from the Fund or from your financial intermediary, such as a broker-dealer or bank. Instead, the reports will be made available on the Fund’s website, and you will be notified by mail each time a report is posted and provided with a website link to access the report.
If you already elected to receive shareholder reports electronically, you will not be affected by this change and you need not take any action. You may elect to receive shareholder reports and other communications from the Fund electronically by contacting your financial intermediary (such as a broker-dealer or bank) or, if you are a direct investor, by enrolling at invesco.com/edelivery.
You may elect to receive all future reports in paper free of charge. If you invest through a financial intermediary, you can contact your financial intermediary to request that you continue to receive paper copies of your shareholder reports. If you invest directly with the Fund, you can call (800) 959-4246 to let the Fund know you wish to continue receiving paper copies of your shareholder reports. Your election to receive reports in paper will apply to all funds held with your financial intermediary or all funds held with the fund complex if you invest directly with the Fund.
Dear Shareholders:
This annual report includes information about your Fund, including performance data and a complete list of its investments as of the close of the reporting period. Inside is a discussion of how your Fund was managed and the factors that affected its performance during the reporting period.
Throughout the reporting period, global equity markets remained volatile. Investor sentiment ranged from elation to fear. The reporting period began with several US equity indexes redefining new highs. The exuberance, however, ended in October 2018 as global equities, in particular US stocks, sold off, with the sharpest decline in December. The catalyst for the sell-off was a combination of ongoing trade concerns between the US and China, fears of a global economic slowdown and lower oil prices from a supply glut. Gains posted earlier in 2018 for global equities were erased, while US Treasury bonds, along with government and municipal bonds, rallied as investors fled to “safe haven” assets.
At the start of 2019, global equity markets rebounded strongly buoyed by more dovish central banks and optimism about a potential US-China trade deal. In May, US-China trade concerns and slowing global growth led to a global equity sell-off and rally in U.S. Treasuries. Despite the May sell-off, domestic equity markets rallied in June in anticipation of a U.S. Federal Reserve (the Fed) rate cut and closed the second quarter with modest gains. As the reporting period ended in August, market volatility once again increased as the US Treasury yield curve inverted several times magnifying concerns that the US economy could be headed into a recession.
During the reporting period, the Fed both raised and lowered the federal funds rate. Given signs of a strong economy, the Fed raised rates two times: in September and December 2018. In 2019, however, the Fed altered its outlook on further rate hikes leaving rates unchanged for the first half of the year. In July, the Fed lowered interest rates for the first time in 11 years. As 2019 unfolds, we’ll see how the interplay of interest rates, economic data, geopolitics and a host of other factors affect US and overseas equity and fixed income markets.
Investor uncertainty and market volatility, such as we witnessed during the reporting period, are unfortunate facts of life when it comes to investing. That’s why Invesco encourages investors to work with a professional financial adviser who can stress the importance of starting to save and invest early and the importance of adhering to a disciplined investment plan. A financial adviser who knows your unique financial situation, investment goals and risk tolerance can be an invaluable partner as you seek to achieve your financial goals. He or she can offer a long-term perspective when markets are volatile and time-tested advice and guidance when your financial situation or investment goals change.
Visit our website for more information on your investments
Our website, invesco.com/us, offers a wide range of market insights and investment perspectives. On the website, you’ll find detailed information about our funds, including performance, holdings and portfolio manager commentaries. You can access information about your account by completing a simple, secure online registration. To do so, select “Log In” on the right side of the homepage, and then select “Register for Individual Account Access.”
In addition to the resources accessible on our website and through our mobile app, you can obtain timely updates to help you stay informed about the markets and the economy by connecting with Invesco on Twitter, LinkedIn or Facebook. You can access our blog at blog.invesco.us.com. Our goal is to provide you the information you want, when and where you want it.
Finally, I’m pleased to share with you Invesco’s commitment to both the Principles for Responsible Investment and to considering environmental, social and governance issues in our robust investment process. I invite you to learn more at invesco.com/esg.
Have questions?
For questions about your account, contact an Invesco client services representative at 800 959 4246.
All of us at Invesco look forward to serving your investment management needs. Thank you for investing with us.
Sincerely,
Andrew Schlossberg
Head of the Americas,
Senior Managing Director, Invesco Ltd.
| 2 | Invesco American Franchise Fund |
Dear Shareholders:
Among the many important lessons I’ve learned in more than 40 years in a variety of business endeavors is the value of a trusted advocate.
As independent chair of the Invesco Funds Board, I can assure you that the members of the Board are strong advocates for the interests of investors in Invesco’s mutual funds. We work hard to represent your interests through oversight of the quality of the investment management services your funds receive and other matters important to your investment, including but not limited to:
| ■ | Ensuring that Invesco offers a diverse lineup of mutual funds that your financial adviser can use to strive to meet your financial needs as your investment goals change over time. |
| ■ | Monitoring how the portfolio management teams of the Invesco funds are performing in light of changing economic and market conditions. |
| ■ | Assessing each portfolio management team’s investment performance within the context of the investment strategy described in the fund’s prospectus. |
| ■ | Monitoring for potential conflicts of interests that may impact the nature of the services that your funds receive. |
We believe one of the most important services we provide our fund shareholders is the annual review of the funds’ advisory and sub-advisory contracts with Invesco Advisers and its affiliates. This review is required by the Investment Company Act of 1940 and focuses on the nature and quality of the services Invesco provides as the adviser to the Invesco funds and the reasonableness of the fees that it charges for those services. Each year, we spend months carefully reviewing information received from Invesco and a variety of independent sources, such as performance and fee data prepared by Lipper, Inc. (a subsidiary of Broadridge Financial Solutions, Inc.), an independent, third-party firm widely recognized as a leader in its field. We also meet with our independent legal counsel and other independent advisers to review and help us assess the information that we have received. Our goal is to assure that you receive quality investment management services for a reasonable fee.
I trust the measures outlined above provide assurance that you have a worthy advocate when it comes to choosing the Invesco Funds.
As always, please contact me at bruce@brucecrockett.com with any questions or concerns you may have. On behalf of the Board, we look forward to continuing to represent your interests and serving your needs.
Sincerely,
Bruce L. Crockett
Independent Chair
Invesco Funds Board of Trustees
| 3 | Invesco American Franchise Fund |
Management’s Discussion of Fund Performance
Performance summary
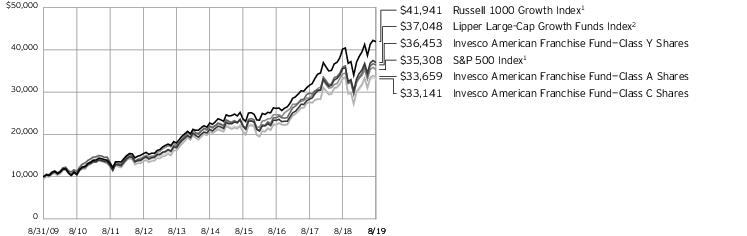
For the fiscal year ended August 31, 2019, Class A shares of Invesco American Franchise Fund (the Fund), at net asset value (NAV), underperformed the Russell 1000 Growth Index, the Fund’s style-specific benchmark.
Your Fund’s long-term performance appears later in this report.
Fund vs. Indexes
Total returns, August 31, 2018 to August 31, 2019, at net asset value (NAV). Performance shown does not include applicable contingent deferred sales charges (CDSC) or front-end sales charges, which would have reduced performance.
| Class A Shares | 1.21% |
| Class C Shares | 0.46 |
| Class R Shares | 0.99 |
| Class Y Shares | 1.50 |
| Class R5 Shares | 1.54 |
| Class R6 Shares | 1.66 |
| S&P 500 Index▼ (Broad Market Index) | 2.92 |
| Russell 1000 Growth Index▼ (Style-Specific Index) | 4.27 |
Lipper Large-Cap Growth Funds Index■
(Peer Group Index) | 4.14 |
| Source(s):▼RIMES Technologies Corp.;■ Lipper Inc. |
Market conditions and your Fund
The fiscal year proved to be an increasingly volatile time for US equities. After a relatively quiet summer, market volatility noticeably rose in October 2018, as US equity markets suffered a sharp sell-off through year-end 2018, amid ongoing trade concerns between the US and China, fears of a global economic slowdown and lower oil prices from a supply glut, with oil prices plummeting from near $75 per barrel in early October 2018 to around $45 per barrel in late December 2018.1 In this environment, there was a flight to safety, as investors fled to defensive areas of the markets, such as health care, utilities and US Treasuries.
Given signs of a strong economy, the US Federal Reserve (the Fed) raised interest rates two times during the fiscal year: in September and December 2018.2 In contrast, the European Central Bank and central banks in several other
countries maintained extraordinarily accommodative monetary policies.
Following a sharp sell-off during the fourth quarter of 2018, equity markets rebounded in the first quarter of 2019, fueled by optimism about a potential US-China trade deal and the Fed’s indication that there would be no interest rate hikes in 2019, a surprising shift in monetary policy. The Fed’s more accommodative stance provided a supportive environment for equities and fixed income, even as US economic data were mixed and overseas growth appeared to be slowing. Against this backdrop, the S&P 500 Index posted its best first quarter returns since 1998.
Although the S&P 500 Index posted modest gains for the second quarter of 2019, the US stock market experienced increased volatility. After four consecutive months of rising stock markets, the market sold off in May 2019, along with bond yields and oil prices, as investors weighed the impact of the lingering trade war between the US and China, as well
as potential tariffs imposed on Mexico. In addition, economic data showed a slowing domestic and global economy. During the July 2019 meeting, the Fed lowered rates by 25 basis points. (A basis point is one one-hundredth of a percentage point.) This was the first time the Fed lowered rates in more than a decade.2
Market volatility increased in August 2019, as the US Treasury yield curve inverted several times, causing jitters for investors who were concerned that a US recession would be imminent. As a result, much of August saw a “risk off” sentiment, with investors crowding into perceived “safe haven” asset classes, such as US Treasuries and gold. However, a more dovish tone from the Fed provided some support to risk assets. With rising volatility in the markets, the S&P 500 Index posted a modestly positive return for the fiscal year.
In this environment, the Fund’s Class A shares at NAV produced a small gain but underperformed the style-specific benchmark during the fiscal year. Stock selection in and overweight exposures to the consumer discretionary, communication services and energy sectors were the largest detractors from the Fund’s performance relative to the style-specific benchmark. Additionally, stock selection in and underweight exposure to the consumer staples sector also detracted from the Fund’s relative performance. Positively, stock selection in the health care, industrials and information technology (IT) sectors benefited the Fund’s relative performance.
At the stock level, overweight exposure to e-commerce leaderAmazon.com was the largest detractor on an absolute and relative basis for the fiscal year. Amazon.com came under pressure following third quarter 2018 results and suffered from investors’ general rotation out of growth stocks as they moved toward more defensive areas of the market
| Portfolio Composition |
| By sector % of total net assets |
| Information Technology | 27.12% |
| Consumer Discretionary | 20.17 |
| Communication Services | 19.20 |
| Health Care | 13.11 |
| Industrials | 9.48 |
| Financials | 4.12 |
| Consumer Staples | 4.04 |
| Other Sectors, Each Less than 2% of Net Assets | 2.20 |
| Money Market Funds Plus Other Assets Less Liabilities | 0.56 |
| Top 10 Equity Holdings* |
| % of total net assets |
| 1. | Amazon.com, Inc. | 8.12% |
| 2. | Alphabet, Inc., Class A | 5.48 |
| 3. | Facebook, Inc., Class A | 5.00 |
| 4. | Microsoft Corp. | 4.52 |
| 5. | Visa, Inc., Class A | 4.01 |
| 6. | Lowe’s Cos., Inc. | 3.73 |
| 7. | Alibaba Group Holding Ltd., ADR | 3.18 |
| 8. | salesforce.com, inc. | 3.13 |
| 9. | Activision Blizzard, Inc. | 2.69 |
| 10. | Nintendo Co., Ltd. | 2.60 |
| Total Net Assets | $10.8 billion |
| Total Number of Holdings* | 79 |
| The Fund’s holdings are subject to change, and there is no assurance that the Fund will continue to hold any particular security. |
| *Excluding money market fund holdings. |
| Data presented here are as of August 31, 2019. |
| 4 | Invesco American Franchise Fund |
in the final quarter of 2018. The stock recovered until June 2019, when the US Department of Justice announced that it would conduct an antitrust review of leading technology platforms to assess competitive conditions. We believed, however, there was extremely low risk of a break-up or a major alteration of the business models of any of the large technology companies over the near term. As such, we viewed the downward market moves as an overreaction. Furthermore, we believe Amazon.com is well-positioned to benefit from increased market penetration in food and consumable goods within e-commerce.
Within communication services, an overweight position inActivision Blizzard detracted from absolute and relative performance for the fiscal year. While our long-term view on the video game developer has not changed, the company reported some disappointments in late 2018 that continued to weigh on the stock. Activision Blizzard announced slower-than-expected growth for its Destiny franchise due to a delayed launch schedule for its Destiny 2 title. This was expected to slow the company’s growth for the second half of 2018 and most of 2019. Given Activision Blizzard’s strong track record of product management and product quality, we viewed these issues as transitory and continued to hold the stock at the end of the fiscal year.
Finally, overweight exposure to the energy sector, including out-of-benchmark exposure toMarathon Petroleum, detracted from both absolute and relative performance for the fiscal year. During the second half of 2018, the Fund held an overweight position in energy based on the view that global crude oil inventories had normalized. Oil supply and demand ended up being out of balance given an unexpected reduction in sanctions on Iran and oil prices plummeted in response. Due to elevated oil inventories, excess spare capacity and risks to global demand growth, we reduced our overweight position in the energy sector. We continued to hold Marathon Petroleum, the largest refiner in the US, as we believed the company was well-positioned to take advantage of many of the disruptions in the oil markets, including price differentials and price swings.
Within the health care sector, overweight exposure toZoetis was an absolute and relative contributor to the Fund’s performance for the fiscal year. Zoetis is the largest global animal health
care company and has continued to show strength in its companion animal business. Of particular note is the growing expectation for its oral canine pill designed to treat fleas, ticks and heartworm. We view the animal health care space as a relatively “safe haven” compared to the policies, generic equivalents and pricing concerns that plague the human health care space.
Within the IT sector, underweight exposure toApple and overweight exposure toVisa contributed to the Fund’s performance relative to the style-specific benchmark during the fiscal year. Apple detracted from the Fund’s absolute performance as annual iPhone sales fell short of expectations and recent production data suggested a worse-than-feared cutback in phone orders. However, we began trimming our position early in the fiscal year and the Fund’s underweight exposure was beneficial to the Fund’s relative return. Visa recently implemented price increases across almost all its product offerings and reported very positive earnings results despite slowing cross-border volumes. The company also made progress in the emerging alternative payments space.
At the end of the fiscal year, the Fund’s largest overweight positions relative to the style-specific benchmark were in the communication services, consumer discretionary and financials sectors. The largest underweight exposures relative to the style-specific benchmark were in the IT, real estate and health care sectors.
At the close of the fiscal year, our view was that we are in a slowing growth environment as the benefits of the Tax Cuts and Jobs Act of 2017 and deregulations were offset by rising labor costs and trade pressures. In such an environment, true growth will likely remain scarce, and we believe the market will favor companies that can produce growth and compound earnings in spite of the economic cycle. We believe that change is the fuel for growth, and thus, we are seeking to identify opportunities in companies that can gain market share from technology-enabled business models, and from disruptive shifts in consumer behavior. Though we anticipate a possible slowdown in the economy, we continue to prudently balance the Fund between dynamic growth opportunities and more durable growth opportunities.
Thank you for your commitment to the Invesco American Franchise Fund and for sharing our long-term investment horizon.
| 2 | Source: US Federal Reserve |
The views and opinions expressed in management’s discussion of Fund performance are those of Invesco Advisers, Inc. These views and opinions are subject to change at any time based on factors such as market and economic conditions. These views and opinions may not be relied upon as investment advice or recommendations, or as an offer for a particular security. The information is not a complete analysis of every aspect of any market, country, industry, security or the Fund. Statements of fact are from sources considered reliable, but Invesco Advisers, Inc. makes no representation or warranty as to their completeness or accuracy. Although historical performance is no guarantee of future results, these insights may help you understand our investment management philosophy.
See important Fund and, if applicable, index disclosures later in this report.
Erik Voss
Chartered Financial Analyst, Portfolio Manager, is lead manager of Invesco American Franchise Fund. He joined Invesco in 2010. Mr. Voss earned a BS in mathematics and an MS in finance from the University of Wisconsin.
Ido Cohen
Portfolio Manager, is manager of Invesco American Franchise Fund. He joined Invesco in 2010. Mr. Cohen earned a BS in economics from The Wharton School of the University of Pennsylvania.
| 5 | Invesco American Franchise Fund |
Your Fund’s Long-Term Performance
Results of a $10,000 Investment — Oldest Share Class(es)
Fund and index data from 8/31/09
| 1 | Source: RIMES Technologies Corp. |
| 2 | Source: Lipper Inc. |
Past performance cannot guarantee comparable future results.
The data shown in the chart include reinvested distributions, applicable sales charges and Fund expenses including
management fees. Index results include reinvested dividends, but they do not reflect sales charges. Performance of the peer group, if applicable, reflects fund expenses and management fees; perfor-
mance of a market index does not. Performance shown in the chart and table(s) does not reflect deduction of taxes a shareholder would pay on Fund distributions or sale of Fund shares.
| 6 | Invesco American Franchise Fund |
| Average Annual Total Returns |
| As of 8/31/19, including maximum applicable sales charges |
| Class A Shares | |
| Inception (6/23/05) | 8.88% |
| 10 Years | 12.90 |
| 5 Years | 9.12 |
| 1 Year | –4.38 |
| Class C Shares | |
| Inception (6/23/05) | 8.76% |
| 10 Years | 12.73 |
| 5 Years | 9.54 |
| 1 Year | –0.45 |
| Class R Shares | |
| 10 Years | 13.26% |
| 5 Years | 10.10 |
| 1 Year | 0.99 |
| Class Y Shares | |
| Inception (6/23/05) | 9.58% |
| 10 Years | 13.81 |
| 5 Years | 10.65 |
| 1 Year | 1.50 |
| Class R5 Shares | |
| 10 Years | 13.89 |
| 5 Years | 10.73 |
| 1 Year | 1.54 |
| Class R6 Shares | |
| 10 Years | 13.89% |
| 5 Years | 10.84 |
| 1 Year | 1.66 |
Effective June 1, 2010, Class A, Class C and Class I shares of the predecessor fund, Van Kampen American Franchise Fund, advised by Van Kampen Asset Management were reorganized into Class A, Class C and Class Y shares, respectively, of Invesco Van Kampen American Franchise Fund (renamed Invesco American Franchise Fund). Returns shown above, prior to June 1, 2010, for Class A, Class C and Class Y shares are blended returns of the predecessor fund and Invesco American Franchise Fund. Share class returns will differ from the predecessor fund because of different expenses.
Class R shares incepted on May 23, 2011. Performance shown prior to that date is that of the Fund’s and the predecessor fund’s Class A shares, restated to reflect the higher 12b-1 fees applicable to Class R shares.
Class R5 shares incepted on December 22, 2010. Performance shown prior to that date is that of the Fund’s and the predecessor fund’s Class A shares
| Average Annual Total Returns |
| As of 6/30/19, the most recent calendar quarter end, including maximum applicable sales charges |
| Class A Shares | |
| Inception (6/23/05) | 8.95% |
| 10 Years | 14.26 |
| 5 Years | 9.51 |
| 1 Year | 1.29 |
| Class C Shares | |
| Inception (6/23/05) | 8.82% |
| 10 Years | 14.09 |
| 5 Years | 9.94 |
| 1 Year | 5.44 |
| Class R Shares | |
| 10 Years | 14.63% |
| 5 Years | 10.48 |
| 1 Year | 6.93 |
| Class Y Shares | |
| Inception (6/23/05) | 9.64% |
| 10 Years | 15.18 |
| 5 Years | 11.03 |
| 1 Year | 7.44 |
| Class R5 Shares | |
| 10 Years | 15.26% |
| 5 Years | 11.13 |
| 1 Year | 7.52 |
| Class R6 Shares | |
| 10 Years | 15.25% |
| 5 Years | 11.23 |
| 1 Year | 7.56 |
and includes the 12b-1 fees applicable to Class A shares.
Class R6 shares incepted on September 24, 2012. Performance shown prior to that date is that of the Fund’s and the predecessor fund’s Class A shares and includes the 12b-1 fees applicable to Class A shares.
The performance data quoted represent past performance and cannot guarantee comparable future results; current performance may be lower or higher. Please visit invesco.com/performance for the most recent month-end performance. Performance figures reflect reinvested distributions, changes in net asset value and the effect of the maximum sales charge unless otherwise stated. Investment return and principal value will fluctuate so that you may have a gain or loss when you sell shares.
The total annual Fund operating expense ratio set forth in the most recent Fund prospectus as of the date of this report for Class A, Class C, Class R, Class Y, Class R5 and Class R6 shares was 1.01%, 1.76%,
1.26%, 0.76%, 0.71% and 0.62%, respectively. The expense ratios presented above may vary from the expense ratios presented in other sections of this report that are based on expenses incurred during the period covered by this report.
Class A share performance reflects the maximum 5.50% sales charge, and Class C share performance reflects the applicable contingent deferred sales charge (CDSC) for the period involved. The CDSC on Class C shares is 1% for the first year after purchase. Class R, Class Y, Class R5 and Class R6 shares do not have a front-end sales charge or a CDSC; therefore, performance is at net asset value.
The performance of the Fund’s share classes will differ primarily due to different sales charge structures and class expenses.
Fund performance reflects any applicable fee waivers and/or expense reimbursements. Had the adviser not waived fees and/or reimbursed expenses currently or in the past, returns would have been lower. See current prospectus for more information.
| 7 | Invesco American Franchise Fund |
Invesco American Franchise Fund’s investment objective is to seek long-term capital appreciation.
| ■ | Unless otherwise stated, information presented in this report is as of August 31, 2019, and is based on total net assets. |
| ■ | Unless otherwise noted, all data provided by Invesco. |
| ■ | To access your Fund’s reports/prospectus, visit invesco.com/fundreports. |
About share classes
| ■ | Class R sharesare generally available only to employer sponsored retirement and benefit plans. Please see the prospectus for more information. |
| ■ | Class Y shares are available only to certain investors. Please see the prospectus for more information. |
| ■ | Class R5 shares andClass R6 shares are available for use by retirement plans that meet certain standards and for institutional investors. Class R6 shares are also available through intermediaries that have established an agreement with Invesco Distributors, Inc. to make such shares available for use in retail omnibus accounts. Please see the prospectus for more information. |
Principal risks of investing in the Fund
| ■ | Foreign securities risk. The Fund’s foreign investments may be adversely affected by political and social instability, changes in economic or taxation policies, difficulty in enforcing obligations, decreased liquidity or increased volatility. Foreign investments also involve the risk of the possible seizure, nationalization or expropriation of the issuer or foreign deposits (in which the Fund could lose its entire investments in a certain market) and the possible adoption of foreign governmental restrictions such as exchange controls. Unless the Fund has hedged its foreign securities risk, foreign securities risk also involves the risk of negative foreign currency rate fluctuations, which may cause the value of securities denominated in such foreign currency (or other instruments through which the Fund has exposure to foreign currencies) to decline in value. Currency exchange rates may fluctuate significantly over short periods of time. Currency hedging strategies, if used, are not always successful. |
| ■ | Growth investing risk. Growth stocks tend to be more expensive relative to |
| | the issuing company’s earnings or assets compared with other types of stock. As a result, they tend to be more sensitive to changes in, or investors’ expectations of, the issuing company’s earnings and can be more volatile. |
| ■ | Management risk. The Fund is actively managed and depends heavily on the Adviser’s judgment about markets, interest rates or the attractiveness, relative values, liquidity, or potential appreciation of particular investments made for the Fund’s portfolio. The Fund could experience losses if these judgments prove to be incorrect. Additionally, legislative, regulatory, or tax developments may adversely affect management of the Fund and, therefore, the ability of the Fund to achieve its investment objective. |
| ■ | Market risk.The market values of the Fund’s investments, and therefore the value of the Fund’s shares, will go up and down, sometimes rapidly or unpredictably. Market risk may affect a single issuer, industry or section of the economy, or it may affect the market as a whole. Individual stock prices tend to go up and down more dramatically than those of certain other types of investments, such as bonds. During a general downturn in the financial markets, multiple asset classes may decline in value. When markets perform well, there can be no assurance that specific investments held by the Fund will rise in value. |
| ■ | Mid-capitalization companies risk. Mid-capitalization companies tend to be more vulnerable to changing market conditions and may have more limited product lines and markets, less experienced management and fewer financial resources than larger companies. These companies’ securities may be more volatile and less liquid than those of more established companies, and their returns may vary, sometimes significantly, from the overall securities market. |
| ■ | Sector focus risk. The Fund may from time to time invest a significant |
amount of its assets (i.e. over 25%) in one market sector or group of related industries. In this event, the Fund’s performance will depend to a greater extent on the overall condition of the sector or group of industries and there is increased risk that the Fund will lose significant value if conditions adversely affect that sector or group of industries.
About indexes used in this report
| ■ | TheS&P 500® Index is an unmanaged index considered representative of the US stock market. |
| ■ | TheRussell 1000® Growth Index is an unmanaged index considered representative of large-cap growth stocks. The Russell 1000 Growth Index is a trademark/service mark of the Frank Russell Co. Russell® is a trademark of the Frank Russell Co. |
| ■ | TheLipper Large-Cap Growth Funds Index is an unmanaged index considered representative of large-cap growth funds tracked by Lipper. |
| ■ | The Fund is not managed to track the performance of any particular index, including the index(es) described here, and consequently, the performance of the Fund may deviate significantly from the performance of the index(es). |
| ■ | A direct investment cannot be made in an index. Unless otherwise indicated, index results include reinvested dividends, and they do not reflect sales charges. Performance of the peer group, if applicable, reflects fund expenses; performance of a market index does not. |
Other information
| ■ | The returns shown in management’s discussion of Fund performance are based on net asset values (NAVs) calculated for shareholder transactions. Generally accepted accounting principles require adjustments to be made to the net assets of the Fund at period end for financial reporting purposes, |
This report must be accompanied or preceded by a currently effective Fund prospectus, which contains more complete information, including sales charges and expenses. Investors should read it carefully before investing.
NOT FDIC INSURED | MAY LOSE VALUE | NO BANK GUARANTEE
| 8 | Invesco American Franchise Fund |
| | and as such, the NAVs for shareholder transactions and the returns based on those NAVs may differ from the NAVs and returns reported in the Financial Highlights. |
| ■ | Industry classifications used in this report are generally according to the Global Industry Classification Standard, which was developed by and is the exclusive property and a service mark of MSCI Inc. and Standard & Poor’s. |
| 9 | Invesco American Franchise Fund |
Schedule of Investments(a)
August 31, 2019
| | Shares | Value |
| Common Stocks & Other Equity Interests–99.44% |
| Aerospace & Defense–3.49% |
| Airbus S.E. (France) | 918,100 | $126,591,137 |
| Boeing Co. (The) | 218,388 | 79,512,887 |
| L3Harris Technologies, Inc. | 551,052 | 116,497,903 |
| Lockheed Martin Corp. | 145,451 | 55,869,183 |
| | | | 378,471,110 |
| Agricultural & Farm Machinery–0.56% |
| Deere & Co. | 392,869 | 60,859,337 |
| Application Software–4.64% |
| Adobe, Inc.(b) | 433,579 | 123,357,561 |
| salesforce.com, inc.(b) | 2,173,391 | 339,201,134 |
| Splunk, Inc.(b) | 366,717 | 41,006,295 |
| | | | 503,564,990 |
| Asset Management & Custody Banks–1.94% |
| Apollo Global Management LLC, Class A | 3,040,497 | 114,717,952 |
| KKR & Co., Inc., Class A | 2,455,040 | 63,438,234 |
| Legg Mason, Inc. | 877,228 | 32,273,218 |
| | | | 210,429,404 |
| Biotechnology–0.55% |
| Alnylam Pharmaceuticals, Inc.(b) | 301,567 | 24,333,441 |
| Bluebird Bio, Inc.(b) | 72,068 | 7,445,345 |
| Moderna, Inc.(b)(c) | 1,081,111 | 17,005,876 |
| Sage Therapeutics, Inc.(b) | 62,176 | 10,673,754 |
| | | | 59,458,416 |
| Commodity Chemicals–0.29% |
| LyondellBasell Industries N.V., Class A | 406,792 | 31,477,565 |
| Consumer Electronics–1.14% |
| Sony Corp. (Japan) | 2,173,400 | 123,776,015 |
| Data Processing & Outsourced Services–9.18% |
| Fiserv, Inc.(b) | 1,048,785 | 112,157,068 |
| Mastercard, Inc., Class A | 957,297 | 269,354,657 |
| PayPal Holdings, Inc.(b) | 1,647,070 | 179,612,983 |
| Visa, Inc., Class A | 2,403,744 | 434,644,990 |
| | | | 995,769,698 |
| Distillers & Vintners–0.70% |
| Constellation Brands, Inc., Class A | 371,258 | 75,866,572 |
| Diversified Support Services–1.62% |
| Cintas Corp. | 530,520 | 139,951,176 |
| IAA, Inc.(b) | 731,506 | 35,734,068 |
| | | | 175,685,244 |
| Environmental & Facilities Services–1.44% |
| Republic Services, Inc. | 477,139 | 42,584,656 |
| | Shares | Value |
| Environmental & Facilities Services–(continued) |
| Waste Management, Inc. | 954,508 | $113,920,530 |
| | | | 156,505,186 |
| Financial Exchanges & Data–1.74% |
| London Stock Exchange Group PLC (United Kingdom) | 1,012,209 | 85,710,821 |
| S&P Global, Inc. | 396,615 | 103,195,257 |
| | | | 188,906,078 |
| Health Care Equipment–4.70% |
| Abbott Laboratories | 1,303,301 | 111,197,641 |
| Boston Scientific Corp.(b) | 2,781,893 | 118,870,288 |
| Intuitive Surgical, Inc.(b) | 166,706 | 85,243,446 |
| Stryker Corp. | 254,628 | 56,186,215 |
| Teleflex, Inc. | 379,975 | 138,280,502 |
| | | | 509,778,092 |
| Home Improvement Retail–4.08% |
| Home Depot, Inc. (The) | 164,685 | 37,533,358 |
| Lowe’s Cos., Inc. | 3,607,837 | 404,799,312 |
| | | | 442,332,670 |
| Hotels, Resorts & Cruise Lines–2.29% |
| Norwegian Cruise Line Holdings Ltd.(b) | 921,984 | 46,790,688 |
| Royal Caribbean Cruises Ltd. | 1,935,553 | 201,839,467 |
| | | | 248,630,155 |
| Industrial Conglomerates–0.53% |
| Roper Technologies, Inc. | 157,417 | 57,734,259 |
| Industrial Gases–0.64% |
| Air Products and Chemicals, Inc. | 305,298 | 68,972,924 |
| Industrial Machinery–0.21% |
| Stanley Black & Decker, Inc. | 168,521 | 22,389,700 |
| Interactive Home Entertainment–7.03% |
| Activision Blizzard, Inc. | 5,761,549 | 291,534,379 |
| Electronic Arts, Inc.(b) | 1,263,741 | 118,387,257 |
| Nintendo Co., Ltd. (Japan) | 745,400 | 282,138,114 |
| Take-Two Interactive Software, Inc.(b) | 529,171 | 69,834,697 |
| | | | 761,894,447 |
| Interactive Media & Services–10.48% |
| Alphabet, Inc., Class A(b) | 499,262 | 594,386,389 |
| Facebook, Inc., Class A(b) | 2,922,622 | 542,643,227 |
| | | | 1,137,029,616 |
| Internet & Direct Marketing Retail–12.66% |
| Alibaba Group Holding Ltd., ADR (China)(b) | 1,972,909 | 345,318,262 |
| Amazon.com, Inc.(b) | 495,511 | 880,171,234 |
| Booking Holdings, Inc.(b) | 65,207 | 128,223,697 |
See accompanying Notes to Financial Statements which are an integral part of the financial statements.
| 10 | Invesco American Franchise Fund |
| | Shares | Value |
| Internet & Direct Marketing Retail–(continued) |
| Farfetch Ltd., Class A (United Kingdom)(b) | 1,930,998 | $18,885,161 |
| | | | 1,372,598,354 |
| Investment Banking & Brokerage–0.44% |
| Goldman Sachs Group, Inc. (The) | 233,274 | 47,566,901 |
| Life Sciences Tools & Services–4.08% |
| Avantor, Inc.(b) | 2,134,140 | 37,347,450 |
| Illumina, Inc.(b) | 549,990 | 154,734,186 |
| IQVIA Holdings, Inc.(b) | 802,972 | 124,581,106 |
| Thermo Fisher Scientific, Inc. | 439,181 | 126,071,298 |
| | | | 442,734,040 |
| Managed Health Care–2.08% |
| Anthem, Inc. | 210,482 | 55,045,253 |
| UnitedHealth Group, Inc. | 727,003 | 170,118,702 |
| | | | 225,163,955 |
| Movies & Entertainment–1.69% |
| Netflix, Inc.(b) | 457,566 | 134,410,012 |
| Vivendi S.A. (France) | 1,748,593 | 49,118,762 |
| | | | 183,528,774 |
| Oil & Gas Exploration & Production–0.01% |
| Noble Energy, Inc. | 51,534 | 1,163,638 |
| Oil & Gas Refining & Marketing–0.73% |
| Marathon Petroleum Corp. | 1,600,278 | 78,749,680 |
| Packaged Foods & Meats–1.47% |
| Tyson Foods, Inc., Class A | 1,714,976 | 159,561,367 |
| Pharmaceuticals–1.70% |
| Novo Nordisk A/S, Class B (Denmark) | 507,863 | 26,477,875 |
| Zoetis, Inc. | 1,251,732 | 158,243,959 |
| | | | 184,721,834 |
| Railroads–1.16% |
| Canadian Pacific Railway Ltd. (Canada) | 240,789 | 57,969,952 |
| Union Pacific Corp. | 418,865 | 67,839,375 |
| | | | 125,809,327 |
| Semiconductor Equipment–2.32% |
| Applied Materials, Inc. | 3,203,337 | 153,824,243 |
| ASML Holding N.V., New York Shares (Netherlands) | 437,030 | 97,287,248 |
| | | | 251,111,491 |
| Semiconductors–2.18% |
| Broadcom, Inc. | 223,533 | 63,179,367 |
| NVIDIA Corp. | 216,337 | 36,238,611 |
| | Shares | Value |
| Semiconductors–(continued) |
| QUALCOMM, Inc. | 1,767,473 | $137,456,375 |
| | | | 236,874,353 |
| Specialty Chemicals–0.53% |
| Sherwin-Williams Co. (The) | 109,631 | 57,748,129 |
| Systems Software–6.62% |
| Microsoft Corp. | 3,555,434 | 490,152,131 |
| Palo Alto Networks, Inc.(b) | 636,468 | 129,597,614 |
| ServiceNow, Inc.(b) | 374,228 | 97,987,860 |
| | | | 717,737,605 |
| Technology Hardware, Storage & Peripherals–2.18% |
| Apple, Inc. | 1,131,128 | 236,111,659 |
| Tobacco–1.87% |
| Philip Morris International, Inc. | 2,816,066 | 203,010,198 |
| Trucking–0.47% |
| Lyft, Inc., Class A(b)(c) | 669,300 | 32,775,621 |
| Uber Technologies, Inc.(b)(c) | 556,690 | 18,131,393 |
| | | | 50,907,014 |
| Total Common Stocks & Other Equity Interests (Cost $6,062,078,628) | 10,784,629,797 |
| Money Market Funds–0.56% |
| Invesco Government & Agency Portfolio, Institutional Class, 2.02%(d) | 21,433,977 | 21,433,977 |
| Invesco Liquid Assets Portfolio, Institutional Class, 2.14%(d) | 15,303,862 | 15,309,984 |
| Invesco Treasury Portfolio, Institutional Class, 1.98%(d) | 24,495,974 | 24,495,974 |
| Total Money Market Funds (Cost $61,239,935) | 61,239,935 |
| TOTAL INVESTMENTS IN SECURITIES (excluding investments purchased with cash collateral from securities on loan)-100.00% (Cost $6,123,318,563) | | | 10,845,869,732 |
| Investments Purchased with Cash Collateral from Securities on Loan |
| Money Market Funds–0.30% |
| Invesco Government & Agency Portfolio, Institutional Class, 2.02%(d)(e) | 24,171,283 | 24,171,283 |
| Invesco Liquid Assets Portfolio, Institutional Class, 2.14%(d)(e) | 8,053,873 | 8,057,094 |
| Total Investments Purchased with Cash Collateral from Securities on Loan (Cost $32,228,377) | 32,228,377 |
| TOTAL INVESTMENTS IN SECURITIES–100.30% (Cost $6,155,546,940) | 10,878,098,109 |
| OTHER ASSETS LESS LIABILITIES—(0.30)% | (32,880,126) |
| NET ASSETS–100.00% | $10,845,217,983 |
Investment Abbreviations:
| ADR | – American Depositary Receipt |
See accompanying Notes to Financial Statements which are an integral part of the financial statements.
| 11 | Invesco American Franchise Fund |
Notes to Schedule of Investments:
| (a) | Industry and/or sector classifications used in this report are generally according to the Global Industry Classification Standard, which was developed by and is the exclusive property and a service mark of MSCI Inc. and Standard & Poor’s. |
| (b) | Non-income producing security. |
| (c) | All or a portion of this security was out on loan at August 31, 2019. |
| (d) | The money market fund and the Fund are affiliated by having the same investment adviser. The rate shown is the 7-day SEC standardized yield as of August 31, 2019. |
| (e) | The security has been segregated to satisfy the commitment to return the cash collateral received in securities lending transactions upon the borrower’s return of the securities loaned. See Note 1I. |
See accompanying Notes to Financial Statements which are an integral part of the financial statements.
| 12 | Invesco American Franchise Fund |
Statement of Assets and Liabilities
August 31, 2019
| Assets: | |
Investments in securities, at value
(Cost $6,062,078,628)* | $10,784,629,797 |
| Investments in affiliated money market funds, at value (Cost $93,468,312) | 93,468,312 |
| Foreign currencies, at value (Cost $8,679) | 8,681 |
| Receivable for: | |
| Fund shares sold | 1,507,266 |
| Dividends | 7,058,198 |
| Investments sold | 54,505,567 |
| Investment for trustee deferred compensation and retirement plans | 2,459,338 |
| Other assets | 163,821 |
| Total assets | 10,943,800,980 |
| Liabilities: | |
| Payable for: | |
| Investments purchased | 48,529,483 |
| Fund shares reacquired | 4,580,174 |
| Amount due custodian | 4,075,124 |
| Collateral upon return of securities loaned | 32,228,377 |
| Accrued fees to affiliates | 6,055,475 |
| Accrued trustees’ and officers’ fees and benefits | 16,866 |
| Accrued other operating expenses | 403,198 |
| Trustee deferred compensation and retirement plans | 2,694,300 |
| Total liabilities | 98,582,997 |
| Net assets applicable to shares outstanding | $10,845,217,983 |
| Net assets consist of: | |
| Shares of beneficial interest | $5,533,002,215 |
| Distributable earnings | 5,312,215,768 |
| | $10,845,217,983 |
| Net Assets: |
| Class A | $10,115,812,509 |
| Class C | $139,838,764 |
| Class R | $34,113,779 |
| Class Y | $350,473,196 |
| Class R5 | $75,148,622 |
| Class R6 | $129,831,113 |
| Shares outstanding, no par value, with an unlimited number of shares authorized: |
| Class A | 475,549,725 |
| Class C | 7,279,762 |
| Class R | 1,644,208 |
| Class Y | 16,041,526 |
| Class R5 | 3,429,109 |
| Class R6 | 5,883,891 |
| Class A: | |
| Net asset value per share | $21.27 |
Maximum offering price per share
(Net asset value of $21.27 ÷ 94.50%) | $22.51 |
| Class C: | |
| Net asset value and offering price per share | $19.21 |
| Class R: | |
| Net asset value and offering price per share | $20.75 |
| Class Y: | |
| Net asset value and offering price per share | $21.85 |
| Class R5: | |
| Net asset value and offering price per share | $21.91 |
| Class R6: | |
| Net asset value and offering price per share | $22.07 |
| * | At August 31, 2019, securities with an aggregate value of $31,556,542 were on loan to brokers. |
See accompanying Notes to Financial Statements which are an integral part of the financial statements.
| 13 | Invesco American Franchise Fund |
Statement of Operations
For the year ended August 31, 2019
| Investment income: | |
| Dividends (net of foreign withholding taxes of $1,507,120) | $99,696,956 |
| Dividends from affiliated money market funds (includes securities lending income of $922,189) | 2,267,956 |
| Total investment income | 101,964,912 |
| Expenses: | |
| Advisory fees | 61,422,878 |
| Administrative services fees | 1,253,952 |
| Custodian fees | 107,847 |
| Distribution fees: | |
| Class A | 24,287,665 |
| Class C | 2,317,137 |
| Class R | 167,406 |
| Transfer agent fees — A, C, R and Y | 15,685,243 |
| Transfer agent fees — R5 | 80,019 |
| Transfer agent fees — R6 | 11,302 |
| Trustees’ and officers’ fees and benefits | 174,503 |
| Registration and filing fees | 200,525 |
| Reports to shareholders | 642,625 |
| Professional services fees | 140,442 |
| Other | 130,109 |
| Total expenses | 106,621,653 |
| Less: Fees waived and/or expense offset arrangement(s) | (215,799) |
| Net expenses | 106,405,854 |
| Net investment income (loss) | (4,440,942) |
| Realized and unrealized gain (loss) from: | |
| Net realized gain (loss) from: | |
| Investment securities (includes net gains (losses) from securities sold to affiliates of $(152,328)) | 710,483,736 |
| Foreign currencies | (209,972) |
| | 710,273,764 |
| Change in net unrealized appreciation (depreciation) of: | |
| Investment securities | (629,501,847) |
| Foreign currencies | (6,409) |
| | (629,508,256) |
| Net realized and unrealized gain | 80,765,508 |
| Net increase (decrease) in net assets resulting from operations | $76,324,566 |
See accompanying Notes to Financial Statements which are an integral part of the financial statements.
| 14 | Invesco American Franchise Fund |
Statement of Changes in Net Assets
For the years ended August 31, 2019 and 2018
| | 2019 | 2018 |
| Operations: | | |
| Net investment income (loss) | $(4,440,942) | $(19,723,687) |
| Net realized gain | 710,273,764 | 958,613,075 |
| Change in net unrealized appreciation (depreciation) | (629,508,256) | 1,056,071,409 |
| Net increase in net assets resulting from operations | 76,324,566 | 1,994,960,797 |
| Distributions to shareholders from distributable earnings(1): | | |
| Class A | (804,913,487) | (478,520,623) |
| Class B | — | (2,479,794) |
| Class C | (33,225,403) | (20,255,914) |
| Class R | (3,005,915) | (1,865,721) |
| Class Y | (27,603,239) | (13,953,873) |
| Class R5 | (6,608,373) | (3,494,510) |
| Class R6 | (10,724,224) | (6,684,184) |
| Total distributions from distributable earnings | (886,080,641) | (527,254,619) |
| Share transactions–net: | | |
| Class A | 297,930,110 | (145,332,102) |
| Class B | — | (62,310,041) |
| Class C | (200,992,890) | (16,924,402) |
| Class R | (1,216,256) | (888,078) |
| Class Y | 6,407,551 | 60,767,520 |
| Class R5 | (5,226,299) | 7,510,265 |
| Class R6 | (1,969,306) | (10,728,006) |
| Net increase (decrease) in net assets resulting from share transactions | 94,932,910 | (167,904,844) |
| Net increase (decrease) in net assets | (714,823,165) | 1,299,801,334 |
| Net assets: | | |
| Beginning of year | 11,560,041,148 | 10,260,239,814 |
| End of year | $10,845,217,983 | $11,560,041,148 |
| (1) | The Securities and Exchange Commission eliminated the requirement to disclose distribution components separately, except for tax return of capital. For the year ended August 31, 2018, distributions to shareholders from distributable earnings consisted of distributions from net realized gains. |
See accompanying Notes to Financial Statements which are an integral part of the financial statements.
| 15 | Invesco American Franchise Fund |
Financial Highlights
August 31, 2019
The following schedule presents financial highlights for a share of the Fund outstanding throughout the periods indicated.
| | Net asset
value,
beginning
of period | Net
investment
income
(loss)(a) | Net gains
(losses)
on securities
(both
realized and
unrealized) | Total from
investment
operations | Distributions
from net
realized
gains | Net asset
value, end
of period | Total
return(b) | Net assets,
end of period
(000’s omitted) | Ratio of
expenses
to average
net assets
with fee waivers
and/or
expenses
absorbed | Ratio of
expenses
to average net
assets without
fee waivers
and/or
expenses
absorbed | Ratio of net
investment
income
(loss)
to average
net assets | Portfolio
turnover(c) |
| Class A |
| Year ended 08/31/19 | $23.12 | $(0.01) | $(0.04) | $(0.05) | $(1.80) | $21.27 | 1.21% | $10,115,813 | 1.01%(d) | 1.01%(d) | (0.04)%(d) | 43% |
| Year ended 08/31/18 | 20.25 | (0.04) | 3.97 | 3.93 | (1.06) | 23.12 | 20.30 | 10,524,889 | 1.01 | 1.01 | (0.17) | 44 |
| Year ended 08/31/17 | 16.96 | (0.03) | 3.99 | 3.96 | (0.67) | 20.25 | 24.19 | 9,333,084 | 1.06 | 1.06 | (0.15) | 48 |
| Year ended 08/31/16 | 16.49 | (0.01) | 1.30 | 1.29 | (0.82) | 16.96 | 7.99 | 8,253,739 | 1.08 | 1.08 | (0.04) | 59 |
| Year ended 08/31/15 | 18.07 | (0.05) | 0.08 | 0.03 | (1.61) | 16.49 | 0.27 | 8,320,796 | 1.05 | 1.05 | (0.28) | 74 |
| Class C |
| Year ended 08/31/19 | 21.23 | (0.15) | (0.07) | (0.22) | (1.80) | 19.21 | 0.46 | 139,839 | 1.76(d) | 1.76(d) | (0.79)(d) | 43 |
| Year ended 08/31/18 | 18.81 | (0.18) | 3.66 | 3.48 | (1.06) | 21.23 | 19.43 | 401,863 | 1.76 | 1.76 | (0.92) | 44 |
| Year ended 08/31/17 | 15.92 | (0.15) | 3.71 | 3.56 | (0.67) | 18.81 | 23.23 | 370,960 | 1.81 | 1.81 | (0.90) | 48 |
| Year ended 08/31/16 | 15.64 | (0.12) | 1.22 | 1.10 | (0.82) | 15.92 | 7.18 | 367,233 | 1.83 | 1.83 | (0.79) | 59 |
| Year ended 08/31/15 | 17.34 | (0.17) | 0.08 | (0.09) | (1.61) | 15.64 | (0.46) | 381,264 | 1.80 | 1.80 | (1.03) | 74 |
| Class R |
| Year ended 08/31/19 | 22.65 | (0.06) | (0.04) | (0.10) | (1.80) | 20.75 | 0.99 | 34,114 | 1.26(d) | 1.26(d) | (0.29)(d) | 43 |
| Year ended 08/31/18 | 19.91 | (0.09) | 3.89 | 3.80 | (1.06) | 22.65 | 19.99 | 38,537 | 1.26 | 1.26 | (0.42) | 44 |
| Year ended 08/31/17 | 16.72 | (0.07) | 3.93 | 3.86 | (0.67) | 19.91 | 23.93 | 34,479 | 1.31 | 1.31 | (0.40) | 48 |
| Year ended 08/31/16 | 16.31 | (0.05) | 1.28 | 1.23 | (0.82) | 16.72 | 7.70 | 28,686 | 1.33 | 1.33 | (0.29) | 59 |
| Year ended 08/31/15 | 17.93 | (0.09) | 0.08 | (0.01) | (1.61) | 16.31 | 0.03 | 30,716 | 1.30 | 1.30 | (0.53) | 74 |
| Class Y |
| Year ended 08/31/19 | 23.63 | 0.04 | (0.02) | 0.02 | (1.80) | 21.85 | 1.50 | 350,473 | 0.76(d) | 0.76(d) | 0.21(d) | 43 |
| Year ended 08/31/18 | 20.62 | 0.02 | 4.05 | 4.07 | (1.06) | 23.63 | 20.63 | 368,991 | 0.76 | 0.76 | 0.08 | 44 |
| Year ended 08/31/17 | 17.22 | 0.02 | 4.05 | 4.07 | (0.67) | 20.62 | 24.47 | 264,309 | 0.81 | 0.81 | 0.10 | 48 |
| Year ended 08/31/16 | 16.69 | 0.04 | 1.31 | 1.35 | (0.82) | 17.22 | 8.26 | 147,246 | 0.83 | 0.83 | 0.21 | 59 |
| Year ended 08/31/15 | 18.22 | (0.01) | 0.09 | 0.08 | (1.61) | 16.69 | 0.56 | 152,179 | 0.80 | 0.80 | (0.03) | 74 |
| Class R5 |
| Year ended 08/31/19 | 23.68 | 0.05 | (0.02) | 0.03 | (1.80) | 21.91 | 1.54 | 75,149 | 0.71(d) | 0.71(d) | 0.26(d) | 43 |
| Year ended 08/31/18 | 20.66 | 0.03 | 4.05 | 4.08 | (1.06) | 23.68 | 20.64 | 86,177 | 0.71 | 0.71 | 0.13 | 44 |
| Year ended 08/31/17 | 17.23 | 0.03 | 4.07 | 4.10 | (0.67) | 20.66 | 24.63 | 67,740 | 0.72 | 0.72 | 0.19 | 48 |
| Year ended 08/31/16 | 16.68 | 0.05 | 1.32 | 1.37 | (0.82) | 17.23 | 8.39 | 53,789 | 0.71 | 0.71 | 0.33 | 59 |
| Year ended 08/31/15 | 18.20 | 0.01 | 0.08 | 0.09 | (1.61) | 16.68 | 0.62 | 50,052 | 0.71 | 0.71 | 0.06 | 74 |
| Class R6 |
| Year ended 08/31/19 | 23.81 | 0.07 | (0.01) | 0.06 | (1.80) | 22.07 | 1.66 | 129,831 | 0.62(d) | 0.62(d) | 0.35(d) | 43 |
| Year ended 08/31/18 | 20.75 | 0.05 | 4.07 | 4.12 | (1.06) | 23.81 | 20.75 | 139,584 | 0.62 | 0.62 | 0.22 | 44 |
| Year ended 08/31/17 | 17.29 | 0.05 | 4.08 | 4.13 | (0.67) | 20.75 | 24.72 | 130,807 | 0.64 | 0.64 | 0.27 | 48 |
| Year ended 08/31/16 | 16.72 | 0.07 | 1.32 | 1.39 | (0.82) | 17.29 | 8.49 | 120,754 | 0.63 | 0.63 | 0.42 | 59 |
| Year ended 08/31/15 | 18.22 | 0.03 | 0.08 | 0.11 | (1.61) | 16.72 | 0.73 | 86,444 | 0.62 | 0.62 | 0.15 | 74 |
| (a) | Calculated using average shares outstanding. |
| (b) | Includes adjustments in accordance with accounting principles generally accepted in the United States of America and as such, the net asset value for financial reporting purposes and the returns based upon those net asset values may differ from the net asset value and returns for shareholder transactions. Does not include sales charges and is not annualized for periods less than one year, if applicable. |
| (c) | Portfolio turnover is calculated at the fund level and is not annualized for periods less than one year, if applicable. |
| (d) | Ratios are based on average daily net assets (000’s omitted) of $9,715,066, $231,714, $33,481, $335,710, $79,981 and $130,563 for Class A, Class C, Class R, Class Y, Class R5 and Class R6 shares, respectively. |
See accompanying Notes to Financial Statements which are an integral part of the financial statements.
| 16 | Invesco American Franchise Fund |
Notes to Financial Statements
August 31, 2019
NOTE 1—Significant Accounting Policies
Invesco American Franchise Fund (the “Fund”) is a series portfolio of AIM Counselor Series Trust (Invesco Counselor Series Trust) (the “Trust”). The Trust is a Delaware statutory trust registered under the Investment Company Act of 1940, as amended (the “1940 Act”), as an open-end series management investment company authorized to issue an unlimited number of shares of beneficial interest. Information presented in these financial statements pertains only to the Fund. Matters affecting the Fund or each class will be voted on exclusively by the shareholders of the Fund or each class.
The Fund’s investment objective is to seek long-term capital appreciation.
The Fund currently consists of six different classes of shares: Class A, Class C, Class R, Class Y, Class R5 and Class R6. Class Y shares are available only to certain investors. Class A shares are sold with a front-end sales charge unless certain waiver criteria are met. Under certain circumstances, load waived shares may be subject to contingent deferred sales charges ("CDSC"). Class C shares are sold with a CDSC. Class R, Class Y, Class R5 and Class R6 shares are sold at net asset value. Class C shares held for ten years after purchase are eligible for automatic conversion into Class A shares of the same Fund (the "Conversion Feature"). The automatic conversion pursuant to the Conversion Feature will generally occur at the end of the month following the tenth anniversary after a purchase of Class C shares.
The Fund is an investment company and accordingly follows the investment company accounting and reporting guidance in accordance with Financial Accounting Standards Board Accounting Standards Codification Topic 946,Financial Services – Investment Companies.
The following is a summary of the significant accounting policies followed by the Fund in the preparation of its financial statements.
| A. | Security Valuations — Securities, including restricted securities, are valued according to the following policy. |
A security listed or traded on an exchange (except convertible securities) is valued at its last sales price or official closing price as of the close of the customary trading session on the exchange where the security is principally traded, or lacking any sales or official closing price on a particular day, the security may be valued at the closing bid price on that day. Securities traded in the over-the-counter market are valued based on prices furnished by independent pricing services or market makers. When such securities are valued by an independent pricing service they may be considered fair valued. Futures contracts are valued at the final settlement price set by an exchange on which they are principally traded. Listed options are valued at the mean between the last bid and asked prices from the exchange on which they are principally traded. Options not listed on an exchange are valued by an independent source at the mean between the last bid and asked prices. For purposes of determining net asset value (“NAV”) per share, futures and option contracts generally are valued 15 minutes after the close of the customary trading session of the New York Stock Exchange (“NYSE”).
Investments in open-end and closed-end registered investment companies that do not trade on an exchange are valued at the end-of-day net asset value per share. Investments in open-end and closed-end registered investment companies that trade on an exchange are valued at the last sales price or official closing price as of the close of the customary trading session on the exchange where the security is principally traded.
Debt obligations (including convertible securities) and unlisted equities are fair valued using an evaluated quote provided by an independent pricing service. Evaluated quotes provided by the pricing service may be determined without exclusive reliance on quoted prices, and may reflect appropriate factors such as institution-size trading in similar groups of securities, developments related to specific securities, dividend rate (for unlisted equities), yield (for debt obligations), quality, type of issue, coupon rate (for debt obligations), maturity (for debt obligations), individual trading characteristics and other market data. Pricing services generally value debt obligations assuming orderly transactions of institutional round lot size, but a fund may hold or transact in the same securities in smaller, odd lot sizes. Odd lots often trade at lower prices than institutional round lots. Debt obligations are subject to interest rate and credit risks. In addition, all debt obligations involve some risk of default with respect to interest and/or principal payments.
Foreign securities’ (including foreign exchange contracts) prices are converted into U.S. dollar amounts using the applicable exchange rates as of the close of the NYSE. If market quotations are available and reliable for foreign exchange-traded equity securities, the securities will be valued at the market quotations. Because trading hours for certain foreign securities end before the close of the NYSE, closing market quotations may become unreliable. If between the time trading ends on a particular security and the close of the customary trading session on the NYSE, events occur that the investment adviser determines are significant and make the closing price unreliable, the Fund may fair value the security. If the event is likely to have affected the closing price of the security, the security will be valued at fair value in good faith using procedures approved by the Board of Trustees. Adjustments to closing prices to reflect fair value may also be based on a screening process of an independent pricing service to indicate the degree of certainty, based on historical data, that the closing price in the principal market where a foreign security trades is not the current value as of the close of the NYSE. Foreign securities’ prices meeting the approved degree of certainty that the price is not reflective of current value will be priced at the indication of fair value from the independent pricing service. Multiple factors may be considered by the independent pricing service in determining adjustments to reflect fair value and may include information relating to sector indices, American Depositary Receipts and domestic and foreign index futures. Foreign securities may have additional risks including exchange rate changes, potential for sharply devalued currencies and high inflation, political and economic upheaval, the relative lack of issuer information, relatively low market liquidity and the potential lack of strict financial and accounting controls and standards.
Securities for which market prices are not provided by any of the above methods may be valued based upon quotes furnished by independent sources. The last bid price may be used to value equity securities. The mean between the last bid and asked prices is used to value debt obligations, including corporate loans.
Securities for which market quotations are not readily available or became unreliable are valued at fair value as determined in good faith by or under the supervision of the Trust’s officers following procedures approved by the Board of Trustees. Issuer specific events, market trends, bid/asked quotes of brokers and information providers and other market data may be reviewed in the course of making a good faith determination of a security’s fair value.
The Fund may invest in securities that are subject to interest rate risk, meaning the risk that the prices will generally fall as interest rates rise and, conversely, the prices will generally rise as interest rates fall. Specific securities differ in their sensitivity to changes in interest rates
| 17 | Invesco American Franchise Fund |
depending on their individual characteristics. Changes in interest rates may result in increased market volatility, which may affect the value and/or liquidity of certain Fund investments.
Valuations change in response to many factors including the historical and prospective earnings of the issuer, the value of the issuer’s assets, general economic conditions, interest rates, investor perceptions and market liquidity. Because of the inherent uncertainties of valuation, the values reflected in the financial statements may materially differ from the value received upon actual sale of those investments.
| B. | Securities Transactions and Investment Income — Securities transactions are accounted for on a trade date basis. Realized gains or losses on sales are computed on the basis of specific identification of the securities sold. Interest income (net of withholding tax, if any) is recorded on the accrual basis from settlement date. Dividend income (net of withholding tax, if any) is recorded on the ex-dividend date. |
The Fund may periodically participate in litigation related to Fund investments. As such, the Fund may receive proceeds from litigation settlements. Any proceeds received are included in the Statement of Operations as realized gain (loss) for investments no longer held and as unrealized gain (loss) for investments still held.
Brokerage commissions and mark ups are considered transaction costs and are recorded as an increase to the cost basis of securities purchased and/or a reduction of proceeds on a sale of securities. Such transaction costs are included in the determination of net realized and unrealized gain (loss) from investment securities reported in the Statement of Operations and the Statement of Changes in Net Assets and the net realized and unrealized gains (losses) on securities per share in the Financial Highlights. Transaction costs are included in the calculation of the Fund’s net asset value and, accordingly, they reduce the Fund’s total returns. These transaction costs are not considered operating expenses and are not reflected in net investment income reported in the Statement of Operations and the Statement of Changes in Net Assets, or the net investment income per share and the ratios of expenses and net investment income reported in the Financial Highlights, nor are they limited by any expense limitation arrangements between the Fund and the investment adviser.
The Fund allocates income and realized and unrealized capital gains and losses to a class based on the relative net assets of each class.
| C. | Country Determination — For the purposes of making investment selection decisions and presentation in the Schedule of Investments, the investment adviser may determine the country in which an issuer is located and/or credit risk exposure based on various factors. These factors include the laws of the country under which the issuer is organized, where the issuer maintains a principal office, the country in which the issuer derives 50% or more of its total revenues and the country that has the primary market for the issuer’s securities, as well as other criteria. Among the other criteria that may be evaluated for making this determination are the country in which the issuer maintains 50% or more of its assets, the type of security, financial guarantees and enhancements, the nature of the collateral and the sponsor organization. Country of issuer and/or credit risk exposure has been determined to be the United States of America, unless otherwise noted. |
| D. | Distributions– Distributions from net investment income and net realized capital gain, if any, are generally declared and paid annually and recorded on the ex-dividend date. The Fund may elect to treat a portion of the proceeds from redemptions as distributions for federal income tax purposes. |
| E. | Federal Income Taxes –The Fund intends to comply with the requirements of Subchapter M of the Internal Revenue Code of 1986, as amended (the “Internal Revenue Code”), necessary to qualify as a regulated investment company and to distribute substantially all of the Fund’s taxable earnings to shareholders. As such, the Fund will not be subject to federal income taxes on otherwise taxable income (including net realized capital gain) that is distributed to shareholders. Therefore, no provision for federal income taxes is recorded in the financial statements. |
The Fund recognizes the tax benefits of uncertain tax positions only when the position is more likely than not to be sustained. Management has analyzed the Fund’s uncertain tax positions and concluded that no liability for unrecognized tax benefits should be recorded related to uncertain tax positions. Management is not aware of any tax positions for which it is reasonably possible that the total amounts of unrecognized tax benefits will change materially in the next 12 months.
The Fund files tax returns in the U.S. Federal jurisdiction and certain other jurisdictions. Generally, the Fund is subject to examinations by such taxing authorities for up to three years after the filing of the return for the tax period.
| F. | Expenses – Fees provided for under the Rule 12b-1 plan of a particular class of the Fund are charged to the operations of such class. Transfer agency fees and expenses and other shareholder recordkeeping fees and expenses attributable to Class R5 and Class R6 are allocated to each share class based on relative net assets. Sub-accounting fees attributable to Class R5 are charged to the operations of the class. Transfer agency fees and expenses and other shareholder recordkeeping fees and expenses relating to all other classes are allocated among those classes based on relative net assets. All other expenses are allocated among the classes based on relative net assets. |
| G. | Accounting Estimates – The preparation of financial statements in conformity with accounting principles generally accepted in the United States of America (“GAAP”) requires management to make estimates and assumptions that affect the reported amounts of assets and liabilities at the date of the financial statements and the reported amounts of revenues and expenses during the reporting period including estimates and assumptions related to taxation. Actual results could differ from those estimates by a significant amount. In addition, the Fund monitors for material events or transactions that may occur or become known after the period-end date and before the date the financial statements are released to print. |
| H. | Indemnifications – Under the Trust’s organizational documents, each Trustee, officer, employee or other agent of the Trust is indemnified against certain liabilities that may arise out of the performance of their duties to the Fund. Additionally, in the normal course of business, the Fund enters into contracts, including the Fund’s servicing agreements, that contain a variety of indemnification clauses. The Fund’s maximum exposure under these arrangements is unknown as this would involve future claims that may be made against the Fund that have not yet occurred. The risk of material loss as a result of such indemnification claims is considered remote. |
| I. | Securities Lending– The Fund may lend portfolio securities having a market value up to one-third of the Fund’s total assets. Such loans are secured by collateral equal to no less than the market value of the loaned securities determined daily by the securities lending provider. Such collateral will be cash or debt securities issued or guaranteed by the U.S. Government or any of its sponsored agencies. Cash collateral received in connection with these loans is invested in short-term money market instruments or affiliated money market funds and is shown as such on the Schedule of Investments. The Fund bears the risk of loss with respect to the investment of collateral. It is the Fund’s policy to obtain additional collateral from or return excess collateral to the borrower by the end of the next business day, following the valuation date of the securities loaned. Therefore, the value of the collateral held may be temporarily less than the value of the securities on loan. When loaning securities, the Fund retains certain benefits of owning the securities, including the economic equivalent of dividends or interest generated by the security. Lending securities entails a risk of loss to the Fund if, and to the extent that, the market value of the securities loaned were to increase and the |
| 18 | Invesco American Franchise Fund |
| | borrower did not increase the collateral accordingly, and the borrower failed to return the securities. The securities loaned are subject to termination at the option of the borrower or the Fund. Upon termination, the borrower will return to the Fund the securities loaned and the Fund will return the collateral. Upon the failure of the borrower to return the securities, collateral may be liquidated and the securities may be purchased on the open market to replace the loaned securities. The Fund could experience delays and costs in gaining access to the collateral and the securities may lose value during the delay which could result in potential losses to the Fund. Some of these losses may be indemnified by the lending agent. The Fund bears the risk of any deficiency in the amount of the collateral available for return to the borrower due to any loss on the collateral invested. Dividends received on cash collateral investments for securities lending transactions, which are net of compensation to counterparties, are included inDividends from affiliated money market funds on the Statement of Operations. The aggregate value of securities out on loan, if any, is shown as a footnote on the Statement of Assets and Liabilities. |
| J. | Foreign Currency Translations— Foreign currency is valued at the close of the NYSE based on quotations posted by banks and major currency dealers. Portfolio securities and other assets and liabilities denominated in foreign currencies are translated into U.S. dollar amounts at the date of valuation. Purchases and sales of portfolio securities (net of foreign taxes withheld on disposition) and income items denominated in foreign currencies are translated into U.S. dollar amounts on the respective dates of such transactions. The Fund does not separately account for the portion of the results of operations resulting from changes in foreign exchange rates on investments and the fluctuations arising from changes in market prices of securities held. The combined results of changes in foreign exchange rates and the fluctuation of market prices on investments (net of estimated foreign tax withholding) are included with the net realized and unrealized gain or loss from investments in the Statement of Operations. Reported net realized foreign currency gains or losses arise from (1) sales of foreign currencies, (2) currency gains or losses realized between the trade and settlement dates on securities transactions, and (3) the difference between the amounts of dividends, interest, and foreign withholding taxes recorded on the Fund’s books and the U.S. dollar equivalent of the amounts actually received or paid. Net unrealized foreign currency gains and losses arise from changes in the fair values of assets and liabilities, other than investments in securities at fiscal period end, resulting from changes in exchange rates. |
The Fund may invest in foreign securities, which may be subject to foreign taxes on income, gains on investments or currency repatriation, a portion of which may be recoverable. Foreign taxes, if any, are recorded based on the tax regulations and rates that exist in the foreign markets in which the Fund invests and are shown in the Statement of Operations.
| K. | Forward Foreign Currency Contracts— The Fund may engage in foreign currency transactions either on a spot (i.e. for prompt delivery and settlement) basis, or through forward foreign currency contracts, to manage or minimize currency or exchange rate risk. |
The Fund may also enter into forward foreign currency contracts for the purchase or sale of a security denominated in a foreign currency in order to “lock in” the U.S. dollar price of that security, or the Fund may also enter into forward foreign currency contracts that do not provide for physical settlement of the two currencies, but instead are settled by a single cash payment calculated as the difference between the agreed upon exchange rate and the spot rate at settlement based upon an agreed upon notional amount (non-deliverable forwards). The Fund will set aside liquid assets in an amount equal to the daily mark-to-market obligation for forward foreign currency contracts.
A forward foreign currency contract is an obligation between two parties (“Counterparties”) to purchase or sell a specific currency for an agreed-upon price at a future date. The use of forward foreign currency contracts does not eliminate fluctuations in the price of the underlying securities the Fund owns or intends to acquire but establishes a rate of exchange in advance. Fluctuations in the value of these contracts are measured by the difference in the contract date and reporting date exchange rates and are recorded as unrealized appreciation (depreciation) until the contracts are closed. When the contracts are closed, realized gains (losses) are recorded. Realized and unrealized gains (losses) on the contracts are included in the Statement of Operations. The primary risks associated with forward foreign currency contracts include failure of the Counterparty to meet the terms of the contract and the value of the foreign currency changing unfavorably. These risks may be in excess of the amounts reflected in the Statement of Assets and Liabilities.
NOTE 2—Advisory Fees and Other Fees Paid to Affiliates
The Trust has entered into a master investment advisory agreement with Invesco Advisers, Inc. (the "Adviser" or "Invesco"). Under the terms of the investment advisory agreement, the Fund accrues daily and pays monthly an advisory fee to the Adviser based on the annual rate of the Fund’s average daily net assets as follows:
| Average Daily Net Assets | Rate |
| First $250 million | 0.695% |
| Next $250 million | 0.67% |
| Next $500 million | 0.645% |
| Next $550 million | 0.62% |
| Next $3.45 billion | 0.60% |
| Next $250 million | 0.595% |
| Next $2.25 billion | 0.57% |
| Next $2.5 billion | 0.545% |
| Over $10 billion | 0.52% |
For the year ended August 31, 2019, the effective advisory fees incurred by the Fund was 0.58%.
Under the terms of a master sub-advisory agreement between the Adviser and each of Invesco Asset Management Deutschland GmbH, Invesco Asset Management Limited, Invesco Asset Management (Japan) Limited, Invesco Hong Kong Limited, Invesco Senior Secured Management, Inc. and Invesco Canada Ltd. (collectively, the "Affiliated Sub-Advisers") the Adviser, not the Fund, will pay 40% of the fees paid to the Adviser to any such Affiliated Sub-Adviser(s) that provide(s) discretionary investment management services to the Fund based on the percentage of assets allocated to such Affiliated Sub-Adviser(s).
The Adviser has contractually agreed, through at least June 30, 2020, to waive advisory fees and/or reimburse expenses of all shares to the extent necessary to limit total annual fund operating expenses after fee waiver and/or expense reimbursement (excluding certain items discussed
| 19 | Invesco American Franchise Fund |
below) of Class A, Class C, Class R, Class Y, Class R5 and Class R6 shares to 2.00%, 2.75%, 2.25%, 1.75%, 1.75% and 1.75%, respectively, of average daily net assets (the "expense limits"). In determining the Adviser’s obligation to waive advisory fees and/or reimburse expenses, the following expenses are not taken into account, and could cause the total annual fund operating expenses after fee waiver and/or expense reimbursement to exceed the numbers reflected above: (1) interest; (2) taxes; (3) dividend expense on short sales; (4) extraordinary or non-routine items, including litigation expenses; and (5) expenses that the Fund has incurred but did not actually pay because of an expense offset arrangement. Unless Invesco continues the fee waiver agreement, it will terminate on June 30, 2020. During its term, the fee waiver agreement cannot be terminated or amended to increase the expense limits or reduce the advisory fee waivers without approval of the Board of Trustees. The Adviser did not waive fees and/or reimburse expenses during the period under this expense limit.
Further, the Adviser has contractually agreed, through at least June 30, 2021, to waive the advisory fee payable by the Fund in an amount equal to 100% of the net advisory fees the Adviser receives from the affiliated money market funds on investments by the Fund of uninvested cash (excluding investments of cash collateral from securities lending) in such affiliated money market funds.
For the year ended August 31, 2019, the Adviser waived advisory fees of $62,032.
The Trust has entered into a master administrative services agreement with Invesco pursuant to which the Fund has agreed to pay Invesco for certain administrative costs incurred in providing accounting services to the Fund. For the year ended August 31, 2019, expenses incurred under the agreement are shown in the Statement of Operations asAdministrative services fees. Also, Invesco has entered into a sub-administration agreement whereby State Street Bank and Trust Company (“SSB”) serves as custodian and fund accountant and provides certain administrative services to the Fund.
The Trust has entered into a transfer agency and service agreement with Invesco Investment Services, Inc. (“IIS”) pursuant to which the Fund has agreed to pay IIS a fee for providing transfer agency and shareholder services to the Fund and reimburse IIS for certain expenses incurred by IIS in the course of providing such services. IIS may make payments to intermediaries that provide omnibus account services, sub-accounting services and/or networking services. All fees payable by IIS to intermediaries that provide omnibus account services or sub-accounting services are charged back to the Fund, subject to certain limitations approved by the Trust’s Board of Trustees. For the year ended August 31, 2019, expenses incurred under the agreement are shown in the Statement of Operations asTransfer agent fees.
Shares of the Fund are distributed by Invesco Distributors, Inc. (“IDI”). The Fund has adopted a distribution plan pursuant to Rule 12b-1 under the 1940 Act, and a service plan (collectively, the “Plans”) for Class A, Class C and Class R shares to compensate IDI for the sale, distribution, shareholder servicing and maintenance of shareholder accounts for these shares. Under the Plans, the Fund will incur annual fees of up to 0.25% of Class A average daily net assets, up to 1.00% of Class C average daily net assets and up to 0.50% of Class R average daily net assets. The fees are accrued daily and paid monthly.
With respect to Class C shares, the Fund is authorized to reimburse in future years any distribution related expenses that exceed the maximum annual reimbursement rate for such class, so long as such reimbursement does not cause the Fund to exceed the Class C maximum annual reimbursement rate, respectively. With respect to Class A shares, distribution related expenses that exceed the maximum annual reimbursement rate for such class are not carried forward to future years and the Fund will not reimburse IDI for any such expenses.
For the year ended August 31, 2019, expenses incurred under these agreements are shown in the Statement of Operations asDistribution fees.
Front-end sales commissions and CDSC (collectively, the “sales charges”) are not recorded as expenses of the Fund. Front-end sales commissions are deducted from proceeds from the sales of Fund shares prior to investment in Class A shares of the Fund. CDSC are deducted from redemption proceeds prior to remittance to the shareholder. During the year ended August 31, 2019, IDI advised the Fund that IDI retained $788,195 in front-end sales commissions from the sale of Class A shares and $15,663 and $11,311 from Class A and Class C shares, respectively, for CDSC imposed upon redemptions by shareholders.
For the year ended August 31, 2019, the Fund incurred $87,156 in brokerage commissions with Invesco Capital Markets, Inc., an affiliate of the Adviser and IDI, for portfolio transactions executed on behalf of the Fund.
Certain officers and trustees of the Trust are officers and directors of the Adviser, IIS and/or IDI.
NOTE 3—Additional Valuation Information
GAAP defines fair value as the price that would be received to sell an asset or paid to transfer a liability in an orderly transaction between market participants at the measurement date, under current market conditions. GAAP establishes a hierarchy that prioritizes the inputs to valuation methods, giving the highest priority to readily available unadjusted quoted prices in an active market for identical assets (Level 1) and the lowest priority to significant unobservable inputs (Level 3), generally when market prices are not readily available or are unreliable. Based on the valuation inputs, the securities or other investments are tiered into one of three levels. Changes in valuation methods may result in transfers in or out of an investment’s assigned level:
Level 1 – Prices are determined using quoted prices in an active market for identical assets.
Level 2 – Prices are determined using other significant observable inputs. Observable inputs are inputs that other market participants may use in pricing a security. These may include quoted prices for similar securities, interest rates, prepayment speeds, credit risk, yield curves, loss severities, default rates, discount rates, volatilities and others.
Level 3 – Prices are determined using significant unobservable inputs. In situations where quoted prices or observable inputs are unavailable (for example, when there is little or no market activity for an investment at the end of the period), unobservable inputs may be used. Unobservable inputs reflect the Fund’s own assumptions about the factors market participants would use in determining fair value of the securities or instruments and would be based on the best available information.
The following is a summary of the tiered valuation input levels, as of August 31, 2019. The level assigned to the securities valuations may not be an indication of the risk or liquidity associated with investing in those securities. Because of the inherent uncertainties of valuation, the values reflected in the financial statements may materially differ from the value received upon actual sale of those investments.
| 20 | Invesco American Franchise Fund |
| | Level 1 | Level 2 | Level 3 | Total |
| Investments in Securities | | | | |
| Common Stocks & Other Equity Interests | $10,090,817,073 | $693,812,724 | $— | $10,784,629,797 |
| Money Market Funds | 93,468,312 | — | — | 93,468,312 |
| Total Investments | $10,184,285,385 | $693,812,724 | $— | $10,878,098,109 |
NOTE 4—Security Transactions with Affiliated Funds
The Fund is permitted to purchase or sell securities from or to certain other Invesco Funds under specified conditions outlined in procedures adopted by the Board of Trustees of the Trust. The procedures have been designed to ensure that any purchase or sale of securities by the Fund from or to another fund or portfolio that is or could be considered an affiliate by virtue of having a common investment adviser (or affiliated investment advisers), common Trustees and/or common officers complies with Rule 17a-7 of the 1940 Act. Further, as defined under the procedures, each transaction is effected at the current market price. Pursuant to these procedures, for the year ended August 31, 2019, the Fund engaged in securities purchases of $34,488,300 and securities sales of $443,535, which resulted in net realized gains (losses) of $(152,328).
NOTE 5—Expense Offset Arrangement(s)
The expense offset arrangement is comprised of transfer agency credits which result from balances in demand deposit accounts used by the transfer agent for clearing shareholder transactions. For the year ended August 31, 2019, the Fund received credits from this arrangement, which resulted in the reduction of the Fund’s total expenses of $153,767.
NOTE 6—Trustees’ and Officers’ Fees and Benefits
Trustees’ and Officers’ Fees and Benefits include amounts accrued by the Fund to pay remuneration to certain Trustees and Officers of the Fund. Trustees have the option to defer compensation payable by the Fund, and Trustees’ and Officers’ Fees and Benefits also include amounts accrued by the Fund to fund such deferred compensation amounts. Those Trustees who defer compensation have the option to select various Invesco Funds in which their deferral accounts shall be deemed to be invested. Finally, certain current Trustees were eligible to participate in a retirement plan that provided for benefits to be paid upon retirement to Trustees over a period of time based on the number of years of service. The Fund may have certain former Trustees who also participate in a retirement plan and receive benefits under such plan.Trustees’ and Officers’ Fees and Benefits include amounts accrued by the Fund to fund such retirement benefits. Obligations under the deferred compensation and retirement plans represent unsecured claims against the general assets of the Fund.
NOTE 7—Cash Balances
The Fund is permitted to temporarily carry a negative or overdrawn balance in its account with SSB, the custodian bank. Such balances, if any at period-end, are shown in the Statement of Assets and Liabilities under the payable captionAmount due custodian. To compensate the custodian bank for such overdrafts, the overdrawn Fund may either (1) leave funds as a compensating balance in the account so the custodian bank can be compensated by earning the additional interest; or (2) compensate by paying the custodian bank at a rate agreed upon by the custodian bank and Invesco, not to exceed the contractually agreed upon rate. The Fund may not purchase additional securities when any borrowings from banks or broker-dealers exceed 5% of the Fund’s total assets, or when any borrowings from an Invesco Fund are outstanding.
NOTE 8—Distributions to Shareholders and Tax Components of Net Assets
| Tax Character of Distributions to Shareholders Paid During the Fiscal Years Ended August 31, 2019 and August 31, 2018 |
| | 2019 | 2018 |
| Ordinary income | $— | $33,773,211 |
| Long-term capital gain | 886,080,641 | 493,481,408 |
| Total distributions | $886,080,641 | $527,254,619 |
| Tax Components of Net Assets at Period-End: |
| | 2019 |
| Undistributed long-term capital gain | $645,140,495 |
| Net unrealized appreciation — investments | 4,672,376,739 |
| Net unrealized appreciation (depreciation) - foreign currencies | (8,131) |
| Temporary book/tax differences | (2,336,319) |
| Late-Year ordinary loss deferral | (2,957,016) |
| Shares of beneficial interest | 5,533,002,215 |
| Total net assets | $10,845,217,983 |
The difference between book-basis and tax-basis unrealized appreciation (depreciation) is due to differences in the timing of recognition of gains and losses on investments for tax and book purposes. The Fund’s net unrealized appreciation difference is attributable primarily to wash sales.
The temporary book/tax differences are a result of timing differences between book and tax recognition of income and/or expenses. The Fund’s temporary book/tax differences are the result of the trustee deferral of compensation and retirement plan benefits.
| 21 | Invesco American Franchise Fund |
Capital loss carryforward is calculated and reported as of a specific date. Results of transactions and other activity after that date may affect the amount of capital loss carryforward actually available for the Fund to utilize. Capital losses generated in years beginning after December 22, 2010 can be carried forward for an unlimited period, whereas previous losses expire in eight tax years. Capital losses with an expiration period may not be used to offset capital gains until all net capital losses without an expiration date have been utilized. Capital loss carryforwards with no expiration date will retain their character as either short-term or long-term capital losses instead of as short-term capital losses as under prior law. The ability to utilize capital loss carryforwards in the future may be limited under the Internal Revenue Code and related regulations based on the results of future transactions.
The Fund does not have a capital loss carryforward as of August 31, 2019.
NOTE 9—Investment Transactions
The aggregate amount of investment securities (other than short-term securities, U.S. Treasury obligations and money market funds, if any) purchased and sold by the Fund during the year ended August 31, 2019 was $4,553,887,927 and $5,358,576,967, respectively. Cost of investments, including any derivatives, on a tax basis includes the adjustments for financial reporting purposes as of the most recently completed federal income tax reporting period-end.
| Unrealized Appreciation (Depreciation) of Investments on a Tax Basis |
| Aggregate unrealized appreciation of investments | $4,767,731,793 |
| Aggregate unrealized (depreciation) of investments | (95,355,054) |
| Net unrealized appreciation of investments | $4,672,376,739 |
Cost of investments for tax purposes is $6,205,721,370.
NOTE 10—Reclassification of Permanent Differences
Primarily as a result of differing book/tax treatment of net operating losses, on August 31, 2019, undistributed net investment income (loss) was increased by $13,280,668, undistributed net realized gain (loss) was increased by $67,600 and shares of beneficial interest was decreased by $13,348,268. This reclassification had no effect on the net assets of the Fund.
NOTE 11—Share Information
| | Summary of Share Activity |
| | Years ended August 31, |
| | 2019(a) | | 2018 |
| | Shares | Amount | | Shares | Amount |
| Sold: | | | | | |
| Class A | 14,898,952 | $303,695,759 | | 15,878,174 | $336,279,096 |
| Class B(b) | - | - | | 11,213 | 222,192 |
| Class C | 1,254,642 | 23,546,144 | | 1,956,690 | 38,381,580 |
| Class R | 313,575 | 6,189,319 | | 385,858 | 7,948,431 |
| Class Y | 3,812,120 | 79,347,751 | | 5,667,513 | 123,150,034 |
| Class R5 | 927,059 | 19,376,762 | | 953,465 | 20,609,344 |
| Class R6 | 899,657 | 18,597,376 | | 1,100,474 | 23,450,394 |
| Issued as reinvestment of dividends: | | | | | |
| Class A | 42,328,565 | 759,797,658 | | 23,082,251 | 454,951,201 |
| Class B(b) | - | - | | 127,537 | 2,441,051 |
| Class C | 1,927,229 | 31,413,829 | | 1,060,110 | 19,294,012 |
| Class R | 171,298 | 3,004,573 | | 96,419 | 1,865,721 |
| Class Y | 1,242,260 | 22,857,584 | | 576,480 | 11,593,017 |
| Class R5 | 358,107 | 6,607,064 | | 173,387 | 3,493,738 |
| Class R6 | 572,179 | 10,625,365 | | 327,912 | 6,636,942 |
| Conversion of Class B shares to Class A shares:(c) | | | | | |
| Class A | - | - | | 2,428,444 | 52,988,647 |
| Class B | - | - | | (2,523,779) | (52,988,647) |
| Automatic conversion of Class C shares to Class A shares: | | | | | |
| Class A | 10,853,607 | 203,583,098 | | - | - |
| Class C | (11,963,414) | (203,583,098) | | - | - |
| 22 | Invesco American Franchise Fund |
| | Summary of Share Activity |
| | Years ended August 31, |
| | 2019(a) | | 2018 |
| | Shares | Amount | | Shares | Amount |
| Reacquired: | | | | | |
| Class A | (47,849,882) | $(969,146,405) | | (47,013,118) | $(989,551,046) |
| Class B(b) | - | - | | (603,399) | (11,984,637) |
| Class C | (2,869,385) | (52,369,765) | | (3,804,108) | (74,599,994) |
| Class R | (542,053) | (10,410,148) | | (512,785) | (10,702,230) |
| Class Y | (4,629,269) | (95,797,784) | | (3,442,724) | (73,975,531) |
| Class R5 | (1,494,658) | (31,210,125) | | (767,131) | (16,592,817) |
| Class R6 | (1,450,009) | (31,192,047) | | (1,871,050) | (40,815,342) |
| Net increase (decrease) in share activity | 8,760,580 | $94,932,910 | | (6,712,167) | $(167,904,844) |
| (a) | There are entities that are record owners of more than 5% of the outstanding shares of the Fund and in the aggregate own 27% of the outstanding shares of the Fund. IDI has an agreement with these entities to sell Fund shares. The Fund, Invesco and/or Invesco affiliates may make payments to these entities, which are considered to be related to the Fund, for providing services to the Fund, Invesco and/or Invesco affiliates including but not limited to services such as securities brokerage, distribution, third party record keeping and account servicing. The Fund has no knowledge as to whether all or any portion of the shares owned of record by these entities are also owned beneficially. |
| (b) | Class B shares activity for the period September 1, 2017 through January 26, 2018 (date of conversion). |
| (c) | Effective as of the close of business January 26, 2018, all outstanding Class B shares were converted to Class A shares. |
| 23 | Invesco American Franchise Fund |
Report of Independent Registered Public Accounting Firm
To the Board of Trustees of AIM Counselor Series Trust (Invesco Counselor Series Trust) and Shareholders of Invesco American Franchise Fund
Opinion on the Financial Statements
We have audited the accompanying statement of assets and liabilities, including the schedule of investments, of Invesco American Franchise (one of the funds constituting AIM Counselor Series Trust (Invesco Counselor Series Trust), hereafter referred to as the "Fund") as of August 31, 2019, the related statement of operations for the year ended August 31, 2019, the statement of changes in net assets for each of the two years in the period ended August 31, 2019, including the related notes, and the financial highlights for each of the five years in the period ended August 31, 2019 (collectively referred to as the "financial statements"). In our opinion, the financial statements present fairly, in all material respects, the financial position of the Fund as of August 31, 2019, the changes in its net assets for each of the two years in the period ended August 31, 2019 and the financial highlights for each of the five years in the period ended August 31, 2019 in conformity with accounting principles generally accepted in the United States of America.
Basis for Opinion
These financial statements are the responsibility of the Fund’s management. Our responsibility is to express an opinion on the Fund’s financial statements based on our audits. We are a public accounting firm registered with the Public Company Accounting Oversight Board (United States) (PCAOB) and are required to be independent with respect to the Fund in accordance with the U.S. federal securities laws and the applicable rules and regulations of the Securities and Exchange Commission and the PCAOB.
We conducted our audits of these financial statements in accordance with the standards of the PCAOB. Those standards require that we plan and perform the audit to obtain reasonable assurance about whether the financial statements are free of material misstatement, whether due to error or fraud.
Our audits included performing procedures to assess the risks of material misstatement of the financial statements, whether due to error or fraud, and performing procedures that respond to those risks. Such procedures included examining, on a test basis, evidence regarding the amounts and disclosures in the financial statements. Our audits also included evaluating the accounting principles used and significant estimates made by management, as well as evaluating the overall presentation of the financial statements. Our procedures included confirmation of securities owned as of August 31, 2019 by correspondence with the custodian, transfer agent and brokers; when replies were not received from brokers, we performed other auditing procedures. We believe that our audits provide a reasonable basis for our opinion.
/s/ PricewaterhouseCoopers LLP
Houston, Texas
October 29, 2019
We have served as the auditor of one or more of the investment companies in the Invesco group of investment companies since at least 1995. We have not been able to determine the specific year we began serving as auditor.
| 24 | Invesco American Franchise Fund |
Calculating your ongoing Fund expenses
Example
As a shareholder of the Fund, you incur two types of costs: (1) transaction costs, which may include sales charges (loads) on purchase payments or contingent deferred sales charges on redemptions, if any; and (2) ongoing costs, including management fees, distribution and/or service (12b-1) fees, and other Fund expenses. This example is intended to help you understand your ongoing costs (in dollars) of investing in the Fund and to compare these costs with ongoing costs of investing in other mutual funds. The example is based on an investment of $1,000 invested at the beginning of the period and held for the entire period March 1, 2019 through August 31, 2019.
Actual expenses
The table below provides information about actual account values and actual expenses. You may use the information in this table, together with the amount you invested, to estimate the expenses that you paid over the period. Simply divide your account value by $1,000 (for example, an $8,600 account value divided by $1,000 = 8.6), then multiply the result by the number in the table under the heading entitled “Actual Expenses Paid During Period” to estimate the expenses you paid on your account during this period.
Hypothetical example for comparison purposes
The table below also provides information about hypothetical account values and hypothetical expenses based on the Fund’s actual expense ratio and an assumed rate of return of 5% per year before expenses, which is not the Fund’s actual return.
The hypothetical account values and expenses may not be used to estimate the actual ending account balance or expenses you paid for the period. You may use this information to compare the ongoing costs of investing in the Fund and other funds. To do so, compare this 5% hypothetical example with the 5% hypothetical examples that appear in the shareholder reports of the other funds.
Please note that the expenses shown in the table are meant to highlight your ongoing costs only and do not reflect any transaction costs, such as sales charges (loads) on purchase payments or contingent deferred sales charges on redemptions, if any. Therefore, the hypothetical information is useful in comparing ongoing costs only, and will not help you determine the relative total costs of owning different funds. In addition, if these transaction costs were included, your costs would have been higher.
| | Beginning
Account Value (03/01/19) | ACTUAL | HYPOTHETICAL
(5% annual return before
expenses) | Annualized
Expense
Ratio |
Ending
Account Value
(08/31/19)1 | Expenses
Paid During
Period2 | Ending
Account Value
(08/31/19) | Expenses
Paid During
Period2 |
| Class A | $1,000.00 | $1,088.50 | $5.37 | $1,020.06 | $5.19 | 1.02% |
| Class C | 1,000.00 | 1,084.10 | 9.30 | 1,016.28 | 9.00 | 1.77 |
| Class R | 1,000.00 | 1,086.90 | 6.68 | 1,018.80 | 6.46 | 1.27 |
| Class Y | 1,000.00 | 1,089.80 | 4.06 | 1,021.32 | 3.92 | 0.77 |
| Class R5 | 1,000.00 | 1,090.00 | 3.74 | 1,021.63 | 3.62 | 0.71 |
| Class R6 | 1,000.00 | 1,091.00 | 3.32 | 1,022.03 | 3.21 | 0.63 |
| 1 | The actual ending account value is based on the actual total return of the Fund for the period March 1, 2019 through August 31, 2019, after actual expenses and will differ from the hypothetical ending account value which is based on the Fund’s expense ratio and a hypothetical annual return of 5% before expenses. |
| 2 | Expenses are equal to the Fund’s annualized expense ratio as indicated above multiplied by the average account value over the period, multiplied by 184/365 to reflect the most recent fiscal half year. |
| 25 | Invesco American Franchise Fund |
Approval of Investment Advisory and Sub-Advisory Contracts
At meetings held on June 10, 2019, the Board of Trustees (the Board or the Trustees) of AIM Counselor Series Trust (Invesco Counselor Series Trust) as a whole, and the independent Trustees, who comprise over 75% of the Board, voting separately, approved the continuance of the Invesco American Franchise Fund’s (the Fund) Master Investment Advisory Agreement with Invesco Advisers, Inc. (Invesco Advisers and the investment advisory agreement) and the Master IntergroupSub-Advisory Contract for Mutual Funds with Invesco Asset Management Deutschland GmbH, Invesco Asset Management Limited, Invesco Asset Management (Japan) Limited, Invesco Hong Kong Limited, Invesco Senior Secured Management, Inc. and Invesco Canada Ltd. (collectively, the AffiliatedSub-Advisers and thesub-advisory contracts) for another year, effective July 1, 2019. After evaluating the factors discussed below, among others, the Board approved the renewal of the Fund’s investment advisory agreement and thesub-advisory contracts and determined that the compensation payable by the Fund to Invesco Advisers and by Invesco Advisers to the AffiliatedSub-Advisers is fair and reasonable.
The Board’s Evaluation Process
The Board’s Investments Committee has established threeSub-Committees, which meet throughout the year to review the performance of funds advised by Invesco Advisers (the Invesco Funds). As part of a regularly scheduled basis ofin-person Board meetings, theSub-Committees meet with portfolio managers for their assigned Invesco Funds and other members of management to review detailed information about investment performance and portfolio attributes of these funds. The Board took into account evaluations and reports that it received from the Investments Committee andSub-Committees, as well as the information provided to such committees and the Board throughout the year, in considering whether to approve each Invesco Fund’s investment advisory agreement andsub-advisory contracts.
As part of the contract renewal process, the Board reviews and considers information provided in response to detailed requests for information submitted to management by the independent Trustees with assistance from legal counsel to the independent Trustees. The Board receives comparative investment performance and fee data regarding the Invesco Funds prepared by Invesco Advisers and Broadridge Financial Solutions, Inc. (Broadridge), an independent mutual fund data provider. The Board also receives an independent written evaluation from the Senior Officer, an officer of the Invesco Funds who reports directly to the independent Trustees. The Senior Officer’s evaluation is prepared as part of his responsibility to manage the process by which the Invesco Funds’ proposed management fees
are negotiated during the annual contract renewal process to ensure they are negotiated in a manner that is at arms’ length and reasonable. In addition to meetings with Invesco Advisers and fund counsel throughout the year, the independent Trustees also discuss the continuance of the investment advisory agreement andsub-advisory contracts in separate sessions with the Senior Officer and with independent legal counsel.
The discussion below is a summary of the Senior Officer’s independent written evaluation with respect to the Fund’s investment advisory agreement, as well as a discussion of the material factors and related conclusions that formed the basis for the Board’s approval of the Fund’s investment advisory agreement andsub-advisory contracts. The Trustees’ review and conclusions are based on the comprehensive consideration of all information presented to them during the course of the year and in prior years and are not the result of any single determinative factor. Moreover, one Trustee may have weighed a particular piece of information or factor differently than another Trustee. This information is current as of June 10, 2019.
Factors and Conclusions and Summary of Independent Written Fee Evaluation
| A. | Nature, Extent and Quality of Services Provided by Invesco Advisers and the AffiliatedSub-Advisers |
The Board reviewed the nature, extent and quality of the advisory services provided to the Fund by Invesco Advisers under the Fund’s investment advisory agreement, and the credentials and experience of the officers and employees of Invesco Advisers who provide these services, including the Fund’s portfolio manager(s). The Board’s review included consideration of Invesco Advisers’ investment process oversight and structure, credit analysis and investment risk management. The Board also considerednon-advisory services that Invesco Advisers and its affiliates provide to the Invesco Funds such as various back office support functions, third party oversight, internal audit, valuation, portfolio trading and legal and compliance. The Board also received and reviewed information about Invesco Advisers’ role as administrator of the Invesco Funds’ liquidity risk management program. The Board also reviewed and considered the benefits to shareholders of investing in a fund that is part of the Invesco family of funds under the umbrella of Invesco Ltd., Invesco Advisers’ parent company, and noted Invesco Ltd.’s depth and experience in conducting an investment management business, as well as its commitment of financial and other resources to such business. The Board reviewed and considered information about the resources that Invesco Advisers intends to continue to
commit to managing the Invesco family of funds following Invesco Ltd.’s acquisition of OppenheimerFunds, Inc. and its subsidiaries. The Board concluded that the nature, extent and quality of the services provided to the Fund by Invesco Advisers are appropriate and satisfactory.
The Board reviewed the services that may be provided by the AffiliatedSub-Advisers under thesub-advisory contracts and the credentials and experience of the officers and employees of the AffiliatedSub-Advisers who provide these services. The Board noted the AffiliatedSub-Advisers’ expertise with respect to certain asset classes and that the AffiliatedSub-Advisers have offices and personnel that are located in financial centers around the world. As a result, the Board noted that the AffiliatedSub-Advisers can provide research and investment analysis on the markets and economies of various countries in which the Fund may invest, make recommendations regarding securities and assist with security trades. The Board concluded that thesub-advisory contracts may benefit the Fund and its shareholders by permitting Invesco Advisers to use the resources and talents of the AffiliatedSub-Advisers in managing the Fund. The Board concluded that the nature, extent and quality of the services that may be provided by the AffiliatedSub-Advisers are appropriate and satisfactory.
| B. | Fund Investment Performance |
The Board considered Fund investment performance as a relevant factor in considering whether to approve the investment advisory agreement. The Board did not view Fund investment performance as a relevant factor in considering whether to approve thesub-advisory contracts for the Fund, as no AffiliatedSub-Adviser currently manages assets of the Fund.
The Board compared the Fund’s investment performance over multiple time periods ending December 31, 2018 to the performance of funds in the Broadridge performance universe and against the LipperLarge-Cap Growth Funds Index. The Board noted that performance of Class A shares of the Fund was in the fifth quintile of its performance universe for the one, three and five year periods (the first quintile being the best performing funds and the fifth quintile being the worst performing funds). The Board noted that performance of Class A shares of the Fund was below the performance of the Index for the one, three and five year periods. The Board noted that the Fund’s security selection in and underweight and overweight exposure to certain sectors detracted from the Fund’s performance.The Trustees also reviewed more recent Fund performance and this review did not change their conclusions.
26 Invesco American Franchise Fund
| C. | Advisory andSub-Advisory Fees and Fund Expenses |
The Board compared the Fund’s contractual management fee rate to the contractual management fee rates of funds in the Fund’s Broadridge expense group. The Board noted that the contractual management fee rate for Class A shares of the Fund was reasonably comparable to the median contractual management fee rate of funds in its expense group. The Board noted that the term “contractual management fee” for funds in the expense group may include both advisory and certainnon-portfolio management administrative services fees, but that Broadridge does not provide information on a fund by fund basis as to what is included. The Board also reviewed the methodology used by Broadridge in providing expense group information, which includes using each fund’s contractual management fee schedule (including any applicable breakpoints) as reported in the most recent prospectus or statement of additional information for each fund in the expense group. The Board also considered comparative information regarding the Fund’s total expense ratio and its various components.
The Board noted that Invesco Advisers has contractually agreed to waive fees and/or limit expenses of the Fund for the term disclosed in the Fund’s registration statement in an amount necessary to limit total annual operating expenses to a specified percentage of average daily net assets for each class of the Fund.
The Board also considered the fees charged by Invesco Advisers and the AffiliatedSub-Advisers to other similarly managed client accounts. The Board noted that Invesco Advisers or the AffiliatedSub-Advisers may charge lower fees to large institutional clients. Invesco Advisers reviewed with the Board differences in the scope of services it provides to the Invesco Funds relative to certain other types of client accounts, including management of cash flows as a result of redemptions and purchases, necessary infrastructure such as officers, office space, technology, legal and distribution, oversight of service providers, costs and business risks associated with launching new funds and sponsoring and maintaining the product line, preparation of annual registration statement updates and financial information and compliance with federal and state laws and regulations.
The Board also considered the services that may be provided by the AffiliatedSub-Advisers pursuant to thesub-advisory contracts, as well as the fees payable by Invesco Advisers to the AffiliatedSub-Advisers pursuant to thesub-advisory contracts.
| D. | Economies of Scale and Breakpoints |
The Board considered the extent to which there may be economies of scale in the provision of advisory services to the Fund. The Board considered Invesco’s reinvestment in its business, including investments in business infrastructure and cybersecurity. The Board also
considered that the Fund benefits from economies of scale through contractual breakpoints in the Fund’s advisory fee schedule, which generally operate to reduce the Fund’s expense ratio as it grows in size. The Board noted that the Fund shares directly in economies of scale through lower fees charged by third party service providers based on the combined size of the Invesco Funds. The Board noted that the Fund may also benefit from economies of scale through initial fee setting, fee waivers and expense reimbursements.
| E. | Profitability and Financial Resources |
The Board reviewed information from Invesco Advisers concerning the costs of the advisory and other services that Invesco Advisers and its affiliates provide to the Fund and the Invesco Funds and the profitability of Invesco Advisers and its affiliates in providing these services. The Board considered the methodology used for calculating profitability and noted the periodic review of such methodology by an independent consultant. The Board noted that Invesco Advisers continues to operate at a net profit from services Invesco Advisers and its affiliates provide to the Invesco Funds and the Fund. The Board did not deem the level of profits realized by Invesco Advisers and its affiliates from providing services to the Fund to be excessive given the nature, extent and quality of the services provided. The Board received information from Invesco Advisers demonstrating that Invesco Advisers and the AffiliatedSub-Advisers are financially sound and have the resources necessary to perform their obligations under the investment advisory agreement andsub-advisory contracts.
| F. | Collateral Benefits to Invesco Advisers and its Affiliates |
The Board considered various other benefits received by Invesco Advisers and its affiliates from the relationship with the Fund, including the fees received for providing administrative, transfer agency and distribution services to the Fund. The Board considered comparative information regarding fees charged for these services, including information provided by Broadridge and other independent sources. The Board considered the performance of Invesco Advisers and its affiliates in providing these services and the organizational structure employed to provide these services. The Board also considered that these services are provided to the Fund pursuant to written contracts that are reviewed and approved on an annual basis by the Board; and that the services are required for the operation of the Fund.
The Board considered the benefits realized by Invesco Advisers and the AffiliatedSub-Advisers as a result of portfolio brokerage transactions executed through “soft dollar” arrangements. The Board noted that soft dollar arrangements may result in the Fund bearing costs to purchase research that may be used by Invesco Advisers or the AffiliatedSub-Advisers with other clients and may reduce Invesco Advisers’ or the AffiliatedSub-Advisers’ expenses. The Board also considered that it receives periodic
reports from Invesco representing that these arrangements are consistent with regulatory requirements. The Board did not deem the soft dollar arrangements to be inappropriate.
The Board considered that the Fund’s uninvested cash and cash collateral from any securities lending arrangements may be invested in money market funds advised by Invesco Advisers pursuant to procedures approved by the Board. The Board considered information regarding the returns of the affiliated money market funds relative to comparable overnight investments, as well as the costs to the Fund of such investments. The Board noted that Invesco Advisers receives advisory fees from these affiliated money market funds attributable to such investments, although Invesco Advisers has contractually agreed to waive through varying periods the advisory fees payable by the Invesco Funds with respect to certain investments in the affiliated money market funds. The waiver is in an amount equal to 100% of the net advisory fee Invesco Advisers receives from the affiliated money market funds with respect to the Fund’s investment in the affiliated money market funds of uninvested cash, but not cash collateral. The Board concluded that the amount of advisory fees received by Invesco Advisers from the Fund’s investment of cash collateral from any securities lending arrangements in the affiliated money market funds is fair and reasonable.
The Board also considered that an affiliated broker may receive commissions for executing certain trades for the Fund. Invesco Advisers and the AffiliatedSub-Advisers may use the affiliated broker to, among other things, control order routing and minimize information leakage, and the Board was advised that such trades are executed in compliance with rules under the federal securities laws and consistent with best execution obligations.
27 Invesco American Franchise Fund
Tax Information
Form 1099-DIV, Form 1042-S and other year–end tax information provide shareholders with actual calendar year amounts that should be included in their tax returns. Shareholders should consult their tax advisers.
The following distribution information is being provided as required by the Internal Revenue Code or to meet a specific state’s requirement.
The Fund designates the following amounts or, if subsequently determined to be different, the maximum amount allowable for its fiscal year ended August 31, 2019:
| Federal and State Income Tax | |
| Long-Term Capital Gain Distributions | $886,080,641 |
| Qualified Dividend Income* | 0% |
| Corporate Dividends Received Deduction* | 0% |
| U.S. Treasury Obligations* | 0% |
| Tax-Exempt Interest Dividends* | 0% |
| * | The above percentages are based on ordinary income dividends paid to shareholders during the Fund’s fiscal year. |
| 28 | Invesco American Franchise Fund |
Trustees and Officers
The address of each trustee and officer is AIM Counselor Series Trust (Invesco Counselor Series Trust) (the “Trust”), 11 Greenway Plaza, Suite 1000, Houston, Texas 77046-1173. The trustees serve for the life of the Trust, subject to their earlier death, incapacitation, resignation, retirement or removal as more specifically provided in the Trust’s organizational documents. Each officer serves for a one year term or until their successors are elected and qualified. Column two below includes length of time served with predecessor entities, if any.
| | | | | | | | |
Name, Year of Birth and Position(s) Held with the Trust | | Trustee and/ or Officer Since | | Principal Occupation(s) During Past 5 Years | | Number of Funds in Fund
Complex
Overseen by
Trustee | | Other Directorship(s) Held by Trustee During Past 5 Years |
| Interested Persons | | | | | | | | |
Martin L. Flanagan1 — 1960 Trustee and Vice Chair | | 2007 | | Executive Director, Chief Executive Officer and President, Invesco Ltd. (ultimate parent of Invesco and a global investment management firm); Trustee and Vice Chair, The Invesco Funds; Vice Chair, Investment Company Institute; and Member of Executive Board, SMU Cox School of Business Formerly: Advisor to the Board, Invesco Advisers, Inc. (formerly known as Invesco Institutional (N.A.), Inc.); Chairman and Chief Executive Officer, Invesco Advisers, Inc. (registered investment adviser); Director, Chairman, Chief Executive Officer and President, Invesco Holding Company (US), Inc. (formerly IVZ Inc.) (holding company), Invesco Group Services, Inc. (service provider) and Invesco North American Holdings, Inc. (holding company); Director, Chief Executive Officer and President, Invesco Holding Company Limited (parent of Invesco and a global investment management firm); Director, Invesco Ltd.; Chairman, Investment Company Institute and President,Co-Chief Executive Officer,Co-President, Chief Operating Officer and Chief Financial Officer, Franklin Resources, Inc. (global investment management organization) | | 229 | | None |
Philip A. Taylor2 — 1954 Trustee | | 2006 | | Vice Chair, Invesco Ltd.; Trustee, The Invesco Funds Formerly: Director, Invesco Canada Ltd. (formerly known as Invesco Trimark Ltd./Invesco Trimark Ltèe) (registered investment adviser and registered transfer agent); Head of the Americas and Senior Managing Director, Invesco Ltd.; Director, Invesco Advisers, Inc. (formerly known as Invesco Institutional (N.A.), Inc.) (registered investment adviser); Director and Chairman, Invesco Investment Services, Inc. (formerly known as Invesco AIM Investment Services, Inc.) (registered transfer agent); Chief Executive Officer, Invesco Corporate Class Inc. (corporate mutual fund company); Chairman and Chief Executive Officer, Invesco Canada Ltd. (formerly known as Invesco Trimark Ltd./Invesco Trimark Ltèe) (registered investment adviser and registered transfer agent); Senior Vice President, The Invesco Funds; Director, Invesco Investment Advisers LLC (formerly known as Van Kampen Asset Management); Director, Chairman, Chief Executive Officer and President, Invesco Management Group, Inc. (formerly known as Invesco AIM Management Group, Inc.) (financial services holding company);Co-Chairman,Co-President andCo-Chief Executive Officer, Invesco Advisers, Inc. (formerly known as Invesco Institutional (N.A.), Inc.) (registered investment adviser); Director, Chief Executive Officer and President, Van Kampen Exchange Corp; President and Principal Executive Officer, The Invesco Funds (other than AIM Treasurer’s Series Trust (Invesco Treasurer’s Series Trust), Short-Term Investments Trust and Invesco Management Trust); Executive Vice President, The Invesco Funds (AIM Treasurer’s Series Trust (Invesco Treasurer’s Series Trust), Short-Term Investments Trust and Invesco Management Trust only); Director and President, INVESCO Funds Group, Inc. (registered investment adviser and registered transfer agent); Director and Chairman, IVZ Distributors, Inc. (formerly known as INVESCO Distributors, Inc.) (registered broker dealer); Director, President and Chairman, Invesco Inc. (holding company), Invesco Canada Holdings Inc. (holding company), Trimark Investments Ltd./Placements Trimark Ltèe and Invesco Financial Services Ltd/Services Financiers Invesco Ltèe; Chief Executive Officer, Invesco Canada Fund Inc. (corporate mutual fund company); Director and Chairman, Van Kampen Investor Services Inc.; Director, Chief Executive Officer and President, 1371 Preferred Inc. (holding company) and Van Kampen Investments Inc.; Director and President, AIM GP Canada Inc. (general partner for limited partnerships) and Van Kampen Advisors, Inc.; Director and Chief Executive Officer, Invesco Trimark Dealer Inc. (registered broker dealer); Director, Invesco Distributors, Inc. (formerly known as Invesco AIM Distributors, Inc.) (registered broker dealer); Manager, Invesco Capital Management LLC; Director, Chief Executive Officer and President, Invesco Advisers, Inc.; Director, Chairman, Chief Executive Officer and President, Invesco AIM Capital Management, Inc.; President, Invesco Trimark Dealer Inc. and Invesco Trimark Ltd./Invesco Trimark Ltèe; Director and President, AIM Trimark Corporate Class Inc. and AIM Trimark Canada Fund Inc.; Senior Managing Director, Invesco Holding Company Limited; Director and Chairman, Fund Management Company (former registered broker dealer); President and Principal Executive Officer, The Invesco Funds (AIM Treasurer’s Series Trust (Invesco Treasurer’s Series Trust), and Short-Term Investments Trust only); President, AIM Trimark Global Fund Inc. and AIM Trimark Canada Fund Inc. | | 229 | | None |
| 1 | Mr. Flanagan is considered an interested person (within the meaning of Section 2(a)(19) of the 1940 Act) of the Trust because he is an officer of the Adviser to the Trust, and an officer and a director of Invesco Ltd., ultimate parent of the Adviser. |
| 2 | Mr. Taylor is considered an interested person (within the meaning of Section 2(a)(19) of the 1940 Act) of the Trust because he is an officer of Invesco Ltd., ultimate parent of the Adviser. |
T-1 Invesco American Franchise Fund
Trustees and Officers—(continued)
| | | | | | | | |
Name, Year of Birth and Position(s) Held with the Trust | | Trustee and/ or Officer Since | | Principal Occupation(s)
During Past 5 Years | | Number of
Funds in Fund
Complex
Overseen by
Trustee | | Other Directorship(s) Held by Trustee During
Past 5 Years |
| Independent Trustees | | | | | | | | |
Bruce L. Crockett — 1944 Trustee and Chair | | 2003 | | Chairman, Crockett Technologies Associates (technology consulting company) Formerly: Director, Captaris (unified messaging provider); Director, President and Chief Executive Officer, COMSAT Corporation; Chairman, Board of Governors of INTELSAT (international communications company); ACE Limited (insurance company); Independent Directors Council and Investment Company Institute: Member of the Audit Committee, Investment Company Institute; Member of the Executive Committee and Chair of the Governance Committee, Independent Directors Council | | 229 | | Director and Chairman of the Audit Committee, ALPS (Attorneys Liability Protection Society) (insurance company); Director and Member of the Audit Committee and Compensation Committee, Ferroglobe PLC (metallurgical company) |
David C. Arch — 1945 Trustee | | 2010 | | Chairman of Blistex Inc. (consumer health care products manufacturer); Member, World Presidents’ Organization | | 229 | | Board member of the Illinois Manufacturers’ Association |
Beth Ann Brown — 1968 Trustee | | 2019 | | Independent Consultant Formerly: Head of Intermediary Distribution, Managing Director, Strategic Relations, Managing Director, Head of National Accounts, Senior Vice President, National Account Manager and Senior Vice President, Key Account Manager, Columbia Management Investment Advisers LLC; Vice President, Key Account Manager, Liberty Funds Distributor, Inc.; and Trustee of certain Oppenheimer Funds | | 229 | | Director, Board of Directors of Caron Engineering Inc.; Advisor, Board of Advisors of Caron Engineering Inc.; President and Director, Acton Shapleigh Youth Conservation Corps (non -profit); and Vice President and Director of Grahamtastic Connection(non-profit) |
Jack M. Fields — 1952 Trustee | | 2003 | | Chief Executive Officer, Twenty First Century Group, Inc. (government affairs company); and Chairman, Discovery Learning Alliance(non-profit) Formerly: Owner and Chief Executive Officer, Dos Angeles Ranch L.P. (cattle, hunting, corporate entertainment); Director, Insperity, Inc. (formerly known as Administaff) (human resources provider); Chief Executive Officer, Texana Timber LP (sustainable forestry company); Director of Cross Timbers Quail Research Ranch(non-profit); and member of the U.S. House of Representatives | | 229 | | None |
Cynthia Hostetler — 1962 Trustee | | 2017 | | Non-Executive Director and Trustee of a number of public and private business corporations Formerly: Director, Aberdeen Investment Funds (4 portfolios); Head of Investment Funds and Private Equity, Overseas Private Investment Corporation; President, First Manhattan Bancorporation, Inc.; Attorney, Simpson Thacher & Bartlett LLP | | 229 | | Vulcan Materials Company (construction materials company); Trilinc Global Impact Fund; Genesee & Wyoming, Inc. (railroads); Artio Global Investment LLC (mutual fund complex); Edgen Group, Inc. (specialized energy and infrastructure products distributor); Investment Company Institute (professional organization); Independent Directors Council (professional organization) |
Eli Jones — 1961 Trustee | | 2016 | | Professor and Dean, Mays Business School — Texas A&M University Formerly: Professor and Dean, Walton College of Business, University of Arkansas and E.J. Ourso College of Business, Louisiana State University; Director, Arvest Bank | | 229 | | Insperity, Inc. (formerly known as Administaff) (human resources provider) |
Elizabeth Krentzman — 1959 Trustee | | 2019 | | Formerly: Principal and Chief Regulatory Advisor for Asset Management Services and U.S. Mutual Fund Leader of Deloitte & Touche LLP; General Counsel of the Investment Company Institute (trade association); National Director of the Investment Management Regulatory Consulting Practice, Principal, Director and Senior Manager of Deloitte & Touche LLP; Assistant Director of the Division of Investment Management — Office of Disclosure and Investment Adviser Regulation of the U.S. Securities and Exchange Commission and various positions with the Division of Investment Management — Office of Regulatory Policy of the U.S. Securities and Exchange Commission; Associate at Ropes & Gray LLP; Advisory Board Member of the Securities and Exchange Commission Historical Society; and Trustee of certain Oppenheimer Funds | | 229 | | Trustee of the University of Florida National Board Foundation and Audit Committee Member; Member of the Cartica Funds Board of Directors (private investment funds); Member of the University of Florida Law Center Association, Inc. Board of Trustees and Audit Committee Member |
Anthony J. LaCava, Jr. — 1956 Trustee | | 2019 | | Formerly: Director and Member of the Audit Committee, Blue Hills Bank (publicly traded financial institution) and Managing Partner, KPMG LLP | | 229 | | Blue Hills Bank; Chairman, Bentley University; Member, Business School Advisory Council; and Nominating Committee, KPMG LLP |
T-2 Invesco American Franchise Fund
Trustees and Officers—(continued)
| | | | | | | | |
Name, Year of Birth and Position(s) Held with the Trust | | Trustee and/ or Officer Since | | Principal Occupation(s)
During Past 5 Years | | Number of
Funds in Fund
Complex
Overseen by
Trustee | | Other Directorship(s) Held by Trustee During
Past 5 Years |
| Independent Trustees—(continued) |
Prema Mathai-Davis — 1950 Trustee | | 2003 | | Retired Co-Owner & Partner of Quantalytics Research, LLC, (a FinTech Investment Research Platform for the Self-Directed Investor) | | 229 | | None |
Joel W. Motley — 1952 Trustee | | 2019 | | Director of Office of Finance, Federal Home Loan Bank; Member of the Vestry of Trinity Wall Street; Managing Director of Carmona Motley Inc. (privately held financial advisor); Member of the Finance and Budget Committee of the Council on Foreign Relations, Member of the Investment Committee and Board of Human Rights Watch and Member of the Investment Committee and Board of Historic Hudson Valley(non-profit cultural organization) Formerly: Managing Director of Public Capital Advisors, LLC (privately held financial advisor); Managing Director of Carmona Motley Hoffman, Inc. (privately held financial advisor); Trustee of certain Oppenheimer Funds; and Director of Columbia Equity Financial Corp. (privately held financial advisor) | | 229 | | Director of Greenwall Foundation (bioethics research foundation); Member of Board and Investment Committee of The Greenwall Foundation; Director of Southern Africa Legal Services Foundation; Board Member and Investment Committee Member of Pulitzer Center for Crisis Reporting(non-profit journalism) |
Teresa M. Ressel — 1962 Trustee | | 2017 | | Non-executive director and trustee of a number of public and private business corporations Formerly: Chief Financial Officer, Olayan America, The Olayan Group (international investor/commercial/industrial); Chief Executive Officer, UBS Securities LLC; Group Chief Operating Officer, Americas, UBS AG; Assistant Secretary for Management & Budget and CFO, US Department of the Treasury | | 229 | | Atlantic Power Corporation (power generation company); ON Semiconductor Corp. (semiconductor supplier) |
Ann Barnett Stern — 1957 Trustee | | 2017 | | President and Chief Executive Officer, Houston Endowment Inc. (private philanthropic institution) Formerly: Executive Vice President and General Counsel, Texas Children’s Hospital; Attorney, Beck, Redden and Secrest, LLP; Business Law Instructor, University of St. Thomas; Attorney, Andrews & Kurth LLP | | 229 | | Federal Reserve Bank of Dallas |
Raymond Stickel, Jr. — 1944 Trustee | | 2005 | | Retired Formerly: Director, Mainstay VP Series Funds, Inc. (25 portfolios); Partner, Deloitte & Touche | | 229 | | None |
Robert C. Troccoli — 1949 Trustee | | 2016 | | Retired Formerly: Adjunct Professor, University of Denver — Daniels College of Business; Senior Partner, KPMG LLP | | 229 | | None |
Daniel S. Vandivort — 1954 Trustee | | 2019 | | Treasurer, Chairman of the Audit and Finance Committee, and Trustee, Board of Trustees, Huntington Disease Foundation of America; and President, Flyway Advisory Services LLC (consulting and property management) Formerly: Trustee and Governance Chair, of certain Oppenheimer Funds | | 229 | | Chairman and Lead Independent Director, Chairman of the Audit Committee, and Director, Board of Directors, Value Line Funds |
James D. Vaughn — 1945 Trustee | | 2019 | | Retired Formerly: Managing Partner, Deloitte & Touche LLP; Trustee and Chairman of the Audit Committee, Schroder Funds; Board Member, Mile High United Way, Boys and Girls Clubs, Boy Scouts, Colorado Business Committee for the Arts, Economic Club of Colorado and Metro Denver Network (economic development corporation); and Trustee of certain Oppenheimer Funds | | 229 | | Board member and Chairman of Audit Committee of AMG National Trust Bank; Trustee and Investment Committee member, University of South Dakota Foundation; Board member, Audit Committee Member and past Board Chair, Junior Achievement(non-profit) |
Christopher L. Wilson — 1957 Trustee, Vice Chair and Chair Designate | | 2017 | | Retired Formerly: Director, TD Asset Management USA Inc. (mutual fund complex) (22 portfolios); Managing Partner, CT2, LLC (investing and consulting firm); President/Chief Executive Officer, Columbia Funds, Bank of America Corporation; President/Chief Executive Officer, CDC IXIS Asset Management Services, Inc.; Principal & Director of Operations, Scudder Funds, Scudder, Stevens & Clark, Inc.; Assistant Vice President, Fidelity Investments | | 229 | | ISO New England, Inc.(non-profit organization managing regional electricity market) |
T-3 Invesco American Franchise Fund
Trustees and Officers—(continued)
| | | | | | | | |
Name, Year of Birth and Position(s) Held with the Trust | | Trustee and/ or Officer Since | | Principal Occupation(s)
During Past 5 Years | | Number of
Funds in Fund
Complex
Overseen by
Trustee | | Other Directorship(s) Held by Trustee During
Past 5 Years |
| Other Officers | | | | | | | | |
Sheri Morris — 1964 President, Principal Executive Officer and Treasurer | | 2003 | | President, Principal Executive Officer and Treasurer, The Invesco Funds; Vice President, Invesco Advisers, Inc. (formerly known as Invesco Institutional (N.A.), Inc.) (registered investment adviser); and Vice President, Invesco Exchange-Traded Fund Trust, Invesco Exchange-Traded Fund Trust II, Invesco India Exchange-Traded Fund Trust, Invesco Actively Managed Exchange-Traded Fund Trust, Invesco Actively Managed Exchange-Traded Commodity Fund Trust and Invesco Exchange-Traded Self-Indexed Fund Trust; and Vice President, OppenheimerFunds, Inc. Formerly: Vice President and Principal Financial Officer, The Invesco Funds; Vice President, Invesco AIM Advisers, Inc., Invesco AIM Capital Management, Inc. and Invesco AIM Private Asset Management, Inc.; Assistant Vice President and Assistant Treasurer, The Invesco Funds and Assistant Vice President, Invesco Advisers, Inc., Invesco AIM Capital Management, Inc. and Invesco AIM Private Asset Management, Inc.; and Treasurer, Invesco Exchange-Traded Fund Trust, Invesco Exchange-Traded Fund Trust II, Invesco India Exchange-Traded Fund Trust and Invesco Actively Managed Exchange-Traded Fund Trust | | N/A | | N/A |
Russell C. Burk — 1958 Senior Vice President and Senior Officer | | 2005 | | Senior Vice President and Senior Officer, The Invesco Funds | | N/A | | N/A |
Jeffrey H. Kupor — 1968 Senior Vice President, Chief Legal Officer and Secretary | | 2018 | | Head of Legal of the Americas, Invesco Ltd.; Senior Vice President and Secretary, Invesco Advisers, Inc. (formerly known as Invesco Institutional (N.A.), Inc.) (registered investment adviser); Senior Vice President and Secretary, Invesco Distributors, Inc. (formerly known as Invesco AIM Distributors, Inc.); Vice President and Secretary, Invesco Investment Services, Inc. (formerly known as Invesco AIM Investment Services, Inc.) Senior Vice President, Chief Legal Officer and Secretary, The Invesco Funds; Secretary and General Counsel, Invesco Investment Advisers LLC (formerly known as Van Kampen Asset Management); Secretary and General Counsel, Invesco Capital Markets, Inc. (formerly known as Van Kampen Funds Inc.) and Chief Legal Officer, Invesco Exchange-Traded Fund Trust, Invesco Exchange-Traded Fund Trust II, Invesco India Exchange-Traded Fund Trust, Invesco Actively Managed Exchange-Traded Fund Trust, Invesco Actively Managed Exchange-Traded Commodity Fund Trust and Invesco Exchange-Traded Self-Indexed Fund Trust; Secretary, Invesco Indexing LLC; Secretary, W.L. Ross & Co., LLC Formerly: Secretary and Vice President, Jemstep, Inc.; Head of Legal, Worldwide Institutional, Invesco Ltd.; Secretary and General Counsel, INVESCO Private Capital Investments, Inc.; Senior Vice President, Secretary and General Counsel, Invesco Management Group, Inc. (formerly known as Invesco AIM Management Group, Inc.); Assistant Secretary, INVESCO Asset Management (Bermuda) Ltd.; Secretary and General Counsel, Invesco Private Capital, Inc.; Assistant Secretary and General Counsel, INVESCO Realty, Inc.; Secretary and General Counsel, Invesco Senior Secured Management, Inc.; and Secretary, Sovereign G./P. Holdings Inc. | | N/A | | N/A |
Andrew R. Schlossberg — 1974 Senior Vice President | | 2019 | | Head of the Americas and Senior Managing Director, Invesco Ltd.; Director and Senior Vice President, Invesco Advisers, Inc. (formerly known as Invesco Institutional (N.A.), Inc.) (registered investment adviser); Director and Chairman, Invesco Investment Services, Inc. (formerly known as Invesco AIM Investment Services, Inc.) (registered transfer agent); Senior Vice President, The Invesco Funds; Director, Invesco Investment Advisers LLC (formerly known as Van Kampen Asset Management); Director, President and Chairman, Invesco Insurance Agency, Inc. Formerly: Director, Invesco UK Limited; Director and Chief Executive, Invesco Asset Management Limited and Invesco Fund Managers Limited; Assistant Vice President, The Invesco Funds; Senior Vice President, Invesco Advisers, Inc. (formerly known as Invesco Institutional (N.A.), Inc.) (registered investment adviser); Director and Chief Executive, Invesco Administration Services Limited and Invesco Global Investment Funds Limited; Director, Invesco Distributors, Inc.; Head of EMEA, Invesco Ltd.; President, Invesco Actively Managed Exchange-Traded Commodity Fund Trust, Invesco Actively Managed Exchange-Traded Fund Trust, Invesco Exchange-Traded Fund Trust, Invesco Exchange-Traded Fund Trust II and Invesco India Exchange-Traded Fund Trust; Managing Director and Principal Executive Officer, Invesco Capital Management LLC | | N/A | | N/A |
T-4 Invesco American Franchise Fund
Trustees and Officers—(continued)
| | | | | | | | |
Name, Year of Birth and Position(s) Held with the Trust | | Trustee and/ or Officer Since | | Principal Occupation(s)
During Past 5 Years | | Number of
Funds in Fund
Complex
Overseen by
Trustee | | Other Directorship(s) Held by Trustee During
Past 5 Years |
| Other Officers—(continued) | | | | | | | | |
John M. Zerr — 1962
Senior Vice President | | 2006 | | Chief Operating Officer of the Americas; Senior Vice President, Invesco Advisers, Inc. (formerly known as Invesco Institutional (N.A.), Inc.) (registered investment adviser); Senior Vice President, Invesco Distributors, Inc. (formerly known as Invesco AIM Distributors, Inc.); Director and Vice President, Invesco Investment Services, Inc. (formerly known as Invesco AIM Investment Services, Inc.) Senior Vice President, The Invesco Funds; Managing Director, Invesco Capital Management LLC; Director, Invesco Investment Advisers LLC (formerly known as Van Kampen Asset Management); Senior Vice President, Invesco Capital Markets, Inc. (formerly known as Van Kampen Funds Inc.); Manager, Invesco Indexing LLC; Manager, Invesco Specialized Products, LLC; Director and Senior Vice President, Invesco Insurance Agency, Inc.; Member, Invesco Canada Funds Advisory Board; Director, President and Chief Executive Officer, Invesco Corporate Class Inc. (corporate mutual fund company); and Director, Chairman, President and Chief Executive Officer, Invesco Canada Ltd. (formerly known as Invesco Trimark Ltd./Invesco Trimark Ltèe) (registered investment adviser and registered transfer agent) Formerly: Director and Senior Vice President, Invesco Management Group, Inc. (formerly known as Invesco AIM Management Group, Inc.); Secretary and General Counsel, Invesco Management Group, Inc. (formerly known as Invesco AIM Management Group, Inc.); Secretary, Invesco Investment Services, Inc. (formerly known as Invesco AIM Investment Services, Inc.); Chief Legal Officer and Secretary, The Invesco Funds; Secretary and General Counsel, Invesco Investment Advisers LLC (formerly known as Van Kampen Asset Management); Secretary and General Counsel, Invesco Capital Markets, Inc. (formerly known as Van Kampen Funds Inc.); Chief Legal Officer, Invesco Exchange-Traded Fund Trust, Invesco Exchange-Traded Fund Trust II, Invesco India Exchange-Traded Fund Trust, Invesco Actively Managed Exchange-Traded Fund Trust, Invesco Actively Managed Exchange-Traded Commodity Fund Trust and Invesco Exchange-Traded Self-Indexed Fund Trust; Secretary, Invesco Indexing LLC; Director, Secretary, General Counsel and Senior Vice President, Van Kampen Exchange Corp.; Director, Vice President and Secretary, IVZ Distributors, Inc. (formerly known as INVESCO Distributors, Inc.); Director and Vice President, INVESCO Funds Group, Inc.; Director and Vice President, Van Kampen Advisors Inc.; Director, Vice President, Secretary and General Counsel, Van Kampen Investor Services Inc.; Director and Secretary, Invesco Distributors, Inc. (formerly known as Invesco AIM Distributors, Inc.); Director, Senior Vice President, General Counsel and Secretary, Invesco AIM Advisers, Inc. and Van Kampen Investments Inc.; Director, Vice President and Secretary, Fund Management Company; Director, Senior Vice President, Secretary, General Counsel and Vice President, Invesco AIM Capital Management, Inc.; Chief Operating Officer and General Counsel, Liberty Ridge Capital, Inc. (an investment adviser) | | N/A | | N/A |
Gregory G. McGreevey — 1962 Senior Vice President | | 2012 | | Senior Managing Director, Invesco Ltd.; Director, Chairman, President, and Chief Executive Officer, Invesco Advisers, Inc. (formerly known as Invesco Institutional (N.A.), Inc.) (registered investment adviser); Director, Invesco Mortgage Capital, Inc. and Invesco Senior Secured Management, Inc.; and Senior Vice President, The Invesco Funds; and President, SNW Asset Management Corporation Formerly: Senior Vice President, Invesco Management Group, Inc. and Invesco Advisers, Inc.; Assistant Vice President, The Invesco Funds | | N/A | | N/A |
Kelli Gallegos — 1970 Vice President, Principal Financial Officer and Assistant Treasurer | | 2008 | | Assistant Treasurer, Invesco Specialized Products, LLC; Vice President, Principal Financial Officer and Assistant Treasurer, The Invesco Funds; Principal Financial and Accounting Officer — Pooled Investments, Invesco Capital Management LLC; Vice President and Treasurer, Invesco Exchange-Traded Fund Trust, Invesco Exchange-Traded Fund Trust II, Invesco India Exchange-Traded Fund Trust, Invesco Actively Managed Exchange-Traded Fund Trust, Invesco Actively Managed Exchange-Traded Commodity Fund Trust and Invesco Exchange-Traded Self-Indexed Fund Trust Formerly: Assistant Treasurer, Invesco Exchange-Traded Fund Trust, Invesco Exchange-Traded Fund Trust II, Invesco India Exchange-Traded Fund Trust, Invesco Actively Managed Exchange-Traded Fund Trust, Invesco Actively Managed Exchange-Traded Commodity Fund Trust and Invesco Exchange-Traded Self-Indexed Fund Trust; Assistant Treasurer, Invesco Capital Management LLC; Assistant Vice President, The Invesco Funds | | N/A | | N/A |
T-5 Invesco American Franchise Fund
Trustees and Officers—(continued)
| | | | | | | | |
Name, Year of Birth and Position(s) Held with the Trust | | Trustee and/ or Officer Since | | Principal Occupation(s)
During Past 5 Years | | Number of
Funds in Fund
Complex
Overseen by
Trustee | | Other Directorship(s) Held by Trustee During
Past 5 Years |
| Other Officers—(continued) | | | | | | | | |
Crissie M. Wisdom — 1969 Anti-Money Laundering Compliance Officer | | 2013 | | Anti-Money Laundering Compliance Officer, Invesco Advisers, Inc. (formerly known as Invesco Institutional (N.A.), Inc.) (registered investment adviser), Invesco Capital Markets, Inc. (formerly known as Van Kampen Funds Inc.), Invesco Distributors, Inc., Invesco Investment Services, Inc., The Invesco Funds, and Invesco Exchange-Traded Fund Trust, Invesco Exchange-Traded Fund Trust II, Invesco India Exchange-Traded Fund Trust, Invesco Actively Managed Exchange-Traded Fund Trust, Invesco Actively Managed Exchange-Traded Commodity Fund Trust and Invesco Exchange-Traded Self-Indexed Fund Trust; Anti-Money Laundering Compliance Officer and Bank Secrecy Act Officer, INVESCO National Trust Company and Invesco Trust Company; and Fraud Prevention Manager and Controls and Risk Analysis Manager for Invesco Investment Services, Inc. Formerly: Anti-Money Laundering Compliance Officer, Van Kampen Exchange Corp. and Invesco Management Group, Inc. | | N/A | | N/A |
Robert R. Leveille — 1969 Chief Compliance Officer | | 2016 | | Chief Compliance Officer, Invesco Advisers, Inc. (registered investment adviser); and Chief Compliance Officer, The Invesco Funds Formerly: Chief Compliance Officer, Putnam Investments and the Putnam Funds | | N/A | | N/A |
The Statement of Additional Information of the Trust includes additional information about the Fund’s Trustees and is available upon request, without charge, by calling 1.800.959.4246. Please refer to the Fund’s Statement of Additional Information for information on the Fund’ssub-advisers.
| | | | | | |
Office of the Fund 11 Greenway Plaza, Suite 1000
Houston, TX 77046-1173 | | Investment Adviser Invesco Advisers, Inc.
1555 Peachtree Street, N.E.
Atlanta, GA 30309 | | Distributor Invesco Distributors, Inc.
11 Greenway Plaza, Suite 1000
Houston, TX 77046-1173 | | Auditors PricewaterhouseCoopers LLP
1000 Louisiana Street, Suite 5800 Houston, TX 77002-5021 |
| | | |
| | | | | | |
Counsel to the Fund Stradley Ronon Stevens & Young, LLP
2005 Market Street, Suite 2600
Philadelphia, PA 19103-7018 | | Counsel to the Independent Trustees Goodwin Procter LLP
901 New York Avenue, N.W.
Washington, D.C. 20001 | | Transfer Agent Invesco Investment Services, Inc.
11 Greenway Plaza, Suite 1000
Houston, TX 77046-1173 | | Custodian State Street Bank and Trust Company
225 Franklin Street
Boston, MA 02110-2801 |
T-6 Invesco American Franchise Fund
Go paperless with eDelivery
Visit invesco.com/edelivery to enjoy the convenience and security of anytime electronic access to your investment documents.
With eDelivery, you can elect to have any or all of the following materials delivered straight to your inbox to download, save and print from your own computer:
| • | Fund reports and prospectuses |
| • | Quarterly statements |
| • | Daily confirmations |
| • | Tax forms |
Invesco mailing information
Send general correspondence to Invesco Investment Services, Inc., P.O. Box 219078, Kansas City, MO 64121-9078.
Important notice regarding delivery of security holder documents
To reduce Fund expenses, only one copy of most shareholder documents may be mailed to shareholders with multiple accounts at the same address (Householding). Mailing of your shareholder documents may be householded indefinitely unless you instruct us otherwise. If you do not want the mailing of these documents to be combined with those for other members of your household, please contact Invesco Investment Services, Inc. at 800 959 4246 or contact your financial institution. We will begin sending you individual copies for each account within 30 days after receiving your request.
Fund holdings and proxy voting information
The Fund provides a complete list of its holdings four times in each fiscal year, at the quarter-ends. For the second and fourth quarters, the list appears in the Fund’s semiannual and annual reports to shareholders. For the first and third quarters, the Fund files the lists with the Securities and Exchange Commission (SEC) as an exhibit to its reports on Form N-PORT. The most recent list of portfolio holdings is available at invesco.com/completeqtrholdings. Shareholders can also look up the Fund’s Form N-PORT filings on the SEC website, sec.gov. The SEC file numbers for the Fund are shown below.
A description of the policies and procedures that the Fund uses to determine how to vote proxies relating to portfolio securities is available without charge, upon request, from our Client Services department at 800 959 4246, or at invesco.com/proxyguidelines. The information is also available on the SEC website, sec.gov.
Information regarding how the Fund voted proxies related to its portfolio securities during the most recent 12-month period ended June 30 is available at invesco.com/proxysearch. This information is also available on the SEC website, sec.gov.
Invesco Advisers, Inc. is an investment adviser; it provides investment advisory services to individual and institutional clients and does not sell securities. Invesco Distributors, Inc. is the US distributor for Invesco Ltd.’s retail mutual funds, exchange-traded funds and institutional money market funds. Both are wholly owned, indirect subsidiaries of Invesco Ltd.
| SEC file numbers: 811-09913 and 333-36074 | Invesco Distributors, Inc. | VK-AMFR-AR-1 |
| | | | |
| | |
 | | Annual Report to Shareholders | | August 31, 2019 |
| | |
| | Invesco CaliforniaTax-Free Income Fund Nasdaq: A: CLFAX∎ C: CLFCX∎ Y: CLFDX∎ R6: CLFSX |

Letters to Shareholders
Dear Shareholders:

This annual report includes information about your Fund, including performance data and a complete list of its investments as of the close of the reporting period. Inside is a discussion of how your Fund was managed and the factors that affected its performance during the reporting period.
Throughout the reporting period, global equity markets remained volatile. Investor sentiment ranged from elation to fear. The reporting period began with several US equity indexes redefining new highs. The exuberance, however, ended in October 2018 as global equities, in particular US stocks, sold off, with the sharpest decline in December. The catalyst for thesell-off was a combination of ongoing trade concerns between the US and China, fears of a global economic slowdown and lower oil prices from a supply glut. Gains posted earlier in 2018 for global equities were erased, while US Treasury bonds, along with government and municipal bonds, rallied as investors fled to “safe haven” assets.
At the start of 2019, global equity markets rebounded strongly buoyed by more dovish central banks and optimism about a potentialUS-China trade deal. In May,US-China trade concerns and slowing global growth led to a global equitysell-off and rally in U.S. Treasuries. Despite the Maysell-off, domestic equity markets rallied in June in anticipation of a U.S. Federal Reserve (the Fed) rate cut and closed the second quarter with modest gains. As the reporting period ended in August, market volatility once again increased as the US Treasury yield curve inverted several times magnifying concerns that the US economy could be headed into a recession.
During the reporting period, the Fed both raised and lowered the federal funds rate. Given signs of a strong economy, the Fed raised rates two times: in September and December 2018. In 2019, however, the Fed altered its outlook on further rate hikes leaving rates unchanged for the first half of the year. In July, the Fed lowered interest rates for the first time in 11 years. As 2019 unfolds, we’ll see how the interplay of interest rates, economic data, geopolitics and a host of other factors affect US and overseas equity and fixed income markets.
Investor uncertainty and market volatility, such as we witnessed during the reporting period, are unfortunate facts of life when it comes to investing. That’s why Invesco encourages investors to work with a professional financial adviser who can stress the importance of starting to save and invest early and the importance of adhering to a disciplined investment plan. A financial adviser who knows your unique financial situation, investment goals and risk tolerance can be an invaluable partner as you seek to achieve your financial goals. He or she can offer a long-term perspective when markets are volatile and time-tested advice and guidance when your financial situation or investment goals change.
Visit our website for more information on your investments
Our website, invesco.com/us, offers a wide range of market insights and investment perspectives. On the website, you’ll find detailed information about our funds, including performance, holdings and portfolio manager commentaries. You can access information about your account by completing a simple, secure online registration. To do so, select “Log In” on the right side of the homepage, and then select “Register for Individual Account Access.”
In addition to the resources accessible on our website and through our mobile app, you can obtain timely updates to help you stay informed about the markets and the economy by connecting with Invesco on Twitter, LinkedIn or Facebook. You can access our blog at blog.invesco.us.com. Our goal is to provide you the information you want, when and where you want it.
Finally, I’m pleased to share with you Invesco’s commitment to both the Principles for Responsible Investment and to considering environmental, social and governance issues in our robust investment process. I invite you to learn more at invesco.com/esg.
Have questions?
For questions about your account, contact an Invesco client services representative at 800 959 4246.
All of us at Invesco look forward to serving your investment management needs. Thank you for investing with us.
Sincerely,

Andrew Schlossberg
Head of the Americas,
Senior Managing Director, Invesco Ltd.
|
| 2 Invesco California Tax-Free Income Fund |
| | | | |
 | | | | Dear Shareholders: Among the many important lessons I’ve learned in more than 40 years in a variety of business endeavors is the value of a trusted advocate. As independent chair of the Invesco Funds Board, I can assure you that the members of the Board are strong advocates for the interests of investors in Invesco’s mutual funds. We work hard to represent your interests through oversight of the quality of the investment management services your funds receive and other matters important to your investment, including but not limited to: ∎ Ensuring that Invesco offers a diverse lineup of mutual funds that your financial adviser can use to strive to meet your financial needs as your investment goals change over time. |
∎ Monitoring how the portfolio management teams of the Invesco funds are performing in light of changing economic and market conditions.
∎ Assessing each portfolio management team’s investment performance within the context of the investment strategy described in the fund’s prospectus.
∎ Monitoring for potential conflicts of interests that may impact the nature of the services that your funds receive.
We believe one of the most important services we provide our fund shareholders is the annual review of the funds’ advisory andsub-advisory contracts with Invesco Advisers and its affiliates. This review is required by the Investment Company Act of 1940 and focuses on the nature and quality of the services Invesco provides as the adviser to the Invesco funds and the reasonableness of the fees that it charges for those services. Each year, we spend months carefully reviewing information received from Invesco and a variety of independent sources, such as performance and fee data prepared by Lipper, Inc. (a subsidiary of Broadridge Financial Solutions, Inc.), an independent, third-party firm widely recognized as a leader in its field. We also meet with our independent legal counsel and other independent advisers to review and help us assess the information that we have received. Our goal is to assure that you receive quality investment management services for a reasonable fee.
I trust the measures outlined above provide assurance that you have a worthy advocate when it comes to choosing the Invesco Funds.
As always, please contact me at bruce@brucecrockett.com with any questions or concerns you may have. On behalf of the Board, we look forward to continuing to represent your interests and serving your needs.
Sincerely,

Bruce L. Crockett
Independent Chair
Invesco Funds Board of Trustees
|
| 3 Invesco California Tax-Free Income Fund |
Management’s Discussion of Fund Performance
| | | | | |
| |
Performance summary For the fiscal year ended August 31, 2019, Class A shares of Invesco CaliforniaTax-Free Income Fund (the Fund), at net asset value (NAV), underperformed the S&P Municipal Bond California 5+ Year Investment Grade Index, the Fund’s style-specific benchmark. Your Fund’s long-term performance appears later in this report. | |
Fund vs. Indexes | | | | | |
Total returns, August 31, 2018 to August 31, 2019, at net asset value (NAV). Performance shown does not include applicable contingent deferred sales charges (CDSC) orfront-end sales charges, which would have reduced performance. | |
Class A Shares | | | | 7.62 | % |
Class C Shares | | | | 7.11 | |
Class Y Shares | | | | 7.85 | |
Class R6 Shares | | | | 8.03 | |
S&P Municipal Bond Index▼(Broad Market Index) | | | | 8.26 | |
S&P Municipal Bond California 5+ Year Investment Grade Index▼
(Style-Specific Index) | | | | 9.88 | |
Lipper California Municipal Debt Funds Index⬛(Peer Group Index) | | | | 8.47 | |
Source(s):▼RIMES Technologies Corp.;⬛Lipper Inc. | | | | | |
| | |
Market conditions and your Fund California’s financial condition continued to improve through the fiscal year, with total revenue rising 6.3% to $284.7 billion from the previous fiscal year.1 This improvement was driven by a 10.6% year-over-year increase in income tax revenues, which totaled $107 billion.1 The state continues to maintain a large and diverse economy, low unemployment rate and high median household income.2 California’s $3 trillion dollar economy accounted for 14.5% of the nation’s economy in the first quarter of 2019.3 In August 2019, Fitch Ratings upgraded California’s general obligation bond rating to AA with a stable outlook, while Moody’s maintained a rating of Aa3 with positive outlook and Standard & Poor’s (S&P) maintained a rating ofAA-with a stable outlook, respectively.4 California’s financial condition has been volatile compared to most states because the state’s income tax revenue | | is sensitive to both national economic conditions and equity market valuations. California’s highest income earners account for a large and disproportionate share of the state’s income tax revenue.5 In 2012, California voters approved a temporary tax increase that was scheduled to expire in 2018. However, voters approved an extension of the temporary tax increase through 2030. While the temporary tax increase improved the state’s financial standing, it also increased the sensitivity of tax revenues to the economic cycle. California maintains arainy-day fund, which the state can use if certain spending criteria are met, or in the event of a natural disaster. Moving forward, therainy-day fund may assist the state’s budget process during periods of weak economic and revenue growth. The broad municipal bond market experienced positive returns for the fifth consecutive year in 2018, and performance remained strong throughout the fiscal year. Investment grade municipal |
bonds returned 8.72% and high yield municipal bonds returned 9.81% during the fiscal year.6 Performance was particularly strong during the first eight months of 2019, with investment grade municipal bonds returning 7.61% and high yield municipal bonds returning 9.91%.6
The fiscal year was characterized by supportive technical conditions (supply and demand balances) as new issuance of municipal bonds totaled $351 billion – down nearly 15% from the previous fiscal year.7 Flows into the municipal bond asset class were positive for the last 34 weeks of the fiscal year.8 A consistently positive flow pattern, coupled with continued limited supply, resulted in strong performance across the municipal bond market. Fund flows totaled $52.1 billion from September 2018 through August 2019.8
For the fiscal year, the high yield municipal bond market outperformed the investment grade bond segment, led by improved price discovery on Puerto Rico bonds as a result of developments in the commonwealth’s debt restructuring, as well as strong performance of high yield general obligation securities.
Municipal bonds withstood considerable headwinds during the fiscal year, including interest rate movements that had the10-year US Treasury yield breaching 2.00% in July 2019.9 Additionally, the US government shutdown, which occurred midway through the fiscal year and lasted 35 days, along with ongoingUS-China trade negotiations and Brexit developments, created a challenging market environment. Both investment grade municipals and high yield municipals posted negative returns for the months of September and October 2018. Worsening market conditions exposed the municipal bond market to
| | | | | |
Portfolio Composition | | | | | |
By credit sector, based on total investments as of August 31, 2019 | |
| |
Revenue Bonds | | | | 74.8 | % |
General Obligation Bonds | | | | 16.4 | |
Pre-Refunded Bonds | | | | 8.8 | |
| | | | | |
Top Five Debt Holdings | | | | | |
Based on total net assets | | | | | |
| |
1. California State University | | | | 1.7 | % |
2. California (State of) Educational Facilities Authority (Stanford University) | | | | 1.6 | % |
3. California (State of) Municipal Finance Authority (Orange County Civic Center) | | | | 1.4 | % |
4. San Francisco (City & County of), CA Airport Commission (San Francisco International Airport) | | | | 1.3 | % |
5. San Francisco (City & County of), CA Airport Commission (San Francisco International Airport) | | | | 1.2 | % |
| | | | | |
Total Net Assets | | | $ | 444.9 million | |
| |
Total Number of Holdings | | | | 264 | |
The Fund’s holdings are subject to change, and there is no assurance that the Fund will continue to hold any particular security.
Data presented here are as of August 31, 2019.
|
| 4 Invesco California Tax-Free Income Fund |
more sensitivity relating to asell-off in US Treasuries in September 2018. Despite these challenges, the municipal bond market performed positively for the fiscal year as technical conditions continued to provide tailwinds.
Concerns about future interest rate hikes led to an increased demand for US Treasuries and investment grade municipal bonds alike, and yields continued to fall as high yield securities rallied. The yield curve for30-year,AAA-rated municipal bonds continued to flatten as trade tensions between the US and China increased worries about inflationary pressures.
During the fiscal year, the US Federal Reserve (the Fed) raised the federal funds rate two times, in September and December 2018, before lowering it in July 2019.10 The two rate hikes, the eighth and ninth since December 2008, were anticipated and reflected increased confidence in the US economy amid low unemployment, relatively stable inflation and overall robust economic growth. This expansionary monetary policy significantly flattened the US Treasury yield curve with a slight inversion on the short end occurring in December 2018.
However, the Fed’s dovish stance at the beginning of calendar year 2019 took the market by surprise, leading economists to change their predictions from two interest rate increases in 2019 to just one. Despite favorable growth and labor trends, the Fed ultimately reversed course and lowered the federal funds rate in July 2019, citing uncertainty about the global economic outlook. The US Treasury curve was inverted at fiscalyear-end with the yield on the2-year US Treasury note exceeding the10-year note.9 Economist views were mixed as to whether this inversion, the first since December 2005, signaled a possible recession.
As anticipated, US midterm election results had a positive impact on municipal securities as perceived threats to municipal tax exemptions, further tax reform and changes to the Affordable Care Act were greatly reduced. News of a possible ban on flavorede-cigarettes and menthol cigarettes made headlines, which caused a short-lived decline in the valuations of below investment grade tobacco settlement bonds. Meanwhile,year-end demand for yield and coupon payments caused the asset class to end 2018 on a strong note. Investors affected by the Tax Cuts and Jobs Act of 2017, which instituted a $10,000 cap on state and local tax deductions, poured a
record $18.9 billion into municipal bond funds during the first eight weeks of calendar year 2019, the most recorded over that period in at least 13 years.8 At the close of the fiscal year, we believed municipal fundamentals remained strong and viewed the ongoing impact of the Tax Cuts and Jobs Act as a potential market factor. As a result, we believe demand for municipal bond investments could remain strong as retail investors continue to seek tax-exempt income.
Over the fiscal year, underweight exposure to state general obligation bonds and security selection in the higher education sector significantly contributed to the Fund’s performance versus the style-specific benchmark. Security selection inBB-rated bonds also benefited the Fund’s relative performance. The Fund’s security selection in prerefunded bonds and in the airport and special tax sectors detracted from its relative performance. Additionally, overweight exposure to shorter duration bonds (2.99 years and less) detracted from the Fund’s relative performance.
During the fiscal year, leverage contributed to the Fund’s performance relative to its style-specific benchmark. The Fund achieved a leveraged position through the use of inverse floating rate securities. The Fund uses leverage because we believe that, over time, leveraging provides opportunities for additional income and total return for shareholders. However, the use of leverage also can expose common shareholders to additional volatility.
We wish to remind you that the Fund is subject to interest rate risk, meaning when interest rates rise, the value of fixed income securities tends to fall. The degree to which the value of fixed income securities may decline due to rising interest rates may vary depending on the speed and magnitude of the increase in interest rates, as well as individual security characteristics, such as price, maturity, duration and coupon and market forces, such as supply and demand for similar securities. We are monitoring interest rates, as well as the market, economic and geopolitical factors that may impact the direction, speed and magnitude of changes to interest rates across the maturity spectrum, including the potential impact of monetary policy changes by the Fed and certain foreign central banks. If interest rates rise, markets may experience increased volatility, which may affect the value and/or liquidity of certain of the Fund’s investments.
Thank you for investing in Invesco CaliforniaTax-Free Income Fund and for sharing our long-term investment horizon.
| 2 | Source: US Census Bureau |
| 3 | Source: Bureau of Economic Analysis |
| 4 | Sources: Fitch Ratings, Moody’s, Standard & Poor’s. A credit rating is an assessment provided by a nationally recognized statistical rating organization (NRSRO) of the creditworthiness of an issuer with respect to debt obligations, including specific securities, money market instruments or other debts. Ratings are measured on a scale that generally ranges from AAA (highest) to D (lowest); ratings are subject to change without notice.“Non-Rated” indicates the debtor was not rated, and should not be interpreted as indicating low quality. For more information on rating methodology, please visit www.standardandpoors.com and select “Under standing Ratings” under Rating Resources on the homepage; www.fitchratings.com and select “Understanding Credit Ratings” from the drop-down menu on the homepage; and www.moodys.com and select “Methodology,” then “Rating Methodologies” under Research Type on the left-hand side. |
| 5 | Source: Bureau of Labor Statistics |
| 6 | Source: FactSet Research Systems Inc. |
| 8 | Source: Strategic Insight |
| 9 | Source: US Department of the Treasury |
| 10 | Source: US Federal Reserve |
The views and opinions expressed in management’s discussion of Fund performance are those of Invesco Advisers, Inc. These views and opinions are subject to change at any time based on factors such as market and economic conditions. These views and opinions may not be relied upon as investment advice or recommendations, or as an offer for a particular security. The information is not a complete analysis of every aspect of any market, country, industry, security or the Fund. Statements of fact are from sources considered reliable, but Invesco Advisers, Inc. makes no representation or warranty as to their completeness or accuracy. Although historical performance is no guarantee of future results, these insights may help you understand our investment management philosophy.
See important Fund and, if applicable, index disclosures later in this report.
| | |
 | | Mark Paris Portfolio Manager and Chief Investment Officer and Head of Municipal Strategies |
| for Invesco Fixed Income, is manager of Invesco CaliforniaTax-Free Income Fund. He joined Invesco in 2010. Mr. Paris earned a BBA in finance from Baruch College – The City University of New York. |
|
| 5 Invesco California Tax-Free Income Fund |
| | |
 | | John (Jack) Connelly Portfolio Manager, is manager of Invesco CaliforniaTax-Free Income Fund. He |
| joined Invesco in 2016. Mr. Connelly earned a BA in philosophy from Wheaton College and masters degrees from the University of Rhode Island and Yale University. |
| | |
 | | Tim O’Reilly Portfolio Manager, is manager of Invesco CaliforniaTax-Free Income Fund. He |
| joined Invesco in 2010. Mr. O’Reilly earned a BS in finance from Eastern Illinois University and an MBA in finance from the University of Illinois at Chicago. |
| | |
 | | James Phillips Portfolio Manager, is manager of Invesco CaliforniaTax-Free Income Fund. He |
| joined Invesco in 2010. Mr. Phillips earned a BA in American literature from Empire State College, the independent study division of the State University of New York, and an MBA in finance from the University at Albany, State University of New York. |
| | |
 | | John Schorle Portfolio Manager, is manager of Invesco CaliforniaTax-Free Income Fund. He has |
| been associated with Invesco or its investment advisory affiliates since 2010. Mr. Schorle earned a BA degree in economics from DePaul University. He is also a Registered Certified Public Accountant. |
| | |
 | | Julius Williams Portfolio Manager, is manager of Invesco CaliforniaTax-Free Income Fund. He |
| joined Invesco in 2010. Mr. Williams earned a BA in economics and sociology and a Master of Education degree in educational psychology from the University of Virginia. |
|
| 6 Invesco California Tax-Free Income Fund |
Your Fund’s Long-Term Performance
Results of a $10,000 Investment – Oldest Share Class(es)
Fund and index data from 8/31/09
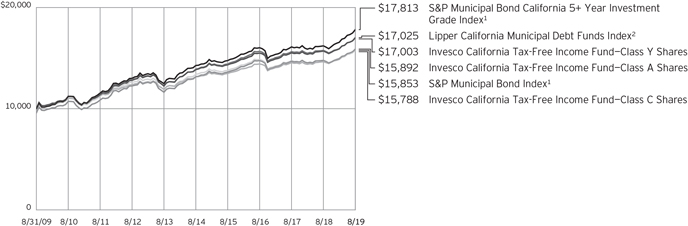
1 Source: RIMES Technologies Corp.
2 Source: Lipper Inc.
Past performance cannot guarantee comparable future results.
The data shown in the chart include reinvested distributions, applicable sales charges and Fund expenses including
management fees. Index results include reinvested dividends, but they do not reflect sales charges. Performance of the peer group, if applicable, reflects fund expenses and management fees;
performance of a market index does not. Performance shown in the chart and table(s) does not reflect deduction of taxes a shareholder would pay on Fund distributions or sale of Fund shares.
|
| 7 Invesco California Tax-Free Income Fund |
| | | | | |
| | |
Average Annual Total Returns | | | | | |
As of 8/31/19, including maximum applicable sales charges | | | | | |
| |
Class A Shares | | | | | |
Inception (7/28/97) | | | | 4.26 | % |
10 Years | | | | 4.74 | |
5 Years | | | | 2.96 | |
1 Year | | | | 3.06 | |
| |
Class C Shares | | | | | |
Inception (7/28/97) | | | | 4.24 | % |
10 Years | | | | 4.67 | |
5 Years | | | | 3.34 | |
1 Year | | | | 6.11 | |
| |
Class Y Shares | | | | | |
Inception (7/28/97) | | | | 4.72 | % |
10 Years | | | | 5.45 | |
5 Years | | | | 4.10 | |
1 Year | | | | 7.85 | |
| |
Class R6 Shares | | | | | |
10 Years | | | | 5.27 | % |
5 Years | | | | 4.01 | |
1 Year | | | | 8.03 | |
Effective June 1, 2010, Class A, Class C and Class I shares of the predecessor fund, Morgan Stanley CaliforniaTax-Free Income Fund, advised by Morgan Stanley Investment Advisors Inc. were reorganized into Class A, Class C and Class Y shares, respectively, of Invesco CaliforniaTax-Free Income Fund. Returns shown above, prior to June 1, 2010, for Class A, Class C and Class Y shares are blended returns of the predecessor fund and Invesco CaliforniaTax-Free Income Fund. Share class returns will differ from the predecessor fund because of different expenses.
Class R6 shares incepted on April 4, 2017. Performance shown prior to that date is that of the Fund’s and the predecessor fund’s Class A shares and includes the12b-1 fees applicable to Class A shares.
The performance data quoted represent past performance and cannot guarantee comparable future results; current performance may be lower or higher. Please visit invesco.com/ performance for the most recentmonth-end performance. Performance figures reflect reinvested distributions, changes in net asset value and the effect of the maximum sales charge unless otherwise stated. Investment return and principal value will fluctuate so that you may have a gain or loss when you sell shares.
| | | | | |
| | |
Average Annual Total Returns | | | | | |
As of 6/30/19, the most recent calendar quarter end, including maximum applicable sales charges | |
| |
Class A Shares | | | | | |
Inception (7/28/97) | | | | 4.18 | % |
10 Years | | | | 4.89 | |
5 Years | | | | 2.86 | |
1 Year | | | | 0.79 | |
| |
Class C Shares | | | | | |
Inception (7/28/97) | | | | 4.15 | % |
10 Years | | | | 4.83 | |
5 Years | | | | 3.23 | |
1 Year | | | | 3.75 | |
| |
Class Y Shares | | | | | |
Inception (7/28/97) | | | | 4.64 | % |
10 Years | | | | 5.60 | |
5 Years | | | | 3.99 | |
1 Year | | | | 5.47 | |
| |
Class R6 Shares | | | | | |
10 Years | | | | 5.42 | % |
5 Years | | | | 3.89 | |
1 Year | | | | 5.66 | |
The total annual Fund operating expense ratio set forth in the most recent Fund prospectus as of the date of this report for Class A, Class C, Class Y and Class R6 shares was 1.27%, 1.75%, 1.03% and 0.96%, respectively. The expense ratios presented above may vary from the expense ratios presented in other sections of this report that are based on expenses incurred during the period covered by this report.
Class A share performance reflects the maximum 4.25% sales charge, and Class C share performance reflects the applicable contingent deferred sales charge (CDSC) for the period involved. The CDSC on Class C shares is 1% for the first year after purchase. Class Y and Class R6 shares do not have afront-end sales charge or a CDSC; therefore, performance is at net asset value.
The performance of the Fund’s share classes will differ primarily due to different sales charge structures and class expenses.
Fund performance reflects any applicable fee waivers and/or expense reimbursements. Had the adviser not waived fees and/or reimbursed expenses currently or in the past, returns would have been lower. See current prospectus for more information.
|
| 8 Invesco California Tax-Free Income Fund |
Invesco CaliforniaTax-Free Income Fund’s investment objective is to provide a high level of current income exempt from federal and California income tax, consistent with the preservation of capital.
| ∎ | | Unless otherwise stated, information presented in this report is as of August 31, 2019, and is based on total net assets. |
| ∎ | | Unless otherwise noted, all data provided by Invesco. |
| ∎ | | To access your Fund’s reports/prospectus, visit invesco.com/fundreports. |
About share classes
| ∎ | | Class Y sharesare available only to certain investors. Please see the prospectus for more information. |
| ∎ | | Class R6 sharesare available for use by retirement plans that meet certain standards and for institutional investors. Class R6 shares are also available through intermediaries that have established an agreement with Invesco Distributors, Inc. to make such shares available for use in retail omnibus accounts. Please see the prospectus for more information. |
Principal risks of investing in the Fund
| ∎ | | Alternative minimum tax risk. A portion of the Fund’s otherwisetax-exempt income may be taxable to those shareholders subject to the federal alternative minimum tax. |
| ∎ | | California and US territories municipal securities risk.The Fund is more susceptible to political, economic, regulatory or other factors affecting issuers of California municipal securities than a fund which does not focus its investments in such issuers. As with California municipal securities, events in any of the territories where the Fund is invested may affect the Fund’s investments and its performance. |
| ∎ | | Changing fixed income market conditions risk.The current low interest rate environment was created in part by the Federal Reserve Board (FRB) and certain foreign central banks keeping the federal funds and equivalent foreign rates near historical lows. Increases in the federal funds and equivalent foreign rates may expose fixed income markets to heightened volatility and reduced liquidity for certain fixed income investments, particularly those with longer maturities. In addition, decreases in fixed income dealer market-making capacity may also potentially lead to heightened volatility and reduced liquidity in the fixed income markets. As a result, the |
| | value of the Fund’s investments and share price may decline. Changes in central bank policies could also result in higher than normal shareholder redemptions, which could potentially increase portfolio turnover and the Fund’s transaction costs. |
| ∎ | | Debt securities risk.The prices of debt securities held by the Fund will be affected by changes in interest rates, the creditworthiness of the issuer and other factors. An increase in prevailing interest rates typically causes the value of existing debt securities to fall and often has a greater impact on longer-duration debt securities and higher quality debt securities. Falling interest rates will cause the Fund to reinvest the proceeds of debt securities that have been repaid by the issuer at lower interest rates. Falling interest rates may also reduce the Fund’s distributable income because interest payments on floating rate debt instruments held by the Fund will decline. The Fund could lose money on investments in debt securities if the issuer or borrower fails to meet its obligations to make interest payments and/or to repay principal in a timely manner. Changes in an issuer’s financial strength, the market’s perception of such strength or in the credit rating of the issuer or the security may affect the value of debt securities. The Adviser’s credit analysis may fail to anticipate such changes, which could result in buying a debt security at an inopportune time or failing to sell a debt security in advance of a price decline or other credit event. |
| ∎ | | Derivatives risk.The value of a derivative instrument depends largely on (and is derived from) the value of an underlying security, currency, commodity, interest rate, index or other asset (each referred to as an underlying asset). In addition to risks relating to the underlying assets, the use of derivatives may include other, possibly greater, risks, including counterparty, |
| | leverage and liquidity risks. Counterparty risk is the risk that the counterparty to the derivative contract will default on its obligation to pay the Fund the amount owed or otherwise perform under the derivative contract. Derivatives create leverage risk because they do not require payment up front equal to the economic exposure created by holding a position in the derivative. As a result, an adverse change in the value of the underlying asset could result in the Fund sustaining a loss that is substantially greater than the amount invested in the derivative or the anticipated value of the underlying asset, which may make the Fund’s returns more volatile and increase the risk of loss. Derivative instruments may also be less liquid than more traditional investments and the Fund may be unable to sell or close out its derivative positions at a desirable time or price. This risk may be more acute under adverse market conditions, during which the Fund may be most in need of liquidating its derivative positions. Derivatives may also be harder to value, less tax efficient and subject to changing government regulation that could impact the Fund’s ability to use certain derivatives or their cost. Derivatives strategies may not always be successful. For example, derivatives used for hedging or to gain or limit exposure to a particular market segment may not provide the expected benefits, particularly during adverse market conditions. |
| ∎ | | High yield debt securities (junk bond) risk.Investments in high yield debt securities (“junk bonds”) and other lower-rated securities will subject the Fund to substantial risk of loss. These securities are considered to be speculative with respect to the issuer’s ability to pay interest and principal when due, are more susceptible to default or decline in market value and are less |
| | |
| |
This report must be accompanied or preceded by a currently effective Fund prospectus, which contains more complete information, including sales charges and expenses. Investors should read it carefully before investing. | | |
| | |
NOT FDIC INSURED | MAY LOSE VALUE | NO BANK GUARANTEE | | |
|
| 9 Invesco California Tax-Free Income Fund |
liquid than investment grade debt securities. Prices of high yield debt securities tend to be very volatile.
| | ∎ | | Inverse floating rate obligations risk. The price of inverse floating rate obligations (inverse floaters) is expected to decline when interest rates rise, and generally will decline further than the price of a bond with a similar maturity. The price of inverse floaters is typically more volatile than the price of bonds with similar maturities. These risks can be particularly high if leverage is used in the formula that determines the interest payable by the inverse floater, which may make the Fund’s returns more volatile and increase the risk of loss. Additionally, these securities may lose some or all of their principal and, in some cases, the Fund could lose money in excess of its investment. |
| | ∎ | | Liquidity risk.The Fund may be unable to sell illiquid investments at the time or price it desires and, as a result, could lose its entire investment in such investments. Liquid securities can become illiquid during periods of market stress. If a significant amount of the Fund’s securities become illiquid, the Fund may not be able to timely pay redemption proceeds and may need to sell securities at significantly reduced prices. |
| | ∎ | | Management risk. The Fund is actively managed and depends heavily on the Adviser’s judgment about markets, interest rates or the attractiveness, relative values, liquidity, or potential appreciation of particular investments made for the Fund’s portfolio. The Fund could experience losses if these judgments prove to be incorrect. Additionally, legislative, regulatory, or tax developments may adversely affect management of the Fund and, therefore, the ability of the Fund to achieve its investment objective. |
| | ∎ | | Market risk.The market values of the Fund’s investments, and therefore the value of the Fund’s shares, will go up and down, sometimes rapidly or unpredictably. Market risk may affect a single issuer, industry or section of the economy, or it may affect the market as a whole. Individual stock prices tend to go up and down more dramatically than those of certain other types of investments, such as bonds. During a general downturn in the financial markets, multiple asset classes may decline in value. When |
markets perform well, there can be no assurance that specific investments held by the Fund will rise in value.
| | ∎ | | Medium- and lower-grade municipal securities risk.Medium- and lower-grade municipal securities generally involve more volatility and greater risks, including credit, market, liquidity and management risks, than higher-grade securities. Furthermore, many issuers of medium- and lower-grade securities choose not to have a rating assigned to their obligations. As such, the Fund’s portfolio may consist of a higher portion of unrated securities than an investment company investing solely in higher-grade securities. Unrated securities may not be as attractive to as many buyers as are rated securities, which may have the effect of limiting the Fund’s ability to sell such securities at their fair value. |
| | ∎ | | Money market fund risk.Although money market funds generally seek to preserve the value of an investment at $1.00 per share, the Fund may lose money by investing in money market funds. A money market fund’s sponsor has no legal obligation to provide financial support to the money market fund. The credit quality of a money market fund’s holdings can change rapidly in certain markets, and the default of a single holding could have an adverse impact on the money market fund’s share price. A money market fund’s share price can also be negatively affected during periods of high redemption pressures, illiquid markets and/or significant market volatility. |
| | ∎ | | Municipal issuer focus risk.The municipal issuers in which the Fund invests may be located in the same geographic area or may pay their interest obligations from revenue of similar projects, such as hospitals, airports, utility systems and housing finance agencies. This may make the Fund’s investments more susceptible to similar social, economic, political or regulatory occurrences, making the Fund more susceptible to experience a drop in its share price than if the Fund had been more diversified across issuers that did not have similar characteristics. |
| | ∎ | | Municipal securities risk.The risk of a municipal obligation generally depends on the financial and credit status of the issuer. Constitutional amendments, legislative enactments, executive orders, administrative regulations, voter initiatives, and the issuer’s |
regional economic conditions may affect the municipal security’s value, interest payments, repayment of principal and the Fund’s ability to sell the security. Failure of a municipal security issuer to comply with applicable tax requirements may make income paid thereon taxable, resulting in a decline in the security’s value. In addition, there could be changes in applicable tax laws or tax treatments that reduce or eliminate the current federal income tax exemption on municipal securities or otherwise adversely affect the current federal or state tax status of municipal securities.
| | ∎ | | Variable-rate demand notes risk.The absence of an active secondary market for certain variable and floating rate notes could make it difficult to dispose of these instruments, which could result in a loss. |
| | ∎ | | When-issued, delayed delivery and forward commitment risks. When-issued and delayed delivery transactions subject the Fund to market risk because the value or yield of a security at delivery may be more or less than the purchase price or yield generally available when delivery occurs, and counterparty risk because the Fund relies on the buyer or seller, as the case may be, to consummate the transaction. These transactions also have a leveraging effect on the Fund because the Fund commits to purchase securities that it does not have to pay for until a later date, which increases the Fund’s overall investment exposure and, as a result, its volatility. |
| | ∎ | | Zero coupon orpay-in-kind securities risk.The value, interest rates, and liquidity ofnon-cash paying instruments, such as zero coupon andpay-in-kind securities, are subject to greater fluctuation than other types of securities. The higher yields and interest rates onpay-in-kind securities reflect the payment deferral and increased credit risk associated with such instruments and that such investments may represent a higher credit risk than loans that periodically pay interest. |
About indexes used in this report
| | ∎ | | TheS&P Municipal Bond Indexis a broad, market value-weighted index that seeks to measure the performance of the US municipal bond market. |
| | ∎ | | TheS&P Municipal Bond California 5+ Year Investment Grade Indextracks the performance of investment |
|
| 10 Invesco California Tax-Free Income Fund |
grade California-issued US municipal bonds with maturities equal to or greater than five years.
| | ∎ | | TheLipper California Municipal Debt Funds Indexis an unmanaged index considered representative of California municipal debt funds tracked by Lipper. |
| | ∎ | | The Fund is not managed to track the performance of any particular index, including the index(es) described here, and consequently, the performance of the Fund may deviate significantly from the performance of the index(es). |
| | ∎ | | A direct investment cannot be made in an index. Unless otherwise indicated, index results include reinvested dividends, and they do not reflect sales charges. Performance of the peer group, if applicable, reflects fund expenses; performance of a market index does not. |
Other information
| | ∎ | | CPA® and Certified Public Accountant® are trademarks owned by the American Institute of Certified Public Accountants. |
| | ∎ | | The returns shown in management’s discussion of Fund performance are based on net asset values (NAVs) calculated for shareholder transactions. Generally accepted accounting principles require adjustments to be made to the net assets of the Fund at period end for financial reporting purposes, and as such, the NAVs for shareholder transactions and the returns based on those NAVs may differ from the NAVs and returns reported in the Financial Highlights. |
|
| 11 Invesco California Tax-Free Income Fund |
Schedule of Investments
August 31, 2019
| | | | | | | | | | | | | | | | |
| | | Interest
Rate | | | Maturity
Date | | | Principal
Amount
(000) | | | Value | |
| |
Municipal Obligations–107.22% | | | | | | | | | | | | | | | | |
| California–104.22% | | | | | | | | | | | | | | | | |
ABAG Finance Authority forNon-profit Corps. (Sharp Healthcare); Series 2014 A, RB | | | 5.00% | | | | 08/01/2043 | | | $ | 500 | | | $ | 562,905 | |
| |
Alhambra (City of), CA (Atherton Baptist Homes); Series 2010 A, RB(a)(b) | | | 7.62% | | | | 01/01/2020 | | | | 1,575 | | | | 1,608,847 | |
| |
Alhambra Elementary School District (Election of 1999); Series 1999 A, GO Bonds (INS-AGM)(c)(d) | | | 0.00% | | | | 09/01/2020 | | | | 1,925 | | | | 1,905,865 | |
| |
Anaheim (City of), CA Public Financing Authority (Electric System Distribution Facilities); Series 2011 A, RB(a)(b) | | | 5.38% | | | | 04/01/2021 | | | | 2,500 | | | | 2,679,050 | |
| |
Bay Area Toll Authority (San Francisco Bay Area); | | | | | | | | | | | | | | | | |
Series 2017F-1, RB(e) | | | 5.00% | | | | 04/01/2056 | | | | 3,465 | | | | 4,196,843 | |
| |
Series 2017, Ref. RB | | | 4.00% | | | | 04/01/2037 | | | | 1,720 | | | | 1,962,675 | |
| |
Series 2017, Ref. RB | | | 4.00% | | | | 04/01/2049 | | | | 630 | | | | 703,137 | |
| |
Bay Area Water Supply & Conservation Agency; Series 2013 A, RB | | | 5.00% | | | | 10/01/2034 | | | | 1,950 | | | | 2,204,494 | |
| |
Beverly Hills Unified School District (Election of 2008); | | | | | | | | | | | | | | | | |
Series 2009, GO Bonds(d) | | | 0.00% | | | | 08/01/2026 | | | | 1,465 | | | | 1,330,835 | |
| |
Series 2009, GO Bonds(d) | | | 0.00% | | | | 08/01/2032 | | | | 3,045 | | | | 2,357,104 | |
| |
California (County of), CA Tobacco Securitization Agency (Alameda County Tobacco Asset Securitization Corp.); Series 2006 C, RB(d) | | | 0.00% | | | | 06/01/2055 | | | | 12,000 | | | | 732,120 | |
| |
California (County of), CA Tobacco Securitization Agency (Gold Country Settlement Funding Corp.); Series 2006, RB(d) | | | 0.00% | | | | 06/01/2033 | | | | 1,345 | | | | 615,674 | |
| |
California (County of), CA Tobacco Securitization Agency (Los Angeles County Securitization Corp.); Series 2006, RB(f) | | | 5.70% | | | | 06/01/2046 | | | | 1,030 | | | | 1,036,221 | |
| |
California (State of); | | | | | | | | | | | | | | | | |
Series 2004 A9, Ref. VRD GO Bonds(LOC-State Street Bank & Trust Co.)(g)(h) | | | 1.05% | | | | 09/12/2019 | | | | 3,275 | | | | 3,275,000 | |
| |
Series 2009, GO Bonds | | | 6.00% | | | | 11/01/2035 | | | | 1,750 | | | | 1,764,000 | |
| |
Series 2010, GO Bonds | | | 5.25% | | | | 11/01/2040 | | | | 3,000 | | | | 3,139,950 | |
| |
Series 2011, GO Bonds | | | 5.00% | | | | 09/01/2032 | | | | 2,450 | | | | 2,637,645 | |
| |
Series 2011, GO Bonds | | | 5.00% | | | | 10/01/2041 | | | | 2,500 | | | | 2,694,525 | |
| |
Series 2012, Ref. GO Bonds | | | 5.25% | | | | 02/01/2030 | | | | 1,000 | | | | 1,098,250 | |
| |
Series 2015, GO Bonds | | | 5.00% | | | | 08/01/2045 | | | | 1,000 | | | | 1,185,790 | |
| |
Series 2016, GO Bonds(e) | | | 5.00% | | | | 09/01/2045 | | | | 3,400 | | | | 4,128,076 | |
| |
Series 2017, Ref. GO Bonds | | | 5.00% | | | | 08/01/2035 | | | | 1,370 | | | | 1,692,799 | |
| |
California (State of) (Green Bonds); Series 2014, GO Bonds | | | 5.00% | | | | 10/01/2037 | | | | 1,745 | | | | 2,045,541 | |
| |
California (State of) Community College Financing Authority (Orange Coast PropertiesLLC- Orange Coast College); Series 2018, RB | | | 5.25% | | | | 05/01/2048 | | | | 665 | | | | 794,934 | |
| |
California (State of) Community Housing Agency (Annadel Apartments);
Series 2019 A, RB(i) | | | 5.00% | | | | 04/01/2049 | | | | 2,055 | | | | 2,310,991 | |
| |
California (State of) Educational Facilities Authority (Loma Linda University); | | | | | | | | | | | | | | | | |
Series 2017 A, Ref. RB | | | 5.00% | | | | 04/01/2042 | | | | 1,715 | | | | 2,048,704 | |
| |
Series 2017 A, Ref. RB | | | 5.00% | | | | 04/01/2047 | | | | 1,000 | | | | 1,184,040 | |
| |
California (State of) Educational Facilities Authority (Pitzer College); Series 2009, RB (a)(b) | | | 6.00% | | | | 04/01/2020 | | | | 2,000 | | | | 2,058,580 | |
| |
California (State of) Educational Facilities Authority (Stanford University); Series 2010, RB(e) | | | 5.25% | | | | 04/01/2040 | | | | 4,520 | | | | 6,980,236 | |
| |
California (State of) Health Facilities Financing Authority; Series 2019, RB | | | 5.00% | | | | 11/15/2049 | | | | 1,690 | | | | 2,023,302 | |
| |
California (State of) Health Facilities Financing Authority (Adventist Health System West); Series 2009 A, RB(a)(b) | | | 5.75% | | | | 09/01/2019 | | | | 500 | | | | 500,000 | |
| |
California (State of) Health Facilities Financing Authority (Catholic Healthcare West); Series 2011 A, RB | | | 5.25% | | | | 03/01/2041 | | | | 2,500 | | | | 2,633,375 | |
| |
California (State of) Health Facilities Financing Authority (Cedars-Sinai Medical Center); | | | | | | | | | | | | | | | | |
Series 2015, Ref. RB | | | 5.00% | | | | 11/15/2031 | | | | 1,300 | | | | 1,591,759 | |
| |
Series 2015, Ref. RB | | | 5.00% | | | | 11/15/2032 | | | | 1,250 | | | | 1,535,112 | |
| |
Series 2015, Ref. RB | | | 5.00% | | | | 11/15/2033 | | | | 1,000 | | | | 1,220,500 | |
| |
California (State of) Health Facilities Financing Authority (Children’s Hospital Los Angeles); | | | | | | | | | | | | | | | | |
Series 2010, RB(a)(b) | | | 5.25% | | | | 07/01/2020 | | | | 2,950 | | | | 3,054,459 | |
| |
Series 2017 A, Ref. RB | | | 5.00% | | | | 08/15/2047 | | | | 1,715 | | | | 2,053,627 | |
| |
See accompanying Notes to Financial Statements which are an integral part of the financial statements.
|
| 12 Invesco California Tax-Free Income Fund |
| | | | | | | | | | | | | | | | |
| | | Interest
Rate | | | Maturity
Date | | | Principal
Amount
(000) | | | Value | |
| California–(continued) | | | | | | | | | | | | | | | | |
California (State of) Health Facilities Financing Authority (Lucile Salter Packard Children’s Hospital at Stanford); Series 2017, RB | | | 4.00% | | | | 11/15/2047 | | | $ | 560 | | | $ | 619,931 | |
California (State of) Health Facilities Financing Authority (Scripps Health);
Series 2010 A, RB | | | 5.00% | | | | 11/15/2036 | | | | 4,000 | | | | 4,031,520 | |
California (State of) Health Facilities Financing Authority (St. Joseph Health System); Series 2013 A, RB | | | 5.00% | | | | 07/01/2037 | | | | 1,000 | | | | 1,130,360 | |
California (State of) Health Facilities Financing Authority (Stanford Hospital); | | | | | | | | | | | | | | | | |
Series 2008A-2, Ref. RB(a)(b) | | | 5.25% | | | | 11/15/2021 | | | | 2,000 | | | | 2,189,300 | |
California (State of) Health Facilities Financing Authority (Sutter Health); | | | | | | | | | | | | | | | | |
Series 2011 B, RB(a)(b) | | | 5.50% | | | | 08/15/2020 | | | | 1,000 | | | | 1,042,990 | |
Series 2018 A, RB | | | 5.00% | | | | 11/15/2048 | | | | 3,000 | | | | 3,676,470 | |
California (State of) Housing Finance Agency; Series 2019A-1, RB | | | 4.25% | | | | 01/15/2035 | | | | 1,695 | | | | 2,030,135 | |
California (State of) Housing Finance Agency (Verdant at Green Valley); Series 2019 A, RB(i) | | | 5.00% | | | | 08/01/2049 | | | | 1,360 | | | | 1,544,158 | |
California (State of) Municipal Finance Authority (American Heritage Education Foundation);
Series 2016 A, Ref. RB | | | 5.00% | | | | 06/01/2036 | | | | 1,000 | | | | 1,167,050 | |
Series 2016 A, Ref. RB | | | 5.00% | | | | 06/01/2046 | | | | 1,640 | | | | 1,888,378 | |
California (State of) Municipal Finance Authority (Bella Mente Montessori Academy); | | | | | | | | | | | | | | | | |
Series 2018 A, RB(i) | | | 5.00% | | | | 06/01/2038 | | | | 280 | | | | 330,792 | |
Series 2018 A, RB(i) | | | 5.00% | | | | 06/01/2048 | | | | 380 | | | | 441,370 | |
California (State of) Municipal Finance Authority (California Baptist University); Series 2016 A, RB(i) | | | 5.00% | | | | 11/01/2046 | | | | 1,000 | | | | 1,146,660 | |
California (State of) Municipal Finance Authority (Caritas Affordable Housing, Inc.);
Series 2014 A, RB | | | 5.25% | | | | 08/15/2039 | | | | 1,200 | | | | 1,367,040 | |
Series 2014 A, RB | | | 5.25% | | | | 08/15/2049 | | | | 1,420 | | | | 1,597,827 | |
California (State of) Municipal Finance Authority (Caritas Projects); | | | | | | | | | | | | | | | | |
Series 2012 A, RB | | | 5.50% | | | | 08/15/2047 | | | | 1,500 | | | | 1,617,780 | |
Series 2017 A, Ref. RB | | | 4.00% | | | | 08/15/2037 | | | | 1,055 | | | | 1,136,056 | |
California (State of) Municipal Finance Authority(CHF-Davis I, LLC - West Village Student Housing Project); Series 2018, RB | | | 5.00% | | | | 05/15/2043 | | | | 1,650 | | | | 1,998,414 | |
California (State of) Municipal Finance Authority (Community Medical Centers);
Series 2017 A, Ref. RB | | | 5.00% | | | | 02/01/2042 | | | | 625 | | | | 746,213 | |
Series 2017 A, Ref. RB | | | 5.00% | | | | 02/01/2047 | | | | 1,380 | | | | 1,637,356 | |
California (State of) Municipal Finance Authority (Eisenhower Medical Center); | | | | | | | | | | | | | | | | |
Series 2010 A, RB(a)(b) | | | 5.50% | | | | 07/01/2020 | | | | 1,000 | | | | 1,037,030 | |
Series 2010 A, RB(a)(b) | | | 5.75% | | | | 07/01/2020 | | | | 1,500 | | | | 1,558,620 | |
Series 2017 A, Ref. RB | | | 5.00% | | | | 07/01/2047 | | | | 1,000 | | | | 1,172,880 | |
California (State of) Municipal Finance Authority (Emerson College);
Series 2011, RB(a)(b) | | | 5.75% | | | | 01/01/2022 | | | | 1,315 | | | | 1,462,043 | |
California (State of) Municipal Finance Authority (Humangood Obligation Group); Series 2019 A, Ref. RB | | | 5.00% | | | | 10/01/2044 | | | | 1,695 | | | | 2,010,626 | |
California (State of) Municipal Finance Authority (Linxs APM); Series 2018 A, RB(j) | | | 5.00% | | | | 12/31/2038 | | | | 2,005 | | | | 2,453,418 | |
California (State of) Municipal Finance Authority (Mt. San Antonio Gardens); Series 2019, Ref. RB | | | 5.00% | | | | 11/15/2049 | | | | 2,750 | | | | 3,255,230 | |
California (State of) Municipal Finance Authority (Orange County Civic Center); Series 2017 A, RB(e) | | | 5.00% | | | | 06/01/2042 | | | | 5,160 | | | | 6,268,626 | |
California (State of) Municipal Finance Authority (Palmdale Aerospace Academy (The)); Series 2018 A, RB(i) | | | 5.00% | | | | 07/01/2049 | | | | 600 | | | | 677,028 | |
California (State of) Municipal Finance Authority (Touro College and University System); Series 2014 A, RB | | | 5.25% | | | | 01/01/2034 | | | | 620 | | | | 705,120 | |
California (State of) Municipal Finance Authority (Town and Country Manor); Series 2019, Ref. RB (INS-Cal-Mortgage)(c) | | | 5.00% | | | | 07/01/2049 | | | | 1,400 | | | | 1,751,036 | |
California (State of) Municipal Finance Authority (UCR North District Phase 1 Student Housing); Series 2019, RB | | | 5.00% | | | | 05/15/2049 | | | | 2,660 | | | | 3,257,356 | |
California (State of) Municipal Finance Authority (University of La Verne); | | | | | | | | | | | | | | | | |
Series 2010 A, RB(a)(b) | | | 6.12% | | | | 06/01/2020 | | | | 1,000 | | | | 1,038,670 | |
Series 2017 A, Ref. RB | | | 5.00% | | | | 06/01/2043 | | | | 600 | | | | 722,028 | |
California (State of) Municipal Finance Authority (William Jessup University); Series 2019, Ref. RB | | | 5.00% | | | | 08/01/2039 | | | | 1,500 | | | | 1,738,725 | |
California (State of) Pollution Control Finance Authority; Series 2012, RB(i)(j) | | | 5.00% | | | | 07/01/2037 | | | | 3,000 | | | | 3,237,450 | |
California (State of) Pollution Control Financing Authority (San Diego County Water Authority); Ref. RB(i) | | | 5.00% | | | | 07/01/2039 | | | | 2,000 | | | | 2,443,320 | |
California (State of) Pollution Control Financing Authority (Waste Management, Inc.); Series 2015B-1, Ref.RB(j) | | | 3.00% | | | | 11/01/2025 | | | | 1,500 | | | | 1,630,965 | |
See accompanying Notes to Financial Statements which are an integral part of the financial statements.
|
| 13 Invesco California Tax-Free Income Fund |
| | | | | | | | | | | | | | | | |
| | | Interest
Rate | | | Maturity
Date | | | Principal
Amount
(000) | | | Value | |
| California–(continued) | | | | | | | | | | | | | | | | |
California (State of) Public Finance Authority (Sharp HealthCare); Series 2017 B, VRD RB (LOC - Barclays Bank PLC)(g)(h) | | | 1.05% | | | | 08/01/2052 | | | $ | 5,225 | | | $ | 5,225,000 | |
California (State of) Public Finance Authority (Trinity Classical Academy); | | | | | | | | | | | | | | | | |
Series 2019 A, RB(i) | | | 5.00% | | | | 07/01/2036 | | | | 400 | | | | 435,340 | |
Series 2019 A, RB(i) | | | 5.00% | | | | 07/01/2044 | | | | 375 | | | | 400,170 | |
Series 2019 A, RB(i) | | | 5.00% | | | | 07/01/2054 | | | | 1,000 | | | | 1,058,840 | |
California (State of) Public Works Board (Various Capital); Series 2011 A, RB | | | 5.13% | | | | 10/01/2031 | | | | 2,000 | | | | 2,164,160 | |
California (State of) Public Works Board (Various Correctional Facilities); Series 2014 A, RB | | | 5.00% | | | | 09/01/2039 | | | | 3,000 | | | | 3,498,660 | |
California (State of) School Finance Authority (Alliance for College-Ready Public Schools);
Series 2013 A, RB | | | 6.30% | | | | 07/01/2043 | | | | 840 | | | | 967,067 | |
Series 2015, RB(i) | | | 5.00% | | | | 07/01/2045 | | | | 1,265 | | | | 1,428,691 | |
California (State of) School Finance Authority (Aspire Public Schools); | | | | | | | | | | | | | | | | |
Series 2015 A, Ref. RB(i) | | | 5.00% | | | | 08/01/2045 | | | | 1,000 | | | | 1,127,540 | |
Series 2016, Ref. RB(i) | | | 5.00% | | | | 08/01/2046 | | | | 750 | | | | 845,153 | |
California (State of) School Finance Authority (Green Dot Public Schools); | | | | | | | | | | | | | | | | |
Series 2015 A, RB(i) | | | 5.00% | | | | 08/01/2045 | | | | 1,500 | | | | 1,697,445 | |
Series 2018 A, RB(i) | | | 5.00% | | | | 08/01/2038 | | | | 1,000 | | | | 1,204,420 | |
California (State of) School Finance Authority (KIPP LA); | | | | | | | | | | | | | | | | |
Series 2015 A, RB(i) | | | 5.00% | | | | 07/01/2045 | | | | 500 | | | | 567,595 | |
Series 2017 A, RB(i) | | | 5.00% | | | | 07/01/2037 | | | | 590 | | | | 706,466 | |
Series 2017 A, RB(i) | | | 5.00% | | | | 07/01/2047 | | | | 370 | | | | 434,828 | |
California (State of) School Finance Authority (Kipp Socal Public Schools); Series 2019 A, RB(i) | | | 5.00% | | | | 07/01/2049 | | | | 1,700 | | | | 2,062,491 | |
California (State of) School Finance Authority (New Designs Charter School); Series 2012 A, RB | | | 5.25% | | | | 06/01/2032 | | | | 1,550 | | | | 1,665,196 | |
California (State of) Statewide Communities Development Authority (Adventist Health System);
Series 2015, Ref. RB | | | 5.00% | | | | 03/01/2033 | | | | 775 | | | | 933,046 | |
Series 2015, Ref. RB | | | 5.00% | | | | 03/01/2045 | | | | 2,315 | | | | 2,727,209 | |
California (State of) Statewide Communities Development Authority (Alliance for College-Ready Public Schools); Series 2012, RB | | | 6.10% | | | | 07/01/2032 | | | | 820 | | | | 884,690 | |
California (State of) Statewide Communities Development Authority (American Baptist Homes of the West); Series 2010, RB | | | 6.25% | | | | 10/01/2039 | | | | 2,000 | | | | 2,007,900 | |
California (State of) Statewide Communities Development Authority (California Baptist University);
Series 2014 A, RB | | | 5.13% | | | | 11/01/2023 | | | | 715 | | | | 764,685 | |
Series 2017 A, Ref.RB(i) | | | 5.00% | | | | 11/01/2041 | | | | 875 | | | | 1,024,940 | |
California (State of) Statewide Communities Development Authority (Cottage Health System Obligated Group); Series 2010, RB | | | 5.25% | | | | 11/01/2030 | | | | 1,675 | | | | 1,752,335 | |
California (State of) Statewide Communities Development Authority (Front Porch Communities & Services); Series 2017, Ref. RB | | | 5.00% | | | | 04/01/2047 | | | | 2,015 | | | | 2,391,986 | |
California (State of) Statewide Communities Development Authority (Henry Mayo Newhall Memorial Hospital); Series 2014 A, RB (INS-AGM)(c) | | | 5.25% | | | | 10/01/2043 | | | | 600 | | | | 684,540 | |
California (State of) Statewide Communities Development Authority (Huntington Memorial Hospital); | | | | | | | | | | | | | | | | |
Series 2014 B, Ref. RB | | | 5.00% | | | | 07/01/2044 | | | | 750 | | | | 855,030 | |
California (State of) Statewide Communities Development Authority (John Muir Health); Series 2016 A, Ref. RB | | | 5.00% | | | | 08/15/2051 | | | | 3,000 | | | | 3,549,660 | |
California (State of) Statewide Communities Development Authority (Lancer Educational Student Housing); | | | | | | | | | | | | | | | | |
Series 2016, Ref.RB(i) | | | 5.00% | | | | 06/01/2046 | | | | 1,000 | | | | 1,121,860 | |
Series 2019, RB(i) | | | 5.00% | | | | 06/01/2034 | | | | 375 | | | | 450,210 | |
Series 2019, RB(i) | | | 5.00% | | | | 06/01/2039 | | | | 100 | | | | 118,079 | |
Series 2019, RB(i) | | | 5.00% | | | | 06/01/2051 | | | | 295 | | | | 343,421 | |
California (State of) Statewide Communities Development Authority (Loma Linda University Medical Center); | | | | | | | | | | | | | | | | |
Series 2014, RB | | | 5.50% | | | | 12/01/2054 | | | | 1,500 | | | | 1,694,565 | |
Series 2016 A, RB(i) | | | 5.25% | | | | 12/01/2056 | | | | 830 | | | | 949,188 | |
California (State of) Statewide Communities Development Authority (Methodist Hospital of Sothern California); Series 2018; RB | | | 5.00% | | | | 01/01/2048 | | | | 495 | | | | 588,001 | |
See accompanying Notes to Financial Statements which are an integral part of the financial statements.
|
| 14 Invesco California Tax-Free Income Fund |
| | | | | | | | | | | | | | | | |
| | | Interest
Rate | | | Maturity
Date | | | Principal
Amount
(000) | | | Value | |
| California–(continued) | | | | | | | | | | | | | | | | |
California (State of) Statewide Communities Development Authority (NCCD—Hooper Street LLC—California College of the Arts); Series 2019, RB (i) | | | 5.25% | | | | 07/01/2039 | | | $ | 1,640 | | | $ | 1,932,035 | |
California (State of) Statewide Communities Development Authority (Southern California Presbyterian Homes); | | | | | | | | | | | | | | | | |
Series 2009, RB(a)(i) | | | 6.25% | | | | 11/15/2019 | | | | 455 | | | | 459,723 | |
Series 2009, RB(i) | | | 7.25% | | | | 11/15/2041 | | | | 500 | | | | 506,120 | |
California (State of) Statewide Communities Development Authority (Terraces at San Joaquin Garden); Series 2012, RB | | | 5.62% | | | | 10/01/2032 | | | | 1,000 | | | | 1,089,750 | |
California (State of) Statewide Communities Development Authority (University of California - Irvine East Campus Apartments); Series 2012, Ref. RB | | | 5.38% | | | | 05/15/2038 | | | | 2,000 | | | | 2,145,580 | |
California (State of) Statewide Finance Authority (Pooled Tobacco Securitization); Series 2006 A, RB(d) | | | 0.00% | | | | 06/01/2046 | | | | 8,000 | | | | 1,542,960 | |
California Infrastructure & Economic Development Bank (Academy Motion Picture Arts & Sciences Obligated Group); Series 2015 A, Ref. RB | | | 5.00% | | | | 11/01/2041 | | | | 4,265 | | | | 4,846,490 | |
California Infrastructure & Economic Development Bank (Academy Motion Picture Arts and Sciences Obligated Group); Series 2015, Ref. RB | | | 5.00% | | | | 11/01/2035 | | | | 1,000 | | | | 1,146,310 | |
California Infrastructure & Economic Development Bank (Broad Museum); Series 2011 A, RB | | | 5.00% | | | | 06/01/2021 | | | | 2,000 | | | | 2,143,880 | |
California Public Finance Authority (Henry Mayo Newhall Hospital); | | | | | | | | | | | | | | | | |
Series 2017, Ref. RB | | | 5.00% | | | | 10/15/2037 | | | | 1,000 | | | | 1,160,770 | |
Series 2017, Ref. RB | | | 5.00% | | | | 10/15/2047 | | | | 1,000 | | | | 1,144,920 | |
California State University; Series 2012 A, RB(e) | | | 5.00% | | | | 11/01/2037 | | | | 6,750 | | | | 7,531,718 | |
Cerritos Community College District (Election of 2012); Series 2018 B, GO Bonds | | | 4.00% | | | | 08/01/2043 | | | | 1,870 | | | | 2,120,412 | |
Clovis Unified School District (Election of 2004); Series 2004 A, GO Bonds(INS - NATL)(c)(d) | | | 0.00% | | | | 08/01/2029 | | | | 735 | | | | 611,880 | |
Compton Unified School District; Series 2019 B, GO Bonds (INS-BAM)(c) | | | 4.00% | | | | 06/01/2049 | | | | 1,390 | | | | 1,556,369 | |
East Bay Municipal Utility District; Series 2010 A, Ref. RB(a)(b) | | | 5.00% | | | | 06/01/2020 | | | | 2,000 | | | | 2,061,520 | |
Eden (Township of), CA Healthcare District; Series 2010, Ref. COP(a)(b) | | | 6.12% | | | | 06/01/2020 | | | | 1,000 | | | | 1,037,910 | |
El Segundo Unified School District (Election of 2008); Series 2009 A, GO Bonds (d) | | | 0.00% | | | | 08/01/2033 | | | | 4,430 | | | | 3,243,247 | |
Emeryville (City of), CA Public Financing Authority (Alameda County); | | | | | | | | | | | | | | | | |
Series 2014 A, Ref. RB (INS-AGM)(c) | | | 5.00% | | | | 09/01/2032 | | | | 445 | | | | 526,297 | |
Series 2014 A, Ref. RB (INS-AGM)(c) | | | 5.00% | | | | 09/01/2033 | | | | 385 | | | | 454,712 | |
Series 2014 A, Ref. RB (INS-AGM)(c) | | | 5.00% | | | | 09/01/2034 | | | | 500 | | | | 585,915 | |
Escondido Union School District (Election of 2014); Series 2018 B, GO Bonds | | | 4.00% | | | | 08/01/2047 | | | | 1,690 | | | | 1,897,954 | |
Foothill-Eastern Transportation Corridor Agency; Series 2015, Ref. RB
(INS-AGM)(c)(d) | | | 0.00% | | | | 01/15/2035 | | | | 2,745 | | | | 1,855,098 | |
Fremont Community Facilities District No. 1 (Pacific Commons); | | | | | | | | | | | | | | | | |
Series 2015, Ref. RB | | | 5.00% | | | | 09/01/2035 | | | | 815 | | | | 938,489 | |
Series 2015, Ref. RB | | | 5.00% | | | | 09/01/2045 | | | | 905 | | | | 1,027,329 | |
Fullerton (City of), CA Community Facilities District No. 1 (Amerige Heights); | | | | | | | | | | | | | | | | |
Series 2012, Ref. RB | | | 5.00% | | | | 09/01/2026 | | | | 1,960 | | | | 2,174,130 | |
Series 2012, Ref. RB | | | 5.00% | | | | 09/01/2032 | | | | 1,090 | | | | 1,207,393 | |
Gilroy Unified School District (Election of 2008); | | | | | | | | | | | | | | | | |
Series 2009 A, GO Bonds(a)(d) | | | 0.00% | | | | 08/01/2029 | | | | 615 | | | | 532,449 | |
Series 2009 A, GO Bonds (INS-AGC)(c)(d) | | | 0.00% | | | | 08/01/2029 | | | | 4,735 | | | | 3,907,180 | |
Series 2009 A, GO Bonds(a)(d) | | | 0.00% | | | | 08/01/2031 | | | | 2,235 | | | | 1,853,038 | |
Series 2009 A, GO Bonds (INS-AGC)(c)(d) | | | 0.00% | | | | 08/01/2031 | | | | 1,415 | | | | 1,089,875 | |
Glendora (City of), CA Public Finance Authority; Series 2003 A, RB (INS -NATL)(c) | | | 5.00% | | | | 09/01/2024 | | | | 2,200 | | | | 2,206,820 | |
Golden State Tobacco Securitization Corp.; | | | | | | | | | | | | | | | | |
Series 2013 A, RB | | | 5.00% | | | | 06/01/2030 | | | | 2,000 | | | | 2,288,200 | |
Series 2015 A, Ref. RB | | | 5.00% | | | | 06/01/2040 | | | | 695 | | | | 820,232 | |
Series 2015 A, Ref. RB | | | 5.00% | | | | 06/01/2045 | | | | 1,165 | | | | 1,367,454 | |
Series 2017A-1, Ref. RB | | | 5.00% | | | | 06/01/2029 | | | | 1,000 | | | | 1,209,330 | |
Series 2018A-1, Ref. RB | | | 5.00% | | | | 06/01/2047 | | | | 2,240 | | | | 2,297,478 | |
Series 2018A-2, Ref. RB | | | 5.00% | | | | 06/01/2047 | | | | 3,000 | | | | 3,076,980 | |
Hollister Joint Powers Financing Authority; Series 2016, Ref. RB (INS-AGM)(c) | | | 5.00% | | | | 06/01/2036 | | | | 1,270 | | | | 1,545,844 | |
Inglewood (City of), CA Redevelopment Agency (Merged Redevelopment);
Series 1998 A, Ref. RB (INS -AMBAC)(c) | | | 5.25% | | | | 05/01/2023 | | | | 650 | | | | 708,767 | |
See accompanying Notes to Financial Statements which are an integral part of the financial statements.
|
| 15 Invesco California Tax-Free Income Fund |
| | | | | | | | | | | | | | | | |
| | | Interest
Rate | | | Maturity
Date | | | Principal
Amount
(000) | | | Value | |
| |
| California–(continued) | | | | | | | | | | | | | | | | |
| | | | |
Inland Empire Tobacco Securitization Authority;
Series 2007C-1, RB(d) | | | 0.00% | | | | 06/01/2036 | | | $ | 8,000 | | | $ | 2,686,720 | |
| |
Series 2007C-2, RB(d) | | | 0.00% | | | | 06/01/2047 | | | | 14,000 | | | | 2,219,840 | |
| |
Irvine (City of), CA Community Facilities DistrictNo. 2013-3 (Great Park Improvement Area No. 1); Series 2014, RB | | | 5.00% | | | | 09/01/2044 | | | | 445 | | | | 496,224 | |
| |
Series 2014, RB | | | 5.00% | | | | 09/01/2049 | | | | 445 | | | | 494,413 | |
| |
Irvine Ranch Water District; Series 2016, RB(e) | | | 5.25% | | | | 02/01/2046 | | | | 4,305 | | | | 5,295,968 | |
| |
Irvine Unified School District (Community Facilities DistrictNo. 01-1); Series 2015, Ref. RB (INS -BAM)(c) | | | 5.00% | | | | 09/01/2038 | | | | 3,500 | | | | 4,062,030 | |
| |
Irvine Unified School District (Community Facilities DistrictNo. 06-1- Portola Springs); Series 2010, RB | | | 6.70% | | | | 09/01/2035 | | | | 515 | | | | 536,960 | |
| |
Irvine Unified School District (Community Facilities DistrictNo. 09-1);
Series 2017 B, RB | | | 5.00% | | | | 09/01/2047 | | | | 500 | | | | 586,485 | |
| |
Series 2018 A, Ref. RB | | | 5.00% | | | | 09/01/2045 | | | | 1,000 | | | | 1,176,120 | |
| |
Long Beach (City of), CA;
Series 2010 A, RB | | | 5.00% | | | | 06/01/2040 | | | | 2,500 | | | | 2,567,250 | |
| |
Series 2015, RB | | | 5.00% | | | | 05/15/2045 | | | | 2,370 | | | | 2,693,505 | |
| |
Long Beach (City of), CA Bond Finance Authority (Aquarium of the Pacific); Series 2012, Ref. RB | | | 5.00% | | | | 11/01/2029 | | | | 2,000 | | | | 2,164,880 | |
| |
Long Beach (City of), CA Bond Finance Authority (Natural Gas Purchase); Series 2007 A, RB | | | 5.50% | | | | 11/15/2032 | | | | 2,665 | | | | 3,677,460 | |
| |
Los Alamitos Unified School District; Series 2013, GO Bonds(f) | | | 6.01% | | | | 08/01/2040 | | | | 1,660 | | | | 1,655,452 | |
| |
Los Angeles (City of), CA Community Facilities District No. 4 (Playa Vista - Phase 1); Series 2014, Ref. RB | | | 5.00% | | | | 09/01/2031 | | | | 600 | | | | 700,944 | |
| |
Los Angeles (City of), CA Department of Airports (Los Angeles International Airport); Series 2010 A, RB | | | 5.00% | | | | 05/15/2035 | | | | 2,500 | | | | 2,569,800 | |
| |
Series 2010 B, RB | | | 5.00% | | | | 05/15/2040 | | | | 1,000 | | | | 1,026,930 | |
| |
Series 2013, RB(j) | | | 5.00% | | | | 05/15/2043 | | | | 3,000 | | | | 3,338,310 | |
| |
Series 2019, RB(j) | | | 5.00% | | | | 05/15/2049 | | | | 2,000 | | | | 2,443,040 | |
| |
Los Angeles (City of), CA Department of Water & Power; Series 2011 A, RB(a)(b) | | | 5.00% | | | | 07/01/2021 | | | | 25 | | | | 26,879 | |
| |
Series 2011 A, RB(e) | | | 5.00% | | | | 07/01/2022 | | | | 1,830 | | | | 1,966,884 | |
| |
Series 2011 A, RB | | | 5.25% | | | | 07/01/2039 | | | | 1,500 | | | | 1,581,345 | |
| |
Los Angeles (City of), CA Harbor Department; Series 2014 A, Ref. RB(j) | | | 5.00% | | | | 08/01/2036 | | | | 1,000 | | | | 1,160,100 | |
| |
Los Angeles County Schools Regionalized Business Services Corp. (Los Angeles County Schools Pooled Financing Program); Series 1999 A, COP (INS -AMBAC)(c)(d) | | | 0.00% | | | | 08/01/2024 | | | | 1,265 | | | | 1,163,927 | |
| |
Marin (County of), CA Water District Financing Authority; Series 2017, RB(e) | | | 5.00% | | | | 07/01/2047 | | | | 3,120 | | | | 3,817,944 | |
| |
Menifee Union School District (Election of 2008); Series 2009 C, GO Bonds (INS-AGC)(c)(d) | | | 0.00% | | | | 08/01/2035 | | | | 940 | | | | 633,259 | |
| |
Montclair (City of), CA Redevelopment Agency (Montclair Redevelopment Project No. V); Series 2001, Ref. RB (INS -NATL)(c) | | | 5.00% | | | | 10/01/2020 | | | | 245 | | | | 245,196 | |
| |
Moorpark Unified School District (Election of 2008); Series 2009 A, GO Bonds (INS-AGC)(c)(d) | | | 0.00% | | | | 08/01/2031 | | | | 840 | | | | 642,440 | |
| |
Mountain View Shoreline Regional Park Community; Series 2018 A, RB (INS-AGM)(c) | | | 5.00% | | | | 08/01/2048 | | | | 2,000 | | | | 2,495,120 | |
| |
Mt. San Antonio Community College District (Election 2008); Series 2013 A, GO Bonds(f) | | | 6.25% | | | | 08/01/2043 | | | | 2,035 | | | | 2,075,700 | |
| |
National City (City of), CA Community Development Commission (National City Redevelopment); Series 2011, RB(a)(b) | | | 7.00% | | | | 08/01/2021 | | | | 1,500 | | | | 1,673,280 | |
| |
Norco (City of), CA Financing Authority; Series 2009, Ref. RB (INS-AGM)(c) | | | 5.62% | | | | 10/01/2034 | | | | 1,000 | | | | 1,003,260 | |
| |
North Orange County Community College District (Election of 2014); Series 2019 B, GO Bonds | | | 4.00% | | | | 08/01/2044 | | | | 2,500 | | | | 2,914,150 | |
| |
Northern California Transmission Agency (California-Oregon Transmission); Series 2016, Ref. RB | | | 5.00% | | | | 05/01/2038 | | | | 1,250 | | | | 1,502,062 | |
| |
Oakland Unified School District (County of Alameda); Series 2015 A, GO Bonds | | | 5.00% | | | | 08/01/2040 | | | | 1,070 | | | | 1,255,303 | |
| |
Orange (County of), CA Community Facilities DistrictNo. 2015-1 (Esencia Village); Series 2015 A, RB | | | 5.00% | | | | 08/15/2035 | | | | 125 | | | | 143,808 | |
| |
Series 2015 A, RB | | | 5.25% | | | | 08/15/2045 | | | | 1,810 | | | | 2,082,387 | |
| |
Orange (County of), CA Community Facilities DistrictNo. 2016-1 (Esencia Village); Series 2016 A, RB | | | 5.00% | | | | 08/15/2046 | | | | 2,000 | | | | 2,307,200 | |
| |
Oroville (City of), CA (Oroville Hospital);
Series 2019, RB | | | 5.25% | | | | 04/01/2039 | | | | 1,325 | | | | 1,618,991 | |
| |
Series 2019, RB | | | 5.25% | | | | 04/01/2049 | | | | 2,165 | | | | 2,599,732 | |
| |
See accompanying Notes to Financial Statements which are an integral part of the financial statements.
|
| 16 Invesco California Tax-Free Income Fund |
| | | | | | | | | | | | | | | | |
| | | Interest
Rate | | | Maturity
Date | | | Principal
Amount
(000) | | | Value | |
| |
| California–(continued) | | | | | | | | | | | | | | | | |
| | | | |
Palomar Community College District; Series 2010, GO Bonds(f) | | | 6.37% | | | | 08/01/2045 | | | $ | 3,330 | | | $ | 3,340,756 | |
| |
Palomar Pomerado Health; Series 2009, COP(a)(b) | | | 6.75% | | | | 11/01/2019 | | | | 2,000 | | | | 2,018,040 | |
| |
Rancho Cordova (City of), CA Community Facilities DistrictNo. 2003-1 (Sunridge Anatolia); Series 2012, Ref. RB | | | 5.00% | | | | 09/01/2027 | | | | 1,000 | | | | 1,092,790 | |
| |
Redding (City of), CA Redevelopment Agency (Canby-Hilltop-Cypress Redevelopment); Series 2003 A, RB (INS -NATL)(c) | | | 5.00% | | | | 09/01/2023 | | | | 1,400 | | | | 1,404,172 | |
| |
Regents of the University of California;
Series 2016 L, Ref. RB(e) | | | 5.00% | | | | 05/15/2041 | | | | 3,420 | | | | 4,070,176 | |
| |
Series 2018 O, Ref. RB | | | 5.00% | | | | 05/15/2048 | | | | 3,000 | | | | 3,714,030 | |
| |
Riverside (County of), CA Community Facilities DistrictNo. 07-2 (Clinton Keith); Series 2015, RB | | | 5.00% | | | | 09/01/2044 | | | | 1,000 | | | | 1,135,930 | |
| |
Riverside (County of), CA Public Financing Authority (Desert Communities and Interstate 215 Corridor); Series 2017 A, Ref. RB (INS-BAM)(c) | | | 5.00% | | | | 10/01/2034 | | | | 1,000 | | | | 1,233,980 | |
| |
Series 2017 A, Ref. RB (INS-BAM)(c) | | | 4.00% | | | | 10/01/2040 | | | | 500 | | | | 559,460 | |
| |
Riverside (County of), CA Transportation Commission; Series 2010 A, RB(a)(b) | | | 5.00% | | | | 06/01/2020 | | | | 1,500 | | | | 1,545,000 | |
| |
Romoland School District Community FacilitiesNo. 2004-1; Series 2015, Ref. RB | | | 5.00% | | | | 09/01/2038 | | | | 1,000 | | | | 1,144,580 | |
| |
Sacramento (City of), CA; Series 2018 A, RB | | | 5.00% | | | | 06/01/2043 | | | | 2,000 | | | | 2,461,760 | |
| |
Sacramento (County of), CA; Series 2010, RB | | | 5.00% | | | | 07/01/2040 | | | | 2,200 | | | | 2,265,802 | |
| |
Series 2018 C, Ref. RB(j) | | | 5.00% | | | | 07/01/2039 | | | | 1,685 | | | | 2,070,124 | |
| |
San Buenaventura (City of), CA (Community Memorial Health System); Series 2011, RB | | | 7.50% | | | | 12/01/2041 | | | | 2,000 | | | | 2,238,960 | |
| |
San Diego (City of), CA Public Facilities Financing Authority;
Series 2016 A, Ref. RB | | | 5.00% | | | | 05/15/2039 | | | | 1,565 | | | | 1,903,932 | |
| |
Series 2016 B, Ref. RB | | | 5.00% | | | | 08/01/2036 | | | | 1,500 | | | | 1,854,885 | |
| |
Subseries 2012 A, Ref. RB | | | 5.00% | | | | 08/01/2032 | | | | 2,215 | | | | 2,458,384 | |
| |
San Diego (City of), CA Regional Building Authority (County Operations Center); Series 2016 A, Ref. RB | | | 5.00% | | | | 10/15/2034 | | | | 1,500 | | | | 1,825,470 | |
| |
San Diego (County of), CA Regional Airport Authority; Series 2017 B, RB(j) | | | 5.00% | | | | 07/01/2037 | | | | 1,000 | | | | 1,228,010 | |
| |
San Diego (County of), CA Regional Transportation Commission; Series 2014 A, RB(e) | | | 5.00% | | | | 04/01/2048 | | | | 2,980 | | | | 3,423,573 | |
| |
San Diego Community College District (Election of 2006); Series 2011,
GO Bonds(a)(b) | | | 5.00% | | | | 08/01/2021 | | | | 2,500 | | | | 2,698,950 | |
| |
San Francisco (City & County of), CA Airport Commission (San Francisco International Airport); Series 2011 C, Ref. RB(j) | | | 5.00% | | | | 05/01/2023 | | | | 5,000 | | | | 5,312,001 | |
| |
Series 2011 G, Ref.RB(a)(b) | | | 5.25% | | | | 05/03/2021 | | | | 1,450 | | | | 1,554,168 | |
| |
Series 2011 G, Ref. RB | | | 5.25% | | | | 05/01/2028 | | | | 550 | | | | 587,983 | |
| |
Series 2018 D, RB(e)(j) | | | 5.25% | | | | 05/01/2048 | | | | 4,500 | | | | 5,563,215 | |
| |
San Francisco (City & County of), CA Public Utilities Commission (Water System Improvement Program); Subseries 2011 A, RB | | | 5.00% | | | | 11/01/2036 | | | | 4,000 | | | | 4,345,880 | |
| |
San Francisco (City & County of), CA Redevelopment Financing Authority (Mission Bay North Redevelopment); Series 2011 C, RB(a)(b) | | | 6.75% | | | | 02/01/2021 | | | | 1,000 | | | | 1,082,410 | |
| |
San Francisco (City & County of), CA Redevelopment Financing Authority (Mission Bay South Redevelopment); Series 2011 D, RB(a)(b) | | | 7.00% | | | | 02/01/2021 | | | | 500 | | | | 542,655 | |
| |
San Francisco (City & County of), CA Successor Agency to the Redevelopment Agency (Mission Bay South Redevelopment); Series 2014 A, RB | | | 5.00% | | | | 08/01/2043 | | | | 1,060 | | | | 1,215,990 | |
| |
San Francisco (City & County of), CA Successor Agency to the Redevelopment Agency Community Facilities District No. 6 (Mission Bay South Public Improvements); Series 2013 A, Ref. RB | | | 5.00% | | | | 08/01/2033 | | | | 500 | | | | 542,770 | |
| |
San Francisco (City of), CA Bay Area Rapid Transit District; Series 2012 A, RB | | | 5.00% | | | | 07/01/2036 | | | | 730 | | | | 809,037 | |
| |
Series 2015 A, Ref. RB | | | 5.00% | | | | 07/01/2032 | | | | 1,500 | | | | 1,815,420 | |
| |
San Francisco (City of), CA Bay Area Rapid Transit District (Election of 2016 Green Bond); Series 2017A-1, GO Bonds(e) | | | 5.00% | | | | 08/01/2047 | | | | 3,425 | | | | 4,226,690 | |
| |
San Joaquin Hills Transportation Corridor Agency;
Series 2014 A, Ref. RB | | | 5.00% | | | | 01/15/2044 | | | | 1,730 | | | | 1,988,185 | |
| |
Series 2014 B, Ref. RB | | | 5.25% | | | | 01/15/2044 | | | | 2,000 | | | | 2,288,760 | |
| |
San Jose Evergreen Community College District (Election of 2004); Series 2008 B, GO Bonds (INS -AGM)(c)(d) | | | 0.00% | | | | 09/01/2031 | | | | 3,110 | | | | 2,455,532 | |
| |
See accompanying Notes to Financial Statements which are an integral part of the financial statements.
|
| 17 Invesco California Tax-Free Income Fund |
| | | | | | | | | | | | | | | | |
| | | Interest
Rate | | | Maturity
Date | | | Principal
Amount
(000) | | | Value | |
| |
| California–(continued) | | | | | | | | | | | | | | | | |
| | | | |
San Luis Obispo (County of), CA Financing Authority (Lopez Dam Improvement); Series 2011 A, Ref. RB (INS-AGM)(c) | | | 5.00% | | | | 08/01/2030 | | | $ | 1,500 | | | $ | 1,603,950 | |
| |
San Mateo & Foster (Cities of), CA Public Financing Authority (Clean Water Program); Series 2019, RB | | | 5.00% | | | | 08/01/2049 | | | | 1,670 | | | | 2,134,527 | |
| |
San Mateo (City of), CA Foster School District (Election 2008); Series 2010, GO Bonds(f) | | | 6.62% | | | | 08/01/2042 | | | | 1,010 | | | | 1,032,402 | |
| |
Santa Margarita Water District (Community Facilities DistrictNo. 2013-1); Series 2013, RB | | | 5.63% | | | | 09/01/2036 | | | | 960 | | | | 1,070,006 | |
| |
Series 2013, RB | | | 5.63% | | | | 09/01/2043 | | | | 960 | | | | 1,070,102 | |
| |
Santaluz Community Facilities District No. 2 (Improvement Area No. 1);
Series 2011 A, Ref. RB | | | 5.00% | | | | 09/01/2028 | | | | 820 | | | | 880,631 | |
| |
Series 2011 A, Ref. RB | | | 5.00% | | | | 09/01/2029 | | | | 710 | | | | 762,881 | |
| |
Series 2011 A, Ref. RB | | | 5.10% | | | | 09/01/2030 | | | | 460 | | | | 495,296 | |
| |
Silicon Valley Tobacco Securitization Authority (Santa Clara); Series 2007 A, RB(d) | | | 0.00% | | | | 06/01/2036 | | | | 4,000 | | | | 1,580,360 | |
| |
Simi Valley Unified School District; Series 2019 B, GO Bonds | | | 4.00% | | | | 08/01/2048 | | | | 2,000 | | | | 2,254,120 | |
| |
Simi Valley Unified School District (Election of 2004); Series 2007 C, GO Bonds (INS-AGM)(c)(d) | | | 0.00% | | | | 08/01/2028 | | | | 3,480 | | | | 2,983,195 | |
| |
Series 2007 C, GO Bonds (INS-AGM)(c)(d) | | | 0.00% | | | | 08/01/2030 | | | | 2,765 | | | | 2,229,364 | |
| |
South Orange (County of), CA Public Financing Authority (Ladera Ranch); Series 2014 A, Ref. RB | | | 5.00% | | | | 08/15/2034 | | | | 895 | | | | 971,370 | |
| |
Southern California Public Power Authority (Milford Wind Corridor Phase II); Series 2011 1, RB(e) | | | 5.25% | | | | 07/01/2031 | | | | 2,100 | | | | 2,256,219 | |
| |
Series2011-1, RB(e) | | | 5.25% | | | | 07/01/2029 | | | | 2,100 | | | | 2,257,017 | |
| |
Southern California Tobacco Securitization Authority (San Diego County Tobacco Asset Securitization Corp.);
Series 2006A-1, RB | | | 5.00% | | | | 06/01/2037 | | | | 860 | | | | 863,655 | |
| |
Series 2006A-1, RB | | | 5.13% | | | | 06/01/2046 | | | | 3,840 | | | | 3,848,026 | |
| |
Tustin (City of), CA Public Financing Authority; Series 2011 A, RB(a)(b) | | | 5.00% | | | | 04/01/2021 | | | | 1,000 | | | | 1,065,760 | |
| |
Tustin Unified School District (Community Facilities DistrictNo. 97-1); Series 2015, Ref. RB (INS -BAM)(c) | | | 5.00% | | | | 09/01/2038 | | | | 3,000 | | | | 3,525,030 | |
| |
University of California; Series 2018 AZ, Ref. RB | | | 4.00% | | | | 05/15/2048 | | | | 2,000 | | | | 2,265,900 | |
| |
Walnut (City of), CA Energy Center Authority; Series 2010 A, Ref. RB | | | 5.00% | | | | 01/01/2035 | | | | 3,000 | | | | 3,035,700 | |
| |
West Contra Costa Unified School District; Series 2005, GO Bonds
(INS -NATL)(c)(d) | | | 0.00% | | | | 08/01/2025 | | | | 2,500 | | | | 2,279,875 | |
| |
Western Riverside (County of), CA Water & Wastewater Financing Authority (Eastern Municipal Water District Improvement); Series 2009, RB
(INS-AGC)(c) | | | 5.62% | | | | 09/01/2039 | | | | 1,000 | | | | 1,003,240 | |
| |
Whittier (City of), CA (Presbyterian Intercommunity Hospital, Inc.); Series 2014, RB | | | 5.00% | | | | 06/01/2044 | | | | 1,500 | | | | 1,684,245 | |
| |
Woodland (City of), CA Community Facilities District 1; Series 2019, RB | | | 5.00% | | | | 09/01/2044 | | | | 1,155 | | | | 1,337,455 | |
| |
Yosemite Community College District (Election of 2004); Series 2008 C, GO Bonds (INS-AGM)(c)(d) | | | 0.00% | | | | 08/01/2024 | | | | 4,685 | | | | 4,378,414 | |
| |
| | | | | | | | | | | | | | | 463,679,399 | |
| |
| | | | |
| Guam–1.68% | | | | | | | | | | | | | | | | |
Guam (Territory of); Series 2011 A, RB | | | 5.13% | | | | 01/01/2042 | | | | 1,500 | | | | 1,578,555 | |
| |
Guam (Territory of) (Section 30);
Series 2009 A, RB(a)(b) | | | 5.38% | | | | 12/01/2019 | | | | 1,000 | | | | 1,010,560 | |
| |
Series 2009 A, RB(a)(b) | | | 5.62% | | | | 12/01/2019 | | | | 660 | | | | 667,365 | |
| |
Guam (Territory of) International Airport Authority; Series 2013 C, RB(j) | | | 6.25% | | | | 10/01/2034 | | | | 1,000 | | | | 1,169,130 | |
| |
Guam (Territory of) Waterworks Authority; Series 2014 A, Ref. RB | | | 5.00% | | | | 07/01/2035 | | | | 765 | | | | 851,208 | |
| |
Port Authority of Guam; Series 2018 A, RB | | | 5.00% | | | | 07/01/2048 | | | | 1,825 | | | | 2,188,029 | |
| |
| | | | | | | | | | | | | | | 7,464,847 | |
| |
| | | | |
| Virgin Islands–0.96% | | | | | | | | | | | | | | | | |
Virgin Islands (Government of) Port Authority;
Series 2014 A, Ref. RB(j) | | | 5.00% | | | | 09/01/2029 | | | | 1,645 | | | | 1,652,222 | |
| |
Series 2014 A, Ref. RB(j) | | | 5.00% | | | | 09/01/2033 | | | | 1,500 | | | | 1,477,500 | |
| |
Virgin Islands (Government of) Public Finance Authority; Series 2015, RB(i) | | | 5.00% | | | | 09/01/2030 | | | | 1,000 | | | | 1,126,450 | |
| |
| | | | | | | | | | | | | | | 4,256,172 | |
| |
See accompanying Notes to Financial Statements which are an integral part of the financial statements.
|
| 18 Invesco California Tax-Free Income Fund |
| | | | | | | | | | | | | | | | |
| | | Interest
Rate | | | Maturity
Date | | | Principal
Amount
(000) | | | Value | |
| |
| Puerto Rico–0.36% | | | | | | | | | | | | | | | | |
Children’s Trust Fund; Series 2002, RB | | | 5.38% | | | | 05/15/2033 | | | $ | 700 | | | $ | 710,276 | |
| |
Puerto Rico Sales Tax Financing Corp.; Series 2018 A-1, RB(d) | | | 0.00% | | | | 07/01/2027 | | | | 1,120 | | | | 886,245 | |
| |
| | | | | | | | | | | | | | | 1,596,521 | |
| |
TOTAL INVESTMENTS IN SECURITIES(k)-107.22% (Cost $434,622,675) | | | | | | | | | | | | | | | 476,996,939 | |
| |
FLOATING RATE NOTE OBLIGATIONS-(8.05)% | | | | | | | | | | | | | | | | |
Notes with interest and fee rates ranging from 1.85% to 2.12% at 08/31/2019 and contractual maturities of collateral ranging from 07/01/2022 to 04/01/2056 (See Note 1K)(l) | | | | | | | | | | | | | | | (35,820,000 | ) |
| |
OTHER ASSETS LESS LIABILITIES-0.83% | | | | | | | | | | | | | | | 3,716,909 | |
| |
NET ASSETS-100.00% | | | | | | | | | | | | | | $ | 444,893,848 | |
| |
Investment Abbreviations:
| | |
AGC | | - Assured Guaranty Corp. |
AGM | | - Assured Guaranty Municipal Corp. |
AMBAC | | - American Municipal Bond Assurance Corp. |
BAM | | - Build America Mutual Assurance Co. |
COP | | - Certificates of Participation |
GO | | - General Obligation |
INS | | - Insurer |
LOC | | - Letter of Credit |
NATL | | - National Public Finance Guarantee Corp. |
RB | | - Revenue Bonds |
Ref. | | - Refunding |
VRD | | - Variable Rate Demand |
Notes to Schedule of Investments:
| (a) | Advance refunded; secured by an escrow fund of U.S. Government obligations or other highly rated collateral. |
| (b) | Security has an irrevocable call by the issuer or mandatory put by the holder. Maturity date reflects such call or put. |
| (c) | Principal and/or interest payments are secured by the bond insurance company listed. |
| (d) | Zero coupon bond issued at a discount. |
| (e) | Underlying security related to TOB Trusts entered into by the Fund. See Note 1J. |
| (f) | Convertible capital appreciation bond. The interest rate shown represents the coupon rate at which the bond will accrue at a specified future date. |
| (g) | Demand security payable upon demand by the Fund at specified time intervals no greater than thirteen months. Interest rate is redetermined periodically by the issuer or agent based on current market conditions. Rate shown is the rate in effect on August 31, 2019. |
| (h) | Principal and interest payments are fully enhanced by a letter of credit from the bank listed or a predecessor bank, branch or subsidiary. |
| (i) | Security purchased or received in a transaction exempt from registration under the Securities Act of 1933, as amended (the “1933 Act”). The security may be resold pursuant to an exemption from registration under the 1933 Act, typically to qualified institutional buyers. The aggregate value of these securities at August 31, 2019 was $32,132,774, which represented 7.22% of the Fund’s Net Assets. |
| (j) | Security subject to the alternative minimum tax. |
| (k) | This table provides a listing of those entities that have either issued, guaranteed, backed or otherwise enhanced the credit quality of more than 5% of the securities held in the portfolio. In instances where the entity has guaranteed, backed or otherwise enhanced the credit quality of a security, it is not primarily responsible for the issuer’s obligations but may be called upon to satisfy the issuer’s obligations. |
| | | | |
| Entity | | Percent | |
| |
Assured Guaranty Municipal Corp. | | | 5.2% | |
| |
| (l) | Floating rate note obligations related to securities held. The interest and fee rates shown reflect the rates in effect at August 31, 2019. At August 31, 2019, the Fund’s investments with a value of $61,983,185 are held by TOB Trusts and serve as collateral for the $35,820,000 in the floating rate note obligations outstanding at that date. |
|
See accompanying Notes to Financial Statements which are an integral part of the financial statements. 19 Invesco California Tax-Free Income Fund |
Statement of Assets and Liabilities
August 31, 2019
| | | | |
Assets: | | | | |
Investments in securities, at value
(Cost $434,622,675) | | $ | 476,996,939 | |
| |
Receivable for: | | | | |
Fund shares sold | | | 408,242 | |
| |
Investments sold | | | 537,400 | |
| |
Interest | | | 4,876,453 | |
| |
Investment for trustee deferred compensation and retirement plans | | | 68,707 | |
| |
Other assets | | | 39,994 | |
| |
Total assets | | | 482,927,735 | |
| |
| |
Liabilities: | | | | |
Floating rate note obligations | | | 35,820,000 | |
| |
Payable for: | |
Dividends | | | 476,665 | |
| |
Fund shares reacquired | | | 303,289 | |
| |
Amount due custodian | | | 1,025,958 | |
| |
Accrued fees to affiliates | | | 201,142 | |
| |
Accrued trustees’ and officers’ fees and benefits | | | 3,032 | |
| |
Accrued other operating expenses | | | 81,586 | |
| |
Trustee deferred compensation and retirement plans | | | 122,215 | |
| |
Total liabilities | | | 38,033,887 | |
| |
Net assets applicable to shares outstanding | | $ | 444,893,848 | |
| |
| |
Net assets consist of: | | | | |
Shares of beneficial interest | | $ | 416,455,082 | |
| |
Distributable earnings | | | 28,438,766 | |
| |
| | $ | 444,893,848 | |
| |
| | | | |
Net Assets: | | | | |
Class A | | $ | 338,796,675 | |
| |
Class C | | $ | 44,332,265 | |
| |
Class Y | | $ | 47,414,497 | |
| |
Class R6 | | $ | 14,350,411 | |
| |
|
Shares outstanding, no par value, with an unlimited number of shares authorized: | |
Class A | | | 27,687,462 | |
| |
Class C | | | 3,598,774 | |
| |
Class Y | | | 3,860,994 | |
| |
Class R6 | | | 1,167,604 | |
| |
Class A: | |
Net asset value per share | | $ | 12.24 | |
| |
Maximum offering price per share
(Net asset value of $12.24 ÷ 95.75%) | | $ | 12.78 | |
| |
Class C: | |
Net asset value and offering price per share | | $ | 12.32 | |
| |
Class Y: | |
Net asset value and offering price per share | | $ | 12.28 | |
| |
Class R6: | |
Net asset value and offering price per share | | $ | 12.29 | |
| |
|
See accompanying Notes to Financial Statements which are an integral part of the financial statements. 20 Invesco California Tax-Free Income Fund |
Statement of Operations
For the year ended August 31, 2019
| | | | |
Investment income: | |
Interest | | $ | 18,486,457 | |
| |
|
Expenses: | |
Advisory fees | | | 1,943,249 | |
| |
Administrative services fees | | | 75,265 | |
| |
Custodian fees | | | 2,351 | |
| |
Distribution fees: | | | | |
Class A | | | 778,320 | |
| |
Class C | | | 302,376 | |
| |
Interest, facilities and maintenance fees | | | 569,044 | |
| |
Transfer agent fees – A, C and Y | | | 374,276 | |
| |
Transfer agent fees – R6 | | | 320 | |
| |
Trustees’ and officers’ fees and benefits | | | 26,889 | |
| |
Registration and filing fees | | | 26,034 | |
| |
Reports to shareholders | | | 30,787 | |
| |
Professional services fees | | | 67,613 | |
| |
Other | | | 37,643 | |
| |
Total expenses | | | 4,234,167 | |
| |
Less: Expense offset arrangement(s) | | | (457 | ) |
| |
Net expenses | | | 4,233,710 | |
| |
Net investment income | | | 14,252,747 | |
| |
|
Realized and unrealized gain (loss) from: | |
Net realized gain (loss) from: | | | | |
Investment securities | | | (1,087,823 | ) |
| |
Futures contracts | | | (783,694 | ) |
| |
| | | (1,871,517 | ) |
| |
Change in net unrealized appreciation of Investment securities | | | 18,463,762 | |
| |
Net realized and unrealized gain | | | 16,592,245 | |
| |
Net increase in net assets resulting from operations | | | $30,844,992 | |
| |
|
See accompanying Notes to Financial Statements which are an integral part of the financial statements. 21 Invesco California Tax-Free Income Fund |
Statement of Changes in Net Assets
For the years ended August 31, 2019 and 2018
| | | | | | | | |
| | | 2019 | | | 2018 | |
| |
Operations: | | | | | | | | |
Net investment income | | $ | 14,252,747 | | | $ | 14,698,223 | |
| |
Net realized gain (loss) | | | (1,871,517 | ) | | | (1,075,869 | ) |
| |
Change in net unrealized appreciation (depreciation) | | | 18,463,762 | | | | (11,749,146 | ) |
| |
Net increase in net assets resulting from operations | | | 30,844,992 | | | | 1,873,208 | |
| |
|
Distributions to shareholders from distributable earnings(1): | |
Class A | | | (10,837,590 | ) | | | (11,286,198 | ) |
| |
Class B | | | – | | | | (74,772 | ) |
| |
Class C | | | (1,168,690 | ) | | | (1,587,707 | ) |
| |
Class Y | | | (1,628,259 | ) | | | (1,664,405 | ) |
| |
Class R6 | | | (459,636 | ) | | | (232,741 | ) |
| |
Total distributions from distributable earnings | | | (14,094,175 | ) | | | (14,845,823 | ) |
| |
|
Share transactions–net: | |
Class A | | | 18,441,202 | | | | (21,912,047 | ) |
| |
Class B | | | – | | | | (6,256,180 | ) |
| |
Class C | | | (6,896,399 | ) | | | (807,095 | ) |
| |
Class Y | | | 495,160 | | | | 1,108,834 | |
| |
Class R6 | | | 2,313,966 | | | | 11,657,490 | |
| |
Net increase (decrease) in net assets resulting from share transactions | | | 14,353,929 | | | | (16,208,998 | ) |
| |
Net increase (decrease) in net assets | | | 31,104,746 | | | | (29,181,613 | ) |
| |
| | |
Net assets: | | | | | | | | |
Beginning of year | | | 413,789,102 | | | | 442,970,715 | |
| |
End of year | | $ | 444,893,848 | | | $ | 413,789,102 | |
| |
| (1) | The Securities and Exchange Commission eliminated the requirement to disclose distribution components separately, except for tax return of capital. For the year ended August 31, 2018, distributions to shareholders from distributable earnings consisted of distributions from net investment income. |
See accompanying Notes to Financial Statements which are an integral part of the financial statements.
|
| 22 Invesco California Tax-Free Income Fund |
Financial Highlights
August 31, 2019
The following schedule presents financial highlights for a share of the Fund outstanding throughout the periods indicated.
| | | | | | | | | | | | | | | | | | | | | | | | | | | | | | | | | | | | | | | | | | | | | | | | | | | | | | | | | | | | | | | | | |
| | | Net asset
value,
beginning
of period | | Net
investment
income(a) | | Net gains
(losses)
on securities
(both
realized and
unrealized) | | Total from
investment
operations | | Dividends
from net
investment
income | | Net asset
value, end
of period | | Total
return (b) | | Net assets,
end of period
(000’s omitted) | | Ratio of
expenses
to average
net assets
with fee waivers
and/or
expenses
absorbed | | Ratio of
expenses
to average net
assets without
fee waivers
and/or
expenses
absorbed | | Supplemental
ratio of
expenses
to average
net assets
with fee waivers
(excluding
interest,
facilities and
maintenance
fees) | | Ratio of net
investment
income
to average
net assets | | Portfolio
turnover (c) |
Class A | | | | | | | | | | | | | | | | | | | | | | | | | | | | | | | | | | | | | | | | | | | | | | | | | | | | | | | | | | | | | | | | | |
Year ended 08/31/19 | | | $ | 11.76 | | | | $ | 0.41 | | | | $ | 0.47 | | | | $ | 0.88 | | | | $ | (0.40 | ) | | | $ | 12.24 | | | | | 7.71 | % | | | $ | 338,797 | | | | | 1.02 | %(d) | | | | 1.02 | %(d) | | | | 0.88 | %(d) | | | | 3.45 | %(d) | | | | 17 | % |
Year ended 08/31/18 | | | | 12.12 | | | | | 0.41 | | | | | (0.35 | ) | | | | 0.06 | | | | | (0.42 | ) | | | | 11.76 | | | | | 0.48 | | | | | 307,176 | | | | | 1.27 | | | | | 1.27 | | | | | 0.92 | | | | | 3.46 | | | | | 18 | |
Year ended 08/31/17 | | | | 12.63 | | | | | 0.45 | | | | | (0.51 | ) | | | | (0.06 | ) | | | | (0.45 | ) | | | | 12.12 | | | | | (0.41 | ) | | | | 338,904 | | | | | 1.02 | | | | | 1.02 | | | | | 0.88 | | | | | 3.70 | | | | | 18 | |
Year ended 08/31/16 | | | | 12.09 | | | | | 0.46 | | | | | 0.54 | | | | | 1.00 | | | | | (0.46 | ) | | | | 12.63 | | | | | 8.37 | | | | | 353,372 | | | | | 0.94 | | | | | 0.94 | | | | | 0.87 | | | | | 3.71 | | | | | 7 | |
Year ended 08/31/15 | | | | 12.15 | | | | | 0.48 | | | | | (0.06 | ) | | | | 0.42 | | | | | (0.48 | ) | | | | 12.09 | | | | | 3.48 | | | | | 300,873 | | | | | 0.91 | | | | | 0.91 | | | | | 0.86 | | | | | 3.94 | | | | | 12 | |
Class C | | | | | | | | | | | | | | | | | | | | | | | | | | | | | | | | | | | | | | | | | | | | | | | | | | | | | | | | | | | | | | | | | |
Year ended 08/31/19 | | | | 11.84 | | | | | 0.35 | | | | | 0.47 | | | | | 0.82 | | | | | (0.34 | ) | | | | 12.32 | | | | | 7.11 | | | | | 44,332 | | | | | 1.52 | (d) | | | | 1.52 | (d) | | | | 1.38 | (d) | | | | 2.95 | (d) | | | | 17 | |
Year ended 08/31/18 | | | | 12.19 | | | | | 0.36 | | | | | (0.35 | ) | | | | 0.01 | | | | | (0.36 | ) | | | | 11.84 | | | | | 0.07 | (e) | | | | 50,017 | | | | | 1.75 | (e) | | | | 1.75 | (e) | | | | 1.40 | (e) | | | | 2.98 | (e) | | | | 18 | |
Year ended 08/31/17 | | | | 12.71 | | | | | 0.39 | | | | | (0.52 | ) | | | | (0.13 | ) | | | | (0.39 | ) | | | | 12.19 | | | | | (0.94 | ) | | | | 52,424 | | | | | 1.52 | | | | | 1.52 | | | | | 1.38 | | | | | 3.20 | | | | | 18 | |
Year ended 08/31/16 | | | | 12.16 | | | | | 0.40 | | | | | 0.54 | | | | | 0.94 | | | | | (0.39 | ) | | | | 12.71 | | | | | 7.88 | | | | | 57,137 | | | | | 1.44 | | | | | 1.44 | | | | | 1.37 | | | | | 3.21 | | | | | 7 | |
Year ended 08/31/15 | | | | 12.23 | | | | | 0.42 | | | | | (0.07 | ) | | | | 0.35 | | | | | (0.42 | ) | | | | 12.16 | | | | | 2.87 | | | | | 28,335 | | | | | 1.41 | | | | | 1.41 | | | | | 1.36 | | | | | 3.44 | | | | | 12 | |
Class Y | | | | | | | | | | | | | | | | | | | | | | | | | | | | | | | | | | | | | | | | | | | | | | | | | | | | | | | | | | | | | | | | | |
Year ended 08/31/19 | | | | 11.81 | | | | | 0.44 | | | | | 0.46 | | | | | 0.90 | | | | | (0.43 | ) | | | | 12.28 | | | | | 7.85 | | | | | 47,414 | | | | | 0.77 | (d) | | | | 0.77 | (d) | | | | 0.63 | (d) | | | | 3.70 | (d) | | | | 17 | |
Year ended 08/31/18 | | | | 12.16 | | | | | 0.44 | | | | | (0.34 | ) | | | | 0.10 | | | | | (0.45 | ) | | | | 11.81 | | | | | 0.83 | | | | | 45,078 | | | | | 1.03 | | | | | 1.03 | | | | | 0.68 | | | | | 3.70 | | | | | 18 | |
Year ended 08/31/17 | | | | 12.68 | | | | | 0.48 | | | | | (0.52 | ) | | | | (0.04 | ) | | | | (0.48 | ) | | | | 12.16 | | | | | (0.24 | ) | | | | 45,285 | | | | | 0.77 | | | | | 0.77 | | | | | 0.63 | | | | | 3.95 | | | | | 18 | |
Year ended 08/31/16 | | | | 12.13 | | | | | 0.49 | | | | | 0.55 | | | | | 1.04 | | | | | (0.49 | ) | | | | 12.68 | | | | | 8.70 | | | | | 39,091 | | | | | 0.69 | | | | | 0.69 | | | | | 0.62 | | | | | 3.96 | | | | | 7 | |
Year ended 08/31/15 | | | | 12.20 | | | | | 0.51 | | | | | (0.07 | ) | | | | 0.44 | | | | | (0.51 | ) | | | | 12.13 | | | | | 3.65 | | | | | 23,698 | | | | | 0.66 | | | | | 0.66 | | | | | 0.61 | | | | | 4.19 | | | | | 12 | |
Class R6 | | | | | | | | | | | | | | | | | | | | | | | | | | | | | | | | | | | | | | | | | | | | | | | | | | | | | | | | | | | | | | | | | |
Year ended 08/31/19 | | | | 11.80 | | | | | 0.45 | | | | | 0.48 | | | | | 0.93 | | | | | (0.44 | ) | | | | 12.29 | | | | | 8.12 | | | | | 14,350 | | | | | 0.67 | (d) | | | | 0.67 | (d) | | | | 0.53 | (d) | | | | 3.80 | (d) | | | | 17 | |
Year ended 08/31/18 | | | | 12.17 | | | | | 0.45 | | | | | (0.37 | ) | | | | 0.08 | | | | | (0.45 | ) | | | | 11.80 | | | | | 0.70 | | | | | 11,518 | | | | | 0.96 | | | | | 0.96 | | | | | 0.61 | | | | | 3.77 | | | | | 18 | |
Year ended 08/31/17(f) | | | | 11.97 | | | | | 0.19 | | | | | 0.21 | | | | | 0.40 | | | | | (0.20 | ) | | | | 12.17 | | | | | 3.40 | | | | | 10 | | | | | 0.81 | (g) | | | | 0.81 | (g) | | | | 0.67 | (g) | | | | 3.91 | (g) | | | | 18 | |
| (a) | Calculated using average shares outstanding. |
| (b) | Includes adjustments in accordance with accounting principles generally accepted in the United States of America and as such, the net asset value for financial reporting purposes and the returns based upon those net asset values may differ from the net asset value and returns for shareholder transactions. Does not include sales charges and is not annualized for periods less than one year, if applicable. |
| (c) | Portfolio turnover is calculated at the fund level and is not annualized for periods less than one year, if applicable. |
| (d) | Ratios are based on average daily net assets (000’s omitted) of $316,311, $40,317, $44,805 and $12,023 for Class A, Class C, Class Y and Class R6 shares, respectively. |
| (e) | The total return, ratio of expenses to average net assets and ratio of net investment income to average net assets reflect actual12b-1 fees of 0.72% for the year ended August 31, 2018. |
| (f) | Commencement date of April 04, 2017. |
See accompanying Notes to Financial Statements which are an integral part of the financial statements.
|
| 23 Invesco California Tax-Free Income Fund |
Notes to Financial Statements
August 31, 2019
NOTE 1–Significant Accounting Policies
Invesco CaliforniaTax-Free Income Fund (the “Fund”) is a series portfolio of AIM Counselor Series Trust (Invesco Counselor Series Trust) (the “Trust”). The Trust is a Delaware statutory trust registered under the Investment Company Act of 1940, as amended (the “1940 Act”), as anopen-end series management investment company authorized to issue an unlimited number of shares of beneficial interest. Information presented in these financial statements pertains only to the Fund. Matters affecting the Fund or each class will be voted on exclusively by the shareholders of the Fund or each class.
The Fund’s investment objective is to provide a high level of current income exempt from federal and California income tax, consistent with the preservation of capital.
The Fund currently consists of four different classes of shares: Class A, Class C, Class Y and Class R6. Class Y shares are available only to certain investors. Class A shares are sold with afront-end sales charge unless certain waiver criteria are met. Under certain circumstances, load waived shares may be subject to contingent deferred sales charges (“CDSC”). Class C shares are sold with a CDSC. Class Y and Class R6 shares are sold at net asset value. Class C shares held for ten years after purchase are eligible for automatic conversion into Class A shares of the same Fund (the “Conversion Feature”). The automatic conversion pursuant to the Conversion Feature will generally occur at the end of the month following the tenth anniversary after a purchase of Class C shares.
The Fund is an investment company and accordingly follows the investment company accounting and reporting guidance in accordance with Financial Accounting Standards Board Accounting Standards Codification Topic 946,Financial Services-Investment Companies.
The following is a summary of the significant accounting policies followed by the Fund in the preparation of its financial statements.
| A. | Security Valuations- Securities, including restricted securities, are valued according to the following policy. |
Securities are fair valued using an evaluated quote provided by an independent pricing service approved by the Board of Trustees. Evaluated quotes provided by the pricing service may be determined without exclusive reliance on quoted prices, and may reflect appropriate factors such asinstitution-size trading in similar groups of securities, developments related to specific securities, dividend rate (for unlisted equities), yield (for debt obligations), quality, type of issue, coupon rate (for debt obligations), maturity (for debt obligations), individual trading characteristics and other market data. Pricing services generally value debt obligations assuming orderly transactions of institutional round lot size, but a fund may hold or transact in the same securities in smaller, odd lot sizes. Odd lots often trade at lower prices than institutional round lots. Debt obligations are subject to interest rate and credit risks. In addition, all debt obligations involve some risk of default with respect to interest and/or principal payments.
A security listed or traded on an exchange (except convertible securities) is valued at its last sales price or official closing price as of the close of the customary trading session on the exchange where the security is principally traded, or lacking any sales or official closing price on a particular day, the security may be valued at the closing bid price on that day. Securities traded in theover-the-counter market are valued based on prices furnished by independent pricing services or market makers. When such securities are valued by an independent pricing service they may be considered fair valued. Futures contracts are valued at the final settlement price set by an exchange on which they are principally traded. Listed options are valued at the mean between the last bid and asked prices from the exchange on which they are principally traded. Options not listed on an exchange are valued by an independent source at the mean between the last bid and asked prices. For purposes of determining net asset value (“NAV”) per share, futures and option contracts generally are valued 15 minutes after the close of the customary trading session of the New York Stock Exchange (“NYSE”).
Securities for which market quotations either are not readily available or became unreliable are valued at fair value as determined in good faith by or under the supervision of the Trust’s officers following procedures approved by the Board of Trustees. Some of the factors which may be considered in determining fair value are fundamental analytical data relating to the investment; the nature and duration of any restrictions on transferability or disposition; trading in similar securities by the same issuer or comparable companies; relevant political, economic or issuer specific news; and other relevant factors under the circumstances.
The Fund may invest in securities that are subject to interest rate risk, meaning the risk that the prices will generally fall as interest rates rise and, conversely, the prices will generally rise as interest rates fall. Specific securities differ in their sensitivity to changes in interest rates depending on their individual characteristics. Changes in interest rates may result in increased market volatility, which may affect the value and/or liquidity of certain Fund investments.
Valuations change in response to many factors including the historical and prospective earnings of the issuer, the value of the issuer’s assets, general economic conditions, interest rates, investor perceptions and market liquidity. Because of the inherent uncertainties of valuation, the values reflected in the financial statements may materially differ from the value received upon actual sale of those investments.
| B. | Securities Transactions and Investment Income- Securities transactions are accounted for on a trade date basis. Realized gains or losses on sales are computed on the basis of specific identification of the securities sold. Interest income (net of withholding tax, if any) is recorded on the accrual basis from settlement date. Bond premiums and discounts are amortized and/or accreted over the lives of the respective securities.Pay-in-kind interest income andnon-cash dividend income received in the form of securitiesin-lieu of cash are recorded at the fair value of the securities received. |
The Fund may periodically participate in litigation related to Fund investments. As such, the Fund may receive proceeds from litigation settlements. Any proceeds received are included in the Statement of Operations as realized gain (loss) for investments no longer held and as unrealized gain (loss) for investments still held.
Brokerage commissions and mark ups are considered transaction costs and are recorded as an increase to the cost basis of securities purchased and/or a reduction of proceeds on a sale of securities. Such transaction costs are included in the determination of net realized and unrealized gain (loss) from investment securities reported in the Statement of Operations and the Statement of Changes in Net Assets and the net realized and unrealized gains (losses) on securities per share in the Financial Highlights. Transaction costs are included in the calculation of the Fund’s net asset value and, accordingly, they reduce the Fund’s total returns. These transaction costs are not considered operating expenses and are not reflected in net investment income reported in the Statement of Operations and the Statement of Changes in Net Assets, or the net
|
| 24 Invesco California Tax-Free Income Fund |
investment income per share and the ratios of expenses and net investment income reported in the Financial Highlights, nor are they limited by any expense limitation arrangements between the Fund and the investment adviser.
The Fund allocates realized and unrealized capital gains and losses to a class based on the relative net assets of each class. The Fund allocates income to a class based on the relative value of the settled shares of each class.
| C. | Country Determination– For the purposes of making investment selection decisions and presentation in the Schedule of Investments, the investment adviser may determine the country in which an issuer is located and/or credit risk exposure based on various factors. These factors include the laws of the country under which the issuer is organized, where the issuer maintains a principal office, the country in which the issuer derives 50% or more of its total revenues and the country that has the primary market for the issuer’s securities, as well as other criteria. Among the other criteria that may be evaluated for making this determination are the country in which the issuer maintains 50% or more of its assets, the type of security, financial guarantees and enhancements, the nature of the collateral and the sponsor organization. Country of issuer and/or credit risk exposure has been determined to be the United States of America, unless otherwise noted. |
| D. | Distributions– Distributions from net investment income, if any, are declared daily and paid monthly. Distributions from net realized capital gain, if any, are generally declared and paid annually and recorded on theex-dividend date. The Fund may elect to treat a portion of the proceeds from redemptions as distributions for federal income tax purposes. |
| E. | Federal Income Taxes– The Fund intends to comply with the requirements of Subchapter M of the Internal Revenue Code of 1986, as amended (the “Internal Revenue Code”), necessary to qualify as a regulated investment company and to distribute substantially all of the Fund’s taxable and tax-exempt earnings to shareholders. As such, the Fund will not be subject to federal income taxes on otherwise taxable income (including net realized capital gain) that is distributed to shareholders. Therefore, no provision for federal income taxes is recorded in the financial statements. |
The Fund recognizes the tax benefits of uncertain tax positions only when the position is more likely than not to be sustained. Management has analyzed the Fund’s uncertain tax positions and concluded that no liability for unrecognized tax benefits should be recorded related to uncertain tax positions. Management is not aware of any tax positions for which it is reasonably possible that the total amounts of unrecognized tax benefits will change materially in the next 12 months.
In addition, the Fund intends to invest in such municipal securities to allow it to qualify to pay shareholders “exempt-interest dividends”, as defined in the Internal Revenue Code.
The Fund files tax returns in the U.S. Federal jurisdiction and certain other jurisdictions. Generally, the Fund is subject to examinations by such taxing authorities for up to three years after the filing of the return for the tax period.
| F. | Expenses– Fees provided for under the Rule12b-1 plan of a particular class of the Fund are charged to the operations of such class. Transfer agency fees and expenses and other shareholder recordkeeping fees and expenses attributable to Class R6 are charged to such class. Transfer agency fees and expenses and other shareholder recordkeeping fees and expenses relating to all other classes are allocated among those classes based on relative net assets. All other expenses are allocated among the classes based on relative net assets. |
| G. | Interest, Facilities and Maintenance Fees– Interest, Facilities and Maintenance Fees include interest and related borrowing costs such as commitment fees, rating and bank agent fees and other expenses associated with lines of credit and Variable Rate Muni Term Preferred Shares (“VMTP Shares”), and interest and administrative expenses related to establishing and maintaining floating rate note obligations, if any. |
| H. | Accounting Estimates– The preparation of financial statements in conformity with accounting principles generally accepted in the United States of America (“GAAP”) requires management to make estimates and assumptions that affect the reported amounts of assets and liabilities at the date of the financial statements and the reported amounts of revenues and expenses during the reporting period including estimates and assumptions related to taxation. Actual results could differ from those estimates by a significant amount. In addition, the Fund monitors for material events or transactions that may occur or become known after theperiod-end date and before the date the financial statements are released to print. |
| I. | Indemnifications– Under the Trust’s organizational documents, each Trustee, officer, employee or other agent of the Trust is indemnified against certain liabilities that may arise out of the performance of their duties to the Fund. Additionally, in the normal course of business, the Fund enters into contracts, including the Fund’s servicing agreements, that contain a variety of indemnification clauses. The Fund’s maximum exposure under these arrangements is unknown as this would involve future claims that may be made against the Fund that have not yet occurred. The risk of material loss as a result of such indemnification claims is considered remote. |
| J. | Floating Rate Note Obligations– The Fund invests in inverse floating rate securities, such as Tender Option Bonds (“TOBs”), for investment purposes and to enhance the yield of the Fund. Such securities may be purchased in the secondary market without first owning an underlying bond but generally are created through the sale of fixed rate bonds by the Fund to special purpose trusts established by a broker dealer or by the Fund (“TOB Trusts”) in exchange for cash and residual interests in the TOB Trusts’ assets and cash flows, which are in the form of inverse floating rate securities. The TOB Trusts finance the purchases of the fixed rate bonds by issuing floating rate notes to third parties and allowing the Fund to retain residual interests in the bonds. The floating rate notes issued by the TOB Trusts have interest rates that reset weekly and the floating rate note holders have the option to tender their notes to the TOB Trusts for redemption at par at each reset date. The residual interests held by the Fund (inverse floating rate securities) include the right of the Fund (1) to cause the holders of the floating rate notes to tender their notes at par at the next interest rate reset date, and (2) to transfer the municipal bond from the TOB Trust to the Fund, thereby collapsing the TOB Trust. Inverse floating rate securities tend to underperform the market for fixed rate bonds in a rising interest rate environment, but tend to outperform the market for fixed rate bonds when interest rates decline or remain relatively stable. |
The Fund generally invests in inverse floating rate securities that include embedded leverage, thus exposing the Fund to greater risks and increased costs. The primary risks associated with inverse floating rate securities are varying degrees of liquidity and decreases in the value of such securities in response to changes in interest rates to a greater extent than fixed rate securities having similar credit quality, redemption provisions and maturity, which may cause the Fund’s net asset value to be more volatile than if it had not invested in inverse floating rate securities. In certain instances, the short-term floating rate notes created by the TOB Trust may not be able to be sold to third parties or, in the case of holders tendering (or putting) such notes for repayment of principal, may not be able to be remarketed to third parties. In such cases, the TOB Trust holding the fixed rate bonds may be collapsed with the entity that contributed the fixed rate bonds to the TOB Trust. In the case where a TOB Trust is collapsed with the Fund, the Fund will be required to repay the principal amount of the tendered securities, which may require the Fund to sell other portfolio holdings to raise cash to meet that obligation. The Fund could therefore be required to sell other portfolio holdings at a
|
| 25 Invesco California Tax-Free Income Fund |
disadvantageous time or price to raise cash to meet this obligation, which risk will be heightened during times of market volatility, illiquidity or uncertainty. The embedded leverage in the TOB Trust could cause the Fund to lose more money than the value of the asset it has contributed to the TOB Trust and greater levels of leverage create the potential for greater losses. In addition, a Fund may enter into reimbursement agreements with the liquidity provider of certain TOB transactions in connection with certain residuals held by the Fund. These agreements commit a Fund to reimburse the liquidity provider to the extent that the liquidity provider must provide cash to a TOB Trust, including following the termination of a TOB Trust resulting from a mandatory tender event (“liquidity shortfall”). The reimbursement agreement will effectively make the Fund liable for the amount of the negative difference, if any, between the liquidation value of the underlying security and the purchase price of the floating rate notes issued by the TOB Trust.
The Fund accounts for the transfer of fixed rate bonds to the TOB Trusts as secured borrowings, with the securities transferred remaining in the Fund’s investment assets, and the related floating rate notes reflected as Fund liabilities under the captionFloating rate note obligations on the Statement of Assets and Liabilities. The carrying amount of the Fund’s floating rate note obligations as reported on the Statement of Assets and Liabilities approximates its fair value. The Fund records the interest income from the fixed rate bonds under the caption Interest and records the expenses related to floating rate obligations and any administrative expenses of the TOB Trusts as a component ofInterest, facilities andmaintenance fees on the Statement of Operations.
Final rules implementing section 619 of the Dodd-Frank Wall Street Reform and Consumer Protection Act (the “Volcker Rule”) prohibit banking entities from engaging in proprietary trading of certain instruments and limit such entities’ investments in, and relationships with, “covered funds”, as defined in the rules. These rules preclude banking entities and their affiliates from sponsoring and/or providing services for existing TOB Trusts. A new TOB structure is being utilized by the Fund wherein the Fund, as holder of the residuals, will perform certain duties previously performed by banking entities as “sponsors” of TOB Trusts. These duties may be performed by a third-party service provider. The Fund’s expanded role under the new TOB structure may increase its operational and regulatory risk. The new structure is substantially similar to the previous structure; however, pursuant to the Volcker Rule, the remarketing agent would not be able to repurchase tendered floaters for its own account upon a failed remarketing. In the event of a failed remarketing, a banking entity serving as liquidity provider may loan the necessary funds to the TOB Trust to purchase the tendered floaters. The TOB Trust, not the Fund, would be the borrower and the loan from the liquidity provider will be secured by the purchased floaters now held by the TOB Trust. However, as previously described, the Fund would bear the risk of loss with respect to any liquidity shortfall to the extent it entered into a reimbursement agreement with the liquidity provider.
Further, the SEC and various banking agencies have adopted rules implementing credit risk retention requirements for asset-backed securities (the “Risk Retention Rules”). The Risk Retention Rules require the sponsor of a TOB Trust to retain at least 5% of the credit risk of the underlying assets supporting the TOB Trust’s municipal bonds. The Fund has adopted policies intended to comply with the Risk Retention Rules. The Risk Retention Rules may adversely affect the Fund’s ability to engage in TOB Trust transactions or increase the costs of such transactions in certain circumstances.
There can be no assurances that the new TOB structure will continue to be a viable form of leverage. Further, there can be no assurances that alternative forms of leverage will be available to the Fund in order to maintain current levels of leverage. Any alternative forms of leverage may be less advantageous to the Fund, and may adversely affect the Fund’s net asset value, distribution rate and ability to achieve its investment objective.
TOBs are presently classified as private placement securities. Private placement securities are subject to restrictions on resale because they have not been registered under the Securities Act of 1933, as amended (the “1933 Act”), or are otherwise not readily marketable. As a result of the absence of a public trading market for these securities, they may be less liquid than publicly traded securities. Although atypical, these securities may be resold in privately negotiated transactions, the prices realized from these sales could be less than those originally paid by the Fund or less than what may be considered the fair value of such securities.
| K. | Futures Contracts– The Fund may enter into futures contracts to manage exposure to interest rate, equity and market price movements and/or currency risks. A futures contract is an agreement between two parties (“Counterparties”) to purchase or sell a specified underlying security, currency or commodity (or delivery of a cash settlement price, in the case of an index future) for a fixed price at a future date. The Fund currently invests only in exchange-traded futures and they are standardized as to maturity date and underlying financial instrument. Initial margin deposits required upon entering into futures contracts are satisfied by the segregation of specific securities or cash as collateral at the futures commission merchant (broker). During the period the futures contracts are open, changes in the value of the contracts are recognized as unrealized gains or losses by recalculating the value of the contracts on a daily basis. Subsequent or variation margin payments are received or made depending upon whether unrealized gains or losses are incurred. These amounts are reflected as receivables or payables on the Statement of Assets and Liabilities. When the contracts are closed or expire, the Fund recognizes a realized gain or loss equal to the difference between the proceeds from, or cost of, the closing transaction and the Fund’s basis in the contract. The net realized gain (loss) and the change in unrealized gain (loss) on futures contracts held during the period is included on the Statement of Operations. The primary risks associated with futures contracts are market risk and the absence of a liquid secondary market. If the Fund were unable to liquidate a futures contract and/or enter into an offsetting closing transaction, the Fund would continue to be subject to market risk with respect to the value of the contracts and continue to be required to maintain the margin deposits on the futures contracts. Futures contracts have minimal Counterparty risk since the exchange’s clearinghouse, as Counterparty to all exchange-traded futures, guarantees the futures against default. Risks may exceed amounts recognized in the Statement of Assets and Liabilities. |
| L. | Other Risks –The value of, payment of interest on, repayment of principal for and the ability to sell a municipal security may be affected by constitutional amendments, legislative enactments, executive orders, administrative regulations, voter initiatives and the economics of the regions in which the issuers are located. |
Since many municipal securities are issued to finance similar projects, especially those relating to education, health care, transportation and utilities, conditions in those sectors can affect the overall municipal securities market and the Fund’s investments in municipal securities.
There is some risk that a portion or all of the interest received from certaintax-free municipal securities could become taxable as a result of determinations by the Internal Revenue Service.
|
| 26 Invesco California Tax-Free Income Fund |
NOTE 2–Advisory Fees and Other Fees Paid to Affiliates
The Trust has entered into a master investment advisory agreement with Invesco Advisers, Inc. (the “Adviser” or “Invesco”). Under the terms of the investment advisory agreement, the Fund accrues daily and pays monthly an advisory fee to the Adviser based on the annual rate of the Fund’s average daily net assets as follows:
| | | | | |
| |
| Average Daily Net Assets | | | | Rate | |
First $ 500 million | | | | 0.47% | |
Next $250 million | | | | 0.445% | |
Next $250 million | | | | 0.42% | |
Next $250 million | | | | 0.395% | |
Over $1.25 billion | | | | 0.37% | |
For the year ended August 31, 2019, the effective advisory fees incurred by the Fund was 0.47%.
Under the terms of a mastersub-advisory agreement between the Adviser and each of Invesco Asset Management Deutschland GmbH, Invesco Asset Management Limited, Invesco Asset Management (Japan) Limited, Invesco Hong Kong Limited, Invesco Senior Secured Management, Inc. and Invesco Canada Ltd. (collectively, the “AffiliatedSub-Advisers”) the Adviser, not the Fund, will pay 40% of the fees paid to the Adviser to any such AffiliatedSub-Adviser(s) that provide(s) discretionary investment management services to the Fund based on the percentage of assets allocated to such AffiliatedSub-Adviser(s).
The Adviser has contractually agreed, through at least June 30, 2020, to waive advisory fees and/or reimburse expenses to the extent necessary to limit total annual fund operating expenses and/or reimbursement (excluding certain items discussed below) of Class A, Class C, Class Y and Class R6 shares to 1.50%, 2.00%, 1.25% and 1.25%, respectively, of the Fund’s average daily net assets (the “expense limits”). In determining the Adviser’s obligation to waive advisory fees and/or reimburse expenses, the following expenses are not taken into account, and could cause the net annual fund operating expenses and/or reimbursement to exceed the numbers reflected above: (1) interest, facilities and maintenance fees; (2) taxes; (3) dividend expense on short sales; (4) extraordinary ornon-routine items, including litigation expenses; and (5) expenses that the Fund has incurred but did not actually pay because of an expense offset arrangement. Unless Invesco continues the fee waiver agreement, it will terminate on June 30, 2020. During its term, the fee waiver agreement cannot be terminated or amended to increase the expense limits or reduce the advisory fee waivers without approval of the Board of Trustees. The Adviser did not waive fees and/or reimburse expenses during the period under this expense limit.
The Trust has entered into a master administrative services agreement with Invesco pursuant to which the Fund has agreed to pay Invesco for certain administrative costs incurred in providing accounting services to the Fund. For the year ended August 31, 2019, expenses incurred under the agreement are shown in the Statement of Operations asAdministrative services fees. Also, Invesco has entered into asub-administration agreement whereby State Street Bank and Trust Company (“SSB”) serves as custodian and fund accountant and provides certain administrative services to the Fund.
The Trust has entered into a transfer agency and service agreement with Invesco Investment Services, Inc. (“IIS”) pursuant to which the Fund has agreed to pay IIS a fee for providing transfer agency and shareholder services to the Fund and reimburse IIS for certain expenses incurred by IIS in the course of providing such services. IIS may make payments to intermediaries that provide omnibus account services,sub-accounting services and/or networking services. All fees payable by IIS to intermediaries that provide omnibus account services orsub-accounting services are charged back to the Fund, subject to certain limitations approved by the Trust’s Board of Trustees. For the year ended August 31, 2019, expenses incurred under the agreement are shown in the Statement of Operations asTransfer agent fees.
Shares of the Fund are distributed by Invesco Distributors, Inc. (“IDI”), an affiliate of the Adviser. The Fund has adopted a Plan of Distribution (the “Plan”) pursuant to Rule12b-1 under the 1940 Act. The Plan provides that the Fund will reimburse IDI for distribution related expenses that IDI incurs up to a maximum of the following annual rates: (1) Class A – up to 0.25% of the average daily net assets of Class A shares; and (2) Class C – up to 0.75% of the average daily net assets of Class C shares. The fees are accrued daily and paid monthly. For the year ended August 31, 2019, expenses incurred under these agreements are shown in the Statement of Operations asDistribution fees.
Front-end sales commissions and CDSC (collectively, the “sales charges”) are not recorded as expenses of the Fund.Front-end sales commissions are deducted from proceeds from the sales of Fund shares prior to investment in Class A shares of the Fund. CDSC are deducted from redemption proceeds prior to remittance to the shareholder. During the year ended August 31, 2019, IDI advised the Fund that IDI retained $24,778 infront-end sales commissions from the sale of Class A shares and $8,735 and $410 from Class A and Class C shares, respectively, for CDSC imposed upon redemptions by shareholders.
Certain officers and trustees of the Trust are officers and directors of the Adviser, IIS and/or IDI.
NOTE 3–Additional Valuation Information
GAAP defines fair value as the price that would be received to sell an asset or paid to transfer a liability in an orderly transaction between market participants at the measurement date, under current market conditions. GAAP establishes a hierarchy that prioritizes the inputs to valuation methods, giving the highest priority to readily available unadjusted quoted prices in an active market for identical assets (Level 1) and the lowest priority to significant unobservable inputs (Level 3), generally when market prices are not readily available or are unreliable. Based on the valuation inputs, the securities or other investments are tiered into one of three levels. Changes in valuation methods may result in transfers in or out of an investment’s assigned level:
| | |
| Level 1 – | | Prices are determined using quoted prices in an active market for identical assets. |
| Level 2 – | | Prices are determined using other significant observable inputs. Observable inputs are inputs that other market participants may use in pricing a security. These may include quoted prices for similar securities, interest rates, prepayment speeds, credit risk, yield curves, loss severities, default rates, discount rates, volatilities and others. |
| Level 3 – | | Prices are determined using significant unobservable inputs. In situations where quoted prices or observable inputs are unavailable (for example, when there is little or no market activity for an investment at the end of the period), unobservable inputs may be used. |
|
| 27 Invesco California Tax-Free Income Fund |
| | Unobservable inputs reflect the Fund’s own assumptions about the factors market participants would use in determining fair value of the securities or instruments and would be based on the best available information. |
As of August 31, 2019, all of the securities in this Fund were valued based on Level 2 inputs (see the Schedule of Investments for security categories). The level assigned to the securities valuations may not be an indication of the risk or liquidity associated with investing in those securities. Because of the inherent uncertainties of valuation, the values reflected in the financial statements may materially differ from the value received upon actual sale of those investments.
NOTE 4–Derivative Investments
The Fund may enter into an International Swaps and Derivatives Association Master Agreement (“ISDA Master Agreement”) under which a fund may trade OTC derivatives. An OTC transaction entered into under an ISDA Master Agreement typically involves a collateral posting arrangement, payment netting provisions andclose-out netting provisions. These netting provisions allow for reduction of credit risk through netting of contractual obligations. The enforceability of the netting provisions of the ISDA Master Agreement depends on the governing law of the ISDA Master Agreement, among other factors.
For financial reporting purposes, the Fund does not offset OTC derivative assets or liabilities that are subject to ISDA Master Agreements in the Statement of Assets and Liabilities.
Effect of Derivative Investments for the year ended August 31, 2019
The table below summarizes the gains (losses) on derivative investments, detailed by primary risk exposure, recognized in earnings during the period:
| | | | | |
| | | Location of Gain (Loss) on
Statement of Operations |
| | | Interest Rate Risk |
Realized Gain (Loss): | | | | | |
Futures contracts | | | $ | (783,694 | ) |
The table below summarizes the average notional value of derivatives held during the period.
| | | | | |
| | | Futures
Contracts |
Average notional value | | | $ | 17,097,338 | |
NOTE 5–Security Transactions with Affiliated Funds
The Fund is permitted to purchase or sell securities from or to certain other Invesco Funds under specified conditions outlined in procedures adopted by the Board of Trustees of the Trust. The procedures have been designed to ensure that any purchase or sale of securities by the Fund from or to another fund or portfolio that is or could be considered an affiliate by virtue of having a common investment adviser (or affiliated investment advisers), common Trustees and/or common officers complies with Rule17a-7 of the 1940 Act. Further, as defined under the procedures, each transaction is effected at the current market price. Pursuant to these procedures, for the year ended August 31, 2019, the Fund engaged in securities purchases of $29,065,325 and securities sales of $26,064,746, which did not result in any net realized gains (losses).
NOTE 6–Expense Offset Arrangement(s)
The expense offset arrangement is comprised of transfer agency credits which result from balances in demand deposit accounts used by the transfer agent for clearing shareholder transactions. For the year ended August 31, 2019, the Fund received credits from this arrangement, which resulted in the reduction of the Fund’s total expenses of $457.
NOTE 7–Trustees’ and Officers’ Fees and Benefits
Trustees’ and Officers’ Fees and Benefits include amounts accrued by the Fund to pay remuneration to certain Trustees and Officers of the Fund. Trustees have the option to defer compensation payable by the Fund, andTrustees’ andOfficers’ Fees and Benefits also include amounts accrued by the Fund to fund such deferred compensation amounts. Those Trustees who defer compensation have the option to select various Invesco Funds in which their deferral accounts shall be deemed to be invested. Finally, certain current Trustees were eligible to participate in a retirement plan that provided for benefits to be paid upon retirement to Trustees over a period of time based on the number of years of service. The Fund may have certain former Trustees who also participate in a retirement plan and receive benefits under such plan.Trustees’ andOfficers’ Fees and Benefits include amounts accrued by the Fund to fund such retirement benefits. Obligations under the deferred compensation and retirement plans represent unsecured claims against the general assets of the Fund.
NOTE 8–Cash Balances and Borrowings
The Fund is permitted to temporarily carry a negative or overdrawn balance in its account with SSB, the custodian bank. Such balances, if any atperiod-end, are shown in the Statement of Assets and Liabilities under the payable captionAmount due custodian. To compensate the custodian bank for such overdrafts, the overdrawn Fund may either (1) leave funds as a compensating balance in the account so the custodian bank can be compensated by earning the additional interest; or (2) compensate by paying the custodian bank at a rate agreed upon by the custodian bank and Invesco, not to exceed the contractually agreed upon rate. The Fund may not purchase additional securities when any borrowings from banks or broker-dealers exceed 5% of the Fund’s total assets, or when any borrowings from an Invesco Fund are outstanding.
|
| 28 Invesco California Tax-Free Income Fund |
Inverse floating rate obligations resulting from the transfer of bonds to TOB Trusts are accounted for as secured borrowings. The average floating rate notes outstanding and average annual interest and fee rate related to inverse floating rate note obligations during the year ended August 31, 2019 were $44,708,077 and 1.27%, respectively.
NOTE 9–Distributions to Shareholders and Tax Components of Net Assets
Tax Character of Distributions to Shareholders Paid During the Fiscal Years Ended August 31, 2019 and August 31, 2018
| | | | | | | | |
| | | 2019 | | | 2018 | |
| |
Ordinary income | | $ | 14,094,175 | | | $ | 14,845,823 | |
| |
Tax Components of Net Assets atPeriod-End:
| | | | |
| | | 2019 | |
| |
Undistributedtax-exempt income | | $ | 321,654 | |
| |
Net unrealized appreciation – investments | | | 42,930,679 | |
| |
Temporary book/tax differences | | | (110,404 | ) |
| |
Capital loss carryforward | | | (14,703,163 | ) |
| |
Shares of beneficial interest | | | 416,455,082 | |
| |
Total net assets | | $ | 444,893,848 | |
| |
The difference between book-basis andtax-basis unrealized appreciation (depreciation) is due to differences in the timing of recognition of gains and losses on investments for tax and book purposes. The Fund’s net unrealized appreciation (depreciation) difference is attributable primarily to TOBs, accretion of bond discount differences and wash sales.
The temporary book/tax differences are a result of timing differences between book and tax recognition of income and/or expenses. The Fund’s temporary book/tax differences are the result of the trustee deferral of compensation and retirement plan benefits.
Capital loss carryforward is calculated and reported as of a specific date. Results of transactions and other activity after that date may affect the amount of capital loss carryforward actually available for the Fund to utilize. Capital losses generated in years beginning after December 22, 2010 can be carried forward for an unlimited period, whereas previous losses expire in eight tax years. Capital losses with an expiration period may not be used to offset capital gains until all net capital losses without an expiration date have been utilized. Capital loss carryforwards with no expiration date will retain their character as either short-term or long-term capital losses instead of as short-term capital losses as under prior law. The ability to utilize capital loss carryforwards in the future may be limited under the Internal Revenue Code and related regulations based on the results of future transactions.
The Fund has a capital loss carryforward as of August 31, 2019, as follows:
| | | | | | | | | | | | |
| Capital Loss Carryforward* | |
| |
| Expiration | | Short-Term | | | Long-Term | | | Total | |
| |
Not subject to expiration | | $ | 6,736,518 | | | $ | 7,966,645 | | | $ | 14,703,163 | |
| |
| * | Capital loss carryforwards as of the date listed above is reduced for limitations, if any, to the extent required by the Internal Revenue Code and may be further limited depending upon a variety of factors, including the realization of net unrealized gains or losses as of the date of any reorganization. |
NOTE 10–Investment Transactions
The aggregate amount of investment securities (other than short-term securities, U.S. Treasury obligations and money market funds, if any) purchased and sold by the Fund during the year ended August 31, 2019 was $75,439,272 and $82,873,037, respectively. Cost of investments, including any derivatives, on a tax basis includes the adjustments for financial reporting purposes as of the most recently completed federal income tax reportingperiod-end.
| | | | |
| Unrealized Appreciation (Depreciation) of Investments on a Tax Basis | |
| |
Aggregate unrealized appreciation of investments | | $ | 44,333,026 | |
| |
Aggregate unrealized (depreciation) of investments | | | (1,402,347 | ) |
| |
Net unrealized appreciation of investments | | $ | 42,930,679 | |
| |
Cost of investments for tax purposes is $434,066,260.
NOTE 11–Reclassification of Permanent Differences
Primarily as a result of differing book/tax treatment of expired capital loss carryforward, on August 31, 2019, undistributed net investment income was decreased by $79,916, undistributed net realized gain (loss) was increased by $1,923,607 and shares of beneficial interest was decreased by $1,843,691. This reclassification had no effect on the net assets of the Fund.
|
| 29 Invesco California Tax-Free Income Fund |
NOTE 12–Share Information
| | | | | | | | | | | | | | | | |
| | | Summary of Share Activity | |
| |
| | | Years ended August 31, | |
| | | | |
| | | 2019(a) | | | 2018 | |
| | | | | | | | |
| | | Shares | | | Amount | | | Shares | | | Amount | |
| |
Sold: | |
Class A | | | 4,000,251 | | | $ | 47,078,118 | | | | 2,499,917 | | | $ | 29,773,939 | |
| |
Class B(b) | | | - | | | | - | | | | 2 | | | | 23 | |
| |
Class C | | | 1,645,859 | | | | 19,721,627 | | | | 1,412,191 | | | | 16,962,855 | |
| |
Class Y | | | 1,499,545 | | | | 17,698,899 | | | | 1,598,496 | | | | 19,122,183 | |
| |
Class R6 | | | 601,650 | | | | 7,116,777 | | | | 1,102,949 | | | | 13,173,581 | |
| |
| | | | |
Issued as reinvestment of dividends: | | | | | | | | | | | | | | | | |
Class A | | | 545,922 | | | | 6,434,972 | | | | 601,520 | | | | 7,139,093 | |
| |
Class B(b) | | | - | | | | - | | | | 2,711 | | | | 32,853 | |
| |
Class C | | | 65,281 | | | | 773,478 | | | | 89,874 | | | | 1,073,253 | |
| |
Class Y | | | 77,828 | | | | 922,154 | | | | 71,708 | | | | 854,632 | |
| |
Class R6 | | | 27,638 | | | | 327,286 | | | | 15,319 | | | | 181,167 | |
| |
| | | | |
Conversion of Class B shares to Class A shares:(c) | | | | | | | | | | | | | | | | |
Class A | | | - | | | | - | | | | 353,611 | | | | 4,215,042 | |
| |
Class B | | | - | | | | - | | | | (347,895 | ) | | | (4,215,042 | ) |
| |
| | | | |
Automatic conversion of Class C shares to Class A shares: | | | | | | | | | | | | | | | | |
Class A | | | 1,434,710 | | | | 16,662,817 | | | | - | | | | - | |
| |
Class C | | | (1,426,104 | ) | | | (16,662,817 | ) | | | - | | | | - | |
| |
| | | | |
Reacquired: | | | | | | | | | | | | | | | | |
Class A | | | (4,405,048 | ) | | | (51,734,705 | ) | | | (5,308,093 | ) | | | (63,040,121 | ) |
| |
Class B(b) | | | - | | | | - | | | | (173,722 | ) | | | (2,074,014 | ) |
| |
Class C | | | (910,449 | ) | | | (10,728,687 | ) | | | (1,576,923 | ) | | | (18,843,203 | ) |
| |
Class Y | | | (1,533,560 | ) | | | (18,125,893 | ) | | | (1,575,593 | ) | | | (18,867,981 | ) |
| |
Class R6 | | | (437,384 | ) | | | (5,130,097 | ) | | | (143,404 | ) | | | (1,697,258 | ) |
| |
Net increase (decrease) in share activity | | | 1,186,139 | | | $ | 14,353,929 | | | | (1,377,332 | ) | | $ | (16,208,998 | ) |
| |
| (a) | There are entities that are record owners of more than 5% of the outstanding shares of the Fund and in the aggregate own 60% of the outstanding shares of the Fund. IDI has an agreement with these entities to sell Fund shares. The Fund, Invesco and/or Invesco affiliates may make payments to these entities, which are considered to be related to the Fund, for providing services to the Fund, Invesco and/or Invesco affiliates including but not limited to services such as securities brokerage, distribution, third party record keeping and account servicing. The Fund has no knowledge as to whether all or any portion of the shares owned of record by these entities are also owned beneficially. |
| (b) | Class B shares activity for the period September 1, 2017 through January 26, 2018 (date of conversion). |
| (c) | Effective as of the close of business January 26, 2018, all outstanding Class B shares were converted to Class A shares. |
|
| 30 Invesco California Tax-Free Income Fund |
Report of Independent Registered Public Accounting Firm
To the Board of Trustees of AIM Counselor Series Trust (Invesco Counselor Series Trust) and Shareholders of Invesco CaliforniaTax-Free Income Fund
Opinion on the Financial Statements
We have audited the accompanying statement of assets and liabilities, including the schedule of investments, of Invesco CaliforniaTax-Free Income Fund (one of the funds constituting AIM Counselor Series Trust (Invesco Counselor Series Trust), hereafter referred to as the “Fund”) as of August 31, 2019, the related statement of operations for the year ended August 31, 2019, the statement of changes in net assets for each of the two years in the period ended August 31, 2019, including the related notes, and the financial highlights for each of the periods indicated therein (collectively referred to as the “financial statements”). In our opinion, the financial statements present fairly, in all material respects, the financial position of the Fund as of August 31, 2019, the results of its operations for the year then ended, the changes in its net assets for each of the two years in the period ended August 31, 2019 and the financial highlights for each of the periods indicated therein in conformity with accounting principles generally accepted in the United States of America.
Basis for Opinion
These financial statements are the responsibility of the Fund’s management. Our responsibility is to express an opinion on the Fund’s financial statements based on our audits. We are a public accounting firm registered with the Public Company Accounting Oversight Board (United States) (PCAOB) and are required to be independent with respect to the Fund in accordance with the U.S. federal securities laws and the applicable rules and regulations of the Securities and Exchange Commission and the PCAOB.
We conducted our audits of these financial statements in accordance with the standards of the PCAOB. Those standards require that we plan and perform the audit to obtain reasonable assurance about whether the financial statements are free of material misstatement, whether due to error or fraud.
Our audits included performing procedures to assess the risks of material misstatement of the financial statements, whether due to error or fraud, and performing procedures that respond to those risks. Such procedures included examining, on a test basis, evidence regarding the amounts and disclosures in the financial statements. Our audits also included evaluating the accounting principles used and significant estimates made by management, as well as evaluating the overall presentation of the financial statements. Our procedures included confirmation of securities owned as of August 31, 2019 by correspondence with the custodian and brokers. We believe that our audits provide a reasonable basis for our opinion.
/s/ PricewaterhouseCoopers LLP
Houston, Texas
October 29, 2019
We have served as the auditor of one or more of the investment companies in the Invesco group of investment companies since at least 1995. We have not been able to determine the specific year we began serving as auditor.
|
| 31 Invesco California Tax-Free Income Fund |
Calculating your ongoing Fund expenses
Example
As a shareholder of the Fund, you incur two types of costs: (1) transaction costs, which may include sales charges (loads) on purchase payments or contingent deferred sales charges on redemptions, if any; and (2) ongoing costs, including management fees, distribution and/or service(12b-1) fees, and other Fund expenses. This example is intended to help you understand your ongoing costs (in dollars) of investing in the Fund and to compare these costs with ongoing costs of investing in other mutual funds. The example is based on an investment of $1,000 invested at the beginning of the period and held for the entire period March 1, 2019 through August 31, 2019.
Actual expenses
The table below provides information about actual account values and actual expenses. You may use the information in this table, together with the amount you invested, to estimate the expenses that you paid over the period. Simply divide your account value by $1,000 (for example, an $8,600 account value divided by $1,000 = 8.6), then multiply the result by the number in the table under the heading entitled “Actual Expenses Paid During Period” to estimate the expenses you paid on your account during this period.
Hypothetical example for comparison purposes
The table below also provides information about hypothetical account values and hypothetical expenses based on the Fund’s actual expense ratio and an assumed rate of return of 5% per year before expenses, which is not the Fund’s actual return.
The hypothetical account values and expenses may not be used to estimate the actual ending account balance or expenses you paid for the period. You may use this information to compare the ongoing costs of investing in the Fund and other funds. To do so, compare this 5% hypothetical example with the 5% hypothetical examples that appear in the shareholder reports of the other funds.
Please note that the expenses shown in the table are meant to highlight your ongoing costs only and do not reflect any transaction costs, such as sales charges (loads) on purchase payments or contingent deferred sales charges on redemptions, if any. Therefore, the hypothetical information is useful in comparing ongoing costs only, and will not help you determine the relative total costs of owning different funds. In addition, if these transaction costs were included, your costs would have been higher.
| | | | | | | | | | | | | | | | | | | | | | | | |
| | | | | | ACTUAL | | | HYPOTHETICAL (5% annual return before expenses) | | | Annualized
Expense Ratio | |
| | Beginning
Account Value
(03/01/19) | | | Ending
Account Value
(08/31/19)1 | | | Expenses
Paid During
Period2 | | | Ending
Account Value
(08/31/19) | | | Expenses
Paid During
Period2 | |
| Class A | | | $1,000.00 | | | | $1,066.10 | | | | $4.43 | | | | $1,020.92 | | | | $4.33 | | | | 0.85% | |
| Class C | | | 1,000.00 | | | | 1,063.00 | | | | 7.02 | | | | 1,018.40 | | | | 6.87 | | | | 1.35 | |
| Class Y | | | 1,000.00 | | | | 1,067.20 | | | | 3.13 | | | | 1,022.18 | | | | 3.06 | | | | 0.60 | |
| Class R6 | | | 1,000.00 | | | | 1,067.60 | | | | 2.66 | | | | 1,022.63 | | | | 2.60 | | | | 0.51 | |
| 1 | The actual ending account value is based on the actual total return of the Fund for the period March 1, 2019 through August 31, 2019, after actual expenses and will differ from the hypothetical ending account value which is based on the Fund’s expense ratio and a hypothetical annual return of 5% before expenses. |
| 2 | Expenses are equal to the Fund’s annualized expense ratio as indicated above multiplied by the average account value over the period, multiplied by 184/365 to reflect the most recent fiscal half year. |
|
| 32 Invesco California Tax-Free Income Fund |
Approval of Investment Advisory andSub-Advisory Contracts
At meetings held on June 10, 2019, the Board of Trustees (the Board or the Trustees) of AIM Counselor Series Trust (Invesco Counselor Series Trust) as a whole, and the independent Trustees, who comprise over 75% of the Board, voting separately, approved the continuance of the Invesco CaliforniaTax-Free Income Fund’s (the Fund) Master Investment Advisory Agreement with Invesco Advisers, Inc. (Invesco Advisers and the investment advisory agreement) and the Master IntergroupSub-Advisory Contract for Mutual Funds with Invesco Asset Management Deutschland GmbH, Invesco Asset Management Limited, Invesco Asset Management (Japan) Limited, Invesco Hong Kong Limited, Invesco Senior Secured Management, Inc. and Invesco Canada Ltd. (collectively, the AffiliatedSub-Advisers and thesub-advisory contracts) for another year, effective July 1, 2019. After evaluating the factors discussed below, among others, the Board approved the renewal of the Fund’s investment advisory agreement and thesub-advisory contracts and determined that the compensation payable by the Fund to Invesco Advisers and by Invesco Advisers to the AffiliatedSub-Advisers is fair and reasonable.
The Board’s Evaluation Process
The Board’s Investments Committee has established threeSub-Committees, which meet throughout the year to review the performance of funds advised by Invesco Advisers (the Invesco Funds). As part of a regularly scheduled basis ofin-person Board meetings, theSub-Committees meet with portfolio managers for their assigned Invesco Funds and other members of management to review detailed information about investment performance and portfolio attributes of these funds. The Board took into account evaluations and reports that it received from the Investments Committee andSub-Committees, as well as the information provided to such committees and the Board throughout the year, in considering whether to approve each Invesco Fund’s investment advisory agreement andsub-advisory contracts.
As part of the contract renewal process, the Board reviews and considers information provided in response to detailed requests for information submitted to management by the independent Trustees with assistance from legal counsel to the independent Trustees. The Board receives comparative investment performance and fee data regarding the Invesco Funds prepared by Invesco Advisers and Broadridge Financial Solutions, Inc. (Broadridge), an independent mutual fund data provider. The Board also receives an independent written evaluation from the Senior Officer, an officer of the Invesco Funds who reports directly to the independent Trustees. The Senior Officer’s evaluation is prepared as part of his responsibility to manage the process by which
the Invesco Funds’ proposed management fees are negotiated during the annual contract renewal process to ensure they are negotiated in a manner that is at arms’ length and reasonable. In addition to meetings with Invesco Advisers and fund counsel throughout the year, the independent Trustees also discuss the continuance of the investment advisory agreement andsub-advisory contracts in separate sessions with the Senior Officer and with independent legal counsel.
The discussion below is a summary of the Senior Officer’s independent written evaluation with respect to the Fund’s investment advisory agreement, as well as a discussion of the material factors and related conclusions that formed the basis for the Board’s approval of the Fund’s investment advisory agreement andsub-advisory contracts. The Trustees’ review and conclusions are based on the comprehensive consideration of all information presented to them during the course of the year and in prior years and are not the result of any single determinative factor. Moreover, one Trustee may have weighed a particular piece of information or factor differently than another Trustee. This information is current as of June 10, 2019.
Factors and Conclusions and Summary of Independent Written Fee Evaluation
| A. | Nature, Extent and Quality of Services Provided by Invesco Advisers and the AffiliatedSub-Advisers |
The Board reviewed the nature, extent and quality of the advisory services provided to the Fund by Invesco Advisers under the Fund’s investment advisory agreement, and the credentials and experience of the officers and employees of Invesco Advisers who provide these services, including the Fund’s portfolio manager(s). The Board’s review included consideration of Invesco Advisers’ investment process oversight and structure, credit analysis and investment risk management. The Board also considerednon-advisory services that Invesco Advisers and its affiliates provide to the Invesco Funds such as various back office support functions, third party oversight, internal audit, valuation, portfolio trading and legal and compliance. The Board also received and reviewed information about Invesco Advisers’ role as administrator of the Invesco Funds’ liquidity risk management program. The Board also reviewed and considered the benefits to shareholders of investing in a fund that is part of the Invesco family of funds under the umbrella of Invesco Ltd., Invesco Advisers’ parent company, and noted Invesco Ltd.’s depth and experience in conducting an investment management business, as well as its commitment of financial and other resources to such business. The Board reviewed and considered information about the resources
that Invesco Advisers intends to continue to commit to managing the Invesco family of funds following Invesco Ltd.’s acquisition of OppenheimerFunds, Inc. and its subsidiaries. The Board concluded that the nature, extent and quality of the services provided to the Fund by Invesco Advisers are appropriate and satisfactory.
The Board reviewed the services that may be provided by the AffiliatedSub-Advisers under thesub-advisory contracts and the credentials and experience of the officers and employees of the AffiliatedSub-Advisers who provide these services. The Board noted the AffiliatedSub-Advisers’ expertise with respect to certain asset classes and that the AffiliatedSub-Advisers have offices and personnel that are located in financial centers around the world. As a result, the Board noted that the AffiliatedSub-Advisers can provide research and investment analysis on the markets and economies of various countries in which the Fund may invest, make recommendations regarding securities and assist with security trades. The Board concluded that thesub-advisory contracts may benefit the Fund and its shareholders by permitting Invesco Advisers to use the resources and talents of the AffiliatedSub-Advisers in managing the Fund. The Board concluded that the nature, extent and quality of the services that may be provided by the AffiliatedSub-Advisers are appropriate and satisfactory.
B. Fund Investment Performance
The Board considered Fund investment performance as a relevant factor in considering whether to approve the investment advisory agreement. The Board did not view Fund investment performance as a relevant factor in considering whether to approve thesub-advisory contracts for the Fund, as no AffiliatedSub-Adviser currently manages assets of the Fund.
The Board compared the Fund’s investment performance over multiple time periods ending December 31, 2018 to the performance of funds in the Broadridge performance universe and against the Lipper California Municipal Debt Funds Index. The Board noted that performance of Class A shares of the Fund was in the fourth quintile of its performance universe for the one and three year periods and the third quintile for the five year period (the first quintile being the best performing funds and the fifth quintile being the worst performing funds). The Board noted that performance of Class A shares of the Fund was below the performance of the Index for the one, three and five year periods. The Board noted that the Fund’s exposure to certain types of bonds and security selection in and exposure to certain sectors negatively impacted Fund performance. The Trustees also reviewed more recent Fund performance and this review did not change their conclusions.
|
| 33 Invesco California Tax-Free Income Fund |
| C. | Advisory andSub-Advisory Fees and Fund Expenses |
The Board compared the Fund’s contractual management fee rate to the contractual management fee rates of funds in the Fund’s Broadridge expense group. The Board noted that the contractual management fee rate for Class A shares of the Fund was below the median contractual management fee rate of funds in its expense group. The Board noted that the term “contractual management fee” for funds in the expense group may include both advisory and certainnon-portfolio management administrative services fees, but that Broadridge does not provide information on a fund by fund basis as to what is included. The Board also reviewed the methodology used by Broadridge in providing expense group information, which includes using each fund’s contractual management fee schedule (including any applicable breakpoints) as reported in the most recent prospectus or statement of additional information for each fund in the expense group. The Board also considered comparative information regarding the Fund’s total expense ratio and its various components. The Board noted that the Fund’s total expense ratio was in the fifth quintile of its expense group and discussed with management reasons for such relative total expenses.
The Board noted that Invesco Advisers has contractually agreed to waive fees and/or limit expenses of the Fund for the term disclosed in the Fund’s registration statement in an amount necessary to limit total annual operating expenses to a specified percentage of average daily net assets for each class of the Fund.
The Board noted that Invesco Advisers and the AffiliatedSub-Advisers do not manage other similarly managed mutual funds or client accounts.
The Board also considered the services that may be provided by the AffiliatedSub-Advisers pursuant to thesub-advisory contracts, as well as the fees payable by Invesco Advisers to the AffiliatedSub-Advisers pursuant to thesub-advisory contracts.
| D. | Economies of Scale and Breakpoints |
The Board considered the extent to which there may be economies of scale in the provision of advisory services to the Fund. The Board considered Invesco’s reinvestment in its business, including investments in business infrastructure and cybersecurity. The Board also considered that the Fund may benefit from economies of scale through contractual breakpoints in the Fund’s advisory fee schedule, which generally operate to reduce the Fund’s expense ratio as it grows in size. The Board noted that the Fund shares directly in economies of scale through lower fees charged by third party service providers based on the combined size of the Invesco Funds. The Board noted that the Fund may also benefit from economies of scale through initial fee setting, fee waivers and expense reimbursements.
| E. | Profitability and Financial Resources |
The Board reviewed information from Invesco Advisers concerning the costs of the advisory and other services that Invesco Advisers and its affiliates provide to the Fund and the Invesco Funds and the profitability of Invesco Advisers and its affiliates in providing these services. The Board considered the methodology used for calculating profitability and noted the periodic review of such methodology by an independent consultant. The Board noted that Invesco Advisers continues to operate at a net profit from services Invesco Advisers and its affiliates provide to the Invesco Funds and the Fund. The Board did not deem the level of profits realized by Invesco Advisers and its affiliates from providing services to the Fund to be excessive given the nature, extent and quality of the services provided. The Board received information from Invesco Advisers demonstrating that Invesco Advisers and the AffiliatedSub-Advisers are financially sound and have the resources necessary to perform their obligations under the investment advisory agreement andsub-advisory contracts.
| F. | Collateral Benefits to Invesco Advisers and its Affiliates |
The Board considered various other benefits received by Invesco Advisers and its affiliates from the relationship with the Fund, including the fees received for providing administrative, transfer agency and distribution services to the Fund. The Board considered comparative information regarding fees charged for these services, including information provided by Broadridge and other independent sources. The Board considered the performance of Invesco Advisers and its affiliates in providing these services and the organizational structure employed to provide these services. The Board also considered that these services are provided to the Fund pursuant to written contracts that are reviewed and approved on an annual basis by the Board; and that the services are required for the operation of the Fund.
The Board considered the benefits realized by Invesco Advisers and the AffiliatedSub-Advisers as a result of portfolio brokerage transactions executed through “soft dollar” arrangements. Invesco Advisers noted that the Fund does not execute brokerage transactions through “soft dollar” arrangements to any significant degree.
The Board considered that the Fund’s uninvested cash and cash collateral from any securities lending arrangements may be invested in money market funds advised by Invesco Advisers pursuant to procedures approved by the Board. The Board considered information regarding the returns of the affiliated money market funds relative to comparable overnight investments, as well as the costs to the Fund of such investments. The Board noted that Invesco Advisers receives advisory fees from these affiliated money market funds attributable to such investments, although Invesco Advisers has contractually agreed to waive through varying periods the advisory fees payable by the Invesco Funds with
respect to certain investments in the affiliated money market funds. The waiver is in an amount equal to 100% of the net advisory fee Invesco Advisers receives from the affiliated money market funds with respect to the Fund’s investment in the affiliated money market funds of uninvested cash, but not cash collateral. The Board concluded that the amount of advisory fees received by Invesco Advisers from the Fund’s investment of cash collateral from any securities lending arrangements in the affiliated money market funds is fair and reasonable.
|
| 34 Invesco California Tax-Free Income Fund |
Tax Information
Form1099-DIV, Form1042-S and other year–end tax information provide shareholders with actual calendar year amounts that should be included in their tax returns. Shareholders should consult their tax advisers.
The following distribution information is being provided as required by the Internal Revenue Code or to meet a specific state’s requirement.
The Fund designates the following amounts or, if subsequently determined to be different, the maximum amount allowable for its fiscal year ended August 31, 2019:
| | | | | | |
Federal and State Income Tax | | | |
Qualified Dividend Income* | | | 0.00 | % |
Corporate Dividends Received Deduction* | | | 0.00 | % |
Tax-Exempt Interest Dividends* | | | 100.00 | % |
U.S. Treasury Obligations* | | | 0.00 | % |
| | * | The above percentages are based on ordinary income dividends paid to shareholders during the Fund’s fiscal year. |
|
| 35 Invesco California Tax-Free Income Fund |
Trustees and Officers
The address of each trustee and officer is AIM Counselor Series Trust (Invesco Counselor Series Trust) (the “Trust”), 11 Greenway Plaza, Suite 1000, Houston, Texas 77046-1173. The trustees serve for the life of the Trust, subject to their earlier death, incapacitation, resignation, retirement or removal as more specifically provided in the Trust’s organizational documents. Each officer serves for a one year term or until their successors are elected and qualified. Column two below includes length of time served with predecessor entities, if any.
| | | | | | | | |
Name, Year of Birth and
Position(s) Held with the Trust | | Trustee and/
or Officer Since | | Principal Occupation(s) During Past 5 Years | | Number of
Funds in Fund
Complex
Overseen by
Trustee | | Other Directorship(s)
Held by Trustee During
Past 5 Years |
| Interested Persons | | | | | | | | |
| Martin L. Flanagan1 – 1960 Trustee and Vice Chair | | 2007 | | Executive Director, Chief Executive Officer and President, Invesco Ltd. (ultimate parent of Invesco and a global investment management firm); Trustee and Vice Chair, The Invesco Funds; Vice Chair, Investment Company Institute; and Member of Executive Board, SMU Cox School of Business Formerly: Advisor to the Board, Invesco Advisers, Inc. (formerly known as Invesco Institutional (N.A.), Inc.); Chairman and Chief Executive Officer, Invesco Advisers, Inc. (registered investment adviser); Director, Chairman, Chief Executive Officer and President, Invesco Holding Company (US), Inc. (formerly IVZ Inc.) (holding company), Invesco Group Services, Inc. (service provider) and Invesco North American Holdings, Inc. (holding company); Director, Chief Executive Officer and President, Invesco Holding Company Limited (parent of Invesco and a global investment management firm); Director, Invesco Ltd.; Chairman, Investment Company Institute and President,Co-Chief Executive Officer,Co-President, Chief Operating Officer and Chief Financial Officer, Franklin Resources, Inc. (global investment management organization) | | 229 | | None |
| Philip A. Taylor2 – 1954 Trustee | | 2006 | | Vice Chair, Invesco Ltd.; Trustee, The Invesco Funds Formerly: Director, Invesco Canada Ltd. (formerly known as Invesco Trimark Ltd./Invesco Trimark Ltèe) (registered investment adviser and registered transfer agent); Head of the Americas and Senior Managing Director, Invesco Ltd.; Director, Invesco Advisers, Inc. (formerly known as Invesco Institutional (N.A.), Inc.) (registered investment adviser); Director and Chairman, Invesco Investment Services, Inc. (formerly known as Invesco AIM Investment Services, Inc.) (registered transfer agent); Chief Executive Officer, Invesco Corporate Class Inc. (corporate mutual fund company); Chairman and Chief Executive Officer, Invesco Canada Ltd. (formerly known as Invesco Trimark Ltd./Invesco Trimark Ltèe) (registered investment adviser and registered transfer agent); Senior Vice President, The Invesco Funds; Director, Invesco Investment Advisers LLC (formerly known as Van Kampen Asset Management); Director, Chairman, Chief Executive Officer and President, Invesco Management Group, Inc. (formerly known as Invesco AIM Management Group, Inc.) (financial services holding company);Co-Chairman,Co-President andCo-Chief Executive Officer, Invesco Advisers, Inc. (formerly known as Invesco Institutional (N.A.), Inc.) (registered investment adviser); Director, Chief Executive Officer and President, Van Kampen | | 229 | | None |
| | | | | Exchange Corp; President and Principal Executive Officer, The Invesco Funds (other than AIM Treasurer’s Series Trust (Invesco Treasurer’s Series Trust), Short-Term Investments Trust and Invesco Management Trust); Executive Vice President, The Invesco Funds (AIM Treasurer’s Series Trust (Invesco Treasurer’s Series Trust), Short-Term Investments Trust and Invesco Management Trust only); Director and President, INVESCO Funds Group, Inc. (registered investment adviser and registered transfer agent); Director and Chairman, IVZ Distributors, Inc. (formerly known as INVESCO Distributors, Inc.) (registered broker dealer); Director, President and Chairman, Invesco Inc. (holding company), Invesco Canada Holdings Inc. (holding company), Trimark Investments Ltd./Placements Trimark Ltèe and Invesco Financial Services Ltd/Services Financiers Invesco Ltèe; Chief Executive Officer, Invesco Canada Fund Inc. (corporate mutual fund company); Director and Chairman, Van Kampen Investor Services Inc.; Director, Chief Executive Officer and President, 1371 Preferred Inc. (holding company) and Van Kampen Investments Inc.; Director and President, AIM GP Canada Inc. (general partner for limited partnerships) and Van Kampen Advisors, Inc.; Director and Chief Executive Officer, Invesco Trimark Dealer Inc. (registered broker dealer); Director, Invesco Distributors, Inc. (formerly known as Invesco AIM Distributors, Inc.) (registered broker dealer); Manager, Invesco Capital Management LLC; Director, Chief Executive Officer and President, Invesco Advisers, Inc.; Director, Chairman, Chief Executive Officer and President, Invesco AIM Capital Management, Inc.; President, Invesco Trimark Dealer Inc. and Invesco Trimark Ltd./Invesco Trimark Ltèe; Director and President, AIM Trimark Corporate Class Inc. and AIM Trimark Canada Fund Inc.; Senior Managing Director, Invesco Holding Company Limited; Director and Chairman, Fund Management Company (former registered broker dealer); President and Principal Executive Officer, The Invesco Funds (AIM Treasurer’s Series Trust (Invesco Treasurer’s Series Trust), and Short-Term Investments Trust only); President, AIM Trimark Global Fund Inc. and AIM Trimark Canada Fund Inc. | | | | |
| 1 | Mr. Flanagan is considered an interested person (within the meaning of Section 2(a)(19) of the 1940 Act) of the Trust because he is an officer of the Adviser to the Trust, and an officer and a director of Invesco Ltd., ultimate parent of the Adviser. |
| 2 | Mr. Taylor is considered an interested person (within the meaning of Section 2(a)(19) of the 1940 Act) of the Trust because he is an officer of Invesco Ltd., ultimate parent of the Adviser. |
|
| T-1 Invesco California Tax-Free Income Fund |
Trustees and Officers—(continued)
| | | | | | | | |
Name, Year of Birth and
Position(s) Held with the Trust | | Trustee and/
or Officer Since | | Principal Occupation(s)
During Past 5 Years | | Number of
Funds in Fund
Complex
Overseen by
Trustee | | Other Directorship(s)
Held by Trustee During
Past 5 Years |
| Independent Trustees | | | | | | | | |
Bruce L. Crockett – 1944 Trustee and Chair | | 2003 | | Chairman, Crockett Technologies Associates (technology consulting company) Formerly: Director, Captaris (unified messaging provider); Director, President and Chief Executive Officer, COMSAT Corporation; Chairman, Board of Governors of INTELSAT (international communications company); ACE Limited (insurance company); Independent Directors Council and Investment Company Institute: Member of the Audit Committee, Investment Company Institute; Member of the Executive Committee and Chair of the Governance Committee, Independent Directors Council | | 229 | | Director and Chairman of the Audit Committee, ALPS (Attorneys Liability Protection Society) (insurance company); Director and Member of the Audit Committee and Compensation Committee, Ferroglobe PLC (metallurgical company) |
David C. Arch – 1945 Trustee | | 2010 | | Chairman of Blistex Inc. (consumer health care products manufacturer); Member, World Presidents’ Organization | | 229 | | Board member of the Illinois Manufacturers’ Association |
Beth Ann Brown – 1968 Trustee | | 2019 | | Independent Consultant Formerly: Head of Intermediary Distribution, Managing Director, Strategic Relations, Managing Director, Head of National Accounts, Senior Vice President, National Account Manager and Senior Vice President, Key Account Manager, Columbia Management Investment Advisers LLC; Vice President, Key Account Manager, Liberty Funds Distributor, Inc.; and Trustee of certain Oppenheimer Funds | | 229 | | Director, Board of Directors of Caron Engineering Inc.; Advisor, Board of Advisors of Caron Engineering Inc.; President and Director, Acton Shapleigh Youth Conservation Corps (non - profit); and Vice President and Director of Grahamtastic Connection(non-profit) |
Jack M. Fields – 1952 Trustee | | 2003 | | Chief Executive Officer, Twenty First Century Group, Inc. (government affairs company); and Chairman, Discovery Learning Alliance(non-profit) Formerly: Owner and Chief Executive Officer, Dos Angeles Ranch L.P. (cattle, hunting, corporate entertainment); Director, Insperity, Inc. (formerly known as Administaff) (human resources provider); Chief Executive Officer, Texana Timber LP (sustainable forestry company); Director of Cross Timbers Quail Research Ranch(non-profit); and member of the U.S. House of Representatives | | 229 | | None |
Cynthia Hostetler – 1962 Trustee | | 2017 | | Non-Executive Director and Trustee of a number of public and private business corporations Formerly: Director, Aberdeen Investment Funds (4 portfolios); Head of Investment Funds and Private Equity, Overseas Private Investment Corporation; President, First Manhattan Bancorporation, Inc.; Attorney, Simpson Thacher & Bartlett LLP | | 229 | | Vulcan Materials Company (construction materials company); Trilinc Global Impact Fund; Genesee & Wyoming, Inc. (railroads); Artio Global Investment LLC (mutual fund complex); Edgen Group, Inc. (specialized energy and infrastructure products distributor); Investment Company Institute (professional organization); Independent Directors Council (professional organization) |
Eli Jones – 1961 Trustee | | 2016 | | Professor and Dean, Mays Business School – Texas A&M University Formerly: Professor and Dean, Walton College of Business, University of Arkansas and E.J. Ourso College of Business, Louisiana State University; Director, Arvest Bank | | 229 | | Insperity, Inc. (formerly known as Administaff) (human resources provider) |
| Elizabeth Krentzman – 1959 Trustee | | 2019 | | Formerly: Principal and Chief Regulatory Advisor for Asset Management Services and U.S. Mutual Fund Leader of Deloitte & Touche LLP; General Counsel of the Investment Company Institute (trade association); National Director of the Investment Management Regulatory Consulting Practice, Principal, Director and Senior Manager of Deloitte & Touche LLP; Assistant Director of the Division of Investment Management – Office of Disclosure and Investment Adviser Regulation of the U.S. Securities and Exchange Commission and various positions with the Division of Investment Management – Office of Regulatory Policy of the U.S. Securities and Exchange Commission; Associate at Ropes & Gray LLP; Advisory Board Member of the Securities and Exchange Commission Historical Society; and Trustee of certain Oppenheimer Funds | | 229 | | Trustee of the University of Florida National Board Foundation and Audit Committee Member; Member of the Cartica Funds Board of Directors (private investment funds); Member of the University of Florida Law Center Association, Inc. Board of Trustees and Audit Committee Member |
| Anthony J. LaCava, Jr. – 1956 Trustee | | 2019 | | Formerly: Director and Member of the Audit Committee, Blue Hills Bank (publicly traded financial institution) and Managing Partner, KPMG LLP | | 229 | | Blue Hills Bank; Chairman, Bentley University; Member, Business School Advisory Council; and Nominating Committee, KPMG LLP |
|
| T-2 Invesco California Tax-Free Income Fund |
Trustees and Officers–(continued)
| | | | | | | | |
Name, Year of Birth and
Position(s) Held with the Trust | | Trustee and/
or Officer Since | | Principal Occupation(s)
During Past 5 Years | | Number of
Funds in Fund
Complex
Overseen by
Trustee | | Other Directorship(s)
Held by Trustee During
Past 5 Years |
| Independent Trustees–(continued) | | | | | | | | |
| Prema Mathai-Davis – 1950 Trustee | | 2003 | | Retired Co-Owner & Partner of Quantalytics Research, LLC, (a FinTech Investment Research Platform for the Self-Directed Investor) | | 229 | | None |
| Joel W. Motley – 1952 Trustee | | 2019 | | Director of Office of Finance, Federal Home Loan Bank; Member of the Vestry of Trinity Wall Street; Managing Director of Carmona Motley Inc. (privately held financial advisor); Member of the Finance and Budget Committee of the Council on Foreign Relations, Member of the Investment Committee and Board of Human Rights Watch and Member of the Investment Committee and Board of Historic Hudson Valley(non-profit cultural organization) Formerly: Managing Director of Public Capital Advisors, LLC (privately held financial advisor); Managing Director of Carmona Motley Hoffman, Inc. (privately held financial advisor); Trustee of certain Oppenheimer Funds; and Director of Columbia Equity Financial Corp. (privately held financial advisor) | | 229 | | Director of Greenwall Foundation (bioethics research foundation); Member of Board and Investment Committee of The Greenwall Foundation; Director of Southern Africa Legal Services Foundation; Board Member and Investment Committee Member of Pulitzer Center for Crisis Reporting(non-profit journalism) |
| Teresa M. Ressel – 1962 Trustee | | 2017 | | Non-executive director and trustee of a number of public and private business corporations Formerly: Chief Financial Officer, Olayan America, The Olayan Group (international investor/commercial/industrial); Chief Executive Officer, UBS Securities LLC; Group Chief Operating Officer, Americas, UBS AG; Assistant Secretary for Management & Budget and CFO, US Department of the Treasury | | 229 | | Atlantic Power Corporation (power generation company); ON Semiconductor Corp. (semiconductor supplier) |
| Ann Barnett Stern – 1957 Trustee | | 2017 | | President and Chief Executive Officer, Houston Endowment Inc. (private philanthropic institution) Formerly: Executive Vice President and General Counsel, Texas Children’s Hospital; Attorney, Beck, Redden and Secrest, LLP; Business Law Instructor, University of St. Thomas; Attorney, Andrews & Kurth LLP | | 229 | | Federal Reserve Bank of Dallas |
| Raymond Stickel, Jr. – 1944 Trustee | | 2005 | | Retired Formerly: Director, Mainstay VP Series Funds, Inc. (25 portfolios); Partner, Deloitte & Touche | | 229 | | None |
| Robert C. Troccoli – 1949 Trustee | | 2016 | | Retired Formerly: Adjunct Professor, University of Denver – Daniels College of Business; Senior Partner, KPMG LLP | | 229 | | None |
| Daniel S. Vandivort – 1954 Trustee | | 2019 | | Treasurer, Chairman of the Audit and Finance Committee, and Trustee, Board of Trustees, Huntington Disease Foundation of America; and President, Flyway Advisory Services LLC (consulting and property management) Formerly: Trustee and Governance Chair, of certain Oppenheimer Funds | | 229 | | Chairman and Lead Independent Director, Chairman of the Audit Committee, and Director, Board of Directors, Value Line Funds |
| James D. Vaughn – 1945 Trustee | | 2019 | | Retired Formerly: Managing Partner, Deloitte & Touche LLP; Trustee and Chairman of the Audit Committee, Schroder Funds; Board Member, Mile High United Way, Boys and Girls Clubs, Boy Scouts, Colorado Business Committee for the Arts, Economic Club of Colorado and Metro Denver Network (economic development corporation); and Trustee of certain Oppenheimer Funds | | 229 | | Board member and Chairman of Audit Committee of AMG National Trust Bank; Trustee and Investment Committee member, University of South Dakota Foundation; Board member, Audit Committee Member and past Board Chair, Junior Achievement(non-profit) |
Christopher L. Wilson – 1957
Trustee, Vice Chair and Chair Designate | | 2017 | | Retired Formerly: Director, TD Asset Management USA Inc. (mutual fund complex) (22 portfolios); Managing Partner, CT2, LLC (investing and consulting firm); President/Chief Executive Officer, Columbia Funds, Bank of America Corporation; President/Chief Executive Officer, CDC IXIS Asset Management Services, Inc.; Principal & Director of Operations, Scudder Funds, Scudder, Stevens & Clark, Inc.; Assistant Vice President, Fidelity Investments | | 229 | | ISO New England, Inc.(non-profit organization managing regional electricity market) |
|
| T-3 Invesco California Tax-Free Income Fund |
Trustees and Officers–(continued)
| | | | | | | | |
Name, Year of Birth and
Position(s) Held with the Trust | | Trustee and/
or Officer Since | | Principal Occupation(s)
During Past 5 Years | | Number of
Funds in Fund
Complex
Overseen by
Trustee | | Other Directorship(s)
Held by Trustee During
Past 5 Years |
| Other Officers | | | | | | | | |
| Sheri Morris – 1964 President, Principal Executive Officer and Treasurer | | 2003 | | President, Principal Executive Officer and Treasurer, The Invesco Funds; Vice President, Invesco Advisers, Inc. (formerly known as Invesco Institutional (N.A.), Inc.) (registered investment adviser); and Vice President, Invesco Exchange-Traded Fund Trust, Invesco Exchange-Traded Fund Trust II, Invesco India Exchange-Traded Fund Trust, Invesco Actively Managed Exchange-Traded Fund Trust, Invesco Actively Managed Exchange-Traded Commodity Fund Trust and Invesco Exchange-Traded Self-Indexed Fund Trust; and Vice President, OppenheimerFunds, Inc. Formerly: Vice President and Principal Financial Officer, The Invesco Funds; Vice President, Invesco AIM Advisers, Inc., Invesco AIM Capital Management, Inc. and Invesco AIM Private Asset Management, Inc.; Assistant Vice President and Assistant Treasurer, The Invesco Funds and Assistant Vice President, Invesco Advisers, Inc., Invesco AIM Capital Management, Inc. and Invesco AIM Private Asset Management, Inc.; and Treasurer, Invesco Exchange-Traded Fund Trust, Invesco Exchange-Traded Fund Trust II, Invesco India Exchange-Traded Fund Trust and Invesco Actively Managed Exchange-Traded Fund Trust | | N/A | | N/A |
| Russell C. Burk – 1958 Senior Vice President and Senior Officer | | 2005 | | Senior Vice President and Senior Officer, The Invesco Funds | | N/A | | N/A |
| | | | | |
| Jeffrey H. Kupor – 1968 Senior Vice President, Chief Legal Officer and Secretary | | 2018 | | Head of Legal of the Americas, Invesco Ltd.; Senior Vice President and Secretary, Invesco Advisers, Inc. (formerly known as Invesco Institutional (N.A.), Inc.) (registered investment adviser); Senior Vice President and Secretary, Invesco Distributors, Inc. (formerly known as Invesco AIM Distributors, Inc.); Vice President and Secretary, Invesco Investment Services, Inc. (formerly known as Invesco AIM Investment Services, Inc.) Senior Vice President, Chief Legal Officer and Secretary, The Invesco Funds; Secretary and General Counsel, Invesco Investment Advisers LLC (formerly known as Van Kampen Asset Management); Secretary and General Counsel, Invesco Capital Markets, Inc. (formerly known as Van Kampen Funds Inc.) and Chief Legal Officer, Invesco Exchange-Traded Fund Trust, Invesco Exchange-Traded Fund Trust II, Invesco India Exchange-Traded Fund Trust, Invesco Actively Managed Exchange-Traded Fund Trust, Invesco Actively Managed Exchange-Traded Commodity Fund Trust and Invesco Exchange-Traded Self-Indexed Fund Trust; Secretary, Invesco Indexing LLC; Secretary, W.L. Ross & Co., LLC Formerly: Secretary and Vice President, Jemstep, Inc.; Head of Legal, Worldwide Institutional, Invesco Ltd.; Secretary and General Counsel, INVESCO Private Capital Investments, Inc.; Senior Vice President, Secretary and General Counsel, Invesco Management Group, Inc. (formerly known as Invesco AIM Management Group, Inc.); Assistant Secretary, INVESCO Asset Management (Bermuda) Ltd.; Secretary and General Counsel, Invesco Private Capital, Inc.; Assistant Secretary and General Counsel, INVESCO Realty, Inc.; Secretary and General Counsel, Invesco Senior Secured Management, Inc.; and Secretary, Sovereign G./P. Holdings Inc. | | N/A | | N/A |
| | | | | |
| Andrew R. Schlossberg – 1974 Senior Vice President | | 2019 | | Head of the Americas and Senior Managing Director, Invesco Ltd.; Director and Senior Vice President, Invesco Advisers, Inc. (formerly known as Invesco Institutional (N.A.), Inc.) (registered investment adviser); Director and Chairman, Invesco Investment Services, Inc. (formerly known as Invesco AIM Investment Services, Inc.) (registered transfer agent); Senior Vice President, The Invesco Funds; Director, Invesco Investment Advisers LLC (formerly known as Van Kampen Asset Management); Director, President and Chairman, Invesco Insurance Agency, Inc. Formerly: Director, Invesco UK Limited; Director and Chief Executive, Invesco Asset Management Limited and Invesco Fund Managers Limited; Assistant Vice President, The Invesco Funds; Senior Vice President, Invesco Advisers, Inc. (formerly known as Invesco Institutional (N.A.), Inc.) (registered investment adviser); Director and Chief Executive, Invesco Administration Services Limited and Invesco Global Investment Funds Limited; Director, Invesco Distributors, Inc.; Head of EMEA, Invesco Ltd.; President, Invesco Actively Managed Exchange-Traded Commodity Fund Trust, Invesco Actively Managed Exchange-Traded Fund Trust, Invesco Exchange-Traded Fund Trust, Invesco Exchange-Traded Fund Trust II and Invesco India Exchange-Traded Fund Trust; Managing Director and Principal Executive Officer, Invesco Capital Management LLC | | N/A | | N/A |
|
| T-4 Invesco California Tax-Free Income Fund |
Trustees and Officers–(continued)
| | | | | | | | |
Name, Year of Birth and
Position(s) Held with the Trust | | Trustee and/
or Officer Since | | Principal Occupation(s)
During Past 5 Years | | Number of
Funds in Fund
Complex
Overseen by
Trustee | | Other Directorship(s)
Held by Trustee During
Past 5 Years |
| Other Officers-(continued) | | | | | | | | |
| John M. Zerr – 1962 Senior Vice President | | 2006 | | Chief Operating Officer of the Americas; Senior Vice President, Invesco Advisers, Inc. (formerly known as Invesco Institutional (N.A.), Inc.) (registered investment adviser); Senior Vice President, Invesco Distributors, Inc. (formerly known as Invesco AIM Distributors, Inc.); Director and Vice President, Invesco Investment Services, Inc. (formerly known as Invesco AIM Investment Services, Inc.) Senior Vice President, The Invesco Funds; Managing Director, Invesco Capital Management LLC; Director, Invesco Investment Advisers LLC (formerly known as Van Kampen Asset Management); Senior Vice President, Invesco Capital Markets, Inc. (formerly known as Van Kampen Funds Inc.); Manager, Invesco Indexing LLC; Manager, Invesco Specialized Products, LLC; Director and Senior Vice President, Invesco Insurance Agency, Inc.; Member, Invesco Canada Funds Advisory Board; Director, President and Chief Executive Officer, Invesco Corporate Class Inc. (corporate mutual fund company); and Director, Chairman, President and Chief Executive Officer, Invesco Canada Ltd. (formerly known as Invesco Trimark Ltd./Invesco Trimark Ltèe) (registered investment adviser and registered transfer agent) Formerly: Director and Senior Vice President, Invesco Management Group, Inc. (formerly known as Invesco AIM Management Group, Inc.); Secretary and General Counsel, Invesco Management Group, Inc. (formerly known as Invesco AIM Management Group, Inc.); Secretary, Invesco Investment Services, Inc. (formerly known as Invesco AIM Investment Services, Inc.); Chief Legal Officer and Secretary, The Invesco Funds; Secretary and General Counsel, Invesco Investment Advisers LLC (formerly known as Van Kampen Asset Management); Secretary and General Counsel, Invesco Capital Markets, Inc. (formerly known as Van Kampen Funds Inc.); Chief Legal Officer, Invesco Exchange-Traded Fund Trust, Invesco Exchange-Traded Fund Trust II, Invesco India Exchange-Traded Fund Trust, Invesco Actively Managed Exchange-Traded Fund Trust, Invesco Actively Managed Exchange-Traded Commodity Fund Trust and Invesco Exchange-Traded Self-Indexed Fund Trust; Secretary, Invesco Indexing LLC; Director, Secretary, General Counsel and Senior Vice President, Van Kampen Exchange Corp.; Director, Vice President and Secretary, IVZ Distributors, Inc. (formerly known as INVESCO Distributors, Inc.); Director and Vice President, INVESCO Funds Group, Inc.; Director and Vice President, Van Kampen Advisors Inc.; Director, Vice President, Secretary and General Counsel, Van Kampen Investor Services Inc.; Director and Secretary, Invesco Distributors, Inc. (formerly known as Invesco AIM Distributors, Inc.); Director, Senior Vice President, General Counsel and Secretary, Invesco AIM Advisers, Inc. and Van Kampen Investments Inc.; Director, Vice President and Secretary, Fund Management Company; Director, Senior Vice President, Secretary, General Counsel and Vice President, Invesco AIM Capital Management, Inc.; Chief Operating Officer and General Counsel, Liberty Ridge Capital, Inc. (an investment adviser) | | N/A | | N/A |
Gregory G. McGreevey – 1962 Senior Vice President | | 2012 | | Senior Managing Director, Invesco Ltd.; Director, Chairman, President, and Chief Executive Officer, Invesco Advisers, Inc. (formerly known as Invesco Institutional (N.A.), Inc.) (registered investment adviser); Director, Invesco Mortgage Capital, Inc. and Invesco Senior Secured Management, Inc.; and Senior Vice President, The Invesco Funds; and President, SNW Asset Management Corporation Formerly: Senior Vice President, Invesco Management Group, Inc. and Invesco Advisers, Inc.; Assistant Vice President, The Invesco Funds | | N/A | | N/A |
Kelli Gallegos – 1970 Vice President, Principal Financial Officer and Assistant Treasurer | | 2008 | | Assistant Treasurer, Invesco Specialized Products, LLC; Vice President, Principal Financial Officer and Assistant Treasurer, The Invesco Funds; Principal Financial and Accounting Officer - Pooled Investments, Invesco Capital Management LLC; Vice President and Treasurer, Invesco Exchange-Traded Fund Trust, Invesco Exchange-Traded Fund Trust II, Invesco India Exchange-Traded Fund Trust, Invesco Actively Managed Exchange-Traded Fund Trust, Invesco Actively Managed Exchange-Traded Commodity Fund Trust and Invesco Exchange-Traded Self-Indexed Fund Trust Formerly: Assistant Treasurer, Invesco Exchange-Traded Fund Trust, Invesco Exchange-Traded Fund Trust II, Invesco India Exchange-Traded Fund Trust, Invesco Actively Managed Exchange-Traded Fund Trust, Invesco Actively Managed Exchange-Traded Commodity Fund Trust and Invesco Exchange-Traded Self-Indexed Fund Trust; Assistant Treasurer, Invesco Capital Management LLC; Assistant Vice President, The Invesco Funds | | N/A | | N/A |
|
| T-5 Invesco California Tax-Free Income Fund |
Trustees and Officers–(continued)
| | | | | | | | |
Name, Year of Birth and
Position(s) Held with the Trust | | Trustee and/
or Officer Since | | Principal Occupation(s)
During Past 5 Years | | Number of
Funds in Fund
Complex
Overseen by
Trustee | | Other Directorship(s)
Held by Trustee
During Past 5 Years |
| Other Officers–(continued) | | | | | | | | |
| Crissie M. Wisdom – 1969 Anti-Money Laundering Compliance Officer | | 2013 | | Anti-Money Laundering Compliance Officer, Invesco Advisers, Inc. (formerly known as Invesco Institutional (N.A.), Inc.) (registered investment adviser), Invesco Capital Markets, Inc. (formerly known as Van Kampen Funds Inc.), Invesco Distributors, Inc., Invesco Investment Services, Inc., The Invesco Funds, and Invesco Exchange-Traded Fund Trust, Invesco Exchange-Traded Fund Trust II, Invesco India Exchange-Traded Fund Trust, Invesco Actively Managed Exchange-Traded Fund Trust, Invesco Actively Managed Exchange-Traded Commodity Fund Trust and Invesco Exchange-Traded Self-Indexed Fund Trust; Anti-Money Laundering Compliance Officer and Bank Secrecy Act Officer, INVESCO National Trust Company and Invesco Trust Company; and Fraud Prevention Manager and Controls and Risk Analysis Manager for Invesco Investment Services, Inc. Formerly: Anti-Money Laundering Compliance Officer, Van Kampen Exchange Corp. and Invesco Management Group, Inc. | | N/A | | N/A |
| Robert R. Leveille – 1969 Chief Compliance Officer | | 2016 | | Chief Compliance Officer, Invesco Advisers, Inc. (registered investment adviser); and Chief Compliance Officer, The Invesco Funds Formerly: Chief Compliance Officer, Putnam Investments and the Putnam Funds | | N/A | | N/A |
The Statement of Additional Information of the Trust includes additional information about the Fund’s Trustees and is available upon request, without charge, by calling 1.800.959.4246. Please refer to the Fund’s Statement of Additional Information for information on the Fund’ssub-advisers.
| | | | | | |
Office of the Fund 11 Greenway Plaza, Suite 1000 Houston, TX 77046-1173 | | Investment Adviser Invesco Advisers, Inc.
1555 Peachtree Street, N.E.
Atlanta, GA 30309 | | Distributor Invesco Distributors, Inc. 11 Greenway Plaza, Suite 1000 Houston, TX 77046-1173 | | Auditors PricewaterhouseCoopers LLP 1000 Louisiana Street, Suite 5800 Houston, TX 77002-5021 |
| | | |
| | | | | | |
Counsel to the Fund Stradley Ronon Stevens & Young, LLP 2005 Market Street, Suite 2600 Philadelphia, PA 19103-7018 | | Counsel to the Independent Trustees Goodwin Procter LLP
901 New York Avenue, N.W. Washington, D.C. 20001 | | Transfer Agent Invesco Investment Services, Inc. 11 Greenway Plaza, Suite 1000 Houston, TX 77046-1173 | | Custodian State Street Bank and Trust Company 225 Franklin Street Boston, MA 02110-2801 |
|
| T-6 Invesco California Tax-Free Income Fund |

Go paperless with eDelivery
Visit invesco.com/edelivery to enjoy the convenience and security of anytime electronic access to your investment documents. With eDelivery, you can elect to have any or all of the following materials delivered straight to your inbox to download, save and print from your own computer:
| ∎ | | Fund reports and prospectuses |
Invesco mailing information
Send general correspondence to Invesco Investment Services, Inc., P.O. Box 219078, Kansas City, MO 64121-9078.
Important notice regarding delivery of security holder documents
To reduce Fund expenses, only one copy of most shareholder documents may be mailed to shareholders with multiple accounts at the same address (Householding). Mailing of your shareholder documents may be householded indefinitely unless you instruct us otherwise. If you do not want the mailing of these documents to be combined with those for other members of your household, please contact Invesco Investment Services, Inc. at 800 959 4246 or contact your financial institution. We will begin sending you individual copies for each account within 30 days after receiving your request.
Fund holdings and proxy voting information
The Fund provides a complete list of its holdings four times in each fiscal year, at the quarter-ends. For the second and fourth quarters, the list appears in the Fund’s semiannual and annual reports to shareholders. For the first and third quarters, the Fund files the lists with the Securities and Exchange Commission (SEC) as an exhibit to its reports onForm N-PORT. The most recent list of portfolio holdings is available at invesco.com/completeqtrholdings. Shareholders can also look up the Fund’s FormN-PORT filings on the SEC website, sec.gov. The SEC file numbers for the Fund are shown below.
A description of the policies and procedures that the Fund uses to determine how to vote proxies relating to portfolio securities is available without charge, upon request, from our Client Services department at 800 959 4246, or at invesco.com/proxyguidelines. The information is also available on the SEC website, sec.gov.
| | |
Information regarding how the Fund voted proxies related to its portfolio securities during the most recent12-month period ended June 30 is available at invesco.com/proxysearch. This information is also available on the SEC website, sec.gov. Invesco Advisers, Inc. is an investment adviser; it provides investment advisory services to individual and institutional clients and does not sell securities. Invesco Distributors, Inc. is the US distributor for Invesco Ltd.’s retail mutual funds, exchange-traded funds and institutional money market funds. Both are wholly owned, indirect subsidiaries of Invesco Ltd. | |  |
| | | | | | | | |
| SEC file numbers:811-09913 and333-36074 | | Invesco Distributors, Inc. | | MS-CTFI-AR-1 | | | | |
| Annual Report to Shareholders | August 31, 2019 |
Invesco Core Plus Bond Fund
Nasdaq:
A: ACPSX ■ C: CPCFX ■ R: CPBRX ■ Y: CPBYX ■ R5: CPIIX ■ R6: CPBFX

Beginning on January 1, 2021, as permitted by regulations adopted by the Securities and Exchange Commission, paper copies of the Fund’s shareholder reports will no longer be sent by mail, unless you specifically request paper copies of the reports from the Fund or from your financial intermediary, such as a broker-dealer or bank. Instead, the reports will be made available on the Fund’s website, and you will be notified by mail each time a report is posted and provided with a website link to access the report.
If you already elected to receive shareholder reports electronically, you will not be affected by this change and you need not take any action. You may elect to receive shareholder reports and other communications from the Fund electronically by contacting your financial intermediary (such as a broker-dealer or bank) or, if you are a direct investor, by enrolling at invesco.com/edelivery.
You may elect to receive all future reports in paper free of charge. If you invest through a financial intermediary, you can contact your financial intermediary to request that you continue to receive paper copies of your shareholder reports. If you invest directly with the Fund, you can call (800) 959-4246 to let the Fund know you wish to continue receiving paper copies of your shareholder reports. Your election to receive reports in paper will apply to all funds held with your financial intermediary or all funds held with the fund complex if you invest directly with the Fund.
Dear Shareholders:
This annual report includes information about your Fund, including performance data and a complete list of its investments as of the close of the reporting period. Inside is a discussion of how your Fund was managed and the factors that affected its performance during the reporting period.
Throughout the reporting period, global equity markets remained volatile. Investor sentiment ranged from elation to fear. The reporting period began with several US equity indexes redefining new highs. The exuberance, however, ended in October 2018 as global equities, in particular US stocks, sold off, with the sharpest decline in December. The catalyst for the sell-off was a combination of ongoing trade concerns between the US and China, fears of a global economic slowdown and lower oil prices from a supply glut. Gains posted earlier in 2018 for global equities were erased, while US Treasury bonds, along with government and municipal bonds, rallied as investors fled to “safe haven” assets.
At the start of 2019, global equity markets rebounded strongly buoyed by more dovish central banks and optimism about a potential US-China trade deal. In May, US-China trade concerns and slowing global growth led to a global equity sell-off and rally in U.S. Treasuries. Despite the May sell-off, domestic equity markets rallied in June in anticipation of a U.S. Federal Reserve (the Fed) rate cut and closed the second quarter with modest gains. As the reporting period ended in August, market volatility once again increased as the US Treasury yield curve inverted several times magnifying concerns that the US economy could be headed into a recession.
During the reporting period, the Fed both raised and lowered the federal funds rate. Given signs of a strong economy, the Fed raised rates two times: in September and December 2018. In 2019, however, the Fed altered its outlook on further rate hikes leaving rates unchanged for the first half of the year. In July, the Fed lowered interest rates for the first time in 11 years. As 2019 unfolds, we’ll see how the interplay of interest rates, economic data, geopolitics and a host of other factors affect US and overseas equity and fixed income markets.
Investor uncertainty and market volatility, such as we witnessed during the reporting period, are unfortunate facts of life when it comes to investing. That’s why Invesco encourages investors to work with a professional financial adviser who can stress the importance of starting to save and invest early and the importance of adhering to a disciplined investment plan. A financial adviser who knows your unique financial situation, investment goals and risk tolerance can be an invaluable partner as you seek to achieve your financial goals. He or she can offer a long-term perspective when markets are volatile and time-tested advice and guidance when your financial situation or investment goals change.
Visit our website for more information on your investments
Our website, invesco.com/us, offers a wide range of market insights and investment perspectives. On the website, you’ll find detailed information about our funds, including performance, holdings and portfolio manager commentaries. You can access information about your account by completing a simple, secure online registration. To do so, select “Log In” on the right side of the homepage, and then select “Register for Individual Account Access.”
In addition to the resources accessible on our website and through our mobile app, you can obtain timely updates to help you stay informed about the markets and the economy by connecting with Invesco on Twitter, LinkedIn or Facebook. You can access our blog at blog.invesco.us.com. Our goal is to provide you the information you want, when and where you want it.
Finally, I’m pleased to share with you Invesco’s commitment to both the Principles for Responsible Investment and to considering environmental, social and governance issues in our robust investment process. I invite you to learn more at invesco.com/esg.
Have questions?
For questions about your account, contact an Invesco client services representative at 800 959 4246.
All of us at Invesco look forward to serving your investment management needs. Thank you for investing with us.
Sincerely,
Andrew Schlossberg
Head of the Americas,
Senior Managing Director, Invesco Ltd.
| 2 | Invesco Core Plus Bond Fund |
Dear Shareholders:
Among the many important lessons I’ve learned in more than 40 years in a variety of business endeavors is the value of a trusted advocate.
As independent chair of the Invesco Funds Board, I can assure you that the members of the Board are strong advocates for the interests of investors in Invesco’s mutual funds. We work hard to represent your interests through oversight of the quality of the investment management services your funds receive and other matters important to your investment, including but not limited to:
| ■ | Ensuring that Invesco offers a diverse lineup of mutual funds that your financial adviser can use to strive to meet your financial needs as your investment goals change over time. |
| ■ | Monitoring how the portfolio management teams of the Invesco funds are performing in light of changing economic and market conditions. |
| ■ | Assessing each portfolio management team’s investment performance within the context of the investment strategy described in the fund’s prospectus. |
| ■ | Monitoring for potential conflicts of interests that may impact the nature of the services that your funds receive. |
We believe one of the most important services we provide our fund shareholders is the annual review of the funds’ advisory and sub-advisory contracts with Invesco Advisers and its affiliates. This review is required by the Investment Company Act of 1940 and focuses on the nature and quality of the services Invesco provides as the adviser to the Invesco funds and the reasonableness of the fees that it charges for those services. Each year, we spend months carefully reviewing information received from Invesco and a variety of independent sources, such as performance and fee data prepared by Lipper, Inc. (a subsidiary of Broadridge Financial Solutions, Inc.), an independent, third-party firm widely recognized as a leader in its field. We also meet with our independent legal counsel and other independent advisers to review and help us assess the information that we have received. Our goal is to assure that you receive quality investment management services for a reasonable fee.
I trust the measures outlined above provide assurance that you have a worthy advocate when it comes to choosing the Invesco Funds.
As always, please contact me at bruce@brucecrockett.com with any questions or concerns you may have. On behalf of the Board, we look forward to continuing to represent your interests and serving your needs.
Sincerely,
Bruce L. Crockett
Independent Chair
Invesco Funds Board of Trustees
| 3 | Invesco Core Plus Bond Fund |
Management’s Discussion of Fund Performance
Performance summary
For the fiscal year ended August 31, 2019, Class A shares of Invesco Core Plus Bond Fund (the Fund), at net asset value (NAV), underperformed the Bloomberg Barclays U.S. Aggregate Bond Index, the Fund’s broad market/style-specific benchmark.
Your Fund’s long-term performance appears later in this report.
Fund vs. Indexes
Total returns, August 31, 2018 to August 31, 2019, at net asset value (NAV). Performance shown does not include applicable contingent deferred sales charges (CDSC) or front-end sales charges, which would have reduced performance.
| Class A Shares | 9.57% |
| Class C Shares | 8.67 |
| Class R Shares | 9.21 |
| Class Y Shares | 9.84 |
| Class R5 Shares | 9.75 |
| Class R6 Shares | 9.91 |
| Bloomberg Barclays U.S. Aggregate Bond Index▼ (Broad Market/Style-Specific Index) | 10.17 |
| Lipper Core Plus Bond Funds Index■ (Peer Group Index) | 9.73 |
| Source(s):▼RIMES Technologies Corp.;■ Lipper Inc. |
Market conditions and your Fund
Throughout the fiscal year, US economic data remained supportive of continued economic expansion as 2019 second quarter gross domestic product grew at 2.0%.1 The US economy continued to add jobs, pushing the unemployment rate to 3.7% at the close of the fiscal year, while inflation remained subdued.2 Against this backdrop, the US Federal Reserve (the Fed) raised the federal funds target rate from a range of 1.75% to 2.00% at the start of the fiscal year to a range of 2.00% to 2.25% at the close of the fiscal year.3 This was accomplished with two 0.25% rate hikes in September and December 2018, followed by a single 0.25% rate cut in July 2019.3 Working against these positive developments, however, were global macroeconomic headwinds in the form of geopolitical trade tension, sub-optimal inflation and the still lingering unknown of Brexit —
the decision by UK voters to leave the European Union. We believe these headwinds, coupled with continued low US inflation, could encourage further Fed rate cuts in the near-term. The uncertainty of the global economic and interest rate environment continued to drive overseas investments into higher yielding segments of the fixed income markets.
The 10-year US Treasury yield continued to move upward at the start of the fiscal year and spiked in October 2018 due to continued strength of the global economy, increased risk of inflation and the high probability of additional Fed rate hikes throughout the fiscal year. However, elevated volatility levels in December led to a severe "risk-off" tone in the markets driving Treasury yields lower. Throughout the remainder of the fiscal year, Treasury yields continued to decline as the Fed adopted a more dovish stance and continued geopolitical uncertainty forced investors to seek higher
quality fixed income instruments. The 10-year US Treasury yield ended the fiscal year at 1.50%, 136 basis points lower than at the beginning of the fiscal year.4 (A basis point is one one-hundredth of a percentage point.)
The broader bond market, as represented by the Bloomberg Barclays U.S. Aggregate Bond Index, gained 10.17% for the fiscal year. Strong performance for the Fund’s broad market/style-specific benchmark was largely attributable to the sharp decline in US Treasury yields. The four primary sectors of the Bloomberg Barclays U.S. Aggregate Bond Index — government-related, corporate, securitized and treasury — posted positive returns for the fiscal year.
The Fund, at NAV, generated positive returns for the fiscal year, but underperformed its broad market/style-specific benchmark. Overweight exposure to investment grade credit was the most notable detractor from the Fund’s relative performance. Underperformance from the investment grade credit sector was driven by slightly wider credit spreads and weaker technicals due in part to declining overseas demand for the asset class stemming from heightened foreign currency hedging costs. Security selection in the financials and energy sectors also detracted from the Fund’s relative performance during the fiscal year, but was slightly offset by security selection within the industrial and communication services sectors.
Overweight exposure to and security selection in commercial mortgage-backed securities, particularly conduit and single borrower issues, contributed to the Fund’s performance relative to the broad market/style-specific index during the fiscal year. The Fund’s out-of-index exposure to US dollar-denominated emerging
| Portfolio Composition |
| By security type, based on Net Assets |
| as of August 31, 2019 |
| U.S. Dollar Denominated Bonds & Notes | 43.01% |
| Asset-Backed Securities | 24.73 |
| U.S. Government Sponsored Agency Mortgage-Backed Securities | 14.96 |
| U.S. Treasury Securities | 12.40 |
| Preferred Stocks | 1.16 |
| Security Types Each Less Than 1% of Portfolio | 2.08 |
| Money Market Funds Plus Other Assets Less Liabilities | 1.66 |
| Top Five Debt Issuers |
| % of total net assets |
| 1. | U.S. Treasury | 12.3% |
| 2. | Federal National Mortgage Association | 7.1 |
| 3. | Freddie Mac Multifamily Structured Pass Through Ctfs. | 5.1 |
| 4. | Hertz Vehicle Financing II L.P. | 2.0 |
| 5. | Sprint Spectrum Co. LLC/Sprint Spectrum Co. II LLC/Sprint Spectrum Co. III LLC | 1.9 |
| Total Net Assets | $4.2 billion |
| Total Number of Holdings* | 954 |
| The Fund’s holdings are subject to change, and there is no assurance that the Fund will continue to hold any particular security. |
| *Excluding money market fund holdings. |
| Data presented here are as of August 31, 2019. |
| 4 | Invesco Core Plus Bond Fund |
market (EM) corporate debt during the fiscal year also contributed to the Fund’s relative performance. Out-of-index exposure, such as high yield and US dollar-denominated EM corporate debt, provided gains despite concerns over global growth, a volatile geopolitical environment and a series of juxtaposed Fed actions. Helping to support returns in high yield and US dollar-denominated EM corporate debt were very accommodative central bank policies.
The Fund’s allocation to cash holdings detracted from relative Fund performance, as intermediate and long duration assets rallied during the fiscal year as a result of lower Treasury rates.
The Fund benefited from incremental income earned from transactions in the highly liquid to-be-announced (TBA) market for agency mortgage-backed securities (MBS). Such transactions involve the Fund selling an MBS to a financial institution, with an agreement to repurchase a substantially similar security at an agreed upon price and date. Cash received by the Fund as a result of this repurchase transaction may be invested in short-term instruments, and the income from these investments, together with any additional fee income received from this activity, generates income for the Fund.
The Fund may use active duration and yield curve positioning for risk management and for generating excess return versus its broad market/style-specific benchmark. Duration measures a portfolio’s price sensitivity to interest rate changes. Yield curve positioning refers to actively emphasizing particular points (maturities) along the yield curve with favorable risk-return expectations. Duration of the portfolio was maintained close to that of the broad market/style-specific benchmark, on average, and the timing of changes and the degree of variance from the Fund’s broad market/style-specific benchmark during the fiscal year provided a small boost to relative returns. Buying and selling US Treasury futures and interest rate swaptions were important tools used for the management of interest rate risk and to maintain our targeted portfolio duration.
Part of the Fund’s strategy to manage credit and currency risk in the portfolio during the fiscal year entailed purchasing and selling credit and currency derivatives. We sought to manage credit market risk by purchasing and selling protection through credit default swaps at various points throughout the fiscal year. The currency management was carried out via currency forwards and options on
an as-needed basis and we believe this was effective in managing the currency positioning within the Fund.
We wish to remind you that the Fund is subject to interest rate risk, meaning when interest rates rise, the value of fixed income securities tends to fall. The degree to which the value of fixed income securities may decline due to rising interest rates may vary depending on the speed and magnitude of the increase in interest rates, as well as individual security characteristics, such as price, maturity, duration and coupon and market forces, such as supply and demand for similar securities. We are monitoring interest rates, as well as the market, economic and geopolitical factors that may impact the direction, speed and magnitude of changes to interest rates across the maturity spectrum, including the potential impact of monetary policy changes by the Fed and certain foreign central banks. If interest rates rise, markets may experience increased volatility, which may affect the value and/or liquidity of certain of the Fund’s investments.
Thank you for investing in Invesco Core Plus Bond Fund and for sharing our long-term investment horizon.
| 1 | Source: Bureau of Economic Analysis |
| 2 | Source: Bureau of Labor Statistics |
| 3 | Source: US Federal Reserve |
| 4 | Source: US Department of the Treasury |
The views and opinions expressed in management’s discussion of Fund performance are those of Invesco Advisers, Inc. These views and opinions are subject to change at any time based on factors such as market and economic conditions. These views and opinions may not be relied upon as investment advice or recommendations, or as an offer for a particular security. The information is not a complete analysis of every aspect of any market, country, industry, security or the Fund. Statements of fact are from sources considered reliable, but Invesco Advisers, Inc. makes no representation or warranty as to their completeness or accuracy. Although historical performance is no guarantee of future results, these insights may help you understand our investment management philosophy.
See important Fund and, if applicable, index disclosures later in this report.
Matt Brill
Chartered Financial Analyst, Portfolio Manager, is manager of Invesco Core Plus Bond Fund. He joined Invesco in 2013. Mr. Brill earned a BA in economics from Washington and Lee University.
Chuck Burge
Portfolio Manager, is manager of Invesco Core Plus Bond Fund. He joined Invesco in 2002. Mr. Burge earned a BS in economics from Texas A&M University and an MBA in finance and accounting from Rice University.
Michael Hyman
Portfolio Manager, is manager of Invesco Core Plus Bond Fund. He joined Invesco in 2013. Mr. Hyman earned a BSE in finance from Pennsylvania State University and an MBA from the Stern School of Business at New York University.
Joseph Portera
Portfolio Manager, is manager of Invesco Core Plus Bond Fund. He joined Invesco in 2012. Mr. Portera earned BA and MA degrees in Soviet studies and an MA in international political economy and development from Fordham University.
Scott Roberts
Chartered Financial Analyst, Portfolio Manager, is manager of Invesco Core Plus Bond Fund. He joined Invesco in 2000. Mr. Roberts earned a BBA in finance from the University of Houston.
| 5 | Invesco Core Plus Bond Fund |
Your Fund’s Long-Term Performance
Results of a $10,000 Investment — Oldest Share Class(es)
Fund and index data from 8/31/09
| 1 | Source: Lipper Inc. |
| 2 | Source: RIMES Technologies Corp. |
Past performance cannot guarantee comparable future results.
The data shown in the chart include reinvested distributions, applicable sales charges and Fund expenses including
management fees. Index results include reinvested dividends, but they do not reflect sales charges. Performance of the peer group, if applicable, reflects fund expenses and management fees; perfor-
mance of a market index does not. Performance shown in the chart and table(s) does not reflect deduction of taxes a shareholder would pay on Fund distributions or sale of Fund shares.
| 6 | Invesco Core Plus Bond Fund |
| Average Annual Total Returns |
| As of 8/31/19, including maximum applicable sales charges |
| Class A Shares | |
| Inception (6/3/09) | 4.50% |
| 10 Years | 4.24 |
| 5 Years | 2.87 |
| 1 Year | 4.89 |
| Class C Shares | |
| Inception (6/3/09) | 4.16% |
| 10 Years | 3.91 |
| 5 Years | 2.98 |
| 1 Year | 7.67 |
| Class R Shares | |
| Inception (6/3/09) | 4.67% |
| 10 Years | 4.43 |
| 5 Years | 3.50 |
| 1 Year | 9.21 |
| Class Y Shares | |
| Inception (6/3/09) | 5.21% |
| 10 Years | 4.97 |
| 5 Years | 4.03 |
| 1 Year | 9.84 |
| Class R5 Shares | |
| Inception (6/3/09) | 5.20% |
| 10 Years | 4.95 |
| 5 Years | 4.02 |
| 1 Year | 9.75 |
| Class R6 Shares | |
| 10 Years | 4.92% |
| 5 Years | 4.09 |
| 1 Year | 9.91 |
Class R6 shares incepted on September 24, 2012. Performance shown prior to that date is that of Class A shares and includes the 12b-1 fees applicable to Class A shares.
The performance data quoted represent past performance and cannot guarantee comparable future results; current performance may be lower or higher. Please visit invesco.com/performance for the most recent month-end performance. Performance figures reflect reinvested distributions, changes in net asset value and the effect of the maximum sales charge unless otherwise stated. Investment return and principal value will fluctuate so that you may have a gain or loss when you sell shares.
The net annual Fund operating expense ratio set forth in the most recent Fund prospectus as of the date of this report for Class A, Class C, Class R, Class Y, Class R5 and Class R6 shares was 0.76%, 1.51% 1.01%, 0.51%, 0.51% and 0.45%, re-
| Average Annual Total Returns |
| As of 6/30/19, the most recent calendar quarter end, including maximum applicable sales charges |
| Class A Shares | |
| Inception (6/3/09) | 4.27% |
| 10 Years | 4.29 |
| 5 Years | 2.42 |
| 1 Year | 3.06 |
| Class C Shares | |
| Inception (6/3/09) | 3.94% |
| 10 Years | 3.96 |
| 5 Years | 2.55 |
| 1 Year | 5.79 |
| Class R Shares | |
| Inception (6/3/09) | 4.45% |
| 10 Years | 4.48 |
| 5 Years | 3.07 |
| 1 Year | 7.32 |
| Class Y Shares | |
| Inception (6/3/09) | 4.98% |
| 10 Years | 5.01 |
| 5 Years | 3.56 |
| 1 Year | 7.85 |
| Class R5 Shares | |
| Inception (6/3/09) | 4.98% |
| 10 Years | 5.01 |
| 5 Years | 3.59 |
| 1 Year | 7.85 |
| Class R6 Shares | |
| 10 Years | 4.97% |
| 5 Years | 3.66 |
| 1 Year | 7.92 |
spectively.1,2 The total annual Fund operating expense ratio set forth in the most recent Fund prospectus as of the date of this report for Class A, Class C, Class R, Class Y, Class R5 and Class R6 shares was 0.84%, 1.59%, 1.09%, 0.59%, 0.56% and 0.46%, respectively. The expense ratios presented above may vary from the expense ratios presented in other sections of this report that are based on expenses incurred during the period covered by this report.
Class A share performance reflects the maximum 4.25% sales charge, and Class C share performance reflects the applicable contingent deferred sales charge (CDSC) for the period involved. The CDSC on Class C shares is 1% for the first year after purchase. Class R, Class Y, Class R5 and Class R6 shares do not have a front-end sales charge or a CDSC; therefore, performance is at net asset value.
The performance of the Fund’s share classes will differ primarily due to dif-
ferent sales charge structures and class expenses.
Fund performance reflects any applicable fee waivers and/or expense reimbursements. Had the adviser not waived fees and/or reimbursed expenses currently or in the past, returns would have been lower. See current prospectus for more information.
| 1 | Total annual Fund operating expenses after any contractual fee waivers and/or expense reimbursements by the adviser in effect through at least December 31, 2019. See current prospectus for more information. |
| 2 | Total annual Fund operating expenses after any contractual fee waivers and/or expense reimbursements by the adviser in effect through at least June 30, 2021. See current prospectus for more information. |
| 7 | Invesco Core Plus Bond Fund |
Invesco Core Plus Bond Fund’s investment objective is total return, comprised of current income and capital appreciation.
| ■ | Unless otherwise stated, information presented in this report is as of August 31, 2019, and is based on total net assets. |
| ■ | Unless otherwise noted, all data provided by Invesco. |
| ■ | To access your Fund’s reports/prospectus, visit invesco.com/fundreports. |
About share classes
| ■ | Class R shares are generally available only to employer sponsored retirement and benefit plans. Please see the prospectus for more information. |
| ■ | Class Y sharesare available only to certain investors. Please see the prospectus for more information. |
| ■ | Class R5 shares and Class R6 sharesare available for use by retirement plans that meet certain standards and for institutional investors. Class R6 shares are also available through intermediaries that have established an agreement with Invesco Distributors, Inc. to make such shares available for use in retail omnibus accounts. Please see the prospectus for more information. |
Principal risks of investing in the Fund
| ■ | Active trading risk. Active trading of portfolio securities may result in added expenses, a lower return and increased tax liability. |
| ■ | Changing fixed income market conditions risk. The current low interest rate environment was created in part by the Federal Reserve Board (FRB) and certain foreign central banks keeping the federal funds and equivalent foreign rates near historical lows. Increases in the federal funds and equivalent foreign rates may expose fixed income markets to heightened volatility and reduced liquidity for certain fixed income investments, particularly those with longer maturities. In addition, decreases in fixed income dealer market-making capacity may also potentially lead to heightened volatility and reduced liquidity in the fixed income markets. As a result, the value of the Fund’s investments and share price may decline. Changes in central bank policies could also result in higher than normal shareholder redemptions, which could potentially increase portfolio turnover and the Fund’s transaction costs. |
| ■ | Collateralized loan obligations risk. CLOs are subject to the risks of substantial losses due to actual defaults by underlying borrowers, which will be greater during periods of economic or financial stress. CLOs may also lose value due to collateral defaults and disappearance of subordinate tranches, market anticipation of defaults, and investor aversion to CLO securities as a class. The risks of CLOs will be greater if the Fund invests in CLOs that hold loans of uncreditworthy borrowers or if the Fund holds subordinate tranches of the CLO that absorbs losses from the defaults before senior tranches. In addition, CLOs are subject to interest rate risk and credit risk. |
| ■ | Debt securities risk. The prices of debt securities held by the Fund will be affected by changes in interest rates, the creditworthiness of the issuer and other factors. An increase in prevailing interest rates typically causes the value of existing debt securities to fall and often has a greater impact on longer-duration debt securities and higher quality debt securities. Falling interest rates will cause the Fund to reinvest the proceeds of debt securities that have been repaid by the issuer at lower interest rates. Falling interest rates may also reduce the Fund’s distributable income because interest payments on floating rate debt instruments held by the Fund will decline. The Fund could lose money on investments in debt securities if the issuer or borrower fails to meet its obligations to make interest payments and/or to repay principal in a timely manner. Changes in an issuer’s financial strength, the market’s perception of such strength or in the credit rating of the issuer or the security may affect the value of debt securities. The Adviser’s credit analysis may fail to anticipate such changes, which could result in buying a debt security at an |
| | inopportune time or failing to sell a debt security in advance of a price decline or other credit event. |
| ■ | Derivatives risk. The value of a derivative instrument depends largely on (and is derived from) the value of an underlying security, currency, commodity, interest rate, index or other asset (each referred to as an underlying asset). In addition to risks relating to the underlying assets, the use of derivatives may include other, possibly greater, risks, including counterparty, leverage and liquidity risks. Counterparty risk is the risk that the counterparty to the derivative contract will default on its obligation to pay the Fund the amount owed or otherwise perform under the derivative contract. Derivatives create leverage risk because they do not require payment up front equal to the economic exposure created by holding a position in the derivative. As a result, an adverse change in the value of the underlying asset could result in the Fund sustaining a loss that is substantially greater than the amount invested in the derivative or the anticipated value of the underlying asset, which may make the Fund’s returns more volatile and increase the risk of loss. Derivative instruments may also be less liquid than more traditional investments and the Fund may be unable to sell or close out its derivative positions at a desirable time or price. This risk may be more acute under adverse market conditions, during which the Fund may be most in need of liquidating its derivative positions. Derivatives may also be harder to value, less tax efficient and subject to changing government regulation that could impact the Fund’s ability to use certain derivatives or their cost. Derivatives strategies may not always be successful. For example, derivatives used for hedging or to gain or limit exposure to a particular market |
This report must be accompanied or preceded by a currently effective Fund prospectus, which contains more complete information, including sales charges and expenses. Investors should read it carefully before investing.
NOT FDIC INSURED | MAY LOSE VALUE | NO BANK GUARANTEE
| 8 | Invesco Core Plus Bond Fund |
| | segment may not provide the expected benefits, particularly during adverse market conditions. |
| ■ | Emerging markets securities risk. Emerging markets (also referred to as developing markets) are generally subject to greater market volatility, political, social and economic instability, uncertain trading markets and more governmental limitations on foreign investment than more developed markets. In addition, companies operating in emerging markets may be subject to lower trading volume and greater price fluctuations than companies in more developed markets. Securities law and the enforcement of systems of taxation in many emerging market countries may change quickly and unpredictably. In addition, investments in emerging markets securities may also be subject to additional transaction costs, delays in settlement procedures, and lack of timely information. |
| ■ | Foreign government debt risk. Investments in foreign government debt securities (sometimes referred to as sovereign debt securities) involve certain risks in addition to those relating to foreign securities or debt securities generally. The issuer of the debt or the governmental authorities that control the repayment of the debt may be unable or unwilling to repay principal or interest when due in accordance with the terms of such debt, and the Fund may have limited recourse in the event of a default against the defaulting government. Without the approval of debt holders, some governmental debtors have in the past been able to reschedule or restructure their debt payments or declare moratoria on payments. |
| ■ | Foreign securities risk. The Fund’s foreign investments may be adversely affected by political and social instability, changes in economic or taxation policies, difficulty in enforcing obligations, decreased liquidity or increased volatility. Foreign investments also involve the risk of the possible seizure, nationalization or expropriation of the issuer or foreign deposits (in which the Fund could lose its entire investments in a certain market) and the possible adoption of foreign governmental restrictions such as exchange controls. Unless the Fund has hedged its foreign securities risk, foreign securities risk also involves the risk of negative foreign currency rate fluctuations, which may cause the |
| | value of securities denominated in such foreign currency (or other instruments through which the Fund has exposure to foreign currencies) to decline in value. Currency exchange rates may fluctuate significantly over short periods of time. Currency hedging strategies, if used, are not always successful. |
| ■ | High yield debt securities (junk bond) risk. Investments in high yield debt securities (“junk bonds”) and other lower-rated securities will subject the Fund to substantial risk of loss. These securities are considered to be speculative with respect to the issuer’s ability to pay interest and principal when due, are more susceptible to default or decline in market value and are less liquid than investment grade debt securities. Prices of high yield debt securities tend to be very volatile. |
| ■ | Liquidity risk. The Fund may be unable to sell illiquid investments at the time or price it desires and, as a result, could lose its entire investment in such investments. Liquid securities can become illiquid during periods of market stress. If a significant amount of the Fund’s securities become illiquid, the Fund may not be able to timely pay redemption proceeds and may need to sell securities at significantly reduced prices. |
| ■ | Management risk. The Fund is actively managed and depends heavily on the Adviser’s judgment about markets, interest rates or the attractiveness, relative values, liquidity, or potential appreciation of particular investments made for the Fund’s portfolio. The Fund could experience losses if these judgments prove to be incorrect. Additionally, legislative, regulatory, or tax developments may adversely affect management of the Fund and, therefore, the ability of the Fund to achieve its investment objective. |
| ■ | Market risk. The market values of the Fund’s investments, and therefore the value of the Fund’s shares, will go up and down, sometimes rapidly or unpredictably. Market risk may affect a single issuer, industry or section of the economy, or it may affect the market as a whole. Individual stock prices tend to go up and down more dramatically than those of certain other types of investments, such as bonds. During a general downturn in the financial markets, multiple asset classes may decline in value. When |
| | markets perform well, there can be no assurance that specific investments held by the Fund will rise in value. |
| ■ | Mortgage- and asset-backed securities risk. Mortgage- and asset-backed securities, including collateralized debt obligations and collateralized mortgage obligations, are subject to prepayment or call risk, which is the risk that a borrower’s payments may be received earlier or later than expected due to changes in prepayment rates on underlying loans. This could result in the Fund reinvesting these early payments at lower interest rates, thereby reducing the Fund’s income. Mortgage- and asset-backed securities also are subject to extension risk, which is the risk that an unexpected rise in interest rates could reduce the rate of prepayments, causing the price of the mortgage- and asset-backed securities and the Fund’s share price to fall. An unexpectedly high rate of defaults on the mortgages held by a mortgage pool may adversely affect the value of mortgage-backed securities and could result in losses to the Fund. The Fund may invest in mortgage pools that include subprime mortgages, which are loans made to borrowers with weakened credit histories or with lower capacity to make timely payments on their mortgages. Privately issued mortgage-related securities are not subject to the same underwriting requirements as those with government or government-sponsored entity guarantees and, therefore, mortgage loans underlying privately issued mortgage-related securities may have less favorable collateral, credit risk or other underwriting characteristics, and wider variances in interest rate, term, size, purpose and borrower characteristics. |
| ■ | Municipal securities risk. The risk of a municipal obligation generally depends on the financial and credit status of the issuer. Constitutional amendments, legislative enactments, executive orders, administrative regulations, voter initiatives, and the issuer’s regional economic conditions may affect the municipal security’s value, interest payments, repayment of principal and the Fund’s ability to sell the security. Failure of a municipal security issuer to comply with applicable tax requirements may make income paid thereon taxable, resulting in a |
| 9 | Invesco Core Plus Bond Fund |
| | decline in the security’s value. In addition, there could be changes in applicable tax laws or tax treatments that reduce or eliminate the current federal income tax exemption on municipal securities or otherwise adversely affect the current federal or state tax status of municipal securities. |
| ■ | TBA transactions risk. TBA transactions involve the risk of loss if the securities received are less favorable than what was anticipated by the Fund when entering into the TBA transaction, or if the counterparty fails to deliver the securities. When the Fund enters into a short sale of a TBA mortgage it does not own, the Fund may have to purchase deliverable mortgages to settle the short sale at a higher price than anticipated, thereby causing a loss. As there is no limit on how much the price of mortgage securities can increase, the Fund’s exposure is unlimited. The Fund may not always be able to purchase mortgage securities to close out the short position at a particular time or at an acceptable price. In addition, taking short positions results in a form of leverage, which could increase the volatility of the Fund’s share price. |
| ■ | US government obligations risk. Obligations of US government agencies and authorities receive varying levels of support and may not be backed by the full faith and credit of the US government, which could affect the Fund’s ability to recover should they default. No assurance can be given that the US government will provide financial support to its agencies and authorities if it is not obligated by law to do so. |
| ■ | When-issued, delayed delivery and forward commitment risks. When-issued and delayed delivery transactions subject the Fund to market risk because the value or yield of a security at delivery may be more or less than the purchase price or yield generally available when delivery occurs, and counterparty risk because the Fund relies on the buyer or seller, as the case may be, to consummate the transaction. These transactions also have a leveraging effect on the Fund because the Fund commits to purchase securities that it does not have to pay for until a later date, which increases the Fund’s overall investment exposure and, as a result, its volatility. |
| ■ | Zero coupon or pay-in-kind securities risk. The value, interest rates, and |
liquidity of non-cash paying instruments, such as zero coupon and pay-in-kind securities, are subject to greater fluctuation than other types of securities. The higher yields and interest rates on pay-in-kind securities reflect the payment deferral and increased credit risk associated with such instruments and that such investments may represent a higher credit risk than loans that periodically pay interest.
About indexes used in this report
| ■ | TheBloomberg Barclays U.S. Aggregate Bond Index is an unmanaged index considered representative of the US investment grade, fixed-rate bond market. |
| ■ | TheLipper Core Plus Bond Funds Index is an unmanaged index considered representative of core plus bond funds tracked by Lipper. |
| ■ | The Fund is not managed to track the performance of any particular index, including the index(es) described here, and consequently, the performance of the Fund may deviate significantly from the performance of the index(es). |
| ■ | A direct investment cannot be made in an index. Unless otherwise indicated, index results include reinvested dividends, and they do not reflect sales charges. Performance of the peer group, if applicable, reflects fund expenses; performance of a market index does not. |
Other information
| ■ | The returns shown in management’s discussion of Fund performance are based on net asset values (NAVs) calculated for shareholder transactions. Generally accepted accounting principles require adjustments to be made to the net assets of the Fund at period end for financial reporting purposes, and as such, the NAVs for shareholder transactions and the returns based on those NAVs may differ from the NAVs and returns reported in the Financial Highlights. |
| ■ | Industry classifications used in this report are generally according to the Global Industry Classification Standard, which was developed by and is the exclusive property and a service mark of MSCI Inc. and Standard & Poor’s. |
| 10 | Invesco Core Plus Bond Fund |
Schedule of Investments(a)
August 31, 2019
| | | Principal
Amount | Value |
| U.S. Dollar Denominated Bonds & Notes–43.01% |
| Aerospace & Defense–0.05% |
| L3Harris Technologies, Inc., 3.85%, 12/15/2026(b) | | | $600,000 | $651,492 |
| Moog, Inc., 5.25%, 12/01/2022(b) | | | 97,000 | 99,061 |
| Northrop Grumman Corp., 3.25%, 01/15/2028 | | | 300,000 | 318,970 |
| TransDigm UK Holdings PLC, 6.88%, 05/15/2026 | | | 321,000 | 337,050 |
| TransDigm, Inc., | | | |
| 6.50%, 07/15/2024 | | | 128,000 | 132,640 |
| 6.50%, 05/15/2025 | | | 201,000 | 210,296 |
| Triumph Group, Inc., 7.75%, 08/15/2025 | | | 368,000 | 369,840 |
| | | | | 2,119,349 |
| Agricultural & Farm Machinery–0.01% |
| Titan International, Inc., 6.50%, 11/30/2023 | | | 541,000 | 434,153 |
| Agricultural Products–0.01% |
| JBS Investments II GmbH, 5.75%, 01/15/2028(b) | | | 200,000 | 210,450 |
| Kernel Holding S.A. (Ukraine), REGS, 8.75%, 01/31/2022(b) | | | 266,000 | 282,702 |
| | | | | 493,152 |
| Air Freight & Logistics–0.00% |
| XPO Logistics, Inc., 6.50%, 06/15/2022(b) | | | 67,000 | 68,637 |
| Airlines–3.49% |
| American Airlines Group, Inc., 5.00%, 06/01/2022(b) | | | 3,631,000 | 3,780,779 |
| American Airlines Pass Through Trust, | | | |
| Series 2017-1, Class B, 4.95%, 02/15/2025 | | | 4,588,210 | 4,890,186 |
| Series 2016-3, Class B, 3.75%, 10/15/2025 | | | 4,530,559 | 4,669,117 |
| Series 2017-2, Class B, 3.70%, 10/15/2025 | | | 5,865,282 | 5,939,611 |
| Series 2019-1, Class B, 3.85%, 02/15/2028 | | | 5,300,000 | 5,369,002 |
| Series 2017-2, Class A, 3.60%, 10/15/2029 | | | 8,684,101 | 8,906,949 |
| Series 2019-1, Class A, 3.50%, 02/15/2032 | | | 8,188,000 | 8,492,880 |
| Series 2019-1, Class AA, 3.15%, 02/15/2032 | | | 9,198,000 | 9,546,562 |
| Avianca Holdings S.A./Avianca Leasing LLC/Grupo Taca Holdings Ltd. (Colombia), REGS, 8.38%, 05/10/2020(b) | | | 8,219,000 | 6,523,831 |
| | | Principal
Amount | Value |
| Airlines–(continued) |
| British Airways Pass Through Trust (United Kingdom), | | | |
| Series 2019-1, Class A, 3.35%, 06/15/2029(b) | | | $6,303,000 | $6,502,741 |
| Series 2019-1, Class AA, 3.30%, 12/15/2032(b) | | | 11,075,000 | 11,662,591 |
| Delta Air Lines Pass Through Trust, Series 2019-1, Class A, 3.40%, 04/25/2024 | | | 2,033,000 | 2,142,672 |
| Delta Air Lines, Inc., | | | |
| 2.88%, 03/13/2020 | | | 4,744,000 | 4,745,449 |
| 2.60%, 12/04/2020 | | | 8,050,000 | 8,078,112 |
| 3.40%, 04/19/2021 | | | 2,569,000 | 2,605,394 |
| 3.63%, 03/15/2022 | | | 7,899,000 | 8,134,254 |
| 3.80%, 04/19/2023 | | | 4,552,000 | 4,739,325 |
| LATAM Airlines Group S.A. Pass Through Trust (Chile), Series 2015-1, Class A, 4.20%, 11/15/2027 | | | 5,203,154 | 5,234,112 |
| Latam Finance Ltd. (Chile), 7.00%, 03/01/2026(b) | | | 225,000 | 234,283 |
| Norwegian Air Shuttle ASA Pass Through Trust (Norway), Series 2016-1, Class B, 7.50%, 11/10/2023(b) | | | 14,937,671 | 15,382,066 |
| United Airlines Pass Through Trust, | | | |
| Series 2018-1, Class A, 3.70%, 03/01/2030 | | | 7,843,048 | 8,284,234 |
| Series 2018-1, Class AA, 3.50%, 03/01/2030 | | | 11,591,636 | 12,297,333 |
| US Airways Pass Through Trust, Series 2012-1, Class B, 8.00%, 04/01/2021 | | | 6,436 | 6,456 |
| | | | | 148,167,939 |
| Alternative Carriers–0.06% |
| CenturyLink, Inc., | | | |
| Series S, 6.45%, 06/15/2021 | | | 468,000 | 494,325 |
| Series Y, 7.50%, 04/01/2024 | | | 722,000 | 803,211 |
| Level 3 Financing, Inc., | | | |
| 5.38%, 05/01/2025 | | | 837,000 | 872,572 |
| 5.25%, 03/15/2026 | | | 366,000 | 382,470 |
| | | | | 2,552,578 |
| Aluminum–0.10% |
| Alcoa Nederland Holding B.V., 6.75%, 09/30/2024(b) | | | 350,000 | 368,375 |
| Indonesia Asahan Aluminium Persero PT (Persero) (Indonesia), 5.23%, 11/15/2021(b) | | | 3,530,000 | 3,721,824 |
See accompanying Notes to Financial Statements which are an integral part of the financial statements.
| 11 | Invesco Core Plus Bond Fund |
| | | Principal
Amount | Value |
| Aluminum–(continued) |
| PT Indonesia Asahan Aluminium (Persero) (Indonesia), 5.71%, 11/15/2023(b) | | | $200,000 | $222,021 |
| | | | | 4,312,220 |
| Apparel Retail–0.08% |
| L Brands, Inc., | | | |
| 5.63%, 02/15/2022 | | | 2,621,000 | 2,765,155 |
| 6.88%, 11/01/2035 | | | 281,000 | 238,850 |
| 6.75%, 07/01/2036 | | | 22,000 | 18,590 |
| Michaels Stores, Inc., 8.00%, 07/15/2027(b) | | | 297,000 | 285,557 |
| | | | | 3,308,152 |
| Apparel, Accessories & Luxury Goods–0.01% |
| Hanesbrands, Inc., | | | |
| 4.63%, 05/15/2024(b) | | | 31,000 | 32,589 |
| 4.88%, 05/15/2026(b) | | | 547,000 | 579,371 |
| | | | | 611,960 |
| Asset Management & Custody Banks–0.35% |
| Affiliated Managers Group, Inc., 4.25%, 02/15/2024 | | | 660,000 | 710,078 |
| Apollo Management Holdings L.P., 4.00%, 05/30/2024(b) | | | 5,598,000 | 5,958,630 |
| Blackstone Holdings Finance Co. LLC, 5.00%, 06/15/2044(b) | | | 3,581,000 | 4,465,507 |
| Carlyle Holdings II Finance LLC, 5.63%, 03/30/2043(b) | | | 2,866,000 | 3,437,658 |
| Prime Security Services Borrower LLC/Prime Finance, Inc., 9.25%, 05/15/2023(b) | | | 257,000 | 270,743 |
| | | | | 14,842,616 |
| Auto Parts & Equipment–0.02% |
| Dana, Inc., 5.50%, 12/15/2024 | | | 414,000 | 424,350 |
| Delphi Technologies PLC, 5.00%, 10/01/2025(b) | | | 166,000 | 144,005 |
| Flexi-Van Leasing, Inc., 10.00%, 02/15/2023(b) | | | 191,000 | 187,657 |
| | | | | 756,012 |
| Automobile Manufacturers–2.38% |
| Ford Motor Credit Co. LLC, | | | |
| 2.68%, 01/09/2020 | | | 5,293,000 | 5,294,433 |
| 5.09%, 01/07/2021 | | | 12,522,000 | 12,904,438 |
| 3.81%, 10/12/2021 | | | 8,681,000 | 8,829,208 |
| 5.60%, 01/07/2022 | | | 7,258,000 | 7,677,834 |
| 5.58%, 03/18/2024 | | | 14,479,000 | 15,581,184 |
| General Motors Co., 4.88%, 10/02/2023 | | | 370,000 | 398,268 |
| General Motors Financial Co., Inc., | | | |
| 3.16%, (3 mo. USD LIBOR + 0.85%), 04/09/2021(c) | | | 6,385,000 | 6,385,277 |
| 3.55%, 07/08/2022 | | | 9,923,000 | 10,176,323 |
| Hyundai Capital America, 4.30%, 02/01/2024(b) | | | 16,343,000 | 17,323,730 |
| | | Principal
Amount | Value |
| Automobile Manufacturers–(continued) |
| J.B. Poindexter & Co., Inc., 7.13%, 04/15/2026(b) | | | $602,000 | $618,555 |
| Toyota Motor Corp. (Japan), 3.42%, 07/20/2023 | | | 300,000 | 318,874 |
| Volkswagen Group of America Finance, LLC (Germany), | | | |
| 2.95%, (3 mo. USD LIBOR + 0.77%), 11/13/2020(b)(c) | | | 6,674,000 | 6,704,212 |
| 3.12%, (3 mo. USD LIBOR + 0.94%), 11/12/2021(b)(c) | | | 7,881,000 | 7,924,960 |
| 4.25%, 11/13/2023(b) | | | 600,000 | 641,986 |
| | | | | 100,779,282 |
| Automotive Retail–0.06% |
| AutoZone, Inc., 3.75%, 04/18/2029 | | | 600,000 | 648,819 |
| Lithia Motors, Inc., 5.25%, 08/01/2025(b) | | | 85,000 | 88,294 |
| Murphy Oil USA, Inc., 5.63%, 05/01/2027 | | | 472,000 | 497,960 |
| O’Reilly Automotive, Inc., 3.90%, 06/01/2029 | | | 700,000 | 770,369 |
| Penske Automotive Group, Inc., 5.50%, 05/15/2026 | | | 584,000 | 613,930 |
| | | | | 2,619,372 |
| Brewers–0.01% |
| Anheuser-Busch Cos. LLC / Anheuser-Busch InBev Worldwide, Inc. (Belgium), 3.65%, 02/01/2026 | | | 485,000 | 521,580 |
| Broadcasting–0.04% |
| AMC Networks, Inc., | | | |
| 5.00%, 04/01/2024 | | | 155,000 | 160,038 |
| 4.75%, 08/01/2025 | | | 244,000 | 250,100 |
| CBS Corp., 3.50%, 01/15/2025 | | | 275,000 | 286,901 |
| Gray Television, Inc., 7.00%, 05/15/2027(b) | | | 185,000 | 202,982 |
| iHeartCommunications, Inc., | | | |
| 8.38%, 05/01/2027 | | | 146,000 | 158,228 |
| 5.25%, 08/15/2027(b) | | | 236,000 | 248,727 |
| Tribune Media Co., 5.88%, 07/15/2022 | | | 123,000 | 124,807 |
| TV Azteca, S.A.B. de C.V. (Mexico), REGS, 8.25%, 08/09/2024(b) | | | 265,000 | 260,034 |
| | | | | 1,691,817 |
| Building Products–0.03% |
| Owens Corning, 4.20%, 12/01/2024 | | | 500,000 | 530,605 |
| Standard Industries, Inc., | | | |
| 6.00%, 10/15/2025(b) | | | 486,000 | 513,338 |
| 5.00%, 02/15/2027(b) | | | 192,000 | 197,280 |
| | | | | 1,241,223 |
See accompanying Notes to Financial Statements which are an integral part of the financial statements.
| 12 | Invesco Core Plus Bond Fund |
| | | Principal
Amount | Value |
| Cable & Satellite–1.07% |
| Altice Financing S.A. (Luxembourg), | | | |
| 6.63%, 02/15/2023(b) | | | $200,000 | $206,750 |
| 7.50%, 05/15/2026(b) | | | 400,000 | 427,000 |
| Altice Luxembourg S.A. (Luxembourg), | | | |
| 7.75%, 05/15/2022(b) | | | 200,000 | 205,605 |
| 10.50%, 05/15/2027(b) | | | 210,000 | 228,900 |
| CCO Holdings LLC/CCO Holdings Capital Corp., | | | |
| 5.75%, 09/01/2023 | | | 245,000 | 250,415 |
| 5.75%, 02/15/2026(b) | | | 1,985,000 | 2,106,581 |
| Charter Communications Operating, LLC/Charter Communications Operating Capital Corp., | | | |
| 4.46%, 07/23/2022 | | | 265,000 | 280,097 |
| 4.91%, 07/23/2025 | | | 260,000 | 287,569 |
| 5.38%, 04/01/2038 | | | 5,235,000 | 5,914,165 |
| 5.38%, 05/01/2047 | | | 4,585,000 | 5,100,388 |
| Comcast Corp., | | | |
| 3.95%, 10/15/2025 | | | 4,479,000 | 4,908,008 |
| 4.60%, 10/15/2038 | | | 5,889,000 | 7,139,874 |
| 3.40%, 07/15/2046 | | | 500,000 | 521,243 |
| Cox Communications, Inc., 3.35%, 09/15/2026(b) | | | 4,933,000 | 5,132,279 |
| CSC Holdings, LLC, | | | |
| 7.75%, 07/15/2025(b) | | | 395,000 | 425,119 |
| 10.88%, 10/15/2025(b) | | | 500,000 | 568,437 |
| 5.50%, 05/15/2026(b) | | | 200,000 | 212,000 |
| 5.75%, 01/15/2030(b) | | | 226,000 | 236,735 |
| Discovery Communications LLC, 5.20%, 09/20/2047 | | | 365,000 | 413,683 |
| DISH DBS Corp., | | | |
| 7.88%, 09/01/2019 | | | 387,000 | 387,000 |
| 5.88%, 11/15/2024 | | | 1,757,000 | 1,678,023 |
| Globo Comunicacao E Participacoes S.A. (Brazil), 5.13%, 03/31/2027(b) | | | 267,000 | 272,674 |
| Sirius XM Radio, Inc., | | | |
| 4.63%, 07/15/2024(b) | | | 5,296,000 | 5,540,940 |
| 5.38%, 07/15/2026(b) | | | 609,000 | 645,540 |
| Telenet Finance Luxembourg Notes S.a r.l. (Belgium), 5.50%, 03/01/2028(b) | | | 400,000 | 408,800 |
| Unitymedia Hessen GmbH & Co. KG/Unitymedia NRW GmbH (Germany), 5.00%, 01/15/2025(b) | | | 400,000 | 414,548 |
| UPC Holding B.V. (Netherlands), 5.50%, 01/15/2028(b) | | | 200,000 | 209,000 |
| Virgin Media Secured Finance PLC (United Kingdom), 5.50%, 08/15/2026(b) | | | 700,000 | 734,125 |
| VTR Finance B.V. (Chile), 6.88%, 01/15/2024(b) | | | 224,000 | 232,120 |
| Ziggo B.V. (Netherlands), 5.50%, 01/15/2027(b) | | | 250,000 | 264,988 |
| | | | | 45,352,606 |
| | | Principal
Amount | Value |
| Casinos & Gaming–0.41% |
| Boyd Gaming Corp., | | | |
| 6.38%, 04/01/2026 | | | $163,000 | $173,391 |
| 6.00%, 08/15/2026 | | | 126,000 | 133,560 |
| Las Vegas Sands Corp., | | | |
| 3.20%, 08/08/2024 | | | 10,017,000 | 10,234,071 |
| 3.50%, 08/18/2026 | | | 4,689,000 | 4,798,601 |
| MGM Resorts International, | | | |
| 7.75%, 03/15/2022 | | | 110,000 | 123,775 |
| 6.00%, 03/15/2023 | | | 485,000 | 534,712 |
| 4.63%, 09/01/2026 | | | 350,000 | 364,000 |
| Scientific Games International, Inc., 10.00%, 12/01/2022 | | | 298,000 | 310,293 |
| Studio City Finance Ltd. (Macau), 7.25%, 02/11/2024(b) | | | 200,000 | 209,750 |
| Wynn Las Vegas LLC/Wynn Las Vegas Capital Corp., 5.50%, 03/01/2025(b) | | | 436,000 | 461,070 |
| | | | | 17,343,223 |
| Coal & Consumable Fuels–0.02% |
| SunCoke Energy Partners L.P./SunCoke Energy Partners Finance Corp., 7.50%, 06/15/2025(b) | | | 717,000 | 681,598 |
| Commodity Chemicals–0.02% |
| Alpek SAB de C.V. (Mexico), REGS, 4.50%, 11/20/2022(b) | | | 300,000 | 314,100 |
| Koppers, Inc., 6.00%, 02/15/2025(b) | | | 159,000 | 155,423 |
| Nufarm Australia Ltd./Nufarm Americas, Inc. (Australia), 5.75%, 04/30/2026(b) | | | 170,000 | 161,075 |
| Olin Corp., 5.63%, 08/01/2029 | | | 366,000 | 381,097 |
| | | | | 1,011,695 |
| Communications Equipment–0.03% |
| CommScope Technologies LLC, 6.00%, 06/15/2025(b) | | | 593,000 | 532,217 |
| Hughes Satellite Systems Corp., | | | |
| 7.63%, 06/15/2021 | | | 249,000 | 269,543 |
| 5.25%, 08/01/2026 | | | 614,000 | 653,142 |
| | | | | 1,454,902 |
| Construction & Engineering–0.02% |
| AECOM, 5.13%, 03/15/2027 | | | 97,000 | 101,803 |
| Bioceanico Sovereign Certificate Ltd. (Cayman Islands), 0.00%, 06/05/2034(b)(d) | | | 150,000 | 103,500 |
| William Lyon Homes, Inc., | | | |
| 6.00%, 09/01/2023 | | | 79,000 | 82,358 |
| 6.63%, 07/15/2027(b) | | | 386,000 | 387,930 |
| | | | | 675,591 |
| Construction Machinery & Heavy Trucks–0.02% |
| Oshkosh Corp., 5.38%, 03/01/2025 | | | 379,000 | 394,160 |
See accompanying Notes to Financial Statements which are an integral part of the financial statements.
| 13 | Invesco Core Plus Bond Fund |
| | | Principal
Amount | Value |
| Construction Machinery & Heavy Trucks–(continued) |
| Wabtec Corp., 4.95%, 09/15/2028 | | | $236,000 | $263,680 |
| | | | | 657,840 |
| Consumer Finance–0.54% |
| Ally Financial, Inc., | | | |
| 8.00%, 03/15/2020 | | | 145,000 | 149,423 |
| 4.13%, 03/30/2020 | | | 4,449,000 | 4,493,490 |
| 5.13%, 09/30/2024 | | | 919,000 | 1,029,280 |
| 4.63%, 03/30/2025 | | | 750,000 | 822,187 |
| Credit Acceptance Corp., 6.63%, 03/15/2026(b) | | | 5,071,000 | 5,498,891 |
| Discover Bank, 3.45%, 07/27/2026 | | | 335,000 | 350,345 |
| Navient Corp., | | | |
| 8.00%, 03/25/2020 | | | 235,000 | 242,638 |
| 7.25%, 01/25/2022 | | | 870,000 | 957,000 |
| 7.25%, 09/25/2023 | | | 875,000 | 974,531 |
| Synchrony Financial, 4.50%, 07/23/2025 | | | 5,120,000 | 5,506,805 |
| Unifin Financiera, S.A.B. de C.V., SOFOM, E.N.R. (Mexico), 7.38%, 02/12/2026(b) | | | 3,013,000 | 2,877,114 |
| | | | | 22,901,704 |
| Copper–0.46% |
| First Quantum Minerals Ltd. (Zambia), 7.50%, 04/01/2025(b) | | | 600,000 | 552,000 |
| Freeport-McMoRan, Inc., | | | |
| 5.00%, 09/01/2027 | | | 16,460,000 | 16,460,000 |
| 5.40%, 11/14/2034 | | | 1,706,000 | 1,646,290 |
| Southern Copper Corp. (Peru), 7.50%, 07/27/2035 | | | 200,000 | 271,000 |
| Taseko Mines Ltd. (Canada), 8.75%, 06/15/2022(b) | | | 543,000 | 519,922 |
| | | | | 19,449,212 |
| Data Processing & Outsourced Services–0.13% |
| Fidelity National Information Services, Inc., 4.50%, 08/15/2046 | | | 4,764,000 | 5,607,231 |
| Department Stores–0.20% |
| Macy’s Retail Holdings, Inc., 4.38%, 09/01/2023 | | | 7,997,000 | 8,170,269 |
| SACI Falabella (Chile), 3.75%, 10/30/2027(b) | | | 200,000 | 206,502 |
| | | | | 8,376,771 |
| Distillers & Vintners–0.12% |
| Constellation Brands, Inc., 2.86% (3 mo. USD LIBOR + 0.70%), 11/15/2021(c) | | | 5,132,000 | 5,133,249 |
| | Principal
Amount | Value |
| Diversified Banks–6.26% |
| ABN AMRO Bank N.V. (Netherlands), 2.45%, 06/04/2020(b) | | $6,244,000 | $6,255,527 |
| Africa Finance Corp. (Supranational), 4.38%, 04/17/2026(b) | | 20,285,000 | 21,350,774 |
| Australia & New Zealand Banking Group Ltd. (Australia), 6.75%(b)(e) | | 5,945,000 | 6,574,308 |
| Banco Bilbao Vizcaya Argentaria S.A. (Spain), Series 9, 6.50%(e) | | 9,400,000 | 9,536,300 |
| Banco de Bogota S.A. (Colombia), 4.38%, 08/03/2027(b) | | 400,000 | 423,504 |
| Banco del Estado de Chile (Chile), REGS, 4.13%, 10/07/2020(b) | | 300,000 | 305,968 |
| Banco do Brasil S.A. (Brazil), REGS, 8.50%(b)(e) | | 5,349,000 | 5,656,621 |
| Banco Mercantil del Norte, S.A. (Mexico), 6.75% (5 yr. U.S. Treasury Yield Curve Rate + 4.97%)(b)(e) | | 200,000 | 197,680 |
| Banco Safra S.A. (Brazil), 4.13%, 02/08/2023(b) | | 250,000 | 255,000 |
| Bank of America Corp., 4.20%, 08/26/2024 | | 4,663,000 | 5,035,833 |
| Barclays Bank PLC (United Kingdom), 7.63%, 11/21/2022 | | 200,000 | 220,643 |
| Barclays PLC (United Kingdom), | | |
| 6.63%(e) | | 7,410,000 | 7,422,315 |
| 4.84%, 05/09/2028 | | 2,345,000 | 2,436,210 |
| BBVA Bancomer S.A. (Mexico), | | |
| 7.25%, 04/22/2020(b) | | 5,605,000 | 5,759,194 |
| 4.38%, 04/10/2024(b) | | 1,385,000 | 1,450,801 |
| BNP Paribas S.A. (France), | | |
| 2.38%, 05/21/2020 | | 6,282,000 | 6,294,888 |
| 4.38%, 03/01/2033(b) | | 11,980,000 | 12,753,722 |
| BPCE S.A. (France), 12.50%(b)(e) | | 3,375,000 | 3,415,500 |
| Citigroup, Inc., | | |
| Series Q, 5.95%(e) | | 1,480,000 | 1,508,068 |
| Series T, 6.25%(e) | | 6,669,000 | 7,474,982 |
| 5.50%, 09/13/2025 | | 6,552,000 | 7,515,046 |
| 4.45%, 09/29/2027 | | 9,614,000 | 10,589,186 |
| Credit Agricole S.A. (France), REGS, 8.13%(b)(e) | | 202,000 | 236,170 |
| Development Bank of Kazakhstan JSC (Kazakhstan), REGS, 4.13%, 12/10/2022(b) | | 300,000 | 311,808 |
| DIB Sukuk Ltd. (United Arab Emirates), REGS, 3.66%, 02/14/2022(b) | | 200,000 | 205,276 |
| Export-Import Bank of India (India), REGS, 3.38%, 08/05/2026(b) | | 200,000 | 206,300 |
| Global Bank Corp. (Panama), | | |
| 4.50%, 10/20/2021(b) | | 7,642,000 | 7,882,723 |
| 5.25%, 04/16/2029(b) | | 1,484,000 | 1,601,236 |
See accompanying Notes to Financial Statements which are an integral part of the financial statements.
| 14 | Invesco Core Plus Bond Fund |
| | | Principal
Amount | Value |
| Diversified Banks–(continued) |
| HSBC Holdings PLC (United Kingdom), | | | |
| 6.00%(e) | | | $10,561,000 | $10,603,455 |
| 3.12%, (3 mo. USD LIBOR + 1.00%), 05/18/2024(c) | | | 6,489,000 | 6,501,830 |
| 4.38%, 11/23/2026 | | | 570,000 | 613,320 |
| Industrial Senior Trust (Guatemala), REGS, 5.50%, 11/01/2022(b) | | | 500,000 | 519,750 |
| ING Bank N.V. (Netherlands), 2.75%, 03/22/2021(b) | | | 5,088,000 | 5,136,160 |
| JPMorgan Chase & Co., | | | |
| Series I, 5.74% (3 mo. USD LIBOR + 3.47%)(c)(e) | | | 8,921,000 | 8,980,949 |
| 2.30%, 08/15/2021 | | | 8,152,000 | 8,174,113 |
| 3.15%, (3 mo. USD LIBOR + 0.89%), 07/23/2024(c) | | | 14,136,000 | 14,197,040 |
| 3.63%, 12/01/2027 | | | 5,110,000 | 5,436,953 |
| 3.78%, 02/01/2028 | | | 5,425,000 | 5,908,367 |
| Series W, 3.16% (3 mo. USD LIBOR + 1.00%), 05/15/2047(c) | | | 11,797,000 | 9,101,621 |
| Lloyds Banking Group PLC (United Kingdom), 4.65%, 03/24/2026 | | | 500,000 | 528,159 |
| Multibank, Inc. (Panama), 4.38%, 11/09/2022(b) | | | 200,000 | 206,000 |
| National Australia Bank Ltd. (Australia), 3.93%, 08/02/2034(b) | | | 4,120,000 | 4,264,145 |
| Nordea Bank Abp (Finland), 5.50%(b)(e) | | | 3,560,000 | 3,572,852 |
| QNB Finance Ltd. (Qatar), REGS, 2.13%, 09/07/2021(b) | | | 340,000 | 337,802 |
| Shinhan Financial Group Co. Ltd. (South Korea), 3.34%, 02/05/2030(b) | | | 200,000 | 204,655 |
| SMBC Aviation Capital Finance DAC (Ireland), | | | |
| 3.00%, 07/15/2022(b) | | | 4,160,000 | 4,231,830 |
| 4.13%, 07/15/2023(b) | | | 8,347,000 | 8,862,045 |
| Societe Generale S.A. (France), | | | |
| 7.38%(b)(e) | | | 2,988,000 | 3,148,605 |
| REGS, 7.38%(b)(e) | | | 202,000 | 212,857 |
| Standard Chartered PLC (United Kingdom), | | | |
| 7.75%(b)(e) | | | 5,720,000 | 6,124,490 |
| 3.43%, (3 mo. USD LIBOR + 1.15%), 01/20/2023(b)(c) | | | 3,722,000 | 3,717,567 |
| REGS, 7.50%(b)(e) | | | 200,000 | 209,750 |
| Sumitomo Mitsui Financial Group, Inc. (Japan), 3.04%, 07/16/2029 | | | 11,770,000 | 12,194,243 |
| Wells Fargo & Co., 5.38%, 11/02/2043 | | | 7,491,000 | 9,906,007 |
| | | | | 265,770,148 |
| | | Principal
Amount | Value |
| Diversified Capital Markets–0.12% |
| Credit Suisse Group AG (Switzerland), 7.50%(b)(e) | | | $305,000 | $337,364 |
| Credit Suisse Group Funding (Guernsey) Ltd. (Switzerland), 3.75%, 03/26/2025 | | | 725,000 | 766,851 |
| UBS AG (Switzerland), 4.88%, 08/04/2020 | | | 3,987,000 | 4,091,287 |
| | | | | 5,195,502 |
| Diversified Chemicals–0.23% |
| Chemours Co. (The), 7.00%, 05/15/2025 | | | 275,000 | 272,250 |
| CNAC (HK) Finbridge Co. Ltd. (China), REGS, 3.00%, 07/19/2020(b) | | | 300,000 | 301,461 |
| Dow Chemical Co. (The), | | | |
| 3.15%, 05/15/2024(b) | | | 4,769,000 | 4,928,378 |
| 4.55%, 11/30/2025(b) | | | 500,000 | 551,816 |
| OCP S.A. (Morocco), | | | |
| 4.50%, 10/22/2025(b) | | | 1,940,000 | 2,062,639 |
| REGS, 4.50%, 10/22/2025(b) | | | 700,000 | 744,251 |
| Office Cherifien desA Phosphates (Morocco), REGS, 6.88%, 04/25/2044(b) | | | 400,000 | 498,980 |
| SABIC Capital II B.V. (Saudi Arabia), | | | |
| 4.00%, 10/10/2023(b) | | | 200,000 | 212,788 |
| 4.50%, 10/10/2028(b) | | | 200,000 | 226,488 |
| Trinseo Materials Operating S.C.A./Trinseo Materials Finance, Inc., 5.38%, 09/01/2025(b) | | | 97,000 | 91,423 |
| | | | | 9,890,474 |
| Diversified Metals & Mining–0.29% |
| Corp. Nacional del Cobre de Chile (Chile), 3.63%, 08/01/2027(b) | | | 200,000 | 214,582 |
| Hudbay Minerals, Inc. (Canada), 7.63%, 01/15/2025(b) | | | 448,000 | 456,951 |
| Minmetals Bounteous Finance (BVI) Ltd. (China), | | | |
REGS,
3.50%, 07/30/2020(b) | | | 300,000 | 302,528 |
| 3.13%, 07/27/2021(b) | | | 300,000 | 302,388 |
| MMC Norilsk Nickel OJSC via MMC Finance DAC (Russia), 6.63%, 10/14/2022(b) | | | 295,000 | 326,292 |
| Teck Resources Ltd. (Canada), 6.13%, 10/01/2035 | | | 8,811,000 | 10,321,675 |
| Vedanta Resources Ltd. (India), 6.38%, 07/30/2022(b) | | | 262,000 | 252,175 |
| | | | | 12,176,591 |
| Diversified REITs–0.60% |
| STORE Capital Corp., 4.63%, 03/15/2029 | | | 5,290,000 | 5,882,047 |
See accompanying Notes to Financial Statements which are an integral part of the financial statements.
| 15 | Invesco Core Plus Bond Fund |
| | | Principal
Amount | Value |
| Diversified REITs–(continued) |
| Trust F/1401 (Mexico), | | | |
| 5.25%, 01/30/2026(b) | | | $8,353,000 | $8,864,705 |
| 4.87%, 01/15/2030(b) | | | 10,275,000 | 10,498,481 |
| 6.39%, 01/15/2050(b) | | | 200,000 | 212,000 |
| | | | | 25,457,233 |
| Electric Utilities–0.65% |
| Adani Transmission Ltd. (India), 4.00%, 08/03/2026(b) | | | 200,000 | 205,784 |
| CLP Power Hong Kong Financing Ltd. (Hong Kong), REGS, 3.13%, 05/06/2025(b) | | | 200,000 | 207,986 |
| Drax Finco PLC (United Kingdom), 6.63%, 11/01/2025(b) | | | 9,254,000 | 9,601,025 |
| Electricite de France S.A. (France), 4.88%, 09/21/2038(b) | | | 550,000 | 652,330 |
| Empresa de Transmision Electrica, S.A. (Panama), 5.13%, 05/02/2049(b) | | | 200,000 | 233,002 |
| Empresas Publicas de Medellin E.S.P. (Colombia), 4.25%, 07/18/2029(b) | | | 10,160,000 | 10,700,512 |
| Eskom Holdings SOC Ltd. (South Africa), 6.35%, 08/10/2028(b) | | | 222,000 | 240,800 |
| Israel Electric Corp. Ltd. (The) (Israel), REGS, 4.25%, 08/14/2028(b) | | | 200,000 | 220,075 |
| Korea East-West Power Co. Ltd. (South Korea), 3.88%, 07/19/2023(b) | | | 200,000 | 212,762 |
| Korea Hydro & Nuclear Power Co., Ltd. (South Korea), REGS, 3.00%, 09/19/2022(b) | | | 200,000 | 204,520 |
| Perusahaan Listrik Negara PT (Indonesia), REGS, 5.45%, 05/21/2028(b) | | | 200,000 | 234,697 |
| Southern Co. (The), Series B, 5.50%, 03/15/2057 | | | 3,932,000 | 4,082,144 |
| State Grid Overseas Investment (2016) Ltd. (China), 3.50%, 05/04/2027(b) | | | 200,000 | 214,252 |
| Trinidad Generation Unlimited (Trinidad), REGS, 5.25%, 11/04/2027(b) | | | 400,000 | 408,504 |
| | | | | 27,418,393 |
| Electrical Components & Equipment–0.01% |
| EnerSys, 5.00%, 04/30/2023(b) | | | 519,000 | 537,165 |
| Electronic Equipment & Instruments–0.01% |
| Itron, Inc., 5.00%, 01/15/2026(b) | | | 266,000 | 272,650 |
| MTS Systems Corp., 5.75%, 08/15/2027(b) | | | 204,000 | 213,690 |
| | | | | 486,340 |
| | | Principal
Amount | Value |
| Electronic Manufacturing Services–0.01% |
| Jabil, Inc., 3.95%, 01/12/2028 | | | $280,000 | $283,400 |
| Environmental & Facilities Services–0.03% |
| Core & Main L.P., 6.13%, 08/15/2025(b) | | | 359,000 | 366,180 |
| GFL Environmental, Inc. (Canada), 7.00%, 06/01/2026(b) | | | 535,000 | 556,400 |
| Waste Pro USA, Inc., 5.50%, 02/15/2026(b) | | | 245,000 | 256,025 |
| | | | | 1,178,605 |
| Fertilizers & Agricultural Chemicals–0.01% |
| OCI N.V. (Netherlands), 6.63%, 04/15/2023(b) | | | 211,000 | 223,660 |
| Financial Exchanges & Data–0.02% |
| Moody’s Corp., 4.88%, 02/15/2024 | | | 700,000 | 776,009 |
| MSCI, Inc., 5.25%, 11/15/2024(b) | | | 175,000 | 182,560 |
| | | | | 958,569 |
| Food Distributors–0.01% |
| US Foods, Inc., 5.88%, 06/15/2024(b) | | | 365,000 | 378,680 |
| Food Retail–0.02% |
| Albertsons Cos. LLC/Safeway, Inc./New Albertson’s, Inc./Albertson’s LLC, | | | |
| 6.63%, 06/15/2024 | | | 513,000 | 539,933 |
| 5.88%, 02/15/2028(b) | | | 289,000 | 305,288 |
| | | | | 845,221 |
| Forest Products–0.01% |
| Norbord, Inc. (Canada), 5.75%, 07/15/2027(b) | | | 307,000 | 313,140 |
| Gas Utilities–0.03% |
| AmeriGas Partners, L.P./AmeriGas Finance Corp., | | | |
| 5.63%, 05/20/2024 | | | 124,000 | 132,215 |
| 5.88%, 08/20/2026 | | | 424,000 | 462,563 |
| Suburban Propane Partners, L.P./Suburban Energy Finance Corp., 5.50%, 06/01/2024 | | | 631,000 | 643,620 |
| | | | | 1,238,398 |
| General Merchandise Stores–0.01% |
| Dollar Tree, Inc., 4.00%, 05/15/2025 | | | 500,000 | 528,977 |
| Health Care Distributors–0.02% |
| AmerisourceBergen Corp., 4.30%, 12/15/2047 | | | 770,000 | 821,843 |
| Health Care Equipment–0.22% |
| Hill-Rom Holdings, Inc., 5.00%, 02/15/2025(b) | | | 472,000 | 487,340 |
See accompanying Notes to Financial Statements which are an integral part of the financial statements.
| 16 | Invesco Core Plus Bond Fund |
| | | Principal
Amount | Value |
| Health Care Equipment–(continued) |
| Teleflex, Inc., | | | |
| 4.88%, 06/01/2026 | | | $39,000 | $41,280 |
| 4.63%, 11/15/2027 | | | 385,000 | 408,535 |
| Zimmer Biomet Holdings, Inc., 3.17% (3 mo. USD LIBOR + 0.75%), 03/19/2021(c) | | | 8,322,000 | 8,314,868 |
| | | | | 9,252,023 |
| Health Care Facilities–0.10% |
| Acadia Healthcare Co., Inc., 6.50%, 03/01/2024 | | | 63,000 | 65,363 |
| Encompass Health Corp., 5.75%, 09/15/2025 | | | 475,000 | 501,719 |
| HCA Healthcare, Inc., 6.25%, 02/15/2021 | | | 130,000 | 136,877 |
| HCA, Inc., | | | |
| 5.38%, 02/01/2025 | | | 130,000 | 144,625 |
| 5.25%, 04/15/2025 | | | 987,000 | 1,102,966 |
| 5.88%, 02/15/2026 | | | 444,000 | 507,603 |
| 5.38%, 09/01/2026 | | | 123,000 | 137,452 |
| 5.50%, 06/15/2047 | | | 939,000 | 1,080,573 |
| Tenet Healthcare Corp., | | | |
| 6.00%, 10/01/2020 | | | 180,000 | 187,110 |
| 8.13%, 04/01/2022 | | | 390,000 | 421,648 |
| 6.75%, 06/15/2023 | | | 117,000 | 120,656 |
| | | | | 4,406,592 |
| Health Care REITs–0.43% |
| HCP, Inc., 4.25%, 11/15/2023 | | | 2,157,000 | 2,319,135 |
| MPT Operating Partnership L.P./MPT Finance Corp., | | | |
| 5.00%, 10/15/2027 | | | 815,000 | 872,050 |
| 4.63%, 08/01/2029 | | | 6,053,000 | 6,306,470 |
| Physicians Realty L.P., 4.30%, 03/15/2027 | | | 325,000 | 349,198 |
| Senior Housing Properties Trust, 6.75%, 12/15/2021 | | | 1,942,000 | 2,071,786 |
| Welltower, Inc., | | | |
| 5.25%, 01/15/2022 | | | 300,000 | 321,089 |
| 3.10%, 01/15/2030 | | | 5,833,000 | 5,943,738 |
| | | | | 18,183,466 |
| Health Care Services–0.71% |
| AMN Healthcare, Inc., 5.13%, 10/01/2024(b) | | | 138,000 | 142,140 |
| CHS/Community Health Systems, Inc., 8.00%, 03/15/2026(b) | | | 301,000 | 289,713 |
| Cigna Corp., | | | |
| 3.40%, 09/17/2021 | | | 8,569,000 | 8,775,543 |
| 3.19%, (3 mo. USD LIBOR + 0.89%), 07/15/2023(c) | | | 10,138,000 | 10,159,637 |
| 4.13%, 11/15/2025 | | | 600,000 | 653,288 |
| CVS Health Corp., | | | |
| 2.63%, 08/15/2024 | | | 7,236,000 | 7,285,735 |
| 4.10%, 03/25/2025 | | | 920,000 | 984,890 |
| | | Principal
Amount | Value |
| Health Care Services–(continued) |
| Eagle Holding Co. II, LLC, 8.38% PIK Rate, 7.63% Cash Rate, 05/15/2022(b)(f) | | | $166,000 | $168,075 |
| Envision Healthcare Corp., 8.75%, 10/15/2026(b) | | | 161,000 | 88,550 |
| Hadrian Merger Sub, Inc., 8.50%, 05/01/2026(b) | | | 414,000 | 397,440 |
| MPH Acquisition Holdings LLC, 7.13%, 06/01/2024(b) | | | 477,000 | 428,732 |
| Prime Healthcare Foundation, Inc., Series B, 7.00%, 12/01/2027 | | | 450,000 | 556,292 |
| Surgery Center Holdings, Inc., | | | |
| 6.75%, 07/01/2025(b) | | | 81,000 | 69,710 |
| 10.00%, 04/15/2027(b) | | | 208,000 | 199,680 |
| Team Health Holdings, Inc., 6.38%, 02/01/2025(b) | | | 160,000 | 108,000 |
| | | | | 30,307,425 |
| Home Improvement Retail–0.40% |
| Hillman Group, Inc. (The), 6.38%, 07/15/2022(b) | | | 181,000 | 161,543 |
| Lowe’s Cos., Inc., 3.65%, 04/05/2029 | | | 15,486,000 | 16,840,973 |
| | | | | 17,002,516 |
| Homebuilding–0.59% |
| Beazer Homes USA, Inc., | | | |
| 8.75%, 03/15/2022 | | | 145,000 | 151,888 |
| 6.75%, 03/15/2025 | | | 566,000 | 572,367 |
| 5.88%, 10/15/2027 | | | 31,000 | 29,528 |
| KB Home, 8.00%, 03/15/2020 | | | 148,000 | 152,625 |
| Lennar Corp., | | | |
| 8.38%, 01/15/2021 | | | 40,000 | 43,200 |
| 5.38%, 10/01/2022 | | | 157,000 | 168,186 |
| 4.75%, 11/15/2022 | | | 310,000 | 328,212 |
| 5.25%, 06/01/2026 | | | 782,000 | 854,335 |
| MDC Holdings, Inc., 6.00%, 01/15/2043 | | | 21,036,000 | 21,667,080 |
| Meritage Homes Corp., | | | |
| 7.15%, 04/15/2020 | | | 55,000 | 56,719 |
| 6.00%, 06/01/2025 | | | 83,000 | 92,026 |
| Taylor Morrison Communities, Inc., 5.75%, 01/15/2028(b) | | | 251,000 | 267,315 |
| Taylor Morrison Communities, Inc./Taylor Morrison Holdings II, Inc., 5.88%, 04/15/2023(b) | | | 463,000 | 495,410 |
| | | | | 24,878,891 |
| Hotel & Resort REITs–0.07% |
| Hospitality Properties Trust, 4.95%, 02/15/2027 | | | 2,247,000 | 2,334,197 |
| Host Hotels & Resorts L.P., Series F, 4.50%, 02/01/2026 | | | 620,000 | 679,500 |
| | | | | 3,013,697 |
See accompanying Notes to Financial Statements which are an integral part of the financial statements.
| 17 | Invesco Core Plus Bond Fund |
| | | Principal
Amount | Value |
| Hotels, Resorts & Cruise Lines–0.01% |
| Royal Caribbean Cruises Ltd., 3.70%, 03/15/2028 | | | $585,000 | $609,037 |
| Household Products–0.34% |
| Reynolds Group Issuer Inc./Reynolds Group Issuer LLC/Reynolds Group Issuer (Luxembourg) S.A., 7.00%, 07/15/2024(b) | | | 893,000 | 924,813 |
| Reynolds Group Issuer, Inc./LLC, | | | |
| 5.75%, 10/15/2020 | | | 13,120,749 | 13,169,952 |
| 5.13%, 07/15/2023(b) | | | 42,000 | 43,283 |
| Spectrum Brands, Inc., 5.75%, 07/15/2025 | | | 305,000 | 318,725 |
| | | | | 14,456,773 |
| Housewares & Specialties–0.02% |
| Newell Brands, Inc., 4.20%, 04/01/2026 | | | 925,000 | 959,950 |
| Hypermarkets & Super Centers–0.00% |
| Cencosud S.A. (Chile), REGS, 4.38%, 07/17/2027(b) | | | 200,000 | 196,820 |
| Independent Power Producers & Energy Traders–0.06% |
| AES Corp. (The), 5.50%, 04/15/2025 | | | 912,000 | 954,208 |
| AES Gener S.A. (Chile), 7.13%, 03/26/2079(b) | | | 200,000 | 212,050 |
| Calpine Corp., 5.38%, 01/15/2023 | | | 143,000 | 145,312 |
| Colbun S.A. (Chile), 3.95%, 10/11/2027(b) | | | 200,000 | 208,377 |
| Emirates SembCorp Water & Power Co. PJSC (United Arab Emirates), 4.45%, 08/01/2035(b) | | | 200,000 | 220,500 |
| NRG Energy, Inc., 6.63%, 01/15/2027 | | | 812,000 | 880,005 |
| | | | | 2,620,452 |
| Industrial Conglomerates–0.38% |
| CITIC Ltd. (China), REGS, 3.13%, 02/28/2022(b) | | | 200,000 | 201,675 |
| GE Capital International Funding Co. Unlimited Co., 4.42%, 11/15/2035 | | | 15,269,000 | 15,539,523 |
| Koc Holding A.S. (Turkey), 6.50%, 03/11/2025(b) | | | 200,000 | 200,841 |
| | | | | 15,942,039 |
| Industrial Machinery–0.04% |
| Cleaver-Brooks, Inc., 7.88%, 03/01/2023(b) | | | 642,000 | 592,245 |
| EnPro Industries, Inc., 5.75%, 10/15/2026 | | | 359,000 | 376,950 |
| Mueller Industries, Inc., 6.00%, 03/01/2027 | | | 547,000 | 555,205 |
| | | | | 1,524,400 |
| | | Principal
Amount | Value |
| Industrial REITs–0.12% |
| PLA Administradora Industrial S de RL de CV (Mexico), 4.96%, 07/18/2029(b) | | | $4,941,000 | $5,041,302 |
| Integrated Oil & Gas–0.78% |
| Ecopetrol S.A. (Colombia), 5.88%, 05/28/2045 | | | 100,000 | 117,876 |
| Petrobras Global Finance B.V. (Brazil), | | | |
| 5.75%, 02/01/2029 | | | 733,000 | 795,671 |
| 7.25%, 03/17/2044 | | | 170,000 | 200,719 |
| 6.90%, 03/19/2049 | | | 238,000 | 270,725 |
| Petroleos del Peru S.A. (Peru), 4.75%, 06/19/2032(b) | | | 375,000 | 423,750 |
| Petroleos Mexicanos (Mexico), | | | |
| 5.38%, 03/13/2022 | | | 150,000 | 154,125 |
| 6.50%, 01/23/2029 | | | 94,000 | 95,763 |
| Saudi Arabian Oil Co. (Saudi Arabia), | | | |
| 2.75%, 04/16/2022(b) | | | 7,417,000 | 7,529,911 |
| 2.88%, 04/16/2024(b) | | | 22,639,000 | 23,248,071 |
| 3.50%, 04/16/2029(b) | | | 200,000 | 213,725 |
| 4.25%, 04/16/2039(b) | | | 201,000 | 228,273 |
| | | | | 33,278,609 |
| Integrated Telecommunication Services–1.52% |
| Altice France S.A. (France), 7.38%, 05/01/2026(b) | | | 200,000 | 214,000 |
| AT&T, Inc., | | | |
| 4.45%, 04/01/2024 | | | 200,000 | 217,770 |
| 3.40%, 05/15/2025 | | | 3,812,000 | 4,007,017 |
| 5.25%, 03/01/2037 | | | 360,000 | 428,569 |
| 5.35%, 12/15/2043 | | | 245,000 | 284,668 |
| 4.75%, 05/15/2046 | | | 4,247,000 | 4,756,544 |
| 5.15%, 02/15/2050 | | | 35,788,000 | 42,546,721 |
| 5.70%, 03/01/2057 | | | 4,698,000 | 5,959,803 |
| Cincinnati Bell, Inc., | | | |
| 7.00%, 07/15/2024(b) | | | 92,000 | 84,410 |
| 8.00%, 10/15/2025(b) | | | 31,000 | 27,366 |
| Frontier Communications Corp., | | | |
| 10.50%, 09/15/2022 | | | 31,000 | 16,236 |
| 11.00%, 09/15/2025 | | | 618,000 | 316,725 |
| Intelsat Jackson Holdings S.A. (Luxembourg), | | | |
| 5.50%, 08/01/2023 | | | 834,000 | 763,110 |
| 8.50%, 10/15/2024(b) | | | 295,000 | 293,525 |
| Telecom Argentina S.A. (Argentina), 8.00%, 07/18/2026(b) | | | 100,000 | 80,500 |
| Telecom Italia Capital S.A. (Italy), | | | |
| 6.38%, 11/15/2033 | | | 34,000 | 36,125 |
| 7.20%, 07/18/2036 | | | 672,000 | 752,640 |
| T-Mobile USA, Inc., | | | |
| 6.38%, 03/01/2025 | | | 962,000 | 998,556 |
| 6.50%, 01/15/2026 | | | 1,661,000 | 1,789,728 |
| Turk Telekomunikasyon A.S. (Turkey), 6.88%, 02/28/2025(b) | | | 215,000 | 219,024 |
See accompanying Notes to Financial Statements which are an integral part of the financial statements.
| 18 | Invesco Core Plus Bond Fund |
| | | Principal
Amount | Value |
| Integrated Telecommunication Services–(continued) |
| Verizon Communications, Inc., 5.25%, 03/16/2037 | | | $350,000 | $444,078 |
| Virgin Media Finance PLC (United Kingdom), 6.00%, 10/15/2024(b) | | | 200,000 | 207,250 |
| | | | | 64,444,365 |
| Interactive Media & Services–0.51% |
| Cumulus Media New Holdings, Inc., 6.75%, 07/01/2026(b) | | | 275,000 | 283,938 |
| Diamond Sports Group LLC/Diamond Sports Finance Co., | | | |
| 5.38%, 08/15/2026(b) | | | 6,987,000 | 7,353,817 |
| 6.63%, 08/15/2027(b) | | | 383,000 | 402,150 |
| Match Group, Inc., 5.63%, 02/15/2029(b) | | | 7,642,000 | 8,310,675 |
| Tencent Holdings Ltd. (China), 2.99%, 01/19/2023(b) | | | 5,274,000 | 5,388,041 |
| | | | | 21,738,621 |
| Internet & Direct Marketing Retail–0.55% |
| Alibaba Group Holding Ltd. (China), | | | |
| 3.60%, 11/28/2024 | | | 200,000 | 211,836 |
| 4.20%, 12/06/2047 | | | 5,425,000 | 6,248,623 |
| 4.40%, 12/06/2057 | | | 5,440,000 | 6,497,606 |
| QVC, Inc., | | | |
| 4.45%, 02/15/2025 | | | 380,000 | 395,544 |
| 5.45%, 08/15/2034 | | | 9,969,000 | 10,186,764 |
| | | | | 23,540,373 |
| Investment Banking & Brokerage–1.05% |
| Cantor Fitzgerald, L.P., 6.50%, 06/17/2022(b) | | | 1,727,000 | 1,872,023 |
| Goldman Sachs Group, Inc. (The), | | | |
| Series P, 5.00%(e) | | | 7,805,000 | 7,733,936 |
| 3.75%, 05/22/2025 | | | 5,664,000 | 6,044,310 |
| 3.27%, 09/29/2025 | | | 7,286,000 | 7,586,167 |
| Jefferies Group LLC/Jefferies Group Capital Finance, Inc., 4.15%, 01/23/2030 | | | 335,000 | 340,158 |
| Morgan Stanley, | | | |
| 5.50%, 07/28/2021 | | | 3,712,000 | 3,939,666 |
| 4.35%, 09/08/2026 | | | 4,867,000 | 5,333,505 |
| 3.59%, 07/22/2028 | | | 10,764,000 | 11,480,196 |
| Raymond James Financial, Inc., 4.95%, 07/15/2046 | | | 295,000 | 361,706 |
| | | | | 44,691,667 |
| Leisure Facilities–0.01% |
| Six Flags Entertainment Corp., 4.88%, 07/31/2024(b) | | | 380,000 | 394,250 |
| Life & Health Insurance–0.82% |
| American Equity Investment Life Holding Co., 5.00%, 06/15/2027 | | | 7,395,000 | 7,845,706 |
| Athene Holding Ltd., 4.13%, 01/12/2028 | | | 12,847,000 | 13,155,365 |
| | | Principal
Amount | Value |
| Life & Health Insurance–(continued) |
| Global Atlantic Financial Group Ltd., 8.63%, 04/15/2021(b) | | | $50,000 | $54,273 |
| MetLife, Inc., | | | |
| Series C, 5.25%(e) | | | 7,496,000 | 7,607,503 |
| Series D, 5.88%(e) | | | 200,000 | 214,680 |
| Prudential Financial, Inc., 5.63%, 06/15/2043 | | | 5,590,000 | 6,000,669 |
| | | | | 34,878,196 |
| Managed Health Care–0.03% |
| Centene Corp., 5.38%, 06/01/2026(b) | | | 582,000 | 623,642 |
| Molina Healthcare, Inc., 4.88%, 06/15/2025(b) | | | 120,000 | 122,850 |
| WellCare Health Plans, Inc., | | | |
| 5.25%, 04/01/2025 | | | 265,000 | 278,462 |
| 5.38%, 08/15/2026(b) | | | 173,000 | 184,894 |
| | | | | 1,209,848 |
| Marine–0.01% |
| Hidrovias International Finance S.a.r.l. (Brazil), 5.95%, 01/24/2025(b) | | | 200,000 | 201,960 |
| Marine Ports & Services–0.32% |
| Adani Abbot Point Terminal Pty Ltd. (Australia), 4.45%, 12/15/2022(b) | | | 13,216,000 | 13,104,019 |
| DP World PLC (United Arab Emirates), REGS, 6.85%, 07/02/2037(b) | | | 200,000 | 270,756 |
| | | | | 13,374,775 |
| Metal & Glass Containers–0.03% |
| Ardagh Packaging Finance PLC/Ardagh Holdings USA, Inc. (Ireland), 6.00%, 02/15/2025(b) | | | 200,000 | 209,375 |
| Ball Corp., 5.25%, 07/01/2025 | | | 405,000 | 455,625 |
| Berry Global, Inc., | | | |
| 5.50%, 05/15/2022 | | | 87,000 | 88,788 |
| 6.00%, 10/15/2022 | | | 60,000 | 61,275 |
| Flex Acquisition Co., Inc., 7.88%, 07/15/2026(b) | | | 280,000 | 254,100 |
| OI European Group B.V., 4.00%, 03/15/2023(b) | | | 80,000 | 80,800 |
| | | | | 1,149,963 |
| Movies & Entertainment–0.17% |
| AMC Entertainment Holdings, Inc., | | | |
| 5.75%, 06/15/2025 | | | 310,000 | 295,662 |
| 6.13%, 05/15/2027 | | | 314,000 | 291,235 |
| Netflix, Inc., | | | |
| 5.75%, 03/01/2024 | | | 184,000 | 202,630 |
| 5.88%, 11/15/2028 | | | 1,336,000 | 1,497,990 |
| 5.38%, 11/15/2029(b) | | | 4,403,000 | 4,799,270 |
See accompanying Notes to Financial Statements which are an integral part of the financial statements.
| 19 | Invesco Core Plus Bond Fund |
| | | Principal
Amount | Value |
| Movies & Entertainment–(continued) |
| Walt Disney Co. (The), 6.55%, 03/15/2033(b) | | | $180,000 | $258,522 |
| | | | | 7,345,309 |
| Multi-line Insurance–0.60% |
| Acrisure LLC/Acrisure Finance, Inc., 8.13%, 02/15/2024(b) | | | 75,000 | 80,953 |
| AIG Global Funding, 2.70%, 12/15/2021(b) | | | 5,386,000 | 5,444,662 |
| American Financial Group, Inc., 3.50%, 08/15/2026 | | | 590,000 | 613,797 |
| Fairfax Financial Holdings Ltd. (Canada), 4.85%, 04/17/2028 | | | 7,920,000 | 8,646,957 |
| Hartford Financial Services Group, Inc. (The), 3.60%, 08/19/2049 | | | 4,024,000 | 4,219,705 |
| XLIT Ltd. (Bermuda), 5.50%, 03/31/2045 | | | 5,097,000 | 6,583,337 |
| | | | | 25,589,411 |
| Multi-Utilities–0.35% |
| Abu Dhabi National Energy Co. PJSC (United Arab Emirates), 4.88%, 04/23/2030(b) | | | 200,000 | 232,000 |
| CenterPoint Energy, Inc., Series A, 6.13%(e) | | | 14,054,000 | 14,731,614 |
| | | | | 14,963,614 |
| Office REITs–0.31% |
| Alexandria Real Estate Equities, Inc., | | | |
| 3.38%, 08/15/2031 | | | 4,570,000 | 4,842,986 |
| 4.00%, 02/01/2050 | | | 6,952,000 | 7,722,360 |
| Hudson Pacific Properties, L.P., 3.95%, 11/01/2027 | | | 335,000 | 358,195 |
| Office Properties Income Trust, 4.50%, 02/01/2025 | | | 330,000 | 341,315 |
| | | | | 13,264,856 |
| Office Services & Supplies–0.22% |
| Pitney Bowes, Inc., | | | |
| 3.88%, 10/01/2021 | | | 8,285,000 | 8,305,712 |
| 4.95%, 04/01/2023 | | | 1,205,000 | 1,150,775 |
| | | | | 9,456,487 |
| Oil & Gas Drilling–0.22% |
| Diamond Offshore Drilling, Inc., 4.88%, 11/01/2043 | | | 134,000 | 77,050 |
| Ensign Drilling, Inc. (Canada), 9.25%, 04/15/2024(b) | | | 266,000 | 249,375 |
| Noble Holding International Ltd., 7.75%, 01/15/2024 | | | 256,000 | 171,520 |
| Precision Drilling Corp. (Canada), | | | |
| 6.50%, 12/15/2021 | | | 25,970 | 26,035 |
| 7.75%, 12/15/2023 | | | 19,000 | 18,858 |
| 5.25%, 11/15/2024 | | | 443,000 | 382,087 |
| | | Principal
Amount | Value |
| Oil & Gas Drilling–(continued) |
| Targa Resources Partners L.P./Targa Resources Partners Finance Corp., | | | |
| 5.25%, 05/01/2023 | | | $6,533,000 | $6,661,635 |
| 5.13%, 02/01/2025 | | | 592,000 | 609,760 |
| 5.88%, 04/15/2026 | | | 407,000 | 427,859 |
| Transocean, Inc., 7.50%, 04/15/2031 | | | 269,000 | 209,484 |
| Valaris PLC, 7.75%, 02/01/2026 | | | 513,000 | 328,217 |
| Vantage Drilling International, 7.50%, 11/01/2019(g)(h) | | | 356,000 | 0 |
| | | | | 9,161,880 |
| Oil & Gas Equipment & Services–0.01% |
| Calfrac Holdings L.P. (Canada), 8.50%, 06/15/2026(b) | | | 237,000 | 150,495 |
| SESI, L.L.C., 7.13%, 12/15/2021 | | | 223,000 | 158,330 |
| | | | | 308,825 |
| Oil & Gas Exploration & Production–0.86% |
| Antero Resources Corp., 5.63%, 06/01/2023 | | | 249,000 | 230,948 |
| Ascent Resources Utica Holdings, LLC/ARU Finance Corp., 10.00%, 04/01/2022(b) | | | 340,000 | 344,250 |
| Brazos Valley Longhorn LLC/Brazos Valley Longhorn Finance Corp., 6.88%, 02/01/2025 | | | 177,000 | 158,415 |
| California Resources Corp., 8.00%, 12/15/2022(b) | | | 161,000 | 93,380 |
| Callon Petroleum Co., | | | |
| 6.13%, 10/01/2024 | | | 550,000 | 536,250 |
| 6.38%, 07/01/2026 | | | 111,000 | 108,225 |
| Centennial Resource Production, LLC, 6.88%, 04/01/2027(b) | | | 531,000 | 533,655 |
| CNOOC Curtis Funding No.1 Pty Ltd. (China), REGS, 4.50%, 10/03/2023(b) | | | 200,000 | 216,448 |
| CNOOC Finance (2015) U.S.A. LLC (China), 3.50%, 05/05/2025 | | | 400,000 | 420,700 |
| Concho Resources, Inc., 4.38%, 01/15/2025 | | | 565,000 | 586,137 |
| Continental Resources, Inc., 5.00%, 09/15/2022 | | | 19,225,000 | 19,409,597 |
| Denbury Resources, Inc., 5.50%, 05/01/2022 | | | 80,000 | 34,400 |
| Dolphin Energy Ltd. LLC (United Arab Emirates), REGS, 5.50%, 12/15/2021(b) | | | 600,000 | 639,867 |
| Enterprise Products Operating LLC, Series D, 4.88%, 08/16/2077 | | | 5,943,000 | 5,687,570 |
| EP Energy LLC/Everest Acquisition Finance, Inc., 8.00%, 11/29/2024(b) | | | 152,000 | 66,880 |
See accompanying Notes to Financial Statements which are an integral part of the financial statements.
| 20 | Invesco Core Plus Bond Fund |
| | | Principal
Amount | Value |
| Oil & Gas Exploration & Production–(continued) |
| Gazprom OAO Via Gaz Capital S.A. (Russia), 5.15%, 02/11/2026(b) | | | $350,000 | $381,202 |
| Genesis Energy L.P. / Genesis Energy Finance Corp., 6.25%, 05/15/2026 | | | 284,000 | 272,751 |
| Gran Tierra Energy, Inc. (Canada), 7.75%, 05/23/2027(b) | | | 200,000 | 194,500 |
| Gulfport Energy Corp., | | | |
| 6.63%, 05/01/2023 | | | 35,000 | 28,525 |
| 6.00%, 10/15/2024 | | | 544,000 | 398,480 |
| Jagged Peak Energy LLC, 5.88%, 05/01/2026 | | | 524,000 | 528,454 |
| Newfield Exploration Co., 5.63%, 07/01/2024 | | | 389,000 | 428,886 |
| NGL Energy Partners L.P./NGL Energy Finance Corp., 7.50%, 04/15/2026(b) | | | 267,000 | 271,005 |
| Oasis Petroleum, Inc., 6.88%, 01/15/2023 | | | 504,000 | 458,640 |
| Pertamina Persero PT (Indonesia), REGS, 4.30%, 05/20/2023(b) | | | 200,000 | 211,118 |
| QEP Resources, Inc., | | | |
| 6.88%, 03/01/2021 | | | 355,000 | 354,112 |
| 5.25%, 05/01/2023 | | | 79,000 | 69,520 |
| 5.63%, 03/01/2026 | | | 467,000 | 380,605 |
| Range Resources Corp., 5.88%, 07/01/2022 | | | 157,000 | 151,113 |
| Sinopec Group Overseas Development 2018 Ltd. (China), | | | |
| 2.50%, 08/08/2024(b) | | | 200,000 | 201,793 |
| 2.95%, 08/08/2029(b) | | | 200,000 | 203,402 |
| 3.68%, 08/08/2049(b) | | | 200,000 | 218,422 |
| SM Energy Co., | | | |
| 6.13%, 11/15/2022 | | | 462,000 | 431,970 |
| 6.63%, 01/15/2027 | | | 54,000 | 46,170 |
| Southwestern Energy Co., | | | |
| 7.50%, 04/01/2026 | | | 217,000 | 191,003 |
| 7.75%, 10/01/2027 | | | 502,000 | 439,250 |
| Tengizchevroil Finance Co. International Ltd. (Kazakhstan), REGS, 4.00%, 08/15/2026(b) | | | 200,000 | 207,227 |
| Trinidad Petroleum Holdings Ltd. (Trinidad), 9.75%, 06/15/2026(b) | | | 100,000 | 113,750 |
| Whiting Petroleum Corp., 6.25%, 04/01/2023 | | | 632,000 | 499,280 |
| WPX Energy, Inc., 5.25%, 09/15/2024 | | | 714,000 | 728,280 |
| | | | | 36,476,180 |
| Oil & Gas Refining & Marketing–0.26% |
| Calumet Specialty Products Partners L.P./Calumet Finance Corp., 7.63%, 01/15/2022 | | | 72,000 | 68,580 |
| Cosan Ltd. (Brazil), 5.50%, 09/20/2029(b) | | | 1,314,000 | 1,336,942 |
| | | Principal
Amount | Value |
| Oil & Gas Refining & Marketing–(continued) |
| Empresa Nacional del Petroleo (Chile), 5.25%, 11/06/2029(b) | | | $233,000 | $270,759 |
| NuStar Logistics, L.P., 6.00%, 06/01/2026 | | | 325,000 | 349,375 |
| Parkland Fuel Corp. (Canada), | | | |
| 6.00%, 04/01/2026(b) | | | 240,000 | 252,900 |
| 5.88%, 07/15/2027(b) | | | 7,547,000 | 7,943,218 |
| Puma International Financing S.A. (Singapore), 5.00%, 01/24/2026(b) | | | 200,000 | 186,034 |
| Reliance Industries Ltd. (India), REGS, 4.13%, 01/28/2025(b) | | | 250,000 | 267,594 |
| Sunoco L.P. /Sunoco Finance Corp., 4.88%, 01/15/2023 | | | 229,000 | 234,725 |
| | | | | 10,910,127 |
| Oil & Gas Storage & Transportation–1.24% |
| Abu Dhabi Crude Oil Pipeline LLC (United Arab Emirates), 3.65%, 11/02/2029(b) | | | 200,000 | 224,130 |
| Antero Midstream Partners L.P./Antero Midstream Finance Corp., 5.38%, 09/15/2024 | | | 500,000 | 473,750 |
| Buckeye Partners, L.P., 5.60%, 10/15/2044 | | | 2,014,000 | 1,708,277 |
| Energy Transfer Operating, L.P., | | | |
| Series A, 6.25%(e) | | | 1,782,000 | 1,662,570 |
| 5.88%, 01/15/2024 | | | 613,000 | 686,392 |
| 4.75%, 01/15/2026 | | | 815,000 | 891,980 |
| EQM Midstream Partners, L.P., 4.00%, 08/01/2024 | | | 840,000 | 826,692 |
| Holly Energy Partners L.P./Holly Energy Finance Corp., 6.00%, 08/01/2024(b) | | | 158,000 | 166,374 |
| Kinder Morgan, Inc., | | | |
| 7.80%, 08/01/2031 | | | 2,350,000 | 3,269,038 |
| 7.75%, 01/15/2032 | | | 7,887,000 | 11,148,353 |
| MPLX L.P., 4.50%, 07/15/2023 | | | 560,000 | 597,926 |
| NGPL PipeCo. LLC, 7.77%, 12/15/2037(b) | | | 6,653,000 | 8,707,313 |
| Plains All American Pipeline, L.P., Series B, 6.13%(e) | | | 8,921,000 | 8,488,510 |
| SemGroup Corp., 6.38%, 03/15/2025 | | | 185,000 | 175,750 |
| Williams Cos., Inc. (The), | | | |
| 4.13%, 11/15/2020 | | | 12,548,000 | 12,760,873 |
| 7.88%, 09/01/2021 | | | 109,000 | 120,395 |
| 4.55%, 06/24/2024 | | | 574,000 | 622,070 |
| | | | | 52,530,393 |
| Other Diversified Financial Services–0.29% |
| Arab Petroleum Investments Corp. (Supranational), 4.13%, 09/18/2023(b) | | | 200,000 | 212,893 |
| Banco BTG Pactual S.A. (Brazil), 7.75%, 02/15/2029(b) | | | 300,000 | 312,000 |
See accompanying Notes to Financial Statements which are an integral part of the financial statements.
| 21 | Invesco Core Plus Bond Fund |
| | | Principal
Amount | Value |
| Other Diversified Financial Services–(continued) |
| Carlyle Finance LLC, 5.65%, 09/15/2048(b) | | | $7,657,000 | $9,345,066 |
| eG Global Finance PLC (United Kingdom), 6.75%, 02/07/2025(b) | | | 308,000 | 298,375 |
| Fondo MIVIVIENDA S.A. (Peru), REGS, 3.50%, 01/31/2023(b) | | | 300,000 | 309,450 |
| Huarong Finance II Co., Ltd. (China), REGS, 2.88%(b)(e) | | | 200,000 | 196,007 |
| Lions Gate Capital Holdings LLC, 6.38%, 02/01/2024(b) | | | 266,000 | 281,612 |
| LPL Holdings, Inc., 5.75%, 09/15/2025(b) | | | 175,000 | 184,625 |
| Peru Enhanced Pass-Through Finance Ltd. (Peru), REGS, Class A-2, 0.00%, 06/02/2025(b)(d) | | | 247,415 | 226,694 |
| SPARC EM SPC Panama Metro Line 2 S.P. (Cayman Islands), 0.00%, 12/05/2022(b)(d) | | | 512,498 | 491,511 |
| Tempo Acquisition LLC/Tempo Acquisition Finance Corp., 6.75%, 06/01/2025(b) | | | 420,000 | 433,566 |
| VFH Parent LLC/Orchestra Co-Issuer, Inc., 6.75%, 06/15/2022(b) | | | 60,000 | 61,987 |
| | | | | 12,353,786 |
| Packaged Foods & Meats–0.32% |
| B&G Foods, Inc., 5.25%, 04/01/2025 | | | 332,000 | 337,910 |
| JBS USA LUX S.A./JBS USA Food Co./JBS USA Finance, Inc., 5.50%, 01/15/2030(b) | | | 241,000 | 255,942 |
| Kraft Heinz Foods Co. (The), 4.38%, 06/01/2046 | | | 400,000 | 385,075 |
| Lamb Weston Holdings, Inc., 4.63%, 11/01/2024(b) | | | 494,000 | 518,903 |
| Mars, Inc., 2.70%, 04/01/2025(b) | | | 8,763,000 | 9,069,496 |
| NBM US Holdings, Inc. (Brazil), | | | |
| 7.00%, 05/14/2026(b) | | | 250,000 | 256,076 |
| 6.63%, 08/06/2029(b) | | | 2,304,000 | 2,283,840 |
| TreeHouse Foods, Inc., 6.00%, 02/15/2024(b) | | | 249,000 | 259,271 |
| | | | | 13,366,513 |
| Paper Packaging–0.02% |
| International Paper Co., 5.00%, 09/15/2035 | | | 700,000 | 825,188 |
| Trivium Packaging Finance B.V. (Netherlands), 5.50%, 08/15/2026(b) | | | 206,000 | 218,360 |
| | | | | 1,043,548 |
| Paper Products–0.20% |
| Celulosa Arauco y Constitucion S.A. (Chile), 4.50%, 08/01/2024 | | | 200,000 | 212,502 |
| | | Principal
Amount | Value |
| Paper Products–(continued) |
| Mercer International, Inc. (Germany), | | | |
| 7.75%, 12/01/2022 | | | $26,000 | $26,715 |
| 6.50%, 02/01/2024 | | | 392,000 | 405,230 |
| 5.50%, 01/15/2026 | | | 98,000 | 97,040 |
| Schweitzer-Mauduit International, Inc., 6.88%, 10/01/2026(b) | | | 434,000 | 448,105 |
| Suzano Austria GmbH (Brazil), | | | |
| 6.00%, 01/15/2029 | | | 6,475,000 | 7,195,020 |
| 7.00%, 03/16/2047(b) | | | 205,000 | 238,593 |
| | | | | 8,623,205 |
| Pharmaceuticals–1.42% |
| Bausch Health Cos., Inc., | | | |
| REGS, 7.00%, 03/15/2024(b) | | | 150,000 | 158,799 |
| 6.13%, 04/15/2025(b) | | | 175,000 | 180,687 |
| 5.50%, 11/01/2025(b) | | | 129,000 | 135,770 |
| 9.00%, 12/15/2025(b) | | | 700,000 | 787,500 |
| Bayer US Finance II LLC (Germany), | | | |
| 3.42%, (3 mo. USD LIBOR + 1.01%), 12/15/2023(b)(c) | | | 8,097,000 | 8,094,743 |
| 3.88%, 12/15/2023(b) | | | 7,293,000 | 7,662,133 |
| Bristol-Myers Squibb Co., | | | |
| 2.90%, 07/26/2024(b) | | | 21,825,000 | 22,643,771 |
| 3.40%, 07/26/2029(b) | | | 12,560,000 | 13,608,211 |
| Endo Dac/Endo Finance LLC/Endo Finco, Inc., 6.00%, 07/15/2023(b) | | | 200,000 | 133,000 |
| GlaxoSmithKline Capital PLC (United Kingdom), 2.88%, 06/01/2022 | | | 5,954,000 | 6,090,573 |
| HLF Financing S.a.r.l. LLC/Herbalife International, Inc., 7.25%, 08/15/2026(b) | | | 328,000 | 324,310 |
| Par Pharmaceutical, Inc., 7.50%, 04/01/2027(b) | | | 228,000 | 213,180 |
| Teva Pharmaceutical Finance IV, B.V. (Israel), 3.65%, 11/10/2021 | | | 265,000 | 253,075 |
| | | | | 60,285,752 |
| Precious Metals & Minerals–0.01% |
| ALROSA Finance S.A. (Russia), 4.65%, 04/09/2024(b) | | | 200,000 | 211,296 |
| Property & Casualty Insurance–0.01% |
| Allstate Corp. (The), 4.20%, 12/15/2046 | | | 310,000 | 376,981 |
| Publishing–0.11% |
| Meredith Corp., 6.88%, 02/01/2026 | | | 4,206,000 | 4,458,360 |
| Railroads–0.10% |
| Autoridad del Canal de Panama (Panama), REGS, 4.95%, 07/29/2035(b) | | | 300,000 | 343,878 |
See accompanying Notes to Financial Statements which are an integral part of the financial statements.
| 22 | Invesco Core Plus Bond Fund |
| | | Principal
Amount | Value |
| Railroads–(continued) |
| Union Pacific Corp., 3.95%, 08/15/2059 | | | $3,641,000 | $4,013,663 |
| | | | | 4,357,541 |
| Regional Banks–0.14% |
| Banco Internacional del Peru SAA Interbank (Peru), REGS, 3.38%, 01/18/2023(b) | | | 150,000 | 151,875 |
| CIT Group, Inc., 5.00%, 08/01/2023 | | | 536,000 | 582,900 |
| Synovus Financial Corp., 3.13%, 11/01/2022 | | | 5,096,000 | 5,115,747 |
| | | | | 5,850,522 |
| Reinsurance–0.01% |
| Reinsurance Group of America, Inc., 4.70%, 09/15/2023 | | | 310,000 | 338,328 |
| Research & Consulting Services–0.03% |
| Equinix, Inc., 5.88%, 01/15/2026 | | | 981,000 | 1,045,991 |
| IHS Markit Ltd., 5.00%, 11/01/2022(b) | | | 174,000 | 185,983 |
| | | | | 1,231,974 |
| Residential REITs–0.11% |
| Spirit Realty L.P., 4.00%, 07/15/2029 | | | 4,490,000 | 4,799,827 |
| Restaurants–0.44% |
| 1011778 BC ULC/New Red Finance, Inc. (Canada), 5.00%, 10/15/2025(b) | | | 4,808,000 | 4,976,280 |
| Aramark Services, Inc., 5.00%, 04/01/2025(b) | | | 109,000 | 112,886 |
| IRB Holding Corp., 6.75%, 02/15/2026(b) | | | 270,000 | 272,025 |
| Starbucks Corp., 4.45%, 08/15/2049 | | | 11,226,000 | 13,163,081 |
| | | | | 18,524,272 |
| Retail REITs–0.12% |
| Regency Centers, L.P., 4.13%, 03/15/2028 | | | 4,719,000 | 5,209,993 |
| Security & Alarm Services–0.01% |
| Brink’s Co. (The), 4.63%, 10/15/2027(b) | | | 223,000 | 227,460 |
| Semiconductor Equipment–0.43% |
| Broadcom Corp./Broadcom Cayman Finance Ltd., | | | |
| 3.00%, 01/15/2022 | | | 9,827,000 | 9,910,196 |
| 3.50%, 01/15/2028 | | | 290,000 | 281,401 |
| Lam Research Corp., | | | |
| 3.75%, 03/15/2026 | | | 120,000 | 128,614 |
| 4.00%, 03/15/2029 | | | 3,890,000 | 4,321,836 |
| 4.88%, 03/15/2049 | | | 3,005,000 | 3,698,330 |
| | | | | 18,340,377 |
| | | Principal
Amount | Value |
| Semiconductors–1.31% |
| Analog Devices, Inc., 3.13%, 12/05/2023 | | | $4,238,000 | $4,375,141 |
| Micron Technology, Inc., | | | |
| 5.50%, 02/01/2025 | | | 437,000 | 446,437 |
| 4.98%, 02/06/2026 | | | 5,430,000 | 5,855,131 |
| 4.19%, 02/15/2027 | | | 15,800,000 | 16,316,050 |
| 5.33%, 02/06/2029 | | | 3,165,000 | 3,507,388 |
| 4.66%, 02/15/2030 | | | 5,039,000 | 5,267,785 |
| NXP B.V./NXP Funding LLC (Netherlands), | | | |
| 3.88%, 09/01/2022(b) | | | 13,736,000 | 14,249,227 |
| 4.63%, 06/01/2023(b) | | | 5,202,000 | 5,566,405 |
| | | | | 55,583,564 |
| Soft Drinks–0.19% |
| Keurig Dr Pepper, Inc., 3.55%, 05/25/2021 | | | 7,662,000 | 7,840,245 |
| Sovereign Debt–1.07% |
| Abu Dhabi Government International Bond (United Arab Emirates), REGS, 4.13%, 10/11/2047(b) | | | 200,000 | 249,174 |
| Argentine Republic Government International Bond (Argentina), 6.88%, 04/22/2021 | | | 345,000 | 147,491 |
| Bahamas Government International Bond (Bahamas), 6.00%, 11/21/2028(b) | | | 427,000 | 476,643 |
| Banque Ouest Africaine de Developpement (Supranational), 5.00%, 07/27/2027(b) | | | 200,000 | 212,485 |
| Bermuda Government International Bond (Bermuda), REGS, 3.72%, 01/25/2027(b) | | | 200,000 | 215,000 |
| Chile Government International Bond (Chile), 3.50%, 01/25/2050 | | | 8,321,000 | 9,510,986 |
| Colombia Government International Bond (Colombia), 3.88%, 04/25/2027 | | | 300,000 | 324,903 |
| Dominican Republic International Bond (Dominican Repubic), 6.40%, 06/05/2049(b) | | | 250,000 | 274,688 |
| Egypt Government International Bond (Egypt), 6.20%, 03/01/2024(b) | | | 200,000 | 210,988 |
| El Salvador Government International Bond (El Salvador), 7.12%, 01/20/2050(b) | | | 415,000 | 420,188 |
| Guatemala Government Bond (Guatemala), | | | |
| 4.90%, 06/01/2030(b) | | | 200,000 | 215,340 |
| 6.13%, 06/01/2050(b) | | | 400,000 | 478,000 |
| Hong Kong Government International Bond (Hong Kong), 2.50%, 05/28/2024(b) | | | 200,000 | 207,250 |
See accompanying Notes to Financial Statements which are an integral part of the financial statements.
| 23 | Invesco Core Plus Bond Fund |
| | | Principal
Amount | Value |
| Sovereign Debt–(continued) |
| Indonesia Government International Bond (Indonesia), | | | |
| 4.75%, 02/11/2029 | | | $200,000 | $230,958 |
| 5.35%, 02/11/2049 | | | 206,000 | 269,976 |
| REGS, 5.25%, 01/08/2047(b) | | | 200,000 | 252,147 |
| Jamaica Government International Bond (Jamaica), | | | |
| 6.75%, 04/28/2028 | | | 303,000 | 354,131 |
| 8.00%, 03/15/2039 | | | 200,000 | 259,252 |
| 7.88%, 07/28/2045 | | | 4,332,000 | 5,605,608 |
| Kenya Government International Bond (Kenya), 8.00%, 05/22/2032(b) | | | 200,000 | 211,914 |
| KSA Sukuk Ltd. (Saudi Arabia), 3.63%, 04/20/2027(b) | | | 200,000 | 217,923 |
| Mexico Government International Bond (Mexico), 4.50%, 04/22/2029 | | | 200,000 | 221,052 |
| Oman Government International Bond (Oman), | | | |
| 4.13%, 01/17/2023(b) | | | 7,578,000 | 7,560,252 |
| 6.00%, 08/01/2029(b) | | | 200,000 | 199,308 |
| Panama Government International Bond (Panama), 3.16%, 01/23/2030 | | | 200,000 | 212,500 |
| Paraguay Government International Bond (Paraguay), 5.40%, 03/30/2050(b) | | | 200,000 | 235,625 |
| Peruvian Government International Bond (Peru), 2.84%, 06/20/2030 | | | 85,000 | 90,058 |
| Philippine Government International Bond (Philippines), 3.95%, 01/20/2040 | | | 200,000 | 240,590 |
| Qatar Government International Bond (Qatar), | | | |
| 3.38%, 03/14/2024(b) | | | 12,520,000 | 13,264,602 |
| 4.50%, 04/23/2028(b) | | | 200,000 | 234,625 |
| 4.00%, 03/14/2029(b) | | | 329,000 | 376,118 |
| 5.10%, 04/23/2048(b) | | | 230,000 | 306,982 |
| 4.82%, 03/14/2049(b) | | | 329,000 | 424,097 |
| Republic of Poland Government International Bond (Poland), 4.00%, 01/22/2024 | | | 150,000 | 163,482 |
| Russian Foreign Bond (Russia), 5.25%, 06/23/2047(b) | | | 200,000 | 238,271 |
| Saudi Government International Bond (Saudi Arabia), | | | |
| 2.88%, 03/04/2023(b) | | | 280,000 | 288,669 |
| 4.38%, 04/16/2029(b) | | | 415,000 | 479,200 |
| Slovenia Government International Bond (Slovenia), REGS, 5.25%, 02/18/2024(b) | | | 300,000 | 341,056 |
| Trinidad & Tobago Government International Bond (Trinidad), 4.50%, 08/04/2026(b) | | | 200,000 | 206,752 |
| | | | | 45,428,284 |
| | | Principal
Amount | Value |
| Specialized Consumer Services–0.01% |
| ServiceMaster Co., LLC (The), | | | |
| 5.13%, 11/15/2024(b) | | | $259,000 | $272,502 |
| 7.45%, 08/15/2027 | | | 191,000 | 212,726 |
| | | | | 485,228 |
| Specialized Finance–0.07% |
| Park Aerospace Holdings Ltd. (Ireland), 5.25%, 08/15/2022(b) | | | 2,937,000 | 3,109,549 |
| Specialized REITs–0.05% |
| Crown Castle International Corp., 3.80%, 02/15/2028 | | | 205,000 | 220,132 |
| GLP Capital, L.P. / GLP Financing II, Inc., 5.38%, 04/15/2026 | | | 156,000 | 171,625 |
| Iron Mountain US Holdings, Inc., 5.38%, 06/01/2026(b) | | | 522,000 | 541,575 |
| Iron Mountain, Inc., | | | |
| 6.00%, 08/15/2023 | | | 142,000 | 145,550 |
| 5.25%, 03/15/2028(b) | | | 383,000 | 399,278 |
| SBA Communications Corp., 4.88%, 09/01/2024 | | | 783,000 | 813,341 |
| | | | | 2,291,501 |
| Specialty Chemicals–0.03% |
| Ashland LLC, 4.75%, 08/15/2022 | | | 180,000 | 189,848 |
| Element Solutions, Inc., 5.88%, 12/01/2025(b) | | | 258,000 | 270,900 |
| GCP Applied Technologies, Inc., 5.50%, 04/15/2026(b) | | | 389,000 | 399,697 |
| PolyOne Corp., 5.25%, 03/15/2023 | | | 183,000 | 197,411 |
| PQ Corp., 6.75%, 11/15/2022(b) | | | 93,000 | 96,855 |
| Rayonier A.M. Products, Inc., 5.50%, 06/01/2024(b) | | | 419,000 | 280,940 |
| | | | | 1,435,651 |
| Steel–0.10% |
| ArcelorMittal (Luxembourg), 7.00%, 10/15/2039 | | | 230,000 | 275,671 |
| Cleveland-Cliffs, Inc., 5.75%, 03/01/2025 | | | 357,000 | 358,785 |
| POSCO (South Korea), 4.00%, 08/01/2023(b) | | | 228,000 | 241,254 |
| Steel Dynamics, Inc., 5.13%, 10/01/2021 | | | 2,592,000 | 2,602,472 |
| United States Steel Corp., 6.88%, 08/15/2025 | | | 211,000 | 201,305 |
| Usiminas International Sarl (Brazil), 5.88%, 07/18/2026(b) | | | 200,000 | 201,450 |
| Vale Canada Ltd. (Brazil), 7.20%, 09/15/2032 | | | 200,000 | 238,500 |
| | | | | 4,119,437 |
See accompanying Notes to Financial Statements which are an integral part of the financial statements.
| 24 | Invesco Core Plus Bond Fund |
| | | Principal
Amount | Value |
| Systems Software–0.17% |
| Microsoft Corp., 4.25%, 02/06/2047 | | | $245,000 | $312,448 |
| VMware, Inc., | | | |
| 2.30%, 08/21/2020 | | | 6,811,000 | 6,813,514 |
| 2.95%, 08/21/2022 | | | 280,000 | 284,602 |
| | | | | 7,410,564 |
| Technology Distributors–0.02% |
| Avnet, Inc., 4.63%, 04/15/2026 | | | 465,000 | 507,426 |
| CDW LLC/CDW Finance Corp., 5.00%, 09/01/2025 | | | 163,000 | 170,845 |
| | | | | 678,271 |
| Technology Hardware, Storage & Peripherals–0.76% |
| Apple, Inc., 4.25%, 02/09/2047 | | | 255,000 | 310,137 |
| Dell International LLC/EMC Corp., | | | |
| 4.42%, 06/15/2021(b) | | | 7,273,000 | 7,506,393 |
| 7.13%, 06/15/2024(b) | | | 850,000 | 896,092 |
| 6.02%, 06/15/2026(b) | | | 5,674,000 | 6,408,567 |
| 4.90%, 10/01/2026(b) | | | 4,895,000 | 5,237,286 |
| 8.35%, 07/15/2046(b) | | | 9,074,000 | 11,937,494 |
| | | | | 32,295,969 |
| Textiles–0.01% |
| Eagle Intermediate Global Holding B.V./Ruyi US Finance LLC (China), 7.50%, 05/01/2025(b) | | | 501,000 | 472,193 |
| Thrifts & Mortgage Finance–0.01% |
| Nationwide Building Society (United Kingdom), 4.13%, 10/18/2032(b) | | | 335,000 | 333,162 |
| ZAR Sovereign Capital Fund Pty. Ltd. (South Africa), REGS, 3.90%, 06/24/2020(b) | | | 200,000 | 201,706 |
| | | | | 534,868 |
| Tobacco–0.18% |
| Altria Group, Inc., | | | |
| 4.40%, 02/14/2026 | | | 6,477,000 | 7,107,761 |
| 6.20%, 02/14/2059 | | | 460,000 | 592,547 |
| | | | | 7,700,308 |
| Trading Companies & Distributors–0.92% |
| AerCap Global Aviation Trust (Ireland), 6.50%, 06/15/2045(b) | | | 17,106,000 | 18,324,802 |
| Air Lease Corp., 3.63%, 12/01/2027 | | | 340,000 | 354,620 |
| Aircastle Ltd., | | | |
| 7.63%, 04/15/2020 | | | 55,000 | 56,773 |
| 5.00%, 04/01/2023 | | | 327,000 | 350,036 |
| BMC East, LLC, 5.50%, 10/01/2024(b) | | | 481,000 | 500,841 |
| | | Principal
Amount | Value |
| Trading Companies & Distributors–(continued) |
| BOC Aviation Ltd. (Singapore), 3.46% (3 mo. USD LIBOR + 1.13%), 09/26/2023(b)(c) | | | $10,404,000 | $10,456,176 |
| Herc Holdings, Inc., 5.50%, 07/15/2027(b) | | | 6,863,000 | 7,094,626 |
| United Rentals North America, Inc., | | | |
| 5.50%, 07/15/2025 | | | 130,000 | 136,013 |
| 5.88%, 09/15/2026 | | | 340,000 | 365,925 |
| 6.50%, 12/15/2026 | | | 330,000 | 360,112 |
| 5.50%, 05/15/2027 | | | 722,000 | 777,421 |
| 5.25%, 01/15/2030 | | | 380,000 | 407,550 |
| | | | | 39,184,895 |
| Trucking–0.75% |
| Aviation Capital Group LLC, | | | |
| 2.94%, (3 mo. USD LIBOR + 0.67%), 07/30/2021(b)(c) | | | 4,679,000 | 4,677,653 |
| 4.13%, 08/01/2025(b) | | | 5,549,000 | 5,927,039 |
| 3.50%, 11/01/2027(b) | | | 9,841,000 | 10,286,719 |
| Avis Budget Car Rental LLC/Avis Budget Finance, Inc., 5.25%, 03/15/2025(b) | | | 304,000 | 310,460 |
| Avolon Holdings Funding Ltd. (Ireland), 4.38%, 05/01/2026(b) | | | 3,310,000 | 3,440,911 |
| DAE Funding LLC (United Arab Emirates), 4.00%, 08/01/2020(b) | | | 6,449,000 | 6,542,124 |
| Kenan Advantage Group, Inc. (The), 7.88%, 07/31/2023(b) | | | 202,000 | 180,285 |
| Penske Truck Leasing Co., L.P./PTL Finance Corp., 3.90%, 02/01/2024(b) | | | 500,000 | 529,143 |
| | | | | 31,894,334 |
| Wireless Telecommunication Services–2.15% |
| Axiata SPV2 Bhd. (Malaysia), REGS, 4.36%, 03/24/2026(b) | | | 200,000 | 217,286 |
| Bharti Airtel Ltd. (India), REGS, 4.38%, 06/10/2025(b) | | | 200,000 | 207,472 |
| Digicel Group One Ltd. (Jamaica), 8.25%, 12/30/2022(b) | | | 130,000 | 74,100 |
| Digicel Group Two Ltd. (Jamaica), 8.25%, 09/30/2022(b) | | | 124,000 | 24,180 |
| Empresa Nacional de Telecomunicaciones S.A. (Chile), REGS, 4.88%, 10/30/2024(b) | | | 700,000 | 739,424 |
| Oztel Holdings SPC Ltd. (Oman), 5.63%, 10/24/2023(b) | | | 6,393,000 | 6,576,799 |
| Rogers Communications, Inc. (Canada), 4.35%, 05/01/2049 | | | 2,289,000 | 2,687,726 |
| SixSigma Networks Mexico, S.A. de C.V. (Mexico), 7.50%, 05/02/2025(b) | | | 325,000 | 309,891 |
See accompanying Notes to Financial Statements which are an integral part of the financial statements.
| 25 | Invesco Core Plus Bond Fund |
| | | Principal
Amount | Value |
| Wireless Telecommunication Services–(continued) |
| Sprint Communications, Inc., | | | |
| 7.00%, 03/01/2020(b) | | | $105,000 | $107,363 |
| 11.50%, 11/15/2021 | | | 140,000 | 164,850 |
| Sprint Corp., 7.63%, 02/15/2025 | | | 149,000 | 167,066 |
| Sprint Spectrum Co. LLC/Sprint Spectrum Co. II LLC/Sprint Spectrum Co. III LLC, | | | |
| Class A-1, 3.36%, 09/20/2021(b) | | | 15,237,000 | 15,332,993 |
| 4.74%, 03/20/2025(b) | | | 29,781,000 | 31,642,313 |
| 5.15%, 03/20/2028(b) | | | 30,339,000 | 32,766,120 |
| | | | | 91,017,583 |
| Total U.S. Dollar Denominated Bonds & Notes (Cost $1,741,937,034) | | 1,825,255,274 |
|
| Asset-Backed Securities–24.73% |
| Adjustable Rate Mortgage Trust, | | | |
| Series 2004-2, Class 6A1, 4.68%, 02/25/2035(i) | | | 1,240,626 | 1,259,471 |
| Series 2005-1, Class 4A1, 4.38%, 05/25/2035(i) | | | 1,033,835 | 1,050,285 |
| ALM VII Ltd., Series 2012-7A, Class A1A2, 3.47% (3 mo. USD LIBOR + 1.17%), 07/15/2029(b)(c) | | | 5,638,500 | 5,638,221 |
| Angel Oak Mortgage Trust I LLC, | | | |
| Series 2018-3, Class A1, 3.65%, 09/25/2048(b)(i) | | | 9,016,898 | 9,140,087 |
| Series 2019-2, Class A1, 3.63%, 03/25/2049(b)(i) | | | 22,863,696 | 23,259,473 |
| Angel Oak Mortgage Trust, LLC, | | | |
| Series 2017-3, Class A1, 2.71%, 11/25/2047(b)(i) | | | 2,407,479 | 2,407,341 |
| Series 2018-1, Class A1, 3.26%, 04/27/2048(b)(i) | | | 8,914,658 | 8,965,823 |
| Apex Credit CLO Ltd., Series 2017-1A, Class AF, 3.60%, 04/24/2029(b) | | | 8,567,700 | 8,570,593 |
| Avery Point VI CLO Ltd., Series 2015-6A, Class AR, 3.34% (3 mo. USD LIBOR + 1.05%), 08/05/2027(b)(c) | | | 23,491,000 | 23,502,417 |
| Banc of America Commercial Mortgage Trust, Series 2015-UBS7, Class AS, 3.99%, 09/15/2048(i) | | | 4,394,000 | 4,798,005 |
| Bear Stearns Adjustable Rate Mortgage Trust, | | | |
| Series 2003-6, Class 1A3, 4.46%, 08/25/2033(i) | | | 129,846 | 131,602 |
| Series 2004-10, Class 21A1, 4.55%, 01/25/2035(i) | | | 560,010 | 573,166 |
| Series 2006-1, Class A1, 4.91%, 02/25/2036(c) | | | 498,512 | 511,690 |
| Bear Stearns ALT-A Trust, Series 2004-11, Class 2A3, 4.35%, 11/25/2034(i) | | | 1,736,886 | 1,730,594 |
| | Principal
Amount | Value |
|
| Benchmark Mortgage Trust, Series 2019-B11, Class D, 3.00%, 05/15/2052(b) | | $5,242,000 | $4,921,442 |
| Bunker Hill Loan Depositary Trust, Series 2019-1, Class A1, 3.61%, 10/26/2048(b)(i)(j) | | 9,591,738 | 9,714,667 |
| CAL Funding II Ltd., Series 2018-2A, Class A, 4.34%, 09/25/2043(b) | | 8,629,167 | 8,873,603 |
| Castlelake Aircraft Structured Trust, Series 2019-1A, Class A, 3.97%, 04/15/2039(b) | | 11,399,053 | 11,649,477 |
| CFCRE Commercial Mortgage Trust, Series 2011-C2, Class C, 5.94%, 12/15/2047(b)(i) | | 5,000,000 | 5,339,920 |
| CGDBB Commercial Mortgage Trust, | | |
| Series 2017-BIOC, Class A, 2.99% (1 mo. USD LIBOR + 0.79%), 07/15/2032(b)(c) | | 12,581,000 | 12,592,669 |
| Series 2017-BIOC, Class B, 3.17% (1 mo. USD LIBOR + 0.97%), 07/15/2032(b)(c) | | 4,250,000 | 4,253,926 |
| Series 2017-BIOC, Class C, 3.25% (1 mo. USD LIBOR + 1.05%), 07/15/2032(b)(c) | | 17,124,000 | 17,129,254 |
| Series 2017-BIOC, Class D, 3.80% (1 mo. USD LIBOR + 1.60%), 07/15/2032(b)(c) | | 4,973,000 | 4,978,074 |
| CGRBS Commercial Mortgage Trust, Series 2013-VN05, Class A, 3.37%, 03/13/2035(b) | | 1,647,256 | 1,740,188 |
| Chase Home Lending Mortgage Trust, Series 2019-ATR2, Class A3, 3.50% (Acquired 07/29/2019; Cost $12,220,304), 07/25/2049(b)(i) | | 31,287,039 | 31,703,782 |
| Chase Mortgage Trust, | | |
| Series 2016-1, Class M3, 3.75%, 04/25/2045(b)(i) | | 2,556,972 | 2,633,046 |
| Series 2016-2, Class M2, 3.75%, 12/25/2045(b)(i) | | 9,982,851 | 10,534,349 |
| Series 2016-2, Class M3, 3.75%, 12/25/2045(b)(i) | | 4,442,200 | 4,601,320 |
| Citigroup Commercial Mortgage Trust, | | |
| Series 2012-GC8, Class B, 4.29%, 09/10/2045(b) | | 1,300,000 | 1,360,831 |
| Series 2013-GC11, Class D, 4.57%, 04/10/2023(b)(i) | | 752,554 | 783,904 |
| Series 2015-GC27, Class A5, 3.14%, 02/10/2048 | | 1,233,335 | 1,301,410 |
| Citigroup Mortgage Loan Trust, Inc., | | |
| Series 2004-UST1, Class A4, 4.40%, 08/25/2034(i) | | 415,955 | 408,175 |
| Series 2019-IMC1, Class A1, 2.72%, 07/25/2049(b)(i) | | 15,281,000 | 15,311,247 |
See accompanying Notes to Financial Statements which are an integral part of the financial statements.
| 26 | Invesco Core Plus Bond Fund |
| | Principal
Amount | Value |
|
| COLT Mortgage Loan Trust, Series 2018-1, Class A1, 2.93%, 02/25/2048(b)(i) | | $3,142,724 | $3,146,492 |
| Commercial Mortgage Trust, | | |
| Series 2013-SFS, Class A1, 1.87%, 04/12/2035(b) | | 341,803 | 341,035 |
| Series 2015-CR25, Class B, 4.69%, 08/10/2048(i) | | 5,267,000 | 5,755,260 |
| Series 2016-GCT, Class B, 3.09%, 08/10/2029(b) | | 4,595,000 | 4,643,657 |
| Series 2016-GCT, Class C, 3.58%, 08/10/2029(b)(i) | | 2,115,000 | 2,144,692 |
| Countrywide Home Loans Mortgage Pass Through Trust, Series 2007-13, Class A10, 6.00%, 08/25/2037 | | 305,350 | 248,596 |
| Credit Suisse First Boston Mortgage Securities Corp., Series 2004-AR5, Class 3A1, 4.50%, 06/25/2034(i) | | 1,588,271 | 1,626,364 |
| CSAIL Commercial Mortgage Trust, Series 2015-C3, Class A4, 3.72%, 08/15/2048 | | 1,125,283 | 1,221,275 |
| CSWF, Series 2018-TOP, Class B, 3.50% (1 mo. USD LIBOR + 1.30%), 08/15/2035(b)(c) | | 12,819,000 | 12,829,195 |
| DB Master Finance LLC, | | |
| Series 2019-1A, Class A23, 4.35%, 05/20/2049(b) | | 10,184,475 | 10,823,208 |
| Series 2019-1A, Class A2II, 4.02%, 05/20/2049(b) | | 10,758,037 | 11,277,453 |
| DBUBS Mortgage Trust, Series 2011-LC1A, Class E, 5.88%, 11/10/2046(b)(i) | | 638,333 | 662,353 |
| Deephaven Residential Mortgage Trust, | | |
| Series 2017-2A, Class A2, 2.61%, 06/25/2047(b)(i) | | 591,307 | 591,700 |
| Series 2017-2A, Class A3, 2.71%, 06/25/2047(b)(i) | | 639,406 | 639,819 |
| Series 2017-3A, Class A1, 2.58%, 10/25/2047(b)(i) | | 5,470,883 | 5,468,078 |
| Series 2017-3A, Class A2, 2.71%, 10/25/2047(b)(i) | | 1,519,871 | 1,519,390 |
| Series 2018-1A, Class A1, 2.98%, 12/25/2057(b)(i) | | 7,992,623 | 8,010,903 |
| Deutsche Mortgage Securities Inc Re-REMIC Trust Certificates, Series 2007-WM1, Class A1, 3.81%, 06/27/2037(b)(i) | | 6,579,761 | 6,749,660 |
| DT Auto Owner Trust, | | |
| Series 2019-3A, Class C, 2.74%, 04/15/2025(b) | | 7,360,000 | 7,453,058 |
| Series 2019-3A, Class D, 2.96%, 04/15/2025(b) | | 10,579,000 | 10,696,029 |
| First Horizon Alternative Mortgage Securities Trust, Series 2005-FA8, Class 2A1, 5.00%, 11/25/2020 | | 54,447 | 54,705 |
| | Principal
Amount | Value |
|
| Galton Funding Mortgage Trust, Series 2018-1, Class A43, 3.50%, 11/25/2057(b)(i) | | $4,937,362 | $5,018,156 |
| GMACM Mortgage Loan Trust, Series 2006-AR1, Class 1A1, 4.18%, 04/19/2036(i) | | 668,395 | 628,434 |
| Golub Capital Partners CLO 35(B), Ltd., Class 2017-35A, Class AR, 3.47% (3 mo. USD LIBOR + 1.19%), 07/20/2029(b)(c) | | 20,000,000 | 20,019,620 |
| Golub Capital Partners CLO 41 B Ltd, Series 2019-41A, Class A, 3.96% (3 mo. USD LIBOR + 1.37%), 04/20/2029(b)(c) | | 30,760,000 | 30,782,944 |
| GS Mortgage Securities Corp. II, Series 2013-KING, Class A, 2.71%, 12/10/2027(b) | | 1,328,145 | 1,327,491 |
| GS Mortgage Securities Trust, Series 2013-G1, Class A1, 2.06%, 04/10/2031(b) | | 612,609 | 611,756 |
| GSR Mortgage Loan Trust, Series 2005-AR6, Class 3A2, 4.53%, 09/25/2035(i) | | 229,817 | 232,124 |
| Harborview Mortgage Loan Trust, Series 2005-9, Class 2A1C, 2.62% (1 mo. USD LIBOR + 0.45%), 06/20/2035(c) | | 24,209 | 24,492 |
| Hertz Vehicle Financing II L.P., | | |
| Series 2015-1A, Class A, 2.73%, 03/25/2021(b) | | 13,789,000 | 13,817,876 |
| Series 2018-1A, Class A, 3.29%, 02/25/2024(b) | | 8,320,000 | 8,582,601 |
| Series 2018-1A, Class C, 4.39%, 02/25/2024(b) | | 3,217,000 | 3,331,797 |
| Series 2019-1A, Class A, 3.71%, 03/25/2023(b) | | 13,100,000 | 13,556,608 |
| Series 2019-1A, Class B, 4.10%, 03/25/2023(b) | | 12,500,000 | 12,947,328 |
| Series 2019-1A, Class C, 4.99%, 03/25/2023(b) | | 4,000,000 | 4,164,120 |
| Series 2019-2A, Class A, 3.42%, 05/25/2025(b) | | 15,500,000 | 16,190,150 |
| Series 2019-2A, Class B, 3.67%, 05/25/2025(b) | | 10,333,000 | 10,745,409 |
| HMH Trust, Series 2017-NSS, Class A, 3.06%, 07/05/2031(b) | | 9,500,000 | 9,695,187 |
| Home Partners of America Trust, | | |
| Series 2018-1, Class A, 3.08% (1 mo. USD LIBOR + 0.90%), 07/17/2037(b)(c) | | 7,447,825 | 7,431,702 |
| Series 2018-1, Class B, 3.28% (1 mo. USD LIBOR + 1.10%), 07/17/2037(b)(c) | | 7,990,000 | 7,972,655 |
| Series 2018-1, Class C, 3.43% (1 mo. USD LIBOR + 1.25%), 07/17/2037(b)(c) | | 3,610,000 | 3,600,642 |
See accompanying Notes to Financial Statements which are an integral part of the financial statements.
| 27 | Invesco Core Plus Bond Fund |
| | Principal
Amount | Value |
|
| Homeward Opportunities Fund I Trust, Series 2019-1, Class A1, 3.45%, 01/25/2059(b)(i) | | $17,255,173 | $17,464,697 |
| ICG US CLO Ltd., Series 2016-1A, Class A1R, 3.40% (3 mo. USD LIBOR + 1.14%), 07/29/2028(b)(c) | | 11,399,000 | 11,365,705 |
| InTown Hotel Portfolio Trust, | | |
| Series 2018-STAY, Class A, 2.90% (1 mo. USD LIBOR + 0.70%), 01/15/2033(b)(c) | | 15,995,000 | 15,967,527 |
| Series 2018-STAY, Class B, 3.25% (1 mo. USD LIBOR + 1.05%), 01/15/2033(b)(c) | | 8,640,000 | 8,628,251 |
| Invitation Homes Trust, | | |
| Series 2017-SFR2, Class A, 3.03% (1 mo. USD LIBOR + 0.85%), 12/17/2036(b)(c) | | 5,810,113 | 5,812,996 |
| Series 2017-SFR2, Class B, 3.33% (1 mo. USD LIBOR + 1.15%), 12/17/2036(b)(c) | | 3,221,000 | 3,230,553 |
| Series 2017-SFR2, Class C, 3.63% (1 mo. USD LIBOR + 1.45%), 12/17/2036(b)(c) | | 6,188,000 | 6,204,860 |
| Series 2017-SFR2, Class D, 3.98% (1 mo. USD LIBOR + 1.80%), 12/17/2036(b)(c) | | 4,706,000 | 4,717,764 |
| Series 2018-SFR1, Class A, 2.88% (1 mo. USD LIBOR + 0.70%), 03/17/2037(b)(c) | | 30,535,845 | 30,197,731 |
| Jimmy Johns Funding LLC, | | |
| Series 2017-1A, Class A2I, 3.61%, 07/30/2047(b) | | 16,787,003 | 16,988,472 |
| Series 2017-1A, Class A2II, 4.85%, 07/30/2047(b) | | 9,114,000 | 9,846,168 |
| JOL Air Ltd., Series 2019-1, Class A, 3.97%, 04/15/2044(b) | | 16,156,247 | 16,383,924 |
| JP Morgan Chase Commercial Mortgage Securities Trust, Series 2012-LC9, Class B, 3.81%, 12/15/2047(b)(i) | | 5,000,000 | 5,208,617 |
| JP Morgan Mortgage Trust, | | |
| Series 2005-A3, Class 1A1, 4.46%, 06/25/2035(i) | | 498,373 | 505,033 |
| Series 2005-A3, Class 6A5, 4.52%, 06/25/2035(i) | | 762,714 | 778,804 |
| Series 2005-A5, Class 1A2, 4.17%, 08/25/2035(i) | | 554,529 | 565,248 |
| Series 2007-A4, Class 3A1, 3.97%, 06/25/2037(i) | | 839,421 | 850,078 |
| Series 2015-3, Class B2, 3.67%, 05/25/2045(b)(i) | | 9,045,911 | 9,330,652 |
| JPMBB Commercial Mortgage Securities Trust, | | |
| Series 2013-C17, Class C, 5.05%, 01/15/2047(i) | | 12,750,000 | 13,855,713 |
| Series 2015-C31, Class A3, 3.80%, 08/15/2048 | | 1,064,445 | 1,167,654 |
| Series 2016-C1, Class B, 4.90%, 03/15/2049(i) | | 5,083,000 | 5,722,925 |
| | Principal
Amount | Value |
|
| Lehman Mortgage Trust, Series 2006-1, Class 3A5, 5.50%, 02/25/2036 | | $237,945 | $231,775 |
| MAD Mortgage Trust, Series 2017-330M, Class A, 3.29%, 08/15/2034(b)(i) | | 11,633,000 | 12,204,178 |
| Merrill Lynch Mortgage Investors Trust, | | |
| Series 2005-3, Class 3A, 4.46% (1 mo. USD LIBOR + 0.25%), 11/25/2035(c) | | 921,414 | 946,139 |
| Series 2005-A5, Class A9, 4.34%, 06/25/2035(i) | | 1,120,326 | 1,132,363 |
| Morgan Stanley Capital I Trust, | | |
| Series 2014-150E, Class C, 4.44%, 09/09/2032(b)(i) | | 3,350,000 | 3,624,641 |
| Series 2017-CLS, Class A, 2.90% (1 mo. USD LIBOR + 0.70%), 11/15/2034(b)(c) | | 18,372,000 | 18,374,715 |
| Series 2017-CLS, Class B, 3.05% (1 mo. USD LIBOR + 0.85%), 11/15/2034(b)(c) | | 9,024,000 | 9,036,646 |
| Series 2017-CLS, Class C, 3.20% (1 mo. USD LIBOR + 1.00%), 11/15/2034(b)(c) | | 6,124,000 | 6,134,487 |
| Morgan Stanley Capital I Trust 2019-L2, Series 2019-L2, Class A4, 4.07%, 03/15/2052 | | 17,430,000 | 20,062,226 |
| MVW Owner Trust, Series 2019-1A, Class A, 2.89%, 11/20/2036(b) | | 11,429,617 | 11,726,334 |
| Natixis Commercial Mortgage Securities Trust, Series 2018-285M, Class E, 3.92%, 11/15/2032(b)(i) | | 6,250,000 | 6,365,736 |
| OBX Trust, Series 2019-EXP1, Class 1A3, 4.00%, 01/25/2059(b)(i) | | 7,995,844 | 8,158,864 |
| OCP CLO Ltd., Series 2014-7A, Class A1RR, 3.40% (3 mo. USD LIBOR + 1.12%), 07/20/2029(b)(c) | | 17,619,000 | 17,572,204 |
| One Bryant Park Trust, Series 2019-OBP, Class A, 2.52%, 09/13/2049(b) | | 21,801,000 | 22,278,908 |
| PPM CLO 3 Ltd. (Cayman Islands), | | |
| Series 2019-3A, Class A, 0.00%, 07/17/2030(b) | | 9,626,000 | 9,623,236 |
| Series 2019-3A, Class B, 4.42% (3 mo. USD LIBOR + 1.95%), 07/17/2030(b)(c) | | 6,789,000 | 6,785,385 |
| Provident Home Equity Loan Trust, Series 2000-2, Class A1, 2.69% (1 mo. USD LIBOR + 0.54%), 08/25/2031(c) | | 157,896 | 138,786 |
| Residential Funding Mortgage Sec I Trust, Series 2005-S9, Class A10, 6.25%, 12/25/2035 | | 899,454 | 947,176 |
See accompanying Notes to Financial Statements which are an integral part of the financial statements.
| 28 | Invesco Core Plus Bond Fund |
| | Principal
Amount | Value |
|
| Sequoia Mortgage Trust, | | |
| Series 2013-3, Class A1, 2.00%, 03/25/2043(i) | | $1,446,041 | $1,409,248 |
| Series 2013-4, Class A3, 1.55%, 04/25/2043(i) | | 1,106,287 | 1,069,894 |
| Series 2013-7, Class A2, 3.00%, 06/25/2043(i) | | 1,219,520 | 1,238,998 |
| Shellpoint Asset Funding Trust, Series 2013-1, Class A3, 3.75%, 07/25/2043(b)(i) | | 1,972,306 | 1,987,326 |
| Specialty Underwriting & Residential Finance Trust, Series 2004-BC2, Class A2, 2.69% (1 mo. USD LIBOR + 0.54%), 05/25/2035(c) | | 41,645 | 40,109 |
| Starwood Mortgage Residential Trust, Series 2019-IMC1, Class A1, 3.47%, 02/25/2049(b)(i) | | 12,382,824 | 12,625,488 |
| Starwood Waypoint Homes Trust, Series 2017-1, Class D, 4.15% (1 mo. USD LIBOR + 1.95%), 01/17/2035(b)(c) | | 16,580,000 | 16,606,286 |
| Structured Adjustable Rate Mortgage Loan Trust, | | |
| Series 2004-12, Class 3A2, 4.47%, 09/25/2034(i) | | 807,934 | 826,913 |
| Series 2004-8, Class 3A, 4.41%, 07/25/2034(i) | | 1,284,809 | 1,298,381 |
| Suntrust Alternative Loan Trust, Series 2005-1F, Class 2A8, 6.00%, 12/25/2035 | | 220,476 | 223,410 |
| Thornburg Mortgage Securities Trust, | | |
| Series 2003-6, Class A2, 2.65% (1 mo. USD LIBOR + 0.50%), 12/25/2033(c) | | 520,675 | 491,921 |
| Series 2005-1, Class A3, 4.61%, 04/25/2045(i) | | 1,097,857 | 1,103,075 |
| Thunderbolt II Aircraft Lease Ltd., Series 2018-A, Class B, 5.07%, 09/15/2038(b)(i)(j) | | 8,148,113 | 8,404,849 |
| Towd Point Mortgage Trust, Series 2017-2, Class A1, 2.75%, 04/25/2057(b)(i) | | 4,508,196 | 4,552,811 |
| Triton Container Finance VI LLC, Series 2018-2A, Class A, 4.19%, 06/22/2043(b) | | 9,684,867 | 10,091,464 |
| UBS Commercial Mortgage Trust, Series 2019-C16, Class A4, 3.60%, 04/15/2052 | | 16,770,000 | 18,668,944 |
| UBS-Barclays Commercial Mortgage Trust, | | |
| Series 2012-C3, Class A4, 3.09%, 08/10/2049 | | 264,769 | 272,457 |
| Series 2012-C4, Class A5, 2.85%, 12/10/2045 | | 532,433 | 546,563 |
| UBS-Citigroup Commercial Mortgage Trust, Series 2011-C1, Class C, 6.25%, 01/10/2045(b)(i) | | 4,500,000 | 4,809,710 |
| | | Principal
Amount | Value |
|
| Verus Securitization Trust, | | | |
| Series 2017-SG1A, Class A1, 2.69%, 11/25/2047(b)(i) | | | $7,549,067 | $7,543,406 |
| Series 2018-1, Class A1, 2.93%, 02/25/2048(b)(i) | | | 9,800,294 | 9,833,890 |
| Series 2018-3, Class A1, 4.11%, 10/25/2058(b)(i) | | | 5,673,536 | 5,761,976 |
| Series 2019-1, Class A1, 3.84%, 02/25/2059(b)(i) | | | 18,449,254 | 18,738,428 |
| Series 2019-2, Class A1, 3.21%, 04/25/2059(b)(i) | | | 6,803,808 | 6,871,159 |
| Series 2019-INV1, Class A1, 3.40%, 12/25/2059(b)(i) | | | 20,948,840 | 21,194,889 |
| WaMu Mortgage Pass Through Trust, Series 2007-HY2, Class 2A2, 4.10%, 11/25/2036(i) | | | 571,768 | 543,641 |
| Wells Fargo Mortgage Backed Securities Trust, | | | |
| Series 2003-J, Class 2A1, 4.58%, 10/25/2033(i) | | | 460,665 | 472,852 |
| Series 2004-Z, Class 2A1, 4.97%, 12/25/2034(i) | | | 236,307 | 242,942 |
| Series 2005-AR14, Class A1, 4.85%, 08/25/2035(i) | | | 338,236 | 348,792 |
| Series 2005-AR16, Class 4A8, 4.95%, 10/25/2035(i) | | | 4,153,543 | 4,276,078 |
| Series 2005-AR2, Class 2A2, 5.14%, 03/25/2035(i) | | | 678,938 | 703,627 |
| Series 2006-AR8, Class 1A3, 4.95%, 04/25/2036(i) | | | 335,996 | 337,612 |
| Wendy’s Funding LLC, | | | |
| Series 2018-1A, Class A2II, 3.88%, 03/15/2048(b) | | | 11,081,250 | 11,506,216 |
| Series 2019-1A, Class A2II, 4.08%, 06/15/2049(b) | | | 5,500,000 | 5,747,610 |
| WFRBS Commercial Mortgage Trust, | | | |
| Series 2011-C5, Class B, 5.86%, 11/15/2044(b)(i) | | | 5,000,000 | 5,307,095 |
| Series 2012-C6, Class B, 4.70%, 04/15/2045 | | | 5,739,000 | 6,049,009 |
| Series 2012-C9, Class D, 4.97%, 10/15/2022(b)(i) | | | 568,832 | 578,607 |
| Series 2013-C14, Class A5, 3.34%, 06/15/2046 | | | 1,485,143 | 1,555,221 |
| Series 2013-C15, Class B, 4.62%, 08/15/2046(i) | | | 3,800,000 | 4,077,317 |
| Series 2013-C16, Class B, 5.19%, 09/15/2046(i) | | | 3,127,000 | 3,426,362 |
| Total Asset-Backed Securities (Cost $1,032,807,774) | | 1,049,475,813 |
| U.S. Government Sponsored Agency Mortgage-Backed Securities–14.96% |
| Collateralized Mortgage Obligations–5.23% |
| Fannie Mae REMICs | | | |
IO
7.00%, 05/25/2033 | | | 7,469 | 1,347 |
| 6.00%, 07/25/2033 | | | 6,472 | 1,137 |
See accompanying Notes to Financial Statements which are an integral part of the financial statements.
| 29 | Invesco Core Plus Bond Fund |
| | | Principal
Amount | Value |
| Collateralized Mortgage Obligations–(continued) |
| Freddie Mac Multifamily Structured Pass Through Ctfs. | | | |
| Series K038, Class X1, IO, 1.31%, 03/25/2024(i) | | | $24,525,284 | $1,082,558 |
| Series K730, Class AM, IO, 3.59%, 01/25/2025(i) | | | 7,859,000 | 8,515,388 |
| Series K731, Class A2, 3.60%, 02/25/2025(i) | | | 18,951,000 | 20,500,271 |
| Series K734, Class A2, 3.21%, 02/25/2026 | | | 37,873,000 | 40,808,324 |
| Series K062, Class A1, 3.03%, 09/25/2026 | | | 9,192,611 | 9,641,777 |
Series K087, Class A1
3.59%, 10/25/2027 | | | 19,804,476 | 21,521,880 |
| 3.77%, 12/25/2028 | | | 16,541,600 | 18,932,619 |
| Series K071, Class A2, 3.29%, 11/25/2027 | | | 11,136,000 | 12,230,005 |
| Series K083, Class AM, 4.03%, 10/25/2028(i) | | | 4,736,000 | 5,493,521 |
| Series K085, Class AM, 4.06%, 10/25/2028(i) | | | 4,736,000 | 5,496,438 |
| Series K089, Class AM, 3.63%, 01/25/2029(i) | | | 8,018,000 | 9,051,884 |
| Series K088, Class AM, 3.76%, 01/25/2029(i) | | | 18,944,000 | 21,592,231 |
| Series K090, Class A2, 3.42%, 02/25/2029 | | | 37,800,000 | 42,333,891 |
| Freddie Mac Whole Loan Securities Trust, Series 2016-2, Class M3, 3.50%, 05/25/2047 | | | 4,624,414 | 4,706,539 |
| | | | | 221,909,810 |
| Federal Home Loan Mortgage Corp. (FHLMC)–0.92% |
| 7.00%, 07/01/2022 to 10/01/2034 | | | 799,434 | 901,944 |
| 3.50%, 08/01/2026 | | | 532,644 | 556,554 |
| 6.00%, 03/01/2029 to 02/01/2034 | | | 282,544 | 312,584 |
| 7.50%, 05/01/2030 to 05/01/2035 | | | 611,335 | 699,425 |
| 8.50%, 08/01/2031 | | | 36,235 | 44,141 |
| 3.00%, 02/01/2032 | | | 2,317,663 | 2,384,876 |
| 6.50%, 07/01/2032 to 09/01/2036 | | | 293,383 | 330,881 |
| 8.00%, 08/01/2032 | | | 30,946 | 37,013 |
| 5.50%, 01/01/2034 to 07/01/2040 | | | 1,937,832 | 2,162,183 |
| 5.00%, 07/01/2034 to 06/01/2040 | | | 2,414,972 | 2,677,312 |
| 4.50%, 02/01/2040 to 10/01/2046 | | | 26,488,125 | 28,841,646 |
| | | Principal
Amount | Value |
| Federal Home Loan Mortgage Corp. (FHLMC)–(continued) |
| ARM, | | | |
| 5.00%, (1 yr. USD LIBOR + 2.00%), 12/01/2036(c) | | | $73,824 | $78,430 |
| 5.19%, (1 yr. USD LIBOR + 2.07%), 02/01/2037(c) | | | 15,874 | 16,876 |
| 4.75%, (1 yr. USD LIBOR + 1.88%), 05/01/2037(c) | | | 126,013 | 133,890 |
| | | | | 39,177,755 |
| Federal National Mortgage Association (FNMA)–7.14% |
| 5.50%, 03/01/2021 to 06/01/2040 | | | 1,474,307 | 1,663,432 |
| 7.50%, 03/01/2021 to 08/01/2037 | | | 639,694 | 748,988 |
| 6.00%, 03/01/2022 to 10/01/2039 | | | 21,157 | 23,100 |
| 6.50%, 07/01/2028 to 01/01/2037 | | | 104,660 | 117,987 |
| 7.00%, 07/01/2029 to 02/01/2034 | | | 463,948 | 526,709 |
| 9.50%, 04/01/2030 | | | 7,068 | 7,981 |
| 3.50%, 12/01/2030 to 05/01/2047 | | | 76,800,774 | 80,247,085 |
| 8.50%, 10/01/2032 | | | 58,381 | 72,216 |
| 8.00%, 04/01/2033 | | | 57,466 | 69,660 |
| 5.00%, 12/01/2039 | | | 644,556 | 713,020 |
| 3.00%, 08/01/2043 | | | 3,705,848 | 3,833,644 |
| 4.50%, 10/01/2048 to 12/01/2048 | | | 59,307,269 | 62,847,662 |
| 4.00%, 12/01/2048 | | | 66,002,263 | 70,096,897 |
| TBA, | | | |
| 2.50%, 09/01/2034(k) | | | 40,620,000 | 41,164,433 |
| 3.50%, 09/01/2034(k) | | | 39,000,000 | 40,419,843 |
| ARM, | | | |
| 4.71%, (1 yr. U.S. Treasury Yield Curve Rate + 2.21%), 05/01/2035(c) | | | 170,843 | 180,452 |
| 4.75%, (1 yr. USD LIBOR + 1.67%), 01/01/2037(c) | | | 68,989 | 72,962 |
| 4.66%, (1 yr. USD LIBOR + 1.72%), 03/01/2038(c) | | | 43,782 | 46,090 |
| | | | | 302,852,161 |
See accompanying Notes to Financial Statements which are an integral part of the financial statements.
| 30 | Invesco Core Plus Bond Fund |
| | | Principal
Amount | Value |
| Government National Mortgage Association (GNMA)–1.67% |
| 7.50%, 06/15/2023 to 05/15/2032 | | | $10,142 | $10,415 |
| 9.00%, 09/15/2024 to 10/15/2024 | | | 7,377 | 7,397 |
| 8.50%, 02/15/2025 | | | 4,484 | 4,496 |
| 8.00%, 08/15/2025 to 09/15/2026 | | | 21,939 | 22,695 |
| 6.56%, 01/15/2027 | | | 111,024 | 122,230 |
| 7.00%, 10/15/2028 to 09/15/2032 | | | 203,810 | 228,301 |
| 6.00%, 11/15/2028 to 02/15/2033 | | | 60,013 | 67,204 |
| 6.50%, 01/15/2029 to 09/15/2034 | | | 84,667 | 93,702 |
| 5.50%, 06/15/2035 | | | 55,064 | 62,221 |
| 5.00%, 07/15/2035 to 08/15/2035 | | | 54,173 | 57,871 |
| 4.00%, 03/20/2048 | | | 8,787,135 | 9,238,920 |
| ARM, | | | |
| 4.00%, (1 yr. U.S. Treasury Yield Curve Rate + 1.50%), 01/20/2025(c) | | | 22,197 | 22,786 |
| 3.88%, 05/20/2025 to 06/20/2025(c) | | | 12,482 | 12,737 |
TBA,
3.00%, 09/01/2049(k) | | | 59,000,000 | 60,834,531 |
| | | | | 70,785,506 |
| Total U.S. Government Sponsored Agency Mortgage-Backed Securities (Cost $613,582,380) | | 634,725,232 |
| U.S. Treasury Securities–12.40% |
| U.S. Treasury Bills–0.24% |
| 1.88%, 11/21/2019(l) | | | 700,000 | 697,028 |
| 1.80% - 1.83%, 12/19/2019(l)(m) | | | 9,655,000 | 9,600,727 |
| | | | | 10,297,755 |
| U.S. Treasury Bonds–4.78% |
| 2.88%, 05/15/2049 | | | 168,199,800 | 202,720,181 |
| U.S. Treasury Notes–7.38% |
| 1.50%, 08/15/2022 | | | 48,536,200 | 48,637,633 |
| 1.75%, 07/31/2024 | | | 112,119,200 | 114,011,212 |
| 1.88%, 07/31/2026 | | | 27,247,300 | 28,004,583 |
| 1.63%, 08/15/2029 | | | 121,268,100 | 122,667,894 |
| | | | | 313,321,322 |
| Total U.S. Treasury Securities (Cost $515,741,550) | | 526,339,258 |
| | | Shares | |
| Preferred Stocks–1.16% |
| Diversified Banks–0.98% |
| Bank of America Corp., Series L, $72.50 Conv. Pfd. | | 1,100 | 1,621,400 |
| | | Shares | Value |
| Diversified Banks–(continued) |
| Wells Fargo & Co., Class A, Series L, $75.00 Conv. Pfd. | | 27,407 | $39,770,298 |
| | | | | 41,391,698 |
| Investment Banking & Brokerage–0.16% |
| Morgan Stanley, 6.88%, Series F, Pfd. | | 249,737 | 6,997,631 |
| Regional Banks–0.02% |
| PNC Financial Services Group, Inc. (The), 6.13%, Series P, Pfd. | | 24,592 | 675,542 |
| Total Preferred Stocks (Cost $44,018,461) | | 49,064,871 |
| | | Principal
Amount | |
| Agency Credit Risk Transfer Notes–0.84% |
| Fannie Mae Connecticut Avenue Securities, 5.00%, (1 mo. USD LIBOR + 2.85%) 11/25/2029(c) | | | $11,000,000 | 11,290,613 |
| Freddie Mac | | | |
| Series 2017-HQA2, Class M2, STACR®, 4.80%, (1 mo. USD LIBOR + 2.65%) 12/25/2029(c) | | | 9,000,000 | 9,169,722 |
| Series 2019-HQA2, Class M1, STACR®, 2.85%, (1 mo. USD LIBOR + 0.70%) 04/25/2049(b)(c) | | | 15,134,500 | 15,139,788 |
| Total Agency Credit Risk Transfer Notes (Cost $35,448,836) | | 35,600,123 |
| Variable Rate Senior Loan Interests–0.63%(n) |
| Diversified REITs–0.63% |
Asteric Inc. (Canada), Term Loan, 3.90%, 03/31/2023
(Cost $26,671,740)(h) | | | 35,662,784 | 26,785,928 |
| Non-U.S. Dollar Denominated Bonds & Notes–0.52%(o) |
| Brewers–0.04% |
| Molson Coors International L.P.Series MPLE, 3.44%, 07/15/2026 | | CAD | 2,000,000 | 1,537,404 |
| Diversified Banks–0.01% |
| Erste Group Bank AG (Austria), REGS, 6.50%(b)(e) | | EUR | 200,000 | 251,854 |
| Food Retail–0.00% |
| Iceland Bondco PLC (United Kingdom), 4.63%, 03/15/2025(b) | | GBP | 100,000 | 105,645 |
| Integrated Telecommunication Services–0.10% |
| AT&T, Inc.Series MPLE, 5.10%, 11/25/2048 | | CAD | 5,000,000 | 4,199,151 |
| Investment Banking & Brokerage–0.07% |
| Morgan StanleySeries MPLE, 3.00%, 02/07/2024 | | CAD | 4,000,000 | 3,075,800 |
See accompanying Notes to Financial Statements which are an integral part of the financial statements.
| 31 | Invesco Core Plus Bond Fund |
| | Principal
Amount | Value |
| Movies & Entertainment–0.19% |
| Netflix, Inc. 3.88%, 11/15/2029(b) | EUR | 6,750,000 | $8,041,761 |
| Sovereign Debt–0.04% |
| Chile Government International Bond (Chile), 0.83%, 07/02/2031 | EUR | 105,000 | 123,190 |
| Indonesia Treasury Bond (Indonesia), Series FR78, 8.25%, 05/15/2029 | IDR | 2,243,000,000 | 168,719 |
| Latvia Government International Bond (Latvia), REGS, 1.88%, 02/19/2049(b) | EUR | 100,000 | 144,596 |
| Mexico Government International Bond (Mexico), 2.88%, 04/08/2039 | EUR | 100,000 | 125,066 |
| Peru Government Bond (Peru), REGS, 6.15%, 08/12/2032(b) | PEN | 800,000 | 271,561 |
| Saudi Government International Bond (Saudi Arabia), 0.75%, 07/09/2027(b) | EUR | 100,000 | 114,655 |
| Saudi Government International Bond (Saudi Arabia), 2.00%, 07/09/2039(b) | EUR | 100,000 | 124,195 |
| Serbia International Bond (Serbia), 1.50%, 06/26/2029(b) | EUR | 285,000 | 326,822 |
| Ukraine Government International Bond (Ukraine), 6.75%, 06/20/2026(b) | EUR | 185,000 | 221,851 |
| | | | 1,620,655 |
| Steel–0.00% |
| Vale S.A. (Brazil), 3.75%, 01/10/2023 | EUR | 150,000 | 178,838 |
| Technology Hardware, Storage & Peripherals–0.07% |
| Apple, Inc.Series MPLE, 2.51%, 08/19/2024 | CAD | 4,000,000 | 3,080,427 |
| Total Non-U.S. Dollar Denominated Bonds & Notes (Cost $20,609,179) | 22,091,535 |
| | | Principal
Amount | Value |
|
| Municipal Obligations–0.02% |
Georgia (State of) Municipal Electric Authority (Plant Vogtle Units 3 & 4 Project M), Series 2010 A, RB, 6.66%, 04/01/2057
(Cost $545,000) | | | $545,000 | $801,444 |
| | | Shares | |
| Common Stocks & Other Equity Interests–0.00% |
| Auto Parts & Equipment–0.00% |
| Exide Technologies(p) | | 14,555 | 1,455 |
| Paper Packaging–0.00% |
| Westrock Co. | | 65 | 2,222 |
| Specialty Chemicals–0.00% |
| Ingevity Corp.(p) | | 10 | 762 |
| Total Common Stocks & Other Equity Interests (Cost $15,547) | | 4,439 |
| Money Market Funds–3.86% |
| Invesco Government & Agency Portfolio, Institutional Class, 2.02%(q) | | 57,332,938 | 57,332,938 |
| Invesco Liquid Assets Portfolio, Institutional Class, 2.14%(q) | | 40,946,636 | 40,963,015 |
| Invesco Treasury Portfolio, Institutional Class, 1.98%(q) | | 65,523,358 | 65,523,358 |
| Total Money Market Funds (Cost $163,810,364) | | 163,819,311 |
| Options Purchased–0.07% |
| (Cost $3,737,105)(r) | | 3,015,810 |
| TOTAL INVESTMENTS IN SECURITIES–102.20% (Cost $4,198,924,970) | | 4,336,979,038 |
| OTHER ASSETS LESS LIABILITIES—(2.20)% | | (93,318,062) |
| NET ASSETS–100.00% | | $4,243,660,976 |
See accompanying Notes to Financial Statements which are an integral part of the financial statements.
| 32 | Invesco Core Plus Bond Fund |
Investment Abbreviations:
| ARM | – Adjustable Rate Mortgage |
| CAD | – Canadian Dollar |
| CLO | – Collateralized Loan Obligation |
| Conv. | – Convertible |
| Ctfs. | – Certificates |
| EUR | – Euro |
| GBP | – British Pound Sterling |
| IDR | – Indonesian Rupiah |
| IO | – Interest Only |
| LIBOR | – London Interbank Offered Rate |
| PEN | – Peruvian Sol |
| Pfd. | – Preferred |
| PIK | – Pay-in-Kind |
| RB | – Revenue Bonds |
| REGS | – Regulation S |
| REIT | – Real Estate Investment Trust |
| REMICs | – Real Estate Mortgage Investment Conduits |
| STACR® | – Structured Agency Credit Risk |
| TBA | – To Be Announced |
| USD | – U.S. Dollar |
Notes to Schedule of Investments:
| (a) | Industry and/or sector classifications used in this report are generally according to the Global Industry Classification Standard, which was developed by and is the exclusive property and a service mark of MSCI Inc. and Standard & Poor’s. |
| (b) | Security purchased or received in a transaction exempt from registration under the Securities Act of 1933, as amended (the “1933 Act”). The security may be resold pursuant to an exemption from registration under the 1933 Act, typically to qualified institutional buyers. The aggregate value of these securities at August 31, 2019 was $1,707,892,568, which represented 40.25% of the Fund’s Net Assets. |
| (c) | Interest or dividend rate is redetermined periodically. Rate shown is the rate in effect on August 31, 2019. |
| (d) | Zero coupon bond issued at a discount. |
| (e) | Perpetual bond with no specified maturity date. |
| (f) | All or a portion of this security is Pay-in-Kind. Pay-in-Kind securities pay interest income in the form of securities. |
| (g) | Defaulted security. Currently, the issuer is partially or fully in default with respect to principal and/or interest payments. The value of this security at August 31, 2019 represented less than 1% of the Fund’s Net Assets. |
| (h) | Security valued using significant unobservable inputs (Level 3). See Note 3. |
| (i) | Interest rate is redetermined periodically based on the cash flows generated by the pool of assets backing the security, less any applicable fees. The rate shown is the rate in effect on August 31, 2019. |
| (j) | Step coupon bond. The interest rate represents the coupon rate at which the bond will accrue at a specified date. |
| (k) | Security purchased on a forward commitment basis. This security is subject to dollar roll transactions. See Note 1O. |
| (l) | Security traded on a discount basis. The interest rate shown represents the discount rate at the time of purchase by the Fund. |
| (m) | All or a portion of the value was pledged and/or designated as collateral to cover margin requirements for open futures contracts and swap agreements. See Note 1K and Note 1N. |
| (n) | Variable rate senior loan interests are, at present, not readily marketable, not registered under the 1933 Act and may be subject to contractual and legal restrictions on sale. Variable rate senior loan interests in the Fund’s portfolio generally have variable rates which adjust to a base, such as the London Interbank Offered Rate (“LIBOR”), on set dates, typically every 30 days, but not greater than one year, and/or have interest rates that float at margin above a widely recognized base lending rate such as the Prime Rate of a designated U.S. bank. |
| (o) | Foreign denominated security. Principal amount is denominated in the currency indicated. |
| (p) | Non-income producing security. |
| (q) | The money market fund and the Fund are affiliated by having the same investment adviser. The rate shown is the 7-day SEC standardized yield as of August 31, 2019. |
| (r) | The table below details options purchased: See Note 1L and Note 1M: |
See accompanying Notes to Financial Statements which are an integral part of the financial statements.
| 33 | Invesco Core Plus Bond Fund |
| Open Exchange-Traded Equity Options Purchased | |
| Description | Type of
Contract | Expiration
Date | Number of
Contracts | Exercise
Price | Notional
Value(a) | Value |
| Equity Risk | | | | | |
| Abbvie, Inc. | Call | 01/15/2021 | 60 | | $ 85.00 | $ 510,000 | $ 8,070 |
| Amazon.com, Inc. | Call | 01/15/2021 | 3 | | 2,100.00 | 630,000 | 40,320 |
| Bank of America Corp. | Call | 01/15/2021 | 165 | | 32.00 | 528,000 | 25,410 |
| Booking Holdings, Inc. | Call | 01/15/2021 | 6 | | 2,100.00 | 1,260,000 | 127,230 |
| Chevron Corp. | Call | 01/15/2021 | 38 | | 130.00 | 494,000 | 22,610 |
| Cisco Systems, Inc. | Call | 01/15/2021 | 110 | | 60.00 | 660,000 | 14,410 |
| Consumer Discretionary Select Sector SPDR Fund | Call | 01/15/2021 | 60 | | 126.00 | 756,000 | 43,950 |
| Health Care Select Sector SPDR Fund | Call | 01/15/2021 | 125 | | 96.00 | 1,200,000 | 55,000 |
| Industrial Select Sector SPDR Fund | Call | 01/15/2021 | 125 | | 80.00 | 1,000,000 | 57,187 |
| Intel Corp. | Call | 01/15/2021 | 85 | | 52.50 | 446,250 | 33,788 |
| Micron Technology, Inc. | Call | 01/15/2021 | 10 | | 50.00 | 50,000 | 7,750 |
| Microsoft Corp. | Call | 01/15/2021 | 50 | | 145.00 | 725,000 | 66,000 |
| Oracle Corp. | Call | 01/15/2021 | 80 | | 62.50 | 500,000 | 17,720 |
| QUALCOMM, Inc. | Call | 01/15/2021 | 12 | | 85.00 | 102,000 | 9,000 |
| UnitedHealth Group Inc. | Call | 01/15/2021 | 21 | | 250.00 | 525,000 | 45,255 |
| Verizon Communications, Inc. | Call | 01/15/2021 | 90 | | 55.00 | 495,000 | 53,325 |
| Total Open Exchange-Traded Equity Options Purchased | 1,040 | | | | $627,025 |
| Abbreviations: |
| SPDR | –Standard & Poor’s Depositary Receipt |
| (a) | Notional Value is calculated by multiplying the Number of Contracts by the Exercise Price by the multiplier. |
| Open Exchange-Traded Index Options Purchased | |
| Description | Type of
Contract | Expiration
Date | Number of
Contracts | Exercise
Price | Notional
Value* | Value |
| Equity Risk | | | | | | | |
| S&P 500 Index | Call | 12/18/2020 | 131 | | $3,000.00 | | | $39,300,000 | $2,388,785 |
| * | Notional Value is calculated by multiplying the Number of Contracts by the Exercise Price by the multiplier. |
| Open Exchange-Traded Equity Options Written | |
| Description | Type of
Contract | Expiration
Date | Number of
Contracts | Exercise
Price | Premiums
Received | Notional
Value(a) | Value | Unrealized
Appreciation
(Depreciation) |
| Equity Risk | | | | | | | | |
| Abbvie, Inc. | Call | 01/15/2021 | 20 | | $ 105.00 | $ (7,179) | | $210,000 | $(570) | $ 6,609 |
| Amazon.com, Inc. | Call | 01/17/2020 | 1 | | 2,400.00 | (16,108) | | 240,000 | (295) | 15,813 |
| Amazon.com, Inc. | Call | 06/19/2020 | 2 | | 2,300.00 | (18,296) | | 460,000 | (7,390) | 10,906 |
| Booking Holdings, Inc. | Call | 01/15/2021 | 6 | | 2,400.00 | (45,581) | | 1,440,000 | (65,520) | (19,939) |
| Micron Technology, Inc. | Call | 01/15/2021 | 5 | | 70.00 | (1,460) | | 35,000 | (1,425) | 35 |
| Microsoft Corp. | Call | 01/15/2021 | 13 | | 160.00 | (5,420) | | 208,000 | (10,010) | (4,590) |
| Oracle Corp. | Call | 01/15/2021 | 30 | | 70.00 | (4,109) | | 210,000 | (2,745) | 1,364 |
| QUALCOMM, Inc. | Call | 01/15/2021 | 3 | | 110.00 | (801) | | 33,000 | (632) | 169 |
| UnitedHealth Group Inc. | Call | 01/15/2021 | 7 | | 300.00 | (7,013) | | 210,000 | (5,407) | 1,606 |
| Total Exchange-Traded Equity Options Written | | | | $(105,967) | | | $(93,994) | $ 11,973 |
| (a) | Notional Value is calculated by multiplying the Number of Contracts by the Exercise Price by the multiplier. |
See accompanying Notes to Financial Statements which are an integral part of the financial statements.
| 34 | Invesco Core Plus Bond Fund |
| Open Futures Contracts |
| Long Futures Contracts | Number of
Contracts | Expiration
Month | Notional
Value | Value | Unrealized
Appreciation
(Depreciation) |
| Interest Rate Risk |
| U.S. Treasury 5 Year Notes | 2,172 | December-2019 | $260,589,095 | $24,692 | $24,692 |
| U.S. Treasury 10 Year Notes | 1,898 | December-2019 | 250,002,187 | (152,455) | (152,455) |
| U.S. Treasury Long Bonds | 500 | December-2019 | 82,625,000 | (48,065) | (48,065) |
| U.S. Treasury Ultra Bonds | 589 | December-2019 | 116,290,688 | (1,478,180) | (1,478,180) |
| Subtotal—Long Futures Contracts | (1,654,008) | (1,654,008) |
| Short Futures Contracts | | | | | |
| Interest Rate Risk |
| U.S. Treasury 2 Year Notes | 11 | December-2019 | (2,377,289) | 479 | 479 |
| U.S. Treasury 10 Year Ultra Bonds | 2,184 | December-2019 | (315,451,500) | 1,010,919 | 1,010,919 |
| Subtotal—Short Futures Contracts | 1,011,398 | 1,011,398 |
| Total Futures Contracts | $(642,610) | $(642,610) |
| Open Centrally Cleared Credit Default Swap Agreements |
| Reference Entity | Buy/Sell
Protection | (Pay)/
Receive
Fixed
Rate | Payment
Frequency | Maturity Date | Implied
Credit
Spread(a) | Notional Value | Upfront
Payments Paid
(Received) | Value | Unrealized
Appreciation |
| Credit Risk |
| Markit CDX North America High Yield Index, Series 31, Version 1 | Buy | 5.00% | Quarterly | 06/20/2024 | 3.416% | USD | 99,886,050 | $(6,724,652) | $(6,634,398) | $90,254 |
| (a) | Implied credit spreads represent the current level, as of August 31, 2019, at which protection could be bought or sold given the terms of the existing credit default swap agreement and serve as an indicator of the current status of the payment/performance risk of the credit default swap agreement. An implied credit spread that has widened or increased since entry into the initial agreement may indicate a deteriorating credit profile and increased risk of default for the reference entity. A declining or narrowing spread may indicate an improving credit profile or decreased risk of default for the reference entity. Alternatively, credit spreads may increase or decrease reflecting the general tolerance for risk in the credit markets generally. |
| Open Forward Foreign Currency Contracts |
Settlement
Date | Counterparty | Contract to | Unrealized
Appreciation
(Depreciation) |
| Deliver | Receive |
| Currency Risk | | | | | | |
| 10/02/2019 | Citibank, N.A. | USD | 131,895 | BRL | 550,000 | $674 |
| 11/08/2019 | Goldman Sachs & Co. | EUR | 7,750,000 | USD | 8,810,797 | 250,071 |
| 11/29/2019 | Goldman Sachs & Co. | CAD | 53,013,591 | USD | 39,977,671 | 114,728 |
| 11/29/2019 | Goldman Sachs & Co. | EUR | 12,071,665 | USD | 13,497,546 | 143,379 |
| 11/29/2019 | Goldman Sachs & Co. | GBP | 128,227 | USD | 157,273 | 718 |
| 09/04/2019 | Morgan Stanley | BRL | 550,000 | USD | 132,898 | 80 |
| 11/08/2019 | Morgan Stanley | EUR | 11,450,000 | USD | 13,505,100 | 857,318 |
| 11/08/2019 | UBS | EUR | 100,000 | USD | 114,560 | 4,099 |
| Subtotal—Appreciation | 1,371,067 |
| Currency Risk | | | | | | |
| 09/04/2019 | Citibank, N.A. | BRL | 550,000 | USD | 132,157 | (661) |
| 09/04/2019 | Citibank, N.A. | USD | 132,899 | BRL | 550,000 | (80) |
| 11/08/2019 | Citibank, N.A. | USD | 12,896,396 | EUR | 11,045,000 | (695,981) |
| 09/04/2019 | Morgan Stanley | USD | 144,687 | BRL | 550,000 | (11,869) |
| Subtotal—Depreciation | (708,591) |
| Total Forward Foreign Currency Contracts | $662,476 |
See accompanying Notes to Financial Statements which are an integral part of the financial statements.
| 35 | Invesco Core Plus Bond Fund |
| Abbreviations: |
| BRL | —Brazilian Real |
| CAD | —Canadian Dollar |
| EUR | —Euro |
| GBP | —British Pound Sterling |
| USD | —U.S. Dollar |
See accompanying Notes to Financial Statements which are an integral part of the financial statements.
| 36 | Invesco Core Plus Bond Fund |
Statement of Assets and Liabilities
August 31, 2019
| Assets: | |
Investments in securities, at value
(Cost $4,035,114,606) | $4,173,159,727 |
| Investments in affiliated money market funds, at value (Cost $163,810,364) | 163,819,311 |
| Other investments: | |
| Variation margin receivable — futures contracts | 195,969 |
| Variation margin receivable—centrally cleared swap agreements | 32,737 |
| Unrealized appreciation on forward foreign currency contracts outstanding | 1,371,067 |
| Foreign currencies, at value (Cost $16,878,783) | 16,802,760 |
| Receivable for: | |
| Principal paydowns | 649 |
| Investments matured, at value (Cost $8,485) | 60,401 |
| Dividends | 817,428 |
| Fund shares sold | 6,115,808 |
| Interest | 26,083,743 |
| Investments sold | 84,898,618 |
| Investment for trustee deferred compensation and retirement plans | 136,228 |
| Other assets | 117,954 |
| Total assets | 4,473,612,400 |
| Liabilities: | |
| Other investments: | |
| Options written, at value (premiums received $105,967) | 93,994 |
| Unrealized depreciation on forward foreign currency contracts outstanding | 708,591 |
| Payable for: | |
| Investments purchased | 212,461,480 |
| Dividends | 1,207,140 |
| Fund shares reacquired | 5,316,045 |
| Amount due custodian | 8,893,631 |
| Accrued foreign taxes | 592 |
| Accrued fees to affiliates | 1,107,035 |
| Accrued trustees’ and officers’ fees and benefits | 7,975 |
| Trustee deferred compensation and retirement plans | 154,941 |
| Total liabilities | 229,951,424 |
| Net assets applicable to shares outstanding | $4,243,660,976 |
| Net assets consist of: | |
| Shares of beneficial interest | $4,128,077,955 |
| Distributable earnings | 115,583,021 |
| | $4,243,660,976 |
| Net Assets: |
| Class A | $1,079,416,016 |
| Class C | $87,045,755 |
| Class R | $17,597,637 |
| Class Y | $892,952,166 |
| Class R5 | $7,586,147 |
| Class R6 | $2,159,063,255 |
| Shares outstanding, no par value, with an unlimited number of shares authorized: |
| Class A | 97,002,049 |
| Class C | 7,825,849 |
| Class R | 1,581,886 |
| Class Y | 80,172,002 |
| Class R5 | 682,035 |
| Class R6 | 194,147,313 |
| Class A: | |
| Net asset value per share | $11.13 |
Maximum offering price per share
(Net asset value of $11.13 ÷ 95.75%) | $11.62 |
| Class C: | |
| Net asset value and offering price per share | $11.12 |
| Class R: | |
| Net asset value and offering price per share | $11.12 |
| Class Y: | |
| Net asset value and offering price per share | $11.14 |
| Class R5: | |
| Net asset value and offering price per share | $11.12 |
| Class R6: | |
| Net asset value and offering price per share | $11.12 |
See accompanying Notes to Financial Statements which are an integral part of the financial statements.
| 37 | Invesco Core Plus Bond Fund |
Statement of Operations
For the year ended August 31, 2019
| Investment income: | |
| Interest (net of foreign withholding taxes of $2,336) | $155,426,220 |
| Dividends from affiliated money market funds | 6,204,117 |
| Dividends | 3,420,475 |
| Total investment income | 165,050,812 |
| Expenses: | |
| Advisory fees | 15,931,681 |
| Administrative services fees | 572,628 |
| Custodian fees | 108,744 |
| Distribution fees: | |
| Class A | 2,332,199 |
| Class C | 921,235 |
| Class R | 76,662 |
| Transfer agent fees — A, C, R and Y | 2,733,692 |
| Transfer agent fees — R5 | 5,810 |
| Transfer agent fees — R6 | 142,588 |
| Trustees’ and officers’ fees and benefits | 78,073 |
| Registration and filing fees | 217,069 |
| Reports to shareholders | 471,473 |
| Professional services fees | 108,737 |
| Other | 145,349 |
| Total expenses | 23,845,940 |
| Less: Fees waived, expenses reimbursed and/or expense offset arrangement(s) | (1,974,008) |
| Net expenses | 21,871,932 |
| Net investment income | 143,178,880 |
| Realized and unrealized gain (loss) from: | |
| Net realized gain (loss) from: | |
| Investment securities | 19,588,172 |
| Foreign currencies | (390,141) |
| Forward foreign currency contracts | (9,622,288) |
| Futures contracts | 21,866,327 |
| Option contracts written | 4,507,663 |
| Swap agreements | (685,028) |
| | 35,264,705 |
| Change in net unrealized appreciation (depreciation) of: | |
| Investment securities | 190,745,095 |
| Foreign currencies | (46,729) |
| Forward foreign currency contracts | (432,850) |
| Futures contracts | 539,057 |
| Option contracts written | (1,835,189) |
| Swap agreements | 4,239,611 |
| | 193,208,995 |
| Net realized and unrealized gain | 228,473,700 |
| Net increase in net assets resulting from operations | $371,652,580 |
See accompanying Notes to Financial Statements which are an integral part of the financial statements.
| 38 | Invesco Core Plus Bond Fund |
Statement of Changes in Net Assets
For the years ended August 31, 2019 and 2018
| | 2019 | 2018 |
| Operations: | | |
| Net investment income | $143,178,880 | $122,914,123 |
| Net realized gain (loss) | 35,264,705 | (57,853,055) |
| Change in net unrealized appreciation (depreciation) | 193,208,995 | (116,160,777) |
| Net increase (decrease) in net assets resulting from operations | 371,652,580 | (51,099,709) |
| Distributions to shareholders from distributable earnings(1): | | |
| Class A | (28,359,828) | (25,777,403) |
| Class B | — | (19,146) |
| Class C | (2,122,427) | (2,981,838) |
| Class R | (450,317) | (366,792) |
| Class Y | (28,482,762) | (44,624,566) |
| Class R5 | (190,113) | (192,160) |
| Class R6 | (69,362,904) | (49,953,506) |
| Total distributions from distributable earnings | (128,968,351) | (123,915,411) |
| Return of capital: | | |
| Class A | (5,300,471) | (1,152,623) |
| Class B | — | (3,497) |
| Class C | (525,986) | (179,531) |
| Class R | (87,175) | (17,840) |
| Class Y | (4,914,339) | (1,872,061) |
| Class R5 | (32,963) | (8,012) |
| Class R6 | (11,786,606) | (1,989,623) |
| Total return of capital | (22,647,540) | (5,223,187) |
| Share transactions–net: | | |
| Class A | 135,680,952 | 122,084,041 |
| Class B | — | (3,035,643) |
| Class C | (39,828,676) | (905,235) |
| Class R | 2,547,502 | 4,355,347 |
| Class Y | (83,973,549) | (272,131,008) |
| Class R5 | 1,564,636 | 1,116,718 |
| Class R6 | (76,935,016) | 1,062,065,636 |
| Net increase (decrease) in net assets resulting from share transactions | (60,944,151) | 913,549,856 |
| Net increase in net assets | 159,092,538 | 733,311,549 |
| Net assets: | | |
| Beginning of year | 4,084,568,438 | 3,351,256,889 |
| End of year | $4,243,660,976 | $4,084,568,438 |
| (1) | The Securities and Exchange Commission eliminated the requirement to disclose distribution components separately, except for tax return of capital. For the year ended August 31, 2018, distributions to shareholders from distributable earnings consisted of distributions from net investment income. |
See accompanying Notes to Financial Statements which are an integral part of the financial statements.
| 39 | Invesco Core Plus Bond Fund |
Financial Highlights
August 31, 2019
The following schedule presents financial highlights for a share of the Fund outstanding throughout the periods indicated.
| | Net asset
value,
beginning
of period | Net
investment
income(a) | Net gains
(losses)
on securities
(both
realized and
unrealized) | Total from
investment
operations | Dividends
from net
investment
income | Return of
capital | Distributions
from net
realized
gains | Total
distributions | Net asset
value, end
of period | Total
return(b) | Net assets,
end of period
(000’s omitted) | Ratio of
expenses
to average
net assets
with fee waivers
and/or
expenses
absorbed | Ratio of
expenses
to average net
assets without
fee waivers
and/or
expenses
absorbed | Ratio of net
investment
income
to average
net assets | Portfolio
turnover(c) |
| Class A |
| Year ended 08/31/19 | $10.53 | $0.36 | $0.62 | $0.98 | $(0.32) | $(0.06) | $— | $(0.38) | $11.13 | 9.57% | $1,079,416 | 0.74%(d) | 0.84%(d) | 3.41%(d) | 250% |
| Year ended 08/31/18 | 11.03 | 0.31 | (0.48) | (0.17) | (0.32) | (0.01) | — | (0.33) | 10.53 | (1.51) | 887,784 | 0.74 | 0.82 | 2.96 | 383 |
| Year ended 08/31/17 | 11.05 | 0.28 | 0.03 | 0.31 | (0.31) | — | (0.02) | (0.33) | 11.03 | 2.88 | 805,356 | 0.76 | 0.88 | 2.54 | 547 |
| Year ended 08/31/16 | 10.63 | 0.25 | 0.51 | 0.76 | (0.34) | — | — | (0.34) | 11.05 | 7.33 | 684,628 | 0.83 | 0.92 | 2.40 | 518 |
| Year ended 08/31/15 | 10.92 | 0.30 | (0.20) | 0.10 | (0.39) | — | — | (0.39) | 10.63 | 0.91 | 495,226 | 0.84 | 0.97 | 2.78 | 537 |
| Class C |
| Year ended 08/31/19 | 10.53 | 0.28 | 0.61 | 0.89 | (0.24) | (0.06) | — | (0.30) | 11.12 | 8.67 | 87,046 | 1.49(d) | 1.59(d) | 2.66(d) | 250 |
| Year ended 08/31/18 | 11.02 | 0.24 | (0.48) | (0.24) | (0.24) | (0.01) | — | (0.25) | 10.53 | (2.16) | 123,285 | 1.49 | 1.57 | 2.21 | 383 |
| Year ended 08/31/17 | 11.05 | 0.20 | 0.02 | 0.22 | (0.23) | — | (0.02) | (0.25) | 11.02 | 2.02 | 130,591 | 1.51 | 1.63 | 1.79 | 547 |
| Year ended 08/31/16 | 10.63 | 0.17 | 0.51 | 0.68 | (0.26) | — | — | (0.26) | 11.05 | 6.53 | 108,579 | 1.58 | 1.67 | 1.65 | 518 |
| Year ended 08/31/15 | 10.91 | 0.22 | (0.19) | 0.03 | (0.31) | — | — | (0.31) | 10.63 | 0.25 | 65,160 | 1.59 | 1.72 | 2.03 | 537 |
| Class R |
| Year ended 08/31/19 | 10.53 | 0.33 | 0.61 | 0.94 | (0.29) | (0.06) | — | (0.35) | 11.12 | 9.21 | 17,598 | 0.99(d) | 1.09(d) | 3.16(d) | 250 |
| Year ended 08/31/18 | 11.02 | 0.29 | (0.47) | (0.18) | (0.30) | (0.01) | — | (0.31) | 10.53 | (1.67) | 14,134 | 0.99 | 1.07 | 2.71 | 383 |
| Year ended 08/31/17 | 11.05 | 0.25 | 0.02 | 0.27 | (0.28) | — | (0.02) | (0.30) | 11.02 | 2.53 | 10,403 | 1.01 | 1.13 | 2.29 | 547 |
| Year ended 08/31/16 | 10.63 | 0.23 | 0.51 | 0.74 | (0.32) | — | — | (0.32) | 11.05 | 7.06 | 7,545 | 1.08 | 1.17 | 2.15 | 518 |
| Year ended 08/31/15 | 10.91 | 0.27 | (0.19) | 0.08 | (0.36) | — | — | (0.36) | 10.63 | 0.75 | 5,848 | 1.09 | 1.22 | 2.53 | 537 |
| Class Y |
| Year ended 08/31/19 | 10.54 | 0.39 | 0.62 | 1.01 | (0.35) | (0.06) | — | (0.41) | 11.14 | 9.84 | 892,952 | 0.49(d) | 0.59(d) | 3.66(d) | 250 |
| Year ended 08/31/18 | 11.03 | 0.35 | (0.48) | (0.13) | (0.35) | (0.01) | — | (0.36) | 10.54 | (1.17) | 932,839 | 0.49 | 0.57 | 3.21 | 383 |
| Year ended 08/31/17 | 11.06 | 0.30 | 0.03 | 0.33 | (0.34) | — | (0.02) | (0.36) | 11.03 | 3.04 | 1,278,700 | 0.51 | 0.63 | 2.79 | 547 |
| Year ended 08/31/16 | 10.64 | 0.28 | 0.51 | 0.79 | (0.37) | — | — | (0.37) | 11.06 | 7.59 | 282,260 | 0.58 | 0.67 | 2.65 | 518 |
| Year ended 08/31/15 | 10.92 | 0.33 | (0.19) | 0.14 | (0.42) | — | — | (0.42) | 10.64 | 1.25 | 102,380 | 0.59 | 0.72 | 3.03 | 537 |
| Class R5 |
| Year ended 08/31/19 | 10.53 | 0.39 | 0.61 | 1.00 | (0.35) | (0.06) | — | (0.41) | 11.12 | 9.75 | 7,586 | 0.49(d) | 0.54(d) | 3.66(d) | 250 |
| Year ended 08/31/18 | 11.03 | 0.34 | (0.48) | (0.14) | (0.35) | (0.01) | — | (0.36) | 10.53 | (1.27) | 5,660 | 0.49 | 0.50 | 3.21 | 383 |
| Year ended 08/31/17 | 11.05 | 0.30 | 0.04 | 0.34 | (0.34) | — | (0.02) | (0.36) | 11.03 | 3.17 | 4,807 | 0.50 | 0.51 | 2.80 | 547 |
| Year ended 08/31/16 | 10.63 | 0.28 | 0.51 | 0.79 | (0.37) | — | — | (0.37) | 11.05 | 7.60 | 90 | 0.58 | 0.60 | 2.65 | 518 |
| Year ended 08/31/15 | 10.91 | 0.33 | (0.19) | 0.14 | (0.42) | — | — | (0.42) | 10.63 | 1.25 | 668 | 0.59 | 0.60 | 3.03 | 537 |
| Class R6 |
| Year ended 08/31/19 | 10.52 | 0.39 | 0.62 | 1.01 | (0.35) | (0.06) | — | (0.41) | 11.12 | 9.91 | 2,159,063 | 0.44(d) | 0.45(d) | 3.71(d) | 250 |
| Year ended 08/31/18 | 11.02 | 0.35 | (0.48) | (0.13) | (0.36) | (0.01) | — | (0.37) | 10.52 | (1.21) | 2,120,867 | 0.43 | 0.44 | 3.27 | 383 |
| Year ended 08/31/17 | 11.05 | 0.30 | 0.03 | 0.33 | (0.34) | — | (0.02) | (0.36) | 11.02 | 3.12 | 1,118,319 | 0.47 | 0.48 | 2.83 | 547 |
| Year ended 08/31/16 | 10.63 | 0.30 | 0.50 | 0.80 | (0.38) | — | — | (0.38) | 11.05 | 7.71 | 1,147,393 | 0.48 | 0.50 | 2.75 | 518 |
| Year ended 08/31/15 | 10.91 | 0.34 | (0.19) | 0.15 | (0.43) | — | — | (0.43) | 10.63 | 1.32 | 275,013 | 0.52 | 0.53 | 3.10 | 537 |
| (a) | Calculated using average shares outstanding. |
| (b) | Includes adjustments in accordance with accounting principles generally accepted in the United States of America and as such, the net asset value for financial reporting purposes and the returns based upon those net asset values may differ from the net asset value and returns for shareholder transactions. Does not include sales charges and is not annualized for periods less than one year, if applicable. |
| (c) | Portfolio turnover is calculated at the fund level and is not annualized for periods less than one year, if applicable. |
| (d) | Ratios are based on average daily net assets (000’s omitted) of $932,879, $92,123, $15,332, $864,358, $5,802 and $2,071,287 for Class A, Class C, Class R, Class Y, Class R5 and Class R6 shares, respectively. |
See accompanying Notes to Financial Statements which are an integral part of the financial statements.
| 40 | Invesco Core Plus Bond Fund |
Notes to Financial Statements
August 31, 2019
NOTE 1—Significant Accounting Policies
Invesco Core Plus Bond Fund (the “Fund”) is a series portfolio of AIM Counselor Series Trust (Invesco Counselor Series Trust) (the “Trust”). The Trust is a Delaware statutory trust registered under the Investment Company Act of 1940, as amended (the “1940 Act”), as an open-end series management investment company authorized to issue an unlimited number of shares of beneficial interest. Information presented in these financial statements pertains only to the Fund. Matters affecting the Fund or each class will be voted on exclusively by the shareholders of the Fund or each class.
The Fund’s investment objective is total return, comprised of current income and capital appreciation.
The Fund currently consists of six different classes of shares: Class A, Class C, Class R, Class Y, Class R5 and Class R6. Class Y shares are available only to certain investors. Class A shares are sold with a front-end sales charge unless certain waiver criteria are met. Under certain circumstances, load waived shares may be subject to contingent deferred sales charges ("CDSC"). Class C shares are sold with a CDSC. Class R, Class Y, Class R5 and Class R6 shares are sold at net asset value. Class C shares held for ten years after purchase are eligible for automatic conversion into Class A shares of the same Fund (the "Conversion Feature"). The automatic conversion pursuant to the Conversion Feature will generally occur at the end of the month following the tenth anniversary after a purchase of Class C shares.
The Fund is an investment company and accordingly follows the investment company accounting and reporting guidance in accordance with Financial Accounting Standards Board Accounting Standards Codification Topic 946,Financial Services – Investment Companies.
The following is a summary of the significant accounting policies followed by the Fund in the preparation of its financial statements.
| A. | Security Valuations – Securities, including restricted securities, are valued according to the following policy. |
Debt obligations (including convertible securities) and unlisted equities are fair valued using an evaluated quote provided by an independent pricing service. Evaluated quotes provided by the pricing service may be determined without exclusive reliance on quoted prices, and may reflect appropriate factors such as institution-size trading in similar groups of securities, developments related to specific securities, dividend rate (for unlisted equities), yield (for debt obligations), quality, type of issue, coupon rate (for debt obligations), maturity (for debt obligations), individual trading characteristics and other market data. Pricing services generally value debt obligations assuming orderly transactions of institutional round lot size, but a fund may hold or transact in the same securities in smaller, odd lot sizes. Odd lots often trade at lower prices than institutional round lots. Debt obligations are subject to interest rate and credit risks. In addition, all debt obligations involve some risk of default with respect to interest and/or principal payments.
A security listed or traded on an exchange (except convertible securities) is valued at its last sales price or official closing price as of the close of the customary trading session on the exchange where the security is principally traded, or lacking any sales or official closing price on a particular day, the security may be valued at the closing bid price on that day. Securities traded in the over-the-counter market are valued based on prices furnished by independent pricing services or market makers. When such securities are valued by an independent pricing service they may be considered fair valued. Futures contracts are valued at the final settlement price set by an exchange on which they are principally traded. Listed options are valued at the mean between the last bid and asked prices from the exchange on which they are principally traded. Options not listed on an exchange are valued by an independent source at the mean between the last bid and asked prices. For purposes of determining net asset value ("NAV") per share, futures and option contracts generally are valued 15 minutes after the close of the customary trading session of the New York Stock Exchange (“NYSE”).
Investments in open-end and closed-end registered investment companies that do not trade on an exchange are valued at the end-of-day net asset value per share. Investments in open-end and closed-end registered investment companies that trade on an exchange are valued at the last sales price or official closing price as of the close of the customary trading session on the exchange where the security is principally traded.
Swap agreements are fair valued using an evaluated quote, if available, provided by an independent pricing service. Evaluated quotes provided by the pricing service are valued based on a model which may include end-of-day net present values, spreads, ratings, industry, company performance and returns of referenced assets. Centrally cleared swap agreements are valued at the daily settlement price determined by the relevant exchange or clearinghouse.
Foreign securities’ (including foreign exchange contracts) prices are converted into U.S. dollar amounts using the applicable exchange rates as of the close of the NYSE. If market quotations are available and reliable for foreign exchange-traded equity securities, the securities will be valued at the market quotations. Because trading hours for certain foreign securities end before the close of the NYSE, closing market quotations may become unreliable. If between the time trading ends on a particular security and the close of the customary trading session on the NYSE, events occur that the investment adviser determines are significant and make the closing price unreliable, the Fund may fair value the security. If the event is likely to have affected the closing price of the security, the security will be valued at fair value in good faith using procedures approved by the Board of Trustees. Adjustments to closing prices to reflect fair value may also be based on a screening process of an independent pricing service to indicate the degree of certainty, based on historical data, that the closing price in the principal market where a foreign security trades is not the current value as of the close of the NYSE. Foreign securities’ prices meeting the approved degree of certainty that the price is not reflective of current value will be priced at the indication of fair value from the independent pricing service. Multiple factors may be considered by the independent pricing service in determining adjustments to reflect fair value and may include information relating to sector indices, American Depositary Receipts and domestic and foreign index futures. Foreign securities may have additional risks including exchange rate changes, potential for sharply devalued currencies and high inflation, political and economic upheaval, the relative lack of issuer information, relatively low market liquidity and the potential lack of strict financial and accounting controls and standards.
Securities for which market prices are not provided by any of the above methods may be valued based upon quotes furnished by independent sources. The last bid price may be used to value equity securities. The mean between the last bid and asked prices is used to value debt obligations, including corporate loans.
Securities for which market quotations are not readily available or became unreliable are valued at fair value as determined in good faith by or under the supervision of the Trust’s officers following procedures approved by the Board of Trustees. Issuer specific events, market trends, bid/asked quotes of brokers and information providers and other market data may be reviewed in the course of making a good faith determination of a security’s fair value.
| 41 | Invesco Core Plus Bond Fund |
The Fund may invest in securities that are subject to interest rate risk, meaning the risk that the prices will generally fall as interest rates rise and, conversely, the prices will generally rise as interest rates fall. Specific securities differ in their sensitivity to changes in interest rates depending on their individual characteristics. Changes in interest rates may result in increased market volatility, which may affect the value and/or liquidity of certain Fund investments.
Valuations change in response to many factors including the historical and prospective earnings of the issuer, the value of the issuer’s assets, general economic conditions, interest rates, investor perceptions and market liquidity. Because of the inherent uncertainties of valuation, the values reflected in the financial statements may materially differ from the value received upon actual sale of those investments.
| B. | Securities Transactions and Investment Income – Securities transactions are accounted for on a trade date basis. Realized gains or losses on sales are computed on the basis of specific identification of the securities sold. Interest income (net of withholding tax, if any) is recorded on the accrual basis from settlement date. Bond premiums and discounts are amortized and/or accreted over the lives of the respective securities. Pay-in-kind interest income and non-cash dividend income received in the form of securities in-lieu of cash are recorded at the fair value of the securities received. Paydown gains and losses on mortgage and asset-backed securities are recorded as adjustments to interest income. Dividend income (net of withholding tax, if any) is recorded on the ex-dividend date. |
The Fund may periodically participate in litigation related to Fund investments. As such, the Fund may receive proceeds from litigation settlements. Any proceeds received are included in the Statement of Operations as realized gain (loss) for investments no longer held and as unrealized gain (loss) for investments still held.
Brokerage commissions and mark ups are considered transaction costs and are recorded as an increase to the cost basis of securities purchased and/or a reduction of proceeds on a sale of securities. Such transaction costs are included in the determination of net realized and unrealized gain (loss) from investment securities reported in the Statement of Operations and the Statement of Changes in Net Assets and the net realized and unrealized gains (losses) on securities per share in the Financial Highlights. Transaction costs are included in the calculation of the Fund’s net asset value and, accordingly, they reduce the Fund’s total returns. These transaction costs are not considered operating expenses and are not reflected in net investment income reported in the Statement of Operations and the Statement of Changes in Net Assets, or the net investment income per share and the ratios of expenses and net investment income reported in the Financial Highlights, nor are they limited by any expense limitation arrangements between the Fund and the investment adviser.
The Fund allocates realized and unrealized capital gains and losses to a class based on the relative net assets of each class. The Fund allocates income to a class based on the relative value of the settled shares of each class.
| C. | Country Determination — For the purposes of making investment selection decisions and presentation in the Schedule of Investments, the investment adviser may determine the country in which an issuer is located and/or credit risk exposure based on various factors. These factors include the laws of the country under which the issuer is organized, where the issuer maintains a principal office, the country in which the issuer derives 50% or more of its total revenues and the country that has the primary market for the issuer’s securities, as well as other criteria. Among the other criteria that may be evaluated for making this determination are the country in which the issuer maintains 50% or more of its assets, the type of security, financial guarantees and enhancements, the nature of the collateral and the sponsor organization. Country of issuer and/or credit risk exposure has been determined to be the United States of America, unless otherwise noted. |
| D. | Distributions– Distributions from net investment income, if any, are declared daily and paid monthly. Distributions from net realized capital gain, if any, are generally declared and paid annually and recorded on the ex-dividend date. The Fund may elect to treat a portion of the proceeds from redemptions as distributions for federal income tax purposes. |
| E. | Federal Income Taxes –The Fund intends to comply with the requirements of Subchapter M of the Internal Revenue Code of 1986, as amended (the “Internal Revenue Code”), necessary to qualify as a regulated investment company and to distribute substantially all of the Fund’s taxable earnings to shareholders. As such, the Fund will not be subject to federal income taxes on otherwise taxable income (including net realized capital gain) that is distributed to shareholders. Therefore, no provision for federal income taxes is recorded in the financial statements. |
The Fund recognizes the tax benefits of uncertain tax positions only when the position is more likely than not to be sustained. Management has analyzed the Fund’s uncertain tax positions and concluded that no liability for unrecognized tax benefits should be recorded related to uncertain tax positions. Management is not aware of any tax positions for which it is reasonably possible that the total amounts of unrecognized tax benefits will change materially in the next 12 months.
The Fund files tax returns in the U.S. Federal jurisdiction and certain other jurisdictions. Generally, the Fund is subject to examinations by such taxing authorities for up to three years after the filing of the return for the tax period.
| F. | Expenses – Fees provided for under the Rule 12b-1 plan of a particular class of the Fund are charged to the operations of such class. Transfer agency fees and expenses and other shareholder recordkeeping fees and expenses attributable to Class R5 and Class R6 are allocated to each share class based on relative net assets. Sub-accounting fees attributable to Class R5 are charged to the operations of the class. Transfer agency fees and expenses and other shareholder recordkeeping fees and expenses relating to all other classes are allocated among those classes based on relative net assets. All other expenses are allocated among the classes based on relative net assets. |
| G. | Accounting Estimates – The preparation of financial statements in conformity with accounting principles generally accepted in the United States of America (“GAAP”) requires management to make estimates and assumptions that affect the reported amounts of assets and liabilities at the date of the financial statements and the reported amounts of revenues and expenses during the reporting period including estimates and assumptions related to taxation. Actual results could differ from those estimates by a significant amount. In addition, the Fund monitors for material events or transactions that may occur or become known after the period-end date and before the date the financial statements are released to print. |
| H. | Indemnifications – Under the Trust’s organizational documents, each Trustee, officer, employee or other agent of the Trust is indemnified against certain liabilities that may arise out of the performance of their duties to the Fund. Additionally, in the normal course of business, the Fund enters into contracts, including the Fund’s servicing agreements, that contain a variety of indemnification clauses. The Fund’s maximum exposure under these arrangements is unknown as this would involve future claims that may be made against the Fund that have not yet occurred. The risk of material loss as a result of such indemnification claims is considered remote. |
| I. | Foreign Currency Translations— Foreign currency is valued at the close of the NYSE based on quotations posted by banks and major currency dealers. Portfolio securities and other assets and liabilities denominated in foreign currencies are translated into U.S. dollar amounts at the date of valuation. Purchases and sales of portfolio securities (net of foreign taxes withheld on disposition) and income items denominated in |
| 42 | Invesco Core Plus Bond Fund |
| | foreign currencies are translated into U.S. dollar amounts on the respective dates of such transactions. The Fund does not separately account for the portion of the results of operations resulting from changes in foreign exchange rates on investments and the fluctuations arising from changes in market prices of securities held. The combined results of changes in foreign exchange rates and the fluctuation of market prices on investments (net of estimated foreign tax withholding) are included with the net realized and unrealized gain or loss from investments in the Statement of Operations. Reported net realized foreign currency gains or losses arise from (1) sales of foreign currencies, (2) currency gains or losses realized between the trade and settlement dates on securities transactions, and (3) the difference between the amounts of dividends, interest, and foreign withholding taxes recorded on the Fund’s books and the U.S. dollar equivalent of the amounts actually received or paid. Net unrealized foreign currency gains and losses arise from changes in the fair values of assets and liabilities, other than investments in securities at fiscal period end, resulting from changes in exchange rates. |
The Fund may invest in foreign securities, which may be subject to foreign taxes on income, gains on investments or currency repatriation, a portion of which may be recoverable. Foreign taxes, if any, are recorded based on the tax regulations and rates that exist in the foreign markets in which the Fund invests and are shown in the Statement of Operations.
| J. | Forward Foreign Currency Contracts— The Fund may engage in foreign currency transactions either on a spot (i.e. for prompt delivery and settlement) basis, or through forward foreign currency contracts, to manage or minimize currency or exchange rate risk. |
The Fund may also enter into forward foreign currency contracts for the purchase or sale of a security denominated in a foreign currency in order to “lock in” the U.S. dollar price of that security, or the Fund may also enter into forward foreign currency contracts that do not provide for physical settlement of the two currencies, but instead are settled by a single cash payment calculated as the difference between the agreed upon exchange rate and the spot rate at settlement based upon an agreed upon notional amount (non-deliverable forwards). The Fund will set aside liquid assets in an amount equal to the daily mark-to-market obligation for forward foreign currency contracts.
A forward foreign currency contract is an obligation between two parties (“Counterparties”) to purchase or sell a specific currency for an agreed-upon price at a future date. The use of forward foreign currency contracts does not eliminate fluctuations in the price of the underlying securities the Fund owns or intends to acquire but establishes a rate of exchange in advance. Fluctuations in the value of these contracts are measured by the difference in the contract date and reporting date exchange rates and are recorded as unrealized appreciation (depreciation) until the contracts are closed. When the contracts are closed, realized gains (losses) are recorded. Realized and unrealized gains (losses) on the contracts are included in the Statement of Operations. The primary risks associated with forward foreign currency contracts include failure of the Counterparty to meet the terms of the contract and the value of the foreign currency changing unfavorably. These risks may be in excess of the amounts reflected in the Statement of Assets and Liabilities.
| K. | Futures Contracts — The Fund may enter into futures contracts to manage exposure to interest rate, equity and market price movements and/or currency risks. A futures contract is an agreement between two parties ("Counterparties") to purchase or sell a specified underlying security, currency or commodity (or delivery of a cash settlement price, in the case of an index future) for a fixed price at a future date. The Fund currently invests only in exchange-traded futures and they are standardized as to maturity date and underlying financial instrument. Initial margin deposits required upon entering into futures contracts are satisfied by the segregation of specific securities or cash as collateral at the futures commission merchant (broker). During the period the futures contracts are open, changes in the value of the contracts are recognized as unrealized gains or losses by recalculating the value of the contracts on a daily basis. Subsequent or variation margin payments are received or made depending upon whether unrealized gains or losses are incurred. These amounts are reflected as receivables or payables on the Statement of Assets and Liabilities. When the contracts are closed or expire, the Fund recognizes a realized gain or loss equal to the difference between the proceeds from, or cost of, the closing transaction and the Fund’s basis in the contract. The net realized gain (loss) and the change in unrealized gain (loss) on futures contracts held during the period is included on the Statement of Operations. The primary risks associated with futures contracts are market risk and the absence of a liquid secondary market. If the Fund were unable to liquidate a futures contract and/or enter into an offsetting closing transaction, the Fund would continue to be subject to market risk with respect to the value of the contracts and continue to be required to maintain the margin deposits on the futures contracts. Futures contracts have minimal Counterparty risk since the exchange’s clearinghouse, as Counterparty to all exchange-traded futures, guarantees the futures against default. Risks may exceed amounts recognized in the Statement of Assets and Liabilities. |
| L. | Call Options Purchased and Written – The Fund may write covered call options and/or buy call options. A covered call option gives the purchaser of such option the right to buy, and the writer the obligation to sell, the underlying security or foreign currency at the stated exercise price during the option period. Options written by the Fund normally will have expiration dates between three and nine months from the date written. The exercise price of a call option may be below, equal to, or above the current market value of the underlying security at the time the option is written. |
Additionally, the Fund may enter into an option on a swap agreement, also called a “swaption”. A swaption is an option that gives the buyer the right, but not the obligation, to enter into a swap on a future date in exchange for paying a market-based premium. A receiver swaption gives the owner the right to receive the total return of a specified asset, reference rate or index. Swaptions also include options that allow an existing swap to be terminated or extended by one of the Counterparties.
When the Fund writes a covered call option, an amount equal to the premium received by the Fund is recorded as an asset and an equivalent liability in the Statement of Assets and Liabilities. The amount of the liability is subsequently “marked-to-market” to reflect the current market value of the option written. If a written covered call option expires on the stipulated expiration date, or if the Fund enters into a closing purchase transaction, the Fund realizes a gain (or a loss if the closing purchase transaction exceeds the premium received when the option was written) without regard to any unrealized gain or loss on the underlying security, and the liability related to such option is extinguished. If a written covered call option is exercised, the Fund realizes a gain or a loss from the sale of the underlying security and the proceeds of the sale are increased by the premium originally received. Realized and unrealized gains and losses on call options written are included in the Statement of Operations as Net realized gain (loss) from and Change in net unrealized appreciation (depreciation) of Option contracts written. A risk in writing a covered call option is that the Fund gives up the opportunity for profit if the market price of the security increases and the option is exercised.
When the Fund buys a call option, an amount equal to the premium paid by the Fund is recorded as an investment on the Statement of Assets and Liabilities. The amount of the investment is subsequently “marked-to-market” to reflect the current value of the option purchased. Realized and unrealized gains and losses on call options purchased are included in the Statement of Operations as Net realized gain (loss) from and Change
| 43 | Invesco Core Plus Bond Fund |
in net unrealized appreciation (depreciation) of Investment securities. A risk in buying an option is that the Fund pays a premium whether or not the option is exercised. In addition, there can be no assurance that a liquid secondary market will exist for any option purchased.
| M. | Put Options Purchased and Written– The Fund may purchase and write put options including options on securities indexes, or foreign currency and/or futures contracts. By purchasing a put option, the Fund obtains the right (but not the obligation) to sell the option’s underlying instrument at a fixed strike price. In return for this right, the Fund pays an option premium. The option’s underlying instrument may be a security, securities index, or a futures contract. |
Additionally, the Fund may enter into an option on a swap agreement, also called a “swaption”. A swaption is an option that gives the buyer the right, but not the obligation, to enter into a swap on a future date in exchange for paying a market-based premium. A receiver swaption gives the owner the right to receive the total return of a specified asset, reference rate or index. Swaptions also include options that allow an existing swap to be terminated or extended by one of the Counterparties.
Put options may be used by the Fund to hedge securities it owns by locking in a minimum price at which the Fund can sell. If security prices fall, the put option could be exercised to offset all or a portion of the Fund’s resulting losses. At the same time, because the maximum the Fund has at risk is the cost of the option, purchasing put options does not eliminate the potential for the Fund to profit from an increase in the value of the underlying portfolio securities. The Fund may write put options to earn additional income in the form of option premiums if it expects the price of the underlying instrument to remain stable or rise during the option period so that the option will not be exercised. The risk in this strategy is that the price of the underlying securities may decline by an amount greater than the premium received. Put options written are reported as a liability in the Statement of Assets and Liabilities. Realized and unrealized gains and losses on put options purchased and put options written are included in the Statement of Operations as Net realized gain (loss) from and Change in net unrealized appreciation (depreciation) of Investment securities and Option contracts written, respectively. A risk in buying an option is that the Fund pays a premium whether or not the option is exercised. In addition, there can be no assurance that a liquid secondary market will exist for any option purchased.
| N. | Swap Agreements — The Fund may enter into various swap transactions, including interest rate, total return, index, currency and credit default swap contracts (“CDS”) for investment purposes or to manage interest rate, currency or credit risk. Such transactions are agreements between Counterparties. A swap agreement may be negotiated bilaterally and traded over-the-counter (“OTC”) between two parties (“uncleared/ OTC”) or, in some instances, must be transacted through a future commission merchant (“FCM”) and cleared through a clearinghouse that serves as a central Counterparty (“centrally cleared swap”). These agreements may contain among other conditions, events of default and termination events, and various covenants and representations such as provisions that require the Fund to maintain a pre-determined level of net assets, and/ or provide limits regarding the decline of the Fund’s NAV over specific periods of time. If the Fund were to trigger such provisions and have open derivative positions at that time, the Counterparty may be able to terminate such agreement and request immediate payment in an amount equal to the net liability positions, if any. |
Interest rate, total return, index, and currency swap agreements are two-party contracts entered into primarily to exchange the returns (or differentials in rates of returns) earned or realized on particular predetermined investments or instruments. The gross returns to be exchanged or “swapped” between the parties are calculated with respect to a notional amount, i.e., the return on or increase in value of a particular dollar amount invested at a particular interest rate or return of an underlying asset, in a particular foreign currency, or in a “basket” of securities representing a particular index.
In a centrally cleared swap, the Fund’s ultimate Counterparty is a central clearinghouse. The Fund initially will enter into centrally cleared swaps through an executing broker. When a fund enters into a centrally cleared swap, it must deliver to the central Counterparty (via the FCM) an amount referred to as “initial margin.” Initial margin requirements are determined by the central Counterparty, but an FCM may require additional initial margin above the amount required by the central Counterparty. Initial margin deposits required upon entering into centrally cleared swaps are satisfied by cash or securities as collateral at the FCM. Securities deposited as initial margin are designated on the Schedule of Investments and cash deposited is recorded on the Statement of Assets and Liabilities. During the term of a cleared swap agreement, a “variation margin” amount may be required to be paid by the Fund or may be received by the Fund, based on the daily change in price of the underlying reference instrument subject to the swap agreement and is recorded as a receivable or payable for variation margin in the Statement of Assets and Liabilities until the centrally cleared swap is terminated at which time a realized gain or loss is recorded.
A CDS is an agreement between Counterparties to exchange the credit risk of an issuer. A buyer of a CDS is said to buy protection by paying a fixed payment over the life of the agreement and in some situations an upfront payment to the seller of the CDS. If a defined credit event occurs (such as payment default or bankruptcy), the Fund as a protection buyer would cease paying its fixed payment, the Fund would deliver eligible bonds issued by the reference entity to the seller, and the seller would pay the full notional value, or the “par value”, of the referenced obligation to the Fund. A seller of a CDS is said to sell protection and thus would receive a fixed payment over the life of the agreement and an upfront payment, if applicable. If a credit event occurs, the Fund as a protection seller would cease to receive the fixed payment stream, the Fund would pay the buyer “par value” or the full notional value of the referenced obligation, and the Fund would receive the eligible bonds issued by the reference entity. In turn, these bonds may be sold in order to realize a recovery value. Alternatively, the seller of the CDS and its Counterparty may agree to net the notional amount and the market value of the bonds and make a cash payment equal to the difference to the buyer of protection. If no credit event occurs, the Fund receives the fixed payment over the life of the agreement. As the seller, the Fund would effectively add leverage to its portfolio because, in addition to its total net assets, the Fund would be subject to investment exposure on the notional amount of the CDS. In connection with these agreements, cash and securities may be identified as collateral in accordance with the terms of the respective swap agreements to provide assets of value and recourse in the event of default under the swap agreement or bankruptcy/insolvency of a party to the swap agreement. If a Counterparty becomes bankrupt or otherwise fails to perform its obligations due to financial difficulties, the Fund may experience significant delays in obtaining any recovery in a bankruptcy or other reorganization proceeding. The Fund may obtain only limited recovery or may obtain no recovery in such circumstances. The Fund’s maximum risk of loss from Counterparty risk, either as the protection seller or as the protection buyer, is the value of the contract. The risk may be mitigated by having a master netting arrangement between the Fund and the Counterparty and by the designation of collateral by the Counterparty to cover the Fund’s exposure to the Counterparty.
Implied credit spreads represent the current level at which protection could be bought or sold given the terms of the existing CDS contract and serve as an indicator of the current status of the payment/performance risk of the CDS. An implied spread that has widened or increased since entry into the initial contract may indicate a deteriorating credit profile and increased risk of default for the reference entity. A declining or
| 44 | Invesco Core Plus Bond Fund |
narrowing spread may indicate an improving credit profile or decreased risk of default for the reference entity. Alternatively, credit spreads may increase or decrease reflecting the general tolerance for risk in the credit markets.
An interest rate swap is an agreement between Counterparties pursuant to which the parties exchange a floating rate payment for a fixed rate payment based on a specified notional amount.
Changes in the value of centrally cleared and OTC swap agreements are recognized as unrealized gains (losses) in the Statement of Operations by “marking to market” on a daily basis to reflect the value of the swap agreement at the end of each trading day. Payments received or paid at the beginning of the agreement are reflected as such on the Statement of Assets and Liabilities and may be referred to as upfront payments. The Fund accrues for the fixed payment stream and amortizes upfront payments, if any, on swap agreements on a daily basis with the net amount, recorded as a component of realized gain (loss) on the Statement of Operations. A liquidation payment received or made at the termination of a swap agreement is recorded as realized gain (loss) on the Statement of Operations. The Fund segregates cash or liquid securities having a value at least equal to the amount of the potential obligation of a Fund under any swap transaction. Cash held as collateral is recorded as deposits with brokers on the Statement of Assets and Liabilities. Entering into these agreements involves, to varying degrees, lack of liquidity and elements of credit, market, and Counterparty risk in excess of amounts recognized on the Statement of Assets and Liabilities. Such risks involve the possibility that a swap is difficult to sell or liquidate; the Counterparty does not honor its obligations under the agreement and unfavorable interest rates and market fluctuations. It is possible that developments in the swaps market, including potential government regulation, could adversely affect the Fund’s ability to terminate existing swap agreements or to realize amounts to be received under such agreements. A short position in a security poses more risk than holding the same security long. As there is no limit on how much the price of the security can increase, the Fund’s exposure is unlimited.
Notional amounts of each individual credit default swap agreement outstanding as of August 31, 2019 for which the Fund is the seller of protection are disclosed in the open swap agreements table. These potential amounts would be partially offset by any recovery values of the respective referenced obligations, upfront payments received upon entering into the agreement, or net amounts received from the settlement of buy protection credit default swap agreements entered into by the Fund for the same referenced entity or entities.
| O. | Dollar Rolls and Forward Commitment Transactions - The Fund may enter into dollar roll transactions to enhance the Fund’s performance. The Fund executes its dollar roll transactions in theto be announced (“TBA”) market whereby the Fund makes a forward commitment to purchase a security and, instead of accepting delivery, the position is offset by the sale of the security with a simultaneous agreement to repurchase at a future date. |
The Fund accounts for dollar roll transactions as purchases and sales and realizes gains and losses on these transactions. These transactions increase the Fund’s portfolio turnover rate. The Fund will segregate liquid assets in an amount equal to its dollar roll commitments.
Dollar roll transactions involve the risk that a Counterparty to the transaction may fail to complete the transaction. If this occurs, the Fund may lose the opportunity to purchase or sell the security at the agreed upon price. Dollar roll transactions also involve the risk that the value of the securities retained by the Fund may decline below the price of the securities that the Fund has sold but is obligated to purchase under the agreement. Dollar roll transactions covered in this manner are not treated as senior securities for purposes of a Fund’s fundamental investment limitation on borrowings.
| P. | Other Risks– The Fund may invest in obligations issued by agencies and instrumentalities of the U.S. Government that may vary in the level of support they receive from the government. The government may choose not to provide financial support to government sponsored agencies or instrumentalities if it is not legally obligated to do so. In this case, if the issuer defaulted, the Fund may not be able to recover its investment in such issuer from the U.S. Government. Many securities purchased by the Fund are not guaranteed by the U.S. Government. |
| Q. | Leverage Risk — Leverage exists when the Fund can lose more than it originally invests because it purchases or sells an instrument or enters into a transaction without investing an amount equal to the full economic exposure of the instrument or transaction. |
| R. | Collateral—To the extent the Fund has designated or segregated a security as collateral and that security is subsequently sold, it is the Fund’s practice to replace such collateral no later than the next business day. |
NOTE 2—Advisory Fees and Other Fees Paid to Affiliates
The Trust has entered into a master investment advisory agreement with Invesco Advisers, Inc. (the "Adviser" or "Invesco"). Under the terms of the investment advisory agreement, the Fund accrues daily and pays monthly an advisory fee to the Adviser based on the annual rate of the Fund’s average daily net assets as follows:
| Average Daily Net Assets | Rate |
| First $500 million | 0.450% |
| Next $500 million | 0.425% |
| Next $1.5 billion | 0.400% |
| Next $2.5 billion | 0.375% |
| Over $5 billion | 0.350% |
For the year ended August 31, 2019, the effective advisory fees incurred by the Fund was 0.40%.
Under the terms of a master sub-advisory agreement between the Adviser and each of Invesco Asset Management Deutschland GmbH, Invesco Asset Management Limited, Invesco Asset Management (Japan) Limited, Invesco Hong Kong Limited, Invesco Senior Secured Management, Inc. and Invesco Canada Ltd. (collectively, the "Affiliated Sub-Advisers") the Adviser, not the Fund, will pay 40% of the fees paid to the Adviser to any such Affiliated Sub-Adviser(s) that provide(s) discretionary investment management services to the Fund based on the percentage of assets allocated to such Affiliated Sub-Adviser(s).
The Adviser has contractually agreed, through at least December 31, 2019, to waive advisory fees and/or reimburse expenses of all shares to the extent necessary to limit total annual fund operating expenses after fee waiver and/or expense reimbursement (excluding certain items discussed below) of Class A, Class C, Class R, Class Y, Class R5 and Class R6 shares to 0.75%, 1.50%, 1.00%, 0.50%, 0.50% and 0.50%, respectively, of the Fund’s average daily net assets (the "expense limits"). In determining the Adviser’s obligation to waive advisory fees and/or reimburse expenses, the
| 45 | Invesco Core Plus Bond Fund |
following expenses are not taken into account, and could cause the total annual fund operating expenses after fee waiver and/or reimbursement to exceed the numbers reflected above: (1) interest; (2) taxes; (3) dividend expense on short sales; (4) extraordinary or non-routine items, including litigation expenses; and (5) expenses that the Fund has incurred but did not actually pay because of an expense offset arrangement. Unless Invesco continues the fee waiver agreement, it will terminate on December 31, 2019. During its term, the fee waiver agreement cannot be terminated or amended to increase the expense limits or reduce the advisory fee waivers without approval of the Board of Trustees.
Further, the Adviser has contractually agreed, through at least June 30, 2021, to waive the advisory fee payable by the Fund in an amount equal to 100% of the net advisory fees the Adviser receives from the affiliated money market funds on investments by the Fund of uninvested cash in such affiliated money market funds.
For the year ended August 31, 2019, the Adviser waived advisory fees of $325,184 and reimbursed class level expenses of $803,378, $79,335, $13,204, $744,369, $2,500 and $0 of Class A, Class C, Class R, Class Y, Class R5 and Class R6 shares, respectively.
The Trust has entered into a master administrative services agreement with Invesco pursuant to which the Fund has agreed to pay Invesco for certain administrative costs incurred in providing accounting services to the Fund. For the year ended August 31, 2019, expenses incurred under the agreement are shown in the Statement of Operations asAdministrative services fees. Also, Invesco has entered into a sub-administration agreement whereby State Street Bank and Trust Company (“SSB”) serves as custodian and fund accountant and provides certain administrative services to the Fund.
The Trust has entered into a transfer agency and service agreement with Invesco Investment Services, Inc. (“IIS”) pursuant to which the Fund has agreed to pay IIS a fee for providing transfer agency and shareholder services to the Fund and reimburse IIS for certain expenses incurred by IIS in the course of providing such services. IIS may make payments to intermediaries that provide omnibus account services, sub-accounting services and/or networking services. All fees payable by IIS to intermediaries that provide omnibus account services or sub-accounting services are charged back to the Fund, subject to certain limitations approved by the Trust’s Board of Trustees. For the year ended August 31, 2019, expenses incurred under the agreement are shown in the Statement of Operations asTransfer agent fees.
The Trust has entered into master distribution agreements with Invesco Distributors, Inc. (“IDI”) to serve as the distributor for the Class A, Class C, Class R, Class Y, Class R5 and Class R6 shares of the Fund. The Trust has adopted plans pursuant to Rule 12b-1 under the 1940 Act with respect to the Fund’s Class A, Class C and Class R shares (collectively, the “Plans”). The Fund, pursuant to the Plans, pays IDI compensation at the annual rate of 0.25% of the Fund’s average daily net assets of Class A shares, 1.00% of the average daily net assets of Class C shares and 0.50% of the average daily net assets of Class R shares. The fees are accrued daily and paid monthly. Of the Plan payments, up to 0.25% of the average daily net assets of each class of shares may be paid to furnish continuing personal shareholder services to customers who purchase and own shares of such classes. Any amounts not paid as a service fee under the Plans would constitute an asset-based sales charge. Rules of the Financial Industry Regulatory Authority (“FINRA”) impose a cap on the total sales charges, including asset-based sales charges, that may be paid by any class of shares of the Fund. For the year ended August 31, 2019, expenses incurred under the Plans are shown in the Statement of Operations as Distribution fees.
Front-end sales commissions and CDSC (collectively, the “sales charges”) are not recorded as expenses of the Fund. Front-end sales commissions are deducted from proceeds from the sales of Fund shares prior to investment in Class A shares of the Fund. CDSC are deducted from redemption proceeds prior to remittance to the shareholder. During the year ended August 31, 2019, IDI advised the Fund that IDI retained $162,334 in front-end sales commissions from the sale of Class A shares and $22,697 and $10,063 from Class A and Class C shares, respectively, for CDSC imposed upon redemptions by shareholders.
Certain officers and trustees of the Trust are officers and directors of the Adviser, IIS and/or IDI.
NOTE 3—Additional Valuation Information
GAAP defines fair value as the price that would be received to sell an asset or paid to transfer a liability in an orderly transaction between market participants at the measurement date, under current market conditions. GAAP establishes a hierarchy that prioritizes the inputs to valuation methods, giving the highest priority to readily available unadjusted quoted prices in an active market for identical assets (Level 1) and the lowest priority to significant unobservable inputs (Level 3), generally when market prices are not readily available or are unreliable. Based on the valuation inputs, the securities or other investments are tiered into one of three levels. Changes in valuation methods may result in transfers in or out of an investment’s assigned level:
Level 1 – Prices are determined using quoted prices in an active market for identical assets.
Level 2 – Prices are determined using other significant observable inputs. Observable inputs are inputs that other market participants may use in pricing a security. These may include quoted prices for similar securities, interest rates, prepayment speeds, credit risk, yield curves, loss severities, default rates, discount rates, volatilities and others.
Level 3 – Prices are determined using significant unobservable inputs. In situations where quoted prices or observable inputs are unavailable (for example, when there is little or no market activity for an investment at the end of the period), unobservable inputs may be used. Unobservable inputs reflect the Fund’s own assumptions about the factors market participants would use in determining fair value of the securities or instruments and would be based on the best available information.
The following is a summary of the tiered valuation input levels, as of August 31, 2019. The level assigned to the securities valuations may not be an indication of the risk or liquidity associated with investing in those securities. Because of the inherent uncertainties of valuation, the values reflected in the financial statements may materially differ from the value received upon actual sale of those investments.
| 46 | Invesco Core Plus Bond Fund |
| | Level 1 | Level 2 | Level 3 | Total |
| Investments in Securities | | | | |
| U.S. Dollar Denominated Bonds & Notes | $— | $1,825,255,274 | $— | $1,825,255,274 |
| Asset-Backed Securities | — | 1,049,475,813 | — | 1,049,475,813 |
| U.S. Government Sponsored Agency Mortgage-Backed Securities | — | 634,725,232 | — | 634,725,232 |
| U.S. Treasury Securities | — | 526,339,258 | — | 526,339,258 |
| Preferred Stocks | 49,064,871 | — | — | 49,064,871 |
| Agency Credit Risk Transfer Notes | — | 35,600,123 | — | 35,600,123 |
| Variable Rate Senior Loan Interests | — | — | 26,785,928 | 26,785,928 |
| Non-U.S. Dollar Denominated Bonds & Notes | — | 22,091,535 | — | 22,091,535 |
| Municipal Obligations | — | 801,444 | — | 801,444 |
| Common Stocks & Other Equity Interests | 2,984 | 1,455 | — | 4,439 |
| Money Market Funds | 163,819,311 | — | — | 163,819,311 |
| Options Purchased | 3,015,810 | — | — | 3,015,810 |
| Investments Matured | — | 60,401 | — | 60,401 |
| Total Investments in Securities | 215,902,976 | 4,094,350,535 | 26,785,928 | 4,337,039,439 |
| Other Investments - Assets* | | | | |
| Futures Contracts | 1,036,090 | — | — | 1,036,090 |
| Forward Foreign Currency Contracts | — | 1,371,067 | — | 1,371,067 |
| Swap Agreements | — | 90,254 | — | 90,254 |
| | 1,036,090 | 1,461,321 | — | 2,497,411 |
| Other Investments - Liabilities* | | | | |
| Futures Contracts | (1,678,700) | — | — | (1,678,700) |
| Forward Foreign Currency Contracts | — | (708,591) | — | (708,591) |
| Options Written | — | (93,994) | — | (93,994) |
| | (1,678,700) | (802,585) | — | (2,481,285) |
| Total Other Investments | (642,610) | 658,736 | — | 16,126 |
| Total Investments | $215,260,366 | $4,095,009,271 | $26,785,928 | $4,337,055,565 |
| * | Forward foreign currency contracts, futures contracts and swap agreements are valued at unrealized appreciation (depreciation). Options written are shown at value. |
NOTE 4—Derivative Investments
The Fund may enter into an International Swaps and Derivatives Association Master Agreement (“ISDA Master Agreement”) under which a fund may trade OTC derivatives. An OTC transaction entered into under an ISDA Master Agreement typically involves a collateral posting arrangement, payment netting provisions and close-out netting provisions. These netting provisions allow for reduction of credit risk through netting of contractual obligations. The enforceability of the netting provisions of the ISDA Master Agreement depends on the governing law of the ISDA Master Agreement, among other factors.
For financial reporting purposes, the Fund does not offset OTC derivative assets or liabilities that are subject to ISDA Master Agreements in the Statement of Assets and Liabilities.
Value of Derivative Investments at Period-End
The table below summarizes the value of the Fund’s derivative investments, detailed by primary risk exposure, held as of August 31, 2019:
| | Value |
| Derivative Assets | Credit
Risk | Currency
Risk | Equity
Risk | Interest
Rate Risk | Total |
| Unrealized appreciation on futures contracts — Exchange-Traded(a) | $- | $- | $- | $1,036,090 | $1,036,090 |
| Unrealized appreciation on swap agreements — Centrally Cleared(a) | 90,254 | - | - | - | 90,254 |
| Unrealized appreciation on forward foreign currency contracts outstanding | - | 1,371,067 | - | - | 1,371,067 |
| Options purchased, at value — Exchange-Traded(b) | - | - | 3,015,810 | - | 3,015,810 |
| Total Derivative Assets | 90,254 | 1,371,067 | 3,015,810 | 1,036,090 | 5,513,221 |
| Derivatives not subject to master netting agreements | (90,254) | - | (3,015,810) | (1,036,090) | (4,142,154) |
| Total Derivative Assets subject to master netting agreements | $- | $1,371,067 | $- | $- | $1,371,067 |
| 47 | Invesco Core Plus Bond Fund |
| | Value |
| Derivative Liabilities | Credit
Risk | Currency
Risk | Equity
Risk | Interest
Rate Risk | Total |
| Unrealized depreciation on futures contracts — Exchange-Traded(a) | $- | $- | $- | $(1,678,700) | $(1,678,700) |
| Unrealized depreciation on forward foreign currency contracts outstanding | - | (708,591) | - | - | (708,591) |
| Options written, at value — Exchange-Traded | - | - | (93,994) | - | (93,994) |
| Total Derivative Liabilities | - | (708,591) | (93,994) | (1,678,700) | (2,481,285) |
| Derivatives not subject to master netting agreements | - | - | 93,994 | 1,678,700 | 1,772,694 |
| Total Derivative Liabilities subject to master netting agreements | $- | $(708,591) | $- | $- | $(708,591) |
| (a) | The daily variation margin receivable (payable) at period-end is recorded in the Statement of Assets and Liabilities. |
| (b) | Options purchased, at value as reported in the Schedule of Investments. |
Offsetting Assets and Liabilities
The table below reflects the Fund’s exposure to Counterparties subject to either an ISDA Master Agreement or other agreement for OTC derivative transactions as of August 31, 2019.
| | Financial
Derivative
Assets | Financial
Derivative
Liabilities | | Collateral
(Received)/Pledged | |
| Counterparty | Forward Foreign
Currency Contracts | Forward Foreign
Currency Contracts | Net Value of
Derivatives | Non-Cash | Cash | Net
Amount |
| Citibank, N.A. | $674 | $(696,722) | $(696,048) | $– | $– | $(696,048) |
| Goldman Sachs & Co. | 508,896 | – | 508,896 | – | – | 508,896 |
| Morgan Stanley | 857,398 | (11,869) | 845,529 | – | – | 845,529 |
| UBS | 4,099 | – | 4,099 | – | – | 4,099 |
| Total | $1,371,067 | $(708,591) | $662,476 | $– | $– | $662,476 |
Effect of Derivative Investments for the year ended August 31, 2019
The table below summarizes the gains (losses) on derivative investments, detailed by primary risk exposure, recognized in earnings during the period:
| | Location of Gain (Loss) on
Statement of Operations |
| | Credit
Risk | Currency
Risk | Equity
Risk | Interest
Rate Risk | Total |
| Realized Gain (Loss): | | | | | |
| Forward foreign currency contracts | $- | $(9,622,288) | $- | $- | $(9,622,288) |
| Futures contracts | - | - | - | 21,866,327 | 21,866,327 |
| Options purchased(a) | - | (5,938,340) | 301,633 | (1,903,750) | (7,540,457) |
| Options written | - | 1,716,644 | 13,592 | 2,777,427 | 4,507,663 |
| Swap agreements | (1,097,693) | - | - | 412,665 | (685,028) |
| Change in Net Unrealized Appreciation (Depreciation): | | | | | |
| Forward foreign currency contracts | - | (432,850) | - | - | (432,850) |
| Futures contracts | - | - | - | 539,057 | 539,057 |
| Options purchased(a) | - | 1,166,833 | (1,482,445) | - | (315,612) |
| Options written | (156,149) | (1,682,780) | 3,740 | - | (1,835,189) |
| Swap agreements | 90,254 | - | - | 4,149,357 | 4,239,611 |
| Total | $(1,163,588) | $(14,792,781) | $(1,163,480) | $27,841,083 | $10,721,234 |
| (a) | Options purchased are included in the net realized gain (loss) from investment securities and the change in net unrealized appreciation (depreciation) on investment securities. |
The table below summarizes the average notional value of derivatives held during the period.
| | Forward
Foreign Currency
Contracts | Futures
Contracts | Equity
Options
Purchased | Index
Options
Purchased | Swaptions
Purchased | Foreign
Currency
Options
Purchased | Equity
Options
Written | Swaptions
Written | Foreign
Currency
Options
Written | Swap
Agreements |
| Average notional value | $626,777,773 | $955,338,490 | $14,013,463 | $29,954,583 | $250,000,000 | $267,700,917 | $2,785,229 | $142,285,000 | $80,000,000 | $458,630,617 |
| Average Contracts | — | — | 1,334 | 103 | — | — | 179 | — | — | — |
| 48 | Invesco Core Plus Bond Fund |
NOTE 5—Expense Offset Arrangement(s)
The expense offset arrangement is comprised of transfer agency credits which result from balances in demand deposit accounts used by the transfer agent for clearing shareholder transactions. For the year ended August 31, 2019, the Fund received credits from this arrangement, which resulted in the reduction of the Fund’s total expenses of $6,038.
NOTE 6—Trustees’ and Officers’ Fees and Benefits
Trustees’ and Officers’ Fees and Benefits include amounts accrued by the Fund to pay remuneration to certain Trustees and Officers of the Fund. Trustees have the option to defer compensation payable by the Fund, and Trustees’ and Officers’ Fees and Benefits also include amounts accrued by the Fund to fund such deferred compensation amounts. Those Trustees who defer compensation have the option to select various Invesco Funds in which their deferral accounts shall be deemed to be invested. Finally, certain current Trustees were eligible to participate in a retirement plan that provided for benefits to be paid upon retirement to Trustees over a period of time based on the number of years of service. The Fund may have certain former Trustees who also participate in a retirement plan and receive benefits under such plan.Trustees’ and Officers’ Fees and Benefits include amounts accrued by the Fund to fund such retirement benefits. Obligations under the deferred compensation and retirement plans represent unsecured claims against the general assets of the Fund.
NOTE 7—Cash Balances
The Fund may borrow for leveraging in an amount up to 5% of the Fund’s total assets (excluding the amount borrowed) at the time the borrowing is made. In doing so, the Fund is permitted to temporarily carry a negative or overdrawn balance in its account with SSB, the custodian bank. Such balances, if any at period end, are shown in the Statement of Assets and Liabilities under the payable captionAmount due custodian. To compensate the custodian bank for such overdrafts, the overdrawn Fund may either (1) leave funds as a compensating balance in the account so the custodian bank can be compensated by earning the additional interest; or (2) compensate by paying the custodian bank at a rate agreed upon by the custodian bank and Invesco, not to exceed the contractually agreed upon rate. The Fund may not purchase additional securities when any borrowings from banks or broker-dealers exceed 5% of the Fund’s total assets, or when any borrowings from an Invesco Fund are outstanding.
NOTE 8—Distributions to Shareholders and Tax Components of Net Assets
| Tax Character of Distributions to Shareholders Paid During the Fiscal Years Ended August 31, 2019 and August 31, 2018 |
| | 2019 | 2018 |
| Ordinary income | $128,968,351 | $123,915,411 |
| Return of capital | 22,647,540 | 5,223,187 |
| Total distributions | $151,615,891 | $129,138,598 |
| Tax Components of Net Assets at Period-End: |
| | 2019 |
| Net unrealized appreciation — investments | $134,549,548 |
| Net unrealized appreciation (depreciation) — foreign currencies | (82,989) |
| Temporary book/tax differences | (131,287) |
| Capital loss carryforward | (18,752,251) |
| Shares of beneficial interest | 4,128,077,955 |
| Total net assets | $4,243,660,976 |
The difference between book-basis and tax-basis unrealized appreciation (depreciation) is due to differences in the timing of recognition of gains and losses on investments for tax and book purposes. The Fund’s net unrealized appreciation (depreciation) difference is attributable primarily to bond premium amortization, wash sales and derivative investments.
The temporary book/tax differences are a result of timing differences between book and tax recognition of income and/or expenses. The Fund’s temporary book/tax differences are the result of the trustee deferral of compensation and retirement plan benefits.
Capital loss carryforward is calculated and reported as of a specific date. Results of transactions and other activity after that date may affect the amount of capital loss carryforward actually available for the Fund to utilize. Capital losses generated in years beginning after December 22, 2010 can be carried forward for an unlimited period, whereas previous losses expire in eight tax years. Capital losses with an expiration period may not be used to offset capital gains until all net capital losses without an expiration date have been utilized. Capital loss carryforwards with no expiration date will retain their character as either short-term or long-term capital losses instead of as short-term capital losses as under prior law. The ability to utilize capital loss carryforwards in the future may be limited under the Internal Revenue Code and related regulations based on the results of future transactions.
The Fund has a capital loss carryforward as of August 31, 2019, as follows:
| Capital Loss Carryforward* |
| Expiration | Short-Term | Long-Term | Total |
| Not subject to expiration | $— | $18,752,251 | $18,752,251 |
| * | Capital loss carryforwards as of the date listed above is reduced for limitations, if any, to the extent required by the Internal Revenue Code and may be further limited depending upon a variety of factors, including the realization of net unrealized gains or losses as of the date of any reorganization. |
| 49 | Invesco Core Plus Bond Fund |
NOTE 9—Investment Transactions
The aggregate amount of investment securities (other than short-term securities, U.S. Treasury obligations and money market funds, if any) purchased and sold by the Fund during the year ended August 31, 2019 was $4,097,924,131 and $4,031,166,913, respectively. During the same period, purchases and sales of U.S. Treasury obligations were $5,350,650,479 and $5,276,164,348, respectively. Cost of investments, including any derivatives, on a tax basis includes the adjustments for financial reporting purposes as of the most recently completed federal income tax reporting period-end.
| Unrealized Appreciation (Depreciation) of Investments on a Tax Basis |
| Aggregate unrealized appreciation of investments | $150,112,050 |
| Aggregate unrealized (depreciation) of investments | (15,562,502) |
| Net unrealized appreciation of investments | $134,549,548 |
Cost of investments for tax purposes is $4,195,781,365.
NOTE 10—Reclassification of Permanent Differences
Primarily as a result of differing book/tax treatment of return of capital and derivative investments, on August 31, 2019, undistributed net investment income was increased by $9,454,879, undistributed net realized gain (loss) was increased by $11,579,150 and shares of beneficial interest was decreased by $21,034,029. This reclassification had no effect on the net assets of the Fund.
NOTE 11—Share Information
| | Summary of Share Activity |
| | Years ended August 31, |
| | 2019(a) | | 2018 |
| | Shares | Amount | | Shares | Amount |
| Sold: | | | | | |
| Class A | 23,760,865 | $252,505,480 | | 26,826,117 | $288,639,138 |
| Class B(b) | - | - | | 6,748 | 74,038 |
| Class C | 3,277,210 | 34,776,911 | | 4,510,488 | 48,760,686 |
| Class R | 646,015 | 6,816,801 | | 918,412 | 9,911,883 |
| Class Y | 44,625,925 | 471,174,745 | | 112,450,633 | 1,215,135,403 |
| Class R5 | 248,812 | 2,663,977 | | 660,164 | 7,082,251 |
| Class R6 | 32,237,301 | 340,019,216 | | 119,453,038 | 1,266,680,236 |
| Issued as reinvestment of dividends: | | | | | |
| Class A | 2,855,818 | 30,215,479 | | 2,315,982 | 24,739,891 |
| Class B(b) | - | - | | 1,369 | 14,958 |
| Class C | 207,006 | 2,178,746 | | 255,705 | 2,730,753 |
| Class R | 48,134 | 508,598 | | 35,798 | 382,039 |
| Class Y | 2,205,378 | 23,354,973 | | 3,167,089 | 34,018,398 |
| Class R5 | 21,035 | 222,495 | | 18,658 | 199,687 |
| Class R6 | 7,488,829 | 79,112,503 | | 4,832,635 | 51,408,112 |
| Conversion of Class B shares to Class A shares:(c) | | | | | |
| Class A | - | - | | 180,127 | 1,954,379 |
| Class B | - | - | | (179,986) | (1,954,379) |
| Automatic conversion of Class C shares to Class A shares: | | | | | |
| Class A | 3,574,793 | 37,143,597 | | - | - |
| Class C | (3,574,848) | (37,143,597) | | - | - |
| 50 | Invesco Core Plus Bond Fund |
| | Summary of Share Activity |
| | Years ended August 31, |
| | 2019(a) | | 2018 |
| | Shares | Amount | | Shares | Amount |
| Reacquired: | | | | | |
| Class A | (17,496,318) | $(184,183,604) | | (18,049,396) | $(193,249,367) |
| Class B(b) | - | - | | (107,475) | (1,170,260) |
| Class C | (3,796,480) | (39,640,736) | | (4,901,731) | (52,396,674) |
| Class R | (454,922) | (4,777,897) | | (555,488) | (5,938,575) |
| Class Y | (55,164,048) | (578,503,267) | | (142,999,308) | (1,521,284,809) |
| Class R5 | (125,570) | (1,321,836) | | (577,065) | (6,165,220) |
| Class R6 | (47,105,553) | (496,066,735) | | (24,229,180) | (256,022,712) |
| Net increase (decrease) in share activity | (6,520,618) | $(60,944,151) | | 84,033,334 | $913,549,856 |
| (a) | There are entities that are record owners of more than 5% of the outstanding shares of the Fund and in the aggregate own 66% of the outstanding shares of the Fund. IDI has an agreement with these entities to sell Fund shares. The Fund, Invesco and/or Invesco affiliates may make payments to these entities, which are considered to be related to the Fund, for providing services to the Fund, Invesco and/or Invesco affiliates including but not limited to services such as securities brokerage, distribution, third party record keeping and account servicing. The Fund has no knowledge as to whether all or any portion of the shares owned of record by these entities are also owned beneficially. |
| (b) | Class B shares activity for the period September 1, 2017 through January 26, 2018 (date of conversion). |
| (c) | Effective as of the close of business January 26, 2018, all outstanding Class B shares were converted to Class A shares. |
| 51 | Invesco Core Plus Bond Fund |
Report of Independent Registered Public Accounting Firm
To the Board of Trustees of AIM Counselor Series Trust (Invesco Counselor Series Trust) and Shareholders of Invesco Core Plus Bond Fund
Opinion on the Financial Statements
We have audited the accompanying statement of assets and liabilities, including the schedule of investments, of Invesco Core Plus Bond Fund (one of the funds constituting AIM Counselor Series Trust (Invesco Counselor Series Trust), hereafter referred to as the "Fund") as of August 31, 2019, the related statement of operations for the year ended August 31, 2019, the statement of changes in net assets for each of the two years in the period ended August 31, 2019, including the related notes, and the financial highlights for each of the five years in the period ended August 31, 2019 (collectively referred to as the "financial statements"). In our opinion, the financial statements present fairly, in all material respects, the financial position of the Fund as of August 31, 2019, the results of its operations for the year then ended, the changes in its net assets for each of the two years in the period ended August 31, 2019 and the financial highlights for each of the five years in the period ended August 31, 2019 in conformity with accounting principles generally accepted in the United States of America.
Basis for Opinion
These financial statements are the responsibility of the Fund’s management. Our responsibility is to express an opinion on the Fund’s financial statements based on our audits. We are a public accounting firm registered with the Public Company Accounting Oversight Board (United States) (PCAOB) and are required to be independent with respect to the Fund in accordance with the U.S. federal securities laws and the applicable rules and regulations of the Securities and Exchange Commission and the PCAOB.
We conducted our audits of these financial statements in accordance with the standards of the PCAOB. Those standards require that we plan and perform the audit to obtain reasonable assurance about whether the financial statements are free of material misstatement, whether due to error or fraud.
Our audits included performing procedures to assess the risks of material misstatement of the financial statements, whether due to error or fraud, and performing procedures that respond to those risks. Such procedures included examining, on a test basis, evidence regarding the amounts and disclosures in the financial statements. Our audits also included evaluating the accounting principles used and significant estimates made by management, as well as evaluating the overall presentation of the financial statements. Our procedures included confirmation of securities owned as of August 31, 2019 by correspondence with the custodian, transfer agent and brokers; when replies were not received from brokers, we performed other auditing procedures. We believe that our audits provide a reasonable basis for our opinion.
/s/ PricewaterhouseCoopers LLP
Houston, Texas
October 29, 2019
We have served as the auditor of one or more of the investment companies in the Invesco group of investment companies since at least 1995. We have not been able to determine the specific year we began serving as auditor.
| 52 | Invesco Core Plus Bond Fund |
Calculating your ongoing Fund expenses
Example
As a shareholder of the Fund, you incur two types of costs: (1) transaction costs, which may include sales charges (loads) on purchase payments or contingent deferred sales charges on redemptions, if any; and (2) ongoing costs, including management fees, distribution and/or service (12b-1) fees, and other Fund expenses. This example is intended to help you understand your ongoing costs (in dollars) of investing in the Fund and to compare these costs with ongoing costs of investing in other mutual funds. The example is based on an investment of $1,000 invested at the beginning of the period and held for the entire period March 1, 2019 through August 31, 2019.
Actual expenses
The table below provides information about actual account values and actual expenses. You may use the information in this table, together with the amount you invested, to estimate the expenses that you paid over the period. Simply divide your account value by $1,000 (for example, an $8,600 account value divided by $1,000 = 8.6), then multiply the result by the number in the table under the heading entitled “Actual Expenses Paid During Period” to estimate the expenses you paid on your account during this period.
Hypothetical example for comparison purposes
The table below also provides information about hypothetical account values and hypothetical expenses based on the Fund’s actual expense ratio and an assumed rate of return of 5% per year before expenses, which is not the Fund’s actual return.
The hypothetical account values and expenses may not be used to estimate the actual ending account balance or expenses you paid for the period. You may use this information to compare the ongoing costs of investing in the Fund and other funds. To do so, compare this 5% hypothetical example with the 5% hypothetical examples that appear in the shareholder reports of the other funds.
Please note that the expenses shown in the table are meant to highlight your ongoing costs only and do not reflect any transaction costs, such as sales charges (loads) on purchase payments or contingent deferred sales charges on redemptions, if any. Therefore, the hypothetical information is useful in comparing ongoing costs only, and will not help you determine the relative total costs of owning different funds. In addition, if these transaction costs were included, your costs would have been higher.
| | Beginning
Account Value (03/01/19) | ACTUAL | HYPOTHETICAL
(5% annual return before
expenses) | Annualized
Expense
Ratio |
Ending
Account Value
(08/31/19)1 | Expenses
Paid During
Period2 | Ending
Account Value
(08/31/19) | Expenses
Paid During
Period2 |
| Class A | $1,000.00 | $1,083.90 | $3.89 | $1,021.48 | $3.77 | 0.74% |
| Class C | 1,000.00 | 1,079.90 | 7.81 | 1,017.69 | 7.58 | 1.49 |
| Class R | 1,000.00 | 1,081.60 | 5.19 | 1,020.21 | 5.04 | 0.99 |
| Class Y | 1,000.00 | 1,085.10 | 2.58 | 1,022.74 | 2.50 | 0.49 |
| Class R5 | 1,000.00 | 1,085.20 | 2.58 | 1,022.74 | 2.50 | 0.49 |
| Class R6 | 1,000.00 | 1,085.50 | 2.31 | 1,022.99 | 2.24 | 0.44 |
| 1 | The actual ending account value is based on the actual total return of the Fund for the period March 1, 2019 through August 31, 2019, after actual expenses and will differ from the hypothetical ending account value which is based on the Fund’s expense ratio and a hypothetical annual return of 5% before expenses. |
| 2 | Expenses are equal to the Fund’s annualized expense ratio as indicated above multiplied by the average account value over the period, multiplied by 184/365 to reflect the most recent fiscal half year. |
| 53 | Invesco Core Plus Bond Fund |
Approval of Investment Advisory and Sub-Advisory Contracts
At meetings held on June 10, 2019, the Board of Trustees (the Board or the Trustees) of AIM Counselor Series Trust (Invesco Counselor Series Trust) as a whole, and the independent Trustees, who comprise over 75% of the Board, voting separately, approved the continuance of the Invesco Core Plus Bond Fund’s (the Fund) Master Investment Advisory Agreement with Invesco Advisers, Inc. (Invesco Advisers and the investment advisory agreement) and the Master IntergroupSub-Advisory Contract for Mutual Funds with Invesco Asset Management Deutschland GmbH, Invesco Asset Management Limited, Invesco Asset Management (Japan) Limited, Invesco Hong Kong Limited, Invesco Senior Secured Management, Inc. and Invesco Canada Ltd. (collectively, the AffiliatedSub-Advisers and thesub-advisory contracts) for another year, effective July 1, 2019. After evaluating the factors discussed below, among others, the Board approved the renewal of the Fund’s investment advisory agreement and thesub-advisory contracts and determined that the compensation payable by the Fund to Invesco Advisers and by Invesco Advisers to the AffiliatedSub-Advisers is fair and reasonable.
The Board’s Evaluation Process
The Board’s Investments Committee has established threeSub-Committees, which meet throughout the year to review the performance of funds advised by Invesco Advisers (the Invesco Funds). As part of a regularly scheduled basis ofin-person Board meetings, theSub-Committees meet with portfolio managers for their assigned Invesco Funds and other members of management to review detailed information about investment performance and portfolio attributes of these funds. The Board took into account evaluations and reports that it received from the Investments Committee andSub-Committees, as well as the information provided to such committees and the Board throughout the year, in considering whether to approve each Invesco Fund’s investment advisory agreement andsub-advisory contracts.
As part of the contract renewal process, the Board reviews and considers information provided in response to detailed requests for information submitted to management by the independent Trustees with assistance from legal counsel to the independent Trustees. The Board receives comparative investment performance and fee data regarding the Invesco Funds prepared by Invesco Advisers and Broadridge Financial Solutions, Inc. (Broadridge), an independent mutual fund data provider. The Board also receives an independent written evaluation from the Senior Officer, an officer of the Invesco Funds who reports directly to the independent Trustees. The Senior Officer’s evaluation is prepared as part of his responsibility to manage the process by which the Invesco Funds’ proposed management fees
are negotiated during the annual contract renewal process to ensure they are negotiated in a manner that is at arms’ length and reasonable. In addition to meetings with Invesco Advisers and fund counsel throughout the year, the independent Trustees also discuss the continuance of the investment advisory agreement andsub-advisory contracts in separate sessions with the Senior Officer and with independent legal counsel.
The discussion below is a summary of the Senior Officer’s independent written evaluation with respect to the Fund’s investment advisory agreement, as well as a discussion of the material factors and related conclusions that formed the basis for the Board’s approval of the Fund’s investment advisory agreement andsub-advisory contracts. The Trustees’ review and conclusions are based on the comprehensive consideration of all information presented to them during the course of the year and in prior years and are not the result of any single determinative factor. Moreover, one Trustee may have weighed a particular piece of information or factor differently than another Trustee. This information is current as of June 10, 2019.
Factors and Conclusions and Summary of Independent Written Fee Evaluation
| A. | Nature, Extent and Quality of Services Provided by Invesco Advisers and the AffiliatedSub-Advisers |
The Board reviewed the nature, extent and quality of the advisory services provided to the Fund by Invesco Advisers under the Fund’s investment advisory agreement, and the credentials and experience of the officers and employees of Invesco Advisers who provide these services, including the Fund’s portfolio manager(s). The Board’s review included consideration of Invesco Advisers’ investment process oversight and structure, credit analysis and investment risk management. The Board also considerednon-advisory services that Invesco Advisers and its affiliates provide to the Invesco Funds such as various back office support functions, third party oversight, internal audit, valuation, portfolio trading and legal and compliance. The Board also received and reviewed information about Invesco Advisers’ role as administrator of the Invesco Funds’ liquidity risk management program. The Board also reviewed and considered the benefits to shareholders of investing in a fund that is part of the Invesco family of funds under the umbrella of Invesco Ltd., Invesco Advisers’ parent company, and noted Invesco Ltd.’s depth and experience in conducting an investment management business, as well as its commitment of financial and other resources to such business. The Board reviewed and considered information about the resources that Invesco Advisers intends to continue to
commit to managing the Invesco family of funds following Invesco Ltd.’s acquisition of OppenheimerFunds, Inc. and its subsidiaries. The Board concluded that the nature, extent and quality of the services provided to the Fund by Invesco Advisers are appropriate and satisfactory.
The Board reviewed the services that may be provided by the AffiliatedSub-Advisers under thesub-advisory contracts and the credentials and experience of the officers and employees of the AffiliatedSub-Advisers who provide these services. The Board noted the AffiliatedSub-Advisers’ expertise with respect to certain asset classes and that the AffiliatedSub-Advisers have offices and personnel that are located in financial centers around the world. As a result, the Board noted that the AffiliatedSub-Advisers can provide research and investment analysis on the markets and economies of various countries in which the Fund may invest, make recommendations regarding securities and assist with security trades. The Board concluded that thesub-advisory contracts may benefit the Fund and its shareholders by permitting Invesco Advisers to use the resources and talents of the AffiliatedSub-Advisers in managing the Fund. The Board concluded that the nature, extent and quality of the services that may be provided by the AffiliatedSub-Advisers are appropriate and satisfactory.
| B. | Fund Investment Performance |
The Board considered Fund investment performance as a relevant factor in considering whether to approve the investment advisory agreement. The Board did not view Fund investment performance as a relevant factor in considering whether to approve thesub-advisory contracts for the Fund, as no AffiliatedSub-Adviser currently manages assets of the Fund.
The Board compared the Fund’s investment performance over multiple time periods ending December 31, 2018 to the performance of funds in the Broadridge performance universe and against the Lipper Core Plus Bond Funds Index. The Board noted that performance of Class A shares of the Fund was in the fifth quintile of its performance universe for the one year period, the third quintile for the three year period and the second quintile for the five year period (the first quintile being the best performing funds and the fifth quintile being the worst performing funds). The Board noted that performance of Class A shares of the Fund was below the performance of the Index for the one and three year periods and above the performance of the Index for the five year period. The Board noted that the Fund’s overweight exposure to high yield and investment grade credit as well as emerging markets negatively impacted Fund performance. The Trustees also reviewed more recent Fund
54 Invesco Core Plus Bond Fund
performance and this review did not change their conclusions.
| C. | Advisory andSub-Advisory Fees and Fund Expenses |
The Board compared the Fund’s contractual management fee rate to the contractual management fee rates of funds in the Fund’s Broadridge expense group. The Board noted that the contractual management fee rate for Class A shares of the Fund was below the median contractual management fee rate of funds in its expense group. The Board noted that the term “contractual management fee” for funds in the expense group may include both advisory and certainnon-portfolio management administrative services fees, but that Broadridge does not provide information on a fund by fund basis as to what is included. The Board also reviewed the methodology used by Broadridge in providing expense group information, which includes using each fund’s contractual management fee schedule (including any applicable breakpoints) as reported in the most recent prospectus or statement of additional information for each fund in the expense group. The Board also considered comparative information regarding the Fund’s total expense ratio and its various components.
The Board noted that Invesco Advisers has contractually agreed to waive fees and/or limit expenses of the Fund for the term disclosed in the Fund’s registration statement in an amount necessary to limit total annual operating expenses to a specified percentage of average daily net assets for each class of the Fund.
The Board also considered the fees charged by Invesco Advisers and the AffiliatedSub-Advisers to other similarly managed client accounts. The Board noted that Invesco Advisers or the AffiliatedSub-Advisers may charge lower fees to large institutional clients. Invesco Advisers reviewed with the Board differences in the scope of services it provides to the Invesco Funds relative to certain other types of client accounts, including management of cash flows as a result of redemptions and purchases, necessary infrastructure such as officers, office space, technology, legal and distribution, oversight of service providers, costs and business risks associated with launching new funds and sponsoring and maintaining the product line, preparation of annual registration statement updates and financial information and compliance with federal and state laws and regulations.
The Board also considered the services that may be provided by the AffiliatedSub-Advisers pursuant to thesub-advisory contracts, as well as the fees payable by Invesco Advisers to the AffiliatedSub-Advisers pursuant to thesub-advisory contracts.
| D. | Economies of Scale and Breakpoints |
The Board considered the extent to which there may be economies of scale in the provision of advisory services to the Fund. The Board considered Invesco’s reinvestment in its business, including investments in business
infrastructure and cybersecurity. The Board also considered that the Fund benefits from economies of scale through contractual breakpoints in the Fund’s advisory fee schedule, which generally operate to reduce the Fund’s expense ratio as it grows in size. The Board noted that the Fund shares directly in economies of scale through lower fees charged by third party service providers based on the combined size of the Invesco Funds. The Board noted that the Fund may also benefit from economies of scale through initial fee setting, fee waivers and expense reimbursements.
| E. | Profitability and Financial Resources |
The Board reviewed information from Invesco Advisers concerning the costs of the advisory and other services that Invesco Advisers and its affiliates provide to the Fund and the Invesco Funds and the profitability of Invesco Advisers and its affiliates in providing these services. The Board considered the methodology used for calculating profitability and noted the periodic review of such methodology by an independent consultant. The Board noted that Invesco Advisers continues to operate at a net profit from services Invesco Advisers and its affiliates provide to the Invesco Funds and the Fund. The Board did not deem the level of profits realized by Invesco Advisers and its affiliates from providing services to the Fund to be excessive given the nature, extent and quality of the services provided. The Board received information from Invesco Advisers demonstrating that Invesco Advisers and the AffiliatedSub-Advisers are financially sound and have the resources necessary to perform their obligations under the investment advisory agreement andsub-advisory contracts.
| F. | Collateral Benefits to Invesco Advisers and its Affiliates |
The Board considered various other benefits received by Invesco Advisers and its affiliates from the relationship with the Fund, including the fees received for providing administrative, transfer agency and distribution services to the Fund. The Board considered comparative information regarding fees charged for these services, including information provided by Broadridge and other independent sources. The Board considered the performance of Invesco Advisers and its affiliates in providing these services and the organizational structure employed to provide these services. The Board also considered that these services are provided to the Fund pursuant to written contracts that are reviewed and approved on an annual basis by the Board; and that the services are required for the operation of the Fund.
The Board considered the benefits realized by Invesco Advisers and the AffiliatedSub-Advisers as a result of portfolio brokerage transactions executed through “soft dollar” arrangements. Invesco Advisers noted that the Fund does not execute brokerage transactions through “soft dollar” arrangements to any significant degree.
The Board considered that the Fund’s uninvested cash and cash collateral from any securities lending arrangements may be
invested in money market funds advised by Invesco Advisers pursuant to procedures approved by the Board. The Board considered information regarding the returns of the affiliated money market funds relative to comparable overnight investments, as well as the costs to the Fund of such investments. The Board noted that Invesco Advisers receives advisory fees from these affiliated money market funds attributable to such investments, although Invesco Advisers has contractually agreed to waive through varying periods the advisory fees payable by the Invesco Funds with respect to certain investments in the affiliated money market funds. The waiver is in an amount equal to 100% of the net advisory fee Invesco Advisers receives from the affiliated money market funds with respect to the Fund’s investment in the affiliated money market funds of uninvested cash, but not cash collateral. The Board concluded that the amount of advisory fees received by Invesco Advisers from the Fund’s investment of cash collateral from any securities lending arrangements in the affiliated money market funds is fair and reasonable.
55 Invesco Core Plus Bond Fund
Tax Information
Form 1099-DIV, Form 1042-S and other year–end tax information provide shareholders with actual calendar year amounts that should be included in their tax returns. Shareholders should consult their tax advisers.
The following distribution information is being provided as required by the Internal Revenue Code or to meet a specific state’s requirement.
The Fund designates the following amounts or, if subsequently determined to be different, the maximum amount allowable for its fiscal year ended August 31, 2019:
| Federal and State Income Tax | |
| Qualified Dividend Income* | 6.62% |
| Corporate Dividends Received Deduction* | 6.62% |
| U.S. Treasury Obligations* | 6.85% |
| Tax-Exempt* | 0.00% |
| * | The above percentages are based on ordinary income dividends paid to shareholders during the Fund’s fiscal year. |
| 56 | Invesco Core Plus Bond Fund |
Trustees and Officers
The address of each trustee and officer is AIM Counselor Series Trust (Invesco Counselor Series Trust) (the “Trust”), 11 Greenway Plaza, Suite 1000, Houston, Texas 77046-1173. The trustees serve for the life of the Trust, subject to their earlier death, incapacitation, resignation, retirement or removal as more specifically provided in the Trust’s organizational documents. Each officer serves for a one year term or until their successors are elected and qualified. Column two below includes length of time served with predecessor entities, if any.
| | | | | | | | |
Name, Year of Birth and Position(s) Held with the Trust | | Trustee and/ or Officer Since | | Principal Occupation(s) During Past 5 Years | | Number of Funds in Fund
Complex
Overseen by
Trustee | | Other Directorship(s) Held by Trustee During Past 5 Years |
| Interested Persons | | | | | | | | |
Martin L. Flanagan1 — 1960 Trustee and Vice Chair | | 2007 | | Executive Director, Chief Executive Officer and President, Invesco Ltd. (ultimate parent of Invesco and a global investment management firm); Trustee and Vice Chair, The Invesco Funds; Vice Chair, Investment Company Institute; and Member of Executive Board, SMU Cox School of Business Formerly: Advisor to the Board, Invesco Advisers, Inc. (formerly known as Invesco Institutional (N.A.), Inc.); Chairman and Chief Executive Officer, Invesco Advisers, Inc. (registered investment adviser); Director, Chairman, Chief Executive Officer and President, Invesco Holding Company (US), Inc. (formerly IVZ Inc.) (holding company), Invesco Group Services, Inc. (service provider) and Invesco North American Holdings, Inc. (holding company); Director, Chief Executive Officer and President, Invesco Holding Company Limited (parent of Invesco and a global investment management firm); Director, Invesco Ltd.; Chairman, Investment Company Institute and President,Co-Chief Executive Officer,Co-President, Chief Operating Officer and Chief Financial Officer, Franklin Resources, Inc. (global investment management organization) | | 229 | | None |
Philip A. Taylor2 — 1954 Trustee | | 2006 | | Vice Chair, Invesco Ltd.; Trustee, The Invesco Funds Formerly: Director, Invesco Canada Ltd. (formerly known as Invesco Trimark Ltd./Invesco Trimark Ltèe) (registered investment adviser and registered transfer agent); Head of the Americas and Senior Managing Director, Invesco Ltd.; Director, Invesco Advisers, Inc. (formerly known as Invesco Institutional (N.A.), Inc.) (registered investment adviser); Director and Chairman, Invesco Investment Services, Inc. (formerly known as Invesco AIM Investment Services, Inc.) (registered transfer agent); Chief Executive Officer, Invesco Corporate Class Inc. (corporate mutual fund company); Chairman and Chief Executive Officer, Invesco Canada Ltd. (formerly known as Invesco Trimark Ltd./Invesco Trimark Ltèe) (registered investment adviser and registered transfer agent); Senior Vice President, The Invesco Funds; Director, Invesco Investment Advisers LLC (formerly known as Van Kampen Asset Management); Director, Chairman, Chief Executive Officer and President, Invesco Management Group, Inc. (formerly known as Invesco AIM Management Group, Inc.) (financial services holding company);Co-Chairman,Co-President andCo-Chief Executive Officer, Invesco Advisers, Inc. (formerly known as Invesco Institutional (N.A.), Inc.) (registered investment adviser); Director, Chief Executive Officer and President, Van Kampen Exchange Corp; President and Principal Executive Officer, The Invesco Funds (other than AIM Treasurer’s Series Trust (Invesco Treasurer’s Series Trust), Short-Term Investments Trust and Invesco Management Trust); Executive Vice President, The Invesco Funds (AIM Treasurer’s Series Trust (Invesco Treasurer’s Series Trust), Short-Term Investments Trust and Invesco Management Trust only); Director and President, INVESCO Funds Group, Inc. (registered investment adviser and registered transfer agent); Director and Chairman, IVZ Distributors, Inc. (formerly known as INVESCO Distributors, Inc.) (registered broker dealer); Director, President and Chairman, Invesco Inc. (holding company), Invesco Canada Holdings Inc. (holding company), Trimark Investments Ltd./Placements Trimark Ltèe and Invesco Financial Services Ltd/Services Financiers Invesco Ltèe; Chief Executive Officer, Invesco Canada Fund Inc. (corporate mutual fund company); Director and Chairman, Van Kampen Investor Services Inc.; Director, Chief Executive Officer and President, 1371 Preferred Inc. (holding company) and Van Kampen Investments Inc.; Director and President, AIM GP Canada Inc. (general partner for limited partnerships) and Van Kampen Advisors, Inc.; Director and Chief Executive Officer, Invesco Trimark Dealer Inc. (registered broker dealer); Director, Invesco Distributors, Inc. (formerly known as Invesco AIM Distributors, Inc.) (registered broker dealer); Manager, Invesco Capital Management LLC; Director, Chief Executive Officer and President, Invesco Advisers, Inc.; Director, Chairman, Chief Executive Officer and President, Invesco AIM Capital Management, Inc.; President, Invesco Trimark Dealer Inc. and Invesco Trimark Ltd./Invesco Trimark Ltèe; Director and President, AIM Trimark Corporate Class Inc. and AIM Trimark Canada Fund Inc.; Senior Managing Director, Invesco Holding Company Limited; Director and Chairman, Fund Management Company (former registered broker dealer); President and Principal Executive Officer, The Invesco Funds (AIM Treasurer’s Series Trust (Invesco Treasurer’s Series Trust), and Short-Term Investments Trust only); President, AIM Trimark Global Fund Inc. and AIM Trimark Canada Fund Inc. | | 229 | | None |
| 1 | Mr. Flanagan is considered an interested person (within the meaning of Section 2(a)(19) of the 1940 Act) of the Trust because he is an officer of the Adviser to the Trust, and an officer and a director of Invesco Ltd., ultimate parent of the Adviser. |
| 2 | Mr. Taylor is considered an interested person (within the meaning of Section 2(a)(19) of the 1940 Act) of the Trust because he is an officer of Invesco Ltd., ultimate parent of the Adviser. |
T-1 Invesco Core Plus Bond Fund
Trustees and Officers—(continued)
| | | | | | | | |
Name, Year of Birth and Position(s) Held with the Trust | | Trustee and/ or Officer Since | | Principal Occupation(s)
During Past 5 Years | | Number of
Funds in Fund
Complex
Overseen by
Trustee | | Other Directorship(s) Held by Trustee During
Past 5 Years |
| Independent Trustees | | | | | | | | |
Bruce L. Crockett — 1944 Trustee and Chair | | 2003 | | Chairman, Crockett Technologies Associates (technology consulting company) Formerly: Director, Captaris (unified messaging provider); Director, President and Chief Executive Officer, COMSAT Corporation; Chairman, Board of Governors of INTELSAT (international communications company); ACE Limited (insurance company); Independent Directors Council and Investment Company Institute: Member of the Audit Committee, Investment Company Institute; Member of the Executive Committee and Chair of the Governance Committee, Independent Directors Council | | 229 | | Director and Chairman of the Audit Committee, ALPS (Attorneys Liability Protection Society) (insurance company); Director and Member of the Audit Committee and Compensation Committee, Ferroglobe PLC (metallurgical company) |
David C. Arch — 1945 Trustee | | 2010 | | Chairman of Blistex Inc. (consumer health care products manufacturer); Member, World Presidents’ Organization | | 229 | | Board member of the Illinois Manufacturers’ Association |
Beth Ann Brown — 1968 Trustee | | 2019 | | Independent Consultant Formerly: Head of Intermediary Distribution, Managing Director, Strategic Relations, Managing Director, Head of National Accounts, Senior Vice President, National Account Manager and Senior Vice President, Key Account Manager, Columbia Management Investment Advisers LLC; Vice President, Key Account Manager, Liberty Funds Distributor, Inc.; and Trustee of certain Oppenheimer Funds | | 229 | | Director, Board of Directors of Caron Engineering Inc.; Advisor, Board of Advisors of Caron Engineering Inc.; President and Director, Acton Shapleigh Youth Conservation Corps (non -profit); and Vice President and Director of Grahamtastic Connection(non-profit) |
Jack M. Fields — 1952 Trustee | | 2003 | | Chief Executive Officer, Twenty First Century Group, Inc. (government affairs company); and Chairman, Discovery Learning Alliance(non-profit) Formerly: Owner and Chief Executive Officer, Dos Angeles Ranch L.P. (cattle, hunting, corporate entertainment); Director, Insperity, Inc. (formerly known as Administaff) (human resources provider); Chief Executive Officer, Texana Timber LP (sustainable forestry company); Director of Cross Timbers Quail Research Ranch(non-profit); and member of the U.S. House of Representatives | | 229 | | None |
Cynthia Hostetler — 1962 Trustee | | 2017 | | Non-Executive Director and Trustee of a number of public and private business corporations Formerly: Director, Aberdeen Investment Funds (4 portfolios); Head of Investment Funds and Private Equity, Overseas Private Investment Corporation; President, First Manhattan Bancorporation, Inc.; Attorney, Simpson Thacher & Bartlett LLP | | 229 | | Vulcan Materials Company (construction materials company); Trilinc Global Impact Fund; Genesee & Wyoming, Inc. (railroads); Artio Global Investment LLC (mutual fund complex); Edgen Group, Inc. (specialized energy and infrastructure products distributor); Investment Company Institute (professional organization); Independent Directors Council (professional organization) |
Eli Jones — 1961 Trustee | | 2016 | | Professor and Dean, Mays Business School — Texas A&M University Formerly: Professor and Dean, Walton College of Business, University of Arkansas and E.J. Ourso College of Business, Louisiana State University; Director, Arvest Bank | | 229 | | Insperity, Inc. (formerly known as Administaff) (human resources provider) |
Elizabeth Krentzman — 1959 Trustee | | 2019 | | Formerly: Principal and Chief Regulatory Advisor for Asset Management Services and U.S. Mutual Fund Leader of Deloitte & Touche LLP; General Counsel of the Investment Company Institute (trade association); National Director of the Investment Management Regulatory Consulting Practice, Principal, Director and Senior Manager of Deloitte & Touche LLP; Assistant Director of the Division of Investment Management — Office of Disclosure and Investment Adviser Regulation of the U.S. Securities and Exchange Commission and various positions with the Division of Investment Management — Office of Regulatory Policy of the U.S. Securities and Exchange Commission; Associate at Ropes & Gray LLP; Advisory Board Member of the Securities and Exchange Commission Historical Society; and Trustee of certain Oppenheimer Funds | | 229 | | Trustee of the University of Florida National Board Foundation and Audit Committee Member; Member of the Cartica Funds Board of Directors (private investment funds); Member of the University of Florida Law Center Association, Inc. Board of Trustees and Audit Committee Member |
Anthony J. LaCava, Jr. — 1956 Trustee | | 2019 | | Formerly: Director and Member of the Audit Committee, Blue Hills Bank (publicly traded financial institution) and Managing Partner, KPMG LLP | | 229 | | Blue Hills Bank; Chairman, Bentley University; Member, Business School Advisory Council; and Nominating Committee, KPMG LLP |
T-2 Invesco Core Plus Bond Fund
Trustees and Officers—(continued)
| | | | | | | | |
Name, Year of Birth and Position(s) Held with the Trust | | Trustee and/ or Officer Since | | Principal Occupation(s)
During Past 5 Years | | Number of
Funds in Fund
Complex
Overseen by
Trustee | | Other Directorship(s) Held by Trustee During
Past 5 Years |
| Independent Trustees—(continued) |
Prema Mathai-Davis — 1950 Trustee | | 2003 | | Retired Co-Owner & Partner of Quantalytics Research, LLC, (a FinTech Investment Research Platform for the Self-Directed Investor) | | 229 | | None |
Joel W. Motley — 1952 Trustee | | 2019 | | Director of Office of Finance, Federal Home Loan Bank; Member of the Vestry of Trinity Wall Street; Managing Director of Carmona Motley Inc. (privately held financial advisor); Member of the Finance and Budget Committee of the Council on Foreign Relations, Member of the Investment Committee and Board of Human Rights Watch and Member of the Investment Committee and Board of Historic Hudson Valley(non-profit cultural organization) Formerly: Managing Director of Public Capital Advisors, LLC (privately held financial advisor); Managing Director of Carmona Motley Hoffman, Inc. (privately held financial advisor); Trustee of certain Oppenheimer Funds; and Director of Columbia Equity Financial Corp. (privately held financial advisor) | | 229 | | Director of Greenwall Foundation (bioethics research foundation); Member of Board and Investment Committee of The Greenwall Foundation; Director of Southern Africa Legal Services Foundation; Board Member and Investment Committee Member of Pulitzer Center for Crisis Reporting(non-profit journalism) |
Teresa M. Ressel — 1962 Trustee | | 2017 | | Non-executive director and trustee of a number of public and private business corporations Formerly: Chief Financial Officer, Olayan America, The Olayan Group (international investor/commercial/industrial); Chief Executive Officer, UBS Securities LLC; Group Chief Operating Officer, Americas, UBS AG; Assistant Secretary for Management & Budget and CFO, US Department of the Treasury | | 229 | | Atlantic Power Corporation (power generation company); ON Semiconductor Corp. (semiconductor supplier) |
Ann Barnett Stern — 1957 Trustee | | 2017 | | President and Chief Executive Officer, Houston Endowment Inc. (private philanthropic institution) Formerly: Executive Vice President and General Counsel, Texas Children’s Hospital; Attorney, Beck, Redden and Secrest, LLP; Business Law Instructor, University of St. Thomas; Attorney, Andrews & Kurth LLP | | 229 | | Federal Reserve Bank of Dallas |
Raymond Stickel, Jr. — 1944 Trustee | | 2005 | | Retired Formerly: Director, Mainstay VP Series Funds, Inc. (25 portfolios); Partner, Deloitte & Touche | | 229 | | None |
Robert C. Troccoli — 1949 Trustee | | 2016 | | Retired Formerly: Adjunct Professor, University of Denver — Daniels College of Business; Senior Partner, KPMG LLP | | 229 | | None |
Daniel S. Vandivort — 1954 Trustee | | 2019 | | Treasurer, Chairman of the Audit and Finance Committee, and Trustee, Board of Trustees, Huntington Disease Foundation of America; and President, Flyway Advisory Services LLC (consulting and property management) Formerly: Trustee and Governance Chair, of certain Oppenheimer Funds | | 229 | | Chairman and Lead Independent Director, Chairman of the Audit Committee, and Director, Board of Directors, Value Line Funds |
James D. Vaughn — 1945 Trustee | | 2019 | | Retired Formerly: Managing Partner, Deloitte & Touche LLP; Trustee and Chairman of the Audit Committee, Schroder Funds; Board Member, Mile High United Way, Boys and Girls Clubs, Boy Scouts, Colorado Business Committee for the Arts, Economic Club of Colorado and Metro Denver Network (economic development corporation); and Trustee of certain Oppenheimer Funds | | 229 | | Board member and Chairman of Audit Committee of AMG National Trust Bank; Trustee and Investment Committee member, University of South Dakota Foundation; Board member, Audit Committee Member and past Board Chair, Junior Achievement(non-profit) |
Christopher L. Wilson — 1957 Trustee, Vice Chair and Chair Designate | | 2017 | | Retired Formerly: Director, TD Asset Management USA Inc. (mutual fund complex) (22 portfolios); Managing Partner, CT2, LLC (investing and consulting firm); President/Chief Executive Officer, Columbia Funds, Bank of America Corporation; President/Chief Executive Officer, CDC IXIS Asset Management Services, Inc.; Principal & Director of Operations, Scudder Funds, Scudder, Stevens & Clark, Inc.; Assistant Vice President, Fidelity Investments | | 229 | | ISO New England, Inc.(non-profit organization managing regional electricity market) |
T-3 Invesco Core Plus Bond Fund
Trustees and Officers—(continued)
| | | | | | | | |
Name, Year of Birth and Position(s) Held with the Trust | | Trustee and/ or Officer Since | | Principal Occupation(s)
During Past 5 Years | | Number of
Funds in Fund
Complex
Overseen by
Trustee | | Other Directorship(s) Held by Trustee During
Past 5 Years |
| Other Officers | | | | | | | | |
Sheri Morris — 1964 President, Principal Executive Officer and Treasurer | | 2003 | | President, Principal Executive Officer and Treasurer, The Invesco Funds; Vice President, Invesco Advisers, Inc. (formerly known as Invesco Institutional (N.A.), Inc.) (registered investment adviser); and Vice President, Invesco Exchange-Traded Fund Trust, Invesco Exchange-Traded Fund Trust II, Invesco India Exchange-Traded Fund Trust, Invesco Actively Managed Exchange-Traded Fund Trust, Invesco Actively Managed Exchange-Traded Commodity Fund Trust and Invesco Exchange-Traded Self-Indexed Fund Trust; and Vice President, OppenheimerFunds, Inc. Formerly: Vice President and Principal Financial Officer, The Invesco Funds; Vice President, Invesco AIM Advisers, Inc., Invesco AIM Capital Management, Inc. and Invesco AIM Private Asset Management, Inc.; Assistant Vice President and Assistant Treasurer, The Invesco Funds and Assistant Vice President, Invesco Advisers, Inc., Invesco AIM Capital Management, Inc. and Invesco AIM Private Asset Management, Inc.; and Treasurer, Invesco Exchange-Traded Fund Trust, Invesco Exchange-Traded Fund Trust II, Invesco India Exchange-Traded Fund Trust and Invesco Actively Managed Exchange-Traded Fund Trust | | N/A | | N/A |
Russell C. Burk — 1958 Senior Vice President and Senior Officer | | 2005 | | Senior Vice President and Senior Officer, The Invesco Funds | | N/A | | N/A |
Jeffrey H. Kupor — 1968 Senior Vice President, Chief Legal Officer and Secretary | | 2018 | | Head of Legal of the Americas, Invesco Ltd.; Senior Vice President and Secretary, Invesco Advisers, Inc. (formerly known as Invesco Institutional (N.A.), Inc.) (registered investment adviser); Senior Vice President and Secretary, Invesco Distributors, Inc. (formerly known as Invesco AIM Distributors, Inc.); Vice President and Secretary, Invesco Investment Services, Inc. (formerly known as Invesco AIM Investment Services, Inc.) Senior Vice President, Chief Legal Officer and Secretary, The Invesco Funds; Secretary and General Counsel, Invesco Investment Advisers LLC (formerly known as Van Kampen Asset Management); Secretary and General Counsel, Invesco Capital Markets, Inc. (formerly known as Van Kampen Funds Inc.) and Chief Legal Officer, Invesco Exchange-Traded Fund Trust, Invesco Exchange-Traded Fund Trust II, Invesco India Exchange-Traded Fund Trust, Invesco Actively Managed Exchange-Traded Fund Trust, Invesco Actively Managed Exchange-Traded Commodity Fund Trust and Invesco Exchange-Traded Self-Indexed Fund Trust; Secretary, Invesco Indexing LLC; Secretary, W.L. Ross & Co., LLC Formerly: Secretary and Vice President, Jemstep, Inc.; Head of Legal, Worldwide Institutional, Invesco Ltd.; Secretary and General Counsel, INVESCO Private Capital Investments, Inc.; Senior Vice President, Secretary and General Counsel, Invesco Management Group, Inc. (formerly known as Invesco AIM Management Group, Inc.); Assistant Secretary, INVESCO Asset Management (Bermuda) Ltd.; Secretary and General Counsel, Invesco Private Capital, Inc.; Assistant Secretary and General Counsel, INVESCO Realty, Inc.; Secretary and General Counsel, Invesco Senior Secured Management, Inc.; and Secretary, Sovereign G./P. Holdings Inc. | | N/A | | N/A |
Andrew R. Schlossberg — 1974 Senior Vice President | | 2019 | | Head of the Americas and Senior Managing Director, Invesco Ltd.; Director and Senior Vice President, Invesco Advisers, Inc. (formerly known as Invesco Institutional (N.A.), Inc.) (registered investment adviser); Director and Chairman, Invesco Investment Services, Inc. (formerly known as Invesco AIM Investment Services, Inc.) (registered transfer agent); Senior Vice President, The Invesco Funds; Director, Invesco Investment Advisers LLC (formerly known as Van Kampen Asset Management); Director, President and Chairman, Invesco Insurance Agency, Inc. Formerly: Director, Invesco UK Limited; Director and Chief Executive, Invesco Asset Management Limited and Invesco Fund Managers Limited; Assistant Vice President, The Invesco Funds; Senior Vice President, Invesco Advisers, Inc. (formerly known as Invesco Institutional (N.A.), Inc.) (registered investment adviser); Director and Chief Executive, Invesco Administration Services Limited and Invesco Global Investment Funds Limited; Director, Invesco Distributors, Inc.; Head of EMEA, Invesco Ltd.; President, Invesco Actively Managed Exchange-Traded Commodity Fund Trust, Invesco Actively Managed Exchange-Traded Fund Trust, Invesco Exchange-Traded Fund Trust, Invesco Exchange-Traded Fund Trust II and Invesco India Exchange-Traded Fund Trust; Managing Director and Principal Executive Officer, Invesco Capital Management LLC | | N/A | | N/A |
T-4 Invesco Core Plus Bond Fund
Trustees and Officers—(continued)
| | | | | | | | |
Name, Year of Birth and Position(s) Held with the Trust | | Trustee and/ or Officer Since | | Principal Occupation(s)
During Past 5 Years | | Number of
Funds in Fund
Complex
Overseen by
Trustee | | Other Directorship(s) Held by Trustee During
Past 5 Years |
| Other Officers—(continued) | | | | | | | | |
John M. Zerr — 1962
Senior Vice President | | 2006 | | Chief Operating Officer of the Americas; Senior Vice President, Invesco Advisers, Inc. (formerly known as Invesco Institutional (N.A.), Inc.) (registered investment adviser); Senior Vice President, Invesco Distributors, Inc. (formerly known as Invesco AIM Distributors, Inc.); Director and Vice President, Invesco Investment Services, Inc. (formerly known as Invesco AIM Investment Services, Inc.) Senior Vice President, The Invesco Funds; Managing Director, Invesco Capital Management LLC; Director, Invesco Investment Advisers LLC (formerly known as Van Kampen Asset Management); Senior Vice President, Invesco Capital Markets, Inc. (formerly known as Van Kampen Funds Inc.); Manager, Invesco Indexing LLC; Manager, Invesco Specialized Products, LLC; Director and Senior Vice President, Invesco Insurance Agency, Inc.; Member, Invesco Canada Funds Advisory Board; Director, President and Chief Executive Officer, Invesco Corporate Class Inc. (corporate mutual fund company); and Director, Chairman, President and Chief Executive Officer, Invesco Canada Ltd. (formerly known as Invesco Trimark Ltd./Invesco Trimark Ltèe) (registered investment adviser and registered transfer agent) Formerly: Director and Senior Vice President, Invesco Management Group, Inc. (formerly known as Invesco AIM Management Group, Inc.); Secretary and General Counsel, Invesco Management Group, Inc. (formerly known as Invesco AIM Management Group, Inc.); Secretary, Invesco Investment Services, Inc. (formerly known as Invesco AIM Investment Services, Inc.); Chief Legal Officer and Secretary, The Invesco Funds; Secretary and General Counsel, Invesco Investment Advisers LLC (formerly known as Van Kampen Asset Management); Secretary and General Counsel, Invesco Capital Markets, Inc. (formerly known as Van Kampen Funds Inc.); Chief Legal Officer, Invesco Exchange-Traded Fund Trust, Invesco Exchange-Traded Fund Trust II, Invesco India Exchange-Traded Fund Trust, Invesco Actively Managed Exchange-Traded Fund Trust, Invesco Actively Managed Exchange-Traded Commodity Fund Trust and Invesco Exchange-Traded Self-Indexed Fund Trust; Secretary, Invesco Indexing LLC; Director, Secretary, General Counsel and Senior Vice President, Van Kampen Exchange Corp.; Director, Vice President and Secretary, IVZ Distributors, Inc. (formerly known as INVESCO Distributors, Inc.); Director and Vice President, INVESCO Funds Group, Inc.; Director and Vice President, Van Kampen Advisors Inc.; Director, Vice President, Secretary and General Counsel, Van Kampen Investor Services Inc.; Director and Secretary, Invesco Distributors, Inc. (formerly known as Invesco AIM Distributors, Inc.); Director, Senior Vice President, General Counsel and Secretary, Invesco AIM Advisers, Inc. and Van Kampen Investments Inc.; Director, Vice President and Secretary, Fund Management Company; Director, Senior Vice President, Secretary, General Counsel and Vice President, Invesco AIM Capital Management, Inc.; Chief Operating Officer and General Counsel, Liberty Ridge Capital, Inc. (an investment adviser) | | N/A | | N/A |
Gregory G. McGreevey — 1962 Senior Vice President | | 2012 | | Senior Managing Director, Invesco Ltd.; Director, Chairman, President, and Chief Executive Officer, Invesco Advisers, Inc. (formerly known as Invesco Institutional (N.A.), Inc.) (registered investment adviser); Director, Invesco Mortgage Capital, Inc. and Invesco Senior Secured Management, Inc.; and Senior Vice President, The Invesco Funds; and President, SNW Asset Management Corporation Formerly: Senior Vice President, Invesco Management Group, Inc. and Invesco Advisers, Inc.; Assistant Vice President, The Invesco Funds | | N/A | | N/A |
Kelli Gallegos — 1970 Vice President, Principal Financial Officer and Assistant Treasurer | | 2008 | | Assistant Treasurer, Invesco Specialized Products, LLC; Vice President, Principal Financial Officer and Assistant Treasurer, The Invesco Funds; Principal Financial and Accounting Officer — Pooled Investments, Invesco Capital Management LLC; Vice President and Treasurer, Invesco Exchange-Traded Fund Trust, Invesco Exchange-Traded Fund Trust II, Invesco India Exchange-Traded Fund Trust, Invesco Actively Managed Exchange-Traded Fund Trust, Invesco Actively Managed Exchange-Traded Commodity Fund Trust and Invesco Exchange-Traded Self-Indexed Fund Trust Formerly: Assistant Treasurer, Invesco Exchange-Traded Fund Trust, Invesco Exchange-Traded Fund Trust II, Invesco India Exchange-Traded Fund Trust, Invesco Actively Managed Exchange-Traded Fund Trust, Invesco Actively Managed Exchange-Traded Commodity Fund Trust and Invesco Exchange-Traded Self-Indexed Fund Trust; Assistant Treasurer, Invesco Capital Management LLC; Assistant Vice President, The Invesco Funds | | N/A | | N/A |
T-5 Invesco Core Plus Bond Fund
Trustees and Officers—(continued)
| | | | | | | | |
Name, Year of Birth and Position(s) Held with the Trust | | Trustee and/ or Officer Since | | Principal Occupation(s)
During Past 5 Years | | Number of
Funds in Fund
Complex
Overseen by
Trustee | | Other Directorship(s) Held by Trustee During
Past 5 Years |
| Other Officers—(continued) | | | | | | | | |
Crissie M. Wisdom — 1969 Anti-Money Laundering Compliance Officer | | 2013 | | Anti-Money Laundering Compliance Officer, Invesco Advisers, Inc. (formerly known as Invesco Institutional (N.A.), Inc.) (registered investment adviser), Invesco Capital Markets, Inc. (formerly known as Van Kampen Funds Inc.), Invesco Distributors, Inc., Invesco Investment Services, Inc., The Invesco Funds, and Invesco Exchange-Traded Fund Trust, Invesco Exchange-Traded Fund Trust II, Invesco India Exchange-Traded Fund Trust, Invesco Actively Managed Exchange-Traded Fund Trust, Invesco Actively Managed Exchange-Traded Commodity Fund Trust and Invesco Exchange-Traded Self-Indexed Fund Trust; Anti-Money Laundering Compliance Officer and Bank Secrecy Act Officer, INVESCO National Trust Company and Invesco Trust Company; and Fraud Prevention Manager and Controls and Risk Analysis Manager for Invesco Investment Services, Inc. Formerly: Anti-Money Laundering Compliance Officer, Van Kampen Exchange Corp. and Invesco Management Group, Inc. | | N/A | | N/A |
Robert R. Leveille — 1969 Chief Compliance Officer | | 2016 | | Chief Compliance Officer, Invesco Advisers, Inc. (registered investment adviser); and Chief Compliance Officer, The Invesco Funds Formerly: Chief Compliance Officer, Putnam Investments and the Putnam Funds | | N/A | | N/A |
The Statement of Additional Information of the Trust includes additional information about the Fund’s Trustees and is available upon request, without charge, by calling 1.800.959.4246. Please refer to the Fund’s Statement of Additional Information for information on the Fund’ssub-advisers.
| | | | | | |
Office of the Fund 11 Greenway Plaza, Suite 1000
Houston, TX 77046-1173 | | Investment Adviser Invesco Advisers, Inc.
1555 Peachtree Street, N.E.
Atlanta, GA 30309 | | Distributor Invesco Distributors, Inc.
11 Greenway Plaza, Suite 1000
Houston, TX 77046-1173 | | Auditors PricewaterhouseCoopers LLP
1000 Louisiana Street, Suite 5800 Houston, TX 77002-5021 |
| | | |
| | | | | | |
Counsel to the Fund Stradley Ronon Stevens & Young, LLP
2005 Market Street, Suite 2600
Philadelphia, PA 19103-7018 | | Counsel to the Independent Trustees Goodwin Procter LLP
901 New York Avenue, N.W.
Washington, D.C. 20001 | | Transfer Agent Invesco Investment Services, Inc.
11 Greenway Plaza, Suite 1000
Houston, TX 77046-1173 | | Custodian State Street Bank and Trust Company
225 Franklin Street
Boston, MA 02110-2801 |
T-6 Invesco Core Plus Bond Fund
Go paperless with eDelivery
Visit invesco.com/edelivery to enjoy the convenience and security of anytime electronic access to your investment documents.
With eDelivery, you can elect to have any or all of the following materials delivered straight to your inbox to download, save and print from your own computer:
| • | Fund reports and prospectuses |
| • | Quarterly statements |
| • | Daily confirmations |
| • | Tax forms |
Invesco mailing information
Send general correspondence to Invesco Investment Services, Inc., P.O. Box 219078, Kansas City, MO 64121-9078.
Important notice regarding delivery of security holder documents
To reduce Fund expenses, only one copy of most shareholder documents may be mailed to shareholders with multiple accounts at the same address (Householding). Mailing of your shareholder documents may be householded indefinitely unless you instruct us otherwise. If you do not want the mailing of these documents to be combined with those for other members of your household, please contact Invesco Investment Services, Inc. at 800 959 4246 or contact your financial institution. We will begin sending you individual copies for each account within 30 days after receiving your request.
Fund holdings and proxy voting information
The Fund provides a complete list of its holdings four times in each fiscal year, at the quarter-ends. For the second and fourth quarters, the list appears in the Fund’s semiannual and annual reports to shareholders. For the first and third quarters, the Fund files the lists with the Securities and Exchange Commission (SEC) as an exhibit to its reports on Form N-PORT. The most recent list of portfolio holdings is available at invesco.com/completeqtrholdings. Shareholders can also look up the Fund’s Form N-PORT filings on the SEC website, sec.gov. The SEC file numbers for the Fund are shown below.
A description of the policies and procedures that the Fund uses to determine how to vote proxies relating to portfolio securities is available without charge, upon request, from our Client Services department at 800 959 4246, or at invesco.com/proxyguidelines. The information is also available on the SEC website, sec.gov.
Information regarding how the Fund voted proxies related to its portfolio securities during the most recent 12-month period ended June 30 is available at invesco.com/proxysearch. This information is also available on the SEC website, sec.gov.
Invesco Advisers, Inc. is an investment adviser; it provides investment advisory services to individual and institutional clients and does not sell securities. Invesco Distributors, Inc. is the US distributor for Invesco Ltd.’s retail mutual funds, exchange-traded funds and institutional money market funds. Both are wholly owned, indirect subsidiaries of Invesco Ltd.
| SEC file numbers: 811-09913 and 333-36074 | Invesco Distributors, Inc. | CPB-AR-1 |
| Annual Report to Shareholders | August 31, 2019 |
Invesco Equally-Weighted S&P 500 Fund
Nasdaq:
A: VADAX ■ C: VADCX ■ R: VADRX ■ Y: VADDX ■ R6: VADFX

Beginning on January 1, 2021, as permitted by regulations adopted by the Securities and Exchange Commission, paper copies of the Fund’s shareholder reports will no longer be sent by mail, unless you specifically request paper copies of the reports from the Fund or from your financial intermediary, such as a broker-dealer or bank. Instead, the reports will be made available on the Fund’s website, and you will be notified by mail each time a report is posted and provided with a website link to access the report.
If you already elected to receive shareholder reports electronically, you will not be affected by this change and you need not take any action. You may elect to receive shareholder reports and other communications from the Fund electronically by contacting your financial intermediary (such as a broker-dealer or bank) or, if you are a direct investor, by enrolling at invesco.com/edelivery.
You may elect to receive all future reports in paper free of charge. If you invest through a financial intermediary, you can contact your financial intermediary to request that you continue to receive paper copies of your shareholder reports. If you invest directly with the Fund, you can call (800) 959-4246 to let the Fund know you wish to continue receiving paper copies of your shareholder reports. Your election to receive reports in paper will apply to all funds held with your financial intermediary or all funds held with the fund complex if you invest directly with the Fund.
Dear Shareholders:
This annual report includes information about your Fund, including performance data and a complete list of its investments as of the close of the reporting period. Inside is a discussion of how your Fund was managed and the factors that affected its performance during the reporting period.
Throughout the reporting period, global equity markets remained volatile. Investor sentiment ranged from elation to fear. The reporting period began with several US equity indexes redefining new highs. The exuberance, however, ended in October 2018 as global equities, in particular US stocks, sold off, with the sharpest decline in December. The catalyst for the sell-off was a combination of ongoing trade concerns between the US and China, fears of a global economic slowdown and lower oil prices from a supply glut. Gains posted earlier in 2018 for global equities were erased, while US Treasury bonds, along with government and municipal bonds, rallied as investors fled to “safe haven” assets.
At the start of 2019, global equity markets rebounded strongly buoyed by more dovish central banks and optimism about a potential US-China trade deal. In May, US-China trade concerns and slowing global growth led to a global equity sell-off and rally in U.S. Treasuries. Despite the May sell-off, domestic equity markets rallied in June in anticipation of a U.S. Federal Reserve (the Fed) rate cut and closed the second quarter with modest gains. As the reporting period ended in August, market volatility once again increased as the US Treasury yield curve inverted several times magnifying concerns that the US economy could be headed into a recession.
During the reporting period, the Fed both raised and lowered the federal funds rate. Given signs of a strong economy, the Fed raised rates two times: in September and December 2018. In 2019, however, the Fed altered its outlook on further rate hikes leaving rates unchanged for the first half of the year. In July, the Fed lowered interest rates for the first time in 11 years. As 2019 unfolds, we’ll see how the interplay of interest rates, economic data, geopolitics and a host of other factors affect US and overseas equity and fixed income markets.
Investor uncertainty and market volatility, such as we witnessed during the reporting period, are unfortunate facts of life when it comes to investing. That’s why Invesco encourages investors to work with a professional financial adviser who can stress the importance of starting to save and invest early and the importance of adhering to a disciplined investment plan. A financial adviser who knows your unique financial situation, investment goals and risk tolerance can be an invaluable partner as you seek to achieve your financial goals. He or she can offer a long-term perspective when markets are volatile and time-tested advice and guidance when your financial situation or investment goals change.
Visit our website for more information on your investments
Our website, invesco.com/us, offers a wide range of market insights and investment perspectives. On the website, you’ll find detailed information about our funds, including performance, holdings and portfolio manager commentaries. You can access information about your account by completing a simple, secure online registration. To do so, select “Log In” on the right side of the homepage, and then select “Register for Individual Account Access.”
In addition to the resources accessible on our website and through our mobile app, you can obtain timely updates to help you stay informed about the markets and the economy by connecting with Invesco on Twitter, LinkedIn or Facebook. You can access our blog at blog.invesco.us.com. Our goal is to provide you the information you want, when and where you want it.
Finally, I’m pleased to share with you Invesco’s commitment to both the Principles for Responsible Investment and to considering environmental, social and governance issues in our robust investment process. I invite you to learn more at invesco.com/esg.
Have questions?
For questions about your account, contact an Invesco client services representative at 800 959 4246.
All of us at Invesco look forward to serving your investment management needs. Thank you for investing with us.
Sincerely,
Andrew Schlossberg
Head of the Americas,
Senior Managing Director, Invesco Ltd.
| 2 | Invesco Equally-Weighted S&P 500 Fund |
Dear Shareholders:
Among the many important lessons I’ve learned in more than 40 years in a variety of business endeavors is the value of a trusted advocate.
As independent chair of the Invesco Funds Board, I can assure you that the members of the Board are strong advocates for the interests of investors in Invesco’s mutual funds. We work hard to represent your interests through oversight of the quality of the investment management services your funds receive and other matters important to your investment, including but not limited to:
| ■ | Ensuring that Invesco offers a diverse lineup of mutual funds that your financial adviser can use to strive to meet your financial needs as your investment goals change over time. |
| ■ | Monitoring how the portfolio management teams of the Invesco funds are performing in light of changing economic and market conditions. |
| ■ | Assessing each portfolio management team’s investment performance within the context of the investment strategy described in the fund’s prospectus. |
| ■ | Monitoring for potential conflicts of interests that may impact the nature of the services that your funds receive. |
We believe one of the most important services we provide our fund shareholders is the annual review of the funds’ advisory and sub-advisory contracts with Invesco Advisers and its affiliates. This review is required by the Investment Company Act of 1940 and focuses on the nature and quality of the services Invesco provides as the adviser to the Invesco funds and the reasonableness of the fees that it charges for those services. Each year, we spend months carefully reviewing information received from Invesco and a variety of independent sources, such as performance and fee data prepared by Lipper, Inc. (a subsidiary of Broadridge Financial Solutions, Inc.), an independent, third-party firm widely recognized as a leader in its field. We also meet with our independent legal counsel and other independent advisers to review and help us assess the information that we have received. Our goal is to assure that you receive quality investment management services for a reasonable fee.
I trust the measures outlined above provide assurance that you have a worthy advocate when it comes to choosing the Invesco Funds.
As always, please contact me at bruce@brucecrockett.com with any questions or concerns you may have. On behalf of the Board, we look forward to continuing to represent your interests and serving your needs.
Sincerely,
Bruce L. Crockett
Independent Chair
Invesco Funds Board of Trustees
| 3 | Invesco Equally-Weighted S&P 500 Fund |
Management’s Discussion of Fund Performance
Performance summary
For the fiscal year ended August 31, 2019, Class A shares of Invesco Equally-Weighted S&P 500 Fund (the Fund), at net asset value (NAV), underperformed the S&P 500 Equal Weight Index, the Fund’s style-specific benchmark.
Your Fund’s long-term performance appears later in this report.
Fund vs. Indexes
Total returns, August 31, 2018 to August 31, 2019, at net asset value (NAV). Performance shown does not include applicable contingent deferred sales charges (CDSC) or front-end sales charges, which would have reduced performance.
| Class A Shares | –0.09% |
| Class C Shares | –0.83 |
| Class R Shares | –0.33 |
| Class Y Shares | 0.18 |
| Class R6 Shares | 0.29 |
| S&P 500 Index▼ (Broad Market Index) | 2.92 |
| S&P 500 Equal Weight Index▼ (Style-Specific Index) | 0.42 |
| Lipper Multi-Cap Core Funds Index■ (Peer Group Index) | –0.85 |
| Source(s):▼RIMES Technologies Corp.; ■Lipper Inc. |
Market conditions and your Fund
The fiscal year proved to be an increasingly volatile time for US equities. After a relatively quiet summer, market volatility noticeably rose in October 2018, as US equity markets suffered a sharp sell-off through year-end 2018, amid ongoing trade concerns between the US and China, fears of a global economic slowdown and lower oil prices from a supply glut, with oil prices plummeting from near $75 per barrel in early October 2018 to around $45 per barrel in late December 2018.1 In this environment, there was a flight to safety, as investors fled to defensive areas of the markets, such as health care, utilities and US Treasuries.
Given signs of a strong economy, the US Federal Reserve (the Fed) raised interest rates two times during the fiscal year: in September and December 2018.2 In contrast, the European Central Bank and central banks in several other
countries maintained extraordinarily accommodative monetary policies.
Following a sharp sell-off during the fourth quarter of 2018, equity markets rebounded in the first quarter of 2019, fueled by optimism about a potential US-China trade deal and the Fed’s indication that there would be no interest rate hikes in 2019, a surprising shift in monetary policy. The Fed’s more accommodative stance provided a supportive environment for equities and fixed income, even as US economic data were mixed and overseas growth appeared to be slowing. Against this backdrop, the S&P 500 Index posted its best first quarter returns since 1998.
Although the S&P 500 Index posted modest gains for the second quarter of 2019, the US stock market experienced increased volatility. After four consecutive months of rising stock markets, the market sold off in May 2019, along with bond yields and oil prices, as investors weighed the impact of the lingering trade
war between the US and China, as well as potential tariffs imposed on Mexico. In addition, economic data showed a slowing domestic and global economy. During the July 2019 meeting, the Fed lowered rates by 25 basis points. (A basis point is one one-hundredth of a percentage point.) This was the first time the Fed lowered rates in more than a decade.2
Market volatility increased in August 2019, as the US Treasury yield curve inverted several times, causing jitters for investors who were concerned that a US recession would be imminent. As a result, much of August saw a “risk off” sentiment, with investors crowding into perceived “safe haven” asset classes, such as US Treasuries and gold. However, a more dovish tone from the Fed provided some support to risk assets. With rising volatility in the markets, the S&P 500 Index posted a modestly positive return for the fiscal year.
The Fund generally invests in each common stock included in the S&P 500 Index in approximately equal proportions, which differs from the market capitalization weighted approach of the S&P 500 Index. Due to the equally weighted nature of the Fund and the capitalization weighted nature of the S&P 500 Index, the Fund will lag the S&P 500 Index when large-cap stocks outperform mid-cap stocks or when market leadership is narrow.
During the fiscal year, on an absolute basis, holdings in the consumer staples, information technology (IT), real estate and utilities sectors generated positive Fund performance.
Key detractors from the Fund’s performance relative to the S&P 500 Index during the fiscal year included select holdings in the consumer discretionary, energy, IT, consumer staples and communication services sectors. Equally
| Portfolio Composition |
| By sector | % of total net assets |
| Information Technology | 14.13% |
| Industrials | 13.74 |
| Financials | 13.21 |
| Health Care | 12.39 |
| Consumer Discretionary | 11.64 |
| Consumer Staples | 6.65 |
| Real Estate | 6.52 |
| Utilities | 5.76 |
| Materials | 5.49 |
| Energy | 5.25 |
| Communication Services | 4.59 |
| Money Market Funds Plus Other Assets Less Liabilities | 0.63 |
| Top 10 Equity Holdings* |
| % of total net assets |
| 1. | Western Digital Corp. | 0.31% |
| 2. | Micron Technology, Inc. | 0.28 |
| 3. | Allergan PLC | 0.27 |
| 4. | KLA Corp. | 0.27 |
| 5. | Ball Corp. | 0.25 |
| 6. | MarketAxess Holdings, Inc. | 0.25 |
| 7. | Target Corp. | 0.24 |
| 8. | Edison International | 0.24 |
| 9. | Edwards Lifesciences Corp. | 0.24 |
| 10. | Symantec Corp. | 0.24 |
| Total Net Assets | $7.4 billion |
| Total Number of Holdings* | 505 |
| The Fund’s holdings are subject to change, and there is no assurance that the Fund will continue to hold any particular security. |
| *Excluding money market fund holdings. |
| Data presented here are as of August 31, 2019. |
| 4 | Invesco Equally-Weighted S&P 500 Fund |
weighing the stocks in these sectors detracted from the Fund’s relative performance.
The Fund’s underweight exposure to mega-cap and large-cap stocks within the S&P 500 Index also was a damper on its relative performance.
The top contributor to Fund results during the fiscal year was metal packaging makerBall Corp. The company delivered strong performance during the fiscal year and reported solid revenue growth. Also delivering returns of over 75% for the fiscal year wereChipotle Mexican Grilland Starbucks.3
PG&E was the largest detractor from the Fund’s performance relative to the S&P 500 Index during the fiscal year. PG&E sought Chapter 11 bankruptcy protection earlier in 2019 after severe wildfires in 2017 and 2018 resulted in more than $30 billion in liabilities.3
Pharmaceutical companyNektar Therapeutics also detracted from the Fund’s performance versus the S&P 500 Index during the fiscal year. The company’s stock price struggled due to negative revenue growth.
Please note that the Fund’s strategy is principally implemented through equity investments, but the Fund also may use derivative instruments, including S&P 500 futures contracts, to gain exposure to the equity market. During the fiscal year, the Fund invested in S&P 500 futures contracts, which generated a positive return and added to the Fund’s absolute performance. Derivatives can be a cost-effective way to gain exposure to asset classes. However, derivatives may amplify traditional investment risks through the creation of leverage and may be less liquid than traditional securities.
Thank you for your investment in Invesco Equally-Weighted S&P 500 Index Fund.
| 2 | Source: US Federal Reserve |
The views and opinions expressed in management’s discussion of Fund performance are those of Invesco Advisers, Inc. These views and opinions are subject to change at any time based on factors such as market and economic conditions. These views and opinions may not be relied upon as investment advice or recommendations, or as an offer for a particular security. The information is not a complete analysis of every aspect of any market, country, industry, security or the Fund. Statements of fact are from sources considered reliable, but Invesco Advisers, Inc. makes no representation or warranty as to their completeness or accuracy. Although historical performance is no guarantee of future results,
these insights may help you understand our investment management philosophy.
See important Fund and, if applicable, index disclosures later in this report.
Anthony Munchak
Chartered Financial Analyst, Portfolio Manager, is manager of Invesco Equally-Weighted S&P 500 Fund. He joined Invesco in 2000. Mr. Munchak earned a BS and an MS in finance from Boston College and an MBA from Bentley College.
Glen Murphy
Chartered Financial Analyst, Portfolio Manager, is manager of Invesco Equally-Weighted S&P 500 Fund. He joined Invesco in 1995. Mr. Murphy earned a BA from the University of Massachusetts at Amherst and an MS in finance from Boston College.
Francis Orlando
Chartered Financial Analyst, Portfolio Manager, is manager of Invesco Equally-Weighted S&P 500 Fund. He joined Invesco in 1987. Mr. Orlando earned a BA in business administration from Merrimack College and an MBA from Boston University.
Daniel Tsai
Chartered Financial Analyst, Portfolio Manager, is manager of Invesco Equally-Weighted S&P 500 Fund. He joined Invesco in 2000. Mr. Tsai earned a BS in mechanical engineering from National Taiwan University, an MS in mechanical engineering from the University of Michigan and an MS in computer science from Wayne State University.
Anne Unflat
Portfolio Manager, is manager of Invesco Equally-Weighted S&P 500 Fund. She joined Invesco in 1988. Ms. Unflat earned a BA in economics from Queens College and an MBA in finance from St. John’s University.
| 5 | Invesco Equally-Weighted S&P 500 Fund |
Your Fund’s Long-Term Performance
Results of a $10,000 Investment — Oldest Share Class(es)
Fund and index data from 8/31/09
| 1 | Source: RIMES Technologies Corp. |
| 2 | Source: Lipper Inc. |
Past performance cannot guarantee comparable future results.
The data shown in the chart include reinvested distributions, applicable sales charges and Fund expenses including
management fees. Index results include reinvested dividends, but they do not reflect sales charges. Performance of the peer group, if applicable, reflects fund expenses and management fees; perfor-
mance of a market index does not. Performance shown in the chart and table(s) does not reflect deduction of taxes a shareholder would pay on Fund distributions or sale of Fund shares.
| 6 | Invesco Equally-Weighted S&P 500 Fund |
| Average Annual Total Returns |
| As of 8/31/19, including maximum applicable sales charges |
| Class A Shares | |
| Inception (7/28/97) | 8.30% |
| 10 Years | 12.37 |
| 5 Years | 6.44 |
| 1 Year | –5.59 |
| Class C Shares | |
| Inception (7/28/97) | 8.21% |
| 10 Years | 12.18 |
| 5 Years | 6.88 |
| 1 Year | –1.77 |
| Class R Shares | |
| Inception (3/31/08) | 9.42% |
| 10 Years | 12.72 |
| 5 Years | 7.38 |
| 1 Year | –0.33 |
| Class Y Shares | |
| Inception (7/28/97) | 8.84% |
| 10 Years | 13.28 |
| 5 Years | 7.92 |
| 1 Year | 0.18 |
| Class R6 Shares | |
| 10 Years | 13.28% |
| 5 Years | 8.05 |
| 1 Year | 0.29 |
Effective June 1, 2010, Class A, Class C, Class R, Class W and Class I shares of the predecessor fund, Morgan Stanley Equally-Weighted S&P 500 Fund, advised by Morgan Stanley Investment Advisors Inc. were reorganized into Class A, Class C, Class R, Class A and Class Y shares, respectively, of Invesco Equally-Weighted S&P 500 Fund. Returns shown above, prior to June 1, 2010, for Class A, Class C, Class R and Class Y shares are blended returns of the predecessor fund and Invesco Equally-Weighted S&P 500 Fund. Share class returns will differ from the predecessor fund because of different expenses.
Class R6 shares incepted on September 24, 2012. Performance shown prior to that date is that of the Fund’s and the predecessor fund’s Class A shares and includes the 12b-1 fees applicable to Class A shares.
The performance data quoted represent past performance and cannot guarantee comparable future results; current performance may be lower or higher. Please visit invesco.com/performance for the most recent month-end performance. Performance figures reflect reinvested distributions,
| Average Annual Total Returns |
| As of 6/30/19, the most recent calendar quarter end, including maximum applicable sales charges |
| Class A Shares | |
| Inception (7/28/97) | 8.48% |
| 10 Years | 14.25 |
| 5 Years | 7.33 |
| 1 Year | 1.72 |
| Class C Shares | |
| Inception (7/28/97) | 8.40% |
| 10 Years | 14.06 |
| 5 Years | 7.76 |
| 1 Year | 5.81 |
| Class R Shares | |
| Inception (3/31/08) | 9.81% |
| 10 Years | 14.61 |
| 5 Years | 8.27 |
| 1 Year | 7.35 |
| Class Y Shares | |
| Inception (7/28/97) | 9.02% |
| 10 Years | 15.18 |
| 5 Years | 8.81 |
| 1 Year | 7.90 |
| Class R6 Shares | |
| 10 Years | 15.17% |
| 5 Years | 8.95 |
| 1 Year | 8.03 |
changes in net asset value and the effect of the maximum sales charge unless otherwise stated. Investment return and principal value will fluctuate so that you may have a gain or loss when you sell shares.
The total annual Fund operating expense ratio set forth in the most recent Fund prospectus as of the date of this report for Class A, Class C, Class R, Class Y and Class R6 shares was 0.53%, 1.21%, 0.78%, 0.28% and 0.16%, respectively. The expense ratios presented above may vary from the expense ratios presented in other sections of this report that are based on expenses incurred during the period covered by this report.
Class A share performance reflects the maximum 5.50% sales charge, and Class C share performance reflects the applicable contingent deferred sales charge (CDSC) for the period involved. The CDSC on Class C shares is 1% for the first year after purchase. Class R, Class Y and Class R6 shares do not have a front-end sales charge or a CDSC; therefore, performance is at net asset value.
The performance of the Fund’s share classes will differ primarily due to dif-
ferent sales charge structures and class expenses.
Fund performance reflects any applicable fee waivers and/or expense reimbursements. Had the adviser not waived fees and/or reimbursed expenses currently or in the past, returns would have been lower. See current prospectus for more information.
| 7 | Invesco Equally-Weighted S&P 500 Fund |
Invesco Equally-Weighted S&P 500 Fund’s investment objective is total return through growth of capital and current income.
| ■ | Unless otherwise stated, information presented in this report is as of August 31, 2019, and is based on total net assets. |
| ■ | Unless otherwise noted, all data provided by Invesco. |
| ■ | To access your Fund’s reports/prospectus, visit invesco.com/fundreports. |
About share classes
| ■ | Class R sharesare generally available only to employer sponsored retirement and benefit plans. Please see the prospectus for more information. |
| ■ | Class Y sharesare available only to certain investors. Please see the prospectus for more information. |
| ■ | Class R6 shares are available for use by retirement plans that meet certain standards and for institutional investors. Class R6 shares are also available through intermediaries that have established an agreement with Invesco Distributors, Inc. to make such shares available for use in retail omnibus accounts. Please see the prospectus for more information. |
Principal risks of investing in the Fund
| ■ | Depositary receipts risk. Investing in depositary receipts involves the same risks as direct investments in foreign securities. In addition, the underlying issuers of certain depositary receipts are under no obligation to distribute shareholder communications or pass through any voting rights with respect to the deposited securities to the holders of such receipts. The Fund may therefore receive less timely information or have less control than if it invested directly in the foreign issuer. |
| ■ | Derivatives risk. The value of a derivative instrument depends largely on (and is derived from) the value of an underlying security, currency, commodity, interest rate, index or other asset (each referred to as an underlying asset). In addition to risks relating to the underlying assets, the use of derivatives may include other, possibly greater, risks, including counterparty, leverage and liquidity risks. Counterparty risk is the risk that the counterparty to the derivative contract will default on its obligation to pay the Fund the amount owed or otherwise perform under the deriva- |
| | tive contract. Derivatives create leverage risk because they do not require payment up front equal to the economic exposure created by holding a position in the derivative. As a result, an adverse change in the value of the underlying asset could result in the Fund sustaining a loss that is substantially greater than the amount invested in the derivative or the anticipated value of the underlying asset, which may make the Fund’s returns more volatile and increase the risk of loss. Derivative instruments may also be less liquid than more traditional investments and the Fund may be unable to sell or close out its derivative positions at a desirable time or price. This risk may be more acute under adverse market conditions, during which the Fund may be most in need of liquidating its derivative positions. Derivatives may also be harder to value, less tax efficient and subject to changing government regulation that could impact the Fund’s ability to use certain derivatives or their cost. Derivatives strategies may not always be successful. For example, derivatives used for hedging or to gain or limit exposure to a particular market segment may not provide the expected benefits, particularly during adverse market conditions. |
| ■ | Emerging markets securities risk. Emerging markets (also referred to as developing markets) are generally subject to greater market volatility, political, social and economic instability, uncertain trading markets and more governmental limitations on foreign investment than more developed markets. In addition, companies operating in emerging markets may be subject to lower trading volume and greater price fluctuations than companies in more developed markets. Securities law and the enforcement of systems of taxation in many emerging market countries may change quickly and unpredictably. In addition, invest- |
| | ments in emerging markets securities may also be subject to additional transaction costs, delays in settlement procedures, and lack of timely information. |
| ■ | Foreign securities risk. The Fund’s foreign investments may be adversely affected by political and social instability, changes in economic or taxation policies, difficulty in enforcing obligations, decreased liquidity or increased volatility. Foreign investments also involve the risk of the possible seizure, nationalization or expropriation of the issuer or foreign deposits (in which the Fund could lose its entire investments in a certain market) and the possible adoption of foreign governmental restrictions such as exchange controls. Unless the Fund has hedged its foreign securities risk, foreign securities risk also involves the risk of negative foreign currency rate fluctuations, which may cause the value of securities denominated in such foreign currency (or other instruments through which the Fund has exposure to foreign currencies) to decline in value. Currency exchange rates may fluctuate significantly over short periods of time. Currency hedging strategies, if used, are not always successful. |
| ■ | Indexing risk. The Fund is operated as a passively managed index fund and, therefore, the adverse performance of a particular security necessarily will not result in the elimination of the security from the Fund’s portfolio. Ordinarily, the Adviser will not sell the Fund’s portfolio securities except to reflect additions or deletions of the securities that comprise the Index, or as may be necessary to raise cash to pay Fund shareholders who sell Fund shares. As such, the Fund will be negatively affected by declines in the securities represented by the Index. Also, there is no guarantee that the |
This report must be accompanied or preceded by a currently effective Fund prospectus, which contains more complete information, including sales charges and expenses. Investors should read it carefully before investing.
NOT FDIC INSURED | MAY LOSE VALUE | NO BANK GUARANTEE
| 8 | Invesco Equally-Weighted S&P 500 Fund |
| | Adviser will be able to correlate the Fund’s performance with that of the Index. |
| ■ | Market risk. The market values of the Fund’s investments, and therefore the value of the Fund’s shares, will go up and down, sometimes rapidly or unpredictably. Market risk may affect a single issuer, industry or section of the economy, or it may affect the market as a whole. Individual stock prices tend to go up and down more dramatically than those of certain other types of investments, such as bonds. During a general downturn in the financial markets, multiple asset classes may decline in value. When markets perform well, there can be no assurance that specific investments held by the Fund will rise in value. |
About indexes used in this report
| ■ | TheS&P 500® Index is an unmanaged index considered representative of the US stock market. |
| ■ | TheS&P 500® Equal Weight Index is the equally weighted version of the S&P 500 Index. |
| ■ | TheLipper Multi-Cap Core Funds Index is an unmanaged index considered representative of multicap core funds tracked by Lipper. |
| ■ | A direct investment cannot be made in an index. Unless otherwise indicated, index results include reinvested dividends, and they do not reflect sales charges. Performance of the peer group, if applicable, reflects fund expenses; performance of a market index does not. |
Other information
| ■ | The returns shown in management’s discussion of Fund performance are based on net asset values (NAVs) calculated for shareholder transactions. Generally accepted accounting principles require adjustments to be made to the net assets of the Fund at period end for financial reporting purposes, and as such, the NAVs for shareholder transactions and the returns based on those NAVs may differ from the NAVs and returns reported in the Financial Highlights. |
| ■ | Industry classifications used in this report are generally according to the Global Industry Classification Standard, which was developed by and is the exclusive property and a service mark of MSCI Inc. and Standard & Poor’s. |
| 9 | Invesco Equally-Weighted S&P 500 Fund |
Schedule of Investments(a)
August 31, 2019
| | Shares | Value |
| Common Stocks & Other Equity Interests–99.37% |
| Advertising–0.37% |
| Interpublic Group of Cos., Inc. (The) | 667,141 | $13,262,763 |
| Omnicom Group, Inc. | 185,531 | 14,111,488 |
| | | | 27,374,251 |
| Aerospace & Defense–2.35% |
| Arconic, Inc. | 640,723 | 16,556,282 |
| Boeing Co. (The) | 42,411 | 15,441,421 |
| General Dynamics Corp. | 85,977 | 16,444,821 |
| Huntington Ingalls Industries, Inc. | 68,549 | 14,326,741 |
| L3Harris Technologies, Inc. | 77,249 | 16,331,211 |
| Lockheed Martin Corp. | 42,050 | 16,151,826 |
| Northrop Grumman Corp. | 47,583 | 17,504,358 |
| Raytheon Co. | 83,020 | 15,385,266 |
| Textron, Inc. | 297,751 | 13,398,795 |
| TransDigm Group, Inc.(b) | 31,137 | 16,761,670 |
| United Technologies Corp. | 117,507 | 15,304,112 |
| | | | 173,606,503 |
| Agricultural & Farm Machinery–0.20% |
| Deere & Co. | 97,179 | 15,053,999 |
| Agricultural Products–0.19% |
| Archer-Daniels-Midland Co. | 360,965 | 13,734,718 |
| Air Freight & Logistics–0.82% |
| C.H. Robinson Worldwide, Inc. | 175,911 | 14,862,720 |
| Expeditors International of Washington, Inc. | 199,050 | 14,152,455 |
| FedEx Corp. | 89,478 | 14,192,106 |
| United Parcel Service, Inc., Class B | 144,890 | 17,192,647 |
| | | | 60,399,928 |
| Airlines–0.95% |
| Alaska Air Group, Inc. | 233,266 | 13,930,645 |
| American Airlines Group, Inc. | 450,544 | 11,853,813 |
| Delta Air Lines, Inc. | 262,972 | 15,215,560 |
| Southwest Airlines Co. | 284,133 | 14,865,839 |
| United Airlines Holdings, Inc.(b) | 169,005 | 14,248,811 |
| | | | 70,114,668 |
| Alternative Carriers–0.20% |
| CenturyLink, Inc. | 1,326,470 | 15,095,229 |
| Apparel Retail–0.73% |
| Gap, Inc. (The) | 809,891 | 12,788,179 |
| L Brands, Inc. | 654,101 | 10,799,208 |
| Ross Stores, Inc. | 145,823 | 15,458,696 |
| TJX Cos., Inc. (The) | 276,037 | 15,173,754 |
| | | | 54,219,837 |
| | Shares | Value |
| Apparel, Accessories & Luxury Goods–1.12% |
| Capri Holdings Ltd.(b) | 439,385 | $11,590,976 |
| Hanesbrands, Inc. | 887,511 | 12,123,400 |
| PVH Corp. | 167,220 | 12,675,276 |
| Ralph Lauren Corp. | 131,310 | 11,599,926 |
| Tapestry, Inc. | 498,436 | 10,292,704 |
| Under Armour, Inc., Class A(b) | 285,771 | 5,318,198 |
| Under Armour, Inc., Class C(b) | 292,997 | 4,957,509 |
| VF Corp. | 168,734 | 13,827,751 |
| | | | 82,385,740 |
| Application Software–1.65% |
| Adobe, Inc.(b) | 53,681 | 15,272,781 |
| ANSYS, Inc.(b) | 74,690 | 15,427,967 |
| Autodesk, Inc.(b) | 93,093 | 13,295,542 |
| Cadence Design Systems Inc.(b) | 217,421 | 14,888,990 |
| Citrix Systems, Inc. | 152,121 | 14,144,211 |
| Intuit, Inc. | 57,937 | 16,706,713 |
| salesforce.com, inc.(b) | 98,151 | 15,318,427 |
| Synopsys, Inc.(b) | 117,978 | 16,730,460 |
| | | | 121,785,091 |
| Asset Management & Custody Banks–1.62% |
| Affiliated Managers Group, Inc. | 166,634 | 12,769,163 |
| Ameriprise Financial, Inc. | 95,901 | 12,369,311 |
| Bank of New York Mellon Corp. (The) | 330,946 | 13,919,589 |
| BlackRock, Inc. | 32,941 | 13,919,549 |
| Franklin Resources, Inc. | 441,361 | 11,598,967 |
| Invesco Ltd.(c) | 713,363 | 11,199,799 |
| Northern Trust Corp. | 168,909 | 14,852,168 |
| State Street Corp. | 265,964 | 13,646,613 |
| T. Rowe Price Group, Inc. | 138,982 | 15,374,189 |
| | | | 119,649,348 |
| Auto Parts & Equipment–0.38% |
| Aptiv PLC | 195,457 | 16,256,159 |
| BorgWarner, Inc. | 359,555 | 11,732,279 |
| | | | 27,988,438 |
| Automobile Manufacturers–0.39% |
| Ford Motor Co. | 1,475,332 | 13,528,794 |
| General Motors Co. | 412,894 | 15,314,239 |
| | | | 28,843,033 |
| Automotive Retail–0.77% |
| Advance Auto Parts, Inc. | 96,994 | 13,380,322 |
| AutoZone, Inc.(b) | 13,147 | 14,483,918 |
| CarMax, Inc.(b) | 176,248 | 14,677,934 |
| O’Reilly Automotive, Inc.(b) | 37,951 | 14,564,076 |
| | | | 57,106,250 |
See accompanying Notes to Financial Statements which are an integral part of the financial statements.
| 10 | Invesco Equally-Weighted S&P 500 Fund |
| | Shares | Value |
| Biotechnology–1.77% |
| AbbVie, Inc. | 187,111 | $12,300,677 |
| Alexion Pharmaceuticals, Inc.(b) | 124,851 | 12,579,987 |
| Amgen, Inc. | 83,619 | 17,444,596 |
| Biogen, Inc.(b) | 64,671 | 14,211,452 |
| Celgene Corp.(b) | 152,562 | 14,768,002 |
| Gilead Sciences, Inc. | 221,877 | 14,098,064 |
| Incyte Corp.(b) | 189,470 | 15,502,435 |
| Regeneron Pharmaceuticals, Inc.(b) | 48,236 | 13,990,852 |
| Vertex Pharmaceuticals, Inc.(b) | 86,498 | 15,571,370 |
| | | | 130,467,435 |
| Brewers–0.19% |
| Molson Coors Brewing Co., Class B | 272,663 | 14,003,972 |
| Broadcasting–0.55% |
| CBS Corp., Class B | 300,547 | 12,641,007 |
| Discovery, Inc., Class A(b)(d) | 162,459 | 4,483,868 |
| Discovery, Inc., Class C(b) | 372,921 | 9,707,134 |
| Fox Corp., Class A | 286,850 | 9,514,815 |
| Fox Corp., Class B | 132,013 | 4,330,026 |
| | | | 40,676,850 |
| Building Products–1.00% |
| A.O. Smith Corp. | 323,386 | 15,043,916 |
| Allegion PLC | 138,877 | 13,369,689 |
| Fortune Brands Home & Security, Inc. | 272,612 | 13,919,569 |
| Johnson Controls International PLC | 368,555 | 15,733,613 |
| Masco Corp. | 384,534 | 15,662,070 |
| | | | 73,728,857 |
| Cable & Satellite–0.60% |
| Charter Communications, Inc., Class A(b) | 37,552 | 15,380,924 |
| Comcast Corp., Class A | 347,998 | 15,402,391 |
| DISH Network Corp., Class A(b) | 392,216 | 13,162,769 |
| | | | 43,946,084 |
| Casinos & Gaming–0.39% |
| MGM Resorts International | 532,314 | 14,936,731 |
| Wynn Resorts, Ltd. | 127,357 | 14,028,373 |
| | | | 28,965,104 |
| Commodity Chemicals–0.34% |
| Dow, Inc. | 287,855 | 12,271,259 |
| LyondellBasell Industries N.V., Class A | 170,217 | 13,171,391 |
| | | | 25,442,650 |
| Communications Equipment–0.95% |
| Arista Networks, Inc.(b) | 62,367 | 14,133,609 |
| Cisco Systems, Inc. | 268,928 | 12,588,520 |
| F5 Networks, Inc.(b) | 107,527 | 13,841,951 |
| Juniper Networks, Inc. | 552,695 | 12,800,416 |
| Motorola Solutions, Inc. | 91,822 | 16,611,518 |
| | | | 69,976,014 |
| | Shares | Value |
| Computer & Electronics Retail–0.19% |
| Best Buy Co., Inc. | 222,986 | $14,193,059 |
| Construction & Engineering–0.41% |
| Jacobs Engineering Group, Inc. | 188,043 | 16,709,501 |
| Quanta Services, Inc. | 389,725 | 13,211,677 |
| | | | 29,921,178 |
| Construction Machinery & Heavy Trucks–0.76% |
| Caterpillar, Inc. | 115,725 | 13,771,275 |
| Cummins, Inc. | 89,855 | 13,412,656 |
| PACCAR, Inc. | 210,279 | 13,785,891 |
| Wabtec Corp. | 216,526 | 14,985,765 |
| | | | 55,955,587 |
| Construction Materials–0.44% |
| Martin Marietta Materials, Inc. | 65,736 | 16,681,825 |
| Vulcan Materials Co. | 111,046 | 15,685,247 |
| | | | 32,367,072 |
| Consumer Electronics–0.20% |
| Garmin Ltd. | 184,531 | 15,052,194 |
| Consumer Finance–0.78% |
| American Express Co. | 120,686 | 14,526,974 |
| Capital One Financial Corp. | 162,568 | 14,081,640 |
| Discover Financial Services | 190,107 | 15,202,857 |
| Synchrony Financial | 433,691 | 13,899,796 |
| | | | 57,711,267 |
| Copper–0.17% |
| Freeport-McMoRan, Inc. | 1,382,518 | 12,705,340 |
| Data Processing & Outsourced Services–2.91% |
| Alliance Data Systems Corp. | 105,319 | 12,948,971 |
| Automatic Data Processing, Inc. | 88,943 | 15,106,079 |
| Broadridge Financial Solutions, Inc. | 113,128 | 14,643,288 |
| Fidelity National Information Services, Inc. | 121,282 | 16,521,034 |
| Fiserv, Inc.(b) | 165,065 | 17,652,051 |
| FleetCor Technologies, Inc.(b) | 54,000 | 16,113,600 |
| Global Payments, Inc. | 92,712 | 15,388,338 |
| Jack Henry & Associates, Inc. | 106,840 | 15,487,527 |
| Mastercard, Inc., Class A | 56,607 | 15,927,512 |
| Paychex, Inc. | 169,863 | 13,877,807 |
| PayPal Holdings, Inc.(b) | 126,742 | 13,821,215 |
| Total System Services, Inc. | 115,688 | 15,527,643 |
| Visa, Inc., Class A | 86,783 | 15,692,102 |
| Western Union Co. (The) | 732,892 | 16,211,571 |
| | | | 214,918,738 |
| Department Stores–0.51% |
| Kohl’s Corp. | 308,222 | 14,566,572 |
| Macy’s, Inc. | 682,922 | 10,079,929 |
| Nordstrom, Inc.(d) | 451,512 | 13,080,302 |
| | | | 37,726,803 |
See accompanying Notes to Financial Statements which are an integral part of the financial statements.
| 11 | Invesco Equally-Weighted S&P 500 Fund |
| | Shares | Value |
| Distillers & Vintners–0.43% |
| Brown-Forman Corp., Class B | 261,710 | $15,438,273 |
| Constellation Brands, Inc., Class A | 78,472 | 16,035,753 |
| | | | 31,474,026 |
| Distributors–0.37% |
| Genuine Parts Co. | 143,046 | 12,915,623 |
| LKQ Corp.(b) | 561,121 | 14,740,649 |
| | | | 27,656,272 |
| Diversified Banks–0.99% |
| Bank of America Corp. | 525,100 | 14,445,501 |
| Citigroup, Inc. | 218,194 | 14,040,784 |
| JPMorgan Chase & Co. | 134,072 | 14,729,150 |
| U.S. Bancorp | 279,814 | 14,743,399 |
| Wells Fargo & Co. | 322,961 | 15,040,294 |
| | | | 72,999,128 |
| Diversified Chemicals–0.18% |
| Eastman Chemical Co. | 204,241 | 13,351,234 |
| Diversified Support Services–0.43% |
| Cintas Corp. | 62,290 | 16,432,102 |
| Copart, Inc.(b) | 199,482 | 15,038,948 |
| | | | 31,471,050 |
| Drug Retail–0.19% |
| Walgreens Boots Alliance, Inc. | 280,080 | 14,337,295 |
| Electric Utilities–2.91% |
| Alliant Energy Corp. | 294,476 | 15,445,266 |
| American Electric Power Co., Inc. | 162,550 | 14,816,432 |
| Duke Energy Corp. | 167,563 | 15,539,793 |
| Edison International | 247,708 | 17,901,857 |
| Entergy Corp. | 144,294 | 16,282,135 |
| Evergy, Inc. | 242,686 | 15,774,590 |
| Eversource Energy | 190,205 | 15,241,127 |
| Exelon Corp. | 289,838 | 13,697,744 |
| FirstEnergy Corp. | 334,860 | 15,403,560 |
| NextEra Energy, Inc. | 71,142 | 15,585,789 |
| Pinnacle West Capital Corp. | 151,044 | 14,396,004 |
| PPL Corp. | 468,165 | 13,834,276 |
| Southern Co. (The) | 264,579 | 15,414,372 |
| Xcel Energy, Inc. | 245,273 | 15,751,432 |
| | | | 215,084,377 |
| Electrical Components & Equipment–0.79% |
| AMETEK, Inc. | 173,241 | 14,886,599 |
| Eaton Corp. PLC | 187,875 | 15,165,270 |
| Emerson Electric Co. | 234,567 | 13,977,847 |
| Rockwell Automation, Inc. | 94,063 | 14,371,886 |
| | | | 58,401,602 |
| Electronic Components–0.36% |
| Amphenol Corp., Class A | 156,137 | 13,668,233 |
| | Shares | Value |
| Electronic Components–(continued) |
| Corning, Inc. | 476,344 | $13,266,180 |
| | | | 26,934,413 |
| Electronic Equipment & Instruments–0.42% |
| FLIR Systems, Inc. | 288,024 | 14,190,942 |
| Keysight Technologies, Inc.(b) | 175,638 | 17,012,297 |
| | | | 31,203,239 |
| Electronic Manufacturing Services–0.39% |
| IPG Photonics Corp.(b) | 111,593 | 13,807,402 |
| TE Connectivity Ltd. | 162,406 | 14,814,675 |
| | | | 28,622,077 |
| Environmental & Facilities Services–0.59% |
| Republic Services, Inc. | 169,258 | 15,106,276 |
| Rollins, Inc. | 391,071 | 12,831,040 |
| Waste Management, Inc. | 128,502 | 15,336,714 |
| | | | 43,274,030 |
| Fertilizers & Agricultural Chemicals–0.82% |
| CF Industries Holdings, Inc. | 320,082 | 15,424,751 |
| Corteva, Inc. | 584,510 | 17,137,833 |
| FMC Corp. | 184,254 | 15,906,648 |
| Mosaic Co. (The) | 658,489 | 12,109,613 |
| | | | 60,578,845 |
| Financial Exchanges & Data–1.77% |
| Cboe Global Markets, Inc. | 136,660 | 16,284,406 |
| CME Group, Inc. | 74,701 | 16,231,780 |
| Intercontinental Exchange, Inc. | 173,363 | 16,205,973 |
| MarketAxess Holdings, Inc. | 45,513 | 18,096,879 |
| Moody’s Corp. | 76,566 | 16,506,098 |
| MSCI, Inc. | 62,446 | 14,651,705 |
| Nasdaq, Inc. | 153,837 | 15,359,086 |
| S&P Global, Inc. | 65,467 | 17,033,859 |
| | | | 130,369,786 |
| Food Distributors–0.21% |
| Sysco Corp. | 203,789 | 15,147,636 |
| Food Retail–0.19% |
| Kroger Co. (The) | 606,917 | 14,371,795 |
| Footwear–0.20% |
| NIKE, Inc., Class B | 176,459 | 14,910,786 |
| Gas Utilities–0.21% |
| Atmos Energy Corp. | 140,240 | 15,458,655 |
| General Merchandise Stores–0.66% |
| Dollar General Corp. | 108,509 | 16,937,170 |
| Dollar Tree, Inc.(b) | 133,476 | 13,551,818 |
| Target Corp. | 167,716 | 17,952,321 |
| | | | 48,441,309 |
See accompanying Notes to Financial Statements which are an integral part of the financial statements.
| 12 | Invesco Equally-Weighted S&P 500 Fund |
| | Shares | Value |
| Gold–0.22% |
| Newmont Goldcorp Corp. | 409,791 | $16,346,563 |
| Health Care Distributors–0.77% |
| AmerisourceBergen Corp. | 173,119 | 14,242,500 |
| Cardinal Health, Inc. | 333,419 | 14,380,362 |
| Henry Schein, Inc.(b) | 206,562 | 12,728,350 |
| McKesson Corp. | 110,596 | 15,292,109 |
| | | | 56,643,321 |
| Health Care Equipment–3.39% |
| Abbott Laboratories | 179,078 | 15,278,935 |
| ABIOMED, Inc.(b) | 58,669 | 11,327,224 |
| Baxter International, Inc. | 188,936 | 16,616,921 |
| Becton, Dickinson and Co. | 62,878 | 15,965,982 |
| Boston Scientific Corp.(b) | 364,269 | 15,565,214 |
| Danaher Corp. | 105,448 | 14,983,106 |
| Edwards Lifesciences Corp.(b) | 80,050 | 17,758,292 |
| Hologic, Inc.(b) | 307,771 | 15,194,654 |
| IDEXX Laboratories, Inc.(b) | 54,992 | 15,933,382 |
| Intuitive Surgical, Inc.(b) | 29,652 | 15,162,254 |
| Medtronic PLC | 151,013 | 16,292,793 |
| ResMed, Inc. | 124,682 | 17,368,203 |
| Stryker Corp. | 75,324 | 16,620,994 |
| Teleflex, Inc. | 45,977 | 16,731,950 |
| Varian Medical Systems, Inc.(b) | 112,497 | 11,916,807 |
| Zimmer Biomet Holdings, Inc. | 125,361 | 17,450,251 |
| | | | 250,166,962 |
| Health Care Facilities–0.42% |
| HCA Healthcare, Inc. | 116,273 | 13,976,014 |
| Universal Health Services, Inc., Class B | 119,948 | 17,342,082 |
| | | | 31,318,096 |
| Health Care REITs–0.65% |
| HCP, Inc. | 458,399 | 15,911,029 |
| Ventas, Inc. | 220,547 | 16,185,945 |
| Welltower, Inc. | 178,947 | 16,026,493 |
| | | | 48,123,467 |
| Health Care Services–1.05% |
| Cigna Corp. | 92,946 | 14,310,896 |
| CVS Health Corp. | 271,807 | 16,558,482 |
| DaVita, Inc.(b) | 301,223 | 16,979,940 |
| Laboratory Corp. of America Holdings(b) | 88,489 | 14,827,217 |
| Quest Diagnostics, Inc. | 145,737 | 14,919,097 |
| | | | 77,595,632 |
| Health Care Supplies–0.49% |
| Align Technology, Inc.(b) | 48,163 | 8,819,127 |
| Cooper Cos., Inc. (The) | 45,570 | 14,115,307 |
| DENTSPLY SIRONA, Inc. | 259,359 | 13,525,572 |
| | | | 36,460,006 |
| Health Care Technology–0.19% |
| Cerner Corp. | 203,845 | 14,046,959 |
| | Shares | Value |
| Home Furnishings–0.35% |
| Leggett & Platt, Inc. | 393,790 | $14,645,050 |
| Mohawk Industries, Inc.(b) | 96,682 | 11,494,523 |
| | | | 26,139,573 |
| Home Improvement Retail–0.45% |
| Home Depot, Inc. (The) | 71,554 | 16,307,872 |
| Lowe’s Cos., Inc. | 147,784 | 16,581,365 |
| | | | 32,889,237 |
| Homebuilding–0.61% |
| D.R. Horton, Inc. | 320,361 | 15,848,259 |
| Lennar Corp., Class A | 274,954 | 14,022,654 |
| PulteGroup, Inc. | 448,213 | 15,149,599 |
| | | | 45,020,512 |
| Hotel & Resort REITs–0.17% |
| Host Hotels & Resorts, Inc. | 804,140 | 12,898,406 |
| Hotels, Resorts & Cruise Lines–0.91% |
| Carnival Corp. | 277,180 | 12,218,094 |
| Hilton Worldwide Holdings, Inc. | 157,608 | 14,558,251 |
| Marriott International, Inc., Class A | 110,141 | 13,884,375 |
| Norwegian Cruise Line Holdings Ltd.(b) | 271,256 | 13,766,242 |
| Royal Caribbean Cruises Ltd. | 118,615 | 12,369,172 |
| | | | 66,796,134 |
| Household Appliances–0.20% |
| Whirlpool Corp. | 108,517 | 15,093,630 |
| Household Products–1.03% |
| Church & Dwight Co., Inc. | 190,821 | 15,223,699 |
| Clorox Co. (The) | 93,853 | 14,843,791 |
| Colgate-Palmolive Co. | 200,733 | 14,884,352 |
| Kimberly-Clark Corp. | 106,964 | 15,093,690 |
| Procter & Gamble Co. (The) | 132,408 | 15,919,414 |
| | | | 75,964,946 |
| Housewares & Specialties–0.23% |
| Newell Brands, Inc. | 1,015,436 | 16,856,238 |
| Human Resource & Employment Services–0.19% |
| Robert Half International, Inc. | 261,756 | 13,996,093 |
| Hypermarkets & Super Centers–0.44% |
| Costco Wholesale Corp. | 56,597 | 16,682,532 |
| Walmart, Inc. | 134,994 | 15,424,414 |
| | | | 32,106,946 |
| Independent Power Producers & Energy Traders–0.39% |
| AES Corp. (The) | 861,545 | 13,207,485 |
| NRG Energy, Inc. | 423,341 | 15,409,612 |
| | | | 28,617,097 |
| Industrial Conglomerates–0.75% |
| 3M Co. | 88,329 | 14,284,566 |
| General Electric Co. | 1,439,278 | 11,874,043 |
See accompanying Notes to Financial Statements which are an integral part of the financial statements.
| 13 | Invesco Equally-Weighted S&P 500 Fund |
| | Shares | Value |
| Industrial Conglomerates–(continued) |
| Honeywell International, Inc. | 85,201 | $14,025,789 |
| Roper Technologies, Inc. | 40,380 | 14,809,769 |
| | | | 54,994,167 |
| Industrial Gases–0.39% |
| Air Products and Chemicals, Inc. | 67,154 | 15,171,432 |
| Linde PLC (United Kingdom) | 72,634 | 13,721,289 |
| | | | 28,892,721 |
| Industrial Machinery–2.10% |
| Dover Corp. | 153,261 | 14,366,686 |
| Flowserve Corp. | 301,964 | 12,887,824 |
| Fortive Corp. | 190,402 | 13,499,502 |
| IDEX Corp. | 87,157 | 14,355,630 |
| Illinois Tool Works, Inc. | 98,783 | 14,803,620 |
| Ingersoll-Rand PLC | 118,092 | 14,299,760 |
| Parker-Hannifin Corp. | 89,663 | 14,863,436 |
| Pentair PLC | 413,358 | 14,847,819 |
| Snap-on, Inc. | 89,729 | 13,340,908 |
| Stanley Black & Decker, Inc. | 104,047 | 13,823,684 |
| Xylem, Inc. | 181,595 | 13,911,993 |
| | | | 155,000,862 |
| Industrial REITs–0.42% |
| Duke Realty Corp. | 463,741 | 15,428,663 |
| Prologis, Inc. | 184,139 | 15,397,703 |
| | | | 30,826,366 |
| Insurance Brokers–0.82% |
| Aon PLC | 77,184 | 15,039,302 |
| Arthur J. Gallagher & Co. | 167,888 | 15,229,121 |
| Marsh & McLennan Cos., Inc. | 149,967 | 14,980,204 |
| Willis Towers Watson PLC | 77,358 | 15,314,563 |
| | | | 60,563,190 |
| Integrated Oil & Gas–0.55% |
| Chevron Corp. | 121,874 | 14,347,007 |
| Exxon Mobil Corp. | 198,033 | 13,561,300 |
| Occidental Petroleum Corp. | 298,596 | 12,982,954 |
| | | | 40,891,261 |
| Integrated Telecommunication Services–0.42% |
| AT&T, Inc. | 455,140 | 16,048,237 |
| Verizon Communications, Inc. | 252,638 | 14,693,426 |
| | | | 30,741,663 |
| Interactive Home Entertainment–0.66% |
| Activision Blizzard, Inc. | 322,748 | 16,331,049 |
| Electronic Arts, Inc.(b) | 158,781 | 14,874,604 |
| Take-Two Interactive Software, Inc.(b) | 133,416 | 17,606,909 |
| | | | 48,812,562 |
| Interactive Media & Services–0.82% |
| Alphabet, Inc., Class A(b) | 6,690 | 7,964,646 |
| Alphabet, Inc., Class C(b)(e) | 6,869 | 8,161,059 |
| | Shares | Value |
| Interactive Media & Services–(continued) |
| Facebook, Inc., Class A(b) | 81,198 | $15,076,033 |
| TripAdvisor, Inc.(b) | 323,244 | 12,280,039 |
| Twitter, Inc.(b) | 407,297 | 17,371,217 |
| | | | 60,852,994 |
| Internet & Direct Marketing Retail–0.82% |
| Amazon.com, Inc.(b)(e) | 7,875 | 13,988,284 |
| Booking Holdings, Inc.(b) | 8,292 | 16,305,471 |
| eBay, Inc. | 378,406 | 15,245,978 |
| Expedia Group, Inc. | 116,108 | 15,105,651 |
| | | | 60,645,384 |
| Internet Services & Infrastructure–0.42% |
| Akamai Technologies, Inc.(b) | 187,277 | 16,691,999 |
| VeriSign, Inc.(b) | 71,752 | 14,626,645 |
| | | | 31,318,644 |
| Investment Banking & Brokerage–0.97% |
| Charles Schwab Corp. (The) | 359,029 | 13,740,040 |
| E*TRADE Financial Corp. | 324,956 | 13,563,664 |
| Goldman Sachs Group, Inc. (The) | 76,822 | 15,664,774 |
| Morgan Stanley | 343,853 | 14,266,461 |
| Raymond James Financial, Inc. | 178,340 | 14,001,473 |
| | | | 71,236,412 |
| IT Consulting & Other Services–1.13% |
| Accenture PLC, Class A | 79,600 | 15,774,332 |
| Cognizant Technology Solutions Corp., Class A | 238,867 | 14,664,045 |
| DXC Technology Co. | 284,683 | 9,457,169 |
| Gartner, Inc.(b) | 92,847 | 12,410,859 |
| International Business Machines Corp. | 108,943 | 14,765,045 |
| Leidos Holdings, Inc. | 188,973 | 16,508,681 |
| | | | 83,580,131 |
| Leisure Products–0.21% |
| Hasbro, Inc. | 137,016 | 15,136,158 |
| Life & Health Insurance–1.23% |
| Aflac, Inc. | 267,511 | 13,423,702 |
| Globe Life, Inc. | 165,120 | 14,738,611 |
| Lincoln National Corp. | 231,943 | 12,265,146 |
| MetLife, Inc. | 301,655 | 13,363,317 |
| Principal Financial Group, Inc. | 263,348 | 14,015,381 |
| Prudential Financial, Inc. | 148,380 | 11,883,754 |
| Unum Group | 445,501 | 11,320,180 |
| | | | 91,010,091 |
| Life Sciences Tools & Services–1.34% |
| Agilent Technologies, Inc. | 210,429 | 14,963,606 |
| Illumina, Inc.(b) | 42,801 | 12,041,633 |
| IQVIA Holdings, Inc.(b) | 104,201 | 16,166,785 |
| Mettler-Toledo International, Inc.(b) | 18,612 | 12,224,176 |
| PerkinElmer, Inc. | 158,422 | 13,101,499 |
| Thermo Fisher Scientific, Inc. | 51,615 | 14,816,602 |
See accompanying Notes to Financial Statements which are an integral part of the financial statements.
| 14 | Invesco Equally-Weighted S&P 500 Fund |
| | Shares | Value |
| Life Sciences Tools & Services–(continued) |
| Waters Corp.(b) | 72,459 | $15,353,338 |
| | | | 98,667,639 |
| Managed Health Care–0.96% |
| Anthem, Inc. | 51,604 | 13,495,478 |
| Centene Corp.(b) | 274,954 | 12,818,356 |
| Humana, Inc. | 58,466 | 16,558,156 |
| UnitedHealth Group, Inc. | 60,006 | 14,041,404 |
| WellCare Health Plans, Inc.(b) | 51,284 | 13,884,630 |
| | | | 70,798,024 |
| Metal & Glass Containers–0.25% |
| Ball Corp. | 225,099 | 18,100,211 |
| Motorcycle Manufacturers–0.18% |
| Harley-Davidson, Inc. | 425,052 | 13,559,159 |
| Movies & Entertainment–0.54% |
| Netflix, Inc.(b) | 43,339 | 12,730,831 |
| Viacom, Inc., Class B | 500,979 | 12,514,455 |
| Walt Disney Co. (The) | 103,944 | 14,267,354 |
| | | | 39,512,640 |
| Multi-line Insurance–0.64% |
| American International Group, Inc. | 276,192 | 14,373,031 |
| Assurant, Inc. | 138,746 | 17,065,758 |
| Hartford Financial Services Group, Inc. (The) | 267,949 | 15,616,068 |
| | | | 47,054,857 |
| Multi-Sector Holdings–0.40% |
| Berkshire Hathaway, Inc., Class B(b) | 71,766 | 14,597,922 |
| Jefferies Financial Group, Inc. | 818,899 | 15,264,277 |
| | | | 29,862,199 |
| Multi-Utilities–2.04% |
| Ameren Corp. | 191,940 | 14,808,171 |
| CenterPoint Energy, Inc. | 497,089 | 13,764,394 |
| CMS Energy Corp. | 250,617 | 15,801,402 |
| Consolidated Edison, Inc. | 166,295 | 14,783,625 |
| Dominion Energy, Inc. | 192,066 | 14,910,084 |
| DTE Energy Co. | 113,661 | 14,737,285 |
| NiSource, Inc. | 512,133 | 15,133,530 |
| Public Service Enterprise Group, Inc. | 241,531 | 14,605,380 |
| Sempra Energy | 106,879 | 15,137,273 |
| WEC Energy Group, Inc. | 174,638 | 16,725,081 |
| | | | 150,406,225 |
| Office REITs–0.75% |
| Alexandria Real Estate Equities, Inc. | 97,314 | 14,581,530 |
| Boston Properties, Inc. | 108,903 | 13,985,323 |
| SL Green Realty Corp. | 168,195 | 13,492,603 |
| Vornado Realty Trust | 222,413 | 13,449,314 |
| | | | 55,508,770 |
| | Shares | Value |
| Oil & Gas Drilling–0.16% |
| Helmerich & Payne, Inc. | 304,210 | $11,435,254 |
| Oil & Gas Equipment & Services–0.97% |
| Baker Hughes, a GE Co., Class A | 664,732 | 14,418,037 |
| Halliburton Co. | 688,672 | 12,974,581 |
| National Oilwell Varco, Inc. | 736,190 | 15,040,362 |
| Schlumberger Ltd. | 409,791 | 13,289,522 |
| TechnipFMC PLC (United Kingdom) | 647,485 | 16,083,527 |
| | | | 71,806,029 |
| Oil & Gas Exploration & Production–2.13% |
| Apache Corp. | 535,606 | 11,553,021 |
| Cabot Oil & Gas Corp. | 619,428 | 10,604,607 |
| Cimarex Energy Co. | 269,667 | 11,536,354 |
| Concho Resources, Inc. | 149,693 | 10,950,043 |
| ConocoPhillips | 250,319 | 13,061,645 |
| Devon Energy Corp. | 571,354 | 12,564,075 |
| Diamondback Energy, Inc. | 148,800 | 14,594,304 |
| EOG Resources, Inc. | 172,875 | 12,825,596 |
| Hess Corp. | 257,184 | 16,189,733 |
| Marathon Oil Corp. | 1,134,346 | 13,430,657 |
| Noble Energy, Inc. | 746,265 | 16,850,664 |
| Pioneer Natural Resources Co. | 103,995 | 12,835,063 |
| | | | 156,995,762 |
| Oil & Gas Refining & Marketing–0.85% |
| HollyFrontier Corp. | 365,354 | 16,207,104 |
| Marathon Petroleum Corp. | 307,001 | 15,107,519 |
| Phillips 66 | 172,027 | 16,967,023 |
| Valero Energy Corp. | 191,815 | 14,439,833 |
| | | | 62,721,479 |
| Oil & Gas Storage & Transportation–0.59% |
| Kinder Morgan, Inc. | 717,185 | 14,537,340 |
| ONEOK, Inc. | 228,417 | 16,281,564 |
| Williams Cos., Inc. (The) | 545,528 | 12,874,461 |
| | | | 43,693,365 |
| Packaged Foods & Meats–2.46% |
| Campbell Soup Co. | 348,409 | 15,678,405 |
| Conagra Brands, Inc. | 492,764 | 13,974,787 |
| General Mills, Inc. | 275,675 | 14,831,315 |
| Hershey Co. (The) | 106,446 | 16,869,562 |
| Hormel Foods Corp. | 355,389 | 15,143,125 |
| JM Smucker Co. (The) | 119,404 | 12,556,525 |
| Kellogg Co. | 260,000 | 16,328,000 |
| Kraft Heinz Co. (The) | 485,773 | 12,396,927 |
| Lamb Weston Holdings, Inc. | 238,596 | 16,794,773 |
| McCormick & Co., Inc. | 94,021 | 15,313,200 |
| Mondelez International, Inc., Class A | 267,462 | 14,769,252 |
| Tyson Foods, Inc., Class A | 179,755 | 16,724,405 |
| | | | 181,380,276 |
See accompanying Notes to Financial Statements which are an integral part of the financial statements.
| 15 | Invesco Equally-Weighted S&P 500 Fund |
| | Shares | Value |
| Paper Packaging–1.15% |
| Amcor PLC | 1,347,101 | $13,228,532 |
| Avery Dennison Corp. | 133,380 | 15,414,727 |
| International Paper Co. | 342,493 | 13,391,476 |
| Packaging Corp. of America | 154,467 | 15,536,291 |
| Sealed Air Corp. | 332,215 | 13,228,801 |
| Westrock Co. | 408,427 | 13,960,035 |
| | | | 84,759,862 |
| Personal Products–0.36% |
| Coty, Inc., Class A | 1,084,228 | 10,354,377 |
| Estee Lauder Cos., Inc. (The), Class A | 83,241 | 16,480,886 |
| | | | 26,835,263 |
| Pharmaceuticals–2.01% |
| Allergan PLC | 127,017 | 20,287,155 |
| Bristol-Myers Squibb Co. | 309,583 | 14,881,655 |
| Eli Lilly and Co. | 131,768 | 14,885,831 |
| Johnson & Johnson | 105,101 | 13,490,765 |
| Merck & Co., Inc. | 177,866 | 15,380,073 |
| Mylan N.V.(b) | 865,088 | 16,843,264 |
| Nektar Therapeutics(b) | 440,832 | 7,745,418 |
| Perrigo Co. PLC | 340,986 | 15,951,325 |
| Pfizer, Inc. | 344,335 | 12,241,109 |
| Zoetis, Inc. | 132,898 | 16,800,965 |
| | | | 148,507,560 |
| Property & Casualty Insurance–1.18% |
| Allstate Corp. (The) | 144,153 | 14,759,826 |
| Chubb Ltd. | 97,988 | 15,313,565 |
| Cincinnati Financial Corp. | 142,204 | 15,996,528 |
| Loews Corp. | 275,005 | 13,219,490 |
| Progressive Corp. (The) | 179,646 | 13,617,167 |
| Travelers Cos., Inc. (The) | 98,086 | 14,414,718 |
| | | | 87,321,294 |
| Publishing–0.23% |
| News Corp., Class A | 934,727 | 12,852,496 |
| News Corp., Class B | 300,244 | 4,251,455 |
| | | | 17,103,951 |
| Railroads–0.76% |
| CSX Corp. | 190,796 | 12,787,148 |
| Kansas City Southern | 125,940 | 15,843,252 |
| Norfolk Southern Corp. | 75,607 | 13,159,398 |
| Union Pacific Corp. | 88,171 | 14,280,175 |
| | | | 56,069,973 |
| Real Estate Services–0.21% |
| CBRE Group, Inc., Class A(b) | 297,090 | 15,528,894 |
| Regional Banks–2.62% |
| BB&T Corp. | 294,123 | 14,014,961 |
| Citizens Financial Group, Inc. | 421,041 | 14,205,923 |
| Comerica, Inc. | 209,710 | 12,928,622 |
| Fifth Third Bancorp | 537,561 | 14,218,488 |
| | Shares | Value |
| Regional Banks–(continued) |
| First Republic Bank | 152,815 | $13,710,562 |
| Huntington Bancshares, Inc. | 1,102,082 | 14,602,587 |
| KeyCorp | 858,531 | 14,251,615 |
| M&T Bank Corp. | 87,693 | 12,821,594 |
| People’s United Financial, Inc. | 901,090 | 12,948,663 |
| PNC Financial Services Group, Inc. (The) | 108,895 | 14,039,832 |
| Regions Financial Corp. | 1,009,171 | 14,754,080 |
| SunTrust Banks, Inc. | 228,028 | 14,026,002 |
| SVB Financial Group(b) | 67,484 | 13,133,736 |
| Zions Bancorp. N.A. | 328,070 | 13,480,396 |
| | | | 193,137,061 |
| Reinsurance–0.19% |
| Everest Re Group, Ltd. | 58,648 | 13,833,890 |
| Research & Consulting Services–0.84% |
| Equifax, Inc. | 111,509 | 16,322,687 |
| IHS Markit Ltd.(b) | 248,209 | 16,284,992 |
| Nielsen Holdings PLC | 638,500 | 13,255,260 |
| Verisk Analytics, Inc. | 100,964 | 16,309,725 |
| | | | 62,172,664 |
| Residential REITs–1.25% |
| Apartment Investment & Management Co., Class A | 287,968 | 14,686,368 |
| AvalonBay Communities, Inc. | 70,756 | 15,039,895 |
| Equity Residential | 188,139 | 15,946,662 |
| Essex Property Trust, Inc. | 49,211 | 15,809,526 |
| Mid-America Apartment Communities, Inc. | 124,999 | 15,834,873 |
| UDR, Inc. | 317,050 | 15,275,469 |
| | | | 92,592,793 |
| Restaurants–1.08% |
| Chipotle Mexican Grill, Inc.(b) | 19,881 | 16,668,628 |
| Darden Restaurants, Inc. | 123,025 | 14,883,565 |
| McDonald’s Corp. | 71,721 | 15,633,026 |
| Starbucks Corp. | 174,783 | 16,877,047 |
| Yum! Brands, Inc. | 134,108 | 15,661,132 |
| | | | 79,723,398 |
| Retail REITs–1.12% |
| Federal Realty Investment Trust | 110,588 | 14,289,076 |
| Kimco Realty Corp. | 786,109 | 14,448,683 |
| Macerich Co. (The) | 426,406 | 12,165,363 |
| Realty Income Corp. | 200,952 | 14,832,267 |
| Regency Centers Corp. | 213,790 | 13,791,593 |
| Simon Property Group, Inc. | 90,373 | 13,460,155 |
| | | | 82,987,137 |
| Semiconductor Equipment–0.74% |
| Applied Materials, Inc. | 357,113 | 17,148,566 |
| KLA Corp. | 134,218 | 19,850,842 |
| Lam Research Corp. | 83,278 | 17,530,852 |
| | | | 54,530,260 |
See accompanying Notes to Financial Statements which are an integral part of the financial statements.
| 16 | Invesco Equally-Weighted S&P 500 Fund |
| | Shares | Value |
| Semiconductors–2.84% |
| Advanced Micro Devices, Inc.(b) | 484,973 | $15,252,401 |
| Analog Devices, Inc. | 141,547 | 15,546,107 |
| Broadcom, Inc. | 55,366 | 15,648,646 |
| Intel Corp. | 318,766 | 15,112,696 |
| Maxim Integrated Products, Inc. | 262,690 | 14,327,113 |
| Microchip Technology, Inc. | 176,989 | 15,279,460 |
| Micron Technology, Inc.(b) | 450,820 | 20,408,621 |
| NVIDIA Corp. | 101,795 | 17,051,681 |
| Qorvo, Inc.(b) | 239,410 | 17,101,056 |
| QUALCOMM, Inc. | 214,257 | 16,662,767 |
| Skyworks Solutions, Inc. | 205,066 | 15,435,318 |
| Texas Instruments, Inc. | 137,208 | 16,979,490 |
| Xilinx, Inc. | 139,668 | 14,533,852 |
| | | | 209,339,208 |
| Soft Drinks–0.61% |
| Coca-Cola Co. (The) | 286,957 | 15,794,113 |
| Monster Beverage Corp.(b) | 240,074 | 14,085,142 |
| PepsiCo, Inc. | 110,929 | 15,167,322 |
| | | | 45,046,577 |
| Specialized Consumer Services–0.17% |
| H&R Block, Inc. | 513,204 | 12,429,801 |
| Specialized REITs–1.94% |
| American Tower Corp. | 69,704 | 16,045,164 |
| Crown Castle International Corp. | 110,447 | 16,033,591 |
| Digital Realty Trust, Inc. | 122,943 | 15,199,443 |
| Equinix, Inc. | 28,874 | 16,062,029 |
| Extra Space Storage, Inc. | 136,255 | 16,612,210 |
| Iron Mountain, Inc. | 464,034 | 14,779,483 |
| Public Storage | 60,514 | 16,020,476 |
| SBA Communications Corp. | 65,005 | 17,059,262 |
| Weyerhaeuser Co. | 572,688 | 15,067,421 |
| | | | 142,879,079 |
| Specialty Chemicals–1.34% |
| Albemarle Corp.(d) | 207,728 | 12,823,049 |
| Celanese Corp. | 141,316 | 16,020,995 |
| DuPont de Nemours, Inc. | 196,107 | 13,321,549 |
| Ecolab, Inc. | 74,036 | 15,274,367 |
| International Flavors & Fragrances, Inc. | 98,956 | 10,860,421 |
| PPG Industries, Inc. | 126,329 | 13,995,990 |
| Sherwin-Williams Co. (The) | 31,085 | 16,374,024 |
| | | | 98,670,395 |
| Specialty Stores–0.51% |
| Tiffany & Co. | 161,764 | 13,728,911 |
| Tractor Supply Co. | 138,720 | 14,132,793 |
| Ulta Beauty, Inc.(b) | 41,519 | 9,870,312 |
| | | | 37,732,016 |
| Steel–0.19% |
| Nucor Corp. | 284,793 | 13,949,161 |
| | Shares | Value |
| Systems Software–0.85% |
| Fortinet, Inc.(b) | 194,476 | $15,398,609 |
| Microsoft Corp. | 111,164 | 15,325,069 |
| Oracle Corp. | 276,347 | 14,386,625 |
| Symantec Corp. | 760,527 | 17,682,253 |
| | | | 62,792,556 |
| Technology Hardware, Storage & Peripherals–1.46% |
| Apple, Inc. | 76,391 | 15,945,858 |
| Hewlett Packard Enterprise Co. | 1,040,552 | 14,380,429 |
| HP, Inc. | 739,518 | 13,525,784 |
| NetApp, Inc. | 241,452 | 11,604,183 |
| Seagate Technology PLC | 332,666 | 16,703,160 |
| Western Digital Corp. | 405,279 | 23,210,328 |
| Xerox Holdings Corp. | 427,769 | 12,401,023 |
| | | | 107,770,765 |
| Tobacco–0.36% |
| Altria Group, Inc. | 289,496 | 12,662,555 |
| Philip Morris International, Inc. | 190,722 | 13,749,149 |
| | | | 26,411,704 |
| Trading Companies & Distributors–0.58% |
| Fastenal Co. | 465,207 | 14,244,638 |
| United Rentals, Inc.(b) | 119,831 | 13,488,178 |
| W.W. Grainger, Inc. | 54,059 | 14,793,245 |
| | | | 42,526,061 |
| Trucking–0.24% |
| J.B. Hunt Transport Services, Inc. | 162,067 | 17,509,719 |
| Water Utilities–0.21% |
| American Water Works Co., Inc. | 124,492 | 15,850,321 |
| Wireless Telecommunication Services–0.20% |
| T-Mobile US, Inc.(b) | 187,833 | 14,660,366 |
| Total Common Stocks & Other Equity Interests (Cost $4,954,951,735) | 7,334,958,834 |
| Money Market Funds–0.55% |
| Invesco Government & Agency Portfolio, Institutional Class, 2.02%(f) | 14,125,767 | 14,125,767 |
| Invesco Liquid Assets Portfolio, Institutional Class, 2.14%(f) | 10,085,799 | 10,089,834 |
| Invesco Treasury Portfolio, Institutional Class, 1.98%(f) | 16,143,734 | 16,143,734 |
| Total Money Market Funds (Cost $40,359,334) | 40,359,335 |
| TOTAL INVESTMENTS IN SECURITIES (excluding investments purchased with cash collateral from securities on loan)-99.92% (Cost $4,995,311,069) | | | 7,375,318,169 |
| Investments Purchased with Cash Collateral from Securities on Loan |
| Money Market Funds–0.25% |
| Invesco Government & Agency Portfolio, Institutional Class, 2.02%(f)(g) | 13,977,919 | 13,977,919 |
See accompanying Notes to Financial Statements which are an integral part of the financial statements.
| 17 | Invesco Equally-Weighted S&P 500 Fund |
| | Shares | Value |
| Money Market Funds–(continued) |
| Invesco Liquid Assets Portfolio, Institutional Class, 2.14%(f)(g) | 4,657,443 | $4,659,306 |
| Total Investments Purchased with Cash Collateral from Securities on Loan (Cost $18,637,225) | 18,637,225 |
| TOTAL INVESTMENTS IN SECURITIES–100.17% (Cost $5,013,948,294) | 7,393,955,394 |
| OTHER ASSETS LESS LIABILITIES—(0.17)% | (12,217,592) |
| NET ASSETS–100.00% | $7,381,737,802 |
Investment Abbreviations:
| REIT | – Real Estate Investment Trust |
Notes to Schedule of Investments:
| (a) | Industry and/or sector classifications used in this report are generally according to the Global Industry Classification Standard, which was developed by and is the exclusive property and a service mark of MSCI Inc. and Standard & Poor’s. |
| (b) | Non-income producing security. |
| (c) | The Fund’s Adviser is a subsidiary of Invesco Ltd. and therefore, Invesco Ltd. is considered to be affiliated with the Fund. The value of this security as of August 31, 2019 represented less than 1% of the Fund’s Net Assets. See Note 5. |
| (d) | All or a portion of this security was out on loan at August 31, 2019. |
| (e) | All or a portion of the value was pledged as collateral to cover margin requirements for open futures contracts. See Note 1J. |
| (f) | The money market fund and the Fund are affiliated by having the same investment adviser. The rate shown is the 7-day SEC standardized yield as of August 31, 2019. |
| (g) | The security has been segregated to satisfy the commitment to return the cash collateral received in securities lending transactions upon the borrower’s return of the securities loaned. See Note 1I. |
| Open Futures Contracts |
| Long Futures Contracts | Number of
Contracts | Expiration
Month | Notional
Value | Value | Unrealized
Appreciation |
| Equity Risk |
| E-Mini S&P 500 Index | 364 | September-2019 | $53,231,360 | $670,596 | $670,596 |
See accompanying Notes to Financial Statements which are an integral part of the financial statements.
| 18 | Invesco Equally-Weighted S&P 500 Fund |
Statement of Assets and Liabilities
August 31, 2019
| Assets: | |
Investments in securities, at value
(Cost $4,937,777,914)* | $7,323,759,035 |
Investments in affiliates, at value
(Cost $76,170,380) | 70,196,359 |
| Cash | 126,408 |
| Receivable for: | |
| Fund shares sold | 3,789,124 |
| Dividends | 14,135,947 |
| Investment for trustee deferred compensation and retirement plans | 180,758 |
| Other assets | 72,765 |
| Total assets | 7,412,260,396 |
| Liabilities: | |
| Other investments: | |
| Variation margin payable - futures contracts | 35,418 |
| Payable for: | |
| Fund shares reacquired | 7,225,252 |
| Collateral upon return of securities loaned | 18,637,225 |
| Accrued fees to affiliates | 3,582,338 |
| Accrued trustees’ and officers’ fees and benefits | 12,615 |
| Accrued other operating expenses | 765,181 |
| Trustee deferred compensation and retirement plans | 264,565 |
| Total liabilities | 30,522,594 |
| Net assets applicable to shares outstanding | $7,381,737,802 |
| Net assets consist of: | |
| Shares of beneficial interest | $4,835,429,322 |
| Distributable earnings | 2,546,308,480 |
| | $7,381,737,802 |
| Net Assets: |
| Class A | $2,235,826,799 |
| Class C | $1,083,024,085 |
| Class R | $135,224,757 |
| Class Y | $2,902,956,448 |
| Class R6 | $1,024,705,713 |
| Shares outstanding, no par value, with an unlimited number of shares authorized: |
| Class A | 37,254,480 |
| Class C | 18,939,701 |
| Class R | 2,267,883 |
| Class Y | 47,846,314 |
| Class R6 | 16,860,410 |
| Class A: | |
| Net asset value per share | $60.01 |
Maximum offering price per share
(Net asset value of $60.01 ÷ 94.50%) | $63.50 |
| Class C: | |
| Net asset value and offering price per share | $57.18 |
| Class R: | |
| Net asset value and offering price per share | $59.63 |
| Class Y: | |
| Net asset value and offering price per share | $60.67 |
| Class R6: | |
| Net asset value and offering price per share | $60.78 |
| * | At August 31, 2019, securities with an aggregate value of $18,213,793 were on loan to brokers. |
See accompanying Notes to Financial Statements which are an integral part of the financial statements.
| 19 | Invesco Equally-Weighted S&P 500 Fund |
Statement of Operations
For the year ended August 31, 2019
| Investment income: | |
| Dividends | $153,630,044 |
| Dividends from affiliates (includes securities lending income of $212,124) | 2,198,248 |
| Total investment income | 155,828,292 |
| Expenses: | |
| Advisory fees | 7,914,449 |
| Administrative services fees | 934,834 |
| Custodian fees | 80,938 |
| Distribution fees: | |
| Class A | 5,476,261 |
| Class C | 11,236,454 |
| Class R | 674,511 |
| Transfer agent fees — A, C, R and Y | 7,931,418 |
| Transfer agent fees — R6 | 60,772 |
| Trustees’ and officers’ fees and benefits | 130,754 |
| Registration and filing fees | 198,623 |
| Licensing fees | 1,502,888 |
| Reports to shareholders | 366,687 |
| Professional services fees | 121,210 |
| Other | 123,499 |
| Total expenses | 36,753,298 |
| Less: Fees waived and/or expense offset arrangement(s) | (63,761) |
| Net expenses | 36,689,537 |
| Net investment income | 119,138,755 |
| Realized and unrealized gain (loss) from: | |
| Net realized gain (loss) from: | |
| Investment securities | 263,383,032 |
| Futures contracts | (4,642,550) |
| | 258,740,482 |
| Change in net unrealized appreciation (depreciation) of: | |
| Investment securities | (420,241,384) |
| Futures contracts | (16,845) |
| | (420,258,229) |
| Net realized and unrealized gain (loss) | (161,517,747) |
| Net increase (decrease) in net assets resulting from operations | $(42,378,992) |
See accompanying Notes to Financial Statements which are an integral part of the financial statements.
| 20 | Invesco Equally-Weighted S&P 500 Fund |
Statement of Changes in Net Assets
For the years ended August 31, 2019 and 2018
| | 2019 | 2018 |
| Operations: | | |
| Net investment income | $119,138,755 | $101,774,209 |
| Net realized gain | 258,740,482 | 295,114,640 |
| Change in net unrealized appreciation (depreciation) | (420,258,229) | 808,580,285 |
| Net increase (decrease) in net assets resulting from operations | (42,378,992) | 1,205,469,134 |
| Distributions to shareholders from distributable earnings(1): | | |
| Class A | (126,201,339) | (60,472,409) |
| Class B | — | (51,520) |
| Class C | (63,410,741) | (26,444,242) |
| Class R | (7,423,559) | (3,426,997) |
| Class Y | (183,732,668) | (100,099,097) |
| Class R6 | (64,278,995) | (30,682,341) |
| Total distributions from distributable earnings | (445,047,302) | (221,176,606) |
| Share transactions–net: | | |
| Class A | 71,350,980 | (85,392,367) |
| Class B | — | (3,301,772) |
| Class C | (87,475,018) | (21,468,146) |
| Class R | 5,784,706 | (12,092,846) |
| Class Y | (330,937,131) | (295,793,726) |
| Class R6 | 81,917,743 | 70,474,012 |
| Net increase (decrease) in net assets resulting from share transactions | (259,358,720) | (347,574,845) |
| Net increase (decrease) in net assets | (746,785,014) | 636,717,683 |
| Net assets: | | |
| Beginning of year | 8,128,522,816 | 7,491,805,133 |
| End of year | $7,381,737,802 | $8,128,522,816 |
| (1) | For the year ended August 31, 2018, distributions to shareholders from distributable earnings consisted of distributions from net investment income and distributions from net realized gains. The Securities and Exchange Commission eliminated the requirement to disclose the distribution components separately. For the year ended August 31, 2018, distributions from net investment income were $29,659,224, $16,753, $9,106,520, $1,527,437, $53,078,211 and $16,786,276 and distributions from net realized gains were $30,813,185, $34,767, $17,337,722, $1,899,560, $47,020,886 and $13,896,065 for Class A, Class B, Class C, Class R, Class Y and Class R6 shares, respectively. |
See accompanying Notes to Financial Statements which are an integral part of the financial statements.
| 21 | Invesco Equally-Weighted S&P 500 Fund |
Financial Highlights
August 31, 2019
The following schedule presents financial highlights for a share of the Fund outstanding throughout the periods indicated.
| | Net asset
value,
beginning
of period | Net
investment
income(a) | Net gains
(losses)
on securities
(both
realized and
unrealized) | Total from
investment
operations | Dividends
from net
investment
income | Distributions
from net
realized
gains | Total
distributions | Net asset
value, end
of period | Total
return(b) | Net assets,
end of period
(000’s omitted) | Ratio of
expenses
to average
net assets
with fee waivers
and/or
expenses
absorbed | Ratio of
expenses
to average net
assets without
fee waivers
and/or
expenses
absorbed | Ratio of net
investment
income
to average
net assets | Portfolio
turnover(c) |
| Class A |
| Year ended 08/31/19 | $64.04 | $0.92 | $(1.38) | $(0.46) | $(0.82) | $(2.75) | $(3.57) | $60.01 | (0.09)% | $2,235,827 | 0.52%(d) | 0.52%(d) | 1.55%(d) | 22% |
| Year ended 08/31/18 | 56.49 | 0.75 | 8.45 | 9.20 | (0.81) | (0.84) | (1.65) | 64.04 | 16.52 | 2,293,892 | 0.53 | 0.53 | 1.23 | 20 |
| Year ended 08/31/17 | 50.91 | 0.74 | 5.54 | 6.28 | (0.54) | (0.16) | (0.70) | 56.49 | 12.41 | 2,103,146 | 0.53 | 0.53 | 1.37 | 24 |
| Year ended 08/31/16 | 46.87 | 0.75 | 4.57 | 5.32 | (0.66) | (0.62) | (1.28) | 50.91 | 11.69 | 1,957,456 | 0.54 | 0.54 | 1.58 | 29 |
| Year ended 08/31/15 | 48.54 | 0.67 | (1.18) | (0.51) | (0.49) | (0.67) | (1.16) | 46.87 | (1.07) | 1,789,491 | 0.54 | 0.54 | 1.36 | 21 |
| Class C |
| Year ended 08/31/19 | 61.18 | 0.46 | (1.31) | (0.85) | (0.40) | (2.75) | (3.15) | 57.18 | (0.83) | 1,083,024 | 1.27(d) | 1.27(d) | 0.80(d) | 22 |
| Year ended 08/31/18 | 54.05 | 0.32 | 8.09 | 8.41 | (0.44) | (0.84) | (1.28) | 61.18 | 15.75(e) | 1,252,161 | 1.21(e) | 1.21(e) | 0.55(e) | 20 |
| Year ended 08/31/17 | 48.82 | 0.32 | 5.30 | 5.62 | (0.23) | (0.16) | (0.39) | 54.05 | 11.56 | 1,126,361 | 1.28 | 1.28 | 0.62 | 24 |
| Year ended 08/31/16 | 45.03 | 0.41 | 4.39 | 4.80 | (0.39) | (0.62) | (1.01) | 48.82 | 10.90(e) | 941,775 | 1.23(e) | 1.23(e) | 0.89(e) | 29 |
| Year ended 08/31/15 | 46.79 | 0.29 | (1.12) | (0.83) | (0.26) | (0.67) | (0.93) | 45.03 | (1.81) | 750,898 | 1.29 | 1.29 | 0.61 | 21 |
| Class R |
| Year ended 08/31/19 | 63.64 | 0.77 | (1.36) | (0.59) | (0.67) | (2.75) | (3.42) | 59.63 | (0.33) | 135,225 | 0.77(d) | 0.77(d) | 1.30(d) | 22 |
| Year ended 08/31/18 | 56.15 | 0.59 | 8.42 | 9.01 | (0.68) | (0.84) | (1.52) | 63.64 | 16.25 | 137,036 | 0.78 | 0.78 | 0.98 | 20 |
| Year ended 08/31/17 | 50.63 | 0.60 | 5.50 | 6.10 | (0.42) | (0.16) | (0.58) | 56.15 | 12.13 | 132,316 | 0.78 | 0.78 | 1.12 | 24 |
| Year ended 08/31/16 | 46.65 | 0.63 | 4.54 | 5.17 | (0.57) | (0.62) | (1.19) | 50.63 | 11.38 | 111,116 | 0.79 | 0.79 | 1.33 | 29 |
| Year ended 08/31/15 | 48.36 | 0.54 | (1.17) | (0.63) | (0.41) | (0.67) | (1.08) | 46.65 | (1.33) | 89,588 | 0.79 | 0.79 | 1.11 | 21 |
| Class Y |
| Year ended 08/31/19 | 64.71 | 1.08 | (1.40) | (0.32) | (0.97) | (2.75) | (3.72) | 60.67 | 0.18 | 2,902,956 | 0.27(d) | 0.27(d) | 1.80(d) | 22 |
| Year ended 08/31/18 | 57.06 | 0.91 | 8.53 | 9.44 | (0.95) | (0.84) | (1.79) | 64.71 | 16.80 | 3,444,820 | 0.28 | 0.28 | 1.48 | 20 |
| Year ended 08/31/17 | 51.40 | 0.88 | 5.59 | 6.47 | (0.65) | (0.16) | (0.81) | 57.06 | 12.69 | 3,318,343 | 0.28 | 0.28 | 1.62 | 24 |
| Year ended 08/31/16 | 47.30 | 0.88 | 4.61 | 5.49 | (0.77) | (0.62) | (1.39) | 51.40 | 11.97 | 2,116,654 | 0.29 | 0.29 | 1.83 | 29 |
| Year ended 08/31/15 | 48.95 | 0.80 | (1.19) | (0.39) | (0.59) | (0.67) | (1.26) | 47.30 | (0.83) | 1,945,879 | 0.29 | 0.29 | 1.61 | 21 |
| Class R6 |
| Year ended 08/31/19 | 64.83 | 1.15 | (1.40) | (0.25) | (1.05) | (2.75) | (3.80) | 60.78 | 0.29 | 1,024,706 | 0.16(d) | 0.16(d) | 1.91(d) | 22 |
| Year ended 08/31/18 | 57.15 | 0.98 | 8.56 | 9.54 | (1.02) | (0.84) | (1.86) | 64.83 | 16.96 | 1,000,614 | 0.16 | 0.16 | 1.60 | 20 |
| Year ended 08/31/17 | 51.47 | 0.95 | 5.60 | 6.55 | (0.71) | (0.16) | (0.87) | 57.15 | 12.84 | 808,668 | 0.16 | 0.16 | 1.74 | 24 |
| Year ended 08/31/16 | 47.37 | 0.97 | 4.58 | 5.55 | (0.83) | (0.62) | (1.45) | 51.47 | 12.08 | 681,025 | 0.16 | 0.16 | 1.96 | 29 |
| Year ended 08/31/15 | 48.99 | 0.87 | (1.20) | (0.33) | (0.62) | (0.67) | (1.29) | 47.37 | (0.70) | 178,731 | 0.16 | 0.16 | 1.74 | 21 |
| (a) | Calculated using average shares outstanding. |
| (b) | Includes adjustments in accordance with accounting principles generally accepted in the United States of America and as such, the net asset value for financial reporting purposes and the returns based upon those net asset values may differ from the net asset value and returns for shareholder transactions. Does not include sales charges and is not annualized for periods less than one year, if applicable. |
| (c) | Portfolio turnover is calculated at the fund level and is not annualized for periods less than one year, if applicable. |
| (d) | Ratios are based on average daily net assets (000’s omitted) of $2,207,925, $1,125,988, $134,902, $3,019,550 and $1,026,084 for Class A, Class C, Class R, Class Y and Class R6 shares, respectively. |
| (e) | The total return, ratio of expenses to average net assets and ratio of net investment income (loss) to average net assets reflect actual 12b-1 fees of 0.93% and 0.94% for the years ended August 31, 2018 and 2016, respectively. |
See accompanying Notes to Financial Statements which are an integral part of the financial statements.
| 22 | Invesco Equally-Weighted S&P 500 Fund |
Notes to Financial Statements
August 31, 2019
NOTE 1—Significant Accounting Policies
Invesco Equally-Weighted S&P 500 Fund (the “Fund”) is a series portfolio of AIM Counselor Series Trust (Invesco Counselor Series Trust) (the “Trust”). The Trust is a Delaware statutory trust registered under the Investment Company Act of 1940, as amended (the “1940 Act”), as an open-end series management investment company authorized to issue an unlimited number of shares of beneficial interest. Information presented in these financial statements pertains only to the Fund. Matters affecting the Fund or each class will be voted on exclusively by the shareholders of the Fund or each class.
The Fund’s investment objective is total return through growth of capital and current income.
The Fund currently consists of five different classes of shares: Class A, Class C, Class R, Class Y and Class R6. Class Y shares are available only to certain investors. Class A shares are sold with a front-end sales charge unless certain waiver criteria are met. Under certain circumstances, load waived shares may be subject to contingent deferred sales charges ("CDSC"). Class C shares are sold with a CDSC. Class R, Class Y and Class R6 shares are sold at net asset value. Class C shares held for ten years after purchase are eligible for automatic conversion into Class A shares of the same Fund (the "Conversion Feature"). The automatic conversion pursuant to the Conversion Feature will generally occur at the end of the month following the tenth anniversary after a purchase of Class C shares.
The Fund is an investment company and accordingly follows the investment company accounting and reporting guidance in accordance with Financial Accounting Standards Board Accounting Standards Codification Topic 946,Financial Services – Investment Companies.
The following is a summary of the significant accounting policies followed by the Fund in the preparation of its financial statements.
| A. | Security Valuations — Securities, including restricted securities, are valued according to the following policy. |
A security listed or traded on an exchange (except convertible securities) is valued at its last sales price or official closing price as of the close of the customary trading session on the exchange where the security is principally traded, or lacking any sales or official closing price on a particular day, the security may be valued at the closing bid price on that day. Securities traded in the over-the-counter market are valued based on prices furnished by independent pricing services or market makers. When such securities are valued by an independent pricing service they may be considered fair valued. Futures contracts are valued at the final settlement price set by an exchange on which they are principally traded. Listed options are valued at the mean between the last bid and asked prices from the exchange on which they are principally traded. Options not listed on an exchange are valued by an independent source at the mean between the last bid and asked prices. For purposes of determining net asset value (“NAV”) per share, futures and option contracts generally are valued 15 minutes after the close of the customary trading session of the New York Stock Exchange (“NYSE”).
Investments in open-end and closed-end registered investment companies that do not trade on an exchange are valued at the end-of-day net asset value per share. Investments in open-end and closed-end registered investment companies that trade on an exchange are valued at the last sales price or official closing price as of the close of the customary trading session on the exchange where the security is principally traded.
Debt obligations (including convertible securities) and unlisted equities are fair valued using an evaluated quote provided by an independent pricing service. Evaluated quotes provided by the pricing service may be determined without exclusive reliance on quoted prices, and may reflect appropriate factors such as institution-size trading in similar groups of securities, developments related to specific securities, dividend rate (for unlisted equities), yield (for debt obligations), quality, type of issue, coupon rate (for debt obligations), maturity (for debt obligations), individual trading characteristics and other market data. Pricing services generally value debt obligations assuming orderly transactions of institutional round lot size, but a fund may hold or transact in the same securities in smaller, odd lot sizes. Odd lots often trade at lower prices than institutional round lots. Debt obligations are subject to interest rate and credit risks. In addition, all debt obligations involve some risk of default with respect to interest and/or principal payments.
Foreign securities’ (including foreign exchange contracts) prices are converted into U.S. dollar amounts using the applicable exchange rates as of the close of the NYSE. If market quotations are available and reliable for foreign exchange-traded equity securities, the securities will be valued at the market quotations. Because trading hours for certain foreign securities end before the close of the NYSE, closing market quotations may become unreliable. If between the time trading ends on a particular security and the close of the customary trading session on the NYSE, events occur that the investment adviser determines are significant and make the closing price unreliable, the Fund may fair value the security. If the event is likely to have affected the closing price of the security, the security will be valued at fair value in good faith using procedures approved by the Board of Trustees. Adjustments to closing prices to reflect fair value may also be based on a screening process of an independent pricing service to indicate the degree of certainty, based on historical data, that the closing price in the principal market where a foreign security trades is not the current value as of the close of the NYSE. Foreign securities’ prices meeting the approved degree of certainty that the price is not reflective of current value will be priced at the indication of fair value from the independent pricing service. Multiple factors may be considered by the independent pricing service in determining adjustments to reflect fair value and may include information relating to sector indices, American Depositary Receipts and domestic and foreign index futures. Foreign securities may have additional risks including exchange rate changes, potential for sharply devalued currencies and high inflation, political and economic upheaval, the relative lack of issuer information, relatively low market liquidity and the potential lack of strict financial and accounting controls and standards.
Securities for which market prices are not provided by any of the above methods may be valued based upon quotes furnished by independent sources. The last bid price may be used to value equity securities. The mean between the last bid and asked prices is used to value debt obligations, including corporate loans.
Securities for which market quotations are not readily available or became unreliable are valued at fair value as determined in good faith by or under the supervision of the Trust’s officers following procedures approved by the Board of Trustees. Issuer specific events, market trends, bid/asked quotes of brokers and information providers and other market data may be reviewed in the course of making a good faith determination of a security’s fair value.
The Fund may invest in securities that are subject to interest rate risk, meaning the risk that the prices will generally fall as interest rates rise and, conversely, the prices will generally rise as interest rates fall. Specific securities differ in their sensitivity to changes in interest rates
| 23 | Invesco Equally-Weighted S&P 500 Fund |
depending on their individual characteristics. Changes in interest rates may result in increased market volatility, which may affect the value and/or liquidity of certain Fund investments.
Valuations change in response to many factors including the historical and prospective earnings of the issuer, the value of the issuer’s assets, general economic conditions, interest rates, investor perceptions and market liquidity. Because of the inherent uncertainties of valuation, the values reflected in the financial statements may materially differ from the value received upon actual sale of those investments.
| B. | Securities Transactions and Investment Income – Securities transactions are accounted for on a trade date basis. Realized gains or losses on sales are computed on the basis of specific identification of the securities sold. Interest income (net of withholding tax, if any) is recorded on the accrual basis from settlement date. Dividend income (net of withholding tax, if any) is recorded on the ex-dividend date. |
The Fund may periodically participate in litigation related to Fund investments. As such, the Fund may receive proceeds from litigation settlements. Any proceeds received are included in the Statement of Operations as realized gain (loss) for investments no longer held and as unrealized gain (loss) for investments still held.
Brokerage commissions and mark ups are considered transaction costs and are recorded as an increase to the cost basis of securities purchased and/or a reduction of proceeds on a sale of securities. Such transaction costs are included in the determination of net realized and unrealized gain (loss) from investment securities reported in the Statement of Operations and the Statement of Changes in Net Assets and the net realized and unrealized gains (losses) on securities per share in the Financial Highlights. Transaction costs are included in the calculation of the Fund’s net asset value and, accordingly, they reduce the Fund’s total returns. These transaction costs are not considered operating expenses and are not reflected in net investment income reported in the Statement of Operations and the Statement of Changes in Net Assets, or the net investment income per share and the ratios of expenses and net investment income reported in the Financial Highlights, nor are they limited by any expense limitation arrangements between the Fund and the investment adviser.
The Fund allocates income and realized and unrealized capital gains and losses to a class based on the relative net assets of each class.
The Fund recharacterizes distributions received from REIT investments based on information provided by the REIT into the following categories: ordinary income, long-term and short-term capital gains, and return of capital. If information is not available on a timely basis from the REIT, the recharacterization will be based on available information which may include the previous year’s allocation. If new or additional information becomes available from the REIT at a later date, a recharacterization will be made in the following year. The Fund records as dividend income the amount recharacterized as ordinary income and as realized gain the amount recharacterized as capital gain in the Statement of Operations, and the amount recharacterized as return of capital as a reduction of the cost of the related investment. These recharacterizations are reflected in the accompanying financial statements.
| C. | Country Determination — For the purposes of making investment selection decisions and presentation in the Schedule of Investments, the investment adviser may determine the country in which an issuer is located and/or credit risk exposure based on various factors. These factors include the laws of the country under which the issuer is organized, where the issuer maintains a principal office, the country in which the issuer derives 50% or more of its total revenues and the country that has the primary market for the issuer’s securities, as well as other criteria. Among the other criteria that may be evaluated for making this determination are the country in which the issuer maintains 50% or more of its assets, the type of security, financial guarantees and enhancements, the nature of the collateral and the sponsor organization. Country of issuer and/or credit risk exposure has been determined to be the United States of America, unless otherwise noted. |
| D. | Distributions– Distributions from net investment income and net realized capital gain, if any, are generally declared and paid annually and recorded on the ex-dividend date. The Fund may elect to treat a portion of the proceeds from redemptions as distributions for federal income tax purposes. |
| E. | Federal Income Taxes –The Fund intends to comply with the requirements of Subchapter M of the Internal Revenue Code of 1986, as amended (the “Internal Revenue Code”), necessary to qualify as a regulated investment company and to distribute substantially all of the Fund’s taxable earnings to shareholders. As such, the Fund will not be subject to federal income taxes on otherwise taxable income (including net realized capital gain) that is distributed to shareholders. Therefore, no provision for federal income taxes is recorded in the financial statements. |
The Fund recognizes the tax benefits of uncertain tax positions only when the position is more likely than not to be sustained. Management has analyzed the Fund’s uncertain tax positions and concluded that no liability for unrecognized tax benefits should be recorded related to uncertain tax positions. Management is not aware of any tax positions for which it is reasonably possible that the total amounts of unrecognized tax benefits will change materially in the next 12 months.
The Fund files tax returns in the U.S. Federal jurisdiction and certain other jurisdictions. Generally, the Fund is subject to examinations by such taxing authorities for up to three years after the filing of the return for the tax period.
| F. | Expenses – Fees provided for under the Rule 12b-1 plan of a particular class of the Fund are charged to the operations of such class. Transfer agency fees and expenses and other shareholder recordkeeping fees and expenses attributable to Class R6 are charged to such class. Transfer agency fees and expenses and other shareholder recordkeeping fees and expenses relating to all other classes are allocated among those classes based on relative net assets. All other expenses are allocated among the classes based on relative net assets. |
| G. | Accounting Estimates – The preparation of financial statements in conformity with accounting principles generally accepted in the United States of America (“GAAP”) requires management to make estimates and assumptions that affect the reported amounts of assets and liabilities at the date of the financial statements and the reported amounts of revenues and expenses during the reporting period including estimates and assumptions related to taxation. Actual results could differ from those estimates by a significant amount. In addition, the Fund monitors for material events or transactions that may occur or become known after the period-end date and before the date the financial statements are released to print. |
| H. | Indemnifications – Under the Trust’s organizational documents, each Trustee, officer, employee or other agent of the Trust is indemnified against certain liabilities that may arise out of the performance of their duties to the Fund. Additionally, in the normal course of business, the Fund enters into contracts, including the Fund’s servicing agreements, that contain a variety of indemnification clauses. The Fund’s maximum exposure under these arrangements is unknown as this would involve future claims that may be made against the Fund that have not yet occurred. The risk of material loss as a result of such indemnification claims is considered remote. |
| I. | Securities Lending– The Fund may lend portfolio securities having a market value up to one-third of the Fund’s total assets. Such loans are secured by collateral equal to no less than the market value of the loaned securities determined daily by the securities lending provider. Such collateral will be cash or debt securities issued or guaranteed by the U.S. Government or any of its sponsored agencies. Cash collateral received in |
| 24 | Invesco Equally-Weighted S&P 500 Fund |
| | connection with these loans is invested in short-term money market instruments or affiliated money market funds and is shown as such on the Schedule of Investments. The Fund bears the risk of loss with respect to the investment of collateral. It is the Fund’s policy to obtain additional collateral from or return excess collateral to the borrower by the end of the next business day, following the valuation date of the securities loaned. Therefore, the value of the collateral held may be temporarily less than the value of the securities on loan. When loaning securities, the Fund retains certain benefits of owning the securities, including the economic equivalent of dividends or interest generated by the security. Lending securities entails a risk of loss to the Fund if, and to the extent that, the market value of the securities loaned were to increase and the borrower did not increase the collateral accordingly, and the borrower failed to return the securities. The securities loaned are subject to termination at the option of the borrower or the Fund. Upon termination, the borrower will return to the Fund the securities loaned and the Fund will return the collateral. Upon the failure of the borrower to return the securities, collateral may be liquidated and the securities may be purchased on the open market to replace the loaned securities. The Fund could experience delays and costs in gaining access to the collateral and the securities may lose value during the delay which could result in potential losses to the Fund. Some of these losses may be indemnified by the lending agent. The Fund bears the risk of any deficiency in the amount of the collateral available for return to the borrower due to any loss on the collateral invested. Dividends received on cash collateral investments for securities lending transactions, which are net of compensation to counterparties, are included inDividends from affiliated money market funds on the Statement of Operations. The aggregate value of securities out on loan, if any, is shown as a footnote on the Statement of Assets and Liabilities. |
| J. | Futures Contracts — The Fund may enter into futures contracts to manage exposure to interest rate, equity and market price movements and/or currency risks. A futures contract is an agreement between two parties ("Counterparties") to purchase or sell a specified underlying security, currency or commodity (or delivery of a cash settlement price, in the case of an index future) for a fixed price at a future date. The Fund currently invests only in exchange-traded futures and they are standardized as to maturity date and underlying financial instrument. Initial margin deposits required upon entering into futures contracts are satisfied by the segregation of specific securities or cash as collateral at the futures commission merchant (broker). During the period the futures contracts are open, changes in the value of the contracts are recognized as unrealized gains or losses by recalculating the value of the contracts on a daily basis. Subsequent or variation margin payments are received or made depending upon whether unrealized gains or losses are incurred. These amounts are reflected as receivables or payables on the Statement of Assets and Liabilities. When the contracts are closed or expire, the Fund recognizes a realized gain or loss equal to the difference between the proceeds from, or cost of, the closing transaction and the Fund’s basis in the contract. The net realized gain (loss) and the change in unrealized gain (loss) on futures contracts held during the period is included on the Statement of Operations. The primary risks associated with futures contracts are market risk and the absence of a liquid secondary market. If the Fund were unable to liquidate a futures contract and/or enter into an offsetting closing transaction, the Fund would continue to be subject to market risk with respect to the value of the contracts and continue to be required to maintain the margin deposits on the futures contracts. Futures contracts have minimal Counterparty risk since the exchange’s clearinghouse, as Counterparty to all exchange-traded futures, guarantees the futures against default. Risks may exceed amounts recognized in the Statement of Assets and Liabilities. |
| K. | Collateral—To the extent the Fund has designated or segregated a security as collateral and that security is subsequently sold, it is the Fund’s practice to replace such collateral no later than the next business day. |
NOTE 2—Advisory Fees and Other Fees Paid to Affiliates
The Trust has entered into a master investment advisory agreement with Invesco Advisers, Inc. (the "Adviser" or "Invesco"). Under the terms of the investment advisory agreement, the Fund accrues daily and pays monthly an advisory fee to the Adviser based on the annual rate of the Fund’s average daily net assets as follows:
| Average Daily Net Assets | Rate |
| First $2 billion | 0.12% |
| Over $2 billion | 0.10% |
For the year ended August 31, 2019, the effective advisory fees incurred by the Fund was 0.11%.
Under the terms of a master sub-advisory agreement between the Adviser and each of Invesco Asset Management Deutschland GmbH, Invesco Asset Management Limited, Invesco Asset Management (Japan) Limited, Invesco Hong Kong Limited, Invesco Senior Secured Management, Inc. and Invesco Canada Ltd. and a separate sub-advisory agreement with Invesco Capital Management LLC (collectively, the "Affiliated Sub-Advisers") the Adviser, not the Fund, will pay 40% of the fees paid to the Adviser to any such Affiliated Sub-Adviser(s) that provide(s) discretionary investment management services to the Fund based on the percentage of assets allocated to such Affiliated Sub-Adviser(s).
The Adviser has contractually agreed, through at least June 30, 2020, to waive advisory fees and/or reimburse expenses of all shares to the extent necessary to limit total annual fund operating expenses after fee waiver and/or expense reimbursement (excluding certain items discussed below) of Class A, Class C, Class R, Class Y and Class R6 shares to 2.00%, 2.75%, 2.25%, 1.75% and 1.75%, respectively, of average daily net assets (the "expense limits"). In determining the Adviser’s obligation to waive advisory fees and/or reimburse expenses, the following expenses are not taken into account, and could cause the total annual fund operating expenses after fee waiver and/or expense reimbursement to exceed the numbers reflected above: (1) interest; (2) taxes; (3) dividend expense on short sales; (4) extraordinary or non-routine items, including litigation expenses; and (5) expenses that the Fund has incurred but did not actually pay because of an expense offset arrangement. Unless Invesco continues the fee waiver agreement, it will terminate on June 30, 2020. During its term, the fee waiver agreement cannot be terminated or amended to increase the expense limits or reduce the advisory fee waivers without approval of the Board of Trustees. The Adviser did not waive fees and/or reimburse expenses during the period under this expense limit.
Further, the Adviser has contractually agreed, through at least June 30, 2021, to waive the advisory fee payable by the Fund in an amount equal to 100% of the net advisory fees the Adviser receives from the affiliated money market funds on investments by the Fund of uninvested cash (excluding investments of cash collateral from securities lending) in such affiliated money market funds.
For the year ended August 31, 2019, the Adviser waived advisory fees of $51,302.
The Trust has entered into a master administrative services agreement with Invesco pursuant to which the Fund has agreed to pay Invesco for certain administrative costs incurred in providing accounting services to the Fund. For the year ended August 31, 2019, expenses incurred under the
| 25 | Invesco Equally-Weighted S&P 500 Fund |
agreement are shown in the Statement of Operations asAdministrative services fees. Also, Invesco has entered into a sub-administration agreement whereby State Street Bank and Trust Company (“SSB”) serves as custodian and fund accountant and provides certain administrative services to the Fund.
The Trust has entered into a transfer agency and service agreement with Invesco Investment Services, Inc. (“IIS”) pursuant to which the Fund has agreed to pay IIS a fee for providing transfer agency and shareholder services to the Fund and reimburse IIS for certain expenses incurred by IIS in the course of providing such services. IIS may make payments to intermediaries that provide omnibus account services, sub-accounting services and/or networking services. All fees payable by IIS to intermediaries that provide omnibus account services or sub-accounting services are charged back to the Fund, subject to certain limitations approved by the Trust’s Board of Trustees. For the year ended August 31, 2019, expenses incurred under the agreement are shown in the Statement of Operations asTransfer agent fees.
Shares of the Fund are distributed by Invesco Distributors, Inc. (“IDI”). The Fund has adopted a distribution plan pursuant to Rule 12b-1 under the 1940 Act, and a service plan (collectively, the “Plans”) for Class A shares, Class C shares and Class R shares to compensate IDI for the sale, distribution, shareholder servicing and maintenance of shareholder accounts for these shares. Under the Plans, the Fund will incur annual fees of up to 0.25% of Class A average daily net assets and up to 1.00% of Class C average daily net assets and 0.50% of Class R average daily net assets. The fees are accrued daily and paid monthly. For the year ended August 31, 2019, expenses incurred under these agreements are shown in the Statement of Operations as Distribution fees.
Front-end sales commissions and CDSC (collectively, the “sales charges”) are not recorded as expenses of the Fund. Front-end sales commissions are deducted from proceeds from the sales of Fund shares prior to investment in Class A shares of the Fund. CDSC are deducted from redemption proceeds prior to remittance to the shareholder. During the year ended August 31, 2019, IDI advised the Fund that IDI retained $547,994 in front-end sales commissions from the sale of Class A shares and $16,264 and $86,371 from Class A and Class C shares, respectively, for CDSC imposed upon redemptions by shareholders.
Certain officers and trustees of the Trust are officers and directors of the Adviser, IIS and/or IDI.
NOTE 3—Additional Valuation Information
GAAP defines fair value as the price that would be received to sell an asset or paid to transfer a liability in an orderly transaction between market participants at the measurement date, under current market conditions. GAAP establishes a hierarchy that prioritizes the inputs to valuation methods, giving the highest priority to readily available unadjusted quoted prices in an active market for identical assets (Level 1) and the lowest priority to significant unobservable inputs (Level 3), generally when market prices are not readily available or are unreliable. Based on the valuation inputs, the securities or other investments are tiered into one of three levels. Changes in valuation methods may result in transfers in or out of an investment’s assigned level:
Level 1 – Prices are determined using quoted prices in an active market for identical assets.
Level 2 – Prices are determined using other significant observable inputs. Observable inputs are inputs that other market participants may use in pricing a security. These may include quoted prices for similar securities, interest rates, prepayment speeds, credit risk, yield curves, loss severities, default rates, discount rates, volatilities and others.
Level 3 – Prices are determined using significant unobservable inputs. In situations where quoted prices or observable inputs are unavailable (for example, when there is little or no market activity for an investment at the end of the period), unobservable inputs may be used. Unobservable inputs reflect the Fund’s own assumptions about the factors market participants would use in determining fair value of the securities or instruments and would be based on the best available information.
The following is a summary of the tiered valuation input levels, as of August 31, 2019. The level assigned to the securities valuations may not be an indication of the risk or liquidity associated with investing in those securities. Because of the inherent uncertainties of valuation, the values reflected in the financial statements may materially differ from the value received upon actual sale of those investments.
| | Level 1 | Level 2 | Level 3 | Total |
| Investments in Securities | | | | |
| Common Stocks & Other Equity Interests | $7,334,958,834 | $— | $— | $7,334,958,834 |
| Money Market Funds | 58,996,560 | — | — | 58,996,560 |
| Total Investments in Securities | 7,393,955,394 | — | — | 7,393,955,394 |
| Other Investments - Assets* | | | | |
| Futures Contracts | 670,596 | — | — | 670,596 |
| Total Investments | $7,394,625,990 | $— | $— | $7,394,625,990 |
| * | Unrealized appreciation. |
NOTE 4—Derivative Investments
The Fund may enter into an International Swaps and Derivatives Association Master Agreement (“ISDA Master Agreement”) under which a fund may trade OTC derivatives. An OTC transaction entered into under an ISDA Master Agreement typically involves a collateral posting arrangement, payment netting provisions and close-out netting provisions. These netting provisions allow for reduction of credit risk through netting of contractual obligations. The enforceability of the netting provisions of the ISDA Master Agreement depends on the governing law of the ISDA Master Agreement, among other factors.
For financial reporting purposes, the Fund does not offset OTC derivative assets or liabilities that are subject to ISDA Master Agreements in the Statement of Assets and Liabilities.
| 26 | Invesco Equally-Weighted S&P 500 Fund |
Value of Derivative Investments at Period-End
The table below summarizes the value of the Fund’s derivative investments, detailed by primary risk exposure, held as of August 31, 2019:
| | Value |
| Derivative Assets | Equity
Risk |
| Unrealized appreciation on futures contracts — Exchange-Traded(a) | $670,596 |
| Derivatives not subject to master netting agreements | (670,596) |
| Total Derivative Assets subject to master netting agreements | $- |
| (a) | Only current day’s variation margin receivable (payable) is reported within the Statement of Assets and Liabilities. |
Effect of Derivative Investments for the year ended August 31, 2019
The table below summarizes the gains (losses) on derivative investments, detailed by primary risk exposure, recognized in earnings during the period:
| | Location of Gain (Loss) on
Statement of Operations |
| | Equity
Risk |
| Realized Gain (Loss): | |
| Futures contracts | $(4,642,550) |
| Change in Net Unrealized Appreciation (Depreciation): | |
| Futures contracts | (16,845) |
| Total | $(4,659,395) |
The table below summarizes the average notional value of derivatives held during the period.
| | Futures
Contracts |
| Average notional value | $59,557,103 |
NOTE 5—Investments in Affiliates
The Fund’s Adviser is a subsidiary of Invesco Ltd. and therefore, Invesco Ltd. is considered to be affiliated with the Fund. The following is a summary of the transactions in, and earnings from, investments in Invesco Ltd. for the year ended August 31, 2019.
| | Value
08/31/18 | Purchases
at Cost | Proceeds
from Sales | Change in
Unrealized
Appreciation
(Depreciation) | Realized
Gain (Loss) | Value
08/31/19 | Dividend
Income |
| Invesco Ltd. | $13,432,569 | $5,544,659 | $(2,512,618) | $(3,544,765) | $(1,720,046) | $11,199,799 | $907,851 |
NOTE 6—Expense Offset Arrangement(s)
The expense offset arrangement is comprised of transfer agency credits which result from balances in demand deposit accounts used by the transfer agent for clearing shareholder transactions. For the year ended August 31, 2019, the Fund received credits from this arrangement, which resulted in the reduction of the Fund’s total expenses of $12,459.
NOTE 7—Trustees’ and Officers’ Fees and Benefits
Trustees’ and Officers’ Fees and Benefits include amounts accrued by the Fund to pay remuneration to certain Trustees and Officers of the Fund. Trustees have the option to defer compensation payable by the Fund, and Trustees’ and Officers’ Fees and Benefits also include amounts accrued by the Fund to fund such deferred compensation amounts. Those Trustees who defer compensation have the option to select various Invesco Funds in which their deferral accounts shall be deemed to be invested. Finally, certain current Trustees were eligible to participate in a retirement plan that provided for benefits to be paid upon retirement to Trustees over a period of time based on the number of years of service. The Fund may have certain former Trustees who also participate in a retirement plan and receive benefits under such plan.Trustees’ and Officers’ Fees and Benefits include amounts accrued by the Fund to fund such retirement benefits. Obligations under the deferred compensation and retirement plans represent unsecured claims against the general assets of the Fund.
NOTE 8—Cash Balances
The Fund is permitted to temporarily carry a negative or overdrawn balance in its account with SSB, the custodian bank. Such balances, if any at period-end, are shown in the Statement of Assets and Liabilities under the payable captionAmount due custodian. To compensate the custodian bank for such overdrafts, the overdrawn Fund may either (1) leave funds as a compensating balance in the account so the custodian bank can be compensated by earning the additional interest; or (2) compensate by paying the custodian bank at a rate agreed upon by the custodian bank and Invesco, not to exceed the contractually agreed upon rate. The Fund may not purchase additional securities when any borrowings from banks or broker-dealers exceed 5% of the Fund’s total assets, or when any borrowings from an Invesco Fund are outstanding.
| 27 | Invesco Equally-Weighted S&P 500 Fund |
NOTE 9—Distributions to Shareholders and Tax Components of Net Assets
| Tax Character of Distributions to Shareholders Paid During the Fiscal Years Ended August 31, 2019 and August 31, 2018 |
| | 2019 | 2018 |
| Ordinary income | $160,036,754 | $184,421,358 |
| Long-term capital gain | 285,010,548 | 36,755,248 |
| Total distributions | $445,047,302 | $221,176,606 |
| Tax Components of Net Assets at Period-End: |
| | 2019 |
| Undistributed ordinary income | $90,317,940 |
| Undistributed long-term capital gain | 172,280,396 |
| Net unrealized appreciation — investments | 2,283,944,281 |
| Temporary book/tax differences | (234,137) |
| Shares of beneficial interest | 4,835,429,322 |
| Total net assets | $7,381,737,802 |
The difference between book-basis and tax-basis unrealized appreciation (depreciation) is due to differences in the timing of recognition of gains and losses on investments for tax and book purposes. The Fund’s net unrealized appreciation difference is attributable primarily to wash sales.
The temporary book/tax differences are a result of timing differences between book and tax recognition of income and/or expenses. The Fund’s temporary book/tax differences are the result of the trustee deferral of compensation and retirement plan benefits.
Capital loss carryforward is calculated and reported as of a specific date. Results of transactions and other activity after that date may affect the amount of capital loss carryforward actually available for the Fund to utilize. Capital losses generated in years beginning after December 22, 2010 can be carried forward for an unlimited period, whereas previous losses expire in eight tax years. Capital losses with an expiration period may not be used to offset capital gains until all net capital losses without an expiration date have been utilized. Capital loss carryforwards with no expiration date will retain their character as either short-term or long-term capital losses instead of as short-term capital losses as under prior law. The ability to utilize capital loss carryforwards in the future may be limited under the Internal Revenue Code and related regulations based on the results of future transactions.
The Fund does not have a capital loss carryforward as of August 31, 2019.
NOTE 10—Investment Transactions
The aggregate amount of investment securities (other than short-term securities, U.S. Treasury obligations and money market funds, if any) purchased and sold by the Fund during the year ended August 31, 2019 was $1,667,052,128 and $2,166,259,784, respectively. Cost of investments, including any derivatives, on a tax basis includes the adjustments for financial reporting purposes as of the most recently completed federal income tax reporting period-end.
| Unrealized Appreciation (Depreciation) of Investments on a Tax Basis |
| Aggregate unrealized appreciation of investments | $2,604,814,274 |
| Aggregate unrealized (depreciation) of investments | (320,869,993) |
| Net unrealized appreciation of investments | $2,283,944,281 |
Cost of investments for tax purposes is $5,110,681,709.
NOTE 11—Reclassification of Permanent Differences
Primarily as a result of differing book/tax treatment of real estate investment trusts, on August 31, 2019, undistributed net investment income was increased by $40,155 and undistributed net realized gain was decreased by $40,155. This reclassification had no effect on the net assets or the distributable earnings of the Fund.
NOTE 12—Share Information
| | Summary of Share Activity |
| | Years ended August 31, |
| | 2019(a) | | 2018 |
| | Shares | Amount | | Shares | Amount |
| Sold: | | | | | |
| Class A | 6,431,372 | $379,100,243 | | 5,770,756 | $348,451,748 |
| Class B(b) | - | - | | 680 | 39,286 |
| Class C | 3,089,072 | 172,589,506 | | 3,167,491 | 183,252,922 |
| Class R | 725,805 | 42,459,696 | | 691,345 | 41,539,901 |
| Class Y | 13,001,038 | 769,734,746 | | 13,675,120 | 832,580,158 |
| Class R6 | 4,453,071 | 270,465,358 | | 5,330,475 | 319,399,367 |
| 28 | Invesco Equally-Weighted S&P 500 Fund |
| | Summary of Share Activity |
| | Years ended August 31, |
| | 2019(a) | | 2018 |
| | Shares | Amount | | Shares | Amount |
| Issued as reinvestment of dividends: | | | | | |
| Class A | 2,146,740 | $115,601,820 | | 935,175 | $55,568,115 |
| Class B(b) | - | - | | 826 | 48,839 |
| Class C | 1,121,642 | 57,865,538 | | 424,100 | 24,199,130 |
| Class R | 138,220 | 7,408,583 | | 57,829 | 3,421,169 |
| Class Y | 2,749,406 | 149,430,198 | | 1,357,075 | 81,343,086 |
| Class R6 | 1,163,347 | 63,274,464 | | 505,764 | 30,345,827 |
| Conversion of Class B shares to Class A shares:(c) | | | | | |
| Class A | - | - | | 41,105 | 2,597,848 |
| Class B | - | - | | (41,102) | (2,597,848) |
| Automatic conversion of Class C shares to Class A shares: | | | | | |
| Class A | 1,518,737 | 85,282,138 | | - | - |
| Class C | (1,587,017) | (85,282,138) | | - | - |
| Reacquired: | | | | | |
| Class A | (8,662,062) | (508,633,221) | | (8,160,022) | (492,010,078) |
| Class B(b) | - | - | | (13,501) | (792,049) |
| Class C | (4,151,241) | (232,647,924) | | (3,964,268) | (228,920,198) |
| Class R | (749,556) | (44,083,573) | | (952,042) | (57,053,916) |
| Class Y | (21,134,800) | (1,250,102,075) | | (19,961,043) | (1,209,716,970) |
| Class R6 | (4,190,828) | (251,822,079) | | (4,551,974) | (279,271,182) |
| Net increase (decrease) in share activity | (3,937,054) | $(259,358,720) | | (5,686,211) | $(347,574,845) |
| (a) | There are entities that are record owners of more than 5% of the outstanding shares of the Fund and in the aggregate own 40% of the outstanding shares of the Fund. IDI has an agreement with these entities to sell Fund shares. The Fund, Invesco and/or Invesco affiliates may make payments to these entities, which are considered to be related to the Fund, for providing services to the Fund, Invesco and/or Invesco affiliates including but not limited to services such as securities brokerage, distribution, third party record keeping and account servicing. The Fund has no knowledge as to whether all or any portion of the shares owned of record by these entities are also owned beneficially. |
| (b) | Class B shares activity for the period September 1, 2017 through January 26, 2018 (date of conversion). |
| (c) | Effective as of the close of business January 26, 2018, all outstanding Class B shares were converted to Class A shares. |
| 29 | Invesco Equally-Weighted S&P 500 Fund |
Report of Independent Registered Public Accounting Firm
To the Board of Trustees of AIM Counselor Series Trust (Invesco Counselor Series Trust) and Shareholders of Invesco Equally-Weighted S&P 500 Fund
Opinion on the Financial Statements
We have audited the accompanying statement of assets and liabilities, including the schedule of investments, of Invesco Equally-Weighted S&P 500 Fund (one of the funds constituting AIM Counselor Series Trust (Invesco Counselor Series Trust), hereafter referred to as the "Fund") as of August 31, 2019, the related statement of operations for the year ended August 31, 2019, the statement of changes in net assets for each of the two years in the period ended August 31, 2019, including the related notes, and the financial highlights for each of the five years in the period ended August 31, 2019 (collectively referred to as the "financial statements"). In our opinion, the financial statements present fairly, in all material respects, the financial position of the Fund as of August 31, 2019, the results of its operations for the year then ended, the changes in its net assets for each of the two years in the period ended August 31, 2019 and the financial highlights for each of the five years in the period ended August 31, 2019 in conformity with accounting principles generally accepted in the United States of America.
Basis for Opinion
These financial statements are the responsibility of the Fund’s management. Our responsibility is to express an opinion on the Fund’s financial statements based on our audits. We are a public accounting firm registered with the Public Company Accounting Oversight Board (United States) (PCAOB) and are required to be independent with respect to the Fund in accordance with the U.S. federal securities laws and the applicable rules and regulations of the Securities and Exchange Commission and the PCAOB.
We conducted our audits of these financial statements in accordance with the standards of the PCAOB. Those standards require that we plan and perform the audit to obtain reasonable assurance about whether the financial statements are free of material misstatement, whether due to error or fraud.
Our audits included performing procedures to assess the risks of material misstatement of the financial statements, whether due to error or fraud, and performing procedures that respond to those risks. Such procedures included examining, on a test basis, evidence regarding the amounts and disclosures in the financial statements. Our audits also included evaluating the accounting principles used and significant estimates made by management, as well as evaluating the overall presentation of the financial statements. Our procedures included confirmation of securities owned as of August 31, 2019 by correspondence with the custodian, transfer agent and brokers; when replies were not received from brokers, we performed other auditing procedures. We believe that our audits provide a reasonable basis for our opinion.
/s/ PricewaterhouseCoopers LLP
Houston, Texas
October 29, 2019
We have served as the auditor of one or more of the investment companies in the Invesco group of investment companies since at least 1995. We have not been able to determine the specific year we began serving as auditor.
| 30 | Invesco Equally-Weighted S&P 500 Fund |
Calculating your ongoing Fund expenses
Example
As a shareholder of the Fund, you incur two types of costs: (1) transaction costs, which may include sales charges (loads) on purchase payments or contingent deferred sales charges on redemptions, if any; and (2) ongoing costs, including management fees, distribution and/or service (12b-1) fees, and other Fund expenses. This example is intended to help you understand your ongoing costs (in dollars) of investing in the Fund and to compare these costs with ongoing costs of investing in other mutual funds. The example is based on an investment of $1,000 invested at the beginning of the period and held for the entire period March 1, 2019 through August 31, 2019.
Actual expenses
The table below provides information about actual account values and actual expenses. You may use the information in this table, together with the amount you invested, to estimate the expenses that you paid over the period. Simply divide your account value by $1,000 (for example, an $8,600 account value divided by $1,000 = 8.6), then multiply the result by the number in the table under the heading entitled “Actual Expenses Paid During Period” to estimate the expenses you paid on your account during this period.
Hypothetical example for comparison purposes
The table below also provides information about hypothetical account values and hypothetical expenses based on the Fund’s actual expense ratio and an assumed rate of return of 5% per year before expenses, which is not the Fund’s actual return.
The hypothetical account values and expenses may not be used to estimate the actual ending account balance or expenses you paid for the period. You may use this information to compare the ongoing costs of investing in the Fund and other funds. To do so, compare this 5% hypothetical example with the 5% hypothetical examples that appear in the shareholder reports of the other funds.
Please note that the expenses shown in the table are meant to highlight your ongoing costs only and do not reflect any transaction costs, such as sales charges (loads) on purchase payments or contingent deferred sales charges on redemptions, if any. Therefore, the hypothetical information is useful in comparing ongoing costs only, and will not help you determine the relative total costs of owning different funds. In addition, if these transaction costs were included, your costs would have been higher.
| | Beginning
Account Value (03/01/19) | ACTUAL | HYPOTHETICAL
(5% annual return before
expenses) | Annualized
Expense
Ratio |
Ending
Account Value
(08/31/19)1 | Expenses
Paid During
Period2 | Ending
Account Value
(08/31/19) | Expenses
Paid During
Period2 |
| Class A | $1,000.00 | $1,020.20 | $2.65 | $1,022.58 | $2.65 | 0.52% |
| Class C | 1,000.00 | 1,016.40 | 6.45 | 1,018.80 | 6.46 | 1.27 |
| Class R | 1,000.00 | 1,019.10 | 3.92 | 1,021.32 | 3.92 | 0.77 |
| Class Y | 1,000.00 | 1,021.60 | 1.38 | 1,023.84 | 1.38 | 0.27 |
| Class R6 | 1,000.00 | 1,022.40 | 0.82 | 1,024.40 | 0.82 | 0.16 |
| 1 | The actual ending account value is based on the actual total return of the Fund for the period March 1, 2019 through August 31, 2019, after actual expenses and will differ from the hypothetical ending account value which is based on the Fund’s expense ratio and a hypothetical annual return of 5% before expenses. |
| 2 | Expenses are equal to the Fund’s annualized expense ratio as indicated above multiplied by the average account value over the period, multiplied by 184/365 to reflect the most recent fiscal half year. |
| 31 | Invesco Equally-Weighted S&P 500 Fund |
Approval of Investment Advisory and Sub-Advisory Contracts
At meetings held on June 10, 2019, the Board of Trustees (the Board or the Trustees) of AIM Counselor Series Trust (Invesco Counselor Series Trust) as a whole, and the independent Trustees, who comprise over 75% of the Board, voting separately, approved the continuance of the Invesco Equally-Weighted S&P 500 Fund’s (the Fund) Master Investment Advisory Agreement with Invesco Advisers, Inc. (Invesco Advisers and the investment advisory agreement) and the Master IntergroupSub-Advisory Contract for Mutual Funds with Invesco Asset Management Deutschland GmbH, Invesco Asset Management Limited, Invesco Asset Management (Japan) Limited, Invesco Hong Kong Limited, Invesco Senior Secured Management, Inc. and Invesco Canada Ltd. and a separatesub-advisory contract with Invesco Capital Management LLC (collectively, the AffiliatedSub-Advisers and thesub-advisory contracts) for another year, effective July 1, 2019. After evaluating the factors discussed below, among others, the Board approved the renewal of the Fund’s investment advisory agreement and thesub-advisory contracts and determined that the compensation payable by the Fund to Invesco Advisers and by Invesco Advisers to the AffiliatedSub-Advisers is fair and reasonable.
The Board’s Evaluation Process
The Board’s Investments Committee has established threeSub-Committees, which meet throughout the year to review the performance of funds advised by Invesco Advisers (the Invesco Funds). As part of a regularly scheduled basis ofin-person Board meetings, theSub-Committees meet with portfolio managers for their assigned Invesco Funds and other members of management to review detailed information about investment performance and portfolio attributes of these funds. The Board took into account evaluations and reports that it received from the Investments Committee andSub-Committees, as well as the information provided to such committees and the Board throughout the year, in considering whether to approve each Invesco Fund’s investment advisory agreement andsub-advisory contracts.
As part of the contract renewal process, the Board reviews and considers information provided in response to detailed requests for information submitted to management by the independent Trustees with assistance from legal counsel to the independent Trustees. The Board receives comparative investment performance and fee data regarding the Invesco Funds prepared by Invesco Advisers and Broadridge Financial Solutions, Inc. (Broadridge), an independent mutual fund data provider. The Board also receives an independent written evaluation from the Senior Officer, an officer of the Invesco Funds who reports directly to the independent Trustees. The Senior Officer’s
evaluation is prepared as part of his responsibility to manage the process by which the Invesco Funds’ proposed management fees are negotiated during the annual contract renewal process to ensure they are negotiated in a manner that is at arms’ length and reasonable. In addition to meetings with Invesco Advisers and fund counsel throughout the year, the independent Trustees also discuss the continuance of the investment advisory agreement andsub-advisory contracts in separate sessions with the Senior Officer and with independent legal counsel.
The discussion below is a summary of the Senior Officer’s independent written evaluation with respect to the Fund’s investment advisory agreement, as well as a discussion of the material factors and related conclusions that formed the basis for the Board’s approval of the Fund’s investment advisory agreement andsub-advisory contracts. The Trustees’ review and conclusions are based on the comprehensive consideration of all information presented to them during the course of the year and in prior years and are not the result of any single determinative factor. Moreover, one Trustee may have weighed a particular piece of information or factor differently than another Trustee. This information is current as of June 10, 2019.
Factors and Conclusions and Summary of Independent Written Fee Evaluation
| A. | Nature, Extent and Quality of Services Provided by Invesco Advisers and the AffiliatedSub-Advisers |
The Board reviewed the nature, extent and quality of the advisory services provided to the Fund by Invesco Advisers under the Fund’s investment advisory agreement, and the credentials and experience of the officers and employees of Invesco Advisers who provide these services, including the Fund’s portfolio manager(s). The Board’s review included consideration of Invesco Advisers’ investment process oversight and structure, credit analysis and investment risk management. The Board also considerednon-advisory services that Invesco Advisers and its affiliates provide to the Invesco Funds such as various back office support functions, third party oversight, internal audit, valuation, portfolio trading and legal and compliance. The Board also received and reviewed information about Invesco Advisers’ role as administrator of the Invesco Funds’ liquidity risk management program. The Board also reviewed and considered the benefits to shareholders of investing in a fund that is part of the Invesco family of funds under the umbrella of Invesco Ltd., Invesco Advisers’ parent company, and noted Invesco Ltd.’s depth and experience in conducting an investment management business, as well as its commitment of financial and other resources to
such business. The Board reviewed and considered information about the resources that Invesco Advisers intends to continue to commit to managing the Invesco family of funds following Invesco Ltd.’s acquisition of OppenheimerFunds, Inc. and its subsidiaries. The Board concluded that the nature, extent and quality of the services provided to the Fund by Invesco Advisers are appropriate and satisfactory.
The Board reviewed the services that may be provided by the AffiliatedSub-Advisers under thesub-advisory contracts and the credentials and experience of the officers and employees of the AffiliatedSub-Advisers who provide these services. The Board noted the AffiliatedSub-Advisers’ expertise with respect to certain asset classes and that the AffiliatedSub-Advisers have offices and personnel that are located in financial centers around the world. As a result, the Board noted that the AffiliatedSub-Advisers can provide research and investment analysis on the markets and economies of various countries in which the Fund may invest, make recommendations regarding securities and assist with security trades. The Board concluded that thesub-advisory contracts may benefit the Fund and its shareholders by permitting Invesco Advisers to use the resources and talents of the AffiliatedSub-Advisers in managing the Fund. The Board concluded that the nature, extent and quality of the services that may be provided by the AffiliatedSub-Advisers are appropriate and satisfactory.
| B. | Fund Investment Performance |
The Board considered Fund investment performance as a relevant factor in considering whether to approve the investment advisory agreement. The Board did not view Fund investment performance as a relevant factor in considering whether to approve thesub-advisory contracts for the Fund, as no AffiliatedSub-Adviser currently manages assets of the Fund.
The Board compared the Fund’s investment performance over multiple time periods ending December 31, 2018 to the performance of funds in the Broadridge performance universe and against the LipperMulti-Cap Core Funds Index. The Board noted that performance of Class A shares of the Fund was in the third quintile of its performance universe for the one and three year periods, and the second quintile for the five year period (the first quintile being the best performing funds and the fifth quintile being the worst performing funds). The Board noted that performance of Class A shares of the Fund was reasonably comparable to the performance of the Index for the one, three and five year periods. The Board noted that the Fund is passively managed and discussed reasons for differences in the Fund’s performance versus its peers. The Trustees also reviewed more recent
32 Invesco Equally-Weighted S&P 500 Fund
Fund performance and this review did not change their conclusions.
| C. | Advisory andSub-Advisory Fees and Fund Expenses |
The Board compared the Fund’s contractual management fee rate to the contractual management fee rates of funds in the Fund’s Broadridge expense group. The Board noted that the contractual management fee rate for Class A shares of the Fund was below the median contractual management fee rate of funds in its expense group. The Board noted that the term “contractual management fee” for funds in the expense group may include both advisory and certainnon-portfolio management administrative services fees, but that Broadridge does not provide information on a fund by fund basis as to what is included. The Board also reviewed the methodology used by Broadridge in providing expense group information, which includes using each fund’s contractual management fee schedule (including any applicable breakpoints) as reported in the most recent prospectus or statement of additional information for each fund in the expense group. The Board also considered comparative information regarding the Fund’s total expense ratio and its various components. The Board noted that there were only four funds (including the Fund) in the expense group.
The Board noted that Invesco Advisers has contractually agreed to waive fees and/or limit expenses of the Fund for the term disclosed in the Fund’s registration statement in an amount necessary to limit total annual operating expenses to a specified percentage of average daily net assets for each class of the Fund.
The Board also considered the fees charged by Invesco Advisers and the AffiliatedSub-Advisers to other similarly managed client accounts. The Board noted that Invesco Advisers or the AffiliatedSub-Advisers may charge lower fees to large institutional clients. Invesco Advisers reviewed with the Board differences in the scope of services it provides to the Invesco Funds relative to certain other types of client accounts, including management of cash flows as a result of redemptions and purchases, necessary infrastructure such as officers, office space, technology, legal and distribution, oversight of service providers, costs and business risks associated with launching new funds and sponsoring and maintaining the product line, preparation of annual registration statement updates and financial information and compliance with federal and state laws and regulations.
The Board also considered the services that may be provided by the AffiliatedSub-Advisers pursuant to thesub-advisory contracts, as well as the fees payable by Invesco Advisers to the AffiliatedSub-Advisers pursuant to thesub-advisory contracts.
| D. | Economies of Scale and Breakpoints |
The Board considered the extent to which there may be economies of scale in the provision of advisory services to the Fund. The Board
considered Invesco’s reinvestment in its business, including investments in business infrastructure and cybersecurity. The Board also considered that the Fund benefits from economies of scale through contractual breakpoints in the Fund’s advisory fee schedule, which generally operate to reduce the Fund’s expense ratio as it grows in size. The Board noted that the Fund shares directly in economies of scale through lower fees charged by third party service providers based on the combined size of the Invesco Funds. The Board noted that the Fund may also benefit from economies of scale through initial fee setting, fee waivers and expense reimbursements.
| E. | Profitability and Financial Resources |
The Board reviewed information from Invesco Advisers concerning the costs of the advisory and other services that Invesco Advisers and its affiliates provide to the Fund and the Invesco Funds and the profitability of Invesco Advisers and its affiliates in providing these services. The Board considered the methodology used for calculating profitability and noted the periodic review of such methodology by an independent consultant. The Board noted that Invesco Advisers continues to operate at a net profit from services Invesco Advisers and its affiliates provide to the Invesco Funds. The Board received information from Invesco Advisers demonstrating that Invesco Advisers and the AffiliatedSub-Advisers are financially sound and have the resources necessary to perform their obligations under the investment advisory agreement andsub-advisory contracts.
| F. | Collateral Benefits to Invesco Advisers and its Affiliates |
The Board considered various other benefits received by Invesco Advisers and its affiliates from the relationship with the Fund, including the fees received for providing administrative, transfer agency and distribution services to the Fund. The Board considered comparative information regarding fees charged for these services, including information provided by Broadridge and other independent sources. The Board considered the performance of Invesco Advisers and its affiliates in providing these services and the organizational structure employed to provide these services. The Board also considered that these services are provided to the Fund pursuant to written contracts that are reviewed and approved on an annual basis by the Board; and that the services are required for the operation of the Fund.
The Board considered the benefits realized by Invesco Advisers and the AffiliatedSub-Advisers as a result of portfolio brokerage transactions executed through “soft dollar” arrangements. The Board noted that soft dollar arrangements may result in the Fund bearing costs to purchase research that may be used by Invesco Advisers or the AffiliatedSub-Advisers with other clients and may reduce Invesco Advisers’ or the AffiliatedSub-Advisers’ expenses. The Board also considered that it receives periodic reports from Invesco representing that these arrangements are consistent with regulatory
requirements. The Board did not deem the soft dollar arrangements to be inappropriate.
The Board considered that the Fund’s uninvested cash and cash collateral from any securities lending arrangements may be invested in money market funds advised by Invesco Advisers pursuant to procedures approved by the Board. The Board considered information regarding the returns of the affiliated money market funds relative to comparable overnight investments, as well as the costs to the Fund of such investments. The Board noted that Invesco Advisers receives advisory fees from these affiliated money market funds attributable to such investments, although Invesco Advisers has contractually agreed to waive through varying periods the advisory fees payable by the Invesco Funds with respect to certain investments in the affiliated money market funds. The waiver is in an amount equal to 100% of the net advisory fee Invesco Advisers receives from the affiliated money market funds with respect to the Fund’s investment in the affiliated money market funds of uninvested cash, but not cash collateral. The Board concluded that the amount of advisory fees received by Invesco Advisers from the Fund’s investment of cash collateral from any securities lending arrangements in the affiliated money market funds is fair and reasonable.
The Board also considered that an affiliated broker may receive commissions for executing certain trades for the Fund. Invesco Advisers and the AffiliatedSub-Advisers may use the affiliated broker to, among other things, control order routing and minimize information leakage, and the Board was advised that such trades are executed in compliance with rules under the federal securities laws and consistent with best execution obligations.
33 Invesco Equally-Weighted S&P 500 Fund
Tax Information
Form 1099-DIV, Form 1042-S and other year–end tax information provide shareholders with actual calendar year amounts that should be included in their tax returns. Shareholders should consult their tax advisers.
The following distribution information is being provided as required by the Internal Revenue Code or to meet a specific state’s requirement.
The Fund designates the following amounts or, if subsequently determined to be different, the maximum amount allowable for its fiscal year ended August 31, 2019:
| Federal and State Income Tax | |
| Long-Term Capital Gain Distributions | $285,010,548 |
| Qualified Dividend Income* | 76.06% |
| Corporate Dividends Received Deduction* | 72.15% |
| Qualified Business Income (199A) | 1.91% |
| U.S. Treasury Obligations* | 0.00% |
| * | The above percentages are based on ordinary income dividends paid to shareholders during the Fund’s fiscal year. |
| 34 | Invesco Equally-Weighted S&P 500 Fund |
Trustees and Officers
The address of each trustee and officer is AIM Counselor Series Trust (Invesco Counselor Series Trust) (the “Trust”), 11 Greenway Plaza, Suite 1000, Houston, Texas 77046-1173. The trustees serve for the life of the Trust, subject to their earlier death, incapacitation, resignation, retirement or removal as more specifically provided in the Trust’s organizational documents. Each officer serves for a one year term or until their successors are elected and qualified. Column two below includes length of time served with predecessor entities, if any.
| | | | | | | | |
Name, Year of Birth and Position(s) Held with the Trust | | Trustee and/ or Officer Since | | Principal Occupation(s) During Past 5 Years | | Number of Funds in Fund
Complex
Overseen by
Trustee | | Other Directorship(s) Held by Trustee During Past 5 Years |
| Interested Persons | | | | | | | | |
Martin L. Flanagan1 — 1960 Trustee and Vice Chair | | 2007 | | Executive Director, Chief Executive Officer and President, Invesco Ltd. (ultimate parent of Invesco and a global investment management firm); Trustee and Vice Chair, The Invesco Funds; Vice Chair, Investment Company Institute; and Member of Executive Board, SMU Cox School of Business Formerly: Advisor to the Board, Invesco Advisers, Inc. (formerly known as Invesco Institutional (N.A.), Inc.); Chairman and Chief Executive Officer, Invesco Advisers, Inc. (registered investment adviser); Director, Chairman, Chief Executive Officer and President, Invesco Holding Company (US), Inc. (formerly IVZ Inc.) (holding company), Invesco Group Services, Inc. (service provider) and Invesco North American Holdings, Inc. (holding company); Director, Chief Executive Officer and President, Invesco Holding Company Limited (parent of Invesco and a global investment management firm); Director, Invesco Ltd.; Chairman, Investment Company Institute and President,Co-Chief Executive Officer,Co-President, Chief Operating Officer and Chief Financial Officer, Franklin Resources, Inc. (global investment management organization) | | 229 | | None |
Philip A. Taylor2 — 1954 Trustee | | 2006 | | Vice Chair, Invesco Ltd.; Trustee, The Invesco Funds Formerly: Director, Invesco Canada Ltd. (formerly known as Invesco Trimark Ltd./Invesco Trimark Ltèe) (registered investment adviser and registered transfer agent); Head of the Americas and Senior Managing Director, Invesco Ltd.; Director, Invesco Advisers, Inc. (formerly known as Invesco Institutional (N.A.), Inc.) (registered investment adviser); Director and Chairman, Invesco Investment Services, Inc. (formerly known as Invesco AIM Investment Services, Inc.) (registered transfer agent); Chief Executive Officer, Invesco Corporate Class Inc. (corporate mutual fund company); Chairman and Chief Executive Officer, Invesco Canada Ltd. (formerly known as Invesco Trimark Ltd./Invesco Trimark Ltèe) (registered investment adviser and registered transfer agent); Senior Vice President, The Invesco Funds; Director, Invesco Investment Advisers LLC (formerly known as Van Kampen Asset Management); Director, Chairman, Chief Executive Officer and President, Invesco Management Group, Inc. (formerly known as Invesco AIM Management Group, Inc.) (financial services holding company);Co-Chairman,Co-President andCo-Chief Executive Officer, Invesco Advisers, Inc. (formerly known as Invesco Institutional (N.A.), Inc.) (registered investment adviser); Director, Chief Executive Officer and President, Van Kampen Exchange Corp; President and Principal Executive Officer, The Invesco Funds (other than AIM Treasurer’s Series Trust (Invesco Treasurer’s Series Trust), Short-Term Investments Trust and Invesco Management Trust); Executive Vice President, The Invesco Funds (AIM Treasurer’s Series Trust (Invesco Treasurer’s Series Trust), Short-Term Investments Trust and Invesco Management Trust only); Director and President, INVESCO Funds Group, Inc. (registered investment adviser and registered transfer agent); Director and Chairman, IVZ Distributors, Inc. (formerly known as INVESCO Distributors, Inc.) (registered broker dealer); Director, President and Chairman, Invesco Inc. (holding company), Invesco Canada Holdings Inc. (holding company), Trimark Investments Ltd./Placements Trimark Ltèe and Invesco Financial Services Ltd/Services Financiers Invesco Ltèe; Chief Executive Officer, Invesco Canada Fund Inc. (corporate mutual fund company); Director and Chairman, Van Kampen Investor Services Inc.; Director, Chief Executive Officer and President, 1371 Preferred Inc. (holding company) and Van Kampen Investments Inc.; Director and President, AIM GP Canada Inc. (general partner for limited partnerships) and Van Kampen Advisors, Inc.; Director and Chief Executive Officer, Invesco Trimark Dealer Inc. (registered broker dealer); Director, Invesco Distributors, Inc. (formerly known as Invesco AIM Distributors, Inc.) (registered broker dealer); Manager, Invesco Capital Management LLC; Director, Chief Executive Officer and President, Invesco Advisers, Inc.; Director, Chairman, Chief Executive Officer and President, Invesco AIM Capital Management, Inc.; President, Invesco Trimark Dealer Inc. and Invesco Trimark Ltd./Invesco Trimark Ltèe; Director and President, AIM Trimark Corporate Class Inc. and AIM Trimark Canada Fund Inc.; Senior Managing Director, Invesco Holding Company Limited; Director and Chairman, Fund Management Company (former registered broker dealer); President and Principal Executive Officer, The Invesco Funds (AIM Treasurer’s Series Trust (Invesco Treasurer’s Series Trust), and Short-Term Investments Trust only); President, AIM Trimark Global Fund Inc. and AIM Trimark Canada Fund Inc. | | 229 | | None |
| 1 | Mr. Flanagan is considered an interested person (within the meaning of Section 2(a)(19) of the 1940 Act) of the Trust because he is an officer of the Adviser to the Trust, and an officer and a director of Invesco Ltd., ultimate parent of the Adviser. |
| 2 | Mr. Taylor is considered an interested person (within the meaning of Section 2(a)(19) of the 1940 Act) of the Trust because he is an officer of Invesco Ltd., ultimate parent of the Adviser. |
T-1 Invesco Equally-Weighted S&P 500 Fund
Trustees and Officers—(continued)
| | | | | | | | |
Name, Year of Birth and Position(s) Held with the Trust | | Trustee and/ or Officer Since | | Principal Occupation(s)
During Past 5 Years | | Number of
Funds in Fund
Complex
Overseen by
Trustee | | Other Directorship(s) Held by Trustee During
Past 5 Years |
| Independent Trustees | | | | | | | | |
Bruce L. Crockett — 1944 Trustee and Chair | | 2003 | | Chairman, Crockett Technologies Associates (technology consulting company) Formerly: Director, Captaris (unified messaging provider); Director, President and Chief Executive Officer, COMSAT Corporation; Chairman, Board of Governors of INTELSAT (international communications company); ACE Limited (insurance company); Independent Directors Council and Investment Company Institute: Member of the Audit Committee, Investment Company Institute; Member of the Executive Committee and Chair of the Governance Committee, Independent Directors Council | | 229 | | Director and Chairman of the Audit Committee, ALPS (Attorneys Liability Protection Society) (insurance company); Director and Member of the Audit Committee and Compensation Committee, Ferroglobe PLC (metallurgical company) |
David C. Arch — 1945 Trustee | | 2010 | | Chairman of Blistex Inc. (consumer health care products manufacturer); Member, World Presidents’ Organization | | 229 | | Board member of the Illinois Manufacturers’ Association |
Beth Ann Brown — 1968 Trustee | | 2019 | | Independent Consultant Formerly: Head of Intermediary Distribution, Managing Director, Strategic Relations, Managing Director, Head of National Accounts, Senior Vice President, National Account Manager and Senior Vice President, Key Account Manager, Columbia Management Investment Advisers LLC; Vice President, Key Account Manager, Liberty Funds Distributor, Inc.; and Trustee of certain Oppenheimer Funds | | 229 | | Director, Board of Directors of Caron Engineering Inc.; Advisor, Board of Advisors of Caron Engineering Inc.; President and Director, Acton Shapleigh Youth Conservation Corps (non -profit); and Vice President and Director of Grahamtastic Connection(non-profit) |
Jack M. Fields — 1952 Trustee | | 2003 | | Chief Executive Officer, Twenty First Century Group, Inc. (government affairs company); and Chairman, Discovery Learning Alliance(non-profit) Formerly: Owner and Chief Executive Officer, Dos Angeles Ranch L.P. (cattle, hunting, corporate entertainment); Director, Insperity, Inc. (formerly known as Administaff) (human resources provider); Chief Executive Officer, Texana Timber LP (sustainable forestry company); Director of Cross Timbers Quail Research Ranch(non-profit); and member of the U.S. House of Representatives | | 229 | | None |
Cynthia Hostetler — 1962 Trustee | | 2017 | | Non-Executive Director and Trustee of a number of public and private business corporations Formerly: Director, Aberdeen Investment Funds (4 portfolios); Head of Investment Funds and Private Equity, Overseas Private Investment Corporation; President, First Manhattan Bancorporation, Inc.; Attorney, Simpson Thacher & Bartlett LLP | | 229 | | Vulcan Materials Company (construction materials company); Trilinc Global Impact Fund; Genesee & Wyoming, Inc. (railroads); Artio Global Investment LLC (mutual fund complex); Edgen Group, Inc. (specialized energy and infrastructure products distributor); Investment Company Institute (professional organization); Independent Directors Council (professional organization) |
Eli Jones — 1961 Trustee | | 2016 | | Professor and Dean, Mays Business School — Texas A&M University Formerly: Professor and Dean, Walton College of Business, University of Arkansas and E.J. Ourso College of Business, Louisiana State University; Director, Arvest Bank | | 229 | | Insperity, Inc. (formerly known as Administaff) (human resources provider) |
Elizabeth Krentzman — 1959 Trustee | | 2019 | | Formerly: Principal and Chief Regulatory Advisor for Asset Management Services and U.S. Mutual Fund Leader of Deloitte & Touche LLP; General Counsel of the Investment Company Institute (trade association); National Director of the Investment Management Regulatory Consulting Practice, Principal, Director and Senior Manager of Deloitte & Touche LLP; Assistant Director of the Division of Investment Management — Office of Disclosure and Investment Adviser Regulation of the U.S. Securities and Exchange Commission and various positions with the Division of Investment Management — Office of Regulatory Policy of the U.S. Securities and Exchange Commission; Associate at Ropes & Gray LLP; Advisory Board Member of the Securities and Exchange Commission Historical Society; and Trustee of certain Oppenheimer Funds | | 229 | | Trustee of the University of Florida National Board Foundation and Audit Committee Member; Member of the Cartica Funds Board of Directors (private investment funds); Member of the University of Florida Law Center Association, Inc. Board of Trustees and Audit Committee Member |
Anthony J. LaCava, Jr. — 1956 Trustee | | 2019 | | Formerly: Director and Member of the Audit Committee, Blue Hills Bank (publicly traded financial institution) and Managing Partner, KPMG LLP | | 229 | | Blue Hills Bank; Chairman, Bentley University; Member, Business School Advisory Council; and Nominating Committee, KPMG LLP |
T-2 Invesco Equally-Weighted S&P 500 Fund
Trustees and Officers—(continued)
| | | | | | | | |
Name, Year of Birth and Position(s) Held with the Trust | | Trustee and/ or Officer Since | | Principal Occupation(s)
During Past 5 Years | | Number of
Funds in Fund
Complex
Overseen by
Trustee | | Other Directorship(s) Held by Trustee During
Past 5 Years |
| Independent Trustees—(continued) |
Prema Mathai-Davis — 1950 Trustee | | 2003 | | Retired Co-Owner & Partner of Quantalytics Research, LLC, (a FinTech Investment Research Platform for the Self-Directed Investor) | | 229 | | None |
Joel W. Motley — 1952 Trustee | | 2019 | | Director of Office of Finance, Federal Home Loan Bank; Member of the Vestry of Trinity Wall Street; Managing Director of Carmona Motley Inc. (privately held financial advisor); Member of the Finance and Budget Committee of the Council on Foreign Relations, Member of the Investment Committee and Board of Human Rights Watch and Member of the Investment Committee and Board of Historic Hudson Valley(non-profit cultural organization) Formerly: Managing Director of Public Capital Advisors, LLC (privately held financial advisor); Managing Director of Carmona Motley Hoffman, Inc. (privately held financial advisor); Trustee of certain Oppenheimer Funds; and Director of Columbia Equity Financial Corp. (privately held financial advisor) | | 229 | | Director of Greenwall Foundation (bioethics research foundation); Member of Board and Investment Committee of The Greenwall Foundation; Director of Southern Africa Legal Services Foundation; Board Member and Investment Committee Member of Pulitzer Center for Crisis Reporting(non-profit journalism) |
Teresa M. Ressel — 1962 Trustee | | 2017 | | Non-executive director and trustee of a number of public and private business corporations Formerly: Chief Financial Officer, Olayan America, The Olayan Group (international investor/commercial/industrial); Chief Executive Officer, UBS Securities LLC; Group Chief Operating Officer, Americas, UBS AG; Assistant Secretary for Management & Budget and CFO, US Department of the Treasury | | 229 | | Atlantic Power Corporation (power generation company); ON Semiconductor Corp. (semiconductor supplier) |
Ann Barnett Stern — 1957 Trustee | | 2017 | | President and Chief Executive Officer, Houston Endowment Inc. (private philanthropic institution) Formerly: Executive Vice President and General Counsel, Texas Children’s Hospital; Attorney, Beck, Redden and Secrest, LLP; Business Law Instructor, University of St. Thomas; Attorney, Andrews & Kurth LLP | | 229 | | Federal Reserve Bank of Dallas |
Raymond Stickel, Jr. — 1944 Trustee | | 2005 | | Retired Formerly: Director, Mainstay VP Series Funds, Inc. (25 portfolios); Partner, Deloitte & Touche | | 229 | | None |
Robert C. Troccoli — 1949 Trustee | | 2016 | | Retired Formerly: Adjunct Professor, University of Denver — Daniels College of Business; Senior Partner, KPMG LLP | | 229 | | None |
Daniel S. Vandivort — 1954 Trustee | | 2019 | | Treasurer, Chairman of the Audit and Finance Committee, and Trustee, Board of Trustees, Huntington Disease Foundation of America; and President, Flyway Advisory Services LLC (consulting and property management) Formerly: Trustee and Governance Chair, of certain Oppenheimer Funds | | 229 | | Chairman and Lead Independent Director, Chairman of the Audit Committee, and Director, Board of Directors, Value Line Funds |
James D. Vaughn — 1945 Trustee | | 2019 | | Retired Formerly: Managing Partner, Deloitte & Touche LLP; Trustee and Chairman of the Audit Committee, Schroder Funds; Board Member, Mile High United Way, Boys and Girls Clubs, Boy Scouts, Colorado Business Committee for the Arts, Economic Club of Colorado and Metro Denver Network (economic development corporation); and Trustee of certain Oppenheimer Funds | | 229 | | Board member and Chairman of Audit Committee of AMG National Trust Bank; Trustee and Investment Committee member, University of South Dakota Foundation; Board member, Audit Committee Member and past Board Chair, Junior Achievement(non-profit) |
Christopher L. Wilson — 1957 Trustee, Vice Chair and Chair Designate | | 2017 | | Retired Formerly: Director, TD Asset Management USA Inc. (mutual fund complex) (22 portfolios); Managing Partner, CT2, LLC (investing and consulting firm); President/Chief Executive Officer, Columbia Funds, Bank of America Corporation; President/Chief Executive Officer, CDC IXIS Asset Management Services, Inc.; Principal & Director of Operations, Scudder Funds, Scudder, Stevens & Clark, Inc.; Assistant Vice President, Fidelity Investments | | 229 | | ISO New England, Inc.(non-profit organization managing regional electricity market) |
T-3 Invesco Equally-Weighted S&P 500 Fund
Trustees and Officers—(continued)
| | | | | | | | |
Name, Year of Birth and Position(s) Held with the Trust | | Trustee and/ or Officer Since | | Principal Occupation(s)
During Past 5 Years | | Number of
Funds in Fund
Complex
Overseen by
Trustee | | Other Directorship(s) Held by Trustee During
Past 5 Years |
| Other Officers | | | | | | | | |
Sheri Morris — 1964 President, Principal Executive Officer and Treasurer | | 2003 | | President, Principal Executive Officer and Treasurer, The Invesco Funds; Vice President, Invesco Advisers, Inc. (formerly known as Invesco Institutional (N.A.), Inc.) (registered investment adviser); and Vice President, Invesco Exchange-Traded Fund Trust, Invesco Exchange-Traded Fund Trust II, Invesco India Exchange-Traded Fund Trust, Invesco Actively Managed Exchange-Traded Fund Trust, Invesco Actively Managed Exchange-Traded Commodity Fund Trust and Invesco Exchange-Traded Self-Indexed Fund Trust; and Vice President, OppenheimerFunds, Inc. Formerly: Vice President and Principal Financial Officer, The Invesco Funds; Vice President, Invesco AIM Advisers, Inc., Invesco AIM Capital Management, Inc. and Invesco AIM Private Asset Management, Inc.; Assistant Vice President and Assistant Treasurer, The Invesco Funds and Assistant Vice President, Invesco Advisers, Inc., Invesco AIM Capital Management, Inc. and Invesco AIM Private Asset Management, Inc.; and Treasurer, Invesco Exchange-Traded Fund Trust, Invesco Exchange-Traded Fund Trust II, Invesco India Exchange-Traded Fund Trust and Invesco Actively Managed Exchange-Traded Fund Trust | | N/A | | N/A |
Russell C. Burk — 1958 Senior Vice President and Senior Officer | | 2005 | | Senior Vice President and Senior Officer, The Invesco Funds | | N/A | | N/A |
Jeffrey H. Kupor — 1968 Senior Vice President, Chief Legal Officer and Secretary | | 2018 | | Head of Legal of the Americas, Invesco Ltd.; Senior Vice President and Secretary, Invesco Advisers, Inc. (formerly known as Invesco Institutional (N.A.), Inc.) (registered investment adviser); Senior Vice President and Secretary, Invesco Distributors, Inc. (formerly known as Invesco AIM Distributors, Inc.); Vice President and Secretary, Invesco Investment Services, Inc. (formerly known as Invesco AIM Investment Services, Inc.) Senior Vice President, Chief Legal Officer and Secretary, The Invesco Funds; Secretary and General Counsel, Invesco Investment Advisers LLC (formerly known as Van Kampen Asset Management); Secretary and General Counsel, Invesco Capital Markets, Inc. (formerly known as Van Kampen Funds Inc.) and Chief Legal Officer, Invesco Exchange-Traded Fund Trust, Invesco Exchange-Traded Fund Trust II, Invesco India Exchange-Traded Fund Trust, Invesco Actively Managed Exchange-Traded Fund Trust, Invesco Actively Managed Exchange-Traded Commodity Fund Trust and Invesco Exchange-Traded Self-Indexed Fund Trust; Secretary, Invesco Indexing LLC; Secretary, W.L. Ross & Co., LLC Formerly: Secretary and Vice President, Jemstep, Inc.; Head of Legal, Worldwide Institutional, Invesco Ltd.; Secretary and General Counsel, INVESCO Private Capital Investments, Inc.; Senior Vice President, Secretary and General Counsel, Invesco Management Group, Inc. (formerly known as Invesco AIM Management Group, Inc.); Assistant Secretary, INVESCO Asset Management (Bermuda) Ltd.; Secretary and General Counsel, Invesco Private Capital, Inc.; Assistant Secretary and General Counsel, INVESCO Realty, Inc.; Secretary and General Counsel, Invesco Senior Secured Management, Inc.; and Secretary, Sovereign G./P. Holdings Inc. | | N/A | | N/A |
Andrew R. Schlossberg — 1974 Senior Vice President | | 2019 | | Head of the Americas and Senior Managing Director, Invesco Ltd.; Director and Senior Vice President, Invesco Advisers, Inc. (formerly known as Invesco Institutional (N.A.), Inc.) (registered investment adviser); Director and Chairman, Invesco Investment Services, Inc. (formerly known as Invesco AIM Investment Services, Inc.) (registered transfer agent); Senior Vice President, The Invesco Funds; Director, Invesco Investment Advisers LLC (formerly known as Van Kampen Asset Management); Director, President and Chairman, Invesco Insurance Agency, Inc. Formerly: Director, Invesco UK Limited; Director and Chief Executive, Invesco Asset Management Limited and Invesco Fund Managers Limited; Assistant Vice President, The Invesco Funds; Senior Vice President, Invesco Advisers, Inc. (formerly known as Invesco Institutional (N.A.), Inc.) (registered investment adviser); Director and Chief Executive, Invesco Administration Services Limited and Invesco Global Investment Funds Limited; Director, Invesco Distributors, Inc.; Head of EMEA, Invesco Ltd.; President, Invesco Actively Managed Exchange-Traded Commodity Fund Trust, Invesco Actively Managed Exchange-Traded Fund Trust, Invesco Exchange-Traded Fund Trust, Invesco Exchange-Traded Fund Trust II and Invesco India Exchange-Traded Fund Trust; Managing Director and Principal Executive Officer, Invesco Capital Management LLC | | N/A | | N/A |
T-4 Invesco Equally-Weighted S&P 500 Fund
Trustees and Officers—(continued)
| | | | | | | | |
Name, Year of Birth and Position(s) Held with the Trust | | Trustee and/ or Officer Since | | Principal Occupation(s)
During Past 5 Years | | Number of
Funds in Fund
Complex
Overseen by
Trustee | | Other Directorship(s) Held by Trustee During
Past 5 Years |
| Other Officers—(continued) | | | | | | | | |
John M. Zerr — 1962
Senior Vice President | | 2006 | | Chief Operating Officer of the Americas; Senior Vice President, Invesco Advisers, Inc. (formerly known as Invesco Institutional (N.A.), Inc.) (registered investment adviser); Senior Vice President, Invesco Distributors, Inc. (formerly known as Invesco AIM Distributors, Inc.); Director and Vice President, Invesco Investment Services, Inc. (formerly known as Invesco AIM Investment Services, Inc.) Senior Vice President, The Invesco Funds; Managing Director, Invesco Capital Management LLC; Director, Invesco Investment Advisers LLC (formerly known as Van Kampen Asset Management); Senior Vice President, Invesco Capital Markets, Inc. (formerly known as Van Kampen Funds Inc.); Manager, Invesco Indexing LLC; Manager, Invesco Specialized Products, LLC; Director and Senior Vice President, Invesco Insurance Agency, Inc.; Member, Invesco Canada Funds Advisory Board; Director, President and Chief Executive Officer, Invesco Corporate Class Inc. (corporate mutual fund company); and Director, Chairman, President and Chief Executive Officer, Invesco Canada Ltd. (formerly known as Invesco Trimark Ltd./Invesco Trimark Ltèe) (registered investment adviser and registered transfer agent) Formerly: Director and Senior Vice President, Invesco Management Group, Inc. (formerly known as Invesco AIM Management Group, Inc.); Secretary and General Counsel, Invesco Management Group, Inc. (formerly known as Invesco AIM Management Group, Inc.); Secretary, Invesco Investment Services, Inc. (formerly known as Invesco AIM Investment Services, Inc.); Chief Legal Officer and Secretary, The Invesco Funds; Secretary and General Counsel, Invesco Investment Advisers LLC (formerly known as Van Kampen Asset Management); Secretary and General Counsel, Invesco Capital Markets, Inc. (formerly known as Van Kampen Funds Inc.); Chief Legal Officer, Invesco Exchange-Traded Fund Trust, Invesco Exchange-Traded Fund Trust II, Invesco India Exchange-Traded Fund Trust, Invesco Actively Managed Exchange-Traded Fund Trust, Invesco Actively Managed Exchange-Traded Commodity Fund Trust and Invesco Exchange-Traded Self-Indexed Fund Trust; Secretary, Invesco Indexing LLC; Director, Secretary, General Counsel and Senior Vice President, Van Kampen Exchange Corp.; Director, Vice President and Secretary, IVZ Distributors, Inc. (formerly known as INVESCO Distributors, Inc.); Director and Vice President, INVESCO Funds Group, Inc.; Director and Vice President, Van Kampen Advisors Inc.; Director, Vice President, Secretary and General Counsel, Van Kampen Investor Services Inc.; Director and Secretary, Invesco Distributors, Inc. (formerly known as Invesco AIM Distributors, Inc.); Director, Senior Vice President, General Counsel and Secretary, Invesco AIM Advisers, Inc. and Van Kampen Investments Inc.; Director, Vice President and Secretary, Fund Management Company; Director, Senior Vice President, Secretary, General Counsel and Vice President, Invesco AIM Capital Management, Inc.; Chief Operating Officer and General Counsel, Liberty Ridge Capital, Inc. (an investment adviser) | | N/A | | N/A |
Gregory G. McGreevey — 1962 Senior Vice President | | 2012 | | Senior Managing Director, Invesco Ltd.; Director, Chairman, President, and Chief Executive Officer, Invesco Advisers, Inc. (formerly known as Invesco Institutional (N.A.), Inc.) (registered investment adviser); Director, Invesco Mortgage Capital, Inc. and Invesco Senior Secured Management, Inc.; and Senior Vice President, The Invesco Funds; and President, SNW Asset Management Corporation Formerly: Senior Vice President, Invesco Management Group, Inc. and Invesco Advisers, Inc.; Assistant Vice President, The Invesco Funds | | N/A | | N/A |
Kelli Gallegos — 1970 Vice President, Principal Financial Officer and Assistant Treasurer | | 2008 | | Assistant Treasurer, Invesco Specialized Products, LLC; Vice President, Principal Financial Officer and Assistant Treasurer, The Invesco Funds; Principal Financial and Accounting Officer — Pooled Investments, Invesco Capital Management LLC; Vice President and Treasurer, Invesco Exchange-Traded Fund Trust, Invesco Exchange-Traded Fund Trust II, Invesco India Exchange-Traded Fund Trust, Invesco Actively Managed Exchange-Traded Fund Trust, Invesco Actively Managed Exchange-Traded Commodity Fund Trust and Invesco Exchange-Traded Self-Indexed Fund Trust Formerly: Assistant Treasurer, Invesco Exchange-Traded Fund Trust, Invesco Exchange-Traded Fund Trust II, Invesco India Exchange-Traded Fund Trust, Invesco Actively Managed Exchange-Traded Fund Trust, Invesco Actively Managed Exchange-Traded Commodity Fund Trust and Invesco Exchange-Traded Self-Indexed Fund Trust; Assistant Treasurer, Invesco Capital Management LLC; Assistant Vice President, The Invesco Funds | | N/A | | N/A |
T-5 Invesco Equally-Weighted S&P 500 Fund
Trustees and Officers—(continued)
| | | | | | | | |
Name, Year of Birth and Position(s) Held with the Trust | | Trustee and/ or Officer Since | | Principal Occupation(s)
During Past 5 Years | | Number of
Funds in Fund
Complex
Overseen by
Trustee | | Other Directorship(s) Held by Trustee During
Past 5 Years |
| Other Officers—(continued) | | | | | | | | |
Crissie M. Wisdom — 1969 Anti-Money Laundering Compliance Officer | | 2013 | | Anti-Money Laundering Compliance Officer, Invesco Advisers, Inc. (formerly known as Invesco Institutional (N.A.), Inc.) (registered investment adviser), Invesco Capital Markets, Inc. (formerly known as Van Kampen Funds Inc.), Invesco Distributors, Inc., Invesco Investment Services, Inc., The Invesco Funds, and Invesco Exchange-Traded Fund Trust, Invesco Exchange-Traded Fund Trust II, Invesco India Exchange-Traded Fund Trust, Invesco Actively Managed Exchange-Traded Fund Trust, Invesco Actively Managed Exchange-Traded Commodity Fund Trust and Invesco Exchange-Traded Self-Indexed Fund Trust; Anti-Money Laundering Compliance Officer and Bank Secrecy Act Officer, INVESCO National Trust Company and Invesco Trust Company; and Fraud Prevention Manager and Controls and Risk Analysis Manager for Invesco Investment Services, Inc. Formerly: Anti-Money Laundering Compliance Officer, Van Kampen Exchange Corp. and Invesco Management Group, Inc. | | N/A | | N/A |
Robert R. Leveille — 1969 Chief Compliance Officer | | 2016 | | Chief Compliance Officer, Invesco Advisers, Inc. (registered investment adviser); and Chief Compliance Officer, The Invesco Funds Formerly: Chief Compliance Officer, Putnam Investments and the Putnam Funds | | N/A | | N/A |
The Statement of Additional Information of the Trust includes additional information about the Fund’s Trustees and is available upon request, without charge, by calling 1.800.959.4246. Please refer to the Fund’s Statement of Additional Information for information on the Fund’ssub-advisers.
| | | | | | |
Office of the Fund 11 Greenway Plaza, Suite 1000
Houston, TX 77046-1173 | | Investment Adviser Invesco Advisers, Inc.
1555 Peachtree Street, N.E.
Atlanta, GA 30309 | | Distributor Invesco Distributors, Inc.
11 Greenway Plaza, Suite 1000
Houston, TX 77046-1173 | | Auditors PricewaterhouseCoopers LLP
1000 Louisiana Street, Suite 5800 Houston, TX 77002-5021 |
| | | |
| | | | | | |
Counsel to the Fund Stradley Ronon Stevens & Young, LLP
2005 Market Street, Suite 2600
Philadelphia, PA 19103-7018 | | Counsel to the Independent Trustees Goodwin Procter LLP
901 New York Avenue, N.W.
Washington, D.C. 20001 | | Transfer Agent Invesco Investment Services, Inc.
11 Greenway Plaza, Suite 1000
Houston, TX 77046-1173 | | Custodian State Street Bank and Trust Company
225 Franklin Street
Boston, MA 02110-2801 |
T-6 Invesco Equally-Weighted S&P 500 Fund
Go paperless with eDelivery
Visit invesco.com/edelivery to enjoy the convenience and security of anytime electronic access to your investment documents.
With eDelivery, you can elect to have any or all of the following materials delivered straight to your inbox to download, save and print from your own computer:
| • | Fund reports and prospectuses |
| • | Quarterly statements |
| • | Daily confirmations |
| • | Tax forms |
Invesco mailing information
Send general correspondence to Invesco Investment Services, Inc., P.O. Box 219078, Kansas City, MO 64121-9078.
Important notice regarding delivery of security holder documents
To reduce Fund expenses, only one copy of most shareholder documents may be mailed to shareholders with multiple accounts at the same address (Householding). Mailing of your shareholder documents may be householded indefinitely unless you instruct us otherwise. If you do not want the mailing of these documents to be combined with those for other members of your household, please contact Invesco Investment Services, Inc. at 800 959 4246 or contact your financial institution. We will begin sending you individual copies for each account within 30 days after receiving your request.
Fund holdings and proxy voting information
The Fund provides a complete list of its holdings four times in each fiscal year, at the quarter-ends. For the second and fourth quarters, the list appears in the Fund’s semiannual and annual reports to shareholders. For the first and third quarters, the Fund files the lists with the Securities and Exchange Commission (SEC) as an exhibit to its reports on Form N-PORT. The most recent list of portfolio holdings is available at invesco.com/completeqtrholdings. Shareholders can also look up the Fund’s Form N-PORT filings on the SEC website, sec.gov. The SEC file numbers for the Fund are shown below.
A description of the policies and procedures that the Fund uses to determine how to vote proxies relating to portfolio securities is available without charge, upon request, from our Client Services department at 800 959 4246, or at invesco.com/proxyguidelines. The information is also available on the SEC website, sec.gov.
Information regarding how the Fund voted proxies related to its portfolio securities during the most recent 12-month period ended June 30 is available at invesco.com/proxysearch. This information is also available on the SEC website, sec.gov.
Invesco Advisers, Inc. is an investment adviser; it provides investment advisory services to individual and institutional clients and does not sell securities. Invesco Distributors, Inc. is the US distributor for Invesco Ltd.’s retail mutual funds, exchange-traded funds and institutional money market funds. Both are wholly owned, indirect subsidiaries of Invesco Ltd.
| SEC file numbers: 811-09913 and 333-36074 | Invesco Distributors, Inc. | MS-EWSP-AR-1 |
| Annual Report to Shareholders | August 31, 2019 |
Invesco Equity and Income Fund
Nasdaq:
A: ACEIX ■ C: ACERX ■ R: ACESX ■ Y: ACETX ■ R5: ACEKX ■ R6: IEIFX

Beginning on January 1, 2021, as permitted by regulations adopted by the Securities and Exchange Commission, paper copies of the Fund’s shareholder reports will no longer be sent by mail, unless you specifically request paper copies of the reports from the Fund or from your financial intermediary, such as a broker-dealer or bank. Instead, the reports will be made available on the Fund’s website, and you will be notified by mail each time a report is posted and provided with a website link to access the report.
If you already elected to receive shareholder reports electronically, you will not be affected by this change and you need not take any action. You may elect to receive shareholder reports and other communications from the Fund electronically by contacting your financial intermediary (such as a broker-dealer or bank) or, if you are a direct investor, by enrolling at invesco.com/edelivery.
You may elect to receive all future reports in paper free of charge. If you invest through a financial intermediary, you can contact your financial intermediary to request that you continue to receive paper copies of your shareholder reports. If you invest directly with the Fund, you can call (800) 959-4246 to let the Fund know you wish to continue receiving paper copies of your shareholder reports. Your election to receive reports in paper will apply to all funds held with your financial intermediary or all funds held with the fund complex if you invest directly with the Fund.
Dear Shareholders:
This annual report includes information about your Fund, including performance data and a complete list of its investments as of the close of the reporting period. Inside is a discussion of how your Fund was managed and the factors that affected its performance during the reporting period.
Throughout the reporting period, global equity markets remained volatile. Investor sentiment ranged from elation to fear. The reporting period began with several US equity indexes redefining new highs. The exuberance, however, ended in October 2018 as global equities, in particular US stocks, sold off, with the sharpest decline in December. The catalyst for the sell-off was a combination of ongoing trade concerns between the US and China, fears of a global economic slowdown and lower oil prices from a supply glut. Gains posted earlier in 2018 for global equities were erased, while US Treasury bonds, along with government and municipal bonds, rallied as investors fled to “safe haven” assets.
At the start of 2019, global equity markets rebounded strongly buoyed by more dovish central banks and optimism about a potential US-China trade deal. In May, US-China trade concerns and slowing global growth led to a global equity sell-off and rally in U.S. Treasuries. Despite the May sell-off, domestic equity markets rallied in June in anticipation of a U.S. Federal Reserve (the Fed) rate cut and closed the second quarter with modest gains. As the reporting period ended in August, market volatility once again increased as the US Treasury yield curve inverted several times magnifying concerns that the US economy could be headed into a recession.
During the reporting period, the Fed both raised and lowered the federal funds rate. Given signs of a strong economy, the Fed raised rates two times: in September and December 2018. In 2019, however, the Fed altered its outlook on further rate hikes leaving rates unchanged for the first half of the year. In July, the Fed lowered interest rates for the first time in 11 years. As 2019 unfolds, we’ll see how the interplay of interest rates, economic data, geopolitics and a host of other factors affect US and overseas equity and fixed income markets.
Investor uncertainty and market volatility, such as we witnessed during the reporting period, are unfortunate facts of life when it comes to investing. That’s why Invesco encourages investors to work with a professional financial adviser who can stress the importance of starting to save and invest early and the importance of adhering to a disciplined investment plan. A financial adviser who knows your unique financial situation, investment goals and risk tolerance can be an invaluable partner as you seek to achieve your financial goals. He or she can offer a long-term perspective when markets are volatile and time-tested advice and guidance when your financial situation or investment goals change.
Visit our website for more information on your investments
Our website, invesco.com/us, offers a wide range of market insights and investment perspectives. On the website, you’ll find detailed information about our funds, including performance, holdings and portfolio manager commentaries. You can access information about your account by completing a simple, secure online registration. To do so, select “Log In” on the right side of the homepage, and then select “Register for Individual Account Access.”
In addition to the resources accessible on our website and through our mobile app, you can obtain timely updates to help you stay informed about the markets and the economy by connecting with Invesco on Twitter, LinkedIn or Facebook. You can access our blog at blog.invesco.us.com. Our goal is to provide you the information you want, when and where you want it.
Finally, I’m pleased to share with you Invesco’s commitment to both the Principles for Responsible Investment and to considering environmental, social and governance issues in our robust investment process. I invite you to learn more at invesco.com/esg.
Have questions?
For questions about your account, contact an Invesco client services representative at 800 959 4246.
All of us at Invesco look forward to serving your investment management needs. Thank you for investing with us.
Sincerely,
Andrew Schlossberg
Head of the Americas,
Senior Managing Director, Invesco Ltd.
| 2 | Invesco Equity and Income Fund |
Dear Shareholders:
Among the many important lessons I’ve learned in more than 40 years in a variety of business endeavors is the value of a trusted advocate.
As independent chair of the Invesco Funds Board, I can assure you that the members of the Board are strong advocates for the interests of investors in Invesco’s mutual funds. We work hard to represent your interests through oversight of the quality of the investment management services your funds receive and other matters important to your investment, including but not limited to:
| ■ | Ensuring that Invesco offers a diverse lineup of mutual funds that your financial adviser can use to strive to meet your financial needs as your investment goals change over time. |
| ■ | Monitoring how the portfolio management teams of the Invesco funds are performing in light of changing economic and market conditions. |
| ■ | Assessing each portfolio management team’s investment performance within the context of the investment strategy described in the fund’s prospectus. |
| ■ | Monitoring for potential conflicts of interests that may impact the nature of the services that your funds receive. |
We believe one of the most important services we provide our fund shareholders is the annual review of the funds’ advisory and sub-advisory contracts with Invesco Advisers and its affiliates. This review is required by the Investment Company Act of 1940 and focuses on the nature and quality of the services Invesco provides as the adviser to the Invesco funds and the reasonableness of the fees that it charges for those services. Each year, we spend months carefully reviewing information received from Invesco and a variety of independent sources, such as performance and fee data prepared by Lipper, Inc. (a subsidiary of Broadridge Financial Solutions, Inc.), an independent, third-party firm widely recognized as a leader in its field. We also meet with our independent legal counsel and other independent advisers to review and help us assess the information that we have received. Our goal is to assure that you receive quality investment management services for a reasonable fee.
I trust the measures outlined above provide assurance that you have a worthy advocate when it comes to choosing the Invesco Funds.
As always, please contact me at bruce@brucecrockett.com with any questions or concerns you may have. On behalf of the Board, we look forward to continuing to represent your interests and serving your needs.
Sincerely,
Bruce L. Crockett
Independent Chair
Invesco Funds Board of Trustees
| 3 | Invesco Equity and Income Fund |
Management’s Discussion of Fund Performance
Performance summary
For the fiscal year ended August 31, 2019, Class A shares of Invesco Equity and Income Fund (the Fund), at net asset value (NAV), underperformed the Russell 1000 Value Index.
Your Fund’s long-term performance appears later in this report.
Fund vs. Indexes
Total returns, August 31, 2018 to August 31, 2019, at net asset value (NAV). Performance shown does not include applicable contingent deferred sales charges (CDSC) or front-end sales charges, which would have reduced performance.
| Class A Shares | –0.96% |
| Class C Shares | –1.75 |
| Class R Shares | –1.30 |
| Class Y Shares | –0.81 |
| Class R5 Shares | –0.75 |
| Class R6 Shares | –0.56 |
| Russell 1000 Value Index▼ (Broad Market Index) | 0.62 |
Bloomberg Barclays U.S. Government/Credit Index■
(Style-Specific Index) | 11.42 |
Lipper Mixed-Asset Target Allocation Growth Funds Index♦
(Peer Group Index) | 2.07 |
| Source(s):▼RIMES Technologies Corp.;■ FactSet Research Systems Inc.;♦ Lipper Inc. |
Market conditions and your Fund
The fiscal year proved to be an increasingly volatile time for US equities. After a relatively quiet summer, market volatility noticeably rose in October 2018, as US equity markets suffered a sharp sell-off through year-end 2018, amid ongoing trade concerns between the US and China, fears of a global economic slowdown and lower oil prices from a supply glut, with oil prices plummeting from near $75 per barrel in early October 2018 to around $45 per barrel in late December 2018.1 In this environment, there was a flight to safety, as investors fled to defensive areas of the markets, such as health care, utilities and US Treasuries.
Given signs of a strong economy, the US Federal Reserve (the Fed) raised interest rates two times during the fiscal year: in September and December 2018.2 In contrast, the European Central
Bank and central banks in several other countries maintained extraordinarily accommodative monetary policies.
Following a sharp sell-off during the fourth quarter of 2018, equity markets rebounded in the first quarter of 2019, fueled by optimism about a potential US-China trade deal and the Fed’s indication that there would be no interest rate hikes in 2019, a surprising shift in monetary policy. The Fed’s more accommodative stance provided a supportive environment for equities and fixed income, even as US economic data were mixed and overseas growth appeared to be slowing. Against this backdrop, the S&P 500 Index posted its best first quarter returns since 1998.
Although the S&P 500 Index posted modest gains for the second quarter of 2019, the US stock market experienced increased volatility. After four consecutive months of rising stock markets, the market sold off in May 2019, along with
bond yields and oil prices, as investors weighed the impact of the lingering trade war between the US and China, as well as potential tariffs imposed on Mexico. In addition, economic data showed a slowing domestic and global economy. During the July 2019 meeting, the Fed lowered rates by 25 basis points. (A basis point is one one-hundredth of a percentage point.) This was the first time the Fed lowered rates in more than a decade.2
Market volatility increased in August 2019, as the US Treasury yield curve inverted several times, causing jitters for investors who were concerned that a US recession would be imminent. As a result, much of August saw a “risk off” sentiment, with investors crowding into perceived “safe haven” asset classes, such as US Treasuries and gold. However, a more dovish tone from the Fed provided some support to risk assets. With rising volatility in the markets, the S&P 500 Index posted a modestly positive return for the fiscal year.
During the fiscal year, cyclical sectors in the Fund underperformed the Russell 1000 Value Index, with the energy and materials sectors posting double-digit losses. Conversely, the utilities, consumer staples, communication services and real estate sectors posted double-digit gains.
Stock selection in and overweight exposure to the energy sector was the primary detractor from the Fund’s performance versus the Russell 1000 Value Index for the fiscal year. Crude oil prices were volatile during the fiscal year, reaching multiyear highs in October, declining sharply by the end of December, somewhat recovering again in early 2019 and falling again during the summer. Energy stocks mirrored this volatility and a number of the Fund’s largest detractors were in this sector, including
| Portfolio Composition |
| By security type, based on Net Assets |
| as of August 31, 2019 |
| Common Stocks & Other Equity Interests | 59.56% |
| U.S. Dollar Denominated Bonds & Notes | 21.08 |
| U.S. Treasury Securities | 11.74 |
| Security Types Each Less Than 1% of Portfolio | 0.76 |
| Money Market Funds Plus Other Assets Less Liabilities | 6.86 |
| Top 10 Equity Holdings* |
| % of total net assets |
| 1. | American International Group, Inc. | 2.09% |
| 2. | Johnson & Johnson | 2.01 |
| 3. | Bank of America Corp. | 1.95 |
| 4. | Philip Morris International, Inc. | 1.77 |
| 5. | General Motors Co. | 1.75 |
| 6. | Citigroup, Inc. | 1.70 |
| 7. | Mondelez International, Inc., Class A | 1.65 |
| 8. | Morgan Stanley | 1.59 |
| 9. | General Dynamics Corp. | 1.53 |
| 10. | Charter Communications, Inc., Class A | 1.51 |
| Total Net Assets | $13.1 billion |
| Total Number of Holdings | 365 |
| The Fund’s holdings are subject to change, and there is no assurance that the Fund will continue to hold any particular security. |
| *Excluding money market fund holdings. |
| Data presented here are as of August 31, 2019. |
| 4 | Invesco Equity and Income Fund |
Devon Energy,Schlumberger andMarathon Oil. Another key individual detractor from the Fund’s performance relative to the Russell 1000 Value Index wasOccidental Petroleum. The company engaged in a bidding war with Chevron to acquire Anadarko Petroleum. Although the company’s bid succeeded, many investors believed it overpaid for the acquisition. We sold our equity holdings in Schlumberger and Occidental Petroleum during the fiscal year.
Security selection in the consumer discretionary sector also detracted from the Fund’s performance versus the Russell 1000 Value Index during the fiscal year.Capri Holdings andCarnival were top detractors within the sector. Capri Holdings is a global luxury fashion company and owner of the Michael Kors brand, which suffered from declining sales during the fiscal year. Capri Holdings reduced its outlook for the Michael Kors brand in 2020. However, the company’s Jimmy Choo and Versace brands have shown improvement, causing Capri Holding to focus more on accessories, which we believe should help boost its profit margins. Shares of the cruise line operator Carnival declined in June after the company reported a profit decline and a weaker outlook for the remainder of 2019.
During the fiscal year, financial holdings were negatively impacted by the flattening yield curve and subsequent concerns over a possible recession due to a slowing economy. Within the financials sector,State Street,Wells Fargo,Citigroup andBank of America were key detractors from the Fund’s performance versus the Russell 1000 Value Index. Much of the sector’s underperformance occurred in the fourth quarter of 2018, and many stocks recovered in early 2019. As a result, we sold our position in State Street and trimmed a number of our other large positions before the close of the fiscal year, taking profits into strength. The Fund remained overweight within the financials sector, but exposure was reduced compared to the last fiscal year-end.
The Fund’s material underweight exposure to the utilities and real estate sectors also detracted from its performance relative to the Russell 1000 Value Index for the fiscal year. The Fund maintained underweight exposure to these sectors, as we believe valuations and fundamentals are unattractive.
During the fiscal year, stock selection in and an underweight allocation to the industrials sector was the largest con-
tributor to the Fund’s performance versus the Russell 1000 Value Index. Within the sector,Ingersoll Rand andJohnson Controls were key contributors. Both companies benefited from a strong demand for heating, ventilating and air conditioning (HVAC) products in both the residential and industrial segments. The Fund’s lack of exposure to General Electric was also a large contributor to the Fund’s relative performance, as the stock performed poorly for the fiscal year.
Stock selection in the health care sector contributed to the Fund’s performance versus the Russell 1000 Value Index for the fiscal year. Pharmaceutical holdingsNovartis andMerck were significant contributors to relative results. Merck’s shares rose during the fiscal year, reaching a near all-time high as strong sales and profit growth boosted the stock. Based on this strong performance, we sold our position in Merck during the fiscal year.
The Fund uses high grade bonds as a source of income and to dampen return volatility. This contributed to the Fund’s performance relative to the Russell 1000 Value Index for the fiscal year. Bonds fared well compared to most equities during the fiscal year, as yields fell in the US, while bond prices rose. The bond portion of the Fund’s portfolio posted strong returns, outperforming the Russell 1000 Value Index. Conversely, the Fund’s allocation to convertible securities underperformed the Russell 1000 Value Index, detracting from the Fund’s relative returns.
The Fund used currency forward contracts for the purpose of hedging currency exposure of non-US-based companies held in the Fund during the fiscal year. These derivatives were not for speculative purposes or leverage, and these positions had a positive impact on the Fund’s relative performance for the fiscal year.
During the fiscal year, we reduced the Fund’s exposure to the financials and energy sectors, and increased the Fund’s exposure to the consumer staples, communication services and consumer discretionary sectors. At the end of the fiscal year, the Fund’s largest overweight exposures relative to the Russell 1000 Value Index were to the information technology, health care and consumer discretionary sectors, while the largest underweight exposures were to the real estate and utilities sectors.
As always, we thank you for your investment in Invesco Equity and Income
Fund and for sharing our long-term investment horizon.
| 2 | Source: US Federal Reserve |
The views and opinions expressed in management’s discussion of Fund performance are those of Invesco Advisers, Inc. These views and opinions are subject to change at any time based on factors such as market and economic conditions. These views and opinions may not be relied upon as investment advice or recommendations, or as an offer for a particular security. The information is not a complete analysis of every aspect of any market, country, industry, security or the Fund. Statements of fact are from sources considered reliable, but Invesco Advisers, Inc. makes no representation or warranty as to their completeness or accuracy. Although historical performance is no guarantee of future results, these insights may help you understand our investment management philosophy.
See important Fund and, if applicable, index disclosures later in this report.
Thomas Bastian
Chartered Financial Analyst, Portfolio Manager, is co-lead manager of Invesco Equity and Income Fund. He joined Invesco in 2010. Mr. Bastian earned a BA in accounting from St. John’s University and an MBA in finance from the University of Michigan.
Brian Jurkash
Portfolio Manager, is co-lead manager of Invesco Equity and Income Fund. He joined Invesco in 2000. Mr. Jurkash earned a BBA degree in finance from Stephen F. Austin State University and an MBA in finance from the University of Houston.
Matthew Titus
Chartered Financial Analyst, Portfolio Manager, is co-lead manager of Invesco Equity and Income Fund. He joined Invesco in 2016. Mr. Titus earned a bachelor’s degree in accounting and economics from Luther College in Decorah, Iowa, and an MBA from Ohio State University.
Chuck Burge
Portfolio Manager, is manager of Invesco Equity and Income Fund. He joined Invesco in 2002. Mr. Burge earned a BS in economics from Texas A&M University and an MBA in finance and accounting from Rice University.
| 5 | Invesco Equity and Income Fund |
Sergio Marcheli
Portfolio Manager, is manager of Invesco Equity and Income Fund. He joined Invesco in 2010. Mr. Marcheli earned a BBA from the University of Houston and an MBA from the University of St. Thomas.
| 6 | Invesco Equity and Income Fund |
Your Fund’s Long-Term Performance
Results of a $10,000 Investment — Oldest Share Class(es)
Fund and index data from 8/31/09
| 1 | Source: RIMES Technologies Corp. |
| 2 | Source: Lipper Inc. |
| 3 | Source: FactSet Research Systems Inc. |
Past performance cannot guarantee comparable future results.
The data shown in the chart include reinvested distributions, applicable sales charges and Fund expenses including
management fees. Index results include reinvested dividends, but they do not reflect sales charges. Performance of the peer group, if applicable, reflects fund expenses and management fees; perfor-
mance of a market index does not. Performance shown in the chart and table(s) does not reflect deduction of taxes a shareholder would pay on Fund distributions or sale of Fund shares.
| 7 | Invesco Equity and Income Fund |
| Average Annual Total Returns |
| As of 8/31/19, including maximum applicable sales charges |
| Class A Shares | |
| Inception (8/3/60) | 9.88% |
| 10 Years | 8.14 |
| 5 Years | 3.70 |
| 1 Year | –6.44 |
| Class C Shares | |
| Inception (7/6/93) | 8.70% |
| 10 Years | 7.94 |
| 5 Years | 4.09 |
| 1 Year | –2.66 |
| Class R Shares | |
| Inception (10/1/02) | 7.50% |
| 10 Years | 8.46 |
| 5 Years | 4.59 |
| 1 Year | –1.30 |
| Class Y Shares | |
| Inception (12/22/04) | 6.72% |
| 10 Years | 9.02 |
| 5 Years | 5.12 |
| 1 Year | –0.81 |
| Class R5 Shares | |
| 10 Years | 9.07% |
| 5 Years | 5.19 |
| 1 Year | –0.75 |
| Class R6 Shares | |
| 10 Years | 9.05% |
| 5 Years | 5.29 |
| 1 Year | –0.56 |
Effective June 1, 2010, Class A, Class C, Class I and Class R shares of the predecessor fund, Van Kampen Equity and Income Fund, advised by Van Kampen Asset Management were reorganized into Class A, Class C, Class Y and Class R shares, respectively, of Invesco Van Kampen Equity and Income Fund (renamed Invesco Equity and Income Fund). Returns shown above, prior to June 1, 2010, for Class A, Class C, Class R and Class Y shares are blended returns of the predecessor fund and Invesco Equity and Income Fund. Share class returns will differ from the predecessor fund because of different expenses.
Class R5 shares incepted on June 1, 2010. Performance shown prior to that date is that of the predecessor fund’s Class A shares and includes the 12b-1 fees applicable to Class A shares.
Class R6 shares incepted on September 24, 2012. Performance shown prior to that date is that of the Fund’s and the predecessor fund’s Class A
| Average Annual Total Returns |
| As of 6/30/19, the most recent calendar quarter end, including maximum applicable sales charges |
| Class A Shares | |
| Inception (8/3/60) | 9.94% |
| 10 Years | 9.47 |
| 5 Years | 4.33 |
| 1 Year | –2.25 |
| Class C Shares | |
| Inception (7/6/93) | 8.81% |
| 10 Years | 9.27 |
| 5 Years | 4.72 |
| 1 Year | 1.70 |
| Class R Shares | |
| Inception (10/1/02) | 7.66% |
| 10 Years | 9.81 |
| 5 Years | 5.25 |
| 1 Year | 3.21 |
| Class Y Shares | |
| Inception (12/22/04) | 6.90% |
| 10 Years | 10.36 |
| 5 Years | 5.78 |
| 1 Year | 3.74 |
| Class R5 Shares | |
| 10 Years | 10.42% |
| 5 Years | 5.83 |
| 1 Year | 3.80 |
| Class R6 Shares | |
| 10 Years | 10.38% |
| 5 Years | 5.93 |
| 1 Year | 3.90 |
shares and includes the 12b-1 fees applicable to Class A shares.
The performance data quoted represent past performance and cannot guarantee comparable future results; current performance may be lower or higher. Please visit invesco.com/performance for the most recent month-end performance. Performance figures reflect reinvested distributions, changes in net asset value and the effect of the maximum sales charge unless otherwise stated. Investment return and principal value will fluctuate so that you may have a gain or loss when you sell shares.
The net annual Fund operating expense ratio set forth in the most recent Fund prospectus as of the date of this report for Class A, Class C, Class R, Class Y, Class R5 and Class R6 shares was 0.78%, 1.52%, 1.03%, 0.53%, 0.48% and 0.39%, respectively.1 The total annual Fund operating expense ratio set forth in the most recent Fund prospectus as of the date of this report for Class A, Class C,
Class R, Class Y, Class R5 and Class R6 shares was 0.79%, 1.53%, 1.04%, 0.54%, 0.49% and 0.40%, respectively. The expense ratios presented above may vary from the expense ratios presented in other sections of this report that are based on expenses incurred during the period covered by this report.
Class A share performance reflects the maximum 5.50% sales charge, and Class C share performance reflects the applicable contingent deferred sales charge (CDSC) for the period involved. The CDSC on Class C shares is 1% for the first year after purchase. Class R, Class Y, Class R5 and Class R6 shares do not have a front-end sales charge or a CDSC; therefore, performance is at net asset value.
The performance of the Fund’s share classes will differ primarily due to different sales charge structures and class expenses.
Fund performance reflects any applicable fee waivers and/or expense reimbursements. Had the adviser not waived fees and/or reimbursed expenses currently or in the past, returns would have been lower. See current prospectus for more information.
| 1 | Total annual Fund operating expenses after any contractual fee waivers and/or expense reimbursements by the adviser in effect through at least June 30, 2021. See current prospectus for more information. |
| 8 | Invesco Equity and Income Fund |
Invesco Equity and Income Fund’s investment objective is current income and, secondarily, capital appreciation.
| ■ | Unless otherwise stated, information presented in this report is as of August 31, 2019, and is based on total net assets. |
| ■ | Unless otherwise noted, all data provided by Invesco. |
| ■ | To access your Fund’s reports/prospectus, visit invesco.com/fundreports. |
About share classes
| ■ | Class R shares are generally available only to employer sponsored retirement and benefit plans. Please see the prospectus for more information. |
| ■ | Class Y shares are available only to certain investors. Please see the prospectus for more information. |
| ■ | Class R5 shares andClass R6 shares are available for use by retirement plans that meet certain standards and for institutional investors. Class R6 shares are also available through intermediaries that have established an agreement with Invesco Distributors, Inc. to make such shares available for use in retail omnibus accounts. Please see the prospectus for more information. |
Principal risks of investing in the Fund
| ■ | Active trading risk. Active trading of portfolio securities may result in added expenses, a lower return and increased tax liability. |
| ■ | Changing fixed income market conditions risk. The current low interest rate environment was created in part by the Federal Reserve Board (FRB) and certain foreign central banks keeping the federal funds and equivalent foreign rates near historical lows. Increases in the federal funds and equivalent foreign rates may expose fixed income markets to heightened volatility and reduced liquidity for certain fixed income investments, particularly those with longer maturities. In addition, decreases in fixed income dealer market-making capacity may also potentially lead to heightened volatility and reduced liquidity in the fixed income markets. As a result, the value of the Fund’s investments and share price may decline. Changes in central bank policies could also result in higher than normal shareholder redemptions, which could potentially increase portfolio turnover and the Fund’s transaction costs. |
| ■ | Convertible securities risk. The market values of convertible securities are affected by market interest rates, the risk of actual issuer default on interest or principal payments and the value of the underlying common stock into which the convertible security may be converted. Additionally, a convertible security is subject to the same types of market and issuer risks as apply to the underlying common stock. In addition, certain convertible securities are subject to involuntary conversions and may undergo principal write-downs upon the occurrence of certain triggering events, and, as a result, are subject to an increased risk of loss. Convertible securities may be rated below investment grade. |
| ■ | Debt securities risk. The prices of debt securities held by the Fund will be affected by changes in interest rates, the creditworthiness of the issuer and other factors. An increase in prevailing interest rates typically causes the value of existing debt securities to fall and often has a greater impact on longer-duration debt securities and higher quality debt securities. Falling interest rates will cause the Fund to reinvest the proceeds of debt securities that have been repaid by the issuer at lower interest rates. Falling interest rates may also reduce the Fund’s distributable income because interest payments on floating rate debt instruments held by the Fund will decline. The Fund could lose money on investments in debt securities if the issuer or borrower fails to meet its obligations to make interest payments and/or to repay principal in a timely manner. Changes in an issuer’s financial strength, the market’s perception of such strength or in the credit rating of the issuer or the security may affect the value of debt securities. The Adviser’s credit analysis may fail to anticipate such changes, which could result in buying a debt security at an |
| | inopportune time or failing to sell a debt security in advance of a price decline or other credit event. |
| ■ | Depositary receipts risk. Investing in depositary receipts involves the same risks as direct investments in foreign securities. In addition, the underlying issuers of certain depositary receipts are under no obligation to distribute shareholder communications or pass through any voting rights with respect to the deposited securities to the holders of such receipts. The Fund may therefore receive less timely information or have less control than if it invested directly in the foreign issuer. |
| ■ | Derivatives risk. The value of a derivative instrument depends largely on (and is derived from) the value of an underlying security, currency, commodity, interest rate, index or other asset (each referred to as an underlying asset). In addition to risks relating to the underlying assets, the use of derivatives may include other, possibly greater, risks, including counterparty, leverage and liquidity risks. Counterparty risk is the risk that the counterparty to the derivative contract will default on its obligation to pay the Fund the amount owed or otherwise perform under the derivative contract. Derivatives create leverage risk because they do not require payment up front equal to the economic exposure created by holding a position in the derivative. As a result, an adverse change in the value of the underlying asset could result in the Fund sustaining a loss that is substantially greater than the amount invested in the derivative or the anticipated value of the underlying asset, which may make the Fund’s returns more volatile and increase the risk of loss. Derivative instruments may also be less liquid than more traditional investments and the Fund may be unable to sell or close out its derivative positions at a desirable time or |
This report must be accompanied or preceded by a currently effective Fund prospectus, which contains more complete information, including sales charges and expenses. Investors should read it carefully before investing.
NOT FDIC INSURED | MAY LOSE VALUE | NO BANK GUARANTEE
| 9 | Invesco Equity and Income Fund |
| | price. This risk may be more acute under adverse market conditions, during which the Fund may be most in need of liquidating its derivative positions. Derivatives may also be harder to value, less tax efficient and subject to changing government regulation that could impact the Fund’s ability to use certain derivatives or their cost. Derivatives strategies may not always be successful. For example, derivatives used for hedging or to gain or limit exposure to a particular market segment may not provide the expected benefits, particularly during adverse market conditions. |
| ■ | Foreign securities risk. The Fund’s foreign investments may be adversely affected by political and social instability, changes in economic or taxation policies, difficulty in enforcing obligations, decreased liquidity or increased volatility. Foreign investments also involve the risk of the possible seizure, nationalization or expropriation of the issuer or foreign deposits (in which the Fund could lose its entire investments in a certain market) and the possible adoption of foreign governmental restrictions such as exchange controls. Unless the Fund has hedged its foreign securities risk, foreign securities risk also involves the risk of negative foreign currency rate fluctuations, which may cause the value of securities denominated in such foreign currency (or other instruments through which the Fund has exposure to foreign currencies) to decline in value. Currency exchange rates may fluctuate significantly over short periods of time. Currency hedging strategies, if used, are not always successful. |
| ■ | Management risk. The Fund is actively managed and depends heavily on the Adviser’s judgment about markets, interest rates or the attractiveness, relative values, liquidity, or potential appreciation of particular investments made for the Fund’s portfolio. The Fund could experience losses if these judgments prove to be incorrect. Additionally, legislative, regulatory, or tax developments may adversely affect management of the Fund and, therefore, the ability of the Fund to achieve its investment objective. |
| ■ | Market risk. The market values of the Fund’s investments, and therefore the value of the Fund’s shares, will go up and down, sometimes rapidly or unpredictably. Market risk may affect a single issuer, industry or section of |
| | the economy, or it may affect the market as a whole. Individual stock prices tend to go up and down more dramatically than those of certain other types of investments, such as bonds. During a general downturn in the financial markets, multiple asset classes may decline in value. When markets perform well, there can be no assurance that specific investments held by the Fund will rise in value. |
| ■ | Preferred securities risk. Preferred securities are subject to issuer-specific and market risks applicable generally to equity securities. Preferred securities also may be subordinated to bonds or other debt instruments, subjecting them to a greater risk of non-payment, may be less liquid than many other securities, such as common stocks, and generally offer no voting rights with respect to the issuer. |
| ■ | REIT risk/real estate risk. Investments in real estate related instruments may be affected by economic, legal, cultural, environmental or technological factors that affect property values, rents or occupancies of real estate related to the Fund’s holdings. Shares of real estate related companies, which tend to be small- and mid-cap companies, may be more volatile and less liquid. |
| ■ | Small- and mid-capitalization companies risks. Small- and mid-capitalization companies tend to be more vulnerable to changing market conditions, may have little or no operating history or track record of success, and may have more limited product lines and markets, less experienced management and fewer financial resources than larger companies. These companies’ securities may be more volatile and less liquid than those of more established companies, and their returns may vary, sometimes significantly, from the overall securities market. |
| ■ | Value investing style risk. A value investing style subjects the Fund to the risk that the valuations never improve or that the returns on value equity securities are less than returns on other styles of investing or the overall stock market. |
| ■ | Warrants risk. Warrants may be significantly less valuable or worthless on their expiration date and may also be postponed or terminated early, resulting in a partial or total loss. Warrants may also be illiquid. |
| ■ | Zero coupon or pay-in-kind securities risk.The value, interest rates, and liquidity of non-cash paying instruments, such as zero coupon and pay-in-kind securities, are subject to greater fluctuation than other types of securities. The higher yields and interest rates on pay-in-kind securities reflect the payment deferral and increased credit risk associated with such instruments and that such investments may represent a higher credit risk than loans that periodically pay interest. |
About indexes used in this report
| ■ | TheRussell 1000® Value Index is an unmanaged index considered representative of large-cap value stocks. The Russell 1000 Value Index is a trademark/service mark of the Frank Russell Co. Russell® is a trademark of the Frank Russell Co. |
| ■ | TheBloomberg Barclays U.S. Government/Credit Index is a broad-based benchmark that includes investment grade, US dollar-denominated, fixed-rate Treasuries, government-related and corporate securities. |
| ■ | TheLipper Mixed-Asset Target Allocation Growth Funds Index is an unmanaged index considered representative of mixed-asset target allocation growth funds tracked by Lipper. |
| ■ | TheS&P 500® Index is an unmanaged index considered representative of the US stock market. |
| ■ | The Fund is not managed to track the performance of any particular index, including the index(es) described here, and consequently, the performance of the Fund may deviate significantly from the performance of the index(es). |
| ■ | A direct investment cannot be made in an index. Unless otherwise indicated, index results include reinvested dividends, and they do not reflect sales charges. Performance of the peer group, if applicable, reflects fund expenses; performance of a market index does not. |
Other information
| ■ | The returns shown in management’s discussion of Fund performance are based on net asset values (NAVs) calculated for shareholder transactions. Generally accepted accounting principles require adjustments to be made to the net assets of the Fund at period end for financial reporting purposes, and as such, the NAVs for shareholder transactions and the returns |
| 10 | Invesco Equity and Income Fund |
| | based on those NAVs may differ from the NAVs and returns reported in the Financial Highlights. |
| ■ | Industry classifications used in this report are generally according to the Global Industry Classification Standard, which was developed by and is the exclusive property and a service mark of MSCI Inc. and Standard & Poor’s. |
| 11 | Invesco Equity and Income Fund |
Schedule of Investments(a)
August 31, 2019
| | Shares | Value |
| Common Stocks & Other Equity Interests–59.56% |
| Aerospace & Defense–1.53% |
| General Dynamics Corp. | 1,053,406 | $201,484,966 |
| Apparel, Accessories & Luxury Goods–0.85% |
| Capri Holdings Ltd.(b) | 4,238,559 | 111,813,186 |
| Automobile Manufacturers–1.75% |
| General Motors Co. | 6,189,439 | 229,566,292 |
| Biotechnology–0.59% |
| Celgene Corp.(b) | 797,327 | 77,181,254 |
| Broadcasting–0.41% |
| CBS Corp., Class B | 1,291,394 | 54,316,032 |
| Building Products–1.15% |
| Johnson Controls International PLC | 3,539,986 | 151,122,002 |
| Cable & Satellite–2.29% |
| Charter Communications, Inc., Class A(b) | 485,322 | 198,783,038 |
| Comcast Corp., Class A | 2,309,825 | 102,232,854 |
| | | | 301,015,892 |
| Commodity Chemicals–0.49% |
| Dow, Inc. | 1,507,663 | 64,271,674 |
| Communications Equipment–0.90% |
| Cisco Systems, Inc. | 2,523,227 | 118,112,256 |
| Diversified Banks–5.61% |
| Bank of America Corp. | 9,319,617 | 256,382,664 |
| Citigroup, Inc. | 3,471,304 | 223,378,412 |
| JPMorgan Chase & Co. | 1,158,902 | 127,316,974 |
| Wells Fargo & Co. | 2,774,412 | 129,204,367 |
| | | | 736,282,417 |
| Electric Utilities–1.09% |
| Duke Energy Corp. | 525,920 | 48,773,821 |
| Exelon Corp. | 650,562 | 30,745,560 |
| FirstEnergy Corp. | 1,375,276 | 63,262,696 |
| | | | 142,782,077 |
| Fertilizers & Agricultural Chemicals–1.18% |
| Corteva, Inc. | 2,754,848 | 80,772,143 |
| Nutrien Ltd. (Canada) | 1,473,415 | 74,201,180 |
| | | | 154,973,323 |
| Food Distributors–1.04% |
| US Foods Holding Corp.(b) | 3,375,377 | 136,534,000 |
| Health Care Distributors–0.96% |
| McKesson Corp. | 912,227 | 126,133,627 |
| | Shares | Value |
| Health Care Equipment–1.87% |
| Medtronic PLC | 974,494 | $105,138,158 |
| Zimmer Biomet Holdings, Inc. | 1,007,758 | 140,279,913 |
| | | | 245,418,071 |
| Health Care Services–1.02% |
| CVS Health Corp. | 2,207,449 | 134,477,793 |
| Health Care Supplies–0.41% |
| Alcon, Inc. (Switzerland)(b) | 890,140 | 54,271,335 |
| Home Improvement Retail–0.44% |
| Kingfisher PLC (United Kingdom) | 24,313,803 | 57,586,514 |
| Hotels, Resorts & Cruise Lines–1.15% |
| Carnival Corp. | 3,409,809 | 150,304,381 |
| Industrial Machinery–0.90% |
| Ingersoll-Rand PLC | 972,098 | 117,711,347 |
| Insurance Brokers–1.12% |
| Willis Towers Watson PLC | 745,673 | 147,620,884 |
| Integrated Oil & Gas–3.16% |
| BP PLC (United Kingdom) | 22,161,425 | 135,128,393 |
| Chevron Corp. | 1,005,474 | 118,364,399 |
| Royal Dutch Shell PLC, Class A (United Kingdom) | 5,835,572 | 161,704,731 |
| | | | 415,197,523 |
| Internet & Direct Marketing Retail–0.92% |
| eBay, Inc. | 2,991,852 | 120,541,717 |
| Investment Banking & Brokerage–2.65% |
| Goldman Sachs Group, Inc. (The) | 682,187 | 139,104,751 |
| Morgan Stanley | 5,027,934 | 208,608,982 |
| | | | 347,713,733 |
| IT Consulting & Other Services–0.71% |
| Cognizant Technology Solutions Corp., Class A | 1,516,218 | 93,080,623 |
| Managed Health Care–0.66% |
| Anthem, Inc. | 328,839 | 85,997,975 |
| Multi-line Insurance–2.09% |
| American International Group, Inc. | 5,270,170 | 274,259,647 |
| Oil & Gas Equipment & Services–0.93% |
| TechnipFMC PLC (United Kingdom) | 4,936,357 | 122,619,108 |
| Oil & Gas Exploration & Production–2.17% |
| Canadian Natural Resources Ltd. (Canada) | 2,966,830 | 70,883,928 |
| Devon Energy Corp. | 5,303,818 | 116,630,958 |
See accompanying Notes to Financial Statements which are an integral part of the financial statements.
| 12 | Invesco Equity and Income Fund |
| | Shares | Value |
| Oil & Gas Exploration & Production–(continued) |
| Marathon Oil Corp. | 8,229,859 | $97,441,531 |
| | | | 284,956,417 |
| Other Diversified Financial Services–1.16% |
| AXA Equitable Holdings, Inc. | 3,011,478 | 62,548,398 |
| Voya Financial, Inc. | 1,832,299 | 90,368,987 |
| | | | 152,917,385 |
| Packaged Foods & Meats–2.12% |
| Kellogg Co. | 983,552 | 61,767,065 |
| Mondelez International, Inc., Class A | 3,925,594 | 216,771,301 |
| | | | 278,538,366 |
| Pharmaceuticals–4.86% |
| Bristol-Myers Squibb Co. | 2,360,381 | 113,463,515 |
| Johnson & Johnson | 2,059,368 | 264,340,476 |
| Novartis AG (Switzerland) | 868,655 | 78,221,733 |
| Pfizer, Inc. | 2,335,758 | 83,036,197 |
| Sanofi (France) | 1,157,691 | 99,472,296 |
| | | | 638,534,217 |
| Railroads–0.91% |
| CSX Corp. | 1,779,072 | 119,233,405 |
| Regional Banks–2.74% |
| Citizens Financial Group, Inc. | 5,131,783 | 173,146,358 |
| PNC Financial Services Group, Inc. (The) | 1,447,198 | 186,587,238 |
| | | | 359,733,596 |
| Semiconductors–2.32% |
| Intel Corp. | 2,899,070 | 137,444,909 |
| NXP Semiconductors N.V. (Netherlands) | 526,952 | 53,822,877 |
| QUALCOMM, Inc. | 1,461,767 | 113,681,620 |
| | | | 304,949,406 |
| Specialty Chemicals–0.58% |
| DuPont de Nemours, Inc. | 1,112,409 | 75,565,943 |
| Systems Software–1.51% |
| Oracle Corp. | 3,806,469 | 198,164,776 |
| Technology Hardware, Storage & Peripherals–0.91% |
| Apple, Inc. | 573,528 | 119,718,235 |
| Tobacco–1.77% |
| Philip Morris International, Inc. | 3,226,871 | 232,625,130 |
| Wireless Telecommunication Services–0.64% |
| Vodafone Group PLC (United Kingdom) | 44,809,265 | 84,617,326 |
| Total Common Stocks & Other Equity Interests (Cost $6,511,643,367) | 7,821,943,851 |
| | Principal
Amount | Value |
| U.S. Dollar Denominated Bonds & Notes–21.08% |
| Aerospace & Defense–0.12% |
| BAE Systems Holdings, Inc. (United Kingdom), 2.85%, 12/15/2020(c) | | $3,091,000 | $3,110,534 |
| General Dynamics Corp., 2.88%, 05/11/2020 | | 4,561,000 | 4,589,028 |
| Precision Castparts Corp., 2.50%, 01/15/2023 | | 4,150,000 | 4,235,605 |
| United Technologies Corp., 4.45%, 11/16/2038 | | 3,239,000 | 3,941,229 |
| | | | 15,876,396 |
| Agricultural & Farm Machinery–0.11% |
| Deere & Co., 2.60%, 06/08/2022 | | 14,645,000 | 14,924,905 |
| Agricultural Products–0.04% |
| Ingredion, Inc., 6.63%, 04/15/2037 | | 3,940,000 | 5,237,400 |
| Air Freight & Logistics–0.14% |
| FedEx Corp., | | |
| 4.90%, 01/15/2034 | | 4,310,000 | 5,119,778 |
| 5.10%, 01/15/2044 | | 8,875,000 | 10,379,380 |
| United Parcel Service, Inc., 3.40%, 11/15/2046 | | 2,608,000 | 2,730,481 |
| | | | 18,229,639 |
| Airlines–0.15% |
| American Airlines Pass Through Trust, Series 2014-1, Class A, 3.70%, 04/01/2028 | | 3,398,681 | 3,594,105 |
| Continental Airlines Pass Through Trust, | | |
| Series 2010-1, Class A, 4.75%, 01/12/2021 | | 2,052,941 | 2,114,377 |
| Series 2012-1, Class A, 4.15%, 04/11/2024 | | 4,051,954 | 4,301,150 |
| United Airlines Pass Through Trust, | | |
| Series 2014-2, Class A, 3.75%, 09/03/2026 | | 4,371,866 | 4,646,857 |
| Series 2018-1, Class AA, 3.50%, 03/01/2030 | | 5,193,981 | 5,510,189 |
| | | | 20,166,678 |
| Alternative Carriers–0.21% |
| GCI Liberty, Inc., 1.75%, 10/05/2023(c)(d) | | 22,928,000 | 27,957,830 |
| Application Software–0.66% |
| Nuance Communications, Inc., | | |
| 1.00%, 12/15/2022(d) | | 29,489,000 | 28,351,492 |
| 1.25%, 04/01/2025 | | 16,761,000 | 16,926,006 |
| RealPage, Inc., 1.50%, 11/15/2022 | | 6,658,000 | 10,677,921 |
| Workday, Inc., 0.25%, 10/01/2022 | | 22,666,000 | 30,715,965 |
| | | | 86,671,384 |
See accompanying Notes to Financial Statements which are an integral part of the financial statements.
| 13 | Invesco Equity and Income Fund |
| | Principal
Amount | Value |
| Asset Management & Custody Banks–0.15% |
| Apollo Management Holdings L.P., 4.00%, 05/30/2024(c) | | $4,260,000 | $4,534,434 |
| Blackstone Holdings Finance Co. LLC, 5.00%, 06/15/2044(c) | | 3,975,000 | 4,956,825 |
| Brookfield Asset Management, Inc. (Canada), 4.00%, 01/15/2025 | | 4,515,000 | 4,797,745 |
| Carlyle Holdings Finance LLC, 3.88%, 02/01/2023(c) | | 1,033,000 | 1,076,840 |
| KKR Group Finance Co. III LLC, 5.13%, 06/01/2044(c) | | 3,217,000 | 3,834,712 |
| | | | 19,200,556 |
| Automobile Manufacturers–0.19% |
| Ford Motor Credit Co. LLC, | | |
| 3.10%, 05/04/2023 | | 2,847,000 | 2,823,617 |
| 3.81%, 01/09/2024 | | 4,473,000 | 4,514,073 |
| 4.13%, 08/04/2025 | | 7,006,000 | 7,063,793 |
| General Motors Co., 6.60%, 04/01/2036 | | 4,317,000 | 5,020,005 |
| General Motors Financial Co., Inc., 5.25%, 03/01/2026 | | 5,467,000 | 5,978,797 |
| | | | 25,400,285 |
| Automotive Retail–0.05% |
| Advance Auto Parts, Inc., 4.50%, 12/01/2023 | | 6,415,000 | 6,912,443 |
| Biotechnology–0.88% |
| AbbVie, Inc., 4.50%, 05/14/2035 | | 7,233,000 | 7,860,189 |
| BioMarin Pharmaceutical, Inc., 1.50%, 10/15/2020 | | 23,901,000 | 25,514,317 |
| Celgene Corp., | | |
| 4.00%, 08/15/2023 | | 4,735,000 | 5,063,419 |
| 4.63%, 05/15/2044 | | 13,875,000 | 16,973,290 |
| Gilead Sciences, Inc., | | |
| 2.55%, 09/01/2020 | | 17,923,000 | 18,022,291 |
| 4.40%, 12/01/2021 | | 4,988,000 | 5,233,205 |
| Medicines Co. (The), 2.75%, 07/15/2023 | | 9,593,000 | 10,490,870 |
| Neurocrine Biosciences, Inc., 2.25%, 05/15/2024 | | 17,930,000 | 26,468,430 |
| | | | 115,626,011 |
| Brewers–0.32% |
| Anheuser-Busch Cos. LLC / Anheuser-Busch InBev Worldwide, Inc. (Belgium), 4.70%, 02/01/2036 | | 10,870,000 | 12,672,831 |
| Anheuser-Busch Cos. LLC/Anheuser-Busch InBev Worldwide, Inc. (Belgium), 4.90%, 02/01/2046 | | 12,141,000 | 14,529,015 |
| Heineken N.V. (Netherlands), 3.50%, 01/29/2028(c) | | 9,734,000 | 10,491,657 |
| | Principal
Amount | Value |
| Brewers–(continued) |
| Molson Coors Brewing Co., 4.20%, 07/15/2046 | | $4,057,000 | $4,136,675 |
| | | | 41,830,178 |
| Broadcasting–0.67% |
| Liberty Media Corp., | | |
| 2.25%, 10/05/2021(d) | | 14,987,000 | 8,277,850 |
| 1.38%, 10/15/2023 | | 61,171,000 | 72,377,527 |
| Liberty Formula One, 1.00%, 01/30/2023 | | 5,397,000 | 6,768,535 |
| | | | 87,423,912 |
| Cable & Satellite–0.92% |
| Charter Communications Operating, LLC/Charter Communications Operating Capital Corp., 4.46%, 07/23/2022 | | 10,845,000 | 11,462,822 |
| Comcast Corp., | | |
| 4.15%, 10/15/2028 | | 9,915,000 | 11,258,439 |
| 6.45%, 03/15/2037 | | 2,465,000 | 3,539,374 |
| 3.90%, 03/01/2038 | | 8,010,000 | 8,995,647 |
| 4.60%, 10/15/2038 | | 4,030,000 | 4,886,007 |
| DISH Network Corp., 3.38%, 08/15/2026 | | 47,161,000 | 43,517,950 |
| Liberty Latin America Ltd. (Chile), 2.00%, 07/15/2024(c) | | 26,445,000 | 25,987,502 |
| NBCUniversal Media LLC, | | |
| 5.15%, 04/30/2020 | | 3,320,000 | 3,384,555 |
| 5.95%, 04/01/2041 | | 3,365,000 | 4,689,829 |
| Sky Ltd. (United Kingdom), 2.63%, 09/16/2019(c) | | 3,050,000 | 3,050,229 |
| | | | 120,772,354 |
| Commodity Chemicals–0.07% |
| LYB Finance Co., B.V. (Netherlands), 8.10%, 03/15/2027(c) | | 7,384,000 | 9,494,733 |
| Communications Equipment–0.39% |
| Finisar Corp., 0.50%, 12/15/2021(d) | | 10,562,000 | 10,267,185 |
| Viavi Solutions, Inc., | | |
| 1.75%, 06/01/2023 | | 14,372,000 | 17,266,321 |
| 1.00%, 03/01/2024 | | 19,034,000 | 23,257,040 |
| | | | 50,790,546 |
| Consumer Finance–0.20% |
| American Express Co., 3.63%, 12/05/2024 | | 3,423,000 | 3,644,189 |
| Capital One Financial Corp., 3.20%, 01/30/2023 | | 10,060,000 | 10,372,139 |
| Discover Bank, 3.35%, 02/06/2023 | | 5,380,000 | 5,570,951 |
| Synchrony Financial, 3.95%, 12/01/2027 | | 5,795,000 | 6,012,935 |
| | | | 25,600,214 |
See accompanying Notes to Financial Statements which are an integral part of the financial statements.
| 14 | Invesco Equity and Income Fund |
| | Principal
Amount | Value |
| Data Processing & Outsourced Services–0.10% |
| Euronet Worldwide, Inc., 0.75%, 03/15/2025(c)(d) | | $6,048,000 | $7,172,665 |
| Fiserv, Inc., 3.80%, 10/01/2023 | | 5,200,000 | 5,515,534 |
| | | | 12,688,199 |
| Diversified Banks–1.91% |
| ANZ New Zealand (Int’l) Ltd. (New Zealand), 2.88%, 01/25/2022(c) | | 3,545,000 | 3,609,836 |
| Australia & New Zealand Banking Group Ltd. (Australia), | | |
| 2.70%, 11/16/2020 | | 30,315,000 | 30,582,783 |
| 2.30%, 06/01/2021 | | 7,448,000 | 7,492,055 |
| Bank of America Corp., 3.25%, 10/21/2027 | | 5,705,000 | 6,025,847 |
| Bank of Montreal (Canada), 2.10%, 12/12/2019 | | 26,340,000 | 26,336,361 |
| BBVA Bancomer S.A. (Mexico), 4.38%, 04/10/2024(c) | | 6,875,000 | 7,201,631 |
| Citigroup, Inc., | | |
| 3.67%, (3 mo. USD LIBOR + 1.39%), 07/24/2028(e) | | 5,405,000 | 5,799,312 |
| 6.68%, 09/13/2043 | | 8,000,000 | 11,876,214 |
| 5.30%, 05/06/2044 | | 2,765,000 | 3,535,304 |
| 4.75%, 05/18/2046 | | 4,145,000 | 5,029,601 |
| Commonwealth Bank of Australia (Australia), 2.25%, 03/10/2020(c) | | 10,540,000 | 10,553,772 |
| JPMorgan Chase & Co., | | |
| Series V, 5.00% (3 mo. USD LIBOR + 3.32%)(f) | | 6,410,000 | 6,405,193 |
| 3.20%, 06/15/2026 | | 4,365,000 | 4,578,729 |
| 3.51%, (3 mo. USD LIBOR + 0.95%), 01/23/2029(e) | | 11,170,000 | 11,970,590 |
| 4.26%, (3 mo. USD LIBOR + 1.58%), 02/22/2048(e) | | 5,355,000 | 6,518,118 |
| 3.90%, (3 mo. USD LIBOR + 1.22%), 01/23/2049(e) | | 11,170,000 | 12,862,014 |
| Mizuho Bank, Ltd. (Japan), 2.65%, 09/25/2019(c) | | 7,110,000 | 7,111,280 |
| Mizuho Financial Group Cayman 3 Ltd. (Japan), 4.60%, 03/27/2024(c) | | 545,000 | 587,245 |
| National Australia Bank Ltd. (Australia), 1.88%, 07/12/2021 | | 9,725,000 | 9,719,224 |
| SMBC Aviation Capital Finance DAC (Ireland), 2.65%, 07/15/2021(c) | | 3,225,000 | 3,239,830 |
| Societe Generale S.A. (France), | | |
| 2.63%, 09/16/2020(c) | | 8,565,000 | 8,608,042 |
| 5.00%, 01/17/2024(c) | | 7,365,000 | 7,934,041 |
| Standard Chartered PLC (United Kingdom), 3.05%, 01/15/2021(c) | | 7,250,000 | 7,320,990 |
| Sumitomo Mitsui Banking Corp. (Japan), 2.65%, 07/23/2020 | | 7,235,000 | 7,276,199 |
| | Principal
Amount | Value |
| Diversified Banks–(continued) |
| Toronto-Dominion Bank (The) (Canada), 2.65%, 06/12/2024 | | $6,105,000 | $6,269,047 |
| U.S. Bancorp, Series W, 3.10%, 04/27/2026 | | 3,245,000 | 3,406,159 |
| Wells Fargo & Co., | | |
| 3.55%, 09/29/2025 | | 6,840,000 | 7,283,930 |
| 4.10%, 06/03/2026 | | 4,515,000 | 4,894,263 |
| 4.65%, 11/04/2044 | | 14,430,000 | 17,362,420 |
| | | | 251,390,030 |
| Diversified Capital Markets–0.59% |
| Credit Suisse AG (Switzerland), 6.50%, 08/08/2023(c) | | 6,536,000 | 7,308,594 |
| Credit Suisse Group AG (Switzerland), 0.50%, 06/24/2024(c) | | 75,750,000 | 70,371,750 |
| | | | 77,680,344 |
| Diversified Chemicals–0.02% |
| Eastman Chemical Co., 2.70%, 01/15/2020 | | 2,529,000 | 2,530,874 |
| Diversified Metals & Mining–0.02% |
| Rio Tinto Finance USA Ltd. (Australia), 7.13%, 07/15/2028 | | 2,175,000 | 2,988,915 |
| Drug Retail–0.14% |
| CVS Pass Through Trust, 6.04%, 12/10/2028 | | 6,942,769 | 7,878,399 |
| Walgreens Boots Alliance, Inc., | | |
| 3.30%, 11/18/2021 | | 6,129,000 | 6,276,381 |
| 4.50%, 11/18/2034 | | 4,519,000 | 4,870,768 |
| | | | 19,025,548 |
| Electric Utilities–0.37% |
| Electricite de France S.A. (France), | | |
| 5.63%(c)(f) | | 6,390,000 | 6,682,119 |
| 4.60%, 01/27/2020(c) | | 2,150,000 | 2,169,361 |
| 4.88%, 01/22/2044(c) | | 9,110,000 | 10,818,167 |
| Georgia Power Co., 2.00%, 03/30/2020 | | 20,950,000 | 20,912,966 |
| NextEra Energy Capital Holdings, Inc., 3.55%, 05/01/2027 | | 5,572,000 | 5,961,045 |
| Ohio Power Co., Series M, 5.38%, 10/01/2021 | | 1,050,000 | 1,119,925 |
| PPL Electric Utilities Corp., 6.25%, 05/15/2039 | | 355,000 | 518,264 |
| | | | 48,181,847 |
| Environmental & Facilities Services–0.04% |
| Waste Management, Inc., 3.90%, 03/01/2035 | | 4,786,000 | 5,321,299 |
| Food Retail–0.01% |
| Alimentation Couche-Tard, Inc. (Canada), 4.50%, 07/26/2047(c) | | 1,188,000 | 1,333,277 |
See accompanying Notes to Financial Statements which are an integral part of the financial statements.
| 15 | Invesco Equity and Income Fund |
| | Principal
Amount | Value |
| General Merchandise Stores–0.03% |
| Dollar General Corp., 3.25%, 04/15/2023 | | $3,650,000 | $3,787,615 |
| Health Care Equipment–1.27% |
| Becton, Dickinson and Co., | | |
| 2.68%, 12/15/2019 | | 2,786,000 | 2,788,385 |
| 4.88%, 05/15/2044 | | 3,739,000 | 4,345,911 |
| DexCom, Inc., | | |
| 0.75%, 05/15/2022 | | 25,054,000 | 44,757,172 |
| 0.75%, 12/01/2023(c) | | 30,543,000 | 38,572,409 |
| Insulet Corp., 1.38%, 11/15/2024 | | 4,536,000 | 7,894,658 |
| Medtronic, Inc., | | |
| 3.15%, 03/15/2022 | | 4,299,000 | 4,446,699 |
| 4.38%, 03/15/2035 | | 2,601,000 | 3,151,411 |
| NuVasive, Inc., 2.25%, 03/15/2021 | | 20,477,000 | 24,342,752 |
| Wright Medical Group N.V., 2.25%, 11/15/2021 | | 9,978,000 | 11,703,115 |
| Wright Medical Group, Inc., 1.63%, 06/15/2023 | | 25,471,000 | 24,566,043 |
| | | | 166,568,555 |
| Health Care REITs–0.10% |
| HCP, Inc., | | |
| 4.20%, 03/01/2024 | | 4,690,000 | 5,075,892 |
| 3.88%, 08/15/2024 | | 5,085,000 | 5,476,404 |
| Ventas Realty L.P., 5.70%, 09/30/2043 | | 2,080,000 | 2,753,464 |
| | | | 13,305,760 |
| Health Care Services–0.24% |
| Cigna Corp., 4.80%, 08/15/2038 | | 3,240,000 | 3,753,040 |
| CVS Health Corp., | | |
| 3.38%, 08/12/2024 | | 3,740,000 | 3,887,679 |
| 4.10%, 03/25/2025 | | 13,266,000 | 14,201,686 |
| Laboratory Corp. of America Holdings, | | |
| 3.20%, 02/01/2022 | | 6,132,000 | 6,278,595 |
| 4.70%, 02/01/2045 | | 2,694,000 | 3,066,837 |
| | | | 31,187,837 |
| Home Improvement Retail–0.10% |
| Home Depot, Inc. (The), 2.00%, 04/01/2021 | | 6,883,000 | 6,898,603 |
| Lowe’s Cos., Inc., 4.55%, 04/05/2049 | | 5,625,000 | 6,587,162 |
| | | | 13,485,765 |
| Homebuilding–0.08% |
| MDC Holdings, Inc., 6.00%, 01/15/2043 | | 10,130,000 | 10,433,900 |
| Hotel & Resort REITs–0.01% |
| Hospitality Properties Trust, 5.00%, 08/15/2022 | | 1,310,000 | 1,376,853 |
| | Principal
Amount | Value |
| Housewares & Specialties–0.04% |
| Tupperware Brands Corp., 4.75%, 06/01/2021 | | $5,638,000 | $5,747,058 |
| Insurance Brokers–0.02% |
| Willis North America, Inc., 3.60%, 05/15/2024 | | 2,470,000 | 2,576,197 |
| Integrated Oil & Gas–0.16% |
| Husky Energy, Inc. (Canada), 3.95%, 04/15/2022 | | 3,630,000 | 3,759,124 |
| Occidental Petroleum Corp., | | |
| 3.40%, 04/15/2026 | | 4,005,000 | 4,077,032 |
| 3.20%, 08/15/2026 | | 2,408,000 | 2,435,124 |
| Petroleos Mexicanos (Mexico), 4.88%, 01/24/2022 | | 7,430,000 | 7,569,313 |
| Suncor Energy, Inc. (Canada), 3.60%, 12/01/2024 | | 3,379,000 | 3,564,426 |
| | | | 21,405,019 |
| Integrated Telecommunication Services–0.62% |
| AT&T, Inc., | | |
| 3.00%, 06/30/2022 | | 5,334,000 | 5,455,229 |
| 3.40%, 05/15/2025 | | 4,966,000 | 5,220,053 |
| 4.30%, 02/15/2030 | | 3,526,000 | 3,918,809 |
| 4.50%, 05/15/2035 | | 4,755,000 | 5,299,752 |
| 5.35%, 09/01/2040 | | 2,077,000 | 2,478,436 |
| 5.15%, 03/15/2042 | | 1,370,000 | 1,598,532 |
| 4.80%, 06/15/2044 | | 10,275,000 | 11,495,643 |
| 5.15%, 11/15/2046 | | 3,698,000 | 4,357,046 |
| Orange S.A. (France), 1.63%, 11/03/2019 | | 14,365,000 | 14,350,514 |
| Telefonica Emisiones S.A. (Spain), | | |
| 7.05%, 06/20/2036 | | 3,600,000 | 4,914,221 |
| 4.67%, 03/06/2038 | | 3,505,000 | 3,882,483 |
| 5.21%, 03/08/2047 | | 6,725,000 | 7,845,382 |
| Verizon Communications, Inc., | | |
| 4.40%, 11/01/2034 | | 3,285,000 | 3,811,036 |
| 4.81%, 03/15/2039 | | 5,062,000 | 6,218,650 |
| 4.13%, 08/15/2046 | | 857,000 | 975,727 |
| | | | 81,821,513 |
| Interactive Media & Services–0.16% |
| YY, Inc. (China), 1.38%, 06/15/2024(c)(d) | | 22,673,000 | 21,114,231 |
| Internet & Direct Marketing Retail–0.74% |
| Amazon.com, Inc., 2.60%, 12/05/2019 | | 17,678,000 | 17,691,923 |
| Ctrip.com International, Ltd. (China), 1.25%, 09/15/2019(d) | | 30,912,000 | 30,898,152 |
| IAC Financeco 3, Inc., 2.00%, 01/15/2030(c) | | 33,949,000 | 39,626,228 |
| QVC, Inc., 5.45%, 08/15/2034 | | 8,810,000 | 9,002,447 |
| | | | 97,218,750 |
See accompanying Notes to Financial Statements which are an integral part of the financial statements.
| 16 | Invesco Equity and Income Fund |
| | Principal
Amount | Value |
| Investment Banking & Brokerage–0.56% |
| Goldman Sachs Group, Inc. (The), | | |
| 5.25%, 07/27/2021 | | $5,510,000 | $5,823,658 |
| 4.25%, 10/21/2025 | | 5,807,000 | 6,268,835 |
| GS Finance Corp., Series 0001, 0.25%, 07/08/2024 | | 56,790,000 | 53,731,291 |
| Morgan Stanley, 4.00%, 07/23/2025 | | 6,870,000 | 7,448,059 |
| | | | 73,271,843 |
| IT Consulting & Other Services–0.04% |
| DXC Technology Co., 4.45%, 09/18/2022 | | 4,954,000 | 5,209,995 |
| Life & Health Insurance–0.46% |
| Athene Global Funding, | | |
| 4.00%, 01/25/2022(c) | | 12,280,000 | 12,751,092 |
| 2.75%, 06/25/2024(c) | | 2,890,000 | 2,925,219 |
| Guardian Life Global Funding, 2.90%, 05/06/2024(c) | | 7,450,000 | 7,761,048 |
| Jackson National Life Global Funding, | | |
| 2.10%, 10/25/2021(c) | | 5,295,000 | 5,297,696 |
| 3.25%, 01/30/2024(c) | | 4,885,000 | 5,095,223 |
| Metropolitan Life Global Funding I, 2.05%, 06/12/2020(c) | | 5,740,000 | 5,748,129 |
| Nationwide Financial Services, Inc., 5.30%, 11/18/2044(c) | | 4,250,000 | 5,275,672 |
| Prudential Financial, Inc., | | |
| 3.91%, 12/07/2047 | | 4,898,000 | 5,462,763 |
| 3.94%, 12/07/2049 | | 4,856,000 | 5,420,095 |
| Reliance Standard Life Global Funding II, 3.05%, 01/20/2021(c) | | 4,985,000 | 5,036,242 |
| | | | 60,773,179 |
| Managed Health Care–0.05% |
| UnitedHealth Group, Inc., 3.50%, 08/15/2039 | | 5,806,000 | 6,192,168 |
| Movies & Entertainment–0.19% |
| Live Nation Entertainment, Inc., 2.50%, 03/15/2023 | | 20,716,000 | 25,187,080 |
| Multi-line Insurance–0.10% |
| American Financial Group, Inc., 4.50%, 06/15/2047 | | 5,075,000 | 5,591,331 |
| American International Group, Inc., 4.38%, 01/15/2055 | | 7,405,000 | 8,085,383 |
| | | | 13,676,714 |
| Multi-Utilities–0.10% |
| NiSource, Inc., 4.38%, 05/15/2047 | | 6,015,000 | 6,941,812 |
| Sempra Energy, 3.80%, 02/01/2038 | | 5,871,000 | 6,172,577 |
| | | | 13,114,389 |
| | Principal
Amount | Value |
| Office REITs–0.07% |
| Highwoods Realty L.P., 3.20%, 06/15/2021 | | $1,650,000 | $1,672,049 |
| Office Properties Income Trust, 4.00%, 07/15/2022 | | 7,200,000 | 7,359,417 |
| | | | 9,031,466 |
| Oil & Gas Equipment & Services–0.18% |
| Helix Energy Solutions Group, Inc., 4.25%, 05/01/2022 | | 10,666,000 | 10,299,356 |
| Oil States International, Inc., 1.50%, 02/15/2023 | | 15,097,000 | 12,772,804 |
| | | | 23,072,160 |
| Oil & Gas Exploration & Production–0.26% |
| Chesapeake Energy Corp., 5.50%, 09/15/2026 | | 10,145,000 | 6,420,814 |
| ConocoPhillips Co., 4.15%, 11/15/2034 | | 2,403,000 | 2,735,843 |
| Enterprise Products Operating LLC, | | |
| 2.55%, 10/15/2019 | | 3,770,000 | 3,769,820 |
| 5.25%, 01/31/2020 | | 2,889,000 | 2,922,391 |
| 6.45%, 09/01/2040 | | 555,000 | 751,808 |
| 4.25%, 02/15/2048 | | 7,354,000 | 8,008,997 |
| Noble Energy, Inc., 5.25%, 11/15/2043 | | 7,940,000 | 9,015,021 |
| | | | 33,624,694 |
| Oil & Gas Storage & Transportation–0.74% |
| Energy Transfer Operating, L.P., | | |
| 7.50%, 10/15/2020 | | 26,495,000 | 27,924,731 |
| 4.20%, 09/15/2023 | | 1,638,000 | 1,732,988 |
| 4.90%, 03/15/2035 | | 3,640,000 | 3,816,851 |
| Kinder Morgan, Inc., 5.30%, 12/01/2034 | | 4,203,000 | 4,903,228 |
| MPLX L.P., | | |
| 4.50%, 07/15/2023 | | 18,525,000 | 19,779,597 |
| 4.50%, 04/15/2038 | | 8,564,000 | 8,900,846 |
| Plains All American Pipeline L.P./PAA Finance Corp., 3.65%, 06/01/2022 | | 4,275,000 | 4,395,201 |
| Spectra Energy Partners, L.P., 4.50%, 03/15/2045 | | 5,468,000 | 5,988,206 |
| Sunoco Logistics Partners Operations L.P., | | |
| 5.50%, 02/15/2020 | | 5,405,000 | 5,472,578 |
| 5.30%, 04/01/2044 | | 8,165,000 | 8,755,368 |
| Texas Eastern Transmission L.P., 7.00%, 07/15/2032 | | 3,835,000 | 5,244,310 |
| | | | 96,913,904 |
| Other Diversified Financial Services–1.51% |
| Convertible Trust - Consumer, Series 2018-1, 0.25%, 01/17/2024 | | 57,077,000 | 57,927,447 |
| Convertible Trust - Energy, Series 2019-1, 0.33%, 09/19/2024 | | 60,352,000 | 60,858,957 |
See accompanying Notes to Financial Statements which are an integral part of the financial statements.
| 17 | Invesco Equity and Income Fund |
| | Principal
Amount | Value |
| Other Diversified Financial Services–(continued) |
| Convertible Trust - Healthcare, Series 2018-1, 0.25%, 02/05/2024 | | $56,758,000 | $59,471,032 |
| ERAC USA Finance LLC, 2.35%, 10/15/2019(c) | | 9,335,000 | 9,333,034 |
| MassMutual Global Funding II, 2.00%, 04/15/2021(c) | | 10,205,000 | 10,211,473 |
| | | | 197,801,943 |
| Packaged Foods & Meats–0.33% |
| General Mills, Inc., 2.20%, 10/21/2019 | | 8,595,000 | 8,592,500 |
| J. M. Smucker Co. (The), 2.50%, 03/15/2020 | | 33,540,000 | 33,592,133 |
| Mead Johnson Nutrition Co. (United Kingdom), 4.13%, 11/15/2025 | | 648,000 | 714,800 |
| | | | 42,899,433 |
| Paper Packaging–0.12% |
| International Paper Co., 6.00%, 11/15/2041 | | 2,855,000 | 3,554,545 |
| Packaging Corp. of America, 4.50%, 11/01/2023 | | 11,003,000 | 11,856,540 |
| | | | 15,411,085 |
| Pharmaceuticals–0.78% |
| Allergan Funding SCS, 4.85%, 06/15/2044 | | 9,265,000 | 10,179,279 |
| Bayer US Finance II LLC (Germany), 4.38%, 12/15/2028(c) | | 9,800,000 | 10,712,568 |
| Bayer US Finance LLC (Germany), | | |
| 2.38%, 10/08/2019(c) | | 21,949,000 | 21,940,224 |
| 3.00%, 10/08/2021(c) | | 6,079,000 | 6,157,574 |
| Bristol-Myers Squibb Co., 4.13%, 06/15/2039(c) | | 6,435,000 | 7,482,087 |
| Jazz Investments I Ltd., 1.88%, 08/15/2021 | | 14,556,000 | 14,646,975 |
| Mylan N.V., 3.15%, 06/15/2021 | | 4,535,000 | 4,589,916 |
| Pacira BioSciences, Inc., 2.38%, 04/01/2022 | | 11,404,000 | 11,375,490 |
| Perrigo Finance Unlimited Co., 3.50%, 03/15/2021 | | 520,000 | 522,931 |
| Supernus Pharmaceuticals, Inc., 0.63%, 04/01/2023 | | 11,008,000 | 10,232,088 |
| Zoetis, Inc., 4.70%, 02/01/2043 | | 4,101,000 | 5,000,242 |
| | | | 102,839,374 |
| Property & Casualty Insurance–0.30% |
| Allstate Corp. (The), 3.28%, 12/15/2026 | | 3,260,000 | 3,525,377 |
| Liberty Mutual Group, Inc., 4.85%, 08/01/2044(c) | | 9,030,000 | 10,891,475 |
| | Principal
Amount | Value |
| Property & Casualty Insurance–(continued) |
| Markel Corp., | | |
| 5.00%, 03/30/2043 | | $4,185,000 | $4,835,873 |
| 5.00%, 05/20/2049 | | 5,140,000 | 6,220,675 |
| Travelers Cos., Inc. (The), 4.60%, 08/01/2043 | | 6,455,000 | 8,142,880 |
| WR Berkley Corp., 4.63%, 03/15/2022 | | 5,040,000 | 5,346,537 |
| | | | 38,962,817 |
| Railroads–0.20% |
| Burlington Northern Santa Fe, LLC, 5.15%, 09/01/2043 | | 9,530,000 | 12,407,937 |
| CSX Corp., 5.50%, 04/15/2041 | | 1,660,000 | 2,115,211 |
| Union Pacific Corp., | | |
| 4.85%, 06/15/2044 | | 5,560,000 | 6,876,042 |
| 4.15%, 01/15/2045 | | 4,410,000 | 4,919,768 |
| | | | 26,318,958 |
| Regional Banks–0.10% |
| Citizens Financial Group, Inc., 2.38%, 07/28/2021 | | 4,700,000 | 4,717,393 |
| The PNC Financial Services Group, Inc., 3.45%, 04/23/2029 | | 7,450,000 | 8,074,284 |
| | | | 12,791,677 |
| Reinsurance–0.12% |
| PartnerRe Finance B LLC, 3.70%, 07/02/2029 | | 11,285,000 | 11,982,022 |
| Reinsurance Group of America, Inc., 4.70%, 09/15/2023 | | 3,711,000 | 4,050,116 |
| | | | 16,032,138 |
| Renewable Electricity–0.05% |
| Oglethorpe Power Corp., 4.55%, 06/01/2044 | | 5,806,000 | 6,439,348 |
| Restaurants–0.06% |
| Starbucks Corp., 3.55%, 08/15/2029 | | 7,440,000 | 8,147,769 |
| Retail REITs–0.09% |
| Regency Centers, L.P., | | |
| 2.95%, 09/15/2029 | | 7,960,000 | 8,070,145 |
| 4.65%, 03/15/2049 | | 2,970,000 | 3,659,124 |
| | | | 11,729,269 |
| Semiconductor Equipment–0.23% |
| Applied Materials, Inc., 2.63%, 10/01/2020 | | 22,800,000 | 22,957,113 |
| Broadcom Corp./Broadcom Cayman Finance Ltd., 3.63%, 01/15/2024 | | 6,975,000 | 7,123,088 |
| | | | 30,080,201 |
| Semiconductors–0.75% |
| Cree, Inc., 0.88%, 09/01/2023(c) | | 33,830,000 | 34,964,039 |
See accompanying Notes to Financial Statements which are an integral part of the financial statements.
| 18 | Invesco Equity and Income Fund |
| | Principal
Amount | Value |
| Semiconductors–(continued) |
| Microchip Technology, Inc., 1.63%, 02/15/2027 | | $20,600,000 | $25,097,008 |
| NXP B.V./NXP Funding LLC (Netherlands), 5.35%, 03/01/2026(c) | | 7,660,000 | 8,661,137 |
| ON Semiconductor Corp., 1.00%, 12/01/2020 | | 17,148,000 | 19,472,792 |
| Silicon Laboratories, Inc., 1.38%, 03/01/2022 | | 5,936,000 | 7,657,116 |
| Texas Instruments, Inc., 2.63%, 05/15/2024 | | 2,275,000 | 2,348,434 |
| | | | 98,200,526 |
| Specialized REITs–0.19% |
| Crown Castle International Corp., 4.75%, 05/15/2047 | | 470,000 | 556,782 |
| EPR Properties, 4.75%, 12/15/2026 | | 17,525,000 | 19,024,151 |
| LifeStorage L.P., 3.50%, 07/01/2026 | | 4,667,000 | 4,839,887 |
| | | | 24,420,820 |
| Specialty Chemicals–0.01% |
| Sherwin-Williams Co. (The), 4.50%, 06/01/2047 | | 1,665,000 | 1,898,368 |
| Systems Software–0.29% |
| FireEye, Inc., | | |
| Series A, 1.00%, 06/01/2020(d) | | 17,382,000 | 17,192,076 |
| Series B, 1.63%, 06/01/2022(d) | | 17,616,000 | 16,694,523 |
| Microsoft Corp., 3.50%, 02/12/2035 | | 4,259,000 | 4,806,302 |
| | | | 38,692,901 |
| Technology Distributors–0.06% |
| Avnet, Inc., 4.63%, 04/15/2026 | | 7,645,000 | 8,342,522 |
| Technology Hardware, Storage & Peripherals–0.46% |
| Apple, Inc., | | |
| 2.15%, 02/09/2022 | | 7,303,000 | 7,369,066 |
| 3.35%, 02/09/2027 | | 3,495,000 | 3,780,250 |
| Dell International LLC/EMC Corp., | | |
| 5.45%, 06/15/2023(c) | | 7,237,000 | 7,870,584 |
| 8.35%, 07/15/2046(c) | | 278,000 | 365,729 |
| SanDisk LLC, 0.50%, 10/15/2020 | | 24,327,000 | 21,767,799 |
| Western Digital Corp., 1.50%, 02/01/2024(c) | | 20,616,000 | 19,473,812 |
| | | | 60,627,240 |
| Tobacco–0.26% |
| Altria Group, Inc., 5.80%, 02/14/2039 | | 12,541,000 | 15,502,728 |
| | Principal
Amount | Value |
| Tobacco–(continued) |
| Philip Morris International, Inc., | | |
| 3.60%, 11/15/2023 | | $3,940,000 | $4,161,713 |
| 4.88%, 11/15/2043 | | 11,740,000 | 13,881,259 |
| | | | 33,545,700 |
| Trading Companies & Distributors–0.09% |
| Air Lease Corp., | | |
| 3.00%, 09/15/2023 | | 627,000 | 638,577 |
| 4.25%, 09/15/2024 | | 4,355,000 | 4,684,707 |
| Aircastle Ltd., 4.40%, 09/25/2023 | | 5,510,000 | 5,826,392 |
| | | | 11,149,676 |
| Trucking–0.11% |
| Aviation Capital Group LLC, | | |
| 2.88%, 01/20/2022(c) | | 6,230,000 | 6,325,427 |
| 4.88%, 10/01/2025(c) | | 7,745,000 | 8,548,406 |
| | | | 14,873,833 |
| Wireless Telecommunication Services–0.18% |
| America Movil, S.A.B. de C.V. (Mexico), 4.38%, 07/16/2042 | | 6,610,000 | 7,708,395 |
| Rogers Communications, Inc. (Canada), | | |
| 4.50%, 03/15/2043 | | 6,080,000 | 7,135,115 |
| 4.30%, 02/15/2048 | | 8,020,000 | 9,343,903 |
| | | | 24,187,413 |
| Total U.S. Dollar Denominated Bonds & Notes (Cost $2,570,645,164) | 2,768,745,453 |
| U.S. Treasury Securities–11.74% |
| U.S. Treasury Bills–0.01% |
| 1.80% - 1.83%, 12/19/2019(g)(h) | | 1,065,000 | 1,059,013 |
| U.S. Treasury Bonds–1.57% |
| 4.50%, 02/15/2036 | | 9,250,000 | 13,010,342 |
| 2.88%, 05/15/2049 | | 160,754,900 | 193,747,332 |
| | | | 206,757,674 |
| U.S. Treasury Notes–10.16% |
| 3.38%, 11/15/2019 | | 10,000,000 | 10,024,805 |
| 1.75%, 07/31/2021 | | 515,861,000 | 518,047,364 |
| 1.50%, 08/15/2022 | | 135,674,000 | 135,957,537 |
| 1.75%, 07/31/2024 | | 433,484,700 | 440,799,754 |
| 1.88%, 07/31/2026 | | 26,831,000 | 27,576,713 |
| 1.63%, 08/15/2029 | | 199,470,700 | 201,773,184 |
| | | | 1,334,179,357 |
| Total U.S. Treasury Securities (Cost $1,516,239,641) | 1,541,996,044 |
| | Shares | |
| Preferred Stocks–0.55% |
| Asset Management & Custody Banks–0.17% |
| AMG Capital Trust II, $2.58 Conv. Pfd. | 483,000 | 22,669,841 |
See accompanying Notes to Financial Statements which are an integral part of the financial statements.
| 19 | Invesco Equity and Income Fund |
| | Shares | Value |
| Diversified Banks–0.03% |
| Wells Fargo & Co., 5.85%, Series Q, Pfd. | 142,800 | $3,769,920 |
| Oil & Gas Storage & Transportation–0.35% |
| El Paso Energy Capital Trust I, $2.38 Conv. Pfd. | 875,900 | 45,564,318 |
| Total Preferred Stocks (Cost $63,824,606) | 72,004,079 |
| | Principal
Amount | |
| U.S. Government Sponsored Agency Mortgage-Backed Securities–0.15% |
| Federal Home Loan Mortgage Corp. (FHLMC)–0.08% |
| 6.50%, 05/01/2029 | | $1 | 1 |
| 6.75%, 03/15/2031 | | 7,000,000 | 10,598,400 |
| 5.50%, 02/01/2037 | | 15 | 18 |
| | | | 10,598,419 |
| Federal National Mortgage Association (FNMA)–0.07% |
| 5.50%, 03/01/2021 | | 14 | 15 |
| 6.63%, 11/15/2030 | | 6,315,000 | 9,420,701 |
| 7.00%, 07/01/2032 | | 6,204 | 6,225 |
| | | | 9,426,941 |
| Government National Mortgage Association (GNMA)–0.00% |
| 8.00%, 06/15/2026 to 01/20/2031 | | 16,005 | 16,505 |
| 7.50%, 12/20/2030 | | 1,025 | 1,238 |
| | | | 17,743 |
| Total U.S. Government Sponsored Agency Mortgage-Backed Securities (Cost $17,476,644) | 20,043,103 |
| | Principal
Amount | Value |
|
| Municipal Obligations–0.06% |
Georgia (State of) Municipal Electric Authority (Plant Vogtle Units 3 & 4 Project M), Series 2010 A, RB, 6.66%, 04/01/2057
(Cost $4,938,000) | | $4,938,000 | $7,261,527 |
| | Shares | |
| Money Market Funds–7.15% |
| Invesco Government & Agency Portfolio, Institutional Class, 2.02%(i) | 319,714,617 | 319,714,617 |
| Invesco Liquid Assets Portfolio, Institutional Class, 2.14%(i) | 238,271,112 | 238,366,420 |
| Invesco Treasury Portfolio, Institutional Class, 1.98%(i) | 381,390,711 | 381,390,711 |
| Total Money Market Funds (Cost $939,428,085) | 939,471,748 |
| TOTAL INVESTMENTS IN SECURITIES–100.29% (Cost $11,624,195,507) | 13,171,465,805 |
| OTHER ASSETS LESS LIABILITIES—(0.29)% | (37,509,114) |
| NET ASSETS–100.00% | $13,133,956,691 |
Investment Abbreviations:
| Conv. | – Convertible |
| DAC | – Designated Activity Co. |
| LIBOR | – London Interbank Offered Rate |
| Pfd. | – Preferred |
| RB | – Revenue Bonds |
| REIT | – Real Estate Investment Trust |
| USD | – U.S. Dollar |
Notes to Schedule of Investments:
| (a) | Industry and/or sector classifications used in this report are generally according to the Global Industry Classification Standard, which was developed by and is the exclusive property and a service mark of MSCI Inc. and Standard & Poor’s. |
| (b) | Non-income producing security. |
| (c) | Security purchased or received in a transaction exempt from registration under the Securities Act of 1933, as amended (the “1933 Act”). The security may be resold pursuant to an exemption from registration under the 1933 Act, typically to qualified institutional buyers. The aggregate value of these securities at August 31, 2019 was $568,658,654, which represented 4.33% of the Fund’s Net Assets. |
| (d) | Security has an irrevocable call by the issuer or mandatory put by the holder. Maturity date reflects such call or put. |
| (e) | Interest or dividend rate is redetermined periodically. Rate shown is the rate in effect on August 31, 2019. |
| (f) | Perpetual bond with no specified maturity date. |
| (g) | All or a portion of the value was pledged as collateral to cover margin requirements for open futures contracts. See Note 1K. |
| (h) | Security traded on a discount basis. The interest rate shown represents the discount rate at the time of purchase by the Fund. |
| (i) | The money market fund and the Fund are affiliated by having the same investment adviser. The rate shown is the 7-day SEC standardized yield as of August 31, 2019. |
See accompanying Notes to Financial Statements which are an integral part of the financial statements.
| 20 | Invesco Equity and Income Fund |
| Open Futures Contracts |
| Short Futures Contracts | Number of
Contracts | Expiration
Month | Notional
Value | Value | Unrealized
Appreciation
(Depreciation) |
| Interest Rate Risk |
| U.S. Treasury 5 Year Notes | 237 | December-2019 | $(28,434,445) | $(4,267) | $(4,267) |
| U.S. Treasury 10 Year Notes | 359 | December-2019 | (47,287,031) | 27,333 | 27,333 |
| Total Futures Contracts | $23,066 | $23,066 |
| Open Forward Foreign Currency Contracts |
Settlement
Date | Counterparty | Contract to | Unrealized
Appreciation
(Depreciation) |
| Deliver | Receive |
| Currency Risk | | | | | | |
| 09/13/2019 | Bank of New York Mellon (The) | CHF | 98,540,690 | USD | 101,491,035 | $1,850,617 |
| 09/13/2019 | Bank of New York Mellon (The) | EUR | 64,442,870 | USD | 72,313,406 | 1,438,760 |
| 09/13/2019 | State Street Bank & Trust Co. | CAD | 71,737,950 | USD | 54,451,228 | 560,926 |
| 09/13/2019 | State Street Bank & Trust Co. | CHF | 5,838,254 | USD | 5,979,930 | 76,520 |
| 09/13/2019 | State Street Bank & Trust Co. | EUR | 4,245,832 | USD | 4,739,570 | 69,979 |
| 09/13/2019 | State Street Bank & Trust Co. | GBP | 284,590,245 | USD | 346,700,073 | 276,673 |
| 09/13/2019 | State Street Bank & Trust Co. | USD | 17,521,078 | GBP | 14,405,078 | 13,803 |
| Subtotal—Appreciation | 4,287,278 |
| Currency Risk | | | | | | |
| 09/13/2019 | State Street Bank & Trust Co. | CAD | 4,394,616 | USD | 3,301,164 | (118) |
| 09/13/2019 | State Street Bank & Trust Co. | USD | 3,547,555 | CAD | 4,706,134 | (12,257) |
| 09/13/2019 | State Street Bank & Trust Co. | USD | 7,880,201 | CHF | 7,692,791 | (101,558) |
| 09/13/2019 | State Street Bank & Trust Co. | USD | 1,823,590 | EUR | 1,623,662 | (37,877) |
| Subtotal—Depreciation | (151,810) |
| Total Forward Foreign Currency Contracts | $4,135,468 |
| Abbreviations: |
| CAD | —Canadian Dollar |
| CHF | —Swiss Franc |
| EUR | —Euro |
| GBP | —British Pound Sterling |
| USD | —U.S. Dollar |
See accompanying Notes to Financial Statements which are an integral part of the financial statements.
| 21 | Invesco Equity and Income Fund |
Statement of Assets and Liabilities
August 31, 2019
| Assets: | |
Investments in securities, at value
(Cost $10,684,767,422) | $12,231,994,057 |
| Investments in affiliated money market funds, at value (Cost $939,428,085) | 939,471,748 |
| Other investments: | |
| Unrealized appreciation on forward foreign currency contracts outstanding | 4,287,278 |
| Foreign currencies, at value (Cost $206,917) | 202,861 |
| Receivable for: | |
| Fund shares sold | 5,951,340 |
| Investments sold | 7,717,655 |
| Interest | 22,384,090 |
| Dividends | 22,421,755 |
| Investment for trustee deferred compensation and retirement plans | 1,301,756 |
| Other assets | 179,955 |
| Total assets | 13,235,912,495 |
| Liabilities: | |
| Other investments: | |
| Variation margin payable - futures contracts | 55,877 |
| Unrealized depreciation on forward foreign currency contracts outstanding | 151,810 |
| Payable for: | |
| Investments purchased | 73,774,876 |
| Fund shares reacquired | 18,271,529 |
| Accrued fees to affiliates | 7,734,022 |
| Accrued trustees’ and officers’ fees and benefits | 24,642 |
| Accrued other operating expenses | 475,353 |
| Trustee deferred compensation and retirement plans | 1,467,695 |
| Total liabilities | 101,955,804 |
| Net assets applicable to shares outstanding | $13,133,956,691 |
| Net assets consist of: | |
| Shares of beneficial interest | $10,988,470,788 |
| Distributable earnings | 2,145,485,903 |
| | $13,133,956,691 |
| Net Assets: |
| Class A | $9,845,901,718 |
| Class C | $576,794,189 |
| Class R | $148,055,045 |
| Class Y | $987,286,813 |
| Class R5 | $397,606,732 |
| Class R6 | $1,178,312,194 |
| Shares outstanding, no par value, with an unlimited number of shares authorized: |
| Class A | 973,270,811 |
| Class C | 58,184,899 |
| Class R | 14,554,426 |
| Class Y | 97,557,022 |
| Class R5 | 39,287,255 |
| Class R6 | 116,471,113 |
| Class A: | |
| Net asset value per share | $10.12 |
Maximum offering price per share
(Net asset value of $10.12 ÷ 94.50%) | $10.71 |
| Class C: | |
| Net asset value and offering price per share | $9.91 |
| Class R: | |
| Net asset value and offering price per share | $10.17 |
| Class Y: | |
| Net asset value and offering price per share | $10.12 |
| Class R5: | |
| Net asset value and offering price per share | $10.12 |
| Class R6: | |
| Net asset value and offering price per share | $10.12 |
See accompanying Notes to Financial Statements which are an integral part of the financial statements.
| 22 | Invesco Equity and Income Fund |
Statement of Operations
For the year ended August 31, 2019
| Investment income: | |
| Dividends (net of foreign withholding taxes of $4,163,160) | $230,988,994 |
| Interest | 112,898,031 |
| Dividends from affiliated money market funds | 16,389,851 |
| Total investment income | 360,276,876 |
| Expenses: | |
| Advisory fees | 47,918,741 |
| Administrative services fees | 1,574,963 |
| Custodian fees | 154,357 |
| Distribution fees: | |
| Class A | 24,533,342 |
| Class C | 8,761,345 |
| Class R | 854,128 |
| Transfer agent fees — A, C, R and Y | 18,910,070 |
| Transfer agent fees — R5 | 445,014 |
| Transfer agent fees — R6 | 90,716 |
| Trustees’ and officers’ fees and benefits | 225,486 |
| Registration and filing fees | 312,742 |
| Reports to shareholders | 837,580 |
| Professional services fees | 191,224 |
| Other | 147,435 |
| Total expenses | 104,957,143 |
| Less: Fees waived and/or expense offset arrangement(s) | (849,517) |
| Net expenses | 104,107,626 |
| Net investment income | 256,169,250 |
| Realized and unrealized gain (loss) from: | |
| Net realized gain (loss) from: | |
| Investment securities | 753,658,497 |
| Foreign currencies | 2,736,563 |
| Forward foreign currency contracts | 29,740,993 |
| Futures contracts | (7,653,441) |
| | 778,482,612 |
| Change in net unrealized appreciation (depreciation) of: | |
| Investment securities | (1,227,733,735) |
| Foreign currencies | (48,946) |
| Forward foreign currency contracts | 8,244,203 |
| Futures contracts | 57,423 |
| | (1,219,481,055) |
| Net realized and unrealized gain (loss) | (440,998,443) |
| Net increase (decrease) in net assets resulting from operations | $(184,829,193) |
See accompanying Notes to Financial Statements which are an integral part of the financial statements.
| 23 | Invesco Equity and Income Fund |
Statement of Changes in Net Assets
For the years ended August 31, 2019 and 2018
| | 2019 | 2018 |
| Operations: | | |
| Net investment income | $256,169,250 | $224,691,544 |
| Net realized gain | 778,482,612 | 790,431,159 |
| Change in net unrealized appreciation (depreciation) | (1,219,481,055) | 147,862,088 |
| Net increase (decrease) in net assets resulting from operations | (184,829,193) | 1,162,984,791 |
| Distributions to shareholders from distributable earnings(1): | | |
| Class A | (739,441,361) | (667,570,895) |
| Class B | — | (4,290,893) |
| Class C | (90,566,854) | (91,883,104) |
| Class R | (13,352,783) | (13,397,959) |
| Class Y | (87,464,258) | (82,863,114) |
| Class R5 | (36,501,722) | (32,795,473) |
| Class R6 | (94,244,636) | (67,258,264) |
| Total distributions from distributable earnings | (1,061,571,614) | (960,059,702) |
| Share transactions–net: | | |
| Class A | 528,250,556 | (61,133,576) |
| Class B | — | (97,942,010) |
| Class C | (710,214,780) | (141,090,843) |
| Class R | (37,847,325) | (14,236,143) |
| Class Y | (100,497,542) | (26,965,048) |
| Class R5 | (58,559,465) | 31,553,367 |
| Class R6 | 85,572,318 | 337,947,720 |
| Net increase (decrease) in net assets resulting from share transactions | (293,296,238) | 28,133,467 |
| Net increase (decrease) in net assets | (1,539,697,045) | 231,058,556 |
| Net assets: | | |
| Beginning of year | 14,673,653,736 | 14,442,595,180 |
| End of year | $13,133,956,691 | $14,673,653,736 |
| (1) | For the year ended August 31, 2018, distributions to shareholders from distributable earnings consisted of distributions from net investment income and distributions from net realized gains. The Securities and Exchange Commission eliminated the requirement to disclose the distribution components separately, except for tax return of capital. For the year ended August 31, 2018, distributions from net investment income were $204,059,936, $731,363, $19,632,122, $3,720,765, $27,131,829, $11,210,000 and $23,986,409 for Class A, Class B, Class C, Class R, Class Y, Class R5 and Class R6 shares, respectively, and distributions from net realized gains were $463,510,959, $3,559,530, $72,250,982, $9,677,194, $55,731,285, $21,585,473 and $43,271,855 for Class A, Class B, Class C, Class R, Class Y, Class R5 and Class R6 shares, respectively. |
See accompanying Notes to Financial Statements which are an integral part of the financial statements.
| 24 | Invesco Equity and Income Fund |
Financial Highlights
August 31, 2019
The following schedule presents financial highlights for a share of the Fund outstanding throughout the periods indicated.
| | Net asset
value,
beginning
of period | Net
investment
income(a) | Net gains
(losses)
on securities
(both
realized and
unrealized) | Total from
investment
operations | Dividends
from net
investment
income | Distributions
from net
realized
gains | Total
distributions | Net asset
value, end
of period | Total
return(b) | Net assets,
end of period
(000’s omitted) | Ratio of
expenses
to average
net assets
with fee waivers
and/or
expenses
absorbed | Ratio of
expenses
to average net
assets without
fee waivers
and/or
expenses
absorbed | Ratio of net
investment
income
to average
net assets | Portfolio
turnover(c) |
| Class A |
| Year ended 08/31/19 | $11.10 | $0.19 | $(0.36) | $(0.17) | $(0.21) | $(0.60) | $(0.81) | $10.12 | (0.96)% | $9,845,902 | 0.78%(d) | 0.79%(d) | 1.87%(d) | 138% |
| Year ended 08/31/18 | 10.96 | 0.17 | 0.70 | 0.87 | (0.22) | (0.51) | (0.73) | 11.10 | 8.21 | 10,151,828 | 0.77 | 0.78 | 1.55 | 129 |
| Year ended 08/31/17 | 10.22 | 0.19 | 1.02 | 1.21 | (0.18) | (0.29) | (0.47) | 10.96 | 12.04 | 10,072,836 | 0.79 | 0.80 | 1.79 | 94 |
| Year ended 08/31/16 | 10.01 | 0.15 | 0.55 | 0.70 | (0.22) | (0.27) | (0.49) | 10.22 | 7.43 | 10,054,983 | 0.79 | 0.80 | 1.57 | 93 |
| Year ended 08/31/15 | 11.42 | 0.15 | (0.33) | (0.18) | (0.28) | (0.95) | (1.23) | 10.01 | (1.65) | 9,879,022 | 0.79 | 0.80 | 1.38 | 69 |
| Class C |
| Year ended 08/31/19 | 10.89 | 0.12 | (0.36) | (0.24) | (0.14) | (0.60) | (0.74) | 9.91 | (1.75)(e) | 576,794 | 1.49(d)(e) | 1.50(d)(e) | 1.16(d)(e) | 138 |
| Year ended 08/31/18 | 10.76 | 0.09 | 0.69 | 0.78 | (0.14) | (0.51) | (0.65) | 10.89 | 7.43(e) | 1,437,488 | 1.51(e) | 1.52(e) | 0.81(e) | 129 |
| Year ended 08/31/17 | 10.04 | 0.11 | 1.00 | 1.11 | (0.10) | (0.29) | (0.39) | 10.76 | 11.21 | 1,559,156 | 1.54 | 1.55 | 1.04 | 94 |
| Year ended 08/31/16 | 9.83 | 0.08 | 0.55 | 0.63 | (0.15) | (0.27) | (0.42) | 10.04 | 6.71(e) | 1,636,583 | 1.52(e) | 1.53(e) | 0.84(e) | 93 |
| Year ended 08/31/15 | 11.24 | 0.07 | (0.33) | (0.26) | (0.20) | (0.95) | (1.15) | 9.83 | (2.48) | 1,667,769 | 1.54 | 1.55 | 0.63 | 69 |
| Class R |
| Year ended 08/31/19 | 11.16 | 0.17 | (0.37) | (0.20) | (0.19) | (0.60) | (0.79) | 10.17 | (1.30) | 148,055 | 1.03(d) | 1.04(d) | 1.62(d) | 138 |
| Year ended 08/31/18 | 11.01 | 0.14 | 0.72 | 0.86 | (0.20) | (0.51) | (0.71) | 11.16 | 8.00 | 203,003 | 1.02 | 1.03 | 1.30 | 129 |
| Year ended 08/31/17 | 10.27 | 0.17 | 1.02 | 1.19 | (0.16) | (0.29) | (0.45) | 11.01 | 11.71 | 214,107 | 1.04 | 1.05 | 1.54 | 94 |
| Year ended 08/31/16 | 10.05 | 0.13 | 0.56 | 0.69 | (0.20) | (0.27) | (0.47) | 10.27 | 7.24 | 216,293 | 1.04 | 1.05 | 1.32 | 93 |
| Year ended 08/31/15 | 11.47 | 0.13 | (0.34) | (0.21) | (0.26) | (0.95) | (1.21) | 10.05 | (1.98) | 221,987 | 1.04 | 1.05 | 1.13 | 69 |
| Class Y |
| Year ended 08/31/19 | 11.11 | 0.22 | (0.37) | (0.15) | (0.24) | (0.60) | (0.84) | 10.12 | (0.81) | 987,287 | 0.53(d) | 0.54(d) | 2.12(d) | 138 |
| Year ended 08/31/18 | 10.96 | 0.20 | 0.71 | 0.91 | (0.25) | (0.51) | (0.76) | 11.11 | 8.58 | 1,192,995 | 0.52 | 0.53 | 1.80 | 129 |
| Year ended 08/31/17 | 10.22 | 0.22 | 1.01 | 1.23 | (0.20) | (0.29) | (0.49) | 10.96 | 12.32 | 1,202,149 | 0.54 | 0.55 | 2.04 | 94 |
| Year ended 08/31/16 | 10.01 | 0.18 | 0.55 | 0.73 | (0.25) | (0.27) | (0.52) | 10.22 | 7.70 | 819,708 | 0.54 | 0.55 | 1.82 | 93 |
| Year ended 08/31/15 | 11.43 | 0.17 | (0.33) | (0.16) | (0.31) | (0.95) | (1.26) | 10.01 | (1.49) | 784,238 | 0.54 | 0.55 | 1.63 | 69 |
| Class R5 |
| Year ended 08/31/19 | 11.11 | 0.22 | (0.36) | (0.14) | (0.25) | (0.60) | (0.85) | 10.12 | (0.75) | 397,607 | 0.47(d) | 0.48(d) | 2.18(d) | 138 |
| Year ended 08/31/18 | 10.96 | 0.20 | 0.72 | 0.92 | (0.26) | (0.51) | (0.77) | 11.11 | 8.64 | 494,838 | 0.47 | 0.48 | 1.85 | 129 |
| Year ended 08/31/17 | 10.23 | 0.22 | 1.01 | 1.23 | (0.21) | (0.29) | (0.50) | 10.96 | 12.28 | 457,500 | 0.48 | 0.49 | 2.10 | 94 |
| Year ended 08/31/16 | 10.02 | 0.18 | 0.56 | 0.74 | (0.26) | (0.27) | (0.53) | 10.23 | 7.78 | 438,538 | 0.47 | 0.48 | 1.89 | 93 |
| Year ended 08/31/15 | 11.43 | 0.18 | (0.32) | (0.14) | (0.32) | (0.95) | (1.27) | 10.02 | (1.32) | 411,579 | 0.47 | 0.48 | 1.70 | 69 |
| Class R6 |
| Year ended 08/31/19 | 11.10 | 0.23 | (0.35) | (0.12) | (0.26) | (0.60) | (0.86) | 10.12 | (0.56) | 1,178,312 | 0.38(d) | 0.39(d) | 2.27(d) | 138 |
| Year ended 08/31/18 | 10.96 | 0.21 | 0.71 | 0.92 | (0.27) | (0.51) | (0.78) | 11.10 | 8.64 | 1,193,501 | 0.38 | 0.39 | 1.94 | 129 |
| Year ended 08/31/17 | 10.22 | 0.24 | 1.01 | 1.25 | (0.22) | (0.29) | (0.51) | 10.96 | 12.50 | 843,229 | 0.38 | 0.39 | 2.20 | 94 |
| Year ended 08/31/16 | 10.01 | 0.19 | 0.56 | 0.75 | (0.27) | (0.27) | (0.54) | 10.22 | 7.89 | 283,631 | 0.37 | 0.38 | 1.99 | 93 |
| Year ended 08/31/15 | 11.43 | 0.19 | (0.33) | (0.14) | (0.33) | (0.95) | (1.28) | 10.01 | (1.33) | 191,328 | 0.37 | 0.38 | 1.80 | 69 |
| (a) | Calculated using average shares outstanding. |
| (b) | Includes adjustments in accordance with accounting principles generally accepted in the United States of America and as such, the net asset value for financial reporting purposes and the returns based upon those net asset values may differ from the net asset value and returns for shareholder transactions. Does not include sales charges and is not annualized for periods less than one year, if applicable. |
| (c) | Portfolio turnover is calculated at the fund level and is not annualized for periods less than one year, if applicable. |
| (d) | Ratios are based on average daily net assets (000’s omitted) of $9,821,194, $905,331, $170,826, $1,055,202, $455,863 and $1,175,511 for Class A, Class C, Class R, Class Y, Class R5 and Class R6 shares, respectively. |
| (e) | The total return, ratio of expenses to average net assets and ratio of net investment income to average net assets reflect actual 12b-1 fees of 0.97%, 0.99% and 0.98% for the years ended August 31, 2019, August 31, 2018 and August 31, 2016, respectively. |
See accompanying Notes to Financial Statements which are an integral part of the financial statements.
| 25 | Invesco Equity and Income Fund |
Notes to Financial Statements
August 31, 2019
NOTE 1—Significant Accounting Policies
Invesco Equity and Income Fund (the “Fund”) is a series portfolio of AIM Counselor Series Trust (Invesco Counselor Series Trust) (the “Trust”). The Trust is a Delaware statutory trust registered under the Investment Company Act of 1940, as amended (the “1940 Act”), as an open-end series management investment company authorized to issue an unlimited number of shares of beneficial interest. Information presented in these financial statements pertains only to the Fund. Matters affecting the Fund or each class will be voted on exclusively by the shareholders of the Fund or each class.
The Fund’s investment objective is current income and, secondarily, capital appreciation.
The Fund currently consists of six different classes of shares: Class A, Class C, Class R, Class Y, Class R5 and Class R6. Class Y shares are available only to certain investors. Class A shares are sold with a front-end sales charge unless certain waiver criteria are met. Under certain circumstances, load waived shares may be subject to contingent deferred sales charges ("CDSC"). Class C shares are sold with a CDSC. Class R, Class Y, Class R5 and Class R6 shares are sold at net asset value. Class C shares held for ten years after purchase are eligible for automatic conversion into Class A shares of the same Fund (the "Conversion Feature"). The automatic conversion pursuant to the Conversion Feature will generally occur at the end of the month following the tenth anniversary after a purchase of Class C shares.
The Fund is an investment company and accordingly follows the investment company accounting and reporting guidance in accordance with Financial Accounting Standards Board Accounting Standards Codification Topic 946,Financial Services – Investment Companies.
The following is a summary of the significant accounting policies followed by the Fund in the preparation of its financial statements.
| A. | Security Valuations – Securities, including restricted securities, are valued according to the following policy. |
Debt obligations (including convertible securities) and unlisted equities are fair valued using an evaluated quote provided by an independent pricing service. Evaluated quotes provided by the pricing service may be determined without exclusive reliance on quoted prices, and may reflect appropriate factors such as institution-size trading in similar groups of securities, developments related to specific securities, dividend rate (for unlisted equities), yield (for debt obligations), quality, type of issue, coupon rate (for debt obligations), maturity (for debt obligations), individual trading characteristics and other market data. Pricing services generally value debt obligations assuming orderly transactions of institutional round lot size, but a fund may hold or transact in the same securities in smaller, odd lot sizes. Odd lots often trade at lower prices than institutional round lots. Debt obligations are subject to interest rate and credit risks. In addition, all debt obligations involve some risk of default with respect to interest and/or principal payments.
A security listed or traded on an exchange (except convertible securities) is valued at its last sales price or official closing price as of the close of the customary trading session on the exchange where the security is principally traded, or lacking any sales or official closing price on a particular day, the security may be valued at the closing bid price on that day. Securities traded in the over-the-counter market are valued based on prices furnished by independent pricing services or market makers. When such securities are valued by an independent pricing service they may be considered fair valued. Futures contracts are valued at the final settlement price set by an exchange on which they are principally traded. Listed options are valued at the mean between the last bid and asked prices from the exchange on which they are principally traded. Options not listed on an exchange are valued by an independent source at the mean between the last bid and asked prices. For purposes of determining net asset value ("NAV") per share, futures and option contracts generally are valued 15 minutes after the close of the customary trading session of the New York Stock Exchange (“NYSE”).
Investments in open-end and closed-end registered investment companies that do not trade on an exchange are valued at the end-of-day net asset value per share. Investments in open-end and closed-end registered investment companies that trade on an exchange are valued at the last sales price or official closing price as of the close of the customary trading session on the exchange where the security is principally traded.
Foreign securities’ (including foreign exchange contracts) prices are converted into U.S. dollar amounts using the applicable exchange rates as of the close of the NYSE. If market quotations are available and reliable for foreign exchange-traded equity securities, the securities will be valued at the market quotations. Because trading hours for certain foreign securities end before the close of the NYSE, closing market quotations may become unreliable. If between the time trading ends on a particular security and the close of the customary trading session on the NYSE, events occur that the investment adviser determines are significant and make the closing price unreliable, the Fund may fair value the security. If the event is likely to have affected the closing price of the security, the security will be valued at fair value in good faith using procedures approved by the Board of Trustees. Adjustments to closing prices to reflect fair value may also be based on a screening process of an independent pricing service to indicate the degree of certainty, based on historical data, that the closing price in the principal market where a foreign security trades is not the current value as of the close of the NYSE. Foreign securities’ prices meeting the approved degree of certainty that the price is not reflective of current value will be priced at the indication of fair value from the independent pricing service. Multiple factors may be considered by the independent pricing service in determining adjustments to reflect fair value and may include information relating to sector indices, American Depositary Receipts and domestic and foreign index futures. Foreign securities may have additional risks including exchange rate changes, potential for sharply devalued currencies and high inflation, political and economic upheaval, the relative lack of issuer information, relatively low market liquidity and the potential lack of strict financial and accounting controls and standards.
Securities for which market prices are not provided by any of the above methods may be valued based upon quotes furnished by independent sources. The last bid price may be used to value equity securities. The mean between the last bid and asked prices is used to value debt obligations, including corporate loans.
Securities for which market quotations are not readily available or became unreliable are valued at fair value as determined in good faith by or under the supervision of the Trust’s officers following procedures approved by the Board of Trustees. Issuer specific events, market trends, bid/asked quotes of brokers and information providers and other market data may be reviewed in the course of making a good faith determination of a security’s fair value.
The Fund may invest in securities that are subject to interest rate risk, meaning the risk that the prices will generally fall as interest rates rise and, conversely, the prices will generally rise as interest rates fall. Specific securities differ in their sensitivity to changes in interest rates
| 26 | Invesco Equity and Income Fund |
depending on their individual characteristics. Changes in interest rates may result in increased market volatility, which may affect the value and/or liquidity of certain Fund investments.
Valuations change in response to many factors including the historical and prospective earnings of the issuer, the value of the issuer’s assets, general economic conditions, interest rates, investor perceptions and market liquidity. Because of the inherent uncertainties of valuation, the values reflected in the financial statements may materially differ from the value received upon actual sale of those investments.
| B. | Securities Transactions and Investment Income – Securities transactions are accounted for on a trade date basis. Realized gains or losses on sales are computed on the basis of specific identification of the securities sold. Interest income (net of withholding tax, if any) is recorded on the accrual basis from settlement date. Bond premiums and discounts are amortized and/or accreted over the lives of the respective securities. Pay-in-kind interest income and non-cash dividend income received in the form of securities in-lieu of cash are recorded at the fair value of the securities received. Paydown gains and losses on mortgage and asset-backed securities are recorded as adjustments to interest income. Dividend income (net of withholding tax, if any) is recorded on the ex-dividend date. |
The Fund may periodically participate in litigation related to Fund investments. As such, the Fund may receive proceeds from litigation settlements. Any proceeds received are included in the Statement of Operations as realized gain (loss) for investments no longer held and as unrealized gain (loss) for investments still held.
Brokerage commissions and mark ups are considered transaction costs and are recorded as an increase to the cost basis of securities purchased and/or a reduction of proceeds on a sale of securities. Such transaction costs are included in the determination of net realized and unrealized gain (loss) from investment securities reported in the Statement of Operations and the Statement of Changes in Net Assets and the net realized and unrealized gains (losses) on securities per share in the Financial Highlights. Transaction costs are included in the calculation of the Fund’s net asset value and, accordingly, they reduce the Fund’s total returns. These transaction costs are not considered operating expenses and are not reflected in net investment income reported in the Statement of Operations and the Statement of Changes in Net Assets, or the net investment income per share and the ratios of expenses and net investment income reported in the Financial Highlights, nor are they limited by any expense limitation arrangements between the Fund and the investment adviser.
The Fund allocates income and realized and unrealized capital gains and losses to a class based on the relative net assets of each class.
The Fund recharacterizes distributions received from REIT investments based on information provided by the REIT into the following categories: ordinary income, long-term and short-term capital gains, and return of capital. If information is not available on a timely basis from the REIT, the recharacterization will be based on available information which may include the previous year’s allocation. If new or additional information becomes available from the REIT at a later date, a recharacterization will be made in the following year. The Fund records as dividend income the amount recharacterized as ordinary income and as realized gain the amount recharacterized as capital gain in the Statement of Operations, and the amount recharacterized as return of capital as a reduction of the cost of the related investment. These recharacterizations are reflected in the accompanying financial statements.
| C. | Country Determination — For the purposes of making investment selection decisions and presentation in the Schedule of Investments, the investment adviser may determine the country in which an issuer is located and/or credit risk exposure based on various factors. These factors include the laws of the country under which the issuer is organized, where the issuer maintains a principal office, the country in which the issuer derives 50% or more of its total revenues and the country that has the primary market for the issuer’s securities, as well as other criteria. Among the other criteria that may be evaluated for making this determination are the country in which the issuer maintains 50% or more of its assets, the type of security, financial guarantees and enhancements, the nature of the collateral and the sponsor organization. Country of issuer and/or credit risk exposure has been determined to be the United States of America, unless otherwise noted. |
| D. | Distributions- Distributions from net investment income, if any, are declared and paid quarterly and are recorded on the ex-dividend date. Distributions from net realized capital gain, if any, are generally declared and paid annually and recorded on the ex-dividend date. The Fund may elect to treat a portion of the proceeds from redemptions as distributions for federal income tax purposes. |
| E. | Federal Income Taxes –The Fund intends to comply with the requirements of Subchapter M of the Internal Revenue Code of 1986, as amended (the “Internal Revenue Code”), necessary to qualify as a regulated investment company and to distribute substantially all of the Fund’s taxable earnings to shareholders. As such, the Fund will not be subject to federal income taxes on otherwise taxable income (including net realized capital gain) that is distributed to shareholders. Therefore, no provision for federal income taxes is recorded in the financial statements. |
The Fund recognizes the tax benefits of uncertain tax positions only when the position is more likely than not to be sustained. Management has analyzed the Fund’s uncertain tax positions and concluded that no liability for unrecognized tax benefits should be recorded related to uncertain tax positions. Management is not aware of any tax positions for which it is reasonably possible that the total amounts of unrecognized tax benefits will change materially in the next 12 months.
The Fund files tax returns in the U.S. Federal jurisdiction and certain other jurisdictions. Generally, the Fund is subject to examinations by such taxing authorities for up to three years after the filing of the return for the tax period.
| F. | Expenses — Fees provided for under the Rule 12b-1 plan of a particular class of the Fund are charged to the operations of such class. Transfer agency fees and expenses and other shareholder recordkeeping fees and expenses attributable to Class R5 and Class R6 are allocated to each share class based on relative net assets. Sub-accounting fees attributable to Class R5 are charged to the operations of the class. Transfer agency fees and expenses and other shareholder recordkeeping fees and expenses relating to all other classes are allocated among those classes based on relative net assets. All other expenses are allocated among the classes based on relative net assets. |
| G. | Accounting Estimates – The preparation of financial statements in conformity with accounting principles generally accepted in the United States of America (“GAAP”) requires management to make estimates and assumptions that affect the reported amounts of assets and liabilities at the date of the financial statements and the reported amounts of revenues and expenses during the reporting period including estimates and assumptions related to taxation. Actual results could differ from those estimates by a significant amount. In addition, the Fund monitors for material events or transactions that may occur or become known after the period-end date and before the date the financial statements are released to print. |
| H. | Indemnifications – Under the Trust’s organizational documents, each Trustee, officer, employee or other agent of the Trust is indemnified against certain liabilities that may arise out of the performance of their duties to the Fund. Additionally, in the normal course of business, the Fund |
| 27 | Invesco Equity and Income Fund |
| | enters into contracts, including the Fund’s servicing agreements, that contain a variety of indemnification clauses. The Fund’s maximum exposure under these arrangements is unknown as this would involve future claims that may be made against the Fund that have not yet occurred. The risk of material loss as a result of such indemnification claims is considered remote. |
| I. | Foreign Currency Translations— Foreign currency is valued at the close of the NYSE based on quotations posted by banks and major currency dealers. Portfolio securities and other assets and liabilities denominated in foreign currencies are translated into U.S. dollar amounts at the date of valuation. Purchases and sales of portfolio securities (net of foreign taxes withheld on disposition) and income items denominated in foreign currencies are translated into U.S. dollar amounts on the respective dates of such transactions. The Fund does not separately account for the portion of the results of operations resulting from changes in foreign exchange rates on investments and the fluctuations arising from changes in market prices of securities held. The combined results of changes in foreign exchange rates and the fluctuation of market prices on investments (net of estimated foreign tax withholding) are included with the net realized and unrealized gain or loss from investments in the Statement of Operations. Reported net realized foreign currency gains or losses arise from (1) sales of foreign currencies, (2) currency gains or losses realized between the trade and settlement dates on securities transactions, and (3) the difference between the amounts of dividends, interest, and foreign withholding taxes recorded on the Fund’s books and the U.S. dollar equivalent of the amounts actually received or paid. Net unrealized foreign currency gains and losses arise from changes in the fair values of assets and liabilities, other than investments in securities at fiscal period end, resulting from changes in exchange rates. |
The Fund may invest in foreign securities, which may be subject to foreign taxes on income, gains on investments or currency repatriation, a portion of which may be recoverable. Foreign taxes, if any, are recorded based on the tax regulations and rates that exist in the foreign markets in which the Fund invests and are shown in the Statement of Operations.
| J. | Forward Foreign Currency Contracts— The Fund may engage in foreign currency transactions either on a spot (i.e. for prompt delivery and settlement) basis, or through forward foreign currency contracts, to manage or minimize currency or exchange rate risk. |
The Fund may also enter into forward foreign currency contracts for the purchase or sale of a security denominated in a foreign currency in order to “lock in” the U.S. dollar price of that security, or the Fund may also enter into forward foreign currency contracts that do not provide for physical settlement of the two currencies, but instead are settled by a single cash payment calculated as the difference between the agreed upon exchange rate and the spot rate at settlement based upon an agreed upon notional amount (non-deliverable forwards). The Fund will set aside liquid assets in an amount equal to the daily mark-to-market obligation for forward foreign currency contracts.
A forward foreign currency contract is an obligation between two parties (“Counterparties”) to purchase or sell a specific currency for an agreed-upon price at a future date. The use of forward foreign currency contracts does not eliminate fluctuations in the price of the underlying securities the Fund owns or intends to acquire but establishes a rate of exchange in advance. Fluctuations in the value of these contracts are measured by the difference in the contract date and reporting date exchange rates and are recorded as unrealized appreciation (depreciation) until the contracts are closed. When the contracts are closed, realized gains (losses) are recorded. Realized and unrealized gains (losses) on the contracts are included in the Statement of Operations. The primary risks associated with forward foreign currency contracts include failure of the Counterparty to meet the terms of the contract and the value of the foreign currency changing unfavorably. These risks may be in excess of the amounts reflected in the Statement of Assets and Liabilities.
| K. | Futures Contracts — The Fund may enter into futures contracts to manage exposure to interest rate, equity and market price movements and/or currency risks. A futures contract is an agreement between Counterparties to purchase or sell a specified underlying security, currency or commodity (or delivery of a cash settlement price, in the case of an index future) for a fixed price at a future date. The Fund currently invests only in exchange-traded futures and they are standardized as to maturity date and underlying financial instrument. Initial margin deposits required upon entering into futures contracts are satisfied by the segregation of specific securities or cash as collateral at the futures commission merchant (broker). During the period the futures contracts are open, changes in the value of the contracts are recognized as unrealized gains or losses by recalculating the value of the contracts on a daily basis. Subsequent or variation margin payments are received or made depending upon whether unrealized gains or losses are incurred. These amounts are reflected as receivables or payables on the Statement of Assets and Liabilities. When the contracts are closed or expire, the Fund recognizes a realized gain or loss equal to the difference between the proceeds from, or cost of, the closing transaction and the Fund’s basis in the contract. The net realized gain (loss) and the change in unrealized gain (loss) on futures contracts held during the period is included on the Statement of Operations. The primary risks associated with futures contracts are market risk and the absence of a liquid secondary market. If the Fund were unable to liquidate a futures contract and/or enter into an offsetting closing transaction, the Fund would continue to be subject to market risk with respect to the value of the contracts and continue to be required to maintain the margin deposits on the futures contracts. Futures contracts have minimal Counterparty risk since the exchange’s clearinghouse, as Counterparty to all exchange-traded futures, guarantees the futures against default. Risks may exceed amounts recognized in the Statement of Assets and Liabilities. |
| L. | Collateral—To the extent the Fund has designated or segregated a security as collateral and that security is subsequently sold, it is the Fund’s practice to replace such collateral no later than the next business day. |
NOTE 2—Advisory Fees and Other Fees Paid to Affiliates
The Trust has entered into a master investment advisory agreement with Invesco Advisers, Inc. (the "Adviser" or "Invesco"). Under the terms of the investment advisory agreement, the Fund accrues daily and pays monthly an advisory fee to the Adviser based on the annual rate of the Fund’s average daily net assets as follows:
| Average Daily Net Assets | Rate |
| First $150 million | 0.50% |
| Next $100 million | 0.45% |
| Next $100 million | 0.40% |
| Over $350 million | 0.35% |
For the year ended August 31, 2019, the effective advisory fees incurred by the Fund was 0.35%.
| 28 | Invesco Equity and Income Fund |
Under the terms of a master sub-advisory agreement between the Adviser and each of Invesco Asset Management Deutschland GmbH, Invesco Asset Management Limited, Invesco Asset Management (Japan) Limited, Invesco Hong Kong Limited, Invesco Senior Secured Management, Inc. and Invesco Canada Ltd. (collectively, the "Affiliated Sub-Advisers") the Adviser, not the Fund, will pay 40% of the fees paid to the Adviser to any such Affiliated Sub-Adviser(s) that provide(s) discretionary investment management services to the Fund based on the percentage of assets allocated to such Affiliated Sub-Adviser(s).
The Adviser has contractually agreed, through at least June 30, 2020, to waive advisory fees and/or reimburse expenses of all shares to the extent necessary to limit total annual fund operating expenses after fee waiver and/or expense reimbursement (excluding certain items discussed below) of Class A, Class C, Class R, Class Y, Class R5 and Class R6 shares to 1.50%, 2.25%, 1.75%, 1.25%, 1.25% and 1.25%, respectively, of average daily net assets (the "expense limits"). In determining the Adviser’s obligation to waive advisory fees and/or reimburse expenses, the following expenses are not taken into account, and could cause the total annual fund operating expenses after fee waiver and/or expense reimbursement to exceed the numbers reflected above: (1) interest; (2) taxes; (3) dividend expense on short sales; (4) extraordinary or non-routine items, including litigation expenses; and (5) expenses that the Fund has incurred but did not actually pay because of an expense offset arrangement. Unless Invesco continues the fee waiver agreement, it will terminate on June 30, 2020. During its term, the fee waiver agreement cannot be terminated or amended to increase the expense limits or reduce the advisory fee waivers without approval of the Board of Trustees. The Adviser did not waive fees and/or reimburse expenses during the period under this expense limit.
Further, the Adviser has contractually agreed, through at least June 30, 2021, to waive the advisory fee payable by the Fund in an amount equal to 100% of the net advisory fees the Adviser receives from the affiliated money market funds on investments by the Fund of uninvested cash in such affiliated money market funds.
For the year ended August 31, 2019, the Adviser waived advisory fees of $798,272.
The Trust has entered into a master administrative services agreement with Invesco pursuant to which the Fund has agreed to pay Invesco for certain administrative costs incurred in providing accounting services to the Fund. For the year ended August 31, 2019, expenses incurred under the agreement are shown in the Statement of Operations asAdministrative services fees. Also, Invesco has entered into a sub-administration agreement whereby State Street Bank and Trust Company (“SSB”) serves as custodian and fund accountant and provides certain administrative services to the Fund.
The Trust has entered into a transfer agency and service agreement with Invesco Investment Services, Inc. (“IIS”) pursuant to which the Fund has agreed to pay IIS a fee for providing transfer agency and shareholder services to the Fund and reimburse IIS for certain expenses incurred by IIS in the course of providing such services. IIS may make payments to intermediaries that provide omnibus account services, sub-accounting services and/or networking services. All fees payable by IIS to intermediaries that provide omnibus account services or sub-accounting services are charged back to the Fund, subject to certain limitations approved by the Trust’s Board of Trustees. For the year ended August 31, 2019, expenses incurred under the agreement are shown in the Statement of Operations asTransfer agent fees.
Shares of the Fund are distributed by Invesco Distributors, Inc. (“IDI”). The Fund has adopted a distribution plan pursuant to Rule 12b-1 under the 1940 Act, and a service plan (collectively, the “Plans”) for Class A, Class C and Class R shares to compensate IDI for the sale, distribution, shareholder servicing and maintenance of shareholder accounts for these shares. Under the Plans, the Fund will incur annual fees of up to 0.25% of Class A average daily net assets, up to 1.00% of Class C average daily net assets and up to 0.50% of Class R average daily net assets. The fees are accrued daily and paid monthly.
With respect to Class C shares, the Fund is authorized to reimburse in future years any distribution related expenses that exceed the maximum annual reimbursement rate for such class, so long as such reimbursement does not cause the Fund to exceed the Class C maximum annual reimbursement rate, respectively. With respect to Class A shares, distribution related expenses that exceed the maximum annual reimbursement rate for such class are not carried forward to future years and the Fund will not reimburse IDI for any such expenses.
For the year ended August 31, 2019, expenses incurred under these agreements are shown in the Statement of Operations asDistribution fees.
Front-end sales commissions and CDSC (collectively, the “sales charges”) are not recorded as expenses of the Fund. Front-end sales commissions are deducted from proceeds from the sales of Fund shares prior to investment in Class A shares of the Fund. CDSC are deducted from redemption proceeds prior to remittance to the shareholder. During the year ended August 31, 2019, IDI advised the Fund that IDI retained $2,226,848 in front-end sales commissions from the sale of Class A shares and $64,719 and $47,309 from Class A and Class C shares, respectively, for CDSC imposed upon redemptions by shareholders.
For the year ended August 31, 2019, the Fund incurred $144,841 in brokerage commissions with Invesco Capital Markets, Inc., an affiliate of the Adviser and IDI, for portfolio transactions executed on behalf of the Fund.
Certain officers and trustees of the Trust are officers and directors of the Adviser, IIS and/or IDI.
NOTE 3—Additional Valuation Information
GAAP defines fair value as the price that would be received to sell an asset or paid to transfer a liability in an orderly transaction between market participants at the measurement date, under current market conditions. GAAP establishes a hierarchy that prioritizes the inputs to valuation methods, giving the highest priority to readily available unadjusted quoted prices in an active market for identical assets (Level 1) and the lowest priority to significant unobservable inputs (Level 3), generally when market prices are not readily available or are unreliable. Based on the valuation inputs, the securities or other investments are tiered into one of three levels. Changes in valuation methods may result in transfers in or out of an investment’s assigned level:
Level 1 – Prices are determined using quoted prices in an active market for identical assets.
Level 2 – Prices are determined using other significant observable inputs. Observable inputs are inputs that other market participants may use in pricing a security. These may include quoted prices for similar securities, interest rates, prepayment speeds, credit risk, yield curves, loss severities, default rates, discount rates, volatilities and others.
Level 3 – Prices are determined using significant unobservable inputs. In situations where quoted prices or observable inputs are unavailable (for example, when there is little or no market activity for an investment at the end of the period), unobservable inputs may be used. Unobservable inputs reflect the Fund’s own assumptions about the factors market participants would use in determining fair value of the securities or instruments and would be based on the best available information.
| 29 | Invesco Equity and Income Fund |
The following is a summary of the tiered valuation input levels, as of August 31, 2019. The level assigned to the securities valuations may not be an indication of the risk or liquidity associated with investing in those securities. Because of the inherent uncertainties of valuation, the values reflected in the financial statements may materially differ from the value received upon actual sale of those investments.
| | Level 1 | Level 2 | Level 3 | Total |
| Investments in Securities | | | | |
| Common Stocks & Other Equity Interests | $7,150,941,523 | $671,002,328 | $— | $7,821,943,851 |
| U.S. Dollar Denominated Bonds & Notes | — | 2,768,745,453 | — | 2,768,745,453 |
| U.S. Treasury Securities | — | 1,541,996,044 | — | 1,541,996,044 |
| Preferred Stocks | 49,334,238 | 22,669,841 | — | 72,004,079 |
| U.S. Government Sponsored Agency Mortgage-Backed Securities | — | 20,043,103 | — | 20,043,103 |
| Municipal Obligations | — | 7,261,527 | — | 7,261,527 |
| Money Market Funds | 939,471,748 | — | — | 939,471,748 |
| Total Investments in Securities | 8,139,747,509 | 5,031,718,296 | — | 13,171,465,805 |
| Other Investments - Assets* | | | | |
| Futures Contracts | 27,333 | — | — | 27,333 |
| Forward Foreign Currency Contracts | — | 4,287,278 | — | 4,287,278 |
| | 27,333 | 4,287,278 | — | 4,314,611 |
| Other Investments - Liabilities* | | | | |
| Futures Contracts | (4,267) | — | — | (4,267) |
| Forward Foreign Currency Contracts | — | (151,810) | — | (151,810) |
| | (4,267) | (151,810) | — | (156,077) |
| Total Other Investments | 23,066 | 4,135,468 | — | 4,158,534 |
| Total Investments | $8,139,770,575 | $5,035,853,764 | $— | $13,175,624,339 |
| * | Unrealized appreciation (depreciation). |
NOTE 4—Derivative Investments
The Fund may enter into an International Swaps and Derivatives Association Master Agreement (“ISDA Master Agreement”) under which a fund may trade OTC derivatives. An OTC transaction entered into under an ISDA Master Agreement typically involves a collateral posting arrangement, payment netting provisions and close-out netting provisions. These netting provisions allow for reduction of credit risk through netting of contractual obligations. The enforceability of the netting provisions of the ISDA Master Agreement depends on the governing law of the ISDA Master Agreement, among other factors.
For financial reporting purposes, the Fund does not offset OTC derivative assets or liabilities that are subject to ISDA Master Agreements in the Statement of Assets and Liabilities.
Value of Derivative Investments at Period-End
The table below summarizes the value of the Fund’s derivative investments, detailed by primary risk exposure, held as of August 31, 2019:
| | Value |
| Derivative Assets | Currency
Risk | Interest
Rate Risk | Total |
| Unrealized appreciation on futures contracts — Exchange-Traded(a) | $- | $27,333 | $27,333 |
| Unrealized appreciation on forward foreign currency contracts outstanding | 4,287,278 | - | 4,287,278 |
| Total Derivative Assets | 4,287,278 | 27,333 | 4,314,611 |
| Derivatives not subject to master netting agreements | - | (27,333) | (27,333) |
| Total Derivative Assets subject to master netting agreements | $4,287,278 | $- | $4,287,278 |
| (a) | The daily variation margin receivable (payable) at period-end is recorded in the Statement of Assets and Liabilities. |
| | Value |
| Derivative Liabilities | Currency
Risk | Interest
Rate Risk | Total |
| Unrealized depreciation on futures contracts — Exchange-Traded(a) | $- | $(4,267) | $(4,267) |
| Unrealized depreciation on forward foreign currency contracts outstanding | (151,810) | - | (151,810) |
| Total Derivative Liabilities | (151,810) | (4,267) | (156,077) |
| Derivatives not subject to master netting agreements | - | 4,267 | 4,267 |
| Total Derivative Liabilities subject to master netting agreements | $(151,810) | $- | $(151,810) |
| (a) | The daily variation margin receivable (payable) at period-end is recorded in the Statement of Assets and Liabilities. |
| 30 | Invesco Equity and Income Fund |
Offsetting Assets and Liabilities
The table below reflects the Fund’s exposure to Counterparties subject to either an ISDA Master Agreement or other agreement for OTC derivative transactions as of August 31, 2019.
| | Financial
Derivative
Assets | | Financial
Derivative
Liabilities | | Collateral
(Received)/Pledged | |
| Counterparty | Forward Foreign
Currency Contracts | | Forward Foreign
Currency Contracts | Net Value of
Derivatives | Non-Cash | Cash | Net
Amount |
| Bank of New York Mellon (The) | $3,289,377 | | $– | $3,289,377 | $– | $– | $3,289,377 |
| State Street Bank & Trust Co. | $997,901 | | $(151,810) | $846,091 | – | – | $846,091 |
| Total | $4,287,278 | | $(151,810) | $4,135,468 | $– | $– | $4,135,468 |
Effect of Derivative Investments for the year ended August 31, 2019
The table below summarizes the gains (losses) on derivative investments, detailed by primary risk exposure, recognized in earnings during the period:
| | Location of Gain (Loss) on
Statement of Operations |
| | Currency
Risk | Interest
Rate Risk | Total |
| Realized Gain (Loss): | | | |
| Forward foreign currency contracts | $29,740,993 | $- | $29,740,993 |
| Futures contracts | - | (7,653,441) | (7,653,441) |
| Change in Net Unrealized Appreciation: | | | |
| Forward foreign currency contracts | 8,244,203 | - | 8,244,203 |
| Futures contracts | - | 57,423 | 57,423 |
| Total | $37,985,196 | $(7,596,018) | $30,389,178 |
The table below summarizes the average notional value of derivatives held during the period.
| | Forward
Foreign Currency
Contracts | Futures
Contracts |
| Average notional value | $859,130,328 | $103,924,761 |
NOTE 5—Expense Offset Arrangement(s)
The expense offset arrangement is comprised of transfer agency credits which result from balances in demand deposit accounts used by the transfer agent for clearing shareholder transactions. For the year ended August 31, 2019, the Fund received credits from this arrangement, which resulted in the reduction of the Fund’s total expenses of $51,245.
NOTE 6—Trustees’ and Officers’ Fees and Benefits
Trustees’ and Officers’ Fees and Benefits include amounts accrued by the Fund to pay remuneration to certain Trustees and Officers of the Fund. Trustees have the option to defer compensation payable by the Fund, and Trustees’ and Officers’ Fees and Benefits also include amounts accrued by the Fund to fund such deferred compensation amounts. Those Trustees who defer compensation have the option to select various Invesco Funds in which their deferral accounts shall be deemed to be invested. Finally, certain current Trustees were eligible to participate in a retirement plan that provided for benefits to be paid upon retirement to Trustees over a period of time based on the number of years of service. The Fund may have certain former Trustees who also participate in a retirement plan and receive benefits under such plan.Trustees’ and Officers’ Fees and Benefits include amounts accrued by the Fund to fund such retirement benefits. Obligations under the deferred compensation and retirement plans represent unsecured claims against the general assets of the Fund.
NOTE 7—Cash Balances
The Fund is permitted to temporarily carry a negative or overdrawn balance in its account with SSB, the custodian bank. Such balances, if any at period-end, are shown in the Statement of Assets and Liabilities under the payable captionAmount due custodian. To compensate the custodian bank for such overdrafts, the overdrawn Fund may either (1) leave funds as a compensating balance in the account so the custodian bank can be compensated by earning the additional interest; or (2) compensate by paying the custodian bank at a rate agreed upon by the custodian bank and Invesco, not to exceed the contractually agreed upon rate. The Fund may not purchase additional securities when any borrowings from banks or broker-dealers exceed 5% of the Fund’s total assets, or when any borrowings from an Invesco Fund are outstanding.
| 31 | Invesco Equity and Income Fund |
NOTE 8—Distributions to Shareholders and Tax Components of Net Assets
| Tax Character of Distributions to Shareholders Paid During the Fiscal Years Ended August 31, 2019 and August 31, 2018 |
| | 2019 | 2018 |
| Ordinary income | $287,063,744 | $292,945,136 |
| Long-term capital gain | 774,507,870 | 667,114,566 |
| Total distributions | $1,061,571,614 | $960,059,702 |
| Tax Components of Net Assets at Period-End: |
| | 2019 |
| Undistributed ordinary income | $163,166,788 |
| Undistributed long-term capital gain | 485,058,721 |
| Net unrealized appreciation — investments | 1,498,558,775 |
| Net unrealized appreciation (depreciation) — foreign currencies | (19,444) |
| Temporary book/tax differences | (1,278,937) |
| Shares of beneficial interest | 10,988,470,788 |
| Total net assets | $13,133,956,691 |
The difference between book-basis and tax-basis unrealized appreciation (depreciation) is due to differences in the timing of recognition of gains and losses on investments for tax and book purposes. The Fund’s net unrealized appreciation difference is attributable primarily to wash sales, book to tax accretion and amortization differences and contingent payment debt instruments.
The temporary book/tax differences are a result of timing differences between book and tax recognition of income and/or expenses. The Fund’s temporary book/tax differences are the result of the trustee deferral of compensation and retirement plan benefits.
Capital loss carryforward is calculated and reported as of a specific date. Results of transactions and other activity after that date may affect the amount of capital loss carryforward actually available for the Fund to utilize. Capital losses generated in years beginning after December 22, 2010 can be carried forward for an unlimited period, whereas previous losses expire in eight tax years. Capital losses with an expiration period may not be used to offset capital gains until all net capital losses without an expiration date have been utilized. Capital loss carryforwards with no expiration date will retain their character as either short-term or long-term capital losses instead of as short-term capital losses as under prior law. The ability to utilize capital loss carryforwards in the future may be limited under the Internal Revenue Code and related regulations based on the results of future transactions.
The Fund does not have a capital loss carryforward as of August 31, 2019.
NOTE 9—Investment Transactions
The aggregate amount of investment securities (other than short-term securities, U.S. Treasury obligations and money market funds, if any) purchased and sold by the Fund during the year ended August 31, 2019 was $2,694,022,157 and $3,619,890,010, respectively. During the same period, purchases and sales of U.S. Treasury obligations were $14,974,130,011 and $15,302,441,274, respectively. Cost of investments, including any derivatives, on a tax basis includes the adjustments for financial reporting purposes as of the most recently completed federal income tax reporting period-end.
| Unrealized Appreciation (Depreciation) of Investments on a Tax Basis |
| Aggregate unrealized appreciation of investments | $2,034,821,210 |
| Aggregate unrealized (depreciation) of investments | (536,262,435) |
| Net unrealized appreciation of investments | $1,498,558,775 |
Cost of investments for tax purposes is $11,677,065,564.
NOTE 10—Reclassification of Permanent Differences
Primarily as a result of differing book/tax treatment of contingent payment debt instruments and return of capital, on August 31, 2019, undistributed net investment income was increased by $59,173,080, undistributed net realized gain was decreased by $55,370,861 and shares of beneficial interest was decreased by $3,802,219. This reclassification had no effect on the net assets of the Fund.
| 32 | Invesco Equity and Income Fund |
NOTE 11—Share Information
| | Summary of Share Activity |
| | Years ended August 31, |
| | 2019(a) | | 2018 |
| | Shares | Amount | | Shares | Amount |
| Sold: | | | | | |
| Class A | 79,475,662 | $805,826,035 | | 88,715,954 | $979,887,250 |
| Class B(b) | - | - | | 13,659 | 152,215 |
| Class C | 9,620,242 | 95,693,408 | | 14,162,681 | 153,710,123 |
| Class R | 2,085,367 | 21,334,010 | | 2,793,491 | 30,995,546 |
| Class Y | 21,836,318 | 222,322,408 | | 29,531,802 | 326,511,194 |
| Class R5 | 6,955,465 | 69,157,181 | | 15,139,415 | 167,817,844 |
| Class R6 | 25,820,852 | 260,898,217 | | 45,463,679 | 503,264,008 |
| Issued as reinvestment of dividends: | | | | | |
| Class A | 72,770,475 | 692,615,463 | | 57,817,563 | 629,395,051 |
| Class B(b) | - | - | | 399,451 | 4,248,025 |
| Class C | 8,972,531 | 83,034,233 | | 7,945,545 | 84,929,671 |
| Class R | 1,396,640 | 13,346,795 | | 1,222,956 | 13,387,873 |
| Class Y | 7,704,917 | 73,379,570 | | 6,438,247 | 70,032,993 |
| Class R5 | 3,822,482 | 36,479,885 | | 3,013,420 | 32,773,490 |
| Class R6 | 9,730,951 | 92,792,907 | | 6,094,703 | 66,269,720 |
| Conversion of Class B shares to Class A shares:(c) | | | | | |
| Class A | - | - | | 6,009,369 | 69,408,211 |
| Class B | - | - | | (6,168,664) | (69,408,211) |
| Automatic conversion of Class C shares to Class A shares: | | | | | |
| Class A | 64,999,568 | 630,316,139 | | - | - |
| Class C | (66,301,164) | (630,316,139) | | - | - |
| Reacquired: | | | | | |
| Class A | (158,301,088) | (1,600,507,081) | | (157,400,342) | (1,739,824,088) |
| Class B(b) | - | - | | (2,995,990) | (32,934,039) |
| Class C | (26,122,076) | (258,626,282) | | (35,044,976) | (379,730,637) |
| Class R | (7,118,078) | (72,528,130) | | (5,269,679) | (58,619,562) |
| Class Y | (39,396,400) | (396,199,520) | | (38,217,171) | (423,509,235) |
| Class R5 | (16,039,925) | (164,196,531) | | (15,330,385) | (169,037,967) |
| Class R6 | (26,563,084) | (268,118,806) | | (21,009,915) | (231,586,008) |
| Net increase (decrease) in share activity | (24,650,345) | $(293,296,238) | | 3,324,813 | $28,133,467 |
| (a) | There are entities that are record owners of more than 5% of the outstanding shares of the Fund and in the aggregate own 42% of the outstanding shares of the Fund. IDI has an agreement with these entities to sell Fund shares. The Fund, Invesco and/or Invesco affiliates may make payments to these entities, which are considered to be related to the Fund, for providing services to the Fund, Invesco and/or Invesco affiliates including but not limited to services such as securities brokerage, distribution, third party record keeping and account servicing. The Fund has no knowledge as to whether all or any portion of the shares owned of record by these entities are also owned beneficially. |
| (b) | Class B shares activity for the period September 1, 2017 through January 26, 2018 (date of conversion). |
| (c) | Effective as of the close of business January 26, 2018, all outstanding Class B shares were converted to Class A shares. |
| 33 | Invesco Equity and Income Fund |
Report of Independent Registered Public Accounting Firm
To the Board of Trustees of AIM Counselor Series Trust (Invesco Counselor Series Trust) and Shareholders of Invesco Equity and Income Fund
Opinion on the Financial Statements
We have audited the accompanying statement of assets and liabilities, including the schedule of investments, of Invesco Equity and Income Fund (one of the funds constituting AIM Counselor Series Trust (Invesco Counselor Series Trust), referred to hereafter as the "Fund") as of August 31, 2019, the related statement of operations for the year ended August 31, 2019, the statement of changes in net assets for each of the two years in the period ended August 31, 2019, including the related notes, and the financial highlights for each of the five years in the period ended August 31, 2019 (collectively referred to as the "financial statements"). In our opinion, the financial statements present fairly, in all material respects, the financial position of the Fund as of August 31, 2019, the results of its operations for the year then ended, the changes in its net assets for each of the two years in the period ended August 31, 2019 and the financial highlights for each of the five years in the period ended August 31, 2019 in conformity with accounting principles generally accepted in the United States of America.
Basis for Opinion
These financial statements are the responsibility of the Fund’s management. Our responsibility is to express an opinion on the Fund’s financial statements based on our audits. We are a public accounting firm registered with the Public Company Accounting Oversight Board (United States) (PCAOB) and are required to be independent with respect to the Fund in accordance with the U.S. federal securities laws and the applicable rules and regulations of the Securities and Exchange Commission and the PCAOB.
We conducted our audits of these financial statements in accordance with the standards of the PCAOB. Those standards require that we plan and perform the audit to obtain reasonable assurance about whether the financial statements are free of material misstatement, whether due to error or fraud.
Our audits included performing procedures to assess the risks of material misstatement of the financial statements, whether due to error or fraud, and performing procedures that respond to those risks. Such procedures included examining, on a test basis, evidence regarding the amounts and disclosures in the financial statements. Our audits also included evaluating the accounting principles used and significant estimates made by management, as well as evaluating the overall presentation of the financial statements. Our procedures included confirmation of securities owned as of August 31, 2019 by correspondence with the custodian, transfer agent and brokers; when replies were not received from brokers, we performed other auditing procedures. We believe that our audits provide a reasonable basis for our opinion.
/s/PricewaterhouseCoopers LLP
Houston, Texas
October 29, 2019
We have served as the auditor of one or more of the investment companies in the Invesco group of investment companies since at least 1995. We have not been able to determine the specific year we began serving as auditor.
| 34 | Invesco Equity and Income Fund |
Calculating your ongoing Fund expenses
Example
As a shareholder of the Fund, you incur two types of costs: (1) transaction costs, which may include sales charges (loads) on purchase payments or contingent deferred sales charges on redemptions, if any; and (2) ongoing costs, including management fees, distribution and/or service (12b-1) fees, and other Fund expenses. This example is intended to help you understand your ongoing costs (in dollars) of investing in the Fund and to compare these costs with ongoing costs of investing in other mutual funds. The example is based on an investment of $1,000 invested at the beginning of the period and held for the entire period March 1, 2019 through August 31, 2019.
Actual expenses
The table below provides information about actual account values and actual expenses. You may use the information in this table, together with the amount you invested, to estimate the expenses that you paid over the period. Simply divide your account value by $1,000 (for example, an $8,600 account value divided by $1,000 = 8.6), then multiply the result by the number in the table under the heading entitled “Actual Expenses Paid During Period” to estimate the expenses you paid on your account during this period.
Hypothetical example for comparison purposes
The table below also provides information about hypothetical account values and hypothetical expenses based on the Fund’s actual expense ratio and an assumed rate of return of 5% per year before expenses, which is not the Fund’s actual return.
The hypothetical account values and expenses may not be used to estimate the actual ending account balance or expenses you paid for the period. You may use this information to compare the ongoing costs of investing in the Fund and other funds. To do so, compare this 5% hypothetical example with the 5% hypothetical examples that appear in the shareholder reports of the other funds.
Please note that the expenses shown in the table are meant to highlight your ongoing costs only and do not reflect any transaction costs, such as sales charges (loads) on purchase payments or contingent deferred sales charges on redemptions, if any. Therefore, the hypothetical information is useful in comparing ongoing costs only, and will not help you determine the relative total costs of owning different funds. In addition, if these transaction costs were included, your costs would have been higher.
| | Beginning
Account Value (03/01/19) | ACTUAL | HYPOTHETICAL
(5% annual return before
expenses) | Annualized
Expense
Ratio |
Ending
Account Value
(08/31/19)1 | Expenses
Paid During
Period2 | Ending
Account Value
(08/31/19) | Expenses
Paid During
Period2 |
| Class A | $1,000.00 | $1,021.80 | $3.97 | $1,021.27 | $3.97 | 0.78% |
| Class C | 1,000.00 | 1,017.50 | 7.58 | 1,017.69 | 7.58 | 1.49 |
| Class R | 1,000.00 | 1,020.50 | 5.25 | 1,020.01 | 5.24 | 1.03 |
| Class Y | 1,000.00 | 1,023.10 | 2.70 | 1,022.53 | 2.70 | 0.53 |
| Class R5 | 1,000.00 | 1,023.50 | 2.40 | 1,022.84 | 2.40 | 0.47 |
| Class R6 | 1,000.00 | 1,023.90 | 1.94 | 1,023.29 | 1.94 | 0.38 |
| 1 | The actual ending account value is based on the actual total return of the Fund for the period March 1, 2019 through August 31, 2019, after actual expenses and will differ from the hypothetical ending account value which is based on the Fund’s expense ratio and a hypothetical annual return of 5% before expenses. |
| 2 | Expenses are equal to the Fund’s annualized expense ratio as indicated above multiplied by the average account value over the period, multiplied by 184/365 to reflect the most recent fiscal half year. |
| 35 | Invesco Equity and Income Fund |
Approval of Investment Advisory and Sub-Advisory Contracts
At meetings held on June 10, 2019, the Board of Trustees (the Board or the Trustees) of AIM Counselor Series Trust (Invesco Counselor Series Trust) as a whole, and the independent Trustees, who comprise over 75% of the Board, voting separately, approved the continuance of the Invesco Equity and Income Fund’s (the Fund) Master Investment Advisory Agreement with Invesco Advisers, Inc. (Invesco Advisers and the investment advisory agreement) and the Master IntergroupSub-Advisory Contract for Mutual Funds with Invesco Asset Management Deutschland GmbH, Invesco Asset Management Limited, Invesco Asset Management (Japan) Limited, Invesco Hong Kong Limited, Invesco Senior Secured Management, Inc. and Invesco Canada Ltd. (collectively, the AffiliatedSub-Advisers and thesub-advisory contracts) for another year, effective July 1, 2019. After evaluating the factors discussed below, among others, the Board approved the renewal of the Fund’s investment advisory agreement and thesub-advisory contracts and determined that the compensation payable by the Fund to Invesco Advisers and by Invesco Advisers to the AffiliatedSub-Advisers is fair and reasonable.
The Board’s Evaluation Process
The Board’s Investments Committee has established threeSub-Committees, which meet throughout the year to review the performance of funds advised by Invesco Advisers (the Invesco Funds). As part of a regularly scheduled basis ofin-person Board meetings, theSub-Committees meet with portfolio managers for their assigned Invesco Funds and other members of management to review detailed information about investment performance and portfolio attributes of these funds. The Board took into account evaluations and reports that it received from the Investments Committee andSub-Committees, as well as the information provided to such committees and the Board throughout the year, in considering whether to approve each Invesco Fund’s investment advisory agreement andsub-advisory contracts.
As part of the contract renewal process, the Board reviews and considers information provided in response to detailed requests for information submitted to management by the independent Trustees with assistance from legal counsel to the independent Trustees. The Board receives comparative investment performance and fee data regarding the Invesco Funds prepared by Invesco Advisers and Broadridge Financial Solutions, Inc. (Broadridge), an independent mutual fund data provider. The Board also receives an independent written evaluation from the Senior Officer, an officer of the Invesco Funds who reports directly to the independent Trustees. The Senior Officer’s evaluation is prepared as part of his responsibility to manage the process by which the Invesco Funds’ proposed management fees
are negotiated during the annual contract renewal process to ensure they are negotiated in a manner that is at arms’ length and reasonable. In addition to meetings with Invesco Advisers and fund counsel throughout the year, the independent Trustees also discuss the continuance of the investment advisory agreement andsub-advisory contracts in separate sessions with the Senior Officer and with independent legal counsel.
The discussion below is a summary of the Senior Officer’s independent written evaluation with respect to the Fund’s investment advisory agreement, as well as a discussion of the material factors and related conclusions that formed the basis for the Board’s approval of the Fund’s investment advisory agreement andsub-advisory contracts. The Trustees’ review and conclusions are based on the comprehensive consideration of all information presented to them during the course of the year and in prior years and are not the result of any single determinative factor. Moreover, one Trustee may have weighed a particular piece of information or factor differently than another Trustee. This information is current as of June 10, 2019.
Factors and Conclusions and Summary of Independent Written Fee Evaluation
| A. | Nature, Extent and Quality of Services Provided by Invesco Advisers and the AffiliatedSub-Advisers |
The Board reviewed the nature, extent and quality of the advisory services provided to the Fund by Invesco Advisers under the Fund’s investment advisory agreement, and the credentials and experience of the officers and employees of Invesco Advisers who provide these services, including the Fund’s portfolio manager(s). The Board’s review included consideration of Invesco Advisers’ investment process oversight and structure, credit analysis and investment risk management. The Board also considerednon-advisory services that Invesco Advisers and its affiliates provide to the Invesco Funds such as various back office support functions, third party oversight, internal audit, valuation, portfolio trading and legal and compliance. The Board also received and reviewed information about Invesco Advisers’ role as administrator of the Invesco Funds’ liquidity risk management program. The Board also reviewed and considered the benefits to shareholders of investing in a fund that is part of the Invesco family of funds under the umbrella of Invesco Ltd., Invesco Advisers’ parent company, and noted Invesco Ltd.’s depth and experience in conducting an investment management business, as well as its commitment of financial and other resources to such business. The Board reviewed and considered information about the resources that Invesco Advisers intends to continue to
commit to managing the Invesco family of funds following Invesco Ltd.’s acquisition of OppenheimerFunds, Inc. and its subsidiaries. The Board concluded that the nature, extent and quality of the services provided to the Fund by Invesco Advisers are appropriate and satisfactory.
The Board reviewed the services that may be provided by the AffiliatedSub-Advisers under thesub-advisory contracts and the credentials and experience of the officers and employees of the AffiliatedSub-Advisers who provide these services. The Board noted the AffiliatedSub-Advisers’ expertise with respect to certain asset classes and that the AffiliatedSub-Advisers have offices and personnel that are located in financial centers around the world. As a result, the Board noted that the AffiliatedSub-Advisers can provide research and investment analysis on the markets and economies of various countries in which the Fund may invest, make recommendations regarding securities and assist with security trades. The Board concluded that thesub-advisory contracts may benefit the Fund and its shareholders by permitting Invesco Advisers to use the resources and talents of the AffiliatedSub-Advisers in managing the Fund. The Board concluded that the nature, extent and quality of the services that may be provided by the AffiliatedSub-Advisers are appropriate and satisfactory
| B. | Fund Investment Performance |
The Board considered Fund investment performance as a relevant factor in considering whether to approve the investment advisory agreement. The Board did not view Fund investment performance as a relevant factor in considering whether to approve thesub-advisory contracts for the Fund, as no AffiliatedSub-Adviser currently manages assets of the Fund.
The Board compared the Fund’s investment performance over multiple time periods ending December 31, 2018 to the performance of funds in the Broadridge performance universe and against the Lipper Mixed-Asset Target Allocation Growth Funds Index. The Board noted that performance of Class A shares of the Fund was in the fifth quintile of its performance universe for the one year period, the fourth quintile for the three year period and the third quintile for the five year period (the first quintile being the best performing funds and the fifth quintile being the worst performing funds). The Board noted that performance of Class A shares of the Fund was below the performance of the Index for the one, three and five year periods. The Board noted that the Fund’s value style of equity investing compared to its peers, including its underweight exposure to technology stocks and its overweight exposure to energy stocks, negatively impacted relative performance. The Trustees also reviewed more
36 Invesco Equity and Income Fund
recent Fund performance and this review did not change their conclusions.
| C. | Advisory andSub-Advisory Fees and Fund Expenses |
The Board compared the Fund’s contractual management fee rate to the contractual management fee rates of funds in the Fund’s Broadridge expense group. The Board noted that the contractual management fee rate for Class A shares of the Fund was below the median contractual management fee rate of funds in its expense group. The Board noted that the term “contractual management fee” for funds in the expense group may include both advisory and certainnon-portfolio management administrative services fees, but that Broadridge does not provide information on a fund by fund basis as to what is included. The Board also reviewed the methodology used by Broadridge in providing expense group information, which includes using each fund’s contractual management fee schedule (including any applicable breakpoints) as reported in the most recent prospectus or statement of additional information for each fund in the expense group. The Board also considered comparative information regarding the Fund’s total expense ratio and its various components.
The Board noted that Invesco Advisers has contractually agreed to waive fees and/or limit expenses of the Fund for the term disclosed in the Fund’s registration statement in an amount necessary to limit total annual operating expenses to a specified percentage of average daily net assets for each class of the Fund.
The Board also considered the fees charged by Invesco Advisers and the AffiliatedSub-Advisers to other similarly managed client accounts. The Board noted that Invesco Advisers or the AffiliatedSub-Advisers may charge lower fees to large institutional clients. Invesco Advisers reviewed with the Board differences in the scope of services it provides to the Invesco Funds relative to certain other types of client accounts, including management of cash flows as a result of redemptions and purchases, necessary infrastructure such as officers, office space, technology, legal and distribution, oversight of service providers, costs and business risks associated with launching new funds and sponsoring and maintaining the product line, preparation of annual registration statement updates and financial information and compliance with federal and state laws and regulations.
The Board also compared the Fund’s effective advisory fee rate (the advisory fee rate after advisory fee waivers and before other expense limitations/waivers) to the effective advisory fee rates of other similarly managed third-party mutual funds advised orsub-advised by Invesco Advisers and its affiliates, based on asset balances as of December 31, 2018.
The Board also considered the services that may be provided by the AffiliatedSub-Advisers pursuant to thesub-advisory contracts, as well as the fees payable by Invesco Advisers to the
AffiliatedSub-Advisers pursuant to thesub-advisory contracts.
| D. | Economies of Scale and Breakpoints |
The Board considered the extent to which there may be economies of scale in the provision of advisory services to the Fund. The Board considered Invesco’s reinvestment in its business, including investments in business infrastructure and cybersecurity. The Board also considered that the Fund benefits from economies of scale through contractual breakpoints in the Fund’s advisory fee schedule, which generally operate to reduce the Fund’s expense ratio as it grows in size. The Board noted that the Fund shares directly in economies of scale through lower fees charged by third party service providers based on the combined size of the Invesco Funds. The Board noted that the Fund may also benefit from economies of scale through initial fee setting, fee waivers and expense reimbursements.
| E. | Profitability and Financial Resources |
The Board reviewed information from Invesco Advisers concerning the costs of the advisory and other services that Invesco Advisers and its affiliates provide to the Fund and the Invesco Funds and the profitability of Invesco Advisers and its affiliates in providing these services. The Board considered the methodology used for calculating profitability and noted the periodic review of such methodology by an independent consultant. The Board noted that Invesco Advisers continues to operate at a net profit from services Invesco Advisers and its affiliates provide to the Invesco Funds and the Fund. The Board did not deem the level of profits realized by Invesco Advisers and its affiliates from providing services to the Fund to be excessive given the nature, extent and quality of the services provided. The Board received information from Invesco Advisers demonstrating that Invesco Advisers and the AffiliatedSub-Advisers are financially sound and have the resources necessary to perform their obligations under the investment advisory agreement andsub-advisory contracts.
| F. | Collateral Benefits to Invesco Advisers and its Affiliates |
The Board considered various other benefits received by Invesco Advisers and its affiliates from the relationship with the Fund, including the fees received for providing administrative, transfer agency and distribution services to the Fund. The Board considered comparative information regarding fees charged for these services, including information provided by Broadridge and other independent sources. The Board considered the performance of Invesco Advisers and its affiliates in providing these services and the organizational structure employed to provide these services. The Board also considered that these services are provided to the Fund pursuant to written contracts that are reviewed and approved on an annual basis by the Board; and that the services are required for the operation of the Fund.
The Board considered the benefits realized by Invesco Advisers and the AffiliatedSub-Advisers
as a result of portfolio brokerage transactions executed through “soft dollar” arrangements. The Board noted that soft dollar arrangements may result in the Fund bearing costs to purchase research that may be used by Invesco Advisers or the AffiliatedSub-Advisers with other clients and may reduce Invesco Advisers’ or the AffiliatedSub-Advisers’ expenses. The Board also considered that it receives periodic reports from Invesco representing that these arrangements are consistent with regulatory requirements. The Board did not deem the soft dollar arrangements to be inappropriate.
The Board considered that the Fund’s uninvested cash and cash collateral from any securities lending arrangements may be invested in money market funds advised by Invesco Advisers pursuant to procedures approved by the Board. The Board considered information regarding the returns of the affiliated money market funds relative to comparable overnight investments, as well as the costs to the Fund of such investments. The Board noted that Invesco Advisers receives advisory fees from these affiliated money market funds attributable to such investments, although Invesco Advisers has contractually agreed to waive through varying periods the advisory fees payable by the Invesco Funds with respect to certain investments in the affiliated money market funds. The waiver is in an amount equal to 100% of the net advisory fee Invesco Advisers receives from the affiliated money market funds with respect to the Fund’s investment in the affiliated money market funds of uninvested cash, but not cash collateral. The Board concluded that the amount of advisory fees received by Invesco Advisers from the Fund’s investment of cash collateral from any securities lending arrangements in the affiliated money market funds is fair and reasonable.
The Board also considered that an affiliated broker may receive commissions for executing certain trades for the Fund. Invesco Advisers and the AffiliatedSub-Advisers may use the affiliated broker to, among other things, control order routing and minimize information leakage, and the Board was advised that such trades are executed in compliance with rules under the federal securities laws and consistent with best execution obligations.
37 Invesco Equity and Income Fund
Tax Information
Form 1099-DIV, Form 1042-S and other year–end tax information provide shareholders with actual calendar year amounts that should be included in their tax returns. Shareholders should consult their tax advisers.
The following distribution information is being provided as required by the Internal Revenue Code or to meet a specific state’s requirement.
The Fund designates the following amounts or, if subsequently determined to be different, the maximum amount allowable for its fiscal year ended August 31, 2019:
| Federal and State Income Tax | |
| Long-Term Capital Gain Distributions | $774,507,870 |
| Qualified Dividend Income* | 62.19% |
| Corporate Dividends Received Deduction* | 46.60% |
| U.S. Treasury Obligations* | 11.07% |
| * | The above percentages are based on ordinary income dividends paid to shareholders during the Fund’s fiscal year. |
| 38 | Invesco Equity and Income Fund |
Trustees and Officers
The address of each trustee and officer is AIM Counselor Series Trust (Invesco Counselor Series Trust) (the “Trust”), 11 Greenway Plaza, Suite 1000, Houston, Texas 77046-1173. The trustees serve for the life of the Trust, subject to their earlier death, incapacitation, resignation, retirement or removal as more specifically provided in the Trust’s organizational documents. Each officer serves for a one year term or until their successors are elected and qualified. Column two below includes length of time served with predecessor entities, if any.
| | | | | | | | |
Name, Year of Birth and Position(s) Held with the Trust | | Trustee and/ or Officer Since | | Principal Occupation(s) During Past 5 Years | | Number of Funds in Fund
Complex
Overseen by
Trustee | | Other Directorship(s) Held by Trustee During Past 5 Years |
| Interested Persons | | | | | | | | |
Martin L. Flanagan1 — 1960 Trustee and Vice Chair | | 2007 | | Executive Director, Chief Executive Officer and President, Invesco Ltd. (ultimate parent of Invesco and a global investment management firm); Trustee and Vice Chair, The Invesco Funds; Vice Chair, Investment Company Institute; and Member of Executive Board, SMU Cox School of Business Formerly: Advisor to the Board, Invesco Advisers, Inc. (formerly known as Invesco Institutional (N.A.), Inc.); Chairman and Chief Executive Officer, Invesco Advisers, Inc. (registered investment adviser); Director, Chairman, Chief Executive Officer and President, Invesco Holding Company (US), Inc. (formerly IVZ Inc.) (holding company), Invesco Group Services, Inc. (service provider) and Invesco North American Holdings, Inc. (holding company); Director, Chief Executive Officer and President, Invesco Holding Company Limited (parent of Invesco and a global investment management firm); Director, Invesco Ltd.; Chairman, Investment Company Institute and President,Co-Chief Executive Officer,Co-President, Chief Operating Officer and Chief Financial Officer, Franklin Resources, Inc. (global investment management organization) | | 229 | | None |
Philip A. Taylor2 — 1954 Trustee | | 2006 | | Vice Chair, Invesco Ltd.; Trustee, The Invesco Funds Formerly: Director, Invesco Canada Ltd. (formerly known as Invesco Trimark Ltd./Invesco Trimark Ltèe) (registered investment adviser and registered transfer agent); Head of the Americas and Senior Managing Director, Invesco Ltd.; Director, Invesco Advisers, Inc. (formerly known as Invesco Institutional (N.A.), Inc.) (registered investment adviser); Director and Chairman, Invesco Investment Services, Inc. (formerly known as Invesco AIM Investment Services, Inc.) (registered transfer agent); Chief Executive Officer, Invesco Corporate Class Inc. (corporate mutual fund company); Chairman and Chief Executive Officer, Invesco Canada Ltd. (formerly known as Invesco Trimark Ltd./Invesco Trimark Ltèe) (registered investment adviser and registered transfer agent); Senior Vice President, The Invesco Funds; Director, Invesco Investment Advisers LLC (formerly known as Van Kampen Asset Management); Director, Chairman, Chief Executive Officer and President, Invesco Management Group, Inc. (formerly known as Invesco AIM Management Group, Inc.) (financial services holding company);Co-Chairman,Co-President andCo-Chief Executive Officer, Invesco Advisers, Inc. (formerly known as Invesco Institutional (N.A.), Inc.) (registered investment adviser); Director, Chief Executive Officer and President, Van Kampen Exchange Corp; President and Principal Executive Officer, The Invesco Funds (other than AIM Treasurer’s Series Trust (Invesco Treasurer’s Series Trust), Short-Term Investments Trust and Invesco Management Trust); Executive Vice President, The Invesco Funds (AIM Treasurer’s Series Trust (Invesco Treasurer’s Series Trust), Short-Term Investments Trust and Invesco Management Trust only); Director and President, INVESCO Funds Group, Inc. (registered investment adviser and registered transfer agent); Director and Chairman, IVZ Distributors, Inc. (formerly known as INVESCO Distributors, Inc.) (registered broker dealer); Director, President and Chairman, Invesco Inc. (holding company), Invesco Canada Holdings Inc. (holding company), Trimark Investments Ltd./Placements Trimark Ltèe and Invesco Financial Services Ltd/Services Financiers Invesco Ltèe; Chief Executive Officer, Invesco Canada Fund Inc. (corporate mutual fund company); Director and Chairman, Van Kampen Investor Services Inc.; Director, Chief Executive Officer and President, 1371 Preferred Inc. (holding company) and Van Kampen Investments Inc.; Director and President, AIM GP Canada Inc. (general partner for limited partnerships) and Van Kampen Advisors, Inc.; Director and Chief Executive Officer, Invesco Trimark Dealer Inc. (registered broker dealer); Director, Invesco Distributors, Inc. (formerly known as Invesco AIM Distributors, Inc.) (registered broker dealer); Manager, Invesco Capital Management LLC; Director, Chief Executive Officer and President, Invesco Advisers, Inc.; Director, Chairman, Chief Executive Officer and President, Invesco AIM Capital Management, Inc.; President, Invesco Trimark Dealer Inc. and Invesco Trimark Ltd./Invesco Trimark Ltèe; Director and President, AIM Trimark Corporate Class Inc. and AIM Trimark Canada Fund Inc.; Senior Managing Director, Invesco Holding Company Limited; Director and Chairman, Fund Management Company (former registered broker dealer); President and Principal Executive Officer, The Invesco Funds (AIM Treasurer’s Series Trust (Invesco Treasurer’s Series Trust), and Short-Term Investments Trust only); President, AIM Trimark Global Fund Inc. and AIM Trimark Canada Fund Inc. | | 229 | | None |
| 1 | Mr. Flanagan is considered an interested person (within the meaning of Section 2(a)(19) of the 1940 Act) of the Trust because he is an officer of the Adviser to the Trust, and an officer and a director of Invesco Ltd., ultimate parent of the Adviser. |
| 2 | Mr. Taylor is considered an interested person (within the meaning of Section 2(a)(19) of the 1940 Act) of the Trust because he is an officer of Invesco Ltd., ultimate parent of the Adviser. |
T-1 Invesco Equity and Income Fund
Trustees and Officers—(continued)
| | | | | | | | |
Name, Year of Birth and Position(s) Held with the Trust | | Trustee and/ or Officer Since | | Principal Occupation(s)
During Past 5 Years | | Number of
Funds in Fund
Complex
Overseen by
Trustee | | Other Directorship(s) Held by Trustee During
Past 5 Years |
| Independent Trustees | | | | | | | | |
Bruce L. Crockett — 1944 Trustee and Chair | | 2003 | | Chairman, Crockett Technologies Associates (technology consulting company) Formerly: Director, Captaris (unified messaging provider); Director, President and Chief Executive Officer, COMSAT Corporation; Chairman, Board of Governors of INTELSAT (international communications company); ACE Limited (insurance company); Independent Directors Council and Investment Company Institute: Member of the Audit Committee, Investment Company Institute; Member of the Executive Committee and Chair of the Governance Committee, Independent Directors Council | | 229 | | Director and Chairman of the Audit Committee, ALPS (Attorneys Liability Protection Society) (insurance company); Director and Member of the Audit Committee and Compensation Committee, Ferroglobe PLC (metallurgical company) |
David C. Arch — 1945 Trustee | | 2010 | | Chairman of Blistex Inc. (consumer health care products manufacturer); Member, World Presidents’ Organization | | 229 | | Board member of the Illinois Manufacturers’ Association |
Beth Ann Brown — 1968 Trustee | | 2019 | | Independent Consultant Formerly: Head of Intermediary Distribution, Managing Director, Strategic Relations, Managing Director, Head of National Accounts, Senior Vice President, National Account Manager and Senior Vice President, Key Account Manager, Columbia Management Investment Advisers LLC; Vice President, Key Account Manager, Liberty Funds Distributor, Inc.; and Trustee of certain Oppenheimer Funds | | 229 | | Director, Board of Directors of Caron Engineering Inc.; Advisor, Board of Advisors of Caron Engineering Inc.; President and Director, Acton Shapleigh Youth Conservation Corps (non -profit); and Vice President and Director of Grahamtastic Connection(non-profit) |
Jack M. Fields — 1952 Trustee | | 2003 | | Chief Executive Officer, Twenty First Century Group, Inc. (government affairs company); and Chairman, Discovery Learning Alliance(non-profit) Formerly: Owner and Chief Executive Officer, Dos Angeles Ranch L.P. (cattle, hunting, corporate entertainment); Director, Insperity, Inc. (formerly known as Administaff) (human resources provider); Chief Executive Officer, Texana Timber LP (sustainable forestry company); Director of Cross Timbers Quail Research Ranch(non-profit); and member of the U.S. House of Representatives | | 229 | | None |
Cynthia Hostetler — 1962 Trustee | | 2017 | | Non-Executive Director and Trustee of a number of public and private business corporations Formerly: Director, Aberdeen Investment Funds (4 portfolios); Head of Investment Funds and Private Equity, Overseas Private Investment Corporation; President, First Manhattan Bancorporation, Inc.; Attorney, Simpson Thacher & Bartlett LLP | | 229 | | Vulcan Materials Company (construction materials company); Trilinc Global Impact Fund; Genesee & Wyoming, Inc. (railroads); Artio Global Investment LLC (mutual fund complex); Edgen Group, Inc. (specialized energy and infrastructure products distributor); Investment Company Institute (professional organization); Independent Directors Council (professional organization) |
Eli Jones — 1961 Trustee | | 2016 | | Professor and Dean, Mays Business School — Texas A&M University Formerly: Professor and Dean, Walton College of Business, University of Arkansas and E.J. Ourso College of Business, Louisiana State University; Director, Arvest Bank | | 229 | | Insperity, Inc. (formerly known as Administaff) (human resources provider) |
Elizabeth Krentzman — 1959 Trustee | | 2019 | | Formerly: Principal and Chief Regulatory Advisor for Asset Management Services and U.S. Mutual Fund Leader of Deloitte & Touche LLP; General Counsel of the Investment Company Institute (trade association); National Director of the Investment Management Regulatory Consulting Practice, Principal, Director and Senior Manager of Deloitte & Touche LLP; Assistant Director of the Division of Investment Management — Office of Disclosure and Investment Adviser Regulation of the U.S. Securities and Exchange Commission and various positions with the Division of Investment Management — Office of Regulatory Policy of the U.S. Securities and Exchange Commission; Associate at Ropes & Gray LLP; Advisory Board Member of the Securities and Exchange Commission Historical Society; and Trustee of certain Oppenheimer Funds | | 229 | | Trustee of the University of Florida National Board Foundation and Audit Committee Member; Member of the Cartica Funds Board of Directors (private investment funds); Member of the University of Florida Law Center Association, Inc. Board of Trustees and Audit Committee Member |
Anthony J. LaCava, Jr. — 1956 Trustee | | 2019 | | Formerly: Director and Member of the Audit Committee, Blue Hills Bank (publicly traded financial institution) and Managing Partner, KPMG LLP | | 229 | | Blue Hills Bank; Chairman, Bentley University; Member, Business School Advisory Council; and Nominating Committee, KPMG LLP |
T-2 Invesco Equity and Income Fund
Trustees and Officers—(continued)
| | | | | | | | |
Name, Year of Birth and Position(s) Held with the Trust | | Trustee and/ or Officer Since | | Principal Occupation(s)
During Past 5 Years | | Number of
Funds in Fund
Complex
Overseen by
Trustee | | Other Directorship(s) Held by Trustee During
Past 5 Years |
| Independent Trustees—(continued) |
Prema Mathai-Davis — 1950 Trustee | | 2003 | | Retired Co-Owner & Partner of Quantalytics Research, LLC, (a FinTech Investment Research Platform for the Self-Directed Investor) | | 229 | | None |
Joel W. Motley — 1952 Trustee | | 2019 | | Director of Office of Finance, Federal Home Loan Bank; Member of the Vestry of Trinity Wall Street; Managing Director of Carmona Motley Inc. (privately held financial advisor); Member of the Finance and Budget Committee of the Council on Foreign Relations, Member of the Investment Committee and Board of Human Rights Watch and Member of the Investment Committee and Board of Historic Hudson Valley(non-profit cultural organization) Formerly: Managing Director of Public Capital Advisors, LLC (privately held financial advisor); Managing Director of Carmona Motley Hoffman, Inc. (privately held financial advisor); Trustee of certain Oppenheimer Funds; and Director of Columbia Equity Financial Corp. (privately held financial advisor) | | 229 | | Director of Greenwall Foundation (bioethics research foundation); Member of Board and Investment Committee of The Greenwall Foundation; Director of Southern Africa Legal Services Foundation; Board Member and Investment Committee Member of Pulitzer Center for Crisis Reporting(non-profit journalism) |
Teresa M. Ressel — 1962 Trustee | | 2017 | | Non-executive director and trustee of a number of public and private business corporations Formerly: Chief Financial Officer, Olayan America, The Olayan Group (international investor/commercial/industrial); Chief Executive Officer, UBS Securities LLC; Group Chief Operating Officer, Americas, UBS AG; Assistant Secretary for Management & Budget and CFO, US Department of the Treasury | | 229 | | Atlantic Power Corporation (power generation company); ON Semiconductor Corp. (semiconductor supplier) |
Ann Barnett Stern — 1957 Trustee | | 2017 | | President and Chief Executive Officer, Houston Endowment Inc. (private philanthropic institution) Formerly: Executive Vice President and General Counsel, Texas Children’s Hospital; Attorney, Beck, Redden and Secrest, LLP; Business Law Instructor, University of St. Thomas; Attorney, Andrews & Kurth LLP | | 229 | | Federal Reserve Bank of Dallas |
Raymond Stickel, Jr. — 1944 Trustee | | 2005 | | Retired Formerly: Director, Mainstay VP Series Funds, Inc. (25 portfolios); Partner, Deloitte & Touche | | 229 | | None |
Robert C. Troccoli — 1949 Trustee | | 2016 | | Retired Formerly: Adjunct Professor, University of Denver — Daniels College of Business; Senior Partner, KPMG LLP | | 229 | | None |
Daniel S. Vandivort — 1954 Trustee | | 2019 | | Treasurer, Chairman of the Audit and Finance Committee, and Trustee, Board of Trustees, Huntington Disease Foundation of America; and President, Flyway Advisory Services LLC (consulting and property management) Formerly: Trustee and Governance Chair, of certain Oppenheimer Funds | | 229 | | Chairman and Lead Independent Director, Chairman of the Audit Committee, and Director, Board of Directors, Value Line Funds |
James D. Vaughn — 1945 Trustee | | 2019 | | Retired Formerly: Managing Partner, Deloitte & Touche LLP; Trustee and Chairman of the Audit Committee, Schroder Funds; Board Member, Mile High United Way, Boys and Girls Clubs, Boy Scouts, Colorado Business Committee for the Arts, Economic Club of Colorado and Metro Denver Network (economic development corporation); and Trustee of certain Oppenheimer Funds | | 229 | | Board member and Chairman of Audit Committee of AMG National Trust Bank; Trustee and Investment Committee member, University of South Dakota Foundation; Board member, Audit Committee Member and past Board Chair, Junior Achievement(non-profit) |
Christopher L. Wilson — 1957 Trustee, Vice Chair and Chair Designate | | 2017 | | Retired Formerly: Director, TD Asset Management USA Inc. (mutual fund complex) (22 portfolios); Managing Partner, CT2, LLC (investing and consulting firm); President/Chief Executive Officer, Columbia Funds, Bank of America Corporation; President/Chief Executive Officer, CDC IXIS Asset Management Services, Inc.; Principal & Director of Operations, Scudder Funds, Scudder, Stevens & Clark, Inc.; Assistant Vice President, Fidelity Investments | | 229 | | ISO New England, Inc.(non-profit organization managing regional electricity market) |
T-3 Invesco Equity and Income Fund
Trustees and Officers—(continued)
| | | | | | | | |
Name, Year of Birth and Position(s) Held with the Trust | | Trustee and/ or Officer Since | | Principal Occupation(s)
During Past 5 Years | | Number of
Funds in Fund
Complex
Overseen by
Trustee | | Other Directorship(s) Held by Trustee During
Past 5 Years |
| Other Officers | | | | | | | | |
Sheri Morris — 1964 President, Principal Executive Officer and Treasurer | | 2003 | | President, Principal Executive Officer and Treasurer, The Invesco Funds; Vice President, Invesco Advisers, Inc. (formerly known as Invesco Institutional (N.A.), Inc.) (registered investment adviser); and Vice President, Invesco Exchange-Traded Fund Trust, Invesco Exchange-Traded Fund Trust II, Invesco India Exchange-Traded Fund Trust, Invesco Actively Managed Exchange-Traded Fund Trust, Invesco Actively Managed Exchange-Traded Commodity Fund Trust and Invesco Exchange-Traded Self-Indexed Fund Trust; and Vice President, OppenheimerFunds, Inc. Formerly: Vice President and Principal Financial Officer, The Invesco Funds; Vice President, Invesco AIM Advisers, Inc., Invesco AIM Capital Management, Inc. and Invesco AIM Private Asset Management, Inc.; Assistant Vice President and Assistant Treasurer, The Invesco Funds and Assistant Vice President, Invesco Advisers, Inc., Invesco AIM Capital Management, Inc. and Invesco AIM Private Asset Management, Inc.; and Treasurer, Invesco Exchange-Traded Fund Trust, Invesco Exchange-Traded Fund Trust II, Invesco India Exchange-Traded Fund Trust and Invesco Actively Managed Exchange-Traded Fund Trust | | N/A | | N/A |
Russell C. Burk — 1958 Senior Vice President and Senior Officer | | 2005 | | Senior Vice President and Senior Officer, The Invesco Funds | | N/A | | N/A |
Jeffrey H. Kupor — 1968 Senior Vice President, Chief Legal Officer and Secretary | | 2018 | | Head of Legal of the Americas, Invesco Ltd.; Senior Vice President and Secretary, Invesco Advisers, Inc. (formerly known as Invesco Institutional (N.A.), Inc.) (registered investment adviser); Senior Vice President and Secretary, Invesco Distributors, Inc. (formerly known as Invesco AIM Distributors, Inc.); Vice President and Secretary, Invesco Investment Services, Inc. (formerly known as Invesco AIM Investment Services, Inc.) Senior Vice President, Chief Legal Officer and Secretary, The Invesco Funds; Secretary and General Counsel, Invesco Investment Advisers LLC (formerly known as Van Kampen Asset Management); Secretary and General Counsel, Invesco Capital Markets, Inc. (formerly known as Van Kampen Funds Inc.) and Chief Legal Officer, Invesco Exchange-Traded Fund Trust, Invesco Exchange-Traded Fund Trust II, Invesco India Exchange-Traded Fund Trust, Invesco Actively Managed Exchange-Traded Fund Trust, Invesco Actively Managed Exchange-Traded Commodity Fund Trust and Invesco Exchange-Traded Self-Indexed Fund Trust; Secretary, Invesco Indexing LLC; Secretary, W.L. Ross & Co., LLC Formerly: Secretary and Vice President, Jemstep, Inc.; Head of Legal, Worldwide Institutional, Invesco Ltd.; Secretary and General Counsel, INVESCO Private Capital Investments, Inc.; Senior Vice President, Secretary and General Counsel, Invesco Management Group, Inc. (formerly known as Invesco AIM Management Group, Inc.); Assistant Secretary, INVESCO Asset Management (Bermuda) Ltd.; Secretary and General Counsel, Invesco Private Capital, Inc.; Assistant Secretary and General Counsel, INVESCO Realty, Inc.; Secretary and General Counsel, Invesco Senior Secured Management, Inc.; and Secretary, Sovereign G./P. Holdings Inc. | | N/A | | N/A |
Andrew R. Schlossberg — 1974 Senior Vice President | | 2019 | | Head of the Americas and Senior Managing Director, Invesco Ltd.; Director and Senior Vice President, Invesco Advisers, Inc. (formerly known as Invesco Institutional (N.A.), Inc.) (registered investment adviser); Director and Chairman, Invesco Investment Services, Inc. (formerly known as Invesco AIM Investment Services, Inc.) (registered transfer agent); Senior Vice President, The Invesco Funds; Director, Invesco Investment Advisers LLC (formerly known as Van Kampen Asset Management); Director, President and Chairman, Invesco Insurance Agency, Inc. Formerly: Director, Invesco UK Limited; Director and Chief Executive, Invesco Asset Management Limited and Invesco Fund Managers Limited; Assistant Vice President, The Invesco Funds; Senior Vice President, Invesco Advisers, Inc. (formerly known as Invesco Institutional (N.A.), Inc.) (registered investment adviser); Director and Chief Executive, Invesco Administration Services Limited and Invesco Global Investment Funds Limited; Director, Invesco Distributors, Inc.; Head of EMEA, Invesco Ltd.; President, Invesco Actively Managed Exchange-Traded Commodity Fund Trust, Invesco Actively Managed Exchange-Traded Fund Trust, Invesco Exchange-Traded Fund Trust, Invesco Exchange-Traded Fund Trust II and Invesco India Exchange-Traded Fund Trust; Managing Director and Principal Executive Officer, Invesco Capital Management LLC | | N/A | | N/A |
T-4 Invesco Equity and Income Fund
Trustees and Officers—(continued)
| | | | | | | | |
Name, Year of Birth and Position(s) Held with the Trust | | Trustee and/ or Officer Since | | Principal Occupation(s)
During Past 5 Years | | Number of
Funds in Fund
Complex
Overseen by
Trustee | | Other Directorship(s) Held by Trustee During
Past 5 Years |
| Other Officers—(continued) | | | | | | | | |
John M. Zerr — 1962
Senior Vice President | | 2006 | | Chief Operating Officer of the Americas; Senior Vice President, Invesco Advisers, Inc. (formerly known as Invesco Institutional (N.A.), Inc.) (registered investment adviser); Senior Vice President, Invesco Distributors, Inc. (formerly known as Invesco AIM Distributors, Inc.); Director and Vice President, Invesco Investment Services, Inc. (formerly known as Invesco AIM Investment Services, Inc.) Senior Vice President, The Invesco Funds; Managing Director, Invesco Capital Management LLC; Director, Invesco Investment Advisers LLC (formerly known as Van Kampen Asset Management); Senior Vice President, Invesco Capital Markets, Inc. (formerly known as Van Kampen Funds Inc.); Manager, Invesco Indexing LLC; Manager, Invesco Specialized Products, LLC; Director and Senior Vice President, Invesco Insurance Agency, Inc.; Member, Invesco Canada Funds Advisory Board; Director, President and Chief Executive Officer, Invesco Corporate Class Inc. (corporate mutual fund company); and Director, Chairman, President and Chief Executive Officer, Invesco Canada Ltd. (formerly known as Invesco Trimark Ltd./Invesco Trimark Ltèe) (registered investment adviser and registered transfer agent) Formerly: Director and Senior Vice President, Invesco Management Group, Inc. (formerly known as Invesco AIM Management Group, Inc.); Secretary and General Counsel, Invesco Management Group, Inc. (formerly known as Invesco AIM Management Group, Inc.); Secretary, Invesco Investment Services, Inc. (formerly known as Invesco AIM Investment Services, Inc.); Chief Legal Officer and Secretary, The Invesco Funds; Secretary and General Counsel, Invesco Investment Advisers LLC (formerly known as Van Kampen Asset Management); Secretary and General Counsel, Invesco Capital Markets, Inc. (formerly known as Van Kampen Funds Inc.); Chief Legal Officer, Invesco Exchange-Traded Fund Trust, Invesco Exchange-Traded Fund Trust II, Invesco India Exchange-Traded Fund Trust, Invesco Actively Managed Exchange-Traded Fund Trust, Invesco Actively Managed Exchange-Traded Commodity Fund Trust and Invesco Exchange-Traded Self-Indexed Fund Trust; Secretary, Invesco Indexing LLC; Director, Secretary, General Counsel and Senior Vice President, Van Kampen Exchange Corp.; Director, Vice President and Secretary, IVZ Distributors, Inc. (formerly known as INVESCO Distributors, Inc.); Director and Vice President, INVESCO Funds Group, Inc.; Director and Vice President, Van Kampen Advisors Inc.; Director, Vice President, Secretary and General Counsel, Van Kampen Investor Services Inc.; Director and Secretary, Invesco Distributors, Inc. (formerly known as Invesco AIM Distributors, Inc.); Director, Senior Vice President, General Counsel and Secretary, Invesco AIM Advisers, Inc. and Van Kampen Investments Inc.; Director, Vice President and Secretary, Fund Management Company; Director, Senior Vice President, Secretary, General Counsel and Vice President, Invesco AIM Capital Management, Inc.; Chief Operating Officer and General Counsel, Liberty Ridge Capital, Inc. (an investment adviser) | | N/A | | N/A |
Gregory G. McGreevey — 1962 Senior Vice President | | 2012 | | Senior Managing Director, Invesco Ltd.; Director, Chairman, President, and Chief Executive Officer, Invesco Advisers, Inc. (formerly known as Invesco Institutional (N.A.), Inc.) (registered investment adviser); Director, Invesco Mortgage Capital, Inc. and Invesco Senior Secured Management, Inc.; and Senior Vice President, The Invesco Funds; and President, SNW Asset Management Corporation Formerly: Senior Vice President, Invesco Management Group, Inc. and Invesco Advisers, Inc.; Assistant Vice President, The Invesco Funds | | N/A | | N/A |
Kelli Gallegos — 1970 Vice President, Principal Financial Officer and Assistant Treasurer | | 2008 | | Assistant Treasurer, Invesco Specialized Products, LLC; Vice President, Principal Financial Officer and Assistant Treasurer, The Invesco Funds; Principal Financial and Accounting Officer — Pooled Investments, Invesco Capital Management LLC; Vice President and Treasurer, Invesco Exchange-Traded Fund Trust, Invesco Exchange-Traded Fund Trust II, Invesco India Exchange-Traded Fund Trust, Invesco Actively Managed Exchange-Traded Fund Trust, Invesco Actively Managed Exchange-Traded Commodity Fund Trust and Invesco Exchange-Traded Self-Indexed Fund Trust Formerly: Assistant Treasurer, Invesco Exchange-Traded Fund Trust, Invesco Exchange-Traded Fund Trust II, Invesco India Exchange-Traded Fund Trust, Invesco Actively Managed Exchange-Traded Fund Trust, Invesco Actively Managed Exchange-Traded Commodity Fund Trust and Invesco Exchange-Traded Self-Indexed Fund Trust; Assistant Treasurer, Invesco Capital Management LLC; Assistant Vice President, The Invesco Funds | | N/A | | N/A |
T-5 Invesco Equity and Income Fund
Trustees and Officers—(continued)
| | | | | | | | |
Name, Year of Birth and Position(s) Held with the Trust | | Trustee and/ or Officer Since | | Principal Occupation(s)
During Past 5 Years | | Number of
Funds in Fund
Complex
Overseen by
Trustee | | Other Directorship(s) Held by Trustee During
Past 5 Years |
| Other Officers—(continued) | | | | | | | | |
Crissie M. Wisdom — 1969 Anti-Money Laundering Compliance Officer | | 2013 | | Anti-Money Laundering Compliance Officer, Invesco Advisers, Inc. (formerly known as Invesco Institutional (N.A.), Inc.) (registered investment adviser), Invesco Capital Markets, Inc. (formerly known as Van Kampen Funds Inc.), Invesco Distributors, Inc., Invesco Investment Services, Inc., The Invesco Funds, and Invesco Exchange-Traded Fund Trust, Invesco Exchange-Traded Fund Trust II, Invesco India Exchange-Traded Fund Trust, Invesco Actively Managed Exchange-Traded Fund Trust, Invesco Actively Managed Exchange-Traded Commodity Fund Trust and Invesco Exchange-Traded Self-Indexed Fund Trust; Anti-Money Laundering Compliance Officer and Bank Secrecy Act Officer, INVESCO National Trust Company and Invesco Trust Company; and Fraud Prevention Manager and Controls and Risk Analysis Manager for Invesco Investment Services, Inc. Formerly: Anti-Money Laundering Compliance Officer, Van Kampen Exchange Corp. and Invesco Management Group, Inc. | | N/A | | N/A |
Robert R. Leveille — 1969 Chief Compliance Officer | | 2016 | | Chief Compliance Officer, Invesco Advisers, Inc. (registered investment adviser); and Chief Compliance Officer, The Invesco Funds Formerly: Chief Compliance Officer, Putnam Investments and the Putnam Funds | | N/A | | N/A |
The Statement of Additional Information of the Trust includes additional information about the Fund’s Trustees and is available upon request, without charge, by calling 1.800.959.4246. Please refer to the Fund’s Statement of Additional Information for information on the Fund’ssub-advisers.
| | | | | | |
Office of the Fund 11 Greenway Plaza, Suite 1000
Houston, TX 77046-1173 | | Investment Adviser Invesco Advisers, Inc.
1555 Peachtree Street, N.E.
Atlanta, GA 30309 | | Distributor Invesco Distributors, Inc.
11 Greenway Plaza, Suite 1000
Houston, TX 77046-1173 | | Auditors PricewaterhouseCoopers LLP
1000 Louisiana Street, Suite 5800 Houston, TX 77002-5021 |
| | | |
| | | | | | |
Counsel to the Fund Stradley Ronon Stevens & Young, LLP
2005 Market Street, Suite 2600
Philadelphia, PA 19103-7018 | | Counsel to the Independent Trustees Goodwin Procter LLP
901 New York Avenue, N.W.
Washington, D.C. 20001 | | Transfer Agent Invesco Investment Services, Inc.
11 Greenway Plaza, Suite 1000
Houston, TX 77046-1173 | | Custodian State Street Bank and Trust Company
225 Franklin Street
Boston, MA 02110-2801 |
T-6 Invesco Equity and Income Fund
Go paperless with eDelivery
Visit invesco.com/edelivery to enjoy the convenience and security of anytime electronic access to your investment documents.
With eDelivery, you can elect to have any or all of the following materials delivered straight to your inbox to download, save and print from your own computer:
| • | Fund reports and prospectuses |
| • | Quarterly statements |
| • | Daily confirmations |
| • | Tax forms |
Invesco mailing information
Send general correspondence to Invesco Investment Services, Inc., P.O. Box 219078, Kansas City, MO 64121-9078.
Important notice regarding delivery of security holder documents
To reduce Fund expenses, only one copy of most shareholder documents may be mailed to shareholders with multiple accounts at the same address (Householding). Mailing of your shareholder documents may be householded indefinitely unless you instruct us otherwise. If you do not want the mailing of these documents to be combined with those for other members of your household, please contact Invesco Investment Services, Inc. at 800 959 4246 or contact your financial institution. We will begin sending you individual copies for each account within 30 days after receiving your request.
Fund holdings and proxy voting information
The Fund provides a complete list of its holdings four times in each fiscal year, at the quarter-ends. For the second and fourth quarters, the list appears in the Fund’s semiannual and annual reports to shareholders. For the first and third quarters, the Fund files the lists with the Securities and Exchange Commission (SEC) as an exhibit to its reports on Form N-PORT. The most recent list of portfolio holdings is available at invesco.com/completeqtrholdings. Shareholders can also look up the Fund’s Form N-PORT filings on the SEC website, sec.gov. The SEC file numbers for the Fund are shown below.
A description of the policies and procedures that the Fund uses to determine how to vote proxies relating to portfolio securities is available without charge, upon request, from our Client Services department at 800 959 4246, or at invesco.com/proxyguidelines. The information is also available on the SEC website, sec.gov.
Information regarding how the Fund voted proxies related to its portfolio securities during the most recent 12-month period ended June 30 is available at invesco.com/proxysearch. This information is also available on the SEC website, sec.gov.
Invesco Advisers, Inc. is an investment adviser; it provides investment advisory services to individual and institutional clients and does not sell securities. Invesco Distributors, Inc. is the US distributor for Invesco Ltd.’s retail mutual funds, exchange-traded funds and institutional money market funds. Both are wholly owned, indirect subsidiaries of Invesco Ltd.
| SEC file numbers: 811-09913 and 333-36074 | Invesco Distributors, Inc. | VK-EQI-AR-1 |
| Annual Report to Shareholders | August 31, 2019 |
Invesco Floating Rate Fund
Nasdaq:
A: AFRAX ■ C: AFRCX ■ R: AFRRX ■ Y: AFRYX ■ R5: AFRIX ■ R6: AFRFX

Beginning on January 1, 2021, as permitted by regulations adopted by the Securities and Exchange Commission, paper copies of the Fund’s shareholder reports will no longer be sent by mail, unless you specifically request paper copies of the reports from the Fund or from your financial intermediary, such as a broker-dealer or bank. Instead, the reports will be made available on the Fund’s website, and you will be notified by mail each time a report is posted and provided with a website link to access the report.
If you already elected to receive shareholder reports electronically, you will not be affected by this change and you need not take any action. You may elect to receive shareholder reports and other communications from the Fund electronically by contacting your financial intermediary (such as a broker-dealer or bank) or, if you are a direct investor, by enrolling at invesco.com/edelivery.
You may elect to receive all future reports in paper free of charge. If you invest through a financial intermediary, you can contact your financial intermediary to request that you continue to receive paper copies of your shareholder reports. If you invest directly with the Fund, you can call (800) 959-4246 to let the Fund know you wish to continue receiving paper copies of your shareholder reports. Your election to receive reports in paper will apply to all funds held with your financial intermediary or all funds held with the fund complex if you invest directly with the Fund.
Dear Shareholders:
This annual report includes information about your Fund, including performance data and a complete list of its investments as of the close of the reporting period. Inside is a discussion of how your Fund was managed and the factors that affected its performance during the reporting period.
Throughout the reporting period, global equity markets remained volatile. Investor sentiment ranged from elation to fear. The reporting period began with several US equity indexes redefining new highs. The exuberance, however, ended in October 2018 as global equities, in particular US stocks, sold off, with the sharpest decline in December. The catalyst for the sell-off was a combination of ongoing trade concerns between the US and China, fears of a global economic slowdown and lower oil prices from a supply glut. Gains posted earlier in 2018 for global equities were erased, while US Treasury bonds, along with government and municipal bonds, rallied as investors fled to “safe haven” assets.
At the start of 2019, global equity markets rebounded strongly buoyed by more dovish central banks and optimism about a potential US-China trade deal. In May, US-China trade concerns and slowing global growth led to a global equity sell-off and rally in U.S. Treasuries. Despite the May sell-off, domestic equity markets rallied in June in anticipation of a U.S. Federal Reserve (the Fed) rate cut and closed the second quarter with modest gains. As the reporting period ended in August, market volatility once again increased as the US Treasury yield curve inverted several times magnifying concerns that the US economy could be headed into a recession.
During the reporting period, the Fed both raised and lowered the federal funds rate. Given signs of a strong economy, the Fed raised rates two times: in September and December 2018. In 2019, however, the Fed altered its outlook on further rate hikes leaving rates unchanged for the first half of the year. In July, the Fed lowered interest rates for the first time in 11 years. As 2019 unfolds, we’ll see how the interplay of interest rates, economic data, geopolitics and a host of other factors affect US and overseas equity and fixed income markets.
Investor uncertainty and market volatility, such as we witnessed during the reporting period, are unfortunate facts of life when it comes to investing. That’s why Invesco encourages investors to work with a professional financial adviser who can stress the importance of starting to save and invest early and the importance of adhering to a disciplined investment plan. A financial adviser who knows your unique financial situation, investment goals and risk tolerance can be an invaluable partner as you seek to achieve your financial goals. He or she can offer a long-term perspective when markets are volatile and time-tested advice and guidance when your financial situation or investment goals change.
Visit our website for more information on your investments
Our website, invesco.com/us, offers a wide range of market insights and investment perspectives. On the website, you’ll find detailed information about our funds, including performance, holdings and portfolio manager commentaries. You can access information about your account by completing a simple, secure online registration. To do so, select “Log In” on the right side of the homepage, and then select “Register for Individual Account Access.”
In addition to the resources accessible on our website and through our mobile app, you can obtain timely updates to help you stay informed about the markets and the economy by connecting with Invesco on Twitter, LinkedIn or Facebook. You can access our blog at blog.invesco.us.com. Our goal is to provide you the information you want, when and where you want it.
Finally, I’m pleased to share with you Invesco’s commitment to both the Principles for Responsible Investment and to considering environmental, social and governance issues in our robust investment process. I invite you to learn more at invesco.com/esg.
Have questions?
For questions about your account, contact an Invesco client services representative at 800 959 4246.
All of us at Invesco look forward to serving your investment management needs. Thank you for investing with us.
Sincerely,
Andrew Schlossberg
Head of the Americas,
Senior Managing Director, Invesco Ltd.
| 2 | Invesco Floating Rate Fund |
Dear Shareholders:
Among the many important lessons I’ve learned in more than 40 years in a variety of business endeavors is the value of a trusted advocate.
As independent chair of the Invesco Funds Board, I can assure you that the members of the Board are strong advocates for the interests of investors in Invesco’s mutual funds. We work hard to represent your interests through oversight of the quality of the investment management services your funds receive and other matters important to your investment, including but not limited to:
| ■ | Ensuring that Invesco offers a diverse lineup of mutual funds that your financial adviser can use to strive to meet your financial needs as your investment goals change over time. |
| ■ | Monitoring how the portfolio management teams of the Invesco funds are performing in light of changing economic and market conditions. |
| ■ | Assessing each portfolio management team’s investment performance within the context of the investment strategy described in the fund’s prospectus. |
| ■ | Monitoring for potential conflicts of interests that may impact the nature of the services that your funds receive. |
We believe one of the most important services we provide our fund shareholders is the annual review of the funds’ advisory and sub-advisory contracts with Invesco Advisers and its affiliates. This review is required by the Investment Company Act of 1940 and focuses on the nature and quality of the services Invesco provides as the adviser to the Invesco funds and the reasonableness of the fees that it charges for those services. Each year, we spend months carefully reviewing information received from Invesco and a variety of independent sources, such as performance and fee data prepared by Lipper, Inc. (a subsidiary of Broadridge Financial Solutions, Inc.), an independent, third-party firm widely recognized as a leader in its field. We also meet with our independent legal counsel and other independent advisers to review and help us assess the information that we have received. Our goal is to assure that you receive quality investment management services for a reasonable fee.
I trust the measures outlined above provide assurance that you have a worthy advocate when it comes to choosing the Invesco Funds.
As always, please contact me at bruce@brucecrockett.com with any questions or concerns you may have. On behalf of the Board, we look forward to continuing to represent your interests and serving your needs.
Sincerely,
Bruce L. Crockett
Independent Chair
Invesco Funds Board of Trustees
| 3 | Invesco Floating Rate Fund |
Management’s Discussion of Fund Performance
Performance summary
For the fiscal year ended August 31, 2019, Class A shares of Invesco Floating Rate Fund (the Fund), at net asset value (NAV), underperformed the Credit Suisse Leveraged Loan Index, the Fund’s style-specific benchmark.
Your Fund’s long-term performance appears later in this report.
Fund vs. Indexes
Total returns, August 31, 2018 to August 31, 2019, at net asset value (NAV). Performance shown does not include applicable contingent deferred sales charges (CDSC) or front-end sales charges, which would have reduced performance.
| Class A Shares | 2.50% |
| Class C Shares | 2.12 |
| Class R Shares | 2.25 |
| Class Y Shares | 2.76 |
| Class R5 Shares | 2.80 |
| Class R6 Shares | 2.86 |
| Bloomberg Barclays U.S. Aggregate Bond Index▼ (Broad Market Index) | 10.17 |
Credit Suisse Leveraged Loan Index■
(Style-Specific Index) | 3.38 |
Lipper Loan Participation Funds Classification Average♦
(Peer Group) | 2.29 |
Source(s):▼RIMES Technologies Corp.;■
Bloomberg L.P.;♦
Lipper Inc. | |
Market conditions and your Fund
During the fiscal year covered by this report, the senior loan market was characterized by a technically driven sell-off, which was then followed by some of the strongest monthly performance the asset class has experienced in recent
memory. As compared with other risk asset classes, the senior loan market exhibited limited volatility during the fiscal year, despite the constant oscillations in risk sentiment, and returned 3.38%, as represented by the Credit Suisse Leveraged Loan Index.
From a fundamentals standpoint, the backdrop for loans remained favorable during the fiscal year with a trailing 12-month default rate of 1.29%.1 We believe slow, but positive, growth in the US economy may continue to support fundamentals. During the fiscal year, the overall earnings environment remained supportive of loan issuers despite a moderation in profit growth. Year-over-year EBITDA (earnings before interest, taxes, depreciation and amortization) growth among the universe of loan issuers was solid in the first quarter of 2019 at 3.0%.1
Trade remained a key source of uncertainty during the fiscal year; however, there have been indications that the Trump administration has been seeking a resolution. Against a backdrop of these trade tensions, the US Federal Reserve’s (the Fed) shift toward a more accommodative monetary posture should help maintain the underlying economic momentum, which has powered consistent earnings improvement in the US corporate sector.
During the fourth quarter of 2018, the loan market experienced a technically
| Portfolio Composition†* |
| By credit quality, based on total investments |
| as of August 31, 2019 |
| AA | 0.2% |
| A | 0.2 |
| BBB- | 8.8 |
| BB+ | 7.3 |
| BB | 10.9 |
| BB- | 13.6 |
| B+ | 18.4 |
| B | 17.3 |
| B- | 9.5 |
| CCC+ | 3.5 |
| CCC | 1.0 |
| CCC- | 0.1 |
| D | 0.1 |
| Non-Rated | 6.9 |
| Equity | 2.2 |
| † | Source: Standard & Poor’s. A credit rating is an assessment provided by a nationally recognized statistical rating organization (NRSRO) of the creditworthiness of an issuer with respect to debt obligations, including specific securities, money market instruments or other debts. Ratings are measured on a scale that generally ranges from AAA (highest) to D (lowest); ratings are subject to change without notice. “Non-Rated” indicates the debtor was not rated, and should not be interpreted as indicating low quality. For more information on Standard & Poor’s rating methodology, please visit standardandpoors.com and select “Understanding Ratings” under Rating Resources on the homepage. |
| Top Five Debt Issuers |
| % of total net assets |
| 1. | CSC Holdings, LLC | 1.8% |
| 2. | TransDigm, Inc. | 1.9 |
| 3. | Altice Financing S.A. | 1.6 |
| 4. | Sprint Communications, Inc. | 1.6 |
| 5. | Vistra Operations Co. LLC | 1.4 |
| Total Net Assets | $2.2 billion |
| Total Number of Holdings* | 763 |
| The Fund’s holdings are subject to change, and there is no assurance that the Fund will continue to hold any particular security. |
| *Excluding money market fund holdings. |
| Data presented here are as of August 31, 2019. |
| 4 | Invesco Floating Rate Fund |
driven sell-off, as risk assets fell in price due to investors’ softening growth expectations amid tightening US monetary policy. Unlike prior bouts of volatility, loans were caught in the wave of risk aversion. This resulted in sizeable retail and institutional outflows that led to a very weak technical dynamic and ultimately resulted in a sharp decrease in prices. This was despite the fact that loans, from a fundamental standpoint, continued to remain on solid footing. This narrative quickly reversed in the first and second quarters of 2019, as loans snapped back, returning 5.42%, their strongest performance during the first half of a calendar year since 2009.2 Strong demand from collateralized loan obligations was able to more than offset retail outflows, leading to a more favorable technical dynamic. We believe certain investors’ narrow focus on interest rate expectations — rather than the full spectrum of characteristics that define the loan asset class — has driven this reallocation of capital from senior secured risk toward unsecured risk despite loans offering equivalent yields to high yield bonds.3
The average price in the senior loan market was $96.34 as of August 31, 2019, with 21.3% of the market trading at or above par.4 Given the price of senior loans at the end of the Fund’s fiscal year, they provided a 6.13% yield.4
In managing the Fund, we seek to take advantage of market opportunities by decreasing risk in the Fund when we believe senior loans are overbought and increasing risk when we believe they are oversold. We seek to efficiently allocate risk within the portfolio in order to maximize risk-adjusted returns through five different considerations consisting of credit selection, sector migration, risk positioning, asset selection and trading.
During the first quarter of 2019,Vistra Operations,Windstream andTransDigm contributed to the Fund’s performance, whileCheckout Holding,Maxar Technologiesand Serta Simmons detracted from returns. During the second quarter of 2019,Monitronics,Dell Internationaland CSC Holdings all contributed to Fund performance, whileSeadrill, TransoceanandAscena Retail all detracted from performance. We sold our position in Ascena Retail before the close of the fiscal year.
During the fiscal year, the Fund’s allocation to recent primary deals, broadly speaking, also contributed to the Fund’s performance relative to its style-specific benchmark. During calendar year 2019,
the Fund’s credit positioning was a relative contributor to performance, as the Fund has maintained an overweight allocation to higher quality assets, compared to that of the Credit Suisse Leveraged Loan Index.
The senior loan asset class behaves differently from many traditional fixed income investments. The interest income generated by a portfolio of senior loans is usually determined by a fixed credit spread over the London Interbank Offered Rate (Libor). Because senior loans generally have a very short duration and the coupons, or interest rates, are usually adjusted every 30 to 90 days as Libor changes, the yield on the portfolio adjusts. Interest rate risk refers to the tendency for traditional fixed income prices to decline when interest rates rise. For senior loans, however, interest rates and income are variable, and the prices of loans are therefore less sensitive to interest rate changes than traditional fixed income bonds. As a result, senior loans can provide a natural hedge against rising interest rates.
We are monitoring interest rates, the market and economic and geopolitical factors that may impact the direction, speed and magnitude of changes to interest rates across the maturity spectrum, including the potential impact of monetary policy changes by the Fed and other central banks. If interest rates rise, markets may experience increased volatility, which may affect the value and/or liquidity of certain of the Fund’s investments and the market price of the Fund’s shares.
As always, we appreciate your continued participation in Invesco Floating Rate Fund.
| 1 | Source: S&P LCD August 31, 2019 |
| 2 | Source: CS Leveraged Loan Index August 31, 2019 |
| 3 | Source: J.P. Morgan August 31, 2019 |
| 4 | Source: S&P LCD and Invesco August 31, 2019. Yield incorporates forward Libor curve. |
The views and opinions expressed in management’s discussion of Fund performance are those of Invesco Advisers, Inc. These views and opinions are subject to change at any time based on factors such as market and economic conditions. These views and opinions may not be relied upon as investment advice or recommendations, or as an offer for a particular security. The information is not a complete analysis of every aspect of any market, country, industry, security or the Fund. Statements of fact are from sources considered reliable, but Invesco Advisers, Inc. makes no representation or warranty as to their completeness or accuracy. Although historical performance is no guarantee of future results, these insights may help you understand our investment management philosophy.
See important Fund and, if applicable, index disclosures later in this report.
Tom Ewald
Portfolio Manager, is lead manager of Invesco Floating Rate Fund. He joined Invesco or its investment advisory affiliates in 2000. Mr. Ewald earned a BA from Harvard College and an MBA from the Darden School of Business at the University of Virginia.
Scott Baskind
Portfolio Manager, is manager of Invesco Floating Rate Fund. He joined Invesco or its investment advisory affiliates in 1999. Mr. Baskind earned a BS in business administration, with majors in finance and management information systems, from the University at Albany, State University of New York.
Philip Yarrow
Chartered Financial Analyst, Portfolio Manager, is manager of Invesco Floating Rate Fund. He joined Invesco in 2010. Mr. Yarrow earned a BS in mathematics and economics from The University of Nottingham and a master of management degree in finance from Northwestern University.
| 5 | Invesco Floating Rate Fund |
Your Fund’s Long-Term Performance
Results of a $10,000 Investment — Oldest Share Class(es)
Fund and index data from 8/31/09
| 1 | Source: Bloomberg L.P. |
| 2 | Source: Lipper Inc. |
| 3 | Source: RIMES Technologies Corp. |
Past performance cannot guarantee comparable future results.
The data shown in the chart include reinvested distributions, applicable sales charges and Fund expenses including
management fees. Index results include reinvested dividends, but they do not reflect sales charges. Performance of the peer group, if applicable, reflects fund expenses and management fees; perfor-
mance of a market index does not. Performance shown in the chart and table(s) does not reflect deduction of taxes a shareholder would pay on Fund distributions or sale of Fund shares.
| 6 | Invesco Floating Rate Fund |
| Average Annual Total Returns |
| As of 8/31/19, including maximum applicable sales charges |
| Class A Shares | |
| Inception (5/1/97) | 3.97% |
| 10 Years | 4.90 |
| 5 Years | 2.63 |
| 1 Year | 0.00 |
| Class C Shares | |
| Inception (3/31/00) | 3.60% |
| 10 Years | 4.64 |
| 5 Years | 2.63 |
| 1 Year | 1.14 |
| Class R Shares | |
| Inception (4/13/06) | 3.37% |
| 10 Years | 4.90 |
| 5 Years | 2.86 |
| 1 Year | 2.25 |
| Class Y Shares | |
| Inception (10/3/08) | 5.30% |
| 10 Years | 5.43 |
| 5 Years | 3.40 |
| 1 Year | 2.76 |
| Class R5 Shares | |
| Inception (4/13/06) | 3.94% |
| 10 Years | 5.48 |
| 5 Years | 3.41 |
| 1 Year | 2.80 |
| Class R6 Shares | |
| 10 Years | 5.40% |
| 5 Years | 3.48 |
| 1 Year | 2.86 |
Class R6 shares incepted on September 24, 2012. Performance shown prior to that date is that of Class A shares and includes the 12b-1 fees applicable to Class A shares.
The performance data quoted represent past performance and cannot guarantee comparable future results; current performance may be lower or higher. Please visit invesco.com/performance for the most recent month-end performance. Performance figures reflect reinvested distributions, changes in net asset value and the effect of the maximum sales charge unless otherwise stated. Investment return and principal value will fluctuate so that you may have a gain or loss when you sell shares.
The net annual Fund operating expense ratio set forth in the most recent Fund prospectus as of the date of this report for Class A, Class C, Class R, Class Y, Class R5 and Class R6 shares was 1.08%, 1.58%, 1.33%, 0.83%, 0.82% and 0.74%, re-
| Average Annual Total Returns |
| As of 6/30/19, the most recent calendar quarter end, including maximum applicable sales charges |
| Class A Shares | |
| Inception (5/1/97) | 3.98% |
| 10 Years | 5.48 |
| 5 Years | 2.60 |
| 1 Year | 0.59 |
| Class C Shares | |
| Inception (3/31/00) | 3.61% |
| 10 Years | 5.22 |
| 5 Years | 2.62 |
| 1 Year | 1.61 |
| Class R Shares | |
| Inception (4/13/06) | 3.39% |
| 10 Years | 5.44 |
| 5 Years | 2.85 |
| 1 Year | 2.86 |
| Class Y Shares | |
| Inception (10/3/08) | 5.35% |
| 10 Years | 6.00 |
| 5 Years | 3.39 |
| 1 Year | 3.37 |
| Class R5 Shares | |
| Inception (4/13/06) | 3.94% |
| 10 Years | 6.01 |
| 5 Years | 3.38 |
| 1 Year | 3.28 |
| Class R6 Shares | |
| 10 Years | 5.97% |
| 5 Years | 3.44 |
| 1 Year | 3.47 |
spectively.1 The total annual Fund operating expense ratio set forth in the most recent Fund prospectus as of the date of this report for Class A, Class C, Class R, Class Y, Class R5 and Class R6 shares was 1.09%, 1.59%, 1.34%, 0.84%, 0.83% and 0.75%, respectively. The expense ratios presented above may vary from the expense ratios presented in other sections of this report that are based on expenses incurred during the period covered by this report.
Class A share performance reflects the maximum 2.50% sales charge and Class C share performance reflects the applicable contingent deferred sales charge (CDSC) for the period involved. The CDSC on Class C shares is 1% for the first year after purchase. Class R, Class Y, Class R5 and Class R6 shares do not have a front-end sales charge or a CDSC; therefore, performance is at net asset value.
The performance of the Fund’s share classes will differ primarily due to dif-
ferent sales charge structures and class expenses.
Fund performance reflects any applicable fee waivers and/or expense reimbursements. Had the adviser not waived fees and/or reimbursed expenses currently or in the past, returns would have been lower. See current prospectus for more information.
| 1 | Total annual Fund operating expenses after any contractual fee waivers and/or expense reimbursements by the adviser in effect through at least June 30, 2021. See current prospectus for more information. |
| 7 | Invesco Floating Rate Fund |
Invesco Floating Rate Fund’s investment objective is total return, comprised of current income and capital appreciation.
| ■ | Unless otherwise stated, information presented in this report is as of August 31, 2019, and is based on total net assets. |
| ■ | Unless otherwise noted, all data provided by Invesco. |
| ■ | To access your Fund’s reports/prospectus, visit invesco.com/fundreports. |
About share classes
| ■ | As of the close of business on April 13, 2006, Invesco Floating Rate Fund reorganized from a Closed-End Fund to an Open-End Fund. Information presented for Class A shares prior to the reorganization includes financial data for Class B shares of the Closed-End Fund. Information presented for Class C shares prior to the reorganization includes financial data for Class C shares of the Closed-End Fund. |
| ■ | On July 27, 2006, all Class B1 shares converted into Class A shares. |
| ■ | Class R shares are generally available only to employer sponsored retirement and benefit plans. Please see the prospectus for more information. |
| ■ | Class Y sharesare available only to certain investors. Please see the prospectus for more information. |
| ■ | Class R5 sharesand Class R6shares are available for use by retirement plans that meet certain standards and for institutional investors. Class R6 shares are also available through intermediaries that have established an agreement with Invesco Distributors, Inc. to make such shares available for use in retail omnibus accounts. Please see the prospectus for more information. |
Principal risks of investing in the Fund
| ■ | Bank loan risk. There are a number of risks associated with an investment in bank loans including credit risk, interest rate risk, liquidity risk and prepayment risk. Lack of an active trading market, restrictions on resale, irregular trading activity, wide bid/ask spreads and extended trade settlement periods may impair the Fund’s ability to sell bank loans within its desired time frame or at an acceptable price and its ability to accurately value existing and prospective investments. Extended trade settlement periods may result in cash not being immedi- |
| | ately available to the Fund. As a result, the Fund may have to sell other investments or engage in borrowing transactions to raise cash to meet its obligations. The risk of holding bank loans is also directly tied to the risk of insolvency or bankruptcy of the issuing banks. These risks could cause the Fund to lose income or principal on a particular investment, which in turn could affect the Fund’s returns. The value of bank loans can be affected by and sensitive to changes in government regulation and to economic downturns in the United States and abroad. Bank loans generally are floating rate loans, which are subject to interest rate risk as the interest paid on the floating rate loans adjusts periodically based on changes in widely accepted reference rates. |
| ■ | Borrowing risk. Borrowing money to buy securities exposes the Fund to leverage and will cause the Fund’s share price to be more volatile because leverage will exaggerate the effect of any increase or decrease in the value of the Fund’s portfolio securities. Borrowing money may also require the Fund to liquidate positions when it may not be advantageous to do so. In addition, the Fund will incur interest expenses and other fees on borrowed money. There can be no assurance that the Fund’s borrowing strategy will enhance and not reduce the Fund’s returns. |
| ■ | Changing fixed income market conditions risk. The current low interest rate environment was created in part by the Federal Reserve Board (FRB) and certain foreign central banks keeping the federal funds and equivalent foreign rates near historical lows. Increases in the federal funds and equivalent foreign rates may expose fixed income markets to heightened volatility and reduced liquidity for certain fixed income investments, particularly those with longer maturities. In addition, decreases in fixed income |
| | dealer market-making capacity may also potentially lead to heightened volatility and reduced liquidity in the fixed income markets. As a result, the value of the Fund’s investments and share price may decline. Changes in central bank policies could also result in higher than normal shareholder redemptions, which could potentially increase portfolio turnover and the Fund’s transaction costs. |
| ■ | Collateralized loan obligations risk. CLOs are subject to the risks of substantial losses due to actual defaults by underlying borrowers, which will be greater during periods of economic or financial stress. CLOs may also lose value due to collateral defaults and disappearance of subordinate tranches, market anticipation of defaults, and investor aversion to CLO securities as a class. The risks of CLOs will be greater if the Fund invests in CLOs that hold loans of uncreditworthy borrowers or if the Fund holds subordinate tranches of the CLO that absorbs losses from the defaults before senior tranches. In addition, CLOs are subject to interest rate risk and credit risk. |
| ■ | Credit linked notes risk. Risks of credit linked notes include those risks associated with the underlying reference obligation including but not limited to market risk, interest rate risk, credit risk, default risk and, in some cases, foreign currency risk. An investor in a credit linked note bears counterparty risk or the risk that the issuer of the credit linked note will default or become bankrupt and not make timely payment of principal and interest of the structured security. Credit linked notes may be less liquid than other investments and therefore harder to dispose of at the desired time and price. In addition, credit linked notes may be leveraged and, as a result, |
This report must be accompanied or preceded by a currently effective Fund prospectus, which contains more complete information, including sales charges and expenses. Investors should read it carefully before investing.
NOT FDIC INSURED | MAY LOSE VALUE | NO BANK GUARANTEE
| 8 | Invesco Floating Rate Fund |
| | small changes in the value of the underlying reference obligation may produce disproportionate losses to the Fund. |
| ■ | Debt securities risk. The prices of debt securities held by the Fund will be affected by changes in interest rates, the creditworthiness of the issuer and other factors. An increase in prevailing interest rates typically causes the value of existing debt securities to fall and often has a greater impact on longer-duration debt securities and higher quality debt securities. Falling interest rates will cause the Fund to reinvest the proceeds of debt securities that have been repaid by the issuer at lower interest rates. Falling interest rates may also reduce the Fund’s distributable income because interest payments on floating rate debt instruments held by the Fund will decline. The Fund could lose money on investments in debt securities if the issuer or borrower fails to meet its obligations to make interest payments and/or to repay principal in a timely manner. Changes in an issuer’s financial strength, the market’s perception of such strength or in the credit rating of the issuer or the security may affect the value of debt securities. The Adviser’s credit analysis may fail to anticipate such changes, which could result in buying a debt security at an inopportune time or failing to sell a debt security in advance of a price decline or other credit event. |
| ■ | Defaulted securities risk. Defaulted securities pose a greater risk that principal will not be repaid than non-defaulted securities. Defaulted securities and any securities received in an exchange for such securities may be subject to restrictions on resale. |
| ■ | Derivatives risk. The value of a derivative instrument depends largely on (and is derived from) the value of an underlying security, currency, commodity, interest rate, index or other asset (each referred to as an underlying asset). In addition to risks relating to the underlying assets, the use of derivatives may include other, possibly greater, risks, including counterparty, leverage and liquidity risks. Counterparty risk is the risk that the counterparty to the derivative contract will default on its obligation to pay the Fund the amount owed or otherwise perform under the derivative contract. Derivatives create leverage risk because they do not require payment up front equal to the eco- |
| | nomic exposure created by holding a position in the derivative. As a result, an adverse change in the value of the underlying asset could result in the Fund sustaining a loss that is substantially greater than the amount invested in the derivative or the anticipated value of the underlying asset, which may make the Fund’s returns more volatile and increase the risk of loss. Derivative instruments may also be less liquid than more traditional investments and the Fund may be unable to sell or close out its derivative positions at a desirable time or price. This risk may be more acute under adverse market conditions, during which the Fund may be most in need of liquidating its derivative positions. Derivatives may also be harder to value, less tax efficient and subject to changing government regulation that could impact the Fund’s ability to use certain derivatives or their cost. Derivatives strategies may not always be successful. For example, derivatives used for hedging or to gain or limit exposure to a particular market segment may not provide the expected benefits, particularly during adverse market conditions. |
| ■ | Financial services sector risk. The Fund may be susceptible to adverse economic or regulatory occurrences affecting the financial services sector. Financial services companies are subject to extensive government regulation and are disproportionately affected by unstable interest rates, each of which could adversely affect the profitability of such companies. Financial services companies may also have concentrated portfolios, which makes them especially vulnerable to unstable economic conditions. |
| ■ | Foreign securities risk. The Fund’s foreign investments may be adversely affected by political and social instability, changes in economic or taxation policies, difficulty in enforcing obligations, decreased liquidity or increased volatility. Foreign investments also involve the risk of the possible seizure, nationalization or expropriation of the issuer or foreign deposits (in which the Fund could lose its entire investments in a certain market) and the possible adoption of foreign governmental restrictions such as exchange controls. Unless the Fund has hedged its foreign securities risk, foreign securities risk also involves the risk of negative foreign currency rate fluctuations, which may cause the |
| | value of securities denominated in such foreign currency (or other instruments through which the Fund has exposure to foreign currencies) to decline in value. Currency exchange rates may fluctuate significantly over short periods of time. Currency hedging strategies, if used, are not always successful. |
| ■ | High yield debt securities (junk bond) risk. Investments in high yield debt securities (“junk bonds”) and other lower-rated securities will subject the Fund to substantial risk of loss. These securities are considered to be speculative with respect to the issuer’s ability to pay interest and principal when due, are more susceptible to default or decline in market value and are less liquid than investment grade debt securities. Prices of high yield debt securities tend to be very volatile. |
| ■ | Liquidity risk. The Fund may be unable to sell illiquid investments at the time or price it desires and, as a result, could lose its entire investment in such investments. Liquid securities can become illiquid during periods of market stress. If a significant amount of the Fund’s securities become illiquid, the Fund may not be able to timely pay redemption proceeds and may need to sell securities at significantly reduced prices. |
| ■ | Management risk. The Fund is actively managed and depends heavily on the Adviser’s judgment about markets, interest rates or the attractiveness, relative values, liquidity, or potential appreciation of particular investments made for the Fund’s portfolio. The Fund could experience losses if these judgments prove to be incorrect. Additionally, legislative, regulatory, or tax developments may adversely affect management of the Fund and, therefore, the ability of the Fund to achieve its investment objective. |
| ■ | Market risk. The market values of the Fund’s investments, and therefore the value of the Fund’s shares, will go up and down, sometimes rapidly or unpredictably. Market risk may affect a single issuer, industry or section of the economy, or it may affect the market as a whole. Individual stock prices tend to go up and down more dramatically than those of certain other types of investments, such as bonds. During a general downturn in the financial markets, multiple asset classes may decline in value. When |
| 9 | Invesco Floating Rate Fund |
| | markets perform well, there can be no assurance that specific investments held by the Fund will rise in value. |
| ■ | Risk of subordinated debt. Perpetual subordinated debt is a type of hybrid instrument that has no maturity date for the return of principal and does not need to be redeemed by the issuer. These investments typically have lower credit ratings and lower priority than other obligations of an issuer during bankruptcy, presenting a greater risk for nonpayment. This risk increases as the priority of the obligation becomes lower. Payments on these securities may be subordinated to all existing and future liabilities and obligations of subsidiaries and associated companies of an issuer. Additionally, some perpetual subordinated debt does not restrict the ability of an issuer’s subsidiaries to incur further unsecured indebtedness. |
About indexes used in this report
| ■ | TheBloomberg Barclays U.S. Aggregate Bond Indexis an unmanaged index considered representative of the US investment grade, fixed-rate bond market. |
| ■ | TheCredit Suisse Leveraged Loan Indexrepresents tradable, senior-secured, US dollar denominated, non-investment grade loans. |
| ■ | TheLipper Loan Participation Funds Classification Average represents an average of all of the funds in the Lipper Loan Participation Funds classification. |
| ■ | The Fund is not managed to track the performance of any particular index, including the index(es) described here, and consequently, the performance of the Fund may deviate significantly from the performance of the index(es). |
| ■ | A direct investment cannot be made in an index. Unless otherwise indicated, index results include reinvested dividends, and they do not reflect sales charges. Performance of the peer group, if applicable, reflects fund expenses; performance of a market index does not. |
Other information
| ■ | The returns shown in management’s discussion of Fund performance are based on net asset values (NAVs) calculated for shareholder transactions. Generally accepted accounting principles require adjustments to be made to the net assets of the Fund at period end for financial reporting purposes, |
| | and as such, the NAVs for shareholder transactions and the returns based on those NAVs may differ from the NAVs and returns reported in the Financial Highlights. |
| ■ | Industry classifications used in this report are generally according to the Global Industry Classification Standard, which was developed by and is the exclusive property and a service mark of MSCI Inc. and Standard & Poor’s. |
| 10 | Invesco Floating Rate Fund |
Schedule of Investments
August 31, 2019
| | Interest
Rate | Maturity
Date | Principal
Amount
(000)(a) | Value |
| Variable Rate Senior Loan Interests–85.27%(b)(c) | |
| Aerospace & Defense–2.54% | | | |
| Atlantic Aviation FBO, Inc., Term Loan (1 mo. USD LIBOR + 3.75%)(d) | 5.87% | 12/06/2025 | | | $ 165 | $ 166,153 |
Consolidated Aerospace Manufacturing, LLC, Term Loan (1 mo. USD LIBOR + 3.75%)
(Acquired 08/11/2015-05/10/2019; Cost $1,801,684)(d) | 5.86% | 08/11/2022 | | | 1,846 | 1,843,242 |
| Greenrock Finance, Inc., Term Loan B (3 mo. USD LIBOR + 3.50%) | 6.15% | 06/28/2024 | | | 2,540 | 2,544,501 |
| IAP Worldwide Services, Inc. | | | | | | |
Revolver Loan
(Acquired 07/22/2014-05/10/2019; Cost $929,279)(d)(e) | 0.00% | 07/18/2021 | | | 929 | 929,279 |
Second Lien Term Loan (3 mo. USD LIBOR + 6.50%)
(Acquired 08/18/2014-05/10/2019; Cost $960,040)(d) | 8.83% | 07/18/2021 | | | 1,058 | 1,058,330 |
| Leidos Innovations Corp., Term Loan B (1 mo. USD LIBOR + 1.75%) | 3.88% | 08/22/2025 | | | 33 | 32,906 |
| Maxar Technologies Ltd. (Canada), Term Loan B (1 mo. USD LIBOR + 2.75%) | 4.87% | 10/04/2024 | | | 8,967 | 7,883,355 |
| Peraton Corp., Term Loan (1 mo. USD LIBOR + 5.25%)(d) | 7.37% | 04/29/2024 | | | 2,025 | 2,007,296 |
| Perspecta, Inc., Term Loan B (1 mo. USD LIBOR + 2.25%) | 4.36% | 05/31/2025 | | | 2,088 | 2,093,111 |
Space Exploration Technologies Corp., Term Loan (1 mo. USD LIBOR + 4.25%)
(Acquired 11/20/2018-06/06/2019; Cost $6,076,319)(d) | 6.36% | 11/21/2025 | | | 6,108 | 6,122,892 |
| TransDigm, Inc. | | | | | | |
| Term Loan E (3 mo. USD LIBOR + 2.50%) | 4.83% | 05/30/2025 | | | 16,392 | 16,254,759 |
| Term Loan F (3 mo. USD LIBOR + 2.50%) | 4.83% | 06/09/2023 | | | 4,267 | 4,244,405 |
| Term Loan G (3 mo. USD LIBOR + 2.50%) | 4.83% | 08/22/2024 | | | 2,012 | 1,996,015 |
| Vectra Co., First Lien Term Loan (1 mo. USD LIBOR + 3.25%) | 5.36% | 03/08/2025 | | | 1,648 | 1,590,435 |
| Wesco Aircraft Hardware Corp., Term Loan B (1 mo. USD LIBOR + 2.50%) | 4.62% | 02/28/2021 | | | 3,718 | 3,721,017 |
Xebec Global Holdings, LLC, Term Loan (1 wk. USD LIBOR + 5.25%)
(Acquired 02/12/2018-05/10/2019; Cost $2,519,753)(d) | 7.93% | 02/12/2024 | | | 2,532 | 2,544,928 |
| | | | | | | 55,032,624 |
| Air Transport–1.16% | | | |
| American Airlines, Inc. | | | | | | |
| Term Loan (1 mo. USD LIBOR + 1.75%) | 4.06% | 06/27/2025 | | | 93 | 91,721 |
| Term Loan B (1 mo. USD LIBOR + 2.00%) | 4.20% | 12/14/2023 | | | 220 | 219,164 |
| Avolon TLB Borrower 1 (US) LLC (Ireland), Term Loan B-3 (1 mo. USD LIBOR + 1.75%) | 3.92% | 01/15/2025 | | | 7,027 | 7,050,337 |
| Etraveli Group Holding AB (Sweden), Term Loan B-1 (3 mo. EURIBOR + 4.25%) | 4.25% | 08/02/2024 | EUR | | 1,121 | 1,239,775 |
| Gol LuxCo S.A. (Brazil), Term Loan (6 mo. USD LIBOR + 6.50%) | 6.50% | 08/31/2020 | | | 7,224 | 7,332,573 |
| United Airlines, Inc., Term Loan B (1 mo. USD LIBOR + 1.75%) | 3.86% | 04/01/2024 | | | 279 | 279,565 |
| WestJet Airlines Ltd. (Canada), Term Loan B(f) | — | 08/07/2026 | | | 9,014 | 9,048,804 |
| | | | | | | 25,261,939 |
| Automotive–1.84% | | | |
| Allison Transmission, Inc., Term Loan (1 mo. USD LIBOR + 2.00%) | 4.17% | 03/29/2026 | | | 82 | 83,118 |
| American Axle & Manufacturing, Inc., Term Loan B (1 mo. USD LIBOR + 2.25%) | 4.43% | 04/06/2024 | | | 2,068 | 2,031,702 |
| Dayco Products, LLC, Term Loan (3 mo. USD LIBOR + 4.25%) | 6.38% | 05/19/2023 | | | 2,201 | 2,074,156 |
| Garrett Borrowing LLC (Switzerland) | | | | | | |
| Term Loan B (3 mo. EURIBOR + 2.75%) | 2.75% | 09/27/2025 | EUR | | 374 | 408,128 |
| Term Loan B (3 mo. USD LIBOR + 2.50%) | 4.82% | 09/27/2025 | | | 1,433 | 1,421,414 |
| IAA Spinco Inc., Term Loan | 0.00% | 06/29/2026 | | | 2,323 | 2,337,867 |
| Mavis Tire Express Services Corp. | | | | | | |
| Delayed Draw Term Loan(e) | 3.53% | 03/20/2025 | | | 103 | 100,810 |
| Term Loan (1 mo. USD LIBOR + 3.25%) | 5.36% | 03/20/2025 | | | 808 | 794,089 |
| Navistar, Inc., Term Loan B (1 mo. USD LIBOR + 3.50%) | 5.70% | 11/06/2024 | | | 241 | 240,801 |
| Panther BF Aggregator 2 L.P. (Canada) | | | | | | |
| Term Loan (1 mo. EURIBOR + 3.75%) | 3.75% | 04/30/2026 | EUR | | 2,127 | 2,343,184 |
| Term Loan B (1 mo. USD LIBOR + 3.50%) | 5.61% | 04/30/2026 | | | 5,063 | 4,999,913 |
See accompanying Notes to Financial Statements which are an integral part of the financial statements.
| 11 | Invesco Floating Rate Fund |
| | Interest
Rate | Maturity
Date | Principal
Amount
(000)(a) | Value |
| Automotive–(continued) | |
| Superior Industries International, Inc., Term Loan (1 mo. USD LIBOR + 4.00%) | 6.11% | 05/22/2024 | | $ 3,026 | $ 2,912,793 |
| Tenneco, Inc., Term Loan B (1 mo. USD LIBOR + 3.00%) | 5.11% | 10/01/2025 | | 8,501 | 7,943,537 |
| ThermaSys Corp. | | | | | |
Term Loan (3 mo. USD LIBOR + 6.00%)
(Acquired 12/31/2018; Cost $332,456)(d) | 8.33% | 10/02/2023 | | 332 | 302,535 |
| Term Loan (3 mo. USD LIBOR + 6.00%) | 8.33% | 01/01/2024 | | 1,818 | 1,651,607 |
| TI Group Automotive Systems, L.L.C. (United Kingdom), Term Loan (1 mo. USD LIBOR + 2.50%) | 4.61% | 06/30/2022 | | 305 | 303,084 |
| Tower Automotive Holdings USA, LLC, Term Loan (1 mo. USD LIBOR + 2.75%) | 5.00% | 03/07/2024 | | 3,451 | 3,457,329 |
| Transtar Holding Co. | | | | | |
Delayed Draw Term Loan
(Acquired 07/06/2017; Cost $243,131)(d)(e) | 0.00% | 04/11/2022 | | 243 | 242,525 |
First Lien Term Loan (2 mo. USD LIBOR + 4.25%)
(Acquired 03/19/2013-06/13/2016; Cost $2,278,732)(d) | 6.43% | 04/11/2022 | | 2,289 | 2,271,809 |
PIK Term Loan, 7.75% PIK Rate, 1.00% Cash Rate
(Acquired 04/11/2017-04/11/2019; Cost $762,580)(d)(g) | 7.75% | 04/11/2022 | | 809 | 808,592 |
| Visteon Corp., Term Loan (1 mo. USD LIBOR + 1.75%) | 3.86% | 03/25/2024 | | 263 | 257,184 |
| Wand NewCo 3, Inc., Term Loan (1 mo. USD LIBOR + 3.50%) | 5.71% | 02/05/2026 | | 641 | 644,372 |
| Winter Park Intermediate, Inc., Term Loan (1 mo. USD LIBOR + 4.75%) | 6.86% | 04/04/2025 | | 2,266 | 2,249,343 |
| | | | | | 39,879,892 |
| Beverage & Tobacco–0.38% | | | |
| AI Aqua Merger Sub, Inc. | | | | | |
| First Lien Incremental Term Loan (1 mo. USD LIBOR + 3.25%) | 5.36% | 12/13/2023 | | 2,160 | 2,063,930 |
| First Lien Term Loan B-1 (1 mo. USD LIBOR + 3.25%) | 5.36% | 12/13/2023 | | 5,494 | 5,264,224 |
| Incremental Term Loan (1 mo. USD LIBOR + 4.25%) | 6.36% | 12/13/2023 | | 713 | 698,886 |
| Arterra Wines Canada, Inc. (Canada), First Lien Term Loan B-1 (3 mo. USD LIBOR + 2.75%) | 5.17% | 12/15/2023 | | 128 | 127,897 |
| | | | | | 8,154,937 |
| Building & Development–1.68% | | | |
| American Builders & Contractors Supply Co., Inc., Term Loan B-2 (1 mo. USD LIBOR + 2.00%) | 4.11% | 10/31/2023 | | 6,605 | 6,557,014 |
| Beacon Roofing Supply, Inc., Term Loan B (1 mo. USD LIBOR + 2.25%) | 4.36% | 01/02/2025 | | 33 | 32,942 |
| Capital Automotive L.P. | | | | | |
| Second Lien Term Loan B (1 mo. USD LIBOR + 6.00%) | 8.12% | 03/24/2025 | | 2,600 | 2,616,567 |
| Term Loan (1 mo. USD LIBOR + 2.50%) | 4.62% | 03/25/2024 | | 745 | 744,969 |
| DiversiTech Holdings, Inc. | | | | | |
| Second Lien Term Loan (3 mo. USD LIBOR + 7.50%) | 9.83% | 06/02/2025 | | 146 | 143,018 |
| Term Loan B-1 (3 mo. USD LIBOR + 3.00%) | 5.33% | 06/03/2024 | | 1,928 | 1,884,997 |
| Financiere Persea (Proxiserve) (France), Term Loan B (6 mo. EURIBOR + 3.75%) | 3.75% | 03/26/2026 | EUR | 473 | 522,437 |
| Forterra Finance, LLC, Second Lien Term Loan (1 mo. USD LIBOR + 3.00%) | 5.11% | 10/25/2023 | | 2,890 | 2,709,361 |
| HD Supply Waterworks, Ltd., Term Loan (2 mo. USD LIBOR + 2.75%) | 5.24% | 08/01/2024 | | 259 | 259,367 |
| HD Supply, Inc., Term Loan B-5 (1 mo. USD LIBOR + 1.75%) | 3.86% | 10/17/2023 | | 340 | 341,281 |
| LSF10 Wolverine Investments S.C.A. (Luxembourg), Term Loan B(f) | — | 07/04/2024 | EUR | 989 | 1,083,576 |
| Quimper AB (Sweden) | | | | | |
| First Lien Term Loan B-1 (2 mo. EURIBOR + 4.25%) | 4.25% | 02/15/2026 | EUR | 2,071 | 2,291,151 |
| First Lien Term Loan B-2 (2 mo. EURIBOR + 4.25%) | 4.25% | 02/15/2026 | EUR | 100 | 110,935 |
Second Lien Term Loan (6 mo. EURIBOR + 8.25%)
(Acquired 03/01/2019-03/07/2019; Cost $955,523)(d) | 8.25% | 02/13/2027 | EUR | 857 | 949,265 |
| Re/Max, LLC, Term Loan (1 mo. USD LIBOR + 2.75%) | 4.86% | 12/15/2023 | | 4,769 | 4,715,389 |
| Realogy Group LLC, Term Loan (1 mo. USD LIBOR + 2.25%) | 4.42% | 02/08/2025 | | 7,714 | 7,469,420 |
| SRS Distribution, Inc., Term Loan (1 mo. USD LIBOR + 3.25%) | 5.37% | 05/23/2025 | | 1 | 539 |
| TAMKO Building Products, LLC, Term Loan (3 mo. USD LIBOR + 3.25%) | 5.55% | 05/29/2026 | | 789 | 790,817 |
See accompanying Notes to Financial Statements which are an integral part of the financial statements.
| 12 | Invesco Floating Rate Fund |
| | Interest
Rate | Maturity
Date | Principal
Amount
(000)(a) | Value |
| Building & Development–(continued) |
| Werner FinCo L.P., Term Loan (3 mo. USD LIBOR + 4.00%) | 6.33% | 07/24/2024 | | $ 3,291 | $ 3,216,858 |
| | | | | | 36,439,903 |
| Business Equipment & Services–8.44% | | |
| Allied Universal Holdco LLC | | | | | |
| Delayed Draw Term Loan(e) | 0.00% | 06/27/2026 | | 338 | 338,353 |
| Term Loan B (2 mo. USD LIBOR + 4.25%) | 6.51% | 06/30/2026 | | 3,416 | 3,417,367 |
| Alorica, Inc., Term Loan B (1 mo. USD LIBOR + 3.75%) | 5.86% | 06/30/2022 | | 929 | 870,516 |
| Altran Technologies (France), Term Loan B (3 mo. USD LIBOR + 2.50%) | 4.89% | 03/20/2025 | | 991 | 993,016 |
| Ashland LLC, Term Loan B (1 mo. USD LIBOR + 1.75%) | 6.00% | 05/17/2024 | | 605 | 604,320 |
| Asurion LLC | | | | | |
| Second Lien Term Loan B-2 (1 mo. USD LIBOR + 6.50%) | 8.61% | 08/04/2025 | | 12,490 | 12,695,380 |
| Term Loan B-4 (1 mo. USD LIBOR + 3.00%) | 5.11% | 08/04/2022 | | 39 | 39,369 |
| Term Loan B-6 (1 mo. USD LIBOR + 3.00%) | 5.11% | 11/03/2023 | | 16,659 | 16,686,705 |
| Term Loan B-7 (1 mo. USD LIBOR + 3.00%) | 5.11% | 11/03/2024 | | 89 | 89,181 |
| AVS Group GmbH (Germany), Term Loan B(f) | — | 07/17/2026 | EUR | 518 | 573,802 |
| Blackhawk Network Holdings, Inc. | | | | | |
| First Lien Term Loan (1 mo. USD LIBOR + 3.00%) | 5.11% | 06/15/2025 | | 64 | 63,214 |
| Second Lien Term Loan (1 mo. USD LIBOR + 7.00%) | 9.25% | 06/15/2026 | | 1,189 | 1,192,013 |
| Blucora, Inc., Term Loan (2 mo. USD LIBOR + 3.00%) | 5.26% | 05/22/2024 | | 2,615 | 2,622,395 |
| Brand Energy & Infrastructure Services, Inc., Term Loan (3 mo. USD LIBOR + 4.25%) | 6.52% | 06/21/2024 | | 2,909 | 2,768,721 |
| Brightview Landscapes, LLC, Term Loan (1 mo. USD LIBOR + 2.50%) | 4.66% | 08/15/2025 | | 2,660 | 2,664,905 |
| Camelia Bidco Ltd. (United Kingdom), Term Loan B-1 (3 mo. GBP LIBOR + 4.75%) | 5.53% | 10/14/2024 | GBP | 3,136 | 3,739,117 |
| Cast & Crew Payroll, LLC, First Lien Term Loan (1 mo. USD LIBOR + 4.00%) | 6.12% | 02/09/2026 | | 217 | 217,993 |
| Change Healthcare Holdings, Inc., Term Loan (1 mo. USD LIBOR + 2.50%) | 4.61% | 03/01/2024 | | 778 | 771,147 |
| Checkout Holding Corp. | | | | | |
| PIK Term Loan, 9.50% PIK Rate, 3.18% Cash Rate(g) | 9.50% | 08/15/2023 | | 968 | 460,021 |
| Term Loan (1 mo. USD LIBOR + 7.50%) | 9.69% | 02/15/2023 | | 763 | 633,117 |
| CRCI Longhorn Holdings, Inc., Second Lien Term Loan (1 mo. USD LIBOR + 7.25%)(d) | 9.46% | 08/08/2026 | | 234 | 232,062 |
| Crossmark Holdings, Inc., Exit Term Loan (1 mo. USD LIBOR + 10.00%) | 12.15% | 07/26/2023 | | 862 | 870,273 |
| Dream Secured Bondco AB (Sweden), Term Loan B1F (3 mo. EURIBOR + 3.50%) | 3.50% | 10/21/2022 | EUR | 849 | 938,266 |
| Dun & Bradstreet Corp. (The), Term Loan (1 mo. USD LIBOR + 3.75%) | 7.15% | 02/06/2026 | | 4,535 | 4,552,691 |
| FleetCor Technologies Operating Co., LLC, Term Loan B-3 (1 mo. USD LIBOR + 2.00%) | 4.11% | 08/02/2024 | | 42 | 41,682 |
Gartner, Inc., Term Loan A (1 mo. USD LIBOR + 1.50%)
(Acquired 03/21/2017; Cost $417,660)(d) | 3.61% | 03/21/2022 | | 418 | 419,855 |
| Genesys Telecom Holdings, U.S., Inc., Term Loan B-3 (1 mo. USD LIBOR + 3.25%) | 5.36% | 12/01/2023 | | 36 | 35,986 |
| GI Revelation Acquisition LLC | | | | | |
| First Lien Term Loan (1 mo. USD LIBOR + 5.00%) | 7.11% | 04/16/2025 | | 2,463 | 2,413,793 |
| Second Lien Term Loan (1 mo. USD LIBOR + 9.00%) | 11.11% | 04/16/2026 | | 1,148 | 1,098,577 |
| Global Payments, Inc. | | | | | |
| Term Loan B-3 (1 mo. USD LIBOR + 1.75%) | 3.86% | 04/21/2023 | | 620 | 620,416 |
| Term Loan B-4 (1 mo. USD LIBOR + 1.75%) | 3.86% | 10/17/2025 | | 4,608 | 4,609,780 |
| GlobalLogic Holdings, Inc., Term Loan (1 mo. USD LIBOR + 3.25%) | 5.36% | 08/01/2025 | | 46 | 46,219 |
| Holding Socotec (France), Term Loan B-4(f) | — | 07/27/2024 | EUR | 1,072 | 1,181,756 |
| I-Logic Technologies Bidco Ltd. (United Kingdom) | | | | | |
| Term Loan (3 mo. USD LIBOR + 3.00%) | 5.65% | 12/20/2024 | | 42 | 41,064 |
| Term Loan (3 mo. EURIBOR + 3.00%) | 4.00% | 12/21/2024 | EUR | 476 | 526,425 |
| INDIGOCYAN Midco Ltd. (Jersey), Term Loan B (3 mo. GBP LIBOR + 4.75%)(d) | 5.51% | 06/23/2024 | GBP | 1,337 | 1,626,448 |
| Institutional Shareholder Services, Inc. | | | | | |
| First Lien Term Loan (3 mo. USD LIBOR + 4.50%)(d) | 6.83% | 03/05/2026 | | 2,867 | 2,838,057 |
Second Lien Term Loan (3 mo. USD LIBOR + 8.50%)
(Acquired 03/04/2019; Cost $1,887,855)(d) | 10.83% | 03/05/2027 | | 1,946 | 1,941,377 |
| ION Trading Technologies S.a.r.l. (Ireland), Term Loan (6 mo. USD LIBOR + 4.00%) | 6.65% | 11/21/2024 | | 1,898 | 1,830,434 |
See accompanying Notes to Financial Statements which are an integral part of the financial statements.
| 13 | Invesco Floating Rate Fund |
| | Interest
Rate | Maturity
Date | Principal
Amount
(000)(a) | Value |
| Business Equipment & Services–(continued) |
| Iron Mountain, Inc., Term Loan B (1 mo. USD LIBOR + 1.75%) | 3.86% | 01/02/2026 | | $ 3,419 | $ 3,384,684 |
| KAR Auction Services, Inc., Term Loan B-5 (3 mo. USD LIBOR + 2.50%) | 4.88% | 03/09/2023 | | 1,884 | 1,885,728 |
| Karman Buyer Corp. | | | | | |
| First Lien Term Loan (3 mo. USD LIBOR + 3.25%) | 5.58% | 07/23/2021 | | 10,111 | 9,473,115 |
| First Lien Term Loan B-2 (3 mo. USD LIBOR + 3.25%) | 5.58% | 07/23/2021 | | 406 | 376,095 |
| KBR, Inc., Term Loan B (1 mo. USD LIBOR + 3.75%) | 5.86% | 04/25/2025 | | 5,637 | 5,672,397 |
| Learning Care Group (US) No. 2, Inc., First Lien Term Loan (3 mo. USD LIBOR + 3.25%) | 5.48% | 03/13/2025 | | 2 | 2,288 |
| LegalZoom.com, Inc., First Lien Term Loan (1 mo. USD LIBOR + 4.50%) | 6.61% | 11/21/2024 | | 151 | 151,765 |
| Monitronics International, Inc. | | | | | |
DIP Loan (1 mo. USD LIBOR + 5.00%)
(Acquired 06/27/2019; Cost $4,171,562)(d)(e) | 6.06% | 07/03/2020 | | 4,172 | 4,171,562 |
| Term Loan (1 mo. USD LIBOR + 5.00%) | 7.11% | 07/01/2024 | | 4,883 | 4,883,312 |
| Term Loan B-2 (1 mo. USD LIBOR + 4.50%) | 8.61% | 09/30/2022 | | 8,277 | 7,814,108 |
| On Assignment, Inc., Term Loan B (1 mo. USD LIBOR + 2.00%) | 4.11% | 04/02/2025 | | 1,508 | 1,513,193 |
| Outfront Media Capital LLC, Term Loan (1 mo. USD LIBOR + 2.00%) | 4.22% | 03/18/2024 | | 70 | 69,949 |
| Prime Security Services Borrower, LLC, Incremental Term Loan B-1 (1 mo. USD LIBOR + 2.75%) | 4.86% | 05/02/2022 | | 411 | 410,738 |
| Prometric Holdings, Inc., Term Loan (1 mo. USD LIBOR + 3.00%) | 5.12% | 01/29/2025 | | 129 | 126,327 |
| Refinitiv US Holdings, Inc., First Lien Term Loan B (1 mo. USD LIBOR + 3.75%) | 5.86% | 10/01/2025 | | 12,301 | 12,374,867 |
| Sector Alarm Holding A.S. (Norway), Term Loan B (3 mo. EURIBOR + 3.50%) | 3.50% | 06/04/2026 | EUR | 946 | 1,047,861 |
| ServiceMaster Co. (The), Term Loan C (1 mo. USD LIBOR + 2.50%) | 4.61% | 11/08/2023 | | 328 | 329,124 |
| ServPro Borrower, LLC, First Lien Term Loan (1 mo. USD LIBOR + 3.50%) | 5.61% | 03/26/2026 | | 479 | 478,968 |
| SMS Systems Maintenance Services, Inc., First Lien Term Loan (1 mo. USD LIBOR + 5.00%) | 7.11% | 10/30/2023 | | 4,112 | 3,381,786 |
| Spin Holdco, Inc., First Lien Term Loan B-1 (3 mo. USD LIBOR + 3.25%) | 5.58% | 11/14/2022 | | 16,506 | 16,171,709 |
| Techem Verwaltungsgesellschaft Gmbh (Germany), Term Loan B-3 (3 mo. EURIBOR + 3.50%) | 3.50% | 07/31/2025 | EUR | 585 | 647,846 |
| Tempo Acquisition LLC, Term Loan (1 mo. USD LIBOR + 3.00%) | 5.11% | 05/01/2024 | | 2 | 1,948 |
| TNS, Inc., First Lien Term Loan (3 mo. USD LIBOR + 4.00%) | 6.26% | 02/14/2020 | | 465 | 459,662 |
| Trans Union LLC | | | | | |
| Incremental Term Loan B-4 (1 mo. USD LIBOR + 2.00%) | 4.11% | 06/19/2025 | | 130 | 130,041 |
| Term Loan B-3 (1 mo. USD LIBOR + 2.00%) | 4.11% | 04/09/2023 | | 863 | 865,520 |
| Travelport Finance (Luxembourg) S.a.r.l. (Luxembourg), Term Loan (1 mo. USD LIBOR + 5.00%) | 7.54% | 03/20/2026 | | 2,219 | 2,049,301 |
| Ventia Deco LLC (Australia), Term Loan B (3 mo. USD LIBOR + 3.50%)(d) | 5.85% | 06/25/2026 | | 3,290 | 3,294,506 |
| Wash MultiFamily Acquisition, Inc. | | | | | |
| First Lien Term Loan (1 mo. USD LIBOR + 3.25%) | 5.36% | 05/16/2022 | | 5,510 | 5,427,133 |
| First Lien Term Loan (1 mo. USD LIBOR + 3.25%) | 5.36% | 05/16/2022 | | 908 | 894,145 |
| Second Lien Term Loan (1 mo. USD LIBOR + 7.00%) | 9.11% | 05/12/2023 | | 222 | 216,875 |
| Second Lien Term Loan (1 mo. USD LIBOR + 7.00%) | 9.11% | 05/14/2023 | | 39 | 37,985 |
| West Corp. | | | | | |
| Term Loan B (1 mo. USD LIBOR + 4.00%) | 6.11% | 10/10/2024 | | 6,384 | 5,735,268 |
| Term Loan B-1 (1 mo. USD LIBOR + 3.50%) | 5.61% | 10/10/2024 | | 2,948 | 2,629,549 |
| WEX, Inc., Term Loan B-3 (1 mo. USD LIBOR + 2.25%) | 4.36% | 05/17/2026 | | 6,630 | 6,657,441 |
| WowMidco SAS (France) | | | | | |
| Term Loan B(f) | — | 08/02/2026 | EUR | 1,872 | 2,066,240 |
| Term Loan B(f) | — | 08/08/2026 | GBP | 704 | 857,260 |
| | | | | | 182,996,109 |
See accompanying Notes to Financial Statements which are an integral part of the financial statements.
| 14 | Invesco Floating Rate Fund |
| | Interest
Rate | Maturity
Date | Principal
Amount
(000)(a) | Value |
| Cable & Satellite Television–4.77% | | |
| Altice Financing S.A. (France) | | | | | |
| Incremental Term Loan B-13 (1 mo. USD LIBOR + 4.00%) | 6.20% | 08/14/2026 | | $6,189 | $6,148,385 |
| Term Loan (1 mo. USD LIBOR + 2.75%) | 4.94% | 07/15/2025 | | 1,227 | 1,192,697 |
| Term Loan (1 mo. USD LIBOR + 2.75%) | 4.95% | 01/31/2026 | | 2,458 | 2,381,717 |
| Term Loan B-12 (1 mo. USD LIBOR + 3.69%) | 5.88% | 01/31/2026 | | 13,837 | 13,625,760 |
| Atlantic Broadband Finance, LLC, Term Loan B (1 mo. USD LIBOR + 2.25%) | 4.36% | 01/03/2025 | | 8,852 | 8,829,599 |
| Cable One, Inc., Term Loan B-1 (1 mo. USD LIBOR + 1.75%)(d) | 3.87% | 05/01/2024 | | 343 | 344,286 |
| Charter Communications Operating, LLC, Term Loan B (3 mo. USD LIBOR + 2.00%) | 4.33% | 04/30/2025 | | 891 | 893,786 |
| CSC Holdings, LLC | | | | | |
| Incremental Term Loan (1 mo. USD LIBOR + 2.25%) | 4.45% | 01/15/2026 | | 6,832 | 6,812,305 |
| Term Loan (1 mo. USD LIBOR + 2.25%) | 4.45% | 07/17/2025 | | 17,084 | 17,040,855 |
| Term Loan (1 mo. USD LIBOR + 2.50%) | 4.70% | 01/25/2026 | | 3,753 | 3,757,537 |
| Ion Media Networks, Inc., Term Loan B-4 (1 mo. USD LIBOR + 3.00%) | 5.12% | 12/18/2024 | | 5,334 | 5,333,021 |
| MCC Iowa LLC, Term Loan M (1 wk. USD LIBOR + 2.00%) | 4.14% | 01/15/2025 | | 64 | 64,433 |
| Mediacom Illinois LLC, Term Loan N (1 wk. USD LIBOR + 1.75%) | 3.89% | 02/15/2024 | | 2,510 | 2,513,523 |
| Telenet Financing USD LLC (Belgium), Term Loan AN (1 mo. USD LIBOR + 2.25%) | 4.45% | 08/15/2026 | | 8,285 | 8,275,648 |
| Virgin Media Bristol LLC, Term Loan K (1 mo. USD LIBOR + 2.50%) | 4.69% | 01/15/2026 | | 15,603 | 15,619,497 |
| Ziggo Secured Finance Partnership (Netherlands) | | | | | |
| Term Loan E (1 mo. USD LIBOR + 2.50%) | 4.69% | 04/15/2025 | | 10,407 | 10,350,818 |
| Term Loan F (6 mo. EURIBOR + 3.00%) | 3.00% | 04/15/2025 | EUR | 281 | 310,068 |
| | | | | | 103,493,935 |
| Chemicals & Plastics–3.23% | | |
| Alpha US Bidco, Inc. (United Kingdom), Term Loan B-1 (3 mo. USD LIBOR + 3.00%) | 5.33% | 01/31/2024 | | 1,075 | 1,047,150 |
| Ascend Performance Materials Operations LLC, Term Loan B(h) | 0.00% | 08/15/2026 | | 7,481 | 7,499,394 |
| Avantor, Inc., Term Loan B-1 (1 mo. USD LIBOR + 3.00%) | 5.11% | 11/21/2024 | | 72 | 72,855 |
| Axalta Coating Systems US Holdings, Inc., Term Loan B-3 (3 mo. USD LIBOR + 1.75%) | 4.08% | 06/01/2024 | | 98 | 97,949 |
| BCPE Max Dutch Bidco B.V. (Netherlands), Term Loan B (3 mo. EURIBOR + 4.75%) | 4.75% | 10/01/2025 | EUR | 750 | 828,421 |
| Cabot Microelectronics Corp., Term Loan (1 mo. USD LIBOR + 2.25%) | 4.38% | 11/14/2025 | | 3,777 | 3,788,761 |
| Charter NEX US, Inc. | | | | | |
| First Lien Incremental Term Loan (1 mo. USD LIBOR + 3.50%) | 5.61% | 05/16/2024 | | 915 | 915,802 |
| First Lien Term Loan (1 mo. USD LIBOR + 3.00%) | 5.11% | 05/16/2024 | | 82 | 80,762 |
| Chemours Co. (The), Term Loan B-2 (1 mo. USD LIBOR + 1.75%) | 3.87% | 04/03/2025 | | 154 | 149,609 |
| Cyanco Intermediate 2 Corp., First Lien Term Loan (1 mo. USD LIBOR + 3.50%) | 5.61% | 03/16/2025 | | 36 | 35,899 |
| Encapsys, LLC, First Lien Term Loan (1 mo. USD LIBOR + 3.50%) | 5.61% | 11/07/2024 | | 1 | 1,283 |
| Ferro Corp. | | | | | |
| Term Loan B-2 (3 mo. USD LIBOR + 2.25%) | 4.58% | 02/14/2024 | | 464 | 463,299 |
| Term Loan B-3 (3 mo. USD LIBOR + 2.25%) | 4.58% | 02/14/2024 | | 454 | 453,442 |
| Gemini HDPE LLC, Term Loan (3 mo. USD LIBOR + 2.50%) | 4.76% | 08/07/2024 | | 2,126 | 2,130,328 |
| H.B. Fuller Co., Term Loan (1 mo. USD LIBOR + 2.00%) | 4.17% | 10/20/2024 | | 2,463 | 2,455,135 |
| Hexion International Holdings B.V. (Netherlands) | | | | | |
| Term Loan B (3 mo. EURIBOR + 4.00%) | 4.00% | 06/26/2026 | EUR | 767 | 842,806 |
| Term Loan B (3 mo. USD LIBOR + 3.50%)(d) | 5.82% | 06/26/2026 | | 2,558 | 2,557,863 |
| Ignition Midco B.V. (Netherlands), Term Loan B (6 mo. EURIBOR + 4.00%) | 4.00% | 07/02/2025 | EUR | 1,618 | 1,791,790 |
| Ineos US Finance LLC (Luxembourg), Term Loan (2 mo. USD LIBOR + 2.00%) | 4.26% | 03/31/2024 | | 3,219 | 3,167,472 |
| Invictus US NewCo LLC | | | | | |
| First Lien Term Loan (2 mo. USD LIBOR + 3.00%) | 5.15% | 03/28/2025 | | 1,819 | 1,804,831 |
| Second Lien Term Loan (2 mo. USD LIBOR + 6.75%) | 8.90% | 03/30/2026 | �� | 1,149 | 1,144,084 |
| KPEX Holdings, Inc. | | | | | |
Second Lien Term Loan (1 mo. USD LIBOR + 7.00%)
(Acquired 01/26/2018-05/10/2019; Cost $444,063) | 9.11% | 01/31/2026 | | 448 | 412,064 |
| Term Loan (1 mo. USD LIBOR + 3.25%) | 5.36% | 01/31/2025 | | 1,034 | 966,927 |
| Messer Industries USA, Inc., Term Loan B-1 (3 mo. USD LIBOR + 2.50%) | 4.83% | 03/01/2026 | | 13,186 | 13,122,948 |
See accompanying Notes to Financial Statements which are an integral part of the financial statements.
| 15 | Invesco Floating Rate Fund |
| | Interest
Rate | Maturity
Date | Principal
Amount
(000)(a) | Value |
| Chemicals & Plastics–(continued) | |
| Natgasoline LLC, Term Loan (3 mo. USD LIBOR + 3.50%)(d) | 5.81% | 11/14/2025 | | $ 2,091 | $ 2,093,302 |
| Oxea Corp., Term Loan B-2 (1 mo. USD LIBOR + 3.50%) | 5.75% | 10/14/2024 | | 767 | 764,842 |
| Perstorp Holding AB (Sweden) | | | | | |
| Term Loan B (3 mo. EURIBOR + 4.75%) | 4.75% | 02/26/2026 | EUR | 408 | 430,952 |
| Term Loan B (1 mo. USD LIBOR + 4.75%) | 6.89% | 02/27/2026 | | 1,141 | 1,093,703 |
| PQ Corp., Term Loan B-1 (3 mo. USD LIBOR + 2.50%) | 4.76% | 02/05/2025 | | 285 | 285,149 |
| Proampac PG Borrower LLC, First Lien Term Loan (1 mo. USD LIBOR + 3.50%) | 5.70% | 11/20/2023 | | 1,552 | 1,491,707 |
| Starfruit US Holdco LLC (Netherlands), Term Loan (1 mo. USD LIBOR + 3.25%) | 5.46% | 10/01/2025 | | 14,772 | 14,313,385 |
| Tata Chemicals North America, Inc. (India), Term Loan (3 mo. USD LIBOR + 2.75%) | 5.12% | 08/07/2020 | | 1,804 | 1,806,171 |
| Trinseo Materials Finance, Inc., Term Loan (1 mo. USD LIBOR + 2.00%) | 4.11% | 09/06/2024 | | 1,145 | 1,129,858 |
| Tronox Finance LLC, First Lien Term Loan (1 mo. USD LIBOR + 2.75%) | 4.95% | 09/23/2024 | | 153 | 151,848 |
| Univar, Inc., Incremental Term Loan (1 mo. USD LIBOR + 2.50%) | 4.61% | 07/01/2024 | | 0 | 232 |
| Versum Materials, Term Loan (3 mo. USD LIBOR + 1.75%) | 4.33% | 09/29/2023 | | 741 | 741,051 |
| | | | | | 70,133,074 |
| Clothing & Textiles–0.46% | | |
| ABG Intermediate Holdings 2 LLC | | | | | |
| First Lien Term Loan (1 mo. USD LIBOR + 3.50%) | 5.61% | 09/27/2024 | | 3,257 | 3,249,700 |
| Second Lien Term Loan (1 mo. USD LIBOR + 7.75%) | 9.87% | 09/29/2025 | | 3,568 | 3,586,410 |
| International Textile Group, Inc., First Lien Term Loan (1 mo. USD LIBOR + 5.00%) | 7.23% | 05/01/2024 | | 1,940 | 1,745,766 |
| Kontoor Brands, Inc., Term Loan B (3 mo. USD LIBOR + 4.25%) | 6.80% | 05/17/2026 | | 1,319 | 1,328,551 |
| Tumi, Inc., Term Loan B (1 mo. USD LIBOR + 1.75%) | 3.86% | 04/25/2025 | | 104 | 101,470 |
| Varsity Brands Holding Co., Inc., First Lien Term Loan (1 mo. USD LIBOR + 3.50%) | 5.61% | 12/16/2024 | | 1 | 497 |
| | | | | | 10,012,394 |
| Conglomerates–0.32% | | |
| CTC AcquiCo GmbH (Germany) | | | | | |
| Term Loan B-1 (3 mo. EURIBOR + 2.50%) | 2.50% | 03/07/2025 | EUR | 1,187 | 1,291,293 |
| Term Loan B-2 (3 mo. USD LIBOR + 3.00%) | 4.87% | 03/07/2025 | | 1,647 | 1,625,555 |
| Penn Engineering & Manufacturing Corp., Term Loan B (1 mo. USD LIBOR + 2.75%) | 4.87% | 06/27/2024 | | 1,424 | 1,410,852 |
| Safe Fleet Holdings LLC | | | | | |
| First Lien Term Loan (1 mo. USD LIBOR + 3.00%) | 5.21% | 02/03/2025 | | 1,173 | 1,128,555 |
First Lien Term Loan B-1 (1 mo. USD LIBOR + 3.75%)
(Acquired 11/28/2018-05/10/2019; Cost $832,726) | 5.96% | 02/03/2025 | | 855 | 831,469 |
| Second Lien Term Loan (1 mo. USD LIBOR + 6.75%) | 8.96% | 02/02/2026 | | 580 | 565,577 |
| | | | | | 6,853,301 |
| Containers & Glass Products–2.76% | | |
| Berlin Packaging, LLC | | | | | |
| Term Loan (1 mo. USD LIBOR + 3.00%) | 5.22% | 11/07/2025 | | 500 | 490,241 |
| Term Loan B-1 (3 mo. USD LIBOR + 3.00%) | 5.33% | 11/07/2025 | | 2,098 | 2,051,005 |
| Berry Global, Inc. | | | | | |
| Term Loan Q (1 mo. USD LIBOR + 2.25%) | 4.45% | 10/01/2022 | | 702 | 703,033 |
| Term Loan R (1 mo. USD LIBOR + 2.25%) | 4.45% | 01/19/2024 | | 1,410 | 1,411,239 |
| Term Loan T (1 mo. USD LIBOR + 2.00%) | 4.20% | 01/06/2021 | | 42 | 42,090 |
| Term Loan U (1 mo. USD LIBOR + 2.50%) | 4.70% | 07/01/2026 | | 23,849 | 23,874,542 |
| Term Loan V (1 mo. EURIBOR + 2.50%) | 2.50% | 05/17/2026 | EUR | 533 | 588,504 |
| BWAY Holding Co., Term Loan (3 mo. USD LIBOR + 3.25%) | 5.59% | 04/03/2024 | | 603 | 587,605 |
| Consolidated Container Co. LLC | | | | | |
| First Lien Term Loan (1 mo. USD LIBOR + 2.75%) | 4.86% | 05/22/2024 | | 146 | 144,390 |
| Incremental Term Loan (3 mo. USD LIBOR + 3.50%) | 5.61% | 06/26/2026 | | 1,912 | 1,907,618 |
| Crown Americas LLC, Term Loan B (1 mo. USD LIBOR + 2.00%) | 4.20% | 04/03/2025 | | 101 | 101,455 |
Duran Group (Germany), Term Loan B-2 (3 mo. USD LIBOR + 4.00%)
(Acquired 03/24/2017-05/22/2017; Cost $9,516,814)(d) | 6.34% | 03/21/2024 | | 9,599 | 9,406,832 |
See accompanying Notes to Financial Statements which are an integral part of the financial statements.
| 16 | Invesco Floating Rate Fund |
| | Interest
Rate | Maturity
Date | Principal
Amount
(000)(a) | Value |
| Containers & Glass Products–(continued) | |
| Flex Acquisition Co., Inc. | | | | | |
| Incremental Term Loan B (3 mo. USD LIBOR + 3.25%) | 5.57% | 06/29/2025 | | $5,085 | $4,861,217 |
| Term Loan (3 mo. USD LIBOR + 3.25%) | 5.32% | 12/29/2023 | | 50 | 47,998 |
| Fort Dearborn Holding Co., Inc. | | | | | |
| First Lien Term Loan (3 mo. USD LIBOR + 4.00%) | 6.31% | 10/19/2023 | | 5,297 | 5,210,690 |
Second Lien Term Loan (3 mo. USD LIBOR + 8.50%)
(Acquired 10/10/2016; Cost $387,491) | 10.82% | 10/21/2024 | | 393 | 374,706 |
| Hoffmaster Group, Inc., First Lien Term Loan B-1 (3 mo. USD LIBOR + 4.00%) | 6.33% | 11/21/2023 | | 3,798 | 3,776,649 |
| Klockner Pentaplast of America, Inc. (Luxembourg) | | | | | |
| Term Loan (3 mo. EURIBOR + 4.75%) | 4.75% | 06/30/2022 | EUR | 851 | 835,334 |
| Term Loan (1 mo. USD LIBOR + 4.25%) | 6.36% | 06/30/2022 | | 859 | 772,726 |
| Libbey Glass, Inc., Term Loan (1 mo. USD LIBOR + 3.00%) | 5.21% | 04/09/2021 | | 578 | 445,691 |
| Refresco Group, N.V. (Netherlands), Term Loan B-1 (3 mo. EURIBOR + 3.25%) | 3.25% | 03/28/2025 | EUR | 450 | 494,961 |
| TricorBraun, Inc., Term Loan (2 mo. USD LIBOR + 3.75%) | 6.02% | 11/30/2023 | | 238 | 232,528 |
| Trident TPI Holdings, Inc. | | | | | |
| Term Loan B-1 (1 mo. USD LIBOR + 3.25%) | 5.36% | 10/17/2024 | | 1,002 | 960,019 |
| Term Loan B-2 (3 mo. EURIBOR + 3.50%) | 3.50% | 10/17/2024 | EUR | 447 | 472,466 |
| | | | | | 59,793,539 |
| Cosmetics & Toiletries–0.98% | | |
| Alphabet Holding Co., Inc. | | | | | |
| First Lien Term Loan (1 mo. USD LIBOR + 3.50%) | 5.61% | 09/26/2024 | | 7,136 | 6,661,644 |
| Second Lien Term Loan (1 mo. USD LIBOR + 7.75%) | 9.86% | 09/26/2025 | | 2,470 | 2,175,037 |
| Anastasia Parent, LLC, Term Loan (1 mo. USD LIBOR + 3.75%) | 5.86% | 08/11/2025 | | 1,543 | 1,211,480 |
| Coty, Inc., Term Loan B (1 mo. USD LIBOR + 2.25%) | 4.47% | 04/05/2025 | | 10,892 | 10,573,046 |
| Rodenstock Holding GmbH (Germany), Term Loan B (3 mo. EURIBOR + 5.25%) | 5.25% | 06/05/2026 | EUR | 526 | 558,092 |
| | | | | | 21,179,299 |
| Drugs–1.52% | | |
| Catalent Pharma Solutions, Inc., Term Loan B-2 (1 mo. USD LIBOR + 2.25%) | 4.36% | 05/17/2026 | | 3,504 | 3,522,137 |
| Endo LLC, Term Loan (1 mo. USD LIBOR + 4.25%) | 6.37% | 04/29/2024 | | 10,083 | 9,236,462 |
| Grifols Worldwide Operations USA, Inc. (Spain), Term Loan B (1 wk. USD LIBOR + 2.25%) | 4.39% | 01/31/2025 | | 1,598 | 1,601,530 |
| Valeant Pharmaceuticals International, Inc. (Canada) | | | | | |
| Incremental Term Loan (1 mo. USD LIBOR + 2.75%) | 4.95% | 11/27/2025 | | 9,738 | 9,746,290 |
| Term Loan (1 mo. USD LIBOR + 3.00%) | 5.20% | 06/02/2025 | | 8,779 | 8,806,093 |
| | | | | | 32,912,512 |
| Ecological Services & Equipment–1.05% | | |
| Advanced Disposal Services, Inc., Term Loan (1 wk. USD LIBOR + 2.25%) | 4.39% | 11/10/2023 | | 4,988 | 4,998,890 |
| EnergySolutions, LLC, Term Loan (3 mo. USD LIBOR + 3.75%) | 6.08% | 05/11/2025 | | 2,184 | 2,071,817 |
| GFL Environmental, Inc. (Canada), Incremental Term Loan (1 mo. USD LIBOR + 3.00%) | 5.11% | 05/30/2025 | | 11,496 | 11,405,772 |
| Patriot Container Corp. | | | | | |
| First Lien Term Loan (1 mo. USD LIBOR + 3.50%) | 5.61% | 03/20/2025 | | 168 | 167,823 |
Second Lien Term Loan (1 mo. USD LIBOR + 7.75%)
(Acquired 03/16/2018-05/10/2019; Cost $901,515)(d) | 9.87% | 03/20/2026 | | 921 | 879,246 |
| Tunnel Hill Partners, L.P., Term Loan (1 mo. USD LIBOR + 3.50%) | 5.61% | 02/06/2026 | | 504 | 502,303 |
| US Ecology, Inc., Term Loan(f) | — | 08/14/2026 | | 899 | 903,650 |
| WCA Waste Systems, Inc., Term Loan (1 mo. USD LIBOR + 2.50%) | 4.61% | 08/11/2023 | | 1,792 | 1,784,424 |
| | | | | | 22,713,925 |
| Electronics & Electrical–8.26% | | |
| Applied Systems, Inc. | | | | | |
| First Lien Term Loan (3 mo. USD LIBOR + 3.00%) | 5.33% | 09/19/2024 | | 21 | 21,198 |
| Second Lien Term Loan (3 mo. USD LIBOR + 7.00%) | 9.33% | 09/19/2025 | | 173 | 175,373 |
See accompanying Notes to Financial Statements which are an integral part of the financial statements.
| 17 | Invesco Floating Rate Fund |
| | Interest
Rate | Maturity
Date | Principal
Amount
(000)(a) | Value |
| Electronics & Electrical–(continued) |
| Blackboard, Inc., Term Loan B-4 (3 mo. USD LIBOR + 5.00%) | 7.30% | 06/30/2021 | | $ 54 | $ 53,596 |
| Boxer Parent Co., Inc., Term Loan (1 mo. USD LIBOR + 4.25%) | 6.58% | 10/02/2025 | | 50 | 47,265 |
| Brave Parent Holdings, Inc., First Lien Term Loan (3 mo. USD LIBOR + 4.00%) | 6.26% | 04/18/2025 | | 1,368 | 1,303,829 |
| Canyon Valor Cos., Inc., First Lien Term Loan (3 mo. USD LIBOR + 2.75%) | 5.08% | 06/16/2023 | | 3,116 | 3,100,926 |
| CommScope, Inc., Term Loan (1 mo. USD LIBOR + 3.25%) | 5.36% | 04/06/2026 | | 12,366 | 12,329,540 |
| Dell International LLC, Term Loan B (1 mo. USD LIBOR + 2.00%) | 4.12% | 09/07/2023 | | 673 | 675,243 |
| Diebold Nixdorf, Inc. | | | | | |
| Term Loan A (1 mo. USD LIBOR + 4.75%) | 7.00% | 04/30/2022 | | 1,038 | 1,025,512 |
| Term Loan A-1 (1 mo. USD LIBOR + 9.25%) | 11.38% | 08/31/2022 | | 5,394 | 5,717,866 |
| Term Loan B (1 mo. EURIBOR + 3.00%) | 3.00% | 11/06/2023 | EUR | 1,876 | 1,946,269 |
| Term Loan B (1 mo. USD LIBOR + 2.75%) | 5.00% | 11/06/2023 | | 3,564 | 3,376,776 |
| DigiCert Holdings, Inc. | | | | | |
| First Lien Term Loan (1 mo. USD LIBOR + 4.00%) | 6.11% | 10/31/2024 | | 83 | 83,489 |
| Second Lien Term Loan (1 mo. USD LIBOR + 8.00%) | 10.12% | 10/31/2025 | | 663 | 663,467 |
| Dynatrace LLC, First Lien Term Loan (1 mo. USD LIBOR + 3.25%) | 4.86% | 08/22/2025 | | 113 | 113,465 |
| Energizer Holdings, Inc., Term Loan B (1 mo. USD LIBOR + 2.25%) | 4.50% | 12/17/2025 | | 2,394 | 2,391,240 |
| ETA Australia Holdings III Pty. Ltd. (Australia), First Lien Term Loan (1 mo. USD LIBOR + 4.00%) | 6.11% | 05/06/2026 | | 2,782 | 2,787,346 |
| Everest Bidco S.A.S. (France), First Lien Term Loan B (3 mo. EURIBOR + 4.00%) | 4.00% | 07/04/2025 | EUR | 2,794 | 3,049,864 |
| Finastra USA, Inc., First Lien Term Loan (1 mo. USD LIBOR + 3.50%) | 5.70% | 06/13/2024 | | 466 | 450,128 |
| Go Daddy Operating Company, LLC, Term Loan B-1 (1 mo. USD LIBOR + 2.00%) | 4.11% | 02/15/2024 | | 6,673 | 6,694,179 |
| Hyland Software, Inc. | | | | | |
| First Lien Term Loan (1 mo. USD LIBOR + 3.25%) | 5.36% | 07/01/2024 | | 679 | 677,573 |
| Second Lien Term Loan (1 mo. USD LIBOR + 7.00%) | 9.11% | 07/07/2025 | | 665 | 669,051 |
IGT Holding IV AB (Sweden), Term Loan B (3 mo. USD LIBOR + 3.50%)
(Acquired 07/25/2017-05/10/2019; Cost $1,673,178) | 6.08% | 07/26/2024 | | 1,676 | 1,671,843 |
| Imperva, Inc., Second Lien Term Loan (1 mo. USD LIBOR + 7.75%) | 9.93% | 01/11/2027 | | 1,845 | 1,821,558 |
| MA Finance Co., LLC (United Kingdom), Term Loan B-2 (1 mo. USD LIBOR + 2.25%) | 4.36% | 11/19/2021 | | 476 | 473,467 |
| Marcel Bidco LLC, Term Loan B-2 (3 mo. EURIBOR + 3.50%) | 3.50% | 03/11/2025 | EUR | 277 | 303,664 |
| Mavenir Systems, Inc., Term Loan (3 mo. USD LIBOR + 6.00%) | 8.34% | 05/08/2025 | | 4,718 | 4,729,450 |
| McAfee, LLC, Term Loan B-1 (3 mo. EURIBOR + 3.50%) | 3.50% | 09/30/2024 | EUR | 2,749 | 3,032,289 |
| Mediaocean LLC, First Lien Term Loan (1 mo. USD LIBOR + 4.25%) | 6.37% | 08/15/2022 | | 3,383 | 3,403,966 |
| Microchip Technology, Inc., Term Loan (1 mo. USD LIBOR + 2.00%) | 4.12% | 05/29/2025 | | 4,337 | 4,345,363 |
| Mirion Technologies, Inc., Term Loan B-1 (3 mo. USD LIBOR + 4.00%) | 6.33% | 03/06/2026 | | 59 | 59,665 |
| MTS Systems, Term Loan B (1 mo. USD LIBOR + 3.25%)(d) | 5.40% | 07/05/2023 | | 777 | 778,500 |
| Natel Engineering Co., Inc., Term Loan (1 mo. USD LIBOR + 5.00%) | 7.12% | 04/29/2026 | | 3,953 | 3,963,004 |
| NCR Corp. | | | | | |
| Delayed Draw Term Loan | 0.00% | 08/08/2026 | | 2,125 | 2,124,141 |
| Term Loan(f) | — | 08/28/2026 | | 2,429 | 2,427,589 |
| Neustar, Inc. | | | | | |
| Term Loan B-4 (1 mo. USD LIBOR + 3.50%) | 5.61% | 08/08/2024 | | 2,794 | 2,717,148 |
| Term Loan B-5 (1 mo. USD LIBOR + 4.50%) | 6.61% | 08/08/2024 | | 1,919 | 1,887,137 |
| Oberthur Technologies of America Corp. (France), Term Loan B (3 mo. EURIBOR + 3.75%) | 3.75% | 01/10/2024 | EUR | 3,267 | 3,536,100 |
| OEConnection LLC | | | | | |
First Lien Term Loan (1 mo. USD LIBOR + 4.00%)
(Acquired 11/22/2017-05/10/2019; Cost $1,275,590)(d) | 6.12% | 11/22/2024 | | 1,281 | 1,281,424 |
Second Lien Term Loan (1 mo. USD LIBOR + 8.00%)
(Acquired 11/22/2017-05/10/2019; Cost $430,708)(d) | 10.12% | 11/22/2025 | | 435 | 438,251 |
| Open Text Corp. (Canada), Term Loan (1 mo. USD LIBOR + 1.75%) | 3.86% | 05/30/2025 | | 73 | 72,907 |
| Optiv, Inc. | | | | | |
| Second Lien Term Loan (1 mo. USD LIBOR + 7.25%) | 9.36% | 01/31/2025 | | 1,215 | 805,213 |
| Term Loan (1 mo. USD LIBOR + 3.25%) | 5.36% | 02/01/2024 | | 5,714 | 4,742,584 |
| Plantronics, Inc., Term Loan B (1 mo. USD LIBOR + 2.50%) | 4.61% | 07/02/2025 | | 6,753 | 6,736,317 |
See accompanying Notes to Financial Statements which are an integral part of the financial statements.
| 18 | Invesco Floating Rate Fund |
| | Interest
Rate | Maturity
Date | Principal
Amount
(000)(a) | Value |
| Electronics & Electrical–(continued) | |
| Project Accelerate Parent, LLC, First Lien Term Loan (1 mo. USD LIBOR + 4.25%)(d) | 6.45% | 01/02/2025 | | $ 3,643 | $ 3,634,099 |
| Project Leopard Holdings, Inc. | | | | | |
| Incremental Term Loan (6 mo. USD LIBOR + 4.25%) | 6.45% | 07/07/2023 | | 2,235 | 2,232,281 |
| Term Loan (6 mo. USD LIBOR + 4.50%) | 6.70% | 07/07/2023 | | 1,622 | 1,625,248 |
| Quest Software US Holdings, Inc., First Lien Term Loan (3 mo. USD LIBOR + 4.25%) | 6.51% | 05/16/2025 | | 11,330 | 11,064,883 |
| Renaissance Holding Corp. | | | | | |
| First Lien Term Loan (1 mo. USD LIBOR + 3.25%) | 5.36% | 05/30/2025 | | 46 | 44,780 |
| Second Lien Term Loan (1 mo. USD LIBOR + 7.00%) | 9.11% | 05/29/2026 | | 773 | 743,749 |
| Resideo Funding, Inc, Term Loan B (3 mo. USD LIBOR + 2.00%) | 4.33% | 10/25/2025 | | 1,439 | 1,443,416 |
| Riverbed Technology, Inc., Term Loan (1 mo. USD LIBOR + 3.25%) | 5.37% | 04/24/2022 | | 10,451 | 8,789,467 |
| RP Crown Parent, LLC, Term Loan (3 mo. USD LIBOR + 2.75%) | 4.86% | 10/12/2023 | | 92 | 92,174 |
| Sandvine Corp. | | | | | |
| First Lien Term Loan (1 mo. USD LIBOR + 4.50%)(d) | 6.61% | 10/31/2025 | | 4,134 | 4,124,041 |
Second Lien Term Loan (1 mo. USD LIBOR + 8.00%)
(Acquired 10/31/2018; Cost $552,879)(d) | 10.12% | 11/02/2026 | | 564 | 555,700 |
| Science Applications International Corp., Term Loan B (1 mo. USD LIBOR + 1.75%) | 3.86% | 10/31/2025 | | 3,721 | 3,715,003 |
| Severin Acquisition, LLC, Term Loan (3 mo. USD LIBOR + 3.25%) | 5.46% | 08/01/2025 | | 8 | 8,035 |
| SonicWall U.S. Holdings, Inc., Term Loan (3 mo. USD LIBOR + 3.50%)(d) | 5.64% | 05/16/2025 | | 544 | 507,474 |
| SS&C Technologies, Inc. | | | | | |
| Term Loan B-1 (1 mo. USD LIBOR + 2.25%) | 4.36% | 07/08/2022 | | 51 | 50,797 |
| Term Loan B-3 (1 mo. USD LIBOR + 2.25%) | 4.36% | 04/16/2025 | | 6,000 | 6,014,767 |
| Term Loan B-4 (1 mo. USD LIBOR + 2.25%) | 4.36% | 04/16/2025 | | 4,055 | 4,064,463 |
| Term Loan B-5 (1 mo. USD LIBOR + 2.25%) | 4.36% | 04/16/2025 | | 6,359 | 6,368,684 |
| Sybil Software LLC | | | | | |
| Term Loan (3 mo. USD LIBOR + 2.25%) | 4.58% | 09/29/2023 | | 4,367 | 4,385,586 |
| Term Loan (3 mo. EURIBOR + 2.50%) | 2.50% | 09/30/2023 | EUR | 21 | 22,817 |
| TIBCO Software, Inc., Term Loan B-2 (3 mo. USD LIBOR + 4.00%) | 6.25% | 06/30/2026 | | 1 | 10 |
| TTM Technologies, Inc., Term Loan B (1 mo. USD LIBOR + 2.50%) | 4.73% | 09/28/2024 | | 6,654 | 6,651,060 |
| Ultimate Software Group, Inc., First Lien Term Loan (3 mo. USD LIBOR + 3.75%) | 6.08% | 05/04/2026 | | 7,487 | 7,514,621 |
| Verint Systems, Inc., Term Loan (2 mo. USD LIBOR + 2.00%) | 4.23% | 06/29/2024 | | 396 | 398,056 |
| Wall Street Systems Delaware, Inc., Term Loan (3 mo. USD LIBOR + 3.00%) | 5.65% | 11/21/2024 | | 1,852 | 1,800,805 |
| Western Digital Corp., Term Loan B-4 (1 mo. USD LIBOR + 1.75%) | 3.86% | 04/29/2023 | | 1,719 | 1,716,365 |
| Xperi Corp., Term Loan B-1 (1 mo. USD LIBOR + 2.50%) | 4.61% | 12/01/2023 | | 2,833 | 2,804,316 |
| | | | | | 179,077,472 |
| Equipment Leasing–0.09% | | |
| Irel AcquiCo. GmbH (Germany), Term Loan B-1 | 0.00% | 05/29/2026 | EUR | 1,747 | 1,939,606 |
| United Rentals (North America), Inc., Term Loan (1 mo. USD LIBOR + 1.75%) | 3.86% | 10/31/2025 | | 27 | 26,880 |
| | | | | | 1,966,486 |
| Financial Intermediaries–0.92% | | |
| Edelman Financial Center, LLC (The), First Lien Term Loan (1 mo. USD LIBOR + 3.25%) | 5.43% | 07/19/2025 | | 55 | 55,194 |
| Evergood 4 APS (Denmark) | | | | | |
| Second Lien Term Loan (3 mo. EURIBOR + 7.00%) | 8.00% | 02/06/2027 | EUR | 1,154 | 1,265,133 |
| Term Loan B-1E (2 mo. EURIBOR + 3.25%)(e) | 3.00% | 02/06/2025 | EUR | 714 | 786,077 |
| Term Loan B-2 (3 mo. EURIBOR + 3.75%) | 3.75% | 02/06/2025 | EUR | 737 | 813,276 |
| Term Loan B-2(d) | 3.75% | 02/06/2025 | EUR | 236 | 260,517 |
| GEO Group, Inc. (The), Term Loan (1 mo. USD LIBOR + 2.00%) | 4.12% | 03/22/2024 | | 3,249 | 3,039,684 |
| LPL Holdings, Inc., Term Loan B (1 mo. USD LIBOR + 2.25%) | 4.40% | 09/23/2024 | | 1,664 | 1,670,252 |
| MoneyGram International, Inc., Term Loan (3 mo. USD LIBOR + 6.00%) | 8.33% | 05/31/2023 | | 7,508 | 7,297,084 |
| RPI Finance Trust, Term Loan B-6 (1 mo. USD LIBOR + 2.00%) | 4.11% | 03/27/2023 | | 3,409 | 3,420,477 |
| SGG Holdings S.A. (Luxembourg), Term Loan B (6 mo. EURIBOR + 3.75%) | 3.75% | 07/11/2025 | EUR | 1,145 | 1,236,230 |
See accompanying Notes to Financial Statements which are an integral part of the financial statements.
| 19 | Invesco Floating Rate Fund |
| | Interest
Rate | Maturity
Date | Principal
Amount
(000)(a) | Value |
| Financial Intermediaries–(continued) | |
| Stiphout Finance LLC | | | | | |
| First Lien Term Loan (1 mo. USD LIBOR + 3.00%) | 5.11% | 10/26/2022 | | $147 | $144,754 |
| Second Lien Term Loan (1 mo. USD LIBOR + 7.25%) | 9.36% | 10/26/2023 | | 43 | 41,518 |
| | | | | | 20,030,196 |
| Food & Drug Retailers–0.09% | | |
| Albertsons Co., Inc., Term Loan B-8 (1 mo. USD LIBOR + 2.75%) | 4.86% | 08/17/2026 | | 449 | 451,803 |
| Carrols Restaurant Group, Inc., Term Loan (1 mo. USD LIBOR + 3.25%) | 5.40% | 04/30/2026 | | 1,482 | 1,439,034 |
| | | | | | 1,890,837 |
| Food Products–3.36% | | |
| 8th Avenue Food & Provisions, Inc. | | | | | |
| First Lien Term Loan (1 mo. USD LIBOR + 3.75%) | 5.96% | 10/01/2025 | | 1 | 884 |
| Second Lien Term Loan (1 mo. USD LIBOR + 7.75%) | 9.97% | 10/01/2026 | | 1,227 | 1,217,494 |
| CHG PPC Parent LLC | | | | | |
| Term Loan (1 mo. USD LIBOR + 2.75%) | 4.86% | 03/31/2025 | | 217 | 215,277 |
| Term Loan B (1 mo. EURIBOR + 4.00%) | 4.00% | 03/31/2025 | EUR | 324 | 359,391 |
| CSM Bakery Supplies LLC, First Lien Term Loan (3 mo. USD LIBOR + 4.00%) | 6.29% | 07/03/2020 | | 6,113 | 5,868,285 |
| Dole Food Co., Inc., Term Loan B (1 mo. USD LIBOR + 2.75%) | 4.90% | 04/06/2024 | | 7,273 | 7,196,142 |
| H-Food Holdings, LLC | | | | | |
| Incremental Term Loan B-2 (1 mo. USD LIBOR + 4.00%) | 6.11% | 05/23/2025 | | 292 | 285,958 |
| Term Loan (1 mo. USD LIBOR + 3.69%) | 5.80% | 05/23/2025 | | 4,018 | 3,917,657 |
| Jacobs Douwe Egberts International B.V. (Netherlands), Term Loan B (1 mo. USD LIBOR + 2.00%) | 4.25% | 11/01/2025 | | 5,483 | 5,495,459 |
| JBS USA Lux S.A., Term Loan B (1 mo. USD LIBOR + 2.50%) | 4.61% | 05/01/2026 | | 19,442 | 19,507,014 |
| Manna Pro Products, LLC | | | | | |
Delayed Draw Loan
(Acquired 05/30/2019; Cost $803,989)(d)(e) | 0.00% | 12/08/2023 | | 812 | 803,989 |
Incremental Term Loan (1 mo. USD LIBOR + 6.00%)
(Acquired 05/30/2019; Cost $2,719,393)(d) | 8.11% | 12/08/2023 | | 2,747 | 2,719,393 |
| Mastronardi Produce-USA, Inc. (Canada), Term Loan B (1 mo. USD LIBOR + 3.25%) | 5.36% | 05/01/2025 | | 1,506 | 1,505,965 |
| Nomad Foods US LLC (United Kingdom), Term Loan B-4 (1 mo. USD LIBOR + 2.25%) | 4.45% | 05/15/2024 | | 3,943 | 3,928,608 |
| Post Holdings, Inc., Series A, Incremental Term Loan (1 mo. USD LIBOR + 2.00%) | 4.15% | 05/24/2024 | | 1,952 | 1,955,666 |
| Shearer’s Foods, LLC | | | | | |
| First Lien Term Loan (1 mo. USD LIBOR + 4.25%) | 6.36% | 06/30/2021 | | 2,682 | 2,683,265 |
| Second Lien Term Loan (1 mo. USD LIBOR + 6.75%) | 8.86% | 06/30/2022 | | 449 | 445,803 |
| United Natural Foods, Inc., Term Loan B (1 mo. USD LIBOR + 4.25%) | 6.36% | 10/22/2025 | | 17,724 | 14,726,074 |
| | | | | | 72,832,324 |
| Food Service–2.58% | | |
| Aramark Services, Inc., Term Loan B-3 (3 mo. USD LIBOR + 1.75%) | 4.08% | 03/11/2025 | | 18 | 18,198 |
| Carlisle FoodService Products, Inc., Term Loan (1 mo. USD LIBOR + 3.00%) | 5.11% | 03/20/2025 | | 1,259 | 1,200,621 |
| EG Finco Ltd. (Netherlands) | | | | | |
| Term Loan (3 mo. USD LIBOR + 4.00%) | 6.33% | 02/06/2025 | | 1,385 | 1,369,091 |
| Term Loan B (3 mo. USD LIBOR + 4.00%) | 6.33% | 02/06/2025 | | 1,058 | 1,045,841 |
| Term Loan B (3 mo. EURIBOR + 4.00%) | 4.00% | 02/07/2025 | EUR | 1,877 | 2,020,736 |
| Houston Foods, Inc., Term Loan (1 mo. USD LIBOR + 3.75%) | 5.86% | 07/20/2025 | | 3,559 | 3,380,661 |
| New Red Finance, Inc. (Canada), Term Loan B-3 (1 mo. USD LIBOR + 2.25%) | 4.36% | 02/16/2024 | | 21,416 | 21,415,995 |
| NPC International, Inc. | | | | | |
| First Lien Term Loan (1 mo. USD LIBOR + 3.50%) | 5.70% | 04/19/2024 | | 2,571 | 1,875,446 |
| Second Lien Term Loan (3 mo. USD LIBOR + 7.50%) | 9.82% | 04/18/2025 | | 669 | 276,604 |
| Pizza Hut Holdings, LLC, Term Loan B (1 mo. USD LIBOR + 1.75%) | 3.93% | 04/03/2025 | | 186 | 185,982 |
See accompanying Notes to Financial Statements which are an integral part of the financial statements.
| 20 | Invesco Floating Rate Fund |
| | Interest
Rate | Maturity
Date | Principal
Amount
(000)(a) | Value |
| Food Service–(continued) | |
| Restaurant Technologies, Inc. | | | | | |
| First Lien Term Loan (1 mo. USD LIBOR + 3.25%) | 5.36% | 10/01/2025 | | $94 | $94,382 |
| Second Lien Term Loan (1 mo. USD LIBOR + 6.50%) | 8.61% | 10/01/2026 | | 1,465 | 1,467,049 |
| Tacala Investment Corp. | | | | | |
| First Lien Term Loan (1 mo. USD LIBOR + 3.25%) | 5.11% | 02/01/2025 | | 29 | 28,165 |
| Second Lien Term Loan (1 mo. USD LIBOR + 7.00%) | 9.12% | 02/01/2026 | | 533 | 533,793 |
| TMK Hawk Parent, Corp., Term Loan (1 mo. USD LIBOR + 3.50%) | 5.63% | 09/26/2024 | | 3,142 | 2,657,783 |
| US Foods, Inc. | | | | | |
| Incremental Term Loan B(f) | — | 08/15/2026 | | 4,040 | 4,053,359 |
| Term Loan (1 mo. USD LIBOR + 2.00%) | 4.11% | 06/27/2023 | | 12,779 | 12,809,532 |
| Weight Watchers International, Inc., Term Loan (3 mo. USD LIBOR + 4.75%) | 7.05% | 11/29/2024 | | 1,501 | 1,502,969 |
| | | | | | 55,936,207 |
| Forest Products–0.00% | | |
| American Greetings Corp., Term Loan (1 mo. USD LIBOR + 4.50%) | 6.61% | 04/06/2024 | | 23 | 22,643 |
| Health Care–3.68% | | |
| Acadia Healthcare Co., Inc. | | | | | |
| Term Loan B-3 (1 mo. USD LIBOR + 2.50%) | 4.61% | 02/11/2022 | | 1,809 | 1,812,658 |
| Term Loan B-4 (1 mo. USD LIBOR + 2.50%) | 4.61% | 02/16/2023 | | 7,217 | 7,232,503 |
| Argon Medical Devices Holdings, Inc. | | | | | |
| First Lien Term Loan (1 mo. USD LIBOR + 3.75%) | 5.86% | 01/23/2025 | | 3 | 3,316 |
| Second Lien Term Loan (1 mo. USD LIBOR + 8.00%) | 10.11% | 01/23/2026 | | 220 | 217,815 |
| athenahealth, Inc., First Lien Term Loan B (3 mo. USD LIBOR + 4.50%) | 6.68% | 02/11/2026 | | 6,074 | 6,057,229 |
| Biogroup-LCD (France), Term Loan B (3 mo. EURIBOR + 3.75%)(d) | 3.75% | 06/14/2025 | EUR | 588 | 648,299 |
| BVI Medical, Inc., Term Loan (3 mo. EURIBOR + 4.25%) | 4.25% | 03/02/2026 | EUR | 472 | 525,589 |
| Cheplapharm Arzneimittel GmbH (Germany), Term Loan B-3 (3 mo. EURIBOR + 4.00%) | 4.00% | 07/20/2025 | EUR | 473 | 526,295 |
| Convatec, Inc. (United Kingdom), Term Loan B (3 mo. USD LIBOR + 2.25%) | 4.58% | 10/31/2023 | | 675 | 673,969 |
| Curium BidCo S.a.r.l. (Luxembourg), Term Loan B (3 mo. USD LIBOR + 4.00%) | 6.22% | 06/27/2026 | | 2,449 | 2,458,430 |
| Dentalcorp Perfect Smile ULC (Canada) | | | | | |
| First Lien Term Loan (1 mo. USD LIBOR + 3.75%) | 5.86% | 06/06/2025 | | 30 | 29,283 |
| Second Lien Term Loan (1 mo. USD LIBOR + 7.50%) | 9.61% | 06/08/2026 | | 2,075 | 2,054,449 |
| Femur Buyer, Inc., First Lien Term Loan (3 mo. USD LIBOR + 4.50%) | 6.98% | 03/05/2026 | | 36 | 35,989 |
| Financiere Mendel (France), Term Loan B (3 mo. EURIBOR + 4.75%) | 4.75% | 04/12/2026 | EUR | 3,442 | 3,817,816 |
| Global Healthcare Exchange, LLC, Term Loan (3 mo. USD LIBOR + 3.25%) | 5.58% | 06/28/2024 | | 707 | 697,899 |
| Greatbatch, Ltd., Term Loan B (1 mo. USD LIBOR + 3.00%) | 5.22% | 10/27/2022 | | 600 | 604,170 |
| HC Group Holdings III, Inc., Term Loan B (1 mo. USD LIBOR + 4.50%) | 6.61% | 08/15/2026 | | 4,832 | 4,825,880 |
| IQVIA, Inc., Term Loan B-2 (3 mo. USD LIBOR + 2.00%) | 4.33% | 01/17/2025 | | 783 | 784,987 |
| IWH UK Midco Ltd. (United Kingdom), Term Loan B (3 mo. EURIBOR + 4.00%) | 4.00% | 01/31/2025 | EUR | 2,795 | 3,075,609 |
| Kinetic Concepts, Inc., Term Loan (3 mo. USD LIBOR + 3.25%) | 5.58% | 02/03/2024 | | 2,822 | 2,829,255 |
| MED ParentCo., L.P. | | | | | |
| Delayed Draw Term Loan(h) | 0.00% | 07/31/2026 | | 630 | 624,412 |
| First Lien Term Loan(f) | — | 08/02/2026 | | 2,522 | 2,500,606 |
| Second Lien Term Loan(f) | — | 08/02/2027 | | 1,041 | 1,046,497 |
| Nidda Healthcare Holding AG (Germany) | | | | | |
| Term Loan C (3 mo. GBP LIBOR + 4.50%) | 5.27% | 08/21/2024 | GBP | 486 | 593,579 |
| Term Loan D (3 mo. EURIBOR+ 4.00%) | 4.00% | 08/21/2024 | EUR | 1,978 | 2,193,471 |
| Ortho-Clinical Diagnostics, Inc. (Luxembourg), Term Loan (3 mo. USD LIBOR + 3.25%) | 5.57% | 06/30/2025 | | 5,380 | 5,089,438 |
| PAREXEL International Corp., Term Loan (1 mo. USD LIBOR + 2.75%) | 4.86% | 09/27/2024 | | 153 | 144,772 |
| Prophylaxis B.V. (Netherlands), Term Loan B (6 mo. EURIBOR + 4.00%) | 4.00% | 06/05/2025 | EUR | 2,578 | 2,521,166 |
| Sunshine Luxembourg VII S.a.r.l. (Luxembourg) | | | | | |
| Term Loan(f) | — | 07/17/2026 | EUR | 1,572 | 1,736,638 |
| Term Loan (3 mo. USD LIBOR + 4.25%)(f) | — | 07/23/2026 | | 8,613 | 8,622,228 |
See accompanying Notes to Financial Statements which are an integral part of the financial statements.
| 21 | Invesco Floating Rate Fund |
| | Interest
Rate | Maturity
Date | Principal
Amount
(000)(a) | Value |
| Health Care–(continued) | |
| Surgery Center Holdings, Inc., Term Loan (1 mo. USD LIBOR + 3.25%) | 5.37% | 09/02/2024 | | $ 45 | $ 42,798 |
| Synlab Bondco PLC (United Kingdom), First Lien Term Loan(f) | — | 07/01/2026 | EUR | 3,065 | 3,382,814 |
| Team Health Holdings, Inc., Term Loan (1 mo. USD LIBOR + 2.75%) | 4.86% | 02/06/2024 | | 3,657 | 2,957,635 |
| Terveys-ja hoivapalvelut Suomi Oy (Finland) | | | | | |
| First Lien Term Loan B (3 mo. EURIBOR + 4.25%) | 4.25% | 08/11/2025 | EUR | 1,802 | 2,001,322 |
| Second Lien Term Loan (3 mo. EURIBOR + 7.50%) | 7.50% | 07/19/2026 | EUR | 986 | 1,087,899 |
| Unilabs Diagnostics AB (Sweden), Revolver Loan(d)(e) | 0.00% | 04/01/2021 | EUR | 1,850 | 2,019,179 |
| WP CityMD Bidco LLC, First Lien Term Loan (3 mo. USD LIBOR + 4.50%) | 6.71% | 08/13/2026 | | 4,302 | 4,264,599 |
| | | | | | 79,740,493 |
| Home Furnishings–0.82% | | |
| Comfort Holding, LLC, First Lien Term Loan (1 mo. USD LIBOR + 4.75%) | 6.86% | 02/05/2024 | | 2,602 | 2,582,374 |
| Global Appliance, Inc., Term Loan B (1 mo. USD LIBOR + 4.00%) | 6.12% | 09/29/2024 | | 3,068 | 3,058,055 |
| Hayward Industries, Inc., First Lien Term Loan (1 mo. USD LIBOR + 3.50%) | 5.61% | 08/05/2024 | | 1,607 | 1,548,980 |
| Hilding Anders AB (Sweden), Term Loan B (3 mo. EURIBOR + 4.50%) | 4.50% | 11/29/2024 | EUR | 2,191 | 1,854,819 |
| Lifetime Brands, Inc., Term Loan B (1 mo. USD LIBOR + 3.50%) | 5.61% | 02/28/2025 | | 535 | 518,649 |
| PGT Innovations Inc., Term Loan (3 mo. USD LIBOR + 3.50%) | 5.69% | 02/16/2022 | | 142 | 142,359 |
| Serta Simmons Bedding, LLC | | | | | |
| First Lien Term Loan (1 mo. USD LIBOR + 3.50%) | 5.70% | 11/08/2023 | | 5,018 | 3,370,439 |
| Second Lien Term Loan (1 mo. USD LIBOR + 8.00%) | 10.18% | 11/08/2024 | | 704 | 318,306 |
| TGP Holdings III, LLC | | | | | |
| First Lien Term Loan (3 mo. USD LIBOR + 4.25%) | 6.58% | 09/25/2024 | | 3,566 | 3,378,843 |
| Second Lien Term Loan (3 mo. USD LIBOR + 8.50%) | 10.83% | 09/25/2025 | | 1,001 | 941,461 |
| | | | | | 17,714,285 |
| Industrial Equipment–1.62% | | |
| Airxcel, Inc., First Lien Term Loan (1 mo. USD LIBOR + 4.50%) | 6.61% | 04/28/2025 | | 739 | 715,462 |
| Alpha AB Bidco B.V. (Netherlands), Term Loan B (3 mo. EURIBOR + 3.75%) | 3.75% | 07/30/2025 | EUR | 705 | 761,460 |
| Altra Industrial Motion Corp., Term Loan B (1 mo. USD LIBOR + 2.00%) | 4.11% | 10/01/2025 | | 941 | 938,828 |
| CIRCOR International, Inc., Term Loan (1 mo. USD LIBOR + 3.50%) | 5.70% | 12/11/2024 | | 267 | 265,830 |
| Clark Equipment Co. (South Korea), Term Loan B (3 mo. USD LIBOR + 2.00%) | 4.33% | 05/18/2024 | | 3,827 | 3,830,029 |
| Columbus McKinnon Corp., Term Loan (3 mo. USD LIBOR + 2.50%) | 4.83% | 01/31/2024 | | 100 | 99,632 |
| Crosby US Acquisition Corp., Term Loan B (1 mo. USD LIBOR + 4.75%) | 6.92% | 06/20/2026 | | 1,806 | 1,780,944 |
| Delachaux Group S.A. (France) | | | | | |
| Term Loan B-1 (3 mo. EURIBOR + 3.75%) | 3.75% | 04/16/2026 | EUR | 1,364 | 1,508,108 |
| Term Loan B-2 (3 mo. USD LIBOR + 4.50%) | 6.83% | 04/16/2026 | | 937 | 934,206 |
| DXP Enterprises, Inc., Term Loan (1 mo. USD LIBOR + 4.75%) | 6.86% | 08/29/2023 | | 369 | 370,977 |
| Engineered Machinery Holdings, Inc. | | | | | |
| First Lien Incremental Term Loan (3 mo. USD LIBOR + 4.25%) | 6.58% | 07/19/2024 | | 1,258 | 1,258,262 |
| First Lien Term Loan (3 mo. USD LIBOR + 3.25%) | 5.58% | 07/19/2024 | | 1,991 | 1,932,146 |
| Second Lien Term Loan (3 mo. USD LIBOR + 7.25%) | 9.58% | 07/18/2025 | | 1,812 | 1,793,957 |
| Gardner Denver, Inc., Term Loan B-1 (1 mo. USD LIBOR + 2.75%) | 4.86% | 07/30/2024 | | 3,502 | 3,516,052 |
| Generac Power Systems, Inc., Term Loan (1 mo. USD LIBOR + 1.75%) | 3.98% | 05/31/2023 | | 842 | 843,566 |
| Hamilton Holdco LLC (Australia), Term Loan (3 mo. USD LIBOR + 2.00%)(d) | 4.33% | 07/02/2025 | | 4,309 | 4,319,959 |
| MX Holdings US, Inc., Term Loan B-1C (1 mo. USD LIBOR + 3.00%) | 5.11% | 07/31/2025 | | 3,373 | 3,377,993 |
| New VAC US LLC (Germany), Term Loan B (3 mo. USD LIBOR + 4.00%)(d) | 6.33% | 03/08/2025 | | 1,285 | 1,278,028 |
| North American Lifting Holdings, Inc., First Lien Term Loan (3 mo. USD LIBOR + 4.50%) | 6.83% | 11/27/2020 | | 284 | 265,318 |
| Rexnord LLC/RBS Global, Inc., Term Loan B (1 mo. USD LIBOR + 2.00%) | 4.11% | 08/21/2024 | | 277 | 278,809 |
| Robertshaw US Holding Corp. | | | | | |
| First Lien Term Loan (1 mo. USD LIBOR + 3.25%) | 5.38% | 02/28/2025 | | 2,669 | 2,505,892 |
| Second Lien Term Loan (1 mo. USD LIBOR + 8.00%) | 10.13% | 02/28/2026 | | 1,177 | 1,033,641 |
See accompanying Notes to Financial Statements which are an integral part of the financial statements.
| 22 | Invesco Floating Rate Fund |
| | Interest
Rate | Maturity
Date | Principal
Amount
(000)(a) | Value |
| Industrial Equipment–(continued) | |
| Terex Corp. | | | | | |
| Term Loan (2 mo. USD LIBOR + 2.00%) | 4.11% | 01/31/2024 | | $637 | $637,292 |
| Term Loan (1 mo. USD LIBOR + 2.75%) | 4.86% | 01/31/2024 | | 907 | 910,253 |
| | | | | | 35,156,644 |
| Insurance–0.38% | | |
| Alliant Holdings Intermediate, LLC, Initial Term Loan (1 mo. USD LIBOR + 3.00%) | 5.15% | 05/09/2025 | | 652 | 635,220 |
| Andromeda Investissements S.A. (France) | | | | | |
| Term Loan B-1(f) | — | 04/26/2026 | EUR | 926 | 1,030,810 |
| Term Loan B-2(f) | — | 04/26/2026 | EUR | 483 | 537,748 |
| FrontDoor, Inc., Term Loan (1 mo. USD LIBOR + 2.50%) | 4.62% | 08/16/2025 | | 341 | 342,177 |
| Hub International Ltd., Term Loan (3 mo. USD LIBOR + 3.00%) | 5.27% | 04/25/2025 | | 108 | 105,694 |
| Sedgwick Claims Management Services, Inc. | | | | | |
| First Lien Term Loan(f) | — | 08/08/2026 | | 778 | 776,639 |
| Term Loan (1 mo. USD LIBOR + 3.25%) | 5.36% | 12/31/2025 | | 151 | 146,994 |
| USI, Inc., Term Loan (3 mo. USD LIBOR + 3.00%) | 5.33% | 05/16/2024 | | 4,673 | 4,569,640 |
| | | | | | 8,144,922 |
| Leisure Goods, Activities & Movies–2.78% | | |
| Alpha Topco Ltd. (United Kingdom), Term Loan B (1 mo. USD LIBOR + 2.50%) | 4.61% | 02/01/2024 | | 18,207 | 17,885,481 |
| Ancestry.com Operations, Inc., First Lien Term Loan (1 mo. USD LIBOR + 3.75%) | 5.87% | 10/19/2023 | | 5,112 | 5,097,169 |
| Bright Horizons Family Solutions, Inc., Term Loan B (1 mo. USD LIBOR + 1.75%) | 3.86% | 11/07/2023 | | 135 | 135,675 |
| Callaway Golf Co., Term Loan (1 mo. USD LIBOR + 4.50%) | 6.71% | 01/04/2026 | | 164 | 166,885 |
| Crown Finance US, Inc., Term Loan (1 mo. USD LIBOR + 2.25%) | 4.36% | 02/28/2025 | | 13,434 | 13,355,072 |
| CWGS Group, LLC, Term Loan (1 mo. USD LIBOR + 2.75%) | 4.98% | 11/08/2023 | | 3,583 | 3,106,325 |
| Dorna Sports, S.L. (Spain), Term Loan B-2 (6 mo. USD LIBOR + 3.00%) | 5.20% | 04/12/2024 | | 2,081 | 2,032,455 |
| Fitness International, LLC, Term Loan B (1 mo. USD LIBOR + 3.25%) | 5.36% | 04/18/2025 | | 3,474 | 3,477,138 |
| Invictus Media S.L.U. (Spain) | | | | | |
| Term Loan A-1(f) | — | 06/28/2024 | EUR | 646 | 711,721 |
| Term Loan A-2(f) | — | 06/28/2024 | EUR | 401 | 441,418 |
| Term Loan B-1 (6 mo. EURIBOR + 4.50%) | 4.50% | 06/26/2025 | EUR | 1,417 | 1,564,625 |
| Term Loan B-2 (6 mo. EURIBOR + 4.50%) | 4.50% | 06/26/2025 | EUR | 849 | 937,925 |
| Lakeland Tours, LLC, Term Loan (3 mo. USD LIBOR + 4.00%) | 6.15% | 12/16/2024 | | 2,258 | 2,269,550 |
| Life Time Fitness, Inc., Term Loan (3 mo. USD LIBOR + 2.75%) | 4.88% | 06/10/2022 | | 358 | 356,780 |
| Live Nation Entertainment, Inc., Term Loan B-3 (3 mo. USD LIBOR + 1.75%) | 3.88% | 10/31/2023 | | 170 | 171,388 |
Orbiter International S.a.r.l. (Luxembourg), Term Loan B-2 (3 mo. CHF LIBOR + 4.00%)
(Acquired 07/07/2017; Cost $1,072,900)(d) | 4.00% | 07/11/2024 | CHF | 1,039 | 1,042,091 |
| Sabre GLBL, Inc., Term Loan B (1 mo. USD LIBOR + 2.00%) | 4.11% | 02/22/2024 | | 582 | 582,979 |
| Shutterfly, Inc. | | | | | |
| Incremental Term Loan (1 mo. USD LIBOR + 2.50%) | 4.87% | 08/17/2024 | | 2,116 | 2,117,217 |
| Term Loan B (1 mo. USD LIBOR + 2.50%) | 4.69% | 08/19/2024 | | 1,394 | 1,394,669 |
| SRAM, LLC, Delayed Draw Term Loan(d)(e) | 0.00% | 03/15/2024 | | 1,213 | 1,213,431 |
| SSH Group Holdings, Inc. | | | | | |
| First Lien Term Loan (2 mo. USD LIBOR + 4.25%) | 6.51% | 07/30/2025 | | 340 | 337,891 |
| Second Lien Term Loan (2 mo. USD LIBOR + 8.25%) | 10.51% | 07/30/2026 | | 703 | 703,468 |
| UFC Holdings, LLC, Term Loan (1 mo. USD LIBOR + 3.25%) | 5.37% | 04/29/2026 | | 470 | 470,770 |
| Vue International Bidco PLC (United Kingdom) | | | | | |
| Delayed Draw Term Loan(f) | — | 06/21/2026 | EUR | 114 | 126,061 |
| Term Loan B-1 (3 mo. EURIBOR + 4.75%) | 4.75% | 06/21/2026 | EUR | 633 | 701,077 |
| | | | | | 60,399,261 |
See accompanying Notes to Financial Statements which are an integral part of the financial statements.
| 23 | Invesco Floating Rate Fund |
| | Interest
Rate | Maturity
Date | Principal
Amount
(000)(a) | Value |
| Lodging & Casinos–3.71% | | | |
| AMCP Clean Acquisition Co., LLC | | | | | | |
| Delayed Draw Term Loan (3 mo. USD LIBOR + 4.25%) | 6.58% | 06/16/2025 | | | $209 | $207,620 |
| Term Loan (3 mo. USD LIBOR + 4.25%) | 6.58% | 06/16/2025 | | | 865 | 858,110 |
| Aristocrat Technologies, Inc. (Australia), Term Loan B-3 (3 mo. USD LIBOR + 1.75%) | 4.03% | 10/19/2024 | | | 66 | 66,612 |
| B&B Hotels SAS (France) | | | | | | |
| Second Lien Term Loan B(f) | — | 07/10/2027 | EUR | | 821 | 900,061 |
| Term Loan B-1A (3 mo. EURIBOR + 4.75%) | 4.75% | 07/10/2026 | EUR | | 1,802 | 2,002,086 |
| Boyd Gaming Corp., Term Loan B (1 wk. USD LIBOR + 2.25%) | 4.39% | 09/15/2023 | | | 826 | 827,078 |
| Caesars Entertainment Operating Co., LLC, Term Loan B (3 mo. USD LIBOR + 2.00%) | 4.11% | 10/06/2024 | | | 43 | 42,999 |
| Caesars Resort Collection, LLC, Term Loan B (1 mo. USD LIBOR + 2.75%) | 4.86% | 12/23/2024 | | | 21,369 | 21,087,114 |
| CityCenter Holdings, LLC, Term Loan B (1 mo. USD LIBOR + 2.25%) | 4.36% | 04/18/2024 | | | 3,662 | 3,666,463 |
| ESH Hospitality, Inc., Term Loan (1 mo. USD LIBOR + 2.00%) | 4.11% | 08/30/2023 | | | 713 | 714,499 |
| Four Seasons Hotels Ltd. (Canada), First Lien Term Loan (1 mo USD LIBOR + 2.00%) | 4.11% | 11/30/2023 | | | 879 | 881,362 |
| Hilton Worldwide Finance, LLC, Term Loan B-2 (1 mo. USD LIBOR + 1.75%) | 3.90% | 06/22/2026 | | | 3,531 | 3,544,122 |
| Markermeer Finance B.V. (Netherlands), Term Loan B-3(f) | — | 12/22/2024 | EUR | | 1,237 | 1,364,023 |
| MGM Growth Properties Operating Partnership L.P., Term Loan B (1 mo. USD LIBOR + 2.00%) | 4.11% | 03/24/2025 | | | 711 | 712,518 |
| PCI Gaming Authority, Term Loan B (1 mo. USD LIBOR + 3.00%) | 5.12% | 05/15/2026 | | | 2,991 | 3,010,962 |
| Penn National Gaming, Inc., Incremental Term Loan B-1 (1 mo. USD LIBOR + 2.25%) | 4.36% | 10/15/2025 | | | 2,984 | 2,996,205 |
| Scientific Games International, Inc., Term Loan B-5 (2 mo. USD LIBOR + 2.75%) | 4.89% | 08/14/2024 | | | 4,016 | 3,974,609 |
| Stars Group (US) Co-Borrower, LLC (Canada), Term Loan (3 mo. USD LIBOR + 3.50%) | 5.83% | 07/10/2025 | | | 9,609 | 9,650,348 |
| Station Casinos, Inc., Term Loan B (1 mo. USD LIBOR + 2.50%) | 4.62% | 06/08/2023 | | | 7,653 | 7,678,050 |
| Tackle Group S.a.r.l. (Luxembourg), Term Loan B(f) | — | 08/02/2024 | EUR | | 3,892 | 4,283,294 |
| Twin River Management Group, Inc., Term Loan B (1 mo. USD LIBOR + 2.75%) | 4.86% | 05/10/2026 | | | 2,094 | 2,096,340 |
| VICI Properties 1 LLC, Term Loan B (1 mo. USD LIBOR + 2.00%) | 4.17% | 12/20/2024 | | | 7,651 | 7,673,230 |
| Wyndham Hotels & Resorts, Inc., Term Loan B (1 mo. USD LIBOR + 1.75%) | 3.86% | 05/30/2025 | | | 2,170 | 2,179,718 |
| Wynn Resorts, Ltd., Term Loan (1 mo. USD LIBOR + 2.25%) | 4.37% | 10/30/2024 | | | 87 | 87,141 |
| | | | | | | 80,504,564 |
| Nonferrous Metals & Minerals–0.61% | | | |
| American Rock Salt Co. LLC, Term Loan (1 mo. USD LIBOR + 3.75%) | 5.86% | 03/21/2025 | | | 1,818 | 1,818,492 |
| Covia Holdings Corp., Term Loan (3 mo. USD LIBOR + 4.00%) | 6.31% | 06/01/2025 | | | 6,459 | 5,356,607 |
| Form Technologies LLC | | | | | | |
| First Lien Term Loan B-2 (3 mo. USD LIBOR + 3.25%)(d) | 5.58% | 01/28/2022 | | | 2,539 | 2,443,472 |
| Second Lien Term Loan (3 mo. USD LIBOR + 8.50%) | 10.83% | 01/30/2023 | | | 25 | 24,803 |
| U.S. Silica Co., Term Loan (1 mo. USD LIBOR + 4.00%) | 6.13% | 05/01/2025 | | | 2,199 | 2,073,455 |
| US Salt, LLC, Term Loan (1 mo. USD LIBOR + 4.75%)(d) | 6.86% | 01/16/2026 | | | 1,492 | 1,497,710 |
| | | | | | | 13,214,539 |
| Oil & Gas–5.04% | | | |
| BCP Raptor, LLC, Term Loan (1 mo. USD LIBOR + 4.25%) | 6.36% | 06/24/2024 | | | 2,404 | 2,201,970 |
| Blackstone CQP Holdco, Term Loan (3 mo. USD LIBOR + 3.50%) | 5.89% | 09/30/2024 | | | 14,885 | 14,908,691 |
| Brazos Delaware II, LLC, Term Loan (1 mo. USD LIBOR + 4.00%) | 6.17% | 05/21/2025 | | | 3,827 | 3,456,753 |
| California Resources Corp. | | | | | | |
| Term Loan (1 mo. USD LIBOR + 10.38%) | 12.49% | 12/31/2021 | | | 3,321 | 2,964,234 |
| Term Loan (1 mo. USD LIBOR + 4.75%) | 6.87% | 12/31/2022 | | | 3,947 | 3,609,580 |
| Centurion Pipeline Co., LLC, Term Loan (1 mo. USD LIBOR + 3.25%) | 5.36% | 09/29/2025 | | | 1,676 | 1,677,645 |
| Crestwood Holdings LLC, Term Loan (1 mo. USD LIBOR + 7.50%) | 9.71% | 03/06/2023 | | | 6,092 | 5,851,153 |
| Delek US Holdings, Inc., Term Loan (3 mo. USD LIBOR + 2.25%) | 4.58% | 03/31/2025 | | | 5,727 | 5,706,597 |
| Encino Acquisition Partners Holdings, LLC, Second Lien Term Loan (1 mo. USD LIBOR + 6.75%)(d) | 8.86% | 10/29/2025 | | | 3,460 | 2,594,750 |
See accompanying Notes to Financial Statements which are an integral part of the financial statements.
| 24 | Invesco Floating Rate Fund |
| | Interest
Rate | Maturity
Date | Principal
Amount
(000)(a) | Value |
| Oil & Gas–(continued) | |
| Fieldwood Energy LLC | | | | | |
| First Lien Term Loan (3 mo. USD LIBOR + 5.25%) | 7.51% | 04/11/2022 | | $7,492 | $6,639,588 |
| Second Lien Term Loan (3 mo. USD LIBOR + 7.25%) | 9.51% | 04/11/2023 | | 8,514 | 6,537,448 |
| Glass Mountain Pipeline Holdings, LLC, Term Loan (3 mo. USD LIBOR + 4.50%) | 7.12% | 12/23/2024 | | 2,072 | 2,004,869 |
| Gulf Finance, LLC, Term Loan B (1 mo. USD LIBOR + 5.25%) | 7.52% | 08/25/2023 | | 2,914 | 2,312,962 |
| HGIM Corp., Term Loan (3 mo. USD LIBOR + 6.00%) | 8.03% | 07/02/2023 | | 3,437 | 3,118,768 |
| Lucid Energy Group II Borrower, LLC, Term Loan (1 mo. USD LIBOR + 3.00%) | 5.11% | 02/17/2025 | | 2,794 | 2,590,033 |
| McDermott Technology (Americas), Inc., Term Loan B (1 mo. USD LIBOR + 5.00%) | 7.11% | 05/12/2025 | | 10,027 | 9,231,193 |
| Moda Ingleside Energy Center LLC, Term Loan (1 mo. USD LIBOR + 3.25%) | 5.36% | 09/29/2025 | | 1,207 | 1,208,227 |
| Navitas Midstream Midland Basin, LLC, Term Loan (1 mo. USD LIBOR + 4.50%) | 6.61% | 12/13/2024 | | 4,232 | 3,981,185 |
Osum Production Corp. (Canada), Term Loan (3 mo. USD LIBOR + 9.50%)
(Acquired 06/19/2019-06/28/2019; Cost $4,294,416)(d) | 11.83% | 06/27/2022 | | 4,614 | 4,245,024 |
Paragon Offshore Finance Co., Term Loan
(Acquired 07/18/2014; Cost $16,629)(d)(i)(j) | 0.00% | 07/16/2021 | | 17 | 0 |
| Petroleum GEO-Services ASA (Norway), Term Loan (3 mo. USD LIBOR + 2.50%) | 4.83% | 03/19/2021 | | 6,779 | 6,430,245 |
| Prairie ECI Acquiror L.P., Term Loan B (3 mo. USD LIBOR + 4.75%) | 7.08% | 03/11/2026 | | 3,656 | 3,581,251 |
| Seadrill Operating L.P. (United Kingdom), Term Loan (3 mo. USD LIBOR + 6.00%) | 8.33% | 02/21/2021 | | 19,884 | 11,860,762 |
| Southcross Energy Partners, L.P. | | | | | |
| DIP Term Loan (3 mo. Prime Rate + 5.25%)(i) | 10.50% | 10/01/2019 | | 438 | 425,461 |
| First Lien Term Loan (3 mo. Prime Rate + 5.25%)(i) | 10.50% | 10/01/2019 | | 135 | 131,027 |
| PIK Term Loan(i)(j) | 0.00% | 08/04/2021 | | 1,567 | 1,172,537 |
| Tribune Resources, Inc., Term Loan (1 mo. USD LIBOR + 6.50%)(d) | 8.69% | 03/30/2023 | | 917 | 889,340 |
| | | | | | 109,331,293 |
| Publishing–1.41% | | |
| Adtalem Global Education, Inc., Term Loan B (1 mo. USD LIBOR + 3.00%) | 5.11% | 04/11/2025 | | 1,729 | 1,736,502 |
| Ascend Learning, LLC, Term Loan (1 mo. USD LIBOR + 3.00%) | 5.11% | 07/12/2024 | | 54 | 53,403 |
| Cengage Learning, Inc., Term Loan B (1 mo. USD LIBOR + 4.25%) | 6.37% | 06/07/2023 | | 7,666 | 7,367,170 |
| Clear Channel Outdoor Holdings, Inc., Term Loan B(h) | 0.00% | 08/15/2026 | | 11,130 | 11,137,654 |
| Merrill Communications LLC, Term Loan (3 mo. USD LIBOR + 5.25%) | 7.51% | 06/01/2022 | | 624 | 627,063 |
| Nielsen Finance LLC, Term Loan B-4 (1 mo. USD LIBOR + 2.00%) | 4.21% | 10/04/2023 | | 820 | 817,102 |
| ProQuest LLC, Term Loan (1 mo. USD LIBOR + 3.25%) | 5.36% | 10/24/2021 | | 1,867 | 1,868,868 |
| Southern Graphics, Inc., First Lien Term Loan (2 mo. USD LIBOR + 3.25%) | 5.38% | 12/31/2022 | | 5,073 | 4,106,982 |
| Tribune Media Co., Term Loan C (1 mo. USD LIBOR + 3.00%) | 5.11% | 01/27/2024 | | 2,946 | 2,947,090 |
| | | | | | 30,661,834 |
| Radio & Television–2.36% | | |
| Diamond Sports Group LLC, Term Loan B (1 mo. USD LIBOR + 3.25%) | 5.39% | 08/24/2026 | | 9,313 | 9,334,605 |
| Gray Television, Inc., Term Loan C (3 mo. USD LIBOR + 2.50%) | 4.83% | 01/02/2026 | | 5,877 | 5,886,834 |
| iHeartCommunications, Inc., Term Loan (1 mo. USD LIBOR + 4.00%) | 6.23% | 05/01/2026 | | 3,865 | 3,882,992 |
| Mission Broadcasting, Inc., Term Loan B-3 (1 mo. USD LIBOR + 2.25%) | 4.48% | 01/17/2024 | | 353 | 352,160 |
| Nexstar Broadcasting, Inc. | | | | | |
| Term Loan B-3 (1 mo. USD LIBOR + 2.25%) | 4.37% | 01/17/2024 | | 1,772 | 1,767,809 |
| Term Loan B-4 (3 mo. USD LIBOR + 2.75%) | 4.89% | 06/20/2026 | | 17,401 | 17,431,580 |
| Sinclair Television Group, Inc. | | | | | |
| Term Loan B (1 mo. USD LIBOR + 2.25%) | 4.37% | 01/03/2024 | | 7,972 | 7,967,971 |
| Term Loan B-2b (1 mo. USD LIBOR + 2.50%) | 4.54% | 09/30/2026 | | 4,448 | 4,452,516 |
| | | | | | 51,076,467 |
| Retailers (except Food & Drug)–1.04% | | |
| Bass Pro Group, LLC, Term Loan (1 mo. USD LIBOR + 5.00%) | 7.11% | 09/25/2024 | | 9,303 | 8,873,468 |
| BJ’s Wholesale Club, Inc., First Lien Term Loan B (1 mo. USD LIBOR + 2.75%) | 4.94% | 02/03/2024 | | 98 | 98,279 |
See accompanying Notes to Financial Statements which are an integral part of the financial statements.
| 25 | Invesco Floating Rate Fund |
| | Interest
Rate | Maturity
Date | Principal
Amount
(000)(a) | Value |
| Retailers (except Food & Drug)–(continued) | |
Claire’s Stores, Inc., First Lien Term Loan (6 mo. USD LIBOR + 7.25%)
(Acquired 10/12/2018; Cost $109,393) | 9.94% | 09/15/2038 | | $ 109 | $ 202,378 |
| Fossil Group, Inc., Term Loan (1 mo. USD LIBOR + 8.00%) | 10.09% | 12/31/2020 | | 894 | 895,651 |
| Fullbeauty Brands Holdings Corp. | | | | | |
| Term Loan (3 mo. USD LIBOR + 10.00%)(d) | 12.47% | 02/07/2022 | | 760 | 740,724 |
| Term Loan B-1 (3 mo. USD LIBOR + 8.50%) | 11.47% | 02/07/2024 | | 1,155 | 1,108,880 |
| Term Loan B-2 | 10.77% | 02/07/2022 | | 47 | 47,279 |
| Party City Holdings Inc., Term Loan (1 mo. USD LIBOR + 2.50%) | 4.62% | 08/19/2022 | | 1,324 | 1,310,677 |
| Payless, Inc. | | | | | |
| Term Loan A-1(j) | 0.00% | 02/10/2022 | | 1,535 | 805,787 |
| Term Loan A-2(j) | 0.00% | 08/10/2022 | | 2,881 | 1,022,753 |
| Petco Animal Supplies, Inc., Term Loan (3 mo. USD LIBOR + 3.25%) | 5.51% | 01/26/2023 | | 9,682 | 6,987,084 |
| Vivarte (France), PIK Term Loan, 7.00% PIK Rate, 4.00% Cash Rate(g) | 7.00% | 10/29/2019 | EUR | 1,156 | 492,314 |
| | | | | | 22,585,274 |
| Surface Transport–1.16% | | |
| Commercial Barge Line Co., First Lien Term Loan (1 mo. USD LIBOR + 8.75%) | 10.87% | 11/12/2020 | | 6,312 | 3,786,935 |
| Kenan Advantage Group, Inc. (The) | | | | | |
| Term Loan (1 mo. USD LIBOR + 3.00%) | 5.11% | 07/29/2022 | | 1,950 | 1,886,600 |
| Term Loan (1 mo. USD LIBOR + 3.00%) | 5.11% | 07/29/2022 | | 7,282 | 7,045,665 |
| Odyssey Logistics & Technology Corp., First Lien Term Loan (1 mo. USD LIBOR + 4.00%) | 6.11% | 10/12/2024 | | 27 | 26,726 |
| PODS LLC, Term Loan B-4 (1 mo. USD LIBOR + 2.75%) | 5.06% | 12/06/2024 | | 5,682 | 5,642,568 |
| U.S. Shipping Corp., Term Loan B-2 (1 mo. USD LIBOR + 4.25%) | 6.36% | 06/26/2021 | | 3,184 | 3,034,799 |
| XPO Logistics, Inc. | | | | | |
| Term Loan B (1 mo. USD LIBOR + 2.00%) | 4.11% | 02/24/2025 | | 824 | 825,712 |
| Term Loan B-1 (1 mo. USD LIBOR + 2.50%) | 4.68% | 02/24/2025 | | 2,844 | 2,860,145 |
| | | | | | 25,109,150 |
| Telecommunications–8.59% | | |
| CenturyLink, Inc., Term Loan B (1 mo. USD LIBOR + 2.75%) | 4.86% | 01/31/2025 | | 21,691 | 21,416,280 |
| Colorado Buyer, Inc. | | | | | |
| First Lien Incremental Term Loan (1 mo. USD LIBOR + 4.00%) | 6.21% | 05/01/2024 | | 11,952 | 11,578,765 |
| Term Loan (1 mo. USD LIBOR + 3.00%) | 5.21% | 05/01/2024 | | 672 | 631,852 |
| Consolidated Communications, Inc., Term Loan (1 mo. USD LIBOR + 3.00%) | 5.12% | 10/05/2023 | | 11,952 | 11,476,757 |
| Frontier Communications Corp., Term Loan B-1 (1 mo. USD LIBOR + 3.75%) | 5.87% | 06/15/2024 | | 2,075 | 2,055,523 |
| Hargray Communications Group, Inc., Term Loan (1 mo. USD LIBOR + 3.00%) | 5.11% | 05/16/2024 | | 507 | 504,877 |
| Intelsat Jackson Holdings S.A. (Luxembourg) | | | | | |
| Term Loan B-3 (1 mo. USD LIBOR + 3.75%) | 5.90% | 11/27/2023 | | 679 | 679,845 |
| Term Loan B-5 (2 mo. USD LIBOR + 6.63%) | 6.62% | 01/02/2024 | | 4,524 | 4,583,239 |
| Level 3 Financing, Inc., Term Loan B (1 mo. USD LIBOR + 2.25%) | 4.36% | 02/22/2024 | | 16,482 | 16,512,933 |
| Lumentum Holdings, Inc., Term Loan (1 mo. USD LIBOR + 2.50%)(d) | 4.61% | 12/10/2025 | | 1,196 | 1,201,527 |
| Midcontinent Communications, Term Loan B (1 mo. USD LIBOR + 2.25%) | 4.28% | 07/29/2026 | | 1,923 | 1,932,520 |
| MLN US Holdco LLC | | | | | |
| First Term Loan B (1 mo. USD LIBOR + 4.50%) | 6.61% | 11/30/2025 | | 4,785 | 4,602,431 |
| Second Lien Term Loan (3 mo. USD LIBOR + 8.75%) | 10.86% | 11/30/2026 | | 2,179 | 1,902,729 |
| MTN Infrastructure TopCo, Inc., Term Loan (1 mo. USD LIBOR + 3.00%) | 5.11% | 11/15/2024 | | 3,475 | 3,421,402 |
| Odyssey Investissement S.A.S. (France), Term Loan B (3 mo. EURIBOR + 3.25%) | 3.25% | 04/25/2025 | EUR | 3,213 | 3,542,741 |
| SBA Senior Finance II LLC, Term Loan (1 mo. USD LIBOR + 2.00%) | 4.12% | 04/11/2025 | | 13,598 | 13,538,864 |
| Sprint Communications, Inc. | | | | | |
| Incremental Term Loan (1 mo. USD LIBOR + 3.00%) | 5.13% | 02/02/2024 | | 9,650 | 9,642,744 |
| Term Loan (1 mo. USD LIBOR + 2.50%) | 4.63% | 02/02/2024 | | 24,576 | 24,453,181 |
| Syniverse Holdings, Inc., Term Loan C (1 mo. USD LIBOR + 5.00%) | 7.20% | 03/09/2023 | | 4,349 | 4,072,813 |
| Telesat LLC (Canada), Term Loan B-4 (3 mo. USD LIBOR + 2.50%) | 4.83% | 11/17/2023 | | 16,662 | 16,689,424 |
See accompanying Notes to Financial Statements which are an integral part of the financial statements.
| 26 | Invesco Floating Rate Fund |
| | Interest
Rate | Maturity
Date | Principal
Amount
(000)(a) | Value |
| Telecommunications–(continued) | |
| U.S. TelePacific Corp., Term Loan (3 mo. USD LIBOR + 5.00%) | 7.33% | 05/02/2023 | | $ 6,129 | $ 5,996,980 |
| Windstream Services, LLC | | | | | |
| DIP Term Loan (1 mo. USD LIBOR + 2.50%)(i) | 4.62% | 02/26/2021 | | 3,740 | 3,760,900 |
| Term Loan B-6 (3 mo. Prime Rate + 5.00%)(i)(j) | 10.25% | 03/29/2021 | | 11,780 | 12,011,461 |
| Term Loan B-7 (3 mo. Prime Rate + 4.25%)(i) | 9.50% | 02/17/2024 | | 5,761 | 5,810,308 |
| Zayo Group, LLC | | | | | |
| Term Loan B-1 (1 mo. USD LIBOR + 2.00%) | 4.11% | 01/19/2021 | | 880 | 881,150 |
| Term Loan B-2 (1 mo. USD LIBOR + 2.25%) | 4.36% | 01/19/2024 | | 3,302 | 3,307,954 |
| | | | | | 186,209,200 |
| Utilities–5.64% | | |
| AES Corp. (The), Term Loan (3 mo. USD LIBOR + 1.75%) | 3.88% | 05/24/2022 | | 418 | 418,928 |
| AI Alpine AT BidCo GmbH | | | | | |
| Term Loan B (1 mo. USD LIBOR + 2.75%)(d) | 5.00% | 10/25/2025 | | 34 | 33,154 |
| Term Loan B (1 mo. EURIBOR + 3.00%) | 3.00% | 10/31/2025 | EUR | 962 | 1,050,418 |
| Aria Energy Operating LLC, Term Loan (1 mo. USD LIBOR + 4.50%) | 6.61% | 05/27/2022 | | 894 | 894,537 |
| Brookfield WEC Holdings, Inc., Incremental Term Loan(h) | 0.00% | 08/01/2025 | | 533 | 533,976 |
| Calpine Construction Finance Co., L.P., Term Loan (1 mo. USD LIBOR + 2.50%) | 4.61% | 01/15/2025 | | 11,387 | 11,372,382 |
| Calpine Corp. | | | | | |
| Term Loan B-10 (1 mo. USD LIBOR + 2.50%) | 4.61% | 08/12/2026 | | 4,967 | 4,960,520 |
| Term Loan B-5 (3 mo. USD LIBOR + 2.50%) | 4.83% | 01/15/2024 | | 9,669 | 9,672,833 |
| Term Loan B-9 (2 mo. USD LIBOR + 2.75%) | 5.08% | 04/05/2026 | | 13,689 | 13,695,988 |
| Eastern Power, LLC, Term Loan (1 mo. USD LIBOR + 3.75%) | 5.86% | 10/02/2023 | | 7,836 | 7,873,340 |
| Granite Acquisition, Inc. | | | | | |
| First Lien Term Loan B (3 mo. USD LIBOR + 3.50%) | 5.82% | 12/17/2021 | | 4,564 | 4,586,538 |
| First Lien Term Loan C (3 mo. USD LIBOR + 3.50%) | 5.83% | 12/17/2021 | | 678 | 681,373 |
| Second Lien Term Loan B (3 mo. USD LIBOR + 7.25%) | 9.58% | 12/19/2022 | | 956 | 957,369 |
| Heritage Power, LLC, Term Loan B (3 mo. USD LIBOR + 6.00%) | 8.21% | 07/01/2026 | | 5,384 | 5,293,474 |
| Invenergy Thermal Operating I LLC, Term Loan (1 mo. USD LIBOR + 3.50%) | 5.61% | 08/28/2025 | | 253 | 254,342 |
| KAMC Holdings, Inc., First Lien Term Loan (3 mo. USD LIBOR + 4.00%) | 6.18% | 08/14/2026 | | 1,876 | 1,876,187 |
| Lightstone Holdco LLC | | | | | |
| Term Loan B (1 mo. USD LIBOR + 3.75%) | 5.86% | 01/30/2024 | | 8,317 | 8,034,254 |
| Term Loan C (1 mo. USD LIBOR + 3.75%) | 5.86% | 01/30/2024 | | 469 | 453,145 |
| Nautilus Power, LLC, Term Loan (1 mo. USD LIBOR + 4.25%) | 6.36% | 05/16/2024 | | 4,548 | 4,546,041 |
| Pacific Gas and Electric Co. | | | | | |
| Delayed Draw Term Loan(e) | 0.00% | 01/29/2020 | | 1,983 | 1,983,193 |
| DIP Term Loan (1 mo. USD LIBOR + 2.25%) | 4.50% | 12/31/2020 | | 5,913 | 5,949,581 |
| Pike Corp., Term Loan B (1 mo. USD LIBOR + 3.25%) | 5.40% | 07/24/2026 | | 2,438 | 2,442,996 |
| PowerTeam Services, LLC, First Lien Term Loan (3 mo. USD LIBOR + 3.25%) | 5.58% | 03/06/2025 | | 2,315 | 2,095,453 |
| Revere Power, LLC | | | | | |
| Term Loan B (3 mo. USD LIBOR + 4.25%) | 6.58% | 03/27/2026 | | 1,364 | 1,356,410 |
| Term Loan C (3 mo. USD LIBOR + 4.25%) | 6.58% | 03/27/2026 | | 212 | 210,847 |
| Southeast PowerGen LLC, Term Loan B (1 mo. USD LIBOR + 3.50%) | 5.62% | 12/02/2021 | | 561 | 537,728 |
| TerraForm Power Operating, LLC, Term Loan (1 mo. USD LIBOR + 2.00%) | 4.11% | 11/08/2022 | | 54 | 54,130 |
| USIC Holding, Inc., First Lien Term Loan (1 mo. USD LIBOR + 3.00%) | 5.11% | 12/08/2023 | | 177 | 175,270 |
| Vistra Operations Co. LLC | | | | | |
| Incremental Term Loan (1 mo. USD LIBOR + 2.00%) | 4.15% | 12/31/2025 | | 20,320 | 20,368,195 |
| Term Loan (1 mo. USD LIBOR + 2.00%) | 4.11% | 08/04/2023 | | 9,967 | 9,989,156 |
| | | | | | 122,351,758 |
| Total Variable Rate Senior Loan Interests (Cost $1,901,631,758) | 1,848,813,232 |
See accompanying Notes to Financial Statements which are an integral part of the financial statements.
| 27 | Invesco Floating Rate Fund |
| | Interest
Rate | Maturity
Date | Principal
Amount
(000)(a) | Value |
| U.S. Dollar Denominated Bonds & Notes–7.76% |
| Aerospace & Defense–0.75% | | |
| TransDigm, Inc.(k) | 6.25% | 03/15/2026 | | $15,087 | $ 16,312,517 |
| Air Transport–0.17% | | |
| Mesa Airlines, Inc. Class B | 5.75% | 07/15/2025 | | 3,766 | 3,745,735 |
| Automotive–0.24% | | |
| Allison Transmission, Inc.(k) | 5.88% | 06/01/2029 | | 1,581 | 1,699,575 |
| IHO Verwaltungs GmbH (Germany)(k) | 4.75% | 09/15/2026 | | 1,965 | 1,908,506 |
| Panther BF Aggregator 2 L.P. / Panther Finance Co., Inc.(k) | 6.25% | 05/15/2026 | | 1,488 | 1,547,520 |
| | | | | | 5,155,601 |
| Business Equipment & Services–0.62% | | |
| Dun & Bradstreet Corp. (The)(k) | 6.87% | 08/15/2026 | | 1,480 | 1,606,725 |
| Prime Security Services Borrower, LLC / Prime Finance, Inc.(k) | 5.25% | 04/15/2024 | | 5,890 | 6,098,565 |
| Prime Security Services Borrower, LLC/Prime Finance, Inc.(k) | 5.75% | 04/15/2026 | | 5,425 | 5,669,125 |
| | | | | | 13,374,415 |
| Cable & Satellite Television–1.46% | | |
| Altice Financing S.A. (Luxembourg)(k) | 6.63% | 02/15/2023 | | 851 | 879,721 |
| Altice Financing S.A. (Luxembourg)(k) | 7.50% | 05/15/2026 | | 10,469 | 11,175,658 |
| Altice France S.A. (France)(k) | 8.12% | 02/01/2027 | | 2,763 | 3,053,115 |
| Altice France S.A. (France)(k) | 7.37% | 05/01/2026 | | 3,732 | 3,993,240 |
| CSC Holdings, LLC(k) | 5.50% | 05/15/2026 | | 10,933 | 11,588,980 |
| Virgin Media Secured Finance PLC (United Kingdom)(k) | 5.50% | 08/15/2026 | | 1,027 | 1,077,066 |
| | | | | | 31,767,780 |
| Chemicals & Plastics–0.15% | | |
| Avantor, Inc.(k) | 6.00% | 10/01/2024 | | 2,940 | 3,160,500 |
| Containers & Glass Products–0.57% | | |
| Ardagh Packaging Finance PLC / Ardagh Holdings USA, Inc. (Ireland)(k) | 4.25% | 09/15/2022 | | 1,695 | 1,722,544 |
| Ardagh Packaging Finance PLC/Ardagh Holdings USA, Inc. (Ireland)(k) | 4.63% | 05/15/2023 | | 1,643 | 1,685,652 |
| Ardagh Packaging Finance PLC/Ardagh Holdings USA, Inc.(k) | 4.13% | 08/15/2026 | | 3,346 | 3,391,941 |
| Berry Global, Inc.(k) | 4.87% | 07/15/2026 | | 2,312 | 2,433,380 |
| Reynolds Group Issuer, Inc./LLC | 5.75% | 10/15/2020 | | 130 | 130,347 |
| Reynolds Group Issuer, Inc./LLC (3 mo. USD LIBOR + 3.50%)(k)(l) | 5.80% | 07/15/2021 | | 1,868 | 1,870,335 |
| Trivium Packaging Finance B.V. (Netherlands)(k) | 5.50% | 08/15/2026 | | 1,069 | 1,133,140 |
| | | | | | 12,367,339 |
| Drugs–0.02% | | |
| Catalent Pharma Solutions, Inc.(k) | 5.00% | 07/15/2027 | | 322 | 338,135 |
| Electronics & Electrical–1.58% | | |
| CommScope, Inc.(k) | 8.25% | 03/01/2027 | | 2,356 | 2,317,715 |
| CommScope, Inc.(k) | 6.00% | 03/01/2026 | | 7,705 | 7,886,068 |
| Dell International LLC/EMC Corp.(k) | 5.45% | 06/15/2023 | | 1,385 | 1,506,254 |
| Dell International LLC/EMC Corp.(k) | 4.90% | 10/01/2026 | | 8,835 | 9,452,794 |
| Dell International LLC/EMC Corp.(k) | 5.30% | 10/01/2029 | | 11,044 | 11,983,367 |
| Riverbed Technology, Inc.(k) | 8.87% | 03/01/2023 | | 2,004 | 1,182,360 |
| | | | | | 34,328,558 |
| Food Service–0.05% | | |
| eG Global Finance PLC (United Kingdom)(k) | 6.75% | 02/07/2025 | | 1,211 | 1,173,156 |
See accompanying Notes to Financial Statements which are an integral part of the financial statements.
| 28 | Invesco Floating Rate Fund |
| | Interest
Rate | Maturity
Date | Principal
Amount
(000)(a) | Value |
| Health Care–0.33% | | |
| CHS/Community Health Systems, Inc.(k) | 8.00% | 03/15/2026 | | $ 6,186 | $ 5,954,025 |
| IQVIA, Inc.(k) | 5.00% | 05/15/2027 | | 1,209 | 1,280,029 |
| | | | | | 7,234,054 |
| Industrial Equipment–0.43% | | |
| F-Brasile S.p.A / F-Brasile US LLC (Italy)(k) | 7.38% | 08/15/2026 | | 9,234 | 9,418,680 |
| Lodging & Casinos–0.08% | | |
| ESH Hospitality, Inc.(k) | 5.25% | 05/01/2025 | | 1,390 | 1,440,387 |
| VICI Properties 1 LLC / VICI FC, Inc. | 8.00% | 10/15/2023 | | 205 | 225,135 |
| | | | | | 1,665,522 |
| Nonferrous Metals & Minerals–0.13% | | |
| TiZir Ltd. (United Kingdom)(k) | 9.50% | 07/19/2022 | | 2,611 | 2,760,478 |
| Oil & Gas–0.01% | | |
| Pacific Drilling S.A.(k) | 8.38% | 10/01/2023 | | 155 | 142,019 |
| Publishing–0.42% | | |
| Clear Channel Worldwide Holdings, Inc.(k) | 5.13% | 08/15/2027 | | 7,906 | 8,291,417 |
| Clear Channel Worldwide Holdings, Inc.(k) | 9.25% | 02/15/2024 | | 672 | 738,360 |
| | | | | | 9,029,777 |
| Radio & Television–0.66% | | |
| Clear Channel International B.V.(k) | 8.75% | 12/15/2020 | | 5,235 | 5,349,489 |
| Diamond Sports Group LLC/Diamond Sports Finance Co.(k) | 5.38% | 08/15/2026 | | 2,720 | 2,862,800 |
| iHeartCommunications, Inc.(k) | 5.25% | 08/15/2027 | | 1,321 | 1,392,242 |
| iHeartCommunications, Inc. | 6.37% | 05/01/2026 | | 1,554 | 1,686,514 |
| iHeartCommunications, Inc. | 8.37% | 05/01/2027 | | 2,786 | 3,019,176 |
| | | | | | 14,310,221 |
| Steel–0.00% | | |
| ERP Iron Ore, LLC 8.00% PIK Rate(d)(j) | 0.00% | 12/31/2019 | | 56 | 39,038 |
| Telecommunications–0.06% | | |
| Goodman Networks, Inc. | 8.00% | 05/11/2022 | | 2,535 | 1,305,469 |
| Windstream Services, LLC / Windstream Finance Corp.(i)(k) | 9.00% | 06/30/2025 | | 12 | 7,020 |
| | | | | | 1,312,489 |
| Utilities–0.03% | | |
| Calpine Corp.(k) | 5.25% | 06/01/2026 | | 725 | 736,781 |
| Total U.S. Dollar Denominated Bonds & Notes (Cost $165,228,306) | 168,372,795 |
| | | | Shares | |
| Common Stocks & Other Equity Interests–2.12%(m) |
| Aerospace & Defense–0.10% | | |
| IAP Worldwide Services, Inc.(d)(n) | | | | 134 | 2,242,390 |
| Automotive–0.05% | | |
| Dayco Products, LLC(n) | | | | 3,261 | 114,135 |
| Dayco Products, LLC(n) | | | | 3,266 | 114,310 |
| ThermaSys Corp.(d)(n) | | | | 1,949,645 | 619,012 |
| Transtar Holding Co., Class A(d)(n) | | | | 3,149,478 | 267,706 |
| | | | | | 1,115,163 |
| Building & Development–0.07% | | |
| Lake at Las Vegas Joint Venture, LLC, Class A(d)(n) | | | | 518 | 0 |
See accompanying Notes to Financial Statements which are an integral part of the financial statements.
| 29 | Invesco Floating Rate Fund |
| | | | Shares | Value |
| Building & Development–(continued) |
| Lake at Las Vegas Joint Venture, LLC, Class B(d)(n) | | | | 4 | $ 0 |
| Masonite International Corp.(n) | | | | 27,093 | 1,446,495 |
| | | | | | 1,446,495 |
| Business Equipment & Services–0.07% | | |
| Checkout Holding Corp.(d)(n) | | | | 15,070 | 79,117 |
| Crossmark Holdings, Inc., Wts. expiring 07/26/2024(d)(n) | | | | 11,489 | 932,953 |
| Crossmark Holdings, Inc., Wts. expiring 07/26/2024(d)(n) | | | | 519 | 0 |
| EmployBridge Holding Co.(n) | | | | 43,971 | 385,318 |
| | | | | | 1,397,388 |
| Cable & Satellite Television–0.14% | | |
| Ion Media Networks, Inc.(d)(n) | | | | 4,471 | 2,962,037 |
| Drugs–0.00% | | |
| Envigo RMS Holding Corp., Class A, Wts. expiring 04/29/2024(d)(n) | | | | 3,490 | 19,963 |
| Envigo RMS Holding Corp., Class B, Wts. expiring 04/29/2024(d)(n) | | | | 5,595 | 32,003 |
| | | | | | 51,966 |
| Food Products–0.00% | | |
| QCE LLC(d)(n) | | | | 17 | 0 |
| Health Care–0.00% | | |
| Millennium International, Ltd. | | | | 259,087 | 22,670 |
| Insurance–0.00% | | |
| Western and Southern Life Insurance Co. (The) | | | | 11 | 312 |
| Lodging & Casinos–0.12% | | |
| Caesars Entertainment Corp.(n) | | | | 83,880 | 965,459 |
| Twin River Worldwide Holdings, Inc. | | | | 74,652 | 1,690,868 |
| | | | | | 2,656,327 |
| Oil & Gas–0.65% | | |
| AF Global, Inc.(d)(n) | | | | 1,049 | 58,744 |
| C&J Energy Services, Inc.(n) | | | | 47,780 | 456,777 |
| Fieldwood Energy LLC(n) | | | | 53,244 | 1,544,076 |
| Fieldwood Energy LLC(n) | | | | 14,375 | 416,875 |
| HGIM Corp.(d)(n) | | | | 6,310 | 78,875 |
| HGIM Corp., Wts. expiring 07/02/2043(d)(n) | | | | 28,193 | 352,412 |
| Pacific Drilling S.A.(n) | | | | 178,023 | 1,082,380 |
| Paragon Offshore Finance Co., Class A (Cayman Islands)(d)(i)(n) | | | | 4,595 | 1,356 |
| Paragon Offshore Finance Co., Class B (Cayman Islands)(d)(i)(n) | | | | 2,298 | 64,919 |
| Samson Investment Co., Class A(n) | | | | 261,209 | 6,366,969 |
| Transocean Ltd.(n) | | | | 428,980 | 1,951,859 |
| Tribune Resources, Inc., Wts., expiring 04/03/2023(d)(n) | | | | 170,533 | 5,116 |
| Tribune Resources, Inc.(n) | | | | 658,667 | 1,786,634 |
| | | | | | 14,166,992 |
| Publishing–0.20% | | |
| Clear Channel Outdoor Holdings, Inc.(n) | | | | 646,324 | 1,680,443 |
| F&W Publications, Inc.(d)(n) | | | | 288 | 0 |
| Merrill Communications LLC, Class A(d)(n) | | | | 133,776 | 2,608,632 |
| Tribune Publishing Co. | | | | 2,262 | 17,304 |
| | | | | | 4,306,379 |
See accompanying Notes to Financial Statements which are an integral part of the financial statements.
| 30 | Invesco Floating Rate Fund |
| | | | Shares | Value |
| Radio & Television–0.17% | | |
| iHeartCommunications, Inc., Wts., expiring 05/01/2039(n) | | | | 242,574 | $ 3,240,061 |
| iHeartMedia, Inc.(n) | | | | 32,283 | 445,505 |
| | | | | | 3,685,566 |
| Retailers (except Food & Drug)–0.05% | | |
| Claire’s Stores, Inc.(n) | | | | 1,210,692 | 432,500 |
| Fullbeauty Brands Holdings Corp.(d)(n) | | | | 6,173 | 509,272 |
| Payless, Inc.(d)(n) | | | | 146,073 | 0 |
| Toys ’R’ Us-Delaware, Inc. | | | | 11 | 52,521 |
| | | | | | 994,293 |
| Surface Transport–0.00% | | |
| U.S. Shipping Corp.(d)(n) | | | | 6,189 | 62 |
| U.S. Shipping Corp., CPR(d)(n) | | | | 87,805 | 74,634 |
| | | | | | 74,696 |
| Telecommunications–0.01% | | |
| Consolidated Communications Holdings, Inc. | | | | 32,797 | 132,172 |
| Goodman Networks, Inc.(d)(n) | | | | 159,473 | 0 |
| | | | | | 132,172 |
| Utilities–0.49% | | |
| Bicent Power, LLC, Series A, Wts. expiring 08/21/2022(d)(n) | | | | 101 | 0 |
| Bicent Power, LLC, Series B, Wts. expiring 08/21/2022(d)(n) | | | | 165 | 0 |
| Vistra Energy Corp. | | | | 410,978 | 10,253,901 |
| Vistra Operations Co. LLC, Rts. expiring 12/31/2046(n) | | | | 410,978 | 337,002 |
| Vistra Operations Co. LLC(d)(n) | | | | 606,090 | 33,335 |
| | | | | | 10,624,238 |
| Total Common Stocks & Other Equity Interests (Cost $73,199,586) | 45,879,084 |
| | Interest
Rate | Maturity
Date | Principal
Amount
(000)(a) | |
| Non-U.S. Dollar Denominated Bonds & Notes–1.14% |
| Automotive–0.21% | | |
| Federal-Mogul Holdings Corp. (3 mo. EURIBOR + 4.88%)(k)(l) | 4.88% | 04/15/2024 | EUR | 2,000 | 2,181,525 |
| Superior Industries International, Inc.(k) | 6.00% | 06/15/2025 | EUR | 535 | 499,940 |
| Tenneco, Inc.(k) | 5.00% | 07/15/2024 | EUR | 1,718 | 1,924,477 |
| | | | | | 4,605,942 |
| Building & Development–0.03% | | |
| Haya Finance 2017 S.A. (Spain) (3 mo. EURIBOR + 5.13%)(k)(l) | 5.12% | 11/15/2022 | EUR | 291 | 267,216 |
| Haya Finance 2017 S.A. (Spain)(k) | 5.25% | 11/15/2022 | EUR | 344 | 315,912 |
| | | | | | 583,128 |
| Cable & Satellite Television–0.14% | | |
| Altice Finco S.A. (Luxembourg)(k) | 4.75% | 01/15/2028 | EUR | 1,299 | 1,380,521 |
| Altice Luxembourg S.A. (Luxembourg)(k) | 8.00% | 05/15/2027 | EUR | 462 | 546,564 |
| Altice Luxembourg S.A. REGS (Luxembourg)(k) | 8.00% | 05/15/2027 | EUR | 947 | 1,120,338 |
| | | | | | 3,047,423 |
| Containers & Glass Products–0.01% | | |
| Trivium Packaging Finance B.V. (Netherlands)(k) | 3.75% | 08/15/2026 | EUR | 145 | 170,661 |
See accompanying Notes to Financial Statements which are an integral part of the financial statements.
| 31 | Invesco Floating Rate Fund |
| | Interest
Rate | Maturity
Date | Principal
Amount
(000)(a) | Value |
| Financial Intermediaries–0.32% | | |
| AnaCap Financial Europe S.A. SICAV-RAIF (Luxembourg) (3 mo. EURIBOR + 5.00%)(k)(l) | 5.00% | 08/01/2024 | EUR | 500 | $488,805 |
| Cabot Financial Luxembourg II S.A. (United Kingdom) (3 mo. EURIBOR + 6.38%)(k)(l) | 6.38% | 06/14/2024 | EUR | 880 | 1,000,889 |
| Garfunkelux Holdco 3 S.A. (Luxembourg) (3 mo. EURIBOR + 4.50%)(k)(l) | 4.50% | 09/01/2023 | EUR | 336 | 326,241 |
| Garfunkelux Holdco 3 S.A. (Luxembourg) (3 mo. EURIBOR + 3.50%)(k)(l) | 3.50% | 09/01/2023 | EUR | 1,402 | 1,333,282 |
| Newday Bondco Plc (Jersey)(k) | 7.37% | 02/01/2024 | GBP | 1,370 | 1,543,323 |
| Newday Bondco Plc (Jersey) (3 mo. GBP LIBOR + 6.50%)(k)(l) | 7.27% | 02/01/2023 | GBP | 1,955 | 2,201,548 |
| | | | | | 6,894,088 |
| Food Service–0.02% | | |
| eG Global Finance PLC REGS (United Kingdom)(k) | 3.63% | 02/07/2024 | EUR | 163 | 174,807 |
| eG Global Finance PLC REGS (United Kingdom)(k) | 4.37% | 02/07/2025 | EUR | 223 | 238,961 |
| | | | | | 413,768 |
| Health Care–0.07% | | |
| IDH Finance Plc (United Kingdom) (3 mo. GBP LIBOR + 6.00%)(k)(l) | 6.77% | 08/15/2022 | GBP | 1,500 | 1,619,766 |
| Home Furnishings–0.23% | | |
| Shop Direct Funding PLC (United Kingdom)(k) | 7.75% | 11/15/2022 | GBP | 4,711 | 5,060,943 |
| Lodging & Casinos–0.11% | | |
| TVL Finance PLC (United Kingdom) (3 mo. GBP LIBOR + 5.38%)(k)(l) | 6.14% | 07/15/2025 | GBP | 1,963 | 2,316,920 |
| Total Non-U.S. Dollar Denominated Bonds & Notes (Cost $27,205,070) | 24,712,639 |
|
| Structured Products–0.62% |
| Clontarf Park CLO, REGS, Series 2017-1A, Class D (3 mo. EURIBOR + 5.10%)(k)(l) | 5.10% | 08/05/2030 | EUR | 387 | 412,990 |
| Diamond CLO Ltd., Series 2019-1A, Class C (3 mo. USD LIBOR + 3.60%)(k)(l) | 6.22% | 04/25/2029 | $ | 3,247 | 3,243,699 |
| FS KKR Capital Corp., Series 2019-1A, Class A2 (3 mo. USD LIBOR + 3.00%)(k)(l) | 4.89% | 07/15/2030 | $ | 3,421 | 3,421,003 |
| NewStar Berkeley Fund CLO LLC, Series 2016-1A, Class DR (3 mo. USD LIBOR + 4.75%)(k)(l) | 7.03% | 10/25/2028 | $ | 2,899 | 2,899,015 |
| OCP Euro CLO (Ireland), | | | | | |
| REGS, Series 2017-1, Class E (3 mo. EURIBOR + 5.35%)(k)(l) | 5.35% | 06/18/2030 | EUR | 100 | 107,949 |
| REGS, Series 2017-2, Class E (3 mo. EURIBOR + 5.00%)(k)(l) | 5.00% | 01/15/2032 | EUR | 437 | 465,673 |
| Octagon Investment Partners XIX Ltd., Series 2014-1A, Class E (3 mo. USD LIBOR + 4.85%)(k)(l) | 7.15% | 04/15/2026 | $ | 2,920 | 2,858,633 |
| Total Structured Products (Cost $13,406,862) | 13,408,962 |
| | | | Shares | |
| Preferred Stocks–0.02% |
| Automotive–0.02% | | |
| ThermaSys Corp., Series A | | | | 415,320 | 331,737 |
| Retailers (except Food & Drug)–0.00% | | |
| Claire’s Stores, Inc., Series A(d) | | | | 197 | 34,475 |
| Vivarte, Class A (France)(d) | | | | 7,780 | 0 |
| Vivarte, Class A Preference Shares (France)(d) | | | | 259 | 0 |
| Vivarte, Class B Preference Shares (France)(d) | | | | 259 | 0 |
| | | | | | 34,475 |
| Telecommunications–0.00% | | |
| Goodman Networks, Inc., Series A-1(d) | | | | 189,735 | 75,894 |
| Total Preferred Stocks (Cost $546,004) | 442,106 |
|
| Money Market Funds–4.77% |
| Invesco Government & Agency Portfolio,Institutional Class, 2.02%(o) | | 36,190,339 | 36,190,339 |
| Invesco Liquid Assets Portfolio,Institutional Class, 2.14%(o) | | 25,844,952 | 25,855,290 |
See accompanying Notes to Financial Statements which are an integral part of the financial statements.
| 32 | Invesco Floating Rate Fund |
| | | | Shares | Value |
|
| Invesco Treasury Portfolio,Institutional Class, 1.98%(o) | | 41,360,631 | $ 41,360,631 |
| Total Money Market Funds (Cost $103,406,260) | | 103,406,260 |
| TOTAL INVESTMENTS IN SECURITIES–101.70% (Cost $2,284,623,846) | 2,205,035,078 |
| OTHER ASSETS LESS LIABILITIES–(1.70)% | (36,757,273) |
| NET ASSETS–100.00% | $2,168,277,805 |
Investment Abbreviations:
| CHF | – Swiss Franc |
| CLO | – Collateralized Loan Obligation |
| DIP | – Debtor-in-Possession |
| EUR | – Euro |
| EURIBOR | – Euro Interbank Offered Rate |
| GBP | – British Pound Sterling |
| LIBOR | – London Interbank Offered Rate |
| PIK | – Pay-in-Kind |
| REGS | – Regulation S |
| Rts. | – Rights |
| USD | – U.S. Dollar |
| Wts. | – Warrants |
Notes to Schedule of Investments:
| (a) | Principal amounts are denominated in U.S. dollars unless otherwise noted. |
| (b) | Variable rate senior loan interests often require prepayments from excess cash flow or permit the borrower to repay at its election. The degree to which borrowers repay, whether as a contractual requirement or at their election, cannot be predicted with any accuracy. As a result, the actual remaining maturity may be substantially less than the stated maturities shown. However, it is anticipated that the variable rate senior loan interests will have an expected average life of three to five years. |
| (c) | Variable rate senior loan interests are, at present, not readily marketable, not registered under the Securities Act of 1933, as amended (the "1933 Act") and may be subject to contractual and legal restrictions on sale. Variable rate senior loan interests in the Fund’s portfolio generally have variable rates which adjust to a base, such as the London Interbank Offered Rate (“LIBOR”), on set dates, typically every 30 days, but not greater than one year, and/or have interest rates that float at margin above a widely recognized base lending rate such as the Prime Rate of a designated U.S. bank. |
| (d) | Security valued using significant unobservable inputs (Level 3). See Note 3. |
| (e) | All or a portion of this holding is subject to unfunded loan commitments. The stated interest rate reflects the weighted average of the reference rate and spread for the funded portion, if any, and the commitment fees on the portion of the loan that is unfunded. See Note 8. |
| (f) | This variable rate interest will settle after August 31, 2019, at which time the interest rate will be determined. |
| (g) | All or a portion of this security is Pay-in-Kind. Pay-in-Kind securities pay interest income in the form of securities. |
| (h) | Zero coupon bond issued at a discount. |
| (i) | The borrower has filed for protection in federal bankruptcy court. |
| (j) | Defaulted security. Currently, the issuer is partially or fully in default with respect to principal and/or interest payments. The aggregate value of these securities at August 31, 2019 was $15,051,576, which represented less than 1% of the Fund’s Net Assets. |
| (k) | Security purchased or received in a transaction exempt from registration under the 1933 Act. The security may be resold pursuant to an exemption from registration under the 1933 Act, typically to qualified institutional buyers. The aggregate value of these securities at August 31, 2019 was $196,342,982, which represented 9.06% of the Fund’s Net Assets. |
| (l) | Interest or dividend rate is redetermined periodically. Rate shown is the rate in effect on August 31, 2019. |
| (m) | Acquired through the restructuring of senior loans. |
| (n) | Non-income producing security. |
| (o) | The money market fund and the Fund are affiliated by having the same investment adviser. The rate shown is the 7-day SEC standardized yield as of August 31, 2019. |
| Open Forward Foreign Currency Contracts |
Settlement
Date | Counterparty | Contract to | Unrealized
Appreciation
(Depreciation) |
| Deliver | Receive |
| Currency Risk | | | | | | |
| 09/17/2019 | Bank of America Merrill Lynch | CHF | 1,064,357 | USD | 1,083,849 | $7,206 |
| 09/17/2019 | Bank of America Merrill Lynch | USD | 8,708,034 | GBP | 7,180,717 | 34,440 |
| 09/17/2019 | Barclays Bank PLC | EUR | 1,720,814 | USD | 1,939,251 | 46,083 |
| 09/17/2019 | Barclays Bank PLC | GBP | 6,948,054 | USD | 8,701,914 | 242,705 |
| 09/17/2019 | Barclays Bank PLC | USD | 8,512,816 | GBP | 7,018,226 | 31,827 |
| 10/15/2019 | Barclays Bank PLC | EUR | 21,106,171 | USD | 23,469,788 | 198,230 |
| 10/15/2019 | Canadian Imperial Bank of Commerce | EUR | 21,106,171 | USD | 23,537,180 | 265,622 |
| 09/17/2019 | Citibank N.A. | EUR | 20,496,274 | USD | 23,121,335 | 572,184 |
| 09/17/2019 | Citibank N.A. | GBP | 7,293,924 | USD | 9,122,593 | 242,290 |
See accompanying Notes to Financial Statements which are an integral part of the financial statements.
| 33 | Invesco Floating Rate Fund |
| Open Forward Foreign Currency Contracts—(continued) |
Settlement
Date | Counterparty | Contract to | Unrealized
Appreciation
(Depreciation) |
| Deliver | Receive |
| 10/15/2019 | Citibank N.A. | EUR | 21,106,172 | USD | 23,484,014 | $212,455 |
| 10/15/2019 | Citibank N.A. | GBP | 799,621 | USD | 981,836 | 7,143 |
| 10/15/2019 | Citibank N.A. | SEK | 46,453 | USD | 4,832 | 87 |
| 09/17/2019 | Goldman Sachs International | EUR | 20,496,274 | USD | 23,114,981 | 565,830 |
| 10/15/2019 | Goldman Sachs International | EUR | 2,251,656 | USD | 2,504,591 | 21,927 |
| 09/17/2019 | J.P. Morgan Chase Bank, N.A. | GBP | 6,937,027 | USD | 8,688,009 | 242,225 |
| 09/17/2019 | J.P. Morgan Chase Bank, N.A. | SEK | 46,453 | USD | 4,986 | 248 |
| 10/15/2019 | Morgan Stanley & Co. LLC | EUR | 248,266 | USD | 276,467 | 2,730 |
| 09/17/2019 | Royal Bank of Canada | EUR | 21,418,614 | USD | 24,170,113 | 606,243 |
| 10/15/2019 | Royal Bank of Canada | CHF | 1,067,758 | USD | 1,098,599 | 15,684 |
| 10/15/2019 | Royal Bank of Canada | EUR | 14,029 | USD | 15,640 | 172 |
| 09/17/2019 | Toronto Dominion Bank | EUR | 20,496,274 | USD | 23,116,928 | 567,778 |
| 09/17/2019 | Toronto Dominion Bank | USD | 8,466,578 | GBP | 6,980,062 | 31,601 |
| 10/15/2019 | Toronto Dominion Bank | EUR | 21,105,729 | USD | 23,545,678 | 274,607 |
| Subtotal—Appreciation | 4,189,317 |
| Currency Risk | | | | | | |
| 10/15/2019 | Bank of America Merrill Lynch | GBP | 6,997,918 | USD | 8,496,571 | (33,493) |
| 09/17/2019 | Barclays Bank PLC | USD | 23,406,758 | EUR | 21,094,581 | (199,376) |
| 10/15/2019 | Barclays Bank PLC | GBP | 6,970,336 | USD | 8,464,230 | (32,213) |
| 09/17/2019 | Canadian Imperial Bank of Commerce | USD | 23,473,628 | EUR | 21,094,581 | (266,245) |
| 09/17/2019 | Citibank N.A. | USD | 23,421,314 | EUR | 21,094,582 | (213,931) |
| 09/17/2019 | Citibank N.A. | USD | 4,823 | SEK | 46,453 | (86) |
| 09/17/2019 | Royal Bank of Canada | USD | 1,092,227 | CHF | 1,064,357 | (15,585) |
| 09/17/2019 | Royal Bank of Canada | USD | 281,302 | EUR | 250,368 | (5,857) |
| 09/17/2019 | Toronto Dominion Bank | USD | 23,482,080 | EUR | 21,094,139 | (275,184) |
| 10/15/2019 | Toronto Dominion Bank | GBP | 6,997,918 | USD | 8,497,698 | (32,366) |
| 10/15/2019 | UBS AG | USD | 914,463 | EUR | 820,858 | (9,390) |
| Subtotal—Depreciation | (1,083,726) |
| Total Forward Foreign Currency Contracts | $3,105,591 |
| Abbreviations: |
| CHF | – Swiss Franc |
| EUR | – Euro |
| GBP | – British Pound Sterling |
| SEK | – Swedish Krona |
| USD | – U.S. Dollar |
See accompanying Notes to Financial Statements which are an integral part of the financial statements.
| 34 | Invesco Floating Rate Fund |
Statement of Assets and Liabilities
August 31, 2019
| Assets: | |
Investments in securities, at value
(Cost $2,181,217,586) | $2,101,628,818 |
| Investments in affiliated money market funds, at value (Cost $103,406,260) | 103,406,260 |
| Other investments: | |
| Unrealized appreciation on forward foreign currency contracts outstanding | 4,189,317 |
| Cash | 48,903,739 |
| Foreign currencies, at value (Cost $12,848,504) | 12,862,118 |
| Receivable for: | |
| Investments matured, at value (Cost $8,988,729) | 140,399 |
| Dividends | 255,002 |
| Fund shares sold | 1,122,584 |
| Interest | 10,346,252 |
| Investments sold | 89,456,091 |
| Investment for trustee deferred compensation and retirement plans | 182,782 |
| Other assets | 123,594 |
| Total assets | 2,372,616,956 |
| Liabilities: | |
| Other investments: | |
| Unrealized depreciation on forward foreign currency contracts outstanding | 1,083,726 |
| Payable for: | |
| Investments purchased | 189,047,229 |
| Dividends | 1,829,082 |
| Fund shares reacquired | 3,392,861 |
| Accrued fees to affiliates | 691,259 |
| Accrued trustees’ and officers’ fees and benefits | 5,638 |
| Accrued other operating expenses | 268,885 |
| Trustee deferred compensation and retirement plans | 204,771 |
| Unfunded loan commitments | 7,815,700 |
| Total liabilities | 204,339,151 |
| Net assets applicable to shares outstanding | $2,168,277,805 |
| Net assets consist of: | |
| Shares of beneficial interest | $2,368,634,215 |
| Distributable earnings | (200,356,410) |
| | $2,168,277,805 |
| Net Assets: |
| Class A | $539,002,625 |
| Class C | $213,446,316 |
| Class R | $5,603,891 |
| Class Y | $592,107,474 |
| Class R5 | $5,671,550 |
| Class R6 | $812,445,949 |
| Shares outstanding, no par value, with an unlimited number of shares authorized: |
| Class A | 72,799,455 |
| Class C | 28,957,100 |
| Class R | 755,802 |
| Class Y | 80,087,258 |
| Class R5 | 765,576 |
| Class R6 | 109,914,657 |
| Class A: | |
| Net asset value per share | $7.40 |
Maximum offering price per share
(Net asset value of $7.40 ÷ 97.50%) | $7.59 |
| Class C: | |
| Net asset value and offering price per share | $7.37 |
| Class R: | |
| Net asset value and offering price per share | $7.41 |
| Class Y: | |
| Net asset value and offering price per share | $7.39 |
| Class R5: | |
| Net asset value and offering price per share | $7.41 |
| Class R6: | |
| Net asset value and offering price per share | $7.39 |
See accompanying Notes to Financial Statements which are an integral part of the financial statements.
| 35 | Invesco Floating Rate Fund |
Statement of Operations
For the year ended August 31, 2019
| Investment income: | |
| Interest | $130,554,927 |
| Dividends | 2,088,028 |
| Dividends from affiliated money market funds | 1,760,192 |
| Other income | 274,743 |
| Total investment income | 134,677,890 |
| Expenses: | |
| Advisory fees | 14,210,979 |
| Administrative services fees | 377,115 |
| Custodian fees | 269,391 |
| Distribution fees: | |
| Class A | 1,454,222 |
| Class C | 2,194,147 |
| Class R | 27,338 |
| Interest, facilities and maintenance fees | 1,266,389 |
| Transfer agent fees — A, C, R & Y | 1,689,082 |
| Transfer agent fees — R5 | 5,650 |
| Transfer agent fees — R6 | 26,656 |
| Trustees’ and officers’ fees and benefits | 54,610 |
| Registration and filing fees | 138,453 |
| Reports to shareholders | 177,788 |
| Professional services fees | 150,442 |
| Taxes | 292,207 |
| Other | 79,272 |
| Total expenses | 22,413,741 |
| Less: Fees waived and/or expense offset arrangement(s) | (90,628) |
| Net expenses | 22,323,113 |
| Net investment income | 112,354,777 |
| Realized and unrealized gain (loss) from: | |
| Net realized gain (loss) from: | |
| Investment securities | (26,755,060) |
| Foreign currencies | (635,821) |
| Forward foreign currency contracts | 8,287,943 |
| | (19,102,938) |
| Change in net unrealized appreciation (depreciation) of: | |
| Investment securities | (41,950,548) |
| Foreign currencies | 477,827 |
| Forward foreign currency contracts | 1,877,658 |
| | (39,595,063) |
| Net realized and unrealized gain (loss) | (58,698,001) |
| Net increase (decrease) in net assets resulting from operations | $53,656,776 |
See accompanying Notes to Financial Statements which are an integral part of the financial statements.
| 36 | Invesco Floating Rate Fund |
Statement of Changes in Net Assets
For the years ended August 31, 2019 and 2018
| | 2019 | 2018 |
| Operations: | | |
| Net investment income | $112,354,777 | $110,339,643 |
| Net realized gain (loss) | (19,102,938) | 1,487,494 |
| Change in net unrealized appreciation (depreciation) | (39,595,063) | 4,131,229 |
| Net increase in net assets resulting from operations | 53,656,776 | 115,958,366 |
| Distributions to shareholders from distributable earnings(1): | | |
| Class A | (27,616,397) | (25,495,503) |
| Class C | (12,351,291) | (15,358,742) |
| Class R | (245,388) | (235,757) |
| Class Y | (37,987,697) | (42,632,667) |
| Class R5 | (285,068) | (150,846) |
| Class R6 | (34,526,997) | (28,890,761) |
| Total distributions from distributable earnings | (113,012,838) | (112,764,276) |
| Share transactions–net: | | |
| Class A | (34,336,728) | (45,642,976) |
| Class C | (165,492,535) | (61,311,478) |
| Class R | 144,390 | (770,602) |
| Class Y | (348,657,537) | (14,750,347) |
| Class R5 | 1,101,811 | 1,865,416 |
| Class R6 | 213,357,164 | (3,772,361) |
| Net increase (decrease) in net assets resulting from share transactions | (333,883,435) | (124,382,348) |
| Net increase (decrease) in net assets | (393,239,497) | (121,188,258) |
| Net assets: | | |
| Beginning of year | 2,561,517,302 | 2,682,705,560 |
| End of year | $2,168,277,805 | $2,561,517,302 |
| (1) | The Securities and Exchange Commission eliminated the requirement to disclose distribution components separately, except for tax return of capital. For the year ended August 31, 2018, distributions to shareholders from distributable earnings consisted of distributions from net investment income. |
See accompanying Notes to Financial Statements which are an integral part of the financial statements.
| 37 | Invesco Floating Rate Fund |
Statement of Cash Flows
For the year ended August 31, 2019
| Cash provided by operating activities: | |
| Net increase in net assets resulting from operations | $53,656,776 |
| Adjustments to reconcile the change in net assets from operations to net cash provided by operating activities: | |
| Purchases of investments | (1,444,937,032) |
| Proceeds from sales of investments | 1,752,564,305 |
| Accretion of discount on investment securities | (3,174,703) |
| Decrease in receivables and other assets | 501,196 |
| Decrease in accrued expenses and other payables | (130,113) |
| Net realized loss from investment securities | 26,755,060 |
| Net change in unrealized depreciation on investment securities | 41,950,548 |
| Net change in unrealized appreciation of forward foreign currency contracts | (1,877,658) |
| Net cash provided by operating activities | 425,308,379 |
| Cash provided by (used in) financing activities: | |
| Dividends paid to shareholders from distributable earnings | (27,046,776) |
| Proceeds from shares of beneficial interest sold | 732,132,607 |
| Disbursements from shares of beneficial interest reacquired | (1,150,534,616) |
| Net cash provided by (used in) financing activities | (445,448,785) |
| Net decrease in cash and cash equivalents | (20,140,406) |
| Cash and cash equivalents at beginning of period | 185,312,523 |
| Cash and cash equivalents at end of period | $165,172,117 |
| Non-cash financing activities: | |
| Value of shares of beneficial interest issued in reinvestment of dividends paid to shareholders | $86,806,389 |
| Supplemental disclosure of cash flow information: | |
| Cash paid during the period for interest, facilities and maintenance fees | $1,266,389 |
See accompanying Notes to Financial Statements which are an integral part of the financial statements.
| 38 | Invesco Floating Rate Fund |
Financial Highlights
August 31, 2019
The following schedule presents financial highlights for a share of the Fund outstanding throughout the periods indicated.
| | Net asset
value,
beginning
of period | Net
investment
income(a) | Net gains
(losses)
on securities
(both
realized and
unrealized) | Total from
investment
operations | Dividends
from net
investment
income | Net asset
value, end
of period | Total
return(b) | Net assets,
end of period
(000’s omitted) | Ratio of
expenses
to average
net assets
with fee waivers
and/or
expenses
absorbed | Ratio of
expenses
to average net
assets without
fee waivers
and/or
expenses
absorbed | Supplemental
ratio of
expenses
to average
net assets
with fee waivers
(excluding
interest,
facilities and
maintenance
fees) | Ratio of net
investment
income
to average
net assets | Portfolio
turnover(c) |
| Class A |
| Year ended 08/31/19 | $7.57 | $0.35 | $(0.17) | $0.18 | $(0.35) | $7.40 | 2.50% | $539,003 | 1.08%(d)(e) | 1.08%(d)(e) | 1.03%(d) | 4.71%(d) | 55% |
| Year ended 08/31/18 | 7.56 | 0.31 | 0.02 | 0.33 | (0.32) | 7.57 | 4.47 | 585,865 | 1.07(e) | 1.08(e) | — | 4.15 | 51 |
| Year ended 08/31/17 | 7.42 | 0.31 | 0.14 | 0.45 | (0.31) | 7.56 | 6.17 | 630,740 | 1.06(e) | 1.07(e) | — | 4.05 | 68 |
| Year ended 08/31/16 | 7.56 | 0.36 | (0.14) | 0.22 | (0.36) | 7.42 | 3.12 | 661,442 | 1.10(e) | 1.11(e) | — | 4.93 | 70 |
| Year ended 08/31/15 | 7.95 | 0.35 | (0.38) | (0.03) | (0.36) | 7.56 | (0.42) | 850,891 | 1.06(e) | 1.06(e) | — | 4.51 | 59 |
| Class C |
| Year ended 08/31/19 | 7.53 | 0.31 | (0.16) | 0.15 | (0.31) | 7.37 | 2.12 | 213,446 | 1.58(d)(e) | 1.58(d)(e) | 1.53(d) | 4.21(d) | 55 |
| Year ended 08/31/18 | 7.53 | 0.28 | 0.00 | 0.28 | (0.28) | 7.53 | 3.81 | 387,685 | 1.57(e) | 1.58(e) | — | 3.65 | 51 |
| Year ended 08/31/17 | 7.39 | 0.27 | 0.14 | 0.41 | (0.27) | 7.53 | 5.65 | 448,408 | 1.56(e) | 1.57(e) | — | 3.55 | 68 |
| Year ended 08/31/16 | 7.52 | 0.32 | (0.13) | 0.19 | (0.32) | 7.39 | 2.74 | 458,340 | 1.60(e) | 1.61(e) | — | 4.43 | 70 |
| Year ended 08/31/15 | 7.92 | 0.31 | (0.39) | (0.08) | (0.32) | 7.52 | (1.07) | 570,097 | 1.56(e) | 1.56(e) | — | 4.01 | 59 |
| Class R |
| Year ended 08/31/19 | 7.58 | 0.33 | (0.16) | 0.17 | (0.34) | 7.41 | 2.25 | 5,604 | 1.33(d)(e) | 1.33(d)(e) | 1.28(d) | 4.46(d) | 55 |
| Year ended 08/31/18 | 7.57 | 0.30 | 0.01 | 0.31 | (0.30) | 7.58 | 4.21 | 5,583 | 1.32(e) | 1.33(e) | — | 3.90 | 51 |
| Year ended 08/31/17 | 7.44 | 0.29 | 0.13 | 0.42 | (0.29) | 7.57 | 5.76 | 6,345 | 1.31(e) | 1.32(e) | — | 3.80 | 68 |
| Year ended 08/31/16 | 7.57 | 0.34 | (0.13) | 0.21 | (0.34) | 7.44 | 3.00 | 6,191 | 1.35(e) | 1.36(e) | — | 4.68 | 70 |
| Year ended 08/31/15 | 7.97 | 0.33 | (0.39) | (0.06) | (0.34) | 7.57 | (0.79) | 11,969 | 1.31(e) | 1.31(e) | — | 4.26 | 59 |
| Class Y |
| Year ended 08/31/19 | 7.56 | 0.37 | (0.17) | 0.20 | (0.37) | 7.39 | 2.76 | 592,107 | 0.83(d)(e) | 0.83(d)(e) | 0.78(d) | 4.96(d) | 55 |
| Year ended 08/31/18 | 7.55 | 0.33 | 0.02 | 0.35 | (0.34) | 7.56 | 4.72 | 963,386 | 0.82(e) | 0.83(e) | — | 4.40 | 51 |
| Year ended 08/31/17 | 7.41 | 0.32 | 0.15 | 0.47 | (0.33) | 7.55 | 6.43 | 977,034 | 0.81(e) | 0.82(e) | — | 4.30 | 68 |
| Year ended 08/31/16 | 7.54 | 0.38 | (0.13) | 0.25 | (0.38) | 7.41 | 3.51 | 648,603 | 0.85(e) | 0.86(e) | — | 5.18 | 70 |
| Year ended 08/31/15 | 7.94 | 0.37 | (0.39) | (0.02) | (0.38) | 7.54 | (0.31) | 805,611 | 0.81(e) | 0.81(e) | — | 4.76 | 59 |
| Class R5 |
| Year ended 08/31/19 | 7.58 | 0.37 | (0.16) | 0.21 | (0.38) | 7.41 | 2.80 | 5,672 | 0.83(d)(e) | 0.83(d)(e) | 0.78(d) | 4.96(d) | 55 |
| Year ended 08/31/18 | 7.57 | 0.33 | 0.02 | 0.35 | (0.34) | 7.58 | 4.73 | 4,696 | 0.81(e) | 0.82(e) | — | 4.41 | 51 |
| Year ended 08/31/17 | 7.43 | 0.32 | 0.15 | 0.47 | (0.33) | 7.57 | 6.43 | 2,830 | 0.82(e) | 0.83(e) | — | 4.29 | 68 |
| Year ended 08/31/16 | 7.56 | 0.38 | (0.13) | 0.25 | (0.38) | 7.43 | 3.52 | 1,858 | 0.84(e) | 0.85(e) | — | 5.19 | 70 |
| Year ended 08/31/15 | 7.96 | 0.37 | (0.39) | (0.02) | (0.38) | 7.56 | (0.29) | 3,466 | 0.80(e) | 0.80(e) | — | 4.77 | 59 |
| Class R6 |
| Year ended 08/31/19 | 7.56 | 0.38 | (0.17) | 0.21 | (0.38) | 7.39 | 2.86 | 812,446 | 0.74(d)(e) | 0.74(d)(e) | 0.69(d) | 5.05(d) | 55 |
| Year ended 08/31/18 | 7.55 | 0.34 | 0.02 | 0.36 | (0.35) | 7.56 | 4.83 | 614,302 | 0.73(e) | 0.74(e) | — | 4.49 | 51 |
| Year ended 08/31/17 | 7.41 | 0.33 | 0.15 | 0.48 | (0.34) | 7.55 | 6.53 | 617,349 | 0.72(e) | 0.73(e) | — | 4.39 | 68 |
| Year ended 08/31/16 | 7.56 | 0.39 | (0.16) | 0.23 | (0.38) | 7.41 | 3.34 | 555,172 | 0.75(e) | 0.76(e) | — | 5.28 | 70 |
| Year ended 08/31/15 | 7.95 | 0.38 | (0.38) | 0.00 | (0.39) | 7.56 | (0.06) | 97,902 | 0.70(e) | 0.70(e) | — | 4.87 | 59 |
| (a) | Calculated using average shares outstanding. |
| (b) | Includes adjustments in accordance with accounting principles generally accepted in the United States of America and as such, the net asset value for financial reporting purposes and the returns based upon those net asset values may differ from the net asset value and returns for shareholder transactions. Does not include sales charges and is not annualized for periods less than one year, if applicable. |
| (c) | Portfolio turnover is calculated at the fund level and is not annualized for periods less than one year, if applicable. |
| (d) | Ratios are based on average daily net assets (000’s omitted) of $581,689, $292,553, $5,468, $764,217, $5,654 and $677,249 for Class A, Class C, Class R, Class Y, Class R5 and Class R6 shares, respectively. |
| (e) | Ratio includes line of credit expense of 0.05%, 0.05%, 0.05%, 0.05% and 0.03% for the years ended August 31, 2019, 2018, 2017, 2016 and 2015, respectively. |
See accompanying Notes to Financial Statements which are an integral part of the financial statements.
| 39 | Invesco Floating Rate Fund |
Notes to Financial Statements
August 31, 2019
NOTE 1—Significant Accounting Policies
Invesco Floating Rate Fund (the “Fund”) is a series portfolio of AIM Counselor Series Trust (Invesco Counselor Series Trust) (the “Trust”). The Trust is a Delaware statutory trust registered under the Investment Company Act of 1940, as amended (the “1940 Act”), as an open-end series management investment company authorized to issue an unlimited number of shares of beneficial interest. Information presented in these financial statements pertains only to the Fund. Matters affecting the Fund or each class will be voted on exclusively by the shareholders of the Fund or each class.
The Fund’s investment objective is total return, comprised of current income and capital appreciation.
The Fund currently consists of six different classes of shares: Class A, Class C, Class R, Class Y, Class R5 and Class R6. Class Y shares are available only to certain investors. Class A shares are sold with a front-end sales charge unless certain waiver criteria are met. Under certain circumstances, load waived shares may be subject to contingent deferred sales charges ("CDSC"). Class C shares are sold with a CDSC. Class R, Class Y, Class R5 and Class R6 shares are sold at net asset value. Class C shares held for ten years after purchase are eligible for automatic conversion into Class A shares of the same Fund (the "Conversion Feature"). The automatic conversion pursuant to the Conversion Feature will generally occur at the end of the month following the tenth anniversary after a purchase of Class C shares.
The Fund is an investment company and accordingly follows the investment company accounting and reporting guidance in accordance with Financial Accounting Standards Board Accounting Standards Codification Topic 946,Financial Services – Investment Companies.
The following is a summary of the significant accounting policies followed by the Fund in the preparation of its financial statements.
| A. | Security Valuations – Variable rate senior loan interests are fair valued using quotes provided by an independent pricing service. Quotes provided by the pricing service may reflect appropriate factors such as ratings, tranche type, industry, company performance, spread, individual trading characteristics, institution-size trading in similar groups of securities and other market data. |
Securities, including restricted securities, are valued according to the following policy. A security listed or traded on an exchange (except convertible securities) is valued at its last sales price as of the close of the customary trading session on the exchange where the security is principally traded, or lacking any sales on a particular day, the security may be valued at the closing bid price on that day. Securities traded in the over-the-counter market (but not securities reported on the NASDAQ Stock Exchange) are valued based on the prices furnished by independent pricing services, in which case the securities may be considered fair valued, or by market makers. Each security reported on the NASDAQ Stock Exchange is valued at the NASDAQ Official Closing Price (“NOCP”) as of the close of the customary trading session on the valuation date or absent a NOCP, at the closing bid price.
Futures contracts are valued at the final settlement price set by an exchange on which they are principally traded. Listed options are valued at the mean between the last bid and the asked prices from the exchange on which they are principally traded. Options not listed on an exchange are valued by an independent source at the mean between the last bid and asked prices. For purposes of determining net asset value ("NAV") per share, futures and option contracts generally are valued 15 minutes after the close of the customary trading session of the New York Stock Exchange (“NYSE”).
Investments in open-end and closed-end registered investment companies that do not trade on an exchange are valued at the end-of-day net asset value per share. Investments in open-end and closed-end registered investment companies that trade on an exchange are valued at the last sales price or official closing price as of the close of the customary trading session on the exchange where the security is principally traded.
Debt obligations (including convertible securities) and unlisted equities are fair valued using an evaluated quote provided by an independent pricing service. Evaluated quotes provided by the pricing service may be determined without exclusive reliance on quoted prices, and may reflect appropriate factors such as institution-size trading in similar groups of securities, developments related to specific securities, dividend rate (for unlisted equities), yield (for debt obligations), quality, type of issue, coupon rate (for debt obligations), maturity (for debt obligations), individual trading characteristics and other market data. Pricing services generally value debt obligations assuming orderly transactions of institutional round lot size, but a fund may hold or transact in the same securities in smaller, odd lot sizes. Odd lots often trade at lower prices than institutional round lots. Debt obligations are subject to interest rate and credit risks. In addition, all debt obligations involve some risk of default with respect to interest and/or principal payments.
Swap agreements are fair valued using an evaluated quote, if available, provided by an independent pricing service. Evaluated quotes provided by the pricing service are valued based on a model which may include end-of-day net present values, spreads, ratings, industry, company performance and returns of referenced assets. Centrally cleared swap agreements are valued at the daily settlement price determined by the relevant exchange or clearinghouse.
Foreign securities’ (including foreign exchange contracts) prices are converted into U.S. dollar amounts using the applicable exchange rates as of the close of the NYSE. If market quotations are available and reliable for foreign exchange-traded equity securities, the securities will be valued at the market quotations. Because trading hours for certain foreign securities end before the close of the NYSE, closing market quotations may become unreliable. If between the time trading ends on a particular security and the close of the customary trading session on the NYSE, events occur that the investment adviser determines are significant and make the closing price unreliable, the Fund may fair value the security. If the event is likely to have affected the closing price of the security, the security will be valued at fair value in good faith using procedures approved by the Board of Trustees. Adjustments to closing prices to reflect fair value may also be based on a screening process of an independent pricing service to indicate the degree of certainty, based on historical data, that the closing price in the principal market where a foreign security trades is not the current value as of the close of the NYSE. Foreign securities’ prices meeting the approved degree of certainty that the price is not reflective of current value will be priced at the indication of fair value from the independent pricing service. Multiple factors may be considered by the independent pricing service in determining adjustments to reflect fair value and may include information relating to sector indices, American Depositary Receipts and domestic and foreign index futures. Foreign securities may have additional risks including exchange rate changes, potential for sharply devalued currencies and high inflation, political and economic upheaval, the relative lack of issuer information, relatively low market liquidity and the potential lack of strict financial and accounting controls and standards.
| 40 | Invesco Floating Rate Fund |
Securities for which market prices are not provided by any of the above methods may be valued based upon quotes furnished by independent sources. The last bid price may be used to value equity securities. The mean between the last bid and asked prices is used to value debt obligations, including corporate loans.
Securities for which market quotations are not readily available or became unreliable are valued at fair value as determined in good faith by or under the supervision of the Trust’s officers following procedures approved by the Board of Trustees. Issuer specific events, market trends, bid/asked quotes of brokers and information providers and other market data may be reviewed in the course of making a good faith determination of a security’s fair value.
The Fund may invest in securities that are subject to interest rate risk, meaning the risk that the prices will generally fall as interest rates rise and, conversely, the prices will generally rise as interest rates fall. Specific securities differ in their sensitivity to changes in interest rates depending on their individual characteristics. Changes in interest rates may result in increased market volatility, which may affect the value and/or liquidity of certain Fund investments.
Valuations change in response to many factors including the historical and prospective earnings of the issuer, the value of the issuer’s assets, general economic conditions, interest rates, investor perceptions and market liquidity. Because of the inherent uncertainties of valuation, the values reflected in the financial statements may materially differ from the value received upon actual sale of those investments.
| B. | Securities Transactions and Investment Income — Securities transactions are accounted for on a trade date basis. Realized gains or losses on sales are computed on the basis of specific identification of the securities sold. Interest income (net of withholding tax, if any) is recorded on the accrual basis from settlement date. Bond premiums and discounts are amortized and/or accreted over the lives of the respective securities. Pay-in-kind interest income and non-cash dividend income received in the form of securities in-lieu of cash are recorded at the fair value of the securities received. Facility fees received may be amortized over the life of the loan. Dividend income (net of withholding tax, if any) is recorded on the ex-dividend date. |
The Fund may periodically participate in litigation related to Fund investments. As such, the Fund may receive proceeds from litigation settlements. Any proceeds received are included in the Statement of Operations as realized gain (loss) for investments no longer held and as unrealized gain (loss) for investments still held.
Other income is comprised primarily of amendment fees which are recorded when received. Amendment fees are received in return for changes in the terms of the loan or note.
Brokerage commissions and mark ups are considered transaction costs and are recorded as an increase to the cost basis of securities purchased and/or a reduction of proceeds on a sale of securities. Such transaction costs are included in the determination of net realized and unrealized gain (loss) from investment securities reported in the Statement of Operations and the Statement of Changes in Net Assets and the net realized and unrealized gains (losses) on securities per share in the Financial Highlights. Transaction costs are included in the calculation of the Fund’s net asset value and, accordingly, they reduce the Fund’s total returns. These transaction costs are not considered operating expenses and are not reflected in net investment income reported in the Statement of Operations and the Statement of Changes in Net Assets, or the net investment income per share and the ratios of expenses and net investment income reported in the Financial Highlights, nor are they limited by any expense limitation arrangements between the Fund and the investment adviser.
The Fund allocates realized and unrealized capital gains and losses to a class based on the relative net assets of each class. The Fund allocates income to a class based on the relative value of the settled shares of each class.
| C. | Country Determination — For the purposes of making investment selection decisions and presentation in the Schedule of Investments, the investment adviser may determine the country in which an issuer is located and/or credit risk exposure based on various factors. These factors include the laws of the country under which the issuer is organized, where the issuer maintains a principal office, the country in which the issuer derives 50% or more of its total revenues and the country that has the primary market for the issuer’s securities, as well as other criteria. Among the other criteria that may be evaluated for making this determination are the country in which the issuer maintains 50% or more of its assets, the type of security, financial guarantees and enhancements, the nature of the collateral and the sponsor organization. Country of issuer and/or credit risk exposure has been determined to be the United States of America, unless otherwise noted. |
| D. | Distributions– Distributions from net investment income, if any, are declared daily and paid monthly. Distributions from net realized capital gain, if any, are generally declared and paid annually and recorded on the ex-dividend date. The Fund may elect to treat a portion of the proceeds from redemptions as distributions for federal income tax purposes. |
| E. | Federal Income Taxes –The Fund intends to comply with the requirements of Subchapter M of the Internal Revenue Code of 1986, as amended (the “Internal Revenue Code”), necessary to qualify as a regulated investment company and to distribute substantially all of the Fund’s taxable earnings to shareholders. As such, the Fund will not be subject to federal income taxes on otherwise taxable income (including net realized capital gain) that is distributed to shareholders. Therefore, no provision for federal income taxes is recorded in the financial statements. |
The Fund recognizes the tax benefits of uncertain tax positions only when the position is more likely than not to be sustained. Management has analyzed the Fund’s uncertain tax positions and concluded that no liability for unrecognized tax benefits should be recorded related to uncertain tax positions. Management is not aware of any tax positions for which it is reasonably possible that the total amounts of unrecognized tax benefits will change materially in the next 12 months.
The Fund files tax returns in the U.S. Federal jurisdiction and certain other jurisdictions. Generally, the Fund is subject to examinations by such taxing authorities for up to three years after the filing of the return for the tax period.
| F. | Expenses – Fees provided for under the Rule 12b-1 plan of a particular class of the Fund are charged to the operations of such class. Transfer agency fees and expenses and other shareholder recordkeeping fees and expenses attributable to Class R5 and Class R6 are allocated to each share class based on relative net assets. Sub-accounting fees attributable to Class R5 are charged to the operations of the class. Transfer agency fees and expenses and other shareholder recordkeeping fees and expenses relating to all other classes are allocated among those classes based on relative net assets. All other expenses are allocated among the classes based on relative net assets. |
| G. | Interest, Facilities and Maintenance Fees— Interest, Facilities and Maintenance Fees include interest and related borrowing costs such as commitment fees and other expenses associated with lines of credit and interest and administrative expenses related to establishing and maintaining the credit agreement. |
| H. | Accounting Estimates – The preparation of financial statements in conformity with accounting principles generally accepted in the United States of America (“GAAP”) requires management to make estimates and assumptions that affect the reported amounts of assets and |
| 41 | Invesco Floating Rate Fund |
| | liabilities at the date of the financial statements and the reported amounts of revenues and expenses during the reporting period including estimates and assumptions related to taxation. Actual results could differ from those estimates by a significant amount. In addition, the Fund monitors for material events or transactions that may occur or become known after the period-end date and before the date the financial statements are released to print. |
| I. | Indemnifications – Under the Trust’s organizational documents, each Trustee, officer, employee or other agent of the Trust is indemnified against certain liabilities that may arise out of the performance of their duties to the Fund. Additionally, in the normal course of business, the Fund enters into contracts, including the Fund’s servicing agreements, that contain a variety of indemnification clauses. The Fund’s maximum exposure under these arrangements is unknown as this would involve future claims that may be made against the Fund that have not yet occurred. The risk of material loss as a result of such indemnification claims is considered remote. |
| J. | Cash and Cash Equivalents – For the purposes of the Statement of Cash Flows, the Fund defines Cash and Cash Equivalents as cash (including foreign currency), money market funds and other investments held in lieu of cash and excludes investments made with cash collateral received. |
| K. | Securities Purchased on a When-Issued and Delayed Delivery Basis — The Fund may purchase and sell interests in corporate loans and corporate debt securities and other portfolio securities on a when-issued and delayed delivery basis, with payment and delivery scheduled for a future date. No income accrues to the Fund on such interests or securities in connection with such transactions prior to the date the Fund actually takes delivery of such interests or securities. These transactions are subject to market fluctuations and are subject to the risk that the value at delivery may be more or less than the trade date purchase price. Although the Fund will generally purchase these securities with the intention of acquiring such securities, they may sell such securities prior to the settlement date. |
| L. | Foreign Currency Translations— Foreign currency is valued at the close of the NYSE based on quotations posted by banks and major currency dealers. Portfolio securities and other assets and liabilities denominated in foreign currencies are translated into U.S. dollar amounts at the date of valuation. Purchases and sales of portfolio securities (net of foreign taxes withheld on disposition) and income items denominated in foreign currencies are translated into U.S. dollar amounts on the respective dates of such transactions. The Fund does not separately account for the portion of the results of operations resulting from changes in foreign exchange rates on investments and the fluctuations arising from changes in market prices of securities held. The combined results of changes in foreign exchange rates and the fluctuation of market prices on investments (net of estimated foreign tax withholding) are included with the net realized and unrealized gain or loss from investments in the Statement of Operations. Reported net realized foreign currency gains or losses arise from (1) sales of foreign currencies, (2) currency gains or losses realized between the trade and settlement dates on securities transactions, and (3) the difference between the amounts of dividends, interest, and foreign withholding taxes recorded on the Fund’s books and the U.S. dollar equivalent of the amounts actually received or paid. Net unrealized foreign currency gains and losses arise from changes in the fair values of assets and liabilities, other than investments in securities at fiscal period end, resulting from changes in exchange rates. |
The Fund may invest in foreign securities, which may be subject to foreign taxes on income, gains on investments or currency repatriation, a portion of which may be recoverable. Foreign taxes, if any, are recorded based on the tax regulations and rates that exist in the foreign markets in which the Fund invests and are shown in the Statement of Operations.
| M. | Forward Foreign Currency Contracts— The Fund may engage in foreign currency transactions either on a spot (i.e. for prompt delivery and settlement) basis, or through forward foreign currency contracts, to manage or minimize currency or exchange rate risk. |
The Fund may also enter into forward foreign currency contracts for the purchase or sale of a security denominated in a foreign currency in order to “lock in” the U.S. dollar price of that security, or the Fund may also enter into forward foreign currency contracts that do not provide for physical settlement of the two currencies, but instead are settled by a single cash payment calculated as the difference between the agreed upon exchange rate and the spot rate at settlement based upon an agreed upon notional amount (non-deliverable forwards). The Fund will set aside liquid assets in an amount equal to the daily mark-to-market obligation for forward foreign currency contracts.
A forward foreign currency contract is an obligation between two parties (“Counterparties”) to purchase or sell a specific currency for an agreed-upon price at a future date. The use of forward foreign currency contracts does not eliminate fluctuations in the price of the underlying securities the Fund owns or intends to acquire but establishes a rate of exchange in advance. Fluctuations in the value of these contracts are measured by the difference in the contract date and reporting date exchange rates and are recorded as unrealized appreciation (depreciation) until the contracts are closed. When the contracts are closed, realized gains (losses) are recorded. Realized and unrealized gains (losses) on the contracts are included in the Statement of Operations. The primary risks associated with forward foreign currency contracts include failure of the Counterparty to meet the terms of the contract and the value of the foreign currency changing unfavorably. These risks may be in excess of the amounts reflected in the Statement of Assets and Liabilities.
| N. | Industry Focus — To the extent that the Fund invests a greater amount of its assets in securities of issuers in the banking and financial services industries, the Fund’s performance will depend to a greater extent on the overall condition of those industries. The value of these securities can be sensitive to changes in government regulation, interest rates and economic downturns in the U.S. and abroad. |
| O. | Bank Loan Risk — Although the resale, or secondary market for floating rate loans has grown substantially over the past decade, both in overall size and number of market participants, there is no organized exchange or board of trade on which floating rate loans are traded. Instead, the secondary market for floating rate loans is a private, unregulated interdealer or interbank resale market. Such a market may therefore be subject to irregular trading activity, wide bid/ask spreads, and extended trade settlement periods, which may impair the Fund’s ability to sell bank loans within its desired time frame or at an acceptable price and its ability to accurately value existing and prospective investments. Extended trade settlement periods may result in cash not being immediately available to the Fund. As a result, the Fund may have to sell other investments or engage in borrowing transactions to raise cash to meet its obligations. Similar to other asset classes, bank loan funds may be exposed to counterparty credit risk, or the risk that an entity with which the Fund has unsettled or open transactions may fail to or be unable to perform on its commitments. The Fund seeks to manage counterparty credit risk by entering into transactions only with counterparties that it believes have the financial resources to honor their obligations and by monitoring the financial stability of those counterparties. |
| P. | Other Risks – The Fund may invest all or substantially all of its assets in senior secured floating rate loans and senior secured debt securities that are determined to be rated below investment grade. These securities are generally considered to have speculative characteristics and are subject to greater risk of loss of principal and interest than higher rated securities. The value of lower quality debt securities and floating rate loans can be more volatile due to increased sensitivity to adverse issuer, political, regulatory, market or economic developments. |
| 42 | Invesco Floating Rate Fund |
The Fund invests in corporate loans from U.S. or non-U.S. companies (the “Borrowers”). The investment of the Fund in a corporate loan may take the form of participation interests or assignments. If the Fund purchases a participation interest from a syndicate of lenders (“Lenders”) or one of the participants in the syndicate (“Participant”), one or more of which administers the loan on behalf of all the Lenders (the “Agent Bank”), the Fund would be required to rely on the Lender that sold the participation interest not only for the enforcement of the Fund’s rights against the Borrower but also for the receipt and processing of payments due to the Fund under the corporate loans. As such, the Fund is subject to the credit risk of the Borrower and the Participant. Lenders and Participants interposed between the Fund and a Borrower, together with Agent Banks, are referred to as “Intermediate Participants”.
| Q. | Leverage Risk — The Fund may utilize leverage to seek to enhance the yield of the Fund by borrowing. There are risks associated with borrowing in an effort to increase the yield and distributions on the common shares, including that the costs of the financial leverage may exceed the income from investments purchased with such leverage proceeds, the higher volatility of the NAV of the shares, and that fluctuations in the interest rates on the borrowing may affect the yield and distributions to the common shareholders. There can be no assurance that the Fund’s leverage strategy will be successful. |
NOTE 2—Advisory Fees and Other Fees Paid to Affiliates
The Trust has entered into a master investment advisory agreement with Invesco Advisers, Inc. (the "Adviser" or "Invesco"). Under the terms of the investment advisory agreement, the Fund accrues daily and pays monthly an advisory fee to the Adviser based on the annual rate of the Fund’s average daily net assets as follows:
| Average Daily Net Assets | Rate |
| First $500 million | 0.65% |
| Next $4.5 billion | 0.60% |
| Next $5 billion | 0.575% |
| Over $10 billion | 0.55% |
For the year ended August 31, 2019, the effective advisory fees incurred by the Fund was 0.61%.
Under the terms of a master sub-advisory agreement between the Adviser and each of Invesco Asset Management Deutschland GmbH, Invesco Asset Management Limited, Invesco Asset Management (Japan) Limited, Invesco Hong Kong Limited, Invesco Senior Secured Management, Inc. and Invesco Canada Ltd. and separate sub-advisory agreements with Invesco Capital Management LLC and Invesco Asset Management (India) Private Limited (collectively, the "Affiliated Sub-Advisers") the Adviser, not the Fund, will pay 40% of the fees paid to the Adviser to any such Affiliated Sub-Adviser(s) that provide(s) discretionary investment management services to the Fund based on the percentage of assets allocated to such Affiliated Sub-Adviser(s).
The Adviser has contractually agreed, through at least June 30, 2020, to waive advisory fees and/or reimburse expenses of all shares to the extent necessary to limit total annual fund operating expenses after fee waiver and/or reimbursement (excluding certain items discussed below) of Class A, Class C, Class R, Class Y, Class R5 and Class R6 shares to 1.50%, 2.00%, 1.75%, 1.25%, 1.25% and 1.25%, respectively, of the Fund’s average daily net assets (the “expense limits”). In determining the Adviser’s obligation to waive advisory fees and/or reimburse expenses, the following expenses are not taken into account, and could cause the total annual fund operating expenses after fee waiver and/or reimbursement to exceed the numbers reflected above: (1) interest, facilities and maintenance fees; (2) taxes; (3) dividend expense on short sales; (4) extraordinary or non-routine items, including litigation expenses; and (5) expenses that the Fund has incurred but did not actually pay because of an expense offset arrangement. Unless Invesco continues the fee waiver agreement, it will terminate on June 30, 2020. During its term, the fee waiver agreement cannot be terminated or amended to increase the expense limits or reduce the advisory fee waivers without approval of the Board of Trustees. The Adviser did not waive fees and/or reimburse expenses during the period under this expense limit.
Further, the Adviser has contractually agreed, through at least June 30, 2021, to waive the advisory fee payable by the Fund in an amount equal to 100% of the net advisory fees the Adviser receives from the affiliated money market funds on investments by the Fund of uninvested cash in such affiliated money market funds.
For the year ended August 31, 2019, the Adviser waived advisory fees of $87,204.
The Trust has entered into a master administrative services agreement with Invesco pursuant to which the Fund has agreed to pay Invesco for certain administrative costs incurred in providing accounting services to the Fund. For the year ended August 31, 2019, expenses incurred under the agreement are shown in the Statement of Operations asAdministrative services fees.
Also, Invesco has entered into service agreements whereby State Street Bank and Trust Company (“SSB”) serves as custodian and fund accountant and provides certain administrative services to the Fund.
The Trust has entered into a transfer agency and service agreement with Invesco Investment Services, Inc. (“IIS”) pursuant to which the Fund has agreed to pay IIS a fee for providing transfer agency and shareholder services to the Fund and reimburse IIS for certain expenses incurred by IIS in the course of providing such services. IIS may make payments to intermediaries that provide omnibus account services, sub-accounting services and/or networking services. All fees payable by IIS to intermediaries that provide omnibus account services or sub-accounting services are charged back to the Fund, subject to certain limitations approved by the Trust’s Board of Trustees. For the year ended August 31, 2019, expenses incurred under the agreement are shown in the Statement of Operations asTransfer agent fees.
The Trust has entered into master distribution agreements with Invesco Distributors, Inc. (“IDI”) to serve as the distributor for the Class A, Class C, Class R, Class Y, Class R5 and Class R6 shares of the Fund. The Trust has adopted plans pursuant to Rule 12b-1 under the 1940 Act with respect to the Fund’s Class A, Class C and Class R shares (collectively, the “Plans”). The Fund, pursuant to the Plans, pays IDI compensation at the annual rate of 0.25% of the Fund’s average daily net assets of Class A shares, 0.75% of the average daily net assets of Class C shares and 0.50% of the average daily net assets of Class R shares. The fees are accrued daily and paid monthly. Of the Plan payments, up to 0.25% of the average daily net assets of each class of shares may be paid to furnish continuing personal shareholder services to customers who purchase and own shares of such classes. Any amounts not paid as a service fee under the Plans would constitute an asset-based sales charge. Rules of the Financial Industry Regulatory Authority (“FINRA”) impose a cap on the total sales charges, including asset-based sales charges, that may be paid by any class of shares of the Fund. For the year ended August 31, 2019, expenses incurred under the Plans are shown in the Statement of Operations asDistribution fees.
| 43 | Invesco Floating Rate Fund |
Front-end sales commissions and CDSC (collectively, the “sales charges”) are not recorded as expenses of the Fund. Front-end sales commissions are deducted from proceeds from the sales of Fund shares prior to investment in Class A shares of the Fund. CDSC are deducted from redemption proceeds prior to remittance to the shareholder. During the year ended August 31, 2019, IDI advised the Fund that IDI retained $57,584 in front-end sales commissions from the sale of Class A shares and $87,867 and $11,771 from Class A and Class C shares, respectively, for CDSC imposed upon redemptions by shareholders.
Certain officers and trustees of the Trust are officers and directors of Invesco.
NOTE 3—Additional Valuation Information
GAAP defines fair value as the price that would be received to sell an asset or paid to transfer a liability in an orderly transaction between market participants at the measurement date, under current market conditions. GAAP establishes a hierarchy that prioritizes the inputs to valuation methods, giving the highest priority to readily available unadjusted quoted prices in an active market for identical assets (Level 1) and the lowest priority to significant unobservable inputs (Level 3), generally when market prices are not readily available or are unreliable. Based on the valuation inputs, the securities or other investments are tiered into one of three levels. Changes in valuation methods may result in transfers in or out of an investment’s assigned level:
Level 1 – Prices are determined using quoted prices in an active market for identical assets.
Level 2 – Prices are determined using other significant observable inputs. Observable inputs are inputs that other market participants may use in pricing a security. These may include quoted prices for similar securities, interest rates, prepayment speeds, credit risk, yield curves, loss severities, default rates, discount rates, volatilities and others.
Level 3 – Prices are determined using significant unobservable inputs. In situations where quoted prices or observable inputs are unavailable (for example, when there is little or no market activity for an investment at the end of the period), unobservable inputs may be used. Unobservable inputs reflect the Fund’s own assumptions about the factors market participants would use in determining fair value of the securities or instruments and would be based on the best available information.
The following is a summary of the tiered valuation input levels, as of August 31, 2019. The level assigned to the securities valuations may not be an indication of the risk or liquidity associated with investing in those securities. Because of the inherent uncertainties of valuation, the values reflected in the financial statements may materially differ from the value received upon actual sale of those investments.
The Fund’s policy is to recognize transfers in and out of the valuation levels as of the end of the reporting period. During the year ended August 31, 2019, there were transfers from Level 3 to Level 2 of $16,639,242, due to third-party vendor quotations utilizing more than one market quote and from Level 2 to Level 3 of $22,627,783, due to third party vendor quotations utilizing single market quotes.
| | Level 1 | Level 2 | Level 3 | Total |
| Investments in Securities | | | | |
| Variable Rate Senior Loan Interests | $— | $1,760,490,914 | $88,322,318 | $1,848,813,232 |
| U.S. Dollar Denominated Bonds & Notes | — | 168,333,757 | 39,038 | 168,372,795 |
| Common Stocks & Other Equity Interests | 20,123,163 | 14,813,383 | 10,942,538 | 45,879,084 |
| Non-U.S. Dollar Denominated Bonds & Notes | — | 24,712,639 | — | 24,712,639 |
| Structured Products | — | 13,408,962 | — | 13,408,962 |
| Preferred Stocks | — | 331,737 | 110,369 | 442,106 |
| Money Market Funds | 103,406,260 | — | — | 103,406,260 |
| Investments Matured | — | — | 140,399 | 140,399 |
| Total Investments in Securities | 123,529,423 | 1,982,091,392 | 99,554,662 | 2,205,175,477 |
| Other Investments - Assets* | | | | |
| Forward Foreign Currency Contracts | — | 4,189,317 | — | 4,189,317 |
| Other Investments - Liabilities* | | | | |
| Forward Foreign Currency Contracts | — | (1,083,726) | — | (1,083,726) |
| Total Other Investments | — | 3,105,591 | — | 3,105,591 |
| Total Investments | $123,529,423 | $1,985,196,983 | $99,554,662 | $2,208,281,068 |
| * | Unrealized appreciation (depreciation). |
A reconciliation of Level 3 investments is presented when the Fund had a significant amount of Level 3 investments at the beginning and/or end of the reporting period in relation to net assets.
The following is a reconciliation of the fair valuations using significant unobservable inputs (Level 3) during the year ended August 31, 2019:
| | Value
08/31/18 | Purchases
at Cost | Proceeds
from Sales | Accrued
Discounts/
Premiums | Realized
Gain | Change in
Unrealized
Appreciation
(Depreciation) | Transfers
into
Level 3 | Transfers
out of
Level 3 | Value
08/31/19 |
| Variable Rate Senior Loan Interests | $125,107,531 | $56,329,445 | $(96,817,909) | $(243,690) | $641,691 | $(2,150,363) | $22,094,855 | $(16,639,242) | $88,322,318 |
| 44 | Invesco Floating Rate Fund |
| | Value
08/31/18 | Purchases
at Cost | Proceeds
from Sales | Accrued
Discounts/
Premiums | Realized
Gain | Change in
Unrealized
Appreciation
(Depreciation) | Transfers
into
Level 3 | Transfers
out of
Level 3 | Value
08/31/19 |
| U.S. Dollar Denominated Bonds & Notes | 44,615 | – | – | 17,566 | – | (23,143) | – | – | 39,038 |
| Common Stocks & Other Equity Interests | 8,448,586 | 8,856,008 | (66,855) | – | 35,433 | (6,816,829) | 486,195 | – | 10,942,538 |
| Preferred Stocks | 0 | 109,339 | – | – | – | 1,030 | – | – | 110,369 |
| Investments Matured | 74,634 | 18,456 | – | 28 | – | 548 | 46,733 | – | 140,399 |
| Total | $133,675,366 | $65,313,248 | $(96,884,764) | $(226,096) | $677,124 | $(8,988,757) | $22,627,783 | $(16,639,242) | $99,554,662 |
Securities determined to be Level 3 at the end of the reporting period were valued primarily by utilizing quotes from a third-party vendor pricing service. A significant change in third-party pricing information could result in a significantly lower or higher value in Level 3 investments.
NOTE 4—Derivative Investments
The Fund may enter into an International Swaps and Derivatives Association Master Agreement (“ISDA Master Agreement”) under which a fund may trade OTC derivatives. An OTC transaction entered into under an ISDA Master Agreement typically involves a collateral posting arrangement, payment netting provisions and close-out netting provisions. These netting provisions allow for reduction of credit risk through netting of contractual obligations. The enforceability of the netting provisions of the ISDA Master Agreement depends on the governing law of the ISDA Master Agreement, among other factors.
For financial reporting purposes, the Fund does not offset OTC derivative assets or liabilities that are subject to ISDA Master Agreements in the Statement of Assets and Liabilities.
Value of Derivative Investments at Period-End
The table below summarizes the value of the Fund’s derivative investments, detailed by primary risk exposure, held as of August 31, 2019:
| | Value |
| Derivative Assets | Currency
Risk |
| Unrealized appreciation on forward foreign currency contracts outstanding | $4,189,317 |
| Derivatives not subject to master netting agreements | - |
| Total Derivative Assets subject to master netting agreements | $4,189,317 |
| | Value |
| Derivative Liabilities | Currency
Risk |
| Unrealized depreciation on forward foreign currency contracts outstanding | $(1,083,726) |
| Derivatives not subject to master netting agreements | - |
| Total Derivative Liabilities subject to master netting agreements | $(1,083,726) |
The table below reflects the Fund’s exposure to Counterparties subject to either an ISDA Master Agreement or other agreement for OTC derivative transactions as of August 31, 2019.
| | Financial
Derivative
Assets | | Financial
Derivative
Liabilities | | Collateral
(Received)/Pledged | |
| Counterparty | Forward Foreign
Currency Contracts | | Forward Foreign
Currency Contracts | Net Value of
Derivatives | Non-Cash | Cash | Net
Amount |
| Bank of America Merrill Lynch | $41,646 | | $(33,493) | $8,153 | $– | $– | $8,153 |
| Barclays Bank PLC | 518,845 | | (231,589) | 287,256 | – | – | 287,256 |
| Canadian Imperial Bank of Commerce | 265,622 | | (266,245) | (623) | – | – | (623) |
| Citibank N.A. | 1,034,159 | | (214,017) | 820,142 | – | – | 820,142 |
| Goldman Sachs International | 587,757 | | – | 587,757 | – | – | 587,757 |
| J.P. Morgan Chase Bank, N.A. | 242,473 | | – | 242,473 | – | – | 242,473 |
| Morgan Stanley & Co. LLC | 2,730 | | – | 2,730 | – | – | 2,730 |
| Royal Bank of Canada | 622,099 | | (21,442) | 600,657 | – | – | 600,657 |
| 45 | Invesco Floating Rate Fund |
| | Financial
Derivative
Assets | | Financial
Derivative
Liabilities | | Collateral
(Received)/Pledged | |
| Counterparty | Forward Foreign
Currency Contracts | | Forward Foreign
Currency Contracts | Net Value of
Derivatives | Non-Cash | Cash | Net
Amount |
| Toronto Dominion Bank | 873,986 | | (307,550) | 566,436 | – | – | 566,436 |
| UBS AG | – | | (9,390) | (9,390) | – | – | (9,390) |
| Total | $4,189,317 | | $(1,083,726) | $3,105,591 | $– | $– | $3,105,591 |
Effect of Derivative Investments for the year ended August 31, 2019
The table below summarizes the gains on derivative investments, detailed by primary risk exposure, recognized in earnings during the period:
| | Location of Gain on
Statement of Operations |
| | Currency
Risk |
| Realized Gain: | |
| Forward foreign currency contracts | $8,287,943 |
| Change in Net Unrealized Appreciation: | |
| Forward foreign currency contracts | 1,877,658 |
| Total | $10,165,601 |
The table below summarizes the average notional value of derivatives held during the period.
| | Forward
Foreign Currency
Contracts |
| Average notional value | $356,775,557 |
NOTE 5—Expense Offset Arrangement(s)
The expense offset arrangement is comprised of transfer agency credits which result from balances in demand deposit accounts used by the transfer agent for clearing shareholder transactions. For the year ended August 31, 2019, the Fund received credits from this arrangement, which resulted in the reduction of the Fund’s total expenses of $3,424.
NOTE 6—Trustees’ and Officers’ Fees and Benefits
Trustees’ and Officers’ Fees and Benefits include amounts accrued by the Fund to pay remuneration to certain Trustees and Officers of the Fund. Trustees have the option to defer compensation payable by the Fund, and Trustees’ and Officers’ Fees and Benefits also include amounts accrued by the Fund to fund such deferred compensation amounts. Those Trustees who defer compensation have the option to select various Invesco Funds in which their deferral accounts shall be deemed to be invested. Finally, certain current Trustees were eligible to participate in a retirement plan that provided for benefits to be paid upon retirement to Trustees over a period of time based on the number of years of service. The Fund may have certain former Trustees who also participate in a retirement plan and receive benefits under such plan.Trustees’ and Officers’ Fees and Benefits include amounts accrued by the Fund to fund such retirement benefits. Obligations under the deferred compensation and retirement plans represent unsecured claims against the general assets of the Fund.
NOTE 7—Cash Balances
Effective July 17, 2019, the Board of Trustees of the Fund approved a revolving line of credit agreement with SSB in which the Fund may borrow up to the lesser of (1) $475,000,000 or (2) the limits set by its prospectus for borrowings. During the year ended August 31, 2019, the Fund did not draw on the revolving line of credit. This agreement will expire on July 15, 2020. Prior to July 17, 2019, the Fund could borrow up to the lesser of (1) $500,000,000 or (2) the limits set by its prospectus for borrowings.
Additionally, the Fund is permitted to temporarily carry a negative or overdrawn balance in its account with SSB, the custodian bank. Such balances, if any at period-end, are shown in the Statement of Assets and Liabilities under the payable captionAmount due custodian. To compensate the custodian bank for such overdrafts, the overdrawn Fund may either (1) leave funds as a compensating balance in the account so the custodian bank can be compensated by earning the additional interest; or (2) compensate by paying the custodian bank at a rate agreed upon by the custodian bank and Invesco, not to exceed the contractually agreed upon rate. The Fund may not purchase additional securities when any borrowings from banks or broker-dealers exceed 5% of the Fund’s total assets, or when any borrowings from an Invesco Fund are outstanding
NOTE 8—Unfunded Loan Commitments
As of August 31, 2019, the Fund had unfunded loan commitments, which could be extended at the option of the borrower, pursuant to the following loan agreements with the following borrowers:
| Borrower | Type | | Principal
Amount(a) | Value |
| Allied Universal Holdco LLC | Delayed Draw Term Loan | | $338,353 | $338,353 |
| 46 | Invesco Floating Rate Fund |
| Borrower | Type | | Principal
Amount(a) | Value |
| Evergood 4 APS | Term Loan | EUR | 714,341 | 18,592 |
| IAP Worldwide Services, Inc. | Revolver | | 929,279 | 929,279 |
| Mavis Tire Express Services Corp. | Delayed Draw Term Loan | | 79,415 | 78,075 |
| Pacific Gas and Electric Co. | Delayed Draw Term Loan | | 1,983,193 | 1,983,193 |
| Manna Pro Products, LLC | Delayed Draw Term Loan | | 211,961 | 209,841 |
| Monitronics International Inc. | DIP Loan | | 783,232 | 783,232 |
| SRAM, LLC | Delayed Draw Term Loan | | 1,213,431 | 1,213,431 |
| Unilabs Diagnostics AB | Revolver | EUR | 1,849,988 | 2,019,179 |
| Transtar Holding Co. | Delayed Draw Term Loan | | 242,525 | 242,525 |
| | | | | $7,815,700 |
| (a) | Principal amounts are denominated in U.S. Dollars unless otherwise noted. |
NOTE 9—Distributions to Shareholders and Tax Components of Net Assets
| Tax Character of Distributions to Shareholders Paid During the Fiscal Years Ended August 31, 2019 and August 31, 2018 |
| | 2019 | 2018 |
| Ordinary income | $113,012,838 | $112,764,276 |
| Tax Components of Net Assets at Period-End: |
| | 2019 |
| Undistributed ordinary income | $14,596,964 |
| Net unrealized appreciation (depreciation) - investments | (92,453,573) |
| Net unrealized appreciation — foreign currencies | 406,442 |
| Temporary book/tax differences | (175,608) |
| Capital loss carryforward | (122,730,635) |
| Shares of beneficial interest | 2,368,634,215 |
| Total net assets | $2,168,277,805 |
The difference between book-basis and tax-basis unrealized appreciation (depreciation) is due to differences in the timing of recognition of gains and losses on investments for tax and book purposes. The Fund’s net unrealized appreciation (depreciation) difference is attributable primarily to wash sales, foreign currency transactions and amortization differences.
The temporary book/tax differences are a result of timing differences between book and tax recognition of income and/or expenses. The Fund’s temporary book/tax differences are the result of the trustee deferral of compensation and retirement plan benefits.
Capital loss carryforward is calculated and reported as of a specific date. Results of transactions and other activity after that date may affect the amount of capital loss carryforward actually available for the Fund to utilize. Capital losses generated in years beginning after December 22, 2010 can be carried forward for an unlimited period, whereas previous losses expire in eight tax years. Capital losses with an expiration period may not be used to offset capital gains until all net capital losses without an expiration date have been utilized. Capital loss carryforwards with no expiration date will retain their character as either short-term or long-term capital losses instead of as short-term capital losses as under prior law. The ability to utilize capital loss carryforwards in the future may be limited under the Internal Revenue Code and related regulations based on the results of future transactions.
The Fund has a capital loss carryforward as of August 31, 2019, as follows:
| Capital Loss Carryforward* |
| Expiration | Short-Term | Long-Term | Total |
| Not subject to expiration | $5,074,458 | $117,656,177 | $122,730,635 |
| * | Capital loss carryforwards as of the date listed above is reduced for limitations, if any, to the extent required by the Internal Revenue Code and may be further limited depending upon a variety of factors, including the realization of net unrealized gains or losses as of the date of any reorganization. |
NOTE 10—Investment Transactions
The aggregate amount of investment securities (other than short-term securities, U.S. Treasury obligations and money market funds, if any) purchased and sold by the Fund during the year ended August 31, 2019 was $1,246,665,694 and $1,751,079,576, respectively. Cost of
| 47 | Invesco Floating Rate Fund |
investments, including any derivatives, on a tax basis includes the adjustments for financial reporting purposes as of the most recently completed federal income tax reporting period-end.
| Unrealized Appreciation (Depreciation) of Investments on a Tax Basis |
| Aggregate unrealized appreciation of investments | $25,671,630 |
| Aggregate unrealized (depreciation) of investments | (118,125,203) |
| Net unrealized appreciation (depreciation) of investments | $(92,453,573) |
Cost of investments for tax purposes is $2,300,734,641.
NOTE 11—Reclassification of Permanent Differences
Primarily as a result of differing book/tax treatment of foreign currency transactions and bond amortization, on August 31, 2019, undistributed net investment income was increased by $6,073,667, undistributed net realized gain (loss) was decreased by $5,785,589 and shares of beneficial interest was decreased by $288,078. This reclassification had no effect on the net assets of the Fund.
NOTE 12—Share Information
| | Summary of Share Activity |
| | Years ended August 31, |
| | 2019(a) | | 2018 |
| | Shares | Amount | | Shares | Amount |
| Sold: | | | | | |
| Class A | 15,746,107 | $117,484,809 | | 18,929,188 | $143,533,968 |
| Class C | 5,442,356 | 40,396,244 | | 6,770,878 | 51,103,833 |
| Class R | 221,829 | 1,665,718 | | 136,694 | 1,037,418 |
| Class Y | 38,926,147 | 290,596,950 | | 48,907,919 | 370,331,167 |
| Class R5 | 402,269 | 3,010,002 | | 336,775 | 2,554,713 |
| Class R6 | 37,218,832 | 277,284,357 | | 10,475,341 | 79,226,341 |
| Issued as reinvestment of dividends: | | | | | |
| Class A | 2,734,932 | 20,340,764 | | 2,462,146 | 18,658,658 |
| Class C | 1,145,899 | 8,487,397 | | 1,509,699 | 11,390,606 |
| Class R | 132,321 | 992,417 | | 27,068 | 205,416 |
| Class Y | 3,018,195 | 22,419,700 | | 3,661,736 | 27,711,614 |
| Class R5 | 38,190 | 284,045 | | 17,965 | 136,259 |
| Class R6 | 4,617,525 | 34,282,066 | | 3,793,428 | 28,707,181 |
| Automatic conversion of Class C shares to Class A shares: | | | | | |
| Class A | 13,611,986 | 100,418,260 | | - | - |
| Class C | (13,685,012) | (100,418,260) | | - | - |
| Reacquired: | | | | | |
| Class A | (36,698,991) | (272,580,561) | | (27,425,782) | (207,835,602) |
| Class C | (15,398,333) | (113,957,916) | | (16,415,089) | (123,805,917) |
| Class R | (334,882) | (2,513,745) | | (265,294) | (2,013,436) |
| Class Y | (89,312,275) | (661,674,187) | | (54,539,771) | (412,793,128) |
| Class R5 | (294,726) | (2,192,236) | | (108,892) | (825,556) |
| Class R6 | (13,201,426) | (98,209,259) | | (14,773,649) | (111,705,883) |
| Net increase (decrease) in share activity | (45,669,057) | $(333,883,435) | | (16,499,640) | $(124,382,348) |
| (a) | There are entities that are record owners of more than 5% of the outstanding shares of the Fund and in the aggregate own 54% of the outstanding shares of the Fund. IDI has an agreement with these entities to sell Fund shares. The Fund, Invesco and/or Invesco affiliates may make payments to these entities, which are considered to be related to the Fund, for providing services to the Fund, Invesco and/or Invesco affiliates including but not limited to services such as securities brokerage, distribution, third party record keeping and account servicing. The Fund has no knowledge as to whether all or any portion of the shares owned of record by these entities are also owned beneficially. |
| 48 | Invesco Floating Rate Fund |
Report of Independent Registered Public Accounting Firm
To the Board of Trustees of AIM Counselor Series Trust (Invesco Counselor Series Trust) and Shareholders of Invesco Floating Rate Fund
Opinion on the Financial Statements
We have audited the accompanying statement of assets and liabilities, including the schedule of investments, of Invesco Floating Rate Fund (one of the funds constituting AIM Counselor Series Trust (Invesco Counselor Series Trust), hereafter referred to as the "Fund") as of August 31, 2019, the related statements of operations and cash flows for the year ended August 31, 2019, the statement of changes in net assets for each of the two years in the period ended August 31, 2019, including the related notes, and the financial highlights for each of the five years in the period ended August 31, 2019 (collectively referred to as the "financial statements"). In our opinion, the financial statements present fairly, in all material respects, the financial position of the Fund as of August 31, 2019, the results of its operations and its cash flows for the year then ended, the changes in its net assets for each of the two years in the period ended August 31, 2019 and the financial highlights for each of the five years in the period ended August 31, 2019 in conformity with accounting principles generally accepted in the United States of America.
Basis for Opinion
These financial statements are the responsibility of the Fund’s management. Our responsibility is to express an opinion on the Fund’s financial statements based on our audits. We are a public accounting firm registered with the Public Company Accounting Oversight Board (United States) (PCAOB) and are required to be independent with respect to the Fund in accordance with the U.S. federal securities laws and the applicable rules and regulations of the Securities and Exchange Commission and the PCAOB.
We conducted our audits of these financial statements in accordance with the standards of the PCAOB. Those standards require that we plan and perform the audit to obtain reasonable assurance about whether the financial statements are free of material misstatement, whether due to error or fraud.
Our audits included performing procedures to assess the risks of material misstatement of the financial statements, whether due to error or fraud, and performing procedures that respond to those risks. Such procedures included examining, on a test basis, evidence regarding the amounts and disclosures in the financial statements. Our audits also included evaluating the accounting principles used and significant estimates made by management, as well as evaluating the overall presentation of the financial statements. Our procedures included confirmation of securities owned as of August 31, 2019 by correspondence with the custodian, transfer agent and brokers; when replies were not received from brokers, we performed other auditing procedures. We believe that our audits provide a reasonable basis for our opinion.
/s/ PricewaterhouseCoopers LLP
Houston, Texas
October 29, 2019
We have served as the auditor of one or more of the investment companies in the Invesco group of investment companies since at least 1995. We have not been able to determine the specific year we began serving as auditor.
| 49 | Invesco Floating Rate Fund |
Calculating your ongoing Fund expenses
Example
As a shareholder of the Fund, you incur two types of costs: (1) transaction costs, which may include sales charges (loads) on purchase payments or contingent deferred sales charges on redemptions, if any; and (2) ongoing costs, including management fees, distribution and/or service (12b-1) fees, and other Fund expenses. This example is intended to help you understand your ongoing costs (in dollars) of investing in the Fund and to compare these costs with ongoing costs of investing in other mutual funds. The example is based on an investment of $1,000 invested at the beginning of the period and held for the entire period March 1, 2019 through August 31, 2019.
Actual expenses
The table below provides information about actual account values and actual expenses. You may use the information in this table, together with the amount you invested, to estimate the expenses that you paid over the period. Simply divide your account value by $1,000 (for example, an $8,600 account value divided by $1,000 = 8.6), then multiply the result by the number in the table under the heading entitled “Actual Expenses Paid During Period” to estimate the expenses you paid on your account during this period.
Hypothetical example for comparison purposes
The table below also provides information about hypothetical account values and hypothetical expenses based on the Fund’s actual expense ratio and an assumed rate of return of 5% per year before expenses, which is not the Fund’s actual return.
The hypothetical account values and expenses may not be used to estimate the actual ending account balance or expenses you paid for the period. You may use this information to compare the ongoing costs of investing in the Fund and other funds. To do so, compare this 5% hypothetical example with the 5% hypothetical examples that appear in the shareholder reports of the other funds.
Please note that the expenses shown in the table are meant to highlight your ongoing costs only and do not reflect any transaction costs, such as sales charges (loads) on purchase payments or contingent deferred sales charges on redemptions, if any. Therefore, the hypothetical information is useful in comparing ongoing costs only, and will not help you determine the relative total costs of owning different funds. In addition, if these transaction costs were included, your costs would have been higher.
| | Beginning
Account Value (03/01/19) | ACTUAL | HYPOTHETICAL
(5% annual return before
expenses) | Annualized
Expense
Ratio |
Ending
Account Value
(08/31/19)1 | Expenses
Paid During
Period | Ending
Account Value
(08/31/19)2 | Expenses
Paid During
Period2 |
| Class A | $1,000.00 | $1,016.30 | $5.03 | $1,020.21 | $5.04 | 0.99% |
| Class C | 1,000.00 | 1,013.70 | 7.56 | 1,017.69 | 7.58 | 1.49 |
| Class R | 1,000.00 | 1,015.00 | 6.30 | 1,018.95 | 6.31 | 1.24 |
| Class Y | 1,000.00 | 1,017.50 | 3.76 | 1,021.48 | 3.77 | 0.74 |
| Class R5 | 1,000.00 | 1,019.00 | 3.66 | 1,021.58 | 3.67 | 0.72 |
| Class R6 | 1,000.00 | 1,018.10 | 3.15 | 1,022.08 | 3.16 | 0.62 |
| 1 | The actual ending account value is based on the actual total return of the Fund for the period March 1, 2019 through August 31, 2019, after actual expenses and will differ from the hypothetical ending account value which is based on the Fund’s expense ratio and a hypothetical annual return of 5% before expenses. |
| 2 | Expenses are equal to the Fund’s annualized expense ratio as indicated above multiplied by the average account value over the period, multiplied by 184/365 to reflect the most recent fiscal half year. |
| 50 | Invesco Floating Rate Fund |
Approval of Investment Advisory and Sub-Advisory Contracts
At meetings held on June 10, 2019, the Board of Trustees (the Board or the Trustees) of AIM Counselor Series Trust (Invesco Counselor Series Trust) as a whole, and the independent Trustees, who comprise over 75% of the Board, voting separately, approved the continuance of the Invesco Floating Rate Fund’s (the Fund) Master Investment Advisory Agreement with Invesco Advisers, Inc. (Invesco Advisers and the investment advisory agreement) and the Master IntergroupSub-Advisory Contract for Mutual Funds with Invesco Asset Management Deutschland GmbH, Invesco Asset Management Limited, Invesco Asset Management (Japan) Limited, Invesco Hong Kong Limited, Invesco Senior Secured Management, Inc., Invesco Canada Ltd. and separatesub-advisory contracts with Invesco Capital Management LLC and Invesco Asset Management (India) Private Limited (collectively, the AffiliatedSub-Advisers and thesub-advisory contracts) for another year, effective July 1, 2019. After evaluating the factors discussed below, among others, the Board approved the renewal of the Fund’s investment advisory agreement and thesub-advisory contracts and determined that the compensation payable by the Fund to Invesco Advisers and by Invesco Advisers to the AffiliatedSub-Advisers is fair and reasonable.
The Board’s Evaluation Process
The Board’s Investments Committee has established threeSub-Committees, which meet throughout the year to review the performance of funds advised by Invesco Advisers (the Invesco Funds). As part of a regularly scheduled basis ofin-person Board meetings, theSub-Committees meet with portfolio managers for their assigned Invesco Funds and other members of management to review detailed information about investment performance and portfolio attributes of these funds. The Board took into account evaluations and reports that it received from the Investments Committee andSub-Committees, as well as the information provided to such committees and the Board throughout the year, in considering whether to approve each Invesco Fund’s investment advisory agreement andsub-advisory contracts.
As part of the contract renewal process, the Board reviews and considers information provided in response to detailed requests for information submitted to management by the independent Trustees with assistance from legal counsel to the independent Trustees. The Board receives comparative investment performance and fee data regarding the Invesco Funds prepared by Invesco Advisers and Broadridge Financial Solutions, Inc. (Broadridge), an independent mutual fund data provider. The Board also receives an independent written evaluation from the Senior Officer, an officer of the Invesco Funds who reports directly to the independent Trustees. The Senior Officer’s
evaluation is prepared as part of his responsibility to manage the process by which the Invesco Funds’ proposed management fees are negotiated during the annual contract renewal process to ensure they are negotiated in a manner that is at arms’ length and reasonable. In addition to meetings with Invesco Advisers and fund counsel throughout the year, the independent Trustees also discuss the continuance of the investment advisory agreement andsub-advisory contracts in separate sessions with the Senior Officer and with independent legal counsel.
The discussion below is a summary of the Senior Officer’s independent written evaluation with respect to the Fund’s investment advisory agreement, as well as a discussion of the material factors and related conclusions that formed the basis for the Board’s approval of the Fund’s investment advisory agreement andsub-advisory contracts. The Trustees’ review and conclusions are based on the comprehensive consideration of all information presented to them during the course of the year and in prior years and are not the result of any single determinative factor. Moreover, one Trustee may have weighed a particular piece of information or factor differently than another Trustee. This information is current as of June 10, 2019.
Factors and Conclusions and Summary of Independent Written Fee Evaluation
| A. | Nature, Extent and Quality of Services Provided by Invesco Advisers and the AffiliatedSub-Advisers |
The Board reviewed the nature, extent and quality of the advisory services provided to the Fund by Invesco Advisers under the Fund’s investment advisory agreement, and the credentials and experience of the officers and employees of Invesco Advisers who provide these services, including the Fund’s portfolio manager(s). The Board’s review included consideration of Invesco Advisers’ investment process oversight and structure, credit analysis and investment risk management. The Board also considerednon-advisory services that Invesco Advisers and its affiliates provide to the Invesco Funds such as various back office support functions, third party oversight, internal audit, valuation, portfolio trading and legal and compliance. The Board also received and reviewed information about Invesco Advisers’ role as administrator of the Invesco Funds’ liquidity risk management program. The Board also reviewed and considered the benefits to shareholders of investing in a fund that is part of the Invesco family of funds under the umbrella of Invesco Ltd., Invesco Advisers’ parent company, and noted Invesco Ltd.’s depth and experience in conducting an investment management business, as well as its commitment of financial and other resources to
such business. The Board reviewed and considered information about the resources that Invesco Advisers intends to continue to commit to managing the Invesco family of funds following Invesco Ltd.’s acquisition of OppenheimerFunds, Inc. and its subsidiaries. The Board concluded that the nature, extent and quality of the services provided to the Fund by Invesco Advisers are appropriate and satisfactory.
The Board reviewed the services that may be provided by the AffiliatedSub-Advisers under thesub-advisory contracts and the credentials and experience of the officers and employees of the AffiliatedSub-Advisers who provide these services. The Board noted the AffiliatedSub-Advisers’ expertise with respect to certain asset classes and that the AffiliatedSub-Advisers have offices and personnel that are located in financial centers around the world. As a result, the Board noted that the AffiliatedSub-Advisers can provide research and investment analysis on the markets and economies of various countries in which the Fund may invest, make recommendations regarding securities and assist with security trades. The Board concluded that thesub-advisory contracts may benefit the Fund and its shareholders by permitting Invesco Advisers to use the resources and talents of the AffiliatedSub-Advisers in managing the Fund. The Board concluded that the nature, extent and quality of the services that may be provided by the AffiliatedSub-Advisers are appropriate and satisfactory.
| B. | Fund Investment Performance |
The Board considered Fund investment performance as a relevant factor in considering whether to approve the investment advisory agreement as well as thesub-advisory contracts for the Fund, as Invesco Senior Secured Management, Inc. currently manages assets of the Fund.
The Board compared the Fund’s investment performance over multiple time periods ending December 31, 2018 to the performance of funds in the Broadridge performance universe and against the Lipper Loan Participation Funds Index. The Board noted that performance of Class A shares of the Fund was in the third quintile of its performance universe for the one and five year periods and the second quintile for the three year period (the first quintile being the best performing funds and the fifth quintile being the worst performing funds). The Board noted that performance of Class A shares of the Fund was below the performance of the Index for the one year period, above the performance of the Index for the three year period and the same as the performance of the Index for the five year period. The Trustees also reviewed more recent Fund performance and this review did not change their conclusions.
51 Invesco Floating Rate Fund
| C. | Advisory andSub-Advisory Fees and Fund Expenses |
The Board compared the Fund’s contractual management fee rate to the contractual management fee rates of funds in the Fund’s Broadridge expense group. The Board noted that the contractual management fee rate for Class A shares of the Fund was the same as the median contractual management fee rate of funds in its expense group. The Board noted that the term “contractual management fee” for funds in the expense group may include both advisory and certainnon-portfolio management administrative services fees, but that Broadridge does not provide information on a fund by fund basis as to what is included. The Board also reviewed the methodology used by Broadridge in providing expense group information, which includes using each fund’s contractual management fee schedule (including any applicable breakpoints) as reported in the most recent prospectus or statement of additional information for each fund in the expense group. The Board also considered comparative information regarding the Fund’s total expense ratio and its various components. The Board noted that the Fund’s total expense ratio was in the fourth quintile of its expense group and discussed with management reasons for such relative total expenses.
The Board noted that Invesco Advisers has contractually agreed to waive fees and/or limit expenses of the Fund for the term disclosed in the Fund’s registration statement in an amount necessary to limit total annual operating expenses to a specified percentage of average daily net assets for each class of the Fund.
The Board also considered the fees charged by Invesco Advisers and the AffiliatedSub-Advisers to other similarly managed client accounts. The Board noted that Invesco Advisers or the AffiliatedSub-Advisers may charge lower fees to large institutional clients. Invesco Advisers reviewed with the Board differences in the scope of services it provides to the Invesco Funds relative to certain other types of client accounts, including management of cash flows as a result of redemptions and purchases, necessary infrastructure such as officers, office space, technology, legal and distribution, oversight of service providers, costs and business risks associated with launching new funds and sponsoring and maintaining the product line, preparation of annual registration statement updates and financial information and compliance with federal and state laws and regulations.
The Board also considered the services that may be provided by the AffiliatedSub-Advisers pursuant to thesub-advisory contracts, as well as the fees payable by Invesco Advisers to the AffiliatedSub-Advisers pursuant to thesub-advisory contracts. The Board noted that Invesco Advisers retains overall responsibility for, and provides services to,sub-advised Invesco Funds, including oversight of the AffiliatedSub-Advisers as well as the additional
services described herein other thanday-to-day portfolio management.
| D. | Economies of Scale and Breakpoints |
The Board considered the extent to which there may be economies of scale in the provision of advisory services to the Fund. The Board considered Invesco’s reinvestment in its business, including investments in business infrastructure and cybersecurity. The Board also considered that the Fund benefits from economies of scale through contractual breakpoints in the Fund’s advisory fee schedule, which generally operate to reduce the Fund’s expense ratio as it grows in size. The Board noted that the Fund shares directly in economies of scale through lower fees charged by third party service providers based on the combined size of the Invesco Funds. The Board noted that the Fund may also benefit from economies of scale through initial fee setting, fee waivers and expense reimbursements.
| E. | Profitability and Financial Resources |
The Board reviewed information from Invesco Advisers concerning the costs of the advisory and other services that Invesco Advisers and its affiliates provide to the Fund and the Invesco Funds and the profitability of Invesco Advisers and its affiliates in providing these services. The Board considered the methodology used for calculating profitability and noted the periodic review of such methodology by an independent consultant. The Board noted that Invesco Advisers continues to operate at a net profit from services Invesco Advisers and its affiliates provide to the Invesco Funds and the Fund. The Board did not deem the level of profits realized by Invesco Advisers and its affiliates from providing services to the Fund to be excessive given the nature, extent and quality of the services provided. The Board received information from Invesco Advisers demonstrating that Invesco Advisers and the AffiliatedSub-Advisers are financially sound and have the resources necessary to perform their obligations under the investment advisory agreement andsub-advisory contracts.
| F. | Collateral Benefits to Invesco Advisers and its Affiliates |
The Board considered various other benefits received by Invesco Advisers and its affiliates from the relationship with the Fund, including the fees received for providing administrative, transfer agency and distribution services to the Fund. The Board considered comparative information regarding fees charged for these services, including information provided by Broadridge and other independent sources. The Board considered the performance of Invesco Advisers and its affiliates in providing these services and the organizational structure employed to provide these services. The Board also considered that these services are provided to the Fund pursuant to written contracts that are reviewed and approved on an annual basis by the Board; and that the services are required for the operation of the Fund.
The Board considered the benefits realized by Invesco Advisers and the AffiliatedSub-Advisers
as a result of portfolio brokerage transactions executed through “soft dollar” arrangements. Invesco Advisers noted that the Fund does not execute brokerage transactions through “soft dollar” arrangements to any significant degree.
The Board considered that the Fund’s uninvested cash and cash collateral from any securities lending arrangements may be invested in money market funds advised by Invesco Advisers pursuant to procedures approved by the Board. The Board considered information regarding the returns of the affiliated money market funds relative to comparable overnight investments, as well as the costs to the Fund of such investments. The Board noted that Invesco Advisers receives advisory fees from these affiliated money market funds attributable to such investments, although Invesco Advisers has contractually agreed to waive through varying periods the advisory fees payable by the Invesco Funds with respect to certain investments in the affiliated money market funds. The waiver is in an amount equal to 100% of the net advisory fee Invesco Advisers receives from the affiliated money market funds with respect to the Fund’s investment in the affiliated money market funds of uninvested cash, but not cash collateral. The Board concluded that the amount of advisory fees received by Invesco Advisers from the Fund’s investment of cash collateral from any securities lending arrangements in the affiliated money market funds is fair and reasonable.
52 Invesco Floating Rate Fund
Tax Information
Form 1099-DIV, Form 1042-S and other year–end tax information provide shareholders with actual calendar year amounts that should be included in their tax returns. Shareholders should consult their tax advisers.
The following distribution information is being provided as required by the Internal Revenue Code or to meet a specific state’s requirement.
The Fund designates the following amounts or, if subsequently determined to be different, the maximum amount allowable for its fiscal year ended August 31, 2019:
| Federal and State Income Tax | |
| Qualified Dividend Income* | 1.65% |
| Corporate Dividends Received Deduction* | 1.65% |
| U.S. Treasury Obligations* | 0.00% |
| * | The above percentages are based on ordinary income dividends paid to shareholders during the Fund’s fiscal year. |
| 53 | Invesco Floating Rate Fund |
Trustees and Officers
The address of each trustee and officer is AIM Counselor Series Trust (Invesco Counselor Series Trust) (the “Trust”), 11 Greenway Plaza, Suite 1000, Houston, Texas 77046-1173. The trustees serve for the life of the Trust, subject to their earlier death, incapacitation, resignation, retirement or removal as more specifically provided in the Trust’s organizational documents. Each officer serves for a one year term or until their successors are elected and qualified. Column two below includes length of time served with predecessor entities, if any.
| | | | | | | | |
Name, Year of Birth and Position(s) Held with the Trust | | Trustee and/ or Officer Since | | Principal Occupation(s) During Past 5 Years | | Number of Funds in Fund
Complex
Overseen by
Trustee | | Other Directorship(s) Held by Trustee During Past 5 Years |
| Interested Persons | | | | | | | | |
Martin L. Flanagan1 — 1960 Trustee and Vice Chair | | 2007 | | Executive Director, Chief Executive Officer and President, Invesco Ltd. (ultimate parent of Invesco and a global investment management firm); Trustee and Vice Chair, The Invesco Funds; Vice Chair, Investment Company Institute; and Member of Executive Board, SMU Cox School of Business Formerly: Advisor to the Board, Invesco Advisers, Inc. (formerly known as Invesco Institutional (N.A.), Inc.); Chairman and Chief Executive Officer, Invesco Advisers, Inc. (registered investment adviser); Director, Chairman, Chief Executive Officer and President, Invesco Holding Company (US), Inc. (formerly IVZ Inc.) (holding company), Invesco Group Services, Inc. (service provider) and Invesco North American Holdings, Inc. (holding company); Director, Chief Executive Officer and President, Invesco Holding Company Limited (parent of Invesco and a global investment management firm); Director, Invesco Ltd.; Chairman, Investment Company Institute and President,Co-Chief Executive Officer,Co-President, Chief Operating Officer and Chief Financial Officer, Franklin Resources, Inc. (global investment management organization) | | 229 | | None |
Philip A. Taylor2 — 1954 Trustee | | 2006 | | Vice Chair, Invesco Ltd.; Trustee, The Invesco Funds Formerly: Director, Invesco Canada Ltd. (formerly known as Invesco Trimark Ltd./Invesco Trimark Ltèe) (registered investment adviser and registered transfer agent); Head of the Americas and Senior Managing Director, Invesco Ltd.; Director, Invesco Advisers, Inc. (formerly known as Invesco Institutional (N.A.), Inc.) (registered investment adviser); Director and Chairman, Invesco Investment Services, Inc. (formerly known as Invesco AIM Investment Services, Inc.) (registered transfer agent); Chief Executive Officer, Invesco Corporate Class Inc. (corporate mutual fund company); Chairman and Chief Executive Officer, Invesco Canada Ltd. (formerly known as Invesco Trimark Ltd./Invesco Trimark Ltèe) (registered investment adviser and registered transfer agent); Senior Vice President, The Invesco Funds; Director, Invesco Investment Advisers LLC (formerly known as Van Kampen Asset Management); Director, Chairman, Chief Executive Officer and President, Invesco Management Group, Inc. (formerly known as Invesco AIM Management Group, Inc.) (financial services holding company);Co-Chairman,Co-President andCo-Chief Executive Officer, Invesco Advisers, Inc. (formerly known as Invesco Institutional (N.A.), Inc.) (registered investment adviser); Director, Chief Executive Officer and President, Van Kampen Exchange Corp; President and Principal Executive Officer, The Invesco Funds (other than AIM Treasurer’s Series Trust (Invesco Treasurer’s Series Trust), Short-Term Investments Trust and Invesco Management Trust); Executive Vice President, The Invesco Funds (AIM Treasurer’s Series Trust (Invesco Treasurer’s Series Trust), Short-Term Investments Trust and Invesco Management Trust only); Director and President, INVESCO Funds Group, Inc. (registered investment adviser and registered transfer agent); Director and Chairman, IVZ Distributors, Inc. (formerly known as INVESCO Distributors, Inc.) (registered broker dealer); Director, President and Chairman, Invesco Inc. (holding company), Invesco Canada Holdings Inc. (holding company), Trimark Investments Ltd./Placements Trimark Ltèe and Invesco Financial Services Ltd/Services Financiers Invesco Ltèe; Chief Executive Officer, Invesco Canada Fund Inc. (corporate mutual fund company); Director and Chairman, Van Kampen Investor Services Inc.; Director, Chief Executive Officer and President, 1371 Preferred Inc. (holding company) and Van Kampen Investments Inc.; Director and President, AIM GP Canada Inc. (general partner for limited partnerships) and Van Kampen Advisors, Inc.; Director and Chief Executive Officer, Invesco Trimark Dealer Inc. (registered broker dealer); Director, Invesco Distributors, Inc. (formerly known as Invesco AIM Distributors, Inc.) (registered broker dealer); Manager, Invesco Capital Management LLC; Director, Chief Executive Officer and President, Invesco Advisers, Inc.; Director, Chairman, Chief Executive Officer and President, Invesco AIM Capital Management, Inc.; President, Invesco Trimark Dealer Inc. and Invesco Trimark Ltd./Invesco Trimark Ltèe; Director and President, AIM Trimark Corporate Class Inc. and AIM Trimark Canada Fund Inc.; Senior Managing Director, Invesco Holding Company Limited; Director and Chairman, Fund Management Company (former registered broker dealer); President and Principal Executive Officer, The Invesco Funds (AIM Treasurer’s Series Trust (Invesco Treasurer’s Series Trust), and Short-Term Investments Trust only); President, AIM Trimark Global Fund Inc. and AIM Trimark Canada Fund Inc. | | 229 | | None |
| 1 | Mr. Flanagan is considered an interested person (within the meaning of Section 2(a)(19) of the 1940 Act) of the Trust because he is an officer of the Adviser to the Trust, and an officer and a director of Invesco Ltd., ultimate parent of the Adviser. |
| 2 | Mr. Taylor is considered an interested person (within the meaning of Section 2(a)(19) of the 1940 Act) of the Trust because he is an officer of Invesco Ltd., ultimate parent of the Adviser. |
T-1 Invesco Floating Rate Fund
Trustees and Officers—(continued)
| | | | | | | | |
Name, Year of Birth and Position(s) Held with the Trust | | Trustee and/ or Officer Since | | Principal Occupation(s)
During Past 5 Years | | Number of
Funds in Fund
Complex
Overseen by
Trustee | | Other Directorship(s) Held by Trustee During
Past 5 Years |
| Independent Trustees | | | | | | | | |
Bruce L. Crockett — 1944 Trustee and Chair | | 2003 | | Chairman, Crockett Technologies Associates (technology consulting company) Formerly: Director, Captaris (unified messaging provider); Director, President and Chief Executive Officer, COMSAT Corporation; Chairman, Board of Governors of INTELSAT (international communications company); ACE Limited (insurance company); Independent Directors Council and Investment Company Institute: Member of the Audit Committee, Investment Company Institute; Member of the Executive Committee and Chair of the Governance Committee, Independent Directors Council | | 229 | | Director and Chairman of the Audit Committee, ALPS (Attorneys Liability Protection Society) (insurance company); Director and Member of the Audit Committee and Compensation Committee, Ferroglobe PLC (metallurgical company) |
David C. Arch — 1945 Trustee | | 2010 | | Chairman of Blistex Inc. (consumer health care products manufacturer); Member, World Presidents’ Organization | | 229 | | Board member of the Illinois Manufacturers’ Association |
Beth Ann Brown — 1968 Trustee | | 2019 | | Independent Consultant Formerly: Head of Intermediary Distribution, Managing Director, Strategic Relations, Managing Director, Head of National Accounts, Senior Vice President, National Account Manager and Senior Vice President, Key Account Manager, Columbia Management Investment Advisers LLC; Vice President, Key Account Manager, Liberty Funds Distributor, Inc.; and Trustee of certain Oppenheimer Funds | | 229 | | Director, Board of Directors of Caron Engineering Inc.; Advisor, Board of Advisors of Caron Engineering Inc.; President and Director, Acton Shapleigh Youth Conservation Corps (non -profit); and Vice President and Director of Grahamtastic Connection(non-profit) |
Jack M. Fields — 1952 Trustee | | 2003 | | Chief Executive Officer, Twenty First Century Group, Inc. (government affairs company); and Chairman, Discovery Learning Alliance(non-profit) Formerly: Owner and Chief Executive Officer, Dos Angeles Ranch L.P. (cattle, hunting, corporate entertainment); Director, Insperity, Inc. (formerly known as Administaff) (human resources provider); Chief Executive Officer, Texana Timber LP (sustainable forestry company); Director of Cross Timbers Quail Research Ranch(non-profit); and member of the U.S. House of Representatives | | 229 | | None |
Cynthia Hostetler — 1962 Trustee | | 2017 | | Non-Executive Director and Trustee of a number of public and private business corporations Formerly: Director, Aberdeen Investment Funds (4 portfolios); Head of Investment Funds and Private Equity, Overseas Private Investment Corporation; President, First Manhattan Bancorporation, Inc.; Attorney, Simpson Thacher & Bartlett LLP | | 229 | | Vulcan Materials Company (construction materials company); Trilinc Global Impact Fund; Genesee & Wyoming, Inc. (railroads); Artio Global Investment LLC (mutual fund complex); Edgen Group, Inc. (specialized energy and infrastructure products distributor); Investment Company Institute (professional organization); Independent Directors Council (professional organization) |
Eli Jones — 1961 Trustee | | 2016 | | Professor and Dean, Mays Business School — Texas A&M University Formerly: Professor and Dean, Walton College of Business, University of Arkansas and E.J. Ourso College of Business, Louisiana State University; Director, Arvest Bank | | 229 | | Insperity, Inc. (formerly known as Administaff) (human resources provider) |
Elizabeth Krentzman — 1959 Trustee | | 2019 | | Formerly: Principal and Chief Regulatory Advisor for Asset Management Services and U.S. Mutual Fund Leader of Deloitte & Touche LLP; General Counsel of the Investment Company Institute (trade association); National Director of the Investment Management Regulatory Consulting Practice, Principal, Director and Senior Manager of Deloitte & Touche LLP; Assistant Director of the Division of Investment Management — Office of Disclosure and Investment Adviser Regulation of the U.S. Securities and Exchange Commission and various positions with the Division of Investment Management — Office of Regulatory Policy of the U.S. Securities and Exchange Commission; Associate at Ropes & Gray LLP; Advisory Board Member of the Securities and Exchange Commission Historical Society; and Trustee of certain Oppenheimer Funds | | 229 | | Trustee of the University of Florida National Board Foundation and Audit Committee Member; Member of the Cartica Funds Board of Directors (private investment funds); Member of the University of Florida Law Center Association, Inc. Board of Trustees and Audit Committee Member |
Anthony J. LaCava, Jr. — 1956 Trustee | | 2019 | | Formerly: Director and Member of the Audit Committee, Blue Hills Bank (publicly traded financial institution) and Managing Partner, KPMG LLP | | 229 | | Blue Hills Bank; Chairman, Bentley University; Member, Business School Advisory Council; and Nominating Committee, KPMG LLP |
T-2 Invesco Floating Rate Fund
Trustees and Officers—(continued)
| | | | | | | | |
Name, Year of Birth and Position(s) Held with the Trust | | Trustee and/ or Officer Since | | Principal Occupation(s)
During Past 5 Years | | Number of
Funds in Fund
Complex
Overseen by
Trustee | | Other Directorship(s) Held by Trustee During
Past 5 Years |
| Independent Trustees—(continued) |
Prema Mathai-Davis — 1950 Trustee | | 2003 | | Retired Co-Owner & Partner of Quantalytics Research, LLC, (a FinTech Investment Research Platform for the Self-Directed Investor) | | 229 | | None |
Joel W. Motley — 1952 Trustee | | 2019 | | Director of Office of Finance, Federal Home Loan Bank; Member of the Vestry of Trinity Wall Street; Managing Director of Carmona Motley Inc. (privately held financial advisor); Member of the Finance and Budget Committee of the Council on Foreign Relations, Member of the Investment Committee and Board of Human Rights Watch and Member of the Investment Committee and Board of Historic Hudson Valley(non-profit cultural organization) Formerly: Managing Director of Public Capital Advisors, LLC (privately held financial advisor); Managing Director of Carmona Motley Hoffman, Inc. (privately held financial advisor); Trustee of certain Oppenheimer Funds; and Director of Columbia Equity Financial Corp. (privately held financial advisor) | | 229 | | Director of Greenwall Foundation (bioethics research foundation); Member of Board and Investment Committee of The Greenwall Foundation; Director of Southern Africa Legal Services Foundation; Board Member and Investment Committee Member of Pulitzer Center for Crisis Reporting(non-profit journalism) |
Teresa M. Ressel — 1962 Trustee | | 2017 | | Non-executive director and trustee of a number of public and private business corporations Formerly: Chief Financial Officer, Olayan America, The Olayan Group (international investor/commercial/industrial); Chief Executive Officer, UBS Securities LLC; Group Chief Operating Officer, Americas, UBS AG; Assistant Secretary for Management & Budget and CFO, US Department of the Treasury | | 229 | | Atlantic Power Corporation (power generation company); ON Semiconductor Corp. (semiconductor supplier) |
Ann Barnett Stern — 1957 Trustee | | 2017 | | President and Chief Executive Officer, Houston Endowment Inc. (private philanthropic institution) Formerly: Executive Vice President and General Counsel, Texas Children’s Hospital; Attorney, Beck, Redden and Secrest, LLP; Business Law Instructor, University of St. Thomas; Attorney, Andrews & Kurth LLP | | 229 | | Federal Reserve Bank of Dallas |
Raymond Stickel, Jr. — 1944 Trustee | | 2005 | | Retired Formerly: Director, Mainstay VP Series Funds, Inc. (25 portfolios); Partner, Deloitte & Touche | | 229 | | None |
Robert C. Troccoli — 1949 Trustee | | 2016 | | Retired Formerly: Adjunct Professor, University of Denver — Daniels College of Business; Senior Partner, KPMG LLP | | 229 | | None |
Daniel S. Vandivort — 1954 Trustee | | 2019 | | Treasurer, Chairman of the Audit and Finance Committee, and Trustee, Board of Trustees, Huntington Disease Foundation of America; and President, Flyway Advisory Services LLC (consulting and property management) Formerly: Trustee and Governance Chair, of certain Oppenheimer Funds | | 229 | | Chairman and Lead Independent Director, Chairman of the Audit Committee, and Director, Board of Directors, Value Line Funds |
James D. Vaughn — 1945 Trustee | | 2019 | | Retired Formerly: Managing Partner, Deloitte & Touche LLP; Trustee and Chairman of the Audit Committee, Schroder Funds; Board Member, Mile High United Way, Boys and Girls Clubs, Boy Scouts, Colorado Business Committee for the Arts, Economic Club of Colorado and Metro Denver Network (economic development corporation); and Trustee of certain Oppenheimer Funds | | 229 | | Board member and Chairman of Audit Committee of AMG National Trust Bank; Trustee and Investment Committee member, University of South Dakota Foundation; Board member, Audit Committee Member and past Board Chair, Junior Achievement(non-profit) |
Christopher L. Wilson — 1957 Trustee, Vice Chair and Chair Designate | | 2017 | | Retired Formerly: Director, TD Asset Management USA Inc. (mutual fund complex) (22 portfolios); Managing Partner, CT2, LLC (investing and consulting firm); President/Chief Executive Officer, Columbia Funds, Bank of America Corporation; President/Chief Executive Officer, CDC IXIS Asset Management Services, Inc.; Principal & Director of Operations, Scudder Funds, Scudder, Stevens & Clark, Inc.; Assistant Vice President, Fidelity Investments | | 229 | | ISO New England, Inc.(non-profit organization managing regional electricity market) |
T-3 Invesco Floating Rate Fund
Trustees and Officers—(continued)
| | | | | | | | |
Name, Year of Birth and Position(s) Held with the Trust | | Trustee and/ or Officer Since | | Principal Occupation(s)
During Past 5 Years | | Number of
Funds in Fund
Complex
Overseen by
Trustee | | Other Directorship(s) Held by Trustee During
Past 5 Years |
| Other Officers | | | | | | | | |
Sheri Morris — 1964 President, Principal Executive Officer and Treasurer | | 2003 | | President, Principal Executive Officer and Treasurer, The Invesco Funds; Vice President, Invesco Advisers, Inc. (formerly known as Invesco Institutional (N.A.), Inc.) (registered investment adviser); and Vice President, Invesco Exchange-Traded Fund Trust, Invesco Exchange-Traded Fund Trust II, Invesco India Exchange-Traded Fund Trust, Invesco Actively Managed Exchange-Traded Fund Trust, Invesco Actively Managed Exchange-Traded Commodity Fund Trust and Invesco Exchange-Traded Self-Indexed Fund Trust; and Vice President, OppenheimerFunds, Inc. Formerly: Vice President and Principal Financial Officer, The Invesco Funds; Vice President, Invesco AIM Advisers, Inc., Invesco AIM Capital Management, Inc. and Invesco AIM Private Asset Management, Inc.; Assistant Vice President and Assistant Treasurer, The Invesco Funds and Assistant Vice President, Invesco Advisers, Inc., Invesco AIM Capital Management, Inc. and Invesco AIM Private Asset Management, Inc.; and Treasurer, Invesco Exchange-Traded Fund Trust, Invesco Exchange-Traded Fund Trust II, Invesco India Exchange-Traded Fund Trust and Invesco Actively Managed Exchange-Traded Fund Trust | | N/A | | N/A |
Russell C. Burk — 1958 Senior Vice President and Senior Officer | | 2005 | | Senior Vice President and Senior Officer, The Invesco Funds | | N/A | | N/A |
Jeffrey H. Kupor — 1968 Senior Vice President, Chief Legal Officer and Secretary | | 2018 | | Head of Legal of the Americas, Invesco Ltd.; Senior Vice President and Secretary, Invesco Advisers, Inc. (formerly known as Invesco Institutional (N.A.), Inc.) (registered investment adviser); Senior Vice President and Secretary, Invesco Distributors, Inc. (formerly known as Invesco AIM Distributors, Inc.); Vice President and Secretary, Invesco Investment Services, Inc. (formerly known as Invesco AIM Investment Services, Inc.) Senior Vice President, Chief Legal Officer and Secretary, The Invesco Funds; Secretary and General Counsel, Invesco Investment Advisers LLC (formerly known as Van Kampen Asset Management); Secretary and General Counsel, Invesco Capital Markets, Inc. (formerly known as Van Kampen Funds Inc.) and Chief Legal Officer, Invesco Exchange-Traded Fund Trust, Invesco Exchange-Traded Fund Trust II, Invesco India Exchange-Traded Fund Trust, Invesco Actively Managed Exchange-Traded Fund Trust, Invesco Actively Managed Exchange-Traded Commodity Fund Trust and Invesco Exchange-Traded Self-Indexed Fund Trust; Secretary, Invesco Indexing LLC; Secretary, W.L. Ross & Co., LLC Formerly: Secretary and Vice President, Jemstep, Inc.; Head of Legal, Worldwide Institutional, Invesco Ltd.; Secretary and General Counsel, INVESCO Private Capital Investments, Inc.; Senior Vice President, Secretary and General Counsel, Invesco Management Group, Inc. (formerly known as Invesco AIM Management Group, Inc.); Assistant Secretary, INVESCO Asset Management (Bermuda) Ltd.; Secretary and General Counsel, Invesco Private Capital, Inc.; Assistant Secretary and General Counsel, INVESCO Realty, Inc.; Secretary and General Counsel, Invesco Senior Secured Management, Inc.; and Secretary, Sovereign G./P. Holdings Inc. | | N/A | | N/A |
Andrew R. Schlossberg — 1974 Senior Vice President | | 2019 | | Head of the Americas and Senior Managing Director, Invesco Ltd.; Director and Senior Vice President, Invesco Advisers, Inc. (formerly known as Invesco Institutional (N.A.), Inc.) (registered investment adviser); Director and Chairman, Invesco Investment Services, Inc. (formerly known as Invesco AIM Investment Services, Inc.) (registered transfer agent); Senior Vice President, The Invesco Funds; Director, Invesco Investment Advisers LLC (formerly known as Van Kampen Asset Management); Director, President and Chairman, Invesco Insurance Agency, Inc. Formerly: Director, Invesco UK Limited; Director and Chief Executive, Invesco Asset Management Limited and Invesco Fund Managers Limited; Assistant Vice President, The Invesco Funds; Senior Vice President, Invesco Advisers, Inc. (formerly known as Invesco Institutional (N.A.), Inc.) (registered investment adviser); Director and Chief Executive, Invesco Administration Services Limited and Invesco Global Investment Funds Limited; Director, Invesco Distributors, Inc.; Head of EMEA, Invesco Ltd.; President, Invesco Actively Managed Exchange-Traded Commodity Fund Trust, Invesco Actively Managed Exchange-Traded Fund Trust, Invesco Exchange-Traded Fund Trust, Invesco Exchange-Traded Fund Trust II and Invesco India Exchange-Traded Fund Trust; Managing Director and Principal Executive Officer, Invesco Capital Management LLC | | N/A | | N/A |
T-4 Invesco Floating Rate Fund
Trustees and Officers—(continued)
| | | | | | | | |
Name, Year of Birth and Position(s) Held with the Trust | | Trustee and/ or Officer Since | | Principal Occupation(s)
During Past 5 Years | | Number of
Funds in Fund
Complex
Overseen by
Trustee | | Other Directorship(s) Held by Trustee During
Past 5 Years |
| Other Officers—(continued) | | | | | | | | |
John M. Zerr — 1962
Senior Vice President | | 2006 | | Chief Operating Officer of the Americas; Senior Vice President, Invesco Advisers, Inc. (formerly known as Invesco Institutional (N.A.), Inc.) (registered investment adviser); Senior Vice President, Invesco Distributors, Inc. (formerly known as Invesco AIM Distributors, Inc.); Director and Vice President, Invesco Investment Services, Inc. (formerly known as Invesco AIM Investment Services, Inc.) Senior Vice President, The Invesco Funds; Managing Director, Invesco Capital Management LLC; Director, Invesco Investment Advisers LLC (formerly known as Van Kampen Asset Management); Senior Vice President, Invesco Capital Markets, Inc. (formerly known as Van Kampen Funds Inc.); Manager, Invesco Indexing LLC; Manager, Invesco Specialized Products, LLC; Director and Senior Vice President, Invesco Insurance Agency, Inc.; Member, Invesco Canada Funds Advisory Board; Director, President and Chief Executive Officer, Invesco Corporate Class Inc. (corporate mutual fund company); and Director, Chairman, President and Chief Executive Officer, Invesco Canada Ltd. (formerly known as Invesco Trimark Ltd./Invesco Trimark Ltèe) (registered investment adviser and registered transfer agent) Formerly: Director and Senior Vice President, Invesco Management Group, Inc. (formerly known as Invesco AIM Management Group, Inc.); Secretary and General Counsel, Invesco Management Group, Inc. (formerly known as Invesco AIM Management Group, Inc.); Secretary, Invesco Investment Services, Inc. (formerly known as Invesco AIM Investment Services, Inc.); Chief Legal Officer and Secretary, The Invesco Funds; Secretary and General Counsel, Invesco Investment Advisers LLC (formerly known as Van Kampen Asset Management); Secretary and General Counsel, Invesco Capital Markets, Inc. (formerly known as Van Kampen Funds Inc.); Chief Legal Officer, Invesco Exchange-Traded Fund Trust, Invesco Exchange-Traded Fund Trust II, Invesco India Exchange-Traded Fund Trust, Invesco Actively Managed Exchange-Traded Fund Trust, Invesco Actively Managed Exchange-Traded Commodity Fund Trust and Invesco Exchange-Traded Self-Indexed Fund Trust; Secretary, Invesco Indexing LLC; Director, Secretary, General Counsel and Senior Vice President, Van Kampen Exchange Corp.; Director, Vice President and Secretary, IVZ Distributors, Inc. (formerly known as INVESCO Distributors, Inc.); Director and Vice President, INVESCO Funds Group, Inc.; Director and Vice President, Van Kampen Advisors Inc.; Director, Vice President, Secretary and General Counsel, Van Kampen Investor Services Inc.; Director and Secretary, Invesco Distributors, Inc. (formerly known as Invesco AIM Distributors, Inc.); Director, Senior Vice President, General Counsel and Secretary, Invesco AIM Advisers, Inc. and Van Kampen Investments Inc.; Director, Vice President and Secretary, Fund Management Company; Director, Senior Vice President, Secretary, General Counsel and Vice President, Invesco AIM Capital Management, Inc.; Chief Operating Officer and General Counsel, Liberty Ridge Capital, Inc. (an investment adviser) | | N/A | | N/A |
Gregory G. McGreevey — 1962 Senior Vice President | | 2012 | | Senior Managing Director, Invesco Ltd.; Director, Chairman, President, and Chief Executive Officer, Invesco Advisers, Inc. (formerly known as Invesco Institutional (N.A.), Inc.) (registered investment adviser); Director, Invesco Mortgage Capital, Inc. and Invesco Senior Secured Management, Inc.; and Senior Vice President, The Invesco Funds; and President, SNW Asset Management Corporation Formerly: Senior Vice President, Invesco Management Group, Inc. and Invesco Advisers, Inc.; Assistant Vice President, The Invesco Funds | | N/A | | N/A |
Kelli Gallegos — 1970 Vice President, Principal Financial Officer and Assistant Treasurer | | 2008 | | Assistant Treasurer, Invesco Specialized Products, LLC; Vice President, Principal Financial Officer and Assistant Treasurer, The Invesco Funds; Principal Financial and Accounting Officer — Pooled Investments, Invesco Capital Management LLC; Vice President and Treasurer, Invesco Exchange-Traded Fund Trust, Invesco Exchange-Traded Fund Trust II, Invesco India Exchange-Traded Fund Trust, Invesco Actively Managed Exchange-Traded Fund Trust, Invesco Actively Managed Exchange-Traded Commodity Fund Trust and Invesco Exchange-Traded Self-Indexed Fund Trust Formerly: Assistant Treasurer, Invesco Exchange-Traded Fund Trust, Invesco Exchange-Traded Fund Trust II, Invesco India Exchange-Traded Fund Trust, Invesco Actively Managed Exchange-Traded Fund Trust, Invesco Actively Managed Exchange-Traded Commodity Fund Trust and Invesco Exchange-Traded Self-Indexed Fund Trust; Assistant Treasurer, Invesco Capital Management LLC; Assistant Vice President, The Invesco Funds | | N/A | | N/A |
T-5 Invesco Floating Rate Fund
Trustees and Officers—(continued)
| | | | | | | | |
Name, Year of Birth and Position(s) Held with the Trust | | Trustee and/ or Officer Since | | Principal Occupation(s)
During Past 5 Years | | Number of
Funds in Fund
Complex
Overseen by
Trustee | | Other Directorship(s) Held by Trustee During
Past 5 Years |
| Other Officers—(continued) | | | | | | | | |
Crissie M. Wisdom — 1969 Anti-Money Laundering Compliance Officer | | 2013 | | Anti-Money Laundering Compliance Officer, Invesco Advisers, Inc. (formerly known as Invesco Institutional (N.A.), Inc.) (registered investment adviser), Invesco Capital Markets, Inc. (formerly known as Van Kampen Funds Inc.), Invesco Distributors, Inc., Invesco Investment Services, Inc., The Invesco Funds, and Invesco Exchange-Traded Fund Trust, Invesco Exchange-Traded Fund Trust II, Invesco India Exchange-Traded Fund Trust, Invesco Actively Managed Exchange-Traded Fund Trust, Invesco Actively Managed Exchange-Traded Commodity Fund Trust and Invesco Exchange-Traded Self-Indexed Fund Trust; Anti-Money Laundering Compliance Officer and Bank Secrecy Act Officer, INVESCO National Trust Company and Invesco Trust Company; and Fraud Prevention Manager and Controls and Risk Analysis Manager for Invesco Investment Services, Inc. Formerly: Anti-Money Laundering Compliance Officer, Van Kampen Exchange Corp. and Invesco Management Group, Inc. | | N/A | | N/A |
Robert R. Leveille — 1969 Chief Compliance Officer | | 2016 | | Chief Compliance Officer, Invesco Advisers, Inc. (registered investment adviser); and Chief Compliance Officer, The Invesco Funds Formerly: Chief Compliance Officer, Putnam Investments and the Putnam Funds | | N/A | | N/A |
The Statement of Additional Information of the Trust includes additional information about the Fund’s Trustees and is available upon request, without charge, by calling 1.800.959.4246. Please refer to the Fund’s Statement of Additional Information for information on the Fund’ssub-advisers.
| | | | | | |
Office of the Fund 11 Greenway Plaza, Suite 1000
Houston, TX 77046-1173 | | Investment Adviser Invesco Advisers, Inc.
1555 Peachtree Street, N.E.
Atlanta, GA 30309 | | Distributor Invesco Distributors, Inc.
11 Greenway Plaza, Suite 1000
Houston, TX 77046-1173 | | Auditors PricewaterhouseCoopers LLP
1000 Louisiana Street, Suite 5800 Houston, TX 77002-5021 |
| | | |
| | | | | | |
Counsel to the Fund Stradley Ronon Stevens & Young, LLP
2005 Market Street, Suite 2600
Philadelphia, PA 19103-7018 | | Counsel to the Independent Trustees Goodwin Procter LLP
901 New York Avenue, N.W.
Washington, D.C. 20001 | | Transfer Agent Invesco Investment Services, Inc.
11 Greenway Plaza, Suite 1000
Houston, TX 77046-1173 | | Custodian State Street Bank and Trust Company
225 Franklin Street
Boston, MA 02110-2801 |
T-6 Invesco Floating Rate Fund
Go paperless with eDelivery
Visit invesco.com/edelivery to enjoy the convenience and security of anytime electronic access to your investment documents.
With eDelivery, you can elect to have any or all of the following materials delivered straight to your inbox to download, save and print from your own computer:
| • | Fund reports and prospectuses |
| • | Quarterly statements |
| • | Daily confirmations |
| • | Tax forms |
Invesco mailing information
Send general correspondence to Invesco Investment Services, Inc., P.O. Box 219078, Kansas City, MO 64121-9078.
Important notice regarding delivery of security holder documents
To reduce Fund expenses, only one copy of most shareholder documents may be mailed to shareholders with multiple accounts at the same address (Householding). Mailing of your shareholder documents may be householded indefinitely unless you instruct us otherwise. If you do not want the mailing of these documents to be combined with those for other members of your household, please contact Invesco Investment Services, Inc. at 800 959 4246 or contact your financial institution. We will begin sending you individual copies for each account within 30 days after receiving your request.
Fund holdings and proxy voting information
The Fund provides a complete list of its holdings four times in each fiscal year, at the quarter-ends. For the second and fourth quarters, the list appears in the Fund’s semiannual and annual reports to shareholders. For the first and third quarters, the Fund files the lists with the Securities and Exchange Commission (SEC) as an exhibit to its reports on Form N-PORT. The most recent list of portfolio holdings is available at invesco.com/completeqtrholdings. Shareholders can also look up the Fund’s Form N-PORT filings on the SEC website, sec.gov. The SEC file numbers for the Fund are shown below.
A description of the policies and procedures that the Fund uses to determine how to vote proxies relating to portfolio securities is available without charge, upon request, from our Client Services department at 800 959 4246, or at invesco.com/proxyguidelines. The information is also available on the SEC website, sec.gov.
Information regarding how the Fund voted proxies related to its portfolio securities during the most recent 12-month period ended June 30 is available at invesco.com/proxysearch. This information is also available on the SEC website, sec.gov.
Invesco Advisers, Inc. is an investment adviser; it provides investment advisory services to individual and institutional clients and does not sell securities. Invesco Distributors, Inc. is the US distributor for Invesco Ltd.’s retail mutual funds, exchange-traded funds and institutional money market funds. Both are wholly owned, indirect subsidiaries of Invesco Ltd.
| SEC file numbers: 811-09913 and 333-36074 | Invesco Distributors, Inc. | FLR-AR-1 |
| Annual Report to Shareholders | August 31, 2019 |
Invesco Global Real Estate Income Fund
Nasdaq:
A: ASRAX ■ C: ASRCX ■ Y: ASRYX ■ R5: ASRIX ■ R6: ASRFX

Beginning on January 1, 2021, as permitted by regulations adopted by the Securities and Exchange Commission, paper copies of the Fund’s shareholder reports will no longer be sent by mail, unless you specifically request paper copies of the reports from the Fund or from your financial intermediary, such as a broker-dealer or bank. Instead, the reports will be made available on the Fund’s website, and you will be notified by mail each time a report is posted and provided with a website link to access the report.
If you already elected to receive shareholder reports electronically, you will not be affected by this change and you need not take any action. You may elect to receive shareholder reports and other communications from the Fund electronically by contacting your financial intermediary (such as a broker-dealer or bank) or, if you are a direct investor, by enrolling at invesco.com/edelivery.
You may elect to receive all future reports in paper free of charge. If you invest through a financial intermediary, you can contact your financial intermediary to request that you continue to receive paper copies of your shareholder reports. If you invest directly with the Fund, you can call (800) 959-4246 to let the Fund know you wish to continue receiving paper copies of your shareholder reports. Your election to receive reports in paper will apply to all funds held with your financial intermediary or all funds held with the fund complex if you invest directly with the Fund.
Dear Shareholders:
This annual report includes information about your Fund, including performance data and a complete list of its investments as of the close of the reporting period. Inside is a discussion of how your Fund was managed and the factors that affected its performance during the reporting period.
Throughout the reporting period, global equity markets remained volatile. Investor sentiment ranged from elation to fear. The reporting period began with several US equity indexes redefining new highs. The exuberance, however, ended in October 2018 as global equities, in particular US stocks, sold off, with the sharpest decline in December. The catalyst for the sell-off was a combination of ongoing trade concerns between the US and China, fears of a global economic slowdown and lower oil prices from a supply glut. Gains posted earlier in 2018 for global equities were erased, while US Treasury bonds, along with government and municipal bonds, rallied as investors fled to “safe haven” assets.
At the start of 2019, global equity markets rebounded strongly buoyed by more dovish central banks and optimism about a potential US-China trade deal. In May, US-China trade concerns and slowing global growth led to a global equity sell-off and rally in U.S. Treasuries. Despite the May sell-off, domestic equity markets rallied in June in anticipation of a U.S. Federal Reserve (the Fed) rate cut and closed the second quarter with modest gains. As the reporting period ended in August, market volatility once again increased as the US Treasury yield curve inverted several times magnifying concerns that the US economy could be headed into a recession.
During the reporting period, the Fed both raised and lowered the federal funds rate. Given signs of a strong economy, the Fed raised rates two times: in September and December 2018. In 2019, however, the Fed altered its outlook on further rate hikes leaving rates unchanged for the first half of the year. In July, the Fed lowered interest rates for the first time in 11 years. As 2019 unfolds, we’ll see how the interplay of interest rates, economic data, geopolitics and a host of other factors affect US and overseas equity and fixed income markets.
Investor uncertainty and market volatility, such as we witnessed during the reporting period, are unfortunate facts of life when it comes to investing. That’s why Invesco encourages investors to work with a professional financial adviser who can stress the importance of starting to save and invest early and the importance of adhering to a disciplined investment plan. A financial adviser who knows your unique financial situation, investment goals and risk tolerance can be an invaluable partner as you seek to achieve your financial goals. He or she can offer a long-term perspective when markets are volatile and time-tested advice and guidance when your financial situation or investment goals change.
Visit our website for more information on your investments
Our website, invesco.com/us, offers a wide range of market insights and investment perspectives. On the website, you’ll find detailed information about our funds, including performance, holdings and portfolio manager commentaries. You can access information about your account by completing a simple, secure online registration. To do so, select “Log In” on the right side of the homepage, and then select “Register for Individual Account Access.”
In addition to the resources accessible on our website and through our mobile app, you can obtain timely updates to help you stay informed about the markets and the economy by connecting with Invesco on Twitter, LinkedIn or Facebook. You can access our blog at blog.invesco.us.com. Our goal is to provide you the information you want, when and where you want it.
Finally, I’m pleased to share with you Invesco’s commitment to both the Principles for Responsible Investment and to considering environmental, social and governance issues in our robust investment process. I invite you to learn more at invesco.com/esg.
Have questions?
For questions about your account, contact an Invesco client services representative at 800 959 4246.
All of us at Invesco look forward to serving your investment management needs. Thank you for investing with us.
Sincerely,
Andrew Schlossberg
Head of the Americas,
Senior Managing Director, Invesco Ltd.
| 2 | Invesco Global Real Estate Income Fund |
Dear Shareholders:
Among the many important lessons I’ve learned in more than 40 years in a variety of business endeavors is the value of a trusted advocate.
As independent chair of the Invesco Funds Board, I can assure you that the members of the Board are strong advocates for the interests of investors in Invesco’s mutual funds. We work hard to represent your interests through oversight of the quality of the investment management services your funds receive and other matters important to your investment, including but not limited to:
| ■ | Ensuring that Invesco offers a diverse lineup of mutual funds that your financial adviser can use to strive to meet your financial needs as your investment goals change over time. |
| ■ | Monitoring how the portfolio management teams of the Invesco funds are performing in light of changing economic and market conditions. |
| ■ | Assessing each portfolio management team’s investment performance within the context of the investment strategy described in the fund’s prospectus. |
| ■ | Monitoring for potential conflicts of interests that may impact the nature of the services that your funds receive. |
We believe one of the most important services we provide our fund shareholders is the annual review of the funds’ advisory and sub-advisory contracts with Invesco Advisers and its affiliates. This review is required by the Investment Company Act of 1940 and focuses on the nature and quality of the services Invesco provides as the adviser to the Invesco funds and the reasonableness of the fees that it charges for those services. Each year, we spend months carefully reviewing information received from Invesco and a variety of independent sources, such as performance and fee data prepared by Lipper, Inc. (a subsidiary of Broadridge Financial Solutions, Inc.), an independent, third-party firm widely recognized as a leader in its field. We also meet with our independent legal counsel and other independent advisers to review and help us assess the information that we have received. Our goal is to assure that you receive quality investment management services for a reasonable fee.
I trust the measures outlined above provide assurance that you have a worthy advocate when it comes to choosing the Invesco Funds.
As always, please contact me at bruce@brucecrockett.com with any questions or concerns you may have. On behalf of the Board, we look forward to continuing to represent your interests and serving your needs.
Sincerely,
Bruce L. Crockett
Independent Chair
Invesco Funds Board of Trustees
| 3 | Invesco Global Real Estate Income Fund |
Management’s Discussion of Fund Performance
Performance summary
For the fiscal year ended August 31, 2019, Class A shares of Invesco Global Real Estate Income Fund (the Fund), at net asset value (NAV), outperformed the Custom Invesco Global Real Estate Income Index, the Fund’s style-specific benchmark.
Your Fund’s long-term performance appears later in this report.
Fund vs. Indexes
Total returns, August 31, 2018 to August 31, 2019, at net asset value (NAV). Performance shown does not include applicable contingent deferred sales charges (CDSC) or front-end sales charges, which would have reduced performance.
| Class A Shares | 8.69% |
| Class C Shares | 7.89 |
| Class Y Shares | 8.98 |
| Class R5 Shares | 8.98 |
| Class R6 Shares | 9.08 |
| MSCI World Index▼ (Broad Market Index) | 0.26 |
Custom Invesco Global Real Estate Income Index■
(Style-Specific Index) | 8.12 |
Lipper Global Real Estate Funds Classification Average♦
(Peer Group) | 8.70 |
Source(s):▼RIMES Technologies Corp.;■
Invesco, RIMES Technologies Corp.;♦
Lipper Inc. |
Market conditions and your Fund
The fiscal year began with market volatility as currency issues, rising interest rates in the US and trade concerns weighed on global stocks, with developed markets generally faring better than emerging markets. Emerging markets struggled, particularly China, due to ongoing trade and tariff disputes with the US. Within the US, a stronger US dollar and higher interest rates also dampened returns and contributed to currency depreciation in a number of markets, including Turkey, Argentina and Brazil. Global equity markets, particularly the US, declined sharply in the fourth quarter of 2018 amid rising interest rates, a flattening US Treasury yield curve signaling a possible recession and concerns that higher inflation could result in a more restrictive monetary policy. Investors also had concerns over Brexit negotia-
tions, ongoing trade tensions between the US and China, declining oil prices and fears of slowing economic growth — particularly in the eurozone.
After a relatively calm start at the beginning of 2019, global equity markets faced greater volatility in the second quarter of 2019, hampered by ongoing US-China trade issues, potential for new tariffs and slowing global growth. Global equity markets, particularly China, declined sharply in May, ending a four-month rally. Trade and tariff issues, which were not limited to the US and China, clouded the outlook for many global economies. Disagreement within the UK about its withdrawal from the European Union increased uncertainty for the UK and eurozone economies. Following better performance in June 2019, most global equity markets managed modest positive returns for the sec-
ond quarter, with developed markets generally outperforming emerging markets.
The fiscal year ended much the same as it began, with market volatility. Global equity markets were impacted by the escalating trade war between the US and China, mounting concerns about the outlook for global economic growth and the brief inversion of the US and UK yield curves, which was perceived by some investors as an indicator of a recession. Global equity indexes, in general, ended the fiscal year in negative territory, with developed markets generally outperforming emerging markets.
Real estate investment trusts (REITs) performed strongly across most major regions during the fiscal year, with REITs doing well as investors sought defensive income characteristics given the prospects of slower corporate earnings growth for many more cyclical areas of the economy. Earnings reports generally showed a rise in net asset value in most countries and property types. Earnings growth moderated from the elevated levels of recent years to a more historically normal level in the mid-single digit range. Demand for REITs has allowed many companies to issue new equity at favorable valuations and deliver earnings accretive investment transactions. Outside retail real estate, investor and occupier demand for assets remained positive in most of the major global cities and property types during the fiscal year. Retail remained structurally challenged and many retail-focused REITs showed higher than ideal leverage. Leverage levels across the rest of the listed real estate universe remained fairly conservative and appropriate for later cycle conditions of slowing growth.
| Portfolio Composition |
| By country, based on Net Assets |
| as of August 31, 2019 |
| United States | 64.84% |
| Japan | 8.62 |
| Germany | 3.80 |
| Hong Kong | 3.59 |
| Australia | 3.02 |
| United Kingdom | 2.47 |
| Singapore | 2.23 |
| Canada | 2.13 |
| Countries, each less than 2% of portfolio | 5.61 |
| Money Market Funds Plus Other Assets Less Liabilities | 3.69 |
| Top 10 Equity Holdings* |
| % of total net assets |
| 1. | AvalonBay Communities, Inc. | 2.46% |
| 2. | Boston Properties, Inc. | 1.69 |
| 3. | Crown Castle International Corp. | 1.52 |
| 4. | Prologis, Inc. | 1.50 |
| 5. | Public Storage | 1.50 |
| 6. | Mid-America Apartment Communities, Inc. | 1.43 |
| 7. | Hudson Pacific Properties, Inc. | 1.31 |
| 8. | Sempra Energy, Series A, $6.00 Conv. Pfd. | 1.54 |
| 9. | Crown Castle International Corp., Series A, $68.75 Conv. Pfd. | 1.51 |
| 10. | American Homes 4 Rent, Series E, Pfd. | 1.33 |
| Total Net Assets | $745.4 million |
| Total Number of Holdings* | 171 |
| The Fund’s holdings are subject to change, and there is no assurance that the Fund will continue to hold any particular security. |
| *Excluding money market fund holdings. |
| Data presented here are as of August 31, 2019. |
| 4 | Invesco Global Real Estate Income Fund |
We evaluate securities for the Fund based primarily on the relative attractiveness of income with a secondary consideration for the potential for capital appreciation. The qualified investment universe includes global public real estate equity and debt securities, including common stock, preferred securities, corporate debt and commercial mortgage-backed securities (CMBS). When constructing the portfolio, we first set a strategic equity versus debt asset allocation and then apply a fundamentals-driven investment process in an effort to identify securities with certain characteristics including: attractive relative yields, favorable property market outlook and attractive valuations relative to peer investment alternatives.
On an absolute basis, common stocks and preferred securities, including convertible preferred securities, had the greatest contribution to the Fund’s performance for the fiscal year. Relative to the Fund’s style-specific benchmark, overweight exposure to CMBS and underweight exposure to common stocks detracted from relative performance. Conversely, the Fund’s overweight exposure to preferred securities contributed to relative performance.
From a country standpoint, relative to the Fund’s style-specific benchmark, underweight exposure to the UK and Hong Kong contributed to relative performance, as did overweight exposure to the US. Additionally, strong security selection in the UK, Hong Kong and Canada all benefited the Fund’s relative returns. Conversely, underweight exposure to Japan and security selection within the US detracted from the Fund’s relative performance during the fiscal year.
Top individual contributors to the Fund’s absolute performance during the fiscal year included two telecommunication infrastructure-related REITs,American Tower andCrown Castle International. Both companies reported double-digit growth in revenue and funds from operations for fiscal year 2018, with Crown Castle raising its expectations for 2019.
Top individual detractors from the Fund’s absolute performance during the fiscal year includedDeutsche Wohnen andMacerich. Deutsche Wohnen, an owner of German residential properties, was negatively impacted by the proposed introduction of new rent regulations in Berlin during the fiscal year. Macerich, which is a retail REIT, detracted from the Fund’s performance on softer net operating income growth. While we remained
concerned about the retail sector and maintained an underweight allocation at the close of the fiscal year, we continued to own Macerich as we believe the company owns high quality assets that should perform better than the retail average.
The Fund has the flexibility to invest across equities and fixed income securities on a global basis, in an effort to take advantage of market dislocations driven by capital market influences rather than underlying commercial real estate fundamentals. We believe the Fund’s ability to invest in both real estate equity and fixed income is particularly beneficial in today’s volatile market environment and can add value throughout the real estate cycle.
The Fund’s fixed income allocation may have the potential to help reduce overall volatility compared to an all-equity real estate portfolio.
The equity portion of the portfolio maintains a bias toward companies with higher quality assets, supply constrained real estate market exposure, generally lower-leveraged balance sheets and most importantly, above average-earnings growth. Listed real estate companies are generally maintaining financial discipline and may benefit from the falling cost of credit with interest rates having declined. Our portfolios seek to capture value creation by listed companies who are actively supplying new assets into markets where there is clear tenant demand. Within the broader investment context, we believe the cash flow security, fundamentally-driven earnings growth opportunity and tangible asset nature of real estate may offer relative attraction to a diversified investor.
We remain committed to owning quality real estate companies that we believe may benefit from sector trends. We continue to seek to manage risk by holding a portfolio that is diversified by property type and geographic location. We also continue to favor lower-leveraged companies with above-average levels of dividend coverage in the portfolio.
We thank you for your continued investment in Invesco Global Real Estate Income Fund.
The views and opinions expressed in management’s discussion of Fund performance are those of Invesco Advisers, Inc. These views and opinions are subject to change at any time based on factors such as market and economic conditions. These views and opinions may not be relied upon as investment advice or recommendations, or as an offer for a particular security. The information is not a complete analysis of every aspect of any market, country, industry, security or the Fund. Statements of fact are from sources considered reliable, but Invesco Advisers, Inc. makes no
representation or warranty as to their completeness or accuracy. Although historical performance is no guarantee of future results, these insights may help you understand our investment management philosophy.
See important Fund and, if applicable, index disclosures later in this report.
James Cowen
Portfolio Manager, is co-lead manager of Invesco Global Real Estate Income Fund. He joined Invesco in 2001. Mr. Cowen earned a Master of Town and Country Planning degree from the University of Manchester and a Master of Philosophy degree in land economy from Cambridge University.
Paul Curbo
Chartered Financial Analyst, Portfolio Manager, is co-lead manager of Invesco Global Real Estate Income Fund. He joined Invesco in 1998. Mr. Curbo earned a BBA in finance from The University of Texas at Austin.
Joe Rodriguez, Jr.
Portfolio Manager, is co-lead manager of Invesco Global Real Estate Income Fund and Chief Investment Officer for Invesco’s Listed Real Assets team. Mr. Rodriguez joined Invesco in 1990. He earned a BBA in economics and finance and an MBA in finance from Baylor University.
Darin Turner
Portfolio Manager, is co-lead manager of Invesco Global Real Estate Income Fund. He joined Invesco in 2005. Mr. Turner earned a BBA in finance from Baylor University, an MS in real estate from The University of Texas at Arlington and an MBA specializing in investments from Southern Methodist University.
Ping-Ying Wang
Chartered Financial Analyst, Portfolio Manager, is co-lead manager of Invesco Global Real Estate Income Fund. She joined Invesco in 1998. Ms. Wang earned a BS in international finance from the People’s University of China and a PhD in finance from The University of Texas at Dallas.
| 5 | Invesco Global Real Estate Income Fund |
Mark Blackburn
Chartered Financial Analyst, Portfolio Manager, is manager of Invesco Global Real Estate Income Fund. He joined Invesco in 1998. Mr. Blackburn earned a BS in accounting from Louisiana State University and an MBA from Southern Methodist University. He is also a Certified Public Accountant.
Grant Jackson
Chartered Financial Analyst, Portfolio Manager, is manager of Invesco Global Real Estate Income Fund. He joined Invesco in 2005. Mr. Jackson earned his BS degree in mechanical engineering from The University of Texas at Austin and his MBA from Southern Methodist University’s Cox School of Business.
| 6 | Invesco Global Real Estate Income Fund |
Your Fund’s Long-Term Performance
Results of a $10,000 Investment — Oldest Share Class(es)
Fund and index data from 8/31/09
| 1 | Source(s): Invesco, RIMES Technologies Corp. |
| 2 | Source: RIMES Technologies Corp. |
| 3 | Source: Lipper Inc. |
Past performance cannot guarantee comparable future results.
The data shown in the chart include reinvested distributions, applicable sales charges and Fund expenses including
management fees. Index results include reinvested dividends, but they do not reflect sales charges. Performance of the peer group, if applicable, reflects fund expenses and management fees; perfor-
mance of a market index does not. Performance shown in the chart and table(s) does not reflect deduction of taxes a shareholder would pay on Fund distributions or sale of Fund shares.
| 7 | Invesco Global Real Estate Income Fund |
| Average Annual Total Returns |
| As of 8/31/19, including maximum applicable sales charges |
| Class A Shares | |
| Inception (5/31/02) | 7.95% |
| 10 Years | 7.89 |
| 5 Years | 3.31 |
| 1 Year | 2.71 |
| Class C Shares | |
| Inception (3/9/07) | 3.49% |
| 10 Years | 7.71 |
| 5 Years | 3.70 |
| 1 Year | 6.89 |
| Class Y Shares | |
| Inception (10/3/08) | 7.60% |
| 10 Years | 8.79 |
| 5 Years | 4.75 |
| 1 Year | 8.98 |
| Class R5 Shares | |
| Inception (3/9/07) | 4.50% |
| 10 Years | 8.90 |
| 5 Years | 4.83 |
| 1 Year | 8.98 |
| Class R6 Shares | |
| 10 Years | 8.83% |
| 5 Years | 4.90 |
| 1 Year | 9.08 |
On March 12, 2007, the Fund reorganized from a Closed-End Fund to an Open-End Fund. Performance shown prior to that date is that of the Closed-End Fund’s Common shares and includes the fees applicable to Common shares.
Class R6 shares incepted on September 24, 2012. Performance shown prior to that date is that of Class A shares and includes the 12b-1 fees applicable to Class A shares.
The performance data quoted represent past performance and cannot guarantee comparable future results; current performance may be lower or higher. Please visit invesco.com/performance for the most recent month-end performance. Performance figures reflect reinvested distributions (reinvested at net asset value, except for periods prior to March 12, 2007 where reinvestments were made at the lower of the Closed-End Fund’s net asset value or market price), changes in net asset value and the effect of the maximum sales charge unless otherwise stated. Investment return and principal value will fluctuate so that you may have a gain or loss when you sell shares.
| Average Annual Total Returns |
| As of 6/30/19, the most recent calendar quarter end, including maximum applicable sales charges |
| Class A Shares | |
| Inception (5/31/02) | 7.90% |
| 10 Years | 9.63 |
| 5 Years | 3.25 |
| 1 Year | 1.62 |
| Class C Shares | |
| Inception (3/9/07) | 3.36% |
| 10 Years | 9.43 |
| 5 Years | 3.64 |
| 1 Year | 5.68 |
| Class Y Shares | |
| Inception (10/3/08) | 7.51% |
| 10 Years | 10.53 |
| 5 Years | 4.68 |
| 1 Year | 7.76 |
| Class R5 Shares | |
| Inception (3/9/07) | 4.39% |
| 10 Years | 10.65 |
| 5 Years | 4.77 |
| 1 Year | 7.88 |
| Class R6 Shares | |
| 10 Years | 10.58% |
| 5 Years | 4.86 |
| 1 Year | 7.98 |
The total annual Fund operating expense ratio set forth in the most recent Fund prospectus as of the date of this report for Class A, Class C, Class Y, Class R5 and Class R6 shares was 1.25%, 2.00%, 1.00%, 0.93% and 0.83%, respectively. The expense ratios presented above may vary from the expense ratios presented in other sections of this report that are based on expenses incurred during the period covered by this report.
Class A share performance reflects the maximum 5.50% sales charge, and Class C share performance reflects the applicable contingent deferred sales charge (CDSC) for the period involved. The CDSC on Class C shares is 1% for the first year after purchase. Class Y, Class R5 and Class R6 shares do not have a front-end sales charge or a CDSC; therefore, performance is at net asset value.
The performance of the Fund’s share classes will differ primarily due to different sales charge structures and class expenses.
Fund performance reflects any applicable fee waivers and/or expense reimbursements. Had the adviser not waived fees and/or reimbursed ex-
penses currently or in the past, returns would have been lower. See current prospectus for more information.
Fund performance was positively impacted by a temporary 2% fee on redemptions that was in effect from March 12, 2007 to March 12, 2008. Without income from this temporary fee, returns would have been lower.
| 8 | Invesco Global Real Estate Income Fund |
Invesco Global Real Estate Income Fund’s investment objective is current income and, secondarily, capital appreciation.
| ■ | Unless otherwise stated, information presented in this report is as of August 31, 2019, and is based on total net assets. |
| ■ | Unless otherwise noted, all data provided by Invesco. |
| ■ | To access your Fund’s reports/prospectus, visit invesco.com/fundreports. |
About share classes
| ■ | On March 12, 2007, Invesco Select Real Estate Income Fund was reorganized from a Closed-End Fund to an Open-End Fund. Information presented for Class A shares prior to the reorganization included financial data for the Closed-End Fund’s Common Shares. |
| ■ | Class Y shares are available only to certain investors. Please see the prospectus for more information. |
| ■ | Class R5 shares and Class R6 shares are available for use by retirement plans that meet certain standards and for institutional investors. Class R6 shares are also available through intermediaries that have established an agreement with Invesco Distributors, Inc. to make such shares available for use in retail omnibus accounts. Please see the prospectus for more information. |
Principal risks of investing in the Fund
| ■ | Changing fixed income market conditions risk.The current low interest rate environment was created in part by the Federal Reserve Board (FRB) and certain foreign central banks keeping the federal funds and equivalent foreign rates near historical lows. Increases in the federal funds and equivalent foreign rates may expose fixed income markets to heightened volatility and reduced liquidity for certain fixed income investments, particularly those with longer maturities. In addition, decreases in fixed income dealer market-making capacity may also potentially lead to heightened volatility and reduced liquidity in the fixed income markets. As a result, the value of the Fund’s investments and share price may decline. Changes in central bank policies could also result in higher than normal shareholder redemptions, which could potentially increase portfolio turnover and the Fund’s transaction costs. |
| ■ | Convertible securities risk. The market values of convertible securities are affected by market interest rates, the risk of actual issuer default on interest or principal payments and the value of the underlying common stock into which the convertible security may be converted. Additionally, a convertible security is subject to the same types of market and issuer risks as apply to the underlying common stock. In addition, certain convertible securities are subject to involuntary conversions and may undergo principal write-downs upon the occurrence of certain triggering events, and, as a result, are subject to an increased risk of loss. Convertible securities may be rated below investment grade. |
| ■ | Debt securities risk. The prices of debt securities held by the Fund will be affected by changes in interest rates, the creditworthiness of the issuer and other factors. An increase in prevailing interest rates typically causes the value of existing debt securities to fall and often has a greater impact on longer-duration debt securities and higher quality debt securities. Falling interest rates will cause the Fund to reinvest the proceeds of debt securities that have been repaid by the issuer at lower interest rates. Falling interest rates may also reduce the Fund’s distributable income because interest payments on floating rate debt instruments held by the Fund will decline. The Fund could lose money on investments in debt securities if the issuer or borrower fails to meet its obligations to make interest payments and/or to repay principal in a timely manner. Changes in an issuer’s financial strength, the market’s perception of such strength or in the credit rating of the issuer or the security may affect the value of debt securities. The Adviser’s credit analysis may fail to anticipate such changes, which could result in buying a debt security at an |
| | inopportune time or failing to sell a debt security in advance of a price decline or other credit event. |
| ■ | Depositary receipts risk.Investing in depositary receipts involves the same risks as direct investments in foreign securities. In addition, the underlying issuers of certain depositary receipts are under no obligation to distribute shareholder communications or pass through any voting rights with respect to the deposited securities to the holders of such receipts. The Fund may therefore receive less timely information or have less control than if it invested directly in the foreign issuer. |
| ■ | Derivatives risk. The value of a derivative instrument depends largely on (and is derived from) the value of an underlying security, currency, commodity, interest rate, index or other asset (each referred to as an underlying asset). In addition to risks relating to the underlying assets, the use of derivatives may include other, possibly greater, risks, including counterparty, leverage and liquidity risks. Counterparty risk is the risk that the counterparty to the derivative contract will default on its obligation to pay the Fund the amount owed or otherwise perform under the derivative contract. Derivatives create leverage risk because they do not require payment up front equal to the economic exposure created by holding a position in the derivative. As a result, an adverse change in the value of the underlying asset could result in the Fund sustaining a loss that is substantially greater than the amount invested in the derivative or the anticipated value of the underlying asset, which may make the Fund’s returns more volatile and increase the risk of loss. Derivative instruments may also be less liquid than more traditional investments and the Fund may be unable to sell or close out its derivative positions at a desirable time or |
This report must be accompanied or preceded by a currently effective Fund prospectus, which contains more complete information, including sales charges and expenses. Investors should read it carefully before investing.
NOT FDIC INSURED | MAY LOSE VALUE | NO BANK GUARANTEE
| 9 | Invesco Global Real Estate Income Fund |
| | price. This risk may be more acute under adverse market conditions, during which the Fund may be most in need of liquidating its derivative positions. Derivatives may also be harder to value, less tax efficient and subject to changing government regulation that could impact the Fund’s ability to use certain derivatives or their cost. Derivatives strategies may not always be successful. For example, derivatives used for hedging or to gain or limit exposure to a particular market segment may not provide the expected benefits, particularly during adverse market conditions. |
| ■ | Emerging markets securities risk. Emerging markets (also referred to as developing markets) are generally subject to greater market volatility, political, social and economic instability, uncertain trading markets and more governmental limitations on foreign investment than more developed markets. In addition, companies operating in emerging markets may be subject to lower trading volume and greater price fluctuations than companies in more developed markets. Securities law and the enforcement of systems of taxation in many emerging market countries may change quickly and unpredictably. In addition, investments in emerging markets securities may be subject to additional transaction costs, delays in settlement procedures, and lack of timely information. |
| ■ | Foreign securities risk. The Fund’s foreign investments may be adversely affected by political and social instability, changes in economic or taxation policies, difficulty in enforcing obligations, decreased liquidity or increased volatility. Foreign investments also involve the risk of the possible seizure, nationalization or expropriation of the issuer or foreign deposits (in which the Fund could lose its entire investments in a certain market) and the possible adoption of foreign governmental restrictions such as exchange controls. Unless the Fund has hedged its foreign securities risk, foreign securities risk also involves the risk of negative foreign currency rate fluctuations, which may cause the value of securities denominated in such foreign currency (or other instruments through which the Fund has exposure to foreign currencies) to decline in value. Currency exchange rates may fluctuate significantly over |
| | short periods of time. Currency hedging strategies, if used, are not always successful. |
| ■ | Geographic focus risk. The Fund may from time to time invest a substantial amount of its assets in securities of issuers located in a single country or a limited number of countries. Adverse economic, political or social conditions in those countries may therefore have a significant negative impact on the Fund’s investment performance. |
| ■ | High yield debt securities (junk bond) risk. Investments in high yield debt securities (“junk bonds”) and other lower-rated securities will subject the Fund to substantial risk of loss. These securities are considered to be speculative with respect to the issuer’s ability to pay interest and principal when due, are more susceptible to default or decline in market value and are less liquid than investment grade debt securities. Prices of high yield debt securities tend to be very volatile. |
| ■ | Management risk. The Fund is actively managed and depends heavily on the Adviser’s judgment about markets, interest rates or the attractiveness, relative values, liquidity, or potential appreciation of particular investments made for the Fund’s portfolio. The Fund could experience losses if these judgments prove to be incorrect. Additionally, legislative, regulatory, or tax developments may adversely affect management of the Fund and, therefore, the ability of the Fund to achieve its investment objective. |
| ■ | Market risk. The market values of the Fund’s investments, and therefore the value of the Fund’s shares, will go up and down, sometimes rapidly or unpredictably. Market risk may affect a single issuer, industry or section of the economy, or it may affect the market as a whole. Individual stock prices tend to go up and down more dramatically than those of certain other types of investments, such as bonds. During a general downturn in the financial markets, multiple asset classes may decline in value. When markets perform well, there can be no assurance that specific investments held by the Fund will rise in value. |
| ■ | Mortgage- and asset-backed securities risk. Mortgage- and asset-backed securities, including collateralized debt obligations and collateralized mortgage obligations, are subject to prepayment or call risk, which is the risk that a borrower’s payments may be received earlier or later than expected |
| | due to changes in prepayment rates on underlying loans. This could result in the Fund reinvesting these early payments at lower interest rates, thereby reducing the Fund’s income. Mortgage- and asset-backed securities also are subject to extension risk, which is the risk that an unexpected rise in interest rates could reduce the rate of prepayments, causing the price of the mortgage- and asset-backed securities and the Fund’s share price to fall. An unexpectedly high rate of defaults on the mortgages held by a mortgage pool may adversely affect the value of mortgage-backed securities and could result in losses to the Fund. Privately issued mortgage-related securities are not subject to the same underwriting requirements as those with government or government-sponsored entity guarantees and, therefore, mortgage loans underlying privately issued mortgage-related securities may have less favorable collateral, credit risk or other underwriting characteristics, and wider variances in interest rate, term, size, purpose and borrower characteristics. |
| ■ | Preferred securities risk. Preferred securities are subject to issuer-specific and market risks applicable generally to equity securities. Preferred securities also may be subordinated to bonds or other debt instruments, subjecting them to a greater risk of non-payment, may be less liquid than many other securities, such as common stocks, and generally offer no voting rights with respect to the issuer. |
| ■ | REIT risk/real estate risk. The Fund concentrates its investments in the securities of real estate and real estate related companies. Investments in real estate related instruments may be affected by economic, legal, cultural, environmental or technological factors that affect property values, rents or occupancies of real estate related to the Fund’s holdings. Shares of real estate related companies, which tend to be small- and mid-cap companies, may be more volatile and less liquid than larger companies. If a real estate related company defaults on certain types of debt obligations, the Fund may own real estate directly, which involves additional risks such as environmental liabilities; difficulty in valuing and selling the real estate; and economic or regulatory changes. |
| 10 | Invesco Global Real Estate Income Fund |
| ■ | Small- and mid-capitalization companies risks. Small- and mid-capitalization companies tend to be more vulnerable to changing market conditions, may have little or no operating history or track record of success, and may have more limited product lines and markets, less experienced management and fewer financial resources than larger companies. These companies’ securities may be more volatile and less liquid than those of more established companies, and their returns may vary, sometimes significantly, from the overall securities market. |
About indexes used in this report
| ■ | TheMSCI World IndexSM is an unmanaged index considered representative of stocks of developed countries. The index is computed using the net return, which withholds applicable taxes for non-resident investors. |
| ■ | TheCustom Invesco Global Real Estate Income Index is composed of FTSE NAREIT All Equity REIT Index through Aug. 31, 2011, and FTSE EPRA/NAREIT Developed Index, which is computed using the net return by withholding applicable taxes, thereafter. |
| ■ | TheLipper Global Real Estate Funds Classification Average represents an average of all funds in the Lipper Global Real Estate Funds classification. |
| ■ | TheFTSE NAREIT All Equity REIT Indexis considered representative of US REITs. |
| ■ | TheFTSE EPRA/NAREIT Developed Index is considered representative of global real estate companies and REITs. |
| ■ | The Fund is not managed to track the performance of any particular index, including the index(es) described here, and consequently, the performance of the Fund may deviate significantly from the performance of the index(es). |
| ■ | A direct investment cannot be made in an index. Unless otherwise indicated, index results include reinvested dividends, and they do not reflect sales charges. Performance of the peer group, if applicable, reflects fund expenses; performance of a market index does not. |
Other information
| ■ | CPA® and Certified Public Accountant® are trademarks owned by the American Institute of Certified Public Accountants. |
| ■ | The returns shown in management’s discussion of Fund performance are based on net asset values (NAVs) calculated for shareholder transactions. Generally accepted accounting principles require adjustments to be made to the net assets of the Fund at period end for financial reporting purposes, and as such, the NAVs for shareholder transactions and the returns based on those NAVs may differ from the NAVs and returns reported in the Financial Highlights. |
| ■ | Industry classifications used in this report are generally according to the Global Industry Classification Standard, which was developed by and is the exclusive property and a service mark of MSCI Inc. and Standard & Poor’s. |
| 11 | Invesco Global Real Estate Income Fund |
Schedule of Investments
August 31, 2019
| | Shares | Value |
| Common Stocks & Other Equity Interests–58.81% |
| Australia–3.02% |
| Dexus | 511,073 | $4,439,231 |
| Goodman Group | 438,889 | 4,293,309 |
| GPT Group (The) | 780,783 | 3,363,023 |
| Mirvac Group | 1,729,150 | 3,719,081 |
| Scentre Group | 2,448,546 | 6,661,027 |
| | | | 22,475,671 |
| Canada–1.60% |
| Allied Properties REIT | 157,100 | 6,194,795 |
| H&R REIT | 234,600 | 3,987,531 |
| Killam Apartment REIT | 53,300 | 821,078 |
| SmartCentres REIT | 40,403 | 960,762 |
| | | | 11,964,166 |
| France–1.67% |
| ICADE | 42,491 | 3,758,277 |
| Klepierre S.A. | 90,056 | 2,749,308 |
| Unibail-Rodamco-Westfield | 45,109 | 5,904,990 |
| | | | 12,412,575 |
| Germany–3.80% |
| Aroundtown S.A. | 600,701 | 4,995,364 |
| Deutsche Wohnen SE | 102,886 | 3,646,432 |
| Grand City Properties S.A. | 240,554 | 5,520,354 |
| LEG Immobilien AG | 51,660 | 6,063,040 |
| Vonovia SE | 163,118 | 8,119,344 |
| | | | 28,344,534 |
| Hong Kong–3.59% |
| CK Asset Holdings Ltd. | 501,500 | 3,384,578 |
| Hang Lung Properties Ltd. | 1,168,000 | 2,633,786 |
| Henderson Land Development Co. Ltd. | 268,300 | 1,245,168 |
| Hongkong Land Holdings Ltd. | 184,800 | 1,007,019 |
| Link REIT | 478,500 | 5,361,885 |
| New World Development Co. Ltd. | 3,307,000 | 4,107,109 |
| Sino Land Co. Ltd. | 1,480,000 | 2,107,123 |
| Sun Hung Kai Properties Ltd. | 328,500 | 4,636,224 |
| Swire Properties Ltd. | 494,400 | 1,618,168 |
| Wharf Real Estate Investment Co. Ltd. | 128,000 | 690,426 |
| | | | 26,791,486 |
| Ireland–0.29% |
| Green REIT PLC | 1,017,573 | 2,132,109 |
| Italy–0.24% |
| Infrastrutture Wireless Italiane S.p.A., REGS(a) | 178,467 | 1,782,561 |
| Japan–8.62% |
| Activia Properties, Inc. | 341 | 1,659,935 |
| | Shares | Value |
| Japan–(continued) |
| Advance Residence Investment Corp. | 784 | $2,523,558 |
| Comforia Residential REIT, Inc | 913 | 2,878,771 |
| Daiwa Office Investment Corp. | 324 | 2,527,596 |
| Invincible Investment Corp. | 6,884 | 4,106,290 |
| Japan Hotel REIT Investment Corp. | 3,076 | 2,369,127 |
| Japan Real Estate Investment Corp. | 369 | 2,455,235 |
| Japan Rental Housing Investments, Inc. | 3,289 | 3,042,830 |
| Japan Retail Fund Investment Corp. | 1,462 | 2,925,377 |
| Kenedix Office Investment Corp. | 24 | 183,722 |
| Kenedix Retail REIT Corp. | 481 | 1,242,262 |
| Mitsubishi Estate Co., Ltd. | 197,700 | 3,777,681 |
| Mitsui Fudosan Co., Ltd. | 339,500 | 8,125,204 |
| Mitsui Fudosan Logistics Park, Inc. | 545 | 2,264,645 |
| Mori Hills REIT Investment Corp. | 1,814 | 2,811,239 |
| Nippon Prologis REIT, Inc. | 1,594 | 4,318,865 |
| Nomura Real Estate Holdings, Inc. | 62,200 | 1,316,541 |
| ORIX JREIT, Inc. | 2,445 | 5,155,705 |
| Sekisui House Reit, Inc. | 1,956 | 1,647,109 |
| Sumitomo Realty & Development Co., Ltd. | 59,100 | 2,218,947 |
| Tokyo Tatemono Co., Ltd. | 64,600 | 840,789 |
| Tokyu Fudosan Holdings Corp. | 558,900 | 3,461,337 |
| Tokyu REIT, Inc. | 1,267 | 2,419,366 |
| | | | 64,272,131 |
| Singapore–2.23% |
| Ascendas REIT | 1,726,900 | 3,830,446 |
| CapitaLand Commercial Trust | 1,484,700 | 2,278,168 |
| CapitaLand Ltd. | 529,700 | 1,321,401 |
| CapitaLand Mall Trust | 1,385,700 | 2,644,476 |
| City Developments Ltd. | 245,400 | 1,690,196 |
| Mapletree Commercial Trust | 1,068,200 | 1,754,397 |
| Mapletree Logistics Trust | 2,715,600 | 3,070,819 |
| | | | 16,589,903 |
| South Africa–0.40% |
| Growthpoint Properties Ltd. | 719,844 | 1,090,461 |
| Redefine Properties Ltd. | 1,646,639 | 851,789 |
| SA Corporate Real Estate Ltd. | 4,829,286 | 1,022,446 |
| | | | 2,964,696 |
| Spain–1.44% |
| Atlantica Yield PLC | 171,979 | 4,091,380 |
| Cellnex Telecom S.A., REGS(a)(b) | 45,789 | 1,833,442 |
| Merlin Properties SOCIMI, S.A. | 362,051 | 4,840,952 |
| | | | 10,765,774 |
| Sweden–0.76% |
| Fabege AB | 88,131 | 1,474,879 |
| Hufvudstaden AB, Class A | 130,310 | 2,413,299 |
See accompanying Notes to Financial Statements which are an integral part of the financial statements.
| 12 | Invesco Global Real Estate Income Fund |
| | Shares | Value |
| Sweden–(continued) |
| Wihlborgs Fastigheter AB | 109,866 | $1,768,456 |
| | | | 5,656,634 |
| Switzerland–0.81% |
| Swiss Prime Site AG(b) | 60,793 | 6,051,365 |
| United Kingdom–2.47% |
| Assura PLC | 3,508,600 | 2,959,146 |
| Big Yellow Group PLC | 95,820 | 1,247,852 |
| Derwent London PLC | 28,453 | 1,103,575 |
| Hansteen Holdings PLC | 1,002,617 | 1,133,375 |
| Land Securities Group PLC | 535,471 | 5,055,881 |
| SEGRO PLC | 360,862 | 3,450,618 |
| Tritax Big Box REIT PLC | 1,354,014 | 2,310,318 |
| Workspace Group PLC | 113,748 | 1,177,196 |
| | | | 18,437,961 |
| United States–27.87% |
| Agree Realty Corp. | 42,336 | 3,162,076 |
| Alexandria Real Estate Equities, Inc. | 20,129 | 3,016,129 |
| American Tower Corp. | 37,036 | 8,525,317 |
| Apple Hospitality REIT, Inc. | 229,732 | 3,659,631 |
| AvalonBay Communities, Inc. | 86,228 | 18,328,624 |
| Boston Properties, Inc. | 98,296 | 12,623,172 |
| Camden Property Trust | 17,263 | 1,868,720 |
| CareTrust REIT, Inc. | 62,635 | 1,490,087 |
| Crown Castle International Corp. | 77,814 | 11,296,258 |
| CyrusOne, Inc. | 63,802 | 4,686,895 |
| Digital Realty Trust, Inc. | 50,427 | 6,234,290 |
| Dominion Energy, Inc. | 41,157 | 3,195,018 |
| EastGroup Properties, Inc. | 24,534 | 3,054,974 |
| Essential Properties Realty Trust, Inc. | 146,003 | 3,315,728 |
| Essex Property Trust, Inc. | 20,794 | 6,680,280 |
| Extra Space Storage, Inc. | 21,077 | 2,569,708 |
| Four Corners Property Trust, Inc. | 103,174 | 2,939,427 |
| HCP, Inc. | 281,749 | 9,779,508 |
| Healthcare Realty Trust, Inc. | 202,683 | 6,735,156 |
| Hudson Pacific Properties, Inc. | 287,968 | 9,790,912 |
| Liberty Property Trust | 57,515 | 2,997,682 |
| Macerich Co. (The) | 65,950 | 1,881,553 |
| Mid-America Apartment Communities, Inc. | 84,050 | 10,647,454 |
| National Retail Properties, Inc. | 53,401 | 2,998,466 |
| Park Hotels & Resorts, Inc. | 72,574 | 1,709,118 |
| Pebblebrook Hotel Trust | 53,122 | 1,432,700 |
| Prologis, Inc. | 133,590 | 11,170,796 |
| Public Storage | 42,150 | 11,158,791 |
| QTS Realty Trust, Inc., Class A | 35,548 | 1,743,985 |
| Retail Opportunity Investments Corp. | 142,875 | 2,501,741 |
| RLJ Lodging Trust | 152,152 | 2,466,384 |
| Simon Property Group, Inc. | 27,065 | 4,031,061 |
| STAG Industrial, Inc. | 113,570 | 3,302,616 |
| Sunstone Hotel Investors, Inc. | 214,709 | 2,821,276 |
| | Shares | Value |
| United States–(continued) |
| Ventas, Inc. | 93,468 | $6,859,616 |
| VICI Properties, Inc. | 235,815 | 5,225,660 |
| Vornado Realty Trust | 53,583 | 3,240,164 |
| Weingarten Realty Investors | 72,586 | 1,922,803 |
| Welltower, Inc. | 30,678 | 2,747,522 |
| Zayo Group Holdings, Inc.(b) | 117,322 | 3,949,059 |
| | | | 207,760,357 |
| Total Common Stocks & Other Equity Interests (Cost $379,232,571) | 438,401,923 |
| Preferred Stocks–18.01% |
| Canada–0.53% |
| Enbridge, Inc., 6.38%, Series B, Pfd. | 141,000 | 3,936,720 |
| United States–17.48% |
| American Homes 4 Rent, 6.50%, Series D, Pfd. | 198,066 | 5,476,525 |
| American Homes 4 Rent, 6.35%, Series E, Pfd. | 357,532 | 9,885,760 |
| American Homes 4 Rent, 5.88%, Series F, Pfd. | 170,449 | 4,455,537 |
| American Homes 4 Rent, 5.88%, Series G, Pfd. | 74,800 | 2,006,884 |
| American Homes 4 Rent, 6.25%, Series H, Pfd. | 73,300 | 2,031,143 |
| Crown Castle International Corp., 0.00%, Series A, $68.75 Conv. Pfd. | 8,636 | 11,272,916 |
| DCP Midstream, L.P., 7.88%, Series B, Pfd. | 200,900 | 4,827,627 |
| DCP Midstream, L.P., 7.95%, Series C, Pfd. | 78,100 | 1,874,400 |
| Digital Realty Trust, Inc., 6.63%, Series C, Pfd. | 109,900 | 3,005,765 |
| Digital Realty Trust, Inc., 6.35%, Series I, Pfd. | 223,800 | 5,908,320 |
| Digital Realty Trust, Inc., 5.25%, Series J, Pfd. | 136,500 | 3,468,465 |
| Dominion Energy, Inc., 0.00%, Series A, $7.25 Conv. Pfd. | 32,660 | 3,329,687 |
| Eagle Hospitality Properties Trust, Inc., 8.25%, Series A, Pfd. | 195,800 | 979 |
| EnLink Midstream Partners L.P., 6.00%, Series C, Pfd. | 4,425,000 | 3,340,875 |
| Kimco Realty Corp., 5.63%, Series K, Pfd. | 74,000 | 1,864,800 |
| National Retail Properties, Inc., 5.70%, Series E, Pfd. | 65,900 | 1,655,408 |
| National Retail Properties, Inc., 5.20%, Series F, Pfd. | 117,108 | 2,952,293 |
| NuStar Logistics L.P., 9.04%, Pfd., (3 mo. USD LIBOR + 6.73%) | 199,400 | 5,166,454 |
| Pebblebrook Hotel Trust, 6.50%, Series C, Pfd. | 173,470 | 4,451,240 |
| Pebblebrook Hotel Trust, 6.38%, Series E, Pfd. | 179,361 | 4,575,499 |
| Pebblebrook Hotel Trust, 6.30%, Series F, Pfd. | 58,006 | 1,512,796 |
| Public Storage, 4.95%, Series D, Pfd. | 231,300 | 5,986,044 |
See accompanying Notes to Financial Statements which are an integral part of the financial statements.
| 13 | Invesco Global Real Estate Income Fund |
| | Shares | Value |
| United States–(continued) |
| Public Storage, 5.15%, Series F, Pfd. | 13,700 | $357,981 |
| QTS Realty Trust, Inc., 7.13%, Series A, Pfd. | 181,573 | 4,926,076 |
| Sempra Energy, 0.00%, Series A, $6.00 Conv. Pfd. | 99,304 | 11,445,779 |
| STAG Industrial, Inc., 6.88%, Series C, Pfd. | 110,300 | 3,044,280 |
| Summit Hotel Properties, Inc., 6.25%, Series E, Pfd. | 252,049 | 6,616,286 |
| Sunstone Hotel Investors, Inc., 6.45%, Series F, Pfd. | 35,000 | 894,950 |
| Sunstone Hotel Investors, Inc., 6.95%, Series E, Pfd. | 139,400 | 3,723,374 |
| Targa Resources Partners L.P., 9.00%, Series A, Pfd. | 284,600 | 7,772,426 |
| Vornado Realty Trust, 5.40%, Series L, Pfd. | 97,600 | 2,486,848 |
| | | | 130,317,417 |
| Total Preferred Stocks (Cost $128,764,450) | 134,254,137 |
| | Principal
Amount | |
| Asset-Backed Securities–17.17% |
| Banc of America Merrill Lynch Large Loan Re-REMIC Trust, | | |
| Series 2016-FR13, Class A, 1.64%, 08/27/2045(a)(c) | | $5,000,000 | 4,688,381 |
| Series 2013-FRR1, Class A1, 0.00%, 12/26/2020(a)(d) | | 6,650,000 | 6,350,185 |
| Barclays Commercial Mortgage Securities Trust, Series 2013-TYSN, Class E, 3.71%, 09/05/2032(a) | | 7,800,000 | 7,834,292 |
| BX Trust, Series 2018-MCSF, Class E, 4.34% (1 mo. USD LIBOR + 2.15%), 04/15/2035(a)(e) | | 500,000 | 502,851 |
| Commercial Mortgage Trust, Series 2014-CR21, Class D, 4.08%, 12/10/2047(a)(c) | | 10,711,000 | 10,173,328 |
| GS Mortgage Securities Corp. Trust, | | |
| Series 2017-500K, Class G, 4.70% (1 mo. USD LIBOR + 2.50%), 07/15/2032(a)(e) | | 8,244,000 | 8,191,069 |
| Series 2017-500K, Class F, 4.00% (1 mo. USD LIBOR + 1.80%), 07/15/2032(a)(e) | | 1,150,000 | 1,151,569 |
| GS Mortgage Securities Trust, Series 2015-590M, Class E, 3.93%, 10/10/2035(a)(c) | | 9,500,000 | 9,770,038 |
| JP Morgan Chase Commercial Mortgage Securities Trust, Series 2012-C8, Class E, 4.81%, 09/15/2022(a)(c) | | 7,805,000 | 7,772,879 |
| JPMBB Commercial Mortgage Securities Trust, | | |
| Series 2014-C23, Class RIM, 4.30%, 09/15/2047(a) | | 10,000,000 | 9,965,417 |
| Series 2014-C26, 4.99%, 09/15/2024(a) | | 10,000,000 | 10,515,468 |
| | Principal
Amount | Value |
| Morgan Stanley Bank of America Merrill Lynch Trust, | | |
| Series 2013-C9, Class D, 4.26%, 05/15/2046(a)(c) | | $14,190,000 | $14,456,165 |
| Series 2013-C12, Class D, 4.92%, 10/15/2046(a)(c) | | 13,510,000 | 14,034,647 |
| Morgan Stanley Capital I Trust, | | |
| Series 2017-CLS, Class F, 4.80% (1 mo. USD LIBOR + 2.60%), 11/15/2034(a)(e) | | 7,700,000 | 7,715,967 |
| Series 2017, Class E, 4.15% (1 mo. USD LIBOR + 1.95%), 11/15/2034(a)(e) | | 216,000 | 216,329 |
| Series 2006-IQ11, Class B, 6.39%, 10/15/2042(c) | | 270,000 | 274,782 |
| Natixis Commercial Mortgage Securities Trust, Series 2018-285M, Class E, 3.92%, 11/15/2032(a)(c) | | 11,150,000 | 11,356,473 |
| New Orleans Hotel Trust, Series 2019-HNLA, Class F, 5.88% (1 mo. USD LIBOR + 3.69%), 04/15/2032(a)(e) | | 3,000,000 | 3,022,235 |
| Total Asset-Backed Securities (Cost $121,238,466) | 127,992,075 |
| U.S. Dollar Denominated Bonds & Notes–2.32% |
| United States–2.32% |
| CenterPoint Energy, Inc., Series A, 6.13% (f) | | 1,958,000 | 2,052,405 |
| CyrusOne L.P./CyrusOne Finance Corp., 5.00%, 03/15/2024 | | 7,400,000 | 7,659,000 |
| Equinix, Inc., 5.38%, 01/01/2022 | | 4,975,000 | 5,111,813 |
| Targa Resources Partners L.P./Targa Resources Partners Finance Corp., 4.25%, 11/15/2023 | | 2,500,000 | 2,506,250 |
| Total U.S. Dollar Denominated Bonds & Notes (Cost $16,999,049) | 17,329,468 |
| | Shares | |
| Money Market Funds–3.60% |
| Invesco Government & Agency Portfolio, Institutional Class, 2.02%(g) | 9,381,957 | 9,381,957 |
| Invesco Liquid Assets Portfolio, Institutional Class, 2.14%(g) | 6,695,547 | 6,698,225 |
| Invesco Treasury Portfolio, Institutional Class, 1.98%(g) | 10,722,237 | 10,722,237 |
| Total Money Market Funds (Cost $26,802,264) | 26,802,419 |
| TOTAL INVESTMENTS IN SECURITIES—99.91% (Cost $673,036,800) | 744,780,022 |
| OTHER ASSETS LESS LIABILITIES–0.09% | 640,148 |
| NET ASSETS–100.00% | $745,420,170 |
See accompanying Notes to Financial Statements which are an integral part of the financial statements.
| 14 | Invesco Global Real Estate Income Fund |
Investment Abbreviations:
| Conv. | – Convertible |
| LIBOR | – London Interbank Offered Rate |
| Pfd. | – Preferred |
| REGS | – Regulation S |
| USD | – U.S. Dollar |
Notes to Schedule of Investments:
| (a) | Security purchased or received in a transaction exempt from registration under the Securities Act of 1933, as amended (the “1933 Act”). The security may be resold pursuant to an exemption from registration under the 1933 Act, typically to qualified institutional buyers. The aggregate value of these securities at August 31, 2019 was $131,333,296, which represented 17.62% of the Fund’s Net Assets. |
| (b) | Non-income producing security. |
| (c) | Interest rate is redetermined periodically based on the cash flows generated by the pool of assets backing the security, less any applicable fees. The rate shown is the rate in effect on August 31, 2019. |
| (d) | Zero coupon bond issued at a discount. |
| (e) | Interest or dividend rate is redetermined periodically. Rate shown is the rate in effect on August 31, 2019. |
| (f) | Perpetual bond with no specified maturity date. |
| (g) | The money market fund and the Fund are affiliated by having the same investment adviser. The rate shown is the 7-day SEC standardized yield as of August 31, 2019. |
See accompanying Notes to Financial Statements which are an integral part of the financial statements.
| 15 | Invesco Global Real Estate Income Fund |
Statement of Assets and Liabilities
August 31, 2019
| Assets: | |
Investments in securities, at value
(Cost $646,234,536) | $717,977,603 |
| Investments in affiliated money market funds, at value (Cost $26,802,264) | 26,802,419 |
| Foreign currencies, at value (Cost $1,173,367) | 1,173,481 |
| Receivable for: | |
| Investments sold | 138,867 |
| Fund shares sold | 541,048 |
| Interest | 765,666 |
| Dividends | 1,132,764 |
| Investment for trustee deferred compensation and retirement plans | 139,249 |
| Other assets | 23,728 |
| Total assets | 748,694,825 |
| Liabilities: | |
| Payable for: | |
| Investments purchased | 1,808,124 |
| Fund shares reacquired | 434,526 |
| Amount due custodian | 464,370 |
| Accrued fees to affiliates | 316,577 |
| Accrued trustees’ and officers’ fees and benefits | 3,522 |
| Accrued other operating expenses | 94,931 |
| Trustee deferred compensation and retirement plans | 152,605 |
| Total liabilities | 3,274,655 |
| Net assets applicable to shares outstanding | $745,420,170 |
| Net assets consist of: | |
| Shares of beneficial interest | $669,399,896 |
| Distributable earnings | 76,020,274 |
| | $745,420,170 |
| Net Assets: |
| Class A | $175,012,679 |
| Class C | $39,087,863 |
| Class Y | $389,619,484 |
| Class R5 | $4,517,257 |
| Class R6 | $137,182,887 |
| Shares outstanding, no par value, with an unlimited number of shares authorized: |
| Class A | 18,287,109 |
| Class C | 4,092,656 |
| Class Y | 40,830,547 |
| Class R5 | 472,281 |
| Class R6 | 14,342,900 |
| Class A: | |
| Net asset value per share | $9.57 |
Maximum offering price per share
(Net asset value of $9.57 ÷ 94.50%) | $10.13 |
| Class C: | |
| Net asset value and offering price per share | $9.55 |
| Class Y: | |
| Net asset value and offering price per share | $9.54 |
| Class R5: | |
| Net asset value and offering price per share | $9.56 |
| Class R6: | |
| Net asset value and offering price per share | $9.56 |
See accompanying Notes to Financial Statements which are an integral part of the financial statements.
| 16 | Invesco Global Real Estate Income Fund |
Statement of Operations
For the year ended August 31, 2019
| Investment income: | |
| Dividends (net of foreign withholding taxes of $1,034,523) | $28,335,138 |
| Interest | 9,867,188 |
| Dividends from affiliated money market funds | 508,406 |
| Total investment income | 38,710,732 |
| Expenses: | |
| Advisory fees | 6,649,926 |
| Administrative services fees | 163,288 |
| Custodian fees | 47,642 |
| Distribution fees: | |
| Class A | 431,621 |
| Class C | 421,782 |
| Transfer agent fees — A, C and Y | 1,508,426 |
| Transfer agent fees — R5 | 4,370 |
| Transfer agent fees — R6 | 9,367 |
| Trustees’ and officers’ fees and benefits | 34,112 |
| Registration and filing fees | 84,171 |
| Reports to shareholders | 124,591 |
| Professional services fees | 76,584 |
| Other | 28,027 |
| Total expenses | 9,583,907 |
| Less: Fees waived and/or expense offset arrangement(s) | (29,732) |
| Net expenses | 9,554,175 |
| Net investment income | 29,156,557 |
| Realized and unrealized gain from: | |
| Net realized gain from: | |
| Investment securities | 12,949,746 |
| Foreign currencies | 13,594 |
| | 12,963,340 |
| Change in net unrealized appreciation of: | |
| Investment securities | 30,136,960 |
| Foreign currencies | 12,651 |
| | 30,149,611 |
| Net realized and unrealized gain | 43,112,951 |
| Net increase in net assets resulting from operations | $72,269,508 |
See accompanying Notes to Financial Statements which are an integral part of the financial statements.
| 17 | Invesco Global Real Estate Income Fund |
Statement of Changes in Net Assets
For the years ended August 31, 2019 and 2018
| | 2019 | 2018 |
| Operations: | | |
| Net investment income | $29,156,557 | $37,937,684 |
| Net realized gain | 12,963,340 | 733,222 |
| Change in net unrealized appreciation (depreciation) | 30,149,611 | (2,184,147) |
| Net increase in net assets resulting from operations | 72,269,508 | 36,486,759 |
| Distributions to shareholders from distributable earnings: | | |
| Class A | (5,952,860) | (8,484,298) |
| Class B | �� | (6,683) |
| Class C | (1,171,631) | (1,934,737) |
| Class Y | (21,134,426) | (25,515,547) |
| Class R5 | (171,798) | (290,676) |
| Class R6 | (5,128,822) | (6,295,516) |
| Total distributions from distributable earnings | (33,559,537) | (42,527,457) |
| Share transactions–net: | | |
| Class A | (21,446,550) | (53,138,358) |
| Class B | — | (474,886) |
| Class C | (14,377,162) | (17,862,650) |
| Class Y | (303,636,604) | 218,321,594 |
| Class R5 | (1,350,688) | (1,734,899) |
| Class R6 | (5,023,529) | (14,277,066) |
| Net increase (decrease) in net assets resulting from share transactions | (345,834,533) | 130,833,735 |
| Net increase (decrease) in net assets | (307,124,562) | 124,793,037 |
| Net assets: | | |
| Beginning of year | 1,052,544,732 | 927,751,695 |
| End of year | $745,420,170 | $1,052,544,732 |
See accompanying Notes to Financial Statements which are an integral part of the financial statements.
| 18 | Invesco Global Real Estate Income Fund |
Financial Highlights
August 31, 2019
The following schedule presents financial highlights for a share of the Fund outstanding throughout the periods indicated.
| | Net asset
value,
beginning
of period | Net
investment
income(a) | Net gains
(losses)
on securities
(both
realized and
unrealized) | Total from
investment
operations | Dividends
from net
investment
income | Distributions
from net
realized
gains | Total
distributions | Net asset
value, end
of period | Total
return(b) | Net assets,
end of period
(000’s omitted) | Ratio of
expenses
to average
net assets
with fee waivers
and/or
expenses
absorbed | Ratio of
expenses
to average net
assets without
fee waivers
and/or
expenses
absorbed | Ratio of net
investment
income
to average
net assets | Portfolio
turnover(c) |
| Class A |
| Year ended 08/31/19 | $9.11 | $0.28 | $0.49 | $0.77 | $(0.31) | $— | $(0.31) | $9.57 | 8.69% | $175,013 | 1.25%(d) | 1.25%(d) | 3.05%(d) | 41% |
| Year ended 08/31/18 | 9.18 | 0.30 | (0.02) | 0.28 | (0.35) | — | (0.35) | 9.11 | 3.11 | 188,658 | 1.24 | 1.24 | 3.33 | 59 |
| Year ended 08/31/17 | 9.30 | 0.26 | (0.02) | 0.24 | (0.36) | — | (0.36) | 9.18 | 2.76 | 244,129 | 1.25 | 1.25 | 2.88 | 43 |
| Year ended 08/31/16 | 8.81 | 0.30 | 0.67 | 0.97 | (0.28) | (0.20) | (0.48) | 9.30 | 11.54 | 385,887 | 1.24 | 1.24 | 3.37 | 60 |
| Year ended 08/31/15 | 9.48 | 0.29 | (0.57) | (0.28) | (0.38) | (0.01) | (0.39) | 8.81 | (3.08) | 499,799 | 1.22 | 1.22 | 3.12 | 60 |
| Class C |
| Year ended 08/31/19 | 9.09 | 0.21 | 0.49 | 0.70 | (0.24) | — | (0.24) | 9.55 | 7.89 | 39,088 | 2.00(d) | 2.00(d) | 2.30(d) | 41 |
| Year ended 08/31/18 | 9.16 | 0.23 | (0.02) | 0.21 | (0.28) | — | (0.28) | 9.09 | 2.34 | 51,925 | 1.99 | 1.99 | 2.58 | 59 |
| Year ended 08/31/17 | 9.28 | 0.19 | (0.02) | 0.17 | (0.29) | — | (0.29) | 9.16 | 1.99 | 70,537 | 2.00 | 2.00 | 2.13 | 43 |
| Year ended 08/31/16 | 8.79 | 0.23 | 0.67 | 0.90 | (0.21) | (0.20) | (0.41) | 9.28 | 10.72 | 95,245 | 1.99 | 1.99 | 2.62 | 60 |
| Year ended 08/31/15 | 9.46 | 0.22 | (0.57) | (0.35) | (0.31) | (0.01) | (0.32) | 8.79 | (3.83) | 103,988 | 1.97 | 1.97 | 2.37 | 60 |
| Class Y |
| Year ended 08/31/19 | 9.08 | 0.30 | 0.49 | 0.79 | (0.33) | — | (0.33) | 9.54 | 8.98 | 389,619 | 1.00(d) | 1.00(d) | 3.30(d) | 41 |
| Year ended 08/31/18 | 9.15 | 0.32 | (0.02) | 0.30 | (0.37) | — | (0.37) | 9.08 | 3.37 | 670,338 | 0.99 | 0.99 | 3.58 | 59 |
| Year ended 08/31/17 | 9.28 | 0.28 | (0.03) | 0.25 | (0.38) | — | (0.38) | 9.15 | 2.91 | 453,479 | 1.00 | 1.00 | 3.13 | 43 |
| Year ended 08/31/16 | 8.79 | 0.32 | 0.67 | 0.99 | (0.30) | (0.20) | (0.50) | 9.28 | 11.84 | 396,910 | 0.99 | 0.99 | 3.62 | 60 |
| Year ended 08/31/15 | 9.45 | 0.31 | (0.55) | (0.24) | (0.41) | (0.01) | (0.42) | 8.79 | (2.75) | 398,283 | 0.97 | 0.97 | 3.37 | 60 |
| Class R5 |
| Year ended 08/31/19 | 9.11 | 0.31 | 0.48 | 0.79 | (0.34) | — | (0.34) | 9.56 | 8.98 | 4,517 | 0.90(d) | 0.90(d) | 3.40(d) | 41 |
| Year ended 08/31/18 | 9.18 | 0.33 | (0.02) | 0.31 | (0.38) | — | (0.38) | 9.11 | 3.46 | 5,745 | 0.92 | 0.92 | 3.65 | 59 |
| Year ended 08/31/17 | 9.30 | 0.29 | (0.02) | 0.27 | (0.39) | — | (0.39) | 9.18 | 3.10 | 7,557 | 0.93 | 0.93 | 3.20 | 43 |
| Year ended 08/31/16 | 8.81 | 0.33 | 0.67 | 1.00 | (0.31) | (0.20) | (0.51) | 9.30 | 11.91 | 12,898 | 0.90 | 0.90 | 3.71 | 60 |
| Year ended 08/31/15 | 9.47 | 0.32 | (0.56) | (0.24) | (0.41) | (0.01) | (0.42) | 8.81 | (2.68) | 14,204 | 0.91 | 0.91 | 3.43 | 60 |
| Class R6 |
| Year ended 08/31/19 | 9.11 | 0.32 | 0.48 | 0.80 | (0.35) | — | (0.35) | 9.56 | 9.08 | 137,183 | 0.81(d) | 0.81(d) | 3.49(d) | 41 |
| Year ended 08/31/18 | 9.17 | 0.34 | (0.02) | 0.32 | (0.38) | — | (0.38) | 9.11 | 3.66 | 135,878 | 0.82 | 0.82 | 3.75 | 59 |
| Year ended 08/31/17 | 9.30 | 0.29 | (0.02) | 0.27 | (0.40) | — | (0.40) | 9.17 | 3.09 | 151,573 | 0.84 | 0.84 | 3.29 | 43 |
| Year ended 08/31/16 | 8.81 | 0.34 | 0.67 | 1.01 | (0.32) | (0.20) | (0.52) | 9.30 | 12.00 | 155,908 | 0.82 | 0.82 | 3.79 | 60 |
| Year ended 08/31/15 | 9.48 | 0.33 | (0.57) | (0.24) | (0.42) | (0.01) | (0.43) | 8.81 | (2.70) | 1,449 | 0.84 | 0.84 | 3.50 | 60 |
| (a) | Calculated using average shares outstanding. |
| (b) | Includes adjustments in accordance with accounting principles generally accepted in the United States of America and as such, the net asset value for financial reporting purposes and the returns based upon those net asset values may differ from the net asset value and returns for shareholder transactions. Not annualized for periods less than one year, if applicable. |
| (c) | Portfolio turnover is calculated at the fund level and is not annualized for periods less than one year, if applicable. |
| (d) | Ratios are based on average daily net assets (000’s omitted) of $172,648, $42,178, $549,315, $4,378 and $132,156 for Class A, Class C, Class Y, Class R5 and Class R6 shares, respectively. |
See accompanying Notes to Financial Statements which are an integral part of the financial statements.
| 19 | Invesco Global Real Estate Income Fund |
Notes to Financial Statements
August 31, 2019
NOTE 1—Significant Accounting Policies
Invesco Global Real Estate Income Fund (the “Fund”) is a series portfolio of AIM Counselor Series Trust (Invesco Counselor Series Trust) (the “Trust”). The Trust is a Delaware statutory trust registered under the Investment Company Act of 1940, as amended (the “1940 Act”), as an open-end series management investment company authorized to issue an unlimited number of shares of beneficial interest. Information presented in these financial statements pertains only to the Fund. Matters affecting the Fund or each class will be voted on exclusively by the shareholders of the Fund or each class.
The Fund’s investment objective is current income and, secondarily, capital appreciation.
The Fund currently consists of five different classes of shares: Class A, Class C, Class Y, Class R5 and Class R6. Class Y shares are available only to certain investors. Class A shares are sold with a front-end sales charge unless certain waiver criteria are met. Under certain circumstances, load waived shares may be subject to contingent deferred sales charges ("CDSC"). Class C shares are sold with a CDSC. Class Y, Class R5 and Class R6 shares are sold at net asset value. Class C shares held for ten years after purchase are eligible for automatic conversion into Class A shares of the same Fund (the "Conversion Feature"). The automatic conversion pursuant to the Conversion Feature will generally occur at the end of the month following the tenth anniversary after a purchase of Class C shares.
The Fund is an investment company and accordingly follows the investment company accounting and reporting guidance in accordance with Financial Accounting Standards Board Accounting Standards Codification Topic 946,Financial Services – Investment Companies.
The following is a summary of the significant accounting policies followed by the Fund in the preparation of its financial statements.
| A. | Security Valuations — Securities, including restricted securities, are valued according to the following policy. |
A security listed or traded on an exchange (except convertible securities) is valued at its last sales price or official closing price as of the close of the customary trading session on the exchange where the security is principally traded, or lacking any sales or official closing price on a particular day, the security may be valued at the closing bid price on that day. Securities traded in the over-the-counter market are valued based on prices furnished by independent pricing services or market makers. When such securities are valued by an independent pricing service they may be considered fair valued. Futures contracts are valued at the final settlement price set by an exchange on which they are principally traded. Listed options are valued at the mean between the last bid and asked prices from the exchange on which they are principally traded. Options not listed on an exchange are valued by an independent source at the mean between the last bid and asked prices. For purposes of determining net asset value (“NAV”) per share, futures and option contracts generally are valued 15 minutes after the close of the customary trading session of the New York Stock Exchange (“NYSE”).
Investments in open-end and closed-end registered investment companies that do not trade on an exchange are valued at the end-of-day net asset value per share. Investments in open-end and closed-end registered investment companies that trade on an exchange are valued at the last sales price or official closing price as of the close of the customary trading session on the exchange where the security is principally traded.
Debt obligations (including convertible securities) and unlisted equities are fair valued using an evaluated quote provided by an independent pricing service. Evaluated quotes provided by the pricing service may be determined without exclusive reliance on quoted prices, and may reflect appropriate factors such as institution-size trading in similar groups of securities, developments related to specific securities, dividend rate (for unlisted equities), yield (for debt obligations), quality, type of issue, coupon rate (for debt obligations), maturity (for debt obligations), individual trading characteristics and other market data. Pricing services generally value debt obligations assuming orderly transactions of institutional round lot size, but a fund may hold or transact in the same securities in smaller, odd lot sizes. Odd lots often trade at lower prices than institutional round lots. Debt obligations are subject to interest rate and credit risks. In addition, all debt obligations involve some risk of default with respect to interest and/or principal payments.
Foreign securities’ (including foreign exchange contracts) prices are converted into U.S. dollar amounts using the applicable exchange rates as of the close of the NYSE. If market quotations are available and reliable for foreign exchange-traded equity securities, the securities will be valued at the market quotations. Because trading hours for certain foreign securities end before the close of the NYSE, closing market quotations may become unreliable. If between the time trading ends on a particular security and the close of the customary trading session on the NYSE, events occur that the investment adviser determines are significant and make the closing price unreliable, the Fund may fair value the security. If the event is likely to have affected the closing price of the security, the security will be valued at fair value in good faith using procedures approved by the Board of Trustees. Adjustments to closing prices to reflect fair value may also be based on a screening process of an independent pricing service to indicate the degree of certainty, based on historical data, that the closing price in the principal market where a foreign security trades is not the current value as of the close of the NYSE. Foreign securities’ prices meeting the approved degree of certainty that the price is not reflective of current value will be priced at the indication of fair value from the independent pricing service. Multiple factors may be considered by the independent pricing service in determining adjustments to reflect fair value and may include information relating to sector indices, American Depositary Receipts and domestic and foreign index futures. Foreign securities may have additional risks including exchange rate changes, potential for sharply devalued currencies and high inflation, political and economic upheaval, the relative lack of issuer information, relatively low market liquidity and the potential lack of strict financial and accounting controls and standards.
Securities for which market prices are not provided by any of the above methods may be valued based upon quotes furnished by independent sources. The last bid price may be used to value equity securities. The mean between the last bid and asked prices is used to value debt obligations, including corporate loans.
Securities for which market quotations are not readily available or became unreliable are valued at fair value as determined in good faith by or under the supervision of the Trust’s officers following procedures approved by the Board of Trustees. Issuer specific events, market trends, bid/asked quotes of brokers and information providers and other market data may be reviewed in the course of making a good faith determination of a security’s fair value.
The Fund may invest in securities that are subject to interest rate risk, meaning the risk that the prices will generally fall as interest rates rise and, conversely, the prices will generally rise as interest rates fall. Specific securities differ in their sensitivity to changes in interest rates
| 20 | Invesco Global Real Estate Income Fund |
depending on their individual characteristics. Changes in interest rates may result in increased market volatility, which may affect the value and/or liquidity of certain Fund investments.
Valuations change in response to many factors including the historical and prospective earnings of the issuer, the value of the issuer’s assets, general economic conditions, interest rates, investor perceptions and market liquidity. Because of the inherent uncertainties of valuation, the values reflected in the financial statements may materially differ from the value received upon actual sale of those investments.
| B. | Securities Transactions and Investment Income – Securities transactions are accounted for on a trade date basis. Realized gains or losses on sales are computed on the basis of specific identification of the securities sold. Interest income (net of withholding tax, if any) is recorded on the accrual basis from settlement date. Bond premiums and discounts are amortized and/or accreted over the lives of the respective securities. Pay-in-kind interest income and non-cash dividend income received in the form of securities in-lieu of cash are recorded at the fair value of the securities received. Paydown gains and losses on mortgage and asset-backed securities are recorded as adjustments to interest income. Dividend income (net of withholding tax, if any) is recorded on the ex-dividend date. |
The Fund may periodically participate in litigation related to Fund investments. As such, the Fund may receive proceeds from litigation settlements. Any proceeds received are included in the Statement of Operations as realized gain (loss) for investments no longer held and as unrealized gain (loss) for investments still held.
Brokerage commissions and mark ups are considered transaction costs and are recorded as an increase to the cost basis of securities purchased and/or a reduction of proceeds on a sale of securities. Such transaction costs are included in the determination of net realized and unrealized gain (loss) from investment securities reported in the Statement of Operations and the Statement of Changes in Net Assets and the net realized and unrealized gains (losses) on securities per share in the Financial Highlights. Transaction costs are included in the calculation of the Fund’s net asset value and, accordingly, they reduce the Fund’s total returns. These transaction costs are not considered operating expenses and are not reflected in net investment income reported in the Statement of Operations and the Statement of Changes in Net Assets, or the net investment income per share and the ratios of expenses and net investment income reported in the Financial Highlights, nor are they limited by any expense limitation arrangements between the Fund and the investment adviser.
The Fund allocates income and realized and unrealized capital gains and losses to a class based on the relative net assets of each class.
The Fund recharacterizes distributions received from REIT investments based on information provided by the REIT into the following categories: ordinary income, long-term and short-term capital gains, and return of capital. If information is not available on a timely basis from the REIT, the recharacterization will be based on available information which may include the previous year’s allocation. If new or additional information becomes available from the REIT at a later date, a recharacterization will be made in the following year. The Fund records as dividend income the amount recharacterized as ordinary income and as realized gain the amount recharacterized as capital gain in the Statement of Operations, and the amount recharacterized as return of capital as a reduction of the cost of the related investment. These recharacterizations are reflected in the accompanying financial statements.
| C. | Country Determination — For the purposes of making investment selection decisions and presentation in the Schedule of Investments, the investment adviser may determine the country in which an issuer is located and/or credit risk exposure based on various factors. These factors include the laws of the country under which the issuer is organized, where the issuer maintains a principal office, the country in which the issuer derives 50% or more of its total revenues and the country that has the primary market for the issuer’s securities, as well as other criteria. Among the other criteria that may be evaluated for making this determination are the country in which the issuer maintains 50% or more of its assets, the type of security, financial guarantees and enhancements, the nature of the collateral and the sponsor organization. Country of issuer and/or credit risk exposure has been determined to be the United States of America, unless otherwise noted. |
| D. | Distributions- Distributions from net investment income, if any, are declared and paid quarterly and are recorded on the ex-dividend date. Distributions from net realized capital gain, if any, are generally declared and paid annually and recorded on the ex-dividend date. The Fund may elect to treat a portion of the proceeds from redemptions as distributions for federal income tax purposes. |
| E. | Federal Income Taxes –The Fund intends to comply with the requirements of Subchapter M of the Internal Revenue Code of 1986, as amended (the “Internal Revenue Code”), necessary to qualify as a regulated investment company and to distribute substantially all of the Fund’s taxable earnings to shareholders. As such, the Fund will not be subject to federal income taxes on otherwise taxable income (including net realized capital gain) that is distributed to shareholders. Therefore, no provision for federal income taxes is recorded in the financial statements. |
The Fund recognizes the tax benefits of uncertain tax positions only when the position is more likely than not to be sustained. Management has analyzed the Fund’s uncertain tax positions and concluded that no liability for unrecognized tax benefits should be recorded related to uncertain tax positions. Management is not aware of any tax positions for which it is reasonably possible that the total amounts of unrecognized tax benefits will change materially in the next 12 months.
The Fund files tax returns in the U.S. Federal jurisdiction and certain other jurisdictions. Generally, the Fund is subject to examinations by such taxing authorities for up to three years after the filing of the return for the tax period.
| F. | Expenses – Fees provided for under the Rule 12b-1 plan of a particular class of the Fund are charged to the operations of such class. Transfer agency fees and expenses and other shareholder recordkeeping fees and expenses attributable to Class R5 and Class R6 are allocated to each share class based on relative net assets. Sub-accounting fees attributable to Class R5 are charged to the operations of the class. Transfer agency fees and expenses and other shareholder recordkeeping fees and expenses relating to all other classes are allocated among those classes based on relative net assets. All other expenses are allocated among the classes based on relative net assets. |
| G. | Accounting Estimates – The preparation of financial statements in conformity with accounting principles generally accepted in the United States of America (“GAAP”) requires management to make estimates and assumptions that affect the reported amounts of assets and liabilities at the date of the financial statements and the reported amounts of revenues and expenses during the reporting period including estimates and assumptions related to taxation. Actual results could differ from those estimates by a significant amount. In addition, the Fund monitors for material events or transactions that may occur or become known after the period-end date and before the date the financial statements are released to print. |
| H. | Indemnifications – Under the Trust’s organizational documents, each Trustee, officer, employee or other agent of the Trust is indemnified against certain liabilities that may arise out of the performance of their duties to the Fund. Additionally, in the normal course of business, the Fund |
| 21 | Invesco Global Real Estate Income Fund |
| | enters into contracts, including the Fund’s servicing agreements, that contain a variety of indemnification clauses. The Fund’s maximum exposure under these arrangements is unknown as this would involve future claims that may be made against the Fund that have not yet occurred. The risk of material loss as a result of such indemnification claims is considered remote. |
| I. | Foreign Currency Translations— Foreign currency is valued at the close of the NYSE based on quotations posted by banks and major currency dealers. Portfolio securities and other assets and liabilities denominated in foreign currencies are translated into U.S. dollar amounts at the date of valuation. Purchases and sales of portfolio securities (net of foreign taxes withheld on disposition) and income items denominated in foreign currencies are translated into U.S. dollar amounts on the respective dates of such transactions. The Fund does not separately account for the portion of the results of operations resulting from changes in foreign exchange rates on investments and the fluctuations arising from changes in market prices of securities held. The combined results of changes in foreign exchange rates and the fluctuation of market prices on investments (net of estimated foreign tax withholding) are included with the net realized and unrealized gain or loss from investments in the Statement of Operations. Reported net realized foreign currency gains or losses arise from (1) sales of foreign currencies, (2) currency gains or losses realized between the trade and settlement dates on securities transactions, and (3) the difference between the amounts of dividends, interest, and foreign withholding taxes recorded on the Fund’s books and the U.S. dollar equivalent of the amounts actually received or paid. Net unrealized foreign currency gains and losses arise from changes in the fair values of assets and liabilities, other than investments in securities at fiscal period end, resulting from changes in exchange rates. |
The Fund may invest in foreign securities, which may be subject to foreign taxes on income, gains on investments or currency repatriation, a portion of which may be recoverable. Foreign taxes, if any, are recorded based on the tax regulations and rates that exist in the foreign markets in which the Fund invests and are shown in the Statement of Operations.
| J. | Forward Foreign Currency Contracts— The Fund may engage in foreign currency transactions either on a spot (i.e. for prompt delivery and settlement) basis, or through forward foreign currency contracts, to manage or minimize currency or exchange rate risk. |
The Fund may also enter into forward foreign currency contracts for the purchase or sale of a security denominated in a foreign currency in order to “lock in” the U.S. dollar price of that security, or the Fund may also enter into forward foreign currency contracts that do not provide for physical settlement of the two currencies, but instead are settled by a single cash payment calculated as the difference between the agreed upon exchange rate and the spot rate at settlement based upon an agreed upon notional amount (non-deliverable forwards). The Fund will set aside liquid assets in an amount equal to the daily mark-to-market obligation for forward foreign currency contracts.
A forward foreign currency contract is an obligation between two parties (“Counterparties”) to purchase or sell a specific currency for an agreed-upon price at a future date. The use of forward foreign currency contracts does not eliminate fluctuations in the price of the underlying securities the Fund owns or intends to acquire but establishes a rate of exchange in advance. Fluctuations in the value of these contracts are measured by the difference in the contract date and reporting date exchange rates and are recorded as unrealized appreciation (depreciation) until the contracts are closed. When the contracts are closed, realized gains (losses) are recorded. Realized and unrealized gains (losses) on the contracts are included in the Statement of Operations. The primary risks associated with forward foreign currency contracts include failure of the Counterparty to meet the terms of the contract and the value of the foreign currency changing unfavorably. These risks may be in excess of the amounts reflected in the Statement of Assets and Liabilities.
| K. | Other Risks - The Fund’s investments are concentrated in a comparatively narrow segment of the economy. Consequently, the Fund may tend to be more volatile than other mutual funds, and the value of the Fund’s investments may tend to rise and fall more rapidly. |
Because the Fund concentrates its assets in the real estate industry, an investment in the Fund will be closely linked to the performance of the real estate markets. Property values may fall due to increasing vacancies or declining rents resulting from economic, legal, cultural or technological developments.
NOTE 2—Advisory Fees and Other Fees Paid to Affiliates
The Trust has entered into a master investment advisory agreement with Invesco Advisers, Inc. (the "Adviser" or "Invesco"). Under the terms of the investment advisory agreement, the Fund accrues daily and pays monthly an advisory fee to the Adviser based on the annual rate of the Fund’s average daily net assets as follows:
| Average Daily Net Assets | Rate |
| First $250 million | 0.75% |
| Next $250 million | 0.74% |
| Next $500 million | 0.73% |
| Next $1.5 billion | 0.72% |
| Next $2.5 billion | 0.71% |
| Next $2.5 billion | 0.70% |
| Next $2.5 billion | 0.69% |
| Over $10 billion | 0.68% |
For the year ended August 31, 2019, the effective advisory fees incurred by the Fund was 0.74%.
Under the terms of a master sub-advisory agreement between the Adviser and each of Invesco Asset Management Deutschland GmbH, Invesco Asset Management Limited, Invesco Asset Management (Japan) Limited, Invesco Hong Kong Limited, Invesco Senior Secured Management, Inc. and Invesco Canada Ltd. (collectively, the "Affiliated Sub-Advisers") the Adviser, not the Fund, will pay 40% of the fees paid to the Adviser to any such Affiliated Sub-Adviser(s) that provide(s) discretionary investment management services to the Fund based on the percentage of assets allocated to such Affiliated Sub-Adviser(s).
The Adviser has contractually agreed, through at least June 30, 2020, to waive advisory fees and/or reimburse expenses to the extent necessary to limit total annual fund operating expenses and/or reimbursement (excluding certain items discussed below) of Class A, Class C, Class Y, Class R5 and Class R6 shares to 2.00%, 2.75%, 1.75%, 1.75% and 1.75%, respectively, of the Fund’s average daily net assets (the ”expense limits”). In determining the Adviser’s obligation to waive advisory fees and/or reimburse expenses, the following expenses are not taken into account, and could
| 22 | Invesco Global Real Estate Income Fund |
cause the net annual fund operating expenses and/or reimbursement to exceed the numbers reflected above: (1) interest; (2) taxes; (3) dividend expense on short sales; (4) extraordinary or non-routine items, including litigation expenses; and (5) expenses that the Fund has incurred but did not actually pay because of an expense offset arrangement. Unless Invesco continues the fee waiver agreement, it will terminate on June 30, 2020. During its term, the fee waiver agreement cannot be terminated or amended to increase the expense limits or reduce the advisory fee waivers without approval of the Board of Trustees. The Adviser did not waive fees and/or reimburse expenses during the period under this expense limit.
Further, the Adviser has contractually agreed, through at least June 30, 2021, to waive the advisory fee payable by the Fund in an amount equal to 100% of the net advisory fees the Adviser receives from the affiliated money market funds on investments by the Fund of uninvested cash in such affiliated money market funds.
For the year ended August 31, 2019, the Adviser waived advisory fees of $28,172.
The Trust has entered into a master administrative services agreement with Invesco pursuant to which the Fund has agreed to pay Invesco for certain administrative costs incurred in providing accounting services to the Fund. For the year ended August 31, 2019, expenses incurred under the agreement are shown in the Statement of Operations asAdministrative services fees. Also, Invesco has entered into a sub-administration agreement whereby State Street Bank and Trust Company (“SSB”) serves as custodian and fund accountant and provides certain administrative services to the Fund.
The Trust has entered into a transfer agency and service agreement with Invesco Investment Services, Inc. (“IIS”) pursuant to which the Fund has agreed to pay IIS a fee for providing transfer agency and shareholder services to the Fund and reimburse IIS for certain expenses incurred by IIS in the course of providing such services. IIS may make payments to intermediaries that provide omnibus account services, sub-accounting services and/or networking services. All fees payable by IIS to intermediaries that provide omnibus account services or sub-accounting services are charged back to the Fund, subject to certain limitations approved by the Trust’s Board of Trustees. For the year ended August 31, 2019, expenses incurred under the agreement are shown in the Statement of Operations asTransfer agent fees.
The Trust has entered into master distribution agreements with Invesco Distributors, Inc. (“IDI”) to serve as the distributor for the Class A, Class C, Class Y, Class R5 and Class R6 shares of the Fund. The Trust has adopted plans pursuant to Rule 12b-1 under the 1940 Act with respect to the Fund’s Class A and Class C shares (collectively, the “Plans”). The Fund, pursuant to the Plans, pays IDI compensation at the annual rate of 0.25% of the Fund’s average daily net assets of Class A shares and 1.00% of the average daily net assets of Class C shares. The fees are accrued daily and paid monthly. Of the Plan payments, up to 0.25% of the average daily net assets of each class of shares may be paid to furnish continuing personal shareholder services to customers who purchase and own shares of such classes. Any amounts not paid as a service fee under the Plans would constitute an asset-based sales charge. Rules of the Financial Industry Regulatory Authority (“FINRA”) impose a cap on the total sales charges, including asset-based sales charges, that may be paid by any class of shares of the Fund. For the year ended August 31, 2019, expenses incurred under the Plans are shown in the Statement of Operations asDistribution fees.
Front-end sales commissions and CDSC (collectively, the “sales charges”) are not recorded as expenses of the Fund. Front-end sales commissions are deducted from proceeds from the sales of Fund shares prior to investment in Class A shares of the Fund. CDSC are deducted from redemption proceeds prior to remittance to the shareholder. During the year ended August 31, 2019, IDI advised the Fund that IDI retained $10,335 in front-end sales commissions from the sale of Class A shares and $2,419 and $1,737 from Class A and Class C shares, respectively, for CDSC imposed upon redemptions by shareholders.
Certain officers and trustees of the Trust are officers and directors of the Adviser, IIS and/or IDI.
NOTE 3—Additional Valuation Information
GAAP defines fair value as the price that would be received to sell an asset or paid to transfer a liability in an orderly transaction between market participants at the measurement date, under current market conditions. GAAP establishes a hierarchy that prioritizes the inputs to valuation methods, giving the highest priority to readily available unadjusted quoted prices in an active market for identical assets (Level 1) and the lowest priority to significant unobservable inputs (Level 3), generally when market prices are not readily available or are unreliable. Based on the valuation inputs, the securities or other investments are tiered into one of three levels. Changes in valuation methods may result in transfers in or out of an investment’s assigned level:
Level 1 – Prices are determined using quoted prices in an active market for identical assets.
Level 2 – Prices are determined using other significant observable inputs. Observable inputs are inputs that other market participants may use in pricing a security. These may include quoted prices for similar securities, interest rates, prepayment speeds, credit risk, yield curves, loss severities, default rates, discount rates, volatilities and others.
Level 3 – Prices are determined using significant unobservable inputs. In situations where quoted prices or observable inputs are unavailable (for example, when there is little or no market activity for an investment at the end of the period), unobservable inputs may be used. Unobservable inputs reflect the Fund’s own assumptions about the factors market participants would use in determining fair value of the securities or instruments and would be based on the best available information.
The following is a summary of the tiered valuation input levels, as of August 31, 2019. The level assigned to the securities valuations may not be an indication of the risk or liquidity associated with investing in those securities. Because of the inherent uncertainties of valuation, the values reflected in the financial statements may materially differ from the value received upon actual sale of those investments.
| 23 | Invesco Global Real Estate Income Fund |
| | Level 1 | Level 2 | Level 3 | Total |
| Investments in Securities | | | | |
| Australia | $— | $22,475,671 | $— | $22,475,671 |
| Canada | 15,900,886 | — | — | 15,900,886 |
| France | — | 12,412,575 | — | 12,412,575 |
| Germany | — | 28,344,534 | — | 28,344,534 |
| Hong Kong | — | 26,791,486 | — | 26,791,486 |
| Ireland | — | 2,132,109 | — | 2,132,109 |
| Italy | — | 1,782,561 | — | 1,782,561 |
| Japan | — | 64,272,131 | — | 64,272,131 |
| Singapore | — | 16,589,903 | — | 16,589,903 |
| South Africa | — | 2,964,696 | — | 2,964,696 |
| Spain | 4,091,380 | 6,674,394 | — | 10,765,774 |
| Sweden | — | 5,656,634 | — | 5,656,634 |
| Switzerland | — | 6,051,365 | — | 6,051,365 |
| United Kingdom | — | 18,437,961 | — | 18,437,961 |
| United States | 334,735,920 | 148,663,397 | — | 483,399,317 |
| Money Market Funds | 26,802,419 | — | — | 26,802,419 |
| Total Investments | $381,530,605 | $363,249,417 | $— | $744,780,022 |
NOTE 4—Expense Offset Arrangement(s)
The expense offset arrangement is comprised of transfer agency credits which result from balances in demand deposit accounts used by the transfer agent for clearing shareholder transactions. For the year ended August 31, 2019, the Fund received credits from this arrangement, which resulted in the reduction of the Fund’s total expenses of $1,560.
NOTE 5—Trustees’ and Officers’ Fees and Benefits
Trustees’ and Officers’ Fees and Benefits include amounts accrued by the Fund to pay remuneration to certain Trustees and Officers of the Fund. Trustees have the option to defer compensation payable by the Fund, and Trustees’ and Officers’ Fees and Benefits also include amounts accrued by the Fund to fund such deferred compensation amounts. Those Trustees who defer compensation have the option to select various Invesco Funds in which their deferral accounts shall be deemed to be invested. Finally, certain current Trustees were eligible to participate in a retirement plan that provided for benefits to be paid upon retirement to Trustees over a period of time based on the number of years of service. The Fund may have certain former Trustees who also participate in a retirement plan and receive benefits under such plan.Trustees’ and Officers’ Fees and Benefits include amounts accrued by the Fund to fund such retirement benefits. Obligations under the deferred compensation and retirement plans represent unsecured claims against the general assets of the Fund.
NOTE 6—Cash Balances
The Fund is permitted to temporarily carry a negative or overdrawn balance in its account with SSB, the custodian bank. Such balances, if any at period-end, are shown in the Statement of Assets and Liabilities under the payable captionAmount due custodian. To compensate the custodian bank for such overdrafts, the overdrawn Fund may either (1) leave funds as a compensating balance in the account so the custodian bank can be compensated by earning the additional interest; or (2) compensate by paying the custodian bank at a rate agreed upon by the custodian bank and Invesco, not to exceed the contractually agreed upon rate. The Fund may not purchase additional securities when any borrowings from banks or broker-dealers exceed 5% of the Fund’s total assets, or when any borrowings from an Invesco Fund are outstanding.
NOTE 7—Distributions to Shareholders and Tax Components of Net Assets
| Tax Character of Distributions to Shareholders Paid During the Fiscal Years Ended August 31, 2019 and August 31, 2018 |
| | 2019 | 2018 |
| Ordinary income | $33,559,537 | $42,527,457 |
| Tax Components of Net Assets at Period-End: |
| | 2019 |
| Undistributed ordinary income | $18,051,189 |
| Undistributed long-term capital gain | 4,247,920 |
| Net unrealized appreciation — investments | 53,860,223 |
| Net unrealized appreciation (depreciation) — foreign currencies | (8,572) |
| Temporary book/tax differences | (130,486) |
| Shares of beneficial interest | 669,399,896 |
| Total net assets | $745,420,170 |
| 24 | Invesco Global Real Estate Income Fund |
The difference between book-basis and tax-basis unrealized appreciation (depreciation) is due to differences in the timing of recognition of gains and losses on investments for tax and book purposes. The Fund’s net unrealized appreciation difference is attributable primarily to passive foreign investment companies and wash sales.
The temporary book/tax differences are a result of timing differences between book and tax recognition of income and/or expenses. The Fund’s temporary book/tax differences are the result of the trustee deferral of compensation and retirement plan benefits.
Capital loss carryforward is calculated and reported as of a specific date. Results of transactions and other activity after that date may affect the amount of capital loss carryforward actually available for the Fund to utilize. Capital losses generated in years beginning after December 22, 2010 can be carried forward for an unlimited period, whereas previous losses expire in eight tax years. Capital losses with an expiration period may not be used to offset capital gains until all net capital losses without an expiration date have been utilized. Capital loss carryforwards with no expiration date will retain their character as either short-term or long-term capital losses instead of as short-term capital losses as under prior law. The ability to utilize capital loss carryforwards in the future may be limited under the Internal Revenue Code and related regulations based on the results of future transactions.
The Fund does not have a capital loss carryforward as of August 31, 2019.
NOTE 8—Investment Transactions
The aggregate amount of investment securities (other than short-term securities, U.S. Treasury obligations and money market funds, if any) purchased and sold by the Fund during the year ended August 31, 2019 was $353,680,439 and $690,630,202, respectively. Cost of investments, including any derivatives, on a tax basis includes the adjustments for financial reporting purposes as of the most recently completed federal income tax reporting period-end.
| Unrealized Appreciation (Depreciation) of Investments on a Tax Basis |
| Aggregate unrealized appreciation of investments | $72,197,009 |
| Aggregate unrealized (depreciation) of investments | (18,336,786) |
| Net unrealized appreciation of investments | $53,860,223 |
Cost of investments for tax purposes is $690,919,799.
NOTE 9—Reclassification of Permanent Differences
Primarily as a result of differing book/tax treatment of passive foreign investment companies, convertible preferred debt instruments and foreign currency transactions, on August 31, 2019, undistributed net investment income (loss) was increased by $5,486,390 and undistributed net realized gain was decreased by $5,486,390. This reclassification had no effect on the net assets or the distributable earnings of the Fund.
NOTE 10—Share Information
| | Summary of Share Activity |
| | Years ended August 31, |
| | 2019(a) | | 2018 |
| | Shares | Amount | | Shares | Amount |
| Sold: | | | | | |
| Class A | 1,465,346 | $13,369,134 | | 2,352,683 | $21,075,015 |
| Class B(b) | - | - | | 51 | 462 |
| Class C | 522,160 | 4,786,507 | | 252,180 | 2,271,886 |
| Class Y | 13,361,294 | 119,530,724 | | 44,027,948 | 395,465,821 |
| Class R5 | 80,515 | 743,981 | | 109,764 | 989,529 |
| Class R6 | 1,510,352 | 13,914,619 | | 1,078,932 | 9,693,490 |
| Issued as reinvestment of dividends: | | | | | |
| Class A | 518,938 | 4,713,766 | | 781,229 | 7,037,420 |
| Class B(b) | - | - | | 617 | 5,613 |
| Class C | 95,303 | 862,444 | | 163,554 | 1,473,882 |
| Class Y | 1,188,362 | 10,764,441 | | 1,822,584 | 16,371,139 |
| Class R5 | 17,207 | 156,108 | | 27,660 | 248,859 |
| Class R6 | 563,000 | 5,112,241 | | 698,413 | 6,279,825 |
| Conversion of Class B shares to Class A shares:(c) | | | | | |
| Class A | - | - | | 33,725 | 309,934 |
| Class B | - | - | | (33,848) | (309,934) |
| Automatic conversion of Class C shares to Class A shares: | | | | | |
| Class A | 717,523 | 6,427,887 | | - | - |
| Class C | (718,341) | (6,427,887) | | - | - |
| 25 | Invesco Global Real Estate Income Fund |
| | Summary of Share Activity |
| | Years ended August 31, |
| | 2019(a) | | 2018 |
| | Shares | Amount | | Shares | Amount |
| Reacquired: | | | | | |
| Class A | (5,121,989) | $(45,957,337) | | (9,062,612) | $(81,560,727) |
| Class B(b) | - | - | | (18,872) | (171,027) |
| Class C | (1,516,846) | (13,598,226) | | (2,406,386) | (21,608,418) |
| Class Y | (47,515,037) | (433,931,769) | | (21,612,083) | (193,515,366) |
| Class R5 | (256,272) | (2,250,777) | | (330,249) | (2,973,287) |
| Class R6 | (2,649,242) | (24,050,389) | | (3,379,609) | (30,250,381) |
| Net increase (decrease) in share activity | (37,737,727) | $(345,834,533) | | 14,505,681 | $130,833,735 |
| (a) | There are entities that are record owners of more than 5% of the outstanding shares of the Fund and in the aggregate own 47% of the outstanding shares of the Fund. IDI has an agreement with these entities to sell Fund shares. The Fund, Invesco and/or Invesco affiliates may make payments to these entities, which are considered to be related to the Fund, for providing services to the Fund, Invesco and/or Invesco affiliates including but not limited to services such as securities brokerage, distribution, third party record keeping and account servicing. The Fund has no knowledge as to whether all or any portion of the shares owned of record by these entities are also owned beneficially. |
| (b) | Class B shares activity for the period September 1, 2017 through January 26, 2018 (date of conversion). |
| (c) | Effective as of the close of business January 26, 2018, all outstanding Class B shares were converted to Class A shares. |
| 26 | Invesco Global Real Estate Income Fund |
Report of Independent Registered Public Accounting Firm
To the Board of Trustees of AIM Counselor Series Trust (Invesco Counselor Series Trust) and Shareholders of Invesco Global Real Estate Income Fund
Opinion on the Financial Statements
We have audited the accompanying statement of assets and liabilities, including the schedule of investments, of Invesco Global Real Estate Income Fund (one of the funds constituting AIM Counselor Series Trust (Invesco Counselor Series Trust), referred to hereafter as the "Fund") as of August 31, 2019, the related statement of operations for the year ended August 31, 2019, the statement of changes in net assets for each of the two years in the period ended August 31, 2019, including the related notes, and the financial highlights for each of the five years in the period ended August 31, 2019 (collectively referred to as the "financial statements"). In our opinion, the financial statements present fairly, in all material respects, the financial position of the Fund as of August 31, 2019, the results of its operations for the year then ended, the changes in its net assets for each of the two years in the period ended August 31, 2019 and the financial highlights for each of the five years in the period ended August 31, 2019 in conformity with accounting principles generally accepted in the United States of America.
Basis for Opinion
These financial statements are the responsibility of the Fund’s management. Our responsibility is to express an opinion on the Fund’s financial statements based on our audits. We are a public accounting firm registered with the Public Company Accounting Oversight Board (United States) (PCAOB) and are required to be independent with respect to the Fund in accordance with the U.S. federal securities laws and the applicable rules and regulations of the Securities and Exchange Commission and the PCAOB.
We conducted our audits of these financial statements in accordance with the standards of the PCAOB. Those standards require that we plan and perform the audit to obtain reasonable assurance about whether the financial statements are free of material misstatement, whether due to error or fraud.
Our audits included performing procedures to assess the risks of material misstatement of the financial statements, whether due to error or fraud, and performing procedures that respond to those risks. Such procedures included examining, on a test basis, evidence regarding the amounts and disclosures in the financial statements. Our audits also included evaluating the accounting principles used and significant estimates made by management, as well as evaluating the overall presentation of the financial statements. Our procedures included confirmation of securities owned as of August 31, 2019 by correspondence with the custodian, transfer agent and brokers; when replies were not received from brokers, we performed other auditing procedures. We believe that our audits provide a reasonable basis for our opinion.
/s/ PricewaterhouseCoopers LLP
Houston, Texas
October 29, 2019
We have served as the auditor of one or more of the investment companies in the Invesco group of investment companies since at least 1995. We have not been able to determine the specific year we began serving as auditor.
| 27 | Invesco Global Real Estate Income Fund |
Calculating your ongoing Fund expenses
Example
As a shareholder of the Fund, you incur two types of costs: (1) transaction costs, which may include sales charges (loads) on purchase payments or contingent deferred sales charges on redemptions, if any; and (2) ongoing costs, including management fees, distribution and/or service (12b-1) fees, and other Fund expenses. This example is intended to help you understand your ongoing costs (in dollars) of investing in the Fund and to compare these costs with ongoing costs of investing in other mutual funds. The example is based on an investment of $1,000 invested at the beginning of the period and held for the entire period March 1, 2019 through August 31, 2019.
Actual expenses
The table below provides information about actual account values and actual expenses. You may use the information in this table, together with the amount you invested, to estimate the expenses that you paid over the period. Simply divide your account value by $1,000 (for example, an $8,600 account value divided by $1,000 = 8.6), then multiply the result by the number in the table under the heading entitled “Actual Expenses Paid During Period” to estimate the expenses you paid on your account during this period.
Hypothetical example for comparison purposes
The table below also provides information about hypothetical account values and hypothetical expenses based on the Fund’s actual expense ratio and an assumed rate of return of 5% per year before expenses, which is not the Fund’s actual return.
The hypothetical account values and expenses may not be used to estimate the actual ending account balance or expenses you paid for the period. You may use this information to compare the ongoing costs of investing in the Fund and other funds. To do so, compare this 5% hypothetical example with the 5% hypothetical examples that appear in the shareholder reports of the other funds.
Please note that the expenses shown in the table are meant to highlight your ongoing costs only and do not reflect any transaction costs, such as sales charges (loads) on purchase payments or contingent deferred sales charges on redemptions, if any. Therefore, the hypothetical information is useful in comparing ongoing costs only, and will not help you determine the relative total costs of owning different funds. In addition, if these transaction costs were included, your costs would have been higher.
| | Beginning
Account Value (03/01/19) | ACTUAL | HYPOTHETICAL
(5% annual return before
expenses) | Annualized
Expense
Ratio |
Ending
Account Value
(08/31/19)1 | Expenses
Paid During
Period2 | Ending
Account Value
(08/31/19) | Expenses
Paid During
Period2 |
| Class A | $1,000.00 | $1,066.10 | $6.20 | $1,019.21 | $6.06 | 1.19% |
| Class C | 1,000.00 | 1,061.10 | 10.08 | 1,015.43 | 9.86 | 1.94 |
| Class Y | 1,000.00 | 1,066.40 | 4.90 | 1,020.47 | 4.79 | 0.94 |
| Class R5 | 1,000.00 | 1,066.90 | 4.64 | 1,020.72 | 4.53 | 0.89 |
| Class R6 | 1,000.00 | 1,067.40 | 4.17 | 1,021.17 | 4.08 | 0.80 |
| 1 | The actual ending account value is based on the actual total return of the Fund for the period March 1, 2019 through August 31, 2019, after actual expenses and will differ from the hypothetical ending account value which is based on the Fund’s expense ratio and a hypothetical annual return of 5% before expenses. |
| 2 | Expenses are equal to the Fund’s annualized expense ratio as indicated above multiplied by the average account value over the period, multiplied by 184/365 to reflect the most recent fiscal half year. |
| 28 | Invesco Global Real Estate Income Fund |
Approval of Investment Advisoryand Sub-Advisory Contracts
At meetings held on June 10, 2019, the Board of Trustees (the Board or the Trustees) of AIM Counselor Series Trust (Invesco Counselor Series Trust) as a whole, and the independent Trustees, who comprise over 75% of the Board, voting separately, approved the continuance of the Invesco Global Real Estate Income Fund’s (the Fund) Master Investment Advisory Agreement with Invesco Advisers, Inc. (Invesco Advisers and the investment advisory agreement) and the Master IntergroupSub-Advisory Contract for Mutual Funds with Invesco Asset Management Deutschland GmbH, Invesco Asset Management Limited, Invesco Asset Management (Japan) Limited, Invesco Hong Kong Limited, Invesco Senior Secured Management, Inc. and Invesco Canada Ltd. (collectively, the AffiliatedSub-Advisers and thesub-advisory contracts) for another year, effective July 1, 2019. After evaluating the factors discussed below, among others, the Board approved the renewal of the Fund’s investment advisory agreement and thesub-advisory contracts and determined that the compensation payable by the Fund to Invesco Advisers and by Invesco Advisers to the AffiliatedSub-Advisers is fair and reasonable.
The Board’s Evaluation Process
The Board’s Investments Committee has established threeSub-Committees, which meet throughout the year to review the performance of funds advised by Invesco Advisers (the Invesco Funds). As part of a regularly scheduled basis ofin-person Board meetings, theSub-Committees meet with portfolio managers for their assigned Invesco Funds and other members of management to review detailed information about investment performance and portfolio attributes of these funds. The Board took into account evaluations and reports that it received from the Investments Committee andSub-Committees, as well as the information provided to such committees and the Board throughout the year, in considering whether to approve each Invesco Fund’s investment advisory agreement andsub-advisory contracts.
As part of the contract renewal process, the Board reviews and considers information provided in response to detailed requests for information submitted to management by the independent Trustees with assistance from legal counsel to the independent Trustees. The Board receives comparative investment performance and fee data regarding the Invesco Funds prepared by Invesco Advisers and Broadridge Financial Solutions, Inc. (Broadridge), an independent mutual fund data provider. The Board also receives an independent written evaluation from the Senior Officer, an officer of the Invesco Funds who reports directly to the independent Trustees. The Senior Officer’s evaluation is prepared as part of his responsibility to manage the process by which
the Invesco Funds’ proposed management fees are negotiated during the annual contract renewal process to ensure they are negotiated in a manner that is at arms’ length and reasonable. In addition to meetings with Invesco Advisers and fund counsel throughout the year, the independent Trustees also discuss the continuance of the investment advisory agreement andsub-advisory contracts in separate sessions with the Senior Officer and with independent legal counsel.
The discussion below is a summary of the Senior Officer’s independent written evaluation with respect to the Fund’s investment advisory agreement, as well as a discussion of the material factors and related conclusions that formed the basis for the Board’s approval of the Fund’s investment advisory agreement andsub-advisory contracts. The Trustees’ review and conclusions are based on the comprehensive consideration of all information presented to them during the course of the year and in prior years and are not the result of any single determinative factor. Moreover, one Trustee may have weighed a particular piece of information or factor differently than another Trustee. This information is current as of June 10, 2019.
Factors and Conclusions and Summary of Independent Written Fee Evaluation
| A. | Nature, Extent and Quality of Services Provided by Invesco Advisers and the AffiliatedSub-Advisers |
The Board reviewed the nature, extent and quality of the advisory services provided to the Fund by Invesco Advisers under the Fund’s investment advisory agreement, and the credentials and experience of the officers and employees of Invesco Advisers who provide these services, including the Fund’s portfolio manager(s). The Board’s review included consideration of Invesco Advisers’ investment process oversight and structure, credit analysis and investment risk management. The Board also considerednon-advisory services that Invesco Advisers and its affiliates provide to the Invesco Funds such as various back office support functions, third party oversight, internal audit, valuation, portfolio trading and legal and compliance. The Board also received and reviewed information about Invesco Advisers’ role as administrator of the Invesco Funds’ liquidity risk management program. The Board also reviewed and considered the benefits to shareholders of investing in a fund that is part of the Invesco family of funds under the umbrella of Invesco Ltd., Invesco Advisers’ parent company, and noted Invesco Ltd.’s depth and experience in conducting an investment management business, as well as its commitment of financial and other resources to such business. The Board reviewed and considered information about the resources
that Invesco Advisers intends to continue to commit to managing the Invesco family of funds following Invesco Ltd.’s acquisition of OppenheimerFunds, Inc. and its subsidiaries. The Board concluded that the nature, extent and quality of the services provided to the Fund by Invesco Advisers are appropriate and satisfactory.
The Board reviewed the services that may be provided by the AffiliatedSub-Advisers under thesub-advisory contracts and the credentials and experience of the officers and employees of the AffiliatedSub-Advisers who provide these services. The Board noted the AffiliatedSub-Advisers’ expertise with respect to certain asset classes and that the AffiliatedSub-Advisers have offices and personnel that are located in financial centers around the world. As a result, the Board noted that the AffiliatedSub-Advisers can provide research and investment analysis on the markets and economies of various countries in which the Fund may invest, make recommendations regarding securities and assist with security trades. The Board concluded that thesub-advisory contracts may benefit the Fund and its shareholders by permitting Invesco Advisers to use the resources and talents of the AffiliatedSub-Advisers in managing the Fund. The Board concluded that the nature, extent and quality of the services that may be provided by the AffiliatedSub-Advisers are appropriate and satisfactory.
| B. | Fund Investment Performance |
The Board considered Fund investment performance as a relevant factor in considering whether to approve the investment advisory agreement as well as thesub-advisory contracts for the Fund, as Invesco Asset Management Limited currently manages assets of the Fund.
The Board compared the Fund’s investment performance over multiple time periods ending December 31, 2018 to the performance of funds in the Broadridge performance universe and against the Lipper Global Real Estate Funds Index. The Board noted that performance of Class A shares of the Fund was in the first quintile of its performance universe for the one year period and the third quintile for the three and five year periods (the first quintile being the best performing funds and the fifth quintile being the worst performing funds). The Board noted that performance of Class A shares of the Fund was above the performance of the Index for the one year period and below the performance of the Index for the three and five year periods. The Trustees also reviewed more recent Fund performance and this review did not change their conclusions.
| C. | Advisory andSub-Advisory Fees and Fund Expenses |
The Board compared the Fund’s contractual management fee rate to the contractual management fee rates of funds in the Fund’s
29 Invesco Global Real Estate Income Fund
Broadridge expense group. The Board noted that the contractual management fee rate for Class A shares of the Fund was below the median contractual management fee rate of funds in its expense group. The Board noted that the term “contractual management fee” for funds in the expense group may include both advisory and certainnon-portfolio management administrative services fees, but that Broadridge does not provide information on a fund by fund basis as to what is included. The Board also reviewed the methodology used by Broadridge in providing expense group information, which includes using each fund’s contractual management fee schedule (including any applicable breakpoints) as reported in the most recent prospectus or statement of additional information for each fund in the expense group. The Board also considered comparative information regarding the Fund’s total expense ratio and its various components.
The Board noted that Invesco Advisers has contractually agreed to waive fees and/or limit expenses of the Fund for the term disclosed in the Fund’s registration statement in an amount necessary to limit total annual operating expenses to a specified percentage of average daily net assets for each class of the Fund.
The Board also considered the fees charged by Invesco Advisers and the AffiliatedSub-Advisers to other similarly managed client accounts. The Board noted that Invesco Advisers or the AffiliatedSub-Advisers may charge lower fees to large institutional clients. Invesco Advisers reviewed with the Board differences in the scope of services it provides to the Invesco Funds relative to certain other types of client accounts, including management of cash flows as a result of redemptions and purchases, necessary infrastructure such as officers, office space, technology, legal and distribution, oversight of service providers, costs and business risks associated with launching new funds and sponsoring and maintaining the product line, preparation of annual registration statement updates and financial information and compliance with federal and state laws and regulations.
The Board also compared the Fund’s effective advisory fee rate (the advisory fee rate after advisory fee waivers and before other expense limitations/waivers) to the effective advisory fee rates of other similarly managed third-party mutual funds advised orsub-advised by Invesco Advisers and its affiliates, based on asset balances as of December 31, 2018.
The Board also considered the services that may be provided by the AffiliatedSub-Advisers pursuant to thesub-advisory contracts, as well as the fees payable by Invesco Advisers to the AffiliatedSub-Advisers pursuant to thesub-advisory contracts. The Board noted that Invesco Advisers retains overall responsibility for, and provides services to,sub-advised Invesco Funds, including oversight of the AffiliatedSub-Advisers as well as the additional
services described herein other thanday-to-day portfolio management.
| D. | Economies of Scale and Breakpoints |
The Board considered the extent to which there may be economies of scale in the provision of advisory services to the Fund. The Board considered Invesco’s reinvestment in its business, including investments in business infrastructure and cybersecurity. The Board also considered that the Fund benefits from economies of scale through contractual breakpoints in the Fund’s advisory fee schedule, which generally operate to reduce the Fund’s expense ratio as it grows in size. The Board noted that the Fund shares directly in economies of scale through lower fees charged by third party service providers based on the combined size of the Invesco Funds. The Board noted that the Fund may also benefit from economies of scale through initial fee setting, fee waivers and expense reimbursements.
| E. | Profitability and Financial Resources |
The Board reviewed information from Invesco Advisers concerning the costs of the advisory and other services that Invesco Advisers and its affiliates provide to the Fund and the Invesco Funds and the profitability of Invesco Advisers and its affiliates in providing these services. The Board considered the methodology used for calculating profitability and noted the periodic review of such methodology by an independent consultant. The Board noted that Invesco Advisers continues to operate at a net profit from services Invesco Advisers and its affiliates provide to the Invesco Funds and the Fund. The Board did not deem the level of profits realized by Invesco Advisers and its affiliates from providing services to the Fund to be excessive given the nature, extent and quality of the services provided. The Board received information from Invesco Advisers demonstrating that Invesco Advisers and the AffiliatedSub-Advisers are financially sound and have the resources necessary to perform their obligations under the investment advisory agreement andsub-advisory contracts.
| F. | Collateral Benefits to Invesco Advisers and its Affiliates |
The Board considered various other benefits received by Invesco Advisers and its affiliates from the relationship with the Fund, including the fees received for providing administrative, transfer agency and distribution services to the Fund. The Board considered comparative information regarding fees charged for these services, including information provided by Broadridge and other independent sources. The Board considered the performance of Invesco Advisers and its affiliates in providing these services and the organizational structure employed to provide these services. The Board also considered that these services are provided to the Fund pursuant to written contracts that are reviewed and approved on an annual basis by the Board; and that the services are required for the operation of the Fund.
The Board considered the benefits realized by Invesco Advisers and the AffiliatedSub-Advisers
as a result of portfolio brokerage transactions executed through “soft dollar” arrangements. The Board noted that soft dollar arrangements may result in the Fund bearing costs to purchase research that may be used by Invesco Advisers or the AffiliatedSub-Advisers with other clients and may reduce Invesco Advisers’ or the AffiliatedSub-Advisers’ expenses. The Board also considered that it receives periodic reports from Invesco representing that these arrangements are consistent with regulatory requirements. The Board did not deem the soft dollar arrangements to be inappropriate.
The Board considered that the Fund’s uninvested cash and cash collateral from any securities lending arrangements may be invested in money market funds advised by Invesco Advisers pursuant to procedures approved by the Board. The Board considered information regarding the returns of the affiliated money market funds relative to comparable overnight investments, as well as the costs to the Fund of such investments. The Board noted that Invesco Advisers receives advisory fees from these affiliated money market funds attributable to such investments, although Invesco Advisers has contractually agreed to waive through varying periods the advisory fees payable by the Invesco Funds with respect to certain investments in the affiliated money market funds. The waiver is in an amount equal to 100% of the net advisory fee Invesco Advisers receives from the affiliated money market funds with respect to the Fund’s investment in the affiliated money market funds of uninvested cash, but not cash collateral. The Board concluded that the amount of advisory fees received by Invesco Advisers from the Fund’s investment of cash collateral from any securities lending arrangements in the affiliated money market funds is fair and reasonable.
The Board also considered that an affiliated broker may receive commissions for executing certain trades for the Fund. Invesco Advisers and the AffiliatedSub-Advisers may use the affiliated broker to, among other things, control order routing and minimize information leakage, and the Board was advised that such trades are executed in compliance with rules under the federal securities laws and consistent with best execution obligations.
30 Invesco Global Real Estate Income Fund
Tax Information
Form 1099-DIV, Form 1042-S and other year–end tax information provide shareholders with actual calendar year amounts that should be included in their tax returns. Shareholders should consult their tax advisers.
The following distribution information is being provided as required by the Internal Revenue Code or to meet a specific state’s requirement.
The Fund designates the following amounts or, if subsequently determined to be different, the maximum amount allowable for its fiscal year ended August 31, 2019:
| Federal and State Income Tax | |
| Qualified Dividend Income* | 13.19% |
| Corporate Dividends Received Deduction* | 1.89% |
| Qualified Business Income (199A)* | 22.56% |
| U.S. Treasury Obligations* | 0.00% |
| Tax-Exempt Interest Dividends* | 0.00% |
| * | The above percentages are based on ordinary income dividends paid to shareholders during the Fund’s fiscal year. |
| 31 | Invesco Global Real Estate Income Fund |
Distribution Information
Correction notice
The following table sets forth on a per share basis the distribution that was paid in March 2019. Included in the table is a written statement of the sources of the distribution on a generally accepted accounting principles (“GAAP”) basis.
| | | Net Income | Gain from
Sale of Securities | Return of Principal | Total Distribution |
| 03/21/2019 | Class A | $0.0609 | $0.000 | $0.0132 | $0.0741 |
| 03/21/2019 | Class C | $0.0437 | $0.000 | $0.0132 | $0.0569 |
| 03/21/2019 | Class Y | $0.0664 | $0.000 | $0.0132 | $0.0796 |
| 03/21/2019 | Class R5 | $0.0699 | $0.000 | $0.0132 | $0.0831 |
| 03/21/2019 | Class R6 | $0.0720 | $0.000 | $0.0132 | $0.0852 |
Please note that the information in the preceding chart is for financial accounting purposes only. Shareholders should be aware that the tax treatment of distributions likely differs from GAAP treatment. Form 1099-DIV for the calendar year will report distributions for federal income tax purposes. This Notice is sent to comply with certain Securities and Exchange Commission requirements.
| 32 | Invesco Global Real Estate Income Fund |
Trustees and Officers
The address of each trustee and officer is AIM Counselor Series Trust (Invesco Counselor Series Trust) (the “Trust”), 11 Greenway Plaza, Suite 1000, Houston, Texas 77046-1173. The trustees serve for the life of the Trust, subject to their earlier death, incapacitation, resignation, retirement or removal as more specifically provided in the Trust’s organizational documents. Each officer serves for a one year term or until their successors are elected and qualified. Column two below includes length of time served with predecessor entities, if any.
| | | | | | | | |
Name, Year of Birth and Position(s) Held with the Trust | | Trustee and/ or Officer Since | | Principal Occupation(s) During Past 5 Years | | Number of Funds in Fund
Complex
Overseen by
Trustee | | Other Directorship(s) Held by Trustee During Past 5 Years |
| Interested Persons | | | | | | | | |
Martin L. Flanagan1 — 1960 Trustee and Vice Chair | | 2007 | | Executive Director, Chief Executive Officer and President, Invesco Ltd. (ultimate parent of Invesco and a global investment management firm); Trustee and Vice Chair, The Invesco Funds; Vice Chair, Investment Company Institute; and Member of Executive Board, SMU Cox School of Business Formerly: Advisor to the Board, Invesco Advisers, Inc. (formerly known as Invesco Institutional (N.A.), Inc.); Chairman and Chief Executive Officer, Invesco Advisers, Inc. (registered investment adviser); Director, Chairman, Chief Executive Officer and President, Invesco Holding Company (US), Inc. (formerly IVZ Inc.) (holding company), Invesco Group Services, Inc. (service provider) and Invesco North American Holdings, Inc. (holding company); Director, Chief Executive Officer and President, Invesco Holding Company Limited (parent of Invesco and a global investment management firm); Director, Invesco Ltd.; Chairman, Investment Company Institute and President,Co-Chief Executive Officer,Co-President, Chief Operating Officer and Chief Financial Officer, Franklin Resources, Inc. (global investment management organization) | | 229 | | None |
Philip A. Taylor2 — 1954 Trustee | | 2006 | | Vice Chair, Invesco Ltd.; Trustee, The Invesco Funds Formerly: Director, Invesco Canada Ltd. (formerly known as Invesco Trimark Ltd./Invesco Trimark Ltèe) (registered investment adviser and registered transfer agent); Head of the Americas and Senior Managing Director, Invesco Ltd.; Director, Invesco Advisers, Inc. (formerly known as Invesco Institutional (N.A.), Inc.) (registered investment adviser); Director and Chairman, Invesco Investment Services, Inc. (formerly known as Invesco AIM Investment Services, Inc.) (registered transfer agent); Chief Executive Officer, Invesco Corporate Class Inc. (corporate mutual fund company); Chairman and Chief Executive Officer, Invesco Canada Ltd. (formerly known as Invesco Trimark Ltd./Invesco Trimark Ltèe) (registered investment adviser and registered transfer agent); Senior Vice President, The Invesco Funds; Director, Invesco Investment Advisers LLC (formerly known as Van Kampen Asset Management); Director, Chairman, Chief Executive Officer and President, Invesco Management Group, Inc. (formerly known as Invesco AIM Management Group, Inc.) (financial services holding company);Co-Chairman,Co-President andCo-Chief Executive Officer, Invesco Advisers, Inc. (formerly known as Invesco Institutional (N.A.), Inc.) (registered investment adviser); Director, Chief Executive Officer and President, Van Kampen Exchange Corp; President and Principal Executive Officer, The Invesco Funds (other than AIM Treasurer’s Series Trust (Invesco Treasurer’s Series Trust), Short-Term Investments Trust and Invesco Management Trust); Executive Vice President, The Invesco Funds (AIM Treasurer’s Series Trust (Invesco Treasurer’s Series Trust), Short-Term Investments Trust and Invesco Management Trust only); Director and President, INVESCO Funds Group, Inc. (registered investment adviser and registered transfer agent); Director and Chairman, IVZ Distributors, Inc. (formerly known as INVESCO Distributors, Inc.) (registered broker dealer); Director, President and Chairman, Invesco Inc. (holding company), Invesco Canada Holdings Inc. (holding company), Trimark Investments Ltd./Placements Trimark Ltèe and Invesco Financial Services Ltd/Services Financiers Invesco Ltèe; Chief Executive Officer, Invesco Canada Fund Inc. (corporate mutual fund company); Director and Chairman, Van Kampen Investor Services Inc.; Director, Chief Executive Officer and President, 1371 Preferred Inc. (holding company) and Van Kampen Investments Inc.; Director and President, AIM GP Canada Inc. (general partner for limited partnerships) and Van Kampen Advisors, Inc.; Director and Chief Executive Officer, Invesco Trimark Dealer Inc. (registered broker dealer); Director, Invesco Distributors, Inc. (formerly known as Invesco AIM Distributors, Inc.) (registered broker dealer); Manager, Invesco Capital Management LLC; Director, Chief Executive Officer and President, Invesco Advisers, Inc.; Director, Chairman, Chief Executive Officer and President, Invesco AIM Capital Management, Inc.; President, Invesco Trimark Dealer Inc. and Invesco Trimark Ltd./Invesco Trimark Ltèe; Director and President, AIM Trimark Corporate Class Inc. and AIM Trimark Canada Fund Inc.; Senior Managing Director, Invesco Holding Company Limited; Director and Chairman, Fund Management Company (former registered broker dealer); President and Principal Executive Officer, The Invesco Funds (AIM Treasurer’s Series Trust (Invesco Treasurer’s Series Trust), and Short-Term Investments Trust only); President, AIM Trimark Global Fund Inc. and AIM Trimark Canada Fund Inc. | | 229 | | None |
| 1 | Mr. Flanagan is considered an interested person (within the meaning of Section 2(a)(19) of the 1940 Act) of the Trust because he is an officer of the Adviser to the Trust, and an officer and a director of Invesco Ltd., ultimate parent of the Adviser. |
| 2 | Mr. Taylor is considered an interested person (within the meaning of Section 2(a)(19) of the 1940 Act) of the Trust because he is an officer of Invesco Ltd., ultimate parent of the Adviser. |
T-1 Invesco Global Real Estate Income Fund
Trustees and Officers—(continued)
| | | | | | | | |
Name, Year of Birth and Position(s) Held with the Trust | | Trustee and/ or Officer Since | | Principal Occupation(s)
During Past 5 Years | | Number of
Funds in Fund
Complex
Overseen by
Trustee | | Other Directorship(s) Held by Trustee During
Past 5 Years |
| Independent Trustees | | | | | | | | |
Bruce L. Crockett — 1944 Trustee and Chair | | 2003 | | Chairman, Crockett Technologies Associates (technology consulting company) Formerly: Director, Captaris (unified messaging provider); Director, President and Chief Executive Officer, COMSAT Corporation; Chairman, Board of Governors of INTELSAT (international communications company); ACE Limited (insurance company); Independent Directors Council and Investment Company Institute: Member of the Audit Committee, Investment Company Institute; Member of the Executive Committee and Chair of the Governance Committee, Independent Directors Council | | 229 | | Director and Chairman of the Audit Committee, ALPS (Attorneys Liability Protection Society) (insurance company); Director and Member of the Audit Committee and Compensation Committee, Ferroglobe PLC (metallurgical company) |
David C. Arch — 1945 Trustee | | 2010 | | Chairman of Blistex Inc. (consumer health care products manufacturer); Member, World Presidents’ Organization | | 229 | | Board member of the Illinois Manufacturers’ Association |
Beth Ann Brown — 1968 Trustee | | 2019 | | Independent Consultant Formerly: Head of Intermediary Distribution, Managing Director, Strategic Relations, Managing Director, Head of National Accounts, Senior Vice President, National Account Manager and Senior Vice President, Key Account Manager, Columbia Management Investment Advisers LLC; Vice President, Key Account Manager, Liberty Funds Distributor, Inc.; and Trustee of certain Oppenheimer Funds | | 229 | | Director, Board of Directors of Caron Engineering Inc.; Advisor, Board of Advisors of Caron Engineering Inc.; President and Director, Acton Shapleigh Youth Conservation Corps (non -profit); and Vice President and Director of Grahamtastic Connection(non-profit) |
Jack M. Fields — 1952 Trustee | | 2003 | | Chief Executive Officer, Twenty First Century Group, Inc. (government affairs company); and Chairman, Discovery Learning Alliance(non-profit) Formerly: Owner and Chief Executive Officer, Dos Angeles Ranch L.P. (cattle, hunting, corporate entertainment); Director, Insperity, Inc. (formerly known as Administaff) (human resources provider); Chief Executive Officer, Texana Timber LP (sustainable forestry company); Director of Cross Timbers Quail Research Ranch(non-profit); and member of the U.S. House of Representatives | | 229 | | None |
Cynthia Hostetler — 1962 Trustee | | 2017 | | Non-Executive Director and Trustee of a number of public and private business corporations Formerly: Director, Aberdeen Investment Funds (4 portfolios); Head of Investment Funds and Private Equity, Overseas Private Investment Corporation; President, First Manhattan Bancorporation, Inc.; Attorney, Simpson Thacher & Bartlett LLP | | 229 | | Vulcan Materials Company (construction materials company); Trilinc Global Impact Fund; Genesee & Wyoming, Inc. (railroads); Artio Global Investment LLC (mutual fund complex); Edgen Group, Inc. (specialized energy and infrastructure products distributor); Investment Company Institute (professional organization); Independent Directors Council (professional organization) |
Eli Jones — 1961 Trustee | | 2016 | | Professor and Dean, Mays Business School — Texas A&M University Formerly: Professor and Dean, Walton College of Business, University of Arkansas and E.J. Ourso College of Business, Louisiana State University; Director, Arvest Bank | | 229 | | Insperity, Inc. (formerly known as Administaff) (human resources provider) |
Elizabeth Krentzman — 1959 Trustee | | 2019 | | Formerly: Principal and Chief Regulatory Advisor for Asset Management Services and U.S. Mutual Fund Leader of Deloitte & Touche LLP; General Counsel of the Investment Company Institute (trade association); National Director of the Investment Management Regulatory Consulting Practice, Principal, Director and Senior Manager of Deloitte & Touche LLP; Assistant Director of the Division of Investment Management — Office of Disclosure and Investment Adviser Regulation of the U.S. Securities and Exchange Commission and various positions with the Division of Investment Management — Office of Regulatory Policy of the U.S. Securities and Exchange Commission; Associate at Ropes & Gray LLP; Advisory Board Member of the Securities and Exchange Commission Historical Society; and Trustee of certain Oppenheimer Funds | | 229 | | Trustee of the University of Florida National Board Foundation and Audit Committee Member; Member of the Cartica Funds Board of Directors (private investment funds); Member of the University of Florida Law Center Association, Inc. Board of Trustees and Audit Committee Member |
Anthony J. LaCava, Jr. — 1956 Trustee | | 2019 | | Formerly: Director and Member of the Audit Committee, Blue Hills Bank (publicly traded financial institution) and Managing Partner, KPMG LLP | | 229 | | Blue Hills Bank; Chairman, Bentley University; Member, Business School Advisory Council; and Nominating Committee, KPMG LLP |
T-2 Invesco Global Real Estate Income Fund
Trustees and Officers—(continued)
| | | | | | | | |
Name, Year of Birth and Position(s) Held with the Trust | | Trustee and/ or Officer Since | | Principal Occupation(s)
During Past 5 Years | | Number of
Funds in Fund
Complex
Overseen by
Trustee | | Other Directorship(s) Held by Trustee During
Past 5 Years |
| Independent Trustees—(continued) |
Prema Mathai-Davis — 1950 Trustee | | 2003 | | Retired Co-Owner & Partner of Quantalytics Research, LLC, (a FinTech Investment Research Platform for the Self-Directed Investor) | | 229 | | None |
Joel W. Motley — 1952 Trustee | | 2019 | | Director of Office of Finance, Federal Home Loan Bank; Member of the Vestry of Trinity Wall Street; Managing Director of Carmona Motley Inc. (privately held financial advisor); Member of the Finance and Budget Committee of the Council on Foreign Relations, Member of the Investment Committee and Board of Human Rights Watch and Member of the Investment Committee and Board of Historic Hudson Valley(non-profit cultural organization) Formerly: Managing Director of Public Capital Advisors, LLC (privately held financial advisor); Managing Director of Carmona Motley Hoffman, Inc. (privately held financial advisor); Trustee of certain Oppenheimer Funds; and Director of Columbia Equity Financial Corp. (privately held financial advisor) | | 229 | | Director of Greenwall Foundation (bioethics research foundation); Member of Board and Investment Committee of The Greenwall Foundation; Director of Southern Africa Legal Services Foundation; Board Member and Investment Committee Member of Pulitzer Center for Crisis Reporting(non-profit journalism) |
Teresa M. Ressel — 1962 Trustee | | 2017 | | Non-executive director and trustee of a number of public and private business corporations Formerly: Chief Financial Officer, Olayan America, The Olayan Group (international investor/commercial/industrial); Chief Executive Officer, UBS Securities LLC; Group Chief Operating Officer, Americas, UBS AG; Assistant Secretary for Management & Budget and CFO, US Department of the Treasury | | 229 | | Atlantic Power Corporation (power generation company); ON Semiconductor Corp. (semiconductor supplier) |
Ann Barnett Stern — 1957 Trustee | | 2017 | | President and Chief Executive Officer, Houston Endowment Inc. (private philanthropic institution) Formerly: Executive Vice President and General Counsel, Texas Children’s Hospital; Attorney, Beck, Redden and Secrest, LLP; Business Law Instructor, University of St. Thomas; Attorney, Andrews & Kurth LLP | | 229 | | Federal Reserve Bank of Dallas |
Raymond Stickel, Jr. — 1944 Trustee | | 2005 | | Retired Formerly: Director, Mainstay VP Series Funds, Inc. (25 portfolios); Partner, Deloitte & Touche | | 229 | | None |
Robert C. Troccoli — 1949 Trustee | | 2016 | | Retired Formerly: Adjunct Professor, University of Denver — Daniels College of Business; Senior Partner, KPMG LLP | | 229 | | None |
Daniel S. Vandivort — 1954 Trustee | | 2019 | | Treasurer, Chairman of the Audit and Finance Committee, and Trustee, Board of Trustees, Huntington Disease Foundation of America; and President, Flyway Advisory Services LLC (consulting and property management) Formerly: Trustee and Governance Chair, of certain Oppenheimer Funds | | 229 | | Chairman and Lead Independent Director, Chairman of the Audit Committee, and Director, Board of Directors, Value Line Funds |
James D. Vaughn — 1945 Trustee | | 2019 | | Retired Formerly: Managing Partner, Deloitte & Touche LLP; Trustee and Chairman of the Audit Committee, Schroder Funds; Board Member, Mile High United Way, Boys and Girls Clubs, Boy Scouts, Colorado Business Committee for the Arts, Economic Club of Colorado and Metro Denver Network (economic development corporation); and Trustee of certain Oppenheimer Funds | | 229 | | Board member and Chairman of Audit Committee of AMG National Trust Bank; Trustee and Investment Committee member, University of South Dakota Foundation; Board member, Audit Committee Member and past Board Chair, Junior Achievement(non-profit) |
Christopher L. Wilson — 1957 Trustee, Vice Chair and Chair Designate | | 2017 | | Retired Formerly: Director, TD Asset Management USA Inc. (mutual fund complex) (22 portfolios); Managing Partner, CT2, LLC (investing and consulting firm); President/Chief Executive Officer, Columbia Funds, Bank of America Corporation; President/Chief Executive Officer, CDC IXIS Asset Management Services, Inc.; Principal & Director of Operations, Scudder Funds, Scudder, Stevens & Clark, Inc.; Assistant Vice President, Fidelity Investments | | 229 | | ISO New England, Inc.(non-profit organization managing regional electricity market) |
T-3 Invesco Global Real Estate Income Fund
Trustees and Officers—(continued)
| | | | | | | | |
Name, Year of Birth and Position(s) Held with the Trust | | Trustee and/ or Officer Since | | Principal Occupation(s)
During Past 5 Years | | Number of
Funds in Fund
Complex
Overseen by
Trustee | | Other Directorship(s) Held by Trustee During
Past 5 Years |
| Other Officers | | | | | | | | |
Sheri Morris — 1964 President, Principal Executive Officer and Treasurer | | 2003 | | President, Principal Executive Officer and Treasurer, The Invesco Funds; Vice President, Invesco Advisers, Inc. (formerly known as Invesco Institutional (N.A.), Inc.) (registered investment adviser); and Vice President, Invesco Exchange-Traded Fund Trust, Invesco Exchange-Traded Fund Trust II, Invesco India Exchange-Traded Fund Trust, Invesco Actively Managed Exchange-Traded Fund Trust, Invesco Actively Managed Exchange-Traded Commodity Fund Trust and Invesco Exchange-Traded Self-Indexed Fund Trust; and Vice President, OppenheimerFunds, Inc. Formerly: Vice President and Principal Financial Officer, The Invesco Funds; Vice President, Invesco AIM Advisers, Inc., Invesco AIM Capital Management, Inc. and Invesco AIM Private Asset Management, Inc.; Assistant Vice President and Assistant Treasurer, The Invesco Funds and Assistant Vice President, Invesco Advisers, Inc., Invesco AIM Capital Management, Inc. and Invesco AIM Private Asset Management, Inc.; and Treasurer, Invesco Exchange-Traded Fund Trust, Invesco Exchange-Traded Fund Trust II, Invesco India Exchange-Traded Fund Trust and Invesco Actively Managed Exchange-Traded Fund Trust | | N/A | | N/A |
Russell C. Burk — 1958 Senior Vice President and Senior Officer | | 2005 | | Senior Vice President and Senior Officer, The Invesco Funds | | N/A | | N/A |
Jeffrey H. Kupor — 1968 Senior Vice President, Chief Legal Officer and Secretary | | 2018 | | Head of Legal of the Americas, Invesco Ltd.; Senior Vice President and Secretary, Invesco Advisers, Inc. (formerly known as Invesco Institutional (N.A.), Inc.) (registered investment adviser); Senior Vice President and Secretary, Invesco Distributors, Inc. (formerly known as Invesco AIM Distributors, Inc.); Vice President and Secretary, Invesco Investment Services, Inc. (formerly known as Invesco AIM Investment Services, Inc.) Senior Vice President, Chief Legal Officer and Secretary, The Invesco Funds; Secretary and General Counsel, Invesco Investment Advisers LLC (formerly known as Van Kampen Asset Management); Secretary and General Counsel, Invesco Capital Markets, Inc. (formerly known as Van Kampen Funds Inc.) and Chief Legal Officer, Invesco Exchange-Traded Fund Trust, Invesco Exchange-Traded Fund Trust II, Invesco India Exchange-Traded Fund Trust, Invesco Actively Managed Exchange-Traded Fund Trust, Invesco Actively Managed Exchange-Traded Commodity Fund Trust and Invesco Exchange-Traded Self-Indexed Fund Trust; Secretary, Invesco Indexing LLC; Secretary, W.L. Ross & Co., LLC Formerly: Secretary and Vice President, Jemstep, Inc.; Head of Legal, Worldwide Institutional, Invesco Ltd.; Secretary and General Counsel, INVESCO Private Capital Investments, Inc.; Senior Vice President, Secretary and General Counsel, Invesco Management Group, Inc. (formerly known as Invesco AIM Management Group, Inc.); Assistant Secretary, INVESCO Asset Management (Bermuda) Ltd.; Secretary and General Counsel, Invesco Private Capital, Inc.; Assistant Secretary and General Counsel, INVESCO Realty, Inc.; Secretary and General Counsel, Invesco Senior Secured Management, Inc.; and Secretary, Sovereign G./P. Holdings Inc. | | N/A | | N/A |
Andrew R. Schlossberg — 1974 Senior Vice President | | 2019 | | Head of the Americas and Senior Managing Director, Invesco Ltd.; Director and Senior Vice President, Invesco Advisers, Inc. (formerly known as Invesco Institutional (N.A.), Inc.) (registered investment adviser); Director and Chairman, Invesco Investment Services, Inc. (formerly known as Invesco AIM Investment Services, Inc.) (registered transfer agent); Senior Vice President, The Invesco Funds; Director, Invesco Investment Advisers LLC (formerly known as Van Kampen Asset Management); Director, President and Chairman, Invesco Insurance Agency, Inc. Formerly: Director, Invesco UK Limited; Director and Chief Executive, Invesco Asset Management Limited and Invesco Fund Managers Limited; Assistant Vice President, The Invesco Funds; Senior Vice President, Invesco Advisers, Inc. (formerly known as Invesco Institutional (N.A.), Inc.) (registered investment adviser); Director and Chief Executive, Invesco Administration Services Limited and Invesco Global Investment Funds Limited; Director, Invesco Distributors, Inc.; Head of EMEA, Invesco Ltd.; President, Invesco Actively Managed Exchange-Traded Commodity Fund Trust, Invesco Actively Managed Exchange-Traded Fund Trust, Invesco Exchange-Traded Fund Trust, Invesco Exchange-Traded Fund Trust II and Invesco India Exchange-Traded Fund Trust; Managing Director and Principal Executive Officer, Invesco Capital Management LLC | | N/A | | N/A |
T-4 Invesco Global Real Estate Income Fund
Trustees and Officers—(continued)
| | | | | | | | |
Name, Year of Birth and Position(s) Held with the Trust | | Trustee and/ or Officer Since | | Principal Occupation(s)
During Past 5 Years | | Number of
Funds in Fund
Complex
Overseen by
Trustee | | Other Directorship(s) Held by Trustee During
Past 5 Years |
| Other Officers—(continued) | | | | | | | | |
John M. Zerr — 1962
Senior Vice President | | 2006 | | Chief Operating Officer of the Americas; Senior Vice President, Invesco Advisers, Inc. (formerly known as Invesco Institutional (N.A.), Inc.) (registered investment adviser); Senior Vice President, Invesco Distributors, Inc. (formerly known as Invesco AIM Distributors, Inc.); Director and Vice President, Invesco Investment Services, Inc. (formerly known as Invesco AIM Investment Services, Inc.) Senior Vice President, The Invesco Funds; Managing Director, Invesco Capital Management LLC; Director, Invesco Investment Advisers LLC (formerly known as Van Kampen Asset Management); Senior Vice President, Invesco Capital Markets, Inc. (formerly known as Van Kampen Funds Inc.); Manager, Invesco Indexing LLC; Manager, Invesco Specialized Products, LLC; Director and Senior Vice President, Invesco Insurance Agency, Inc.; Member, Invesco Canada Funds Advisory Board; Director, President and Chief Executive Officer, Invesco Corporate Class Inc. (corporate mutual fund company); and Director, Chairman, President and Chief Executive Officer, Invesco Canada Ltd. (formerly known as Invesco Trimark Ltd./Invesco Trimark Ltèe) (registered investment adviser and registered transfer agent) Formerly: Director and Senior Vice President, Invesco Management Group, Inc. (formerly known as Invesco AIM Management Group, Inc.); Secretary and General Counsel, Invesco Management Group, Inc. (formerly known as Invesco AIM Management Group, Inc.); Secretary, Invesco Investment Services, Inc. (formerly known as Invesco AIM Investment Services, Inc.); Chief Legal Officer and Secretary, The Invesco Funds; Secretary and General Counsel, Invesco Investment Advisers LLC (formerly known as Van Kampen Asset Management); Secretary and General Counsel, Invesco Capital Markets, Inc. (formerly known as Van Kampen Funds Inc.); Chief Legal Officer, Invesco Exchange-Traded Fund Trust, Invesco Exchange-Traded Fund Trust II, Invesco India Exchange-Traded Fund Trust, Invesco Actively Managed Exchange-Traded Fund Trust, Invesco Actively Managed Exchange-Traded Commodity Fund Trust and Invesco Exchange-Traded Self-Indexed Fund Trust; Secretary, Invesco Indexing LLC; Director, Secretary, General Counsel and Senior Vice President, Van Kampen Exchange Corp.; Director, Vice President and Secretary, IVZ Distributors, Inc. (formerly known as INVESCO Distributors, Inc.); Director and Vice President, INVESCO Funds Group, Inc.; Director and Vice President, Van Kampen Advisors Inc.; Director, Vice President, Secretary and General Counsel, Van Kampen Investor Services Inc.; Director and Secretary, Invesco Distributors, Inc. (formerly known as Invesco AIM Distributors, Inc.); Director, Senior Vice President, General Counsel and Secretary, Invesco AIM Advisers, Inc. and Van Kampen Investments Inc.; Director, Vice President and Secretary, Fund Management Company; Director, Senior Vice President, Secretary, General Counsel and Vice President, Invesco AIM Capital Management, Inc.; Chief Operating Officer and General Counsel, Liberty Ridge Capital, Inc. (an investment adviser) | | N/A | | N/A |
Gregory G. McGreevey — 1962 Senior Vice President | | 2012 | | Senior Managing Director, Invesco Ltd.; Director, Chairman, President, and Chief Executive Officer, Invesco Advisers, Inc. (formerly known as Invesco Institutional (N.A.), Inc.) (registered investment adviser); Director, Invesco Mortgage Capital, Inc. and Invesco Senior Secured Management, Inc.; and Senior Vice President, The Invesco Funds; and President, SNW Asset Management Corporation Formerly: Senior Vice President, Invesco Management Group, Inc. and Invesco Advisers, Inc.; Assistant Vice President, The Invesco Funds | | N/A | | N/A |
Kelli Gallegos — 1970 Vice President, Principal Financial Officer and Assistant Treasurer | | 2008 | | Assistant Treasurer, Invesco Specialized Products, LLC; Vice President, Principal Financial Officer and Assistant Treasurer, The Invesco Funds; Principal Financial and Accounting Officer — Pooled Investments, Invesco Capital Management LLC; Vice President and Treasurer, Invesco Exchange-Traded Fund Trust, Invesco Exchange-Traded Fund Trust II, Invesco India Exchange-Traded Fund Trust, Invesco Actively Managed Exchange-Traded Fund Trust, Invesco Actively Managed Exchange-Traded Commodity Fund Trust and Invesco Exchange-Traded Self-Indexed Fund Trust Formerly: Assistant Treasurer, Invesco Exchange-Traded Fund Trust, Invesco Exchange-Traded Fund Trust II, Invesco India Exchange-Traded Fund Trust, Invesco Actively Managed Exchange-Traded Fund Trust, Invesco Actively Managed Exchange-Traded Commodity Fund Trust and Invesco Exchange-Traded Self-Indexed Fund Trust; Assistant Treasurer, Invesco Capital Management LLC; Assistant Vice President, The Invesco Funds | | N/A | | N/A |
T-5 Invesco Global Real Estate Income Fund
Trustees and Officers—(continued)
| | | | | | | | |
Name, Year of Birth and Position(s) Held with the Trust | | Trustee and/ or Officer Since | | Principal Occupation(s)
During Past 5 Years | | Number of
Funds in Fund
Complex
Overseen by
Trustee | | Other Directorship(s) Held by Trustee During
Past 5 Years |
| Other Officers—(continued) | | | | | | | | |
Crissie M. Wisdom — 1969 Anti-Money Laundering Compliance Officer | | 2013 | | Anti-Money Laundering Compliance Officer, Invesco Advisers, Inc. (formerly known as Invesco Institutional (N.A.), Inc.) (registered investment adviser), Invesco Capital Markets, Inc. (formerly known as Van Kampen Funds Inc.), Invesco Distributors, Inc., Invesco Investment Services, Inc., The Invesco Funds, and Invesco Exchange-Traded Fund Trust, Invesco Exchange-Traded Fund Trust II, Invesco India Exchange-Traded Fund Trust, Invesco Actively Managed Exchange-Traded Fund Trust, Invesco Actively Managed Exchange-Traded Commodity Fund Trust and Invesco Exchange-Traded Self-Indexed Fund Trust; Anti-Money Laundering Compliance Officer and Bank Secrecy Act Officer, INVESCO National Trust Company and Invesco Trust Company; and Fraud Prevention Manager and Controls and Risk Analysis Manager for Invesco Investment Services, Inc. Formerly: Anti-Money Laundering Compliance Officer, Van Kampen Exchange Corp. and Invesco Management Group, Inc. | | N/A | | N/A |
Robert R. Leveille — 1969 Chief Compliance Officer | | 2016 | | Chief Compliance Officer, Invesco Advisers, Inc. (registered investment adviser); and Chief Compliance Officer, The Invesco Funds Formerly: Chief Compliance Officer, Putnam Investments and the Putnam Funds | | N/A | | N/A |
The Statement of Additional Information of the Trust includes additional information about the Fund’s Trustees and is available upon request, without charge, by calling 1.800.959.4246. Please refer to the Fund’s Statement of Additional Information for information on the Fund’ssub-advisers.
| | | | | | |
Office of the Fund 11 Greenway Plaza, Suite 1000
Houston, TX 77046-1173 | | Investment Adviser Invesco Advisers, Inc.
1555 Peachtree Street, N.E.
Atlanta, GA 30309 | | Distributor Invesco Distributors, Inc.
11 Greenway Plaza, Suite 1000
Houston, TX 77046-1173 | | Auditors PricewaterhouseCoopers LLP
1000 Louisiana Street, Suite 5800 Houston, TX 77002-5021 |
| | | |
| | | | | | |
Counsel to the Fund Stradley Ronon Stevens & Young, LLP
2005 Market Street, Suite 2600
Philadelphia, PA 19103-7018 | | Counsel to the Independent Trustees Goodwin Procter LLP
901 New York Avenue, N.W.
Washington, D.C. 20001 | | Transfer Agent Invesco Investment Services, Inc.
11 Greenway Plaza, Suite 1000
Houston, TX 77046-1173 | | Custodian State Street Bank and Trust Company
225 Franklin Street
Boston, MA 02110-2801 |
T-6 Invesco Global Real Estate Income Fund
Go paperless with eDelivery
Visit invesco.com/edelivery to enjoy the convenience and security of anytime electronic access to your investment documents.
With eDelivery, you can elect to have any or all of the following materials delivered straight to your inbox to download, save and print from your own computer:
| • | Fund reports and prospectuses |
| • | Quarterly statements |
| • | Daily confirmations |
| • | Tax forms |
Invesco mailing information
Send general correspondence to Invesco Investment Services, Inc., P.O. Box 219078, Kansas City, MO 64121-9078.
Important notice regarding delivery of security holder documents
To reduce Fund expenses, only one copy of most shareholder documents may be mailed to shareholders with multiple accounts at the same address (Householding). Mailing of your shareholder documents may be householded indefinitely unless you instruct us otherwise. If you do not want the mailing of these documents to be combined with those for other members of your household, please contact Invesco Investment Services, Inc. at 800 959 4246 or contact your financial institution. We will begin sending you individual copies for each account within 30 days after receiving your request.
Fund holdings and proxy voting information
The Fund provides a complete list of its holdings four times in each fiscal year, at the quarter-ends. For the second and fourth quarters, the list appears in the Fund’s semiannual and annual reports to shareholders. For the first and third quarters, the Fund files the lists with the Securities and Exchange Commission (SEC) as an exhibit to its reports on Form N-PORT. The most recent list of portfolio holdings is available at invesco.com/completeqtrholdings. Shareholders can also look up the Fund’s Form N-PORT filings on the SEC website, sec.gov. The SEC file numbers for the Fund are shown below.
A description of the policies and procedures that the Fund uses to determine how to vote proxies relating to portfolio securities is available without charge, upon request, from our Client Services department at 800 959 4246, or at invesco.com/proxyguidelines. The information is also available on the SEC website, sec.gov.
Information regarding how the Fund voted proxies related to its portfolio securities during the most recent 12-month period ended June 30 is available at invesco.com/proxysearch. This information is also available on the SEC website, sec.gov.
Invesco Advisers, Inc. is an investment adviser; it provides investment advisory services to individual and institutional clients and does not sell securities. Invesco Distributors, Inc. is the US distributor for Invesco Ltd.’s retail mutual funds, exchange-traded funds and institutional money market funds. Both are wholly owned, indirect subsidiaries of Invesco Ltd.
| SEC file numbers: 811-09913 and 333-36074 | Invesco Distributors, Inc. | GREI-AR-1 |
| Annual Report to Shareholders | August 31, 2019 |
Invesco Growth and Income Fund
Nasdaq:
A: ACGIX ■ C: ACGKX ■ R: ACGLX ■ Y: ACGMX ■ R5: ACGQX ■ R6: GIFFX

Beginning on January 1, 2021, as permitted by regulations adopted by the Securities and Exchange Commission, paper copies of the Fund’s shareholder reports will no longer be sent by mail, unless you specifically request paper copies of the reports from the Fund or from your financial intermediary, such as a broker-dealer or bank. Instead, the reports will be made available on the Fund’s website, and you will be notified by mail each time a report is posted and provided with a website link to access the report.
If you already elected to receive shareholder reports electronically, you will not be affected by this change and you need not take any action. You may elect to receive shareholder reports and other communications from the Fund electronically by contacting your financial intermediary (such as a broker-dealer or bank) or, if you are a direct investor, by enrolling at invesco.com/edelivery.
You may elect to receive all future reports in paper free of charge. If you invest through a financial intermediary, you can contact your financial intermediary to request that you continue to receive paper copies of your shareholder reports. If you invest directly with the Fund, you can call (800) 959-4246 to let the Fund know you wish to continue receiving paper copies of your shareholder reports. Your election to receive reports in paper will apply to all funds held with your financial intermediary or all funds held with the fund complex if you invest directly with the Fund.
Dear Shareholders:
This annual report includes information about your Fund, including performance data and a complete list of its investments as of the close of the reporting period. Inside is a discussion of how your Fund was managed and the factors that affected its performance during the reporting period.
Throughout the reporting period, global equity markets remained volatile. Investor sentiment ranged from elation to fear. The reporting period began with several US equity indexes redefining new highs. The exuberance, however, ended in October 2018 as global equities, in particular US stocks, sold off, with the sharpest decline in December. The catalyst for the sell-off was a combination of ongoing trade concerns between the US and China, fears of a global economic slowdown and lower oil prices from a supply glut. Gains posted earlier in 2018 for global equities were erased, while US Treasury bonds, along with government and municipal bonds, rallied as investors fled to “safe haven” assets.
At the start of 2019, global equity markets rebounded strongly buoyed by more dovish central banks and optimism about a potential US-China trade deal. In May, US-China trade concerns and slowing global growth led to a global equity sell-off and rally in U.S. Treasuries. Despite the May sell-off, domestic equity markets rallied in June in anticipation of a U.S. Federal Reserve (the Fed) rate cut and closed the second quarter with modest gains. As the reporting period ended in August, market volatility once again increased as the US Treasury yield curve inverted several times magnifying concerns that the US economy could be headed into a recession.
During the reporting period, the Fed both raised and lowered the federal funds rate. Given signs of a strong economy, the Fed raised rates two times: in September and December 2018. In 2019, however, the Fed altered its outlook on further rate hikes leaving rates unchanged for the first half of the year. In July, the Fed lowered interest rates for the first time in 11 years. As 2019 unfolds, we’ll see how the interplay of interest rates, economic data, geopolitics and a host of other factors affect US and overseas equity and fixed income markets.
Investor uncertainty and market volatility, such as we witnessed during the reporting period, are unfortunate facts of life when it comes to investing. That’s why Invesco encourages investors to work with a professional financial adviser who can stress the importance of starting to save and invest early and the importance of adhering to a disciplined investment plan. A financial adviser who knows your unique financial situation, investment goals and risk tolerance can be an invaluable partner as you seek to achieve your financial goals. He or she can offer a long-term perspective when markets are volatile and time-tested advice and guidance when your financial situation or investment goals change.
Visit our website for more information on your investments
Our website, invesco.com/us, offers a wide range of market insights and investment perspectives. On the website, you’ll find detailed information about our funds, including performance, holdings and portfolio manager commentaries. You can access information about your account by completing a simple, secure online registration. To do so, select “Log In” on the right side of the homepage, and then select “Register for Individual Account Access.”
In addition to the resources accessible on our website and through our mobile app, you can obtain timely updates to help you stay informed about the markets and the economy by connecting with Invesco on Twitter, LinkedIn or Facebook. You can access our blog at blog.invesco.us.com. Our goal is to provide you the information you want, when and where you want it.
Finally, I’m pleased to share with you Invesco’s commitment to both the Principles for Responsible Investment and to considering environmental, social and governance issues in our robust investment process. I invite you to learn more at invesco.com/esg.
Have questions?
For questions about your account, contact an Invesco client services representative at 800 959 4246.
All of us at Invesco look forward to serving your investment management needs. Thank you for investing with us.
Sincerely,
Andrew Schlossberg
Head of the Americas,
Senior Managing Director, Invesco Ltd.
| 2 | Invesco Growth and Income Fund |
Dear Shareholders:
Among the many important lessons I’ve learned in more than 40 years in a variety of business endeavors is the value of a trusted advocate.
As independent chair of the Invesco Funds Board, I can assure you that the members of the Board are strong advocates for the interests of investors in Invesco’s mutual funds. We work hard to represent your interests through oversight of the quality of the investment management services your funds receive and other matters important to your investment, including but not limited to:
| ■ | Ensuring that Invesco offers a diverse lineup of mutual funds that your financial adviser can use to strive to meet your financial needs as your investment goals change over time. |
| ■ | Monitoring how the portfolio management teams of the Invesco funds are performing in light of changing economic and market conditions. |
| ■ | Assessing each portfolio management team’s investment performance within the context of the investment strategy described in the fund’s prospectus. |
| ■ | Monitoring for potential conflicts of interests that may impact the nature of the services that your funds receive. |
We believe one of the most important services we provide our fund shareholders is the annual review of the funds’ advisory and sub-advisory contracts with Invesco Advisers and its affiliates. This review is required by the Investment Company Act of 1940 and focuses on the nature and quality of the services Invesco provides as the adviser to the Invesco funds and the reasonableness of the fees that it charges for those services. Each year, we spend months carefully reviewing information received from Invesco and a variety of independent sources, such as performance and fee data prepared by Lipper, Inc. (a subsidiary of Broadridge Financial Solutions, Inc.), an independent, third-party firm widely recognized as a leader in its field. We also meet with our independent legal counsel and other independent advisers to review and help us assess the information that we have received. Our goal is to assure that you receive quality investment management services for a reasonable fee.
I trust the measures outlined above provide assurance that you have a worthy advocate when it comes to choosing the Invesco Funds.
As always, please contact me at bruce@brucecrockett.com with any questions or concerns you may have. On behalf of the Board, we look forward to continuing to represent your interests and serving your needs.
Sincerely,
Bruce L. Crockett
Independent Chair
Invesco Funds Board of Trustees
| 3 | Invesco Growth and Income Fund |
Management’s Discussion of Fund Performance
Performance summary
For the fiscal year ended August 31, 2019, Class A shares of Invesco Growth and Income Fund (the Fund), at net asset value (NAV), underperformed the Russell 1000 Value Index, the Fund’s style-specific benchmark.
Your Fund’s long-term performance appears later in this report.
Fund vs. Indexes
Total returns, August 31, 2018 to August 31, 2019, at net asset value (NAV). Performance shown does not include applicable contingent deferred sales charges (CDSC) or front-end sales charges, which would have reduced performance.
| Class A Shares | –4.99% |
| Class C Shares | –5.67 |
| Class R Shares | –5.27 |
| Class Y Shares | –4.78 |
| Class R5 Shares | –4.70 |
| Class R6 Shares | –4.64 |
| S&P 500 Index▼ (Broad Market Index) | 2.92 |
| Russell 1000 Value Index▼ (Style-Specific Index) | 0.62 |
Lipper Large-Cap Value Funds Index■
(Peer Group Index) | –0.22 |
| Source(s):▼RIMES Technologies Corp.;■ Lipper Inc. |
Market conditions and your Fund
The fiscal year proved to be an increasingly volatile time for US equities. After a relatively quiet summer, market volatility noticeably rose in October 2018, as US equity markets suffered a sharp sell-off through year-end 2018, amid ongoing trade concerns between the US and China, fears of a global economic slowdown and lower oil prices from a supply glut, with oil prices plummeting from near $75 per barrel in early October 2018 to around $45 per barrel in late December 2018.1 In this environment, there was a flight to safety, as investors fled to defensive areas of the markets, such as health care, utilities and US Treasuries.
Given signs of a strong economy, the US Federal Reserve (the Fed) raised interest rates two times during the fiscal year: in September and December 2018.2 In contrast, the European Central
Bank and central banks in several other countries maintained extraordinarily accommodative monetary policies.
Following a sharp sell-off during the fourth quarter of 2018, equity markets rebounded in the first quarter of 2019, fueled by optimism about a potential US-China trade deal and the Fed’s indication that there would be no interest rate hikes in 2019, a surprising shift in monetary policy. The Fed’s more accommodative stance provided a supportive environment for equities and fixed income, even as US economic data were mixed and overseas growth appeared to be slowing. Against this backdrop, the S&P 500 Index posted its best first quarter returns since 1998.
Although the S&P 500 Index posted modest gains for the second quarter of 2019, the US stock market experienced increased volatility. After four consecutive months of rising stock markets, the market sold off in May 2019, along with
bond yields and oil prices, as investors weighed the impact of the lingering trade war between the US and China, as well as potential tariffs imposed on Mexico. In addition, economic data showed a slowing domestic and global economy. During the July 2019 meeting, the Fed lowered rates by 25 basis points. (A basis point is one one-hundredth of a percentage point.) This was the first time the Fed lowered rates in more than a decade.2
Market volatility increased in August 2019, as the US Treasury yield curve inverted several times, causing jitters for investors who were concerned that a US recession would be imminent. As a result, much of August saw a “risk off” sentiment, with investors crowding into perceived “safe haven” asset classes, such as US Treasuries and gold. However, a more dovish tone from the Fed provided some support to risk assets. With rising volatility in the markets, the S&P 500 Index posted a modestly positive return for the fiscal year.
During the year, cyclical sectors in the Fund underperformed the Russell 1000 Value Index, with the energy and materials sectors posting double-digit losses. Conversely, the utilities, consumer staples, communication services and real estate sectors posted double-digit gains.
Stock selection in and overweight exposure to the energy sector was the primary detractor from the Fund’s performance versus the Russell 1000 Value Index for the fiscal year. Crude oil prices were volatile during the fiscal year, reaching multiyear highs in October, declining sharply by the end of December, somewhat recovering again in early 2019 and falling again during the summer. Energy stocks mirrored this volatility and a number of the Fund’s largest detractors were in this sector, includingDevon Energy,Schlumberger and
| Portfolio Composition |
| By sector % of total net assets |
| Financials | 24.04% |
| Health Care | 16.56 |
| Information Technology | 10.23 |
| Energy | 10.02 |
| Consumer Discretionary | 7.98 |
| Consumer Staples | 7.69 |
| Industrials | 6.96 |
| Communication Services | 5.15 |
| Materials | 3.51 |
| Other Sectors, Each Less than 2% of Net Assets | 1.72 |
| Money Market Funds Plus Other Assets Less Liabilities | 6.14 |
| Top 10 Equity Holdings* |
| % of total net assets |
| 1. | American International Group, Inc. | 3.24% |
| 2. | Johnson & Johnson | 3.12 |
| 3. | Bank of America Corp. | 3.08 |
| 4. | Philip Morris International, Inc. | 2.78 |
| 5. | General Motors Co. | 2.73 |
| 6. | Citigroup, Inc. | 2.68 |
| 7. | Mondelez International, Inc., Class A | 2.54 |
| 8. | Morgan Stanley | 2.45 |
| 9. | Oracle Corp. | 2.42 |
| 10. | General Dynamics Corp. | 2.36 |
| Total Net Assets | $6.7 billion |
| Total Number of Holdings* | 62 |
| The Fund’s holdings are subject to change, and there is no assurance that the Fund will continue to hold any particular security. |
| *Excluding money market fund holdings. |
| Data presented here are as of August 31, 2019. |
| 4 | Invesco Growth and Income Fund |
Marathon Oil. Another key individual detractor from the Fund’s performance relative to the Russell 1000 Value Index wasOccidental Petroleum. The company engaged in a bidding war with Chevron to acquire Anadarko Petroleum. Although the company’s bid succeeded, many investors believed it overpaid for the acquisition. We sold our position in Occidental Petroleum during the fiscal year.
Security selection in the consumer discretionary sector also detracted from the Fund’s performance relative to the Russell 1000 Value Index during the fiscal year.Capri Holdings andCarnival were top detractors within the sector. Capri Holdings is a global luxury fashion company and owner of the Michael Kors brand, which suffered from declining sales during the fiscal year. Capri Holdings reduced its outlook for the Michael Kors brand in 2020. However, the company’s Jimmy Choo and Versace brands have shown improvement, causing Capri Holding to focus more on accessories, which we believe should help boost its profit margins. Shares of the cruise line operator Carnival declined in June after the company reported a profit decline and weaker outlook for the remainder of 2019.
During the fiscal year, financial holdings were negatively impacted by the flattening yield curve and subsequent concerns over possible a recession due to a slowing economy. Within the financials sector,State Street,Wells Fargo,Citigroup andBank of America were key detractors from the Fund’s performance versus the Russell 1000 Value Index. Much of sector’s underperformance occurred in the fourth quarter of 2018, and many stocks recovered in early 2019. As a result, we sold our position in State Street and trimmed a number of our other large positions before the close of the fiscal year, taking profits into strength. The Fund remained overweight within the financials sector, but exposure was reduced compared to the last fiscal year-end.
The Fund’s material underweight exposure to the the utilities and real estate sectors also detracted from its performance relative to the Russell 1000 Value Index for the fiscal year. The Fund maintained underweight exposure in these sectors, as we believe valuations and fundamentals are unattractive.
Stock selection in and an underweight allocation to the industrials sector was the largest contributor to the Fund’s performance relative to the Russell 1000
Value Index for the fiscal year. Within the sector,Ingersoll Rand andJohnson Controlswere key contributors. The Fund’s lack of exposure to General Electric was also a large contributor to the Fund’s relative performance, as the stock performed poorly for the fiscal year.
During the fiscal year, stock selection in the health care sector also contributed to the Fund’s performance versus the Russell 1000 Value Index. Pharmaceutical holdingsNovartis andMerck were significant contributors to relative results. Merck’s shares rose during the fiscal year, reaching a near all-time high as strong sales and profit growth boosted the stock. Based on this strong performance, we sold our position in Merck during the fiscal year.
The Fund used currency forward contracts for the purpose of hedging currency exposure of non-US-based companies held in the Fund during the fiscal year. These derivatives were not for speculative purposes or leverage, and these positions had a positive impact on the Fund’s relative performance for the fiscal year.
During the fiscal year, we reduced the Fund’s exposure to the financials and energy sectors, and increased the Fund’s exposure to the consumer staples, communication services and consumer discretionary sectors. At the end of the fiscal year, the Fund’s largest overweight exposures relative to the Russell 1000 Value Index were to the information technology, health care and consumer discretionary sectors, while the largest underweight exposures were to the real estate, utilities and communication services sectors.
As always, we thank you for your investment in Invesco Growth and Income Fund and for sharing our long-term investment horizon.
| 2 | Source: US Federal Reserve |
The views and opinions expressed in management’s discussion of Fund performance are those of Invesco Advisers, Inc. These views and opinions are subject to change at any time based on factors such as market and economic conditions. These views and opinions may not be relied upon as investment advice or recommendations, or as an offer for a particular security. The information is not a complete analysis of every aspect of any market, country, industry, security or the Fund. Statements of fact are from sources considered reliable, but Invesco Advisers, Inc. makes no representation or warranty as to their completeness or accuracy. Although historical performance is no guarantee of future results, these insights may help you understand our investment management philosophy.
See important Fund and, if applicable, index disclosures later in this report.
Thomas Bastian
Chartered Financial Analyst, Portfolio Manager, is co-lead manager of Invesco Growth and Income. He joined Invesco in 2010. Mr. Bastian earned a BA in accounting from St. John’s University and an MBA in finance from the University of Michigan.
Brian Jurkash
Portfolio Manager, is co-lead manager of Invesco Growth and Income. He joined Invesco in 2000. Mr. Jurkash earned a BBA degree in finance from Stephen F. Austin State University and an MBA in finance from the University of Houston.
Matthew Titus
Chartered Financial Analyst, Portfolio Manager, is co-lead manager of Invesco Growth and Income. He joined Invesco in 2016. Mr. Titus earned a bachelor’s degree in accounting and economics from Luther College in Decorah, Iowa, and an MBA from Ohio State University.
Sergio Marcheli
Portfolio Manager, is manager of Invesco Growth and Income Fund. He joined Invesco in 2010. Mr. Marcheli earned a BBA from the University of Houston and an MBA from the University of St. Thomas.
| 5 | Invesco Growth and Income Fund |
Your Fund’s Long-Term Performance
Results of a $10,000 Investment — Oldest Share Class(es)
Fund and index data from 8/31/09
| 1 | Source: RIMES Technologies Corp. |
| 2 | Source: Lipper Inc. |
Past performance cannot guarantee comparable future results.
The data shown in the chart include reinvested distributions, applicable sales charges and Fund expenses including
management fees. Index results include reinvested dividends, but they do not reflect sales charges. Performance of the peer group, if applicable, reflects fund expenses and management fees; perfor-
mance of a market index does not. Performance shown in the chart and table(s) does not reflect deduction of taxes a shareholder would pay on Fund distributions or sale of Fund shares.
| 6 | Invesco Growth and Income Fund |
| Average Annual Total Returns |
| As of 8/31/19, including maximum applicable sales charges |
| Class A Shares | |
| Inception (8/1/46) | 9.29% |
| 10 Years | 9.56 |
| 5 Years | 4.30 |
| 1 Year | –10.21 |
| Class C Shares | |
| Inception (8/2/93) | 9.04% |
| 10 Years | 9.37 |
| 5 Years | 4.73 |
| 1 Year | –6.50 |
| Class R Shares | |
| Inception (10/1/02) | 8.34% |
| 10 Years | 9.90 |
| 5 Years | 5.23 |
| 1 Year | –5.27 |
| Class Y Shares | |
| Inception (10/19/04) | 7.81% |
| 10 Years | 10.45 |
| 5 Years | 5.76 |
| 1 Year | –4.78 |
| Class R5 Shares | |
| 10 Years | 10.54% |
| 5 Years | 5.85 |
| 1 Year | –4.70 |
| Class R6 Shares | |
| 10 Years | 10.50% |
| 5 Years | 5.95 |
| 1 Year | –4.64 |
Effective June 1, 2010, Class A, Class C, Class R and Class I shares of the predecessor fund, Van Kampen Growth and Income Fund, advised by Van Kampen Asset Management were reorganized into Class A, Class C, Class R and Class Y shares, respectively, of Invesco Van Kampen Growth and Income Fund (renamed Invesco Growth and Income Fund). Returns shown above, prior to June 1, 2010, for Class A, Class C, Class R and Class Y shares are blended returns of the predecessor fund and Invesco Growth and Income Fund. Share class returns will differ from the predecessor fund because of different expenses.
Class R5 shares incepted on June 1, 2010. Performance shown prior to that date is that of the predecessor fund’s Class A shares and includes the 12b-1 fees applicable to Class A shares.
Class R6 shares incepted on September 24, 2012. Performance shown prior to that date is that of the Fund’s and the predecessor fund’s Class A
| Average Annual Total Returns |
| As of 6/30/19, the most recent calendar quarter end, including maximum applicable sales charges |
| Class A Shares | |
| Inception (8/1/46) | 9.36% |
| 10 Years | 11.42 |
| 5 Years | 5.42 |
| 1 Year | –3.50 |
| Class C Shares | |
| Inception (8/2/93) | 9.24% |
| 10 Years | 11.23 |
| 5 Years | 5.84 |
| 1 Year | 0.46 |
| Class R Shares | |
| Inception (10/1/02) | 8.64% |
| 10 Years | 11.78 |
| 5 Years | 6.36 |
| 1 Year | 1.87 |
| Class Y Shares | |
| Inception (10/19/04) | 8.13% |
| 10 Years | 12.33 |
| 5 Years | 6.89 |
| 1 Year | 2.34 |
| Class R5 Shares | |
| 10 Years | 12.42% |
| 5 Years | 6.98 |
| 1 Year | 2.46 |
| Class R6 Shares | |
| 10 Years | 12.38% |
| 5 Years | 7.08 |
| 1 Year | 2.52 |
shares and includes the 12b-1 fees applicable to Class A shares.
The performance data quoted represent past performance and cannot guarantee comparable future results; current performance may be lower or higher. Please visit invesco.com/performance for the most recent month-end performance. Performance figures reflect reinvested distributions, changes in net asset value and the effect of the maximum sales charge unless otherwise stated. Investment return and principal value will fluctuate so that you may have a gain or loss when you sell shares.
The total annual Fund operating expense ratio set forth in the most recent Fund prospectus as of the date of this report for Class A, Class C, Class R, Class Y, Class R5 and Class R6 shares was 0.80%, 1.53%, 1.05%, 0.55%, 0.48% and 0.38%, respectively. The expense ratios presented above may vary from the expense ratios presented in other sections of this report that are based
on expenses incurred during the period covered by this report.
Class A share performance reflects the maximum 5.50% sales charge, and Class C share performance reflects the applicable contingent deferred sales charge (CDSC) for the period involved. The CDSC on Class C shares is 1% for the first year after purchase. Class R, Class Y, Class R5 and Class R6 shares do not have a front-end sales charge or a CDSC; therefore, performance is at net asset value.
The performance of the Fund’s share classes will differ primarily due to different sales charge structures and class expenses.
Fund performance reflects any applicable fee waivers and/or expense reimbursements. Had the adviser not waived fees and/or reimbursed expenses currently or in the past, returns would have been lower. See current prospectus for more information.
| 7 | Invesco Growth and Income Fund |
Supplemental Information
Invesco Growth and Income Fund’s investment objective is total return through growth of capital and current income.
| ■ | Unless otherwise stated, information presented in this report is as of August 31, 2019, and is based on total net assets. |
| ■ | Unless otherwise noted, all data provided by Invesco. |
| ■ | To access your Fund’s reports/prospectus, visit invesco.com/fundreports. |
About share classes
| ■ | Class R shares are generally available only to employer sponsored retirement and benefit plans. Please see the prospectus for more information. |
| ■ | Class Y shares are available only to certain investors. Please see the prospectus for more information. |
| ■ | Class R5 shares andClass R6 shares are available for use by retirement plans that meet certain standards and for institutional investors. Class R6 shares are also available through intermediaries that have established an agreement with Invesco Distributors, Inc. to make such shares available for use in retail omnibus accounts. Please see the prospectus for more information. |
Principal risks of investing in the Fund
| ■ | Convertible securities risk.The market values of convertible securities are affected by market interest rates, the risk of actual issuer default on interest or principal payments and the value of the underlying common stock into which the convertible security may be converted. Additionally, a convertible security is subject to the same types of market and issuer risks as apply to the underlying common stock. In addition, certain convertible securities are subject to involuntary conversions and may undergo principal write-downs upon the occurrence of certain triggering events, and, as a result, are subject to an increased risk of loss. Convertible securities may be rated below investment grade. |
| ■ | Depositary receipts risk.Investing in depositary receipts involves the same risks as direct investments in foreign securities. In addition, the underlying issuers of certain depositary receipts are under no obligation to distribute shareholder communications or pass through any voting rights with respect |
| | to the deposited securities to the holders of such receipts. The Fund may therefore receive less timely information or have less control than if it invested directly in the foreign issuer. |
| ■ | Derivatives risk.The value of a derivative instrument depends largely on (and is derived from) the value of an underlying security, currency, commodity, interest rate, index or other asset (each referred to as an underlying asset). In addition to risks relating to the underlying assets, the use of derivatives may include other, possibly greater, risks, including counterparty, leverage and liquidity risks. Counterparty risk is the risk that the counterparty to the derivative contract will default on its obligation to pay the Fund the amount owed or otherwise perform under the derivative contract. Derivatives create leverage risk because they do not require payment up front equal to the economic exposure created by holding a position in the derivative. As a result, an adverse change in the value of the underlying asset could result in the Fund sustaining a loss that is substantially greater than the amount invested in the derivative or the anticipated value of the underlying asset, which may make the Fund’s returns more volatile and increase the risk of loss. Derivative instruments may also be less liquid than more traditional investments and the Fund may be unable to sell or close out its derivative positions at a desirable time or price. This risk may be more acute under adverse market conditions, during which the Fund may be most in need of liquidating its derivative positions. Derivatives may also be harder to value, less tax efficient and subject to changing government regulation that could impact the Fund’s ability to use certain derivatives or their cost. Derivatives strategies may not always |
| | be successful. For example, derivatives used for hedging or to gain or limit exposure to a particular market segment may not provide the expected benefits, particularly during adverse market conditions. |
| ■ | Foreign securities risk.The Fund’s foreign investments may be adversely affected by political and social instability, changes in economic or taxation policies, difficulty in enforcing obligations, decreased liquidity or increased volatility. Foreign investments also involve the risk of the possible seizure, nationalization or expropriation of the issuer or foreign deposits (in which the Fund could lose its entire investments in a certain market) and the possible adoption of foreign governmental restrictions such as exchange controls. Unless the Fund has hedged its foreign securities risk, foreign securities risk also involves the risk of negative foreign currency rate fluctuations, which may cause the value of securities denominated in such foreign currency (or other instruments through which the Fund has exposure to foreign currencies) to decline in value. Currency exchange rates may fluctuate significantly over short periods of time. Currency hedging strategies, if used, are not always successful. |
| ■ | Management risk.The Fund is actively managed and depends heavily on the Adviser’s judgment about markets, interest rates or the attractiveness, relative values, liquidity, or potential appreciation of particular investments made for the Fund’s portfolio. The Fund could experience losses if these judgments prove to be incorrect. Additionally, legislative, regulatory, or tax developments may adversely affect management of the Fund and, therefore, the ability of the Fund to achieve its investment objective. |
| ■ | Market risk.The market values of the Fund’s investments, and therefore the |
This report must be accompanied or preceded by a currently effective Fund prospectus, which contains more complete information, including sales charges and expenses. Investors should read it carefully before investing.
NOT FDIC INSURED | MAY LOSE VALUE | NO BANK GUARANTEE
| 8 | Invesco Growth and Income Fund |
| | value of the Fund’s shares, will go up and down, sometimes rapidly or unpredictably. Market risk may affect a single issuer, industry or section of the economy, or it may affect the market as a whole. Individual stock prices tend to go up and down more dramatically than those of certain other types of investments, such as bonds. During a general downturn in the financial markets, multiple asset classes may decline in value. When markets perform well, there can be no assurance that specific investments held by the Fund will rise in value. |
| ■ | REIT risk/real estate risk.Investments in real estate related instruments may be affected by economic, legal, cultural, environmental or technological factors that affect property values, rents or occupancies of real estate related to the Fund’s holdings. Shares of real estate related companies, which tend to be small- and mid-cap companies, may be more volatile and less liquid. |
| ■ | Sector focus risk.The Fund may from time to time invest a significant amount of its assets (i.e. over 25%) in one market sector or group of related industries. In this event, the Fund’s performance will depend to a greater extent on the overall condition of the sector or group of industries and there is increased risk that the Fund will lose significant value if conditions adversely affect that sector or group of industries. |
| ■ | Small- and mid-capitalization companies risks.Small- and mid-capitalization companies tend to be more vulnerable to changing market conditions, may have little or no operating history or track record of success, and may have more limited product lines and markets, less experienced management and fewer financial resources than larger companies. These companies’ securities may be more volatile and less liquid than those of more established companies, and their returns may vary, sometimes significantly, from the overall securities market. |
| ■ | Value investing style risk.A value investing style subjects the Fund to the risk that the valuations never improve or that the returns on value equity securities are less than returns on other styles of investing or the overall stock market. |
About indexes used in this report
| ■ | TheS&P 500® Index is an unmanaged index considered representative of the US stock market. |
| ■ | TheRussell 1000® Value Index is an unmanaged index considered representative of large-cap value stocks. The Russell 1000 Value Index is a trademark/service mark of the Frank Russell Co. Russell® is a trademark of the Frank Russell Co. |
| ■ | TheLipper Large-Cap Value Funds Index is an unmanaged index considered representative of large-cap value funds tracked by Lipper. |
| ■ | The Fund is not managed to track the performance of any particular index, including the index(es) described here, and consequently, the performance of the Fund may deviate significantly from the performance of the index(es). |
| ■ | A direct investment cannot be made in an index. Unless otherwise indicated, index results include reinvested dividends, and they do not reflect sales charges. Performance of the peer group, if applicable, reflects fund expenses; performance of a market index does not. |
Other information
| ■ | The returns shown in management’s discussion of Fund performance are based on net asset values (NAVs) calculated for shareholder transactions. Generally accepted accounting principles require adjustments to be made to the net assets of the Fund at period end for financial reporting purposes, and as such, the NAVs for shareholder transactions and the returns based on those NAVs may differ from the NAVs and returns reported in the Financial Highlights. |
| ■ | Industry classifications used in this report are generally according to the Global Industry Classification Standard, which was developed by and is the exclusive property and a service mark of MSCI Inc. and Standard & Poor’s. |
| 9 | Invesco Growth and Income Fund |
Schedule of Investments(a)
August 31, 2019
| | Shares | Value |
| Common Stocks & Other Equity Interests–93.84% |
| Aerospace & Defense–2.36% |
| General Dynamics Corp. | 829,302 | $158,620,594 |
| Apparel, Accessories & Luxury Goods–1.34% |
| Capri Holdings Ltd.(b) | 3,414,048 | 90,062,586 |
| Automobile Manufacturers–2.73% |
| General Motors Co. | 4,944,523 | 183,392,358 |
| Biotechnology–0.91% |
| Celgene Corp.(b) | 629,181 | 60,904,721 |
| Broadcasting–0.64% |
| CBS Corp., Class B | 1,021,878 | 42,980,189 |
| Building Products–1.78% |
| Johnson Controls International PLC | 2,798,729 | 119,477,741 |
| Cable & Satellite–3.51% |
| Charter Communications, Inc., Class A(b) | 378,106 | 154,868,437 |
| Comcast Corp., Class A | 1,839,144 | 81,400,513 |
| | | | 236,268,950 |
| Commodity Chemicals–0.76% |
| Dow, Inc. | 1,194,292 | 50,912,668 |
| Communications Equipment–1.43% |
| Cisco Systems, Inc. | 2,052,081 | 96,057,912 |
| Diversified Banks–8.83% |
| Bank of America Corp. | 7,523,125 | 206,961,169 |
| Citigroup, Inc. | 2,796,968 | 179,984,891 |
| JPMorgan Chase & Co. | 933,774 | 102,584,411 |
| Wells Fargo & Co. | 2,238,518 | 104,247,783 |
| | | | 593,778,254 |
| Electric Utilities–1.70% |
| Duke Energy Corp. | 417,747 | 38,741,857 |
| Exelon Corp. | 525,947 | 24,856,255 |
| FirstEnergy Corp. | 1,109,308 | 51,028,168 |
| | | | 114,626,280 |
| Fertilizers & Agricultural Chemicals–1.86% |
| Corteva, Inc. | 2,179,047 | 63,889,658 |
| Nutrien Ltd. (Canada) | 1,222,036 | 61,541,733 |
| | | | 125,431,391 |
| Food Distributors–1.62% |
| US Foods Holding Corp.(b) | 2,698,832 | 109,167,754 |
| Health Care Distributors–1.48% |
| McKesson Corp. | 719,318 | 99,460,100 |
| | Shares | Value |
| Health Care Equipment–2.96% |
| Medtronic PLC | 817,054 | $88,151,956 |
| Zimmer Biomet Holdings, Inc. | 799,472 | 111,286,502 |
| | | | 199,438,458 |
| Health Care Services–1.59% |
| CVS Health Corp. | 1,751,580 | 106,706,254 |
| Health Care Supplies–0.77% |
| Alcon, Inc. (Switzerland)(b) | 853,126 | 52,014,612 |
| Home Improvement Retail–0.68% |
| Kingfisher PLC (United Kingdom) | 19,355,879 | 45,843,820 |
| Hotels, Resorts & Cruise Lines–1.79% |
| Carnival Corp. | 2,738,482 | 120,712,287 |
| Industrial Machinery–1.40% |
| Ingersoll-Rand PLC | 778,843 | 94,310,099 |
| Insurance Brokers–1.77% |
| Willis Towers Watson PLC | 601,639 | 119,106,473 |
| Integrated Oil & Gas–5.05% |
| BP PLC (United Kingdom) | 17,316,783 | 105,588,384 |
| Chevron Corp. | 798,084 | 93,950,449 |
| Royal Dutch Shell PLC, Class A (United Kingdom) | 5,060,309 | 140,222,056 |
| | | | 339,760,889 |
| Internet & Direct Marketing Retail–1.44% |
| eBay, Inc. | 2,397,252 | 96,585,283 |
| Investment Banking & Brokerage–4.09% |
| Goldman Sachs Group, Inc. (The) | 541,909 | 110,500,664 |
| Morgan Stanley | 3,963,943 | 164,463,995 |
| | | | 274,964,659 |
| IT Consulting & Other Services–1.18% |
| Cognizant Technology Solutions Corp., Class A | 1,293,491 | 79,407,412 |
| Managed Health Care–1.06% |
| Anthem, Inc. | 272,869 | 71,360,701 |
| Multi-line Insurance–3.24% |
| American International Group, Inc. | 4,187,737 | 217,929,834 |
| Oil & Gas Equipment & Services–1.46% |
| TechnipFMC PLC (United Kingdom) | 3,946,702 | 98,036,078 |
| Oil & Gas Exploration & Production–3.51% |
| Canadian Natural Resources Ltd. (Canada) | 2,807,971 | 67,088,447 |
| Devon Energy Corp. | 4,126,989 | 90,752,488 |
| Marathon Oil Corp. | 6,618,511 | 78,363,170 |
| | | | 236,204,105 |
See accompanying Notes to Financial Statements which are an integral part of the financial statements.
| 10 | Invesco Growth and Income Fund |
| | Shares | Value |
| Other Diversified Financial Services–1.79% |
| AXA Equitable Holdings, Inc. | 2,380,680 | $49,446,724 |
| Voya Financial, Inc. | 1,445,825 | 71,308,089 |
| | | | 120,754,813 |
| Packaged Foods & Meats–3.28% |
| Kellogg Co. | 795,494 | 49,957,023 |
| Mondelez International, Inc., Class A | 3,095,064 | 170,909,434 |
| | | | 220,866,457 |
| Pharmaceuticals–7.79% |
| Bristol-Myers Squibb Co. | 1,881,627 | 90,449,810 |
| Johnson & Johnson | 1,636,492 | 210,060,113 |
| Novartis AG (Switzerland) | 832,533 | 74,968,974 |
| Pfizer, Inc. | 1,894,948 | 67,365,401 |
| Sanofi (France) | 943,993 | 81,110,721 |
| | | | 523,955,019 |
| Railroads–1.42% |
| CSX Corp. | 1,424,816 | 95,491,168 |
| Regional Banks–4.32% |
| Citizens Financial Group, Inc. | 4,140,549 | 139,702,123 |
| PNC Financial Services Group, Inc. (The) | 1,169,111 | 150,733,481 |
| | | | 290,435,604 |
| Semiconductors–3.80% |
| Intel Corp. | 2,480,338 | 117,592,824 |
| NXP Semiconductors N.V. (Netherlands) | 425,133 | 43,423,085 |
| QUALCOMM, Inc. | 1,213,022 | 94,336,721 |
| | | | 255,352,630 |
| | Shares | Value |
| Specialty Chemicals–0.89% |
| DuPont de Nemours, Inc. | 881,192 | $59,859,372 |
| Systems Software–2.42% |
| Oracle Corp. | 3,127,532 | 162,819,316 |
| Technology Hardware, Storage & Peripherals–1.41% |
| Apple, Inc. | 453,402 | 94,643,133 |
| Tobacco–2.78% |
| Philip Morris International, Inc. | 2,598,843 | 187,350,592 |
| Wireless Telecommunication Services–1.00% |
| Vodafone Group PLC (United Kingdom) | 35,624,111 | 67,272,181 |
| Total Common Stocks & Other Equity Interests (Cost $5,133,118,406) | 6,312,322,747 |
| Money Market Funds–6.97% |
| Invesco Government & Agency Portfolio, Institutional Class, 2.02%(c) | 164,212,407 | 164,212,407 |
| Invesco Liquid Assets Portfolio, Institutional Class, 2.14%(c) | 117,267,478 | 117,314,384 |
| Invesco Treasury Portfolio, Institutional Class, 1.98%(c) | 187,671,322 | 187,671,322 |
| Total Money Market Funds (Cost $469,182,577) | 469,198,113 |
| TOTAL INVESTMENTS IN SECURITIES–100.81% (Cost $5,602,300,983) | 6,781,520,860 |
| OTHER ASSETS LESS LIABILITIES—(0.81)% | (54,531,995) |
| NET ASSETS–100.00% | $6,726,988,865 |
Notes to Schedule of Investments:
| (a) | Industry and/or sector classifications used in this report are generally according to the Global Industry Classification Standard, which was developed by and is the exclusive property and a service mark of MSCI Inc. and Standard & Poor’s. |
| (b) | Non-income producing security. |
| (c) | The money market fund and the Fund are affiliated by having the same investment adviser. The rate shown is the 7-day SEC standardized yield as of August 31, 2019. |
| Open Forward Foreign Currency Contracts |
Settlement
Date | Counterparty | Contract to | Unrealized
Appreciation
(Depreciation) |
| Deliver | Receive |
| Currency Risk | | | | | | |
| 09/13/2019 | Bank of New York Mellon (The) | CHF | 94,244,662 | USD | 97,066,381 | $1,769,937 |
| 09/13/2019 | Bank of New York Mellon (The) | EUR | 52,436,986 | USD | 58,841,220 | 1,170,715 |
| 09/13/2019 | State Street Bank & Trust Co. | CAD | 70,235,549 | USD | 53,294,456 | 532,773 |
| 09/13/2019 | State Street Bank & Trust Co. | CHF | 5,583,728 | USD | 5,719,227 | 73,184 |
| 09/13/2019 | State Street Bank & Trust Co. | EUR | 3,454,821 | USD | 3,856,575 | 56,942 |
| 09/13/2019 | State Street Bank & Trust Co. | GBP | 232,202,357 | USD | 282,878,896 | 225,742 |
| 09/13/2019 | State Street Bank & Trust Co. | USD | 14,298,847 | GBP | 11,755,914 | 11,285 |
| Subtotal—Appreciation | 3,840,578 |
| Currency Risk | | | | | | |
| 09/13/2019 | State Street Bank & Trust Co. | CAD | 1,811,141 | USD | 1,360,499 | (49) |
| 09/13/2019 | State Street Bank & Trust Co. | USD | 3,350,548 | CAD | 4,444,788 | (11,576) |
| 09/13/2019 | State Street Bank & Trust Co. | USD | 7,536,654 | CHF | 7,357,415 | (97,130) |
See accompanying Notes to Financial Statements which are an integral part of the financial statements.
| 11 | Invesco Growth and Income Fund |
| Open Forward Foreign Currency Contracts—(continued) |
Settlement
Date | Counterparty | Contract to | Unrealized
Appreciation
(Depreciation) |
| Deliver | Receive |
| 09/13/2019 | State Street Bank & Trust Co. | USD | 1,483,849 | EUR | 1,321,168 | $(30,821) |
| Subtotal—Depreciation | (139,576) |
| Total Forward Foreign Currency Contracts | $3,701,002 |
| Abbreviations: |
| CAD | —Canadian Dollar |
| CHF | —Swiss Franc |
| EUR | —Euro |
| GBP | —British Pound Sterling |
| USD | —U.S. Dollar |
See accompanying Notes to Financial Statements which are an integral part of the financial statements.
| 12 | Invesco Growth and Income Fund |
Statement of Assets and Liabilities
August 31, 2019
| Assets: | |
Investments in securities, at value
(Cost $5,133,118,406) | $6,312,322,747 |
| Investments in affiliated money market funds, at value (Cost $469,182,577) | 469,198,113 |
| Other investments: | |
| Unrealized appreciation on forward foreign currency contracts outstanding | 3,840,578 |
| Foreign currencies, at value (Cost $1,337) | 1,314 |
| Receivable for: | |
| Fund shares sold | 4,060,070 |
| Investments sold | 6,319,599 |
| Dividends | 17,935,709 |
| Investment for trustee deferred compensation and retirement plans | 699,855 |
| Other assets | 67,652 |
| Total assets | 6,814,445,637 |
| Liabilities: | |
| Other investments: | |
| Unrealized depreciation on forward foreign currency contracts outstanding | 139,576 |
| Payable for: | |
| Investments purchased | 73,366,172 |
| Fund shares reacquired | 7,381,558 |
| Amount due custodian | 2,004,374 |
| Accrued fees to affiliates | 3,442,903 |
| Accrued trustees’ and officers’ fees and benefits | 12,697 |
| Accrued other operating expenses | 319,299 |
| Trustee deferred compensation and retirement plans | 790,193 |
| Total liabilities | 87,456,772 |
| Net assets applicable to shares outstanding | $6,726,988,865 |
| Net assets consist of: | |
| Shares of beneficial interest | $5,094,710,014 |
| Distributable earnings | 1,632,278,851 |
| | $6,726,988,865 |
| Net Assets: |
| Class A | $3,386,465,819 |
| Class C | $76,521,793 |
| Class R | $84,223,503 |
| Class Y | $938,866,099 |
| Class R5 | $746,385,134 |
| Class R6 | $1,494,526,517 |
| Shares outstanding, no par value, with an unlimited number of shares authorized: |
| Class A | 147,976,589 |
| Class C | 3,390,564 |
| Class R | 3,677,404 |
| Class Y | 40,980,589 |
| Class R5 | 32,540,453 |
| Class R6 | 65,140,111 |
| Class A: | |
| Net asset value per share | $22.89 |
Maximum offering price per share
(Net asset value of $22.89 ÷ 94.50%) | $24.22 |
| Class C: | |
| Net asset value and offering price per share | $22.57 |
| Class R: | |
| Net asset value and offering price per share | $22.90 |
| Class Y: | |
| Net asset value and offering price per share | $22.91 |
| Class R5: | |
| Net asset value and offering price per share | $22.94 |
| Class R6: | |
| Net asset value and offering price per share | $22.94 |
See accompanying Notes to Financial Statements which are an integral part of the financial statements.
| 13 | Invesco Growth and Income Fund |
Statement of Operations
For the year ended August 31, 2019
| Investment income: | |
| Dividends (net of foreign withholding taxes of $3,704,140) | $186,046,301 |
| Dividends from affiliated money market funds | 6,201,999 |
| Total investment income | 192,248,300 |
| Expenses: | |
| Advisory fees | 25,728,066 |
| Administrative services fees | 899,079 |
| Custodian fees | 85,691 |
| Distribution fees: | |
| Class A | 8,930,906 |
| Class C | 1,345,277 |
| Class R | 492,699 |
| Transfer agent fees — A, C, R and Y | 8,911,422 |
| Transfer agent fees — R5 | 820,627 |
| Transfer agent fees — R6 | 65,202 |
| Trustees’ and officers’ fees and benefits | 127,975 |
| Registration and filing fees | 187,452 |
| Reports to shareholders | 394,776 |
| Professional services fees | 149,027 |
| Other | 112,119 |
| Total expenses | 48,250,318 |
| Less: Fees waived and/or expense offset arrangement(s) | (304,331) |
| Net expenses | 47,945,987 |
| Net investment income | 144,302,313 |
| Realized and unrealized gain (loss) from: | |
| Net realized gain from: | |
| Investment securities | 579,079,665 |
| Foreign currencies | 2,101,523 |
| Forward foreign currency contracts | 25,163,435 |
| | 606,344,623 |
| Change in net unrealized appreciation (depreciation) of: | |
| Investment securities | (1,158,536,173) |
| Foreign currencies | (41,406) |
| Forward foreign currency contracts | 7,409,238 |
| | (1,151,168,341) |
| Net realized and unrealized gain (loss) | (544,823,718) |
| Net increase (decrease) in net assets resulting from operations | $(400,521,405) |
See accompanying Notes to Financial Statements which are an integral part of the financial statements.
| 14 | Invesco Growth and Income Fund |
Statement of Changes in Net Assets
For the years ended August 31, 2019 and 2018
| | 2019 | 2018 |
| Operations: | | |
| Net investment income | $144,302,313 | $130,010,029 |
| Net realized gain | 606,344,623 | 727,729,175 |
| Change in net unrealized appreciation (depreciation) | (1,151,168,341) | 77,446,989 |
| Net increase (decrease) in net assets resulting from operations | (400,521,405) | 935,186,193 |
| Distributions to shareholders from distributable earnings(1): | | |
| Class A | (423,519,761) | (432,363,532) |
| Class B | — | (1,466,175) |
| Class C | (23,897,003) | (26,078,358) |
| Class R | (11,806,121) | (12,771,763) |
| Class Y | (138,060,204) | (133,315,379) |
| Class R5 | (100,727,092) | (92,772,524) |
| Class R6 | (185,760,036) | (180,655,314) |
| Total distributions from distributable earnings | (883,770,217) | (879,423,045) |
| Share transactions–net: | | |
| Class A | 50,679,776 | (44,106,092) |
| Class B | — | (18,639,866) |
| Class C | (124,884,378) | (10,800,593) |
| Class R | (13,581,205) | (5,141,530) |
| Class Y | (125,646,831) | 106,745,901 |
| Class R5 | (40,479,886) | 126,551,900 |
| Class R6 | 86,707,598 | 14,120,000 |
| Net increase (decrease) in net assets resulting from share transactions | (167,204,926) | 168,729,720 |
| Net increase (decrease) in net assets | (1,451,496,548) | 224,492,868 |
| Net assets: | | |
| Beginning of year | 8,178,485,413 | 7,953,992,545 |
| End of year | $6,726,988,865 | $8,178,485,413 |
| (1) | For the year ended August 31, 2018, distributions to shareholders from distributable earnings consisted of distributions from net investment income and distributions from net realized gains. The Securities and Exchange Commission eliminated the requirement to disclose the distribution components separately, except for tax return of capital. For the year ended August 31, 2018, distributions from net investment income were $74,100,240, $177,081, $2,842,803, $1,924,086, $25,569,891, $18,771,654 and $37,369,692 for Class A, Class B, Class C, Class R, Class Y, Class R5 and Class R6 shares, respectively, and distributions from net realized gains were $358,263,292, $1,289,094, $23,235,555, $10,847,677, $107,745,488, $74,000,870 and $143,285,622 for Class A, Class B, Class C, Class R, Class Y, Class R5 and Class R6 shares, respectively. |
See accompanying Notes to Financial Statements which are an integral part of the financial statements.
| 15 | Invesco Growth and Income Fund |
Financial Highlights
August 31, 2019
The following schedule presents financial highlights for a share of the Fund outstanding throughout the periods indicated.
| | Net asset
value,
beginning
of period | Net
investment
income(a) | Net gains
(losses)
on securities
(both
realized and
unrealized) | Total from
investment
operations | Dividends
from net
investment
income | Distributions
from net
realized
gains | Total
distributions | Net asset
value, end
of period | Total
return(b) | Net assets,
end of period
(000’s omitted) | Ratio of
expenses
to average
net assets
with fee waivers
and/or
expenses
absorbed | Ratio of
expenses
to average net
assets without
fee waivers
and/or
expenses
absorbed | Ratio of net
investment
income
to average
net assets | Portfolio
turnover(c) |
| Class A |
| Year ended 08/31/19 | $27.50 | $0.44 | $(2.02) | $(1.58) | $(0.43) | $(2.60) | $(3.03) | $22.89 | (4.99)% | $3,386,466 | 0.81%(d) | 0.81%(d) | 1.84%(d) | 23% |
| Year ended 08/31/18 | 27.42 | 0.40 | 2.76 | 3.16 | (0.52) | (2.56) | (3.08) | 27.50 | 11.96 | 3,954,641 | 0.80 | 0.80 | 1.44 | 29 |
| Year ended 08/31/17 | 25.12 | 0.53(e) | 3.64 | 4.17 | (0.42) | (1.45) | (1.87) | 27.42 | 16.90 | 3,972,916 | 0.82 | 0.82 | 1.96(e) | 16 |
| Year ended 08/31/16 | 25.44 | 0.38 | 1.44 | 1.82 | (0.42) | (1.72) | (2.14) | 25.12 | 7.93 | 4,058,588 | 0.83 | 0.83 | 1.59 | 18 |
| Year ended 08/31/15 | 29.30 | 0.35 | (1.09) | (0.74) | (0.54) | (2.58) | (3.12) | 25.44 | (2.61) | 4,450,596 | 0.84 | 0.84 | 1.29 | 23 |
| Class C |
| Year ended 08/31/19 | 27.15 | 0.27 | (2.00) | (1.73) | (0.25) | (2.60) | (2.85) | 22.57 | (5.67)(f) | 76,522 | 1.53(d)(f) | 1.53(d)(f) | 1.12(d)(f) | 23 |
| Year ended 08/31/18 | 27.09 | 0.19 | 2.74 | 2.93 | (0.31) | (2.56) | (2.87) | 27.15 | 11.17(f) | 243,564 | 1.53(f) | 1.53(f) | 0.71(f) | 29 |
| Year ended 08/31/17 | 24.84 | 0.32(e) | 3.60 | 3.92 | (0.22) | (1.45) | (1.67) | 27.09 | 16.00 | 253,253 | 1.57 | 1.57 | 1.21(e) | 16 |
| Year ended 08/31/16 | 25.17 | 0.20 | 1.43 | 1.63 | (0.24) | (1.72) | (1.96) | 24.84 | 7.14(f) | 290,579 | 1.55(f) | 1.55(f) | 0.87(f) | 18 |
| Year ended 08/31/15 | 29.01 | 0.15 | (1.08) | (0.93) | (0.33) | (2.58) | (2.91) | 25.17 | (3.33) | 309,526 | 1.59 | 1.59 | 0.54 | 23 |
| Class R |
| Year ended 08/31/19 | 27.52 | 0.38 | (2.03) | (1.65) | (0.37) | (2.60) | (2.97) | 22.90 | (5.27) | 84,224 | 1.06(d) | 1.06(d) | 1.59(d) | 23 |
| Year ended 08/31/18 | 27.43 | 0.33 | 2.77 | 3.10 | (0.45) | (2.56) | (3.01) | 27.52 | 11.71 | 115,360 | 1.05 | 1.05 | 1.19 | 29 |
| Year ended 08/31/17 | 25.14 | 0.46(e) | 3.64 | 4.10 | (0.36) | (1.45) | (1.81) | 27.43 | 16.55 | 119,766 | 1.07 | 1.07 | 1.71(e) | 16 |
| Year ended 08/31/16 | 25.45 | 0.32 | 1.45 | 1.77 | (0.36) | (1.72) | (2.08) | 25.14 | 7.69 | 116,837 | 1.08 | 1.08 | 1.34 | 18 |
| Year ended 08/31/15 | 29.31 | 0.29 | (1.10) | (0.81) | (0.47) | (2.58) | (3.05) | 25.45 | (2.86) | 139,084 | 1.09 | 1.09 | 1.04 | 23 |
| Class Y |
| Year ended 08/31/19 | 27.53 | 0.50 | (2.03) | (1.53) | (0.49) | (2.60) | (3.09) | 22.91 | (4.78) | 938,866 | 0.56(d) | 0.56(d) | 2.09(d) | 23 |
| Year ended 08/31/18 | 27.44 | 0.47 | 2.77 | 3.24 | (0.59) | (2.56) | (3.15) | 27.53 | 12.27 | 1,266,205 | 0.55 | 0.55 | 1.69 | 29 |
| Year ended 08/31/17 | 25.15 | 0.59(e) | 3.64 | 4.23 | (0.49) | (1.45) | (1.94) | 27.44 | 17.13 | 1,152,199 | 0.57 | 0.57 | 2.21(e) | 16 |
| Year ended 08/31/16 | 25.46 | 0.44 | 1.46 | 1.90 | (0.49) | (1.72) | (2.21) | 25.15 | 8.24 | 1,851,513 | 0.58 | 0.58 | 1.84 | 18 |
| Year ended 08/31/15 | 29.33 | 0.42 | (1.10) | (0.68) | (0.61) | (2.58) | (3.19) | 25.46 | (2.39) | 1,886,928 | 0.59 | 0.59 | 1.54 | 23 |
| Class R5 |
| Year ended 08/31/19 | 27.56 | 0.52 | (2.03) | (1.51) | (0.51) | (2.60) | (3.11) | 22.94 | (4.70) | 746,385 | 0.48(d) | 0.48(d) | 2.17(d) | 23 |
| Year ended 08/31/18 | 27.47 | 0.49 | 2.77 | 3.26 | (0.61) | (2.56) | (3.17) | 27.56 | 12.35 | 932,196 | 0.48 | 0.48 | 1.76 | 29 |
| Year ended 08/31/17 | 25.17 | 0.61(e) | 3.65 | 4.26 | (0.51) | (1.45) | (1.96) | 27.47 | 17.26 | 799,681 | 0.49 | 0.49 | 2.29(e) | 16 |
| Year ended 08/31/16 | 25.49 | 0.46 | 1.45 | 1.91 | (0.51) | (1.72) | (2.23) | 25.17 | 8.31 | 765,516 | 0.48 | 0.48 | 1.94 | 18 |
| Year ended 08/31/15 | 29.36 | 0.45 | (1.10) | (0.65) | (0.64) | (2.58) | (3.22) | 25.49 | (2.29) | 738,797 | 0.48 | 0.48 | 1.65 | 23 |
| Class R6 |
| Year ended 08/31/19 | 27.57 | 0.54 | (2.04) | (1.50) | (0.53) | (2.60) | (3.13) | 22.94 | (4.64) | 1,494,527 | 0.38(d) | 0.38(d) | 2.27(d) | 23 |
| Year ended 08/31/18 | 27.48 | 0.51 | 2.77 | 3.28 | (0.63) | (2.56) | (3.19) | 27.57 | 12.46 | 1,666,520 | 0.38 | 0.38 | 1.86 | 29 |
| Year ended 08/31/17 | 25.18 | 0.64(e) | 3.65 | 4.29 | (0.54) | (1.45) | (1.99) | 27.48 | 17.36 | 1,638,500 | 0.39 | 0.39 | 2.39(e) | 16 |
| Year ended 08/31/16 | 25.49 | 0.49 | 1.46 | 1.95 | (0.54) | (1.72) | (2.26) | 25.18 | 8.46 | 680,404 | 0.38 | 0.38 | 2.04 | 18 |
| Year ended 08/31/15 | 29.36 | 0.48 | (1.10) | (0.62) | (0.67) | (2.58) | (3.25) | 25.49 | (2.19) | 720,155 | 0.38 | 0.38 | 1.75 | 23 |
| (a) | Calculated using average shares outstanding. |
| (b) | Includes adjustments in accordance with accounting principles generally accepted in the United States of America and as such, the net asset value for financial reporting purposes and the returns based upon those net asset values may differ from the net asset value and returns for shareholder transactions. Does not include sales charges and is not annualized for periods less than one year, if applicable. |
| (c) | Portfolio turnover is calculated at the fund level and is not annualized for periods less than one year, if applicable. |
| (d) | Ratios are based on average daily net assets (000’s omitted) of $3,575,223, $139,497, $98,540, $1,087,421, $820,448 and $1,522,605 for Class A, Class C, Class R, Class Y, Class R5 and Class R6 shares, respectively. |
| (e) | Net investment income per share and the ratio of net investment income to average net assets includes significant dividends received during the year ended August 31, 2017. Net investment income per share and the ratio of net investment income to average net assets excluding the significant dividends are $0.40 and 1.47%, $0.19 and 0.72%, $0.33 and 1.22%, $0.46 and 1.72%, $0.48 and 1.80% and $0.51 and 1.90% for Class A, Class C, Class R, Class Y, Class R5 and Class R6 shares, respectively. |
| (f) | The total return, ratio of expenses to average net assets and ratio of net investment income to average net assets reflect actual 12b-1 fees of 0.96%, 0.98% and 0.98% for the years ended August 31, 2019, August 31, 2018 and August 31, 2016, respectively. |
See accompanying Notes to Financial Statements which are an integral part of the financial statements.
| 16 | Invesco Growth and Income Fund |
Notes to Financial Statements
August 31, 2019
NOTE 1—Significant Accounting Policies
Invesco Growth and Income Fund (the “Fund”) is a series portfolio of AIM Counselor Series Trust (Invesco Counselor Series Trust) (the “Trust”). The Trust is a Delaware statutory trust registered under the Investment Company Act of 1940, as amended (the “1940 Act”), as an open-end series management investment company authorized to issue an unlimited number of shares of beneficial interest. Information presented in these financial statements pertains only to the Fund. Matters affecting the Fund or each class will be voted on exclusively by the shareholders of the Fund or each class.
The Fund’s investment objective is total return through growth of capital and current income.
The Fund currently consists of six different classes of shares: Class A, Class C, Class R, Class Y, Class R5 and Class R6. Class Y shares are available only to certain investors. Class A shares are sold with a front-end sales charge unless certain waiver criteria are met. Under certain circumstances, load waived shares may be subject to contingent deferred sales charges ("CDSC"). Class C shares are sold with a CDSC. Class R, Class Y, Class R5 and Class R6 shares are sold at net asset value. Class C shares held for ten years after purchase are eligible for automatic conversion into Class A shares of the same Fund (the "Conversion Feature"). The automatic conversion pursuant to the Conversion Feature will generally occur at the end of the month following the tenth anniversary after a purchase of Class C shares.
The Fund is an investment company and accordingly follows the investment company accounting and reporting guidance in accordance with Financial Accounting Standards Board Accounting Standards Codification Topic 946,Financial Services – Investment Companies.
The following is a summary of the significant accounting policies followed by the Fund in the preparation of its financial statements.
| A. | Security Valuations – Securities, including restricted securities, are valued according to the following policy. |
Debt obligations (including convertible securities) and unlisted equities are fair valued using an evaluated quote provided by an independent pricing service. Evaluated quotes provided by the pricing service may be determined without exclusive reliance on quoted prices, and may reflect appropriate factors such as institution-size trading in similar groups of securities, developments related to specific securities, dividend rate (for unlisted equities), yield (for debt obligations), quality, type of issue, coupon rate (for debt obligations), maturity (for debt obligations), individual trading characteristics and other market data. Pricing services generally value debt obligations assuming orderly transactions of institutional round lot size, but a fund may hold or transact in the same securities in smaller, odd lot sizes. Odd lots often trade at lower prices than institutional round lots. Debt obligations are subject to interest rate and credit risks. In addition, all debt obligations involve some risk of default with respect to interest and/or principal payments.
A security listed or traded on an exchange (except convertible securities) is valued at its last sales price or official closing price as of the close of the customary trading session on the exchange where the security is principally traded, or lacking any sales or official closing price on a particular day, the security may be valued at the closing bid price on that day. Securities traded in the over-the-counter market are valued based on prices furnished by independent pricing services or market makers. When such securities are valued by an independent pricing service they may be considered fair valued. Futures contracts are valued at the final settlement price set by an exchange on which they are principally traded. Listed options are valued at the mean between the last bid and asked prices from the exchange on which they are principally traded. Options not listed on an exchange are valued by an independent source at the mean between the last bid and asked prices. For purposes of determining net asset value ("NAV") per share, futures and option contracts generally are valued 15 minutes after the close of the customary trading session of the New York Stock Exchange (“NYSE”).
Investments in open-end and closed-end registered investment companies that do not trade on an exchange are valued at the end-of-day net asset value per share. Investments in open-end and closed-end registered investment companies that trade on an exchange are valued at the last sales price or official closing price as of the close of the customary trading session on the exchange where the security is principally traded.
Foreign securities’ (including foreign exchange contracts) prices are converted into U.S. dollar amounts using the applicable exchange rates as of the close of the NYSE. If market quotations are available and reliable for foreign exchange-traded equity securities, the securities will be valued at the market quotations. Because trading hours for certain foreign securities end before the close of the NYSE, closing market quotations may become unreliable. If between the time trading ends on a particular security and the close of the customary trading session on the NYSE, events occur that the investment adviser determines are significant and make the closing price unreliable, the Fund may fair value the security. If the event is likely to have affected the closing price of the security, the security will be valued at fair value in good faith using procedures approved by the Board of Trustees. Adjustments to closing prices to reflect fair value may also be based on a screening process of an independent pricing service to indicate the degree of certainty, based on historical data, that the closing price in the principal market where a foreign security trades is not the current value as of the close of the NYSE. Foreign securities’ prices meeting the approved degree of certainty that the price is not reflective of current value will be priced at the indication of fair value from the independent pricing service. Multiple factors may be considered by the independent pricing service in determining adjustments to reflect fair value and may include information relating to sector indices, American Depositary Receipts and domestic and foreign index futures. Foreign securities may have additional risks including exchange rate changes, potential for sharply devalued currencies and high inflation, political and economic upheaval, the relative lack of issuer information, relatively low market liquidity and the potential lack of strict financial and accounting controls and standards.
Securities for which market prices are not provided by any of the above methods may be valued based upon quotes furnished by independent sources. The last bid price may be used to value equity securities. The mean between the last bid and asked prices is used to value debt obligations, including corporate loans.
Securities for which market quotations are not readily available or became unreliable are valued at fair value as determined in good faith by or under the supervision of the Trust’s officers following procedures approved by the Board of Trustees. Issuer specific events, market trends, bid/asked quotes of brokers and information providers and other market data may be reviewed in the course of making a good faith determination of a security’s fair value.
The Fund may invest in securities that are subject to interest rate risk, meaning the risk that the prices will generally fall as interest rates rise and, conversely, the prices will generally rise as interest rates fall. Specific securities differ in their sensitivity to changes in interest rates
| 17 | Invesco Growth and Income Fund |
depending on their individual characteristics. Changes in interest rates may result in increased market volatility, which may affect the value and/or liquidity of certain Fund investments.
Valuations change in response to many factors including the historical and prospective earnings of the issuer, the value of the issuer’s assets, general economic conditions, interest rates, investor perceptions and market liquidity. Because of the inherent uncertainties of valuation, the values reflected in the financial statements may materially differ from the value received upon actual sale of those investments.
| B. | Securities Transactions and Investment Income — Securities transactions are accounted for on a trade date basis. Realized gains or losses on sales are computed on the basis of specific identification of the securities sold. Interest income (net of withholding tax, if any) is recorded on the accrual basis from settlement date. Dividend income (net of withholding tax, if any) is recorded on the ex-dividend date. |
The Fund may periodically participate in litigation related to Fund investments. As such, the Fund may receive proceeds from litigation settlements. Any proceeds received are included in the Statement of Operations as realized gain (loss) for investments no longer held and as unrealized gain (loss) for investments still held.
Brokerage commissions and mark ups are considered transaction costs and are recorded as an increase to the cost basis of securities purchased and/or a reduction of proceeds on a sale of securities. Such transaction costs are included in the determination of net realized and unrealized gain (loss) from investment securities reported in the Statement of Operations and the Statement of Changes in Net Assets and the net realized and unrealized gains (losses) on securities per share in the Financial Highlights. Transaction costs are included in the calculation of the Fund’s net asset value and, accordingly, they reduce the Fund’s total returns. These transaction costs are not considered operating expenses and are not reflected in net investment income reported in the Statement of Operations and the Statement of Changes in Net Assets, or the net investment income per share and the ratios of expenses and net investment income reported in the Financial Highlights, nor are they limited by any expense limitation arrangements between the Fund and the investment adviser.
The Fund allocates income and realized and unrealized capital gains and losses to a class based on the relative net assets of each class.
| C. | Country Determination — For the purposes of making investment selection decisions and presentation in the Schedule of Investments, the investment adviser may determine the country in which an issuer is located and/or credit risk exposure based on various factors. These factors include the laws of the country under which the issuer is organized, where the issuer maintains a principal office, the country in which the issuer derives 50% or more of its total revenues and the country that has the primary market for the issuer’s securities, as well as other criteria. Among the other criteria that may be evaluated for making this determination are the country in which the issuer maintains 50% or more of its assets, the type of security, financial guarantees and enhancements, the nature of the collateral and the sponsor organization. Country of issuer and/or credit risk exposure has been determined to be the United States of America, unless otherwise noted. |
| D. | Distributions- Distributions from net investment income, if any, are declared and paid quarterly and are recorded on the ex-dividend date. Distributions from net realized capital gain, if any, are generally declared and paid annually and recorded on the ex-dividend date. The Fund may elect to treat a portion of the proceeds from redemptions as distributions for federal income tax purposes. |
| E. | Federal Income Taxes –The Fund intends to comply with the requirements of Subchapter M of the Internal Revenue Code of 1986, as amended (the “Internal Revenue Code”), necessary to qualify as a regulated investment company and to distribute substantially all of the Fund’s taxable earnings to shareholders. As such, the Fund will not be subject to federal income taxes on otherwise taxable income (including net realized capital gain) that is distributed to shareholders. Therefore, no provision for federal income taxes is recorded in the financial statements. |
The Fund recognizes the tax benefits of uncertain tax positions only when the position is more likely than not to be sustained. Management has analyzed the Fund’s uncertain tax positions and concluded that no liability for unrecognized tax benefits should be recorded related to uncertain tax positions. Management is not aware of any tax positions for which it is reasonably possible that the total amounts of unrecognized tax benefits will change materially in the next 12 months.
The Fund files tax returns in the U.S. Federal jurisdiction and certain other jurisdictions. Generally, the Fund is subject to examinations by such taxing authorities for up to three years after the filing of the return for the tax period.
| F. | Expenses – Fees provided for under the Rule 12b-1 plan of a particular class of the Fund are charged to the operations of such class. Transfer agency fees and expenses and other shareholder recordkeeping fees and expenses attributable to Class R5 and Class R6 are allocated to each share class based on relative net assets. Sub-accounting fees attributable to Class R5 are charged to the operations of the class. Transfer agency fees and expenses and other shareholder recordkeeping fees and expenses relating to all other classes are allocated among those classes based on relative net assets. All other expenses are allocated among the classes based on relative net assets. |
| G. | Accounting Estimates – The preparation of financial statements in conformity with accounting principles generally accepted in the United States of America (“GAAP”) requires management to make estimates and assumptions that affect the reported amounts of assets and liabilities at the date of the financial statements and the reported amounts of revenues and expenses during the reporting period including estimates and assumptions related to taxation. Actual results could differ from those estimates by a significant amount. In addition, the Fund monitors for material events or transactions that may occur or become known after the period-end date and before the date the financial statements are released to print. |
| H. | Indemnifications – Under the Trust’s organizational documents, each Trustee, officer, employee or other agent of the Trust is indemnified against certain liabilities that may arise out of the performance of their duties to the Fund. Additionally, in the normal course of business, the Fund enters into contracts, including the Fund’s servicing agreements, that contain a variety of indemnification clauses. The Fund’s maximum exposure under these arrangements is unknown as this would involve future claims that may be made against the Fund that have not yet occurred. The risk of material loss as a result of such indemnification claims is considered remote. |
| I. | Foreign Currency Translations— Foreign currency is valued at the close of the NYSE based on quotations posted by banks and major currency dealers. Portfolio securities and other assets and liabilities denominated in foreign currencies are translated into U.S. dollar amounts at the date of valuation. Purchases and sales of portfolio securities (net of foreign taxes withheld on disposition) and income items denominated in foreign currencies are translated into U.S. dollar amounts on the respective dates of such transactions. The Fund does not separately account for the portion of the results of operations resulting from changes in foreign exchange rates on investments and the fluctuations arising from changes in market prices of securities held. The combined results of changes in foreign exchange rates and the fluctuation of market prices on investments (net of estimated foreign tax withholding) are included with the net realized and unrealized gain or loss from investments in the Statement of Operations. Reported net realized foreign currency gains or losses arise from (1) sales of foreign currencies, (2) currency gains or losses realized between the trade and settlement dates on securities transactions, and (3) the difference between the amounts of dividends, |
| 18 | Invesco Growth and Income Fund |
| | interest, and foreign withholding taxes recorded on the Fund’s books and the U.S. dollar equivalent of the amounts actually received or paid. Net unrealized foreign currency gains and losses arise from changes in the fair values of assets and liabilities, other than investments in securities at fiscal period end, resulting from changes in exchange rates. |
The Fund may invest in foreign securities, which may be subject to foreign taxes on income, gains on investments or currency repatriation, a portion of which may be recoverable. Foreign taxes, if any, are recorded based on the tax regulations and rates that exist in the foreign markets in which the Fund invests and are shown in the Statement of Operations.
| J. | Forward Foreign Currency Contracts— The Fund may engage in foreign currency transactions either on a spot (i.e. for prompt delivery and settlement) basis, or through forward foreign currency contracts, to manage or minimize currency or exchange rate risk. |
The Fund may also enter into forward foreign currency contracts for the purchase or sale of a security denominated in a foreign currency in order to “lock in” the U.S. dollar price of that security, or the Fund may also enter into forward foreign currency contracts that do not provide for physical settlement of the two currencies, but instead are settled by a single cash payment calculated as the difference between the agreed upon exchange rate and the spot rate at settlement based upon an agreed upon notional amount (non-deliverable forwards). The Fund will set aside liquid assets in an amount equal to the daily mark-to-market obligation for forward foreign currency contracts.
A forward foreign currency contract is an obligation between two parties (“Counterparties”) to purchase or sell a specific currency for an agreed-upon price at a future date. The use of forward foreign currency contracts does not eliminate fluctuations in the price of the underlying securities the Fund owns or intends to acquire but establishes a rate of exchange in advance. Fluctuations in the value of these contracts are measured by the difference in the contract date and reporting date exchange rates and are recorded as unrealized appreciation (depreciation) until the contracts are closed. When the contracts are closed, realized gains (losses) are recorded. Realized and unrealized gains (losses) on the contracts are included in the Statement of Operations. The primary risks associated with forward foreign currency contracts include failure of the Counterparty to meet the terms of the contract and the value of the foreign currency changing unfavorably. These risks may be in excess of the amounts reflected in the Statement of Assets and Liabilities.
NOTE 2—Advisory Fees and Other Fees Paid to Affiliates
The Trust has entered into a master investment advisory agreement with Invesco Advisers, Inc. (the "Adviser" or "Invesco"). Under the terms of the investment advisory agreement, the Fund accrues daily and pays monthly an advisory fee to the Adviser based on the annual rate of the Fund’s average daily net assets as follows:
| Average Daily Net Assets | Rate |
| First $150 million | 0.50% |
| Next $100 million | 0.45% |
| Next $100 million | 0.40% |
| Over $350 million | 0.35% |
For the year ended August 31, 2019, the effective advisory fees incurred by the Fund was 0.36%.
Under the terms of a master sub-advisory agreement between the Adviser and each of Invesco Asset Management Deutschland GmbH, Invesco Asset Management Limited, Invesco Asset Management (Japan) Limited, Invesco Hong Kong Limited, Invesco Senior Secured Management, Inc. and Invesco Canada Ltd. (collectively, the "Affiliated Sub-Advisers") the Adviser, not the Fund, will pay 40% of the fees paid to the Adviser to any such Affiliated Sub-Adviser(s) that provide(s) discretionary investment management services to the Fund based on the percentage of assets allocated to such Affiliated Sub-Adviser(s).
The Adviser has contractually agreed, through at least June 30, 2020, to waive advisory fees and/or reimburse expenses to the extent necessary to limit total annual fund operating expenses after fee waiver and/or expense reimbursement (excluding certain items discussed below) of Class A, Class C, Class R, Class Y, Class R5 and Class R6 shares to 2.00%, 2.75%, 2.25%, 1.75%, 1.75% and 1.75%, respectively, of the Fund’s average daily net assets (the "expense limits"). In determining the Adviser’s obligation to waive advisory fees and/or reimburse expenses, the following expenses are not taken into account, and could cause total annual fund operating expenses after fee waiver and/or expense reimbursement to exceed the numbers reflected above: (1) interest; (2) taxes; (3) dividend expense on short sales; (4) extraordinary or non-routine items, including litigation expenses; and (5) expenses that the Fund has incurred but did not actually pay because of an expense offset arrangement. Unless Invesco continues the fee waiver agreement, it will terminate on June 30, 2020. During its term, the fee waiver agreement cannot be terminated or amended to increase the expense limits or reduce the advisory fee waivers without approval of the Board of Trustees. The Adviser did not waive fees and/or reimburse expenses during the period under this expense limit.
Further, the Adviser has contractually agreed, through at least June 30, 2021, to waive the advisory fee payable by the Fund in an amount equal to 100% of the net advisory fees the Adviser receives from the affiliated money market funds on investments by the Fund of uninvested cash in such affiliated money market funds.
For the year ended August 31, 2019, the Adviser waived advisory fees of $288,533.
The Trust has entered into a master administrative services agreement with Invesco pursuant to which the Fund has agreed to pay Invesco for certain administrative costs incurred in providing accounting services to the Fund. For the year ended August 31, 2019, expenses incurred under the agreement are shown in the Statement of Operations asAdministrative services fees. Also, Invesco has entered into a sub-administration agreement whereby State Street Bank and Trust Company (“SSB”) serves as custodian and fund accountant and provides certain administrative services to the Fund.
The Trust has entered into a transfer agency and service agreement with Invesco Investment Services, Inc. (“IIS”) pursuant to which the Fund has agreed to pay IIS a fee for providing transfer agency and shareholder services to the Fund and reimburse IIS for certain expenses incurred by IIS in the course of providing such services. IIS may make payments to intermediaries that provide omnibus account services, sub-accounting services and/or networking services. All fees payable by IIS to intermediaries that provide omnibus account services or sub-accounting services are charged back to the Fund, subject to certain limitations approved by the Trust’s Board of Trustees. For the year ended August 31, 2019, expenses incurred under the agreement are shown in the Statement of Operations asTransfer agent fees.
| 19 | Invesco Growth and Income Fund |
Shares of the Fund are distributed by Invesco Distributors, Inc. (“IDI”). The Fund has adopted a distribution plan pursuant to Rule 12b-1 under the 1940 Act, and a service plan (collectively, the “Plans”) for Class A, Class C and Class R shares to compensate IDI for the sale, distribution, shareholder servicing and maintenance of shareholder accounts for these shares. Under the Plans, the Fund will incur annual fees of up to 0.25% of Class A average daily net assets, up to 1.00% of Class C average daily net assets and up to 0.50% of Class R average daily net assets. The fees are accrued daily and paid monthly.
With respect to Class C shares, the Fund is authorized to reimburse in future years any distribution related expenses that exceed the maximum annual reimbursement rate for such class, so long as such reimbursement does not cause the Fund to exceed the Class C maximum annual reimbursement rate, respectively. With respect to Class A shares, distribution related expenses that exceed the maximum annual reimbursement rate for such class are not carried forward to future years and the Fund will not reimburse IDI for any such expenses.
For the year ended August 31, 2019, expenses incurred under these agreements are shown in the Statement of Operations asDistribution fees.
Front-end sales commissions and CDSC (collectively, the “sales charges”) are not recorded as expenses of the Fund. Front-end sales commissions are deducted from proceeds from the sales of Fund shares prior to investment in Class A shares of the Fund. CDSC are deducted from redemption proceeds prior to remittance to the shareholder. During the year ended August 31, 2019, IDI advised the Fund that IDI retained $310,261 in front-end sales commissions from the sale of Class A shares and $9,060 and $3,507 from Class A and Class C shares, respectively, for CDSC imposed upon redemptions by shareholders.
For the year ended August 31, 2019, the Fund incurred $121,236 in brokerage commissions with Invesco Capital Markets, Inc., an affiliate of the Adviser and IDI, for portfolio transactions executed on behalf of the Fund.
Certain officers and trustees of the Trust are officers and directors of the Adviser, IIS and/or IDI.
NOTE 3—Additional Valuation Information
GAAP defines fair value as the price that would be received to sell an asset or paid to transfer a liability in an orderly transaction between market participants at the measurement date, under current market conditions. GAAP establishes a hierarchy that prioritizes the inputs to valuation methods, giving the highest priority to readily available unadjusted quoted prices in an active market for identical assets (Level 1) and the lowest priority to significant unobservable inputs (Level 3), generally when market prices are not readily available or are unreliable. Based on the valuation inputs, the securities or other investments are tiered into one of three levels. Changes in valuation methods may result in transfers in or out of an investment’s assigned level:
Level 1 – Prices are determined using quoted prices in an active market for identical assets.
Level 2 – Prices are determined using other significant observable inputs. Observable inputs are inputs that other market participants may use in pricing a security. These may include quoted prices for similar securities, interest rates, prepayment speeds, credit risk, yield curves, loss severities, default rates, discount rates, volatilities and others.
Level 3 – Prices are determined using significant unobservable inputs. In situations where quoted prices or observable inputs are unavailable (for example, when there is little or no market activity for an investment at the end of the period), unobservable inputs may be used. Unobservable inputs reflect the Fund’s own assumptions about the factors market participants would use in determining fair value of the securities or instruments and would be based on the best available information.
The following is a summary of the tiered valuation input levels, as of August 31, 2019. The level assigned to the securities valuations may not be an indication of the risk or liquidity associated with investing in those securities. Because of the inherent uncertainties of valuation, the values reflected in the financial statements may materially differ from the value received upon actual sale of those investments.
| | Level 1 | Level 2 | Level 3 | Total |
| Investments in Securities | | | | |
| Common Stocks & Other Equity Interests | $5,745,301,999 | $567,020,748 | $— | $6,312,322,747 |
| Money Market Funds | 469,198,113 | — | — | 469,198,113 |
| Total Investments in Securities | 6,214,500,112 | 567,020,748 | — | 6,781,520,860 |
| Other Investments - Assets* | | | | |
| Forward Foreign Currency Contracts | — | 3,840,578 | — | 3,840,578 |
| Other Investments - Liabilities* | | | | |
| Forward Foreign Currency Contracts | — | (139,576) | — | (139,576) |
| Total Other Investments | — | 3,701,002 | — | 3,701,002 |
| Total Investments | $6,214,500,112 | $570,721,750 | $— | $6,785,221,862 |
| * | Unrealized appreciation (depreciation). |
NOTE 4—Derivative Investments
The Fund may enter into an International Swaps and Derivatives Association Master Agreement (“ISDA Master Agreement”) under which a fund may trade OTC derivatives. An OTC transaction entered into under an ISDA Master Agreement typically involves a collateral posting arrangement, payment netting provisions and close-out netting provisions. These netting provisions allow for reduction of credit risk through netting of contractual obligations. The enforceability of the netting provisions of the ISDA Master Agreement depends on the governing law of the ISDA Master Agreement, among other factors.
For financial reporting purposes, the Fund does not offset OTC derivative assets or liabilities that are subject to ISDA Master Agreements in the Statement of Assets and Liabilities.
| 20 | Invesco Growth and Income Fund |
Value of Derivative Investments at Period-End
The table below summarizes the value of the Fund’s derivative investments, detailed by primary risk exposure, held as of August 31, 2019:
| | Value |
| Derivative Assets | Currency
Risk |
| Unrealized appreciation on forward foreign currency contracts outstanding | $3,840,578 |
| Derivatives not subject to master netting agreements | - |
| Total Derivative Assets subject to master netting agreements | $3,840,578 |
| | Value |
| Derivative Liabilities | Currency
Risk |
| Unrealized depreciation on forward foreign currency contracts outstanding | $(139,576) |
| Derivatives not subject to master netting agreements | - |
| Total Derivative Liabilities subject to master netting agreements | $(139,576) |
Offsetting Assets and Liabilities
The table below reflects the Fund’s exposure to Counterparties subject to either an ISDA Master Agreement or other agreement for OTC derivative transactions as of August 31, 2019.
| | Financial
Derivative
Assets | | Financial
Derivative
Liabilities | | Collateral
(Received)/Pledged | |
| Counterparty | Forward Foreign
Currency Contracts | | Forward Foreign
Currency Contracts | Net Value of
Derivatives | Non-Cash | Cash | Net
Amount |
| Bank of New York Mellon (The) | $ 2,940,652 | | $– | $ 2,940,652 | $– | $– | $ 2,940,652 |
| State Street Bank & Trust Co. | 899,926 | | (139,576) | 760,350 | – | – | 760,350 |
| Total | $ 3,840,578 | | $ (139,576) | $ 3,701,002 | $– | $– | $ 3,701,002 |
Effect of Derivative Investments for the year ended August 31, 2019
The table below summarizes the gains (losses) on derivative investments, detailed by primary risk exposure, recognized in earnings during the period:
| | Location of Gain on
Statement of Operations |
| | Currency
Risk |
| Realized Gain: | |
| Forward foreign currency contracts | $25,163,435 |
| Change in Net Unrealized Appreciation: | |
| Forward foreign currency contracts | 7,409,238 |
| Total | $32,572,673 |
The table below summarizes the average notional value of derivatives held during the period.
| | Forward
Foreign Currency
Contracts |
| Average notional value | $742,575,188 |
NOTE 5—Expense Offset Arrangement(s)
The expense offset arrangement is comprised of transfer agency credits which result from balances in demand deposit accounts used by the transfer agent for clearing shareholder transactions. For the year ended August 31, 2019, the Fund received credits from this arrangement, which resulted in the reduction of the Fund’s total expenses of $15,798.
NOTE 6—Trustees’ and Officers’ Fees and Benefits
Trustees’ and Officers’ Fees and Benefits include amounts accrued by the Fund to pay remuneration to certain Trustees and Officers of the Fund. Trustees have the option to defer compensation payable by the Fund, and Trustees’ and Officers’ Fees and Benefits also include amounts accrued by the Fund to fund such deferred compensation amounts. Those Trustees who defer compensation have the option to select various Invesco Funds in which their deferral accounts shall be deemed to be invested. Finally, certain current Trustees were eligible to participate in a retirement plan that provided for benefits to be paid upon retirement to Trustees over a period of time based on the number of years of service. The Fund may have certain former Trustees who also participate in a retirement plan and receive benefits under such plan.Trustees’ and Officers’ Fees and Benefits include amounts
| 21 | Invesco Growth and Income Fund |
accrued by the Fund to fund such retirement benefits. Obligations under the deferred compensation and retirement plans represent unsecured claims against the general assets of the Fund.
NOTE 7—Cash Balances
The Fund is permitted to temporarily carry a negative or overdrawn balance in its account with SSB, the custodian bank. Such balances, if any at period-end, are shown in the Statement of Assets and Liabilities under the payable captionAmount due custodian. To compensate the custodian bank for such overdrafts, the overdrawn Fund may either (1) leave funds as a compensating balance in the account so the custodian bank can be compensated by earning the additional interest; or (2) compensate by paying the custodian bank at a rate agreed upon by the custodian bank and Invesco, not to exceed the contractually agreed upon rate. The Fund may not purchase additional securities when any borrowings from banks or broker-dealers exceed 5% of the Fund’s total assets, or when any borrowings from an Invesco Fund are outstanding.
NOTE 8—Distributions to Shareholders and Tax Components of Net Assets
| Tax Character of Distributions to Shareholders Paid During the Fiscal Years Ended August 31, 2019 and August 31, 2018 |
| | 2019 | 2018 |
| Ordinary income | $144,724,735 | $165,328,326 |
| Long-term capital gain | 739,045,482 | 714,094,719 |
| Total distributions | $883,770,217 | $879,423,045 |
| Tax Components of Net Assets at Period-End: |
| | 2019 |
| Undistributed ordinary income | $33,917,524 |
| Undistributed long-term capital gain | 443,625,876 |
| Net unrealized appreciation — investments | 1,155,440,404 |
| Net unrealized appreciation (depreciation) — foreign currencies | (15,575) |
| Temporary book/tax differences | (689,378) |
| Shares of beneficial interest | 5,094,710,014 |
| Total net assets | $6,726,988,865 |
The difference between book-basis and tax-basis unrealized appreciation (depreciation) is due to differences in the timing of recognition of gains and losses on investments for tax and book purposes. The Fund’s net unrealized appreciation (depreciation) difference is attributable primarily to wash sales and forward contracts.
The temporary book/tax differences are a result of timing differences between book and tax recognition of income and/or expenses. The Fund’s temporary book/tax differences are the result of the trustee deferral of compensation and retirement plan benefits.
Capital loss carryforward is calculated and reported as of a specific date. Results of transactions and other activity after that date may affect the amount of capital loss carryforward actually available for the Fund to utilize. Capital losses generated in years beginning after December 22, 2010 can be carried forward for an unlimited period, whereas previous losses expire in eight tax years. Capital losses with an expiration period may not be used to offset capital gains until all net capital losses without an expiration date have been utilized. Capital loss carryforwards with no expiration date will retain their character as either short-term or long-term capital losses instead of as short-term capital losses as under prior law. The ability to utilize capital loss carryforwards in the future may be limited under the Internal Revenue Code and related regulations based on the results of future transactions.
The Fund does not have a capital loss carryforward as of August 31, 2019.
NOTE 9—Investment Transactions
The aggregate amount of investment securities (other than short-term securities, U.S. Treasury obligations and money market funds, if any) purchased and sold by the Fund during the year ended August 31, 2019 was $1,636,527,123 and $2,646,551,744, respectively. Cost of investments, including any derivatives, on a tax basis includes the adjustments for financial reporting purposes as of the most recently completed federal income tax reporting period-end.
| Unrealized Appreciation (Depreciation) of Investments on a Tax Basis |
| Aggregate unrealized appreciation of investments | $1,541,961,465 |
| Aggregate unrealized (depreciation) of investments | (386,521,061) |
| Net unrealized appreciation of investments | $1,155,440,404 |
Cost of investments for tax purposes is $5,629,781,458.
NOTE 10—Reclassification of Permanent Differences
Primarily as a result of differing book/tax treatment of distributions and foreign currency transactions, on August 31, 2019, undistributed net investment income was increased by $1,739,231, undistributed net realized gain was increased by $1,454,908 and shares of beneficial interest was decreased by $3,194,139. This reclassification had no effect on the net assets of the Fund.
| 22 | Invesco Growth and Income Fund |
NOTE 11—Share Information
| | Summary of Share Activity |
| | Years ended August 31, |
| | 2019(a) | | 2018 |
| | Shares | Amount | | Shares | Amount |
| Sold: | | | | | |
| Class A | 11,003,573 | $258,990,000 | | 12,142,515 | $333,985,416 |
| Class B(b) | - | - | | 1,748 | 49,140 |
| Class C | 627,526 | 14,332,894 | | 837,159 | 22,842,780 |
| Class R | 530,933 | 12,499,672 | | 560,415 | 15,432,322 |
| Class Y | 6,321,356 | 149,705,792 | | 9,734,057 | 267,911,219 |
| Class R5 | 6,597,748 | 155,506,889 | | 8,217,159 | 225,342,220 |
| Class R6 | 12,572,399 | 298,876,054 | | 13,411,692 | 370,076,030 |
| Issued as reinvestment of dividends: | | | | | |
| Class A | 18,355,632 | 397,644,474 | | 15,302,905 | 408,842,647 |
| Class B(b) | - | - | | 53,025 | 1,404,068 |
| Class C | 1,040,751 | 22,083,019 | | 918,205 | 24,246,579 |
| Class R | 544,241 | 11,784,185 | | 476,435 | 12,741,923 |
| Class Y | 5,672,909 | 123,099,534 | | 4,446,429 | 118,848,666 |
| Class R5 | 4,630,645 | 100,719,811 | | 3,460,373 | 92,593,352 |
| Class R6 | 8,400,921 | 182,846,296 | | 6,643,791 | 177,799,605 |
| Conversion of Class B shares to Class A shares:(c) | | | | | |
| Class A | - | - | | 430,282 | 12,508,305 |
| Class B | - | - | | (435,199) | (12,508,305) |
| Automatic conversion of Class C shares to Class A shares: | | | | | |
| Class A | 5,524,023 | 122,941,791 | | - | - |
| Class C | (5,599,603) | (122,941,791) | | - | - |
| Reacquired: | | | | | |
| Class A | (30,692,774) | (728,896,489) | | (29,000,432) | (799,442,460) |
| Class B(b) | - | - | | (270,122) | (7,584,769) |
| Class C | (1,649,175) | (38,358,500) | | (2,133,616) | (57,889,952) |
| Class R | (1,589,407) | (37,865,062) | | (1,211,242) | (33,315,775) |
| Class Y | (17,004,714) | (398,452,157) | | (10,174,298) | (280,013,984) |
| Class R5 | (12,512,149) | (296,706,586) | | (6,965,081) | (191,383,672) |
| Class R6 | (16,288,449) | (395,014,752) | | (19,234,756) | (533,755,635) |
| Net increase (decrease) in share activity | (3,513,614) | $(167,204,926) | | 7,211,444 | $168,729,720 |
| (a) | There are entities that are record owners of more than 5% of the outstanding shares of the Fund and in the aggregate own 30% of the outstanding shares of the Fund. IDI has an agreement with these entities to sell Fund shares. The Fund, Invesco and/or Invesco affiliates may make payments to these entities, which are considered to be related to the Fund, for providing services to the Fund, Invesco and/or Invesco affiliates including but not limited to services such as securities brokerage, distribution, third party record keeping and account servicing. The Fund has no knowledge as to whether all or any portion of the shares owned of record by these entities are also owned beneficially. |
| (b) | Class B shares activity for the period September 1, 2017 through January 26, 2018 (date of conversion). |
| (c) | Effective as of the close of business January 26, 2018, all outstanding Class B shares were converted to Class A shares. |
| 23 | Invesco Growth and Income Fund |
Report of Independent Registered Public Accounting Firm
To the Board of Trustees of AIM Counselor Series Trust (Invesco Counselor Series Trust) and Shareholders of Invesco Growth and Income Fund
Opinion on the Financial Statements
We have audited the accompanying statement of assets and liabilities, including the schedule of investments, of Invesco Growth and Income Fund (one of the funds constituting AIM Counselor Series Trust (Invesco Counselor Series Trust), hereafter referred to as the “Fund”) as of August 31, 2019, the related statement of operations for the year ended August 31, 2019, the statement of changes in net assets for each of the two years in the period ended August 31, 2019, including the related notes, and the financial highlights for each of the five years in the period ended August 31, 2019 (collectively referred to as the “financial statements”). In our opinion, the financial statements present fairly, in all material respects, the financial position of the Fund as of August 31, 2019, the results of its operations for the year then ended, the changes in its net assets for each of the two years in the period ended August 31, 2019 and the financial highlights for each of the five years in the period ended August 31, 2019 in conformity with accounting principles generally accepted in the United States of America.
Basis for Opinion
These financial statements are the responsibility of the Fund’s management. Our responsibility is to express an opinion on the Fund’s financial statements based on our audits. We are a public accounting firm registered with the Public Company Accounting Oversight Board (United States) (PCAOB) and are required to be independent with respect to the Fund in accordance with the U.S. federal securities laws and the applicable rules and regulations of the Securities and Exchange Commission and the PCAOB.
We conducted our audits of these financial statements in accordance with the standards of the PCAOB. Those standards require that we plan and perform the audit to obtain reasonable assurance about whether the financial statements are free of material misstatement, whether due to error or fraud.
Our audits included performing procedures to assess the risks of material misstatement of the financial statements, whether due to error or fraud, and performing procedures that respond to those risks. Such procedures included examining, on a test basis, evidence regarding the amounts and disclosures in the financial statements. Our audits also included evaluating the accounting principles used and significant estimates made by management, as well as evaluating the overall presentation of the financial statements. Our procedures included confirmation of securities owned as of August 31, 2019 by correspondence with the custodian, transfer agent and brokers; when replies were not received from brokers, we performed other auditing procedures. We believe that our audits provide a reasonable basis for our opinion.
/s/ PricewaterhouseCoopers LLP
Houston, Texas
October 29, 2019
We have served as the auditor of one or more of the investment companies in the Invesco group of investment companies since at least 1995. We have not been able to determine the specific year we began serving as auditor.
| 24 | Invesco Growth and Income Fund |
Calculating your ongoing Fund expenses
Example
As a shareholder of the Fund, you incur two types of costs: (1) transaction costs, which may include sales charges (loads) on purchase payments or contingent deferred sales charges on redemptions, if any; and (2) ongoing costs, including management fees, distribution and/or service (12b-1) fees, and other Fund expenses. This example is intended to help you understand your ongoing costs (in dollars) of investing in the Fund and to compare these costs with ongoing costs of investing in other mutual funds. The example is based on an investment of $1,000 invested at the beginning of the period and held for the entire period March 1, 2019 through August 31, 2019.
Actual expenses
The table below provides information about actual account values and actual expenses. You may use the information in this table, together with the amount you invested, to estimate the expenses that you paid over the period. Simply divide your account value by $1,000 (for example, an $8,600 account value divided by $1,000 = 8.6), then multiply the result by the number in the table under the heading entitled “Actual Expenses Paid During Period” to estimate the expenses you paid on your account during this period.
Hypothetical example for comparison purposes
The table below also provides information about hypothetical account values and hypothetical expenses based on the Fund’s actual expense ratio and an assumed rate of return of 5% per year before expenses, which is not the Fund’s actual return.
The hypothetical account values and expenses may not be used to estimate the actual ending account balance or expenses you paid for the period. You may use this information to compare the ongoing costs of investing in the Fund and other funds. To do so, compare this 5% hypothetical example with the 5% hypothetical examples that appear in the shareholder reports of the other funds.
Please note that the expenses shown in the table are meant to highlight your ongoing costs only and do not reflect any transaction costs, such as sales charges (loads) on purchase payments or contingent deferred sales charges on redemptions, if any. Therefore, the hypothetical information is useful in comparing ongoing costs only, and will not help you determine the relative total costs of owning different funds. In addition, if these transaction costs were included, your costs would have been higher.
| | Beginning
Account Value (03/01/19) | ACTUAL | HYPOTHETICAL
(5% annual return before
expenses) | Annualized
Expense
Ratio |
Ending
Account Value
(08/31/19)1 | Expenses
Paid During
Period2 | Ending
Account Value
(08/31/19) | Expenses
Paid During
Period2 |
| Class A | $1,000.00 | $999.10 | $4.08 | $1,021.12 | $4.13 | 0.81% |
| Class C | 1,000.00 | 995.80 | 7.50 | 1,017.69 | 7.58 | 1.49 |
| Class R | 1,000.00 | 997.90 | 5.34 | 1,019.86 | 5.40 | 1.06 |
| Class Y | 1,000.00 | 1,000.30 | 2.82 | 1,022.38 | 2.85 | 0.56 |
| Class R5 | 1,000.00 | 1,000.70 | 2.42 | 1,022.79 | 2.45 | 0.48 |
| Class R6 | 1,000.00 | 1,001.10 | 1.92 | 1,023.29 | 1.94 | 0.38 |
| 1 | The actual ending account value is based on the actual total return of the Fund for the period March 1, 2019 through August 31, 2019, after actual expenses and will differ from the hypothetical ending account value which is based on the Fund’s expense ratio and a hypothetical annual return of 5% before expenses. |
| 2 | Expenses are equal to the Fund’s annualized expense ratio as indicated above multiplied by the average account value over the period, multiplied by 184/365 to reflect the most recent fiscal half year. |
| 25 | Invesco Growth and Income Fund |
Approval of Investment Advisory and Sub-Advisory Contracts
At meetings held on June 10, 2019, the Board of Trustees (the Board or the Trustees) of AIM Counselor Series Trust (Invesco Counselor Series Trust) as a whole, and the independent Trustees, who comprise over 75% of the Board, voting separately, approved the continuance of the Invesco Growth and Income Fund’s (the Fund) Master Investment Advisory Agreement with Invesco Advisers, Inc. (Invesco Advisers and the investment advisory agreement) and the Master IntergroupSub-Advisory Contract for Mutual Funds with Invesco Asset Management Deutschland GmbH, Invesco Asset Management Limited, Invesco Asset Management (Japan) Limited, Invesco Hong Kong Limited, Invesco Senior Secured Management, Inc. and Invesco Canada Ltd. (collectively, the AffiliatedSub-Advisers and thesub-advisory contracts) for another year, effective July 1, 2019. After evaluating the factors discussed below, among others, the Board approved the renewal of the Fund’s investment advisory agreement and thesub-advisory contracts and determined that the compensation payable by the Fund to Invesco Advisers and by Invesco Advisers to the AffiliatedSub-Advisers is fair and reasonable.
The Board’s Evaluation Process
The Board’s Investments Committee has established threeSub-Committees, which meet throughout the year to review the performance of funds advised by Invesco Advisers (the Invesco Funds). As part of a regularly scheduled basis ofin-person Board meetings, theSub-Committees meet with portfolio managers for their assigned Invesco Funds and other members of management to review detailed information about investment performance and portfolio attributes of these funds. The Board took into account evaluations and reports that it received from the Investments Committee andSub-Committees, as well as the information provided to such committees and the Board throughout the year, in considering whether to approve each Invesco Fund’s investment advisory agreement andsub-advisory contracts.
As part of the contract renewal process, the Board reviews and considers information provided in response to detailed requests for information submitted to management by the independent Trustees with assistance from legal counsel to the independent Trustees. The Board receives comparative investment performance and fee data regarding the Invesco Funds prepared by Invesco Advisers and Broadridge Financial Solutions, Inc. (Broadridge), an independent mutual fund data provider. The Board also receives an independent written evaluation from the Senior Officer, an officer of the Invesco Funds who reports directly to the independent Trustees. The Senior Officer’s evaluation is prepared as part of his responsibility to manage the process by which the Invesco Funds’ proposed management fees
are negotiated during the annual contract renewal process to ensure they are negotiated in a manner that is at arms’ length and reasonable. In addition to meetings with Invesco Advisers and fund counsel throughout the year, the independent Trustees also discuss the continuance of the investment advisory agreement andsub-advisory contracts in separate sessions with the Senior Officer and with independent legal counsel.
The discussion below is a summary of the Senior Officer’s independent written evaluation with respect to the Fund’s investment advisory agreement, as well as a discussion of the material factors and related conclusions that formed the basis for the Board’s approval of the Fund’s investment advisory agreement andsub-advisory contracts. The Trustees’ review and conclusions are based on the comprehensive consideration of all information presented to them during the course of the year and in prior years and are not the result of any single determinative factor. Moreover, one Trustee may have weighed a particular piece of information or factor differently than another Trustee. This information is current as of June 10, 2019.
Factors and Conclusions and Summary of Independent Written Fee Evaluation
| A. | Nature, Extent and Quality of Services Provided by Invesco Advisers and the AffiliatedSub-Advisers |
The Board reviewed the nature, extent and quality of the advisory services provided to the Fund by Invesco Advisers under the Fund’s investment advisory agreement, and the credentials and experience of the officers and employees of Invesco Advisers who provide these services, including the Fund’s portfolio manager(s). The Board’s review included consideration of Invesco Advisers’ investment process oversight and structure, credit analysis and investment risk management. The Board also considerednon-advisory services that Invesco Advisers and its affiliates provide to the Invesco Funds such as various back office support functions, third party oversight, internal audit, valuation, portfolio trading and legal and compliance. The Board also received and reviewed information about Invesco Advisers’ role as administrator of the Invesco Funds’ liquidity risk management program. The Board also reviewed and considered the benefits to shareholders of investing in a fund that is part of the Invesco family of funds under the umbrella of Invesco Ltd., Invesco Advisers’ parent company, and noted Invesco Ltd.’s depth and experience in conducting an investment management business, as well as its commitment of financial and other resources to such business. The Board reviewed and considered information about the resources that Invesco Advisers intends to continue to
commit to managing the Invesco family of funds following Invesco Ltd.’s acquisition of OppenheimerFunds, Inc. and its subsidiaries. The Board concluded that the nature, extent and quality of the services provided to the Fund by Invesco Advisers are appropriate and satisfactory.
The Board reviewed the services that may be provided by the AffiliatedSub-Advisers under thesub-advisory contracts and the credentials and experience of the officers and employees of the AffiliatedSub-Advisers who provide these services. The Board noted the AffiliatedSub-Advisers’ expertise with respect to certain asset classes and that the AffiliatedSub-Advisers have offices and personnel that are located in financial centers around the world. As a result, the Board noted that the AffiliatedSub-Advisers can provide research and investment analysis on the markets and economies of various countries in which the Fund may invest, make recommendations regarding securities and assist with security trades. The Board concluded that thesub-advisory contracts may benefit the Fund and its shareholders by permitting Invesco Advisers to use the resources and talents of the AffiliatedSub-Advisers in managing the Fund. The Board concluded that the nature, extent and quality of the services that may be provided by the AffiliatedSub-Advisers are appropriate and satisfactory.
| B. | Fund Investment Performance |
The Board considered Fund investment performance as a relevant factor in considering whether to approve the investment advisory agreement. The Board did not view Fund investment performance as a relevant factor in considering whether to approve thesub-advisory contracts for the Fund, as no AffiliatedSub-Adviser currently manages assets of the Fund.
The Board compared the Fund’s investment performance over multiple time periods ending December 31, 2018 to the performance of funds in the Broadridge performance universe and against the LipperLarge-Cap Value Funds Index. The Board noted that performance of Class A shares of the Fund was in the fifth quintile of its performance universe for the one year period and the fourth quintile for the three and five year periods (the first quintile being the best performing funds and the fifth quintile being the worst performing funds). The Board noted that performance of Class A shares of the Fund was below the performance of the Index for the one, three and five year periods. The Board noted that the Fund’s overweight and underweight exposure to and stock selection in certain sectors negatively impacted performance. The Trustees also reviewed more recent Fund performance and this review did not change their conclusions.
26 Invesco Growth and Income Fund
| C. | Advisory andSub-Advisory Fees and Fund Expenses |
The Board compared the Fund’s contractual management fee rate to the contractual management fee rates of funds in the Fund’s Broadridge expense group. The Board noted that the contractual management fee rate for Class A shares of the Fund was below the median contractual management fee rate of funds in its expense group. The Board noted that the term “contractual management fee” for funds in the expense group may include both advisory and certainnon-portfolio management administrative services fees, but that Broadridge does not provide information on a fund by fund basis as to what is included. The Board also reviewed the methodology used by Broadridge in providing expense group information, which includes using each fund’s contractual management fee schedule (including any applicable breakpoints) as reported in the most recent prospectus or statement of additional information for each fund in the expense group. The Board also considered comparative information regarding the Fund’s total expense ratio and its various components.
The Board noted that Invesco Advisers has contractually agreed to waive fees and/or limit expenses of the Fund for the term disclosed in the Fund’s registration statement in an amount necessary to limit total annual operating expenses to a specified percentage of average daily net assets for each class of the Fund.
The Board also considered the fees charged by Invesco Advisers and the AffiliatedSub-Advisers to other similarly managed client accounts. The Board noted that Invesco Advisers or the AffiliatedSub-Advisers may charge lower fees to large institutional clients. Invesco Advisers reviewed with the Board differences in the scope of services it provides to the Invesco Funds relative to certain other types of client accounts, including management of cash flows as a result of redemptions and purchases, necessary infrastructure such as officers, office space, technology, legal and distribution, oversight of service providers, costs and business risks associated with launching new funds and sponsoring and maintaining the product line, preparation of annual registration statement updates and financial information and compliance with federal and state laws and regulations.
The Board also compared the Fund’s effective advisory fee rate (the advisory fee rate after advisory fee waivers and before other expense limitations/waivers) to the effective advisory fee rates of other similarly managed third-party mutual funds advised orsub-advised by Invesco Advisers and its affiliates, based on asset balances as of December 31, 2018.
The Board also considered the services that may be provided by the AffiliatedSub-Advisers pursuant to thesub-advisory contracts, as well as the fees payable by Invesco Advisers to the AffiliatedSub-Advisers pursuant to thesub-advisory contracts.
| D. | Economies of Scale and Breakpoints |
The Board considered the extent to which there may be economies of scale in the provision of advisory services to the Fund. The Board considered Invesco’s reinvestment in its business, including investments in business infrastructure and cybersecurity. The Board also considered that the Fund benefits from economies of scale through contractual breakpoints in the Fund’s advisory fee schedule, which generally operate to reduce the Fund’s expense ratio as it grows in size. The Board noted that the Fund shares directly in economies of scale through lower fees charged by third party service providers based on the combined size of the Invesco Funds. The Board noted that the Fund may also benefit from economies of scale through initial fee setting, fee waivers and expense reimbursements.
| E. | Profitability and Financial Resources |
The Board reviewed information from Invesco Advisers concerning the costs of the advisory and other services that Invesco Advisers and its affiliates provide to the Fund and the Invesco Funds and the profitability of Invesco Advisers and its affiliates in providing these services. The Board considered the methodology used for calculating profitability and noted the periodic review of such methodology by an independent consultant. The Board noted that Invesco Advisers continues to operate at a net profit from services Invesco Advisers and its affiliates provide to the Invesco Funds and the Fund. The Board did not deem the level of profits realized by Invesco Advisers and its affiliates from providing services to the Fund to be excessive given the nature, extent and quality of the services provided. The Board received information from Invesco Advisers demonstrating that Invesco Advisers and the AffiliatedSub-Advisers are financially sound and have the resources necessary to perform their obligations under the investment advisory agreement andsub-advisory contracts.
| F. | Collateral Benefits to Invesco Advisers and its Affiliates |
The Board considered various other benefits received by Invesco Advisers and its affiliates from the relationship with the Fund, including the fees received for providing administrative, transfer agency and distribution services to the Fund. The Board considered comparative information regarding fees charged for these services, including information provided by Broadridge and other independent sources. The Board considered the performance of Invesco Advisers and its affiliates in providing these services and the organizational structure employed to provide these services. The Board also considered that these services are provided to the Fund pursuant to written contracts that are reviewed and approved on an annual basis by the Board; and that the services are required for the operation of the Fund.
The Board considered the benefits realized by Invesco Advisers and the AffiliatedSub-Advisers as a result of portfolio brokerage transactions executed through “soft dollar” arrangements.
The Board noted that soft dollar arrangements may result in the Fund bearing costs to purchase research that may be used by Invesco Advisers or the AffiliatedSub-Advisers with other clients and may reduce Invesco Advisers’ or the AffiliatedSub-Advisers’ expenses. The Board also considered that it receives periodic reports from Invesco representing that these arrangements are consistent with regulatory requirements. The Board did not deem the soft dollar arrangements to be inappropriate.
The Board considered that the Fund’s uninvested cash and cash collateral from any securities lending arrangements may be invested in money market funds advised by Invesco Advisers pursuant to procedures approved by the Board. The Board considered information regarding the returns of the affiliated money market funds relative to comparable overnight investments, as well as the costs to the Fund of such investments. The Board noted that Invesco Advisers receives advisory fees from these affiliated money market funds attributable to such investments, although Invesco Advisers has contractually agreed to waive through varying periods the advisory fees payable by the Invesco Funds with respect to certain investments in the affiliated money market funds. The waiver is in an amount equal to 100% of the net advisory fee Invesco Advisers receives from the affiliated money market funds with respect to the Fund’s investment in the affiliated money market funds of uninvested cash, but not cash collateral. The Board concluded that the amount of advisory fees received by Invesco Advisers from the Fund’s investment of cash collateral from any securities lending arrangements in the affiliated money market funds is fair and reasonable.
The Board also considered that an affiliated broker may receive commissions for executing certain trades for the Fund. Invesco Advisers and the AffiliatedSub-Advisers may use the affiliated broker to, among other things, control order routing and minimize information leakage, and the Board was advised that such trades are executed in compliance with rules under the federal securities laws and consistent with best execution obligations.
27 Invesco Growth and Income Fund
Tax Information
Form 1099-DIV, Form 1042-S and other year–end tax information provide shareholders with actual calendar year amounts that should be included in their tax returns. Shareholders should consult their tax advisers.
The following distribution information is being provided as required by the Internal Revenue Code or to meet a specific state’s requirement.
The Fund designates the following amounts or, if subsequently determined to be different, the maximum amount allowable for its fiscal year ended August 31, 2019:
| Federal and State Income Tax | |
| Long-Term Capital Gain Distributions | $739,045,482 |
| Qualified Dividend Income* | 100.00% |
| Corporate Dividends Received Deduction* | 91.55% |
| U.S. Treasury Obligations* | 0.00% |
| * | The above percentages are based on ordinary income dividends paid to shareholders during the Fund’s fiscal year. |
| | |
| Non-Resident Alien Shareholders | |
| Qualified Short-Term Gains | $6,626,766 |
| 28 | Invesco Growth and Income Fund |
Trustees and Officers
The address of each trustee and officer is AIM Counselor Series Trust (Invesco Counselor Series Trust) (the “Trust”), 11 Greenway Plaza, Suite 1000, Houston, Texas 77046-1173. The trustees serve for the life of the Trust, subject to their earlier death, incapacitation, resignation, retirement or removal as more specifically provided in the Trust’s organizational documents. Each officer serves for a one year term or until their successors are elected and qualified. Column two below includes length of time served with predecessor entities, if any.
| | | | | | | | |
Name, Year of Birth and Position(s) Held with the Trust | | Trustee and/ or Officer Since | | Principal Occupation(s) During Past 5 Years | | Number of Funds in Fund
Complex
Overseen by
Trustee | | Other Directorship(s) Held by Trustee During Past 5 Years |
| Interested Persons | | | | | | | | |
Martin L. Flanagan1 — 1960 Trustee and Vice Chair | | 2007 | | Executive Director, Chief Executive Officer and President, Invesco Ltd. (ultimate parent of Invesco and a global investment management firm); Trustee and Vice Chair, The Invesco Funds; Vice Chair, Investment Company Institute; and Member of Executive Board, SMU Cox School of Business Formerly: Advisor to the Board, Invesco Advisers, Inc. (formerly known as Invesco Institutional (N.A.), Inc.); Chairman and Chief Executive Officer, Invesco Advisers, Inc. (registered investment adviser); Director, Chairman, Chief Executive Officer and President, Invesco Holding Company (US), Inc. (formerly IVZ Inc.) (holding company), Invesco Group Services, Inc. (service provider) and Invesco North American Holdings, Inc. (holding company); Director, Chief Executive Officer and President, Invesco Holding Company Limited (parent of Invesco and a global investment management firm); Director, Invesco Ltd.; Chairman, Investment Company Institute and President,Co-Chief Executive Officer,Co-President, Chief Operating Officer and Chief Financial Officer, Franklin Resources, Inc. (global investment management organization) | | 229 | | None |
Philip A. Taylor2 — 1954 Trustee | | 2006 | | Vice Chair, Invesco Ltd.; Trustee, The Invesco Funds Formerly: Director, Invesco Canada Ltd. (formerly known as Invesco Trimark Ltd./Invesco Trimark Ltèe) (registered investment adviser and registered transfer agent); Head of the Americas and Senior Managing Director, Invesco Ltd.; Director, Invesco Advisers, Inc. (formerly known as Invesco Institutional (N.A.), Inc.) (registered investment adviser); Director and Chairman, Invesco Investment Services, Inc. (formerly known as Invesco AIM Investment Services, Inc.) (registered transfer agent); Chief Executive Officer, Invesco Corporate Class Inc. (corporate mutual fund company); Chairman and Chief Executive Officer, Invesco Canada Ltd. (formerly known as Invesco Trimark Ltd./Invesco Trimark Ltèe) (registered investment adviser and registered transfer agent); Senior Vice President, The Invesco Funds; Director, Invesco Investment Advisers LLC (formerly known as Van Kampen Asset Management); Director, Chairman, Chief Executive Officer and President, Invesco Management Group, Inc. (formerly known as Invesco AIM Management Group, Inc.) (financial services holding company);Co-Chairman,Co-President andCo-Chief Executive Officer, Invesco Advisers, Inc. (formerly known as Invesco Institutional (N.A.), Inc.) (registered investment adviser); Director, Chief Executive Officer and President, Van Kampen Exchange Corp; President and Principal Executive Officer, The Invesco Funds (other than AIM Treasurer’s Series Trust (Invesco Treasurer’s Series Trust), Short-Term Investments Trust and Invesco Management Trust); Executive Vice President, The Invesco Funds (AIM Treasurer’s Series Trust (Invesco Treasurer’s Series Trust), Short-Term Investments Trust and Invesco Management Trust only); Director and President, INVESCO Funds Group, Inc. (registered investment adviser and registered transfer agent); Director and Chairman, IVZ Distributors, Inc. (formerly known as INVESCO Distributors, Inc.) (registered broker dealer); Director, President and Chairman, Invesco Inc. (holding company), Invesco Canada Holdings Inc. (holding company), Trimark Investments Ltd./Placements Trimark Ltèe and Invesco Financial Services Ltd/Services Financiers Invesco Ltèe; Chief Executive Officer, Invesco Canada Fund Inc. (corporate mutual fund company); Director and Chairman, Van Kampen Investor Services Inc.; Director, Chief Executive Officer and President, 1371 Preferred Inc. (holding company) and Van Kampen Investments Inc.; Director and President, AIM GP Canada Inc. (general partner for limited partnerships) and Van Kampen Advisors, Inc.; Director and Chief Executive Officer, Invesco Trimark Dealer Inc. (registered broker dealer); Director, Invesco Distributors, Inc. (formerly known as Invesco AIM Distributors, Inc.) (registered broker dealer); Manager, Invesco Capital Management LLC; Director, Chief Executive Officer and President, Invesco Advisers, Inc.; Director, Chairman, Chief Executive Officer and President, Invesco AIM Capital Management, Inc.; President, Invesco Trimark Dealer Inc. and Invesco Trimark Ltd./Invesco Trimark Ltèe; Director and President, AIM Trimark Corporate Class Inc. and AIM Trimark Canada Fund Inc.; Senior Managing Director, Invesco Holding Company Limited; Director and Chairman, Fund Management Company (former registered broker dealer); President and Principal Executive Officer, The Invesco Funds (AIM Treasurer’s Series Trust (Invesco Treasurer’s Series Trust), and Short-Term Investments Trust only); President, AIM Trimark Global Fund Inc. and AIM Trimark Canada Fund Inc. | | 229 | | None |
| 1 | Mr. Flanagan is considered an interested person (within the meaning of Section 2(a)(19) of the 1940 Act) of the Trust because he is an officer of the Adviser to the Trust, and an officer and a director of Invesco Ltd., ultimate parent of the Adviser. |
| 2 | Mr. Taylor is considered an interested person (within the meaning of Section 2(a)(19) of the 1940 Act) of the Trust because he is an officer of Invesco Ltd., ultimate parent of the Adviser. |
T-1 Invesco Growth and Income Fund
Trustees and Officers—(continued)
| | | | | | | | |
Name, Year of Birth and Position(s) Held with the Trust | | Trustee and/ or Officer Since | | Principal Occupation(s)
During Past 5 Years | | Number of
Funds in Fund
Complex
Overseen by
Trustee | | Other Directorship(s) Held by Trustee During
Past 5 Years |
| Independent Trustees | | | | | | | | |
Bruce L. Crockett — 1944 Trustee and Chair | | 2003 | | Chairman, Crockett Technologies Associates (technology consulting company) Formerly: Director, Captaris (unified messaging provider); Director, President and Chief Executive Officer, COMSAT Corporation; Chairman, Board of Governors of INTELSAT (international communications company); ACE Limited (insurance company); Independent Directors Council and Investment Company Institute: Member of the Audit Committee, Investment Company Institute; Member of the Executive Committee and Chair of the Governance Committee, Independent Directors Council | | 229 | | Director and Chairman of the Audit Committee, ALPS (Attorneys Liability Protection Society) (insurance company); Director and Member of the Audit Committee and Compensation Committee, Ferroglobe PLC (metallurgical company) |
David C. Arch — 1945 Trustee | | 2010 | | Chairman of Blistex Inc. (consumer health care products manufacturer); Member, World Presidents’ Organization | | 229 | | Board member of the Illinois Manufacturers’ Association |
Beth Ann Brown — 1968 Trustee | | 2019 | | Independent Consultant Formerly: Head of Intermediary Distribution, Managing Director, Strategic Relations, Managing Director, Head of National Accounts, Senior Vice President, National Account Manager and Senior Vice President, Key Account Manager, Columbia Management Investment Advisers LLC; Vice President, Key Account Manager, Liberty Funds Distributor, Inc.; and Trustee of certain Oppenheimer Funds | | 229 | | Director, Board of Directors of Caron Engineering Inc.; Advisor, Board of Advisors of Caron Engineering Inc.; President and Director, Acton Shapleigh Youth Conservation Corps (non -profit); and Vice President and Director of Grahamtastic Connection(non-profit) |
Jack M. Fields — 1952 Trustee | | 2003 | | Chief Executive Officer, Twenty First Century Group, Inc. (government affairs company); and Chairman, Discovery Learning Alliance(non-profit) Formerly: Owner and Chief Executive Officer, Dos Angeles Ranch L.P. (cattle, hunting, corporate entertainment); Director, Insperity, Inc. (formerly known as Administaff) (human resources provider); Chief Executive Officer, Texana Timber LP (sustainable forestry company); Director of Cross Timbers Quail Research Ranch(non-profit); and member of the U.S. House of Representatives | | 229 | | None |
Cynthia Hostetler — 1962 Trustee | | 2017 | | Non-Executive Director and Trustee of a number of public and private business corporations Formerly: Director, Aberdeen Investment Funds (4 portfolios); Head of Investment Funds and Private Equity, Overseas Private Investment Corporation; President, First Manhattan Bancorporation, Inc.; Attorney, Simpson Thacher & Bartlett LLP | | 229 | | Vulcan Materials Company (construction materials company); Trilinc Global Impact Fund; Genesee & Wyoming, Inc. (railroads); Artio Global Investment LLC (mutual fund complex); Edgen Group, Inc. (specialized energy and infrastructure products distributor); Investment Company Institute (professional organization); Independent Directors Council (professional organization) |
Eli Jones — 1961 Trustee | | 2016 | | Professor and Dean, Mays Business School — Texas A&M University Formerly: Professor and Dean, Walton College of Business, University of Arkansas and E.J. Ourso College of Business, Louisiana State University; Director, Arvest Bank | | 229 | | Insperity, Inc. (formerly known as Administaff) (human resources provider) |
Elizabeth Krentzman — 1959 Trustee | | 2019 | | Formerly: Principal and Chief Regulatory Advisor for Asset Management Services and U.S. Mutual Fund Leader of Deloitte & Touche LLP; General Counsel of the Investment Company Institute (trade association); National Director of the Investment Management Regulatory Consulting Practice, Principal, Director and Senior Manager of Deloitte & Touche LLP; Assistant Director of the Division of Investment Management — Office of Disclosure and Investment Adviser Regulation of the U.S. Securities and Exchange Commission and various positions with the Division of Investment Management — Office of Regulatory Policy of the U.S. Securities and Exchange Commission; Associate at Ropes & Gray LLP; Advisory Board Member of the Securities and Exchange Commission Historical Society; and Trustee of certain Oppenheimer Funds | | 229 | | Trustee of the University of Florida National Board Foundation and Audit Committee Member; Member of the Cartica Funds Board of Directors (private investment funds); Member of the University of Florida Law Center Association, Inc. Board of Trustees and Audit Committee Member |
Anthony J. LaCava, Jr. — 1956 Trustee | | 2019 | | Formerly: Director and Member of the Audit Committee, Blue Hills Bank (publicly traded financial institution) and Managing Partner, KPMG LLP | | 229 | | Blue Hills Bank; Chairman, Bentley University; Member, Business School Advisory Council; and Nominating Committee, KPMG LLP |
T-2 Invesco Growth and Income Fund
Trustees and Officers—(continued)
| | | | | | | | |
Name, Year of Birth and Position(s) Held with the Trust | | Trustee and/ or Officer Since | | Principal Occupation(s)
During Past 5 Years | | Number of
Funds in Fund
Complex
Overseen by
Trustee | | Other Directorship(s) Held by Trustee During
Past 5 Years |
| Independent Trustees—(continued) |
Prema Mathai-Davis — 1950 Trustee | | 2003 | | Retired Co-Owner & Partner of Quantalytics Research, LLC, (a FinTech Investment Research Platform for the Self-Directed Investor) | | 229 | | None |
Joel W. Motley — 1952 Trustee | | 2019 | | Director of Office of Finance, Federal Home Loan Bank; Member of the Vestry of Trinity Wall Street; Managing Director of Carmona Motley Inc. (privately held financial advisor); Member of the Finance and Budget Committee of the Council on Foreign Relations, Member of the Investment Committee and Board of Human Rights Watch and Member of the Investment Committee and Board of Historic Hudson Valley(non-profit cultural organization) Formerly: Managing Director of Public Capital Advisors, LLC (privately held financial advisor); Managing Director of Carmona Motley Hoffman, Inc. (privately held financial advisor); Trustee of certain Oppenheimer Funds; and Director of Columbia Equity Financial Corp. (privately held financial advisor) | | 229 | | Director of Greenwall Foundation (bioethics research foundation); Member of Board and Investment Committee of The Greenwall Foundation; Director of Southern Africa Legal Services Foundation; Board Member and Investment Committee Member of Pulitzer Center for Crisis Reporting(non-profit journalism) |
Teresa M. Ressel — 1962 Trustee | | 2017 | | Non-executive director and trustee of a number of public and private business corporations Formerly: Chief Financial Officer, Olayan America, The Olayan Group (international investor/commercial/industrial); Chief Executive Officer, UBS Securities LLC; Group Chief Operating Officer, Americas, UBS AG; Assistant Secretary for Management & Budget and CFO, US Department of the Treasury | | 229 | | Atlantic Power Corporation (power generation company); ON Semiconductor Corp. (semiconductor supplier) |
Ann Barnett Stern — 1957 Trustee | | 2017 | | President and Chief Executive Officer, Houston Endowment Inc. (private philanthropic institution) Formerly: Executive Vice President and General Counsel, Texas Children’s Hospital; Attorney, Beck, Redden and Secrest, LLP; Business Law Instructor, University of St. Thomas; Attorney, Andrews & Kurth LLP | | 229 | | Federal Reserve Bank of Dallas |
Raymond Stickel, Jr. — 1944 Trustee | | 2005 | | Retired Formerly: Director, Mainstay VP Series Funds, Inc. (25 portfolios); Partner, Deloitte & Touche | | 229 | | None |
Robert C. Troccoli — 1949 Trustee | | 2016 | | Retired Formerly: Adjunct Professor, University of Denver — Daniels College of Business; Senior Partner, KPMG LLP | | 229 | | None |
Daniel S. Vandivort — 1954 Trustee | | 2019 | | Treasurer, Chairman of the Audit and Finance Committee, and Trustee, Board of Trustees, Huntington Disease Foundation of America; and President, Flyway Advisory Services LLC (consulting and property management) Formerly: Trustee and Governance Chair, of certain Oppenheimer Funds | | 229 | | Chairman and Lead Independent Director, Chairman of the Audit Committee, and Director, Board of Directors, Value Line Funds |
James D. Vaughn — 1945 Trustee | | 2019 | | Retired Formerly: Managing Partner, Deloitte & Touche LLP; Trustee and Chairman of the Audit Committee, Schroder Funds; Board Member, Mile High United Way, Boys and Girls Clubs, Boy Scouts, Colorado Business Committee for the Arts, Economic Club of Colorado and Metro Denver Network (economic development corporation); and Trustee of certain Oppenheimer Funds | | 229 | | Board member and Chairman of Audit Committee of AMG National Trust Bank; Trustee and Investment Committee member, University of South Dakota Foundation; Board member, Audit Committee Member and past Board Chair, Junior Achievement(non-profit) |
Christopher L. Wilson — 1957 Trustee, Vice Chair and Chair Designate | | 2017 | | Retired Formerly: Director, TD Asset Management USA Inc. (mutual fund complex) (22 portfolios); Managing Partner, CT2, LLC (investing and consulting firm); President/Chief Executive Officer, Columbia Funds, Bank of America Corporation; President/Chief Executive Officer, CDC IXIS Asset Management Services, Inc.; Principal & Director of Operations, Scudder Funds, Scudder, Stevens & Clark, Inc.; Assistant Vice President, Fidelity Investments | | 229 | | ISO New England, Inc.(non-profit organization managing regional electricity market) |
T-3 Invesco Growth and Income Fund
Trustees and Officers—(continued)
| | | | | | | | |
Name, Year of Birth and Position(s) Held with the Trust | | Trustee and/ or Officer Since | | Principal Occupation(s)
During Past 5 Years | | Number of
Funds in Fund
Complex
Overseen by
Trustee | | Other Directorship(s) Held by Trustee During
Past 5 Years |
| Other Officers | | | | | | | | |
Sheri Morris — 1964 President, Principal Executive Officer and Treasurer | | 2003 | | President, Principal Executive Officer and Treasurer, The Invesco Funds; Vice President, Invesco Advisers, Inc. (formerly known as Invesco Institutional (N.A.), Inc.) (registered investment adviser); and Vice President, Invesco Exchange-Traded Fund Trust, Invesco Exchange-Traded Fund Trust II, Invesco India Exchange-Traded Fund Trust, Invesco Actively Managed Exchange-Traded Fund Trust, Invesco Actively Managed Exchange-Traded Commodity Fund Trust and Invesco Exchange-Traded Self-Indexed Fund Trust; and Vice President, OppenheimerFunds, Inc. Formerly: Vice President and Principal Financial Officer, The Invesco Funds; Vice President, Invesco AIM Advisers, Inc., Invesco AIM Capital Management, Inc. and Invesco AIM Private Asset Management, Inc.; Assistant Vice President and Assistant Treasurer, The Invesco Funds and Assistant Vice President, Invesco Advisers, Inc., Invesco AIM Capital Management, Inc. and Invesco AIM Private Asset Management, Inc.; and Treasurer, Invesco Exchange-Traded Fund Trust, Invesco Exchange-Traded Fund Trust II, Invesco India Exchange-Traded Fund Trust and Invesco Actively Managed Exchange-Traded Fund Trust | | N/A | | N/A |
Russell C. Burk — 1958 Senior Vice President and Senior Officer | | 2005 | | Senior Vice President and Senior Officer, The Invesco Funds | | N/A | | N/A |
Jeffrey H. Kupor — 1968 Senior Vice President, Chief Legal Officer and Secretary | | 2018 | | Head of Legal of the Americas, Invesco Ltd.; Senior Vice President and Secretary, Invesco Advisers, Inc. (formerly known as Invesco Institutional (N.A.), Inc.) (registered investment adviser); Senior Vice President and Secretary, Invesco Distributors, Inc. (formerly known as Invesco AIM Distributors, Inc.); Vice President and Secretary, Invesco Investment Services, Inc. (formerly known as Invesco AIM Investment Services, Inc.) Senior Vice President, Chief Legal Officer and Secretary, The Invesco Funds; Secretary and General Counsel, Invesco Investment Advisers LLC (formerly known as Van Kampen Asset Management); Secretary and General Counsel, Invesco Capital Markets, Inc. (formerly known as Van Kampen Funds Inc.) and Chief Legal Officer, Invesco Exchange-Traded Fund Trust, Invesco Exchange-Traded Fund Trust II, Invesco India Exchange-Traded Fund Trust, Invesco Actively Managed Exchange-Traded Fund Trust, Invesco Actively Managed Exchange-Traded Commodity Fund Trust and Invesco Exchange-Traded Self-Indexed Fund Trust; Secretary, Invesco Indexing LLC; Secretary, W.L. Ross & Co., LLC Formerly: Secretary and Vice President, Jemstep, Inc.; Head of Legal, Worldwide Institutional, Invesco Ltd.; Secretary and General Counsel, INVESCO Private Capital Investments, Inc.; Senior Vice President, Secretary and General Counsel, Invesco Management Group, Inc. (formerly known as Invesco AIM Management Group, Inc.); Assistant Secretary, INVESCO Asset Management (Bermuda) Ltd.; Secretary and General Counsel, Invesco Private Capital, Inc.; Assistant Secretary and General Counsel, INVESCO Realty, Inc.; Secretary and General Counsel, Invesco Senior Secured Management, Inc.; and Secretary, Sovereign G./P. Holdings Inc. | | N/A | | N/A |
Andrew R. Schlossberg — 1974 Senior Vice President | | 2019 | | Head of the Americas and Senior Managing Director, Invesco Ltd.; Director and Senior Vice President, Invesco Advisers, Inc. (formerly known as Invesco Institutional (N.A.), Inc.) (registered investment adviser); Director and Chairman, Invesco Investment Services, Inc. (formerly known as Invesco AIM Investment Services, Inc.) (registered transfer agent); Senior Vice President, The Invesco Funds; Director, Invesco Investment Advisers LLC (formerly known as Van Kampen Asset Management); Director, President and Chairman, Invesco Insurance Agency, Inc. Formerly: Director, Invesco UK Limited; Director and Chief Executive, Invesco Asset Management Limited and Invesco Fund Managers Limited; Assistant Vice President, The Invesco Funds; Senior Vice President, Invesco Advisers, Inc. (formerly known as Invesco Institutional (N.A.), Inc.) (registered investment adviser); Director and Chief Executive, Invesco Administration Services Limited and Invesco Global Investment Funds Limited; Director, Invesco Distributors, Inc.; Head of EMEA, Invesco Ltd.; President, Invesco Actively Managed Exchange-Traded Commodity Fund Trust, Invesco Actively Managed Exchange-Traded Fund Trust, Invesco Exchange-Traded Fund Trust, Invesco Exchange-Traded Fund Trust II and Invesco India Exchange-Traded Fund Trust; Managing Director and Principal Executive Officer, Invesco Capital Management LLC | | N/A | | N/A |
T-4 Invesco Growth and Income Fund
Trustees and Officers—(continued)
| | | | | | | | |
Name, Year of Birth and Position(s) Held with the Trust | | Trustee and/ or Officer Since | | Principal Occupation(s)
During Past 5 Years | | Number of
Funds in Fund
Complex
Overseen by
Trustee | | Other Directorship(s) Held by Trustee During
Past 5 Years |
| Other Officers—(continued) | | | | | | | | |
John M. Zerr — 1962
Senior Vice President | | 2006 | | Chief Operating Officer of the Americas; Senior Vice President, Invesco Advisers, Inc. (formerly known as Invesco Institutional (N.A.), Inc.) (registered investment adviser); Senior Vice President, Invesco Distributors, Inc. (formerly known as Invesco AIM Distributors, Inc.); Director and Vice President, Invesco Investment Services, Inc. (formerly known as Invesco AIM Investment Services, Inc.) Senior Vice President, The Invesco Funds; Managing Director, Invesco Capital Management LLC; Director, Invesco Investment Advisers LLC (formerly known as Van Kampen Asset Management); Senior Vice President, Invesco Capital Markets, Inc. (formerly known as Van Kampen Funds Inc.); Manager, Invesco Indexing LLC; Manager, Invesco Specialized Products, LLC; Director and Senior Vice President, Invesco Insurance Agency, Inc.; Member, Invesco Canada Funds Advisory Board; Director, President and Chief Executive Officer, Invesco Corporate Class Inc. (corporate mutual fund company); and Director, Chairman, President and Chief Executive Officer, Invesco Canada Ltd. (formerly known as Invesco Trimark Ltd./Invesco Trimark Ltèe) (registered investment adviser and registered transfer agent) Formerly: Director and Senior Vice President, Invesco Management Group, Inc. (formerly known as Invesco AIM Management Group, Inc.); Secretary and General Counsel, Invesco Management Group, Inc. (formerly known as Invesco AIM Management Group, Inc.); Secretary, Invesco Investment Services, Inc. (formerly known as Invesco AIM Investment Services, Inc.); Chief Legal Officer and Secretary, The Invesco Funds; Secretary and General Counsel, Invesco Investment Advisers LLC (formerly known as Van Kampen Asset Management); Secretary and General Counsel, Invesco Capital Markets, Inc. (formerly known as Van Kampen Funds Inc.); Chief Legal Officer, Invesco Exchange-Traded Fund Trust, Invesco Exchange-Traded Fund Trust II, Invesco India Exchange-Traded Fund Trust, Invesco Actively Managed Exchange-Traded Fund Trust, Invesco Actively Managed Exchange-Traded Commodity Fund Trust and Invesco Exchange-Traded Self-Indexed Fund Trust; Secretary, Invesco Indexing LLC; Director, Secretary, General Counsel and Senior Vice President, Van Kampen Exchange Corp.; Director, Vice President and Secretary, IVZ Distributors, Inc. (formerly known as INVESCO Distributors, Inc.); Director and Vice President, INVESCO Funds Group, Inc.; Director and Vice President, Van Kampen Advisors Inc.; Director, Vice President, Secretary and General Counsel, Van Kampen Investor Services Inc.; Director and Secretary, Invesco Distributors, Inc. (formerly known as Invesco AIM Distributors, Inc.); Director, Senior Vice President, General Counsel and Secretary, Invesco AIM Advisers, Inc. and Van Kampen Investments Inc.; Director, Vice President and Secretary, Fund Management Company; Director, Senior Vice President, Secretary, General Counsel and Vice President, Invesco AIM Capital Management, Inc.; Chief Operating Officer and General Counsel, Liberty Ridge Capital, Inc. (an investment adviser) | | N/A | | N/A |
Gregory G. McGreevey — 1962 Senior Vice President | | 2012 | | Senior Managing Director, Invesco Ltd.; Director, Chairman, President, and Chief Executive Officer, Invesco Advisers, Inc. (formerly known as Invesco Institutional (N.A.), Inc.) (registered investment adviser); Director, Invesco Mortgage Capital, Inc. and Invesco Senior Secured Management, Inc.; and Senior Vice President, The Invesco Funds; and President, SNW Asset Management Corporation Formerly: Senior Vice President, Invesco Management Group, Inc. and Invesco Advisers, Inc.; Assistant Vice President, The Invesco Funds | | N/A | | N/A |
Kelli Gallegos — 1970 Vice President, Principal Financial Officer and Assistant Treasurer | | 2008 | | Assistant Treasurer, Invesco Specialized Products, LLC; Vice President, Principal Financial Officer and Assistant Treasurer, The Invesco Funds; Principal Financial and Accounting Officer — Pooled Investments, Invesco Capital Management LLC; Vice President and Treasurer, Invesco Exchange-Traded Fund Trust, Invesco Exchange-Traded Fund Trust II, Invesco India Exchange-Traded Fund Trust, Invesco Actively Managed Exchange-Traded Fund Trust, Invesco Actively Managed Exchange-Traded Commodity Fund Trust and Invesco Exchange-Traded Self-Indexed Fund Trust Formerly: Assistant Treasurer, Invesco Exchange-Traded Fund Trust, Invesco Exchange-Traded Fund Trust II, Invesco India Exchange-Traded Fund Trust, Invesco Actively Managed Exchange-Traded Fund Trust, Invesco Actively Managed Exchange-Traded Commodity Fund Trust and Invesco Exchange-Traded Self-Indexed Fund Trust; Assistant Treasurer, Invesco Capital Management LLC; Assistant Vice President, The Invesco Funds | | N/A | | N/A |
T-5 Invesco Growth and Income Fund
Trustees and Officers—(continued)
| | | | | | | | |
Name, Year of Birth and Position(s) Held with the Trust | | Trustee and/ or Officer Since | | Principal Occupation(s)
During Past 5 Years | | Number of
Funds in Fund
Complex
Overseen by
Trustee | | Other Directorship(s) Held by Trustee During
Past 5 Years |
| Other Officers—(continued) | | | | | | | | |
Crissie M. Wisdom — 1969 Anti-Money Laundering Compliance Officer | | 2013 | | Anti-Money Laundering Compliance Officer, Invesco Advisers, Inc. (formerly known as Invesco Institutional (N.A.), Inc.) (registered investment adviser), Invesco Capital Markets, Inc. (formerly known as Van Kampen Funds Inc.), Invesco Distributors, Inc., Invesco Investment Services, Inc., The Invesco Funds, and Invesco Exchange-Traded Fund Trust, Invesco Exchange-Traded Fund Trust II, Invesco India Exchange-Traded Fund Trust, Invesco Actively Managed Exchange-Traded Fund Trust, Invesco Actively Managed Exchange-Traded Commodity Fund Trust and Invesco Exchange-Traded Self-Indexed Fund Trust; Anti-Money Laundering Compliance Officer and Bank Secrecy Act Officer, INVESCO National Trust Company and Invesco Trust Company; and Fraud Prevention Manager and Controls and Risk Analysis Manager for Invesco Investment Services, Inc. Formerly: Anti-Money Laundering Compliance Officer, Van Kampen Exchange Corp. and Invesco Management Group, Inc. | | N/A | | N/A |
Robert R. Leveille — 1969 Chief Compliance Officer | | 2016 | | Chief Compliance Officer, Invesco Advisers, Inc. (registered investment adviser); and Chief Compliance Officer, The Invesco Funds Formerly: Chief Compliance Officer, Putnam Investments and the Putnam Funds | | N/A | | N/A |
The Statement of Additional Information of the Trust includes additional information about the Fund’s Trustees and is available upon request, without charge, by calling 1.800.959.4246. Please refer to the Fund’s Statement of Additional Information for information on the Fund’ssub-advisers.
| | | | | | |
Office of the Fund 11 Greenway Plaza, Suite 1000
Houston, TX 77046-1173 | | Investment Adviser Invesco Advisers, Inc.
1555 Peachtree Street, N.E.
Atlanta, GA 30309 | | Distributor Invesco Distributors, Inc.
11 Greenway Plaza, Suite 1000
Houston, TX 77046-1173 | | Auditors PricewaterhouseCoopers LLP
1000 Louisiana Street, Suite 5800 Houston, TX 77002-5021 |
| | | |
| | | | | | |
Counsel to the Fund Stradley Ronon Stevens & Young, LLP
2005 Market Street, Suite 2600
Philadelphia, PA 19103-7018 | | Counsel to the Independent Trustees Goodwin Procter LLP
901 New York Avenue, N.W.
Washington, D.C. 20001 | | Transfer Agent Invesco Investment Services, Inc.
11 Greenway Plaza, Suite 1000
Houston, TX 77046-1173 | | Custodian State Street Bank and Trust Company
225 Franklin Street
Boston, MA 02110-2801 |
T-6 Invesco Growth and Income Fund
Go paperless with eDelivery
Visit invesco.com/edelivery to enjoy the convenience and security of anytime electronic access to your investment documents.
With eDelivery, you can elect to have any or all of the following materials delivered straight to your inbox to download, save and print from your own computer:
| • | Fund reports and prospectuses |
| • | Quarterly statements |
| • | Daily confirmations |
| • | Tax forms |
Invesco mailing information
Send general correspondence to Invesco Investment Services, Inc., P.O. Box 219078, Kansas City, MO 64121-9078.
Important notice regarding delivery of security holder documents
To reduce Fund expenses, only one copy of most shareholder documents may be mailed to shareholders with multiple accounts at the same address (Householding). Mailing of your shareholder documents may be householded indefinitely unless you instruct us otherwise. If you do not want the mailing of these documents to be combined with those for other members of your household, please contact Invesco Investment Services, Inc. at 800 959 4246 or contact your financial institution. We will begin sending you individual copies for each account within 30 days after receiving your request.
Fund holdings and proxy voting information
The Fund provides a complete list of its holdings four times in each fiscal year, at the quarter-ends. For the second and fourth quarters, the list appears in the Fund’s semiannual and annual reports to shareholders. For the first and third quarters, the Fund files the lists with the Securities and Exchange Commission (SEC) as an exhibit to its reports on Form N-PORT. The most recent list of portfolio holdings is available at invesco.com/completeqtrholdings. Shareholders can also look up the Fund’s Form N-PORT filings on the SEC website, sec.gov. The SEC file numbers for the Fund are shown below.
A description of the policies and procedures that the Fund uses to determine how to vote proxies relating to portfolio securities is available without charge, upon request, from our Client Services department at 800 959 4246, or at invesco.com/proxyguidelines. The information is also available on the SEC website, sec.gov.
Information regarding how the Fund voted proxies related to its portfolio securities during the most recent 12-month period ended June 30 is available at invesco.com/proxysearch. This information is also available on the SEC website, sec.gov.
Invesco Advisers, Inc. is an investment adviser; it provides investment advisory services to individual and institutional clients and does not sell securities. Invesco Distributors, Inc. is the US distributor for Invesco Ltd.’s retail mutual funds, exchange-traded funds and institutional money market funds. Both are wholly owned, indirect subsidiaries of Invesco Ltd.
| SEC file numbers: 811-09913 and 333-36074 | Invesco Distributors, Inc. | VK-GRI-AR-1 |
| Annual Report to Shareholders | August 31, 2019 |
Invesco Low Volatility Equity Yield Fund
Nasdaq:
A: SCAUX ■ C: SCCUX ■ R: SCRUX ■ Y: SCAYX ■ Investor: SCNUX ■ R5: SCIUX ■ R6: SLESX

Beginning on January 1, 2021, as permitted by regulations adopted by the Securities and Exchange Commission, paper copies of the Fund’s shareholder reports will no longer be sent by mail, unless you specifically request paper copies of the reports from the Fund or from your financial intermediary, such as a broker-dealer or bank. Instead, the reports will be made available on the Fund’s website, and you will be notified by mail each time a report is posted and provided with a website link to access the report.
If you already elected to receive shareholder reports electronically, you will not be affected by this change and you need not take any action. You may elect to receive shareholder reports and other communications from the Fund electronically by contacting your financial intermediary (such as a broker-dealer or bank) or, if you are a direct investor, by enrolling at invesco.com/edelivery.
You may elect to receive all future reports in paper free of charge. If you invest through a financial intermediary, you can contact your financial intermediary to request that you continue to receive paper copies of your shareholder reports. If you invest directly with the Fund, you can call (800) 959-4246 to let the Fund know you wish to continue receiving paper copies of your shareholder reports. Your election to receive reports in paper will apply to all funds held with your financial intermediary or all funds held with the fund complex if you invest directly with the Fund.
Dear Shareholders:
This annual report includes information about your Fund, including performance data and a complete list of its investments as of the close of the reporting period. Inside is a discussion of how your Fund was managed and the factors that affected its performance during the reporting period.
Throughout the reporting period, global equity markets remained volatile. Investor sentiment ranged from elation to fear. The reporting period began with several US equity indexes redefining new highs. The exuberance, however, ended in October 2018 as global equities, in particular US stocks, sold off, with the sharpest decline in December. The catalyst for the sell-off was a combination of ongoing trade concerns between the US and China, fears of a global economic slowdown and lower oil prices from a supply glut. Gains posted earlier in 2018 for global equities were erased, while US Treasury bonds, along with government and municipal bonds, rallied as investors fled to “safe haven” assets.
At the start of 2019, global equity markets rebounded strongly buoyed by more dovish central banks and optimism about a potential US-China trade deal. In May, US-China trade concerns and slowing global growth led to a global equity sell-off and rally in U.S. Treasuries. Despite the May sell-off, domestic equity markets rallied in June in anticipation of a U.S. Federal Reserve (the Fed) rate cut and closed the second quarter with modest gains. As the reporting period ended in August, market volatility once again increased as the US Treasury yield curve inverted several times magnifying concerns that the US economy could be headed into a recession.
During the reporting period, the Fed both raised and lowered the federal funds rate. Given signs of a strong economy, the Fed raised rates two times: in September and December 2018. In 2019, however, the Fed altered its outlook on further rate hikes leaving rates unchanged for the first half of the year. In July, the Fed lowered interest rates for the first time in 11 years. As 2019 unfolds, we’ll see how the interplay of interest rates, economic data, geopolitics and a host of other factors affect US and overseas equity and fixed income markets.
Investor uncertainty and market volatility, such as we witnessed during the reporting period, are unfortunate facts of life when it comes to investing. That’s why Invesco encourages investors to work with a professional financial adviser who can stress the importance of starting to save and invest early and the importance of adhering to a disciplined investment plan. A financial adviser who knows your unique financial situation, investment goals and risk tolerance can be an invaluable partner as you seek to achieve your financial goals. He or she can offer a long-term perspective when markets are volatile and time-tested advice and guidance when your financial situation or investment goals change.
Visit our website for more information on your investments
Our website, invesco.com/us, offers a wide range of market insights and investment perspectives. On the website, you’ll find detailed information about our funds, including performance, holdings and portfolio manager commentaries. You can access information about your account by completing a simple, secure online registration. To do so, select “Log In” on the right side of the homepage, and then select “Register for Individual Account Access.”
In addition to the resources accessible on our website and through our mobile app, you can obtain timely updates to help you stay informed about the markets and the economy by connecting with Invesco on Twitter, LinkedIn or Facebook. You can access our blog at blog.invesco.us.com. Our goal is to provide you the information you want, when and where you want it.
Finally, I’m pleased to share with you Invesco’s commitment to both the Principles for Responsible Investment and to considering environmental, social and governance issues in our robust investment process. I invite you to learn more at invesco.com/esg.
Have questions?
For questions about your account, contact an Invesco client services representative at 800 959 4246.
All of us at Invesco look forward to serving your investment management needs. Thank you for investing with us.
Sincerely,
Andrew Schlossberg
Head of the Americas,
Senior Managing Director, Invesco Ltd.
| 2 | Invesco Low Volatility Equity Yield Fund |
Dear Shareholders:
Among the many important lessons I’ve learned in more than 40 years in a variety of business endeavors is the value of a trusted advocate.
As independent chair of the Invesco Funds Board, I can assure you that the members of the Board are strong advocates for the interests of investors in Invesco’s mutual funds. We work hard to represent your interests through oversight of the quality of the investment management services your funds receive and other matters important to your investment, including but not limited to:
| ■ | Ensuring that Invesco offers a diverse lineup of mutual funds that your financial adviser can use to strive to meet your financial needs as your investment goals change over time. |
| ■ | Monitoring how the portfolio management teams of the Invesco funds are performing in light of changing economic and market conditions. |
| ■ | Assessing each portfolio management team’s investment performance within the context of the investment strategy described in the fund’s prospectus. |
| ■ | Monitoring for potential conflicts of interests that may impact the nature of the services that your funds receive. |
We believe one of the most important services we provide our fund shareholders is the annual review of the funds’ advisory and sub-advisory contracts with Invesco Advisers and its affiliates. This review is required by the Investment Company Act of 1940 and focuses on the nature and quality of the services Invesco provides as the adviser to the Invesco funds and the reasonableness of the fees that it charges for those services. Each year, we spend months carefully reviewing information received from Invesco and a variety of independent sources, such as performance and fee data prepared by Lipper, Inc. (a subsidiary of Broadridge Financial Solutions, Inc.), an independent, third-party firm widely recognized as a leader in its field. We also meet with our independent legal counsel and other independent advisers to review and help us assess the information that we have received. Our goal is to assure that you receive quality investment management services for a reasonable fee.
I trust the measures outlined above provide assurance that you have a worthy advocate when it comes to choosing the Invesco Funds.
As always, please contact me at bruce@brucecrockett.com with any questions or concerns you may have. On behalf of the Board, we look forward to continuing to represent your interests and serving your needs.
Sincerely,
Bruce L. Crockett
Independent Chair
Invesco Funds Board of Trustees
| 3 | Invesco Low Volatility Equity Yield Fund |
Management’s Discussion of Fund Performance
Performance summary
For the fiscal year ended August 31, 2019, Class A shares of Invesco Low Volatility Equity Yield Fund (the Fund), at net asset value (NAV), underperformed the Russell 1000 Index, the Fund’s style-specific benchmark.
Your Fund’s long-term performance appears later in this report.
Fund vs. Indexes
Total returns, August 31, 2018 to August 31, 2019, at net asset value (NAV). Performance shown does not include applicable contingent deferred sales charges (CDSC) or front-end sales charges, which would have reduced performance.
| Class A Shares | –11.34% |
| Class C Shares | –12.05 |
| Class R Shares | –11.54 |
| Class Y Shares | –11.14 |
| Investor Class Shares | –11.30 |
| Class R5 Shares | –10.96 |
| Class R6 Shares | –10.96 |
| S&P 500 Index▼ (Broad Market Index) | 2.92 |
| Russell 1000 Index▼ (Style-Specific Index) | 2.49 |
Lipper Equity Income Funds Index■
(Peer Group Index) | 2.95 |
Source(s):▼RIMES Technologies Corp.;■
Lipper Inc. |
Market conditions and your Fund
The fiscal year proved to be an increasingly volatile time for US equities. After a relatively quiet summer, market volatility noticeably rose in October 2018, as US equity markets suffered a sharp sell-off through year-end 2018, amid ongoing trade concerns between the US and China, fears of a global economic slowdown and lower oil prices from a supply glut, with oil prices plummeting from near $75 per barrel in early October 2018 to around $45 per barrel in late December 2018.1 In this environment, there was a flight to safety, as investors fled to defensive areas of the markets, such as health care, utilities and US Treasuries.
Given signs of a strong economy, the US Federal Reserve (the Fed) raised interest rates two times during the fiscal
year: in September and December 2018.2 In contrast, the European Central Bank and central banks in several other countries maintained extraordinarily accommodative monetary policies.
Following a sharp sell-off during the fourth quarter of 2018, equity markets rebounded in the first quarter of 2019, fueled by optimism about a potential US-China trade deal and the Fed’s indication that there would be no interest rate hikes in 2019, a surprising shift in monetary policy. The Fed’s more accommodative stance provided a supportive environment for equities and fixed income, even as US economic data were mixed and overseas growth appeared to be slowing. Against this backdrop, the S&P 500 Index posted its best first quarter returns since 1998.
Although the S&P 500 Index posted modest gains for the second quarter of
2019, the US stock market experienced increased volatility. After four consecutive months of rising stock markets, the market sold off in May 2019, along with bond yields and oil prices, as investors weighed the impact of the lingering trade war between the US and China, as well as potential tariffs imposed on Mexico. In addition, economic data showed a slowing domestic and global economy. During the July 2019 meeting, the Fed lowered rates by 25 basis points. (A basis point is one one-hundredth of a percentage point.) This was the first time the Fed lowered rates in more than a decade.2
Market volatility increased in August 2019, as the US Treasury yield curve inverted several times, causing jitters for investors who were concerned that a US recession would be imminent. As a result, much of August saw a “risk off” sentiment, with investors crowding into perceived “safe haven” asset classes, such as US Treasuries and gold. However, a more dovish tone from the Fed provided some support to risk assets. With rising volatility in the markets, the S&P 500 Index posted a modestly positive return for the fiscal year.
The Fund, by design, exhibited a lower volatility level during the fiscal year than its style-specific benchmark, the Russell 1000 Index. The Fund seeks to create a diversified portfolio with a volatility target between a minimum variance portfolio and the style-specific benchmark. The portfolio utilizes both a multi-factor model and a proprietary risk model to build intended exposures to factors that historically have driven excess returns (Quality, Value and Momentum). Both models systematically evaluate fundamental and behavioral factors to rank securities based on their exposure to these factors and to rank attractiveness
| Portfolio Composition |
| By sector % of total net assets |
| Consumer Discretionary | 20.35% |
| Health Care | 14.84 |
| Real Estate | 12.03 |
| Financials | 11.73 |
| Information Technology | 9.09 |
| Consumer Staples | 7.73 |
| Utilities | 6.90 |
| Communication Services | 5.67 |
| Energy | 4.97 |
| Industrials | 3.83 |
| Materials | 0.15 |
| U.S. Treasury Bills, Money Market Funds Plus Other Assets Less Liabilities | 2.71 |
| Top 10 Equity Holdings* |
| % of total net assets |
| 1. | Booz Allen Hamilton Holding Corp. | 2.13% |
| 2. | Amgen, Inc. | 2.10 |
| 3. | Procter & Gamble Co. (The) | 1.99 |
| 4. | Starbucks Corp. | 1.96 |
| 5. | AutoZone, Inc. | 1.89 |
| 6. | Exelon Corp. | 1.88 |
| 7. | Target Corp. | 1.86 |
| 8. | FirstEnergy Corp. | 1.80 |
| 9. | Hershey Co. (The) | 1.77 |
| 10. | Gilead Sciences, Inc. | 1.76 |
| Total Net Assets | $216.2 million |
| Total Number of Holdings* | 90 |
| The Fund’s holdings are subject to change, and there is no assurance that the Fund will continue to hold any particular security. |
| *Excluding money market fund holdings. |
| Data presented here are as of August 31, 2019. |
| 4 | Invesco Low Volatility Equity Yield Fund |
relative to industry peers subject to intended risk targets.
During the fiscal year, overall factor performance was weak in the Fund with Value factors exhibiting the weakest performance as several reversals in market sentiment led to uncertainty among investors. Historically, our factors have exhibited low to negative correlation, which should provide a diversification benefit. However, factors within Momentum (both Price Momentum and Earnings Momentum) were hampered by negative changes in market sentiment that occurred during the fiscal year. It is a rare occurrence when all factor categories are negative — factor scores last exhibited this magnitude of weakness during the sharp rise off the bottom in 2009.
From a sector perspective, the health care, information technology (IT), consumer discretionary, materials, consumer staples and energy sectors detracted from the Fund’s performance relative to the style-specific benchmark during the fiscal year, while the utilities and financials sectors contributed to relative Fund performance. The Fund ended the fiscal year with overweight allocations in the consumer discretionary, health care, materials, real estate and utilities sectors, and underweight allocations in the financials, industrials, communication services and IT sectors relative to the style-specific benchmark.
Top performers within utilities includedEntergy andFirstEnergy, which performed well as defensive stocks tend to hold up better during market volatility and downturns.Booz Allen Hamilton was also a key contributor to the Fund’s performance, as the company delivered strong revenue growth during the fiscal year. Additionally,Starbucks contributed to the Fund’s performance, as its stock price rose nearly 50% during the fiscal year.3
The largest detractor from the Fund’s performance relative to the style-specific benchmark for the fiscal year wasWalgreens Boots Alliance, as the company cut its 2019 earnings forecast and reported a disappointing profit in the face of lower drug prices. Other key detractors includedHuntsman, Endo International andMethanex. Endo’s stock came under pressure during the fiscal year as revenue fell and net losses mounted. Methanex’s stock price struggled, as methanol prices continued to decline on decreasing demand and trade issues. We sold our positions in Walgreens Boots Alliance, Huntsman, Endo International
and Methanex before the close of the fiscal year.
Please note that the Fund’s strategy is principally implemented through equity investments, but the Fund also may use derivative instruments, including S&P 500 futures contracts, to gain exposure to the equity market. During the fiscal year, the Fund invested in S&P 500 futures contracts, which delivered a positive absolute return for the Fund. Derivatives can be a cost-effective way to gain exposure to asset classes. However, derivatives may amplify traditional investment risks through the creation of leverage and may be less liquid than traditional securities.
Thank you for investing in Invesco Low Volatility Equity Yield Fund.
| 2 | Source: US Federal Reserve |
The views and opinions expressed in management’s discussion of Fund performance are those of Invesco Advisers, Inc. These views and opinions are subject to change at any time based on factors such as market and economic conditions. These views and opinions may not be relied upon as investment advice or recommendations, or as an offer for a particular security. The information is not a complete analysis of every aspect of any market, country, industry, security or the Fund. Statements of fact are from sources considered reliable, but Invesco Advisers, Inc. makes no representation or warranty as to their completeness or accuracy. Although historical performance is no guarantee of future results, these insights may help you understand our investment management philosophy.
See important Fund and, if applicable, index disclosures later in this report.
Michael Abata
Chartered Financial Analyst, Portfolio Manager, is manager of Invesco Low Volatility Equity Yield Fund. He joined Invesco in 2011. Mr. Abata earned a BA in economics from Binghamton University.
Anthony Munchak
Chartered Financial Analyst, Portfolio Manager, is manager of Invesco Low Volatility Equity Yield Fund. He joined Invesco in 2000. Mr. Munchak earned a BS and an MS in finance from Boston College and an MBA from Bentley College.
Glen Murphy
Chartered Financial Analyst, Portfolio Manager, is manager of Invesco Low Volatility Equity Yield Fund. He joined Invesco in 1995. Mr. Murphy earned a BA from the University of Massachusetts at Amherst and an MS in finance from Boston College.
Francis Orlando
Chartered Financial Analyst, Portfolio Manager, is manager of Invesco Low Volatility Equity Yield Fund. He joined Invesco in 1987. Mr. Orlando earned a BA in business administration from Merrimack College and an MBA from Boston University.
| 5 | Invesco Low Volatility Equity Yield Fund |
Your Fund’s Long-Term Performance
Results of a $10,000 Investment — Oldest Share Class(es)
Fund and index data from 8/31/09
| 1 | Source: RIMES Technologies Corp. |
| 2 | Source: Lipper Inc. |
Past performance cannot guarantee comparable future results.
The data shown in the chart include reinvested distributions, applicable sales charges and Fund expenses including
management fees. Index results include reinvested dividends, but they do not reflect sales charges. Performance of the peer group, if applicable, reflects fund expenses and management fees; perfor-
mance of a market index does not. Performance shown in the chart and table(s) does not reflect deduction of taxes a shareholder would pay on Fund distributions or sale of Fund shares.
| 6 | Invesco Low Volatility Equity Yield Fund |
| Average Annual Total Returns |
| As of 8/31/19, including maximum applicable sales charges |
| Class A Shares | |
| Inception (3/31/06) | 4.01% |
| 10 Years | 7.49 |
| 5 Years | 0.75 |
| 1 Year | –16.24 |
| Class C Shares | |
| Inception (3/31/06) | 3.87% |
| 10 Years | 7.27 |
| 5 Years | 1.12 |
| 1 Year | –12.91 |
| Class R Shares | |
| Inception (3/31/06) | 4.20% |
| 10 Years | 7.84 |
| 5 Years | 1.65 |
| 1 Year | –11.54 |
| Class Y Shares | |
| Inception (10/3/08) | 7.39% |
| 10 Years | 8.37 |
| 5 Years | 2.15 |
| 1 Year | –11.14 |
| Investor Class Shares | |
| Inception (4/25/08) | 4.45% |
| 10 Years | 8.09 |
| 5 Years | 1.89 |
| 1 Year | –11.30 |
| Class R5 Shares | |
| Inception (3/31/06) | 4.82% |
| 10 Years | 8.50 |
| 5 Years | 2.33 |
| 1 Year | –10.96 |
| Class R6 Shares | |
| 10 Years | 8.21% |
| 5 Years | 2.09 |
| 1 Year | –10.96 |
Class R6 shares incepted on April 4, 2017. Performance shown prior to that date is that of Class A shares and includes the 12b-1 fees applicable to Class A shares.
The performance data quoted represent past performance and cannot guarantee comparable future results; current performance may be lower or higher. Please visit invesco.com/performance for the most recent month-end performance. Performance figures reflect reinvested distributions, changes in net asset value and the effect of the maximum sales charge unless otherwise stated. Investment return and principal value will fluctuate so that you may have a gain or loss when you sell shares.
The total annual Fund operating expense ratio set forth in the most re-
| Average Annual Total Returns |
| As of 6/30/19, the most recent calendar quarter end, including maximum applicable sales charges |
| Class A Shares | |
| Inception (3/31/06) | 4.26% |
| 10 Years | 8.89 |
| 5 Years | 1.61 |
| 1 Year | –10.31 |
| Class C Shares | |
| Inception (3/31/06) | 4.12% |
| 10 Years | 8.65 |
| 5 Years | 1.98 |
| 1 Year | –6.70 |
| Class R Shares | |
| Inception (3/31/06) | 4.46% |
| 10 Years | 9.23 |
| 5 Years | 2.53 |
| 1 Year | –5.23 |
| Class Y Shares | |
| Inception (10/3/08) | 7.76% |
| 10 Years | 9.78 |
| 5 Years | 3.02 |
| 1 Year | –4.79 |
| Investor Class Shares | |
| Inception (4/25/08) | 4.75% |
| 10 Years | 9.50 |
| 5 Years | 2.76 |
| 1 Year | –5.03 |
| Class R5 Shares | |
| Inception (3/31/06) | 5.07% |
| 10 Years | 9.89 |
| 5 Years | 3.20 |
| 1 Year | –4.62 |
| Class R6 Shares | |
| 10 Years | 9.61% |
| 5 Years | 2.97 |
| 1 Year | –4.60 |
cent Fund prospectus as of the date of this report for Class A, Class C, Class R, Class Y, Investor Class, Class R5 and Class R6 shares was 1.21%, 1.96%, 1.46%, 0.96%, 1.21%, 0.79% and 0.75%, respectively. The expense ratios presented above may vary from the expense ratios presented in other sections of this report that are based on expenses incurred during the period covered by this report.
Class A share performance reflects the maximum 5.50% sales charge, and Class C share performance reflects the applicable contingent deferred sales charge (CDSC) for the period involved. The CDSC on Class C shares is 1% for the first year after purchase. Class R, Class Y, Investor Class, Class R5 and Class R6 shares do not have a front-
end sales charge or a CDSC; therefore, performance is at net asset value.
The performance of the Fund’s share classes will differ primarily due to different sales charge structures and class expenses.
Fund performance reflects any applicable fee waivers and/or expense reimbursements. Had the adviser not waived fees and/or reimbursed expenses currently or in the past, returns would have been lower. See current prospectus for more information.
| 7 | Invesco Low Volatility Equity Yield Fund |
Invesco Low Volatility Equity Yield Fund’s investment objective is income and long-term growth of capital.
| ■ | Unless otherwise stated, information presented in this report is as of August 31, 2019, and is based on total net assets. |
| ■ | Unless otherwise noted, all data provided by Invesco. |
| ■ | To access your Fund’s reports/prospectus, visit invesco.com/fundreports. |
About share classes
| ■ | Class R sharesare generally available only to employer sponsored retirement and benefit plans. Please see the prospectus for more information. |
| ■ | Class Y shares are available only to certain investors. Please see the prospectus for more information. |
| ■ | Class R5 sharesand Class R6 sharesare available for use by retirement plans that meet certain standards and for institutional investors. Class R6 shares are also available through intermediaries that have established an agreement with Invesco Distributors, Inc. to make such shares available for use in retail omnibus accounts. Please see the prospectus for more information. |
Principal risks of investing in the Fund
| ■ | Active trading risk. Active trading of portfolio securities may result in added expenses, a lower return and increased tax liability. |
| ■ | Depositary receipts risk. Investing in depositary receipts involves the same risks as direct investments in foreign securities. In addition, the underlying issuers of certain depositary receipts are under no obligation to distribute shareholder communications or pass through any voting rights with respect to the deposited securities to the holders of such receipts. The Fund may therefore receive less timely information or have less control than if it invested directly in the foreign issuer. |
| ■ | Derivatives risk. The value of a derivative instrument depends largely on (and is derived from) the value of an underlying security, currency, commodity, interest rate, index or other asset (each referred to as an underlying asset). In addition to risks relating to the underlying assets, the use of derivatives may include other, possibly greater, risks, including counterparty, leverage and liquidity risks. |
| | Counterparty risk is the risk that the counterparty to the derivative contract will default on its obligation to pay the Fund the amount owed or otherwise perform under the derivative contract. Derivatives create leverage risk because they do not require payment up front equal to the economic exposure created by holding a position in the derivative. As a result, an adverse change in the value of the underlying asset could result in the Fund sustaining a loss that is substantially greater than the amount invested in the derivative or the anticipated value of the underlying asset, which may make the Fund’s returns more volatile and increase the risk of loss. Derivative instruments may also be less liquid than more traditional investments and the Fund may be unable to sell or close out its derivative positions at a desirable time or price. This risk may be more acute under adverse market conditions, during which the Fund may be most in need of liquidating its derivative positions. Derivatives may also be harder to value, less tax efficient and subject to changing government regulation that could impact the Fund’s ability to use certain derivatives or their cost. Derivatives strategies may not always be successful. For example, derivatives used for hedging or to gain or limit exposure to a particular market segment may not provide the expected benefits, particularly during adverse market conditions. |
| ■ | Foreign securities risk. The Fund’s foreign investments may be adversely affected by political and social instability, changes in economic or taxation policies, difficulty in enforcing obligations, decreased liquidity or increased volatility. Foreign investments also involve the risk of the possible seizure, nationalization or expropriation of the issuer or foreign deposits (in which the Fund could lose its entire investments in a certain market) and |
| | the possible adoption of foreign governmental restrictions such as exchange controls. Unless the Fund has hedged its foreign securities risk, foreign securities risk also involves the risk of negative foreign currency rate fluctuations, which may cause the value of securities denominated in such foreign currency (or other instruments through which the Fund has exposure to foreign currencies) to decline in value. Currency exchange rates may fluctuate significantly over short periods of time. Currency hedging strategies, if used, are not always successful. |
| ■ | Management risk. The Fund is actively managed and depends heavily on the Adviser’s judgment about markets, interest rates or the attractiveness, relative values, liquidity, or potential appreciation of particular investments made for the Fund’s portfolio. The Fund could experience losses if these judgments prove to be incorrect. Additionally, legislative, regulatory, or tax developments may adversely affect management of the Fund and, therefore, the ability of the Fund to achieve its investment objective. |
| ■ | Market risk. The market values of the Fund’s investments, and therefore the value of the Fund’s shares, will go up and down, sometimes rapidly or unpredictably. Market risk may affect a single issuer, industry or section of the economy, or it may affect the market as a whole. Individual stock prices tend to go up and down more dramatically than those of certain other types of investments, such as bonds. During a general downturn in the financial markets, multiple asset classes may decline in value. When markets perform well, there can be no assurance that specific investments held by the Fund will rise in value. |
| ■ | REIT risk/real estate risk. Investments in real estate related instruments may be affected by economic, legal, cultural, environmental or technological |
This report must be accompanied or preceded by a currently effective Fund prospectus, which contains more complete information, including sales charges and expenses. Investors should read it carefully before investing.
NOT FDIC INSURED | MAY LOSE VALUE | NO BANK GUARANTEE
| 8 | Invesco Low Volatility Equity Yield Fund |
factors that affect property values, rents or occupancies of real estate related to the Fund’s holdings. Shares of real estate related companies, which tend to be small- and mid-cap companies, may be more volatile and less liquid.
About indexes used in this report
| ■ | TheS&P 500®Index is an unmanaged index considered representative of the US stock market. |
| ■ | TheRussell 1000® Index is an unmanaged index considered representative of large-cap stocks. The Russell 1000 Index is a trademark/service mark of the Frank Russell Co. Russell® is a trademark of the Frank Russell Co. |
| ■ | The Lipper Equity Income Funds Indexis an unmanaged Index considered representative of equity income funds tracked by Lipper. |
| ■ | The Fund is not managed to track the performance of any particular index, including the index(es) described here, and consequently, the performance of the Fund may deviate significantly from the performance of the index(es). |
| ■ | A direct investment cannot be made in an index. Unless otherwise indicated, index results include reinvested dividends, and they do not reflect sales charges. Performance of the peer group, if applicable, reflects fund expenses; performance of a market index does not. |
Other information
| ■ | The returns shown in management’s discussion of Fund performance are based on net asset values (NAVs) calculated for shareholder transactions. Generally accepted accounting principles require adjustments to be made to the net assets of the Fund at period end for financial reporting purposes, and as such, the NAVs for shareholder transactions and the returns based on those NAVs may differ from the NAVs and returns reported in the Financial Highlights. |
| ■ | Industry classifications used in this report are generally according to the Global Industry Classification Standard, which was developed by and is the exclusive property and a service mark of MSCI Inc. and Standard & Poor’s. |
| 9 | Invesco Low Volatility Equity Yield Fund |
Schedule of Investments(a)
August 31, 2019
| | Shares | Value |
| Common Stocks & Other Equity Interests–97.28% |
| Advertising–1.38% |
| Omnicom Group, Inc. | 39,100 | $2,973,946 |
| Airport Services–0.55% |
| Macquarie Infrastructure Corp. | 31,500 | 1,191,330 |
| Apparel, Accessories & Luxury Goods–0.15% |
| Kontoor Brands, Inc.(b) | 9,600 | 328,704 |
| Asset Management & Custody Banks–0.77% |
| Ameriprise Financial, Inc. | 12,850 | 1,657,393 |
| Automobile Manufacturers–2.93% |
| Ford Motor Co. | 334,100 | 3,063,697 |
| General Motors Co. | 88,300 | 3,275,047 |
| | | | 6,338,744 |
| Automotive Retail–1.89% |
| AutoZone, Inc.(b) | 3,715 | 4,092,778 |
| Biotechnology–8.15% |
| Alexion Pharmaceuticals, Inc.(b) | 28,600 | 2,881,736 |
| Amgen, Inc. | 21,750 | 4,537,485 |
| Biogen, Inc.(b) | 14,700 | 3,230,325 |
| Gilead Sciences, Inc. | 60,000 | 3,812,400 |
| Incyte Corp.(b) | 38,600 | 3,158,252 |
| | | | 17,620,198 |
| Broadcasting–1.18% |
| TEGNA, Inc. | 177,900 | 2,545,749 |
| Cable & Satellite–1.59% |
| Comcast Corp., Class A | 77,500 | 3,430,150 |
| Coal & Consumable Fuels–0.77% |
| Peabody Energy Corp. | 90,100 | 1,660,543 |
| Communications Equipment–1.26% |
| Cisco Systems, Inc. | 58,400 | 2,733,704 |
| Construction Machinery & Heavy Trucks–3.05% |
| Allison Transmission Holdings, Inc. | 79,600 | 3,536,628 |
| Cummins, Inc. | 20,550 | 3,067,499 |
| | | | 6,604,127 |
| Consumer Electronics–1.54% |
| Garmin Ltd. | 40,900 | 3,336,213 |
| Consumer Finance–3.56% |
| Ally Financial, Inc. | 107,600 | 3,373,260 |
| Discover Financial Services | 11,900 | 951,643 |
| Navient Corp. | 228,400 | 2,909,816 |
| OneMain Holdings, Inc. | 8,700 | 311,895 |
| | Shares | Value |
| Consumer Finance–(continued) |
| Santander Consumer USA Holdings, Inc. | 5,700 | $148,827 |
| | | | 7,695,441 |
| Diversified Banks–4.46% |
| Bank of Montreal (Canada) | 44,700 | 3,067,761 |
| Canadian Imperial Bank of Commerce (Canada) | 31,700 | 2,454,214 |
| Citigroup, Inc. | 46,100 | 2,966,535 |
| Toronto-Dominion Bank (The) (Canada) | 21,400 | 1,159,666 |
| | | | 9,648,176 |
| Electric Utilities–6.90% |
| Entergy Corp. | 20,100 | 2,268,084 |
| Exelon Corp. | 86,000 | 4,064,360 |
| FirstEnergy Corp. | 84,400 | 3,882,400 |
| Hawaiian Electric Industries, Inc. | 3,500 | 155,400 |
| PPL Corp. | 107,900 | 3,188,445 |
| Southern Co. (The) | 23,200 | 1,351,632 |
| | | | 14,910,321 |
| Footwear–1.72% |
| Deckers Outdoor Corp.(b) | 25,150 | 3,708,368 |
| General Merchandise Stores–1.86% |
| Target Corp. | 37,600 | 4,024,704 |
| Health Care Distributors–2.02% |
| Cardinal Health, Inc. | 32,400 | 1,397,412 |
| McKesson Corp. | 21,400 | 2,958,978 |
| | | | 4,356,390 |
| Health Care Supplies–1.44% |
| DENTSPLY SIRONA, Inc. | 59,900 | 3,123,785 |
| Homebuilding–1.30% |
| NVR, Inc.(b) | 290 | 1,043,710 |
| PulteGroup, Inc. | 52,500 | 1,774,500 |
| | | | 2,818,210 |
| Homefurnishing Retail–0.75% |
| Aaron’s, Inc. | 8,000 | 512,880 |
| Bed Bath & Beyond, Inc.(c) | 114,100 | 1,103,347 |
| | | | 1,616,227 |
| Hotels, Resorts & Cruise Lines–0.94% |
| Extended Stay America, Inc.(d) | 144,200 | 2,026,010 |
| Household Products–1.99% |
| Procter & Gamble Co. (The) | 35,700 | 4,292,211 |
| Industrial REITs–0.82% |
| EastGroup Properties, Inc. | 14,200 | 1,768,184 |
See accompanying Notes to Financial Statements which are an integral part of the financial statements.
| 10 | Invesco Low Volatility Equity Yield Fund |
| | Shares | Value |
| Integrated Oil & Gas–1.45% |
| Chevron Corp. | 26,700 | $3,143,124 |
| Integrated Telecommunication Services–1.53% |
| Verizon Communications, Inc. | 57,000 | 3,315,120 |
| Internet & Direct Marketing Retail–1.66% |
| eBay, Inc. | 89,000 | 3,585,810 |
| IT Consulting & Other Services–2.37% |
| Booz Allen Hamilton Holding Corp. | 61,000 | 4,606,110 |
| CACI International, Inc., Class A(b) | 2,300 | 511,267 |
| | | | 5,117,377 |
| Life & Health Insurance–0.92% |
| Aflac, Inc. | 39,500 | 1,982,110 |
| Mortgage REITs–0.38% |
| AGNC Investment Corp. | 19,600 | 291,452 |
| Chimera Investment Corp. | 7,300 | 139,211 |
| MFA Financial, Inc. | 54,200 | 388,614 |
| | | | 819,277 |
| Office REITs–1.11% |
| Boston Properties, Inc. | 16,900 | 2,170,298 |
| Equity Commonwealth | 7,000 | 235,620 |
| | | | 2,405,918 |
| Oil & Gas Exploration & Production–2.64% |
| Cabot Oil & Gas Corp. | 137,700 | 2,357,424 |
| ConocoPhillips | 64,000 | 3,339,520 |
| | | | 5,696,944 |
| Oil & Gas Refining & Marketing–0.11% |
| CVR Energy, Inc. | 6,100 | 242,658 |
| Packaged Foods & Meats–5.75% |
| General Mills, Inc. | 61,800 | 3,324,840 |
| Hershey Co. (The) | 24,100 | 3,819,368 |
| Mondelez International, Inc., Class A | 65,200 | 3,600,344 |
| TreeHouse Foods, Inc.(b) | 33,100 | 1,676,515 |
| | | | 12,421,067 |
| Paper Products–0.07% |
| Domtar Corp. | 4,400 | 144,980 |
| Pharmaceuticals–3.22% |
| Eli Lilly and Co. | 28,200 | 3,185,754 |
| Merck & Co., Inc. | 43,700 | 3,778,739 |
| | | | 6,964,493 |
| Regional Banks–1.64% |
| Popular, Inc. (Puerto Rico) | 67,400 | 3,543,218 |
| Research & Consulting Services–0.23% |
| Thomson Reuters Corp. (Canada) | 7,100 | 487,628 |
| | Shares | Value |
| Residential REITs–3.43% |
| Equity LifeStyle Properties, Inc. | 19,500 | $2,627,040 |
| Equity Residential | 8,100 | 686,556 |
| Essex Property Trust, Inc. | 10,500 | 3,373,230 |
| Mid-America Apartment Communities, Inc. | 5,700 | 722,076 |
| | | | 7,408,902 |
| Restaurants–4.35% |
| Brinker International, Inc. | 43,900 | 1,668,200 |
| Starbucks Corp. | 43,800 | 4,229,328 |
| Yum! Brands, Inc. | 30,000 | 3,503,400 |
| | | | 9,400,928 |
| Retail REITs–1.63% |
| Kimco Realty Corp. | 116,200 | 2,135,756 |
| Retail Properties of America, Class A | 122,200 | 1,388,192 |
| | | | 3,523,948 |
| Specialized Consumer Services–1.25% |
| H&R Block, Inc. | 111,400 | 2,698,108 |
| Specialized REITs–5.04% |
| EPR Properties | 6,400 | 500,800 |
| Lamar Advertising Co., Class A | 42,700 | 3,272,955 |
| Life Storage, Inc. | 18,000 | 1,907,280 |
| Public Storage | 12,550 | 3,322,487 |
| SBA Communications Corp. | 7,200 | 1,889,496 |
| | | | 10,893,018 |
| Specialty Chemicals–0.08% |
| Livent Corp.(b) | 27,900 | 171,585 |
| Systems Software–1.50% |
| Oracle Corp. | 62,500 | 3,253,750 |
| Technology Distributors–0.94% |
| Tech Data Corp.(b) | 22,000 | 2,040,060 |
| Technology Hardware, Storage & Peripherals–3.01% |
| Hewlett Packard Enterprise Co. | 239,100 | 3,304,362 |
| Xerox Holdings Corp. | 110,400 | 3,200,496 |
| | | | 6,504,858 |
| Total Common Stocks & Other Equity Interests (Cost $203,950,624) | 210,266,487 |
| | Principal
Amount | |
| U.S. Treasury Securities–0.25% |
| U.S. Treasury Bills–0.25% |
2.45%, 09/12/2019
(Cost $549,588)(e)(f) | | $550,000 | 549,588 |
| | Shares | |
| Money Market Funds–2.35% |
| Invesco Government & Agency Portfolio, Institutional Class, 2.02%(g) | 1,777,003 | 1,777,003 |
| Invesco Liquid Assets Portfolio, Institutional Class, 2.14%(g) | 1,269,013 | 1,269,521 |
See accompanying Notes to Financial Statements which are an integral part of the financial statements.
| 11 | Invesco Low Volatility Equity Yield Fund |
| | Shares | Value |
| Money Market Funds–(continued) |
| Invesco Treasury Portfolio, Institutional Class, 1.98%(g) | 2,030,861 | $2,030,861 |
| Total Money Market Funds (Cost $5,077,132) | 5,077,385 |
| TOTAL INVESTMENTS IN SECURITIES (excluding investments purchased with cash collateral from securities on loan)-99.88% (Cost $209,577,344) | | | 215,893,460 |
| Investments Purchased with Cash Collateral from Securities on Loan |
| Money Market Funds–0.46% |
| Invesco Government & Agency Portfolio, Institutional Class, 2.02%(g)(h) | 750,916 | 750,916 |
| | Shares | Value |
| Money Market Funds–(continued) |
| Invesco Liquid Assets Portfolio, Institutional Class, 2.14%(g)(h) | 250,205 | $250,305 |
| Total Investments Purchased with Cash Collateral from Securities on Loan (Cost $1,001,221) | 1,001,221 |
| TOTAL INVESTMENTS IN SECURITIES–100.34% (Cost $210,578,565) | 216,894,681 |
| OTHER ASSETS LESS LIABILITIES—(0.34)% | (741,539) |
| NET ASSETS–100.00% | $216,153,142 |
Investment Abbreviations:
| REIT | – Real Estate Investment Trust |
Notes to Schedule of Investments:
| (a) | Industry and/or sector classifications used in this report are generally according to the Global Industry Classification Standard, which was developed by and is the exclusive property and a service mark of MSCI Inc. and Standard & Poor’s. |
| (b) | Non-income producing security. |
| (c) | All or a portion of this security was out on loan at August 31, 2019. |
| (d) | Each share is comprised of one share of common stock of Extended Stay America, Inc. and one share of Class B stock of ESH Hospitality, Inc. |
| (e) | Security traded on a discount basis. The interest rate shown represents the discount rate at the time of purchase by the Fund. |
| (f) | All or a portion of the value was pledged as collateral to cover margin requirements for open futures contracts. See Note 1J. |
| (g) | The money market fund and the Fund are affiliated by having the same investment adviser. The rate shown is the 7-day SEC standardized yield as of August 31, 2019. |
| (h) | The security has been segregated to satisfy the commitment to return the cash collateral received in securities lending transactions upon the borrower’s return of the securities loaned. See Note 1I. |
| Open Futures Contracts |
| Long Futures Contracts | Number of
Contracts | Expiration
Month | Notional
Value | Value | Unrealized
Appreciation
(Depreciation) |
| Equity Risk |
| E-Mini S&P 500 Index | 36 | September-2019 | $5,264,640 | $(18,164) | $(18,164) |
See accompanying Notes to Financial Statements which are an integral part of the financial statements.
| 12 | Invesco Low Volatility Equity Yield Fund |
Statement of Assets and Liabilities
August 31, 2019
| Assets: | |
Investments in securities, at value
(Cost $204,500,212)* | $210,816,075 |
| Investments in affiliated money market funds, at value (Cost $6,078,353) | 6,078,606 |
| Foreign currencies, at value (Cost $6,207) | 6,200 |
| Receivable for: | |
| Fund shares sold | 161,507 |
| Dividends | 451,544 |
| Investment for trustee deferred compensation and retirement plans | 198,645 |
| Other assets | 37,286 |
| Total assets | 217,749,863 |
| Liabilities: | |
| Other investments: | |
| Variation margin payable - futures contracts | 3,652 |
| Payable for: | |
| Fund shares reacquired | 109,444 |
| Amount due custodian | 40,766 |
| Collateral upon return of securities loaned | 1,001,221 |
| Accrued fees to affiliates | 160,390 |
| Accrued trustees’ and officers’ fees and benefits | 2,744 |
| Accrued other operating expenses | 67,976 |
| Trustee deferred compensation and retirement plans | 210,528 |
| Total liabilities | 1,596,721 |
| Net assets applicable to shares outstanding | $216,153,142 |
| Net assets consist of: | |
| Shares of beneficial interest | $219,413,182 |
| Distributable earnings | (3,260,040) |
| | $216,153,142 |
| Net Assets: |
| Class A | $153,640,952 |
| Class C | $4,626,640 |
| Class R | $526,429 |
| Class Y | $8,321,682 |
| Investor Class | $36,647,374 |
| Class R5 | $11,072,790 |
| Class R6 | $1,317,275 |
| Shares outstanding, no par value, with an unlimited number of shares authorized: |
| Class A | 14,729,434 |
| Class C | 451,808 |
| Class R | 50,708 |
| Class Y | 793,945 |
| Investor Class | 3,501,139 |
| Class R5 | 1,054,703 |
| Class R6 | 125,518 |
| Class A: | |
| Net asset value per share | $10.43 |
Maximum offering price per share
(Net asset value of $10.43 ÷ 94.50%) | $11.04 |
| Class C: | |
| Net asset value and offering price per share | $10.24 |
| Class R: | |
| Net asset value and offering price per share | $10.38 |
| Class Y: | |
| Net asset value and offering price per share | $10.48 |
| Investor Class: | |
| Net asset value and offering price per share | $10.47 |
| Class R5: | |
| Net asset value and offering price per share | $10.50 |
| Class R6: | |
| Net asset value and offering price per share | $10.49 |
| * | At August 31, 2019, securities with an aggregate value of $973,501 were on loan to brokers. |
See accompanying Notes to Financial Statements which are an integral part of the financial statements.
| 13 | Invesco Low Volatility Equity Yield Fund |
Statement of Operations
For the year ended August 31, 2019
| Investment income: | |
| Dividends (net of foreign withholding taxes of $74,966) | $6,262,888 |
| Dividends from affiliated money market funds (includes securities lending income of $2,360) | 125,841 |
| Total investment income | 6,388,729 |
| Expenses: | |
| Advisory fees | 1,408,009 |
| Administrative services fees | 50,477 |
| Custodian fees | 6,649 |
| Distribution fees: | |
| Class A | 401,678 |
| Class C | 119,754 |
| Class R | 1,800 |
| Investor Class | 100,260 |
| Transfer agent fees — A, C, R, Y and Investor | 474,157 |
| Transfer agent fees — R5 | 3,154 |
| Transfer agent fees — R6 | 138 |
| Trustees’ and officers’ fees and benefits | 23,963 |
| Registration and filing fees | 93,472 |
| Reports to shareholders | 38,217 |
| Professional services fees | 52,702 |
| Other | 16,805 |
| Total expenses | 2,791,235 |
| Less: Fees waived and/or expense offset arrangement(s) | (12,597) |
| Net expenses | 2,778,638 |
| Net investment income | 3,610,091 |
| Realized and unrealized gain (loss) from: | |
| Net realized gain (loss) from: | |
| Investment securities | (10,481,526) |
| Foreign currencies | (700) |
| Futures contracts | 106,642 |
| | (10,375,584) |
| Change in net unrealized appreciation (depreciation) of: | |
| Investment securities | (23,317,537) |
| Foreign currencies | 80 |
| Futures contracts | (192,022) |
| | (23,509,479) |
| Net realized and unrealized gain (loss) | (33,885,063) |
| Net increase (decrease) in net assets resulting from operations | $(30,274,972) |
See accompanying Notes to Financial Statements which are an integral part of the financial statements.
| 14 | Invesco Low Volatility Equity Yield Fund |
Statement of Changes in Net Assets
For the years ended August 31, 2019 and 2018
| | 2019 | 2018 |
| Operations: | | |
| Net investment income | $3,610,091 | $3,562,190 |
| Net realized gain (loss) | (10,375,584) | 19,087,351 |
| Change in net unrealized appreciation (depreciation) | (23,509,479) | 11,482,018 |
| Net increase (decrease) in net assets resulting from operations | (30,274,972) | 34,131,559 |
| Distributions to shareholders from distributable earnings(1): | | |
| Class A | (4,688,562) | (2,847,497) |
| Class B | — | (9,092) |
| Class C | (433,725) | (229,135) |
| Class R | (9,231) | (4,638) |
| Class Y | (293,101) | (217,670) |
| Investor Class | (1,229,582) | (775,351) |
| Class R5 | (382,387) | (300,493) |
| Class R6 | (42,321) | (8,820) |
| Total distributions from distributable earnings | (7,078,909) | (4,392,696) |
| Share transactions–net: | | |
| Class A | 2,817,600 | (14,450,270) |
| Class B | — | (1,395,465) |
| Class C | (16,568,468) | (3,395,533) |
| Class R | 297,785 | (136,073) |
| Class Y | (677,915) | (3,459,134) |
| Investor Class | (4,234,832) | (3,969,471) |
| Class R5 | 437,779 | (3,067,653) |
| Class R6 | 191,827 | 1,258,032 |
| Net increase (decrease) in net assets resulting from share transactions | (17,736,224) | (28,615,567) |
| Net increase (decrease) in net assets | (55,090,105) | 1,123,296 |
| Net assets: | | |
| Beginning of year | 271,243,247 | 270,119,951 |
| End of year | $216,153,142 | $271,243,247 |
| (1) | The Securities and Exchange Commission eliminated the requirement to disclose distribution components separately, except for tax return of capital. For the year ended August 31, 2018, distributions to shareholders from distributable earnings consisted of distributions from net investment income. |
See accompanying Notes to Financial Statements which are an integral part of the financial statements.
| 15 | Invesco Low Volatility Equity Yield Fund |
Financial Highlights
August 31, 2019
The following schedule presents financial highlights for a share of the Fund outstanding throughout the periods indicated.
| | Net asset
value,
beginning
of period | Net
investment
income(a) | Net gains
(losses)
on securities
(both
realized and
unrealized) | Total from
investment
operations | Dividends
from net
investment
income | Distributions
from net
realized
gains | Total
distributions | Net asset
value, end
of period | Total
return(b) | Net assets,
end of period
(000’s omitted) | Ratio of
expenses
to average
net assets
with fee waivers
and/or
expenses
absorbed | Ratio of
expenses
to average net
assets without
fee waivers
and/or
expenses
absorbed | Ratio of net
investment
income
to average
net assets | Portfolio
turnover(c) |
| Class A |
| Year ended 08/31/19 | $12.13 | $0.17 | $(1.54) | $(1.37) | $(0.13) | $(0.20) | $(0.33) | $10.43 | (11.34)% | $153,641 | 1.18%(d) | 1.18%(d) | 1.54%(d) | 117% |
| Year ended 08/31/18 | 10.86 | 0.15 | 1.31 | 1.46 | (0.19) | — | (0.19) | 12.13 | 13.57 | 175,074 | 1.21 | 1.21 | 1.35 | 119 |
| Year ended 08/31/17 | 9.97 | 0.24 | 0.90 | 1.14 | (0.25) | — | (0.25) | 10.86 | 11.65 | 170,628 | 1.21 | 1.21 | 2.33 | 108 |
| Year ended 08/31/16 | 9.40 | 0.25 | 0.62 | 0.87 | (0.30) | — | (0.30) | 9.97 | 9.40 | 173,949 | 1.20 | 1.20 | 2.59 | 107 |
| Year ended 08/31/15 | 11.75 | 0.26 | (1.43) | (1.17) | (0.31) | (0.87) | (1.18) | 9.40 | (10.72) | 177,739 | 1.15 | 1.15 | 2.49 | 101 |
| Class C |
| Year ended 08/31/19 | 11.92 | 0.09 | (1.53) | (1.44) | (0.04) | (0.20) | (0.24) | 10.24 | (12.05) | 4,627 | 1.93(d) | 1.93(d) | 0.79(d) | 117 |
| Year ended 08/31/18 | 10.68 | 0.07 | 1.27 | 1.34 | (0.10) | — | (0.10) | 11.92 | 12.64 | 24,319 | 1.96 | 1.96 | 0.60 | 119 |
| Year ended 08/31/17 | 9.80 | 0.16 | 0.89 | 1.05 | (0.17) | — | (0.17) | 10.68 | 10.87 | 25,022 | 1.96 | 1.96 | 1.58 | 108 |
| Year ended 08/31/16 | 9.24 | 0.17 | 0.61 | 0.78 | (0.22) | — | (0.22) | 9.80 | 8.59 | 28,435 | 1.95 | 1.95 | 1.84 | 107 |
| Year ended 08/31/15 | 11.56 | 0.18 | (1.41) | (1.23) | (0.22) | (0.87) | (1.09) | 9.24 | (11.37) | 29,959 | 1.90 | 1.90 | 1.74 | 101 |
| Class R |
| Year ended 08/31/19 | 12.07 | 0.14 | (1.53) | (1.39) | (0.10) | (0.20) | (0.30) | 10.38 | (11.54) | 526 | 1.43(d) | 1.43(d) | 1.29(d) | 117 |
| Year ended 08/31/18 | 10.81 | 0.13 | 1.29 | 1.42 | (0.16) | — | (0.16) | 12.07 | 13.25 | 271 | 1.46 | 1.46 | 1.10 | 119 |
| Year ended 08/31/17 | 9.92 | 0.21 | 0.91 | 1.12 | (0.23) | — | (0.23) | 10.81 | 11.42 | 376 | 1.46 | 1.46 | 2.08 | 108 |
| Year ended 08/31/16 | 9.35 | 0.22 | 0.62 | 0.84 | (0.27) | — | (0.27) | 9.92 | 9.16 | 268 | 1.45 | 1.45 | 2.34 | 107 |
| Year ended 08/31/15 | 11.69 | 0.24 | (1.43) | (1.19) | (0.28) | (0.87) | (1.15) | 9.35 | (10.93) | 170 | 1.40 | 1.40 | 2.24 | 101 |
| Class Y |
| Year ended 08/31/19 | 12.19 | 0.20 | (1.55) | (1.35) | (0.16) | (0.20) | (0.36) | 10.48 | (11.14) | 8,322 | 0.93(d) | 0.93(d) | 1.79(d) | 117 |
| Year ended 08/31/18 | 10.91 | 0.18 | 1.32 | 1.50 | (0.22) | — | (0.22) | 12.19 | 13.89 | 10,450 | 0.96 | 0.96 | 1.60 | 119 |
| Year ended 08/31/17 | 10.02 | 0.27 | 0.90 | 1.17 | (0.28) | — | (0.28) | 10.91 | 11.89 | 12,671 | 0.96 | 0.96 | 2.58 | 108 |
| Year ended 08/31/16 | 9.45 | 0.27 | 0.62 | 0.89 | (0.32) | — | (0.32) | 10.02 | 9.64 | 8,152 | 0.95 | 0.95 | 2.84 | 107 |
| Year ended 08/31/15 | 11.80 | 0.29 | (1.43) | (1.14) | (0.34) | (0.87) | (1.21) | 9.45 | (10.43) | 4,861 | 0.90 | 0.90 | 2.74 | 101 |
| Investor Class |
| Year ended 08/31/19 | 12.17 | 0.17 | (1.54) | (1.37) | (0.13) | (0.20) | (0.33) | 10.47 | (11.30) | 36,647 | 1.18(d) | 1.18(d) | 1.54(d) | 117 |
| Year ended 08/31/18 | 10.90 | 0.16 | 1.30 | 1.46 | (0.19) | — | (0.19) | 12.17 | 13.53 | 47,454 | 1.21 | 1.21 | 1.35 | 119 |
| Year ended 08/31/17 | 10.00 | 0.24 | 0.91 | 1.15 | (0.25) | — | (0.25) | 10.90 | 11.73 | 46,259 | 1.21 | 1.21 | 2.33 | 108 |
| Year ended 08/31/16 | 9.43 | 0.25 | 0.62 | 0.87 | (0.30) | — | (0.30) | 10.00 | 9.38 | 53,620 | 1.20 | 1.20 | 2.59 | 107 |
| Year ended 08/31/15 | 11.78 | 0.27 | (1.44) | (1.17) | (0.31) | (0.87) | (1.18) | 9.43 | (10.68) | 52,880 | 1.15 | 1.15 | 2.49 | 101 |
| Class R5 |
| Year ended 08/31/19 | 12.21 | 0.22 | (1.56) | (1.34) | (0.17) | (0.20) | (0.37) | 10.50 | (10.96) | 11,073 | 0.75(d) | 0.75(d) | 1.97(d) | 117 |
| Year ended 08/31/18 | 10.93 | 0.20 | 1.32 | 1.52 | (0.24) | — | (0.24) | 12.21 | 14.06 | 12,374 | 0.79 | 0.79 | 1.77 | 119 |
| Year ended 08/31/17 | 10.03 | 0.29 | 0.91 | 1.20 | (0.30) | — | (0.30) | 10.93 | 12.20 | 13,858 | 0.77 | 0.77 | 2.77 | 108 |
| Year ended 08/31/16 | 9.46 | 0.29 | 0.62 | 0.91 | (0.34) | — | (0.34) | 10.03 | 9.82 | 13,194 | 0.77 | 0.77 | 3.02 | 107 |
| Year ended 08/31/15 | 11.82 | 0.31 | (1.44) | (1.13) | (0.36) | (0.87) | (1.23) | 9.46 | (10.35) | 13,881 | 0.75 | 0.75 | 2.89 | 101 |
| Class R6 |
| Year ended 08/31/19 | 12.20 | 0.22 | (1.55) | (1.33) | (0.18) | (0.20) | (0.38) | 10.49 | (10.96) | 1,317 | 0.73(d) | 0.73(d) | 1.99(d) | 117 |
| Year ended 08/31/18 | 10.93 | 0.21 | 1.30 | 1.51 | (0.24) | — | (0.24) | 12.20 | 14.00 | 1,301 | 0.75 | 0.75 | 1.81 | 119 |
| Year ended 08/31/17(e) | 10.58 | 0.12 | 0.31 | 0.43 | (0.08) | — | (0.08) | 10.93 | 4.05 | 10 | 0.75(f) | 0.75(f) | 2.79(f) | 108 |
| (a) | Calculated using average shares outstanding. |
| (b) | Includes adjustments in accordance with accounting principles generally accepted in the United States of America and as such, the net asset value for financial reporting purposes and the returns based upon those net asset values may differ from the net asset value and returns for shareholder transactions. Does not include sales charges and is not annualized for periods less than one year, if applicable. |
| (c) | Portfolio turnover is calculated at the fund level and is not annualized for periods less than one year, if applicable. |
| (d) | Ratios are based on average daily net assets (000’s omitted) of $160,671, $11,975, $360, $8,944, $40,104, $11,300 and $1,313 for Class A, Class C, Class R, Class Y, Investor Class, Class R5 and Class R6 shares, respectively. |
| (e) | Commencement date of April 04, 2017. |
| (f) | Annualized. |
See accompanying Notes to Financial Statements which are an integral part of the financial statements.
| 16 | Invesco Low Volatility Equity Yield Fund |
Notes to Financial Statements
August 31, 2019
NOTE 1—Significant Accounting Policies
Invesco Low Volatility Equity Yield Fund (the “Fund”) is a series portfolio of AIM Counselor Series Trust (Invesco Counselor Series Trust) (the “Trust”). The Trust is a Delaware statutory trust registered under the Investment Company Act of 1940, as amended (the “1940 Act”), as an open-end series management investment company authorized to issue an unlimited number of shares of beneficial interest. Information presented in these financial statements pertains only to the Fund. Matters affecting the Fund or each class will be voted on exclusively by the shareholders of the Fund or each class.
The Fund’s investment objective is income and long-term growth of capital.
The Fund currently consists of seven different classes of shares: Class A, Class C, Class R, Class Y, Investor Class, Class R5 and Class R6. Class Y and Investor Class shares are available only to certain investors. Class A shares are sold with a front-end sales charge unless certain waiver criteria are met. Under certain circumstances, load waived shares may be subject to contingent deferred sales charges ("CDSC"). Class C shares are sold with a CDSC. Class R, Class Y, Investor Class, Class R5 and Class R6 shares are sold at net asset value. Class C shares held for ten years after purchase are eligible for automatic conversion into Class A shares of the same Fund (the "Conversion Feature"). The automatic conversion pursuant to the Conversion Feature will generally occur at the end of the month following the tenth anniversary after a purchase of Class C shares.
The Fund is an investment company and accordingly follows the investment company accounting and reporting guidance in accordance with Financial Accounting Standards Board Accounting Standards Codification Topic 946,Financial Services – Investment Companies.
The following is a summary of the significant accounting policies followed by the Fund in the preparation of its financial statements.
| A. | Security Valuations — Securities, including restricted securities, are valued according to the following policy. |
A security listed or traded on an exchange (except convertible securities) is valued at its last sales price or official closing price as of the close of the customary trading session on the exchange where the security is principally traded, or lacking any sales or official closing price on a particular day, the security may be valued at the closing bid price on that day. Securities traded in the over-the-counter market are valued based on prices furnished by independent pricing services or market makers. When such securities are valued by an independent pricing service they may be considered fair valued. Futures contracts are valued at the final settlement price set by an exchange on which they are principally traded. Listed options are valued at the mean between the last bid and asked prices from the exchange on which they are principally traded. Options not listed on an exchange are valued by an independent source at the mean between the last bid and asked prices. For purposes of determining net asset value (“NAV”) per share, futures and option contracts generally are valued 15 minutes after the close of the customary trading session of the New York Stock Exchange (“NYSE”).
Investments in open-end and closed-end registered investment companies that do not trade on an exchange are valued at the end-of-day net asset value per share. Investments in open-end and closed-end registered investment companies that trade on an exchange are valued at the last sales price or official closing price as of the close of the customary trading session on the exchange where the security is principally traded.
Debt obligations (including convertible securities) and unlisted equities are fair valued using an evaluated quote provided by an independent pricing service. Evaluated quotes provided by the pricing service may be determined without exclusive reliance on quoted prices, and may reflect appropriate factors such as institution-size trading in similar groups of securities, developments related to specific securities, dividend rate (for unlisted equities), yield (for debt obligations), quality, type of issue, coupon rate (for debt obligations), maturity (for debt obligations), individual trading characteristics and other market data. Pricing services generally value debt obligations assuming orderly transactions of institutional round lot size, but a fund may hold or transact in the same securities in smaller, odd lot sizes. Odd lots often trade at lower prices than institutional round lots. Debt obligations are subject to interest rate and credit risks. In addition, all debt obligations involve some risk of default with respect to interest and/or principal payments.
Foreign securities’ (including foreign exchange contracts) prices are converted into U.S. dollar amounts using the applicable exchange rates as of the close of the NYSE. If market quotations are available and reliable for foreign exchange-traded equity securities, the securities will be valued at the market quotations. Because trading hours for certain foreign securities end before the close of the NYSE, closing market quotations may become unreliable. If between the time trading ends on a particular security and the close of the customary trading session on the NYSE, events occur that the investment adviser determines are significant and make the closing price unreliable, the Fund may fair value the security. If the event is likely to have affected the closing price of the security, the security will be valued at fair value in good faith using procedures approved by the Board of Trustees. Adjustments to closing prices to reflect fair value may also be based on a screening process of an independent pricing service to indicate the degree of certainty, based on historical data, that the closing price in the principal market where a foreign security trades is not the current value as of the close of the NYSE. Foreign securities’ prices meeting the approved degree of certainty that the price is not reflective of current value will be priced at the indication of fair value from the independent pricing service. Multiple factors may be considered by the independent pricing service in determining adjustments to reflect fair value and may include information relating to sector indices, American Depositary Receipts and domestic and foreign index futures. Foreign securities may have additional risks including exchange rate changes, potential for sharply devalued currencies and high inflation, political and economic upheaval, the relative lack of issuer information, relatively low market liquidity and the potential lack of strict financial and accounting controls and standards.
Securities for which market prices are not provided by any of the above methods may be valued based upon quotes furnished by independent sources. The last bid price may be used to value equity securities. The mean between the last bid and asked prices is used to value debt obligations, including corporate loans.
Securities for which market quotations are not readily available or became unreliable are valued at fair value as determined in good faith by or under the supervision of the Trust’s officers following procedures approved by the Board of Trustees. Issuer specific events, market trends, bid/asked quotes of brokers and information providers and other market data may be reviewed in the course of making a good faith determination of a security’s fair value.
The Fund may invest in securities that are subject to interest rate risk, meaning the risk that the prices will generally fall as interest rates rise and, conversely, the prices will generally rise as interest rates fall. Specific securities differ in their sensitivity to changes in interest rates
| 17 | Invesco Low Volatility Equity Yield Fund |
depending on their individual characteristics. Changes in interest rates may result in increased market volatility, which may affect the value and/or liquidity of certain Fund investments.
Valuations change in response to many factors including the historical and prospective earnings of the issuer, the value of the issuer’s assets, general economic conditions, interest rates, investor perceptions and market liquidity. Because of the inherent uncertainties of valuation, the values reflected in the financial statements may materially differ from the value received upon actual sale of those investments.
| B. | Securities Transactions and Investment Income – Securities transactions are accounted for on a trade date basis. Realized gains or losses on sales are computed on the basis of specific identification of the securities sold. Interest income (net of withholding tax, if any) is recorded on the accrual basis from settlement date. Bond premiums and discounts are amortized and/or accreted over the lives of the respective securities. Pay-in-kind interest income and non-cash dividend income received in the form of securities in-lieu of cash are recorded at the fair value of the securities received. Dividend income (net of withholding tax, if any) is recorded on the ex-dividend date. |
The Fund may periodically participate in litigation related to Fund investments. As such, the Fund may receive proceeds from litigation settlements. Any proceeds received are included in the Statement of Operations as realized gain (loss) for investments no longer held and as unrealized gain (loss) for investments still held.
Brokerage commissions and mark ups are considered transaction costs and are recorded as an increase to the cost basis of securities purchased and/or a reduction of proceeds on a sale of securities. Such transaction costs are included in the determination of net realized and unrealized gain (loss) from investment securities reported in the Statement of Operations and the Statement of Changes in Net Assets and the net realized and unrealized gains (losses) on securities per share in the Financial Highlights. Transaction costs are included in the calculation of the Fund’s net asset value and, accordingly, they reduce the Fund’s total returns. These transaction costs are not considered operating expenses and are not reflected in net investment income reported in the Statement of Operations and the Statement of Changes in Net Assets, or the net investment income per share and the ratios of expenses and net investment income reported in the Financial Highlights, nor are they limited by any expense limitation arrangements between the Fund and the investment adviser.
The Fund allocates income and realized and unrealized capital gains and losses to a class based on the relative net assets of each class.
| C. | Country Determination — For the purposes of making investment selection decisions and presentation in the Schedule of Investments, the investment adviser may determine the country in which an issuer is located and/or credit risk exposure based on various factors. These factors include the laws of the country under which the issuer is organized, where the issuer maintains a principal office, the country in which the issuer derives 50% or more of its total revenues and the country that has the primary market for the issuer’s securities, as well as other criteria. Among the other criteria that may be evaluated for making this determination are the country in which the issuer maintains 50% or more of its assets, the type of security, financial guarantees and enhancements, the nature of the collateral and the sponsor organization. Country of issuer and/or credit risk exposure has been determined to be the United States of America, unless otherwise noted. |
| D. | Distributions- Distributions from net investment income, if any, are declared and paid quarterly and are recorded on the ex-dividend date. Distributions from net realized capital gain, if any, are generally declared and paid annually and recorded on the ex-dividend date. The Fund may elect to treat a portion of the proceeds from redemptions as distributions for federal income tax purposes. |
| E. | Federal Income Taxes –The Fund intends to comply with the requirements of Subchapter M of the Internal Revenue Code of 1986, as amended (the “Internal Revenue Code”), necessary to qualify as a regulated investment company and to distribute substantially all of the Fund’s taxable earnings to shareholders. As such, the Fund will not be subject to federal income taxes on otherwise taxable income (including net realized capital gain) that is distributed to shareholders. Therefore, no provision for federal income taxes is recorded in the financial statements. |
The Fund recognizes the tax benefits of uncertain tax positions only when the position is more likely than not to be sustained. Management has analyzed the Fund’s uncertain tax positions and concluded that no liability for unrecognized tax benefits should be recorded related to uncertain tax positions. Management is not aware of any tax positions for which it is reasonably possible that the total amounts of unrecognized tax benefits will change materially in the next 12 months.
The Fund files tax returns in the U.S. Federal jurisdiction and certain other jurisdictions. Generally, the Fund is subject to examinations by such taxing authorities for up to three years after the filing of the return for the tax period.
| F. | Expenses – Fees provided for under the Rule 12b-1 plan of a particular class of the Fund are charged to the operations of such class. Transfer agency fees and expenses and other shareholder recordkeeping fees and expenses attributable to Class R5 and Class R6 are allocated to each share class based on relative net assets. Sub-accounting fees attributable to Class R5 are charged to the operations of the class. Transfer agency fees and expenses and other shareholder recordkeeping fees and expenses relating to all other classes are allocated among those classes based on relative net assets. All other expenses are allocated among the classes based on relative net assets. |
| G. | Accounting Estimates – The preparation of financial statements in conformity with accounting principles generally accepted in the United States of America (“GAAP”) requires management to make estimates and assumptions that affect the reported amounts of assets and liabilities at the date of the financial statements and the reported amounts of revenues and expenses during the reporting period including estimates and assumptions related to taxation. Actual results could differ from those estimates by a significant amount. In addition, the Fund monitors for material events or transactions that may occur or become known after the period-end date and before the date the financial statements are released to print. |
| H. | Indemnifications – Under the Trust’s organizational documents, each Trustee, officer, employee or other agent of the Trust is indemnified against certain liabilities that may arise out of the performance of their duties to the Fund. Additionally, in the normal course of business, the Fund enters into contracts, including the Fund’s servicing agreements, that contain a variety of indemnification clauses. The Fund’s maximum exposure under these arrangements is unknown as this would involve future claims that may be made against the Fund that have not yet occurred. The risk of material loss as a result of such indemnification claims is considered remote. |
| I. | Securities Lending – The Fund may lend portfolio securities having a market value up to one-third of the Fund’s total assets. Such loans are secured by collateral equal to no less than the market value of the loaned securities determined daily by the securities lending provider. Such collateral will be cash or debt securities issued or guaranteed by the U.S. Government or any of its sponsored agencies. Cash collateral received in connection with these loans is invested in short-term money market instruments or affiliated money market funds and is shown as such on the Schedule of Investments. The Fund bears the risk of loss with respect to the investment of collateral. It is the Fund’s policy to obtain additional collateral from or return excess collateral to the borrower by the end of the next business day, following the valuation date of the securities loaned. Therefore, the value of the collateral held may be temporarily less than the value of the securities on loan. When loaning securities, the |
| 18 | Invesco Low Volatility Equity Yield Fund |
| | Fund retains certain benefits of owning the securities, including the economic equivalent of dividends or interest generated by the security. Lending securities entails a risk of loss to the Fund if, and to the extent that, the market value of the securities loaned were to increase and the borrower did not increase the collateral accordingly, and the borrower failed to return the securities. The securities loaned are subject to termination at the option of the borrower or the Fund. Upon termination, the borrower will return to the Fund the securities loaned and the Fund will return the collateral. Upon the failure of the borrower to return the securities, collateral may be liquidated and the securities may be purchased on the open market to replace the loaned securities. The Fund could experience delays and costs in gaining access to the collateral and the securities may lose value during the delay which could result in potential losses to the Fund. Some of these losses may be indemnified by the lending agent. The Fund bears the risk of any deficiency in the amount of the collateral available for return to the borrower due to any loss on the collateral invested. Dividends received on cash collateral investments for securities lending transactions, which are net of compensation to counterparties, are included inDividends from affiliated money market funds on the Statement of Operations. The aggregate value of securities out on loan, if any, is shown as a footnote on the Statement of Assets and Liabilities. |
| J. | Futures Contracts — The Fund may enter into futures contracts to manage exposure to interest rate, equity and market price movements and/or currency risks. A futures contract is an agreement between two parties ("Counterparties") to purchase or sell a specified underlying security, currency or commodity (or delivery of a cash settlement price, in the case of an index future) for a fixed price at a future date. The Fund currently invests only in exchange-traded futures and they are standardized as to maturity date and underlying financial instrument. Initial margin deposits required upon entering into futures contracts are satisfied by the segregation of specific securities or cash as collateral at the futures commission merchant (broker). During the period the futures contracts are open, changes in the value of the contracts are recognized as unrealized gains or losses by recalculating the value of the contracts on a daily basis. Subsequent or variation margin payments are received or made depending upon whether unrealized gains or losses are incurred. These amounts are reflected as receivables or payables on the Statement of Assets and Liabilities. When the contracts are closed or expire, the Fund recognizes a realized gain or loss equal to the difference between the proceeds from, or cost of, the closing transaction and the Fund’s basis in the contract. The net realized gain (loss) and the change in unrealized gain (loss) on futures contracts held during the period is included on the Statement of Operations. The primary risks associated with futures contracts are market risk and the absence of a liquid secondary market. If the Fund were unable to liquidate a futures contract and/or enter into an offsetting closing transaction, the Fund would continue to be subject to market risk with respect to the value of the contracts and continue to be required to maintain the margin deposits on the futures contracts. Futures contracts have minimal Counterparty risk since the exchange’s clearinghouse, as Counterparty to all exchange-traded futures, guarantees the futures against default. Risks may exceed amounts recognized in the Statement of Assets and Liabilities. |
| K. | Collateral—To the extent the Fund has designated or segregated a security as collateral and that security is subsequently sold, it is the Fund’s practice to replace such collateral no later than the next business day. |
NOTE 2—Advisory Fees and Other Fees Paid to Affiliates
The Trust has entered into a master investment advisory agreement with Invesco Advisers, Inc. (the "Adviser" or "Invesco"). Under the terms of the investment advisory agreement, the Fund accrues daily and pays monthly an advisory fee to the Adviser based on the annual rate of the Fund’s average daily net assets as follows:
| Average Daily Net Assets | Rate |
| First $250 million | 0.60% |
| Next $250 million | 0.575% |
| Next $500 million | 0.55% |
| Next $1.5 billion | 0.525% |
| Next $2.5 billion | 0.50% |
| Next $2.5 billion | 0.475% |
| Next $2.5 billion | 0.45% |
| Over $10 billion | 0.425% |
For the year ended August 31, 2019, the effective advisory fees incurred by the Fund was 0.60%.
Under the terms of a master sub-advisory agreement between the Adviser and each of Invesco Asset Management Deutschland GmbH, Invesco Asset Management Limited, Invesco Asset Management (Japan) Limited, Invesco Hong Kong Limited, Invesco Senior Secured Management, Inc. and Invesco Canada Ltd. (collectively, the "Affiliated Sub-Advisers") the Adviser, not the Fund, will pay 40% of the fees paid to the Adviser to any such Affiliated Sub-Adviser(s) that provide(s) discretionary investment management services to the Fund based on the percentage of assets allocated to such Affiliated Sub-Adviser(s).
The Adviser has contractually agreed, through at least June 30, 2020, to waive advisory fees and/or reimburse expenses to the extent necessary to limit total annual fund operating expenses after fee waiver and/or reimbursement (excluding certain items discussed below) of Class A, Class C, Class R, Class Y, Investor Class, Class R5 and Class R6 shares to 2.00%, 2.75%, 2.25%, 1.75%, 2.00%, 1.75% and 1.75%, respectively, of the Fund’s average daily net assets (the "expense limits"). In determining the Adviser’s obligation to waive advisory fees and/or reimburse expenses, the following expenses are not taken into account, and could cause the total annual fund operating expenses after fee waiver and/or reimbursement to exceed the numbers reflected above: (1) interest; (2) taxes; (3) dividend expense on short sales; (4) extraordinary or non-routine items, including litigation expenses; and (5) expenses that the Fund has incurred but did not actually pay because of an expense offset arrangement. Unless Invesco continues the fee waiver agreement, it will terminate on June 30, 2020. During its term, the fee waiver agreement cannot be terminated or amended to increase the expense limits or reduce the advisory fee waivers without approval of the Board of Trustees. The Adviser did not waive fees and/or reimburse expenses during the period under this expense limit.
Further, the Adviser has contractually agreed, through at least June 30, 2021, to waive the advisory fee payable by the Fund in an amount equal to 100% of the net advisory fees the Adviser receives from the affiliated money market funds on investments by the Fund of uninvested cash (excluding investments of cash collateral from securities lending) in such affiliated money market funds.
| 19 | Invesco Low Volatility Equity Yield Fund |
For the year ended August 31, 2019, the Adviser waived advisory fees of $6,140.
The Trust has entered into a master administrative services agreement with Invesco pursuant to which the Fund has agreed to pay Invesco for certain administrative costs incurred in providing accounting services to the Fund. For the year ended August 31, 2019, expenses incurred under the agreement are shown in the Statement of Operations asAdministrative services fees. Also, Invesco has entered into a sub-administration agreement whereby State Street Bank and Trust Company (“SSB”) serves as custodian and fund accountant and provides certain administrative services to the Fund.
The Trust has entered into a transfer agency and service agreement with Invesco Investment Services, Inc. (“IIS”) pursuant to which the Fund has agreed to pay IIS a fee for providing transfer agency and shareholder services to the Fund and reimburse IIS for certain expenses incurred by IIS in the course of providing such services. IIS may make payments to intermediaries that provide omnibus account services, sub-accounting services and/or networking services. All fees payable by IIS to intermediaries that provide omnibus account services or sub-accounting services are charged back to the Fund, subject to certain limitations approved by the Trust’s Board of Trustees. For the year ended August 31, 2019, expenses incurred under the agreement are shown in the Statement of Operations asTransfer agent fees.
The Trust has entered into master distribution agreements with Invesco Distributors, Inc. (“IDI”) to serve as the distributor for the Class A, Class C, Class R, Class Y, Investor Class, Class R5 and Class R6 shares of the Fund. The Trust has adopted plans pursuant to Rule 12b-1 under the 1940 Act with respect to the Fund’s Class A, Class C, Class R and Investor Class shares (collectively, the “Plans”). The Fund, pursuant to the Plans, pays IDI compensation at the annual rate of 0.25% of the Fund’s average daily net assets of Class A shares, 1.00% of the average daily net assets of Class C shares and 0.50% of the average daily net assets of Class R shares. The Fund, pursuant to the Investor Class Plan, reimburses IDI for its allocated share of expenses incurred pursuant to the Investor Class Plan for the period, up to a maximum annual rate of 0.25% of the average daily net assets of Investor Class shares. Of the Plan payments, up to 0.25% of the average daily net assets of each class of shares may be paid to furnish continuing personal shareholder services to customers who purchase and own shares of such classes. Any amounts not paid as a service fee under the Plans would constitute an asset-based sales charge. Rules of the Financial Industry Regulatory Authority (“FINRA”) impose a cap on the total sales charges, including asset-based sales charges, that may be paid by any class of shares of the Fund. For the year ended August 31, 2019, expenses incurred under the Plans are shown in the Statement of Operations asDistribution fees.
Front-end sales commissions and CDSC (collectively, the “sales charges”) are not recorded as expenses of the Fund. Front-end sales commissions are deducted from proceeds from the sales of Fund shares prior to investment in Class A shares of the Fund. CDSC are deducted from redemption proceeds prior to remittance to the shareholder. During the year ended August 31, 2019, IDI advised the Fund that IDI retained $11,023 in front-end sales commissions from the sale of Class A shares and $816 and $800 from Class A and Class C shares, respectively, for CDSC imposed upon redemptions by shareholders.
Certain officers and trustees of the Trust are officers and directors of the Adviser, IIS and/or IDI.
NOTE 3—Additional Valuation Information
GAAP defines fair value as the price that would be received to sell an asset or paid to transfer a liability in an orderly transaction between market participants at the measurement date, under current market conditions. GAAP establishes a hierarchy that prioritizes the inputs to valuation methods, giving the highest priority to readily available unadjusted quoted prices in an active market for identical assets (Level 1) and the lowest priority to significant unobservable inputs (Level 3), generally when market prices are not readily available or are unreliable. Based on the valuation inputs, the securities or other investments are tiered into one of three levels. Changes in valuation methods may result in transfers in or out of an investment’s assigned level:
Level 1 – Prices are determined using quoted prices in an active market for identical assets.
Level 2 – Prices are determined using other significant observable inputs. Observable inputs are inputs that other market participants may use in pricing a security. These may include quoted prices for similar securities, interest rates, prepayment speeds, credit risk, yield curves, loss severities, default rates, discount rates, volatilities and others.
Level 3 – Prices are determined using significant unobservable inputs. In situations where quoted prices or observable inputs are unavailable (for example, when there is little or no market activity for an investment at the end of the period), unobservable inputs may be used. Unobservable inputs reflect the Fund’s own assumptions about the factors market participants would use in determining fair value of the securities or instruments and would be based on the best available information.
The following is a summary of the tiered valuation input levels, as of August 31, 2019. The level assigned to the securities valuations may not be an indication of the risk or liquidity associated with investing in those securities. Because of the inherent uncertainties of valuation, the values reflected in the financial statements may materially differ from the value received upon actual sale of those investments.
| | Level 1 | Level 2 | Level 3 | Total |
| Investments in Securities | | | | |
| Common Stocks & Other Equity Interests | $210,266,487 | $— | $— | $210,266,487 |
| U.S. Treasury Securities | — | 549,588 | — | 549,588 |
| Money Market Funds | 6,078,606 | — | — | 6,078,606 |
| Total Investments in Securities | 216,345,093 | 549,588 | — | 216,894,681 |
| Other Investments - Liabilities* | | | | |
| Futures Contracts | (18,164) | — | — | (18,164) |
| Total Investments | $216,326,929 | $549,588 | $— | $216,876,517 |
| * | Unrealized appreciation (depreciation). |
| 20 | Invesco Low Volatility Equity Yield Fund |
NOTE 4—Derivative Investments
The Fund may enter into an International Swaps and Derivatives Association Master Agreement (“ISDA Master Agreement”) under which a fund may trade OTC derivatives. An OTC transaction entered into under an ISDA Master Agreement typically involves a collateral posting arrangement, payment netting provisions and close-out netting provisions. These netting provisions allow for reduction of credit risk through netting of contractual obligations. The enforceability of the netting provisions of the ISDA Master Agreement depends on the governing law of the ISDA Master Agreement, among other factors.
For financial reporting purposes, the Fund does not offset OTC derivative assets or liabilities that are subject to ISDA Master Agreements in the Statement of Assets and Liabilities.
Value of Derivative Investments at Period-End
The table below summarizes the value of the Fund’s derivative investments, detailed by primary risk exposure, held as of August 31, 2019:
| | Value |
| Derivative Liabilities | Equity
Risk |
| Unrealized appreciation (depreciation) on futures contracts — Exchange-Traded(a) | $(18,164) |
| Derivatives not subject to master netting agreements | 18,164 |
| Total Derivative Liabilities subject to master netting agreements | $- |
| (a) | The daily variation margin receivable (payable) at period-end is recorded in the Statement of Assets and Liabilities. |
Effect of Derivative Investments for the year ended August 31, 2019
The table below summarizes the gains (losses) on derivative investments, detailed by primary risk exposure, recognized in earnings during the period:
| | Location of Gain (Loss) on
Statement of Operations |
| | Equity
Risk |
| Realized Gain: | |
| Futures contracts | $106,642 |
| Change in Net Unrealized Appreciation (Depreciation): | |
| Futures contracts | (192,022) |
| Total | $(85,380) |
The table below summarizes the average notional value of derivatives held during the period.
| | Futures
Contracts |
| Average notional value | $5,470,562 |
NOTE 5—Expense Offset Arrangement(s)
The expense offset arrangement is comprised of transfer agency credits which result from balances in demand deposit accounts used by the transfer agent for clearing shareholder transactions. For the year ended August 31, 2019, the Fund received credits from this arrangement, which resulted in the reduction of the Fund’s total expenses of $6,457.
NOTE 6—Trustees’ and Officers’ Fees and Benefits
Trustees’ and Officers’ Fees and Benefits include amounts accrued by the Fund to pay remuneration to certain Trustees and Officers of the Fund. Trustees have the option to defer compensation payable by the Fund, and Trustees’ and Officers’ Fees and Benefits also include amounts accrued by the Fund to fund such deferred compensation amounts. Those Trustees who defer compensation have the option to select various Invesco Funds in which their deferral accounts shall be deemed to be invested. Finally, certain current Trustees were eligible to participate in a retirement plan that provided for benefits to be paid upon retirement to Trustees over a period of time based on the number of years of service. The Fund may have certain former Trustees who also participate in a retirement plan and receive benefits under such plan.Trustees’ and Officers’ Fees and Benefits include amounts accrued by the Fund to fund such retirement benefits. Obligations under the deferred compensation and retirement plans represent unsecured claims against the general assets of the Fund.
NOTE 7—Cash Balances
The Fund is permitted to temporarily carry a negative or overdrawn balance in its account with SSB, the custodian bank. Such balances, if any at period-end, are shown in the Statement of Assets and Liabilities under the payable captionAmount due custodian. To compensate the custodian bank for such overdrafts, the overdrawn Fund may either (1) leave funds as a compensating balance in the account so the custodian bank can be compensated by earning the additional interest; or (2) compensate by paying the custodian bank at a rate agreed upon by the custodian bank and Invesco, not to exceed the contractually agreed upon rate. The Fund may not purchase additional securities when any borrowings from banks or broker-dealers exceed 5% of the Fund’s total assets, or when any borrowings from an Invesco Fund are outstanding.
| 21 | Invesco Low Volatility Equity Yield Fund |
NOTE 8—Distributions to Shareholders and Tax Components of Net Assets
| Tax Character of Distributions to Shareholders Paid During the Fiscal Years Ended August 31, 2019 and August 31, 2018 |
| | 2019 | 2018 |
| Ordinary income | $2,743,731 | $4,392,696 |
| Long-term capital gain | 4,335,178 | — |
| Total distributions | $7,078,909 | $4,392,696 |
| Tax Components of Net Assets at Period-End: |
| | 2019 |
| Undistributed ordinary income | $1,134,817 |
| Net unrealized appreciation — investments | 6,315,919 |
| Temporary book/tax differences | (176,537) |
| Capital loss carryforward | (10,534,239) |
| Shares of beneficial interest | 219,413,182 |
| Total net assets | $216,153,142 |
The difference between book-basis and tax-basis unrealized appreciation (depreciation) is due to differences in the timing of recognition of gains and losses on investments for tax and book purposes. The Fund’s net unrealized appreciation (depreciation) difference is attributable primarily to futures contracts.
The temporary book/tax differences are a result of timing differences between book and tax recognition of income and/or expenses. The Fund’s temporary book/tax differences are the result of the trustee deferral of compensation and retirement plan benefits.
Capital loss carryforward is calculated and reported as of a specific date. Results of transactions and other activity after that date may affect the amount of capital loss carryforward actually available for the Fund to utilize. Capital losses generated in years beginning after December 22, 2010 can be carried forward for an unlimited period, whereas previous losses expire in eight tax years. Capital losses with an expiration period may not be used to offset capital gains until all net capital losses without an expiration date have been utilized. Capital loss carryforwards with no expiration date will retain their character as either short-term or long-term capital losses instead of as short-term capital losses as under prior law. The ability to utilize capital loss carryforwards in the future may be limited under the Internal Revenue Code and related regulations based on the results of future transactions.
The Fund has a capital loss carryforward as of August 31, 2019, as follows:
| Capital Loss Carryforward |
| Expiration | Short-Term | Long-Term | Total |
| Not subject to expiration | $10,534,239 | $— | $10,534,239 |
NOTE 9—Investment Transactions
The aggregate amount of investment securities (other than short-term securities, U.S. Treasury obligations and money market funds, if any) purchased and sold by the Fund during the year ended August 31, 2019 was $269,375,374 and $289,317,572, respectively. Cost of investments, including any derivatives, on a tax basis includes the adjustments for financial reporting purposes as of the most recently completed federal income tax reporting period-end.
| Unrealized Appreciation (Depreciation) of Investments on a Tax Basis |
| Aggregate unrealized appreciation of investments | $18,982,400 |
| Aggregate unrealized (depreciation) of investments | (12,666,481) |
| Net unrealized appreciation of investments | $6,315,919 |
Cost of investments for tax purposes is $210,560,598.
NOTE 10—Reclassification of Permanent Differences
Primarily as a result of differing book/tax treatment of distributions, on August 31, 2019, undistributed net investment income was decreased by $16,837 and undistributed net realized gain (loss) was increased by $16,837. This reclassification had no effect on the net assets or the distributable earnings of the Fund.
| 22 | Invesco Low Volatility Equity Yield Fund |
NOTE 11—Share Information
| | Summary of Share Activity |
| | Years ended August 31, |
| | 2019(a) | | 2018 |
| | Shares | Amount | | Shares | Amount |
| Sold: | | | | | |
| Class A | 574,800 | $6,186,605 | | 477,803 | $5,459,288 |
| Class B(b) | - | - | | 766 | 8,651 |
| Class C | 118,065 | 1,282,029 | | 122,796 | 1,385,278 |
| Class R | 30,693 | 324,314 | | 2,142 | 23,643 |
| Class Y | 182,341 | 1,969,735 | | 318,282 | 3,643,035 |
| Investor Class | 71,965 | 778,650 | | 151,983 | 1,736,071 |
| Class R5 | 9,254 | 99,950 | | 35,765 | 403,115 |
| Class R6 | 54,339 | 573,214 | | 124,329 | 1,474,240 |
| Issued as reinvestment of dividends: | | | | | |
| Class A | 405,511 | 4,271,835 | | 236,073 | 2,636,182 |
| Class B(b) | - | - | | 819 | 8,970 |
| Class C | 37,796 | 385,119 | | 18,887 | 206,361 |
| Class R | 840 | 8,785 | | 397 | 4,402 |
| Class Y | 23,236 | 246,233 | | 15,976 | 178,996 |
| Investor Class | 112,877 | 1,193,019 | | 67,157 | 752,458 |
| Class R5 | 35,864 | 381,753 | | 24,740 | 278,677 |
| Class R6 | 3,824 | 40,690 | | 713 | 8,121 |
| Conversion of Class B shares to Class A shares:(c) | | | | | |
| Class A | - | - | | 105,439 | 1,259,997 |
| Class B | - | - | | (108,653) | (1,259,997) |
| Automatic conversion of Class C shares to Class A shares: | | | | | |
| Class A | 1,430,483 | 15,153,429 | | - | - |
| Class C | (1,453,924) | (15,153,429) | | - | - |
| Reacquired: | | | | | |
| Class A | (2,113,351) | (22,794,269) | | (2,098,931) | (23,805,737) |
| Class B(b) | - | - | | (13,971) | (153,089) |
| Class C | (289,626) | (3,082,187) | | (446,150) | (4,987,172) |
| Class R | (3,261) | (35,314) | | (14,904) | (164,118) |
| Class Y | (269,046) | (2,893,883) | | (638,088) | (7,281,165) |
| Investor Class | (582,294) | (6,206,501) | | (565,725) | (6,458,000) |
| Class R5 | (4,107) | (43,924) | | (314,914) | (3,749,445) |
| Class R6 | (39,232) | (422,077) | | (19,402) | (224,329) |
| Net increase (decrease) in share activity | (1,662,953) | $(17,736,224) | | (2,516,671) | $(28,615,567) |
| (a) | There are entities that are record owners of more than 5% of the outstanding shares of the Fund and in the aggregate own 5% of the outstanding shares of the Fund. IDI has an agreement with these entities to sell Fund shares. The Fund, Invesco and/or Invesco affiliates may make payments to these entities, which are considered to be related to the Fund, for providing services to the Fund, Invesco and/or Invesco affiliates including but not limited to services such as securities brokerage, distribution, third party record keeping and account servicing. The Fund has no knowledge as to whether all or any portion of the shares owned of record by these entities are also owned beneficially. |
| (b) | Class B shares activity for the period September 1, 2017 through January 26, 2018 (date of conversion). |
| (c) | Effective as of the close of business January 26, 2018, all outstanding Class B shares were converted to Class A shares. |
| 23 | Invesco Low Volatility Equity Yield Fund |
Report of Independent Registered Public Accounting Firm
To the Board of Trustees of AIM Counselor Series Trust (Invesco Counselor Series Trust) and Shareholders of Invesco Low Volatility Equity Yield Fund
Opinion on the Financial Statements
We have audited the accompanying statement of assets and liabilities, including the schedule of investments, of Invesco Low Volatility Equity Yield Fund (one of the funds constituting AIM Counselor Series Trust (Invesco Counselor Series Trust), hereafter referred to as the "Fund") as of August 31, 2019, the related statement of operations for the year ended August 31, 2019, the statement of changes in net assets for each of the two years in the period ended August 31, 2019, including the related notes, and the financial highlights for each of the five years in the period ended August 31, 2019 (collectively referred to as the "financial statements"). In our opinion, the financial statements present fairly, in all material respects, the financial position of the Fund as of August 31, 2019, the results of its operations for the year then ended, the changes in its net assets for each of the two years in the period ended August 31, 2019 and the financial highlights for each of the five years in the period ended August 31, 2019 in conformity with accounting principles generally accepted in the United States of America.
Basis for Opinion
These financial statements are the responsibility of the Fund’s management. Our responsibility is to express an opinion on the Fund’s financial statements based on our audits. We are a public accounting firm registered with the Public Company Accounting Oversight Board (United States) (PCAOB) and are required to be independent with respect to the Fund in accordance with the U.S. federal securities laws and the applicable rules and regulations of the Securities and Exchange Commission and the PCAOB.
We conducted our audits of these financial statements in accordance with the standards of the PCAOB. Those standards require that we plan and perform the audit to obtain reasonable assurance about whether the financial statements are free of material misstatement, whether due to error or fraud.
Our audits included performing procedures to assess the risks of material misstatement of the financial statements, whether due to error or fraud, and performing procedures that respond to those risks. Such procedures included examining, on a test basis, evidence regarding the amounts and disclosures in the financial statements. Our audits also included evaluating the accounting principles used and significant estimates made by management, as well as evaluating the overall presentation of the financial statements. Our procedures included confirmation of securities owned as of August 31, 2019 by correspondence with the custodian, transfer agent and brokers; when replies were not received from brokers, we performed other auditing procedures. We believe that our audits provide a reasonable basis for our opinion.
/s/ PricewaterhouseCoopers LLP
Houston, Texas
October 29, 2019
We have served as the auditor of one or more of the investment companies in the Invesco group of investment companies since at least 1995. We have not been able to determine the specific year we began serving as auditor.
| 24 | Invesco Low Volatility Equity Yield Fund |
Calculating your ongoing Fund expenses
Example
As a shareholder of the Fund, you incur two types of costs: (1) transaction costs, which may include sales charges (loads) on purchase payments or contingent deferred sales charges on redemptions, if any; and (2) ongoing costs, including management fees, distribution and/or service (12b-1) fees, and other Fund expenses. This example is intended to help you understand your ongoing costs (in dollars) of investing in the Fund and to compare these costs with ongoing costs of investing in other mutual funds. The example is based on an investment of $1,000 invested at the beginning of the period and held for the entire period March 1, 2019 through August 31, 2019.
Actual expenses
The table below provides information about actual account values and actual expenses. You may use the information in this table, together with the amount you invested, to estimate the expenses that you paid over the period. Simply divide your account value by $1,000 (for example, an $8,600 account value divided by $1,000 = 8.6), then multiply the result by the number in the table under the heading entitled “Actual Expenses Paid During Period” to estimate the expenses you paid on your account during this period.
Hypothetical example for comparison purposes
The table below also provides information about hypothetical account values and hypothetical expenses based on the Fund’s actual expense ratio and an assumed rate of return of 5% per year before expenses, which is not the Fund’s actual return.
The hypothetical account values and expenses may not be used to estimate the actual ending account balance or expenses you paid for the period. You may use this information to compare the ongoing costs of investing in the Fund and other funds. To do so, compare this 5% hypothetical example with the 5% hypothetical examples that appear in the shareholder reports of the other funds.
Please note that the expenses shown in the table are meant to highlight your ongoing costs only and do not reflect any transaction costs, such as sales charges (loads) on purchase payments or contingent deferred sales charges on redemptions, if any. Therefore, the hypothetical information is useful in comparing ongoing costs only, and will not help you determine the relative total costs of owning different funds. In addition, if these transaction costs were included, your costs would have been higher.
| | Beginning
Account Value (03/01/19) | ACTUAL | HYPOTHETICAL
(5% annual return before
expenses) | Annualized
Expense
Ratio |
Ending
Account Value
(08/31/19)1 | Expenses
Paid During
Period2 | Ending
Account Value
(08/31/19) | Expenses
Paid During
Period2 |
| Class A | $1,000.00 | $961.50 | $5.93 | $1,019.16 | $6.11 | 1.20% |
| Class C | 1,000.00 | 958.00 | 9.62 | 1,015.38 | 9.91 | 1.95 |
| Class R | 1,000.00 | 961.00 | 7.17 | 1,017.90 | 7.38 | 1.45 |
| Class Y | 1,000.00 | 962.80 | 4.70 | 1,020.42 | 4.84 | 0.95 |
| Investor Class | 1,000.00 | 962.50 | 5.94 | 1,019.16 | 6.11 | 1.20 |
| Class R5 | 1,000.00 | 964.70 | 3.66 | 1,021.48 | 3.77 | 0.74 |
| Class R6 | 1,000.00 | 963.80 | 3.61 | 1,021.53 | 3.72 | 0.73 |
| 1 | The actual ending account value is based on the actual total return of the Fund for the period March 1, 2019 through August 31, 2019, after actual expenses and will differ from the hypothetical ending account value which is based on the Fund’s expense ratio and a hypothetical annual return of 5% before expenses. |
| 2 | Expenses are equal to the Fund’s annualized expense ratio as indicated above multiplied by the average account value over the period, multiplied by 184/365 to reflect the most recent fiscal half year. |
| 25 | Invesco Low Volatility Equity Yield Fund |
Approval of Investment Advisory and Sub-Advisory Contracts
At meetings held on June 10, 2019, the Board of Trustees (the Board or the Trustees) of AIM Counselor Series Trust (Invesco Counselor Series Trust) as a whole, and the independent Trustees, who comprise over 75% of the Board, voting separately, approved the continuance of the Invesco Low Volatility Equity Yield Fund’s (the Fund) Master Investment Advisory Agreement with Invesco Advisers, Inc. (Invesco Advisers and the investment advisory agreement) and the Master IntergroupSub-Advisory Contract for Mutual Funds with Invesco Asset Management Deutschland GmbH, Invesco Asset Management Limited, Invesco Asset Management (Japan) Limited, Invesco Hong Kong Limited, Invesco Senior Secured Management, Inc. and Invesco Canada Ltd. (collectively, the AffiliatedSub-Advisers and thesub-advisory contracts) for another year, effective July 1, 2019. After evaluating the factors discussed below, among others, the Board approved the renewal of the Fund’s investment advisory agreement and thesub-advisory contracts and determined that the compensation payable by the Fund to Invesco Advisers and by Invesco Advisers to the AffiliatedSub-Advisers is fair and reasonable.
The Board’s Evaluation Process
The Board’s Investments Committee has established threeSub-Committees, which meet throughout the year to review the performance of funds advised by Invesco Advisers (the Invesco Funds). As part of a regularly scheduled basis ofin-person Board meetings, theSub-Committees meet with portfolio managers for their assigned Invesco Funds and other members of management to review detailed information about investment performance and portfolio attributes of these funds. The Board took into account evaluations and reports that it received from the Investments Committee andSub-Committees, as well as the information provided to such committees and the Board throughout the year, in considering whether to approve each Invesco Fund’s investment advisory agreement andsub-advisory contracts.
As part of the contract renewal process, the Board reviews and considers information provided in response to detailed requests for information submitted to management by the independent Trustees with assistance from legal counsel to the independent Trustees. The Board receives comparative investment performance and fee data regarding the Invesco Funds prepared by Invesco Advisers and Broadridge Financial Solutions, Inc. (Broadridge), an independent mutual fund data provider. The Board also receives an independent written evaluation from the Senior Officer, an officer of the Invesco Funds who reports directly to the independent Trustees. The Senior Officer’s evaluation is prepared as part of his responsibility to manage the process by which
the Invesco Funds’ proposed management fees are negotiated during the annual contract renewal process to ensure they are negotiated in a manner that is at arms’ length and reasonable. In addition to meetings with Invesco Advisers and fund counsel throughout the year, the independent Trustees also discuss the continuance of the investment advisory agreement andsub-advisory contracts in separate sessions with the Senior Officer and with independent legal counsel.
The discussion below is a summary of the Senior Officer’s independent written evaluation with respect to the Fund’s investment advisory agreement, as well as a discussion of the material factors and related conclusions that formed the basis for the Board’s approval of the Fund’s investment advisory agreement andsub-advisory contracts. The Trustees’ review and conclusions are based on the comprehensive consideration of all information presented to them during the course of the year and in prior years and are not the result of any single determinative factor. Moreover, one Trustee may have weighed a particular piece of information or factor differently than another Trustee. This information is current as of June 10, 2019.
Factors and Conclusions and Summary of Independent Written Fee Evaluation
| A. | Nature, Extent and Quality of Services Provided by Invesco Advisers and the AffiliatedSub-Advisers |
The Board reviewed the nature, extent and quality of the advisory services provided to the Fund by Invesco Advisers under the Fund’s investment advisory agreement, and the credentials and experience of the officers and employees of Invesco Advisers who provide these services, including the Fund’s portfolio manager(s). The Board’s review included consideration of Invesco Advisers’ investment process oversight and structure, credit analysis and investment risk management. The Board also considerednon-advisory services that Invesco Advisers and its affiliates provide to the Invesco Funds such as various back office support functions, third party oversight, internal audit, valuation, portfolio trading and legal and compliance. The Board also received and reviewed information about Invesco Advisers’ role as administrator of the Invesco Funds’ liquidity risk management program. The Board also reviewed and considered the benefits to shareholders of investing in a fund that is part of the Invesco family of funds under the umbrella of Invesco Ltd., Invesco Advisers’ parent company, and noted Invesco Ltd.’s depth and experience in conducting an investment management business, as well as its commitment of financial and other resources to such business. The Board reviewed and considered information about the resources
that Invesco Advisers intends to continue to commit to managing the Invesco family of funds following Invesco Ltd.’s acquisition of OppenheimerFunds, Inc. and its subsidiaries. The Board concluded that the nature, extent and quality of the services provided to the Fund by Invesco Advisers are appropriate and satisfactory.
The Board reviewed the services that may be provided by the AffiliatedSub-Advisers under thesub-advisory contracts and the credentials and experience of the officers and employees of the AffiliatedSub-Advisers who provide these services. The Board noted the AffiliatedSub-Advisers’ expertise with respect to certain asset classes and that the AffiliatedSub-Advisers have offices and personnel that are located in financial centers around the world. As a result, the Board noted that the AffiliatedSub-Advisers can provide research and investment analysis on the markets and economies of various countries in which the Fund may invest, make recommendations regarding securities and assist with security trades. The Board concluded that thesub-advisory contracts may benefit the Fund and its shareholders by permitting Invesco Advisers to use the resources and talents of the AffiliatedSub-Advisers in managing the Fund. The Board concluded that the nature, extent and quality of the services that may be provided by the AffiliatedSub-Advisers are appropriate and satisfactory.
| B. | Fund Investment Performance |
The Board considered Fund investment performance as a relevant factor in considering whether to approve the investment advisory agreement. The Board did not view Fund investment performance as a relevant factor in considering whether to approve thesub-advisory contracts for the Fund, as no AffiliatedSub-Adviser currently manages assets of the Fund.
The Board compared the Fund’s investment performance over multiple time periods ending December 31, 2018 to the performance of funds in the Broadridge performance universe and against the Lipper Equity Income Funds Index. The Board noted that performance of Class A shares of the Fund was in the fourth quintile of its performance universe for the one year period and the fifth quintile for the three and five year periods (the first quintile being the best performing funds and the fifth quintile being the worst performing funds). The Board noted that performance of Class A shares of the Fund was below the performance of the Index for the one, three and five year periods. The Board noted that the valuation component of the Fund’s multi-factor model investment process and its underweight exposure to and stock selection in certain sectors and capitalization sizes detracted from the Fund’s performance. The Trustees also reviewed more
26 Invesco Low Volatility Equity Yield Fund
recent Fund performance and this review did not change their conclusions.
| C. | Advisory andSub-Advisory Fees and Fund Expenses |
The Board compared the Fund’s contractual management fee rate to the contractual management fee rates of funds in the Fund’s Broadridge expense group. The Board noted that the contractual management fee rate for Class A shares of the Fund was below the median contractual management fee rate of funds in its expense group. The Board noted that the term “contractual management fee” for funds in the expense group may include both advisory and certainnon-portfolio management administrative services fees, but that Broadridge does not provide information on a fund by fund basis as to what is included. The Board also reviewed the methodology used by Broadridge in providing expense group information, which includes using each fund’s contractual management fee schedule (including any applicable breakpoints) as reported in the most recent prospectus or statement of additional information for each fund in the expense group. The Board also considered comparative information regarding the Fund’s total expense ratio and its various components.
The Board noted that Invesco Advisers has contractually agreed to waive fees and/or limit expenses of the Fund for the term disclosed in the Fund’s registration statement in an amount necessary to limit total annual operating expenses to a specified percentage of average daily net assets for each class of the Fund.
The Board noted that Invesco Advisers and the AffiliatedSub-Advisers do not manage other similarly managed mutual funds or client accounts.
The Board also considered the services that may be provided by the AffiliatedSub-Advisers pursuant to thesub-advisory contracts, as well as the fees payable by Invesco Advisers to the AffiliatedSub-Advisers pursuant to thesub-advisory contracts.
| D. | Economies of Scale and Breakpoints |
The Board considered the extent to which there may be economies of scale in the provision of advisory services to the Fund. The Board considered Invesco’s reinvestment in its business, including investments in business infrastructure and cybersecurity. The Board also considered that the Fund may benefit from economies of scale through contractual breakpoints in the Fund’s advisory fee schedule, which generally operate to reduce the Fund’s expense ratio as it grows in size. The Board noted that the Fund shares directly in economies of scale through lower fees charged by third party service providers based on the combined size of the Invesco Funds. The Board noted that the Fund may also benefit from economies of scale through initial fee setting, fee waivers and expense reimbursements.
| E. | Profitability and Financial Resources |
The Board reviewed information from Invesco Advisers concerning the costs of the advisory
and other services that Invesco Advisers and its affiliates provide to the Fund and the Invesco Funds and the profitability of Invesco Advisers and its affiliates in providing these services. The Board considered the methodology used for calculating profitability and noted the periodic review of such methodology by an independent consultant. The Board noted that Invesco Advisers continues to operate at a net profit from services Invesco Advisers and its affiliates provide to the Invesco Funds and the Fund. The Board did not deem the level of profits realized by Invesco Advisers and its affiliates from providing services to the Fund to be excessive given the nature, extent and quality of the services provided. The Board received information from Invesco Advisers demonstrating that Invesco Advisers and the AffiliatedSub-Advisers are financially sound and have the resources necessary to perform their obligations under the investment advisory agreement andsub-advisory contracts.
| F. | Collateral Benefits to Invesco Advisers and its Affiliates |
The Board considered various other benefits received by Invesco Advisers and its affiliates from the relationship with the Fund, including the fees received for providing administrative, transfer agency and distribution services to the Fund. The Board considered comparative information regarding fees charged for these services, including information provided by Broadridge and other independent sources. The Board considered the performance of Invesco Advisers and its affiliates in providing these services and the organizational structure employed to provide these services. The Board also considered that these services are provided to the Fund pursuant to written contracts that are reviewed and approved on an annual basis by the Board; and that the services are required for the operation of the Fund.
The Board considered the benefits realized by Invesco Advisers and the AffiliatedSub-Advisers as a result of portfolio brokerage transactions executed through “soft dollar” arrangements. The Board noted that soft dollar arrangements may result in the Fund bearing costs to purchase research that may be used by Invesco Advisers or the AffiliatedSub-Advisers with other clients and may reduce Invesco Advisers’ or the AffiliatedSub-Advisers’ expenses. The Board also considered that it receives periodic reports from Invesco representing that these arrangements are consistent with regulatory requirements. The Board did not deem the soft dollar arrangements to be inappropriate.
The Board considered that the Fund’s uninvested cash and cash collateral from any securities lending arrangements may be invested in money market funds advised by Invesco Advisers pursuant to procedures approved by the Board. The Board considered information regarding the returns of the affiliated money market funds relative to comparable overnight investments, as well as the costs to the Fund of such investments. The Board noted that Invesco Advisers receives
advisory fees from these affiliated money market funds attributable to such investments, although Invesco Advisers has contractually agreed to waive through varying periods the advisory fees payable by the Invesco Funds with respect to certain investments in the affiliated money market funds. The waiver is in an amount equal to 100% of the net advisory fee Invesco Advisers receives from the affiliated money market funds with respect to the Fund’s investment in the affiliated money market funds of uninvested cash, but not cash collateral. The Board concluded that the amount of advisory fees received by Invesco Advisers from the Fund’s investment of cash collateral from any securities lending arrangements in the affiliated money market funds is fair and reasonable.
The Board also considered that an affiliated broker may receive commissions for executing certain trades for the Fund. Invesco Advisers and the AffiliatedSub-Advisers may use the affiliated broker to, among other things, control order routing and minimize information leakage, and the Board was advised that such trades are executed in compliance with rules under the federal securities laws and consistent with best execution obligations.
27 Invesco Low Volatility Equity Yield Fund
Tax Information
Form 1099-DIV, Form 1042-S and other year–end tax information provide shareholders with actual calendar year amounts that should be included in their tax returns. Shareholders should consult their tax advisers.
The following distribution information is being provided as required by the Internal Revenue Code or to meet a specific state’s requirement.
The Fund designates the following amounts or, if subsequently determined to be different, the maximum amount allowable for its fiscal year ended August 31, 2019:
| Federal and State Income Tax | |
| Long-Term Capital Gain Distributions | $4,335,178 |
| Qualified Dividend Income* | 100.00% |
| Corporate Dividends Received Deduction* | 100.00% |
| Qualified Business Income (199A)* | 0.00% |
| U.S. Treasury Obligations* | 0.00% |
| Tax-Exempt Interest Dividends* | 0.00% |
| * | The above percentages are based on ordinary income dividends paid to shareholders during the Fund’s fiscal year. |
| 28 | Invesco Low Volatility Equity Yield Fund |
Trustees and Officers
The address of each trustee and officer is AIM Counselor Series Trust (Invesco Counselor Series Trust) (the “Trust”), 11 Greenway Plaza, Suite 1000, Houston, Texas 77046-1173. The trustees serve for the life of the Trust, subject to their earlier death, incapacitation, resignation, retirement or removal as more specifically provided in the Trust’s organizational documents. Each officer serves for a one year term or until their successors are elected and qualified. Column two below includes length of time served with predecessor entities, if any.
| | | | | | | | |
Name, Year of Birth and Position(s) Held with the Trust | | Trustee and/ or Officer Since | | Principal Occupation(s) During Past 5 Years | | Number of Funds in Fund
Complex
Overseen by
Trustee | | Other Directorship(s) Held by Trustee During Past 5 Years |
| Interested Persons | | | | | | | | |
Martin L. Flanagan1 — 1960 Trustee and Vice Chair | | 2007 | | Executive Director, Chief Executive Officer and President, Invesco Ltd. (ultimate parent of Invesco and a global investment management firm); Trustee and Vice Chair, The Invesco Funds; Vice Chair, Investment Company Institute; and Member of Executive Board, SMU Cox School of Business Formerly: Advisor to the Board, Invesco Advisers, Inc. (formerly known as Invesco Institutional (N.A.), Inc.); Chairman and Chief Executive Officer, Invesco Advisers, Inc. (registered investment adviser); Director, Chairman, Chief Executive Officer and President, Invesco Holding Company (US), Inc. (formerly IVZ Inc.) (holding company), Invesco Group Services, Inc. (service provider) and Invesco North American Holdings, Inc. (holding company); Director, Chief Executive Officer and President, Invesco Holding Company Limited (parent of Invesco and a global investment management firm); Director, Invesco Ltd.; Chairman, Investment Company Institute and President,Co-Chief Executive Officer,Co-President, Chief Operating Officer and Chief Financial Officer, Franklin Resources, Inc. (global investment management organization) | | 229 | | None |
Philip A. Taylor2 — 1954 Trustee | | 2006 | | Vice Chair, Invesco Ltd.; Trustee, The Invesco Funds Formerly: Director, Invesco Canada Ltd. (formerly known as Invesco Trimark Ltd./Invesco Trimark Ltèe) (registered investment adviser and registered transfer agent); Head of the Americas and Senior Managing Director, Invesco Ltd.; Director, Invesco Advisers, Inc. (formerly known as Invesco Institutional (N.A.), Inc.) (registered investment adviser); Director and Chairman, Invesco Investment Services, Inc. (formerly known as Invesco AIM Investment Services, Inc.) (registered transfer agent); Chief Executive Officer, Invesco Corporate Class Inc. (corporate mutual fund company); Chairman and Chief Executive Officer, Invesco Canada Ltd. (formerly known as Invesco Trimark Ltd./Invesco Trimark Ltèe) (registered investment adviser and registered transfer agent); Senior Vice President, The Invesco Funds; Director, Invesco Investment Advisers LLC (formerly known as Van Kampen Asset Management); Director, Chairman, Chief Executive Officer and President, Invesco Management Group, Inc. (formerly known as Invesco AIM Management Group, Inc.) (financial services holding company);Co-Chairman,Co-President andCo-Chief Executive Officer, Invesco Advisers, Inc. (formerly known as Invesco Institutional (N.A.), Inc.) (registered investment adviser); Director, Chief Executive Officer and President, Van Kampen Exchange Corp; President and Principal Executive Officer, The Invesco Funds (other than AIM Treasurer’s Series Trust (Invesco Treasurer’s Series Trust), Short-Term Investments Trust and Invesco Management Trust); Executive Vice President, The Invesco Funds (AIM Treasurer’s Series Trust (Invesco Treasurer’s Series Trust), Short-Term Investments Trust and Invesco Management Trust only); Director and President, INVESCO Funds Group, Inc. (registered investment adviser and registered transfer agent); Director and Chairman, IVZ Distributors, Inc. (formerly known as INVESCO Distributors, Inc.) (registered broker dealer); Director, President and Chairman, Invesco Inc. (holding company), Invesco Canada Holdings Inc. (holding company), Trimark Investments Ltd./Placements Trimark Ltèe and Invesco Financial Services Ltd/Services Financiers Invesco Ltèe; Chief Executive Officer, Invesco Canada Fund Inc. (corporate mutual fund company); Director and Chairman, Van Kampen Investor Services Inc.; Director, Chief Executive Officer and President, 1371 Preferred Inc. (holding company) and Van Kampen Investments Inc.; Director and President, AIM GP Canada Inc. (general partner for limited partnerships) and Van Kampen Advisors, Inc.; Director and Chief Executive Officer, Invesco Trimark Dealer Inc. (registered broker dealer); Director, Invesco Distributors, Inc. (formerly known as Invesco AIM Distributors, Inc.) (registered broker dealer); Manager, Invesco Capital Management LLC; Director, Chief Executive Officer and President, Invesco Advisers, Inc.; Director, Chairman, Chief Executive Officer and President, Invesco AIM Capital Management, Inc.; President, Invesco Trimark Dealer Inc. and Invesco Trimark Ltd./Invesco Trimark Ltèe; Director and President, AIM Trimark Corporate Class Inc. and AIM Trimark Canada Fund Inc.; Senior Managing Director, Invesco Holding Company Limited; Director and Chairman, Fund Management Company (former registered broker dealer); President and Principal Executive Officer, The Invesco Funds (AIM Treasurer’s Series Trust (Invesco Treasurer’s Series Trust), and Short-Term Investments Trust only); President, AIM Trimark Global Fund Inc. and AIM Trimark Canada Fund Inc. | | 229 | | None |
| 1 | Mr. Flanagan is considered an interested person (within the meaning of Section 2(a)(19) of the 1940 Act) of the Trust because he is an officer of the Adviser to the Trust, and an officer and a director of Invesco Ltd., ultimate parent of the Adviser. |
| 2 | Mr. Taylor is considered an interested person (within the meaning of Section 2(a)(19) of the 1940 Act) of the Trust because he is an officer of Invesco Ltd., ultimate parent of the Adviser. |
T-1 Invesco Low Volatility Equity Yield Fund
Trustees and Officers—(continued)
| | | | | | | | |
Name, Year of Birth and Position(s) Held with the Trust | | Trustee and/ or Officer Since | | Principal Occupation(s)
During Past 5 Years | | Number of
Funds in Fund
Complex
Overseen by
Trustee | | Other Directorship(s) Held by Trustee During
Past 5 Years |
| Independent Trustees | | | | | | | | |
Bruce L. Crockett — 1944 Trustee and Chair | | 2003 | | Chairman, Crockett Technologies Associates (technology consulting company) Formerly: Director, Captaris (unified messaging provider); Director, President and Chief Executive Officer, COMSAT Corporation; Chairman, Board of Governors of INTELSAT (international communications company); ACE Limited (insurance company); Independent Directors Council and Investment Company Institute: Member of the Audit Committee, Investment Company Institute; Member of the Executive Committee and Chair of the Governance Committee, Independent Directors Council | | 229 | | Director and Chairman of the Audit Committee, ALPS (Attorneys Liability Protection Society) (insurance company); Director and Member of the Audit Committee and Compensation Committee, Ferroglobe PLC (metallurgical company) |
David C. Arch — 1945 Trustee | | 2010 | | Chairman of Blistex Inc. (consumer health care products manufacturer); Member, World Presidents’ Organization | | 229 | | Board member of the Illinois Manufacturers’ Association |
Beth Ann Brown — 1968 Trustee | | 2019 | | Independent Consultant Formerly: Head of Intermediary Distribution, Managing Director, Strategic Relations, Managing Director, Head of National Accounts, Senior Vice President, National Account Manager and Senior Vice President, Key Account Manager, Columbia Management Investment Advisers LLC; Vice President, Key Account Manager, Liberty Funds Distributor, Inc.; and Trustee of certain Oppenheimer Funds | | 229 | | Director, Board of Directors of Caron Engineering Inc.; Advisor, Board of Advisors of Caron Engineering Inc.; President and Director, Acton Shapleigh Youth Conservation Corps (non -profit); and Vice President and Director of Grahamtastic Connection(non-profit) |
Jack M. Fields — 1952 Trustee | | 2003 | | Chief Executive Officer, Twenty First Century Group, Inc. (government affairs company); and Chairman, Discovery Learning Alliance(non-profit) Formerly: Owner and Chief Executive Officer, Dos Angeles Ranch L.P. (cattle, hunting, corporate entertainment); Director, Insperity, Inc. (formerly known as Administaff) (human resources provider); Chief Executive Officer, Texana Timber LP (sustainable forestry company); Director of Cross Timbers Quail Research Ranch(non-profit); and member of the U.S. House of Representatives | | 229 | | None |
Cynthia Hostetler — 1962 Trustee | | 2017 | | Non-Executive Director and Trustee of a number of public and private business corporations Formerly: Director, Aberdeen Investment Funds (4 portfolios); Head of Investment Funds and Private Equity, Overseas Private Investment Corporation; President, First Manhattan Bancorporation, Inc.; Attorney, Simpson Thacher & Bartlett LLP | | 229 | | Vulcan Materials Company (construction materials company); Trilinc Global Impact Fund; Genesee & Wyoming, Inc. (railroads); Artio Global Investment LLC (mutual fund complex); Edgen Group, Inc. (specialized energy and infrastructure products distributor); Investment Company Institute (professional organization); Independent Directors Council (professional organization) |
Eli Jones — 1961 Trustee | | 2016 | | Professor and Dean, Mays Business School — Texas A&M University Formerly: Professor and Dean, Walton College of Business, University of Arkansas and E.J. Ourso College of Business, Louisiana State University; Director, Arvest Bank | | 229 | | Insperity, Inc. (formerly known as Administaff) (human resources provider) |
Elizabeth Krentzman — 1959 Trustee | | 2019 | | Formerly: Principal and Chief Regulatory Advisor for Asset Management Services and U.S. Mutual Fund Leader of Deloitte & Touche LLP; General Counsel of the Investment Company Institute (trade association); National Director of the Investment Management Regulatory Consulting Practice, Principal, Director and Senior Manager of Deloitte & Touche LLP; Assistant Director of the Division of Investment Management — Office of Disclosure and Investment Adviser Regulation of the U.S. Securities and Exchange Commission and various positions with the Division of Investment Management — Office of Regulatory Policy of the U.S. Securities and Exchange Commission; Associate at Ropes & Gray LLP; Advisory Board Member of the Securities and Exchange Commission Historical Society; and Trustee of certain Oppenheimer Funds | | 229 | | Trustee of the University of Florida National Board Foundation and Audit Committee Member; Member of the Cartica Funds Board of Directors (private investment funds); Member of the University of Florida Law Center Association, Inc. Board of Trustees and Audit Committee Member |
Anthony J. LaCava, Jr. — 1956 Trustee | | 2019 | | Formerly: Director and Member of the Audit Committee, Blue Hills Bank (publicly traded financial institution) and Managing Partner, KPMG LLP | | 229 | | Blue Hills Bank; Chairman, Bentley University; Member, Business School Advisory Council; and Nominating Committee, KPMG LLP |
T-2 Invesco Low Volatility Equity Yield Fund
Trustees and Officers—(continued)
| | | | | | | | |
Name, Year of Birth and Position(s) Held with the Trust | | Trustee and/ or Officer Since | | Principal Occupation(s)
During Past 5 Years | | Number of
Funds in Fund
Complex
Overseen by
Trustee | | Other Directorship(s) Held by Trustee During
Past 5 Years |
| Independent Trustees—(continued) |
Prema Mathai-Davis — 1950 Trustee | | 2003 | | Retired Co-Owner & Partner of Quantalytics Research, LLC, (a FinTech Investment Research Platform for the Self-Directed Investor) | | 229 | | None |
Joel W. Motley — 1952 Trustee | | 2019 | | Director of Office of Finance, Federal Home Loan Bank; Member of the Vestry of Trinity Wall Street; Managing Director of Carmona Motley Inc. (privately held financial advisor); Member of the Finance and Budget Committee of the Council on Foreign Relations, Member of the Investment Committee and Board of Human Rights Watch and Member of the Investment Committee and Board of Historic Hudson Valley(non-profit cultural organization) Formerly: Managing Director of Public Capital Advisors, LLC (privately held financial advisor); Managing Director of Carmona Motley Hoffman, Inc. (privately held financial advisor); Trustee of certain Oppenheimer Funds; and Director of Columbia Equity Financial Corp. (privately held financial advisor) | | 229 | | Director of Greenwall Foundation (bioethics research foundation); Member of Board and Investment Committee of The Greenwall Foundation; Director of Southern Africa Legal Services Foundation; Board Member and Investment Committee Member of Pulitzer Center for Crisis Reporting(non-profit journalism) |
Teresa M. Ressel — 1962 Trustee | | 2017 | | Non-executive director and trustee of a number of public and private business corporations Formerly: Chief Financial Officer, Olayan America, The Olayan Group (international investor/commercial/industrial); Chief Executive Officer, UBS Securities LLC; Group Chief Operating Officer, Americas, UBS AG; Assistant Secretary for Management & Budget and CFO, US Department of the Treasury | | 229 | | Atlantic Power Corporation (power generation company); ON Semiconductor Corp. (semiconductor supplier) |
Ann Barnett Stern — 1957 Trustee | | 2017 | | President and Chief Executive Officer, Houston Endowment Inc. (private philanthropic institution) Formerly: Executive Vice President and General Counsel, Texas Children’s Hospital; Attorney, Beck, Redden and Secrest, LLP; Business Law Instructor, University of St. Thomas; Attorney, Andrews & Kurth LLP | | 229 | | Federal Reserve Bank of Dallas |
Raymond Stickel, Jr. — 1944 Trustee | | 2005 | | Retired Formerly: Director, Mainstay VP Series Funds, Inc. (25 portfolios); Partner, Deloitte & Touche | | 229 | | None |
Robert C. Troccoli — 1949 Trustee | | 2016 | | Retired Formerly: Adjunct Professor, University of Denver — Daniels College of Business; Senior Partner, KPMG LLP | | 229 | | None |
Daniel S. Vandivort — 1954 Trustee | | 2019 | | Treasurer, Chairman of the Audit and Finance Committee, and Trustee, Board of Trustees, Huntington Disease Foundation of America; and President, Flyway Advisory Services LLC (consulting and property management) Formerly: Trustee and Governance Chair, of certain Oppenheimer Funds | | 229 | | Chairman and Lead Independent Director, Chairman of the Audit Committee, and Director, Board of Directors, Value Line Funds |
James D. Vaughn — 1945 Trustee | | 2019 | | Retired Formerly: Managing Partner, Deloitte & Touche LLP; Trustee and Chairman of the Audit Committee, Schroder Funds; Board Member, Mile High United Way, Boys and Girls Clubs, Boy Scouts, Colorado Business Committee for the Arts, Economic Club of Colorado and Metro Denver Network (economic development corporation); and Trustee of certain Oppenheimer Funds | | 229 | | Board member and Chairman of Audit Committee of AMG National Trust Bank; Trustee and Investment Committee member, University of South Dakota Foundation; Board member, Audit Committee Member and past Board Chair, Junior Achievement(non-profit) |
Christopher L. Wilson — 1957 Trustee, Vice Chair and Chair Designate | | 2017 | | Retired Formerly: Director, TD Asset Management USA Inc. (mutual fund complex) (22 portfolios); Managing Partner, CT2, LLC (investing and consulting firm); President/Chief Executive Officer, Columbia Funds, Bank of America Corporation; President/Chief Executive Officer, CDC IXIS Asset Management Services, Inc.; Principal & Director of Operations, Scudder Funds, Scudder, Stevens & Clark, Inc.; Assistant Vice President, Fidelity Investments | | 229 | | ISO New England, Inc.(non-profit organization managing regional electricity market) |
T-3 Invesco Low Volatility Equity Yield Fund
Trustees and Officers—(continued)
| | | | | | | | |
Name, Year of Birth and Position(s) Held with the Trust | | Trustee and/ or Officer Since | | Principal Occupation(s)
During Past 5 Years | | Number of
Funds in Fund
Complex
Overseen by
Trustee | | Other Directorship(s) Held by Trustee During
Past 5 Years |
| Other Officers | | | | | | | | |
Sheri Morris — 1964 President, Principal Executive Officer and Treasurer | | 2003 | | President, Principal Executive Officer and Treasurer, The Invesco Funds; Vice President, Invesco Advisers, Inc. (formerly known as Invesco Institutional (N.A.), Inc.) (registered investment adviser); and Vice President, Invesco Exchange-Traded Fund Trust, Invesco Exchange-Traded Fund Trust II, Invesco India Exchange-Traded Fund Trust, Invesco Actively Managed Exchange-Traded Fund Trust, Invesco Actively Managed Exchange-Traded Commodity Fund Trust and Invesco Exchange-Traded Self-Indexed Fund Trust; and Vice President, OppenheimerFunds, Inc. Formerly: Vice President and Principal Financial Officer, The Invesco Funds; Vice President, Invesco AIM Advisers, Inc., Invesco AIM Capital Management, Inc. and Invesco AIM Private Asset Management, Inc.; Assistant Vice President and Assistant Treasurer, The Invesco Funds and Assistant Vice President, Invesco Advisers, Inc., Invesco AIM Capital Management, Inc. and Invesco AIM Private Asset Management, Inc.; and Treasurer, Invesco Exchange-Traded Fund Trust, Invesco Exchange-Traded Fund Trust II, Invesco India Exchange-Traded Fund Trust and Invesco Actively Managed Exchange-Traded Fund Trust | | N/A | | N/A |
Russell C. Burk — 1958 Senior Vice President and Senior Officer | | 2005 | | Senior Vice President and Senior Officer, The Invesco Funds | | N/A | | N/A |
Jeffrey H. Kupor — 1968 Senior Vice President, Chief Legal Officer and Secretary | | 2018 | | Head of Legal of the Americas, Invesco Ltd.; Senior Vice President and Secretary, Invesco Advisers, Inc. (formerly known as Invesco Institutional (N.A.), Inc.) (registered investment adviser); Senior Vice President and Secretary, Invesco Distributors, Inc. (formerly known as Invesco AIM Distributors, Inc.); Vice President and Secretary, Invesco Investment Services, Inc. (formerly known as Invesco AIM Investment Services, Inc.) Senior Vice President, Chief Legal Officer and Secretary, The Invesco Funds; Secretary and General Counsel, Invesco Investment Advisers LLC (formerly known as Van Kampen Asset Management); Secretary and General Counsel, Invesco Capital Markets, Inc. (formerly known as Van Kampen Funds Inc.) and Chief Legal Officer, Invesco Exchange-Traded Fund Trust, Invesco Exchange-Traded Fund Trust II, Invesco India Exchange-Traded Fund Trust, Invesco Actively Managed Exchange-Traded Fund Trust, Invesco Actively Managed Exchange-Traded Commodity Fund Trust and Invesco Exchange-Traded Self-Indexed Fund Trust; Secretary, Invesco Indexing LLC; Secretary, W.L. Ross & Co., LLC Formerly: Secretary and Vice President, Jemstep, Inc.; Head of Legal, Worldwide Institutional, Invesco Ltd.; Secretary and General Counsel, INVESCO Private Capital Investments, Inc.; Senior Vice President, Secretary and General Counsel, Invesco Management Group, Inc. (formerly known as Invesco AIM Management Group, Inc.); Assistant Secretary, INVESCO Asset Management (Bermuda) Ltd.; Secretary and General Counsel, Invesco Private Capital, Inc.; Assistant Secretary and General Counsel, INVESCO Realty, Inc.; Secretary and General Counsel, Invesco Senior Secured Management, Inc.; and Secretary, Sovereign G./P. Holdings Inc. | | N/A | | N/A |
Andrew R. Schlossberg — 1974 Senior Vice President | | 2019 | | Head of the Americas and Senior Managing Director, Invesco Ltd.; Director and Senior Vice President, Invesco Advisers, Inc. (formerly known as Invesco Institutional (N.A.), Inc.) (registered investment adviser); Director and Chairman, Invesco Investment Services, Inc. (formerly known as Invesco AIM Investment Services, Inc.) (registered transfer agent); Senior Vice President, The Invesco Funds; Director, Invesco Investment Advisers LLC (formerly known as Van Kampen Asset Management); Director, President and Chairman, Invesco Insurance Agency, Inc. Formerly: Director, Invesco UK Limited; Director and Chief Executive, Invesco Asset Management Limited and Invesco Fund Managers Limited; Assistant Vice President, The Invesco Funds; Senior Vice President, Invesco Advisers, Inc. (formerly known as Invesco Institutional (N.A.), Inc.) (registered investment adviser); Director and Chief Executive, Invesco Administration Services Limited and Invesco Global Investment Funds Limited; Director, Invesco Distributors, Inc.; Head of EMEA, Invesco Ltd.; President, Invesco Actively Managed Exchange-Traded Commodity Fund Trust, Invesco Actively Managed Exchange-Traded Fund Trust, Invesco Exchange-Traded Fund Trust, Invesco Exchange-Traded Fund Trust II and Invesco India Exchange-Traded Fund Trust; Managing Director and Principal Executive Officer, Invesco Capital Management LLC | | N/A | | N/A |
T-4 Invesco Low Volatility Equity Yield Fund
Trustees and Officers—(continued)
| | | | | | | | |
Name, Year of Birth and Position(s) Held with the Trust | | Trustee and/ or Officer Since | | Principal Occupation(s)
During Past 5 Years | | Number of
Funds in Fund
Complex
Overseen by
Trustee | | Other Directorship(s) Held by Trustee During
Past 5 Years |
| Other Officers—(continued) | | | | | | | | |
John M. Zerr — 1962
Senior Vice President | | 2006 | | Chief Operating Officer of the Americas; Senior Vice President, Invesco Advisers, Inc. (formerly known as Invesco Institutional (N.A.), Inc.) (registered investment adviser); Senior Vice President, Invesco Distributors, Inc. (formerly known as Invesco AIM Distributors, Inc.); Director and Vice President, Invesco Investment Services, Inc. (formerly known as Invesco AIM Investment Services, Inc.) Senior Vice President, The Invesco Funds; Managing Director, Invesco Capital Management LLC; Director, Invesco Investment Advisers LLC (formerly known as Van Kampen Asset Management); Senior Vice President, Invesco Capital Markets, Inc. (formerly known as Van Kampen Funds Inc.); Manager, Invesco Indexing LLC; Manager, Invesco Specialized Products, LLC; Director and Senior Vice President, Invesco Insurance Agency, Inc.; Member, Invesco Canada Funds Advisory Board; Director, President and Chief Executive Officer, Invesco Corporate Class Inc. (corporate mutual fund company); and Director, Chairman, President and Chief Executive Officer, Invesco Canada Ltd. (formerly known as Invesco Trimark Ltd./Invesco Trimark Ltèe) (registered investment adviser and registered transfer agent) Formerly: Director and Senior Vice President, Invesco Management Group, Inc. (formerly known as Invesco AIM Management Group, Inc.); Secretary and General Counsel, Invesco Management Group, Inc. (formerly known as Invesco AIM Management Group, Inc.); Secretary, Invesco Investment Services, Inc. (formerly known as Invesco AIM Investment Services, Inc.); Chief Legal Officer and Secretary, The Invesco Funds; Secretary and General Counsel, Invesco Investment Advisers LLC (formerly known as Van Kampen Asset Management); Secretary and General Counsel, Invesco Capital Markets, Inc. (formerly known as Van Kampen Funds Inc.); Chief Legal Officer, Invesco Exchange-Traded Fund Trust, Invesco Exchange-Traded Fund Trust II, Invesco India Exchange-Traded Fund Trust, Invesco Actively Managed Exchange-Traded Fund Trust, Invesco Actively Managed Exchange-Traded Commodity Fund Trust and Invesco Exchange-Traded Self-Indexed Fund Trust; Secretary, Invesco Indexing LLC; Director, Secretary, General Counsel and Senior Vice President, Van Kampen Exchange Corp.; Director, Vice President and Secretary, IVZ Distributors, Inc. (formerly known as INVESCO Distributors, Inc.); Director and Vice President, INVESCO Funds Group, Inc.; Director and Vice President, Van Kampen Advisors Inc.; Director, Vice President, Secretary and General Counsel, Van Kampen Investor Services Inc.; Director and Secretary, Invesco Distributors, Inc. (formerly known as Invesco AIM Distributors, Inc.); Director, Senior Vice President, General Counsel and Secretary, Invesco AIM Advisers, Inc. and Van Kampen Investments Inc.; Director, Vice President and Secretary, Fund Management Company; Director, Senior Vice President, Secretary, General Counsel and Vice President, Invesco AIM Capital Management, Inc.; Chief Operating Officer and General Counsel, Liberty Ridge Capital, Inc. (an investment adviser) | | N/A | | N/A |
Gregory G. McGreevey — 1962 Senior Vice President | | 2012 | | Senior Managing Director, Invesco Ltd.; Director, Chairman, President, and Chief Executive Officer, Invesco Advisers, Inc. (formerly known as Invesco Institutional (N.A.), Inc.) (registered investment adviser); Director, Invesco Mortgage Capital, Inc. and Invesco Senior Secured Management, Inc.; and Senior Vice President, The Invesco Funds; and President, SNW Asset Management Corporation Formerly: Senior Vice President, Invesco Management Group, Inc. and Invesco Advisers, Inc.; Assistant Vice President, The Invesco Funds | | N/A | | N/A |
Kelli Gallegos — 1970 Vice President, Principal Financial Officer and Assistant Treasurer | | 2008 | | Assistant Treasurer, Invesco Specialized Products, LLC; Vice President, Principal Financial Officer and Assistant Treasurer, The Invesco Funds; Principal Financial and Accounting Officer — Pooled Investments, Invesco Capital Management LLC; Vice President and Treasurer, Invesco Exchange-Traded Fund Trust, Invesco Exchange-Traded Fund Trust II, Invesco India Exchange-Traded Fund Trust, Invesco Actively Managed Exchange-Traded Fund Trust, Invesco Actively Managed Exchange-Traded Commodity Fund Trust and Invesco Exchange-Traded Self-Indexed Fund Trust Formerly: Assistant Treasurer, Invesco Exchange-Traded Fund Trust, Invesco Exchange-Traded Fund Trust II, Invesco India Exchange-Traded Fund Trust, Invesco Actively Managed Exchange-Traded Fund Trust, Invesco Actively Managed Exchange-Traded Commodity Fund Trust and Invesco Exchange-Traded Self-Indexed Fund Trust; Assistant Treasurer, Invesco Capital Management LLC; Assistant Vice President, The Invesco Funds | | N/A | | N/A |
T-5 Invesco Low Volatility Equity Yield Fund
Trustees and Officers—(continued)
| | | | | | | | |
Name, Year of Birth and Position(s) Held with the Trust | | Trustee and/ or Officer Since | | Principal Occupation(s)
During Past 5 Years | | Number of
Funds in Fund
Complex
Overseen by
Trustee | | Other Directorship(s) Held by Trustee During
Past 5 Years |
| Other Officers—(continued) | | | | | | | | |
Crissie M. Wisdom — 1969 Anti-Money Laundering Compliance Officer | | 2013 | | Anti-Money Laundering Compliance Officer, Invesco Advisers, Inc. (formerly known as Invesco Institutional (N.A.), Inc.) (registered investment adviser), Invesco Capital Markets, Inc. (formerly known as Van Kampen Funds Inc.), Invesco Distributors, Inc., Invesco Investment Services, Inc., The Invesco Funds, and Invesco Exchange-Traded Fund Trust, Invesco Exchange-Traded Fund Trust II, Invesco India Exchange-Traded Fund Trust, Invesco Actively Managed Exchange-Traded Fund Trust, Invesco Actively Managed Exchange-Traded Commodity Fund Trust and Invesco Exchange-Traded Self-Indexed Fund Trust; Anti-Money Laundering Compliance Officer and Bank Secrecy Act Officer, INVESCO National Trust Company and Invesco Trust Company; and Fraud Prevention Manager and Controls and Risk Analysis Manager for Invesco Investment Services, Inc. Formerly: Anti-Money Laundering Compliance Officer, Van Kampen Exchange Corp. and Invesco Management Group, Inc. | | N/A | | N/A |
Robert R. Leveille — 1969 Chief Compliance Officer | | 2016 | | Chief Compliance Officer, Invesco Advisers, Inc. (registered investment adviser); and Chief Compliance Officer, The Invesco Funds Formerly: Chief Compliance Officer, Putnam Investments and the Putnam Funds | | N/A | | N/A |
The Statement of Additional Information of the Trust includes additional information about the Fund’s Trustees and is available upon request, without charge, by calling 1.800.959.4246. Please refer to the Fund’s Statement of Additional Information for information on the Fund’ssub-advisers.
| | | | | | |
Office of the Fund 11 Greenway Plaza, Suite 1000
Houston, TX 77046-1173 | | Investment Adviser Invesco Advisers, Inc.
1555 Peachtree Street, N.E.
Atlanta, GA 30309 | | Distributor Invesco Distributors, Inc.
11 Greenway Plaza, Suite 1000
Houston, TX 77046-1173 | | Auditors PricewaterhouseCoopers LLP
1000 Louisiana Street, Suite 5800 Houston, TX 77002-5021 |
| | | |
| | | | | | |
Counsel to the Fund Stradley Ronon Stevens & Young, LLP
2005 Market Street, Suite 2600
Philadelphia, PA 19103-7018 | | Counsel to the Independent Trustees Goodwin Procter LLP
901 New York Avenue, N.W.
Washington, D.C. 20001 | | Transfer Agent Invesco Investment Services, Inc.
11 Greenway Plaza, Suite 1000
Houston, TX 77046-1173 | | Custodian State Street Bank and Trust Company
225 Franklin Street
Boston, MA 02110-2801 |
T-6 Invesco Low Volatility Equity Yield Fund
Go paperless with eDelivery
Visit invesco.com/edelivery to enjoy the convenience and security of anytime electronic access to your investment documents.
With eDelivery, you can elect to have any or all of the following materials delivered straight to your inbox to download, save and print from your own computer:
| • | Fund reports and prospectuses |
| • | Quarterly statements |
| • | Daily confirmations |
| • | Tax forms |
Invesco mailing information
Send general correspondence to Invesco Investment Services, Inc., P.O. Box 219078, Kansas City, MO 64121-9078.
Important notice regarding delivery of security holder documents
To reduce Fund expenses, only one copy of most shareholder documents may be mailed to shareholders with multiple accounts at the same address (Householding). Mailing of your shareholder documents may be householded indefinitely unless you instruct us otherwise. If you do not want the mailing of these documents to be combined with those for other members of your household, please contact Invesco Investment Services, Inc. at 800 959 4246 or contact your financial institution. We will begin sending you individual copies for each account within 30 days after receiving your request.
Fund holdings and proxy voting information
The Fund provides a complete list of its holdings four times in each fiscal year, at the quarter-ends. For the second and fourth quarters, the list appears in the Fund’s semiannual and annual reports to shareholders. For the first and third quarters, the Fund files the lists with the Securities and Exchange Commission (SEC) as an exhibit to its reports on Form N-PORT. The most recent list of portfolio holdings is available at invesco.com/completeqtrholdings. Shareholders can also look up the Fund’s Form N-PORT filings on the SEC website, sec.gov. The SEC file numbers for the Fund are shown below.
A description of the policies and procedures that the Fund uses to determine how to vote proxies relating to portfolio securities is available without charge, upon request, from our Client Services department at 800 959 4246, or at invesco.com/proxyguidelines. The information is also available on the SEC website, sec.gov.
Information regarding how the Fund voted proxies related to its portfolio securities during the most recent 12-month period ended June 30 is available at invesco.com/proxysearch. This information is also available on the SEC website, sec.gov.
Invesco Advisers, Inc. is an investment adviser; it provides investment advisory services to individual and institutional clients and does not sell securities. Invesco Distributors, Inc. is the US distributor for Invesco Ltd.’s retail mutual funds, exchange-traded funds and institutional money market funds. Both are wholly owned, indirect subsidiaries of Invesco Ltd.
| SEC file numbers: 811-09913 and 333-36074 | Invesco Distributors, Inc. | LVEY-AR-1 |
| Annual Report to Shareholders | August 31, 2019 |
Invesco Pennsylvania Tax Free Income Fund
Nasdaq:
A: VKMPX ■ C: VKPCX ■ Y: VKPYX ■ R6: VKPSX

Beginning on January 1, 2021, as permitted by regulations adopted by the Securities and Exchange Commission, paper copies of the Fund’s shareholder reports will no longer be sent by mail, unless you specifically request paper copies of the reports from the Fund or from your financial intermediary, such as a broker-dealer or bank. Instead, the reports will be made available on the Fund’s website, and you will be notified by mail each time a report is posted and provided with a website link to access the report.
If you already elected to receive shareholder reports electronically, you will not be affected by this change and you need not take any action. You may elect to receive shareholder reports and other communications from the Fund electronically by contacting your financial intermediary (such as a broker-dealer or bank) or, if you are a direct investor, by enrolling at invesco.com/edelivery.
You may elect to receive all future reports in paper free of charge. If you invest through a financial intermediary, you can contact your financial intermediary to request that you continue to receive paper copies of your shareholder reports. If you invest directly with the Fund, you can call (800) 959-4246 to let the Fund know you wish to continue receiving paper copies of your shareholder reports. Your election to receive reports in paper will apply to all funds held with your financial intermediary or all funds held with the fund complex if you invest directly with the Fund.
Dear Shareholders:
This annual report includes information about your Fund, including performance data and a complete list of its investments as of the close of the reporting period. Inside is a discussion of how your Fund was managed and the factors that affected its performance during the reporting period.
Throughout the reporting period, global equity markets remained volatile. Investor sentiment ranged from elation to fear. The reporting period began with several US equity indexes redefining new highs. The exuberance, however, ended in October 2018 as global equities, in particular US stocks, sold off, with the sharpest decline in December. The catalyst for the sell-off was a combination of ongoing trade concerns between the US and China, fears of a global economic slowdown and lower oil prices from a supply glut. Gains posted earlier in 2018 for global equities were erased, while US Treasury bonds, along with government and municipal bonds, rallied as investors fled to “safe haven” assets.
At the start of 2019, global equity markets rebounded strongly buoyed by more dovish central banks and optimism about a potential US-China trade deal. In May, US-China trade concerns and slowing global growth led to a global equity sell-off and rally in U.S. Treasuries. Despite the May sell-off, domestic equity markets rallied in June in anticipation of a U.S. Federal Reserve (the Fed) rate cut and closed the second quarter with modest gains. As the reporting period ended in August, market volatility once again increased as the US Treasury yield curve inverted several times magnifying concerns that the US economy could be headed into a recession.
During the reporting period, the Fed both raised and lowered the federal funds rate. Given signs of a strong economy, the Fed raised rates two times: in September and December 2018. In 2019, however, the Fed altered its outlook on further rate hikes leaving rates unchanged for the first half of the year. In July, the Fed lowered interest rates for the first time in 11 years. As 2019 unfolds, we’ll see how the interplay of interest rates, economic data, geopolitics and a host of other factors affect US and overseas equity and fixed income markets.
Investor uncertainty and market volatility, such as we witnessed during the reporting period, are unfortunate facts of life when it comes to investing. That’s why Invesco encourages investors to work with a professional financial adviser who can stress the importance of starting to save and invest early and the importance of adhering to a disciplined investment plan. A financial adviser who knows your unique financial situation, investment goals and risk tolerance can be an invaluable partner as you seek to achieve your financial goals. He or she can offer a long-term perspective when markets are volatile and time-tested advice and guidance when your financial situation or investment goals change.
Visit our website for more information on your investments
Our website, invesco.com/us, offers a wide range of market insights and investment perspectives. On the website, you’ll find detailed information about our funds, including performance, holdings and portfolio manager commentaries. You can access information about your account by completing a simple, secure online registration. To do so, select “Log In” on the right side of the homepage, and then select “Register for Individual Account Access.”
In addition to the resources accessible on our website and through our mobile app, you can obtain timely updates to help you stay informed about the markets and the economy by connecting with Invesco on Twitter, LinkedIn or Facebook. You can access our blog at blog.invesco.us.com. Our goal is to provide you the information you want, when and where you want it.
Finally, I’m pleased to share with you Invesco’s commitment to both the Principles for Responsible Investment and to considering environmental, social and governance issues in our robust investment process. I invite you to learn more at invesco.com/esg.
Have questions?
For questions about your account, contact an Invesco client services representative at 800 959 4246.
All of us at Invesco look forward to serving your investment management needs. Thank you for investing with us.
Sincerely,
Andrew Schlossberg
Head of the Americas,
Senior Managing Director, Invesco Ltd.
| 2 | Invesco Pennsylvania Tax Free Income Fund |
Dear Shareholders:
Among the many important lessons I’ve learned in more than 40 years in a variety of business endeavors is the value of a trusted advocate.
As independent chair of the Invesco Funds Board, I can assure you that the members of the Board are strong advocates for the interests of investors in Invesco’s mutual funds. We work hard to represent your interests through oversight of the quality of the investment management services your funds receive and other matters important to your investment, including but not limited to:
| ■ | Ensuring that Invesco offers a diverse lineup of mutual funds that your financial adviser can use to strive to meet your financial needs as your investment goals change over time. |
| ■ | Monitoring how the portfolio management teams of the Invesco funds are performing in light of changing economic and market conditions. |
| ■ | Assessing each portfolio management team’s investment performance within the context of the investment strategy described in the fund’s prospectus. |
| ■ | Monitoring for potential conflicts of interests that may impact the nature of the services that your funds receive. |
We believe one of the most important services we provide our fund shareholders is the annual review of the funds’ advisory and sub-advisory contracts with Invesco Advisers and its affiliates. This review is required by the Investment Company Act of 1940 and focuses on the nature and quality of the services Invesco provides as the adviser to the Invesco funds and the reasonableness of the fees that it charges for those services. Each year, we spend months carefully reviewing information received from Invesco and a variety of independent sources, such as performance and fee data prepared by Lipper, Inc. (a subsidiary of Broadridge Financial Solutions, Inc.), an independent, third-party firm widely recognized as a leader in its field. We also meet with our independent legal counsel and other independent advisers to review and help us assess the information that we have received. Our goal is to assure that you receive quality investment management services for a reasonable fee.
I trust the measures outlined above provide assurance that you have a worthy advocate when it comes to choosing the Invesco Funds.
As always, please contact me at bruce@brucecrockett.com with any questions or concerns you may have. On behalf of the Board, we look forward to continuing to represent your interests and serving your needs.
Sincerely,
Bruce L. Crockett
Independent Chair
Invesco Funds Board of Trustees
| 3 | Invesco Pennsylvania Tax Free Income Fund |
Management’s Discussion of Fund Performance
Performance summary
For the fiscal year ended August 31, 2019, Class A shares of Invesco Pennsylvania Tax Free Income Fund (the Fund), at net asset value (NAV), underperformed the S&P Municipal Bond Pennsylvania 5+ Year Investment Grade Index, the Fund’s style-specific benchmark.
Your Fund’s long-term performance appears later in this report.
Fund vs. Indexes
Total returns, August 31, 2018 to August 31, 2019, at net asset value (NAV). Performance shown does not include applicable contingent deferred sales charges (CDSC) or front-end sales charges, which would have reduced performance.
| Class A Shares | 7.53% |
| Class C Shares | 6.80 |
| Class Y Shares | 7.80 |
| Class R6 Shares | 7.88 |
| S&P Municipal Bond Index▼ (Broad Market Index) | 8.26 |
| S&P Municipal Bond Pennsylvania 5+ Year Investment Grade Index▼ (Style-Specific Index) | 10.65 |
Lipper Pennsylvania Municipal Debt Funds Index■
(Peer Group Index) | 8.83 |
| Source(s):▼RIMES Technologies Corp.;■ Lipper Inc. |
Market conditions and your Fund
Pennsylvania benefits from a highly diversified economy that tends to track the national economy but with less volatility. During periods of national economic contraction, Pennsylvania will often outperform the US in real gross state product, real personal income and employment. However, during periods of economic expansion, Pennsylvania will often lag the rate of growth in the national economy.1 Pennsylvania’s population grew an estimated 0.8% between 2010 and 2018, to 12.8 million, lagging the country as a whole, which grew by 6% during the same time period.2 Pennsylvania’s unemployment rate stood at 3.9% in July 2019 versus 3.7% for the US.3Pennsylvania is expected to add jobs at an average annual rate of 0.7% between 2018 and 2020.1
Pennsylvania has made efforts to improve its overall financial condition, including raising several taxes as part of its fiscal 2017-18 budget.1 In addition to the enactment of recurring revenue streams, the government is also working
to shrink its long-term cost drivers.1 At the end of the fiscal year, Pennsylvania’s general obligation bonds were rated A+ by Standard & Poor’s (S&P); AA- by Fitch Ratings; and Aa3 by Moody’s, all with stable outlooks.4
The broad municipal bond market experienced positive returns for the fifth consecutive year in 2018, and performance remained strong throughout the fiscal year. Investment grade municipal bonds returned 8.72% and high yield municipal bonds returned 9.81% during the fiscal year.5 Performance was particularly strong during the first eight months of 2019, with investment grade municipals returning 7.61% and high yield municipals returning 9.91%.5
The fiscal year was characterized by supportive technical conditions (supply and demand balances) as new issuance of municipal bonds totaled $351 billion — down nearly 15% from the previous fiscal year.6 Flows into the municipal bond asset class were positive for the last 34 weeks of the fiscal year.7 A consistently positive flow pattern, coupled with con-
tinued limited supply, resulted in strong performance across the municipal bond market. Fund flows totaled $52.1 billion from September 2018 through August 2019.7
For the fiscal year, the high yield municipal bond market outperformed the investment grade bond segment, led by improved price discovery on Puerto Rico bonds as a result of developments in the commonwealth’s debt restructuring, as well as strong performance of high yield general obligation securities.
Municipal bonds withstood considerable headwinds during the fiscal year, including interest rate movements that had the 10-year US Treasury yield breaching 2.00% in July 2019.8 Additionally, the US government shutdown, which occurred midway through the fiscal year and lasted 35 days, along with ongoing US-China trade negotiations and Brexit developments, created a challenging market environment. Both investment grade municipals and high yield municipals posted negative returns for the months of September and October 2018. Worsening market conditions exposed the municipal bond market to more sensitivity relating to a sell-off in US Treasuries in September 2018. Despite these challenges, the municipal bond market performed positively for the fiscal year as technical conditions continued to provide tailwinds.
Concerns about future interest rate hikes led to an increased demand for US Treasuries and investment grade municipal bonds alike, and yields continued to fall as high yield securities rallied. The yield curve for 30-year, AAA-rated municipal bonds continued to flatten as trade tensions between the US and China increased worries about inflationary pressures.
During the fiscal year, the US Federal Reserve (the Fed) raised the federal funds rate two times, in September and December 2018, before lowering it in
| Portfolio Composition |
| By credit sector, based on total investments |
| as of August 31, 2019 |
| Revenue Bonds | 77.5% |
| Pre-Refunded Bonds | 15.2 |
| General Obligation Bonds | 6.5 |
| Other | 0.8 |
| Top Five Debt Holdings |
| Based on total net assets |
| 1. | Lancaster (County of), PA Hospital Authority (Masonic Villages) | 2.5% |
| 2. | Pennsylvania (Commonwealth of) | 2.4% |
| 3. | Allegheny (County of), PA | 2.3% |
| 4. | Commonwealth Financing Authority | 2.2% |
| 5. | Allegheny (County of), PA Higher Education Building Authority (Carnegie Mellon University) | 2.0% |
| Total Net Assets | 144.3 million |
| Total Number of Holdings | 168 |
| The Fund’s holdings are subject to change, and there is no assurance that the Fund will continue to hold any particular security. |
| Data presented here are as of August 31, 2019. |
| 4 | Invesco Pennsylvania Tax Free Income Fund |
July 2019.9 The two rate hikes, the eighth and ninth since December 2008, were anticipated and reflected increased confidence in the US economy amid low unemployment, relatively stable inflation and overall robust economic growth. This expansionary monetary policy significantly flattened the US Treasury yield curve with a slight inversion on the short end occurring in December 2018.
However, the Fed’s dovish stance at the beginning of calendar year 2019 took the market by surprise, leading economists to change their predictions from two interest rate increases in 2019 to just one. Despite favorable growth and labor trends, the Fed ultimately reversed course and lowered the federal funds rate in July 2019, citing uncertainty about the global economic outlook. The US Treasury curve was inverted at fiscal year-end with the yield on the 2-year US Treasury note exceeding the 10-year note.8 Economist views were mixed as to whether this inversion, the first since December 2005, signaled a possible recession.
As anticipated, US midterm election results had a positive impact on municipal securities as perceived threats to municipal tax exemptions, further tax reform and changes to the Affordable Care Act were greatly reduced. News of a possible ban on flavored e-cigarettes and menthol cigarettes made headlines, which caused a short-lived decline in the valuations of below investment grade tobacco settlement bonds. Meanwhile, year-end demand for yield and coupon payments caused the asset class to end 2018 on a strong note. Investors affected by the Tax Cuts and Jobs Act of 2017, which instituted a $10,000 cap on state and local tax deductions, poured a record $18.9 billion into municipal bond funds during the first eight weeks of calendar year 2019, the most recorded over that period in at least 13 years.7
At the close of the fiscal year, we believed municipal fundamentals remained strong and viewed the ongoing impact of the Tax Cuts and Jobs Act as a potential market factor. As a result, we believe demand for municipal bond investments could remain strong as retail investors continue to seek tax-exempt income.
Over the fiscal year, security selection in BB and B-rated bonds significantly contributed to the Fund’s performance versus its style-specific benchmark. Security selection in the local general obligation bonds and appropriation-backed municipal bonds also added to the Fund’s relative performance.
Overweight exposure to shorter duration bonds (3.99 years and less) detracted from the Fund’s performance relative to the style-specific benchmark. The Fund’s overweight exposure to and security selection in pre-refunded bonds detracted from relative performance.
During the fiscal year, leverage contributed to the Fund’s performance relative to its style-specific benchmark. The Fund achieved a leveraged position through the use of inverse floating rate securities. The Fund uses leverage because we believe that, over time, leveraging provides opportunities for additional income and total return for shareholders. However, the use of leverage also can expose common shareholders to additional volatility.
We wish to remind you that the Fund is subject to interest rate risk, meaning when interest rates rise, the value of fixed income securities tends to fall. The degree to which the value of fixed income securities may decline due to rising interest rates may vary depending on the speed and magnitude of the increase in interest rates, as well as individual security characteristics, such as price, maturity, duration and coupon and market forces, such as supply and demand for similar securities. We are monitoring interest rates, as well as the market, economic and geopolitical factors that may impact the direction, speed and magnitude of changes to interest rates across the maturity spectrum, including the potential impact of monetary policy changes by the Fed and certain foreign central banks. If interest rates rise, markets may experience increased volatility, which may affect the value and/or liquidity of certain of the Fund’s investments.
Thank you for investing in Invesco Pennsylvania Tax Free Income Fund and for sharing our long-term investment horizon.
| 1 | Source: Commonwealth of Pennsylvania |
| 2 | Source: US Census Bureau |
| 3 | Source: Bureau of Labor Statistics |
| 4 | Sources: Standard & Poor’s, Fitch Ratings, Moody’s. A credit rating is an assessment provided by a nationally recognized statistical rating organization (NRSRO) of the creditworthiness of an issuer with respect to debt obligations, including specific securities, money market instruments or other debts. Ratings are measured on a scale that generally ranges from AAA (highest) to D (lowest); ratings are subject to change without notice. “Non-Rated” indicates the debtor was not rated, and should not be interpreted as indicating low quality. For more information on rating methodology, please visit www.standardandpoors.com and select “Understanding Ratings” under Rating |
| | Resources on the homepage; www.fitchratings.com and select “Understanding Credit Ratings” from the drop-down menu on the homepage; and www.moodys.com and select “Methodology,” then “Rating Methodologies” under Research Type on the left-hand side. |
| 5 | Source: FactSet Research Systems Inc. |
| 7 | Source: Strategic Insight |
| 8 | Source: US Department of the Treasury |
| 9 | Source: US Federal Reserve |
The views and opinions expressed in management’s discussion of Fund performance are those of Invesco Advisers, Inc. These views and opinions are subject to change at any time based on factors such as market and economic conditions. These views and opinions may not be relied upon as investment advice or recommendations, or as an offer for a particular security. The information is not a complete analysis of every aspect of any market, country, industry, security or the Fund. Statements of fact are from sources considered reliable, but Invesco Advisers, Inc. makes no representation or warranty as to their completeness or accuracy. Although historical performance is no guarantee of future results, these insights may help you understand our investment management philosophy.
See important Fund and, if applicable, index disclosures later in this report.
Mark Paris
Portfolio Manager and Chief Investment Officer and Head of Municipal Strategies for Invesco Fixed Income, is manager of Invesco Pennsylvania Tax Free Income Fund. He joined Invesco in 2010. Mr. Paris earned a BBA in finance from Baruch College — The City University of New York.
John (Jack) Connelly
Portfolio Manager, is manager of Invesco Pennsylvania Tax Free Income Fund. He joined Invesco in 2016. Mr. Connelly earned a BA in philosophy from Wheaton College and masters degrees from the University of Rhode Island and Yale University.
Tim O’Reilly
Portfolio Manager, is manager of Invesco Pennsylvania Tax Free Income Fund. He joined Invesco in 2010. Mr. O’Reilly earned a BS in finance from Eastern Illinois University and an MBA in finance from the University of Illinois at Chicago.
| 5 | Invesco Pennsylvania Tax Free Income Fund |
James Phillips
Portfolio Manager, is manager of Invesco Pennsylvania Tax Free Income Fund. He joined Invesco in 2010. Mr. Phillips earned a BA in American literature from Empire State College, the independent study division of the State University of New York, and an MBA in finance from the University at Albany, State University of New York.
John Schorle
Portfolio Manager, is manager of Invesco Pennsylvania Tax Free Income Fund. He has been associated with Invesco or its investment advisory affiliates since 2010. Mr. Schorle earned a BA degree in economics from DePaul University. He is also a Registered Certified Public Accountant.
Julius Williams
Portfolio Manager, is manager of Invesco Pennsylvania Tax Free Income Fund. He joined Invesco in 2010. Mr. Williams earned a BA in economics and sociology and a Master of Education degree in educational psychology from the University of Virginia.
| 6 | Invesco Pennsylvania Tax Free Income Fund |
Your Fund’s Long-Term Performance
Results of a $10,000 Investment — Oldest Share Class(es)
Fund and index data from 8/31/09
| 1 | Source: RIMES Technologies Corp. |
| 2 | Source: Lipper Inc. |
Past performance cannot guarantee comparable future results.
The data shown in the chart include reinvested distributions, applicable sales charges and Fund expenses including
management fees. Index results include reinvested dividends, but they do not reflect sales charges. Performance of the peer group, if applicable, reflects fund expenses and management fees; perfor-
mance of a market index does not. Performance shown in the chart and table(s) does not reflect deduction of taxes a shareholder would pay on Fund distributions or sale of Fund shares.
| 7 | Invesco Pennsylvania Tax Free Income Fund |
| Average Annual Total Returns |
| As of 8/31/19, including maximum applicable sales charges |
| Class A Shares | |
| Inception (5/1/87) | 5.44% |
| 10 Years | 4.39 |
| 5 Years | 2.89 |
| 1 Year | 2.98 |
| Class C Shares | |
| Inception (8/13/93) | 4.01% |
| 10 Years | 4.07 |
| 5 Years | 3.01 |
| 1 Year | 5.80 |
| Class Y Shares | |
| 10 Years | 5.09% |
| 5 Years | 4.04 |
| 1 Year | 7.80 |
| Class R6 Shares | |
| 10 Years | 4.91% |
| 5 Years | 3.92 |
| 1 Year | 7.88 |
Effective June 1, 2010, Class A and Class C shares of the predecessor fund, Van Kampen Pennsylvania Tax Free Income Fund, advised by Van Kampen Asset Management were reorganized into Class A and Class C shares, respectively, of Invesco Van Kampen Pennsylvania Tax Free Income Fund (renamed Invesco Pennsylvania Tax Free Income Fund). Returns shown above, prior to June 1, 2010, for Class A and Class C shares are blended returns of the predecessor fund and Invesco Pennsylvania Tax Free Income Fund. Share class returns will differ from the predecessor fund because of different expenses.
Class Y shares incepted on June 1, 2010. Performance shown prior to that date is that of the predecessor fund’s Class A shares and includes the 12b-1 fees applicable to Class A shares.
Class R6 shares incepted on April 4, 2017. Performance shown prior to that date is that of the Fund’s and the predecessor fund’s Class A shares and includes the 12b-1 fees applicable to Class A shares.
The performance data quoted represent past performance and cannot guarantee comparable future results; current performance may be lower or higher. Please visit invesco.com/performance for the most recent month-end performance. Performance figures reflect reinvested distributions, changes in net asset value and the ef-
| Average Annual Total Returns |
| As of 6/30/19, the most recent calendar quarter end, including maximum applicable sales charges |
| Class A Shares | |
| Inception (5/1/87) | 5.40% |
| 10 Years | 4.60 |
| 5 Years | 2.75 |
| 1 Year | 1.00 |
| Class C Shares | |
| Inception (8/13/93) | 3.94% |
| 10 Years | 4.28 |
| 5 Years | 2.90 |
| 1 Year | 3.79 |
| Class Y Shares | |
| 10 Years | 5.30% |
| 5 Years | 3.91 |
| 1 Year | 5.77 |
| Class R6 Shares | |
| 10 Years | 5.11% |
| 5 Years | 3.78 |
| 1 Year | 5.85 |
fect of the maximum sales charge unless otherwise stated. Investment return and principal value will fluctuate so that you may have a gain or loss when you sell shares.
The total annual Fund operating expense ratio set forth in the most recent Fund prospectus as of the date of this report for Class A, Class C, Class Y and Class R6 shares was 1.36%, 2.11%, 1.11% and 1.07%, respectively. The expense ratios presented above may vary from the expense ratios presented in other sections of this report that are based on expenses incurred during the period covered by this report.
Class A share performance reflects the maximum 4.25% sales charge, and Class C share performance reflects the applicable contingent deferred sales charge (CDSC) for the period involved. The CDSC on Class C shares is 1% for the first year after purchase. Class Y and Class R6 shares do not have a front-end sales charge or a CDSC; therefore, performance is at net asset value.
The performance of the Fund’s share classes will differ primarily due to different sales charge structures and class expenses.
Fund performance reflects any applicable fee waivers and/or expense reimbursements. Had the adviser not waived fees and/or reimbursed expenses currently or in the past, returns
would have been lower. See current prospectus for more information.
| 8 | Invesco Pennsylvania Tax Free Income Fund |
Invesco Pennsylvania Tax Free Income Fund’s investment objective is to provide only Pennsylvania investors with a high level of current income exempt from federal and Pennsylvania state income taxes and, where possible under local law, local income and personal property taxes, through investment in a varied portfolio of medium- and lower-grade municipal securities.
| ■ | Unless otherwise stated, information presented in this report is as of August 31, 2019, and is based on total net assets. |
| ■ | Unless otherwise noted, all data provided by Invesco. |
| ■ | To access your Fund’s reports/prospectus, visit invesco.com/fundreports. |
About share classes
| ■ | Class Y shares are available only to certain investors. Please see the prospectus for more information. |
| ■ | Class R6 shares are available for use by retirement plans that meet certain standards and for institutional investors. Class R6 shares are also available through intermediaries that have established an agreement with Invesco Distributors, Inc. to make such shares available for use in retail omnibus accounts. Please see the prospectus for more information. |
Principal risks of investing in the Fund
| ■ | Alternative minimum tax risk. A portion of the Fund’s otherwise tax-exempt income may be taxable to those shareholders subject to the federal alternative minimum tax. |
| ■ | Changing fixed income market conditions risk.The current low interest rate environment was created in part by the Federal Reserve Board (FRB) and certain foreign central banks keeping the federal funds and equivalent foreign rates near historical lows. Increases in the federal funds and equivalent foreign rates may expose fixed income markets to heightened volatility and reduced liquidity for certain fixed income investments, particularly those with longer maturities. In addition, decreases in fixed income dealer market-making capacity may also potentially lead to heightened volatility and reduced liquidity in the fixed income markets. As a result, the value of the Fund’s investments and share price may decline. Changes in central bank policies could also result in higher than normal shareholder redemptions, which could potentially increase portfolio turnover and the Fund’s transaction costs. |
| ■ | Debt securities risk. The prices of debt securities held by the Fund will be af- |
| | fected by changes in interest rates, the creditworthiness of the issuer and other factors. An increase in prevailing interest rates typically causes the value of existing debt securities to fall and often has a greater impact on longer-duration debt securities and higher quality debt securities. Falling interest rates will cause the Fund to reinvest the proceeds of debt securities that have been repaid by the issuer at lower interest rates. Falling interest rates may also reduce the Fund’s distributable income because interest payments on floating rate debt instruments held by the Fund will decline. The Fund could lose money on investments in debt securities if the issuer or borrower fails to meet its obligations to make interest payments and/or to repay principal in a timely manner. Changes in an issuer’s financial strength, the market’s perception of such strength or in the credit rating of the issuer or the security may affect the value of debt securities. The Adviser’s credit analysis may fail to anticipate such changes, which could result in buying a debt security at an inopportune time or failing to sell a debt security in advance of a price decline or other credit event. |
| ■ | Derivatives risk. The value of a derivative instrument depends largely on (and is derived from) the value of an underlying security, currency, commodity, interest rate, index or other asset (each referred to as an underlying asset). In addition to risks relating to the underlying assets, the use of derivatives may include other, possibly greater, risks, including counterparty, leverage and liquidity risks. Counterparty risk is the risk that the counterparty to the derivative contract will default on its obligation to pay the Fund the amount owed or otherwise perform under the derivative contract. Derivatives create lever- |
| | age risk because they do not require payment up front equal to the economic exposure created by holding a position in the derivative. As a result, an adverse change in the value of the underlying asset could result in the Fund sustaining a loss that is substantially greater than the amount invested in the derivative or the anticipated value of the underlying asset, which may make the Fund’s returns more volatile and increase the risk of loss. Derivative instruments may also be less liquid than more traditional investments and the Fund may be unable to sell or close out its derivative positions at a desirable time or price. This risk may be more acute under adverse market conditions, during which the Fund may be most in need of liquidating its derivative positions. Derivatives may also be harder to value, less tax efficient and subject to changing government regulation that could impact the Fund’s ability to use certain derivatives or their cost. Derivatives strategies may not always be successful. For example, derivatives used for hedging or to gain or limit exposure to a particular market segment may not provide the expected benefits, particularly during adverse market conditions. |
| ■ | High yield debt securities (junk bond) risk. Investments in high yield debt securities (“junk bonds”) and other lower-rated securities will subject the Fund to substantial risk of loss. These securities are considered to be speculative with respect to the issuer’s ability to pay interest and principal when due, are more susceptible to default or decline in market value and are less liquid than investment grade debt securities. Prices of high yield debt securities tend to be very volatile. |
| ■ | Inverse floating rate obligations risk. The price of inverse floating rate obligations (inverse floaters) is expected |
This report must be accompanied or preceded by a currently effective Fund prospectus, which contains more complete information, including sales charges and expenses. Investors should read it carefully before investing.
NOT FDIC INSURED | MAY LOSE VALUE | NO BANK GUARANTEE
| 9 | Invesco Pennsylvania Tax Free Income Fund |
| | to decline when interest rates rise, and generally will decline further than the price of a bond with a similar maturity. The price of inverse floaters is typically more volatile than the price of bonds with similar maturities. These risks can be particularly high if leverage is used in the formula that determines the interest payable by the inverse floater, which may make the Fund’s returns more volatile and increase the risk of loss. Additionally, these securities may lose some or all of their principal and, in some cases, the Fund could lose money in excess of its investment. |
| ■ | Liquidity risk. The Fund may be unable to sell illiquid investments at the time or price it desires and, as a result, could lose its entire investment in such investments. Liquid securities can become illiquid during periods of market stress. If a significant amount of the Fund’s securities become illiquid, the Fund may not be able to timely pay redemption proceeds and may need to sell securities at significantly reduced prices. |
| ■ | Management risk. The Fund is actively managed and depends heavily on the Adviser’s judgment about markets, interest rates or the attractiveness, relative values, liquidity, or potential appreciation of particular investments made for the Fund’s portfolio. The Fund could experience losses if these judgments prove to be incorrect. Additionally, legislative, regulatory, or tax developments may adversely affect management of the Fund and, therefore, the ability of the Fund to achieve its investment objective. |
| ■ | Market risk. The market values of the Fund’s investments, and therefore the value of the Fund’s shares, will go up and down, sometimes rapidly or unpredictably. Market risk may affect a single issuer, industry or section of the economy, or it may affect the market as a whole. Individual stock prices tend to go up and down more dramatically than those of certain other types of investments such as bonds. During a general downturn in the financial markets, multiple asset classes may decline in value. When markets perform well, there can be no assurance that specific investments held by the Fund will rise in value. |
| ■ | Medium- and lower-grade municipal securities risk. Medium- and lower-grade municipal securities generally involve more volatility and greater risks, including credit, market, liquidity |
| | and management risks, than higher-grade securities. Furthermore, many issuers of medium- and lower-grade securities choose not to have a rating assigned to their obligations. As such, the Fund’s portfolio may consist of a higher portion of unrated securities than an investment company investing solely in higher-grade securities. Unrated securities may not be as attractive to as many buyers as are rated securities, which may have the effect of limiting the Fund’s ability to sell such securities at their fair value. |
| ■ | Money market fund risk. Although money market funds generally seek to preserve the value of an investment at $1.00 per share, the Fund may lose money by investing in money market funds. A money market fund’s sponsor has no legal obligation to provide financial support to the money market fund. The credit quality of a money market fund’s holdings can change rapidly in certain markets, and the default of a single holding could have an adverse impact on the money market fund’s share price. A money market fund’s share price can also be negatively affected during periods of high redemption pressures, illiquid markets and/or significant market volatility. |
| ■ | Municipal issuer focus risk. The municipal issuers in which the Fund invests may be located in the same geographic area or may pay their interest obligations from revenue of similar projects, such as hospitals, airports, utility systems and housing finance agencies. This may make the Fund’s investments more susceptible to similar social, economic, political or regulatory occurrences, making the Fund more susceptible to experience a drop in its share price than if the Fund had been more diversified across issuers that did not have similar characteristics. |
| ■ | Municipal securities risk. The risk of a municipal obligation generally depends on the financial and credit status of the issuer. Constitutional amendments, legislative enactments, executive orders, administrative regulations, voter initiatives, and the issuer’s regional economic conditions may affect the municipal security’s value, interest payments, repayment of principal and the Fund’s ability to sell the security. Failure of a municipal security issuer to comply with applicable tax requirements may make income paid thereon taxable, resulting in a |
| | decline in the security’s value. In addition, there could be changes in applicable tax laws or tax treatments that reduce or eliminate the current federal income tax exemption on municipal securities or otherwise adversely affect the current federal or state tax status of municipal securities. |
| ■ | Pennsylvania and US territories municipal securities risk. The Fund is more susceptible to political, economic, regulatory or other factors affecting issuers of Pennsylvania municipal securities than a fund that does not focus its investments in such issuers. As with Pennsylvania municipal securities, events in any of the territories where the Fund is invested may affect the Fund’s investments and its performance. |
| ■ | Variable-rate demand notes risk. The absence of an active secondary market for certain variable and floating rate notes could make it difficult to dispose of these instruments, which could result in a loss. |
| ■ | When-issued, delayed delivery and forward commitment risks. When-issued and delayed delivery transactions subject the Fund to market risk because the value or yield of a security at delivery may be more or less than the purchase price or yield generally available when delivery occurs, and counterparty risk because the Fund relies on the buyer or seller, as the case may be, to consummate the transaction. These transactions also have a leveraging effect on the Fund because the Fund commits to purchase securities that it does not have to pay for until a later date, which increases the Fund’s overall investment exposure and, as a result, its volatility. |
| ■ | Zero coupon or pay-in-kind securities risk.The value, interest rates, and liquidity of non-cash paying instruments, such as zero coupon and pay-in-kind securities, are subject to greater fluctuation than other types of securities. The higher yields and interest rates on pay-in-kind securities reflect the payment deferral and increased credit risk associated with such instruments and that such investments may represent a higher credit risk than loans that periodically pay interest. |
| 10 | Invesco Pennsylvania Tax Free Income Fund |
About indexes used in this report
| ■ | TheS&P Municipal Bond Index is a broad, market value-weighted index that seeks to measure the performance of the US municipal bond market. |
| ■ | TheS&P Municipal Bond Pennsylvania 5+ Year Investment Grade Index tracks the performance of investment grade Pennsylvania-issued US municipals with maturities equal to or greater than five years. |
| ■ | TheLipper Pennsylvania Municipal Debt Funds Index is an unmanaged index considered representative of funds that limit assets to those securities that are exempt from taxation in Pennsylvania. |
| ■ | The Fund is not managed to track the performance of any particular index, including the index(es) described here, and consequently, the performance of the Fund may deviate significantly from the performance of the index(es). |
| ■ | A direct investment cannot be made in an index. Unless otherwise indicated, index results include reinvested dividends, and they do not reflect sales charges. Performance of the peer group, if applicable, reflects fund expenses; performance of a market index does not. |
Other information
| ■ | CPA® and Certified Public Accountant® are trademarks owned by the American Institute of Certified Public Accountants. |
| ■ | The returns shown in management’s discussion of Fund performance are based on net asset values (NAVs) calculated for shareholder transactions. Generally accepted accounting principles require adjustments to be made to the net assets of the Fund at period end for financial reporting purposes, and as such, the NAVs for shareholder transactions and the returns based on those NAVs may differ from the NAVs and returns reported in the Financial Highlights. |
| 11 | Invesco Pennsylvania Tax Free Income Fund |
Schedule of Investments
August 31, 2019
| | Interest
Rate | Maturity
Date | Principal
Amount
(000) | Value |
| Municipal Obligations–111.36%(a) |
| Pennsylvania–107.20% | | |
| Allegheny (County of), PA; Series 2016 C-76, GO Bonds(b) | 5.00% | 11/01/2041 | | $2,820 | $ 3,365,473 |
| Allegheny (County of), PA Higher Education Building Authority (Carnegie Mellon University); Series 2008 A, Ref. VRD RB(c) | 1.23% | 12/01/2037 | | 2,800 | 2,800,000 |
| Allegheny (County of), PA Higher Education Building Authority (Chatham University); Series 2012 A, RB | 5.00% | 09/01/2035 | | 1,000 | 1,071,280 |
| Allegheny (County of), PA Higher Education Building Authority (Duquesne University); | | | | | |
| Series 1998, Ref. RB (INS -AMBAC)(d) | 5.50% | 03/01/2020 | | 660 | 672,322 |
| Series 2011 A, RB(e)(f) | 5.50% | 03/01/2021 | | 550 | 585,624 |
| Allegheny (County of), PA Hospital Development Authority (Allegheny Health Network Obligated Group Issue); Series 2018 A, Ref. RB(g) | 5.00% | 04/01/2047 | | 1,000 | 1,197,420 |
| Allegheny (County of), PA Hospital Development Authority (Allegheny Health Network Obligated Group); Series 2018 A, Ref. RB(b)(g) | 5.00% | 04/01/2047 | | 2,115 | 2,532,543 |
| Allegheny (County of), PA Hospital Development Authority (University of Pittsburgh Medical Center); | | | | | |
| Series 2007 A-1, RB (67% of 3 mo. USD LIBOR + 0.82%)(h) | 2.33% | 02/01/2037 | | 600 | 591,972 |
| Series 2019 A, Ref. RB | 4.00% | 07/15/2038 | | 1,035 | 1,181,411 |
| Allegheny (County of), PA Industrial Development Authority (Residential Resources, Inc.); Series 2006, RB | 5.10% | 09/01/2026 | | 980 | 980,000 |
| Allegheny (County of), PA Sanitary Authority; Series 2015, Ref. RB(b) | 5.00% | 12/01/2045 | | 2,120 | 2,476,478 |
| Allentown Neighborhood Improvement Zone Development Authority (City Center); | | | | | |
| Series 2017, RB(i) | 5.00% | 05/01/2022 | | 250 | 267,434 |
| Series 2018, RB(i) | 5.00% | 05/01/2042 | | 615 | 699,612 |
| Berks (County of), PA Industrial Development Authority (Highlands at Wyomissing); | | | | | |
| Series 2017 A, Ref. RB | 5.00% | 05/15/2037 | | 750 | 875,370 |
| Series 2017 C, RB | 5.00% | 05/15/2047 | | 325 | 364,400 |
| Berks (County of), PA Municipal Authority (Reading Hospital Medical Center); Series 2012 A, RB | 5.00% | 11/01/2040 | | 1,000 | 1,076,570 |
| Bethlehem (City of), PA; | | | | | |
| Series 2014, Ref. RB (INS -BAM)(d) | 5.00% | 11/15/2030 | | 425 | 473,310 |
| Series 2014, Ref. RB (INS -BAM)(d) | 5.00% | 11/15/2031 | | 425 | 472,983 |
| Bethlehem Area School District; Series 2010, GO Bonds(e)(f) | 5.25% | 01/15/2020 | | 1,000 | 1,015,160 |
| Bucks (County of), PA Industrial Development Authority (Pennswood Village); Series 2018, Ref. RB | 5.00% | 10/01/2037 | | 270 | 307,222 |
| Central Bradford Progress Authority (Guthrie Healthcare System); Series 2011, RB | 5.38% | 12/01/2041 | | 1,100 | 1,179,365 |
| Centre (County of), PA Hospital Authority (Mt. Nittany Medical Center); | | | | | |
| Series 2011, RB(e)(f) | 6.25% | 11/15/2021 | | 500 | 555,625 |
| Series 2016 A, Ref. RB | 5.00% | 11/15/2046 | | 500 | 576,005 |
| Chester (County of), PA Industrial Development Authority (Avon Grove Charter School); Series 2017 A, Ref. RB | 5.00% | 12/15/2051 | | 770 | 876,083 |
| Chester (County of), PA Industrial Development Authority (Collegium Charter School); Series 2017 A, RB | 5.25% | 10/15/2047 | | 695 | 754,833 |
| Chester (County of), PA Industrial Development Authority (Renaissance Academy Charter School); Series 2014, RB | 5.00% | 10/01/2044 | | 1,000 | 1,100,970 |
| Chester (County of), PA Industrial Development Authority (University Student Housing, LLC at West Chester University of Pennsylvania); Series 2013, RB | 5.00% | 08/01/2045 | | 750 | 811,440 |
| Commonwealth Financing Authority; | | | | | |
| Series 2018, RB(b)(g) | 5.00% | 06/01/2034 | | 2,500 | 3,100,825 |
| Series 2018, RB(b)(g) | 5.00% | 06/01/2035 | | 955 | 1,177,515 |
| Cumberland (County of), PA Municipal Authority (Asbury Pennsylvania Obligated Group); Series 2010, RB | 6.00% | 01/01/2040 | | 870 | 880,031 |
| Cumberland (County of), PA Municipal Authority (Association of Independent Colleges & Universities of Pennsylvania Financing Program-Dickinson College); Series 2009, RB(e)(f) | 5.00% | 11/01/2019 | | 750 | 754,590 |
| Cumberland (County of), PA Municipal Authority (Diakon Lutheran Ministries); Series 2015, Ref. RB | 5.00% | 01/01/2038 | | 1,270 | 1,410,322 |
| Dauphin (County of), PA General Authority (Pinnacle Health System); Series 2016 A, Ref. RB | 5.00% | 06/01/2034 | | 510 | 610,276 |
| Delaware (County of), PA Authority (Villanova University); Series 2015, RB | 5.00% | 08/01/2045 | | 215 | 252,827 |
| Delaware (County of), PA Industrial Development Authority (Covanta); Series 2015, Ref. RB | 5.00% | 07/01/2043 | | 425 | 434,733 |
| Delaware River Port Authority; Series 2010 D, RB(e)(f) | 5.00% | 01/01/2020 | | 1,000 | 1,012,730 |
See accompanying Notes to Financial Statements which are an integral part of the financial statements.
| 12 | Invesco Pennsylvania Tax Free Income Fund |
| | Interest
Rate | Maturity
Date | Principal
Amount
(000) | Value |
| Pennsylvania–(continued) |
| Delaware River Port Authority (Port District); | | | | | |
| Series 2012, Ref. RB | 5.00% | 01/01/2025 | | $540 | $600,982 |
| Series 2012, Ref. RB | 5.00% | 01/01/2027 | | 535 | 593,898 |
| Delaware Valley Regional Financial Authority; Series 2002, RB | 5.75% | 07/01/2032 | | 1,000 | 1,423,640 |
| Derry (Township of), PA Pennsylvania Industrial & Commercial Development Authority (Hershey Arena); Series 2000 A, VRD RB (LOC - PNC Bank N.A.)(c)(j) | 1.28% | 09/12/2019 | | 480 | 480,000 |
| Doylestown (City of), PA Hospital Authority; Series 2013 A, RB (INS -AGM)(d) | 5.00% | 07/01/2024 | | 1,000 | 1,120,450 |
| DuBois (City of), PA Hospital Authority (Penn Highlands Healthcare); Series 2018, Ref. RB | 5.00% | 07/15/2048 | | 650 | 770,484 |
| East Hempfield (Township of), PA Industrial Development Authority (Student Services, Inc. Student Housing); | | | | | |
| Series 2013, RB | 5.00% | 07/01/2035 | | 500 | 541,410 |
| Series 2014, RB | 5.00% | 07/01/2039 | | 250 | 273,550 |
| East Hempfield (Township of), PA Industrial Development Authority (Willow Valley Communities); | | | | | |
| Series 2016, Ref. RB | 5.00% | 12/01/2030 | | 630 | 746,147 |
| Series 2016, Ref. RB | 5.00% | 12/01/2039 | | 370 | 429,940 |
| Fayette (County of), PA Hospital Authority (Fayette Regional Health System); Series 2007 B, VRD RB (LOC -PNC Bank, N.A.)(j) | 1.28% | 06/01/2037 | | 1,135 | 1,135,000 |
| Franklin (County of), PA Industrial Development Authority (Chambersburg Hospital); Series 2010, RB(e)(f) | 5.37% | 07/01/2020 | | 1,000 | 1,034,910 |
| Franklin (County of), PA Industrial Development Authority (Menno-Haven, Inc.); | | | | | |
| Series 2018, Ref. RB | 5.00% | 12/01/2043 | | 475 | 526,656 |
| Series 2018, Ref. RB | 5.00% | 12/01/2053 | | 700 | 771,946 |
| Series 2019, RB | 5.00% | 12/01/2039 | | 385 | 430,345 |
| Series 2019, RB | 5.00% | 12/01/2049 | | 510 | 563,637 |
| Series 2019, RB | 5.00% | 12/01/2054 | | 1,000 | 1,102,190 |
| Fulton (County of), PA Industrial Development Authority (The Fulton County Medical Center); Series 2016, Ref. RB | 5.00% | 07/01/2040 | | 1,515 | 1,636,019 |
| Geisinger Authority (Geisinger Health System); | | | | | |
| Series 2011 A-1, RB | 5.13% | 06/01/2041 | | 500 | 529,885 |
| Series 2011 B, VRD RB(c) | 1.24% | 06/01/2041 | | 1,135 | 1,135,000 |
| Series 2013 A, VRD RB(c) | 1.24% | 10/01/2043 | | 1,825 | 1,825,000 |
| Series 2017 A-1, Ref. RB(b) | 5.00% | 02/15/2045 | | 2,190 | 2,599,946 |
| General Authority of Southcentral Pennsylvania (WellSpan Health Obligated Group); Series 2019 A, Ref. RB | 5.00% | 06/01/2049 | | 750 | 926,332 |
| Lancaster (City of), PA Industrial Development Authority (Willow Valley Communities); Series 2019, RB | 5.00% | 12/01/2049 | | 455 | 530,594 |
| Lancaster (County of), PA Hospital Authority (Brethren Village); Series 2017, Ref. RB | 5.13% | 07/01/2037 | | 1,135 | 1,250,441 |
| Lancaster (County of), PA Hospital Authority (Landis Homes Retirement Community); Series 2015, Ref. RB | 5.00% | 07/01/2045 | | 625 | 677,413 |
| Lancaster (County of), PA Hospital Authority (Masonic Villages); | | | | | |
| Series 2008 D, Ref. VRD RB (LOC - JP Morgan Chase Bank N.A.)(c)(j) | 1.31% | 07/01/2034 | | 3,610 | 3,638,831 |
| Series 2015, Ref. RB | 5.00% | 11/01/2035 | | 210 | 239,341 |
| Lebanon (County of), PA Health Facilities Authority (E.C.C. Retirement Village); Series 2000, VRD RB (LOC-PNC Bank, N.A.)(c)(j) | 1.28% | 10/15/2025 | | 2,225 | 2,225,000 |
| Lehigh (County of), PA General Purpose Authority (Bible Fellowship Church Homes, Inc.); Series 2013, RB | 5.25% | 07/01/2042 | | 825 | 847,803 |
| Lehigh (County of), PA General Purpose Authority (Kidspeace Obligation Group); | | | | | |
| Series 2014 A, RB | 7.50% | 02/01/2044 | | 651 | 656,653 |
| Series 2014 B, RB(k) | 7.50% | 02/01/2044 | | 172 | 81,638 |
| Series 2014 C, RB(l) | 0.00% | 02/01/2044 | | 516 | 134 |
| Lycoming (County of), PA Authority (Pennsylvania College of Technology); Series 2011, RB | 5.00% | 07/01/2030 | | 750 | 792,915 |
| Montgomery (County of), PA Higher Education & Health Authority (Abington Memorial Hospital Obligated Group); Series 2012, RB(e)(f) | 5.00% | 06/01/2022 | | 1,400 | 1,546,636 |
| Montgomery (County of), PA Higher Education & Health Authority (Holy Redeemer Health System); Series 2014, Ref. RB | 5.00% | 10/01/2027 | | 390 | 442,135 |
See accompanying Notes to Financial Statements which are an integral part of the financial statements.
| 13 | Invesco Pennsylvania Tax Free Income Fund |
| | Interest
Rate | Maturity
Date | Principal
Amount
(000) | Value |
| Pennsylvania–(continued) |
| Montgomery (County of), PA Higher Education & Health Authority (Philadelphia Presbytery Homes, Inc.); | | | | | |
| Series 2017, Ref. RB | 5.00% | 12/01/2037 | | $750 | $841,417 |
| Series 2017, Ref. RB | 5.00% | 12/01/2047 | | 1,000 | 1,109,230 |
| Montgomery (County of), PA Higher Education & Health Authority (Thomas Jefferson University); Series 2018 A, Ref. RB | 5.00% | 09/01/2048 | | 270 | 326,487 |
| Montgomery (County of), PA Industrial Development Authority (ACTS Retirement-Life Communities, Inc.); | | | | | |
| Series 2009 A-1, RB(e)(f) | 6.25% | 11/15/2019 | | 1,000 | 1,010,070 |
| Series 2012, Ref. RB | 5.00% | 11/15/2028 | | 900 | 981,108 |
| Montgomery (County of), PA Industrial Development Authority (Albert Einstein Healthcare); Series 2015, Ref. RB | 5.25% | 01/15/2045 | | 850 | 963,721 |
| Montgomery (County of), PA Industrial Development Authority (Philadelphia Presbytery Homes, Inc.); Series 2010, RB(e)(f) | 6.62% | 12/01/2021 | | 1,500 | 1,682,265 |
| Montgomery (County of), PA Industrial Development Authority (Waverly Heights Ltd.); Series 2019, Ref. RB | 5.00% | 12/01/2049 | | 1,000 | 1,161,700 |
| Northampton (County of), PA General Purpose Authority (LaFayette College); Series 2017, Ref. RB(b) | 5.00% | 11/01/2047 | | 1,635 | 1,984,105 |
| Northampton (County of), PA General Purpose Authority (St. Luke’s University Health Network); | | | | | |
| Series 2016, Ref. RB | 5.00% | 08/15/2036 | | 330 | 390,694 |
| Series 2018 A, Ref. RB | 4.00% | 08/15/2048 | | 645 | 700,096 |
| Northampton (County of), PA Industrial Development Authority (Morningstar Senior Living, Inc.); Series 2012, RB | 5.00% | 07/01/2032 | | 920 | 974,832 |
| Northeastern Pennsylvania (State of) Hospital & Education Authority (Kings College); Series 2019, RB | 5.00% | 05/01/2044 | | 1,000 | 1,202,650 |
| Pennsylvania (Commonwealth of); | | | | | |
| First Series 2014, GO Bonds(b) | 5.00% | 06/15/2034 | | 3,000 | 3,467,190 |
| Series 2018 A, Ref. COP | 4.00% | 07/01/2046 | | 540 | 604,417 |
| Pennsylvania (Commonwealth of) (Municipal Real Estate Funding, LLC); Series 2018 A, Ref. COP | 5.00% | 07/01/2043 | | 590 | 713,245 |
| Pennsylvania (Commonwealth of) Higher Educational Facilities Authority (Trustees of the University of Pennsylvania); Series 2017, RB(b) | 5.00% | 08/15/2046 | | 2,200 | 2,677,400 |
| Pennsylvania (State of) Economic Development Financing Agency (Forum Place); Series 2012, RB | 5.00% | 03/01/2034 | | 500 | 538,060 |
| Pennsylvania (State of) Economic Development Financing Authority (Amtrak); Series 2012 A, Ref. RB(m) | 5.00% | 11/01/2041 | | 1,200 | 1,306,632 |
| Pennsylvania (State of) Economic Development Financing Authority (Capital Region Parking System); Series 2013, RB | 6.00% | 07/01/2053 | | 920 | 1,081,920 |
| Pennsylvania (State of) Economic Development Financing Authority (Covanta Holding Corp.); Series 2019 A, RB(i)(m) | 3.25% | 08/01/2039 | | 1,250 | 1,256,187 |
| Pennsylvania (State of) Economic Development Financing Authority (National Gypson Co.); Series 2014, Ref. RB(m) | 5.50% | 11/01/2044 | | 635 | 682,333 |
| Pennsylvania (State of) Economic Development Financing Authority (PA Bridges Finco L.P.); Series 2015, RB(m) | 5.00% | 12/31/2034 | | 1,235 | 1,440,553 |
| Pennsylvania (State of) Economic Development Financing Authority (Philadelphia Biosolids Facility); Series 2009, RB | 6.25% | 01/01/2032 | | 1,000 | 1,013,120 |
| Pennsylvania (State of) Higher Educational Facilities Authority (AICUP Financing Program-Del Valley College); Series 2012, RB | 5.00% | 11/01/2042 | | 535 | 548,782 |
| Pennsylvania (State of) Higher Educational Facilities Authority (Drexel University); Series 2005 B, VRD RB (LOC - Td Bank N.A.)(c)(j) | 1.30% | 05/01/2030 | | 525 | 525,000 |
| Pennsylvania (State of) Higher Educational Facilities Authority (Edinboro University Foundation); Series 2010, RB(e)(f) | 6.00% | 07/01/2020 | | 500 | 520,225 |
| Pennsylvania (State of) Higher Educational Facilities Authority (La Salle University); Series 2012, RB | 5.00% | 05/01/2042 | | 1,180 | 1,269,409 |
| Pennsylvania (State of) Higher Educational Facilities Authority (Shippensburg University Student Services); Series 2012, RB(e)(f) | 5.00% | 10/01/2022 | | 1,300 | 1,454,128 |
| Pennsylvania (State of) Higher Educational Facilities Authority (St. Joseph’s University); Series 2010 A, RB | 5.00% | 11/01/2034 | | 500 | 518,470 |
| Pennsylvania (State of) Higher Educational Facilities Authority (Temple University); First Series 2012, RB | 5.00% | 04/01/2042 | | 570 | 612,328 |
| Pennsylvania (State of) Higher Educational Facilities Authority (Thomas Jefferson University); Series 2015, Ref. RB | 5.25% | 09/01/2050 | | 845 | 981,087 |
| Pennsylvania (State of) Higher Educational Facilities Authority (University of Pennsylvania Health System); Series 2017 A, RB | 5.00% | 08/15/2042 | | 1,075 | 1,301,545 |
See accompanying Notes to Financial Statements which are an integral part of the financial statements.
| 14 | Invesco Pennsylvania Tax Free Income Fund |
| | Interest
Rate | Maturity
Date | Principal
Amount
(000) | Value |
| Pennsylvania–(continued) |
| Pennsylvania (State of) Turnpike Commission; | | | | | |
| Series 2009 C, RB (INS -AGM)(d)(k) | 6.25% | 06/01/2033 | | $2,000 | $2,580,280 |
| Series 2009 E, RB(k) | 6.37% | 12/01/2038 | | 1,435 | 1,900,256 |
| Series 2010 A-1, RB(e)(f) | 5.00% | 12/01/2019 | | 500 | 504,730 |
| Series 2018 A-2, RB | 5.00% | 12/01/2043 | | 535 | 660,880 |
| Series 2018 B, RB | 5.25% | 12/01/2048 | | 630 | 780,135 |
| Series 2019 A, RB | 5.00% | 12/01/2044 | | 1,000 | 1,255,310 |
| Subseries 2010 A-2, RB(e)(f) | 5.50% | 12/01/2020 | | 180 | 189,830 |
| Subseries 2010 A-2, Ref. RB(e)(f) | 5.50% | 12/01/2020 | | 820 | 864,780 |
| Subseries 2010 B-2, RB(e)(f) | 5.00% | 12/01/2020 | | 235 | 246,388 |
| Subseries 2010 B-2, RB(e)(f) | 5.00% | 12/01/2020 | | 125 | 131,058 |
| Subseries 2010 B-2, RB(e)(f) | 5.13% | 12/01/2020 | | 500 | 524,995 |
| Subseries 2010 B-2, Ref. RB(e)(f) | 5.00% | 12/01/2020 | | 265 | 277,842 |
| Subseries 2017 B-1, RB | 5.25% | 06/01/2047 | | 1,000 | 1,190,320 |
| Philadelphia (City of), PA; | | | | | |
| Ninth Series 2010, RB(e)(f) | 5.25% | 08/01/2020 | | 390 | 404,547 |
| Ninth Series 2010, RB | 5.25% | 08/01/2040 | | 610 | 631,747 |
| Series 2010 C, RB(e)(f) | 5.00% | 08/01/2020 | | 970 | 1,004,901 |
| Series 2010 C, RB(e)(f) | 5.00% | 08/01/2020 | | 280 | 289,943 |
| Series 2011, GO Bonds(e)(f) | 6.00% | 08/01/2020 | | 500 | 522,265 |
| Series 2017 A, RB(b)(g) | 5.25% | 10/01/2052 | | 2,070 | 2,531,631 |
| Series 2017 A, Ref. GO Bonds | 5.00% | 08/01/2036 | | 700 | 855,442 |
| Series 2017 B, Ref. RB(m) | 5.00% | 07/01/2047 | | 1,000 | 1,186,920 |
| Series 2017, Ref. GO Bonds | 5.00% | 08/01/2041 | | 880 | 1,062,072 |
| Series 2019 B, GO Bonds | 5.00% | 02/01/2039 | | 300 | 378,381 |
| Philadelphia (City of), PA Authority for Industrial Development (The Childrens Hospital of Philadelphia); Series 2014 A, RB(b) | 5.00% | 07/01/2042 | | 1,500 | 1,734,120 |
| Philadelphia (City of), PA Authority for Industrial Development (Wesley Enhanced Living Obligated Group); | | | | | |
| Series 2017, Ref. RB | 5.00% | 07/01/2042 | | 1,000 | 1,117,810 |
| Series 2017, Ref. RB | 5.00% | 07/01/2049 | | 500 | 555,625 |
| Philadelphia (City of), PA Hospitals & Higher Education Facilities Authority (Jefferson Health System); Series 2010 B, RB(e)(f) | 5.00% | 05/15/2020 | | 1,500 | 1,540,395 |
| Philadelphia (City of), PA Hospitals & Higher Education Facilities Authority (Temple University Health System); Series 2017, Ref. RB | 5.00% | 07/01/2032 | | 1,000 | 1,161,180 |
| Philadelphia (City of), PA Industrial Development Authority (Architecture & Design Charter High School); Series 2013, RB | 6.12% | 03/15/2043 | | 585 | 585,000 |
| Philadelphia (City of), PA Industrial Development Authority (Discovery Charter School); Series 2012, RB | 6.25% | 04/01/2042 | | 1,000 | 1,030,290 |
| Philadelphia (City of), PA Industrial Development Authority (First Philadelphia Preparatory Charter School); Series 2014 A, RB | 7.00% | 06/15/2033 | | 875 | 1,025,482 |
| Philadelphia (City of), PA Industrial Development Authority (Kipp Philadelphia Charter School); Series 2016 B, RB | 5.00% | 04/01/2046 | | 640 | 683,142 |
| Philadelphia (City of), PA Industrial Development Authority (MaST Charter School); Series 2010, RB(e)(f) | 6.00% | 08/01/2020 | | 700 | 730,191 |
| Philadelphia (City of), PA Industrial Development Authority (MaST I Charter School); Series 2016 A, Ref. RB | 5.25% | 08/01/2046 | | 1,500 | 1,660,335 |
| Philadelphia (City of), PA Industrial Development Authority (New Foundations Charter School); Series 2012, RB(e)(f) | 6.62% | 12/15/2022 | | 750 | 879,420 |
| Philadelphia (City of), PA Industrial Development Authority (Performing Arts Charter School); Series 2013, RB(i) | 6.50% | 06/15/2033 | | 945 | 969,239 |
| Philadelphia (City of), PA Industrial Development Authority (University of the Arts); Series 2017, Ref. RB(i) | 5.00% | 03/15/2045 | | 540 | 580,311 |
| Philadelphia (State of) Authority for Industrial Development (Cultural and Commercials Corridors); Series 2016, Ref. RB | 5.00% | 12/01/2031 | | 840 | 999,138 |
| Philadelphia (State of) Authority for Industrial Development (Temple University); First Series 2015, Ref. RB | 5.00% | 04/01/2045 | | 530 | 607,534 |
See accompanying Notes to Financial Statements which are an integral part of the financial statements.
| 15 | Invesco Pennsylvania Tax Free Income Fund |
| | Interest
Rate | Maturity
Date | Principal
Amount
(000) | Value |
| Pennsylvania–(continued) | |
| Philadelphia School District; | | | | | |
| Series 2007 A, Ref. GO Bonds (INS -NATL)(d) | 5.00% | 06/01/2025 | | $535 | $638,100 |
| Series 2008 E, GO Bonds (INS -BHAC)(d) | 5.13% | 09/01/2023 | | 250 | 250,000 |
| Pittsburgh (City of) & Allegheny (County of), PA Sports & Exhibition Authority (Regional Asset District); Series 2010, Ref. RB (INS -AGM)(d) | 5.00% | 02/01/2031 | | 1,000 | 1,032,470 |
| Pittsburgh (City of), PA Water & Sewer Authority; | | | | | |
| Series 2013 A, Ref. RB | 5.00% | 09/01/2031 | | 500 | 570,060 |
| Series 2019 A, RB (INS -AGM)(d) | 5.00% | 09/01/2044 | | 450 | 564,431 |
| Ridley School District; Series 2009, VRD GO Bonds (LOC-TD Bank N.A.)(c)(j) | 1.27% | 11/01/2029 | | 410 | 410,000 |
| State Public School Building Authority (Harrisburg School District); Series 2016 A, Ref. RB (INS -AGM)(d) | 5.00% | 12/01/2030 | | 1,055 | 1,281,825 |
| Susquehanna Area Regional Airport Authority; Series 2012 A, RB(m) | 5.00% | 01/01/2027 | | 1,185 | 1,303,713 |
| Union (County of), PA Hospital Authority (Evangelical Community Hospital); Series 2011, Ref. RB(e)(f) | 7.00% | 08/01/2021 | | 1,000 | 1,109,890 |
| Washington (County of), PA Industrial Development Authority (Washington Jefferson College); Series 2010, RB(e)(f) | 5.25% | 05/01/2020 | | 500 | 513,870 |
| Washington (County of), PA Redevelopment Authority; Series 2018, Ref. RB | 5.00% | 07/01/2028 | | 500 | 537,465 |
| Westmoreland (County of), PA Industrial Development Authority (Excela Health); Series 2005 A, VRD RB (LOC-PNC Bank, N.A.)(c)(j) | 1.28% | 07/01/2027 | | 400 | 400,000 |
| Westmoreland (County of), PA Municipal Authority; Series 2013, RB(e)(f) | 5.00% | 08/15/2023 | | 750 | 863,617 |
| Wilkes-Barre (City of), PA Finance Authority (University of Scranton); Series 2010, RB(e)(f) | 5.00% | 11/01/2020 | | 850 | 887,935 |
| | | | | | 154,659,302 |
| Guam–3.08% | | |
| Guam (Territory of); Series 2011 A, RB | 5.13% | 01/01/2042 | | 785 | 826,110 |
| Guam (Territory of) (Section 30); Series 2009 A, RB(e)(f) | 5.75% | 12/01/2019 | | 1,250 | 1,264,338 |
| Guam (Territory of) Power Authority; | | | | | |
| Series 2010 A, RB(e)(f) | 5.50% | 10/01/2020 | | 410 | 429,311 |
| Series 2012 A, Ref. RB | 5.00% | 10/01/2034 | | 520 | 559,915 |
| Guam (Territory of) Waterworks Authority; | | | | | |
| Series 2010, RB(e)(f) | 5.62% | 07/01/2020 | | 1,000 | 1,037,640 |
| Series 2014 A, Ref. RB | 5.00% | 07/01/2029 | | 285 | 321,839 |
| | | | | | 4,439,153 |
| Virgin Islands–0.74% | | |
| Virgin Islands (Government of) Port Authority; Series 2014 A, Ref. RB(m) | 5.00% | 09/01/2029 | | 575 | 577,524 |
| Virgin Islands (Government of) Public Finance Authority (Matching Fund Loan Note); Series 2009 B, Ref. RB | 5.00% | 10/01/2025 | | 500 | 498,750 |
| | | | | | 1,076,274 |
| Puerto Rico–0.34% | | |
| Children’s Trust Fund; Series 2002, RB | 5.38% | 05/15/2033 | | 210 | 213,083 |
| Puerto Rico Sales Tax Financing Corp.; Series 2018 A-1, RB(l) | 0.00% | 07/01/2027 | | 350 | 276,952 |
| | | | | | 490,035 |
| TOTAL INVESTMENTS IN SECURITIES(n)–111.36% (Cost $150,268,383) | 160,664,764 |
| FLOATING RATE NOTE OBLIGATIONS–(10.83)% | |
Notes with interest and fee rates ranging from 1.90% to 1.97% at 08/31/2019 and
contractual maturities of collateral ranging from 06/01/2034 to 10/01/2052 (See Note 1K)(o) | | | | | (15,630,000) |
| OTHER ASSETS LESS LIABILITIES–(0.53)% | (759,098) |
| NET ASSETS–100.00% | $144,275,666 |
See accompanying Notes to Financial Statements which are an integral part of the financial statements.
| 16 | Invesco Pennsylvania Tax Free Income Fund |
Investment Abbreviations:
| AGM | – Assured Guaranty Municipal Corp. |
| AMBAC | – American Municipal Bond Assurance Corp. |
| BAM | – Build America Mutual Assurance Co. |
| BHAC | – Berkshire Hathaway Assurance Corp. |
| COP | – Certificates of Participation |
| GO | – General Obligation |
| INS | – Insurer |
| LIBOR | – London Interbank Offered Rate |
| LOC | – Letter of Credit |
| NATL | – National Public Finance Guarantee Corp. |
| RB | – Revenue Bonds |
| Ref. | – Refunding |
| USD | – U.S. Dollar |
| VRD | – Variable Rate Demand |
Notes to Schedule of Investments:
| (a) | Calculated as a percentage of net assets. Amounts in excess of 100% are due to the Fund’s use of leverage. |
| (b) | Underlying security related to TOB Trusts entered into by the Fund. See Note 1K. |
| (c) | Demand security payable upon demand by the Fund at specified time intervals no greater than thirteen months. Interest rate is redetermined periodically by the issuer or agent based on current market conditions. Rate shown is the rate in effect on August 31, 2019. |
| (d) | Principal and/or interest payments are secured by the bond insurance company listed. |
| (e) | Advance refunded; secured by an escrow fund of U.S. Government obligations or other highly rated collateral. |
| (f) | Security has an irrevocable call by the issuer or mandatory put by the holder. Maturity date reflects such call or put. |
| (g) | Security is subject to a reimbursement agreement which may require the Fund to pay amounts to a counterparty in the event of a significant decline in the market value of the security underlying the TOB Trusts. In case of a shortfall, the maximum potential amount of payments the Fund could ultimately be required to make under the agreement is $5,095,000. However, such shortfall payment would be reduced by the proceeds from the sale of the security underlying the TOB Trusts. |
| (h) | Interest or dividend rate is redetermined periodically. Rate shown is the rate in effect on August 31, 2019. |
| (i) | Security purchased or received in a transaction exempt from registration under the Securities Act of 1933, as amended (the “1933 Act”). The security may be resold pursuant to an exemption from registration under the 1933 Act, typically to qualified institutional buyers. The aggregate value of these securities at August 31, 2019 was $3,772,783, which represented 2.61% of the Fund’s Net Assets. |
| (j) | Principal and interest payments are fully enhanced by a letter of credit from the bank listed or a predecessor bank, branch or subsidiary. |
| (k) | Convertible capital appreciation bond. The interest rate shown represents the coupon rate at which the bond will accrue at a specified future date. |
| (l) | Zero coupon bond issued at a discount. |
| (m) | Security subject to the alternative minimum tax. |
| (n) | Entities may either issue, guarantee, back or otherwise enhance the credit quality of a security. The entities are not primarily responsible for the issuer’s obligation but may be called upon to satisfy issuer’s obligations. No concentration of any single entity was greater than 5% each. |
| (o) | Floating rate note obligations related to securities held. The interest and fee rates shown reflect the rates in effect at August 31, 2019. At August 31, 2019, the Fund’s investments with a value of $27,647,226 are held by TOB Trusts and serve as collateral for the $15,630,000 in the floating rate note obligations outstanding at that date. |
See accompanying Notes to Financial Statements which are an integral part of the financial statements.
| 17 | Invesco Pennsylvania Tax Free Income Fund |
Statement of Assets and Liabilities
August 31, 2019
| Assets: | |
Investments in securities, at value
(Cost $150,268,383) | $160,664,764 |
| Cash | 91,054 |
| Receivable for: | |
| Fund shares sold | 76,298 |
| Interest | 1,515,531 |
| Investment for trustee deferred compensation and retirement plans | 42,994 |
| Other assets | 6,712 |
| Total assets | 162,397,353 |
| Liabilities: | |
| Floating rate note obligations | 15,630,000 |
| Payable for: | |
| Investments purchased | 2,087,130 |
| Dividends | 172,301 |
| Fund shares reacquired | 30,250 |
| Accrued fees to affiliates | 57,841 |
| Accrued trustees’ and officers’ fees and benefits | 2,619 |
| Accrued other operating expenses | 94,808 |
| Trustee deferred compensation and retirement plans | 46,738 |
| Total liabilities | 18,121,687 |
| Net assets applicable to shares outstanding | $144,275,666 |
| Net assets consist of: | |
| Shares of beneficial interest | $138,616,229 |
| Distributable earnings | 5,659,437 |
| | $144,275,666 |
| Net Assets: |
| Class A | $124,485,198 |
| Class C | $7,283,879 |
| Class Y | $10,454,939 |
| Class R6 | $2,051,650 |
| Shares outstanding, no par value, with an unlimited number of shares authorized: |
| Class A | 7,508,472 |
| Class C | 438,884 |
| Class Y | 630,008 |
| Class R6 | 123,634 |
| Class A: | |
| Net asset value per share | $16.58 |
Maximum offering price per share
(Net asset value of $16.58 ÷ 95.75%) | $17.32 |
| Class C: | |
| Net asset value and offering price per share | $16.60 |
| Class Y: | |
| Net asset value and offering price per share | $16.59 |
| Class R6: | |
| Net asset value and offering price per share | $16.59 |
See accompanying Notes to Financial Statements which are an integral part of the financial statements.
| 18 | Invesco Pennsylvania Tax Free Income Fund |
Statement of Operations
For the year ended August 31, 2019
| Investment income: | |
| Interest | $5,942,649 |
| Expenses: | |
| Advisory fees | 639,832 |
| Administrative services fees | 28,990 |
| Custodian fees | 1,198 |
| Distribution fees: | |
| Class A | 275,881 |
| Class C | 73,817 |
| Interest, facilities and maintenance fees | 402,629 |
| Transfer agent fees — A, C and Y | 104,077 |
| Transfer agent fees — R6 | 223 |
| Trustees’ and officers’ fees and benefits | 22,062 |
| Registration and filing fees | 54,775 |
| Reports to shareholders | 21,268 |
| Professional services fees | 77,786 |
| Other | 19,800 |
| Total expenses | 1,722,338 |
| Less: Expense offset arrangement(s) | (512) |
| Net expenses | 1,721,826 |
| Net investment income | 4,220,823 |
| Realized and unrealized gain (loss) from: | |
| Net realized gain (loss) from Investment securities | (660,914) |
| Change in net unrealized appreciation of Investment securities | 5,997,437 |
| Net realized and unrealized gain | 5,336,523 |
| Net increase in net assets resulting from operations | $9,557,346 |
See accompanying Notes to Financial Statements which are an integral part of the financial statements.
| 19 | Invesco Pennsylvania Tax Free Income Fund |
Statement of Changes in Net Assets
For the years ended August 31, 2019 and 2018
| | 2019 | 2018 |
| Operations: | | |
| Net investment income | $4,220,823 | $5,506,334 |
| Net realized gain (loss) | (660,914) | (261,608) |
| Change in net unrealized appreciation (depreciation) | 5,997,437 | (3,927,613) |
| Net increase in net assets resulting from operations | 9,557,346 | 1,317,113 |
| Distributions to shareholders from distributable earnings(1): | | |
| Class A | (4,441,367) | (4,179,503) |
| Class B | — | (5,238) |
| Class C | (242,072) | (301,057) |
| Class Y | (373,567) | (274,889) |
| Class R6 | (55,313) | (26,987) |
| Total distributions from distributable earnings | (5,112,319) | (4,787,674) |
| Share transactions–net: | | |
| Class A | 12,995,184 | (1,690,730) |
| Class B | — | (409,496) |
| Class C | (1,912,249) | (1,039,714) |
| Class Y | 3,473,418 | (98,829) |
| Class R6 | 950,717 | 1,054,603 |
| Net increase (decrease) in net assets resulting from share transactions | 15,507,070 | (2,184,166) |
| Net increase (decrease) in net assets | 19,952,097 | (5,654,727) |
| Net assets: | | |
| Beginning of year | 124,323,569 | 129,978,296 |
| End of year | $144,275,666 | $124,323,569 |
| (1) | The Securities and Exchange Commission eliminated the requirement to disclose distribution components separately, except for tax return of capital. For the year ended August 31, 2018, distributions to shareholders from distributable earnings consisted of distributions from net investment income. |
See accompanying Notes to Financial Statements which are an integral part of the financial statements.
| 20 | Invesco Pennsylvania Tax Free Income Fund |
Statement of Cash Flows
For the year ended August 31, 2019
| Cash provided by operating activities: | |
| Net increase in net assets resulting from operations | $9,557,346 |
| Adjustments to reconcile the change in net assets from operations to net cash provided by operating activities: | |
| Purchases of investments | (18,223,060) |
| Proceeds from sales of investments | 15,913,921 |
| Purchases of short-term investments, net | (13,545,000) |
| Amortization of premium on investment securities | 797,778 |
| Accretion of discount on investment securities | (19,717) |
| Decrease in receivables and other assets | 85,644 |
| Increase in accrued expenses and other payables | 96,189 |
| Net realized loss from investment securities | 660,914 |
| Net change in unrealized appreciation on investment securities | (5,997,437) |
| Net cash provided by operating activities | (10,673,422) |
| Cash provided by (used in) financing activities: | |
| Dividends paid to shareholders from distributable earnings | (1,814,624) |
| Proceeds from shares of beneficial interest sold | 32,311,690 |
| Proceeds of TOB Trusts | 405,000 |
| Disbursements from shares of beneficial interest reacquired | (20,204,008) |
| Net cash provided by (used in) financing activities | 10,698,058 |
| Net increase in cash and cash equivalents | 24,636 |
| Cash and cash equivalents at beginning of period | 66,418 |
| Cash and cash equivalents at end of period | $91,054 |
| Non-cash financing activities: | |
| Value of shares of beneficial interest issued in reinvestment of dividends paid to shareholders | $3,258,140 |
| Supplemental disclosure of cash flow information: | |
| Cash paid during the period for interest, facilities and maintenance fees | $402,629 |
See accompanying Notes to Financial Statements which are an integral part of the financial statements.
| 21 | Invesco Pennsylvania Tax Free Income Fund |
Financial Highlights
August 31, 2019
The following schedule presents financial highlights for a share of the Fund outstanding throughout the periods indicated.
| | Net asset
value,
beginning
of period | Net
investment
income(a) | Net gains
(losses)
on securities
(both
realized and
unrealized) | Total from
investment
operations | Dividends
from net
investment
income | Net asset
value, end
of period | Total
return(b) | Net assets,
end of period
(000’s omitted) | Ratio of
expenses
to average
net assets
with fee waivers
and/or
expenses
absorbed | Ratio of
expenses
to average net
assets without
fee waivers
and/or
expenses
absorbed | Supplemental
ratio of
expenses
to average
net assets
with fee waivers
(excluding
interest,
facilities and
maintenance
fees) | Ratio of net
investment
income
to average
net assets | Portfolio
turnover(c) |
| Class A |
| Year ended 08/31/19 | $16.04 | $0.53 | $0.66 | $1.19 | $(0.65) | $16.58 | 7.60% | $124,485 | 1.32%(d) | 1.32%(d) | 1.01%(d) | 3.32%(d) | 11% |
| Year ended 08/31/18 | 16.49 | 0.71(e) | (0.54)(e) | 0.17 | (0.62) | 16.04 | 1.05 | 107,640 | 1.36 | 1.36 | 1.05 | 4.37(e) | 17 |
| Year ended 08/31/17 | 17.01 | 0.57 | (0.55) | 0.02 | (0.54) | 16.49 | 0.18 | 112,324 | 1.19 | 1.19 | 1.04 | 3.50 | 22 |
| Year ended 08/31/16 | 16.44 | 0.57 | 0.60 | 1.17 | (0.60) | 17.01 | 7.21 | 118,906 | 1.08 | 1.08 | 1.02 | 3.41 | 12 |
| Year ended 08/31/15 | 16.50 | 0.59 | (0.09) | 0.50 | (0.56) | 16.44 | 3.09 | 112,409 | 1.12 | 1.12 | 1.09 | 3.59 | 13 |
| Class C |
| Year ended 08/31/19 | 16.06 | 0.41 | 0.66 | 1.07 | (0.53) | 16.60 | 6.80 | 7,284 | 2.07(d) | 2.07(d) | 1.76(d) | 2.57(d) | 11 |
| Year ended 08/31/18 | 16.50 | 0.59(e) | (0.53)(e) | 0.06 | (0.50) | 16.06 | 0.36 | 9,013 | 2.11 | 2.11 | 1.80 | 3.62(e) | 17 |
| Year ended 08/31/17 | 17.03 | 0.45 | (0.56) | (0.11) | (0.42) | 16.50 | (0.63) | 10,325 | 1.94 | 1.94 | 1.79 | 2.75 | 22 |
| Year ended 08/31/16 | 16.46 | 0.44 | 0.60 | 1.04 | (0.47) | 17.03 | 6.42 | 11,406 | 1.83 | 1.83 | 1.77 | 2.66 | 12 |
| Year ended 08/31/15 | 16.53 | 0.47 | (0.09) | 0.38 | (0.45) | 16.46 | 2.33 | 9,488 | 1.87 | 1.87 | 1.84 | 2.84 | 13 |
| Class Y |
| Year ended 08/31/19 | 16.06 | 0.57 | 0.65 | 1.22 | (0.69) | 16.59 | 7.80 | 10,455 | 1.07(d) | 1.07(d) | 0.76(d) | 3.57(d) | 11 |
| Year ended 08/31/18 | 16.50 | 0.75(e) | (0.53)(e) | 0.22 | (0.66) | 16.06 | 1.37 | 6,622 | 1.11 | 1.11 | 0.80 | 4.62(e) | 17 |
| Year ended 08/31/17 | 17.02 | 0.61 | (0.55) | 0.06 | (0.58) | 16.50 | 0.44 | 6,905 | 0.94 | 0.94 | 0.79 | 3.75 | 22 |
| Year ended 08/31/16 | 16.46 | 0.61 | 0.59 | 1.20 | (0.64) | 17.02 | 7.41 | 4,351 | 0.83 | 0.83 | 0.77 | 3.66 | 12 |
| Year ended 08/31/15 | 16.51 | 0.64 | (0.08) | 0.56 | (0.61) | 16.46 | 3.41 | 3,323 | 0.87 | 0.87 | 0.84 | 3.84 | 13 |
| Class R6 |
| Year ended 08/31/19 | 16.06 | 0.59 | 0.64 | 1.23 | (0.70) | 16.59 | 7.88 | 2,052 | 1.01(d) | 1.01(d) | 0.70(d) | 3.63(d) | 11 |
| Year ended 08/31/18 | 16.50 | 0.75(e) | (0.53)(e) | 0.22 | (0.66) | 16.06 | 1.38 | 1,048 | 1.07 | 1.07 | 0.76 | 4.66(e) | 17 |
| Year ended 08/31/17(f) | 16.23 | 0.26 | 0.25 | 0.51 | (0.24) | 16.50 | 3.15 | 10 | 0.93(g) | 0.93(g) | 0.78(g) | 3.76(g) | 22 |
| (a) | Calculated using average shares outstanding. |
| (b) | Includes adjustments in accordance with accounting principles generally accepted in the United States of America and as such, the net asset value for financial reporting purposes and the returns based upon those net asset values may differ from the net asset value and returns for shareholder transactions. Does not include sales charges and is not annualized for periods less than one year, if applicable. |
| (c) | Portfolio turnover is calculated at the fund level and is not annualized for periods less than one year, if applicable. |
| (d) | Ratios are based on average daily net assets (000’s omitted) of $110,529, $7,382, $8,765 and $1,290 for Class A, Class C, Class Y and Class R6 shares, respectively. |
| (e) | Amount includes the effect of a one-time reclassification of prior year earnings. Excluding this reclassification, net investment income per share, net gains (losses) on securities and ratio of net investment income to average net assets would have been $0.57, $(0.40) and 3.48%; $0.45, $(0.39) and 2.73%; $0.61, $(0.39) and 3.73%; and $0.61, $(0.39) and 3.77% for Class A, Class C, Class Y and Class R6, respectively. |
| (f) | Commencement date of April 04, 2017. |
| (g) | Annualized. |
See accompanying Notes to Financial Statements which are an integral part of the financial statements.
| 22 | Invesco Pennsylvania Tax Free Income Fund |
Notes to Financial Statements
August 31, 2019
NOTE 1—Significant Accounting Policies
Invesco Pennsylvania Tax Free Income Fund (the “Fund”) is a series portfolio of AIM Counselor Series Trust (Invesco Counselor Series Trust) (the “Trust”). The Trust is a Delaware statutory trust registered under the Investment Company Act of 1940, as amended (the “1940 Act”), as an open-end series management investment company authorized to issue an unlimited number of shares of beneficial interest. Information presented in these financial statements pertains only to the Fund. Matters affecting the Fund or each class will be voted on exclusively by the shareholders of the Fund or each class.
The Fund’s investment objective is to provide only Pennsylvania investors with a high level of current income exempt from federal and Pennsylvania state income taxes and, where possible under local law, local income and personal property taxes, through investment in a varied portfolio of medium- and lower-grade municipal securities.
The Fund currently consists of four different classes of shares: Class A, Class C, Class Y and Class R6. Class Y shares are available only to certain investors. Class A shares are sold with a front-end sales charge unless certain waiver criteria are met. Under certain circumstances, load waived shares may be subject to contingent deferred sales charges ("CDSC"). Class C shares are sold with a CDSC. Class Y and Class R6 shares are sold at net asset value. Class C shares held for ten years after purchase are eligible for automatic conversion into Class A shares of the same Fund (the "Conversion Feature"). The automatic conversion pursuant to the Conversion Feature will generally occur at the end of the month following the tenth anniversary after a purchase of Class C shares.
The Fund is an investment company and accordingly follows the investment company accounting and reporting guidance in accordance with Financial Accounting Standards Board Accounting Standards Codification Topic 946,Financial Services – Investment Companies.
The following is a summary of the significant accounting policies followed by the Fund in the preparation of its financial statements.
| A. | Security Valuations — Securities, including restricted securities, are valued according to the following policy. |
Securities are fair valued using an evaluated quote provided by an independent pricing service approved by the Board of Trustees. Evaluated quotes provided by the pricing service may be determined without exclusive reliance on quoted prices, and may reflect appropriate factors such as institution-size trading in similar groups of securities, developments related to specific securities, dividend rate (for unlisted equities), yield (for debt obligations), quality, type of issue, coupon rate (for debt obligations), maturity (for debt obligations), individual trading characteristics and other market data. Pricing services generally value debt obligations assuming orderly transactions of institutional round lot size, but a trust may hold or transact in the same securities in smaller, odd lot sizes. Odd lots often trade at lower prices than institutional round lots. Debt obligations are subject to interest rate and credit risks. In addition, all debt obligations involve some risk of default with respect to interest and/or principal payments.
Securities for which market quotations are not readily available or became unreliable are valued at fair value as determined in good faith by or under the supervision of the Trust’s officers following procedures approved by the Board of Trustees. Some of the factors which may be considered in determining fair value are fundamental analytical data relating to the investment; the nature and duration of any restrictions on transferability or disposition; trading in similar securities by the same issuer or comparable companies; relevant political, economic or issuer specific news; and other relevant factors under the circumstances.
The Fund may invest in securities that are subject to interest rate risk, meaning the risk that the prices will generally fall as interest rates rise and, conversely, the prices will generally rise as interest rates fall. Specific securities differ in their sensitivity to changes in interest rates depending on their individual characteristics. Changes in interest rates may result in increased market volatility, which may affect the value and/ or liquidity of certain Fund investments.
Valuations change in response to many factors including the historical and prospective earnings of the issuer, the value of the issuer’s assets, general economic conditions, interest rates, investor perceptions and market liquidity. Because of the inherent uncertainties of valuation, the values reflected in the financial statements may materially differ from the value received upon actual sale of those investments.
| B. | Securities Transactions and Investment Income – Securities transactions are accounted for on a trade date basis. Realized gains or losses on sales are computed on the basis of specific identification of the securities sold. Interest income (net of withholding tax, if any) is recorded on the accrual basis from settlement date. Bond premiums and discounts are amortized and/or accreted over the lives of the respective securities. Pay-in-kind interest income and non-cash dividend income received in the form of securities in-lieu of cash are recorded at the fair value of the securities received. Dividend income (net of withholding tax, if any) is recorded on the ex-dividend date. |
The Fund may periodically participate in litigation related to Fund investments. As such, the Fund may receive proceeds from litigation settlements. Any proceeds received are included in the Statement of Operations as realized gain (loss) for investments no longer held and as unrealized gain (loss) for investments still held.
Brokerage commissions and mark ups are considered transaction costs and are recorded as an increase to the cost basis of securities purchased and/or a reduction of proceeds on a sale of securities. Such transaction costs are included in the determination of net realized and unrealized gain (loss) from investment securities reported in the Statement of Operations and the Statement of Changes in Net Assets and the net realized and unrealized gains (losses) on securities per share in the Financial Highlights. Transaction costs are included in the calculation of the Fund’s net asset value and, accordingly, they reduce the Fund’s total returns. These transaction costs are not considered operating expenses and are not reflected in net investment income reported in the Statement of Operations and the Statement of Changes in Net Assets, or the net investment income per share and the ratios of expenses and net investment income reported in the Financial Highlights, nor are they limited by any expense limitation arrangements between the Fund and the investment adviser.
The Fund allocates realized and unrealized capital gains and losses to a class based on the relative net assets of each class. The Fund allocates income to a class based on the relative value of the settled shares of each class.
| C. | Country Determination — For the purposes of making investment selection decisions and presentation in the Schedule of Investments, the investment adviser may determine the country in which an issuer is located and/or credit risk exposure based on various factors. These factors include the laws of the country under which the issuer is organized, where the issuer maintains a principal office, the country in which the issuer derives 50% or more of its total revenues and the country that has the primary market for the issuer’s securities, as well as other criteria. Among |
| 23 | Invesco Pennsylvania Tax Free Income Fund |
| | the other criteria that may be evaluated for making this determination are the country in which the issuer maintains 50% or more of its assets, the type of security, financial guarantees and enhancements, the nature of the collateral and the sponsor organization. Country of issuer and/or credit risk exposure has been determined to be the United States of America, unless otherwise noted. |
| D. | Distributions — Distributions from net investment income, if any, are declared and paid monthly. Distributions from net realized capital gain, if any, are generally declared and paid annually and recorded on the ex-dividend date. The Fund may elect to treat a portion of the proceeds from redemptions as distributions for federal income tax purposes. |
| E. | Federal Income Taxes – The Fund intends to comply with the requirements of Subchapter M of the Internal Revenue Code of 1986, as amended (the “Internal Revenue Code”), necessary to qualify as a regulated investment company and to distribute substantially all of the Fund’s taxable and tax-exempt earnings to shareholders. As such, the Fund will not be subject to federal income taxes on otherwise taxable income (including net realized capital gain) that is distributed to shareholders. Therefore, no provision for federal income taxes is recorded in the financial statements. |
The Fund recognizes the tax benefits of uncertain tax positions only when the position is more likely than not to be sustained. Management has analyzed the Fund’s uncertain tax positions and concluded that no liability for unrecognized tax benefits should be recorded related to uncertain tax positions. Management is not aware of any tax positions for which it is reasonably possible that the total amounts of unrecognized tax benefits will change materially in the next 12 months.
In addition, the Fund intends to invest in such municipal securities to allow it to qualify to pay shareholders “exempt-interest dividends”, as defined in the Internal Revenue Code.
The Fund files tax returns in the U.S. Federal jurisdiction and certain other jurisdictions. Generally, the Fund is subject to examinations by such taxing authorities for up to three years after the filing of the return for the tax period.
| F. | Expenses — Fees provided for under the Rule 12b-1 plan of a particular class of the Fund are charged to the operations of such class. Transfer agency fees and expenses and other shareholder recordkeeping fees and expenses attributable to Class R6 are charged to such class. Transfer agency fees and expenses and other shareholder recordkeeping fees and expenses relating to all other classes are allocated among those classes based on relative net assets. All other expenses are allocated among the classes based on relative net assets. |
| G. | Interest, Facilities and Maintenance Fees — Interest, Facilities and Maintenance Fees include interest and related borrowing costs such as commitment fees and other expenses associated with lines of credit and interest and administrative expenses related to establishing and maintaining floating rate note obligations, if any. |
| H. | Accounting Estimates — The preparation of financial statements in conformity with accounting principles generally accepted in the United States of America (“GAAP”) requires management to make estimates and assumptions that affect the reported amounts of assets and liabilities at the date of the financial statements and the reported amounts of revenues and expenses during the reporting period including estimates and assumptions related to taxation. Actual results could differ from those estimates by a significant amount. In addition, the Fund monitors for material events or transactions that may occur or become known after the period-end date and before the date the financial statements are released to print. |
| I. | Indemnifications — Under the Trust’s organizational documents, each Trustee, officer, employee or other agent of the Trust is indemnified against certain liabilities that may arise out of the performance of their duties to the Fund. Additionally, in the normal course of business, the Fund enters into contracts, including the Fund’s servicing agreements, that contain a variety of indemnification clauses. The Fund’s maximum exposure under these arrangements is unknown as this would involve future claims that may be made against the Fund that have not yet occurred. The risk of material loss as a result of such indemnification claims is considered remote. |
| J. | Cash and Cash Equivalents – For the purposes of the Statement of Cash Flows, the Fund defines Cash and Cash Equivalents as cash (including foreign currency), money market funds and other investments held in lieu of cash and excludes investments made with cash collateral received. |
| K. | Floating Rate Note Obligations– The Fund invests in inverse floating rate securities, such as Tender Option Bonds (“TOBs”), for investment purposes and to enhance the yield of the Fund. Such securities may be purchased in the secondary market without first owning an underlying bond but generally are created through the sale of fixed rate bonds by the Fund to special purpose trusts established by a broker dealer or by the Fund (“TOB Trusts”) in exchange for cash and residual interests in the TOB Trusts’ assets and cash flows, which are in the form of inverse floating rate securities. The TOB Trusts finance the purchases of the fixed rate bonds by issuing floating rate notes to third parties and allowing the Fund to retain residual interests in the bonds. The floating rate notes issued by the TOB Trusts have interest rates that reset weekly and the floating rate note holders have the option to tender their notes to the TOB Trusts for redemption at par at each reset date. The residual interests held by the Fund (inverse floating rate securities) include the right of the Fund (1) to cause the holders of the floating rate notes to tender their notes at par at the next interest rate reset date, and (2) to transfer the municipal bond from the TOB Trust to the Fund, thereby collapsing the TOB Trust. Inverse floating rate securities tend to underperform the market for fixed rate bonds in a rising interest rate environment, but tend to outperform the market for fixed rate bonds when interest rates decline or remain relatively stable. |
The Fund generally invests in inverse floating rate securities that include embedded leverage, thus exposing the Fund to greater risks and increased costs. The primary risks associated with inverse floating rate securities are varying degrees of liquidity and decreases in the value of such securities in response to changes in interest rates to a greater extent than fixed rate securities having similar credit quality, redemption provisions and maturity, which may cause the Fund’s net asset value to be more volatile than if it had not invested in inverse floating rate securities. In certain instances, the short-term floating rate notes created by the TOB Trust may not be able to be sold to third parties or, in the case of holders tendering (or putting) such notes for repayment of principal, may not be able to be remarketed to third parties. In such cases, the TOB Trust holding the fixed rate bonds may be collapsed with the entity that contributed the fixed rate bonds to the TOB Trust. In the case where a TOB Trust is collapsed with the Fund, the Fund will be required to repay the principal amount of the tendered securities, which may require the Fund to sell other portfolio holdings to raise cash to meet that obligation. The Fund could therefore be required to sell other portfolio holdings at a disadvantageous time or price to raise cash to meet this obligation, which risk will be heightened during times of market volatility, illiquidity or uncertainty. The embedded leverage in the TOB Trust could cause the Fund to lose more money than the value of the asset it has contributed to the TOB Trust and greater levels of leverage create the potential for greater losses. In addition, a Fund may enter into reimbursement agreements with the liquidity provider of certain TOB transactions in connection with certain residuals held by the Fund. These agreements commit a Fund to reimburse the liquidity provider to the extent that the liquidity provider must provide cash to a TOB Trust, including following the termination of a
| 24 | Invesco Pennsylvania Tax Free Income Fund |
TOB Trust resulting from a mandatory tender event (“liquidity shortfall”). The reimbursement agreement will effectively make the Fund liable for the amount of the negative difference, if any, between the liquidation value of the underlying security and the purchase price of the floating rate notes issued by the TOB Trust.
The Fund accounts for the transfer of fixed rate bonds to the TOB Trusts as secured borrowings, with the securities transferred remaining in the Fund’s investment assets, and the related floating rate notes reflected as Fund liabilities under the captionFloating rate note obligationson the Statement of Assets and Liabilities. The carrying amount of the Fund’s floating rate note obligations as reported on the Statement of Assets and Liabilities approximates its fair value. The Fund records the interest income from the fixed rate bonds under the caption Interest and records the expenses related to floating rate obligations and any administrative expenses of the TOB Trusts as a component ofInterest, facilities and maintenance fees on the Statement of Operations.
Final rules implementing section 619 of the Dodd-Frank Wall Street Reform and Consumer Protection Act (the “Volcker Rule”) prohibit banking entities from engaging in proprietary trading of certain instruments and limit such entities’ investments in, and relationships with, “covered funds”, as defined in the rules. These rules preclude banking entities and their affiliates from sponsoring and/or providing services for existing TOB Trusts. A new TOB structure is being utilized by the Fund wherein the Fund, as holder of the residuals, will perform certain duties previously performed by banking entities as “sponsors” of TOB Trusts. These duties may be performed by a third-party service provider. The Fund’s expanded role under the new TOB structure may increase its operational and regulatory risk. The new structure is substantially similar to the previous structure; however, pursuant to the Volcker Rule, the remarketing agent would not be able to repurchase tendered floaters for its own account upon a failed remarketing. In the event of a failed remarketing, a banking entity serving as liquidity provider may loan the necessary funds to the TOB Trust to purchase the tendered floaters. The TOB Trust, not the Fund, would be the borrower and the loan from the liquidity provider will be secured by the purchased floaters now held by the TOB Trust. However, as previously described, the Fund would bear the risk of loss with respect to any liquidity shortfall to the extent it entered into a reimbursement agreement with the liquidity provider.
Further, the SEC and various banking agencies have adopted rules implementing credit risk retention requirements for asset-backed securities (the “Risk Retention Rules”). The Risk Retention Rules require the sponsor of a TOB Trust to retain at least 5% of the credit risk of the underlying assets supporting the TOB Trust’s municipal bonds. The Fund has adopted policies intended to comply with the Risk Retention Rules. The Risk Retention Rules may adversely affect the Fund’s ability to engage in TOB Trust transactions or increase the costs of such transactions in certain circumstances.
There can be no assurances that the new TOB structure will continue to be a viable form of leverage. Further, there can be no assurances that alternative forms of leverage will be available to the Fund in order to maintain current levels of leverage. Any alternative forms of leverage may be less advantageous to the Fund, and may adversely affect the Fund’s net asset value, distribution rate and ability to achieve its investment objective.
TOBs are presently classified as private placement securities. Private placement securities are subject to restrictions on resale because they have not been registered under the Securities Act of 1933, as amended (the “1933 Act”), or are otherwise not readily marketable. As a result of the absence of a public trading market for these securities, they may be less liquid than publicly traded securities. Although atypical, these securities may be resold in privately negotiated transactions, the prices realized from these sales could be less than those originally paid by the Fund or less than what may be considered the fair value of such securities.
| L. | Other Risks – The value of, payment of interest on, repayment of principal for and the ability to sell a municipal security may be affected by constitutional amendments, legislative enactments, executive orders, administrative regulations, voter initiatives and the economics of the regions in which the issuers are located. |
Since many municipal securities are issued to finance similar projects, especially those relating to education, health care, transportation and utilities, conditions in those sectors can affect the overall municipal securities market and the Fund’s investments in municipal securities.
There is some risk that a portion or all of the interest received from certain tax-free municipal securities could become taxable as a result of determinations by the Internal Revenue Service.
NOTE 2—Advisory Fees and Other Fees Paid to Affiliates
The Trust has entered into a master investment advisory agreement with Invesco Advisers, Inc. (the “Adviser” or “Invesco”). Under the terms of the investment advisory agreement, the Fund accrues daily and pays monthly an advisory fee to the Adviser based on the annual rate of the Fund’s average daily net assets as follows:
| Average Daily Net Assets | Rate |
| First $500 million | 0.50% |
| Over $500 million | 0.40% |
For the year ended August 31, 2019, the effective advisory fees incurred by the Fund was 0.50%.
Under the terms of a master sub-advisory agreement between the Adviser and each of Invesco Asset Management Deutschland GmbH, Invesco Asset Management Limited, Invesco Asset Management (Japan) Limited, Invesco Hong Kong Limited, Invesco Senior Secured Management, Inc. and Invesco Canada Ltd. and separate sub-advisory agreements with Invesco Capital Management LLC and Invesco Asset Management (India) Private Limited (collectively, the "Affiliated Sub-Advisers") the Adviser, not the Fund, will pay 40% of the fees paid to the Adviser to any such Affiliated Sub-Adviser(s) that provide(s) discretionary investment management services to the Fund based on the percentage of assets allocated to such Affiliated Sub-Adviser(s).
The Adviser has contractually agreed, through at least June 30, 2020, to waive advisory fees and/or reimburse expenses to the extent necessary to limit total annual fund operating expenses after fee waiver and/or expense reimbursement (excluding certain items discussed below) of Class A, Class C, Class Y and Class R6 shares to 1.50%, 2.25%, 1.25% and 1.25%, respectively, of the Fund’s average daily net assets (the "expense limits"). In determining the Adviser’s obligation to waive advisory fees and/or reimburse expenses, the following expenses are not taken into account, and could cause total annual fund operating expenses after fee waiver and/or reimbursement to exceed the numbers reflected above: (1) interest, facilities and maintenance fees; (2) taxes; (3) dividend expense on short sales; (4) extraordinary or non-routine items, including litigation expenses; and (5) expenses that the Fund has incurred but did not actually pay because of an expense offset arrangement. Unless Invesco continues the fee
| 25 | Invesco Pennsylvania Tax Free Income Fund |
waiver agreement, it will terminate on June 30, 2020. During its term, the fee waiver agreement cannot be terminated or amended to increase the expense limits or reduce the advisory fee waivers without approval of the Board of Trustees. The Adviser did not waive fees and/or reimburse expenses during the period under this expense limit.
The Trust has entered into a master administrative services agreement with Invesco pursuant to which the Fund has agreed to pay Invesco for certain administrative costs incurred in providing accounting services to the Fund. For the year ended August 31, 2019, expenses incurred under the agreement are shown in the Statement of Operations asAdministrative services fees. Also, Invesco has entered into a sub-administration agreement whereby State Street Bank and Trust Company (“SSB”) serves as custodian and fund accountant and provides certain administrative services to the Fund.
The Trust has entered into a transfer agency and service agreement with Invesco Investment Services, Inc. (“IIS”) pursuant to which the Fund has agreed to pay IIS a fee for providing transfer agency and shareholder services to the Fund and reimburse IIS for certain expenses incurred by IIS in the course of providing such services. IIS may make payments to intermediaries that provide omnibus account services, sub-accounting services and/or networking services. All fees payable by IIS to intermediaries that provide omnibus account services or sub-accounting services are charged back to the Fund, subject to certain limitations approved by the Trust’s Board of Trustees. For the year ended August 31, 2019, expenses incurred under the agreement are shown in the Statement of Operations asTransfer agent fees.
Shares of the Fund are distributed by Invesco Distributors, Inc. (“IDI”), an affiliate of the Adviser. The Fund has adopted a Plan of Distribution (the “Plan”) pursuant to Rule 12b-1 under the 1940 Act. The Plan provides that the Fund will reimburse IDI for distribution related expenses that IDI incurs up to a maximum of the following annual rates: (1) Class A — up to 0.25% of the average daily net assets of Class A shares; and (2) Class C — up to 1.00% of the average daily net assets of Class C shares. The fees are accrued daily and paid monthly. For the year ended August 31, 2019, expenses incurred under these agreements are shown in the Statement of Operations asDistribution fees.
Front-end sales commissions and CDSC (collectively, the “sales charges”) are not recorded as expenses of the Fund. Front-end sales commissions are deducted from proceeds from the sales of Fund shares prior to investment in Class A shares of the Fund. CDSC are deducted from redemption proceeds prior to remittance to the shareholder. During the year ended August 31, 2019, IDI advised the Fund that IDI retained $22,871 in front-end sales commissions from the sale of Class A shares and $1,371 and $100 from Class A and Class C shares, respectively, for CDSC imposed upon redemptions by shareholders.
NOTE 3—Additional Valuation Information
GAAP defines fair value as the price that would be received to sell an asset or paid to transfer a liability in an orderly transaction between market participants at the measurement date, under current market conditions. GAAP establishes a hierarchy that prioritizes the inputs to valuation methods, giving the highest priority to readily available unadjusted quoted prices in an active market for identical assets (Level 1) and the lowest priority to significant unobservable inputs (Level 3), generally when market prices are not readily available or are unreliable. Based on the valuation inputs, the securities or other investments are tiered into one of three levels. Changes in valuation methods may result in transfers in or out of an investment’s assigned level:
Level 1 — Prices are determined using quoted prices in an active market for identical assets.
Level 2 — Prices are determined using other significant observable inputs. Observable inputs are inputs that other market participants may use in pricing a security. These may include quoted prices for similar securities, interest rates, prepayment speeds, credit risk, yield curves, loss severities, default rates, discount rates, volatilities and others.
Level 3 — Prices are determined using significant unobservable inputs. In situations where quoted prices or observable inputs are unavailable (for example, when there is little or no market activity for an investment at the end of the period), unobservable inputs may be used. Unobservable inputs reflect the Fund’s own assumptions about the factors market participants would use in determining fair value of the securities or instruments and would be based on the best available information.
As of August 31, 2019, all of the securities in this Fund were valued based on Level 2 inputs (see the Schedule of Investments for security categories). The level assigned to the securities valuations may not be an indication of the risk or liquidity associated with investing in those securities. Because of the inherent uncertainties of valuation, the values reflected in the financial statements may materially differ from the value received upon actual sale of those investments.
NOTE 4—Security Transactions with Affiliated Funds
The Fund is permitted to purchase or sell securities from or to certain other Invesco Funds under specified conditions outlined in procedures adopted by the Board of Trustees of the Trust. The procedures have been designed to ensure that any purchase or sale of securities by the Fund from or to another fund or portfolio that is or could be considered an affiliate by virtue of having a common investment adviser (or affiliated investment advisers), common Trustees and/or common officers complies with Rule 17a-7 of the 1940 Act. Further, as defined under the procedures, each transaction is effected at the current market price. Pursuant to these procedures, for the year ended August 31, 2019, the Fund engaged in securities purchases of $19,989,623 and securities sales of $7,405,801, which did not result in any net realized gains (losses).
NOTE 5—Expense Offset Arrangement(s)
The expense offset arrangement is comprised of transfer agency credits which result from balances in demand deposit accounts used by the transfer agent for clearing shareholder transactions. For the year ended August 31, 2019, the Fund received credits from this arrangement, which resulted in the reduction of the Fund’s total expenses of $512.
NOTE 6—Trustees’ and Officers’ Fees and Benefits
Trustees’ and Officers’ Fees and Benefits include amounts accrued by the Fund to pay remuneration to certain Trustees and Officers of the Fund. Trustees have the option to defer compensation payable by the Fund, and Trustees’ and Officers’ Fees and Benefits also include amounts accrued by the Fund to fund such deferred compensation amounts. Those Trustees who defer compensation have the option to select various Invesco Funds in which
| 26 | Invesco Pennsylvania Tax Free Income Fund |
their deferral accounts shall be deemed to be invested. Finally, certain current Trustees were eligible to participate in a retirement plan that provided for benefits to be paid upon retirement to Trustees over a period of time based on the number of years of service. The Fund may have certain former Trustees who also participate in a retirement plan and receive benefits under such plan.Trustees’ and Officers’ Fees and Benefits include amounts accrued by the Fund to fund such retirement benefits. Obligations under the deferred compensation and retirement plans represent unsecured claims against the general assets of the Fund.
NOTE 7—Cash Balances and Borrowings
The Fund is permitted to temporarily carry a negative or overdrawn balance in its account with SSB, the custodian bank. Such balances, if any at period-end, are shown in the Statement of Assets and Liabilities under the payable captionAmount due custodian. To compensate the custodian bank for such overdrafts, the overdrawn Fund may either (1) leave funds as a compensating balance in the account so the custodian bank can be compensated by earning the additional interest; or (2) compensate by paying the custodian bank at a rate agreed upon by the custodian bank and Invesco, not to exceed the contractually agreed upon rate. The Fund may not purchase additional securities when any borrowings from banks or broker-dealers exceed 5% of the Fund’s total assets, or when any borrowings from an Invesco Fund are outstanding.
Inverse floating rate obligations resulting from the transfer of bonds to TOB Trusts are accounted for as secured borrowings. The average floating rate notes outstanding and average annual interest and fee rate related to inverse floating rate note obligations during the year ended August 31, 2019 were $15,243,462 and 2.64%, respectively.
NOTE 8—Distributions to Shareholders and Tax Components of Net Assets
| Tax Character of Distributions to Shareholders Paid During the Fiscal Years Ended August 31, 2019 and August 31, 2018 |
| | 2019 | 2018 |
| Tax Exempt Income | 5,112,319 | 4,787,674 |
| Tax Components of Net Assets at Period-End: |
| | 2019 |
| Undistributed tax-exempt income | $255,693 |
| Net unrealized appreciation — investments | 10,431,550 |
| Temporary book/tax differences | (38,502) |
| Capital loss carryforward | (4,989,304) |
| Shares of beneficial interest | 138,616,229 |
| Total net assets | $144,275,666 |
The difference between book-basis and tax-basis unrealized appreciation (depreciation) is due to differences in the timing of recognition of gains and losses on investments for tax and book purposes. The Fund’s net unrealized appreciation (depreciation) difference is attributable primarily to TOBs and book to tax accretion and amortization differences.
The temporary book/tax differences are a result of timing differences between book and tax recognition of income and/or expenses. The Fund’s temporary book/tax differences are the result of the trustee deferral of compensation and retirement plan benefits.
Capital loss carryforward is calculated and reported as of a specific date. Results of transactions and other activity after that date may affect the amount of capital loss carryforward actually available for the Fund to utilize. Capital losses generated in years beginning after December 22, 2010 can be carried forward for an unlimited period, whereas previous losses expire in eight tax years. Capital losses with an expiration period may not be used to offset capital gains until all net capital losses without an expiration date have been utilized. Capital loss carryforwards with no expiration date will retain their character as either short-term or long-term capital losses instead of as short-term capital losses as under prior law. The ability to utilize capital loss carryforwards in the future may be limited under the Internal Revenue Code and related regulations based on the results of future transactions.
The Fund has a capital loss carryforward as of August 31, 2019, as follows:
| Capital Loss Carryforward* |
| Expiration | Short-Term | Long-Term | Total |
| Not subject to expiration | $1,134,559 | $3,854,745 | $4,989,304 |
| * | Capital loss carryforwards as of the date listed above is reduced for limitations, if any, to the extent required by the Internal Revenue Code and may be further limited depending upon a variety of factors, including the realization of net unrealized gains or losses as of the date of any reorganization. |
NOTE 9—Investment Transactions
The aggregate amount of investment securities (other than short-term securities, U.S. Treasury obligations and money market funds, if any) purchased and sold by the Fund during the year ended August 31, 2019 was $19,518,547 and $14,663,921, respectively. Cost of investments,
| 27 | Invesco Pennsylvania Tax Free Income Fund |
including any derivatives, on a tax basis includes the adjustments for financial reporting purposes as of the most recently completed federal income tax reporting period-end.
| Unrealized Appreciation (Depreciation) of Investments on a Tax Basis |
| Aggregate unrealized appreciation of investments | $10,566,506 |
| Aggregate unrealized (depreciation) of investments | (134,956) |
| Net unrealized appreciation of investments | $10,431,550 |
Cost of investments for tax purposes is $150,233,214.
NOTE 10—Reclassification of Permanent Differences
Primarily as a result of differing book/tax treatment of federal income tax credit, on August 31, 2019, undistributed net investment income was decreased by $13,667, undistributed net realized gain (loss) was decreased by $4 and shares of beneficial interest was increased by $13,671. This reclassification had no effect on the net assets of the Fund.
NOTE 11—Share Information
| | Summary of Share Activity |
| | Years ended August 31, |
| | 2019(a) | | 2018 |
| | Shares | Amount | | Shares | Amount |
| Sold: | | | | | |
| Class A | 1,422,384 | $22,917,558 | | 698,917 | $11,354,722 |
| Class C | 165,811 | 2,677,786 | | 66,944 | 1,090,000 |
| Class Y | 358,323 | 5,739,087 | | 172,232 | 2,804,028 |
| Class R6 | 64,872 | 1,052,876 | | 70,642 | 1,151,862 |
| Issued as reinvestment of dividends: | | | | | |
| Class A | 176,599 | 2,837,833 | | 177,597 | 2,871,169 |
| Class B(b) | - | - | | 86 | 1,400 |
| Class C | 10,430 | 167,565 | | 12,768 | 206,632 |
| Class Y | 12,663 | 204,210 | | 8,344 | 134,919 |
| Class R6 | 3,010 | 48,532 | | 1,614 | 26,000 |
| Conversion of Class B shares to Class A shares:(c) | | | | | |
| Class A | - | - | | 19,569 | 318,589 |
| Class B | - | - | | (19,522) | (318,589) |
| Automatic conversion of Class C shares to Class A shares: | | | | | |
| Class A | 213,649 | 3,398,077 | | - | - |
| Class C | (213,386) | (3,398,077) | | - | - |
| Reacquired: | | | | | |
| Class A | (1,012,851) | (16,158,284) | | (1,000,930) | (16,235,210) |
| Class B(b) | - | - | | (5,629) | (92,307) |
| Class C | (85,078) | (1,359,523) | | (144,200) | (2,336,346) |
| Class Y | (153,248) | (2,469,879) | | (186,742) | (3,037,776) |
| Class R6 | (9,479) | (150,691) | | (7,642) | (123,259) |
| Net increase (decrease) in share activity | 953,699 | $15,507,070 | | (135,952) | $(2,184,166) |
| (a) | There are entities that are record owners of more than 5% of the outstanding shares of the Fund and in the aggregate own 53% of the outstanding shares of the Fund. IDI has an agreement with these entities to sell Fund shares. The Fund, Invesco and/or Invesco affiliates may make payments to these entities, which are considered to be related to the Fund, for providing services to the Fund, Invesco and/or Invesco affiliates including but not limited to services such as securities brokerage, distribution, third party record keeping and account servicing. The Fund has no knowledge as to whether all or any portion of the shares owned of record by these entities are also owned beneficially. |
| (b) | Class B shares activity for the period September 1, 2017 through January 26, 2018 (date of conversion). |
| (c) | Effective as of the close of business January 26, 2018, all outstanding Class B shares were converted to Class A shares. |
| 28 | Invesco Pennsylvania Tax Free Income Fund |
Report of Independent Registered Public Accounting Firm
To the Board of Trustees of AIM Counselor Series Trust (Invesco Counselor Series Trust) and Shareholders of Invesco Pennsylvania Tax Free Income Fund
Opinion on the Financial Statements
We have audited the accompanying statement of assets and liabilities, including the schedule of investments, of Invesco Pennsylvania Tax Free Income Fund (one of the funds constituting AIM Counselor Series Trust (Invesco Counselor Series Trust), hereafter referred to as the "Fund") as of August 31, 2019, the related statements of operations and of cash flows for the year ended August 31, 2019, the statement of changes in net assets for each of the two years in the period ended August 31, 2019, including the related notes, and the financial highlights for each of the periods indicated therein (collectively referred to as the "financial statements"). In our opinion, the financial statements present fairly, in all material respects, the financial position of the Fund as of August 31, 2019, the results of its operations and its cash flows for the year then ended, the changes in its net assets for each of the two years in the period ended August 31, 2019 and the financial highlights for each of the periods indicated therein in conformity with accounting principles generally accepted in the United States of America.
Basis for Opinion
These financial statements are the responsibility of the Fund’s management. Our responsibility is to express an opinion on the Fund’s financial statements based on our audits. We are a public accounting firm registered with the Public Company Accounting Oversight Board (United States) (PCAOB) and are required to be independent with respect to the Fund in accordance with the U.S. federal securities laws and the applicable rules and regulations of the Securities and Exchange Commission and the PCAOB.
We conducted our audits of these financial statements in accordance with the standards of the PCAOB. Those standards require that we plan and perform the audit to obtain reasonable assurance about whether the financial statements are free of material misstatement, whether due to error or fraud.
Our audits included performing procedures to assess the risks of material misstatement of the financial statements, whether due to error or fraud, and performing procedures that respond to those risks. Such procedures included examining, on a test basis, evidence regarding the amounts and disclosures in the financial statements. Our audits also included evaluating the accounting principles used and significant estimates made by management, as well as evaluating the overall presentation of the financial statements. Our procedures included confirmation of securities owned as of August 31, 2019 by correspondence with the custodian and brokers; when replies were not received from brokers, we performed other auditing procedures. We believe that our audits provide a reasonable basis for our opinion.
/s/ PricewaterhouseCoopers LLP
Houston, Texas
October 29, 2019
We have served as the auditor of one or more of the investment companies in the Invesco group of investment companies since at least 1995. We have not been able to determine the specific year we began serving as auditor.
| 29 | Invesco Pennsylvania Tax Free Income Fund |
Calculating your ongoing Fund expenses
Example
As a shareholder of the Fund, you incur two types of costs: (1) transaction costs, which may include sales charges (loads) on purchase payments or contingent deferred sales charges on redemptions, if any; and (2) ongoing costs, including management fees, distribution and/or service (12b-1) fees, and other Fund expenses. This example is intended to help you understand your ongoing costs (in dollars) of investing in the Fund and to compare these costs with ongoing costs of investing in other mutual funds. The example is based on an investment of $1,000 invested at the beginning of the period and held for the entire period March 1, 2019 through August 31, 2019.
Actual expenses
The table below provides information about actual account values and actual expenses. You may use the information in this table, together with the amount you invested, to estimate the expenses that you paid over the period. Simply divide your account value by $1,000 (for example, an $8,600 account value divided by $1,000 = 8.6), then multiply the result by the number in the table under the heading entitled “Actual Expenses Paid During Period” to estimate the expenses you paid on your account during this period.
Hypothetical example for comparison purposes
The table below also provides information about hypothetical account values and hypothetical expenses based on the Fund’s actual expense ratio and an assumed rate of return of 5% per year before expenses, which is not the Fund’s actual return.
The hypothetical account values and expenses may not be used to estimate the actual ending account balance or expenses you paid for the period. You may use this information to compare the ongoing costs of investing in the Fund and other funds. To do so, compare this 5% hypothetical example with the 5% hypothetical examples that appear in the shareholder reports of the other funds.
Please note that the expenses shown in the table are meant to highlight your ongoing costs only and do not reflect any transaction costs, such as sales charges (loads) on purchase payments or contingent deferred sales charges on redemptions, if any. Therefore, the hypothetical information is useful in comparing ongoing costs only, and will not help you determine the relative total costs of owning different funds. In addition, if these transaction costs were included, your costs would have been higher.
| | Beginning
Account Value (03/01/19) | ACTUAL | HYPOTHETICAL
(5% annual return before
expenses) | Annualized
Expense
Ratio |
Ending
Account Value
(08/31/19)1 | Expenses
Paid During
Period2 | Ending
Account Value
(08/31/19) | Expenses
Paid During
Period2 |
| Class A | $1,000.00 | $1,060.60 | $6.39 | $1,019.00 | $6.26 | 1.23% |
| Class C | 1,000.00 | 1,056.70 | 10.26 | 1,015.22 | 10.06 | 1.98 |
| Class Y | 1,000.00 | 1,061.20 | 5.09 | 1,020.27 | 4.99 | 0.98 |
| Class R6 | 1,000.00 | 1,061.60 | 4.78 | 1,020.57 | 4.69 | 0.92 |
| 1 | The actual ending account value is based on the actual total return of the Fund for the period March 1, 2019 through August 31, 2019, after actual expenses and will differ from the hypothetical ending account value which is based on the Fund’s expense ratio and a hypothetical annual return of 5% before expenses. |
| 2 | Expenses are equal to the Fund’s annualized expense ratio as indicated above multiplied by the average account value over the period, multiplied by 184/365 to reflect the most recent fiscal half year. |
| 30 | Invesco Pennsylvania Tax Free Income Fund |
Approval of Investment Advisory and Sub-Advisory Contracts
At meetings held on June 10, 2019, the Board of Trustees (the Board or the Trustees) of AIM Counselor Series Trust (Invesco Counselor Series Trust) as a whole, and the independent Trustees, who comprise over 75% of the Board, voting separately, approved the continuance of the Invesco Pennsylvania Tax Free Income Fund’s (the Fund) Master Investment Advisory Agreement with Invesco Advisers, Inc. (Invesco Advisers and the investment advisory agreement) and the Master IntergroupSub-Advisory Contract for Mutual Funds with Invesco Asset Management Deutschland GmbH, Invesco Asset Management Limited, Invesco Asset Management (Japan) Limited, Invesco Hong Kong Limited, Invesco Senior Secured Management, Inc. and Invesco Canada Ltd. and separatesub-advisory contracts with Invesco Capital Management LLC and Invesco Asset Management (India) Private Limited (collectively, the AffiliatedSub-Advisers and thesub-advisory contracts) for another year, effective July 1, 2019. After evaluating the factors discussed below, among others, the Board approved the renewal of the Fund’s investment advisory agreement and thesub-advisory contracts and determined that the compensation payable by the Fund to Invesco Advisers and by Invesco Advisers to the AffiliatedSub-Advisers is fair and reasonable.
The Board’s Evaluation Process
The Board’s Investments Committee has established threeSub-Committees, which meet throughout the year to review the performance of funds advised by Invesco Advisers (the Invesco Funds). As part of a regularly scheduled basis ofin-person Board meetings, theSub-Committees meet with portfolio managers for their assigned Invesco Funds and other members of management to review detailed information about investment performance and portfolio attributes of these funds. The Board took into account evaluations and reports that it received from the Investments Committee andSub-Committees, as well as the information provided to such committees and the Board throughout the year, in considering whether to approve each Invesco Fund’s investment advisory agreement andsub-advisory contracts.
As part of the contract renewal process, the Board reviews and considers information provided in response to detailed requests for information submitted to management by the independent Trustees with assistance from legal counsel to the independent Trustees. The Board receives comparative investment performance and fee data regarding the Invesco Funds prepared by Invesco Advisers and Broadridge Financial Solutions, Inc. (Broadridge), an independent mutual fund data provider. The Board also receives an independent written evaluation from the Senior Officer, an officer of the Invesco Funds who reports directly to the
independent Trustees. The Senior Officer’s evaluation is prepared as part of his responsibility to manage the process by which the Invesco Funds’ proposed management fees are negotiated during the annual contract renewal process to ensure they are negotiated in a manner that is at arms’ length and reasonable. In addition to meetings with Invesco Advisers and fund counsel throughout the year, the independent Trustees also discuss the continuance of the investment advisory agreement andsub-advisory contracts in separate sessions with the Senior Officer and with independent legal counsel.
The discussion below is a summary of the Senior Officer’s independent written evaluation with respect to the Fund’s investment advisory agreement, as well as a discussion of the material factors and related conclusions that formed the basis for the Board’s approval of the Fund’s investment advisory agreement andsub-advisory contracts. The Trustees’ review and conclusions are based on the comprehensive consideration of all information presented to them during the course of the year and in prior years and are not the result of any single determinative factor. Moreover, one Trustee may have weighed a particular piece of information or factor differently than another Trustee. This information is current as of June 10, 2019.
Factors and Conclusions and Summary of Independent Written Fee Evaluation
| A. | Nature, Extent and Quality of Services Provided by Invesco Advisers and the AffiliatedSub-Advisers |
The Board reviewed the nature, extent and quality of the advisory services provided to the Fund by Invesco Advisers under the Fund’s investment advisory agreement, and the credentials and experience of the officers and employees of Invesco Advisers who provide these services, including the Fund’s portfolio manager(s). The Board’s review included consideration of Invesco Advisers’ investment process oversight and structure, credit analysis and investment risk management. The Board also considerednon-advisory services that Invesco Advisers and its affiliates provide to the Invesco Funds such as various back office support functions, third party oversight, internal audit, valuation, portfolio trading and legal and compliance. The Board also received and reviewed information about Invesco Advisers’ role as administrator of the Invesco Funds’ liquidity risk management program. The Board also reviewed and considered the benefits to shareholders of investing in a fund that is part of the Invesco family of funds under the umbrella of Invesco Ltd., Invesco Advisers’ parent company, and noted Invesco Ltd.’s depth and experience in conducting an investment management business, as well as its
commitment of financial and other resources to such business. The Board reviewed and considered information about the resources that Invesco Advisers intends to continue to commit to managing the Invesco family of funds following Invesco Ltd.’s acquisition of OppenheimerFunds, Inc. and its subsidiaries. The Board concluded that the nature, extent and quality of the services provided to the Fund by Invesco Advisers are appropriate and satisfactory.
The Board reviewed the services that may be provided by the AffiliatedSub-Advisers under thesub-advisory contracts and the credentials and experience of the officers and employees of the AffiliatedSub-Advisers who provide these services. The Board noted the AffiliatedSub-Advisers’ expertise with respect to certain asset classes and that the AffiliatedSub-Advisers have offices and personnel that are located in financial centers around the world. As a result, the Board noted that the AffiliatedSub-Advisers can provide research and investment analysis on the markets and economies of various countries in which the Fund may invest, make recommendations regarding securities and assist with security trades. The Board concluded that thesub-advisory contracts may benefit the Fund and its shareholders by permitting Invesco Advisers to use the resources and talents of the AffiliatedSub-Advisers in managing the Fund. The Board concluded that the nature, extent and quality of the services that may be provided by the AffiliatedSub-Advisers are appropriate and satisfactory.
| B. | Fund Investment Performance |
The Board considered Fund investment performance as a relevant factor in considering whether to approve the investment advisory agreement. The Board did not view Fund investment performance as a relevant factor in considering whether to approve thesub-advisory contracts for the Fund, as no AffiliatedSub-Adviser currently manages assets of the Fund.
The Board compared the Fund’s investment performance over multiple time periods ending December 31, 2018 to the performance of funds in the Broadridge performance universe and against the Lipper Pennsylvania Municipal Debt Funds Index. The Board noted that performance of Class A shares of the Fund was in the third quintile of its perfomance universe for the one year period and the second quintile for the three and five year periods (the first quintile being the best performing funds and the fifth quintile being the worst performing funds). The Board noted that performance of Class A shares of the Fund was below the performance of the Index for the one and three year periods and reasonably comparable to the performance of the Index for the five year period. The Trustees also reviewed more recent Fund
31 Invesco Pennsylvania Tax Free Income Fund
performance and this review did not change their conclusions.
| C. | Advisory andSub-Advisory Fees and Fund Expenses |
The Board compared the Fund’s contractual management fee rate to the contractual management fee rates of funds in the Fund’s Broadridge expense group. The Board noted that the contractual management fee rate for Class A shares of the Fund was above the median contractual management fee rate of funds in its expense group. The Board noted that the term “contractual management fee” for funds in the expense group may include both advisory and certainnon-portfolio management administrative services fees, but that Broadridge does not provide information on a fund by fund basis as to what is included. The Board also reviewed the methodology used by Broadridge in providing expense group information, which includes using each fund’s contractual management fee schedule (including any applicable breakpoints) as reported in the most recent prospectus or statement of additional information for each fund in the expense group. The Board also considered comparative information regarding the Fund’s total expense ratio and its various components. The Board noted that the Fund’s actual and contractual management fees and total expense ratio were in the fourth, fourth and fifth quintiles of its expense group, respectively, and discussed with management reasons for such relative actual and contractual management fees and total expenses.
The Board noted that Invesco Advisers has contractually agreed to waive fees and/or limit expenses of the Fund for the term disclosed in the Fund’s registration statement in an amount necessary to limit total annual operating expenses to a specified percentage of average daily net assets for each class of the Fund.
The Board noted that Invesco Advisers and the AffiliatedSub-Advisers do not manage other similarly managed mutual funds or client accounts.
The Board also considered the services that may be provided by the AffiliatedSub-Advisers pursuant to thesub-advisory contracts, as well as the fees payable by Invesco Advisers to the AffiliatedSub-Advisers pursuant to thesub-advisory contracts.
| D. | Economies of Scale and Breakpoints |
The Board considered the extent to which there may be economies of scale in the provision of advisory services to the Fund. The Board considered Invesco’s reinvestment in its business, including investments in business infrastructure and cybersecurity. The Board also considered that the Fund may benefit from economies of scale through contractual breakpoints in the Fund’s advisory fee schedule, which generally operate to reduce the Fund’s expense ratio as it grows in size. The Board noted that the Fund shares directly in economies of scale through lower fees charged by third party service providers based on the combined size of the Invesco Funds. The Board
noted that the Fund may also benefit from economies of scale through initial fee setting, fee waivers and expense reimbursements.
| E. | Profitability and Financial Resources |
The Board reviewed information from Invesco Advisers concerning the costs of the advisory and other services that Invesco Advisers and its affiliates provide to the Fund and the Invesco Funds and the profitability of Invesco Advisers and its affiliates in providing these services. The Board considered the methodology used for calculating profitability and noted the periodic review of such methodology by an independent consultant. The Board noted that Invesco Advisers continues to operate at a net profit from services Invesco Advisers and its affiliates provide to the Invesco Funds and the Fund. The Board did not deem the level of profits realized by Invesco Advisers and its affiliates from providing services to the Fund to be excessive given the nature, extent and quality of the services provided. The Board received information from Invesco Advisers demonstrating that Invesco Advisers and the AffiliatedSub-Advisers are financially sound and have the resources necessary to perform their obligations under the investment advisory agreement andsub-advisory contracts.
| F. | Collateral Benefits to Invesco Advisers and its Affiliates |
The Board considered various other benefits received by Invesco Advisers and its affiliates from the relationship with the Fund, including the fees received for providing administrative, transfer agency and distribution services to the Fund. The Board considered comparative information regarding fees charged for these services, including information provided by Broadridge and other independent sources. The Board considered the performance of Invesco Advisers and its affiliates in providing these services and the organizational structure employed to provide these services. The Board also considered that these services are provided to the Fund pursuant to written contracts that are reviewed and approved on an annual basis by the Board; and that the services are required for the operation of the Fund.
The Board considered the benefits realized by Invesco Advisers and the AffiliatedSub-Advisers as a result of portfolio brokerage transactions executed through “soft dollar” arrangements. Invesco Advisers noted that the Fund does not execute brokerage transactions through “soft dollar” arrangements to any significant degree.
The Board considered that the Fund’s uninvested cash and cash collateral from any securities lending arrangements may be invested in money market funds advised by Invesco Advisers pursuant to procedures approved by the Board. The Board considered information regarding the returns of the affiliated money market funds relative to comparable overnight investments, as well as the costs to the Fund of such investments. The Board noted that Invesco Advisers receives advisory fees from these affiliated money market funds attributable to such investments,
although Invesco Advisers has contractually agreed to waive through varying periods the advisory fees payable by the Invesco Funds with respect to certain investments in the affiliated money market funds. The waiver is in an amount equal to 100% of the net advisory fee Invesco Advisers receives from the affiliated money market funds with respect to the Fund’s investment in the affiliated money market funds of uninvested cash, but not cash collateral. The Board concluded that the amount of advisory fees received by Invesco Advisers from the Fund’s investment of cash collateral from any securities lending arrangements in the affiliated money market funds is fair and reasonable.
32 Invesco Pennsylvania Tax Free Income Fund
Tax Information
Form 1099-DIV, Form 1042-S and other year–end tax information provide shareholders with actual calendar year amounts that should be included in their tax returns. Shareholders should consult their tax advisers.
The following distribution information is being provided as required by the Internal Revenue Code or to meet a specific state’s requirement.
The Fund designates the following amounts or, if subsequently determined to be different, the maximum amount allowable for its fiscal year ended August 31, 2019:
| Federal and State Income Tax | |
| Qualified Dividend Income* | 0% |
| Corporate Dividends Received Deduction* | 0% |
| U.S. Treasury Obligations* | 0% |
| Tax-Exempt Interest Dividends* | 100% |
| * | The above percentages are based on ordinary income dividends paid to shareholders during the Fund’s fiscal year. |
| 33 | Invesco Pennsylvania Tax Free Income Fund |
Trustees and Officers
The address of each trustee and officer is AIM Counselor Series Trust (Invesco Counselor Series Trust) (the “Trust”), 11 Greenway Plaza, Suite 1000, Houston, Texas 77046-1173. The trustees serve for the life of the Trust, subject to their earlier death, incapacitation, resignation, retirement or removal as more specifically provided in the Trust’s organizational documents. Each officer serves for a one year term or until their successors are elected and qualified. Column two below includes length of time served with predecessor entities, if any.
| | | | | | | | |
Name, Year of Birth and Position(s) Held with the Trust | | Trustee and/ or Officer Since | | Principal Occupation(s) During Past 5 Years | | Number of Funds in Fund
Complex
Overseen by
Trustee | | Other Directorship(s) Held by Trustee During Past 5 Years |
| Interested Persons | | | | | | | | |
Martin L. Flanagan1 — 1960 Trustee and Vice Chair | | 2007 | | Executive Director, Chief Executive Officer and President, Invesco Ltd. (ultimate parent of Invesco and a global investment management firm); Trustee and Vice Chair, The Invesco Funds; Vice Chair, Investment Company Institute; and Member of Executive Board, SMU Cox School of Business Formerly: Advisor to the Board, Invesco Advisers, Inc. (formerly known as Invesco Institutional (N.A.), Inc.); Chairman and Chief Executive Officer, Invesco Advisers, Inc. (registered investment adviser); Director, Chairman, Chief Executive Officer and President, Invesco Holding Company (US), Inc. (formerly IVZ Inc.) (holding company), Invesco Group Services, Inc. (service provider) and Invesco North American Holdings, Inc. (holding company); Director, Chief Executive Officer and President, Invesco Holding Company Limited (parent of Invesco and a global investment management firm); Director, Invesco Ltd.; Chairman, Investment Company Institute and President,Co-Chief Executive Officer,Co-President, Chief Operating Officer and Chief Financial Officer, Franklin Resources, Inc. (global investment management organization) | | 229 | | None |
Philip A. Taylor2 — 1954 Trustee | | 2006 | | Vice Chair, Invesco Ltd.; Trustee, The Invesco Funds Formerly: Director, Invesco Canada Ltd. (formerly known as Invesco Trimark Ltd./Invesco Trimark Ltèe) (registered investment adviser and registered transfer agent); Head of the Americas and Senior Managing Director, Invesco Ltd.; Director, Invesco Advisers, Inc. (formerly known as Invesco Institutional (N.A.), Inc.) (registered investment adviser); Director and Chairman, Invesco Investment Services, Inc. (formerly known as Invesco AIM Investment Services, Inc.) (registered transfer agent); Chief Executive Officer, Invesco Corporate Class Inc. (corporate mutual fund company); Chairman and Chief Executive Officer, Invesco Canada Ltd. (formerly known as Invesco Trimark Ltd./Invesco Trimark Ltèe) (registered investment adviser and registered transfer agent); Senior Vice President, The Invesco Funds; Director, Invesco Investment Advisers LLC (formerly known as Van Kampen Asset Management); Director, Chairman, Chief Executive Officer and President, Invesco Management Group, Inc. (formerly known as Invesco AIM Management Group, Inc.) (financial services holding company);Co-Chairman,Co-President andCo-Chief Executive Officer, Invesco Advisers, Inc. (formerly known as Invesco Institutional (N.A.), Inc.) (registered investment adviser); Director, Chief Executive Officer and President, Van Kampen Exchange Corp; President and Principal Executive Officer, The Invesco Funds (other than AIM Treasurer’s Series Trust (Invesco Treasurer’s Series Trust), Short-Term Investments Trust and Invesco Management Trust); Executive Vice President, The Invesco Funds (AIM Treasurer’s Series Trust (Invesco Treasurer’s Series Trust), Short-Term Investments Trust and Invesco Management Trust only); Director and President, INVESCO Funds Group, Inc. (registered investment adviser and registered transfer agent); Director and Chairman, IVZ Distributors, Inc. (formerly known as INVESCO Distributors, Inc.) (registered broker dealer); Director, President and Chairman, Invesco Inc. (holding company), Invesco Canada Holdings Inc. (holding company), Trimark Investments Ltd./Placements Trimark Ltèe and Invesco Financial Services Ltd/Services Financiers Invesco Ltèe; Chief Executive Officer, Invesco Canada Fund Inc. (corporate mutual fund company); Director and Chairman, Van Kampen Investor Services Inc.; Director, Chief Executive Officer and President, 1371 Preferred Inc. (holding company) and Van Kampen Investments Inc.; Director and President, AIM GP Canada Inc. (general partner for limited partnerships) and Van Kampen Advisors, Inc.; Director and Chief Executive Officer, Invesco Trimark Dealer Inc. (registered broker dealer); Director, Invesco Distributors, Inc. (formerly known as Invesco AIM Distributors, Inc.) (registered broker dealer); Manager, Invesco Capital Management LLC; Director, Chief Executive Officer and President, Invesco Advisers, Inc.; Director, Chairman, Chief Executive Officer and President, Invesco AIM Capital Management, Inc.; President, Invesco Trimark Dealer Inc. and Invesco Trimark Ltd./Invesco Trimark Ltèe; Director and President, AIM Trimark Corporate Class Inc. and AIM Trimark Canada Fund Inc.; Senior Managing Director, Invesco Holding Company Limited; Director and Chairman, Fund Management Company (former registered broker dealer); President and Principal Executive Officer, The Invesco Funds (AIM Treasurer’s Series Trust (Invesco Treasurer’s Series Trust), and Short-Term Investments Trust only); President, AIM Trimark Global Fund Inc. and AIM Trimark Canada Fund Inc. | | 229 | | None |
| 1 | Mr. Flanagan is considered an interested person (within the meaning of Section 2(a)(19) of the 1940 Act) of the Trust because he is an officer of the Adviser to the Trust, and an officer and a director of Invesco Ltd., ultimate parent of the Adviser. |
| 2 | Mr. Taylor is considered an interested person (within the meaning of Section 2(a)(19) of the 1940 Act) of the Trust because he is an officer of Invesco Ltd., ultimate parent of the Adviser. |
T-1 Invesco Pennsylvania Tax Free Income Fund
Trustees and Officers—(continued)
| | | | | | | | |
Name, Year of Birth and Position(s) Held with the Trust | | Trustee and/ or Officer Since | | Principal Occupation(s)
During Past 5 Years | | Number of
Funds in Fund
Complex
Overseen by
Trustee | | Other Directorship(s) Held by Trustee During
Past 5 Years |
| Independent Trustees | | | | | | | | |
Bruce L. Crockett — 1944 Trustee and Chair | | 2003 | | Chairman, Crockett Technologies Associates (technology consulting company) Formerly: Director, Captaris (unified messaging provider); Director, President and Chief Executive Officer, COMSAT Corporation; Chairman, Board of Governors of INTELSAT (international communications company); ACE Limited (insurance company); Independent Directors Council and Investment Company Institute: Member of the Audit Committee, Investment Company Institute; Member of the Executive Committee and Chair of the Governance Committee, Independent Directors Council | | 229 | | Director and Chairman of the Audit Committee, ALPS (Attorneys Liability Protection Society) (insurance company); Director and Member of the Audit Committee and Compensation Committee, Ferroglobe PLC (metallurgical company) |
David C. Arch — 1945 Trustee | | 2010 | | Chairman of Blistex Inc. (consumer health care products manufacturer); Member, World Presidents’ Organization | | 229 | | Board member of the Illinois Manufacturers’ Association |
Beth Ann Brown — 1968 Trustee | | 2019 | | Independent Consultant Formerly: Head of Intermediary Distribution, Managing Director, Strategic Relations, Managing Director, Head of National Accounts, Senior Vice President, National Account Manager and Senior Vice President, Key Account Manager, Columbia Management Investment Advisers LLC; Vice President, Key Account Manager, Liberty Funds Distributor, Inc.; and Trustee of certain Oppenheimer Funds | | 229 | | Director, Board of Directors of Caron Engineering Inc.; Advisor, Board of Advisors of Caron Engineering Inc.; President and Director, Acton Shapleigh Youth Conservation Corps (non -profit); and Vice President and Director of Grahamtastic Connection(non-profit) |
Jack M. Fields — 1952 Trustee | | 2003 | | Chief Executive Officer, Twenty First Century Group, Inc. (government affairs company); and Chairman, Discovery Learning Alliance(non-profit) Formerly: Owner and Chief Executive Officer, Dos Angeles Ranch L.P. (cattle, hunting, corporate entertainment); Director, Insperity, Inc. (formerly known as Administaff) (human resources provider); Chief Executive Officer, Texana Timber LP (sustainable forestry company); Director of Cross Timbers Quail Research Ranch(non-profit); and member of the U.S. House of Representatives | | 229 | | None |
Cynthia Hostetler — 1962 Trustee | | 2017 | | Non-Executive Director and Trustee of a number of public and private business corporations Formerly: Director, Aberdeen Investment Funds (4 portfolios); Head of Investment Funds and Private Equity, Overseas Private Investment Corporation; President, First Manhattan Bancorporation, Inc.; Attorney, Simpson Thacher & Bartlett LLP | | 229 | | Vulcan Materials Company (construction materials company); Trilinc Global Impact Fund; Genesee & Wyoming, Inc. (railroads); Artio Global Investment LLC (mutual fund complex); Edgen Group, Inc. (specialized energy and infrastructure products distributor); Investment Company Institute (professional organization); Independent Directors Council (professional organization) |
Eli Jones — 1961 Trustee | | 2016 | | Professor and Dean, Mays Business School — Texas A&M University Formerly: Professor and Dean, Walton College of Business, University of Arkansas and E.J. Ourso College of Business, Louisiana State University; Director, Arvest Bank | | 229 | | Insperity, Inc. (formerly known as Administaff) (human resources provider) |
Elizabeth Krentzman — 1959 Trustee | | 2019 | | Formerly: Principal and Chief Regulatory Advisor for Asset Management Services and U.S. Mutual Fund Leader of Deloitte & Touche LLP; General Counsel of the Investment Company Institute (trade association); National Director of the Investment Management Regulatory Consulting Practice, Principal, Director and Senior Manager of Deloitte & Touche LLP; Assistant Director of the Division of Investment Management — Office of Disclosure and Investment Adviser Regulation of the U.S. Securities and Exchange Commission and various positions with the Division of Investment Management — Office of Regulatory Policy of the U.S. Securities and Exchange Commission; Associate at Ropes & Gray LLP; Advisory Board Member of the Securities and Exchange Commission Historical Society; and Trustee of certain Oppenheimer Funds | | 229 | | Trustee of the University of Florida National Board Foundation and Audit Committee Member; Member of the Cartica Funds Board of Directors (private investment funds); Member of the University of Florida Law Center Association, Inc. Board of Trustees and Audit Committee Member |
Anthony J. LaCava, Jr. — 1956 Trustee | | 2019 | | Formerly: Director and Member of the Audit Committee, Blue Hills Bank (publicly traded financial institution) and Managing Partner, KPMG LLP | | 229 | | Blue Hills Bank; Chairman, Bentley University; Member, Business School Advisory Council; and Nominating Committee, KPMG LLP |
T-2 Invesco Pennsylvania Tax Free Income Fund
Trustees and Officers—(continued)
| | | | | | | | |
Name, Year of Birth and Position(s) Held with the Trust | | Trustee and/ or Officer Since | | Principal Occupation(s)
During Past 5 Years | | Number of
Funds in Fund
Complex
Overseen by
Trustee | | Other Directorship(s) Held by Trustee During
Past 5 Years |
| Independent Trustees—(continued) |
Prema Mathai-Davis — 1950 Trustee | | 2003 | | Retired Co-Owner & Partner of Quantalytics Research, LLC, (a FinTech Investment Research Platform for the Self-Directed Investor) | | 229 | | None |
Joel W. Motley — 1952 Trustee | | 2019 | | Director of Office of Finance, Federal Home Loan Bank; Member of the Vestry of Trinity Wall Street; Managing Director of Carmona Motley Inc. (privately held financial advisor); Member of the Finance and Budget Committee of the Council on Foreign Relations, Member of the Investment Committee and Board of Human Rights Watch and Member of the Investment Committee and Board of Historic Hudson Valley(non-profit cultural organization) Formerly: Managing Director of Public Capital Advisors, LLC (privately held financial advisor); Managing Director of Carmona Motley Hoffman, Inc. (privately held financial advisor); Trustee of certain Oppenheimer Funds; and Director of Columbia Equity Financial Corp. (privately held financial advisor) | | 229 | | Director of Greenwall Foundation (bioethics research foundation); Member of Board and Investment Committee of The Greenwall Foundation; Director of Southern Africa Legal Services Foundation; Board Member and Investment Committee Member of Pulitzer Center for Crisis Reporting(non-profit journalism) |
Teresa M. Ressel — 1962 Trustee | | 2017 | | Non-executive director and trustee of a number of public and private business corporations Formerly: Chief Financial Officer, Olayan America, The Olayan Group (international investor/commercial/industrial); Chief Executive Officer, UBS Securities LLC; Group Chief Operating Officer, Americas, UBS AG; Assistant Secretary for Management & Budget and CFO, US Department of the Treasury | | 229 | | Atlantic Power Corporation (power generation company); ON Semiconductor Corp. (semiconductor supplier) |
Ann Barnett Stern — 1957 Trustee | | 2017 | | President and Chief Executive Officer, Houston Endowment Inc. (private philanthropic institution) Formerly: Executive Vice President and General Counsel, Texas Children’s Hospital; Attorney, Beck, Redden and Secrest, LLP; Business Law Instructor, University of St. Thomas; Attorney, Andrews & Kurth LLP | | 229 | | Federal Reserve Bank of Dallas |
Raymond Stickel, Jr. — 1944 Trustee | | 2005 | | Retired Formerly: Director, Mainstay VP Series Funds, Inc. (25 portfolios); Partner, Deloitte & Touche | | 229 | | None |
Robert C. Troccoli — 1949 Trustee | | 2016 | | Retired Formerly: Adjunct Professor, University of Denver — Daniels College of Business; Senior Partner, KPMG LLP | | 229 | | None |
Daniel S. Vandivort — 1954 Trustee | | 2019 | | Treasurer, Chairman of the Audit and Finance Committee, and Trustee, Board of Trustees, Huntington Disease Foundation of America; and President, Flyway Advisory Services LLC (consulting and property management) Formerly: Trustee and Governance Chair, of certain Oppenheimer Funds | | 229 | | Chairman and Lead Independent Director, Chairman of the Audit Committee, and Director, Board of Directors, Value Line Funds |
James D. Vaughn — 1945 Trustee | | 2019 | | Retired Formerly: Managing Partner, Deloitte & Touche LLP; Trustee and Chairman of the Audit Committee, Schroder Funds; Board Member, Mile High United Way, Boys and Girls Clubs, Boy Scouts, Colorado Business Committee for the Arts, Economic Club of Colorado and Metro Denver Network (economic development corporation); and Trustee of certain Oppenheimer Funds | | 229 | | Board member and Chairman of Audit Committee of AMG National Trust Bank; Trustee and Investment Committee member, University of South Dakota Foundation; Board member, Audit Committee Member and past Board Chair, Junior Achievement(non-profit) |
Christopher L. Wilson — 1957 Trustee, Vice Chair and Chair Designate | | 2017 | | Retired Formerly: Director, TD Asset Management USA Inc. (mutual fund complex) (22 portfolios); Managing Partner, CT2, LLC (investing and consulting firm); President/Chief Executive Officer, Columbia Funds, Bank of America Corporation; President/Chief Executive Officer, CDC IXIS Asset Management Services, Inc.; Principal & Director of Operations, Scudder Funds, Scudder, Stevens & Clark, Inc.; Assistant Vice President, Fidelity Investments | | 229 | | ISO New England, Inc.(non-profit organization managing regional electricity market) |
T-3 Invesco Pennsylvania Tax Free Income Fund
Trustees and Officers—(continued)
| | | | | | | | |
Name, Year of Birth and Position(s) Held with the Trust | | Trustee and/ or Officer Since | | Principal Occupation(s)
During Past 5 Years | | Number of
Funds in Fund
Complex
Overseen by
Trustee | | Other Directorship(s) Held by Trustee During
Past 5 Years |
| Other Officers | | | | | | | | |
Sheri Morris — 1964 President, Principal Executive Officer and Treasurer | | 2003 | | President, Principal Executive Officer and Treasurer, The Invesco Funds; Vice President, Invesco Advisers, Inc. (formerly known as Invesco Institutional (N.A.), Inc.) (registered investment adviser); and Vice President, Invesco Exchange-Traded Fund Trust, Invesco Exchange-Traded Fund Trust II, Invesco India Exchange-Traded Fund Trust, Invesco Actively Managed Exchange-Traded Fund Trust, Invesco Actively Managed Exchange-Traded Commodity Fund Trust and Invesco Exchange-Traded Self-Indexed Fund Trust; and Vice President, OppenheimerFunds, Inc. Formerly: Vice President and Principal Financial Officer, The Invesco Funds; Vice President, Invesco AIM Advisers, Inc., Invesco AIM Capital Management, Inc. and Invesco AIM Private Asset Management, Inc.; Assistant Vice President and Assistant Treasurer, The Invesco Funds and Assistant Vice President, Invesco Advisers, Inc., Invesco AIM Capital Management, Inc. and Invesco AIM Private Asset Management, Inc.; and Treasurer, Invesco Exchange-Traded Fund Trust, Invesco Exchange-Traded Fund Trust II, Invesco India Exchange-Traded Fund Trust and Invesco Actively Managed Exchange-Traded Fund Trust | | N/A | | N/A |
Russell C. Burk — 1958 Senior Vice President and Senior Officer | | 2005 | | Senior Vice President and Senior Officer, The Invesco Funds | | N/A | | N/A |
Jeffrey H. Kupor — 1968 Senior Vice President, Chief Legal Officer and Secretary | | 2018 | | Head of Legal of the Americas, Invesco Ltd.; Senior Vice President and Secretary, Invesco Advisers, Inc. (formerly known as Invesco Institutional (N.A.), Inc.) (registered investment adviser); Senior Vice President and Secretary, Invesco Distributors, Inc. (formerly known as Invesco AIM Distributors, Inc.); Vice President and Secretary, Invesco Investment Services, Inc. (formerly known as Invesco AIM Investment Services, Inc.) Senior Vice President, Chief Legal Officer and Secretary, The Invesco Funds; Secretary and General Counsel, Invesco Investment Advisers LLC (formerly known as Van Kampen Asset Management); Secretary and General Counsel, Invesco Capital Markets, Inc. (formerly known as Van Kampen Funds Inc.) and Chief Legal Officer, Invesco Exchange-Traded Fund Trust, Invesco Exchange-Traded Fund Trust II, Invesco India Exchange-Traded Fund Trust, Invesco Actively Managed Exchange-Traded Fund Trust, Invesco Actively Managed Exchange-Traded Commodity Fund Trust and Invesco Exchange-Traded Self-Indexed Fund Trust; Secretary, Invesco Indexing LLC; Secretary, W.L. Ross & Co., LLC Formerly: Secretary and Vice President, Jemstep, Inc.; Head of Legal, Worldwide Institutional, Invesco Ltd.; Secretary and General Counsel, INVESCO Private Capital Investments, Inc.; Senior Vice President, Secretary and General Counsel, Invesco Management Group, Inc. (formerly known as Invesco AIM Management Group, Inc.); Assistant Secretary, INVESCO Asset Management (Bermuda) Ltd.; Secretary and General Counsel, Invesco Private Capital, Inc.; Assistant Secretary and General Counsel, INVESCO Realty, Inc.; Secretary and General Counsel, Invesco Senior Secured Management, Inc.; and Secretary, Sovereign G./P. Holdings Inc. | | N/A | | N/A |
Andrew R. Schlossberg — 1974 Senior Vice President | | 2019 | | Head of the Americas and Senior Managing Director, Invesco Ltd.; Director and Senior Vice President, Invesco Advisers, Inc. (formerly known as Invesco Institutional (N.A.), Inc.) (registered investment adviser); Director and Chairman, Invesco Investment Services, Inc. (formerly known as Invesco AIM Investment Services, Inc.) (registered transfer agent); Senior Vice President, The Invesco Funds; Director, Invesco Investment Advisers LLC (formerly known as Van Kampen Asset Management); Director, President and Chairman, Invesco Insurance Agency, Inc. Formerly: Director, Invesco UK Limited; Director and Chief Executive, Invesco Asset Management Limited and Invesco Fund Managers Limited; Assistant Vice President, The Invesco Funds; Senior Vice President, Invesco Advisers, Inc. (formerly known as Invesco Institutional (N.A.), Inc.) (registered investment adviser); Director and Chief Executive, Invesco Administration Services Limited and Invesco Global Investment Funds Limited; Director, Invesco Distributors, Inc.; Head of EMEA, Invesco Ltd.; President, Invesco Actively Managed Exchange-Traded Commodity Fund Trust, Invesco Actively Managed Exchange-Traded Fund Trust, Invesco Exchange-Traded Fund Trust, Invesco Exchange-Traded Fund Trust II and Invesco India Exchange-Traded Fund Trust; Managing Director and Principal Executive Officer, Invesco Capital Management LLC | | N/A | | N/A |
T-4 Invesco Pennsylvania Tax Free Income Fund
Trustees and Officers—(continued)
| | | | | | | | |
Name, Year of Birth and Position(s) Held with the Trust | | Trustee and/ or Officer Since | | Principal Occupation(s)
During Past 5 Years | | Number of
Funds in Fund
Complex
Overseen by
Trustee | | Other Directorship(s) Held by Trustee During
Past 5 Years |
| Other Officers—(continued) | | | | | | | | |
John M. Zerr — 1962
Senior Vice President | | 2006 | | Chief Operating Officer of the Americas; Senior Vice President, Invesco Advisers, Inc. (formerly known as Invesco Institutional (N.A.), Inc.) (registered investment adviser); Senior Vice President, Invesco Distributors, Inc. (formerly known as Invesco AIM Distributors, Inc.); Director and Vice President, Invesco Investment Services, Inc. (formerly known as Invesco AIM Investment Services, Inc.) Senior Vice President, The Invesco Funds; Managing Director, Invesco Capital Management LLC; Director, Invesco Investment Advisers LLC (formerly known as Van Kampen Asset Management); Senior Vice President, Invesco Capital Markets, Inc. (formerly known as Van Kampen Funds Inc.); Manager, Invesco Indexing LLC; Manager, Invesco Specialized Products, LLC; Director and Senior Vice President, Invesco Insurance Agency, Inc.; Member, Invesco Canada Funds Advisory Board; Director, President and Chief Executive Officer, Invesco Corporate Class Inc. (corporate mutual fund company); and Director, Chairman, President and Chief Executive Officer, Invesco Canada Ltd. (formerly known as Invesco Trimark Ltd./Invesco Trimark Ltèe) (registered investment adviser and registered transfer agent) Formerly: Director and Senior Vice President, Invesco Management Group, Inc. (formerly known as Invesco AIM Management Group, Inc.); Secretary and General Counsel, Invesco Management Group, Inc. (formerly known as Invesco AIM Management Group, Inc.); Secretary, Invesco Investment Services, Inc. (formerly known as Invesco AIM Investment Services, Inc.); Chief Legal Officer and Secretary, The Invesco Funds; Secretary and General Counsel, Invesco Investment Advisers LLC (formerly known as Van Kampen Asset Management); Secretary and General Counsel, Invesco Capital Markets, Inc. (formerly known as Van Kampen Funds Inc.); Chief Legal Officer, Invesco Exchange-Traded Fund Trust, Invesco Exchange-Traded Fund Trust II, Invesco India Exchange-Traded Fund Trust, Invesco Actively Managed Exchange-Traded Fund Trust, Invesco Actively Managed Exchange-Traded Commodity Fund Trust and Invesco Exchange-Traded Self-Indexed Fund Trust; Secretary, Invesco Indexing LLC; Director, Secretary, General Counsel and Senior Vice President, Van Kampen Exchange Corp.; Director, Vice President and Secretary, IVZ Distributors, Inc. (formerly known as INVESCO Distributors, Inc.); Director and Vice President, INVESCO Funds Group, Inc.; Director and Vice President, Van Kampen Advisors Inc.; Director, Vice President, Secretary and General Counsel, Van Kampen Investor Services Inc.; Director and Secretary, Invesco Distributors, Inc. (formerly known as Invesco AIM Distributors, Inc.); Director, Senior Vice President, General Counsel and Secretary, Invesco AIM Advisers, Inc. and Van Kampen Investments Inc.; Director, Vice President and Secretary, Fund Management Company; Director, Senior Vice President, Secretary, General Counsel and Vice President, Invesco AIM Capital Management, Inc.; Chief Operating Officer and General Counsel, Liberty Ridge Capital, Inc. (an investment adviser) | | N/A | | N/A |
Gregory G. McGreevey — 1962 Senior Vice President | | 2012 | | Senior Managing Director, Invesco Ltd.; Director, Chairman, President, and Chief Executive Officer, Invesco Advisers, Inc. (formerly known as Invesco Institutional (N.A.), Inc.) (registered investment adviser); Director, Invesco Mortgage Capital, Inc. and Invesco Senior Secured Management, Inc.; and Senior Vice President, The Invesco Funds; and President, SNW Asset Management Corporation Formerly: Senior Vice President, Invesco Management Group, Inc. and Invesco Advisers, Inc.; Assistant Vice President, The Invesco Funds | | N/A | | N/A |
Kelli Gallegos — 1970 Vice President, Principal Financial Officer and Assistant Treasurer | | 2008 | | Assistant Treasurer, Invesco Specialized Products, LLC; Vice President, Principal Financial Officer and Assistant Treasurer, The Invesco Funds; Principal Financial and Accounting Officer — Pooled Investments, Invesco Capital Management LLC; Vice President and Treasurer, Invesco Exchange-Traded Fund Trust, Invesco Exchange-Traded Fund Trust II, Invesco India Exchange-Traded Fund Trust, Invesco Actively Managed Exchange-Traded Fund Trust, Invesco Actively Managed Exchange-Traded Commodity Fund Trust and Invesco Exchange-Traded Self-Indexed Fund Trust Formerly: Assistant Treasurer, Invesco Exchange-Traded Fund Trust, Invesco Exchange-Traded Fund Trust II, Invesco India Exchange-Traded Fund Trust, Invesco Actively Managed Exchange-Traded Fund Trust, Invesco Actively Managed Exchange-Traded Commodity Fund Trust and Invesco Exchange-Traded Self-Indexed Fund Trust; Assistant Treasurer, Invesco Capital Management LLC; Assistant Vice President, The Invesco Funds | | N/A | | N/A |
T-5 Invesco Pennsylvania Tax Free Income Fund
Trustees and Officers—(continued)
| | | | | | | | |
Name, Year of Birth and Position(s) Held with the Trust | | Trustee and/ or Officer Since | | Principal Occupation(s)
During Past 5 Years | | Number of
Funds in Fund
Complex
Overseen by
Trustee | | Other Directorship(s) Held by Trustee During
Past 5 Years |
| Other Officers—(continued) | | | | | | | | |
Crissie M. Wisdom — 1969 Anti-Money Laundering Compliance Officer | | 2013 | | Anti-Money Laundering Compliance Officer, Invesco Advisers, Inc. (formerly known as Invesco Institutional (N.A.), Inc.) (registered investment adviser), Invesco Capital Markets, Inc. (formerly known as Van Kampen Funds Inc.), Invesco Distributors, Inc., Invesco Investment Services, Inc., The Invesco Funds, and Invesco Exchange-Traded Fund Trust, Invesco Exchange-Traded Fund Trust II, Invesco India Exchange-Traded Fund Trust, Invesco Actively Managed Exchange-Traded Fund Trust, Invesco Actively Managed Exchange-Traded Commodity Fund Trust and Invesco Exchange-Traded Self-Indexed Fund Trust; Anti-Money Laundering Compliance Officer and Bank Secrecy Act Officer, INVESCO National Trust Company and Invesco Trust Company; and Fraud Prevention Manager and Controls and Risk Analysis Manager for Invesco Investment Services, Inc. Formerly: Anti-Money Laundering Compliance Officer, Van Kampen Exchange Corp. and Invesco Management Group, Inc. | | N/A | | N/A |
Robert R. Leveille — 1969 Chief Compliance Officer | | 2016 | | Chief Compliance Officer, Invesco Advisers, Inc. (registered investment adviser); and Chief Compliance Officer, The Invesco Funds Formerly: Chief Compliance Officer, Putnam Investments and the Putnam Funds | | N/A | | N/A |
The Statement of Additional Information of the Trust includes additional information about the Fund’s Trustees and is available upon request, without charge, by calling 1.800.959.4246. Please refer to the Fund’s Statement of Additional Information for information on the Fund’ssub-advisers.
| | | | | | |
Office of the Fund 11 Greenway Plaza, Suite 1000
Houston, TX 77046-1173 | | Investment Adviser Invesco Advisers, Inc.
1555 Peachtree Street, N.E.
Atlanta, GA 30309 | | Distributor Invesco Distributors, Inc.
11 Greenway Plaza, Suite 1000
Houston, TX 77046-1173 | | Auditors PricewaterhouseCoopers LLP
1000 Louisiana Street, Suite 5800 Houston, TX 77002-5021 |
| | | |
| | | | | | |
Counsel to the Fund Stradley Ronon Stevens & Young, LLP
2005 Market Street, Suite 2600
Philadelphia, PA 19103-7018 | | Counsel to the Independent Trustees Goodwin Procter LLP
901 New York Avenue, N.W.
Washington, D.C. 20001 | | Transfer Agent Invesco Investment Services, Inc.
11 Greenway Plaza, Suite 1000
Houston, TX 77046-1173 | | Custodian State Street Bank and Trust Company
225 Franklin Street
Boston, MA 02110-2801 |
T-6 Invesco Pennsylvania Tax Free Income Fund
Go paperless with eDelivery
Visit invesco.com/edelivery to enjoy the convenience and security of anytime electronic access to your investment documents.
With eDelivery, you can elect to have any or all of the following materials delivered straight to your inbox to download, save and print from your own computer:
| • | Fund reports and prospectuses |
| • | Quarterly statements |
| • | Daily confirmations |
| • | Tax forms |
Invesco mailing information
Send general correspondence to Invesco Investment Services, Inc., P.O. Box 219078, Kansas City, MO 64121-9078.
Important notice regarding delivery of security holder documents
To reduce Fund expenses, only one copy of most shareholder documents may be mailed to shareholders with multiple accounts at the same address (Householding). Mailing of your shareholder documents may be householded indefinitely unless you instruct us otherwise. If you do not want the mailing of these documents to be combined with those for other members of your household, please contact Invesco Investment Services, Inc. at 800 959 4246 or contact your financial institution. We will begin sending you individual copies for each account within 30 days after receiving your request.
Fund holdings and proxy voting information
The Fund provides a complete list of its holdings four times in each fiscal year, at the quarter-ends. For the second and fourth quarters, the list appears in the Fund’s semiannual and annual reports to shareholders. For the first and third quarters, the Fund files the lists with the Securities and Exchange Commission (SEC) as an exhibit to its reports on Form N-PORT. The most recent list of portfolio holdings is available at invesco.com/completeqtrholdings. Shareholders can also look up the Fund’s Form N-PORT filings on the SEC website, sec.gov. The SEC file numbers for the Fund are shown below.
A description of the policies and procedures that the Fund uses to determine how to vote proxies relating to portfolio securities is available without charge, upon request, from our Client Services department at 800 959 4246, or at invesco.com/proxyguidelines. The information is also available on the SEC website, sec.gov.
Information regarding how the Fund voted proxies related to its portfolio securities during the most recent 12-month period ended June 30 is available at invesco.com/proxysearch. This information is also available on the SEC website, sec.gov.
Invesco Advisers, Inc. is an investment adviser; it provides investment advisory services to individual and institutional clients and does not sell securities. Invesco Distributors, Inc. is the US distributor for Invesco Ltd.’s retail mutual funds, exchange-traded funds and institutional money market funds. Both are wholly owned, indirect subsidiaries of Invesco Ltd.
| SEC file numbers: 811-09913 and 333-36074 | Invesco Distributors, Inc. | VK-PTFI-AR-1 |
| Annual Report to Shareholders | August 31, 2019 |
Invesco S&P 500 Index Fund
Nasdaq:
A: SPIAX ■ C: SPICX ■ Y: SPIDX ■ R6: SPISX

Beginning on January 1, 2021, as permitted by regulations adopted by the Securities and Exchange Commission, paper copies of the Fund’s shareholder reports will no longer be sent by mail, unless you specifically request paper copies of the reports from the Fund or from your financial intermediary, such as a broker-dealer or bank. Instead, the reports will be made available on the Fund’s website, and you will be notified by mail each time a report is posted and provided with a website link to access the report.
If you already elected to receive shareholder reports electronically, you will not be affected by this change and you need not take any action. You may elect to receive shareholder reports and other communications from the Fund electronically by contacting your financial intermediary (such as a broker-dealer or bank) or, if you are a direct investor, by enrolling at invesco.com/edelivery.
You may elect to receive all future reports in paper free of charge. If you invest through a financial intermediary, you can contact your financial intermediary to request that you continue to receive paper copies of your shareholder reports. If you invest directly with the Fund, you can call (800) 959-4246 to let the Fund know you wish to continue receiving paper copies of your shareholder reports. Your election to receive reports in paper will apply to all funds held with your financial intermediary or all funds held with the fund complex if you invest directly with the Fund.
Dear Shareholders:
This annual report includes information about your Fund, including performance data and a complete list of its investments as of the close of the reporting period. Inside is a discussion of how your Fund was managed and the factors that affected its performance during the reporting period.
Throughout the reporting period, global equity markets remained volatile. Investor sentiment ranged from elation to fear. The reporting period began with several US equity indexes redefining new highs. The exuberance, however, ended in October 2018 as global equities, in particular US stocks, sold off, with the sharpest decline in December. The catalyst for the sell-off was a combination of ongoing trade concerns between the US and China, fears of a global economic slowdown and lower oil prices from a supply glut. Gains posted earlier in 2018 for global equities were erased, while US Treasury bonds, along with government and municipal bonds, rallied as investors fled to “safe haven” assets.
At the start of 2019, global equity markets rebounded strongly buoyed by more dovish central banks and optimism about a potential US-China trade deal. In May, US-China trade concerns and slowing global growth led to a global equity sell-off and rally in U.S. Treasuries. Despite the May sell-off, domestic equity markets rallied in June in anticipation of a U.S. Federal Reserve (the Fed) rate cut and closed the second quarter with modest gains. As the reporting period ended in August, market volatility once again increased as the US Treasury yield curve inverted several times magnifying concerns that the US economy could be headed into a recession.
During the reporting period, the Fed both raised and lowered the federal funds rate. Given signs of a strong economy, the Fed raised rates two times: in September and December 2018. In 2019, however, the Fed altered its outlook on further rate hikes leaving rates unchanged for the first half of the year. In July, the Fed lowered interest rates for the first time in 11 years. As 2019 unfolds, we’ll see how the interplay of interest rates, economic data, geopolitics and a host of other factors affect US and overseas equity and fixed income markets.
Investor uncertainty and market volatility, such as we witnessed during the reporting period, are unfortunate facts of life when it comes to investing. That’s why Invesco encourages investors to work with a professional financial adviser who can stress the importance of starting to save and invest early and the importance of adhering to a disciplined investment plan. A financial adviser who knows your unique financial situation, investment goals and risk tolerance can be an invaluable partner as you seek to achieve your financial goals. He or she can offer a long-term perspective when markets are volatile and time-tested advice and guidance when your financial situation or investment goals change.
Visit our website for more information on your investments
Our website, invesco.com/us, offers a wide range of market insights and investment perspectives. On the website, you’ll find detailed information about our funds, including performance, holdings and portfolio manager commentaries. You can access information about your account by completing a simple, secure online registration. To do so, select “Log In” on the right side of the homepage, and then select “Register for Individual Account Access.”
In addition to the resources accessible on our website and through our mobile app, you can obtain timely updates to help you stay informed about the markets and the economy by connecting with Invesco on Twitter, LinkedIn or Facebook. You can access our blog at blog.invesco.us.com. Our goal is to provide you the information you want, when and where you want it.
Finally, I’m pleased to share with you Invesco’s commitment to both the Principles for Responsible Investment and to considering environmental, social and governance issues in our robust investment process. I invite you to learn more at invesco.com/esg.
Have questions?
For questions about your account, contact an Invesco client services representative at 800 959 4246.
All of us at Invesco look forward to serving your investment management needs. Thank you for investing with us.
Sincerely,
Andrew Schlossberg
Head of the Americas,
Senior Managing Director, Invesco Ltd.
| 2 | Invesco S&P 500 Index Fund |
Dear Shareholders:
Among the many important lessons I’ve learned in more than 40 years in a variety of business endeavors is the value of a trusted advocate.
As independent chair of the Invesco Funds Board, I can assure you that the members of the Board are strong advocates for the interests of investors in Invesco’s mutual funds. We work hard to represent your interests through oversight of the quality of the investment management services your funds receive and other matters important to your investment, including but not limited to:
| ■ | Ensuring that Invesco offers a diverse lineup of mutual funds that your financial adviser can use to strive to meet your financial needs as your investment goals change over time. |
| ■ | Monitoring how the portfolio management teams of the Invesco funds are performing in light of changing economic and market conditions. |
| ■ | Assessing each portfolio management team’s investment performance within the context of the investment strategy described in the fund’s prospectus. |
| ■ | Monitoring for potential conflicts of interests that may impact the nature of the services that your funds receive. |
We believe one of the most important services we provide our fund shareholders is the annual review of the funds’ advisory and sub-advisory contracts with Invesco Advisers and its affiliates. This review is required by the Investment Company Act of 1940 and focuses on the nature and quality of the services Invesco provides as the adviser to the Invesco funds and the reasonableness of the fees that it charges for those services. Each year, we spend months carefully reviewing information received from Invesco and a variety of independent sources, such as performance and fee data prepared by Lipper, Inc. (a subsidiary of Broadridge Financial Solutions, Inc.), an independent, third-party firm widely recognized as a leader in its field. We also meet with our independent legal counsel and other independent advisers to review and help us assess the information that we have received. Our goal is to assure that you receive quality investment management services for a reasonable fee.
I trust the measures outlined above provide assurance that you have a worthy advocate when it comes to choosing the Invesco Funds.
As always, please contact me at bruce@brucecrockett.com with any questions or concerns you may have. On behalf of the Board, we look forward to continuing to represent your interests and serving your needs.
Sincerely,
Bruce L. Crockett
Independent Chair
Invesco Funds Board of Trustees
| 3 | Invesco S&P 500 Index Fund |
Management’s Discussion of Fund Performance
Performance summary
For the fiscal year ended August 31, 2019, Class A shares of Invesco S&P 500 Index Fund (the Fund), at net asset value (NAV), underperformed the S&P 500 Index, the Fund’s broad market/style-specific benchmark.
Your Fund’s long-term performance appears later in this report.
Fund vs. Indexes
Total returns, August 31, 2018 to August 31, 2019, at net asset value (NAV). Performance shown does not include applicable contingent deferred sales charges (CDSC) or front-end sales charges, which would have reduced performance.
| Class A Shares | 2.36% |
| Class C Shares | 1.60 |
| Class Y Shares | 2.62 |
| Class R6 Shares | 2.65 |
| S&P 500 Index▼ (Broad Market/Style-Specific Index) | 2.92 |
Lipper S&P 500 Objective Funds Index■
(Peer Group Index) | 2.71 |
| Source(s):▼RIMES Technologies Corp.;■ Lipper Inc. |
Market conditions and your Fund
The fiscal year proved to be an increasingly volatile time for US equities. After a relatively quiet summer, market volatility noticeably rose in October 2018, as US equity markets suffered a sharp sell-off through year-end 2018, amid ongoing trade concerns between the US and China, fears of a global economic slowdown and lower oil prices from a supply glut, with oil prices plummeting from near $75 per barrel in early October 2018 to around $45 per barrel in late December 2018.1 In this environment, there was a flight to safety, as investors fled to defensive areas of the markets, such as health care, utilities and US Treasuries.
Given signs of a strong economy, the US Federal Reserve (the Fed) raised interest rates two times during the fiscal year: in September and December 2018.2 In contrast, the European Central Bank and central banks in several other countries maintained extraordinarily accommodative monetary policies.
Following a sharp sell-off during the fourth quarter of 2018, equity markets rebounded in the first quarter of 2019, fueled by optimism about a potential US-China trade deal and the Fed’s indication that there would be no interest rate hikes in 2019, a surprising shift in monetary policy. The Fed’s more accommodative stance provided a supportive environment for equities and fixed income, even as US economic data were mixed and overseas growth appeared to be slowing. Against this backdrop, the S&P 500 Index posted its best first quarter returns since 1998.
Although the S&P 500 Index posted modest gains for the second quarter of 2019, the US stock market experienced increased volatility. After four consecutive months of rising stock markets, the market sold off in May 2019, along with bond yields and oil prices, as investors weighed the impact of the lingering trade war between the US and China, as well as potential tariffs imposed on Mexico. In addition, economic data showed a slowing domestic and global economy. During
the July 2019 meeting, the Fed lowered rates by 25 basis points. (A basis point is one one-hundredth of a percentage point.) This was the first time the Fed lowered rates in more than a decade.2
Market volatility increased in August 2019, as the US Treasury yield curve inverted several times, causing jitters for investors who were concerned that a US recession would be imminent. As a result, much of August saw a “risk off” sentiment, with investors crowding into perceived “safe haven” asset classes, such as US Treasuries and gold. However, a more dovish tone from the Fed provided some support to risk assets. With rising volatility in the markets, the S&P 500 Index posted a modestly positive return for the fiscal year.
Invesco S&P 500 Index Fund invests in stocks in approximately the same proportion as they are represented in the S&P 500 Index.
During the fiscal year, the information technology (IT), consumer staples, real estate, utilities and communication services sectors contributed the most to the Fund’s overall performance. Market sectors delivering negative overall returns for the Fund included energy, financials, health care and materials.
Leading contributors to the Fund’s performance for the fiscal year includedMicrosoft,Procter & Gamble,Visaand Mastercard. Microsoft and Mastercard repeatedly delivered strong earnings and increased revenue growth during the fiscal year.
Top detractors from the Fund’s performance for the fiscal year wereApple andAmazon.com. The stocks’ larger weights in the Fund, coupled with negative returns, hurt the Fund’s performance. Other detractors includedNVIDIAand Wells Fargo.
| Portfolio Composition |
| By sector % of total net assets |
| Information Technology | 21.75% |
| Health Care | 13.70 |
| Financials | 12.59 |
| Communication Services | 10.32 |
| Consumer Discretionary | 10.01 |
| Industrials | 9.10 |
| Consumer Staples | 7.48 |
| Energy | 4.35 |
| Utilities | 3.41 |
| Real Estate | 3.21 |
| Materials | 2.67 |
| Money Market Funds Plus Other Assets Less Liabilities | 1.41 |
| Top 10 Equity Holdings* |
| % of total net assets |
| 1. | Microsoft Corp. | 4.27% |
| 2. | Apple, Inc. | 3.69 |
| 3. | Amazon.com, Inc. | 2.97 |
| 4. | Facebook, Inc., Class A | 1.80 |
| 5. | Berkshire Hathaway, Inc., Class B | 1.59 |
| 6. | Alphabet, Inc., Class C | 1.47 |
| 7. | Alphabet, Inc., Class A | 1.44 |
| 8. | JPMorgan Chase & Co. | 1.44 |
| 9. | Johnson & Johnson | 1.38 |
| 10. | Visa, Inc., Class A | 1.27 |
| Total Net Assets | $1.4 billion |
| Total Number of Holdings* | 505 |
| The Fund’s holdings are subject to change, and there is no assurance that the Fund will continue to hold any particular security. |
| *Excluding money market fund holdings. |
| Data presented here are as of August 31, 2019. |
| 4 | Invesco S&P 500 Index Fund |
Please note that the Fund’s strategy is principally implemented through equity investments, but the Fund also may use derivative instruments, including S&P 500 futures contracts, to gain exposure to the equity market. During the fiscal year, the Fund invested in S&P 500 futures contracts, which generated a positive return and were a slight contributor to Fund performance. Derivatives can be a cost-effective way to gain exposure to asset classes. However, derivatives may amplify traditional investment risks through the creation of leverage and may be less liquid than traditional securities.
Thank you for your investment in Invesco S&P 500 Index Fund.
| 2 | Source: US Federal Reserve |
The views and opinions expressed in management’s discussion of Fund performance are those of Invesco Advisers, Inc. These views and opinions are subject to change at any time based on factors such as market and economic conditions. These views and opinions may not be relied upon as investment advice or recommendations, or as an offer for a particular security. The information is not a complete analysis of every aspect of any market, country, industry, security or the Fund. Statements of fact are from sources considered reliable, but Invesco Advisers, Inc. makes no representation or warranty as to their completeness or accuracy. Although historical performance is no guarantee of future results, these insights may help you understand our investment management philosophy.
See important Fund and, if applicable, index disclosures later in this report.
Anthony Munchak
Chartered Financial Analyst, Portfolio Manager, is manager of Invesco S&P 500 Index Fund. He joined Invesco in 2000. Mr. Munchak earned a BS and an MS in finance from Boston College and an MBA from Bentley College.
Glen Murphy
Chartered Financial Analyst, Portfolio Manager, is manager of Invesco S&P 500 Index Fund. He joined Invesco in 1995. Mr. Murphy earned a BA from the University of Massachusetts at Amherst and an MS in finance from Boston College.
Francis Orlando
Chartered Financial Analyst, Portfolio Manager, is manager of Invesco S&P 500 Index Fund. He joined Invesco in 1987. Mr. Orlando earned a BA in business administration from Merrimack College and an MBA from Boston University.
Daniel Tsai
Chartered Financial Analyst, Portfolio Manager, is manager of Invesco S&P 500 Index Fund. He joined Invesco in 2000. Mr. Tsai earned a BS in mechanical engineering from National Taiwan University, an MS in mechanical engineering from the University of Michigan and an MS in computer science from Wayne State University.
Anne Unflat
Portfolio Manager, is manager of Invesco S&P 500 Index Fund. She joined Invesco in 1988. Ms. Unflat earned a BA in economics from Queens College and an MBA in finance from St. John’s University.
| 5 | Invesco S&P 500 Index Fund |
Your Fund’s Long-Term Performance
Results of a $10,000 Investment — Oldest Share Class(es)
Fund and index data from 8/31/09
| 1 | Source: RIMES Technologies Corp. |
| 2 | Source: Lipper Inc. |
Past performance cannot guarantee comparable future results.
The data shown in the chart include reinvested distributions, applicable sales charges and Fund expenses including
management fees. Index results include reinvested dividends, but they do not reflect sales charges. Performance of the peer group, if applicable, reflects fund expenses and management fees; perfor-
mance of a market index does not. Performance shown in the chart and table(s) does not reflect deduction of taxes a shareholder would pay on Fund distributions or sale of Fund shares.
| 6 | Invesco S&P 500 Index Fund |
| Average Annual Total Returns |
| As of 8/31/19, including maximum applicable sales charges |
| Class A Shares | |
| Inception (9/26/97) | 6.41% |
| 10 Years | 12.18 |
| 5 Years | 8.26 |
| 1 Year | –3.26 |
| Class C Shares | |
| Inception (9/26/97) | 6.31% |
| 10 Years | 11.99 |
| 5 Years | 8.68 |
| 1 Year | 0.60 |
| Class Y Shares | |
| Inception (9/26/97) | 6.94% |
| 10 Years | 13.10 |
| 5 Years | 9.76 |
| 1 Year | 2.62 |
| Class R6 Shares | |
| 10 Years | 12.91% |
| 5 Years | 9.66 |
| 1 Year | 2.65 |
Effective June 1, 2010, Class A, Class C and Class I shares of the predecessor fund, Morgan Stanley S&P 500 Index Fund, advised by Morgan Stanley Investment Advisors Inc. were reorganized into Class A, Class C and Class Y shares, respectively, of Invesco S&P 500 Index Fund. Returns shown above, prior to June 1, 2010, for Class A, Class C and Class Y shares are blended returns of the predecessor fund and Invesco S&P 500 Index Fund. Share class returns will differ from the predecessor fund because of different expenses.
Class R6 shares incepted on April 4, 2017. Performance shown prior to that date is that of the Fund’s and the predecessor fund’s Class A shares and includes the 12b-1 fees applicable to Class A shares.
The performance data quoted represent past performance and cannot guarantee comparable future results; current performance may be lower or higher. Please visit invesco.com/performance for the most recent month-end performance. Performance figures reflect reinvested distributions, changes in net asset value and the effect of the maximum sales charge unless otherwise stated. Investment return and principal value will fluctuate so that you may have a gain or loss when you sell shares.
| Average Annual Total Returns |
| As of 6/30/19, the most recent calendar quarter end, including maximum applicable sales charges |
| Class A Shares | |
| Inception (9/26/97) | 6.47% |
| 10 Years | 13.43 |
| 5 Years | 8.85 |
| 1 Year | 3.80 |
| Class C Shares | |
| Inception (9/26/97) | 6.37% |
| 10 Years | 13.23 |
| 5 Years | 9.27 |
| 1 Year | 7.98 |
| Class Y Shares | |
| Inception (9/26/97) | 7.00% |
| 10 Years | 14.35 |
| 5 Years | 10.35 |
| 1 Year | 10.06 |
| Class R6 Shares | |
| 10 Years | 14.15% |
| 5 Years | 10.24 |
| 1 Year | 10.13 |
The total annual Fund operating expense ratio set forth in the most recent Fund prospectus as of the date of this report for Class A, Class C, Class Y and Class R6 shares was 0.57%, 1.29%, 0.32% and 0.29%, respectively. The expense ratios presented above may vary from the expense ratios presented in other sections of this report that are based on expenses incurred during the period covered by this report.
Class A share performance reflects the maximum 5.50% sales charge, and Class C share performance reflects the applicable contingent deferred sales charge (CDSC) for the period involved. The CDSC on Class C shares is 1% for the first year after purchase. Class Y and Class R6 shares do not have a front-end sales charge or a CDSC; therefore, performance is at net asset value.
The performance of the Fund’s share classes will differ primarily due to different sales charge structures and class expenses.
Fund performance reflects any applicable fee waivers and/or expense reimbursements. Had the adviser not waived fees and/or reimbursed expenses currently or in the past, returns would have been lower. See current prospectus for more information.
| 7 | Invesco S&P 500 Index Fund |
Invesco S&P 500 Index Fund’s investment objective is total return through growth of capital and current income.
| ■ | Unless otherwise stated, information presented in this report is as of August 31, 2019, and is based on total net assets. |
| ■ | Unless otherwise noted, all data provided by Invesco. |
| ■ | To access your Fund’s reports/prospectus, visit invesco.com/fundreports. |
About share classes
| ■ | Class Y shares are available only to certain investors. Please see the prospectus for more information. |
| ■ | Class R6 shares are available for use by retirement plans that meet certain standards and for institutional investors. Class R6 shares are also available through intermediaries that have established an agreement with Invesco Distributors, Inc. to make such shares available for use in retail omnibus accounts. Please see the prospectus for more information. |
Principal risks of investing in the Fund
| ■ | Depositary receipts risk. Investing in depositary receipts involves the same risks as direct investments in foreign securities. In addition, the underlying issuers of certain depositary receipts are under no obligation to distribute shareholder communications or pass through any voting rights with respect to the deposited securities to the holders of such receipts. The Fund may therefore receive less timely information or have less control than if it invested directly in the foreign issuer. |
| ■ | Derivatives risk. The value of a derivative instrument depends largely on (and is derived from) the value of an underlying security, currency, commodity, interest rate, index or other asset (each referred to as an underlying asset). In addition to risks relating to the underlying assets, the use of derivatives may include other, possibly greater, risks, including counterparty, leverage and liquidity risks. Counterparty risk is the risk that the counterparty to the derivative contract will default on its obligation to pay the Fund the amount owed or otherwise perform under the derivative contract. Derivatives create leverage risk because they do not require payment up front equal to the economic exposure created by holding a |
| | position in the derivative. As a result, an adverse change in the value of the underlying asset could result in the Fund sustaining a loss that is substantially greater than the amount invested in the derivative or the anticipated value of the underlying asset, which may make the Fund’s returns more volatile and increase the risk of loss. Derivative instruments may also be less liquid than more traditional investments and the Fund may be unable to sell or close out its derivative positions at a desirable time or price. This risk may be more acute under adverse market conditions, during which the Fund may be most in need of liquidating its derivative positions. Derivatives may also be harder to value, less tax efficient and subject to changing government regulation that could impact the Fund’s ability to use certain derivatives or their cost. Derivatives strategies may not always be successful. For example, derivatives used for hedging or to gain or limit exposure to a particular market segment may not provide the expected benefits, particularly during adverse market conditions. |
| ■ | Emerging markets securities risk. Emerging markets (also referred to as developing markets) are generally subject to greater market volatility, political, social and economic instability, uncertain trading markets and more governmental limitations on foreign investment than more developed markets. In addition, companies operating in emerging markets may be subject to lower trading volume and greater price fluctuations than companies in more developed markets. Securities law and the enforcement of systems of taxation in many emerging market countries may change quickly and unpredictably. In addition, investments in emerging markets securities may also be subject to additional |
| | transaction costs, delays in settlement procedures, and lack of timely information. |
| ■ | Foreign securities risk. The Fund’s foreign investments may be adversely affected by political and social instability, changes in economic or taxation policies, difficulty in enforcing obligations, decreased liquidity or increased volatility. Foreign investments also involve the risk of the possible seizure, nationalization or expropriation of the issuer or foreign deposits (in which the Fund could lose its entire investments in a certain market) and the possible adoption of foreign governmental restrictions such as exchange controls. Unless the Fund has hedged its foreign securities risk, foreign securities risk also involves the risk of negative foreign currency rate fluctuations, which may cause the value of securities denominated in such foreign currency (or other instruments through which the Fund has exposure to foreign currencies) to decline in value. Currency exchange rates may fluctuate significantly over short periods of time. Currency hedging strategies, if used, are not always successful. |
| ■ | Indexing risk. The Fund is operated as a passively managed index fund and, therefore, the adverse performance of a particular security necessarily will not result in the elimination of the security from the Fund’s portfolio. Ordinarily, the Adviser will not sell the Fund’s portfolio securities except to reflect additions or deletions of the securities that comprise the Index, or as may be necessary to raise cash to pay Fund shareholders who sell Fund shares. As such, the Fund will be negatively affected by declines in the securities represented by the Index. Also, there is no guarantee that the Adviser will be able to correlate the Fund’s performance with that of the Index. |
This report must be accompanied or preceded by a currently effective Fund prospectus, which contains more complete information, including sales charges and expenses. Investors should read it carefully before investing.
NOT FDIC INSURED | MAY LOSE VALUE | NO BANK GUARANTEE
| 8 | Invesco S&P 500 Index Fund |
| ■ | Market risk. The market values of the Fund’s investments, and therefore the value of the Fund’s shares, will go up and down, sometimes rapidly or unpredictably. Market risk may affect a single issuer, industry or section of the economy, or it may affect the market as a whole. Individual stock prices tend to go up and down more dramatically than those of certain other types of investments, such as bonds. During a general downturn in the financial markets, multiple asset classes may decline in value. When markets perform well, there can be no assurance that specific investments held by the Fund will rise in value. |
| ■ | Sector focus risk. The Fund may from time to time invest a significant amount of its assets (i.e. over 25%) in one market sector or group of related industries. In this event, the Fund’s performance will depend to a greater extent on the overall condition of the sector or group of industries and there is increased risk that the Fund will lose significant value if conditions adversely affect that sector or group of industries. |
About indexes used in this report
| ■ | TheS&P 500® Index is an unmanaged index considered representative of the US stock market. |
| ■ | TheLipper S&P 500 Objective Funds Index is an unmanaged index considered representative of S&P 500 funds tracked by Lipper. |
| ■ | A direct investment cannot be made in an index. Unless otherwise indicated, index results include reinvested dividends, and they do not reflect sales charges. Performance of the peer group, if applicable, reflects fund expenses; performance of a market index does not. |
Other information
| ■ | The returns shown in management’s discussion of Fund performance are based on net asset values (NAVs) calculated for shareholder transactions. Generally accepted accounting principles require adjustments to be made to the net assets of the Fund at period end for financial reporting purposes, and as such, the NAVs for shareholder transactions and the returns based on those NAVs may differ from the NAVs and returns reported in the Financial Highlights. |
| ■ | Industry classifications used in this report are generally according to the Global Industry Classification Stan- |
dard, which was developed by and is the exclusive property and a service mark of MSCI Inc. and Standard & Poor’s.
| 9 | Invesco S&P 500 Index Fund |
Schedule of Investments(a)
August 31, 2019
| | Shares | Value |
| Common Stocks & Other Equity Interests–98.59% |
| Advertising–0.10% |
| Interpublic Group of Cos., Inc. (The) | 21,736 | $432,112 |
| Omnicom Group, Inc. | 12,364 | 940,406 |
| | | | 1,372,518 |
| Aerospace & Defense–2.67% |
| Arconic, Inc. | 22,423 | 579,410 |
| Boeing Co. (The) | 29,382 | 10,697,692 |
| General Dynamics Corp. | 15,249 | 2,916,676 |
| Huntington Ingalls Industries, Inc. | 2,322 | 485,298 |
| L3Harris Technologies, Inc. | 12,476 | 2,637,551 |
| Lockheed Martin Corp. | 13,804 | 5,302,255 |
| Northrop Grumman Corp. | 9,536 | 3,508,008 |
| Raytheon Co. | 15,642 | 2,898,776 |
| Textron, Inc. | 13,022 | 585,990 |
| TransDigm Group, Inc.(b) | 2,747 | 1,478,765 |
| United Technologies Corp. | 45,553 | 5,932,823 |
| | | | 37,023,244 |
| Agricultural & Farm Machinery–0.20% |
| Deere & Co. | 17,809 | 2,758,792 |
| Agricultural Products–0.09% |
| Archer-Daniels-Midland Co. | 31,459 | 1,197,015 |
| Air Freight & Logistics–0.59% |
| C.H. Robinson Worldwide, Inc. | 7,652 | 646,517 |
| Expeditors International of Washington, Inc. | 9,700 | 689,670 |
| FedEx Corp. | 13,480 | 2,138,063 |
| United Parcel Service, Inc., Class B | 39,173 | 4,648,268 |
| | | | 8,122,518 |
| Airlines–0.39% |
| Alaska Air Group, Inc. | 6,984 | 417,084 |
| American Airlines Group, Inc. | 22,234 | 584,977 |
| Delta Air Lines, Inc. | 33,456 | 1,935,764 |
| Southwest Airlines Co. | 27,448 | 1,436,079 |
| United Airlines Holdings, Inc.(b) | 12,412 | 1,046,456 |
| | | | 5,420,360 |
| Alternative Carriers–0.04% |
| CenturyLink, Inc. | 53,884 | 613,200 |
| Apparel Retail–0.46% |
| Gap, Inc. (The) | 11,844 | 187,017 |
| L Brands, Inc. | 12,880 | 212,649 |
| Ross Stores, Inc. | 20,622 | 2,186,138 |
| TJX Cos., Inc. (The) | 68,104 | 3,743,677 |
| | | | 6,329,481 |
| | Shares | Value |
| Apparel, Accessories & Luxury Goods–0.24% |
| Capri Holdings Ltd.(b) | 8,434 | $222,489 |
| Hanesbrands, Inc. | 20,312 | 277,462 |
| PVH Corp. | 4,234 | 320,937 |
| Ralph Lauren Corp. | 2,971 | 262,458 |
| Tapestry, Inc. | 16,315 | 336,905 |
| Under Armour, Inc., Class A(b) | 10,601 | 197,285 |
| Under Armour, Inc., Class C(b) | 10,910 | 184,597 |
| VF Corp. | 18,289 | 1,498,783 |
| | | | 3,300,916 |
| Application Software–1.81% |
| Adobe, Inc.(b) | 27,403 | 7,796,428 |
| ANSYS, Inc.(b) | 4,734 | 977,855 |
| Autodesk, Inc.(b) | 12,333 | 1,761,399 |
| Cadence Design Systems Inc.(b) | 15,782 | 1,080,751 |
| Citrix Systems, Inc. | 6,997 | 650,581 |
| Intuit, Inc. | 14,558 | 4,197,945 |
| salesforce.com, inc.(b) | 47,970 | 7,486,678 |
| Synopsys, Inc.(b) | 8,369 | 1,186,808 |
| | | | 25,138,445 |
| Asset Management & Custody Banks–0.76% |
| Affiliated Managers Group, Inc. | 2,910 | 222,993 |
| Ameriprise Financial, Inc. | 7,519 | 969,801 |
| Bank of New York Mellon Corp. (The) | 49,473 | 2,080,834 |
| BlackRock, Inc. | 6,681 | 2,823,123 |
| Franklin Resources, Inc. | 16,524 | 434,251 |
| Invesco Ltd.(c) | 22,496 | 353,187 |
| Northern Trust Corp. | 12,213 | 1,073,889 |
| State Street Corp. | 20,957 | 1,075,304 |
| T. Rowe Price Group, Inc. | 13,312 | 1,472,574 |
| | | | 10,505,956 |
| Auto Parts & Equipment–0.11% |
| Aptiv PLC | 14,440 | 1,200,975 |
| BorgWarner, Inc. | 11,614 | 378,965 |
| | | | 1,579,940 |
| Automobile Manufacturers–0.34% |
| Ford Motor Co. | 220,078 | 2,018,115 |
| General Motors Co. | 74,081 | 2,747,665 |
| | | | 4,765,780 |
| Automotive Retail–0.33% |
| Advance Auto Parts, Inc. | 4,007 | 552,766 |
| AutoZone, Inc.(b) | 1,377 | 1,517,027 |
| CarMax, Inc.(b) | 9,333 | 777,252 |
| O’Reilly Automotive, Inc.(b) | 4,402 | 1,689,312 |
| | | | 4,536,357 |
See accompanying Notes to Financial Statements which are an integral part of the financial statements.
| 10 | Invesco S&P 500 Index Fund |
| | Shares | Value |
| Biotechnology–2.11% |
| AbbVie, Inc. | 83,024 | $5,457,998 |
| Alexion Pharmaceuticals, Inc.(b) | 12,596 | 1,269,173 |
| Amgen, Inc. | 34,254 | 7,146,069 |
| Biogen, Inc.(b) | 10,889 | 2,392,858 |
| Celgene Corp.(b) | 39,608 | 3,834,054 |
| Gilead Sciences, Inc. | 71,432 | 4,538,789 |
| Incyte Corp.(b) | 10,035 | 821,064 |
| Regeneron Pharmaceuticals, Inc.(b) | 4,416 | 1,280,861 |
| Vertex Pharmaceuticals, Inc.(b) | 14,383 | 2,589,228 |
| | | | 29,330,094 |
| Brewers–0.04% |
| Molson Coors Brewing Co., Class B | 10,594 | 544,108 |
| Broadcasting–0.18% |
| CBS Corp., Class B | 19,766 | 831,358 |
| Discovery, Inc., Class A(b) | 8,880 | 245,088 |
| Discovery, Inc., Class C(b) | 20,257 | 527,290 |
| Fox Corp., Class A | 19,900 | 660,083 |
| Fox Corp., Class B | 9,079 | 297,791 |
| | | | 2,561,610 |
| Building Products–0.28% |
| A.O. Smith Corp. | 7,929 | 368,857 |
| Allegion PLC | 5,281 | 508,402 |
| Fortune Brands Home & Security, Inc. | 7,859 | 401,280 |
| Johnson Controls International PLC | 44,691 | 1,907,859 |
| Masco Corp. | 16,467 | 670,701 |
| | | | 3,857,099 |
| Cable & Satellite–1.13% |
| Charter Communications, Inc., Class A(b) | 9,661 | 3,957,049 |
| Comcast Corp., Class A | 254,373 | 11,258,549 |
| DISH Network Corp., Class A(b) | 12,957 | 434,837 |
| | | | 15,650,435 |
| Casinos & Gaming–0.10% |
| MGM Resorts International | 28,661 | 804,228 |
| Wynn Resorts, Ltd. | 5,416 | 596,572 |
| | | | 1,400,800 |
| Commodity Chemicals–0.22% |
| Dow, Inc. | 42,028 | 1,791,653 |
| LyondellBasell Industries N.V., Class A | 17,018 | 1,316,853 |
| | | | 3,108,506 |
| Communications Equipment–1.04% |
| Arista Networks, Inc.(b) | 2,971 | 673,288 |
| Cisco Systems, Inc. | 240,410 | 11,253,592 |
| F5 Networks, Inc.(b) | 3,373 | 434,207 |
| Juniper Networks, Inc. | 19,337 | 447,845 |
| Motorola Solutions, Inc. | 9,253 | 1,673,960 |
| | | | 14,482,892 |
| | Shares | Value |
| Computer & Electronics Retail–0.06% |
| Best Buy Co., Inc. | 13,091 | $833,242 |
| Construction & Engineering–0.06% |
| Jacobs Engineering Group, Inc. | 6,443 | 572,525 |
| Quanta Services, Inc. | 8,004 | 271,336 |
| | | | 843,861 |
| Construction Machinery & Heavy Trucks–0.50% |
| Caterpillar, Inc. | 32,116 | 3,821,804 |
| Cummins, Inc. | 8,144 | 1,215,655 |
| PACCAR, Inc. | 19,489 | 1,277,699 |
| Wabtec Corp. | 9,084 | 628,703 |
| | | | 6,943,861 |
| Construction Materials–0.14% |
| Martin Marietta Materials, Inc. | 3,491 | 885,911 |
| Vulcan Materials Co. | 7,371 | 1,041,154 |
| | | | 1,927,065 |
| Consumer Electronics–0.04% |
| Garmin Ltd. | 6,780 | 553,045 |
| Consumer Finance–0.69% |
| American Express Co. | 38,457 | 4,629,069 |
| Capital One Financial Corp. | 26,372 | 2,284,343 |
| Discover Financial Services | 18,180 | 1,453,854 |
| Synchrony Financial | 35,615 | 1,141,461 |
| | | | 9,508,727 |
| Copper–0.05% |
| Freeport-McMoRan, Inc. | 81,468 | 748,691 |
| Data Processing & Outsourced Services–4.27% |
| Alliance Data Systems Corp. | 2,548 | 313,277 |
| Automatic Data Processing, Inc. | 24,442 | 4,151,229 |
| Broadridge Financial Solutions, Inc. | 6,568 | 850,162 |
| Fidelity National Information Services, Inc. | 34,417 | 4,688,284 |
| Fiserv, Inc.(b) | 32,002 | 3,422,294 |
| FleetCor Technologies, Inc.(b) | 4,850 | 1,447,240 |
| Global Payments, Inc. | 8,812 | 1,462,616 |
| Jack Henry & Associates, Inc. | 4,315 | 625,502 |
| Mastercard, Inc., Class A | 50,476 | 14,202,432 |
| Paychex, Inc. | 17,971 | 1,468,231 |
| PayPal Holdings, Inc.(b) | 65,985 | 7,195,664 |
| Total System Services, Inc. | 9,101 | 1,221,536 |
| Visa, Inc., Class A | 97,663 | 17,659,424 |
| Western Union Co. (The) | 24,188 | 535,038 |
| | | | 59,242,929 |
| Department Stores–0.06% |
| Kohl’s Corp. | 9,098 | 429,972 |
| Macy’s, Inc. | 17,345 | 256,012 |
| Nordstrom, Inc. | 5,892 | 170,691 |
| | | | 856,675 |
See accompanying Notes to Financial Statements which are an integral part of the financial statements.
| 11 | Invesco S&P 500 Index Fund |
| | Shares | Value |
| Distillers & Vintners–0.18% |
| Brown-Forman Corp., Class B | 9,298 | $548,489 |
| Constellation Brands, Inc., Class A | 9,390 | 1,918,847 |
| | | | 2,467,336 |
| Distributors–0.09% |
| Genuine Parts Co. | 8,160 | 736,767 |
| LKQ Corp.(b) | 17,601 | 462,378 |
| | | | 1,199,145 |
| Diversified Banks–4.11% |
| Bank of America Corp. | 496,613 | 13,661,824 |
| Citigroup, Inc. | 129,870 | 8,357,134 |
| JPMorgan Chase & Co. | 182,185 | 20,014,844 |
| U.S. Bancorp | 84,036 | 4,427,857 |
| Wells Fargo & Co. | 227,167 | 10,579,167 |
| | | | 57,040,826 |
| Diversified Chemicals–0.04% |
| Eastman Chemical Co. | 7,816 | 510,932 |
| Diversified Support Services–0.15% |
| Cintas Corp. | 4,735 | 1,249,093 |
| Copart, Inc.(b) | 11,330 | 854,169 |
| | | | 2,103,262 |
| Drug Retail–0.16% |
| Walgreens Boots Alliance, Inc. | 43,645 | 2,234,188 |
| Electric Utilities–2.07% |
| Alliant Energy Corp. | 13,301 | 697,637 |
| American Electric Power Co., Inc. | 27,711 | 2,525,858 |
| Duke Energy Corp. | 40,887 | 3,791,860 |
| Edison International | 18,319 | 1,323,914 |
| Entergy Corp. | 10,701 | 1,207,501 |
| Evergy, Inc. | 13,708 | 891,020 |
| Eversource Energy | 18,032 | 1,444,904 |
| Exelon Corp. | 54,529 | 2,577,041 |
| FirstEnergy Corp. | 28,354 | 1,304,284 |
| NextEra Energy, Inc. | 26,896 | 5,892,376 |
| Pinnacle West Capital Corp. | 6,271 | 597,689 |
| PPL Corp. | 40,533 | 1,197,750 |
| Southern Co. (The) | 58,454 | 3,405,530 |
| Xcel Energy, Inc. | 28,904 | 1,856,215 |
| | | | 28,713,579 |
| Electrical Components & Equipment–0.44% |
| AMETEK, Inc. | 12,801 | 1,099,990 |
| Eaton Corp. PLC | 23,788 | 1,920,167 |
| Emerson Electric Co. | 34,517 | 2,056,868 |
| Rockwell Automation, Inc. | 6,634 | 1,013,609 |
| | | | 6,090,634 |
| Electronic Components–0.19% |
| Amphenol Corp., Class A | 16,776 | 1,468,571 |
| | Shares | Value |
| Electronic Components–(continued) |
| Corning, Inc. | 44,098 | $1,228,129 |
| | | | 2,696,700 |
| Electronic Equipment & Instruments–0.10% |
| FLIR Systems, Inc. | 7,575 | 373,220 |
| Keysight Technologies, Inc.(b) | 10,599 | 1,026,619 |
| | | | 1,399,839 |
| Electronic Manufacturing Services–0.14% |
| IPG Photonics Corp.(b) | 1,987 | 245,852 |
| TE Connectivity Ltd. | 18,947 | 1,728,345 |
| | | | 1,974,197 |
| Environmental & Facilities Services–0.29% |
| Republic Services, Inc. | 12,150 | 1,084,387 |
| Rollins, Inc. | 8,241 | 270,387 |
| Waste Management, Inc. | 21,942 | 2,618,778 |
| | | | 3,973,552 |
| Fertilizers & Agricultural Chemicals–0.20% |
| CF Industries Holdings, Inc. | 12,463 | 600,592 |
| Corteva, Inc. | 42,028 | 1,232,261 |
| FMC Corp. | 7,393 | 638,238 |
| Mosaic Co. (The) | 19,932 | 366,549 |
| | | | 2,837,640 |
| Financial Exchanges & Data–1.17% |
| Cboe Global Markets, Inc. | 6,274 | 747,610 |
| CME Group, Inc. | 20,104 | 4,368,398 |
| Intercontinental Exchange, Inc. | 31,667 | 2,960,231 |
| MarketAxess Holdings, Inc. | 2,117 | 841,761 |
| Moody’s Corp. | 9,241 | 1,992,175 |
| MSCI, Inc. | 4,765 | 1,118,012 |
| Nasdaq, Inc. | 6,474 | 646,364 |
| S&P Global, Inc. | 13,819 | 3,595,566 |
| | | | 16,270,117 |
| Food Distributors–0.14% |
| Sysco Corp. | 26,555 | 1,973,833 |
| Food Retail–0.08% |
| Kroger Co. (The) | 45,303 | 1,072,775 |
| Footwear–0.43% |
| NIKE, Inc., Class B | 70,578 | 5,963,841 |
| Gas Utilities–0.05% |
| Atmos Energy Corp. | 6,536 | 720,463 |
| General Merchandise Stores–0.48% |
| Dollar General Corp. | 14,507 | 2,264,398 |
| Dollar Tree, Inc.(b) | 13,306 | 1,350,958 |
| Target Corp. | 28,773 | 3,079,862 |
| | | | 6,695,218 |
See accompanying Notes to Financial Statements which are an integral part of the financial statements.
| 12 | Invesco S&P 500 Index Fund |
| | Shares | Value |
| Gold–0.13% |
| Newmont Goldcorp Corp. | 46,030 | $1,836,137 |
| Health Care Distributors–0.25% |
| AmerisourceBergen Corp. | 8,734 | 718,546 |
| Cardinal Health, Inc. | 16,765 | 723,075 |
| Henry Schein, Inc.(b) | 8,366 | 515,513 |
| McKesson Corp. | 10,626 | 1,469,257 |
| | | | 3,426,391 |
| Health Care Equipment–3.44% |
| Abbott Laboratories | 99,078 | 8,453,335 |
| ABIOMED, Inc.(b) | 2,541 | 490,591 |
| Baxter International, Inc. | 26,653 | 2,344,131 |
| Becton, Dickinson and Co. | 15,147 | 3,846,126 |
| Boston Scientific Corp.(b) | 78,100 | 3,337,213 |
| Danaher Corp. | 35,382 | 5,027,428 |
| Edwards Lifesciences Corp.(b) | 11,709 | 2,597,525 |
| Hologic, Inc.(b) | 15,075 | 744,253 |
| IDEXX Laboratories, Inc.(b) | 4,809 | 1,393,360 |
| Intuitive Surgical, Inc.(b) | 6,483 | 3,315,017 |
| Medtronic PLC | 75,295 | 8,123,577 |
| ResMed, Inc. | 8,013 | 1,116,211 |
| Stryker Corp. | 17,391 | 3,837,498 |
| Teleflex, Inc. | 2,593 | 943,645 |
| Varian Medical Systems, Inc.(b) | 5,076 | 537,701 |
| Zimmer Biomet Holdings, Inc. | 11,532 | 1,605,254 |
| | | | 47,712,865 |
| Health Care Facilities–0.18% |
| HCA Healthcare, Inc. | 15,034 | 1,807,087 |
| Universal Health Services, Inc., Class B | 4,670 | 675,188 |
| | | | 2,482,275 |
| Health Care REITs–0.32% |
| HCP, Inc. | 26,843 | 931,720 |
| Ventas, Inc. | 20,746 | 1,522,549 |
| Welltower, Inc. | 22,741 | 2,036,684 |
| | | | 4,490,953 |
| Health Care Services–0.71% |
| Cigna Corp. | 21,310 | 3,281,101 |
| CVS Health Corp. | 72,957 | 4,444,540 |
| DaVita, Inc.(b) | 7,071 | 398,592 |
| Laboratory Corp. of America Holdings(b) | 5,513 | 923,758 |
| Quest Diagnostics, Inc. | 7,507 | 768,492 |
| | | | 9,816,483 |
| Health Care Supplies–0.17% |
| Align Technology, Inc.(b) | 4,090 | 748,920 |
| Cooper Cos., Inc. (The) | 2,779 | 860,795 |
| DENTSPLY SIRONA, Inc. | 13,140 | 685,251 |
| | | | 2,294,966 |
| Health Care Technology–0.09% |
| Cerner Corp. | 18,275 | 1,259,330 |
| | Shares | Value |
| Home Furnishings–0.05% |
| Leggett & Platt, Inc. | 7,329 | $272,566 |
| Mohawk Industries, Inc.(b) | 3,436 | 408,506 |
| | | | 681,072 |
| Home Improvement Retail–1.37% |
| Home Depot, Inc. (The) | 61,792 | 14,083,015 |
| Lowe’s Cos., Inc. | 43,968 | 4,933,209 |
| | | | 19,016,224 |
| Homebuilding–0.16% |
| D.R. Horton, Inc. | 19,103 | 945,026 |
| Lennar Corp., Class A | 15,989 | 815,439 |
| PulteGroup, Inc. | 14,358 | 485,300 |
| | | | 2,245,765 |
| Hotel & Resort REITs–0.05% |
| Host Hotels & Resorts, Inc. | 41,609 | 667,408 |
| Hotels, Resorts & Cruise Lines–0.44% |
| Carnival Corp. | 22,491 | 991,403 |
| Hilton Worldwide Holdings, Inc. | 16,375 | 1,512,559 |
| Marriott International, Inc., Class A | 15,521 | 1,956,577 |
| Norwegian Cruise Line Holdings Ltd.(b) | 12,070 | 612,553 |
| Royal Caribbean Cruises Ltd. | 9,692 | 1,010,682 |
| | | | 6,083,774 |
| Household Appliances–0.04% |
| Whirlpool Corp. | 3,557 | 494,743 |
| Household Products–1.84% |
| Church & Dwight Co., Inc. | 13,851 | 1,105,033 |
| Clorox Co. (The) | 7,166 | 1,133,375 |
| Colgate-Palmolive Co. | 48,184 | 3,572,844 |
| Kimberly-Clark Corp. | 19,259 | 2,717,637 |
| Procter & Gamble Co. (The) | 140,871 | 16,936,920 |
| | | | 25,465,809 |
| Housewares & Specialties–0.03% |
| Newell Brands, Inc. | 21,860 | 362,876 |
| Human Resource & Employment Services–0.03% |
| Robert Half International, Inc. | 6,658 | 356,003 |
| Hypermarkets & Super Centers–1.17% |
| Costco Wholesale Corp. | 24,698 | 7,279,983 |
| Walmart, Inc. | 78,558 | 8,976,037 |
| | | | 16,256,020 |
| Independent Power Producers & Energy Traders–0.08% |
| AES Corp. (The) | 37,275 | 571,426 |
| NRG Energy, Inc. | 15,003 | 546,109 |
| | | | 1,117,535 |
| Industrial Conglomerates–1.31% |
| 3M Co. | 32,372 | 5,235,200 |
| General Electric Co. | 489,771 | 4,040,611 |
See accompanying Notes to Financial Statements which are an integral part of the financial statements.
| 13 | Invesco S&P 500 Index Fund |
| | Shares | Value |
| Industrial Conglomerates–(continued) |
| Honeywell International, Inc. | 40,870 | $6,728,019 |
| Roper Technologies, Inc. | 5,831 | 2,138,578 |
| | | | 18,142,408 |
| Industrial Gases–0.62% |
| Air Products and Chemicals, Inc. | 12,362 | 2,792,823 |
| Linde PLC (United Kingdom) | 30,482 | 5,758,355 |
| | | | 8,551,178 |
| Industrial Machinery–0.79% |
| Dover Corp. | 8,204 | 769,043 |
| Flowserve Corp. | 7,324 | 312,588 |
| Fortive Corp. | 16,567 | 1,174,600 |
| IDEX Corp. | 4,251 | 700,182 |
| Illinois Tool Works, Inc. | 16,829 | 2,521,994 |
| Ingersoll-Rand PLC | 13,541 | 1,639,680 |
| Parker-Hannifin Corp. | 7,183 | 1,190,726 |
| Pentair PLC | 8,915 | 320,227 |
| Snap-on, Inc. | 3,109 | 462,246 |
| Stanley Black & Decker, Inc. | 8,463 | 1,124,394 |
| Xylem, Inc. | 10,141 | 776,902 |
| | | | 10,992,582 |
| Industrial REITs–0.26% |
| Duke Realty Corp. | 20,190 | 671,721 |
| Prologis, Inc. | 35,425 | 2,962,239 |
| | | | 3,633,960 |
| Insurance Brokers–0.57% |
| Aon PLC | 13,507 | 2,631,839 |
| Arthur J. Gallagher & Co. | 10,403 | 943,656 |
| Marsh & McLennan Cos., Inc. | 28,717 | 2,868,541 |
| Willis Towers Watson PLC | 7,269 | 1,439,044 |
| | | | 7,883,080 |
| Integrated Oil & Gas–2.24% |
| Chevron Corp. | 106,981 | 12,593,804 |
| Exxon Mobil Corp.(d) | 237,623 | 16,272,423 |
| Occidental Petroleum Corp. | 50,290 | 2,186,609 |
| | | | 31,052,836 |
| Integrated Telecommunication Services–2.01% |
| AT&T, Inc. | 409,865 | 14,451,840 |
| Verizon Communications, Inc. | 232,266 | 13,508,590 |
| | | | 27,960,430 |
| Interactive Home Entertainment–0.33% |
| Activision Blizzard, Inc. | 43,019 | 2,176,762 |
| Electronic Arts, Inc.(b) | 16,652 | 1,559,959 |
| Take-Two Interactive Software, Inc.(b) | 6,327 | 834,974 |
| | | | 4,571,695 |
| Interactive Media & Services–4.86% |
| Alphabet, Inc., Class A(b) | 16,815 | 20,018,762 |
| Alphabet, Inc., Class C(b) | 17,211 | 20,448,389 |
| | Shares | Value |
| Interactive Media & Services–(continued) |
| Facebook, Inc., Class A(b) | 134,929 | $25,052,267 |
| TripAdvisor, Inc.(b) | 5,846 | 222,090 |
| Twitter, Inc.(b) | 41,008 | 1,748,991 |
| | | | 67,490,499 |
| Internet & Direct Marketing Retail–3.52% |
| Amazon.com, Inc.(b) | 23,225 | 41,254,335 |
| Booking Holdings, Inc.(b) | 2,431 | 4,780,343 |
| eBay, Inc. | 46,008 | 1,853,662 |
| Expedia Group, Inc. | 7,774 | 1,011,398 |
| | | | 48,899,738 |
| Internet Services & Infrastructure–0.15% |
| Akamai Technologies, Inc.(b) | 9,226 | 822,313 |
| VeriSign, Inc.(b) | 5,890 | 1,200,677 |
| | | | 2,022,990 |
| Investment Banking & Brokerage–0.76% |
| Charles Schwab Corp. (The) | 66,728 | 2,553,681 |
| E*TRADE Financial Corp. | 13,773 | 574,885 |
| Goldman Sachs Group, Inc. (The) | 19,101 | 3,894,885 |
| Morgan Stanley | 71,801 | 2,979,023 |
| Raymond James Financial, Inc. | 7,097 | 557,185 |
| | | | 10,559,659 |
| IT Consulting & Other Services–1.28% |
| Accenture PLC, Class A | 35,820 | 7,098,449 |
| Cognizant Technology Solutions Corp., Class A | 31,971 | 1,962,700 |
| DXC Technology Co. | 15,102 | 501,689 |
| Gartner, Inc.(b) | 5,066 | 677,172 |
| International Business Machines Corp. | 49,815 | 6,751,427 |
| Leidos Holdings, Inc. | 8,098 | 707,441 |
| | | | 17,698,878 |
| Leisure Products–0.05% |
| Hasbro, Inc. | 6,473 | 715,072 |
| Life & Health Insurance–0.61% |
| Aflac, Inc. | 41,857 | 2,100,384 |
| Globe Life, Inc. | 5,671 | 506,194 |
| Lincoln National Corp. | 11,323 | 598,760 |
| MetLife, Inc. | 53,373 | 2,364,424 |
| Principal Financial Group, Inc. | 14,574 | 775,628 |
| Prudential Financial, Inc. | 22,770 | 1,823,649 |
| Unum Group | 11,899 | 302,354 |
| | | | 8,471,393 |
| Life Sciences Tools & Services–0.98% |
| Agilent Technologies, Inc. | 17,760 | 1,262,914 |
| Illumina, Inc.(b) | 8,254 | 2,322,180 |
| IQVIA Holdings, Inc.(b) | 8,848 | 1,372,767 |
| Mettler-Toledo International, Inc.(b) | 1,392 | 914,252 |
| PerkinElmer, Inc. | 6,195 | 512,326 |
| Thermo Fisher Scientific, Inc. | 22,461 | 6,447,655 |
See accompanying Notes to Financial Statements which are an integral part of the financial statements.
| 14 | Invesco S&P 500 Index Fund |
| | Shares | Value |
| Life Sciences Tools & Services–(continued) |
| Waters Corp.(b) | 3,901 | $826,583 |
| | | | 13,658,677 |
| Managed Health Care–1.46% |
| Anthem, Inc. | 14,443 | 3,777,133 |
| Centene Corp.(b) | 23,214 | 1,082,237 |
| Humana, Inc. | 7,580 | 2,146,732 |
| UnitedHealth Group, Inc. | 53,371 | 12,488,814 |
| WellCare Health Plans, Inc.(b) | 2,825 | 764,840 |
| | | | 20,259,756 |
| Metal & Glass Containers–0.11% |
| Ball Corp. | 18,799 | 1,511,628 |
| Motorcycle Manufacturers–0.02% |
| Harley-Davidson, Inc. | 8,921 | 284,580 |
| Movies & Entertainment–1.53% |
| Netflix, Inc.(b) | 24,554 | 7,212,738 |
| Viacom, Inc., Class B | 19,876 | 496,502 |
| Walt Disney Co. (The) | 98,040 | 13,456,970 |
| | | | 21,166,210 |
| Multi-line Insurance–0.30% |
| American International Group, Inc. | 48,846 | 2,541,946 |
| Assurant, Inc. | 3,449 | 424,227 |
| Hartford Financial Services Group, Inc. (The) | 20,302 | 1,183,200 |
| | | | 4,149,373 |
| Multi-Sector Holdings–1.61% |
| Berkshire Hathaway, Inc., Class B(b) | 108,828 | 22,136,703 |
| Jefferies Financial Group, Inc. | 14,229 | 265,229 |
| | | | 22,401,932 |
| Multi-Utilities–1.12% |
| Ameren Corp. | 13,792 | 1,064,053 |
| CenterPoint Energy, Inc. | 28,202 | 780,913 |
| CMS Energy Corp. | 15,948 | 1,005,521 |
| Consolidated Edison, Inc. | 18,369 | 1,633,004 |
| Dominion Energy, Inc. | 45,060 | 3,498,008 |
| DTE Energy Co. | 10,289 | 1,334,072 |
| NiSource, Inc. | 20,953 | 619,161 |
| Public Service Enterprise Group, Inc. | 28,385 | 1,716,441 |
| Sempra Energy | 15,424 | 2,184,501 |
| WEC Energy Group, Inc. | 17,740 | 1,698,960 |
| | | | 15,534,634 |
| Office REITs–0.22% |
| Alexandria Real Estate Equities, Inc. | 6,303 | 944,442 |
| Boston Properties, Inc. | 8,639 | 1,109,420 |
| SL Green Realty Corp. | 4,779 | 383,371 |
| Vornado Realty Trust | 9,796 | 592,364 |
| | | | 3,029,597 |
| | Shares | Value |
| Oil & Gas Drilling–0.02% |
| Helmerich & Payne, Inc. | 6,217 | $233,697 |
| Oil & Gas Equipment & Services–0.37% |
| Baker Hughes, a GE Co., Class A | 28,917 | 627,210 |
| Halliburton Co. | 49,083 | 924,724 |
| National Oilwell Varco, Inc. | 21,673 | 442,779 |
| Schlumberger Ltd. | 77,789 | 2,522,697 |
| TechnipFMC PLC (United Kingdom) | 23,653 | 587,541 |
| | | | 5,104,951 |
| Oil & Gas Exploration & Production–0.88% |
| Apache Corp. | 21,111 | 455,364 |
| Cabot Oil & Gas Corp. | 23,775 | 407,028 |
| Cimarex Energy Co. | 5,673 | 242,691 |
| Concho Resources, Inc. | 11,216 | 820,451 |
| ConocoPhillips | 63,435 | 3,310,038 |
| Devon Energy Corp. | 23,317 | 512,741 |
| Diamondback Energy, Inc. | 8,740 | 857,219 |
| EOG Resources, Inc. | 32,591 | 2,417,926 |
| Hess Corp. | 14,334 | 902,325 |
| Marathon Oil Corp. | 45,934 | 543,859 |
| Noble Energy, Inc. | 26,857 | 606,431 |
| Pioneer Natural Resources Co. | 9,465 | 1,168,170 |
| | | | 12,244,243 |
| Oil & Gas Refining & Marketing–0.45% |
| HollyFrontier Corp. | 8,784 | 389,658 |
| Marathon Petroleum Corp. | 37,213 | 1,831,252 |
| Phillips 66 | 23,458 | 2,313,663 |
| Valero Energy Corp. | 23,454 | 1,765,617 |
| | | | 6,300,190 |
| Oil & Gas Storage & Transportation–0.39% |
| Kinder Morgan, Inc. | 109,335 | 2,216,221 |
| ONEOK, Inc. | 23,180 | 1,652,270 |
| Williams Cos., Inc. (The) | 68,054 | 1,606,074 |
| | | | 5,474,565 |
| Packaged Foods & Meats–1.09% |
| Campbell Soup Co. | 10,874 | 489,330 |
| Conagra Brands, Inc. | 27,288 | 773,888 |
| General Mills, Inc. | 33,628 | 1,809,186 |
| Hershey Co. (The) | 7,774 | 1,232,024 |
| Hormel Foods Corp. | 15,245 | 649,589 |
| JM Smucker Co. (The) | 6,361 | 668,923 |
| Kellogg Co. | 13,937 | 875,244 |
| Kraft Heinz Co. (The) | 34,941 | 891,694 |
| Lamb Weston Holdings, Inc. | 8,191 | 576,565 |
| McCormick & Co., Inc. | 6,855 | 1,116,474 |
| Mondelez International, Inc., Class A | 80,896 | 4,467,077 |
| Tyson Foods, Inc., Class A | 16,510 | 1,536,090 |
| | | | 15,086,084 |
See accompanying Notes to Financial Statements which are an integral part of the financial statements.
| 15 | Invesco S&P 500 Index Fund |
| | Shares | Value |
| Paper Packaging–0.27% |
| Amcor PLC | 91,153 | $895,122 |
| Avery Dennison Corp. | 4,696 | 542,717 |
| International Paper Co. | 22,280 | 871,148 |
| Packaging Corp. of America | 5,284 | 531,465 |
| Sealed Air Corp. | 8,702 | 346,514 |
| Westrock Co. | 14,435 | 493,388 |
| | | | 3,680,354 |
| Personal Products–0.19% |
| Coty, Inc., Class A | 16,878 | 161,185 |
| Estee Lauder Cos., Inc. (The), Class A | 12,314 | 2,438,049 |
| | | | 2,599,234 |
| Pharmaceuticals–4.31% |
| Allergan PLC | 17,304 | 2,763,795 |
| Bristol-Myers Squibb Co. | 91,863 | 4,415,854 |
| Eli Lilly and Co. | 48,525 | 5,481,869 |
| Johnson & Johnson | 149,111 | 19,139,888 |
| Merck & Co., Inc. | 144,594 | 12,503,043 |
| Mylan N.V.(b) | 28,948 | 563,618 |
| Nektar Therapeutics(b) | 9,836 | 172,819 |
| Perrigo Co. PLC | 6,989 | 326,945 |
| Pfizer, Inc. | 311,796 | 11,084,348 |
| Zoetis, Inc. | 26,881 | 3,398,296 |
| | | | 59,850,475 |
| Property & Casualty Insurance–0.88% |
| Allstate Corp. (The) | 18,707 | 1,915,410 |
| Chubb Ltd. | 25,713 | 4,018,427 |
| Cincinnati Financial Corp. | 8,473 | 953,128 |
| Loews Corp. | 15,067 | 724,271 |
| Progressive Corp. (The) | 32,796 | 2,485,937 |
| Travelers Cos., Inc. (The) | 14,728 | 2,164,427 |
| | | | 12,261,600 |
| Publishing–0.03% |
| News Corp., Class A | 21,651 | 297,701 |
| News Corp., Class B | 6,920 | 97,987 |
| | | | 395,688 |
| Railroads–0.91% |
| CSX Corp. | 43,170 | 2,893,253 |
| Kansas City Southern | 5,644 | 710,015 |
| Norfolk Southern Corp. | 14,955 | 2,602,918 |
| Union Pacific Corp. | 39,752 | 6,438,234 |
| | | | 12,644,420 |
| Real Estate Services–0.07% |
| CBRE Group, Inc., Class A(b) | 17,565 | 918,123 |
| Regional Banks–1.09% |
| BB&T Corp. | 43,014 | 2,049,617 |
| Citizens Financial Group, Inc. | 25,743 | 868,569 |
| Comerica, Inc. | 8,656 | 533,642 |
| Fifth Third Bancorp | 40,837 | 1,080,139 |
| | Shares | Value |
| Regional Banks–(continued) |
| First Republic Bank | 9,214 | $826,680 |
| Huntington Bancshares, Inc. | 58,769 | 778,689 |
| KeyCorp | 56,626 | 939,992 |
| M&T Bank Corp. | 7,672 | 1,121,723 |
| People’s United Financial, Inc. | 22,148 | 318,267 |
| PNC Financial Services Group, Inc. (The) | 25,365 | 3,270,309 |
| Regions Financial Corp. | 56,910 | 832,024 |
| SunTrust Banks, Inc. | 24,925 | 1,533,137 |
| SVB Financial Group(b) | 2,943 | 572,767 |
| Zions Bancorp. N.A. | 10,252 | 421,255 |
| | | | 15,146,810 |
| Reinsurance–0.04% |
| Everest Re Group, Ltd. | 2,274 | 536,391 |
| Research & Consulting Services–0.30% |
| Equifax, Inc. | 6,749 | 987,919 |
| IHS Markit Ltd.(b) | 20,429 | 1,340,347 |
| Nielsen Holdings PLC | 19,977 | 414,722 |
| Verisk Analytics, Inc. | 9,143 | 1,476,960 |
| | | | 4,219,948 |
| Residential REITs–0.48% |
| Apartment Investment & Management Co., Class A | 8,357 | 426,207 |
| AvalonBay Communities, Inc. | 7,828 | 1,663,920 |
| Equity Residential | 20,805 | 1,763,432 |
| Essex Property Trust, Inc. | 3,693 | 1,186,413 |
| Mid-America Apartment Communities, Inc. | 6,368 | 806,698 |
| UDR, Inc. | 15,825 | 762,448 |
| | | | 6,609,118 |
| Restaurants–1.43% |
| Chipotle Mexican Grill, Inc.(b) | 1,361 | 1,141,090 |
| Darden Restaurants, Inc. | 6,906 | 835,488 |
| McDonald’s Corp. | 42,881 | 9,346,771 |
| Starbucks Corp. | 68,022 | 6,568,204 |
| Yum! Brands, Inc. | 17,133 | 2,000,792 |
| | | | 19,892,345 |
| Retail REITs–0.41% |
| Federal Realty Investment Trust | 4,158 | 537,255 |
| Kimco Realty Corp. | 23,701 | 435,624 |
| Macerich Co. (The) | 5,920 | 168,898 |
| Realty Income Corp. | 17,679 | 1,304,887 |
| Regency Centers Corp. | 9,366 | 604,201 |
| Simon Property Group, Inc. | 17,352 | 2,584,407 |
| | | | 5,635,272 |
| Semiconductor Equipment–0.41% |
| Applied Materials, Inc. | 52,572 | 2,524,507 |
| KLA Corp. | 9,075 | 1,342,193 |
| Lam Research Corp. | 8,419 | 1,772,284 |
| | | | 5,638,984 |
See accompanying Notes to Financial Statements which are an integral part of the financial statements.
| 16 | Invesco S&P 500 Index Fund |
| | Shares | Value |
| Semiconductors–3.39% |
| Advanced Micro Devices, Inc.(b) | 49,809 | $1,566,493 |
| Analog Devices, Inc. | 20,766 | 2,280,730 |
| Broadcom, Inc. | 22,230 | 6,283,087 |
| Intel Corp. | 251,371 | 11,917,499 |
| Maxim Integrated Products, Inc. | 15,287 | 833,753 |
| Microchip Technology, Inc. | 13,361 | 1,153,455 |
| Micron Technology, Inc.(b) | 62,152 | 2,813,621 |
| NVIDIA Corp. | 34,201 | 5,729,009 |
| Qorvo, Inc.(b) | 6,690 | 477,867 |
| QUALCOMM, Inc. | 68,274 | 5,309,669 |
| Skyworks Solutions, Inc. | 9,733 | 732,603 |
| Texas Instruments, Inc. | 52,690 | 6,520,387 |
| Xilinx, Inc. | 14,259 | 1,483,792 |
| | | | 47,101,965 |
| Soft Drinks–1.72% |
| Coca-Cola Co. (The) | 215,631 | 11,868,330 |
| Monster Beverage Corp.(b) | 21,979 | 1,289,508 |
| PepsiCo, Inc. | 78,727 | 10,764,343 |
| | | | 23,922,181 |
| Specialized Consumer Services–0.02% |
| H&R Block, Inc. | 11,392 | 275,914 |
| Specialized REITs–1.41% |
| American Tower Corp. | 24,823 | 5,714,006 |
| Crown Castle International Corp. | 23,348 | 3,389,429 |
| Digital Realty Trust, Inc. | 11,722 | 1,449,191 |
| Equinix, Inc. | 4,720 | 2,625,642 |
| Extra Space Storage, Inc. | 7,118 | 867,827 |
| Iron Mountain, Inc. | 16,113 | 513,199 |
| Public Storage | 8,441 | 2,234,670 |
| SBA Communications Corp. | 6,359 | 1,668,792 |
| Weyerhaeuser Co. | 41,848 | 1,101,021 |
| | | | 19,563,777 |
| Specialty Chemicals–0.83% |
| Albemarle Corp.(e) | 5,913 | 365,009 |
| Celanese Corp. | 7,063 | 800,732 |
| DuPont de Nemours, Inc. | 42,028 | 2,854,962 |
| Ecolab, Inc. | 14,244 | 2,938,680 |
| International Flavors & Fragrances, Inc. | 5,714 | 627,112 |
| PPG Industries, Inc. | 13,291 | 1,472,510 |
| Sherwin-Williams Co. (The) | 4,562 | 2,403,033 |
| | | | 11,462,038 |
| Specialty Stores–0.14% |
| Tiffany & Co. | 6,066 | 514,822 |
| Tractor Supply Co. | 6,781 | 690,848 |
| Ulta Beauty, Inc.(b) | 3,118 | 741,242 |
| | | | 1,946,912 |
| Steel–0.06% |
| Nucor Corp. | 17,076 | 836,382 |
| | Shares | Value |
| Systems Software–4.89% |
| Fortinet, Inc.(b) | 8,110 | $642,150 |
| Microsoft Corp. | 430,353 | 59,328,465 |
| Oracle Corp. | 136,276 | 7,094,528 |
| Symantec Corp. | 34,717 | 807,170 |
| | | | 67,872,313 |
| Technology Hardware, Storage & Peripherals–4.07% |
| Apple, Inc. | 245,482 | 51,241,913 |
| Hewlett Packard Enterprise Co. | 75,208 | 1,039,374 |
| HP, Inc. | 84,595 | 1,547,242 |
| NetApp, Inc. | 13,911 | 668,563 |
| Seagate Technology PLC | 14,148 | 710,371 |
| Western Digital Corp. | 16,454 | 942,321 |
| Xerox Holdings Corp. | 10,975 | 318,165 |
| | | | 56,467,949 |
| Tobacco–0.78% |
| Altria Group, Inc. | 105,073 | 4,595,893 |
| Philip Morris International, Inc. | 87,375 | 6,298,864 |
| | | | 10,894,757 |
| Trading Companies & Distributors–0.16% |
| Fastenal Co. | 32,141 | 984,157 |
| United Rentals, Inc.(b) | 4,400 | 495,264 |
| W.W. Grainger, Inc. | 2,521 | 689,872 |
| | | | 2,169,293 |
| Trucking–0.04% |
| J.B. Hunt Transport Services, Inc. | 4,864 | 525,507 |
| Water Utilities–0.09% |
| American Water Works Co., Inc. | 10,107 | 1,286,823 |
| Wireless Telecommunication Services–0.10% |
| T-Mobile US, Inc.(b) | 17,750 | 1,385,387 |
| Total Common Stocks & Other Equity Interests (Cost $660,516,144) | 1,367,889,343 |
| Money Market Funds–1.29% |
| Invesco Government & Agency Portfolio, Institutional Class, 2.02%(f) | 6,262,859 | 6,262,859 |
| Invesco Liquid Assets Portfolio, Institutional Class, 2.14%(f) | 4,473,644 | 4,475,434 |
| Invesco Treasury Portfolio, Institutional Class, 1.98%(f) | 7,157,552 | 7,157,552 |
| Total Money Market Funds (Cost $17,894,876) | 17,895,845 |
| TOTAL INVESTMENTS IN SECURITIES (excluding investments purchased with cash collateral from securities on loan)-99.88% (Cost $678,411,020) | | | 1,385,785,188 |
| Investments Purchased with Cash Collateral from Securities on Loan |
| Money Market Funds–0.02% |
| Invesco Government & Agency Portfolio, Institutional Class, 2.02%(f)(g) | 247,440 | 247,440 |
See accompanying Notes to Financial Statements which are an integral part of the financial statements.
| 17 | Invesco S&P 500 Index Fund |
| | Shares | Value |
| Money Market Funds–(continued) |
| Invesco Liquid Assets Portfolio, Institutional Class, 2.14%(f)(g) | 82,447 | $82,480 |
| Total Investments Purchased with Cash Collateral from Securities on Loan (Cost $329,920) | 329,920 |
| TOTAL INVESTMENTS IN SECURITIES–99.90% (Cost $678,740,940) | 1,386,115,108 |
| OTHER ASSETS LESS LIABILITIES—0.10% | 1,328,029 |
| NET ASSETS–100.00% | $1,387,443,137 |
Investment Abbreviations:
| REIT | – Real Estate Investment Trust |
Notes to Schedule of Investments:
| (a) | Industry and/or sector classifications used in this report are generally according to the Global Industry Classification Standard, which was developed by and is the exclusive property and a service mark of MSCI Inc. and Standard & Poor’s. |
| (b) | Non-income producing security. |
| (c) | The Fund’s Adviser is a subsidiary of Invesco Ltd. and therefore, Invesco Ltd. is considered to be affiliated with the Fund. The value of this security as of August 31, 2019 represented less than 1% of the Fund’s Net Assets. See Note 5. |
| (d) | All or a portion of the value was pledged as collateral to cover margin requirements for open futures contracts. See Note 1J. |
| (e) | All or a portion of this security was out on loan at August 31, 2019. |
| (f) | The money market fund and the Fund are affiliated by having the same investment adviser. The rate shown is the 7-day SEC standardized yield as of August 31, 2019. |
| (g) | The security has been segregated to satisfy the commitment to return the cash collateral received in securities lending transactions upon the borrower’s return of the securities loaned. See Note 1I. |
| Open Futures Contracts |
| Long Futures Contracts | Number of
Contracts | Expiration
Month | Notional
Value | Value | Unrealized
Appreciation |
| Equity Risk |
| E-Mini S&P 500 Index | 139 | September-2019 | $20,327,360 | $46,954 | $46,954 |
See accompanying Notes to Financial Statements which are an integral part of the financial statements.
| 18 | Invesco S&P 500 Index Fund |
Statement of Assets and Liabilities
August 31, 2019
| Assets: | |
Investments in securities, at value
(Cost $659,961,680)* | $1,367,536,156 |
Investments in affiliates, at value
(Cost $18,779,260) | 18,578,952 |
| Cash | 122,539 |
| Receivable for: | |
| Fund shares sold | 1,519,061 |
| Dividends | 2,692,389 |
| Investment for trustee deferred compensation and retirement plans | 81,966 |
| Other assets | 46,358 |
| Total assets | 1,390,577,421 |
| Liabilities: | |
| Other investments: | |
| Variation margin payable - futures contracts | 13,205 |
| Payable for: | |
| Fund shares reacquired | 1,656,067 |
| Collateral upon return of securities loaned | 329,920 |
| Accrued fees to affiliates | 866,367 |
| Accrued trustees’ and officers’ fees and benefits | 4,277 |
| Accrued other operating expenses | 171,547 |
| Trustee deferred compensation and retirement plans | 92,901 |
| Total liabilities | 3,134,284 |
| Net assets applicable to shares outstanding | $1,387,443,137 |
| Net assets consist of: | |
| Shares of beneficial interest | $677,885,336 |
| Distributable earnings | 709,557,801 |
| | $1,387,443,137 |
| Net Assets: |
| Class A | $906,581,317 |
| Class C | $294,011,144 |
| Class Y | $181,204,472 |
| Class R6 | $5,646,204 |
| Shares outstanding, no par value, with an unlimited number of shares authorized: |
| Class A | 28,696,333 |
| Class C | 9,683,319 |
| Class Y | 5,660,567 |
| Class R6 | 176,307 |
| Class A: | |
| Net asset value per share | $31.59 |
Maximum offering price per share
(Net asset value of $31.59 ÷ 94.50%) | $33.43 |
| Class C: | |
| Net asset value and offering price per share | $30.36 |
| Class Y: | |
| Net asset value and offering price per share | $32.01 |
| Class R6: | |
| Net asset value and offering price per share | $32.02 |
| * | At August 31, 2019, securities with an aggregate value of $321,867 were on loan to brokers. |
See accompanying Notes to Financial Statements which are an integral part of the financial statements.
| 19 | Invesco S&P 500 Index Fund |
Statement of Operations
For the year ended August 31, 2019
| Investment income: | |
| Dividends | $25,801,137 |
| Dividends from affiliates (includes securities lending income of $4,478) | 628,726 |
| Total investment income | 26,429,863 |
| Expenses: | |
| Advisory fees | 1,570,872 |
| Administrative services fees | 226,524 |
| Custodian fees | 22,349 |
| Distribution fees: | |
| Class A | 2,044,293 |
| Class C | 3,029,091 |
| Transfer agent fees — A, C and Y | 1,624,944 |
| Transfer agent fees — R6 | 3,688 |
| Trustees’ and officers’ fees and benefits | 38,893 |
| Registration and filing fees | 95,202 |
| Licensing fees | 261,763 |
| Reports to shareholders | 77,663 |
| Professional services fees | 69,538 |
| Other | 44,011 |
| Total expenses | 9,108,831 |
| Less: Fees waived and/or expense offset arrangement(s) | (35,695) |
| Net expenses | 9,073,136 |
| Net investment income | 17,356,727 |
| Realized and unrealized gain (loss) from: | |
| Net realized gain from: | |
| Investment securities | 9,008,354 |
| Futures contracts | 2,282,763 |
| | 11,291,117 |
| Change in net unrealized appreciation (depreciation) of: | |
| Investment securities | 7,389,129 |
| Futures contracts | (1,177,951) |
| | 6,211,178 |
| Net realized and unrealized gain | 17,502,295 |
| Net increase in net assets resulting from operations | $34,859,022 |
See accompanying Notes to Financial Statements which are an integral part of the financial statements.
| 20 | Invesco S&P 500 Index Fund |
Statement of Changes in Net Assets
For the years ended August 31, 2019 and 2018
| | 2019 | 2018 |
| Operations: | | |
| Net investment income | $17,356,727 | $13,833,295 |
| Net realized gain | 11,291,117 | 28,129,383 |
| Change in net unrealized appreciation | 6,211,178 | 162,674,203 |
| Net increase in net assets resulting from operations | 34,859,022 | 204,636,881 |
| Distributions to shareholders from distributable earnings(1): | | |
| Class A | (17,931,707) | (9,069,459) |
| Class B | — | (8,313) |
| Class C | (5,722,985) | (2,178,576) |
| Class Y | (3,847,793) | (2,294,947) |
| Class R6 | (108,124) | (5,812) |
| Total distributions from distributable earnings | (27,610,609) | (13,557,107) |
| Share transactions–net: | | |
| Class A | 92,451,578 | 25,874,696 |
| Class B | — | (1,675,552) |
| Class C | (45,672,438) | 22,566,167 |
| Class Y | 24,054,463 | (14,506,640) |
| Class R6 | 1,368,709 | 3,724,262 |
| Net increase in net assets resulting from share transactions | 72,202,312 | 35,982,933 |
| Net increase in net assets | 79,450,725 | 227,062,707 |
| Net assets: | | |
| Beginning of year | 1,307,992,412 | 1,080,929,705 |
| End of year | $1,387,443,137 | $1,307,992,412 |
| (1) | The Securities and Exchange Commission eliminated the requirement to disclose distribution components separately, except for tax return of capital. For the year ended August 31, 2018, distributions to shareholders from distributable earnings consisted of distributions from net investment income. |
See accompanying Notes to Financial Statements which are an integral part of the financial statements.
| 21 | Invesco S&P 500 Index Fund |
Financial Highlights
August 31, 2019
The following schedule presents financial highlights for a share of the Fund outstanding throughout the periods indicated.
| | Net asset
value,
beginning
of period | Net
investment
income(a) | Net gains
(losses)
on securities
(both
realized and
unrealized) | Total from
investment
operations | Dividends
from net
investment
income | Distributions
from net
realized
gains | Total
distributions | Net asset
value, end
of period | Total
return(b) | Net assets,
end of period
(000’s omitted) | Ratio of
expenses
to average
net assets
with fee waivers
and/or
expenses
absorbed | Ratio of
expenses
to average net
assets without
fee waivers
and/or
expenses
absorbed | Ratio of net
investment
income
to average
net assets | Portfolio
turnover(c) |
| Class A |
| Year ended 08/31/19 | $31.63 | $0.45 | $0.20 | $0.65 | $(0.42) | $(0.27) | $(0.69) | $31.59 | 2.36%(d) | $906,581 | 0.55%(d)(e) | 0.55%(d)(e) | 1.47%(d)(e) | 3% |
| Year ended 08/31/18 | 26.93 | 0.38 | 4.69 | 5.07 | (0.37) | — | (0.37) | 31.63 | 18.96 | 805,009 | 0.57 | 0.57 | 1.30 | 4 |
| Year ended 08/31/17 | 23.60 | 0.38 | 3.26 | 3.64 | (0.31) | — | (0.31) | 26.93 | 15.55 | 661,887 | 0.58 | 0.58 | 1.52 | 4 |
| Year ended 08/31/16 | 21.42 | 0.36 | 2.16 | 2.52 | (0.34) | — | (0.34) | 23.60 | 11.89 | 600,869 | 0.59 | 0.59 | 1.62 | 6 |
| Year ended 08/31/15 | 21.69 | 0.32 | (0.33) | (0.01) | (0.26) | — | (0.26) | 21.42 | (0.05) | 534,656 | 0.58 | 0.58 | 1.44 | 4 |
| Class C |
| Year ended 08/31/19 | 30.43 | 0.21 | 0.21 | 0.42 | (0.22) | (0.27) | (0.49) | 30.36 | 1.60 | 294,011 | 1.31(e) | 1.31(e) | 0.71(e) | 3 |
| Year ended 08/31/18 | 25.95 | 0.17 | 4.51 | 4.68 | (0.20) | — | (0.20) | 30.43 | 18.11(f) | 345,823 | 1.29(f) | 1.29(f) | 0.58(f) | 4 |
| Year ended 08/31/17 | 22.77 | 0.19 | 3.14 | 3.33 | (0.15) | — | (0.15) | 25.95 | 14.71(f) | 274,100 | 1.31(f) | 1.31(f) | 0.79(f) | 4 |
| Year ended 08/31/16 | 20.70 | 0.19 | 2.08 | 2.27 | (0.20) | — | (0.20) | 22.77 | 11.05(f) | 222,221 | 1.32(f) | 1.32(f) | 0.89(f) | 6 |
| Year ended 08/31/15 | 20.99 | 0.15 | (0.32) | (0.17) | (0.12) | — | (0.12) | 20.70 | (0.81) | 164,876 | 1.33 | 1.33 | 0.69 | 4 |
| Class Y |
| Year ended 08/31/19 | 32.04 | 0.53 | 0.20 | 0.73 | (0.49) | (0.27) | (0.76) | 32.01 | 2.62 | 181,204 | 0.31(e) | 0.31(e) | 1.71(e) | 3 |
| Year ended 08/31/18 | 27.26 | 0.46 | 4.75 | 5.21 | (0.43) | — | (0.43) | 32.04 | 19.29 | 152,974 | 0.32 | 0.32 | 1.55 | 4 |
| Year ended 08/31/17 | 23.88 | 0.45 | 3.29 | 3.74 | (0.36) | — | (0.36) | 27.26 | 15.83 | 143,171 | 0.33 | 0.33 | 1.77 | 4 |
| Year ended 08/31/16 | 21.67 | 0.42 | 2.18 | 2.60 | (0.39) | — | (0.39) | 23.88 | 12.15 | 87,687 | 0.34 | 0.34 | 1.87 | 6 |
| Year ended 08/31/15 | 21.94 | 0.38 | (0.34) | 0.04 | (0.31) | — | (0.31) | 21.67 | 0.17 | 48,047 | 0.33 | 0.33 | 1.69 | 4 |
| Class R6 |
| Year ended 08/31/19 | 32.05 | 0.54 | 0.20 | 0.74 | (0.50) | (0.27) | (0.77) | 32.02 | 2.65 | 5,646 | 0.26(e) | 0.26(e) | 1.76(e) | 3 |
| Year ended 08/31/18 | 27.28 | 0.48 | 4.75 | 5.23 | (0.46) | — | (0.46) | 32.05 | 19.33 | 4,186 | 0.29 | 0.29 | 1.58 | 4 |
| Year ended 08/31/17(g) | 25.85 | 0.20 | 1.23 | 1.43 | — | — | — | 27.28 | 5.53 | 284 | 0.26(h) | 0.26(h) | 1.84(h) | 4 |
| (a) | Calculated using average shares outstanding. |
| (b) | Includes adjustments in accordance with accounting principles generally accepted in the United States of America and as such, the net asset value for financial reporting purposes and the returns based upon those net asset values may differ from the net asset value and returns for shareholder transactions. Not annualized for periods less than one year, if applicable. |
| (c) | Portfolio turnover is calculated at the fund level and is not annualized for periods less than one year, if applicable. |
| (d) | The total return, ratio of expenses to average net assets and ratio of net investment income to average net assets reflect actual 12b-1 fees of 0.24% for the year ended August 31, 2019. |
| (e) | Ratios are based on average daily net assets (000’s omitted) of $832,727, $302,910, $168,680 and $4,743 for Class A, Class C, Class Y and Class R6 shares, respectively. |
| (f) | The total return, ratio of expenses to average net assets and ratio of net investment income to average net assets reflect actual 12b-1 fees of 0.97%, 0.98% and 0.98% for the years ended August 31, 2018, August 31, 2017 and August 31, 2016, respectively. |
| (g) | Commencement date of April 04, 2017. |
| (h) | Annualized. |
See accompanying Notes to Financial Statements which are an integral part of the financial statements.
| 22 | Invesco S&P 500 Index Fund |
Notes to Financial Statements
August 31, 2019
NOTE 1—Significant Accounting Policies
Invesco S&P 500 Index Fund (the “Fund”) is a series portfolio of AIM Counselor Series Trust (Invesco Counselor Series Trust) (the “Trust”). The Trust is a Delaware statutory trust registered under the Investment Company Act of 1940, as amended (the “1940 Act”), as an open-end series management investment company authorized to issue an unlimited number of shares of beneficial interest. Information presented in these financial statements pertains only to the Fund. Matters affecting the Fund or each class will be voted on exclusively by the shareholders of the Fund or each class.
The Fund’s investment objective is total return through growth of capital and current income.
The Fund currently consists of four different classes of shares: Class A, Class C, Class Y and Class R6. Class Y shares are available only to certain investors. Class A shares are sold with a front-end sales charge unless certain waiver criteria are met. Under certain circumstances, load waived shares may be subject to contingent deferred sales charges ("CDSC"). Class C shares are sold with a CDSC. Class Y and Class R6 shares are sold at net asset value. Class C shares held for ten years after purchase are eligible for automatic conversion into Class A shares of the same Fund (the "Conversion Feature"). The automatic conversion pursuant to the Conversion Feature will generally occur at the end of the month following the tenth anniversary after a purchase of Class C shares.
The Fund is an investment company and accordingly follows the investment company accounting and reporting guidance in accordance with Financial Accounting Standards Board Accounting Standards Codification Topic 946,Financial Services – Investment Companies.
The following is a summary of the significant accounting policies followed by the Fund in the preparation of its financial statements.
| A. | Security Valuations — Securities, including restricted securities, are valued according to the following policy. |
A security listed or traded on an exchange (except convertible securities) is valued at its last sales price or official closing price as of the close of the customary trading session on the exchange where the security is principally traded, or lacking any sales or official closing price on a particular day, the security may be valued at the closing bid price on that day. Securities traded in the over-the-counter market are valued based on prices furnished by independent pricing services or market makers. When such securities are valued by an independent pricing service they may be considered fair valued. Futures contracts are valued at the final settlement price set by an exchange on which they are principally traded. Listed options are valued at the mean between the last bid and asked prices from the exchange on which they are principally traded. Options not listed on an exchange are valued by an independent source at the mean between the last bid and asked prices. For purposes of determining net asset value (“NAV”) per share, futures and option contracts generally are valued 15 minutes after the close of the customary trading session of the New York Stock Exchange (“NYSE”).
Investments in open-end and closed-end registered investment companies that do not trade on an exchange are valued at the end-of-day net asset value per share. Investments in open-end and closed-end registered investment companies that trade on an exchange are valued at the last sales price or official closing price as of the close of the customary trading session on the exchange where the security is principally traded.
Debt obligations (including convertible securities) and unlisted equities are fair valued using an evaluated quote provided by an independent pricing service. Evaluated quotes provided by the pricing service may be determined without exclusive reliance on quoted prices, and may reflect appropriate factors such as institution-size trading in similar groups of securities, developments related to specific securities, dividend rate (for unlisted equities), yield (for debt obligations), quality, type of issue, coupon rate (for debt obligations), maturity (for debt obligations), individual trading characteristics and other market data. Pricing services generally value debt obligations assuming orderly transactions of institutional round lot size, but a fund may hold or transact in the same securities in smaller, odd lot sizes. Odd lots often trade at lower prices than institutional round lots. Debt obligations are subject to interest rate and credit risks. In addition, all debt obligations involve some risk of default with respect to interest and/or principal payments.
Foreign securities’ (including foreign exchange contracts) prices are converted into U.S. dollar amounts using the applicable exchange rates as of the close of the NYSE. If market quotations are available and reliable for foreign exchange-traded equity securities, the securities will be valued at the market quotations. Because trading hours for certain foreign securities end before the close of the NYSE, closing market quotations may become unreliable. If between the time trading ends on a particular security and the close of the customary trading session on the NYSE, events occur that the investment adviser determines are significant and make the closing price unreliable, the Fund may fair value the security. If the event is likely to have affected the closing price of the security, the security will be valued at fair value in good faith using procedures approved by the Board of Trustees. Adjustments to closing prices to reflect fair value may also be based on a screening process of an independent pricing service to indicate the degree of certainty, based on historical data, that the closing price in the principal market where a foreign security trades is not the current value as of the close of the NYSE. Foreign securities’ prices meeting the approved degree of certainty that the price is not reflective of current value will be priced at the indication of fair value from the independent pricing service. Multiple factors may be considered by the independent pricing service in determining adjustments to reflect fair value and may include information relating to sector indices, American Depositary Receipts and domestic and foreign index futures. Foreign securities may have additional risks including exchange rate changes, potential for sharply devalued currencies and high inflation, political and economic upheaval, the relative lack of issuer information, relatively low market liquidity and the potential lack of strict financial and accounting controls and standards.
Securities for which market prices are not provided by any of the above methods may be valued based upon quotes furnished by independent sources. The last bid price may be used to value equity securities. The mean between the last bid and asked prices is used to value debt obligations, including corporate loans.
Securities for which market quotations are not readily available or became unreliable are valued at fair value as determined in good faith by or under the supervision of the Trust’s officers following procedures approved by the Board of Trustees. Issuer specific events, market trends, bid/asked quotes of brokers and information providers and other market data may be reviewed in the course of making a good faith determination of a security’s fair value.
The Fund may invest in securities that are subject to interest rate risk, meaning the risk that the prices will generally fall as interest rates rise and, conversely, the prices will generally rise as interest rates fall. Specific securities differ in their sensitivity to changes in interest rates depending on their individual characteristics. Changes in interest rates may result in increased market volatility, which may affect the value and/or liquidity of certain Fund investments.
| 23 | Invesco S&P 500 Index Fund |
Valuations change in response to many factors including the historical and prospective earnings of the issuer, the value of the issuer’s assets, general economic conditions, interest rates, investor perceptions and market liquidity. Because of the inherent uncertainties of valuation, the values reflected in the financial statements may materially differ from the value received upon actual sale of those investments.
| B. | Securities Transactions and Investment Income – Securities transactions are accounted for on a trade date basis. Realized gains or losses on sales are computed on the basis of specific identification of the securities sold. Interest income (net of withholding tax, if any) is recorded on the accrual basis from settlement date. Bond premiums and discounts are amortized and/or accreted over the lives of the respective securities. Pay-in-kind interest income and non-cash dividend income received in the form of securities in-lieu of cash are recorded at the fair value of the securities received. Dividend income (net of withholding tax, if any) is recorded on the ex-dividend date. |
The Fund may periodically participate in litigation related to Fund investments. As such, the Fund may receive proceeds from litigation settlements. Any proceeds received are included in the Statement of Operations as realized gain (loss) for investments no longer held and as unrealized gain (loss) for investments still held.
Brokerage commissions and mark ups are considered transaction costs and are recorded as an increase to the cost basis of securities purchased and/or a reduction of proceeds on a sale of securities. Such transaction costs are included in the determination of net realized and unrealized gain (loss) from investment securities reported in the Statement of Operations and the Statement of Changes in Net Assets and the net realized and unrealized gains (losses) on securities per share in the Financial Highlights. Transaction costs are included in the calculation of the Fund’s net asset value and, accordingly, they reduce the Fund’s total returns. These transaction costs are not considered operating expenses and are not reflected in net investment income reported in the Statement of Operations and the Statement of Changes in Net Assets, or the net investment income per share and the ratios of expenses and net investment income reported in the Financial Highlights, nor are they limited by any expense limitation arrangements between the Fund and the investment adviser.
The Fund allocates realized and unrealized capital gains and losses to a class based on the relative net assets of each class. The Fund allocates income to a class based on the relative value of the settled shares of each class.
| C. | Country Determination — For the purposes of making investment selection decisions and presentation in the Schedule of Investments, the investment adviser may determine the country in which an issuer is located and/or credit risk exposure based on various factors. These factors include the laws of the country under which the issuer is organized, where the issuer maintains a principal office, the country in which the issuer derives 50% or more of its total revenues and the country that has the primary market for the issuer’s securities, as well as other criteria. Among the other criteria that may be evaluated for making this determination are the country in which the issuer maintains 50% or more of its assets, the type of security, financial guarantees and enhancements, the nature of the collateral and the sponsor organization. Country of issuer and/or credit risk exposure has been determined to be the United States of America, unless otherwise noted. |
| D. | Distributions– Distributions from net investment income and net realized capital gain, if any, are generally declared and paid annually and recorded on the ex-dividend date. The Fund may elect to treat a portion of the proceeds from redemptions as distributions for federal income tax purposes. |
| E. | Federal Income Taxes –The Fund intends to comply with the requirements of Subchapter M of the Internal Revenue Code of 1986, as amended (the “Internal Revenue Code”), necessary to qualify as a regulated investment company and to distribute substantially all of the Fund’s taxable earnings to shareholders. As such, the Fund will not be subject to federal income taxes on otherwise taxable income (including net realized capital gain) that is distributed to shareholders. Therefore, no provision for federal income taxes is recorded in the financial statements. |
The Fund recognizes the tax benefits of uncertain tax positions only when the position is more likely than not to be sustained. Management has analyzed the Fund’s uncertain tax positions and concluded that no liability for unrecognized tax benefits should be recorded related to uncertain tax positions. Management is not aware of any tax positions for which it is reasonably possible that the total amounts of unrecognized tax benefits will change materially in the next 12 months.
The Fund files tax returns in the U.S. Federal jurisdiction and certain other jurisdictions. Generally, the Fund is subject to examinations by such taxing authorities for up to three years after the filing of the return for the tax period.
| F. | Expenses – Fees provided for under the Rule 12b-1 plan of a particular class of the Fund are charged to the operations of such class. Transfer agency fees and expenses and other shareholder recordkeeping fees and expenses attributable to Class R6 are charged to such class. Transfer agency fees and expenses and other shareholder recordkeeping fees and expenses relating to all other classes are allocated among those classes based on relative net assets. All other expenses are allocated among the classes based on relative net assets. |
| G. | Accounting Estimates – The preparation of financial statements in conformity with accounting principles generally accepted in the United States of America (“GAAP”) requires management to make estimates and assumptions that affect the reported amounts of assets and liabilities at the date of the financial statements and the reported amounts of revenues and expenses during the reporting period including estimates and assumptions related to taxation. Actual results could differ from those estimates by a significant amount. In addition, the Fund monitors for material events or transactions that may occur or become known after the period-end date and before the date the financial statements are released to print. |
| H. | Indemnifications – Under the Trust’s organizational documents, each Trustee, officer, employee or other agent of the Trust is indemnified against certain liabilities that may arise out of the performance of their duties to the Fund. Additionally, in the normal course of business, the Fund enters into contracts, including the Fund’s servicing agreements, that contain a variety of indemnification clauses. The Fund’s maximum exposure under these arrangements is unknown as this would involve future claims that may be made against the Fund that have not yet occurred. The risk of material loss as a result of such indemnification claims is considered remote. |
| I. | Securities Lending– The Fund may lend portfolio securities having a market value up to one-third of the Fund’s total assets. Such loans are secured by collateral equal to no less than the market value of the loaned securities determined daily by the securities lending provider. Such collateral will be cash or debt securities issued or guaranteed by the U.S. Government or any of its sponsored agencies. Cash collateral received in connection with these loans is invested in short-term money market instruments or affiliated money market funds and is shown as such on the Schedule of Investments. The Fund bears the risk of loss with respect to the investment of collateral. It is the Fund’s policy to obtain additional collateral from or return excess collateral to the borrower by the end of the next business day, following the valuation date of the securities loaned. Therefore, the value of the collateral held may be temporarily less than the value of the securities on loan. When loaning securities, the Fund retains certain benefits of owning the securities, including the economic equivalent of dividends or interest generated by the security. Lending securities entails a risk of loss to the Fund if, and to the extent that, the market value of the securities loaned were to increase and the |
| 24 | Invesco S&P 500 Index Fund |
| | borrower did not increase the collateral accordingly, and the borrower failed to return the securities. The securities loaned are subject to termination at the option of the borrower or the Fund. Upon termination, the borrower will return to the Fund the securities loaned and the Fund will return the collateral. Upon the failure of the borrower to return the securities, collateral may be liquidated and the securities may be purchased on the open market to replace the loaned securities. The Fund could experience delays and costs in gaining access to the collateral and the securities may lose value during the delay which could result in potential losses to the Fund. Some of these losses may be indemnified by the lending agent. The Fund bears the risk of any deficiency in the amount of the collateral available for return to the borrower due to any loss on the collateral invested. Dividends received on cash collateral investments for securities lending transactions, which are net of compensation to counterparties, are included inDividends from affiliated money market funds on the Statement of Operations. The aggregate value of securities out on loan, if any, is shown as a footnote on the Statement of Assets and Liabilities. |
| J. | Futures Contracts — The Fund may enter into futures contracts to manage exposure to interest rate, equity and market price movements and/or currency risks. A futures contract is an agreement between two parties ("Counterparties") to purchase or sell a specified underlying security, currency or commodity (or delivery of a cash settlement price, in the case of an index future) for a fixed price at a future date. The Fund currently invests only in exchange-traded futures and they are standardized as to maturity date and underlying financial instrument. Initial margin deposits required upon entering into futures contracts are satisfied by the segregation of specific securities or cash as collateral at the futures commission merchant (broker). During the period the futures contracts are open, changes in the value of the contracts are recognized as unrealized gains or losses by recalculating the value of the contracts on a daily basis. Subsequent or variation margin payments are received or made depending upon whether unrealized gains or losses are incurred. These amounts are reflected as receivables or payables on the Statement of Assets and Liabilities. When the contracts are closed or expire, the Fund recognizes a realized gain or loss equal to the difference between the proceeds from, or cost of, the closing transaction and the Fund’s basis in the contract. The net realized gain (loss) and the change in unrealized gain (loss) on futures contracts held during the period is included on the Statement of Operations. The primary risks associated with futures contracts are market risk and the absence of a liquid secondary market. If the Fund were unable to liquidate a futures contract and/or enter into an offsetting closing transaction, the Fund would continue to be subject to market risk with respect to the value of the contracts and continue to be required to maintain the margin deposits on the futures contracts. Futures contracts have minimal Counterparty risk since the exchange’s clearinghouse, as Counterparty to all exchange-traded futures, guarantees the futures against default. Risks may exceed amounts recognized in the Statement of Assets and Liabilities. |
| K. | Collateral—To the extent the Fund has designated or segregated a security as collateral and that security is subsequently sold, it is the Fund’s practice to replace such collateral no later than the next business day. This practice does not apply to securities pledged as collateral for securities lending transactions. |
NOTE 2—Advisory Fees and Other Fees Paid to Affiliates
The Trust has entered into a master investment advisory agreement with Invesco Advisers, Inc. (the "Adviser" or "Invesco"). Under the terms of the investment advisory agreement, the Fund accrues daily and pays monthly an advisory fee to the Adviser based on the annual rate of the Fund’s average daily net assets as follows:
| Average Daily Net Assets | Rate |
| First $2 billion | 0.12% |
| Over $2 billion | 0.10% |
For the year ended August 31, 2019, the effective advisory fees incurred by the Fund was 0.12%.
Under the terms of a master sub-advisory agreement between the Adviser and each of Invesco Asset Management Deutschland GmbH, Invesco Asset Management Limited, Invesco Asset Management (Japan) Limited, Invesco Hong Kong Limited, Invesco Senior Secured Management, Inc. and Invesco Canada Ltd. (collectively, the "Affiliated Sub-Advisers") the Adviser, not the Fund, will pay 40% of the fees paid to the Adviser to any such Affiliated Sub-Adviser(s) that provide(s) discretionary investment management services to the Fund based on the percentage of assets allocated to such Affiliated Sub-Adviser(s).
The Adviser has contractually agreed, through at least June 30, 2020, to waive advisory fees and/or reimburse expenses to the extent necessary to limit total annual fund operating expenses after fee waiver and/or reimbursement (excluding certain items discussed below) of Class A, Class C, Class Y and Class R6 shares to 2.00%, 2.75%, 1.75% and 1.75%, respectively, of the Fund’s average daily net assets (the "expense limits"). In determining the Adviser’s obligation to waive advisory fees and/or reimburse expenses, the following expenses are not taken into account, and could cause total annual fund operating expenses after fee waiver and/or reimbursement to exceed the numbers reflected above: (1) interest; (2) taxes; (3) dividend expense on short sales; (4) extraordinary or non-routine items, including litigation expenses; and (5) expenses that the Fund has incurred but did not actually pay because of an expense offset arrangement. Unless Invesco continues the fee waiver agreement, it will terminate on June 30, 2020. During its term, the fee waiver agreement cannot be terminated or amended to increase the expense limits or reduce the advisory fee waivers without approval of the Board of Trustees. The Adviser did not waive fees and/or reimburse expenses during the period under this expense limit.
Further, the Adviser has contractually agreed, through at least June 30, 2021, to waive the advisory fee payable by the Fund in an amount equal to 100% of the net advisory fees the Adviser receives from the affiliated money market funds on investments by the Fund of uninvested cash (excluding investments of cash collateral from securities lending) in such affiliated money market funds.
For the year ended August 31, 2019, the Adviser waived advisory fees of $30,246.
The Trust has entered into a master administrative services agreement with Invesco pursuant to which the Fund has agreed to pay Invesco for certain administrative costs incurred in providing accounting services to the Fund. For the year ended August 31, 2019, expenses incurred under the agreement are shown in the Statement of Operations asAdministrative services fees. Also, Invesco has entered into a sub-administration agreement whereby State Street Bank and Trust Company (“SSB”) serves as custodian and fund accountant and provides certain administrative services to the Fund.
The Trust has entered into a transfer agency and service agreement with Invesco Investment Services, Inc. (“IIS”) pursuant to which the Fund has agreed to pay IIS a fee for providing transfer agency and shareholder services to the Fund and reimburse IIS for certain expenses incurred by IIS in the course of providing such services. IIS may make payments to intermediaries that provide omnibus account services, sub-accounting services and/or
| 25 | Invesco S&P 500 Index Fund |
networking services. All fees payable by IIS to intermediaries that provide omnibus account services or sub-accounting services are charged back to the Fund, subject to certain limitations approved by the Trust’s Board of Trustees. For the year ended August 31, 2019, expenses incurred under the agreement are shown in the Statement of Operations asTransfer agent fees.
Shares of the Fund are distributed by Invesco Distributors, Inc. (“IDI”), an affiliate of the Adviser. The Fund has adopted a Plan of Distribution (the “Plan”) pursuant to Rule 12b-1 under the 1940 Act. The Plan provides that the Fund will reimburse IDI for distribution related expenses that IDI incurs up to a maximum of the following annual rates: (1) Class A — up to 0.25% of the average daily net assets of Class A shares; and (2) Class C — up to 1.00% of the average daily net assets of Class C shares. The fees are accrued daily and paid monthly.
For the year ended August 31, 2019, expenses incurred under these agreements are shown in the Statement of Operations asDistribution fees.
Front-end sales commissions and CDSC (collectively, the “sales charges”) are not recorded as expenses of the Fund. Front-end sales commissions are deducted from proceeds from the sales of Fund shares prior to investment in Class A shares of the Fund. CDSC are deducted from redemption proceeds prior to remittance to the shareholder. During the year ended August 31, 2019, IDI advised the Fund that IDI retained $93,003 in front-end sales commissions from the sale of Class A shares and $11,650 and $25,452 from Class A and Class C shares, respectively, for CDSC imposed upon redemptions by shareholders.
Certain officers and trustees of the Trust are officers and directors of the Adviser, IIS and/or IDI.
NOTE 3—Additional Valuation Information
GAAP defines fair value as the price that would be received to sell an asset or paid to transfer a liability in an orderly transaction between market participants at the measurement date, under current market conditions. GAAP establishes a hierarchy that prioritizes the inputs to valuation methods, giving the highest priority to readily available unadjusted quoted prices in an active market for identical assets (Level 1) and the lowest priority to significant unobservable inputs (Level 3), generally when market prices are not readily available or are unreliable. Based on the valuation inputs, the securities or other investments are tiered into one of three levels. Changes in valuation methods may result in transfers in or out of an investment’s assigned level:
Level 1 – Prices are determined using quoted prices in an active market for identical assets.
Level 2 – Prices are determined using other significant observable inputs. Observable inputs are inputs that other market participants may use in pricing a security. These may include quoted prices for similar securities, interest rates, prepayment speeds, credit risk, yield curves, loss severities, default rates, discount rates, volatilities and others.
Level 3 – Prices are determined using significant unobservable inputs. In situations where quoted prices or observable inputs are unavailable (for example, when there is little or no market activity for an investment at the end of the period), unobservable inputs may be used. Unobservable inputs reflect the Fund’s own assumptions about the factors market participants would use in determining fair value of the securities or instruments and would be based on the best available information.
The following is a summary of the tiered valuation input levels, as of August 31, 2019. The level assigned to the securities valuations may not be an indication of the risk or liquidity associated with investing in those securities. Because of the inherent uncertainties of valuation, the values reflected in the financial statements may materially differ from the value received upon actual sale of those investments.
| | Level 1 | Level 2 | Level 3 | Total |
| Investments in Securities | | | | |
| Common Stocks & Other Equity Interests | $1,367,889,343 | $— | $— | $1,367,889,343 |
| Money Market Funds | 18,225,765 | — | — | 18,225,765 |
| Total Investments in Securities | 1,386,115,108 | — | — | 1,386,115,108 |
| Other Investments - Assets* | | | | |
| Futures Contracts | 46,954 | — | — | 46,954 |
| Total Investments | $1,386,162,062 | $— | $— | $1,386,162,062 |
| * | Unrealized appreciation. |
NOTE 4—Derivative Investments
The Fund may enter into an International Swaps and Derivatives Association Master Agreement (“ISDA Master Agreement”) under which a fund may trade OTC derivatives. An OTC transaction entered into under an ISDA Master Agreement typically involves a collateral posting arrangement, payment netting provisions and close-out netting provisions. These netting provisions allow for reduction of credit risk through netting of contractual obligations. The enforceability of the netting provisions of the ISDA Master Agreement depends on the governing law of the ISDA Master Agreement, among other factors.
For financial reporting purposes, the Fund does not offset OTC derivative assets or liabilities that are subject to ISDA Master Agreements in the Statement of Assets and Liabilities.
| 26 | Invesco S&P 500 Index Fund |
Value of Derivative Investments at Period-End
The table below summarizes the value of the Fund’s derivative investments, detailed by primary risk exposure, held as of August 31, 2019:
| | Value |
| Derivative Assets | Equity
Risk |
| Unrealized appreciation on futures contracts — Exchange-Traded(a) | $46,954 |
| Derivatives not subject to master netting agreements | (46,954) |
| Total Derivative Assets subject to master netting agreements | $- |
| (a) | The daily variation margin receivable (payable) at period-end is recorded in the Statement of Assets and Liabilities. |
Effect of Derivative Investments for the year ended August 31, 2019
The table below summarizes the gains (losses) on derivative investments, detailed by primary risk exposure, recognized in earnings during the period:
| | Location of Gain (Loss) on
Statement of Operations |
| | Equity
Risk |
| Realized Gain: | |
| Futures contracts | $2,282,763 |
| Change in Net Unrealized Appreciation (Depreciation): | |
| Futures contracts | (1,177,951) |
| Total | $1,104,812 |
The table below summarizes the average notional value of derivatives held during the period.
| | Futures
Contracts |
| Average notional value | $25,014,267 |
NOTE 5—Investments in Affiliates
The Fund’s Adviser is a subsidiary of Invesco Ltd. and therefore, Invesco Ltd. is considered to be affiliated with the Fund. The following is a summary of the transactions in, and earnings from, investments in Invesco Ltd. for the year ended August 31, 2019.
| | Value
08/31/18 | Purchases
at Cost | Proceeds
from Sales | Change in
Unrealized
Appreciation
(Depreciation) | Realized
Gain
(Loss) | Value
08/31/19 | Dividend
Income |
| Invesco Ltd. | $514,583 | $34,893 | $(12,481) | $(172,269) | $(11,539) | $353,187 | $26,970 |
NOTE 6—Expense Offset Arrangement(s)
The expense offset arrangement is comprised of transfer agency credits which result from balances in demand deposit accounts used by the transfer agent for clearing shareholder transactions. For the year ended August 31, 2019, the Fund received credits from this arrangement, which resulted in the reduction of the Fund’s total expenses of $5,449.
NOTE 7—Trustees’ and Officers’ Fees and Benefits
Trustees’ and Officers’ Fees and Benefits include amounts accrued by the Fund to pay remuneration to certain Trustees and Officers of the Fund. Trustees have the option to defer compensation payable by the Fund, and Trustees’ and Officers’ Fees and Benefits also include amounts accrued by the Fund to fund such deferred compensation amounts. Those Trustees who defer compensation have the option to select various Invesco Funds in which their deferral accounts shall be deemed to be invested. Finally, certain current Trustees were eligible to participate in a retirement plan that provided for benefits to be paid upon retirement to Trustees over a period of time based on the number of years of service. The Fund may have certain former Trustees who also participate in a retirement plan and receive benefits under such plan.Trustees’ and Officers’ Fees and Benefits include amounts accrued by the Fund to fund such retirement benefits. Obligations under the deferred compensation and retirement plans represent unsecured claims against the general assets of the Fund.
NOTE 8—Cash Balances
The Fund is permitted to temporarily carry a negative or overdrawn balance in its account with SSB, the custodian bank. Such balances, if any at period-end, are shown in the Statement of Assets and Liabilities under the payable captionAmount due custodian. To compensate the custodian bank for such overdrafts, the overdrawn Fund may either (1) leave funds as a compensating balance in the account so the custodian bank can be compensated by earning the additional interest; or (2) compensate by paying the custodian bank at a rate agreed upon by the custodian bank and Invesco, not to exceed the contractually agreed upon rate. The Fund may not purchase additional securities when any borrowings from banks or broker-dealers exceed 5% of the Fund’s total assets, or when any borrowings from an Invesco Fund are outstanding.
| 27 | Invesco S&P 500 Index Fund |
NOTE 9—Distributions to Shareholders and Tax Components of Net Assets
| Tax Character of Distributions to Shareholders Paid During the Fiscal Years Ended August 31, 2019 and August 31, 2018 |
| | 2019 | 2018 |
| Ordinary income | $16,005,130 | $13,557,107 |
| Long-term capital gain | 11,605,479 | — |
| Total distributions | $27,610,609 | $13,557,107 |
| Tax Components of Net Assets at Period-End: |
| | 2019 |
| Undistributed ordinary income | $12,458,203 |
| Undistributed long-term capital gain | 9,440,402 |
| Net unrealized appreciation — investments | 687,738,288 |
| Temporary book/tax differences | (79,092) |
| Shares of beneficial interest | 677,885,336 |
| Total net assets | $1,387,443,137 |
The difference between book-basis and tax-basis unrealized appreciation (depreciation) is due to differences in the timing of recognition of gains and losses on investments for tax and book purposes. The Fund’s net unrealized appreciation difference is attributable primarily to wash sales.
The temporary book/tax differences are a result of timing differences between book and tax recognition of income and/or expenses. The Fund’s temporary book/tax differences are the result of the trustee deferral of compensation and retirement plan benefits.
Capital loss carryforward is calculated and reported as of a specific date. Results of transactions and other activity after that date may affect the amount of capital loss carryforward actually available for the Fund to utilize. Capital losses generated in years beginning after December 22, 2010 can be carried forward for an unlimited period, whereas previous losses expire in eight tax years. Capital losses with an expiration period may not be used to offset capital gains until all net capital losses without an expiration date have been utilized. Capital loss carryforwards with no expiration date will retain their character as either short-term or long-term capital losses instead of as short-term capital losses as under prior law. The ability to utilize capital loss carryforwards in the future may be limited under the Internal Revenue Code and related regulations based on the results of future transactions.
The Fund does not have a capital loss carryforward as of August 31, 2019.
NOTE 10—Investment Transactions
The aggregate amount of investment securities (other than short-term securities, U.S. Treasury obligations and money market funds, if any) purchased and sold by the Fund during the year ended August 31, 2019 was $114,080,306 and $34,009,333, respectively. Cost of investments, including any derivatives, on a tax basis includes the adjustments for financial reporting purposes as of the most recently completed federal income tax reporting period-end.
| Unrealized Appreciation (Depreciation) of Investments on a Tax Basis |
| Aggregate unrealized appreciation of investments | $719,501,978 |
| Aggregate unrealized (depreciation) of investments | (31,763,690) |
| Net unrealized appreciation of investments | $687,738,288 |
Cost of investments for tax purposes is $698,423,774.
NOTE 11—Reclassification of Permanent Differences
Primarily as a result of differing book/tax treatment of return of capital, on August 31, 2019, undistributed net investment income was increased by $277,528, undistributed net realized gain (loss) was decreased by $5,389 and shares of beneficial interest was decreased by $272,139. This reclassification had no effect on the net assets of the Fund.
NOTE 12—Share Information
| | Summary of Share Activity |
| | Years ended August 31, |
| | 2019(a) | | 2018 |
| | Shares | Amount | | Shares | Amount |
| Sold: | | | | | |
| Class A | 7,071,759 | $212,218,195 | | 4,805,626 | $140,602,068 |
| Class B(b) | - | - | | 1,571 | 43,156 |
| Class C | 2,843,978 | 81,699,031 | | 2,491,828 | 70,190,318 |
| Class Y | 2,920,504 | 86,644,155 | | 1,705,580 | 50,666,573 |
| Class R6 | 76,637 | 2,331,396 | | 143,776 | 4,429,414 |
| 28 | Invesco S&P 500 Index Fund |
| | Summary of Share Activity |
| | Years ended August 31, |
| | 2019(a) | | 2018 |
| | Shares | Amount | | Shares | Amount |
| Issued as reinvestment of dividends: | | | | | |
| Class A | 583,510 | $16,209,896 | | 285,046 | $8,195,074 |
| Class B(b) | - | - | | 282 | 7,941 |
| Class C | 189,858 | 5,095,800 | | 69,675 | 1,937,663 |
| Class Y | 108,623 | 3,052,301 | | 66,773 | 1,941,093 |
| Class R6 | 3,784 | 106,331 | | 194 | 5,635 |
| Conversion of Class B shares to Class A shares:(c) | | | | | |
| Class A | - | - | | 45,012 | 1,397,621 |
| Class B | - | - | | (46,623) | (1,397,621) |
| Automatic conversion of Class C shares to Class A shares: | | | | | |
| Class A | 2,495,010 | 71,383,269 | | - | - |
| Class C | (2,585,055) | (71,383,269) | | - | - |
| Reacquired: | | | | | |
| Class A | (6,903,207) | (207,359,782) | | (4,267,693) | (124,320,067) |
| Class B(b) | - | - | | (11,873) | (329,028) |
| Class C | (2,128,634) | (61,084,000) | | (1,761,326) | (49,561,814) |
| Class Y | (2,142,542) | (65,641,993) | | (2,249,589) | (67,114,306) |
| Class R6 | (34,729) | (1,069,018) | | (23,773) | (710,787) |
| Net increase in share activity | 2,499,496 | $72,202,312 | | 1,254,486 | $35,982,933 |
| (a) | There are entities that are record owners of more than 5% of the outstanding shares of the Fund and in the aggregate own 49% of the outstanding shares of the Fund. IDI has an agreement with these entities to sell Fund shares. The Fund, Invesco and/or Invesco affiliates may make payments to these entities, which are considered to be related to the Fund, for providing services to the Fund, Invesco and/or Invesco affiliates including but not limited to services such as securities brokerage, distribution, third party record keeping and account servicing. The Fund has no knowledge as to whether all or any portion of the shares owned of record by these entities are also owned beneficially. |
| (b) | Class B shares activity for the period September 1, 2017 through January 26, 2018 (date of conversion). |
| (c) | Effective as of the close of business January 26, 2018, all outstanding Class B shares were converted to Class A shares. |
| 29 | Invesco S&P 500 Index Fund |
Report of Independent Registered Public Accounting Firm
To the Board of Trustees of AIM Counselor Series Trust (Invesco Counselor Series Trust) and Shareholders of Invesco S&P 500 Index Fund
Opinion on the Financial Statements
We have audited the accompanying statement of assets and liabilities, including the schedule of investments, of Invesco S&P 500 Index Fund (one of the funds constituting AIM Counselor Series Trust (Invesco Counselor Series Trust), hereafter referred to as the "Fund") as of August 31, 2019, the related statement of operations for the year ended August 31, 2019, the statement of changes in net assets for each of the two years in the period ended August 31, 2019, including the related notes, and the financial highlights for each of the periods indicated therein (collectively referred to as the "financial statements"). In our opinion, the financial statements present fairly, in all material respects, the financial position of the Fund as of August 31, 2019, the results of its operations for the year then ended, the changes in its net assets for each of the two years in the period ended August 31, 2019 and the financial highlights for each of the periods indicated therein in conformity with accounting principles generally accepted in the United States of America.
Basis for Opinion
These financial statements are the responsibility of the Fund’s management. Our responsibility is to express an opinion on the Fund’s financial statements based on our audits. We are a public accounting firm registered with the Public Company Accounting Oversight Board (United States) (PCAOB) and are required to be independent with respect to the Fund in accordance with the U.S. federal securities laws and the applicable rules and regulations of the Securities and Exchange Commission and the PCAOB.
We conducted our audits of these financial statements in accordance with the standards of the PCAOB. Those standards require that we plan and perform the audit to obtain reasonable assurance about whether the financial statements are free of material misstatement, whether due to error or fraud.
Our audits included performing procedures to assess the risks of material misstatement of the financial statements, whether due to error or fraud, and performing procedures that respond to those risks. Such procedures included examining, on a test basis, evidence regarding the amounts and disclosures in the financial statements. Our audits also included evaluating the accounting principles used and significant estimates made by management, as well as evaluating the overall presentation of the financial statements. Our procedures included confirmation of securities owned as of August 31, 2019 by correspondence with the custodian, transfer agent and brokers; when replies were not received from brokers, we performed other auditing procedures. We believe that our audits provide a reasonable basis for our opinion.
/s/ PricewaterhouseCoopers LLP
Houston, Texas
October 29, 2019
We have served as the auditor of one or more of the investment companies in the Invesco group of investment companies since at least 1995. We have not been able to determine the specific year we began serving as auditor.
| 30 | Invesco S&P 500 Index Fund |
Calculating your ongoing Fund expenses
Example
As a shareholder of the Fund, you incur two types of costs: (1) transaction costs, which may include sales charges (loads) on purchase payments or contingent deferred sales charges on redemptions, if any; and (2) ongoing costs, including management fees, distribution and/or service (12b-1) fees, and other Fund expenses. This example is intended to help you understand your ongoing costs (in dollars) of investing in the Fund and to compare these costs with ongoing costs of investing in other mutual funds. The example is based on an investment of $1,000 invested at the beginning of the period and held for the entire period March 1, 2019 through August 31, 2019.
Actual expenses
The table below provides information about actual account values and actual expenses. You may use the information in this table, together with the amount you invested, to estimate the expenses that you paid over the period. Simply divide your account value by $1,000 (for example, an $8,600 account value divided by $1,000 = 8.6), then multiply the result by the number in the table under the heading entitled “Actual Expenses Paid During Period” to estimate the expenses you paid on your account during this period.
Hypothetical example for comparison purposes
The table below also provides information about hypothetical account values and hypothetical expenses based on the Fund’s actual expense ratio and an assumed rate of return of 5% per year before expenses, which is not the Fund’s actual return.
The hypothetical account values and expenses may not be used to estimate the actual ending account balance or expenses you paid for the period. You may use this information to compare the ongoing costs of investing in the Fund and other funds. To do so, compare this 5% hypothetical example with the 5% hypothetical examples that appear in the shareholder reports of the other funds.
Please note that the expenses shown in the table are meant to highlight your ongoing costs only and do not reflect any transaction costs, such as sales charges (loads) on purchase payments or contingent deferred sales charges on redemptions, if any. Therefore, the hypothetical information is useful in comparing ongoing costs only, and will not help you determine the relative total costs of owning different funds. In addition, if these transaction costs were included, your costs would have been higher.
| | Beginning
Account Value (03/01/19) | ACTUAL | HYPOTHETICAL
(5% annual return before
expenses) | Annualized
Expense
Ratio |
Ending
Account Value
(08/31/19)1 | Expenses
Paid During
Period2 | Ending
Account Value
(08/31/19) | Expenses
Paid During
Period2 |
| Class A | $1,000.00 | $1,058.60 | $2.85 | $1,022.43 | $2.80 | 0.55% |
| Class C | 1,000.00 | 1,054.50 | 6.78 | 1,018.60 | 6.67 | 1.31 |
| Class Y | 1,000.00 | 1,059.90 | 1.61 | 1,023.64 | 1.58 | 0.31 |
| Class R6 | 1,000.00 | 1,059.90 | 1.35 | 1,023.89 | 1.33 | 0.26 |
| 1 | The actual ending account value is based on the actual total return of the Fund for the period March 1, 2019 through August 31, 2019, after actual expenses and will differ from the hypothetical ending account value which is based on the Fund’s expense ratio and a hypothetical annual return of 5% before expenses. |
| 2 | Expenses are equal to the Fund’s annualized expense ratio as indicated above multiplied by the average account value over the period, multiplied by 184/365 to reflect the most recent fiscal half year. |
| 31 | Invesco S&P 500 Index Fund |
Approval of Investment Advisoryand Sub-Advisory Contracts
At meetings held on June 10, 2019, the Board of Trustees (the Board or the Trustees) of AIM Counselor Series Trust (Invesco Counselor Series Trust) as a whole, and the independent Trustees, who comprise over 75% of the Board, voting separately, approved the continuance of the Invesco S&P 500 Index Fund’s (the Fund) Master Investment Advisory Agreement with Invesco Advisers, Inc. (Invesco Advisers and the investment advisory agreement) and the Master IntergroupSub-Advisory Contract for Mutual Funds with Invesco Asset Management Deutschland GmbH, Invesco Asset Management Limited, Invesco Asset Management (Japan) Limited, Invesco Hong Kong Limited, Invesco Senior Secured Management, Inc. and Invesco Canada Ltd. (collectively, the AffiliatedSub-Advisers and thesub-advisory contracts) for another year, effective July 1, 2019. After evaluating the factors discussed below, among others, the Board approved the renewal of the Fund’s investment advisory agreement and thesub-advisory contracts and determined that the compensation payable by the Fund to Invesco Advisers and by Invesco Advisers to the AffiliatedSub-Advisers is fair and reasonable.
The Board’s Evaluation Process
The Board’s Investments Committee has established threeSub-Committees, which meet throughout the year to review the performance of funds advised by Invesco Advisers (the Invesco Funds). As part of a regularly scheduled basis ofin-person Board meetings, theSub-Committees meet with portfolio managers for their assigned Invesco Funds and other members of management to review detailed information about investment performance and portfolio attributes of these funds. The Board took into account evaluations and reports that it received from the Investments Committee andSub-Committees, as well as the information provided to such committees and the Board throughout the year, in considering whether to approve each Invesco Fund’s investment advisory agreement andsub-advisory contracts.
As part of the contract renewal process, the Board reviews and considers information provided in response to detailed requests for information submitted to management by the independent Trustees with assistance from legal counsel to the independent Trustees. The Board receives comparative investment performance and fee data regarding the Invesco Funds prepared by Invesco Advisers and Broadridge Financial Solutions, Inc. (Broadridge), an independent mutual fund data provider. The Board also receives an independent written evaluation from the Senior Officer, an officer of the Invesco Funds who reports directly to the independent Trustees. The Senior Officer’s evaluation is prepared as part of his responsibility to manage the process by which the Invesco Funds’ proposed management fees
are negotiated during the annual contract renewal process to ensure they are negotiated in a manner that is at arms’ length and reasonable. In addition to meetings with Invesco Advisers and fund counsel throughout the year, the independent Trustees also discuss the continuance of the investment advisory agreement andsub-advisory contracts in separate sessions with the Senior Officer and with independent legal counsel.
The discussion below is a summary of the Senior Officer’s independent written evaluation with respect to the Fund’s investment advisory agreement, as well as a discussion of the material factors and related conclusions that formed the basis for the Board’s approval of the Fund’s investment advisory agreement andsub-advisory contracts. The Trustees’ review and conclusions are based on the comprehensive consideration of all information presented to them during the course of the year and in prior years and are not the result of any single determinative factor. Moreover, one Trustee may have weighed a particular piece of information or factor differently than another Trustee. This information is current as of June 10, 2019.
Factors and Conclusions and Summary of Independent Written Fee Evaluation
| A. | Nature, Extent and Quality of Services Provided by Invesco Advisers and the Affiliated Sub-Advisers |
The Board reviewed the nature, extent and quality of the advisory services provided to the Fund by Invesco Advisers under the Fund’s investment advisory agreement, and the credentials and experience of the officers and employees of Invesco Advisers who provide these services, including the Fund’s portfolio manager(s). The Board’s review included consideration of Invesco Advisers’ investment process oversight and structure, credit analysis and investment risk management. The Board also considerednon-advisory services that Invesco Advisers and its affiliates provide to the Invesco Funds such as various back office support functions, third party oversight, internal audit, valuation, portfolio trading and legal and compliance. The Board also received and reviewed information about Invesco Advisers’ role as administrator of the Invesco Funds’ liquidity risk management program. The Board also reviewed and considered the benefits to shareholders of investing in a fund that is part of the Invesco family of funds under the umbrella of Invesco Ltd., Invesco Advisers’ parent company, and noted Invesco Ltd.’s depth and experience in conducting an investment management business, as well as its commitment of financial and other resources to such business. The Board reviewed and considered information about the resources that Invesco Advisers intends to continue to
commit to managing the Invesco family of funds following Invesco Ltd.’s acquisition of OppenheimerFunds, Inc. and its subsidiaries. The Board concluded that the nature, extent and quality of the services provided to the Fund by Invesco Advisers are appropriate and satisfactory.
The Board reviewed the services that may be provided by the AffiliatedSub-Advisers under thesub-advisory contracts and the credentials and experience of the officers and employees of the AffiliatedSub-Advisers who provide these services. The Board noted the AffiliatedSub-Advisers’ expertise with respect to certain asset classes and that the AffiliatedSub-Advisers have offices and personnel that are located in financial centers around the world. As a result, the Board noted that the AffiliatedSub-Advisers can provide research and investment analysis on the markets and economies of various countries in which the Fund may invest, make recommendations regarding securities and assist with security trades. The Board concluded that thesub-advisory contracts may benefit the Fund and its shareholders by permitting Invesco Advisers to use the resources and talents of the AffiliatedSub-Advisers in managing the Fund. The Board concluded that the nature, extent and quality of the services that may be provided by the AffiliatedSub-Advisers are appropriate and satisfactory.
| B. | Fund Investment Performance |
The Board considered Fund investment performance as a relevant factor in considering whether to approve the investment advisory agreement. The Board did not view Fund investment performance as a relevant factor in considering whether to approve thesub-advisory contracts for the Fund, as no AffiliatedSub-Adviser currently manages assets of the Fund.
The Board compared the Fund’s investment performance over multiple time periods ending December 31, 2018 to the performance of funds in the Broadridge performance universe and against the Lipper S&P 500 Objective Funds Index. The Board noted that performance of Class A shares of the Fund was in the fourth quintile of its performance universe for the one, three and five year periods (the first quintile being the best performing funds and the fifth quintile being the worst performing funds). The Board noted that performance of Class A shares of the Fund was reasonably comparable to the performance of the Index for the one, three and five year periods. The Board noted that the Fund is passively managed and discussed reasons for differences in the Fund’s performance versus its peers and the Index. The Trustees also reviewed more recent Fund performance and this review did not change their conclusions.
32 Invesco S&P 500 Index Fund
| C. | Advisory andSub-Advisory Fees and Fund Expenses |
The Board compared the Fund’s contractual management fee rate to the contractual management fee rates of funds in the Fund’s Broadridge expense group. The Board noted that the contractual management fee rate for Class A shares of the Fund was below the median contractual management fee rate of funds in its expense group. The Board noted that the term “contractual management fee” for funds in the expense group may include both advisory and certainnon-portfolio management administrative services fees, but that Broadridge does not provide information on a fund by fund basis as to what is included. The Board also reviewed the methodology used by Broadridge in providing expense group information, which includes using each fund’s contractual management fee schedule (including any applicable breakpoints) as reported in the most recent prospectus or statement of additional information for each fund in the expense group. The Board also considered comparative information regarding the Fund’s total expense ratio and its various components. The Board noted that the Fund’s total expense ratio was in the fourth quintile of its expense group and discussed with management reasons for such relative total expenses.
The Board noted that Invesco Advisers has contractually agreed to waive fees and/or limit expenses of the Fund for the term disclosed in the Fund’s registration statement in an amount necessary to limit total annual operating expenses to a specified percentage of average daily net assets for each class of the Fund.
The Board also considered the fees charged by Invesco Advisers and the AffiliatedSub-Advisers to other similarly managed client accounts. The Board noted that Invesco Advisers or the AffiliatedSub-Advisers may charge lower fees to large institutional clients. Invesco Advisers reviewed with the Board differences in the scope of services it provides to the Invesco Funds relative to certain other types of client accounts, including management of cash flows as a result of redemptions and purchases, necessary infrastructure such as officers, office space, technology, legal and distribution, oversight of service providers, costs and business risks associated with launching new funds and sponsoring and maintaining the product line, preparation of annual registration statement updates and financial information and compliance with federal and state laws and regulations.
The Board also considered the services that may be provided by the AffiliatedSub-Advisers pursuant to thesub-advisory contracts, as well as the fees payable by Invesco Advisers to the AffiliatedSub-Advisers pursuant to thesub-advisory contracts.
| D. | Economies of Scale and Breakpoints |
The Board considered the extent to which there may be economies of scale in the provision of advisory services to the Fund. The Board
considered Invesco’s reinvestment in its business, including investments in business infrastructure and cybersecurity. The Board also considered that the Fund may benefit from economies of scale through contractual breakpoints in the Fund’s advisory fee schedule, which generally operate to reduce the Fund’s expense ratio as it grows in size. The Board noted that the Fund shares directly in economies of scale through lower fees charged by third party service providers based on the combined size of the Invesco Funds. The Board noted that the Fund may also benefit from economies of scale through initial fee setting, fee waivers and expense reimbursements.
| E. | Profitability and Financial Resources |
The Board reviewed information from Invesco Advisers concerning the costs of the advisory and other services that Invesco Advisers and its affiliates provide to the Fund and the Invesco Funds and the profitability of Invesco Advisers and its affiliates in providing these services. The Board considered the methodology used for calculating profitability and noted the periodic review of such methodology by an independent consultant. The Board noted that Invesco Advisers continues to operate at a net profit from services Invesco Advisers and its affiliates provide to the Invesco Funds and the Fund. The Board did not deem the level of profits realized by Invesco Advisers and its affiliates from providing services to the Fund to be excessive given the nature, extent and quality of the services provided. The Board received information from Invesco Advisers demonstrating that Invesco Advisers and the AffiliatedSub-Advisers are financially sound and have the resources necessary to perform their obligations under the investment advisory agreement andsub-advisory contracts.
| F. | Collateral Benefits to Invesco Advisers and its Affiliates |
The Board considered various other benefits received by Invesco Advisers and its affiliates from the relationship with the Fund, including the fees received for providing administrative, transfer agency and distribution services to the Fund. The Board considered comparative information regarding fees charged for these services, including information provided by Broadridge and other independent sources. The Board considered the performance of Invesco Advisers and its affiliates in providing these services and the organizational structure employed to provide these services. The Board also considered that these services are provided to the Fund pursuant to written contracts that are reviewed and approved on an annual basis by the Board; and that the services are required for the operation of the Fund.
The Board considered the benefits realized by Invesco Advisers and the AffiliatedSub-Advisers as a result of portfolio brokerage transactions executed through “soft dollar” arrangements. The Board noted that soft dollar arrangements may result in the Fund bearing costs to purchase research that may be used by Invesco Advisers or the AffiliatedSub-Advisers with
other clients and may reduce Invesco Advisers’ or the AffiliatedSub-Advisers’ expenses. The Board also considered that it receives periodic reports from Invesco representing that these arrangements are consistent with regulatory requirements. The Board did not deem the soft dollar arrangements to be inappropriate.
The Board considered that the Fund’s uninvested cash and cash collateral from any securities lending arrangements may be invested in money market funds advised by Invesco Advisers pursuant to procedures approved by the Board. The Board considered information regarding the returns of the affiliated money market funds relative to comparable overnight investments, as well as the costs to the Fund of such investments. The Board noted that Invesco Advisers receives advisory fees from these affiliated money market funds attributable to such investments, although Invesco Advisers has contractually agreed to waive through varying periods the advisory fees payable by the Invesco Funds with respect to certain investments in the affiliated money market funds. The waiver is in an amount equal to 100% of the net advisory fee Invesco Advisers receives from the affiliated money market funds with respect to the Fund’s investment in the affiliated money market funds of uninvested cash, but not cash collateral. The Board concluded that the amount of advisory fees received by Invesco Advisers from the Fund’s investment of cash collateral from any securities lending arrangements in the affiliated money market funds is fair and reasonable.
The Board also considered that an affiliated broker may receive commissions for executing certain trades for the Fund. Invesco Advisers and the AffiliatedSub-Advisers may use the affiliated broker to, among other things, control order routing and minimize information leakage, and the Board was advised that such trades are executed in compliance with rules under the federal securities laws and consistent with best execution obligations.
33 Invesco S&P 500 Index Fund
Tax Information
Form 1099-DIV, Form 1042-S and other year–end tax information provide shareholders with actual calendar year amounts that should be included in their tax returns. Shareholders should consult their tax advisers.
The following distribution information is being provided as required by the Internal Revenue Code or to meet a specific state’s requirement.
The Fund designates the following amounts or, if subsequently determined to be different, the maximum amount allowable for its fiscal year ended August 31, 2019:
| Federal and State Income Tax | |
| Long-Term Capital Gain Distributions | $11,605,479 |
| Qualified Dividend Income* | 100% |
| Corporate Dividends Received Deduction* | 100% |
| U.S. Treasury Obligations* | 0% |
| * | The above percentages are based on ordinary income dividends paid to shareholders during the Fund’s fiscal year. |
| 34 | Invesco S&P 500 Index Fund |
Trustees and Officers
The address of each trustee and officer is AIM Counselor Series Trust (Invesco Counselor Series Trust) (the “Trust”), 11 Greenway Plaza, Suite 1000, Houston, Texas 77046-1173. The trustees serve for the life of the Trust, subject to their earlier death, incapacitation, resignation, retirement or removal as more specifically provided in the Trust’s organizational documents. Each officer serves for a one year term or until their successors are elected and qualified. Column two below includes length of time served with predecessor entities, if any.
| | | | | | | | |
Name, Year of Birth and Position(s) Held with the Trust | | Trustee and/ or Officer Since | | Principal Occupation(s) During Past 5 Years | | Number of Funds in Fund
Complex
Overseen by
Trustee | | Other Directorship(s) Held by Trustee During Past 5 Years |
| Interested Persons | | | | | | | | |
Martin L. Flanagan1 — 1960 Trustee and Vice Chair | | 2007 | | Executive Director, Chief Executive Officer and President, Invesco Ltd. (ultimate parent of Invesco and a global investment management firm); Trustee and Vice Chair, The Invesco Funds; Vice Chair, Investment Company Institute; and Member of Executive Board, SMU Cox School of Business Formerly: Advisor to the Board, Invesco Advisers, Inc. (formerly known as Invesco Institutional (N.A.), Inc.); Chairman and Chief Executive Officer, Invesco Advisers, Inc. (registered investment adviser); Director, Chairman, Chief Executive Officer and President, Invesco Holding Company (US), Inc. (formerly IVZ Inc.) (holding company), Invesco Group Services, Inc. (service provider) and Invesco North American Holdings, Inc. (holding company); Director, Chief Executive Officer and President, Invesco Holding Company Limited (parent of Invesco and a global investment management firm); Director, Invesco Ltd.; Chairman, Investment Company Institute and President,Co-Chief Executive Officer,Co-President, Chief Operating Officer and Chief Financial Officer, Franklin Resources, Inc. (global investment management organization) | | 229 | | None |
Philip A. Taylor2 — 1954 Trustee | | 2006 | | Vice Chair, Invesco Ltd.; Trustee, The Invesco Funds Formerly: Director, Invesco Canada Ltd. (formerly known as Invesco Trimark Ltd./Invesco Trimark Ltèe) (registered investment adviser and registered transfer agent); Head of the Americas and Senior Managing Director, Invesco Ltd.; Director, Invesco Advisers, Inc. (formerly known as Invesco Institutional (N.A.), Inc.) (registered investment adviser); Director and Chairman, Invesco Investment Services, Inc. (formerly known as Invesco AIM Investment Services, Inc.) (registered transfer agent); Chief Executive Officer, Invesco Corporate Class Inc. (corporate mutual fund company); Chairman and Chief Executive Officer, Invesco Canada Ltd. (formerly known as Invesco Trimark Ltd./Invesco Trimark Ltèe) (registered investment adviser and registered transfer agent); Senior Vice President, The Invesco Funds; Director, Invesco Investment Advisers LLC (formerly known as Van Kampen Asset Management); Director, Chairman, Chief Executive Officer and President, Invesco Management Group, Inc. (formerly known as Invesco AIM Management Group, Inc.) (financial services holding company);Co-Chairman,Co-President andCo-Chief Executive Officer, Invesco Advisers, Inc. (formerly known as Invesco Institutional (N.A.), Inc.) (registered investment adviser); Director, Chief Executive Officer and President, Van Kampen Exchange Corp; President and Principal Executive Officer, The Invesco Funds (other than AIM Treasurer’s Series Trust (Invesco Treasurer’s Series Trust), Short-Term Investments Trust and Invesco Management Trust); Executive Vice President, The Invesco Funds (AIM Treasurer’s Series Trust (Invesco Treasurer’s Series Trust), Short-Term Investments Trust and Invesco Management Trust only); Director and President, INVESCO Funds Group, Inc. (registered investment adviser and registered transfer agent); Director and Chairman, IVZ Distributors, Inc. (formerly known as INVESCO Distributors, Inc.) (registered broker dealer); Director, President and Chairman, Invesco Inc. (holding company), Invesco Canada Holdings Inc. (holding company), Trimark Investments Ltd./Placements Trimark Ltèe and Invesco Financial Services Ltd/Services Financiers Invesco Ltèe; Chief Executive Officer, Invesco Canada Fund Inc. (corporate mutual fund company); Director and Chairman, Van Kampen Investor Services Inc.; Director, Chief Executive Officer and President, 1371 Preferred Inc. (holding company) and Van Kampen Investments Inc.; Director and President, AIM GP Canada Inc. (general partner for limited partnerships) and Van Kampen Advisors, Inc.; Director and Chief Executive Officer, Invesco Trimark Dealer Inc. (registered broker dealer); Director, Invesco Distributors, Inc. (formerly known as Invesco AIM Distributors, Inc.) (registered broker dealer); Manager, Invesco Capital Management LLC; Director, Chief Executive Officer and President, Invesco Advisers, Inc.; Director, Chairman, Chief Executive Officer and President, Invesco AIM Capital Management, Inc.; President, Invesco Trimark Dealer Inc. and Invesco Trimark Ltd./Invesco Trimark Ltèe; Director and President, AIM Trimark Corporate Class Inc. and AIM Trimark Canada Fund Inc.; Senior Managing Director, Invesco Holding Company Limited; Director and Chairman, Fund Management Company (former registered broker dealer); President and Principal Executive Officer, The Invesco Funds (AIM Treasurer’s Series Trust (Invesco Treasurer’s Series Trust), and Short-Term Investments Trust only); President, AIM Trimark Global Fund Inc. and AIM Trimark Canada Fund Inc. | | 229 | | None |
| 1 | Mr. Flanagan is considered an interested person (within the meaning of Section 2(a)(19) of the 1940 Act) of the Trust because he is an officer of the Adviser to the Trust, and an officer and a director of Invesco Ltd., ultimate parent of the Adviser. |
| 2 | Mr. Taylor is considered an interested person (within the meaning of Section 2(a)(19) of the 1940 Act) of the Trust because he is an officer of Invesco Ltd., ultimate parent of the Adviser. |
T-1 Invesco S&P 500 Index Fund
Trustees and Officers—(continued)
| | | | | | | | |
Name, Year of Birth and Position(s) Held with the Trust | | Trustee and/ or Officer Since | | Principal Occupation(s)
During Past 5 Years | | Number of
Funds in Fund
Complex
Overseen by
Trustee | | Other Directorship(s) Held by Trustee During
Past 5 Years |
| Independent Trustees | | | | | | | | |
Bruce L. Crockett — 1944 Trustee and Chair | | 2003 | | Chairman, Crockett Technologies Associates (technology consulting company) Formerly: Director, Captaris (unified messaging provider); Director, President and Chief Executive Officer, COMSAT Corporation; Chairman, Board of Governors of INTELSAT (international communications company); ACE Limited (insurance company); Independent Directors Council and Investment Company Institute: Member of the Audit Committee, Investment Company Institute; Member of the Executive Committee and Chair of the Governance Committee, Independent Directors Council | | 229 | | Director and Chairman of the Audit Committee, ALPS (Attorneys Liability Protection Society) (insurance company); Director and Member of the Audit Committee and Compensation Committee, Ferroglobe PLC (metallurgical company) |
David C. Arch — 1945 Trustee | | 2010 | | Chairman of Blistex Inc. (consumer health care products manufacturer); Member, World Presidents’ Organization | | 229 | | Board member of the Illinois Manufacturers’ Association |
Beth Ann Brown — 1968 Trustee | | 2019 | | Independent Consultant Formerly: Head of Intermediary Distribution, Managing Director, Strategic Relations, Managing Director, Head of National Accounts, Senior Vice President, National Account Manager and Senior Vice President, Key Account Manager, Columbia Management Investment Advisers LLC; Vice President, Key Account Manager, Liberty Funds Distributor, Inc.; and Trustee of certain Oppenheimer Funds | | 229 | | Director, Board of Directors of Caron Engineering Inc.; Advisor, Board of Advisors of Caron Engineering Inc.; President and Director, Acton Shapleigh Youth Conservation Corps (non -profit); and Vice President and Director of Grahamtastic Connection(non-profit) |
Jack M. Fields — 1952 Trustee | | 2003 | | Chief Executive Officer, Twenty First Century Group, Inc. (government affairs company); and Chairman, Discovery Learning Alliance(non-profit) Formerly: Owner and Chief Executive Officer, Dos Angeles Ranch L.P. (cattle, hunting, corporate entertainment); Director, Insperity, Inc. (formerly known as Administaff) (human resources provider); Chief Executive Officer, Texana Timber LP (sustainable forestry company); Director of Cross Timbers Quail Research Ranch(non-profit); and member of the U.S. House of Representatives | | 229 | | None |
Cynthia Hostetler — 1962 Trustee | | 2017 | | Non-Executive Director and Trustee of a number of public and private business corporations Formerly: Director, Aberdeen Investment Funds (4 portfolios); Head of Investment Funds and Private Equity, Overseas Private Investment Corporation; President, First Manhattan Bancorporation, Inc.; Attorney, Simpson Thacher & Bartlett LLP | | 229 | | Vulcan Materials Company (construction materials company); Trilinc Global Impact Fund; Genesee & Wyoming, Inc. (railroads); Artio Global Investment LLC (mutual fund complex); Edgen Group, Inc. (specialized energy and infrastructure products distributor); Investment Company Institute (professional organization); Independent Directors Council (professional organization) |
Eli Jones — 1961 Trustee | | 2016 | | Professor and Dean, Mays Business School — Texas A&M University Formerly: Professor and Dean, Walton College of Business, University of Arkansas and E.J. Ourso College of Business, Louisiana State University; Director, Arvest Bank | | 229 | | Insperity, Inc. (formerly known as Administaff) (human resources provider) |
Elizabeth Krentzman — 1959 Trustee | | 2019 | | Formerly: Principal and Chief Regulatory Advisor for Asset Management Services and U.S. Mutual Fund Leader of Deloitte & Touche LLP; General Counsel of the Investment Company Institute (trade association); National Director of the Investment Management Regulatory Consulting Practice, Principal, Director and Senior Manager of Deloitte & Touche LLP; Assistant Director of the Division of Investment Management — Office of Disclosure and Investment Adviser Regulation of the U.S. Securities and Exchange Commission and various positions with the Division of Investment Management — Office of Regulatory Policy of the U.S. Securities and Exchange Commission; Associate at Ropes & Gray LLP; Advisory Board Member of the Securities and Exchange Commission Historical Society; and Trustee of certain Oppenheimer Funds | | 229 | | Trustee of the University of Florida National Board Foundation and Audit Committee Member; Member of the Cartica Funds Board of Directors (private investment funds); Member of the University of Florida Law Center Association, Inc. Board of Trustees and Audit Committee Member |
Anthony J. LaCava, Jr. — 1956 Trustee | | 2019 | | Formerly: Director and Member of the Audit Committee, Blue Hills Bank (publicly traded financial institution) and Managing Partner, KPMG LLP | | 229 | | Blue Hills Bank; Chairman, Bentley University; Member, Business School Advisory Council; and Nominating Committee, KPMG LLP |
T-2 Invesco S&P 500 Index Fund
Trustees and Officers—(continued)
| | | | | | | | |
Name, Year of Birth and Position(s) Held with the Trust | | Trustee and/ or Officer Since | | Principal Occupation(s)
During Past 5 Years | | Number of
Funds in Fund
Complex
Overseen by
Trustee | | Other Directorship(s) Held by Trustee During
Past 5 Years |
| Independent Trustees—(continued) |
Prema Mathai-Davis — 1950 Trustee | | 2003 | | Retired Co-Owner & Partner of Quantalytics Research, LLC, (a FinTech Investment Research Platform for the Self-Directed Investor) | | 229 | | None |
Joel W. Motley — 1952 Trustee | | 2019 | | Director of Office of Finance, Federal Home Loan Bank; Member of the Vestry of Trinity Wall Street; Managing Director of Carmona Motley Inc. (privately held financial advisor); Member of the Finance and Budget Committee of the Council on Foreign Relations, Member of the Investment Committee and Board of Human Rights Watch and Member of the Investment Committee and Board of Historic Hudson Valley(non-profit cultural organization) Formerly: Managing Director of Public Capital Advisors, LLC (privately held financial advisor); Managing Director of Carmona Motley Hoffman, Inc. (privately held financial advisor); Trustee of certain Oppenheimer Funds; and Director of Columbia Equity Financial Corp. (privately held financial advisor) | | 229 | | Director of Greenwall Foundation (bioethics research foundation); Member of Board and Investment Committee of The Greenwall Foundation; Director of Southern Africa Legal Services Foundation; Board Member and Investment Committee Member of Pulitzer Center for Crisis Reporting(non-profit journalism) |
Teresa M. Ressel — 1962 Trustee | | 2017 | | Non-executive director and trustee of a number of public and private business corporations Formerly: Chief Financial Officer, Olayan America, The Olayan Group (international investor/commercial/industrial); Chief Executive Officer, UBS Securities LLC; Group Chief Operating Officer, Americas, UBS AG; Assistant Secretary for Management & Budget and CFO, US Department of the Treasury | | 229 | | Atlantic Power Corporation (power generation company); ON Semiconductor Corp. (semiconductor supplier) |
Ann Barnett Stern — 1957 Trustee | | 2017 | | President and Chief Executive Officer, Houston Endowment Inc. (private philanthropic institution) Formerly: Executive Vice President and General Counsel, Texas Children’s Hospital; Attorney, Beck, Redden and Secrest, LLP; Business Law Instructor, University of St. Thomas; Attorney, Andrews & Kurth LLP | | 229 | | Federal Reserve Bank of Dallas |
Raymond Stickel, Jr. — 1944 Trustee | | 2005 | | Retired Formerly: Director, Mainstay VP Series Funds, Inc. (25 portfolios); Partner, Deloitte & Touche | | 229 | | None |
Robert C. Troccoli — 1949 Trustee | | 2016 | | Retired Formerly: Adjunct Professor, University of Denver — Daniels College of Business; Senior Partner, KPMG LLP | | 229 | | None |
Daniel S. Vandivort — 1954 Trustee | | 2019 | | Treasurer, Chairman of the Audit and Finance Committee, and Trustee, Board of Trustees, Huntington Disease Foundation of America; and President, Flyway Advisory Services LLC (consulting and property management) Formerly: Trustee and Governance Chair, of certain Oppenheimer Funds | | 229 | | Chairman and Lead Independent Director, Chairman of the Audit Committee, and Director, Board of Directors, Value Line Funds |
James D. Vaughn — 1945 Trustee | | 2019 | | Retired Formerly: Managing Partner, Deloitte & Touche LLP; Trustee and Chairman of the Audit Committee, Schroder Funds; Board Member, Mile High United Way, Boys and Girls Clubs, Boy Scouts, Colorado Business Committee for the Arts, Economic Club of Colorado and Metro Denver Network (economic development corporation); and Trustee of certain Oppenheimer Funds | | 229 | | Board member and Chairman of Audit Committee of AMG National Trust Bank; Trustee and Investment Committee member, University of South Dakota Foundation; Board member, Audit Committee Member and past Board Chair, Junior Achievement(non-profit) |
Christopher L. Wilson — 1957 Trustee, Vice Chair and Chair Designate | | 2017 | | Retired Formerly: Director, TD Asset Management USA Inc. (mutual fund complex) (22 portfolios); Managing Partner, CT2, LLC (investing and consulting firm); President/Chief Executive Officer, Columbia Funds, Bank of America Corporation; President/Chief Executive Officer, CDC IXIS Asset Management Services, Inc.; Principal & Director of Operations, Scudder Funds, Scudder, Stevens & Clark, Inc.; Assistant Vice President, Fidelity Investments | | 229 | | ISO New England, Inc.(non-profit organization managing regional electricity market) |
T-3 Invesco S&P 500 Index Fund
Trustees and Officers—(continued)
| | | | | | | | |
Name, Year of Birth and Position(s) Held with the Trust | | Trustee and/ or Officer Since | | Principal Occupation(s)
During Past 5 Years | | Number of
Funds in Fund
Complex
Overseen by
Trustee | | Other Directorship(s) Held by Trustee During
Past 5 Years |
| Other Officers | | | | | | | | |
Sheri Morris — 1964 President, Principal Executive Officer and Treasurer | | 2003 | | President, Principal Executive Officer and Treasurer, The Invesco Funds; Vice President, Invesco Advisers, Inc. (formerly known as Invesco Institutional (N.A.), Inc.) (registered investment adviser); and Vice President, Invesco Exchange-Traded Fund Trust, Invesco Exchange-Traded Fund Trust II, Invesco India Exchange-Traded Fund Trust, Invesco Actively Managed Exchange-Traded Fund Trust, Invesco Actively Managed Exchange-Traded Commodity Fund Trust and Invesco Exchange-Traded Self-Indexed Fund Trust; and Vice President, OppenheimerFunds, Inc. Formerly: Vice President and Principal Financial Officer, The Invesco Funds; Vice President, Invesco AIM Advisers, Inc., Invesco AIM Capital Management, Inc. and Invesco AIM Private Asset Management, Inc.; Assistant Vice President and Assistant Treasurer, The Invesco Funds and Assistant Vice President, Invesco Advisers, Inc., Invesco AIM Capital Management, Inc. and Invesco AIM Private Asset Management, Inc.; and Treasurer, Invesco Exchange-Traded Fund Trust, Invesco Exchange-Traded Fund Trust II, Invesco India Exchange-Traded Fund Trust and Invesco Actively Managed Exchange-Traded Fund Trust | | N/A | | N/A |
Russell C. Burk — 1958 Senior Vice President and Senior Officer | | 2005 | | Senior Vice President and Senior Officer, The Invesco Funds | | N/A | | N/A |
Jeffrey H. Kupor — 1968 Senior Vice President, Chief Legal Officer and Secretary | | 2018 | | Head of Legal of the Americas, Invesco Ltd.; Senior Vice President and Secretary, Invesco Advisers, Inc. (formerly known as Invesco Institutional (N.A.), Inc.) (registered investment adviser); Senior Vice President and Secretary, Invesco Distributors, Inc. (formerly known as Invesco AIM Distributors, Inc.); Vice President and Secretary, Invesco Investment Services, Inc. (formerly known as Invesco AIM Investment Services, Inc.) Senior Vice President, Chief Legal Officer and Secretary, The Invesco Funds; Secretary and General Counsel, Invesco Investment Advisers LLC (formerly known as Van Kampen Asset Management); Secretary and General Counsel, Invesco Capital Markets, Inc. (formerly known as Van Kampen Funds Inc.) and Chief Legal Officer, Invesco Exchange-Traded Fund Trust, Invesco Exchange-Traded Fund Trust II, Invesco India Exchange-Traded Fund Trust, Invesco Actively Managed Exchange-Traded Fund Trust, Invesco Actively Managed Exchange-Traded Commodity Fund Trust and Invesco Exchange-Traded Self-Indexed Fund Trust; Secretary, Invesco Indexing LLC; Secretary, W.L. Ross & Co., LLC Formerly: Secretary and Vice President, Jemstep, Inc.; Head of Legal, Worldwide Institutional, Invesco Ltd.; Secretary and General Counsel, INVESCO Private Capital Investments, Inc.; Senior Vice President, Secretary and General Counsel, Invesco Management Group, Inc. (formerly known as Invesco AIM Management Group, Inc.); Assistant Secretary, INVESCO Asset Management (Bermuda) Ltd.; Secretary and General Counsel, Invesco Private Capital, Inc.; Assistant Secretary and General Counsel, INVESCO Realty, Inc.; Secretary and General Counsel, Invesco Senior Secured Management, Inc.; and Secretary, Sovereign G./P. Holdings Inc. | | N/A | | N/A |
Andrew R. Schlossberg — 1974 Senior Vice President | | 2019 | | Head of the Americas and Senior Managing Director, Invesco Ltd.; Director and Senior Vice President, Invesco Advisers, Inc. (formerly known as Invesco Institutional (N.A.), Inc.) (registered investment adviser); Director and Chairman, Invesco Investment Services, Inc. (formerly known as Invesco AIM Investment Services, Inc.) (registered transfer agent); Senior Vice President, The Invesco Funds; Director, Invesco Investment Advisers LLC (formerly known as Van Kampen Asset Management); Director, President and Chairman, Invesco Insurance Agency, Inc. Formerly: Director, Invesco UK Limited; Director and Chief Executive, Invesco Asset Management Limited and Invesco Fund Managers Limited; Assistant Vice President, The Invesco Funds; Senior Vice President, Invesco Advisers, Inc. (formerly known as Invesco Institutional (N.A.), Inc.) (registered investment adviser); Director and Chief Executive, Invesco Administration Services Limited and Invesco Global Investment Funds Limited; Director, Invesco Distributors, Inc.; Head of EMEA, Invesco Ltd.; President, Invesco Actively Managed Exchange-Traded Commodity Fund Trust, Invesco Actively Managed Exchange-Traded Fund Trust, Invesco Exchange-Traded Fund Trust, Invesco Exchange-Traded Fund Trust II and Invesco India Exchange-Traded Fund Trust; Managing Director and Principal Executive Officer, Invesco Capital Management LLC | | N/A | | N/A |
T-4 Invesco S&P 500 Index Fund
Trustees and Officers—(continued)
| | | | | | | | |
Name, Year of Birth and Position(s) Held with the Trust | | Trustee and/ or Officer Since | | Principal Occupation(s)
During Past 5 Years | | Number of
Funds in Fund
Complex
Overseen by
Trustee | | Other Directorship(s) Held by Trustee During
Past 5 Years |
| Other Officers—(continued) | | | | | | | | |
John M. Zerr — 1962
Senior Vice President | | 2006 | | Chief Operating Officer of the Americas; Senior Vice President, Invesco Advisers, Inc. (formerly known as Invesco Institutional (N.A.), Inc.) (registered investment adviser); Senior Vice President, Invesco Distributors, Inc. (formerly known as Invesco AIM Distributors, Inc.); Director and Vice President, Invesco Investment Services, Inc. (formerly known as Invesco AIM Investment Services, Inc.) Senior Vice President, The Invesco Funds; Managing Director, Invesco Capital Management LLC; Director, Invesco Investment Advisers LLC (formerly known as Van Kampen Asset Management); Senior Vice President, Invesco Capital Markets, Inc. (formerly known as Van Kampen Funds Inc.); Manager, Invesco Indexing LLC; Manager, Invesco Specialized Products, LLC; Director and Senior Vice President, Invesco Insurance Agency, Inc.; Member, Invesco Canada Funds Advisory Board; Director, President and Chief Executive Officer, Invesco Corporate Class Inc. (corporate mutual fund company); and Director, Chairman, President and Chief Executive Officer, Invesco Canada Ltd. (formerly known as Invesco Trimark Ltd./Invesco Trimark Ltèe) (registered investment adviser and registered transfer agent) Formerly: Director and Senior Vice President, Invesco Management Group, Inc. (formerly known as Invesco AIM Management Group, Inc.); Secretary and General Counsel, Invesco Management Group, Inc. (formerly known as Invesco AIM Management Group, Inc.); Secretary, Invesco Investment Services, Inc. (formerly known as Invesco AIM Investment Services, Inc.); Chief Legal Officer and Secretary, The Invesco Funds; Secretary and General Counsel, Invesco Investment Advisers LLC (formerly known as Van Kampen Asset Management); Secretary and General Counsel, Invesco Capital Markets, Inc. (formerly known as Van Kampen Funds Inc.); Chief Legal Officer, Invesco Exchange-Traded Fund Trust, Invesco Exchange-Traded Fund Trust II, Invesco India Exchange-Traded Fund Trust, Invesco Actively Managed Exchange-Traded Fund Trust, Invesco Actively Managed Exchange-Traded Commodity Fund Trust and Invesco Exchange-Traded Self-Indexed Fund Trust; Secretary, Invesco Indexing LLC; Director, Secretary, General Counsel and Senior Vice President, Van Kampen Exchange Corp.; Director, Vice President and Secretary, IVZ Distributors, Inc. (formerly known as INVESCO Distributors, Inc.); Director and Vice President, INVESCO Funds Group, Inc.; Director and Vice President, Van Kampen Advisors Inc.; Director, Vice President, Secretary and General Counsel, Van Kampen Investor Services Inc.; Director and Secretary, Invesco Distributors, Inc. (formerly known as Invesco AIM Distributors, Inc.); Director, Senior Vice President, General Counsel and Secretary, Invesco AIM Advisers, Inc. and Van Kampen Investments Inc.; Director, Vice President and Secretary, Fund Management Company; Director, Senior Vice President, Secretary, General Counsel and Vice President, Invesco AIM Capital Management, Inc.; Chief Operating Officer and General Counsel, Liberty Ridge Capital, Inc. (an investment adviser) | | N/A | | N/A |
Gregory G. McGreevey — 1962 Senior Vice President | | 2012 | | Senior Managing Director, Invesco Ltd.; Director, Chairman, President, and Chief Executive Officer, Invesco Advisers, Inc. (formerly known as Invesco Institutional (N.A.), Inc.) (registered investment adviser); Director, Invesco Mortgage Capital, Inc. and Invesco Senior Secured Management, Inc.; and Senior Vice President, The Invesco Funds; and President, SNW Asset Management Corporation Formerly: Senior Vice President, Invesco Management Group, Inc. and Invesco Advisers, Inc.; Assistant Vice President, The Invesco Funds | | N/A | | N/A |
Kelli Gallegos — 1970 Vice President, Principal Financial Officer and Assistant Treasurer | | 2008 | | Assistant Treasurer, Invesco Specialized Products, LLC; Vice President, Principal Financial Officer and Assistant Treasurer, The Invesco Funds; Principal Financial and Accounting Officer — Pooled Investments, Invesco Capital Management LLC; Vice President and Treasurer, Invesco Exchange-Traded Fund Trust, Invesco Exchange-Traded Fund Trust II, Invesco India Exchange-Traded Fund Trust, Invesco Actively Managed Exchange-Traded Fund Trust, Invesco Actively Managed Exchange-Traded Commodity Fund Trust and Invesco Exchange-Traded Self-Indexed Fund Trust Formerly: Assistant Treasurer, Invesco Exchange-Traded Fund Trust, Invesco Exchange-Traded Fund Trust II, Invesco India Exchange-Traded Fund Trust, Invesco Actively Managed Exchange-Traded Fund Trust, Invesco Actively Managed Exchange-Traded Commodity Fund Trust and Invesco Exchange-Traded Self-Indexed Fund Trust; Assistant Treasurer, Invesco Capital Management LLC; Assistant Vice President, The Invesco Funds | | N/A | | N/A |
T-5 Invesco S&P 500 Index Fund
Trustees and Officers—(continued)
| | | | | | | | |
Name, Year of Birth and Position(s) Held with the Trust | | Trustee and/ or Officer Since | | Principal Occupation(s)
During Past 5 Years | | Number of
Funds in Fund
Complex
Overseen by
Trustee | | Other Directorship(s) Held by Trustee During
Past 5 Years |
| Other Officers—(continued) | | | | | | | | |
Crissie M. Wisdom — 1969 Anti-Money Laundering Compliance Officer | | 2013 | | Anti-Money Laundering Compliance Officer, Invesco Advisers, Inc. (formerly known as Invesco Institutional (N.A.), Inc.) (registered investment adviser), Invesco Capital Markets, Inc. (formerly known as Van Kampen Funds Inc.), Invesco Distributors, Inc., Invesco Investment Services, Inc., The Invesco Funds, and Invesco Exchange-Traded Fund Trust, Invesco Exchange-Traded Fund Trust II, Invesco India Exchange-Traded Fund Trust, Invesco Actively Managed Exchange-Traded Fund Trust, Invesco Actively Managed Exchange-Traded Commodity Fund Trust and Invesco Exchange-Traded Self-Indexed Fund Trust; Anti-Money Laundering Compliance Officer and Bank Secrecy Act Officer, INVESCO National Trust Company and Invesco Trust Company; and Fraud Prevention Manager and Controls and Risk Analysis Manager for Invesco Investment Services, Inc. Formerly: Anti-Money Laundering Compliance Officer, Van Kampen Exchange Corp. and Invesco Management Group, Inc. | | N/A | | N/A |
Robert R. Leveille — 1969 Chief Compliance Officer | | 2016 | | Chief Compliance Officer, Invesco Advisers, Inc. (registered investment adviser); and Chief Compliance Officer, The Invesco Funds Formerly: Chief Compliance Officer, Putnam Investments and the Putnam Funds | | N/A | | N/A |
The Statement of Additional Information of the Trust includes additional information about the Fund’s Trustees and is available upon request, without charge, by calling 1.800.959.4246. Please refer to the Fund’s Statement of Additional Information for information on the Fund’ssub-advisers.
| | | | | | |
Office of the Fund 11 Greenway Plaza, Suite 1000
Houston, TX 77046-1173 | | Investment Adviser Invesco Advisers, Inc.
1555 Peachtree Street, N.E.
Atlanta, GA 30309 | | Distributor Invesco Distributors, Inc.
11 Greenway Plaza, Suite 1000
Houston, TX 77046-1173 | | Auditors PricewaterhouseCoopers LLP
1000 Louisiana Street, Suite 5800 Houston, TX 77002-5021 |
| | | |
| | | | | | |
Counsel to the Fund Stradley Ronon Stevens & Young, LLP
2005 Market Street, Suite 2600
Philadelphia, PA 19103-7018 | | Counsel to the Independent Trustees Goodwin Procter LLP
901 New York Avenue, N.W.
Washington, D.C. 20001 | | Transfer Agent Invesco Investment Services, Inc.
11 Greenway Plaza, Suite 1000
Houston, TX 77046-1173 | | Custodian State Street Bank and Trust Company
225 Franklin Street
Boston, MA 02110-2801 |
T-6 Invesco S&P 500 Index Fund
Go paperless with eDelivery
Visit invesco.com/edelivery to enjoy the convenience and security of anytime electronic access to your investment documents.
With eDelivery, you can elect to have any or all of the following materials delivered straight to your inbox to download, save and print from your own computer:
| • | Fund reports and prospectuses |
| • | Quarterly statements |
| • | Daily confirmations |
| • | Tax forms |
Invesco mailing information
Send general correspondence to Invesco Investment Services, Inc., P.O. Box 219078, Kansas City, MO 64121-9078.
Important notice regarding delivery of security holder documents
To reduce Fund expenses, only one copy of most shareholder documents may be mailed to shareholders with multiple accounts at the same address (Householding). Mailing of your shareholder documents may be householded indefinitely unless you instruct us otherwise. If you do not want the mailing of these documents to be combined with those for other members of your household, please contact Invesco Investment Services, Inc. at 800 959 4246 or contact your financial institution. We will begin sending you individual copies for each account within 30 days after receiving your request.
Fund holdings and proxy voting information
The Fund provides a complete list of its holdings four times in each fiscal year, at the quarter-ends. For the second and fourth quarters, the list appears in the Fund’s semiannual and annual reports to shareholders. For the first and third quarters, the Fund files the lists with the Securities and Exchange Commission (SEC) as an exhibit to its reports on Form N-PORT. The most recent list of portfolio holdings is available at invesco.com/completeqtrholdings. Shareholders can also look up the Fund’s Form N-PORT filings on the SEC website, sec.gov. The SEC file numbers for the Fund are shown below.
A description of the policies and procedures that the Fund uses to determine how to vote proxies relating to portfolio securities is available without charge, upon request, from our Client Services department at 800 959 4246, or at invesco.com/proxyguidelines. The information is also available on the SEC website, sec.gov.
Information regarding how the Fund voted proxies related to its portfolio securities during the most recent 12-month period ended June 30 is available at invesco.com/proxysearch. This information is also available on the SEC website, sec.gov.
Invesco Advisers, Inc. is an investment adviser; it provides investment advisory services to individual and institutional clients and does not sell securities. Invesco Distributors, Inc. is the US distributor for Invesco Ltd.’s retail mutual funds, exchange-traded funds and institutional money market funds. Both are wholly owned, indirect subsidiaries of Invesco Ltd.
| SEC file numbers: 811-09913 and 333-36074 | Invesco Distributors, Inc. | MS-SPI-AR-1 |
| Annual Report to Shareholders | August 31, 2019 |
Invesco Short Duration High Yield Municipal Fund
Nasdaq:
A: ISHAX ■ C: ISHCX ■ Y: ISHYX ■ R5: ISHFX ■ R6: ISHSX

Beginning on January 1, 2021, as permitted by regulations adopted by the Securities and Exchange Commission, paper copies of the Fund’s shareholder reports will no longer be sent by mail, unless you specifically request paper copies of the reports from the Fund or from your financial intermediary, such as a broker-dealer or bank. Instead, the reports will be made available on the Fund’s website, and you will be notified by mail each time a report is posted and provided with a website link to access the report.
If you already elected to receive shareholder reports electronically, you will not be affected by this change and you need not take any action. You may elect to receive shareholder reports and other communications from the Fund electronically by contacting your financial intermediary (such as a broker-dealer or bank) or, if you are a direct investor, by enrolling at invesco.com/edelivery.
You may elect to receive all future reports in paper free of charge. If you invest through a financial intermediary, you can contact your financial intermediary to request that you continue to receive paper copies of your shareholder reports. If you invest directly with the Fund, you can call (800) 959-4246 to let the Fund know you wish to continue receiving paper copies of your shareholder reports. Your election to receive reports in paper will apply to all funds held with your financial intermediary or all funds held with the fund complex if you invest directly with the Fund.
Dear Shareholders:
This annual report includes information about your Fund, including performance data and a complete list of its investments as of the close of the reporting period. Inside is a discussion of how your Fund was managed and the factors that affected its performance during the reporting period.
Throughout the reporting period, global equity markets remained volatile. Investor sentiment ranged from elation to fear. The reporting period began with several US equity indexes redefining new highs. The exuberance, however, ended in October 2018 as global equities, in particular US stocks, sold off, with the sharpest decline in December. The catalyst for the sell-off was a combination of ongoing trade concerns between the US and China, fears of a global economic slowdown and lower oil prices from a supply glut. Gains posted earlier in 2018 for global equities were erased, while US Treasury bonds, along with government and municipal bonds, rallied as investors fled to “safe haven” assets.
At the start of 2019, global equity markets rebounded strongly buoyed by more dovish central banks and optimism about a potential US-China trade deal. In May, US-China trade concerns and slowing global growth led to a global equity sell-off and rally in U.S. Treasuries. Despite the May sell-off, domestic equity markets rallied in June in anticipation of a U.S. Federal Reserve (the Fed) rate cut and closed the second quarter with modest gains. As the reporting period ended in August, market volatility once again increased as the US Treasury yield curve inverted several times magnifying concerns that the US economy could be headed into a recession.
During the reporting period, the Fed both raised and lowered the federal funds rate. Given signs of a strong economy, the Fed raised rates two times: in September and December 2018. In 2019, however, the Fed altered its outlook on further rate hikes leaving rates unchanged for the first half of the year. In July, the Fed lowered interest rates for the first time in 11 years. As 2019 unfolds, we’ll see how the interplay of interest rates, economic data, geopolitics and a host of other factors affect US and overseas equity and fixed income markets.
Investor uncertainty and market volatility, such as we witnessed during the reporting period, are unfortunate facts of life when it comes to investing. That’s why Invesco encourages investors to work with a professional financial adviser who can stress the importance of starting to save and invest early and the importance of adhering to a disciplined investment plan. A financial adviser who knows your unique financial situation, investment goals and risk tolerance can be an invaluable partner as you seek to achieve your financial goals. He or she can offer a long-term perspective when markets are volatile and time-tested advice and guidance when your financial situation or investment goals change.
Visit our website for more information on your investments
Our website, invesco.com/us, offers a wide range of market insights and investment perspectives. On the website, you’ll find detailed information about our funds, including performance, holdings and portfolio manager commentaries. You can access information about your account by completing a simple, secure online registration. To do so, select “Log In” on the right side of the homepage, and then select “Register for Individual Account Access.”
In addition to the resources accessible on our website and through our mobile app, you can obtain timely updates to help you stay informed about the markets and the economy by connecting with Invesco on Twitter, LinkedIn or Facebook. You can access our blog at blog.invesco.us.com. Our goal is to provide you the information you want, when and where you want it.
Finally, I’m pleased to share with you Invesco’s commitment to both the Principles for Responsible Investment and to considering environmental, social and governance issues in our robust investment process. I invite you to learn more at invesco.com/esg.
Have questions?
For questions about your account, contact an Invesco client services representative at 800 959 4246.
All of us at Invesco look forward to serving your investment management needs. Thank you for investing with us.
Sincerely,
Andrew Schlossberg
Head of the Americas,
Senior Managing Director, Invesco Ltd.
| 2 | Invesco Short Duration High Yield Municipal Fund |
Dear Shareholders:
Among the many important lessons I’ve learned in more than 40 years in a variety of business endeavors is the value of a trusted advocate.
As independent chair of the Invesco Funds Board, I can assure you that the members of the Board are strong advocates for the interests of investors in Invesco’s mutual funds. We work hard to represent your interests through oversight of the quality of the investment management services your funds receive and other matters important to your investment, including but not limited to:
| ■ | Ensuring that Invesco offers a diverse lineup of mutual funds that your financial adviser can use to strive to meet your financial needs as your investment goals change over time. |
| ■ | Monitoring how the portfolio management teams of the Invesco funds are performing in light of changing economic and market conditions. |
| ■ | Assessing each portfolio management team’s investment performance within the context of the investment strategy described in the fund’s prospectus. |
| ■ | Monitoring for potential conflicts of interests that may impact the nature of the services that your funds receive. |
We believe one of the most important services we provide our fund shareholders is the annual review of the funds’ advisory and sub-advisory contracts with Invesco Advisers and its affiliates. This review is required by the Investment Company Act of 1940 and focuses on the nature and quality of the services Invesco provides as the adviser to the Invesco funds and the reasonableness of the fees that it charges for those services. Each year, we spend months carefully reviewing information received from Invesco and a variety of independent sources, such as performance and fee data prepared by Lipper, Inc. (a subsidiary of Broadridge Financial Solutions, Inc.), an independent, third-party firm widely recognized as a leader in its field. We also meet with our independent legal counsel and other independent advisers to review and help us assess the information that we have received. Our goal is to assure that you receive quality investment management services for a reasonable fee.
I trust the measures outlined above provide assurance that you have a worthy advocate when it comes to choosing the Invesco Funds.
As always, please contact me at bruce@brucecrockett.com with any questions or concerns you may have. On behalf of the Board, we look forward to continuing to represent your interests and serving your needs.
Sincerely,
Bruce L. Crockett
Independent Chair
Invesco Funds Board of Trustees
| 3 | Invesco Short Duration High Yield Municipal Fund |
Management’s Discussion of Fund Performance
Performance summary
For the fiscal year ended August 31, 2019, Class A shares of Invesco Short Duration High Yield Municipal Fund (the Fund), at net asset value (NAV), outperformed the Custom Invesco Short Duration High Yield Municipal Index, the Fund’s style-specific benchmark.
Your Fund’s long-term performance appears later in this report.
Fund vs. Indexes
Total returns, August 31, 2018 to August 31, 2019, at net asset value (NAV). Performance shown does not include applicable contingent deferred sales charges (CDSC) or front-end sales charges, which would have reduced performance.
| Class A Shares | 7.09% |
| Class C Shares | 6.29 |
| Class Y Shares | 7.35 |
| Class R5 Shares | 7.44 |
| Class R6 Shares | 7.44 |
| S&P Municipal Bond High Yield Index▼ (Broad Market Index) | 8.94 |
Custom Invesco Short Duration High Yield Municipal Index■
(Style-Specific Index) | 6.68 |
Lipper High Yield Municipal Debt Funds Index♦
(Peer Group Index) | 8.79 |
| Source(s):▼RIMES Technologies Corp.;■ Invesco, RIMES Technologies Corp.;♦ Lipper Inc. |
Market conditions and your Fund
The broad municipal bond market experienced positive returns for the fifth consecutive year in 2018, and performance remained strong throughout this fiscal year. Investment grade municipal bonds returned 8.72% and high yield municipal bonds returned 9.81% during the fiscal year.1 Performance was particularly strong during the first eight months of 2019, with investment grade municipals returning 7.61% and high yield municipals returning 9.91%.1
The fiscal year was characterized by supportive technical conditions (supply and demand balances) as new issuance of municipal bonds totaled $351 billion — down nearly 15% from the previous fiscal year.2 Flows into the municipal bond asset class were positive for the last 34 weeks of the fiscal year.3 A consistently positive flow pattern, coupled with continued limited supply, resulted in strong performance across the municipal bond market. Fund flows totaled $52.1 billion from September 2018 through August 2019.3
For the fiscal year, the high yield municipal bond market outperformed the investment grade bond segment, led by improved price discovery on Puerto Rico bonds as a result of developments in the commonwealth’s debt restructuring, as well as strong performance of high yield general obligation securities.
Municipal bonds withstood considerable headwinds during the fiscal year, including interest rate movements that had the 10-year US Treasury yield breaching 2.00% in July 2019.4 Additionally, the US government shutdown, which occurred midway through the fiscal year and lasted 35 days, along with ongoing US-China trade negotiations and Brexit developments, created a challenging market environment. Both investment grade municipals and high yield municipals posted negative returns for the months of September and October 2018. Worsening market conditions exposed the municipal bond market to more sensitivity relating to a sell-off in US Treasuries in September 2018. Despite these challenges, the municipal
bond market performed positively for the fiscal year as technical conditions continued to provide tailwinds.
Concerns about future interest rate hikes led to an increased demand for US Treasuries and investment grade municipal bonds alike, and yields continued to fall as high yield securities rallied. The yield curve for 30-year, AAA-rated municipal bonds continued to flatten as trade tensions between the US and China increased worries about inflationary pressures.
During the fiscal year, the US Federal Reserve (the Fed) raised the federal funds rate two times in September and December 2018, before lowering it in July 2019.5 The two rate hikes, the eighth and ninth since December 2008, were anticipated and reflected increased confidence in the US economy amid low unemployment, relatively stable inflation and overall robust economic growth. This expansionary monetary policy significantly flattened the US Treasury yield curve with a slight inversion on the short end occurring in December 2018.
However, the Fed’s dovish stance at the beginning of calendar year 2019 took the market by surprise, leading economists to change their predictions from two interest rate increases in 2019 to just one. Despite favorable growth and labor trends, the Fed ultimately reversed course and lowered the federal funds rate in July 2019, citing uncertainty about the global economic outlook. The US Treasury curve was inverted at fiscal year-end with the yield on the 2-year US Treasury note exceeding the 10-year note.4 Economist views were mixed as to whether this inversion, the first since December 2005, signaled a possible recession.
As anticipated, US midterm election results had a positive impact on municipal securities as perceived threats to municipal tax exemptions, further tax reform and changes to the Affordable Care
| Portfolio Composition |
| By credit sector, based on total investments |
| as of August 31, 2019 |
| Revenue Bonds | 88.9% |
| General Obligation Bonds | 10.9 |
| Pre-Refunded Bonds | 0.2 |
| Top Five Debt Holdings |
| Based on total net assets |
| 1. | Tuscaloosa (County of), AL Industrial Development Authority (Hunt Refining) | 1.2% |
| 2. | Illinois (State of) | 0.9% |
| 3. | Fourth Street Crossing Business Improvement District | 0.9% |
| 4. | New York (City of), NY Municipal Water Finance Authority | 0.9% |
| 5. | Buckeye Tobacco Settlement Financing Authority | 0.8% |
| Total Net Assets | 477.2 million |
| Total Number of Holdings | 395 |
| The Fund’s holdings are subject to change, and there is no assurance that the Fund will continue to hold any particular security. |
| Data presented here are as of August 31, 2019. |
| 4 | Invesco Short Duration High Yield Municipal Fund |
Act were greatly reduced. News of a possible ban on flavored e-cigarettes and menthol cigarettes made headlines, which caused a short-lived decline in the valuations of below investment grade tobacco settlement bonds. Meanwhile, year-end demand for yield and coupon payments caused the asset class to end 2018 on a strong note. Investors affected by the Tax Cuts and Jobs Acts of 2017, which instituted a $10,000 cap on state and local tax deductions, poured a record $18.9 billion into municipal bond funds in the first eight weeks of calendar year 2019, the most recorded over that period in at least 13 years.3
At the close of the fiscal year, we believed municipal fundamentals remained strong and viewed the ongoing impact of the Tax Cuts and Jobs Act as a potential market factor. As a result, we believe demand for municipal bond investments could remain strong as retail investors continue to seek tax-exempt income.
During the fiscal year, security selection in state and local general obligation bonds, as well as the industrial development revenue/pollution control revenue sector aided the Fund’s performance relative to its style-specific benchmark. Security selection in higher coupon bonds (5.00%+) also contributed to the Fund’s relative performance. At the state level, holdings in Vermont and Illinois also contributed to the Fund’s relative performance. Security selection in higher education and life care bonds detracted from the Fund’s relative performance over the fiscal year. On a state level, holdings in Oklahoma detracted from the Fund’s relative return.
During the fiscal year, leverage contributed to the Fund’s performance relative to its style-specific benchmark. The Fund achieved a leveraged position through the use of inverse floating rate securities. The Fund uses leverage because we believe that, over time, leveraging provides opportunities for additional income and total return for shareholders. However, the use of leverage also can expose common shareholders to additional volatility.
We wish to remind you that the Fund is subject to interest rate risk, meaning when interest rates rise, the value of fixed income securities tends to fall. The degree to which the value of fixed income securities may decline due to rising interest rates may vary depending on the speed and magnitude of the increase in interest rates, as well as individual security characteristics, such as price, maturity, duration and coupon and market
forces, such as supply and demand for similar securities. We are monitoring interest rates, as well as the market, economic and geopolitical factors that may impact the direction, speed and magnitude of changes to interest rates across the maturity spectrum, including the potential impact of monetary policy changes by the Fed and certain foreign central banks. If interest rates rise, markets may experience increased volatility, which may affect the value and/or liquidity of certain of the Fund’s investments.
Thank you for investing in Invesco Short Duration High Yield Municipal Fund and for sharing our long-term investment horizon.
| 1 | Source: FactSet Research Systems Inc. |
| 3 | Source: Strategic Insight |
| 4 | Source: US Department of the Treasury |
| 5 | Source: US Federal Reserve |
The views and opinions expressed in management’s discussion of Fund performance are those of Invesco Advisers, Inc. These views and opinions are subject to change at any time based on factors such as market and economic conditions. These views and opinions may not be relied upon as investment advice or recommendations, or as an offer for a particular security. The information is not a complete analysis of every aspect of any market, country, industry, security or the Fund. Statements of fact are from sources considered reliable, but Invesco Advisers, Inc. makes no representation or warranty as to their completeness or accuracy. Although historical performance is no guarantee of future results, these insights may help you understand our investment management philosophy.
See important Fund and, if applicable, index disclosures later in this report.
Mark Paris
Portfolio Manager and Chief Investment Officer and Head of Municipal Strategies for Invesco Fixed Income, is manager of Invesco Short Duration High Yield Municipal Fund. He joined Invesco in 2010. Mr. Paris earned a BBA in finance from Baruch College — The City University of New York.
John (Jack) Connelly
Portfolio Manager, is manager of Invesco Short Duration High Yield Municipal Fund. He joined Invesco in 2016. Mr. Connelly earned a BA in philosophy from Wheaton College and masters degrees from the University of Rhode Island and Yale University.
Tim O’Reilly
Portfolio Manager, is manager of Invesco Short Duration High Yield Municipal Fund. He joined Invesco in 2010. Mr. O’Reilly earned a BS in finance from Eastern Illinois University and an MBA in finance from the University of Illinois at Chicago.
James Phillips
Portfolio Manager, is manager of Invesco Short Duration High Yield Municipal Fund. He joined Invesco in 2010. Mr. Phillips earned a BA in American literature from Empire State College, the independent study division of the State University of New York, and an MBA in finance from the University at Albany, State University of New York.
John Schorle
Portfolio Manager, is manager of Invesco Short Duration High Yield Municipal Fund. He has been associated with Invesco or its investment advisory affiliates since 2010. Mr. Schorle earned a BA degree in economics from DePaul University. He is also a Registered Certified Public Accountant.
Julius Williams
Portfolio Manager, is manager of Invesco Short Duration High Yield Municipal Fund. He joined Invesco in 2010. Mr. Williams earned a BA in economics and sociology and a Master of Education degree in educational psychology from the University of Virginia.
| 5 | Invesco Short Duration High Yield Municipal Fund |
Your Fund’s Long-Term Performance
Results of a $10,000 Investment — Oldest Share Class(es) since Inception
Fund and index data from 9/30/15
| 1 | Source: RIMES Technologies Corp. |
| 2 | Source: Lipper Inc. |
| 3 | Sources: Invesco, RIMES Technologies Corp. |
Past performance cannot guarantee comparable future results.
The data shown in the chart include reinvested distributions, applicable sales charges and Fund expenses including
management fees. Index results include reinvested dividends, but they do not reflect sales charges. Performance of the peer group, if applicable, reflects fund expenses and management fees; perfor-
mance of a market index does not. Performance shown in the chart and table(s) does not reflect deduction of taxes a shareholder would pay on Fund distributions or sale of Fund shares.
| 6 | Invesco Short Duration High Yield Municipal Fund |
| Average Annual Total Returns |
| As of 8/31/19, including maximum applicable sales charges |
| Class A Shares | |
| Inception (9/30/15) | 4.70% |
| 1 Year | 4.39 |
| Class C Shares | |
| Inception (9/30/15) | 4.59% |
| 1 Year | 5.29 |
| Class Y Shares | |
| Inception (9/30/15) | 5.66% |
| 1 Year | 7.35 |
| Class R5 Shares | |
| Inception (9/30/15) | 5.69% |
| 1 Year | 7.44 |
| Class R6 Shares | |
| Inception | 5.58% |
| 1 Year | 7.44 |
Class R6 shares incepted on April 4, 2017. Performance shown prior to that date is that of Class A shares and includes the 12b-1 fees applicable to Class A shares.
The performance data quoted represent past performance and cannot guarantee comparable future results; current performance may be lower or higher. Please visit invesco.com/performance for the most recent month-end performance. Performance figures reflect reinvested distributions, changes in net asset value and the effect of the maximum sales charge unless otherwise stated. Investment return and principal value will fluctuate so that you may have a gain or loss when you sell shares.
The net annual Fund operating expense ratio set forth in the most recent Fund prospectus as of the date of this report for Class A, Class C, Class Y, Class R5 and Class R6 shares was 0.86%, 1.61%, 0.61%, 0.61% and 0.61%, respectively.1 The total annual Fund operating expense ratio set forth in the most recent Fund prospectus as of the date of this report for Class A, Class C, Class Y, Class R5 and Class R6 shares was 1.06%, 1.81%, 0.81%, 0.82% and 0.76%, respectively. The expense ratios presented above may vary from the expense ratios presented in other sections of this report that are based on expenses incurred during the period covered by this report.
Class A share performance reflects the maximum 2.50% sales charge, and
| Average Annual Total Returns |
| As of 6/30/19, the most recent calendar quarter end, including maximum applicable sales charges |
| Class A Shares | |
| Inception (9/30/15) | 4.46% |
| 1 Year | 3.36 |
| Class C Shares | |
| Inception (9/30/15) | 4.38% |
| 1 Year | 4.14 |
| Class Y Shares | |
| Inception (9/30/15) | 5.45% |
| 1 Year | 6.28 |
| Class R5 Shares | |
| Inception (9/30/15) | 5.45% |
| 1 Year | 6.18 |
| Class R6 Shares | |
| Inception | 5.36% |
| 1 Year | 6.27 |
Class C share performance reflects the applicable contingent deferred sales charge (CDSC) for the period involved. The CDSC on Class C shares is 1% for the first year after purchase. Class Y, Class R5 and Class R6 shares do not have a front-end sales charge or a CDSC; therefore, performance is at net asset value.
The performance of the Fund’s share classes will differ primarily due to different sales charge structures and class expenses.
Fund performance reflects any applicable fee waivers and/or expense reimbursements. Had the adviser not waived fees and/or reimbursed expenses currently or in the past, returns would have been lower. See current prospectus for more information.
| 1 | Total annual Fund operating expenses after any contractual fee waivers by the adviser in effect through at least December 31, 2019. See current prospectus for more information. |
| 7 | Invesco Short Duration High Yield Municipal Fund |
Invesco Short Duration High Yield Municipal Fund’s investment objective is to seek federal tax-exempt current income and taxable capital appreciation.
| ■ | Unless otherwise stated, information presented in this report is as of August 31, 2019, and is based on total net assets. |
| ■ | Unless otherwise noted, all data provided by Invesco. |
| ■ | To access your Fund’s reports/prospectus, visit invesco.com/fundreports. |
About share classes
| ■ | Class Y shares are available only to certain investors. Please see the prospectus for more information. |
| ■ | Class R5 shares andClass R6 shares are available for use by retirement plans that meet certain standards and for institutional investors. Class R6 shares are also available through intermediaries that have established an agreement with Invesco Distributors, Inc. to make such shares available for use in retail omnibus accounts. Please see the prospectus for more information. |
Principal risks of investing in the Fund
| ■ | Alternative minimum tax risk. All or a portion of the Fund’s otherwise tax-exempt income may be taxable to those shareholders subject to the federal alternative minimum tax. |
| ■ | Changing fixed income market conditions risk.The current low interest rate environment was created in part by the Federal Reserve Board (FRB) and certain foreign central banks keeping the federal funds and equivalent foreign rates near historical lows. Increases in the federal funds and equivalent foreign rates may expose fixed income markets to heightened volatility and reduced liquidity for certain fixed income investments, particularly those with longer maturities. In addition, decreases in fixed income dealer market-making capacity may also potentially lead to heightened volatility and reduced liquidity in the fixed income markets. As a result, the value of the Fund’s investments and share price may decline. Changes in central bank policies could also result in higher than normal shareholder redemptions, which could potentially increase portfolio turnover and the Fund’s transaction costs. |
| ■ | Debt securities risk.The prices of debt securities held by the Fund will be affected by changes in interest rates, the creditworthiness of the issuer and other factors. An increase in prevailing interest rates typically causes the value of existing debt securities to fall and often has a greater impact on longer-duration debt securities and higher quality debt securities. Falling interest rates will cause the Fund to reinvest the proceeds of debt securities that have been repaid by the issuer at lower interest rates. Falling interest rates may also reduce the Fund’s distributable income because interest payments on floating rate debt instruments held by the Fund will decline. The Fund could lose money on investments in debt securities if the issuer or borrower fails to meet its obligations to make interest payments and/or to repay principal in a timely manner. Changes in an issuer’s financial strength, the market’s perception of such strength or in the credit rating of the issuer or the security may affect the value of debt securities. The Adviser’s credit analysis may fail to anticipate such changes, which could result in buying a debt security at an inopportune time or failing to sell a debt security in advance of a price decline or other credit event. |
| ■ | Derivatives risk. The value of a derivative instrument depends largely on (and is derived from) the value of an underlying security, currency, commodity, interest rate, index or other asset (each referred to as an underlying asset). In addition to risks relating to the underlying assets, the use of derivatives may include other, possibly greater, risks, including counterparty, leverage and liquidity risks. Counterparty risk is the risk that the counterparty to the derivative contract will default on its obligation to pay the Fund the amount owed or otherwise perform under the deriva- |
| | tive contract. Derivatives create leverage risk because they do not require payment up front equal to the economic exposure created by holding a position in the derivative. As a result, an adverse change in the value of the underlying asset could result in the Fund sustaining a loss that is substantially greater than the amount invested in the derivative or the anticipated value of the underlying asset, which may make the Fund’s returns more volatile and increase the risk of loss. Derivative instruments may also be less liquid than more traditional investments and the Fund may be unable to sell or close out its derivative positions at a desirable time or price. This risk may be more acute under adverse market conditions, during which the Fund may be most in need of liquidating its derivative positions. Derivatives may also be harder to value, less tax efficient and subject to changing government regulation that could impact the Fund’s ability to use certain derivatives or their cost. Derivatives strategies may not always be successful. For example, derivatives used for hedging or to gain or limit exposure to a particular market segment may not provide the expected benefits, particularly during adverse market conditions. |
| ■ | High yield debt securities (junk bond) risk.Investments in high yield debt securities (“junk bonds”) and other lower-rated securities will subject the Fund to substantial risk of loss. These securities are considered to be speculative with respect to the issuer’s ability to pay interest and principal when due, are more susceptible to default or decline in market value and are less liquid than investment grade debt securities. Prices of high yield debt securities tend to be very volatile. |
| ■ | Inverse floating rate obligations risk. The price of inverse floating rate obligations (inverse floaters) is expected |
This report must be accompanied or preceded by a currently effective Fund prospectus, which contains more complete information, including sales charges and expenses. Investors should read it carefully before investing.
NOT FDIC INSURED | MAY LOSE VALUE | NO BANK GUARANTEE
| 8 | Invesco Short Duration High Yield Municipal Fund |
| | to decline when interest rates rise, and generally will decline further than the price of a bond with a similar maturity. The price of inverse floaters is typically more volatile than the price of bonds with similar maturities. These risks can be particularly high if leverage is used in the formula that determines the interest payable by the inverse floater, which may make the Fund’s returns more volatile and increase the risk of loss. Additionally, these securities may lose some or all of their principal and, in some cases, the Fund could lose money in excess of its investment. |
| ■ | Liquidity risk. The Fund may be unable to sell illiquid investments at the time or price it desires and, as a result, could lose its entire investment in such investments. Liquid securities can become illiquid during periods of market stress. If a significant amount of the Fund’s securities become illiquid, the Fund may not be able to timely pay redemption proceeds and may need to sell securities at significantly reduced prices. |
| ■ | Management risk.The Fund is actively managed and depends heavily on the Adviser’s judgment about markets, interest rates or the attractiveness, relative values, liquidity, or potential appreciation of particular investments made for the Fund’s portfolio. The Fund could experience losses if these judgments prove to be incorrect. Additionally, legislative, regulatory, or tax developments may adversely affect management of the Fund and, therefore, the ability of the Fund to achieve its investment objective. |
| ■ | Market risk.The market values of the Fund’s investments, and therefore the value of the Fund’s shares, will go up and down, sometimes rapidly or unpredictably. Market risk may affect a single issuer, industry or section of the economy, or it may affect the market as a whole. Individual stock prices tend to go up and down more dramatically than those of certain other types of investments, such as bonds. During a general downturn in the financial markets, multiple asset classes may decline in value. When markets perform well, there can be no assurance that specific investments held by the Fund will rise in value. |
| ■ | Medium- and lower-grade municipal securities risk. Medium- and lower-grade municipal securities generally involve more volatility and greater risks, including credit, market, liquidity |
| | and management risks, than higher-grade securities. Furthermore, many issuers of medium- and lower-grade securities choose not to have a rating assigned to their obligations. As such, the Fund’s portfolio may consist of a higher portion of unrated securities than an investment company investing solely in higher-grade securities. Unrated securities may not be as attractive to as many buyers as are rated securities, which may have the effect of limiting the Fund’s ability to sell such securities at their fair value. |
| ■ | Money market fund risk.Although money market funds generally seek to preserve the value of an investment at $1.00 per share, the Fund may lose money by investing in money market funds. A money market fund’s sponsor has no legal obligation to provide financial support to the money market fund. The credit quality of a money market fund’s holdings can change rapidly in certain markets, and the default of a single holding could have an adverse impact on the money market fund’s share price. A money market fund’s share price can also be negatively affected during periods of high redemption pressures, illiquid markets and/or significant market volatility. |
| ■ | Municipal issuer focus risk. The municipal issuers in which the Fund invests may be located in the same geographic area or may pay their interest obligations from revenue of similar projects, such as hospitals, airports, utility systems and housing finance agencies. This may make the Fund’s investments more susceptible to similar social, economic, political or regulatory occurrences, making the Fund more susceptible to experience a drop in its share price than if the Fund had been more diversified across issuers that did not have similar characteristics. |
| ■ | Municipal securities risk. The risk of a municipal obligation generally depends on the financial and credit status of the issuer. Constitutional amendments, legislative enactments, executive orders, administrative regulations, voter initiatives, and the issuer’s regional economic conditions may affect the municipal security’s value, interest payments, repayment of principal and the Fund’s ability to sell the security. Failure of a municipal security issuer to comply with applicable tax requirements may make income paid thereon taxable, resulting in a |
| | decline in the security’s value. In addition, there could be changes in applicable tax laws or tax treatments that reduce or eliminate the current federal income tax exemption on municipal securities or otherwise adversely affect the current federal or state tax status of municipal securities. |
| ■ | Variable-rate demand notes risk. The absence of an active secondary market for certain variable and floating rate notes could make it difficult to dispose of these instruments, which could result in a loss. |
| ■ | When-issued, delayed delivery and forward commitment risks. When-issued and delayed delivery transactions subject the Fund to market risk because the value or yield of a security at delivery may be more or less than the purchase price or yield generally available when delivery occurs, and counterparty risk because the Fund relies on the buyer or seller, as the case may be, to consummate the transaction. These transactions also have a leveraging effect on the Fund because the Fund commits to purchase securities that it does not have to pay for until a later date, which increases the Fund’s overall investment exposure and, as a result, its volatility. |
| ■ | Zero coupon or pay-in-kind securities risk. The value, interest rates, and liquidity of non-cash paying instruments, such as zero coupon and pay-in-kind securities, are subject to greater fluctuation than other types of securities. The higher yields and interest rates on pay-in-kind securities reflect the payment deferral and increased credit risk associated with such instruments and that such investments may represent a higher credit risk than loans that periodically pay interest. |
About indexes used in this report
| ■ | TheS&P Municipal Bond High Yield Index is an unmanaged index considered representative of municipal bonds that are not rated or are rated below investment grade. |
| ■ | TheCustom Invesco Short Duration High Yield Municipal Index is composed of 60% S&P Municipal Bond High Yield Index and 40% S&P Municipal Bond Short Index. |
| ■ | TheLipper High Yield Municipal Debt Funds Index is an unmanaged index considered representative of high-yield municipal debt funds tracked by Lipper. |
| 9 | Invesco Short Duration High Yield Municipal Fund |
| ■ | TheS&P Municipal Bond Short Index is considered representative of US municipal bonds with maturities between six months and four years. |
| ■ | The Fund is not managed to track the performance of any particular index, including the index(es) described here, and consequently, the performance of the Fund may deviate significantly from the performance of the index(es). |
| ■ | A direct investment cannot be made in an index. Unless otherwise indicated, index results include reinvested dividends, and they do not reflect sales charges. Performance of the peer group, if applicable, reflects fund expenses; performance of a market index does not. |
Other information
| ■ | CPA® and Certified Public Accountant® are trademarks owned by the American Institute of Certified Public Accountants. |
| ■ | The returns shown in management’s discussion of Fund performance are based on net asset values (NAVs) calculated for shareholder transactions. Generally accepted accounting principles require adjustments to be made to the net assets of the Fund at period end for financial reporting purposes, and as such, the NAVs for shareholder transactions and the returns based on those NAVs may differ from the NAVs and returns reported in the Financial Highlights. |
| ■ | Industry classifications used in this report are generally according to the Global Industry Classification Standard, which was developed by and is the exclusive property and a service mark of MSCI Inc. and Standard & Poor’s. |
| 10 | Invesco Short Duration High Yield Municipal Fund |
Schedule of Investments
August 31, 2019
| | Interest
Rate | Maturity
Date | | Principal
Amount
(000) | Value |
| Municipal Obligations–101.82% |
| Alabama–2.23% | | | |
| Birmingham (City of), AL Special Care Facilities Financing Authority (Methodist Home for the Aging); Series 2016, RB | 5.25% | 06/01/2025 | | | $1,500 | $ 1,627,005 |
| Black Belt Energy Gas District (The) (No. 4); Series 2019 A-1, RB(a) | 4.00% | 12/01/2025 | | | 2,000 | 2,267,900 |
| Huntsville (City of), AL Special Care Facilities Financing Authority (Redstone Village); Series 2007, RB(b) | 5.50% | 01/01/2028 | | | 90 | 74,623 |
| Southeast Alabama Gas Supply District (The) (No. 1); | | | | | | |
| Series 2018 B, RB (67% of 1 mo. USD LIBOR + 0.90%)(a)(c) | 2.30% | 04/01/2024 | | | 750 | 745,785 |
| Series 2018 C, RB (SIFMA Municipal Swap Index + 0.65%)(a)(c) | 1.93% | 04/01/2024 | | | 250 | 247,160 |
| Tuscaloosa (County of), AL Industrial Development Authority (Hunt Refining); Series 2019 A, Ref. IDR(d) | 4.50% | 05/01/2032 | | | 5,000 | 5,692,100 |
| | | | | | | 10,654,573 |
| Alaska–0.07% | | | |
| Northern Tobacco Securitization Corp.; Series 2006 A, RB | 4.63% | 06/01/2023 | | | 330 | 330,419 |
| American Samoa–0.23% | | | |
| American Samoa (Territory of) Economic Development Authority; Series 2015 A, Ref. RB | 6.25% | 09/01/2029 | | | 1,000 | 1,078,500 |
| Arizona–3.91% | | | |
| Arizona (State of) Industrial Development Authority (American Charter Schools Foundation); | | | | | | |
| Series 2017, Ref. RB(d) | 5.00% | 07/01/2022 | | | 1,500 | 1,556,805 |
| Series 2017, Ref. RB(d) | 6.00% | 07/01/2037 | | | 940 | 1,096,087 |
| Arizona (State of) Industrial Development Authority (Basis Schools); Series 2017 A, Ref. RB(d) | 5.00% | 07/01/2026 | | | 500 | 568,555 |
| Arizona (State of) Industrial Development Authority (Great Laked Senior Living Community); Series 2019 A, RB | 5.00% | 01/01/2034 | | | 1,875 | 2,251,725 |
| Arizona (State of) Industrial Development Authority (Leman Academy of Excellence); | | | | | | |
| Series 2017 A, Ref. RB(d) | 4.38% | 07/01/2029 | | | 1,000 | 1,035,380 |
| Series 2017 A, Ref. RB(d) | 5.00% | 07/01/2032 | | | 500 | 524,240 |
| Arizona (State of) Industrial Development Authority (Mater Academy of Nevada Mountain Vista Campus Project); Series 2018 A, RB(d) | 4.75% | 12/15/2028 | | | 395 | 433,659 |
| Arizona (State of) Industrial Development Authority (Pinecrest Academy of Nevada-Horizon, Inspirada and St. Rose Campus Projects); Series 2018 A, RB(d) | 5.00% | 07/15/2028 | | | 1,000 | 1,123,600 |
| Arizona (State of) Industrial Development Authority (Somerset Academy of Las Vegas - Lone Mountain Campus); | | | | | | |
| Series 2019 A, IDR(d) | 5.00% | 12/15/2039 | | | 400 | 442,788 |
| Series 2019 A, IDR(d) | 5.00% | 12/15/2049 | | | 700 | 763,833 |
| Glendale (City of), AZ Industrial Development Authority (Terraces of Phoenix); | | | | | | |
| Series 2018 A, Ref. RB | 3.60% | 07/01/2023 | | | 585 | 597,145 |
| Series 2018 A, Ref. RB | 5.00% | 07/01/2038 | | | 320 | 346,422 |
| Maricopa County Pollution Control Corp. (Southern California Education Co.); Series 2000 B, Ref. RB | 5.00% | 06/01/2035 | | | 3,000 | 3,069,210 |
| Phoenix (City of), AZ Industrial Development Authority (Basis Schools); Series 2016 A, Ref. RB(d) | 5.00% | 07/01/2035 | | | 1,000 | 1,092,150 |
| Pima (County of), AZ Industrial Development Authority (American Leadership Academy); | | | | | | |
| Series 2015, Ref. RB(d) | 4.60% | 06/15/2025 | | | 365 | 387,097 |
| Series 2015, Ref. RB(d) | 5.38% | 06/15/2035 | | | 1,000 | 1,107,230 |
| Pima (County of), AZ Industrial Development Authority (Grande Innovations Academy); Series 2018, RB(d) | 4.13% | 07/01/2026 | | | 1,225 | 1,259,214 |
| Tempe (City of), AZ Industrial Development Authority (Mirabella at ASU); Series 2017 B, RB(d) | 4.00% | 10/01/2023 | | | 1,000 | 1,012,820 |
| | | | | | | 18,667,960 |
| California–2.50% | | | |
| California (State of) Municipal Finance Authority (Bella Mente Montessori Academy); Series 2018 A, RB(d) | 5.00% | 06/01/2028 | | | 430 | 500,752 |
| California (State of) Municipal Finance Authority (UCR North District Phase 1 Student Housing); Series 2019, RB | 5.00% | 05/15/2029 | | | 1,000 | 1,292,250 |
See accompanying Notes to Financial Statements which are an integral part of the financial statements.
| 11 | Invesco Short Duration High Yield Municipal Fund |
| | Interest
Rate | Maturity
Date | Principal
Amount
(000) | Value |
| California–(continued) | |
| California (State of) Pollution Control Financing Authority (Aemerge Redpack Services Southern California, LLC); Series 2016, RB (Acquired 01/22/2016 - 09/25/2017; Cost $707,500)(b)(d)(e) | 7.00% | 12/31/2049 | | $ 710 | $ 355,000 |
| California (State of) Pollution Control Financing Authority (Waste Management, Inc.); Series 2015A-1, Ref. RB(e) | 3.38% | 07/01/2025 | | 2,000 | 2,207,700 |
| California (State of) School Finance Authority (New Designs Charter School); Series 2012 A, RB | 5.25% | 06/01/2032 | | 1,000 | 1,074,320 |
| California (State of) Statewide Communities Development Authority (Creative Child Care & Team Charter); Series 2015, RB (Acquired 11/03/2015; Cost $385,000)(d) | 5.00% | 06/01/2022 | | 385 | 393,874 |
| California (State of) Statewide Communities Development Authority (Lancer Educational Student Housing); | | | | | |
| Series 2016, Ref. RB(d) | 4.00% | 06/01/2021 | | 275 | 280,973 |
| Series 2016, Ref. RB(d) | 4.00% | 06/01/2026 | | 500 | 539,525 |
| California (State of) Statewide Communities Development Authority (Loma Linda University Medical Center); Series 2018 A, RB(d) | 5.25% | 12/01/2038 | | 1,790 | 2,153,388 |
| California (State of) Statewide Communities Development Authority (NCCD-Hooper Street LLC-California College of the Arts); Series 2019, RB(d) | 5.00% | 07/01/2029 | | 900 | 1,052,424 |
| California County Tobacco Securitization Agency (The) (Los Angeles County Securitization Corp.); Series 2006, RB(f) | 5.60% | 06/01/2036 | | 1,000 | 1,006,590 |
| California County Tobacco Securitization Agency (The) (Sonoma County Securitization Corp.); Series 2005, Ref. RB | 5.13% | 06/01/2038 | | 90 | 90,247 |
| San Diego Tobacco Settlement Revenue Funding Corp.; Series 2018 C, Ref. RB | 4.00% | 06/01/2032 | | 900 | 970,155 |
| | | | | | 11,917,198 |
| Colorado–7.89% | | |
| Amber Creak Metropolitan District; Series 2017 A, Ref. GO Bonds | 5.00% | 12/01/2037 | | 750 | 789,750 |
| Arista Metroplitan District; | | | | | |
| Series 2018 A, Ref. GO Bonds | 4.38% | 12/01/2028 | | 500 | 527,750 |
| Series 2018 A, Ref. GO Bonds | 5.00% | 12/01/2038 | | 1,240 | 1,321,989 |
| Arkansas River Power Authority; Series 2006, RB(g) | 5.88% | 10/01/2021 | | 1,000 | 1,049,270 |
| Broadway Station Metropolitan District No. 2; Series 2019 A, GO Bonds | 5.00% | 12/01/2035 | | 735 | 788,008 |
| Centerra Metropolitan District No. 1 (In the City of Loveland); Series 2017, Ref. RB(d) | 5.00% | 12/01/2029 | | 1,500 | 1,628,895 |
| Clear Creek Station Metropolitan District No. 2; Series 2017 A, Ref. GO Bonds | 4.38% | 12/01/2032 | | 790 | 826,166 |
| Colorado (State of) Health Facilities Authority (Frasier Meadows Retirement Community); | | | | | |
| Series 2017 A, Ref. RB | 5.00% | 05/15/2025 | | 525 | 604,506 |
| Series 2017 A, Ref. RB | 5.00% | 05/15/2026 | | 475 | 555,133 |
| Colorado (State of) Health Facilities Authority (Sunny Vista Living Center); Series 2015 A, Ref. RB(d) | 5.00% | 12/01/2025 | | 150 | 156,771 |
| Colorado (State of) Regional Transportation District (Denver Transit Partners Eagle P3); Series 2010, RB | 6.50% | 01/15/2030 | | 1,500 | 1,555,770 |
| Colorado International Center Metropolitan District No. 14; Series 2018, Ref. GO Bonds | 5.63% | 12/01/2032 | | 1,000 | 1,097,210 |
| Copperleaf Metropolitan District No. 2; Series 2015, Ref. GO Bonds | 5.25% | 12/01/2030 | | 500 | 525,700 |
| Cornerstar Metropolitan District; Series 2017 A, Ref. GO Bonds | 3.50% | 12/01/2021 | | 178 | 181,136 |
| Denver (City & County of), CO; | | | | | |
| Series 2016, Ref. RB (70% of 1 mo. USD LIBOR + 0.86%)(a)(c) | 2.32% | 11/15/2019 | | 880 | 880,387 |
| Series 2018 A, RB(e)(h) | 5.00% | 12/01/2029 | | 1,500 | 1,921,170 |
| Denver (City & County of), CO (United Airlines, Inc.); Series 2017, Ref. RB(e) | 5.00% | 10/01/2032 | | 1,500 | 1,653,630 |
| Denver Gateway Center Metropolitan District; Series 2018 A, GO Bonds | 5.50% | 12/01/2038 | | 1,375 | 1,473,808 |
| Fourth Street Crossing Business Improvement District; Series 2019 A, RB(d) | 4.63% | 12/01/2029 | | 4,000 | 4,088,560 |
| Gardens on Havana Metropolitan District No. 3 (The); Series 2017 A, RB | 3.63% | 12/01/2021 | | 703 | 717,777 |
| Godding Hollow Metropolitan District (In The Town of Frederick); Series 2018, GO Bonds | 6.50% | 12/01/2034 | | 1,000 | 1,059,580 |
| Grandby Ranch Metropolitan District; Series 2018, Ref. GO Bonds(d) | 4.88% | 12/01/2028 | | 965 | 997,308 |
| Independence Water & Sanitation District; Series 2019, RB | 7.25% | 12/01/2038 | | 1,500 | 1,603,230 |
| Neu Towne Metropolitan District; Series 2018 A, Ref. GO Bonds | 5.13% | 12/01/2031 | | 1,500 | 1,557,285 |
| North Park Metropolitan District No. 1; Seires 2018 A-2, RB | 5.13% | 12/01/2028 | | 1,500 | 1,611,765 |
| Plaza Metropolitan District No. 1; Series 2013, Ref. RB(d) | 5.00% | 12/01/2040 | | 1,465 | 1,541,883 |
| Prairie Center Metropolitan District No. 3; Series 2017 A, Ref. RB(d) | 4.13% | 12/15/2027 | | 965 | 1,001,631 |
| Solaris Metropolitan District No. 3; Series 2016 A, Ref. GO Bonds | 5.00% | 12/01/2036 | | 1,000 | 1,055,970 |
See accompanying Notes to Financial Statements which are an integral part of the financial statements.
| 12 | Invesco Short Duration High Yield Municipal Fund |
| | Interest
Rate | Maturity
Date | Principal
Amount
(000) | Value |
| Colorado–(continued) | |
| Southlands Metropolitan District No. 1; | | | | | |
| Series 2017 A-1, Ref. GO Bonds | 5.00% | 12/01/2037 | | $100 | $113,955 |
| Series 2017 A-2, GO Bonds | 5.00% | 12/01/2037 | | 200 | 227,910 |
| Sterling Ranch Community Authority Board; Series 2017 A, RB | 5.00% | 12/01/2030 | | 1,750 | 1,847,125 |
| Trails at Crowfoot Metropolitan District No. 3; | | | | | |
| Series 2019 A, GO Bonds | 4.38% | 12/01/2030 | | 620 | 635,556 |
| Series 2019 A, GO Bonds | 5.00% | 12/01/2039 | | 1,535 | 1,613,346 |
| Villages at Castle Rock Metropolitan District No. 6 (Cobblestone Ranch); Series 2007, GO Bonds(i) | 0.00% | 12/01/2037 | | 1,487 | 450,606 |
| | | | | | 37,660,536 |
| Connecticut–0.96% | | |
| Connecticut (State of); Series 2018 C, GO Bonds | 5.00% | 06/15/2027 | | 1,000 | 1,257,350 |
| Hamden (Town of), CT (Whitney Center); Series 2009 A, RB | 7.63% | 01/01/2030 | | 3,280 | 3,319,524 |
| | | | | | 4,576,874 |
| Delaware–0.62% | | |
| Millsboro (Town of), DE (Plantation Lakes Special Development District); Series 2018, Ref. RB(d) | 5.00% | 07/01/2028 | | 2,730 | 2,959,265 |
| District of Columbia–0.65% | | |
| District of Columbia (Ingleside at Rock Creek); | | | | | |
| Series 2017 A, RB | 4.13% | 07/01/2027 | | 1,365 | 1,444,402 |
| Series 2017 A, RB | 5.00% | 07/01/2032 | | 1,500 | 1,649,115 |
| | | | | | 3,093,517 |
| Florida–3.85% | | |
| Alachua (County of), FL Health Facilities Authority (Terraces Bonita Springs); Series 2011 A, RB | 7.50% | 11/15/2021 | | 285 | 287,879 |
| Cape Coral (City of), FL Health Facilities Authority (Gulf Care, Inc.); Series 2015, Ref. RB(d) | 5.88% | 07/01/2040 | | 250 | 275,355 |
| Capital Trust Agency (H-Bay Ministries, Inc.- Superior Residences); | | | | | |
| Series 2018 B, RB | 4.00% | 07/01/2028 | | 750 | 777,472 |
| Series 2018 B, RB | 4.25% | 07/01/2033 | | 625 | 646,300 |
| Capital Trust Agency (Sarasota-Manatee Jewish Housing Council, Inc.); Series 2017, Ref. RB(d) | 5.00% | 07/01/2027 | | 1,000 | 1,099,420 |
| Capital Trust Agency, Inc. (University Bridge LLC); Series 2018 A, RB(d) | 4.00% | 12/01/2028 | | 2,200 | 2,239,600 |
| Charlotte (County of), FL Industrial Development Authority (Town & Country Utilities); Series 2019, RB(d)(e) | 5.00% | 10/01/2029 | | 1,000 | 1,118,030 |
| Florida Development Finance Corp. (Virgin Trains USA Passenger Rail); Series 2019 A, Ref. RB(a)(d)(e) | 6.38% | 01/01/2026 | | 2,500 | 2,393,175 |
| Lake (County of), FL (Lakeside at Waterman Village); Series 2018 A, RB(d) | 10.00% | 10/31/2023 | | 750 | 750,308 |
| Lake Helen (City of), FL (Ivy Hawn Charter School of the Arts); Series 2018 A, RB(d) | 5.00% | 07/15/2028 | | 600 | 651,138 |
| Lee (County of), FL Industrial Development Authority (Cypress Cove Healthpark); Series 2012, Ref. RB | 4.75% | 10/01/2022 | | 260 | 279,523 |
| Miami-Dade (County of), FL Industrial Development Authority (Waste Management, Inc.); Series 2018 B, RB (SIFMA Municipal Swap Index + 0.80%)(a)(c)(e) | 2.08% | 11/01/2021 | | 1,500 | 1,500,000 |
| Pinellas (County of), FL Industrial Development Authority (2017 Foundation for Global Understanding); Series 2019, RB | 5.00% | 07/01/2029 | | 2,000 | 2,417,260 |
| Polk (County of), FL Industrial Development Authority (Carpenter’s Home Estates); | | | | | |
| Series 2019, Ref. IDR | 5.00% | 01/01/2029 | | 1,255 | 1,457,896 |
| Series 2019, Ref. IDR | 5.00% | 01/01/2039 | | 1,750 | 1,983,502 |
| Seminole (County of), FL Industrial Development Authority (Legacy Pointe at UCF); Series 2016 A, RB(d) | 10.00% | 12/28/2021 | | 400 | 514,484 |
| | | | | | 18,391,342 |
| Georgia–1.74% | | |
| Georgia (State of) Municipal Electric Authority (Plant Vogtle Units 3 & 4); Series 2019 A, RB | 5.00% | 01/01/2034 | | 2,185 | 2,643,588 |
| Macon-Bibb (County of), GA Urban Development Authority (Academy for Classical Education, Inc.); Series 2017 A, RB(d) | 5.00% | 06/15/2027 | | 500 | 528,325 |
| Main Street Natural Gas, Inc.; | | | | | |
| Series 2018 B, RB (67% of 1 mo. USD LIBOR + 0.75%)(a)(c) | 2.15% | 09/01/2023 | | 2,865 | 2,882,906 |
| Series 2019 B, RB(a) | 4.00% | 12/02/2024 | | 1,000 | 1,137,450 |
See accompanying Notes to Financial Statements which are an integral part of the financial statements.
| 13 | Invesco Short Duration High Yield Municipal Fund |
| | Interest
Rate | Maturity
Date | | Principal
Amount
(000) | Value |
| Georgia–(continued) | |
| Marietta (City of), GA Developing Authority (Life University, Inc.); Series 2017 A, Ref. RB(d) | 5.00% | 11/01/2023 | | | $1,000 | $ 1,105,620 |
| | | | | | | 8,297,889 |
| Guam–0.68% | | | |
| Guam (Territory of); Series 2019, GO Bonds(e) | 5.00% | 11/15/2031 | | | 2,750 | 3,246,925 |
| Idaho–0.22% | | | |
| Idaho (State of) Health Facilities Authority (Valley Vista Care Corp.); Series 2017 A, Ref. RB | 4.00% | 11/15/2027 | | | 1,000 | 1,043,380 |
| Illinois–12.52% | | | |
| Aurora (City of), IL (East River Area TIF No. 6); Series 2018 A, Ref. RB | 5.00% | 12/30/2027 | | | 1,335 | 1,393,887 |
| Aurora (City of), IL (River City TIF No. 3); Series 2018 B, Ref. RB | 4.50% | 12/30/2023 | | | 1,000 | 1,023,000 |
| Bartlett (Village of) ,IL (Quarry Redevelopment); Series 2016, Ref. RB | 4.00% | 01/01/2024 | | | 1,165 | 1,169,835 |
| Chicago (City of), IL; | | | | | | |
| Series 1993 B, Ref. GO Bonds (INS -AGM)(j) | 5.13% | 01/01/2022 | | | 2,000 | 2,081,680 |
| Series 2008 C, Ref. RB | 5.00% | 01/01/2020 | | | 200 | 202,348 |
| Series 2009 C, GO Bonds | 4.60% | 01/01/2025 | | | 655 | 656,631 |
| Series 2009 D, GO Bonds | 5.00% | 01/01/2020 | | | 100 | 100,274 |
| Series 2010 A, Ref. GO Bonds(a)(g) | 4.00% | 01/01/2020 | | | 110 | 110,990 |
| Series 2017 A, Ref. GO Bonds | 5.63% | 01/01/2029 | | | 1,000 | 1,206,430 |
| Series 2017 A, Ref. GO Bonds | 5.75% | 01/01/2034 | | | 1,500 | 1,790,790 |
| Series 2019 A, GO Bonds | 5.50% | 01/01/2035 | | | 2,000 | 2,430,880 |
| Chicago (City of), IL Board of Education; | | | | | | |
| Series 1998 B-1, GO Bonds (INS - NATL)(i)(j) | 0.00% | 12/01/2025 | | | 1,000 | 857,330 |
| Series 2011 A, GO Bonds | 5.00% | 12/01/2041 | | | 205 | 213,469 |
| Series 2017 C, Ref. GO Bonds | 5.00% | 12/01/2024 | | | 1,000 | 1,122,730 |
| Series 2018 C, Ref. GO Bonds | 5.00% | 12/01/2023 | | | 2,000 | 2,209,260 |
| Series 2018 C, Ref. GO Bonds | 5.00% | 12/01/2026 | | | 2,000 | 2,319,840 |
| Cook (County of), IL; Series 2018, RB(h) | 5.25% | 11/15/2036 | | | 2,250 | 2,758,703 |
| Hillside (Village of), IL (Mannheim Redevelopment); | | | | | | |
| Series 2018, Ref. RB | 5.00% | 01/01/2024 | | | 1,480 | 1,544,646 |
| Series 2018, Ref. RB | 5.00% | 01/01/2030 | | | 2,195 | 2,363,378 |
| Illinois (State of); | | | | | | |
| First Series 2001, GO Bonds (INS -NATL)(j) | 6.00% | 11/01/2026 | | | 3,500 | 4,158,350 |
| Series 2013, GO Bonds | 5.50% | 07/01/2033 | | | 1,500 | 1,649,760 |
| Series 2014, GO Bonds | 5.00% | 05/01/2021 | | | 860 | 905,322 |
| Series 2017 D, GO Bonds | 5.00% | 11/01/2023 | | | 1,500 | 1,653,915 |
| Series 2017 D, GO Bonds(h)(k) | 5.00% | 11/01/2023 | | | 2,250 | 2,480,873 |
| Series 2018 A, GO Bonds | 6.00% | 05/01/2025 | | | 2,500 | 2,962,475 |
| Illinois (State of) Finance Authority (Field Museum); Series 2019, Ref. RB (68% of 1 mo. USD LIBOR + 1.00%)(a)(c) | 1.92% | 09/01/2022 | | | 2,000 | 2,000,040 |
| Illinois (State of) Finance Authority (Intrinsic Schools - Belmont School); Series 2015, RB(d) | 5.25% | 12/01/2025 | | | 400 | 429,408 |
| Illinois (State of) Finance Authority (Lutheran Home & Services); | | | | | | |
| Series 2012, Ref. RB | 5.00% | 05/15/2022 | | | 255 | 264,445 |
| Series 2012, Ref. RB | 5.75% | 05/15/2046 | | | 1,500 | 1,560,930 |
| Illinois (State of) Finance Authority (Montgomery Place); Series 2017, Ref. RB | 5.00% | 05/15/2024 | | | 1,115 | 1,214,937 |
| Illinois (State of) Finance Authority (Park Place of Elmhurst); | | | | | | |
| Series 2016 A, RB | 6.20% | 05/15/2030 | | | 685 | 615,671 |
| Series 2016 A, RB | 6.33% | 05/15/2048 | | | 336 | 301,436 |
| Series 2016 B, RB | 5.63% | 05/15/2020 | | | 189 | 170,574 |
| Illinois (State of) Finance Authority (Peace Village); Series 2013, RB | 5.25% | 08/15/2023 | | | 590 | 616,202 |
| Illinois (State of) Finance Authority (Plymouth Place); Series 2015, Ref. RB | 5.00% | 05/15/2025 | | | 250 | 279,465 |
| Illinois (State of) Finance Authority (Roosevelt University); Series 2007, RB | 5.50% | 04/01/2037 | | | 2,000 | 2,001,680 |
See accompanying Notes to Financial Statements which are an integral part of the financial statements.
| 14 | Invesco Short Duration High Yield Municipal Fund |
| | Interest
Rate | Maturity
Date | Principal
Amount
(000) | Value |
| Illinois–(continued) | |
| Illinois (State of) Finance Authority (Three Crowns Park); Series 2017, Ref. RB | 4.00% | 02/15/2027 | | $1,795 | $ 1,877,373 |
| Illinois (State of) Metropolitan Pier & Exposition Authority (McCormick Place Expansion); Series 2012 B, Ref. RB | 5.00% | 12/15/2020 | | 545 | 567,176 |
| Illinois (State of) Sports Facilities Authority; Series 2019, Ref. RB | 5.00% | 06/15/2029 | | 1,000 | 1,226,250 |
| Manhattan (Village of), IL Special Service Area No. 2004-1 (Brookstone Springs); Series 2015, Ref. RB | 4.25% | 03/01/2024 | | 371 | 378,884 |
| Metropolitan Pier & Exposition Authority (McCormick Place Expansion); Series 1994 A, Ref. RB (INS -NATL)(i)(j) | 0.00% | 06/15/2029 | | 4,000 | 3,118,680 |
| Regional Transportation Authority; Series 2018 B, RB(h) | 5.00% | 06/01/2030 | | 3,000 | 3,778,440 |
| | | | | | 59,768,387 |
| Indiana–0.76% | | |
| Allen (County of), IN Economic Development (StoryPoint Fort Wayne); Series 2017, RB(d) | 6.63% | 01/15/2034 | | 500 | 555,775 |
| Carmel (City of), IN (Barrington Carmel); Series 2012 A, RB(b) | 7.00% | 11/15/2027 | | 1,120 | 784,000 |
| Indiana (State of) Finance Authority (Irvington Community School); Series 2018 A, Ref. RB(d) | 5.50% | 07/01/2028 | | 750 | 801,068 |
| Indiana Bond Bank; Series 2007 B-1, RB (67% of 3 mo. USD LIBOR + 0.97%)(c) | 2.51% | 10/15/2022 | | 1,500 | 1,500,225 |
| | | | | | 3,641,068 |
| Iowa–2.26% | | |
| Iowa (State of) Finance Authority (Iowa Fertilizer Co.); | | | | | |
| Series 2013, RB | 5.25% | 12/01/2025 | | 1,000 | 1,096,880 |
| Series 2013, RB(d) | 5.88% | 12/01/2026 | | 460 | 483,543 |
| Series 2013, Ref. RB(a) | 5.25% | 12/01/2033 | | 1,540 | 1,654,206 |
| Series 2019, Ref. RB | 3.13% | 12/01/2022 | | 2,000 | 2,033,900 |
| Iowa (State of) Finance Authority (Iowa Health System); Series 2018, Ref. RB (SIFMA Municipal Swap Index + 0.58%)(a)(c)(d) | 1.86% | 01/04/2024 | | 550 | 550,006 |
| Iowa (State of) Finance Authority (Lifespace Communities, Inc.); Series 2018 A, RB | 4.13% | 05/15/2038 | | 1,250 | 1,340,062 |
| PEFA, Inc.; Series 2019, RB(a) | 5.00% | 09/01/2026 | | 3,000 | 3,613,230 |
| | | | | | 10,771,827 |
| Kansas–1.15% | | |
| Lenexa (City of), KS (Lakeview Village, Inc.); Series 2018 A, Ref. RB | 5.00% | 05/15/2027 | | 1,440 | 1,670,861 |
| Wichita (City of), KS (Kansas Masonic Home); | | | | | |
| Series 2016 II-A, RB | 4.25% | 12/01/2024 | | 500 | 529,840 |
| Series 2016 II-A, RB | 5.00% | 12/01/2031 | | 1,050 | 1,152,742 |
| Series 2016 II-A, RB | 5.25% | 12/01/2036 | | 1,000 | 1,100,290 |
| Wichita (City of), KS (Presbyterian Manors, Inc.); Series 2018 I, Ref. RB | 5.00% | 05/15/2028 | | 935 | 1,032,932 |
| | | | | | 5,486,665 |
| Kentucky–1.28% | | |
| Ashland Kentucky (Ashland Hospital Corp. d/b/a King’s Daughters Medical Center); Series 2016 A, Ref. RB | 5.00% | 02/01/2029 | | 1,000 | 1,155,050 |
| Christian (County of), KY (Jennie Stuart Medical Center, Inc.); Series 2016, Ref. RB | 5.00% | 02/01/2026 | | 855 | 951,247 |
| Kentucky (State of) Economic Development Finance Authority (Masonic Home Independent Living II, Inc.); Series 2016 A, Ref. RB | 5.00% | 05/15/2021 | | 520 | 539,604 |
| Kentucky (State of) Economic Development Finance Authority (Next Generation Kentucky Information Highway); Series 2015 A, RB | 5.00% | 07/01/2032 | | 1,000 | 1,148,520 |
| Kentucky (State of) Economic Development Finance Authority (Rosedale Green); Series 2015, Ref. RB | 5.00% | 11/15/2025 | | 600 | 634,362 |
| Kentucky (State of) Public Energy Authority; Series 2018 B, RB(a) | 4.00% | 01/01/2025 | | 1,500 | 1,681,635 |
| | | | | | 6,110,418 |
| Louisiana–1.04% | | |
| Louisiana (State of) Local Government Environmental Facilities & Community Development Authority (Livingston Parish Gomesha Project); Series 2018, Ref. RB(d) | 5.38% | 11/01/2038 | | 2,000 | 2,209,040 |
See accompanying Notes to Financial Statements which are an integral part of the financial statements.
| 15 | Invesco Short Duration High Yield Municipal Fund |
| | Interest
Rate | Maturity
Date | Principal
Amount
(000) | Value |
| Louisiana–(continued) | |
| Tobacco Settlement Financing Corp.; Series 2013 A, Ref. RB | 5.25% | 05/15/2035 | | $2,500 | $ 2,760,900 |
| | | | | | 4,969,940 |
| Maine–0.23% | | |
| Maine (State of) Health & Higher Educational Facilities Authority (Maine General Medical Center); Series 2011, RB | 7.50% | 07/01/2032 | | 1,000 | 1,103,940 |
| Maryland–0.75% | | |
| Baltimore (City of), MD (East Baltimore Research Park); Series 2017, Ref. RB | 4.00% | 09/01/2027 | | 425 | 457,993 |
| Howard (County of), MD (Downtown Columbia); Series 2017 A, RB(d) | 4.00% | 02/15/2028 | | 500 | 538,040 |
| Howard (County of), MD (Vantage House Facility); | | | | | |
| Series 2016, Ref. RB | 5.00% | 04/01/2021 | | 170 | 175,028 |
| Series 2017, Ref. RB | 5.00% | 04/01/2021 | | 256 | 263,534 |
| Maryland (State of) Health & Higher Educational Facilities Authority (Green Street Academy); Series 2017 A, RB(d) | 5.00% | 07/01/2027 | | 400 | 441,604 |
| Maryland Economic Development Corp. (AFCO Cargo BWI II, LLC); Series 2017, Ref. RB(d)(e) | 4.00% | 07/01/2024 | | 1,590 | 1,713,225 |
| | | | | | 3,589,424 |
| Massachusetts–0.17% | | |
| Massachusetts (State of) Development Finance Agency (Lawrence General Hospital); Series 2017, Ref. RB | 5.00% | 07/01/2028 | | 675 | 794,603 |
| Michigan–2.36% | | |
| Detroit (City of), MI; | | | | | |
| Series 2018, GO Bonds | 5.00% | 04/01/2023 | | 1,000 | 1,082,470 |
| Series 2018, GO Bonds | 5.00% | 04/01/2026 | | 1,000 | 1,135,220 |
| Michigan (State of) Tobacco Settlement Finance Authority; | | | | | |
| Series 2007 A, RB | 6.00% | 06/01/2034 | | 1,000 | 1,005,020 |
| Series 2007 A, RB | 6.00% | 06/01/2048 | | 2,400 | 2,412,048 |
| Star International Academy; Series 2012, Ref. RB | 5.00% | 03/01/2033 | | 2,000 | 2,049,400 |
| Summit Academy North; Series 2016, Ref. RB | 4.00% | 11/01/2021 | | 1,585 | 1,607,539 |
| Waterford Township Economic Development Corp. (Canterbury Health Care, Inc.); Series 2016 A, Ref. RB(d) | 5.00% | 07/01/2026 | | 1,835 | 1,976,020 |
| | | | | | 11,267,717 |
| Minnesota–2.67% | | |
| Brooklyn Park (City of), MN (Athlos Leadership Academy); Series 2015, RB | 4.00% | 07/01/2020 | | 85 | 85,574 |
| Deephaven (City of), MN (Seven Hills Preparatory Academy); | | | | | |
| Series 2017, RB | 4.38% | 10/01/2027 | | 250 | 261,150 |
| Series 2017, RB | 5.00% | 10/01/2037 | | 1,000 | 1,048,770 |
| Minnesota (State of) Higher Education Facilities Authority (Concordia University, St. Paul); Series 2007 Six-Q, VRD RB (LOC-U.S. Bank N.A.)(l)(m) | 1.31% | 04/01/2037 | | 215 | 215,000 |
| Rochester (City of), MN (Homestead at Rochester, Inc.); Series 2015, RB | 5.00% | 12/01/2021 | | 470 | 488,964 |
| St. Louis Park (City of), MN (Place Via Sol); Series 2018, Ref. RB(a)(d) | 6.00% | 07/01/2027 | | 2,000 | 2,114,780 |
| St. Paul (City of), MN Housing & Redevelopment Authority (Emerald Gardens); | | | | | |
| Series 2012, Ref. RB | 5.00% | 09/01/2026 | | 1,000 | 1,029,420 |
| Series 2012, Ref. RB | 5.00% | 03/01/2029 | | 935 | 961,414 |
| St. Paul (City of), MN Housing & Redevelopment Authority (High School for Recording Arts); Series 2015, RB | 5.13% | 10/01/2023 | | 300 | 312,567 |
| St. Paul (City of), MN Housing & Redevelopment Authority (Hmong Academy); Series 2012 A, RB | 5.50% | 09/01/2043 | | 1,000 | 1,026,220 |
| St. Paul (City of), MN Housing & Redevelopment Authority (Hmong College Prep Academy); Series 2016, Ref. RB | 5.00% | 09/01/2026 | | 1,000 | 1,101,290 |
| St. Paul (City of), MN Housing & Redevelopment Authority (Rossy & Richard Shaller Family Sholom East Campus); | | | | | |
| Series 2018, Ref. RB | 4.00% | 10/01/2031 | | 250 | 255,180 |
| Series 2018, Ref. RB | 4.13% | 10/01/2033 | | 250 | 255,500 |
See accompanying Notes to Financial Statements which are an integral part of the financial statements.
| 16 | Invesco Short Duration High Yield Municipal Fund |
| | Interest
Rate | Maturity
Date | Principal
Amount
(000) | Value |
| Minnesota–(continued) | |
| St. Paul Park (City of), MN (Presbyterian Homes Bloomington); | | | | | |
| Series 2017, Ref. RB | 3.80% | 09/01/2029 | | $350 | $371,564 |
| Series 2017, Ref. RB | 3.90% | 09/01/2030 | | 565 | 600,538 |
| Series 2017, Ref. RB | 4.00% | 09/01/2031 | | 585 | 623,388 |
| Series 2017, Ref. RB | 4.00% | 09/01/2032 | | 400 | 424,900 |
| Series 2017, Ref. RB | 4.10% | 09/01/2033 | | 500 | 531,280 |
| Wayzata (City of), MN (Folkstone Senior Living Co.); | | | | | |
| Series 2019, Ref. RB | 5.00% | 08/01/2033 | | 100 | 112,702 |
| Series 2019, Ref. RB | 5.00% | 08/01/2034 | | 100 | 112,455 |
| Series 2019, Ref. RB | 5.00% | 08/01/2035 | | 100 | 112,208 |
| West St. Paul (City of), MN (Walker Westwood Ridge Campus); Series 2017, Ref. RB | 4.00% | 11/01/2030 | | 650 | 687,407 |
| | | | | | 12,732,271 |
| Mississippi–0.15% | | |
| Mississippi Business Finance Corp. (Chevron U.S.A., Inc.); Series 2010 I, VRD IDR(l) | 1.28% | 11/01/2035 | | 700 | 700,000 |
| Missouri–2.65% | | |
| I-470 Western Gateway Transportation Development District; Series 2019 A, RB(d) | 4.50% | 12/01/2029 | | 1,005 | 1,052,275 |
| Kansas City (City of), MO Industrial Development Authority; Series 2016 A, Ref. RB(d) | 4.25% | 04/01/2026 | | 455 | 478,428 |
| Kansas City (City of), MO Industrial Development Authority (Ward Parkway Center Community Improvement District); Series 2016 A, Ref. RB(d) | 5.00% | 04/01/2036 | | 2,000 | 2,108,660 |
| Kansas City (City of), MO Land Clearance for Redevelopment Authority (Convention Center Hotel); Series 2018 B, RB(d) | 4.38% | 02/01/2031 | | 1,000 | 1,091,390 |
| Kirkwood (City of), MO Industrial Development Authority (Aberdeen Heights); | | | | | |
| Series 2017 A, Ref. IDR | 5.00% | 05/15/2026 | | 1,000 | 1,150,590 |
| Series 2017 A, Ref. IDR | 5.00% | 05/15/2027 | | 800 | 933,736 |
| Series 2017, Ref. RB | 5.00% | 05/15/2023 | | 1,000 | 1,092,170 |
| Series 2017, Ref. RB | 5.00% | 05/15/2024 | | 1,500 | 1,669,395 |
| St. Louis (City of), MO Industrial Development Authority (Ballpark Village Development); Series 2017 A, Ref. RB | 3.88% | 11/15/2029 | | 660 | 721,466 |
| St. Louis (County of), MO Industrial Development Authority (Friendship Village West County); | | | | | |
| Series 2018 A, RB | 5.00% | 09/01/2025 | | 1,000 | 1,161,860 |
| Series 2018 A, RB | 5.00% | 09/01/2026 | | 1,000 | 1,183,380 |
| | | | | | 12,643,350 |
| Nebraska–0.42% | | |
| Central Plains Energy Project; Series 2014, Ref. RB(a) | 5.00% | 12/01/2019 | | 2,000 | 2,017,200 |
| Nevada–0.36% | | |
| Director of the State of Nevada Department of Business & Industry (Somerset Academy); Series 2018 A, RB(d) | 4.50% | 12/15/2029 | | 750 | 812,595 |
| Nevada (State of) Department of Business & Industry (Doral Academy of Nevada); | | | | | |
| Series 2017 A, RB(d) | 5.00% | 07/15/2027 | | 335 | 375,552 |
| Series 2017 A, RB(d) | 5.00% | 07/15/2037 | | 500 | 544,685 |
| | | | | | 1,732,832 |
| New Hampshire–0.34% | | |
| National Finance Authority (Convanta); Series 2018 A, Ref. RB(d)(e) | 4.00% | 11/01/2027 | | 1,500 | 1,596,795 |
| New Jersey–7.03% | | |
| New Jersey (State of) Economic Development Authority; | | | | | |
| Series 2005 N-1, Ref. RB (INS- NATL)(h)(j)(k) | 5.50% | 09/01/2022 | | 3,000 | 3,334,140 |
| Series 2012 II, Ref. RB | 5.00% | 03/01/2023 | | 1,500 | 1,624,860 |
| Series 2012, Ref. RB | 5.00% | 06/15/2025 | | 600 | 651,048 |
| Series 2017 B, Ref. RB | 5.00% | 11/01/2023 | | 1,500 | 1,705,500 |
See accompanying Notes to Financial Statements which are an integral part of the financial statements.
| 17 | Invesco Short Duration High Yield Municipal Fund |
| | Interest
Rate | Maturity
Date | Principal
Amount
(000) | Value |
| New Jersey–(continued) | |
| New Jersey (State of) Economic Development Authority (Beloved Community Charter School, Inc.); Series 2019 A, RB(d) | 5.00% | 06/15/2039 | | $ 825 | $ 900,116 |
| New Jersey (State of) Economic Development Authority (Continental Airlines, Inc.); | | | | | |
| Series 1999, RB(e) | 5.25% | 09/15/2029 | | 3,000 | 3,312,960 |
| Series 2012, RB(e) | 5.75% | 09/15/2027 | | 200 | 222,762 |
| New Jersey (State of) Economic Development Authority (Paterson Charter School for Science and Technology, Inc.); | | | | | |
| Series 2012 C, RB | 5.00% | 07/01/2022 | | 290 | 295,676 |
| Series 2012 C, RB | 5.00% | 07/01/2032 | | 1,000 | 1,013,330 |
| New Jersey (State of) Economic Development Authority (School Facilities Construction); Series 2013, Ref. RB (SIFMA Municipal Swap Index + 1.60%)(c) | 2.88% | 03/01/2028 | | 1,000 | 1,003,980 |
| New Jersey (State of) Higher Education Student Assistance Authority; | | | | | |
| Series 2018 B, Ref. RB(e) | 5.00% | 12/01/2026 | | 1,000 | 1,220,720 |
| Series 2018 B, Ref. RB(e) | 5.00% | 12/01/2027 | | 1,000 | 1,240,750 |
| New Jersey (State of) Transportation Trust Fund Authority; | | | | | |
| Series 2008 A, RB(i) | 0.00% | 12/15/2028 | | 715 | 569,390 |
| Series 2008 A, RB(i) | 0.00% | 12/15/2035 | | 1,000 | 619,540 |
| Series 2009 A, RB(i) | 0.00% | 12/15/2032 | | 1,465 | 1,015,919 |
| Series 2010 A, RB(i) | 0.00% | 12/15/2031 | | 1,575 | 1,128,834 |
| Series 2013 AA, RB | 5.25% | 06/15/2031 | | 1,150 | 1,278,501 |
| Series 2014, RN (SIFMA Municipal Swap Index + 1.20%)(a)(c) | 2.48% | 12/15/2021 | | 2,000 | 2,013,040 |
| Series 2018 A, Ref. RB | 5.00% | 12/15/2024 | | 1,000 | 1,165,720 |
| Series 2018 A, Ref. RN(h)(k) | 5.00% | 06/15/2029 | | 1,000 | 1,197,660 |
| Series 2018 A, Ref. RN(h)(k) | 5.00% | 06/15/2030 | | 2,000 | 2,382,220 |
| Series 2018 A, Ref. RN | 5.00% | 06/15/2031 | | 2,000 | 2,366,720 |
| Salem (County of), NJ Pollution Control Financing Authority (Chambers); Series 2014 A, Ref. PCR(e) | 5.00% | 12/01/2023 | | 3,000 | 3,260,850 |
| | | | | | 33,524,236 |
| New Mexico–0.32% | | |
| New Mexico (State of) Hospital Equipment Loan Council (La Vida Expansion); Series 2019 C, RB | 2.25% | 07/01/2023 | | 1,525 | 1,528,523 |
| New York–3.49% | | |
| Build NYC Resource Corp. (Pratt Paper, Inc.); Series 2014, Ref. RB(d)(e) | 3.75% | 01/01/2020 | | 65 | 65,444 |
| Metropolitan Transportation Authority; Subseries 2014 D-2, RB (SIFMA Municipal Swap Index + 0.45%)(a)(c) | 1.73% | 11/15/2022 | | 2,500 | 2,495,650 |
| Nassau (County of), NY Industrial Development Agency (Amsterdam at Harborside); | | | | | |
| Series 2014 A, RB | 6.50% | 01/01/2032 | | 1,000 | 1,022,990 |
| Series 2014 B, RB | 5.50% | 07/01/2020 | | 255 | 255,037 |
| New York & New Jersey (States of) Port Authority; Two Hundred Seventh Series 2018, Ref. RB(e)(h) | 5.00% | 09/15/2029 | | 2,250 | 2,878,875 |
| New York (City of), NY; Subseries 2015 F-5, VRD GO Bonds(l) | 1.25% | 06/01/2044 | | 600 | 600,000 |
| New York (City of), NY Municipal Water Finance Authority; Subseries 2012 A-1, VRD RB(l) | 1.25% | 06/15/2044 | | 4,050 | 4,050,000 |
| New York Transportation Development Corp. (American Airlines, Inc.); Series 2016, Ref. RB(e) | 5.00% | 08/01/2026 | | 2,900 | 3,074,116 |
| Tompkins County Development Corp. (Tompkins Cortland Community College Foundation, Inc.); | | | | | |
| Series 2013 A, RB | 5.00% | 07/01/2027 | | 1,000 | 613,010 |
| Series 2013 A, RB | 5.00% | 07/01/2032 | | 1,000 | 613,010 |
| Triborough Bridge & Tunnel Authority (MTA Bridges and Tunnels); Series 2018 D, RB (67% of SOFR + 0.50%)(a)(c) | 1.95% | 10/01/2020 | | 1,000 | 1,003,060 |
| | | | | | 16,671,192 |
| North Dakota–0.28% | | |
| Burleigh (County of), ND (University of Mary); Series 2016, RB | 4.38% | 04/15/2026 | | 1,300 | 1,356,329 |
See accompanying Notes to Financial Statements which are an integral part of the financial statements.
| 18 | Invesco Short Duration High Yield Municipal Fund |
| | Interest
Rate | Maturity
Date | Principal
Amount
(000) | Value |
| Ohio–4.64% | | |
| Buckeye Tobacco Settlement Financing Authority; | | | | | |
| Series 2007 A-2, RB | 5.13% | 06/01/2024 | | $1,025 | $ 1,025,020 |
| Series 2007 A-2, RB | 5.38% | 06/01/2024 | | 1,645 | 1,645,132 |
| Series 2007 A-2, RB | 5.88% | 06/01/2030 | | 3,975 | 4,000,281 |
| Butler (County of), OH Port Authority (Storypoint Fairfield); Sr. Series 2017 A-1, RB(d) | 6.25% | 01/15/2034 | | 1,000 | 1,096,880 |
| Cleveland (City of), OH (Continental Airlines, Inc.); Series 1998, RB(e) | 5.38% | 09/15/2027 | | 200 | 200,552 |
| Cuyahoga (County of), OH (Metrohealth System); Series 2017, Ref. RB | 5.00% | 02/15/2031 | | 2,500 | 2,936,650 |
| Gallia (County of), OH (Holzer Health System Obligated Group); Series 2012, Ref. RB | 8.00% | 07/01/2042 | | 2,910 | 3,313,559 |
| Lucas (County of), OH (ProMedica Healthcare System); Series 2018 A, Ref. RB | 5.00% | 11/15/2019 | | 1,160 | 1,167,679 |
| Muskingum (County of), OH (Genesis Healthcare System); Series 2013, RB | 5.00% | 02/15/2021 | | 365 | 380,512 |
| Ohio (State of) (Portsmouth Bypass); Series 2015, RB(e) | 5.00% | 12/31/2025 | | 340 | 398,579 |
| Ohio (State of) Air Quality Development Authority (FirstEnergy Generation Corp.); Series 2009 D, Ref. PCR(a) | 4.25% | 09/15/2021 | | 1,975 | 2,034,250 |
| Ohio (State of) Air Quality Development Authority (Ohio Valley Electric Corp.); Series 2019 A, Ref. PCR | 3.25% | 09/01/2029 | | 2,000 | 2,077,960 |
| Ohio (State of) Air Quality Development Authority (Pratt Paper LLC); | | | | | |
| Series 2017, RB(d)(e) | 3.75% | 01/15/2028 | | 1,250 | 1,364,275 |
| Series 2017, RB(d)(e) | 4.25% | 01/15/2038 | | 250 | 271,415 |
| Toledo-Lucas (County of), OH Port Authority (StoryPoint Waterville); Series 2016 A-1, RB(d) | 6.13% | 01/15/2034 | | 225 | 245,698 |
| | | | | | 22,158,442 |
| Oklahoma–1.34% | | |
| Comanche (County of), OK Hospital Authority; | | | | | |
| Series 2012 A, Ref. RB | 5.00% | 07/01/2021 | | 325 | 336,060 |
| Series 2015, Ref. RB | 5.00% | 07/01/2023 | | 1,000 | 1,093,630 |
| Oklahoma (State of) Development Finance Authority (Inverness Village Community); Series 2012, Ref. RB(b) | 5.25% | 01/01/2022 | | 375 | 236,250 |
| Oklahoma (State of) Development Finance Authority (Provident Oklahoma Education Resources Inc. - Cross Village Student Housing); Series 2017 A, RB | 5.00% | 08/01/2037 | | 1,650 | 973,500 |
| Payne (County of), OK Economic Development Authority (Epworth Living at the Ranch); Series 2016 B-2, RB(b) | 4.75% | 11/01/2023 | | 978 | 9,782 |
| Tulsa (City of), OK Municipal Airport Trust; Series 2000 B, Ref. RB(e) | 5.50% | 06/01/2035 | | 2,000 | 2,203,800 |
| Tulsa (City of), OK Municipal Airport Trust (American Airlines Group, Inc.); Series 2015, Ref. RB(a)(e) | 5.00% | 06/01/2025 | | 1,340 | 1,527,185 |
| | | | | | 6,380,207 |
| Pennsylvania–2.53% | | |
| Allentown Neighborhood Improvement Zone Development Authority (City Center); | | | | | |
| Series 2018, RB(d) | 5.00% | 05/01/2023 | | 750 | 820,088 |
| Series 2018, RB(d) | 5.00% | 05/01/2028 | | 1,250 | 1,488,912 |
| Series 2018, RB(d) | 5.00% | 05/01/2033 | | 500 | 589,090 |
| Commonwealth Financing Authority; Series 2018, RB | 5.00% | 06/01/2026 | | 1,000 | 1,220,610 |
| Cumberland (County of), PA Municipal Authority (Asbury Pennsylvania Obligated Group); Series 2010, RB | 6.00% | 01/01/2030 | | 1,300 | 1,317,212 |
| Fayette (County of), PA Hospital Authority (Fayette Regional Health System); Series 2007 B, VRD RB (LOC -PNC Bank, N.A.)(a)(m) | 1.28% | 06/01/2037 | | 1,100 | 1,100,000 |
| Montgomery (County of), PA Higher Education & Health Authority (Thomas Jefferson University); Series 2018 C, RB (SIFMA Municipal Swap Index + 0.72%)(a)(c) | 2.00% | 09/01/2023 | | 1,000 | 1,000,010 |
| Northampton (County of), PA Industrial Development Authority (Morningstar Senior Living, Inc.); Series 2012, RB | 5.00% | 07/01/2027 | | 1,500 | 1,603,320 |
| Philadelphia (City of), PA Authority for Industrial Development (Alliance for Progress Charter School Inc.); | | | | | |
| Series 2019 A, RB | 4.00% | 06/15/2029 | | 765 | 798,683 |
| Series 2019 A, RB | 5.00% | 06/15/2039 | | 920 | 987,096 |
| Philadelphia (City of), PA Authority for Industrial Development (Wesley Enhanced Living Obligated Group); Series 2017, Ref. RB | 5.00% | 07/01/2032 | | 1,000 | 1,146,790 |
| | | | | | 12,071,811 |
See accompanying Notes to Financial Statements which are an integral part of the financial statements.
| 19 | Invesco Short Duration High Yield Municipal Fund |
| | Interest
Rate | Maturity
Date | Principal
Amount
(000) | Value |
| Puerto Rico–6.69% | | |
| Children’s Trust Fund; | | | | | |
| Series 2002, RB | 5.38% | 05/15/2033 | | $ 680 | $ 689,982 |
| Series 2002, RB | 5.50% | 05/15/2039 | | 3,220 | 3,275,062 |
| Puerto Rico (Commonwealth of); Series 2006 A, GO Bonds (CPI RATE + 1.02%) (INS- AGC)(j)(n) | 3.48% | 07/01/2020 | | 1,500 | 1,498,590 |
| Puerto Rico (Commonwealth of) Aqueduct & Sewer Authority; | | | | | |
| Series 2008 A, RB(f) | 6.13% | 07/01/2024 | | 1,500 | 1,608,750 |
| Series 2008 A, RB | 6.00% | 07/01/2038 | | 500 | 507,500 |
| Series 2008 A, RB | 6.00% | 07/01/2044 | | 1,000 | 1,015,000 |
| Series 2012 A, RB | 5.00% | 07/01/2021 | | 795 | 829,781 |
| Series 2012 A, RB | 5.25% | 07/01/2029 | | 2,880 | 3,031,200 |
| Puerto Rico (Commonwealth of) Electric Power Authority; | | | | | |
| Series 2004 PP, Ref. RB (INS -NATL)(j) | 5.00% | 07/01/2023 | | 1,500 | 1,515,750 |
| Series 2007 TT, RB(b) | 5.00% | 07/01/2037 | | 500 | 400,000 |
| Series 2007 TT, RB(b) | 5.00% | 12/31/2049 | | 1,990 | 1,592,000 |
| Series 2007 VV, Ref. RB (INS -NATL)(j) | 5.25% | 07/01/2030 | | 1,000 | 1,085,040 |
| Series 2016 E-4, RB | 10.00% | 07/01/2022 | | 1,289 | 1,142,751 |
| Puerto Rico (Commonwealth of) Industrial Tourist Educational Medical & Environmental Control Facilities Financing Authority; Series 2000, RB(e) | 6.63% | 06/01/2026 | | 3,000 | 3,078,750 |
| Puerto Rico (Commonwealth of) Public Buildings Authority; | | | | | |
| Series 2007 M-3, Ref. RB (INS -NATL)(j) | 6.00% | 07/01/2024 | | 500 | 515,180 |
| Series 2007 N, RB(b) | 5.00% | 07/01/2037 | | 2,125 | 1,769,063 |
| Puerto Rico Sales Tax Financing Corp.; | | | | | |
| Series 2018 A-1, RB(i) | 0.00% | 07/01/2024 | | 3,991 | 3,482,188 |
| Series 2018 A-1, RB(i) | 0.00% | 07/01/2027 | | 1,000 | 791,290 |
| Series 2018 A-1, RB(i) | 0.00% | 07/01/2031 | | 1,000 | 677,940 |
| Series 2018 A-1, RB | 4.50% | 07/01/2034 | | 2,250 | 2,408,535 |
| Series 2019 A-2, RB | 4.33% | 07/01/2040 | | 1,000 | 1,018,750 |
| | | | | | 31,933,102 |
| Rhode Island–0.12% | | |
| Tobacco Settlement Financing Corp.; Series 2015 A, Ref. RB | 5.00% | 06/01/2026 | | 500 | 583,625 |
| South Carolina–0.39% | | |
| South Carolina (State of) Jobs-Economic Development Authority (South Carolina Episcopal Home at Still Hopes); Series 2018 A, Ref. RB | 5.00% | 04/01/2027 | | 1,655 | 1,872,450 |
| Tennessee–2.53% | | |
| Bristol (City of), TN Industrial Development Board (Pinnacle); | | | | | |
| Series 2016 B, RB(d)(i) | 0.00% | 12/01/2020 | | 750 | 713,752 |
| Series 2016 B, RB(d)(i) | 0.00% | 12/01/2021 | | 250 | 228,008 |
| Series 2016, RB | 4.25% | 06/01/2021 | | 665 | 671,005 |
| Memphis (City of) & Shelby (County of), TN Economic Development Growth Engine Industrial Development Board (Graceland); | | | | | |
| Series 2017 A, Ref. RB | 4.75% | 07/01/2027 | | 610 | 673,635 |
| Series 2017 A, Ref. RB | 5.50% | 07/01/2037 | | 350 | 392,193 |
| Metropolitan Development and Housing Agency (Fifth + Broadway Development); | | | | | |
| Series 2018, RB(d) | 4.50% | 06/01/2028 | | 750 | 819,712 |
| Series 2018, RB(d) | 5.13% | 06/01/2036 | | 1,000 | 1,115,040 |
| Nashville (City of) & Davidson (County of), TN Health and Educational Facilities Board of Metropolitan Government (Trousdale Roundation Properties); Series 2018 A, RB(d) | 5.25% | 04/01/2028 | | 2,000 | 2,191,680 |
| Shelby (County of), TN Health, Educational & Housing Facilities Board (Trezevant Manor); | | | | | |
| Series 2016 A, Ref. RB(d) | 5.00% | 09/01/2024 | | 1,000 | 1,059,220 |
| Series 2016 A, Ref. RB(d) | 5.00% | 09/01/2031 | | 3,000 | 3,147,810 |
| Series 2016 A, Ref. RB(d) | 5.00% | 09/01/2037 | | 1,000 | 1,035,770 |
| | | | | | 12,047,825 |
See accompanying Notes to Financial Statements which are an integral part of the financial statements.
| 20 | Invesco Short Duration High Yield Municipal Fund |
| | Interest
Rate | Maturity
Date | Principal
Amount
(000) | Value |
| Texas–7.32% | | |
| Arlington Higher Education Finance Corp. (Leadership Prep School); Series 2016 A, RB | 5.00% | 06/15/2036 | | $ 700 | $ 718,914 |
| Clifton Higher Education Finance Corp. (International Leadership of Texas); Series 2018 D, RB | 5.75% | 08/15/2033 | | 2,000 | 2,250,140 |
| Guadalupe (County of) & Seguin (City of), TX Hospital Board of Managers; Series 2015, Ref. RB | 5.00% | 12/01/2021 | | 450 | 473,724 |
| Gulf Coast Industrial Development Authority (ExxonMobil); Series 2012, VRD RB(l) | 1.25% | 11/01/2041 | | 2,300 | 2,300,000 |
| Houston (City of), TX Airport System (United Airlines, Inc. Airport Improvement); Series 2015 C, Ref. RB(e) | 5.00% | 07/15/2020 | | 500 | 512,685 |
| Houston (City of), TX Airport System (United Airlines, Inc. Terminal E); Series 2014, Ref. RB(e) | 4.75% | 07/01/2024 | | 1,885 | 2,066,808 |
| Houston (City of), TX Airport System (United Airlines, Inc. Terminal Improvement); Series 2015 B-2, Ref. RB(e) | 5.00% | 07/15/2020 | | 1,000 | 1,027,200 |
| Mclendon-Chisholm (City of), TX (Sonoma Public Improvement Distribution Phase); Series 2015, RB | 5.38% | 09/15/2035 | | 450 | 468,531 |
| Mesquite Health Facility Development Corp. (Christian Care Centers, Inc.); Series 2016, Ref. RB | 5.00% | 02/15/2035 | | 650 | 653,536 |
| Mission Economic Development Corp. (Natgasoline); Series 2018, Ref. RB(d)(e) | 4.63% | 10/01/2031 | | 2,500 | 2,703,125 |
| New Hope Cultural Education Facilities Corp. (Presbyterian Village North); Series 2018, Ref. RB | 5.00% | 10/01/2024 | | 1,650 | 1,830,477 |
| New Hope Cultural Education Facilities Finance Corp. (Carillon Lifecare Community); Series 2016, Ref. RB | 5.00% | 07/01/2036 | | 2,750 | 2,875,895 |
| New Hope Cultural Education Facilities Finance Corp. (Jubilee Academic Center); | | | | | |
| Series 2017 A, RB(d) | 3.63% | 08/15/2022 | | 765 | 778,036 |
| Series 2017 S, RB(d) | 4.25% | 08/15/2027 | | 610 | 625,823 |
| New Hope Cultural Education Facilities Finance Corp. (MRC Senior Living-The Langford); | | | | | |
| Series 2016 A, RB | 5.38% | 11/15/2036 | | 1,165 | 1,259,714 |
| Series 2016 B-1, RB | 3.25% | 11/15/2022 | | 220 | 220,020 |
| Newark High Education Finance Corp. (Austin Achieve Public Schools, Inc.); | | | | | |
| Series 2018, RB | 4.25% | 06/15/2028 | | 150 | 155,042 |
| Series 2018, RB | 5.00% | 06/15/2033 | | 150 | 156,755 |
| Series 2018, RB | 5.00% | 06/15/2038 | | 250 | 259,772 |
| Port Beaumont Navigation District (Jefferson Energy Companies); Series 2016, RB(a)(d)(e) | 7.25% | 02/13/2020 | | 2,500 | 2,544,175 |
| Red River Health Facilities Development Corp. (MRC Crossing); | | | | | |
| Series 2014 A, RB | 6.75% | 11/15/2024 | | 200 | 235,306 |
| Series 2014 A, RB | 7.50% | 11/15/2034 | | 100 | 119,322 |
| Rowlett (City of), TX (Bayside Public Improvement District North Improvement Area); Series 2016, RB | 4.90% | 09/15/2024 | | 330 | 326,575 |
| Tarrant County Cultural Education Facilities Finance Corp. (Air Force Village Obligated Group); Series 2016, Ref. RB | 5.00% | 05/15/2037 | | 1,400 | 1,544,802 |
| Tarrant County Cultural Education Facilities Finance Corp. (Buckner Senior Living - Ventana); | | | | | |
| Series 2017, RB | 3.88% | 11/15/2022 | | 750 | 750,487 |
| Series 2017, RB | 4.50% | 11/15/2023 | | 750 | 752,175 |
| Tarrant County Cultural Education Facilities Finance Corp. (C.C. Young Memorial Home); Series 2017 A, RB | 6.00% | 02/15/2031 | | 1,000 | 1,133,880 |
| Tarrant County Cultural Education Facilities Finance Corp. (MRC Stevenson Oaks); Series 2018 A, RN(d) | 10.00% | 03/15/2023 | | 750 | 750,112 |
| Temple (City of), TX; Series 2018 A, RB(d) | 5.00% | 08/01/2028 | | 940 | 1,069,053 |
| Texas Municipal Gas Acquisition & Supply Corp. I; Series 2008 D, RB | 6.25% | 12/15/2026 | | 3,255 | 3,840,672 |
| Travis County Cultural Education Facilities Finance Corp. (Wayside Schools); Series 2012 A, RB | 5.00% | 08/15/2027 | | 500 | 523,025 |
| | | | | | 34,925,781 |
| Utah–0.76% | | |
| Salt Lake City (City of), UT; Series 2017 A, RB(e)(h) | 5.00% | 07/01/2036 | | 3,000 | 3,636,150 |
| Vermont–0.30% | | |
| University of Vermont & State Agricultural College; Series 2019 B, Ref. RB | 5.00% | 10/01/2039 | | 1,000 | 1,437,910 |
| Virgin Islands–2.07% | | |
| Virgin Islands (Government of) Port Authority; | | | | | |
| Series 2014 A, Ref. RB(e) | 5.00% | 09/01/2022 | | 1,320 | 1,356,524 |
| Series 2014 A, Ref. RB(e) | 5.00% | 09/01/2023 | | 1,000 | 1,028,120 |
See accompanying Notes to Financial Statements which are an integral part of the financial statements.
| 21 | Invesco Short Duration High Yield Municipal Fund |
| | Interest
Rate | Maturity
Date | Principal
Amount
(000) | Value |
| Virgin Islands–(continued) | |
| Virgin Islands (Government of) Public Finance Authority (Matching Fund Loan Note - Sr. Lien Capital); Series 2009 A-1, RB | 5.00% | 10/01/2029 | | $1,500 | $ 1,496,250 |
| Virgin Islands (Government of) Public Finance Authority (Matching Fund Loan Note); | | | | | |
| Series 2010 A, RB | 5.00% | 10/01/2029 | | 1,870 | 1,865,325 |
| Series 2010 B, RB | 5.00% | 10/01/2025 | | 2,750 | 2,736,250 |
| Series 2012 A, RB | 5.00% | 10/01/2032 | | 405 | 403,988 |
| Virgin Islands (Government of) Water & Power Authority; Series 2010 B, Ref. RB | 4.00% | 07/01/2021 | | 1,020 | 989,023 |
| | | | | | 9,875,480 |
| Virginia–0.46% | | |
| Hanover (County of), VA Economic Development Authority (Covenant Woods); Series 2018, Ref. RB | 5.00% | 07/01/2038 | | 250 | 275,087 |
| Norfolk (City of), VA Redevelopment & Housing Authority (Fort Norfolk Retirement Community, Inc. - Harbor’s Edge); Series 2019 A, RB | 5.00% | 01/01/2034 | | 1,000 | 1,106,560 |
| Peninsula Town Center Community Development Authority; Series 2018, Ref. RB(d) | 4.50% | 09/01/2028 | | 725 | 808,629 |
| | | | | | 2,190,276 |
| Washington–1.01% | | |
| Washington (State of) Health Care Facilities Authority (Catholic Health Initiatives); Series 2013, RB (SIFMA Municipal Swap Index + 1.40%)(a)(c) | 2.68% | 01/01/2025 | | 1,000 | 1,016,990 |
| Washington (State of) Housing Finance Commission (Judson Park); | | | | | |
| Series 2018, Ref. RB(d) | 3.70% | 07/01/2023 | | 365 | 374,574 |
| Series 2018, Ref. RB(d) | 5.00% | 07/01/2038 | | 385 | 423,396 |
| Washington (State of) Housing Finance Commission (Presbyterian Retirement Communities Northwest); Series 2016, Ref. RB(d) | 5.00% | 01/01/2036 | | 1,755 | 1,977,779 |
| Washington (State of) Housing Finance Commission (The Hearthstone); Series 2018 A, Ref. RB(d) | 4.50% | 07/01/2028 | | 965 | 1,048,164 |
| | | | | | 4,840,903 |
| West Virginia–1.06% | | |
| Harrison (County of), WV Commission (Charles Pointe No. 2); Series 2008 A, Ref. RB | 6.50% | 06/01/2023 | | 535 | 534,947 |
| Monongalia (County of), WV Commission Special District (University Town Centre Economic Opportunity Development District); Series 2017 A, Ref. RB(d) | 4.50% | 06/01/2027 | | 2,990 | 3,160,968 |
| West Virginia (State of) Economic Development Authority (Entsorga West Virginia LLC); | | | | | |
| Series 2016, RB(d)(e) | 6.75% | 02/01/2026 | | 1,000 | 1,006,960 |
| Series 2018, RB(d)(e) | 8.75% | 02/01/2036 | | 320 | 330,678 |
| | | | | | 5,033,553 |
| Wisconsin–4.82% | | |
| Public Finance Authority (American Dream at Meadowlands); | | | | | |
| Series 2017, RB(d) | 6.25% | 08/01/2027 | | 2,000 | 2,300,960 |
| Series 2017, RB(d) | 6.75% | 08/01/2031 | | 500 | 599,735 |
| Public Finance Authority (Mallard Creek Stem Academy); Series 2019 A, RB(d) | 4.38% | 06/15/2029 | | 2,000 | 2,078,380 |
| Public Finance Authority (WhiteStone); Series 2017, Ref. RB(d) | 4.00% | 03/01/2027 | | 1,680 | 1,811,846 |
| Wisconsin (State of) Health & Educational Facilities Authority (American Baptist Homes of the Midwest Obligated Group); | | | | | |
| Series 2017, Ref. RB | 3.50% | 08/01/2022 | | 1,370 | 1,389,673 |
| Series 2017, Ref. RB | 5.00% | 08/01/2027 | | 500 | 557,785 |
| Wisconsin (State of) Health & Educational Facilities Authority (Benevolent Corp. Cedar Community); Series 2017, Ref. RB | 5.00% | 06/01/2028 | | 1,205 | 1,351,408 |
| Wisconsin (State of) Public Finance Authority (Alabama Proton Therapy Center); Series 2017 A, RB(d) | 6.25% | 10/01/2031 | | 2,000 | 2,246,040 |
| Wisconsin (State of) Public Finance Authority (Bancroft Neurohealth); | | | | | |
| Series 2016 A, RB(d) | 5.00% | 06/01/2025 | | 650 | 720,239 |
| Series 2016 A, RB(d) | 5.00% | 06/01/2026 | | 1,005 | 1,125,510 |
| Wisconsin (State of) Public Finance Authority (Delray Beach Radiation Therapy Center); Series 2017 A, RB(d) | 5.75% | 12/31/2049 | | 1,500 | 1,571,520 |
| Wisconsin (State of) Public Finance Authority (Glenridge Palmer Ranch); Series 2011 A, RB(d) | 7.00% | 06/01/2020 | | 25 | 25,803 |
See accompanying Notes to Financial Statements which are an integral part of the financial statements.
| 22 | Invesco Short Duration High Yield Municipal Fund |
| | Interest
Rate | Maturity
Date | Principal
Amount
(000) | Value |
| Wisconsin–(continued) | |
| Wisconsin (State of) Public Finance Authority (Million Air Two LLC General Aviation Facilities); Series 2017 B, Ref. RB(d)(e) | 6.00% | 06/01/2022 | | $2,290 | $ 2,331,563 |
| Wisconsin (State of) Public Finance Authority (North Carolina Leadership Academy); | | | | | |
| Series 2019, RB(d) | 4.00% | 06/15/2029 | | 355 | 373,723 |
| Series 2019, RB(d) | 5.00% | 06/15/2039 | | 440 | 473,317 |
| Series 2019, RB(d) | 5.00% | 06/15/2049 | | 540 | 576,385 |
| Wisconsin (State of) Public Finance Authority (Prime Healthcare Foundation, Inc.); Series 2018 A, RB | 5.00% | 12/01/2027 | | 1,395 | 1,560,698 |
| Wisconsin (State of) Public Finance Authority (Wittenberg University); | | | | | |
| Series 2016, RB(d) | 4.00% | 12/01/2021 | | 1,320 | 1,360,828 |
| Series 2016, RB(d) | 5.00% | 12/01/2031 | | 500 | 546,625 |
| | | | | | 23,002,038 |
| TOTAL INVESTMENTS IN SECURITIES(o)–101.82% (Cost $465,665,013) | 485,914,648 |
| FLOATING RATE NOTE OBLIGATIONS–(2.81)% | |
Notes with interest and fee rates ranging from 1.90% to 2.12% at 08/31/2019 and
contractual maturities of collateral ranging from 09/01/2022 to 11/15/2036 (See Note 1J)(p) | | | | | (13,420,000) |
| OTHER ASSETS LESS LIABILITIES–0.99% | 4,715,380 |
| NET ASSETS –100.00% | $477,210,028 |
Investment Abbreviations:
| AGC | – Assured Guaranty Corp. |
| AGM | – Assured Guaranty Municipal Corp. |
| CPI | – Consumer Price Index |
| GO | – General Obligation |
| IDR | – Industrial Development Revenue Bonds |
| INS | – Insurer |
| LIBOR | – London Interbank Offered Rate |
| LOC | – Letter of Credit |
| NATL | – National Public Finance Guarantee Corp. |
| PCR | – Pollution Control Revenue Bonds |
| RB | – Revenue Bonds |
| Ref. | – Refunding |
| RN | – Revenue Notes |
| SIFMA | – Securities Industry and Financial Markets Association |
| SOFR | – Secured Overnight Financing Rate |
| Sr. | – Senior |
| USD | – U.S. Dollar |
| VRD | – Variable Rate Demand |
See accompanying Notes to Financial Statements which are an integral part of the financial statements.
| 23 | Invesco Short Duration High Yield Municipal Fund |
Notes to Schedule of Investments:
| (a) | Security has an irrevocable call by the issuer or mandatory put by the holder. Maturity date reflects such call or put. |
| (b) | Defaulted security. Currently, the issuer is partially or fully in default with respect to principal and/or interest payments. The aggregate value of these securities at August 31, 2019 was $5,220,718, which represented 1.93% of the Fund’s Net Assets. |
| (c) | Interest or dividend rate is redetermined periodically. Rate shown is the rate in effect on August 31, 2019. |
| (d) | Security purchased or received in a transaction exempt from registration under the Securities Act of 1933, as amended (the “1933 Act”). The security may be resold pursuant to an exemption from registration under the 1933 Act, typically to qualified institutional buyers. The aggregate value of these securities at August 31, 2019 was $119,191,007, which represented 24.98% of the Fund’s Net Assets. |
| (e) | Security subject to the alternative minimum tax. |
| (f) | Convertible capital appreciation bond. The interest rate shown represents the coupon rate at which the bond will accrue at a specified future date. |
| (g) | Advance refunded; secured by an escrow fund of U.S. Government obligations or other highly rated collateral. |
| (h) | Underlying security related to TOB Trusts entered into by the Fund. See Note 1J. |
| (i) | Zero coupon bond issued at a discount. |
| (j) | Principal and/or interest payments are secured by the bond insurance company listed. |
| (k) | Security is subject to a reimbursement agreement which may require the Fund to pay amounts to a counterparty in the event of a significant decline in the market value of the security underlying the TOB Trusts. In case of a shortfall, the maximum potential amount of payments the Fund could ultimately be required to make under the agreement is $5,500,000. However, such shortfall payment would be reduced by the proceeds from the sale of the security underlying the TOB Trusts. |
| (l) | Demand security payable upon demand by the Fund at specified time intervals no greater than thirteen months. Interest rate is redetermined periodically by the issuer or agent based on current market conditions. Rate shown is the rate in effect on August 31, 2019. |
| (m) | Principal and interest payments are fully enhanced by a letter of credit from the bank listed or a predecessor bank, branch or subsidiary. |
| (n) | Interest rate is redetermined periodically based on an auction conducted by the auction agent. |
| (o) | Entities may either issue, guarantee, back or otherwise enhance the credit quality of a security. The entities are not primarily responsible for the issuer’s obligation but may be called upon to satisfy issuer’s obligations. No concentration of any single entity was greater than 5% each. |
| (p) | Floating rate note obligations related to securities held. The interest and fee rates shown reflect the rates in effect at August 31, 2019. At August 31, 2019, the Fund’s investments with a value of $24,368,231 are held by TOB Trusts and serve as collateral for the $13,420,000 in the floating rate note obligations outstanding at that date. |
| Open Futures Contracts(a) |
| Short Futures Contracts | Number of
Contracts | Expiration
Month | Notional
Value | Value | Unrealized
Appreciation
(Depreciation) |
| Interest Rate Risk |
| U.S. Treasury 5 Year Notes | 18 | December-2019 | $(2,159,578) | $(324) | $(324) |
| U.S. Treasury 10 Year Notes | 105 | December-2019 | (13,830,469) | 7,992 | 7,992 |
| Total Futures Contracts | $7,668 | $7,668 |
| (a) | Futures contracts collateralized by $200,000 cash held with Goldman Sachs & Co., the futures commission merchant. |
See accompanying Notes to Financial Statements which are an integral part of the financial statements.
| 24 | Invesco Short Duration High Yield Municipal Fund |
Statement of Assets and Liabilities
August 31, 2019
| Assets: | |
Investments in securities, at value
(Cost $465,665,013) | $485,914,648 |
| Deposits with brokers: | |
| Cash collateral — exchange-traded futures contracts | 200,000 |
| Cash | 671,851 |
| Receivable for: | |
| Investments sold | 5,000 |
| Investments matured, at value (Cost $603,750) | 792,500 |
| Fund shares sold | 1,324,957 |
| Interest | 5,347,614 |
| Investment for trustee deferred compensation and retirement plans | 10,893 |
| Other assets | 57,708 |
| Total assets | 494,325,171 |
| Liabilities: | |
| Floating rate note obligations | 13,420,000 |
| Other investments: | |
| Variation margin payable - futures contracts | 11,531 |
| Payable for: | |
| Investments purchased | 2,838,274 |
| Dividends | 326,174 |
| Fund shares reacquired | 264,895 |
| Accrued fees to affiliates | 170,834 |
| Accrued trustees’ and officers’ fees and benefits | 3,027 |
| Accrued other operating expenses | 69,515 |
| Trustee deferred compensation and retirement plans | 10,893 |
| Total liabilities | 17,115,143 |
| Net assets applicable to shares outstanding | $477,210,028 |
| Net assets consist of: | |
| Shares of beneficial interest | $458,808,455 |
| Distributable earnings | 18,401,573 |
| | $477,210,028 |
| Net Assets: |
| Class A | $193,075,712 |
| Class C | $52,194,518 |
| Class Y | $216,578,711 |
| Class R5 | $10,897 |
| Class R6 | $15,350,190 |
| Shares outstanding, no par value, with an unlimited number of shares authorized: |
| Class A | 17,779,755 |
| Class C | 4,814,083 |
| Class Y | 19,926,942 |
| Class R5 | 1,002 |
| Class R6 | 1,411,002 |
| Class A: | |
| Net asset value per share | $10.86 |
Maximum offering price per share
(Net asset value of $10.86 ÷ 97.50%) | $11.14 |
| Class C: | |
| Net asset value and offering price per share | $10.84 |
| Class Y: | |
| Net asset value and offering price per share | $10.87 |
| Class R5: | |
| Net asset value and offering price per share | $10.88 |
| Class R6: | |
| Net asset value and offering price per share | $10.88 |
See accompanying Notes to Financial Statements which are an integral part of the financial statements.
| 25 | Invesco Short Duration High Yield Municipal Fund |
Statement of Operations
For the year ended August 31, 2019
| Investment income: | |
| Interest | $15,965,568 |
| Expenses: | |
| Advisory fees | 1,842,049 |
| Administrative services fees | 68,375 |
| Custodian fees | 6,259 |
| Distribution fees: | |
| Class A | 393,308 |
| Class C | 496,204 |
| Interest, facilities and maintenance fees | 236,929 |
| Transfer agent fees — A, C and Y | 315,288 |
| Transfer agent fees — R5 | 3 |
| Transfer agent fees — R6 | 3,573 |
| Trustees’ and officers’ fees and benefits | 24,536 |
| Registration and filing fees | 109,420 |
| Reports to shareholders | 25,211 |
| Professional services fees | 59,358 |
| Other | 26,262 |
| Total expenses | 3,606,775 |
| Less: Fees waived, expenses reimbursed and/or expense offset arrangement(s) | (459,274) |
| Net expenses | 3,147,501 |
| Net investment income | 12,818,067 |
| Realized and unrealized gain (loss) from: | |
| Net realized gain (loss) from: | |
| Investment securities | (230,868) |
| Futures contracts | (1,408,465) |
| | (1,639,333) |
| Change in net unrealized appreciation of: | |
| Investment securities | 17,336,630 |
| Futures contracts | 10,267 |
| | 17,346,897 |
| Net realized and unrealized gain | 15,707,564 |
| Net increase in net assets resulting from operations | $28,525,631 |
See accompanying Notes to Financial Statements which are an integral part of the financial statements.
| 26 | Invesco Short Duration High Yield Municipal Fund |
Statement of Changes in Net Assets
For the years ended August 31, 2019 and 2018
| | 2019 | 2018 |
| Operations: | | |
| Net investment income | $12,818,067 | $6,286,528 |
| Net realized gain (loss) | (1,639,333) | (272,922) |
| Change in net unrealized appreciation | 17,346,897 | 383,729 |
| Net increase in net assets resulting from operations | 28,525,631 | 6,397,335 |
| Distributions to shareholders from distributable earnings(1): | | |
| Class A | (5,162,000) | (2,955,793) |
| Class C | (1,260,643) | (1,144,475) |
| Class Y | (5,447,593) | (2,129,529) |
| Class R5 | (373) | (630) |
| Class R6 | (444,896) | (110,735) |
| Total distributions from distributable earnings | (12,315,505) | (6,341,162) |
| Share transactions–net: | | |
| Class A | 76,714,062 | 35,880,945 |
| Class C | (1,842,225) | 17,315,424 |
| Class Y | 107,159,401 | 67,943,582 |
| Class R5 | — | (17,968) |
| Class R6 | 5,079,575 | 9,694,020 |
| Net increase in net assets resulting from share transactions | 187,110,813 | 130,816,003 |
| Net increase in net assets | 203,320,939 | 130,872,176 |
| Net assets: | | |
| Beginning of year | 273,889,089 | 143,016,913 |
| End of year | $477,210,028 | $273,889,089 |
| (1) | The Securities and Exchange Commission eliminated the requirement to disclose distribution components separately, except for tax return of capital. For the year ended August 31, 2018, distributions to shareholders from distributable earnings consisted of distributions from net investment income. |
See accompanying Notes to Financial Statements which are an integral part of the financial statements.
| 27 | Invesco Short Duration High Yield Municipal Fund |
Financial Highlights
August 31, 2019
The following schedule presents financial highlights for a share of the Fund outstanding throughout the periods indicated.
| | Net asset
value,
beginning
of period | Net
investment
income(a) | Net gains
(losses)
on securities
(both
realized and
unrealized) | Total from
investment
operations | Dividends
from net
investment
income | Net asset
value, end
of period | Total
return(b) | Net assets,
end of period
(000’s omitted) | Ratio of
expenses
to average
net assets
with fee waivers
and/or
expenses
absorbed | Ratio of
expenses
to average net
assets without
fee waivers
and/or
expenses
absorbed | Supplemental
ratio of
expenses
to average
net assets
with fee waivers
(excluding
interest,
facilities and
maintenance
fees) | Ratio of net
investment
income
to average
net assets | Portfolio
turnover(c) |
| Class A |
| Year ended 08/31/19 | $10.48 | $0.36 | $0.37 | $0.73 | $(0.35) | $10.86 | 7.09% | $193,076 | 0.86%(d) | 0.98%(d) | 0.79%(d) | 3.40%(d) | 24% |
| Year ended 08/31/18 | 10.47 | 0.34 | 0.01 | 0.35 | (0.34) | 10.48 | 3.46 | 109,307 | 0.86 | 1.06 | 0.79 | 3.26 | 26 |
| Year ended 08/31/17 | 10.60 | 0.37 | (0.16) | 0.21 | (0.34) | 10.47 | 2.08 | 73,384 | 0.82 | 1.16 | 0.80 | 3.65 | 42 |
| Year ended 08/31/16(e) | 10.00 | 0.35 | 0.50 | 0.85 | (0.25) | 10.60 | 8.61 | 41,561 | 0.79(f) | 1.47(f) | — | 3.64(f) | 69 |
| Class C |
| Year ended 08/31/19 | 10.46 | 0.28 | 0.37 | 0.65 | (0.27) | 10.84 | 6.29 | 52,195 | 1.61(d) | 1.73(d) | 1.54(d) | 2.65(d) | 24 |
| Year ended 08/31/18 | 10.45 | 0.26 | 0.02 | 0.28 | (0.27) | 10.46 | 2.69 | 52,446 | 1.61 | 1.81 | 1.54 | 2.51 | 26 |
| Year ended 08/31/17 | 10.58 | 0.30 | (0.17) | 0.13 | (0.26) | 10.45 | 1.32 | 35,114 | 1.57 | 1.91 | 1.55 | 2.90 | 42 |
| Year ended 08/31/16(e) | 10.00 | 0.28 | 0.49 | 0.77 | (0.19) | 10.58 | 7.81 | 20,641 | 1.54(f) | 2.22(f) | — | 2.89(f) | 69 |
| Class Y |
| Year ended 08/31/19 | 10.48 | 0.39 | 0.37 | 0.76 | (0.37) | 10.87 | 7.45 | 216,579 | 0.61(d) | 0.73(d) | 0.54(d) | 3.65(d) | 24 |
| Year ended 08/31/18 | 10.48 | 0.37 | 0.00 | 0.37 | (0.37) | 10.48 | 3.62 | 102,388 | 0.61 | 0.81 | 0.54 | 3.51 | 26 |
| Year ended 08/31/17 | 10.61 | 0.40 | (0.16) | 0.24 | (0.37) | 10.48 | 2.34 | 34,480 | 0.57 | 0.91 | 0.55 | 3.90 | 42 |
| Year ended 08/31/16(e) | 10.00 | 0.37 | 0.51 | 0.88 | (0.27) | 10.61 | 8.91 | 13,943 | 0.54(f) | 1.22(f) | — | 3.89(f) | 69 |
| Class R5 |
| Year ended 08/31/19 | 10.49 | 0.39 | 0.37 | 0.76 | (0.37) | 10.88 | 7.44 | 11 | 0.61(d) | 0.68(d) | 0.54(d) | 3.65(d) | 24 |
| Year ended 08/31/18 | 10.48 | 0.37 | 0.01 | 0.38 | (0.37) | 10.49 | 3.72 | 11 | 0.61 | 0.82 | 0.54 | 3.51 | 26 |
| Year ended 08/31/17 | 10.61 | 0.40 | (0.16) | 0.24 | (0.37) | 10.48 | 2.34 | 28 | 0.57 | 0.92 | 0.55 | 3.90 | 42 |
| Year ended 08/31/16(e) | 10.00 | 0.37 | 0.51 | 0.88 | (0.27) | 10.61 | 8.91 | 63 | 0.54(f) | 1.20(f) | — | 3.89(f) | 69 |
| Class R6 |
| Year ended 08/31/19 | 10.49 | 0.39 | 0.37 | 0.76 | (0.37) | 10.88 | 7.44 | 15,350 | 0.61(d) | 0.68(d) | 0.54(d) | 3.65(d) | 24 |
| Year ended 08/31/18 | 10.48 | 0.37 | 0.01 | 0.38 | (0.37) | 10.49 | 3.72 | 9,738 | 0.61 | 0.76 | 0.54 | 3.52 | 26 |
| Year ended 08/31/17(e) | 10.24 | 0.17 | 0.22 | 0.39 | (0.15) | 10.48 | 3.87 | 10 | 0.56(f) | 0.88(f) | 0.54(f) | 3.91(f) | 42 |
| (a) | Calculated using average shares outstanding. |
| (b) | Includes adjustments in accordance with accounting principles generally accepted in the United States of America and as such, the net asset value for financial reporting purposes and the returns based upon those net asset values may differ from the net asset value and returns for shareholder transactions. Does not include sales charges and is not annualized for periods less than one year, if applicable. |
| (c) | Portfolio turnover is calculated at the fund level and is not annualized for periods less than one year, if applicable. |
| (d) | Ratios are based on average daily net assets (000’s omitted) of $157,323, $49,620, $154,788, $11 and $12,616 for Class A, Class C, Class Y, Class R5 and Class R6 shares, respectively. |
| (e) | Commencement date of September 30, 2015 for Class A, Class C, Class Y and Class R5 shares and April 4, 2017 for Class R6 shares, respectively. |
| (f) | Annualized. |
See accompanying Notes to Financial Statements which are an integral part of the financial statements.
| 28 | Invesco Short Duration High Yield Municipal Fund |
Notes to Financial Statements
August 31, 2019
NOTE 1—Significant Accounting Policies
Invesco Short Duration High Yield Municipal Fund (the “Fund”) is a series portfolio of AIM Counselor Series Trust (Invesco Counselor Series Trust) (the “Trust”). The Trust is a Delaware statutory trust registered under the Investment Company Act of 1940, as amended (the “1940 Act”), as an open-end series management investment company authorized to issue an unlimited number of shares of beneficial interest. Information presented in these financial statements pertains only to the Fund. Matters affecting the Fund or each class will be voted on exclusively by the shareholders of the Fund or each class.
The Fund’s investment objective is to seek federal tax-exempt current income and taxable capital appreciation.
The Fund currently consists of five different classes of shares: Class A, Class C, Class Y, Class R5 and Class R6. Class Y shares are available only to certain investors. Class A shares are sold with a front-end sales charge unless certain waiver criteria are met. Under certain circumstances, load waived shares may be subject to contingent deferred sales charges ("CDSC"). Class C shares are sold with a CDSC. Class Y, Class R5 and Class R6 shares are sold at net asset value. Class C shares held for ten years after purchase are eligible for automatic conversion into Class A shares of the same Fund (the "Conversion Feature"). The automatic conversion pursuant to the Conversion Feature will generally occur at the end of the month following the tenth anniversary after a purchase of Class C shares.
As of the opening of business on September 6, 2019, the Fund has limited public sales of its shares to certain investors.
The Fund is an investment company and accordingly follows the investment company accounting and reporting guidance in accordance with Financial Accounting Standards Board Accounting Standards Codification Topic 946,Financial Services – Investment Companies.
The following is a summary of the significant accounting policies followed by the Fund in the preparation of its financial statements.
| A. | Security Valuations – Securities, including restricted securities, are valued according to the following policy. |
Debt obligations (including convertible securities) and unlisted equities are fair valued using an evaluated quote provided by an independent pricing service. Evaluated quotes provided by the pricing service may be determined without exclusive reliance on quoted prices, and may reflect appropriate factors such as institution-size trading in similar groups of securities, developments related to specific securities, dividend rate (for unlisted equities), yield (for debt obligations), quality, type of issue, coupon rate (for debt obligations), maturity (for debt obligations), individual trading characteristics and other market data. Pricing services generally value debt obligations assuming orderly transactions of institutional round lot size, but a fund may hold or transact in the same securities in smaller, odd lot sizes. Odd lots often trade at lower prices than institutional round lots. Debt obligations are subject to interest rate and credit risks. In addition, all debt obligations involve some risk of default with respect to interest and/or principal payments.
A security listed or traded on an exchange (except convertible securities) is valued at its last sales price or official closing price as of the close of the customary trading session on the exchange where the security is principally traded, or lacking any sales or official closing price on a particular day, the security may be valued at the closing bid price on that day. Securities traded in the over-the-counter market are valued based on prices furnished by independent pricing services or market makers. When such securities are valued by an independent pricing service they may be considered fair valued. Futures contracts are valued at the final settlement price set by an exchange on which they are principally traded. Listed options are valued at the mean between the last bid and asked prices from the exchange on which they are principally traded. Options not listed on an exchange are valued by an independent source at the mean between the last bid and asked prices. For purposes of determining net asset value ("NAV") per share, futures and option contracts generally are valued 15 minutes after the close of the customary trading session of the New York Stock Exchange (“NYSE”).
Investments in open-end and closed-end registered investment companies that do not trade on an exchange are valued at the end-of-day net asset value per share. Investments in open-end and closed-end registered investment companies that trade on an exchange are valued at the last sales price or official closing price as of the close of the customary trading session on the exchange where the security is principally traded.
Foreign securities’ (including foreign exchange contracts) prices are converted into U.S. dollar amounts using the applicable exchange rates as of the close of the NYSE. If market quotations are available and reliable for foreign exchange-traded equity securities, the securities will be valued at the market quotations. Because trading hours for certain foreign securities end before the close of the NYSE, closing market quotations may become unreliable. If between the time trading ends on a particular security and the close of the customary trading session on the NYSE, events occur that the investment adviser determines are significant and make the closing price unreliable, the Fund may fair value the security. If the event is likely to have affected the closing price of the security, the security will be valued at fair value in good faith using procedures approved by the Board of Trustees. Adjustments to closing prices to reflect fair value may also be based on a screening process of an independent pricing service to indicate the degree of certainty, based on historical data, that the closing price in the principal market where a foreign security trades is not the current value as of the close of the NYSE. Foreign securities’ prices meeting the approved degree of certainty that the price is not reflective of current value will be priced at the indication of fair value from the independent pricing service. Multiple factors may be considered by the independent pricing service in determining adjustments to reflect fair value and may include information relating to sector indices, American Depositary Receipts and domestic and foreign index futures. Foreign securities may have additional risks including exchange rate changes, potential for sharply devalued currencies and high inflation, political and economic upheaval, the relative lack of issuer information, relatively low market liquidity and the potential lack of strict financial and accounting controls and standards.
Securities for which market prices are not provided by any of the above methods may be valued based upon quotes furnished by independent sources. The last bid price may be used to value equity securities. The mean between the last bid and asked prices is used to value debt obligations, including corporate loans.
Securities for which market quotations are not readily available or became unreliable are valued at fair value as determined in good faith by or under the supervision of the Trust’s officers following procedures approved by the Board of Trustees. Issuer specific events, market trends, bid/asked quotes of brokers and information providers and other market data may be reviewed in the course of making a good faith determination of a security’s fair value.
The Fund may invest in securities that are subject to interest rate risk, meaning the risk that the prices will generally fall as interest rates rise and, conversely, the prices will generally rise as interest rates fall. Specific securities differ in their sensitivity to changes in interest rates
| 29 | Invesco Short Duration High Yield Municipal Fund |
depending on their individual characteristics. Changes in interest rates may result in increased market volatility, which may affect the value and/or liquidity of certain Fund investments.
Valuations change in response to many factors including the historical and prospective earnings of the issuer, the value of the issuer’s assets, general economic conditions, interest rates, investor perceptions and market liquidity. Because of the inherent uncertainties of valuation, the values reflected in the financial statements may materially differ from the value received upon actual sale of those investments.
| B. | Securities Transactions and Investment Income – Securities transactions are accounted for on a trade date basis. Realized gains or losses on sales are computed on the basis of specific identification of the securities sold. Interest income (net of withholding tax, if any) is recorded on the accrual basis from settlement date. Bond premiums and discounts are amortized and/or accreted over the lives of the respective securities. Pay-in-kind interest income and non-cash dividend income received in the form of securities in-lieu of cash are recorded at the fair value of the securities received. Dividend income (net of withholding tax, if any) is recorded on the ex-dividend date. |
The Fund may periodically participate in litigation related to Fund investments. As such, the Fund may receive proceeds from litigation settlements. Any proceeds received are included in the Statement of Operations as realized gain (loss) for investments no longer held and as unrealized gain (loss) for investments still held.
Brokerage commissions and mark ups are considered transaction costs and are recorded as an increase to the cost basis of securities purchased and/or a reduction of proceeds on a sale of securities. Such transaction costs are included in the determination of net realized and unrealized gain (loss) from investment securities reported in the Statement of Operations and the Statement of Changes in Net Assets and the net realized and unrealized gains (losses) on securities per share in the Financial Highlights. Transaction costs are included in the calculation of the Fund’s net asset value and, accordingly, they reduce the Fund’s total returns. These transaction costs are not considered operating expenses and are not reflected in net investment income reported in the Statement of Operations and the Statement of Changes in Net Assets, or the net investment income per share and the ratios of expenses and net investment income reported in the Financial Highlights, nor are they limited by any expense limitation arrangements between the Fund and the investment adviser.
The Fund allocates realized and unrealized capital gains and losses to a class based on the relative net assets of each class. The Fund allocates income to a class based on the relative value of the settled shares of each class.
| C. | Country Determination — For the purposes of making investment selection decisions and presentation in the Schedule of Investments, the investment adviser may determine the country in which an issuer is located and/or credit risk exposure based on various factors. These factors include the laws of the country under which the issuer is organized, where the issuer maintains a principal office, the country in which the issuer derives 50% or more of its total revenues and the country that has the primary market for the issuer’s securities, as well as other criteria. Among the other criteria that may be evaluated for making this determination are the country in which the issuer maintains 50% or more of its assets, the type of security, financial guarantees and enhancements, the nature of the collateral and the sponsor organization. Country of issuer and/or credit risk exposure has been determined to be the United States of America, unless otherwise noted. |
| D. | Distributions — Distributions from net investment income, if any, are declared and paid monthly. Distributions from net realized capital gain, if any, are generally declared and paid annually and recorded on the ex-dividend date. The Fund may elect to treat a portion of the proceeds from redemptions as distributions for federal income tax purposes. |
| E. | Federal Income Taxes — The Fund intends to comply with the requirements of Subchapter M of the Internal Revenue Code of 1986, as amended (the “Internal Revenue Code”), necessary to qualify as a regulated investment company and to distribute substantially all of the Fund’s taxable and tax-exempt earnings to shareholders. As such, the Fund will not be subject to federal income taxes on otherwise taxable income (including net realized capital gain) that is distributed to shareholders. Therefore, no provision for federal income taxes is recorded in the financial statements. |
The Fund recognizes the tax benefits of uncertain tax positions only when the position is more likely than not to be sustained. Management has analyzed the Fund’s uncertain tax positions and concluded that no liability for unrecognized tax benefits should be recorded related to uncertain tax positions. Management is not aware of any tax positions for which it is reasonably possible that the total amounts of unrecognized tax benefits will change materially in the next 12 months.
In addition, the Fund intends to invest in such municipal securities to allow it to qualify to pay shareholders “exempt-interest dividends”, as defined in the Internal Revenue Code.
The Fund files tax returns in the U.S. Federal jurisdiction and certain other jurisdictions. Generally, the Fund is subject to examinations by such taxing authorities for up to three years after the filing of the return for the tax period.
| F. | Expenses — Fees provided for under the Rule 12b-1 plan of a particular class of the Fund are charged to the operations of such class. Transfer agency fees and expenses and other shareholder recordkeeping fees and expenses attributable to Class R5 and Class R6 are allocated to each share class based on relative net assets. Sub-accounting fees attributable to Class R5 are charged to the operations of the class. Transfer agency fees and expenses and other shareholder recordkeeping fees and expenses relating to all other classes are allocated among those classes based on relative net assets. All other expenses are allocated among the classes based on relative net assets. |
| G. | Interest, Facilities and Maintenance Fees — Interest, Facilities and Maintenance Fees include interest and related borrowing costs such as commitment fees and other expenses associated with lines of credit and interest and administrative expenses related to establishing and maintaining floating rate note obligations, if any. |
| H. | Accounting Estimates — The preparation of financial statements in conformity with accounting principles generally accepted in the United States of America (“GAAP”) requires management to make estimates and assumptions that affect the reported amounts of assets and liabilities at the date of the financial statements and the reported amounts of revenues and expenses during the reporting period including estimates and assumptions related to taxation. Actual results could differ from those estimates by a significant amount. In addition, the Fund monitors for material events or transactions that may occur or become known after the period-end date and before the date the financial statements are released to print. |
| I. | Indemnifications — Under the Trust’s organizational documents, each Trustee, officer, employee or other agent of the Trust is indemnified against certain liabilities that may arise out of the performance of their duties to the Fund. Additionally, in the normal course of business, the Fund enters into contracts, including the Fund’s servicing agreements, that contain a variety of indemnification clauses. The Fund’s maximum exposure under these arrangements is unknown as this would involve future claims that may be made against the Fund that have not yet occurred. The risk of material loss as a result of such indemnification claims is considered remote. |
| 30 | Invesco Short Duration High Yield Municipal Fund |
| J. | Floating Rate Note Obligations– The Fund invests in inverse floating rate securities, such as Tender Option Bonds (“TOBs”), for investment purposes and to enhance the yield of the Fund. Such securities may be purchased in the secondary market without first owning an underlying bond but generally are created through the sale of fixed rate bonds by the Fund to special purpose trusts established by a broker dealer or by the Fund (“TOB Trusts”) in exchange for cash and residual interests in the TOB Trusts’ assets and cash flows, which are in the form of inverse floating rate securities. The TOB Trusts finance the purchases of the fixed rate bonds by issuing floating rate notes to third parties and allowing the Fund to retain residual interests in the bonds. The floating rate notes issued by the TOB Trusts have interest rates that reset weekly and the floating rate note holders have the option to tender their notes to the TOB Trusts for redemption at par at each reset date. The residual interests held by the Fund (inverse floating rate securities) include the right of the Fund (1) to cause the holders of the floating rate notes to tender their notes at par at the next interest rate reset date, and (2) to transfer the municipal bond from the TOB Trust to the Fund, thereby collapsing the TOB Trust. Inverse floating rate securities tend to underperform the market for fixed rate bonds in a rising interest rate environment, but tend to outperform the market for fixed rate bonds when interest rates decline or remain relatively stable. |
The Fund generally invests in inverse floating rate securities that include embedded leverage, thus exposing the Fund to greater risks and increased costs. The primary risks associated with inverse floating rate securities are varying degrees of liquidity and decreases in the value of such securities in response to changes in interest rates to a greater extent than fixed rate securities having similar credit quality, redemption provisions and maturity, which may cause the Fund’s net asset value to be more volatile than if it had not invested in inverse floating rate securities. In certain instances, the short-term floating rate notes created by the TOB Trust may not be able to be sold to third parties or, in the case of holders tendering (or putting) such notes for repayment of principal, may not be able to be remarketed to third parties. In such cases, the TOB Trust holding the fixed rate bonds may be collapsed with the entity that contributed the fixed rate bonds to the TOB Trust. In the case where a TOB Trust is collapsed with the Fund, the Fund will be required to repay the principal amount of the tendered securities, which may require the Fund to sell other portfolio holdings to raise cash to meet that obligation. The Fund could therefore be required to sell other portfolio holdings at a disadvantageous time or price to raise cash to meet this obligation, which risk will be heightened during times of market volatility, illiquidity or uncertainty. The embedded leverage in the TOB Trust could cause the Fund to lose more money than the value of the asset it has contributed to the TOB Trust and greater levels of leverage create the potential for greater losses. In addition, a Fund may enter into reimbursement agreements with the liquidity provider of certain TOB transactions in connection with certain residuals held by the Fund. These agreements commit a Fund to reimburse the liquidity provider to the extent that the liquidity provider must provide cash to a TOB Trust, including following the termination of a TOB Trust resulting from a mandatory tender event (“liquidity shortfall”). The reimbursement agreement will effectively make the Fund liable for the amount of the negative difference, if any, between the liquidation value of the underlying security and the purchase price of the floating rate notes issued by the TOB Trust.
The Fund accounts for the transfer of fixed rate bonds to the TOB Trusts as secured borrowings, with the securities transferred remaining in the Fund’s investment assets, and the related floating rate notes reflected as Fund liabilities under the captionFloating rate note obligationson the Statement of Assets and Liabilities. The carrying amount of the Fund’s floating rate note obligations as reported on the Statement of Assets and Liabilities approximates its fair value. The Fund records the interest income from the fixed rate bonds under the caption Interest and records the expenses related to floating rate obligations and any administrative expenses of the TOB Trusts as a component ofInterest, facilities and maintenance fees on the Statement of Operations.
Final rules implementing section 619 of the Dodd-Frank Wall Street Reform and Consumer Protection Act (the “Volcker Rule”) prohibit banking entities from engaging in proprietary trading of certain instruments and limit such entities’ investments in, and relationships with, “covered funds”, as defined in the rules. These rules preclude banking entities and their affiliates from sponsoring and/or providing services for existing TOB Trusts. A new TOB structure is being utilized by the Fund wherein the Fund, as holder of the residuals, will perform certain duties previously performed by banking entities as “sponsors” of TOB Trusts. These duties may be performed by a third-party service provider. The Fund’s expanded role under the new TOB structure may increase its operational and regulatory risk. The new structure is substantially similar to the previous structure; however, pursuant to the Volcker Rule, the remarketing agent would not be able to repurchase tendered floaters for its own account upon a failed remarketing. In the event of a failed remarketing, a banking entity serving as liquidity provider may loan the necessary funds to the TOB Trust to purchase the tendered floaters. The TOB Trust, not the Fund, would be the borrower and the loan from the liquidity provider will be secured by the purchased floaters now held by the TOB Trust. However, as previously described, the Fund would bear the risk of loss with respect to any liquidity shortfall to the extent it entered into a reimbursement agreement with the liquidity provider.
Further, the SEC and various banking agencies have adopted rules implementing credit risk retention requirements for asset-backed securities (the “Risk Retention Rules”). The Risk Retention Rules require the sponsor of a TOB Trust to retain at least 5% of the credit risk of the underlying assets supporting the TOB Trust’s municipal bonds. The Fund has adopted policies intended to comply with the Risk Retention Rules. The Risk Retention Rules may adversely affect the Fund’s ability to engage in TOB Trust transactions or increase the costs of such transactions in certain circumstances.
There can be no assurances that the new TOB structure will continue to be a viable form of leverage. Further, there can be no assurances that alternative forms of leverage will be available to the Fund in order to maintain current levels of leverage. Any alternative forms of leverage may be less advantageous to the Fund, and may adversely affect the Fund’s net asset value, distribution rate and ability to achieve its investment objective.
TOBs are presently classified as private placement securities. Private placement securities are subject to restrictions on resale because they have not been registered under the Securities Act of 1933, as amended (the “1933 Act”), or are otherwise not readily marketable. As a result of the absence of a public trading market for these securities, they may be less liquid than publicly traded securities. Although atypical, these securities may be resold in privately negotiated transactions, the prices realized from these sales could be less than those originally paid by the Fund or less than what may be considered the fair value of such securities.
| K. | Futures Contracts — The Fund may enter into futures contracts to manage exposure to interest rate, equity and market price movements and/or currency risks. A futures contract is an agreement between two parties ("Counterparties") to purchase or sell a specified underlying security, currency or commodity (or delivery of a cash settlement price, in the case of an index future) for a fixed price at a future date. The Fund currently invests only in exchange-traded futures and they are standardized as to maturity date and underlying financial instrument. Initial margin deposits required upon entering into futures contracts are satisfied by the segregation of specific securities or cash as collateral at the futures commission merchant (broker). During the period the futures contracts are open, changes in the value of the contracts are recognized as |
| 31 | Invesco Short Duration High Yield Municipal Fund |
| | unrealized gains or losses by recalculating the value of the contracts on a daily basis. Subsequent or variation margin payments are received or made depending upon whether unrealized gains or losses are incurred. These amounts are reflected as receivables or payables on the Statement of Assets and Liabilities. When the contracts are closed or expire, the Fund recognizes a realized gain or loss equal to the difference between the proceeds from, or cost of, the closing transaction and the Fund’s basis in the contract. The net realized gain (loss) and the change in unrealized gain (loss) on futures contracts held during the period is included on the Statement of Operations. The primary risks associated with futures contracts are market risk and the absence of a liquid secondary market. If the Fund were unable to liquidate a futures contract and/or enter into an offsetting closing transaction, the Fund would continue to be subject to market risk with respect to the value of the contracts and continue to be required to maintain the margin deposits on the futures contracts. Futures contracts have minimal Counterparty risk since the exchange’s clearinghouse, as Counterparty to all exchange-traded futures, guarantees the futures against default. Risks may exceed amounts recognized in the Statement of Assets and Liabilities. |
| L. | Other Risks — The value of, payment of interest on, repayment of principal for and the ability to sell a municipal security may be affected by constitutional amendments, legislative enactments, executive orders, administrative regulations, voter initiatives and the economics of the regions in which the issuers are located. |
Since many municipal securities are issued to finance similar projects, especially those relating to education, health care, transportation and utilities, conditions in those sectors can affect the overall municipal securities market and the Fund’s investments in municipal securities.
There is some risk that a portion or all of the interest received from certain tax-free municipal securities could become taxable as a result of determinations by the Internal Revenue Service.
The Fund is non-diversified and may invest in securities of fewer issuers than if it were diversified. Thus, the value of the Fund’s shares may vary more widely and the Fund may be subject to greater market and credit risk than if the Fund invested more broadly.
| M. | Collateral—To the extent the Fund has designated or segregated a security as collateral and that security is subsequently sold, it is the Fund’s practice to replace such collateral no later than the next business day. |
NOTE 2—Advisory Fees and Other Fees Paid to Affiliates
The Trust has entered into a master investment advisory agreement with Invesco Advisers, Inc. (the “Adviser” or “Invesco”). Under the terms of the investment advisory agreement, the Fund accrues daily and pays monthly an advisory fee to the Adviser based on the annual rate of the Fund’s average daily net assets as follows:
| Average Daily Net Assets | Rate |
| First $300 million | 0.50% |
| Next $300 million | 0.46% |
| Over $600 million | 0.42% |
For the year ended August 31, 2019, the effective advisory fees incurred by the Fund was 0.49%.
Under the terms of a master sub-advisory agreement between the Adviser and each of Invesco Asset Management Deutschland GmbH, Invesco Asset Management Limited, Invesco Asset Management (Japan) Limited, Invesco Hong Kong Limited, Invesco Senior Secured Management, Inc. and Invesco Canada Ltd. and separate sub-advisory agreements with Invesco Capital Management LLC and Invesco Asset Management (India) Private Limited (collectively, the "Affiliated Sub-Advisers") the Adviser, not the Fund, will pay 40% of the fees paid to the Adviser to any such Affiliated Sub-Adviser(s) that provide(s) discretionary investment management services to the Fund based on the percentage of assets allocated to such Affiliated Sub-Adviser(s).
The Adviser has contractually agreed, through at least December 31, 2019, to waive advisory fees and/or reimburse expenses to the extent necessary to limit total annual fund operating expenses after fee waiver and/or expense reimbursement (excluding certain items discussed below) of Class A, Class C, Class Y, Class R5 and Class R6 shares to 0.79%, 1.54%, 0.54%, 0.54% and 0.54%, respectively, of average daily net assets (the "expense limits"). In determining the Adviser’s obligation to waive advisory fees and/or reimburse expenses, the following expenses are not taken into account, and could cause total annual fund operating expenses after fee waiver and/or reimbursement to exceed the numbers reflected above: (1) interest, facilities and maintenance fees; (2) taxes; (3) dividend expense on short sales; (4) extraordinary or non-routine items, including litigation expenses; and (5) expenses that the Fund has incurred but did not actually pay because of an expense offset arrangement. Unless Invesco continues the fee waiver agreement, it will terminate on December 31, 2019. During its term, the fee waiver agreement cannot be terminated or amended to increase the expense limits or reduce the advisory fee waivers without approval of the Board of Trustees.
For the year ended August 31, 2019, the Adviser waived advisory fees of $140,409 and reimbursed class level expenses of $137,007, $43,212, $134,799, $3 and $3,573 of Class A, Class C, Class Y, Class R5 and Class R6 shares, respectively.
The Trust has entered into a master administrative services agreement with Invesco pursuant to which the Fund has agreed to pay Invesco for certain administrative costs incurred in providing accounting services to the Fund. For the year ended August 31, 2019, expenses incurred under the agreement are shown in the Statement of Operations asAdministrative services fees. Also, Invesco has entered into a sub-administration agreement whereby State Street Bank and Trust Company (“SSB”) serves as custodian and fund accountant and provides certain administrative services to the Fund.
The Trust has entered into a transfer agency and service agreement with Invesco Investment Services, Inc. (“IIS”) pursuant to which the Fund has agreed to pay IIS a fee for providing transfer agency and shareholder services to the Fund and reimburse IIS for certain expenses incurred by IIS in the course of providing such services. IIS may make payments to intermediaries that provide omnibus account services, sub-accounting services and/or networking services. All fees payable by IIS to intermediaries that provide omnibus account services or sub-accounting services are charged back to the Fund, subject to certain limitations approved by the Trust’s Board of Trustees. For the year ended August 31, 2019, expenses incurred under the agreement are shown in the Statement of Operations asTransfer agent fees.
The Trust has entered into master distribution agreements with Invesco Distributors, Inc. (“IDI”) to serve as the distributor for the Class A, Class C, Class Y, Class R5 and Class R6 shares of the Fund. The Trust has adopted plans pursuant to Rule 12b-1 under the 1940 Act with respect to the Fund’s Class A and Class C shares (collectively, the “Plans”). The Fund, pursuant to the Plans, pays IDI compensation at the annual rate of 0.25% of the Fund’s average daily net assets of Class A shares and 1.00% of the average daily net assets of Class C shares. The fees are accrued daily and paid monthly. Of
| 32 | Invesco Short Duration High Yield Municipal Fund |
the Plan payments, up to 0.25% of the average daily net assets of each class of shares may be paid to furnish continuing personal shareholder services to customers who purchase and own shares of such classes. Any amounts not paid as a service fee under the Plans would constitute an asset-based sales charge. Rules of the Financial Industry Regulatory Authority (“FINRA”) impose a cap on the total sales charges, including asset-based sales charges, that may be paid by any class of shares of the Fund. For the year ended August 31, 2019, expenses incurred under the Plans are shown in the Statement of Operations asDistribution fees.
Front-end sales commissions and CDSC (collectively, the “sales charges”) are not recorded as expenses of the Fund. Front-end sales commissions are deducted from proceeds from the sales of Fund shares prior to investment in Class A shares of the Fund. CDSC are deducted from redemption proceeds prior to remittance to the shareholder. During the year ended August 31, 2019, IDI advised the Fund that IDI retained $55,982 in front-end sales commissions from the sale of Class A shares and $19,457 and $4,114 from Class A and Class C shares, respectively, for CDSC imposed upon redemptions by shareholders.
Certain officers and trustees of the Trust are officers and directors of the Adviser, IIS and/or IDI.
NOTE 3—Additional Valuation Information
Generally Accepted Accounting Principles ("GAAP") defines fair value as the price that would be received to sell an asset or paid to transfer a liability in an orderly transaction between market participants at the measurement date, under current market conditions. GAAP establishes a hierarchy that prioritizes the inputs to valuation methods, giving the highest priority to readily available unadjusted quoted prices in an active market for identical assets (Level 1) and the lowest priority to significant unobservable inputs (Level 3), generally when market prices are not readily available or are unreliable. Based on the valuation inputs, the securities or other investments are tiered into one of three levels. Changes in valuation methods may result in transfers in or out of an investment’s assigned level:
Level 1 — Prices are determined using quoted prices in an active market for identical assets.
Level 2 — Prices are determined using other significant observable inputs. Observable inputs are inputs that other market participants may use in pricing a security. These may include quoted prices for similar securities, interest rates, prepayment speeds, credit risk, yield curves, loss severities, default rates, discount rates, volatilities and others.
Level 3 — Prices are determined using significant unobservable inputs. In situations where quoted prices or observable inputs are unavailable (for example, when there is little or no market activity for an investment at the end of the period), unobservable inputs may be used. Unobservable inputs reflect the Fund’s own assumptions about the factors market participants would use in determining fair value of the securities or instruments and would be based on the best available information.
The following is a summary of the tiered valuation input levels, as of August 31, 2019. The level assigned to the securities valuations may not be an indication of the risk or liquidity associated with investing in those securities. Because of the inherent uncertainties of valuation, the values reflected in the financial statements may materially differ from the value received upon actual sale of those investments.
| | Level 1 | Level 2 | Level 3 | Total |
| Investments in Securities | | | | |
| Municipal Obligations | $— | $485,914,648 | $— | $485,914,648 |
| Investments Matured | — | 792,500 | — | 792,500 |
| Total Investments in Securities | — | 486,707,148 | — | 486,707,148 |
| Other Investments - Assets* | | | | |
| Futures Contracts | 7,992 | — | — | 7,992 |
| Other Investments - Liabilities* | | | | |
| Futures Contracts | (324) | — | — | (324) |
| Total Other Investments | 7,668 | — | — | 7,668 |
| Total Investments | $7,668 | $486,707,148 | $— | $486,714,816 |
| * | Unrealized appreciation (depreciation). |
NOTE 4—Derivative Investments
The Fund may enter into an International Swaps and Derivatives Association Master Agreement (“ISDA Master Agreement”) under which a fund may trade OTC derivatives. An OTC transaction entered into under an ISDA Master Agreement typically involves a collateral posting arrangement, payment netting provisions and close-out netting provisions. These netting provisions allow for reduction of credit risk through netting of contractual obligations. The enforceability of the netting provisions of the ISDA Master Agreement depends on the governing law of the ISDA Master Agreement, among other factors.
For financial reporting purposes, the Fund does not offset OTC derivative assets or liabilities that are subject to ISDA Master Agreements in the Statement of Assets and Liabilities.
| 33 | Invesco Short Duration High Yield Municipal Fund |
Value of Derivative Investments at Period-End
The table below summarizes the value of the Fund’s derivative investments, detailed by primary risk exposure, held as of August 31, 2019:
| | Value |
| Derivative Assets | Interest
Rate Risk |
| Unrealized appreciation on futures contracts — Exchange-Traded(a) | $7,992 |
| Derivatives not subject to master netting agreements | (7,992) |
| Total Derivative Assets subject to master netting agreements | $- |
| (a) | The daily variation margin receivable (payable) at period-end is recorded in the Statement of Assets and Liabilities. |
| | Value |
| Derivative Liabilities | Interest
Rate Risk |
| Unrealized depreciation on futures contracts — Exchange-Traded(a) | $(324) |
| Derivatives not subject to master netting agreements | 324 |
| Total Derivative Liabilities subject to master netting agreements | $- |
| (a) | The daily variation margin receivable (payable) at period-end is recorded in the Statement of Assets and Liabilities. |
Effect of Derivative Investments for the year ended August 31, 2019
The table below summarizes the gains (losses) on derivative investments, detailed by primary risk exposure, recognized in earnings during the period:
| | Location of Gain (Loss) on
Statement of Operations |
| | Interest
Rate Risk |
| Realized Gain (Loss): | |
| Futures contracts | $(1,408,465) |
| Change in Net Unrealized Appreciation: | |
| Futures contracts | 10,267 |
| Total | $(1,398,198) |
The table below summarizes the average notional value of derivatives held during the period.
| | Futures
Contracts |
| Average notional value | $16,907,433 |
NOTE 5—Security Transactions with Affiliated Funds
The Fund is permitted to purchase or sell securities from or to certain other Invesco Funds under specified conditions outlined in procedures adopted by the Board of Trustees of the Trust. The procedures have been designed to ensure that any purchase or sale of securities by the Fund from or to another fund or portfolio that is or could be considered an affiliate by virtue of having a common investment adviser (or affiliated investment advisers), common Trustees and/or common officers complies with Rule 17a-7 of the 1940 Act. Further, as defined under the procedures, each transaction is effected at the current market price. Pursuant to these procedures, for the year ended August 31, 2019, the Fund engaged in securities purchases of $111,617,101 and securities sales of $93,949,701, which did not result in any net realized gains (losses).
NOTE 6—Expense Offset Arrangement(s)
The expense offset arrangement is comprised of transfer agency credits which result from balances in demand deposit accounts used by the transfer agent for clearing shareholder transactions. For the year ended August 31, 2019, the Fund received credits from this arrangement, which resulted in the reduction of the Fund’s total expenses of $271.
NOTE 7—Trustees’ and Officers’ Fees and Benefits
Trustees’ and Officers’ Fees and Benefits include amounts accrued by the Fund to pay remuneration to certain Trustees and Officers of the Fund. Trustees have the option to defer compensation payable by the Fund, and Trustees’ and Officers’ Fees and Benefits also include amounts accrued by the Fund to fund such deferred compensation amounts. Those Trustees who defer compensation have the option to select various Invesco Funds in which their deferral accounts shall be deemed to be invested. Obligations under the deferred compensation plan represent unsecured claims against the general assets of the Fund.
NOTE 8—Cash Balances and Borrowings
The Fund is permitted to temporarily carry a negative or overdrawn balance in its account with SSB, the custodian bank. Such balances, if any at period-end, are shown in the Statement of Assets and Liabilities under the payable captionAmount due custodian. To compensate the custodian bank
| 34 | Invesco Short Duration High Yield Municipal Fund |
for such overdrafts, the overdrawn Fund may either (1) leave funds as a compensating balance in the account so the custodian bank can be compensated by earning the additional interest; or (2) compensate by paying the custodian bank at a rate agreed upon by the custodian bank and Invesco, not to exceed the contractually agreed upon rate. The Fund may not purchase additional securities when any borrowings from banks or broker-dealers exceed 5% of the Fund’s total assets, or when any borrowings from an Invesco Fund are outstanding.
Inverse floating rate obligations resulting from the transfer of bonds to TOB Trusts are accounted for as secured borrowings. The average floating rate notes outstanding and average annual interest and fee rate related to inverse floating rate note obligations during the year ended August 31, 2019 were $12,501,538 and 1.90%, respectively.
NOTE 9—Distributions to Shareholders and Tax Components of Net Assets
| Tax Character of Distributions to Shareholders Paid During the Fiscal Years Ended August 31, 2019 and August 31, 2018 |
| | 2019 | 2018 |
| Ordinary income | $12,315,505 | $6,341,162 |
| Tax Components of Net Assets at Period-End: |
| | 2019 |
| Undistributed tax-exempt income | $721,445 |
| Net unrealized appreciation — investments | 20,566,644 |
| Temporary book/tax differences | (8,537) |
| Capital loss carryforward | (2,877,979) |
| Shares of beneficial interest | 458,808,455 |
| Total net assets | $477,210,028 |
The difference between book-basis and tax-basis unrealized appreciation (depreciation) is due to differences in the timing of recognition of gains and losses on investments for tax and book purposes. The Fund’s net unrealized appreciation (depreciation) difference is attributable primarily to wash sales, defaulted bonds, TOBs and amortization differences.
The temporary book/tax differences are a result of timing differences between book and tax recognition of income and/or expenses. The Fund’s temporary book/tax differences are the result of the trustee deferral of compensation and retirement plan benefits.
Capital loss carryforward is calculated and reported as of a specific date. Results of transactions and other activity after that date may affect the amount of capital loss carryforward actually available for the Fund to utilize. Capital losses generated in years beginning after December 22, 2010 can be carried forward for an unlimited period, whereas previous losses expire in eight tax years. Capital losses with an expiration period may not be used to offset capital gains until all net capital losses without an expiration date have been utilized. Capital loss carryforwards with no expiration date will retain their character as either short-term or long-term capital losses instead of as short-term capital losses as under prior law. The ability to utilize capital loss carryforwards in the future may be limited under the Internal Revenue Code and related regulations based on the results of future transactions.
The Fund has a capital loss carryforward as of August 31, 2019, as follows:
| Capital Loss Carryforward* |
| Expiration | Short-Term | Long-Term | Total |
| Not subject to expiration | $2,078,042 | $799,937 | $2,877,979 |
| * | Capital loss carryforwards as of the date listed above is reduced for limitations, if any, to the extent required by the Internal Revenue Code and may be further limited depending upon a variety of factors, including the realization of net unrealized gains or losses as of the date of any reorganization. |
NOTE 10—Investment Transactions
The aggregate amount of investment securities (other than short-term securities, U.S. Treasury obligations and money market funds, if any) purchased and sold by the Fund during the year ended August 31, 2019 was $274,332,445 and $91,005,159, respectively. Cost of investments, including any derivatives, on a tax basis includes the adjustments for financial reporting purposes as of the most recently completed federal income tax reporting period-end.
| Unrealized Appreciation (Depreciation) of Investments on a Tax Basis |
| Aggregate unrealized appreciation of investments | $24,206,228 |
| Aggregate unrealized (depreciation) of investments | (3,639,584) |
| Net unrealized appreciation of investments | $20,566,644 |
Cost of investments for tax purposes is $466,148,172.
NOTE 11—Reclassification of Permanent Differences
Primarily as a result of differing book/tax treatment of federal income taxes and bond discount, on August 31, 2019, undistributed net investment income was increased by $55,916, undistributed net realized gain (loss) was decreased by $67,064 and shares of beneficial interest was increased by $11,148. This reclassification had no effect on the net assets of the Fund.
| 35 | Invesco Short Duration High Yield Municipal Fund |
NOTE 12—Share Information
| | Summary of Share Activity |
| | Years ended August 31, |
| | 2019(a) | | 2018 |
| | Shares | Amount | | Shares | Amount |
| Sold: | | | | | |
| Class A | 10,574,145 | $110,744,771 | | 6,505,004 | $68,128,355 |
| Class C | 2,686,161 | 28,238,725 | | 2,976,565 | 31,132,509 |
| Class Y | 14,451,070 | 152,236,887 | | 8,752,628 | 91,778,543 |
| Class R6 | 717,180 | 7,547,211 | | 980,608 | 10,256,388 |
| Issued as reinvestment of dividends: | | | | | |
| Class A | 382,726 | 4,048,612 | | 223,190 | 2,335,864 |
| Class C | 97,720 | 1,028,428 | | 94,915 | 991,659 |
| Class Y | 386,327 | 4,098,443 | | 127,429 | 1,334,866 |
| Class R5 | - | - | | 21 | 215 |
| Class R6 | 35,886 | 379,968 | | 8,963 | 94,036 |
| Automatic conversion of Class C shares to Class A shares: | | | | | |
| Class A | 1,432,103 | 14,881,615 | | - | - |
| Class C | (1,434,862) | (14,881,615) | | - | - |
| Reacquired: | | | | | |
| Class A | (5,043,974) | (52,960,936) | | (3,304,391) | (34,583,274) |
| Class C | (1,550,243) | (16,227,763) | | (1,417,024) | (14,808,744) |
| Class Y | (4,675,872) | (49,175,929) | | (2,406,237) | (25,169,827) |
| Class R5 | - | - | | (1,730) | (18,183) |
| Class R6 | (269,980) | (2,847,604) | | (62,632) | (656,404) |
| Net increase in share activity | 17,788,387 | $187,110,813 | | 12,477,309 | $130,816,003 |
| (a) | There are entities that are record owners of more than 5% of the outstanding shares of the Fund and in the aggregate own 73% of the outstanding shares of the Fund. IDI has an agreement with these entities to sell Fund shares. The Fund, Invesco and/or Invesco affiliates may make payments to these entities, which are considered to be related to the Fund, for providing services to the Fund, Invesco and/or Invesco affiliates including but not limited to services such as securities brokerage, distribution, third party record keeping and account servicing. The Fund has no knowledge as to whether all or any portion of the shares owned of record by these entities are also owned beneficially. |
| 36 | Invesco Short Duration High Yield Municipal Fund |
Report of Independent Registered Public Accounting Firm
To the Board of Trustees of AIM Counselor Series Trust (Invesco Counselor Series Trust) and Shareholders of Invesco Short Duration High Yield Municipal Fund
Opinion on the Financial Statements
We have audited the accompanying statement of assets and liabilities, including the schedule of investments, of Invesco Short Duration High Yield Municipal Fund (one of the funds constituting AIM Counselor Series Trust (Invesco Counselor Series Trust), hereafter referred to as the “Fund”) as of August 31, 2019, the related statement of operations for the year ended August 31, 2019, the statement of changes in net assets for each of the two years in the period ended August 31, 2019, including the related notes, and the financial highlights for each of the periods indicated therein (collectively referred to as the "financial statements"). In our opinion, the financial statements present fairly, in all material respects, the financial position of the Fund as of August 31, 2019, the results of its operations for the year then ended, the changes in its net assets for each of the two years in the period ended August 31, 2019 and the financial highlights for each of the periods indicated therein in conformity with accounting principles generally accepted in the United States of America.
Basis for Opinion
These financial statements are the responsibility of the Fund’s management. Our responsibility is to express an opinion on the Fund’s financial statements based on our audits. We are a public accounting firm registered with the Public Company Accounting Oversight Board (United States) (PCAOB) and are required to be independent with respect to the Fund in accordance with the U.S. federal securities laws and the applicable rules and regulations of the Securities and Exchange Commission and the PCAOB.
We conducted our audits of these financial statements in accordance with the standards of the PCAOB. Those standards require that we plan and perform the audit to obtain reasonable assurance about whether the financial statements are free of material misstatement, whether due to error or fraud.
Our audits included performing procedures to assess the risks of material misstatement of the financial statements, whether due to error or fraud, and performing procedures that respond to those risks. Such procedures included examining, on a test basis, evidence regarding the amounts and disclosures in the financial statements. Our audits also included evaluating the accounting principles used and significant estimates made by management, as well as evaluating the overall presentation of the financial statements. Our procedures included confirmation of securities owned as of August 31, 2019 by correspondence with the custodian and brokers; when replies were not received from brokers, we performed other auditing procedures. We believe that our audits provide a reasonable basis for our opinion.
/s/ PricewaterhouseCoopers LLP
Houston, Texas
October 29, 2019
We have served as the auditor of one or more of the investment companies in the Invesco group of investment companies since at least 1995. We have not been able to determine the specific year we began serving as auditor.
| 37 | Invesco Short Duration High Yield Municipal Fund |
Calculating your ongoing Fund expenses
Example
As a shareholder of the Fund, you incur two types of costs: (1) transaction costs, which may include sales charges (loads) on purchase payments or contingent deferred sales charges on redemptions, if any; and (2) ongoing costs, including management fees, distribution and/or service (12b-1) fees, and other Fund expenses. This example is intended to help you understand your ongoing costs (in dollars) of investing in the Fund and to compare these costs with ongoing costs of investing in other mutual funds. The example is based on an investment of $1,000 invested at the beginning of the period and held for the entire period March 1, 2019 through August 31, 2019.
Actual expenses
The table below provides information about actual account values and actual expenses. You may use the information in this table, together with the amount you invested, to estimate the expenses that you paid over the period. Simply divide your account value by $1,000 (for example, an $8,600 account value divided by $1,000 = 8.6), then multiply the result by the number in the table under the heading entitled “Actual Expenses Paid During Period” to estimate the expenses you paid on your account during this period.
Hypothetical example for comparison purposes
The table below also provides information about hypothetical account values and hypothetical expenses based on the Fund’s actual expense ratio and an assumed rate of return of 5% per year before expenses, which is not the Fund’s actual return.
The hypothetical account values and expenses may not be used to estimate the actual ending account balance or expenses you paid for the period. You may use this information to compare the ongoing costs of investing in the Fund and other funds. To do so, compare this 5% hypothetical example with the 5% hypothetical examples that appear in the shareholder reports of the other funds.
Please note that the expenses shown in the table are meant to highlight your ongoing costs only and do not reflect any transaction costs, such as sales charges (loads) on purchase payments or contingent deferred sales charges on redemptions, if any. Therefore, the hypothetical information is useful in comparing ongoing costs only, and will not help you determine the relative total costs of owning different funds. In addition, if these transaction costs were included, your costs would have been higher.
| | Beginning
Account Value (03/01/19) | ACTUAL | HYPOTHETICAL
(5% annual return before
expenses) | Annualized
Expense
Ratio |
Ending
Account Value
(08/31/19)1 | Expenses
Paid During
Period2 | Ending
Account Value
(08/31/19) | Expenses
Paid During
Period2 |
| Class A | $1,000.00 | $1,054.20 | $4.56 | $1,020.77 | $4.48 | 0.88% |
| Class C | 1,000.00 | 1,050.30 | 8.42 | 1,016.99 | 8.29 | 1.63 |
| Class Y | 1,000.00 | 1,055.40 | 3.26 | 1,022.03 | 3.21 | 0.63 |
| Class R5 | 1,000.00 | 1,056.40 | 3.27 | 1,022.03 | 3.21 | 0.63 |
| Class R6 | 1,000.00 | 1,055.30 | 3.26 | 1,022.03 | 3.21 | 0.63 |
| 1 | The actual ending account value is based on the actual total return of the Fund for the period March 1, 2019 through August 31, 2019, after actual expenses and will differ from the hypothetical ending account value which is based on the Fund’s expense ratio and a hypothetical annual return of 5% before expenses. |
| 2 | Expenses are equal to the Fund’s annualized expense ratio as indicated above multiplied by the average account value over the period, multiplied by 184/365 to reflect the most recent fiscal half year. |
| 38 | Invesco Short Duration High Yield Municipal Fund |
Approval of Investment Advisory and Sub-Advisory Contracts
At meetings held on June 10, 2019, the Board of Trustees (the Board or the Trustees) of AIM Counselor Series Trust (Invesco Counselor Series Trust) (the Company) as a whole, and the independent Trustees, who comprise over 75% of the Board, voting separately, approved the continuance of the Invesco Short Duration High Yield Municipal Fund’s (the Fund) Master Investment Advisory Agreement with Invesco Advisers, Inc. (Invesco Advisers and the investment advisory agreement) and the Master IntergroupSub-Advisory Contract for Mutual Funds with Invesco Asset Management Deutschland GmbH, Invesco Asset Management Limited, Invesco Asset Management (Japan) Limited, Invesco Hong Kong Limited, Invesco Senior Secured Management, Inc., Invesco Canada Ltd. and separatesub-advisory contracts with Invesco Capital Management LLC and Invesco Asset Management (India) Private Limited (collectively, the AffiliatedSub-Advisers and thesub-advisory contracts) for another year, effective July 1, 2019. After evaluating the factors discussed below, among others, the Board approved the renewal of the Fund’s investment advisory agreement and thesub-advisory contracts and determined that the compensation payable by the Fund to Invesco Advisers and by Invesco Advisers to the AffiliatedSub-Advisers is fair and reasonable.
The Board’s Evaluation Process
The Board’s Investments Committee has established threeSub-Committees, which meet throughout the year to review the performance of funds advised by Invesco Advisers (the Invesco Funds). As part of a regularly scheduled basis ofin-person Board meetings, theSub-Committees meet with portfolio managers for their assigned Invesco Funds and other members of management to review detailed information about investment performance and portfolio attributes of these funds. The Board took into account evaluations and reports that it received from the Investments Committee andSub-Committees, as well as the information provided to such committees and the Board throughout the year, in considering whether to approve each Invesco Fund’s investment advisory agreement andsub-advisory contracts.
As part of the contract renewal process, the Board reviews and considers information provided in response to detailed requests for information submitted to management by the independent Trustees with assistance from legal counsel to the independent Trustees. The Board receives comparative investment performance and fee data regarding the Invesco Funds prepared by Invesco Advisers and Broadridge Financial Solutions, Inc. (Broadridge), an independent mutual fund data provider. The Board also receives an independent written evaluation from the Senior Officer, an officer of the Invesco Funds who reports directly to the
independent Trustees. The Senior Officer’s evaluation is prepared as part of his responsibility to manage the process by which the Invesco Funds’ proposed management fees are negotiated during the annual contract renewal process to ensure they are negotiated in a manner that is at arms’ length and reasonable. In addition to meetings with Invesco Advisers and fund counsel throughout the year, the independent Trustees also discuss the continuance of the investment advisory agreement andsub-advisory contracts in separate sessions with the Senior Officer and with independent legal counsel.
The discussion below is a summary of the Senior Officer’s independent written evaluation with respect to the Fund’s investment advisory agreement, as well as a discussion of the material factors and related conclusions that formed the basis for the Board’s approval of the Fund’s investment advisory agreement andsub-advisory contracts. The Trustees’ review and conclusions are based on the comprehensive consideration of all information presented to them during the course of the year and in prior years and are not the result of any single determinative factor. Moreover, one Trustee may have weighed a particular piece of information or factor differently than another Trustee. This information is current as of June 10, 2019.
Factors and Conclusions and Summary of Independent Written Fee Evaluation
| A. | Nature, Extent and Quality of Services Provided by Invesco Advisers and the AffiliatedSub-Advisers |
The Board reviewed the nature, extent and quality of the advisory services provided to the Fund by Invesco Advisers under the Fund’s investment advisory agreement, and the credentials and experience of the officers and employees of Invesco Advisers who provide these services, including the Fund’s portfolio manager(s). The Board’s review included consideration of Invesco Advisers’ investment process oversight and structure, credit analysis and investment risk management. The Board also considerednon-advisory services that Invesco Advisers and its affiliates provide to the Invesco Funds such as various back office support functions, third party oversight, internal audit, valuation, portfolio trading and legal and compliance. The Board also received and reviewed information about Invesco Advisers’ role as administrator of the Invesco Funds’ liquidity risk management program. The Board also reviewed and considered the benefits to shareholders of investing in a fund that is part of the Invesco family of funds under the umbrella of Invesco Ltd., Invesco Advisers’ parent company, and noted Invesco Ltd.’s depth and experience in conducting an investment management business, as well as its
commitment of financial and other resources to such business. The Board reviewed and considered information about the resources that Invesco Advisers intends to continue to commit to managing the Invesco family of funds following Invesco Ltd.’s acquisition of OppenheimerFunds, Inc. and its subsidiaries. The Board concluded that the nature, extent and quality of the services provided to the Fund by Invesco Advisers are appropriate and satisfactory.
The Board reviewed the services that may be provided by the AffiliatedSub-Advisers under thesub-advisory contracts and the credentials and experience of the officers and employees of the AffiliatedSub-Advisers who provide these services. The Board noted the AffiliatedSub-Advisers’ expertise with respect to certain asset classes and that the AffiliatedSub-Advisers have offices and personnel that are located in financial centers around the world. As a result, the Board noted that the AffiliatedSub-Advisers can provide research and investment analysis on the markets and economies of various countries in which the Fund may invest, make recommendations regarding securities and assist with security trades. The Board concluded that thesub-advisory contracts may benefit the Fund and its shareholders by permitting Invesco Advisers to use the resources and talents of the AffiliatedSub-Advisers in managing the Fund. The Board concluded that the nature, extent and quality of the services that may be provided by the AffiliatedSub-Advisers are appropriate and satisfactory.
| B. | Fund Investment Performance |
The Board considered Fund investment performance as a relevant factor in considering whether to approve the investment advisory agreement. The Board did not view Fund investment performance as a relevant factor in considering whether to approve thesub-advisory contracts for the Fund, as no AffiliatedSub-Adviser currently manages assets of the Fund.
The Board noted that the Fund incepted on September 30, 2015 and compared the Fund’s investment performance for the past three years ended December 31, 2018 to the performance of funds in the Broadridge performance universe and against the Lipper High Yield Municipal Debt Funds Index. The Board noted that performance of Class A shares of the Fund was in the second quintile of its performance universe for the one and three year periods (the first quintile being the best performing funds and the fifth quintile being the worst performing funds). The Board noted that performance of Class A shares of the Fund was reasonably comparable to the performance of the Index for the one year period and above the performance of the Index for the three year period. The Trustees also reviewed more recent
39 Invesco Short Duration High Yield Municipal Fund
Fund performance and this review did not change their conclusions.
| C. | Advisory andSub-Advisory Fees and Fee Waivers and Fund Expenses |
The Board compared the Fund’s contractual management fee rate to the contractual management fee rates of funds in the Fund’s Broadridge expense group. The Board noted that the contractual management fee rate for Class A shares of the Fund was below the median contractual management fee rate of funds in its expense group. The Board noted that the term “contractual management fee” for funds in the expense group may include both advisory and certainnon-portfolio management administrative services fees, but that Broadridge does not provide information on a fund by fund basis as to what is included. The Board also reviewed the methodology used by Broadridge in providing expense group information, which includes using each fund’s contractual management fee schedule (including any applicable breakpoints) as reported in the most recent prospectus or statement of additional information for each fund in the expense group. The Board also considered comparative information regarding the Fund’s total expense ratio and its various components.
The Board noted that Invesco Advisers has contractually agreed to waive fees and/or limit expenses of the Fund for the term disclosed in the Fund’s registration statement in an amount necessary to limit total annual operating expenses to a specified percentage of average daily net assets for each class of the Fund.
The Board noted that Invesco Advisers and the AffiliatedSub-Advisers do not manage other similarly managed mutual funds or client accounts.
The Board also considered the services that may be provided by the AffiliatedSub-Advisers pursuant to thesub-advisory contracts, as well as the fees payable by Invesco Advisers to the AffiliatedSub-Advisers pursuant to thesub-advisory contracts.
| D. | Economies of Scale and Breakpoints |
The Board considered the extent to which there may be economies of scale in the provision of advisory services to the Fund. The Board considered Invesco’s reinvestment in its business, including investments in business infrastructure and cybersecurity. The Board also considered that the Fund benefits from economies of scale through contractual breakpoints in the Fund’s advisory fee schedule, which generally operate to reduce the Fund’s expense ratio as it grows in size. The Board noted that the Fund shares directly in economies of scale through lower fees charged by third party service providers based on the combined size of the Invesco Funds. The Board noted that the Fund may also benefit from economies of scale through initial fee setting, fee waivers and expense reimbursements.
| E. | Profitability and Financial Resources |
The Board reviewed information from Invesco Advisers concerning the costs of the advisory
and other services that Invesco Advisers and its affiliates provide to the Fund and the Invesco Funds and the profitability of Invesco Advisers and its affiliates in providing these services. The Board considered the methodology used for calculating profitability and noted the periodic review of such methodology by an independent consultant. The Board noted that Invesco Advisers continues to operate at a net profit from services Invesco Advisers and its affiliates provide to the Invesco Funds. The Board received information from Invesco Advisers demonstrating that Invesco Advisers and the AffiliatedSub-Advisers are financially sound and have the resources necessary to perform their obligations under the investment advisory agreement andsub-advisory contracts.
| F. | Collateral Benefits to Invesco Advisers and its Affiliates |
The Board considered various other benefits received by Invesco Advisers and its affiliates from the relationship with the Fund, including the fees received for providing administrative, transfer agency and distribution services to the Fund. The Board considered comparative information regarding fees charged for these services, including information provided by Broadridge and other independent sources. The Board considered the performance of Invesco Advisers and its affiliates in providing these services and the organizational structure employed to provide these services. The Board also considered that these services are provided to the Fund pursuant to written contracts that are reviewed and approved on an annual basis by the Board; and that the services are required for the operation of the Fund.
The Board considered the benefits realized by Invesco Advisers and the AffiliatedSub-Advisers as a result of portfolio brokerage transactions executed through “soft dollar” arrangements. Invesco Advisers noted that the Fund does not execute brokerage transactions through “soft dollar” arrangements to any significant degree.
The Board considered that the Fund’s uninvested cash and cash collateral from any securities lending arrangements may be invested in money market funds advised by Invesco Advisers pursuant to procedures approved by the Board. The Board considered information regarding the returns of the affiliated money market funds relative to comparable overnight investments, as well as the costs to the Fund of such investments. The Board noted that Invesco Advisers receives advisory fees from these affiliated money market funds attributable to such investments, although Invesco Advisers has contractually agreed to waive through varying periods the advisory fees payable by the Invesco Funds with respect to certain investments in the affiliated money market funds. The waiver is in an amount equal to 100% of the net advisory fee Invesco Advisers receives from the affiliated money market funds with respect to the Fund’s investment in the affiliated money market funds of uninvested cash, but not cash collateral. The Board concluded that the amount of advisory
fees received by Invesco Advisers from the Fund’s investment of cash collateral from any securities lending arrangements in the affiliated money market funds is fair and reasonable.
40 Invesco Short Duration High Yield Municipal Fund
Tax Information
Form 1099-DIV, Form 1042-S and other year–end tax information provide shareholders with actual calendar year amounts that should be included in their tax returns. Shareholders should consult their tax advisers.
The following distribution information is being provided as required by the Internal Revenue Code or to meet a specific state’s requirement.
The Fund designates the following amounts or, if subsequently determined to be different, the maximum amount allowable for its fiscal year ended August 31, 2019:
| Federal and State Income Tax | |
| Qualified Dividend Income* | 0% |
| Corporate Dividends Received Deduction* | 0% |
| U.S. Treasury Obligations* | 0% |
| Tax-Exempt Interest Dividends* | 100% |
| * | The above percentages are based on ordinary income dividends paid to shareholders during the Fund’s fiscal year. |
| 41 | Invesco Short Duration High Yield Municipal Fund |
Trustees and Officers
The address of each trustee and officer is AIM Counselor Series Trust (Invesco Counselor Series Trust) (the “Trust”), 11 Greenway Plaza, Suite 1000, Houston, Texas 77046-1173. The trustees serve for the life of the Trust, subject to their earlier death, incapacitation, resignation, retirement or removal as more specifically provided in the Trust’s organizational documents. Each officer serves for a one year term or until their successors are elected and qualified. Column two below includes length of time served with predecessor entities, if any.
| | | | | | | | |
Name, Year of Birth and Position(s) Held with the Trust | | Trustee and/ or Officer Since | | Principal Occupation(s) During Past 5 Years | | Number of Funds in Fund
Complex
Overseen by
Trustee | | Other Directorship(s) Held by Trustee During Past 5 Years |
| Interested Persons | | | | | | | | |
Martin L. Flanagan1 — 1960 Trustee and Vice Chair | | 2007 | | Executive Director, Chief Executive Officer and President, Invesco Ltd. (ultimate parent of Invesco and a global investment management firm); Trustee and Vice Chair, The Invesco Funds; Vice Chair, Investment Company Institute; and Member of Executive Board, SMU Cox School of Business Formerly: Advisor to the Board, Invesco Advisers, Inc. (formerly known as Invesco Institutional (N.A.), Inc.); Chairman and Chief Executive Officer, Invesco Advisers, Inc. (registered investment adviser); Director, Chairman, Chief Executive Officer and President, Invesco Holding Company (US), Inc. (formerly IVZ Inc.) (holding company), Invesco Group Services, Inc. (service provider) and Invesco North American Holdings, Inc. (holding company); Director, Chief Executive Officer and President, Invesco Holding Company Limited (parent of Invesco and a global investment management firm); Director, Invesco Ltd.; Chairman, Investment Company Institute and President,Co-Chief Executive Officer,Co-President, Chief Operating Officer and Chief Financial Officer, Franklin Resources, Inc. (global investment management organization) | | 229 | | None |
Philip A. Taylor2 — 1954 Trustee | | 2006 | | Vice Chair, Invesco Ltd.; Trustee, The Invesco Funds Formerly: Director, Invesco Canada Ltd. (formerly known as Invesco Trimark Ltd./Invesco Trimark Ltèe) (registered investment adviser and registered transfer agent); Head of the Americas and Senior Managing Director, Invesco Ltd.; Director, Invesco Advisers, Inc. (formerly known as Invesco Institutional (N.A.), Inc.) (registered investment adviser); Director and Chairman, Invesco Investment Services, Inc. (formerly known as Invesco AIM Investment Services, Inc.) (registered transfer agent); Chief Executive Officer, Invesco Corporate Class Inc. (corporate mutual fund company); Chairman and Chief Executive Officer, Invesco Canada Ltd. (formerly known as Invesco Trimark Ltd./Invesco Trimark Ltèe) (registered investment adviser and registered transfer agent); Senior Vice President, The Invesco Funds; Director, Invesco Investment Advisers LLC (formerly known as Van Kampen Asset Management); Director, Chairman, Chief Executive Officer and President, Invesco Management Group, Inc. (formerly known as Invesco AIM Management Group, Inc.) (financial services holding company);Co-Chairman,Co-President andCo-Chief Executive Officer, Invesco Advisers, Inc. (formerly known as Invesco Institutional (N.A.), Inc.) (registered investment adviser); Director, Chief Executive Officer and President, Van Kampen Exchange Corp; President and Principal Executive Officer, The Invesco Funds (other than AIM Treasurer’s Series Trust (Invesco Treasurer’s Series Trust), Short-Term Investments Trust and Invesco Management Trust); Executive Vice President, The Invesco Funds (AIM Treasurer’s Series Trust (Invesco Treasurer’s Series Trust), Short-Term Investments Trust and Invesco Management Trust only); Director and President, INVESCO Funds Group, Inc. (registered investment adviser and registered transfer agent); Director and Chairman, IVZ Distributors, Inc. (formerly known as INVESCO Distributors, Inc.) (registered broker dealer); Director, President and Chairman, Invesco Inc. (holding company), Invesco Canada Holdings Inc. (holding company), Trimark Investments Ltd./Placements Trimark Ltèe and Invesco Financial Services Ltd/Services Financiers Invesco Ltèe; Chief Executive Officer, Invesco Canada Fund Inc. (corporate mutual fund company); Director and Chairman, Van Kampen Investor Services Inc.; Director, Chief Executive Officer and President, 1371 Preferred Inc. (holding company) and Van Kampen Investments Inc.; Director and President, AIM GP Canada Inc. (general partner for limited partnerships) and Van Kampen Advisors, Inc.; Director and Chief Executive Officer, Invesco Trimark Dealer Inc. (registered broker dealer); Director, Invesco Distributors, Inc. (formerly known as Invesco AIM Distributors, Inc.) (registered broker dealer); Manager, Invesco Capital Management LLC; Director, Chief Executive Officer and President, Invesco Advisers, Inc.; Director, Chairman, Chief Executive Officer and President, Invesco AIM Capital Management, Inc.; President, Invesco Trimark Dealer Inc. and Invesco Trimark Ltd./Invesco Trimark Ltèe; Director and President, AIM Trimark Corporate Class Inc. and AIM Trimark Canada Fund Inc.; Senior Managing Director, Invesco Holding Company Limited; Director and Chairman, Fund Management Company (former registered broker dealer); President and Principal Executive Officer, The Invesco Funds (AIM Treasurer’s Series Trust (Invesco Treasurer’s Series Trust), and Short-Term Investments Trust only); President, AIM Trimark Global Fund Inc. and AIM Trimark Canada Fund Inc. | | 229 | | None |
| 1 | Mr. Flanagan is considered an interested person (within the meaning of Section 2(a)(19) of the 1940 Act) of the Trust because he is an officer of the Adviser to the Trust, and an officer and a director of Invesco Ltd., ultimate parent of the Adviser. |
| 2 | Mr. Taylor is considered an interested person (within the meaning of Section 2(a)(19) of the 1940 Act) of the Trust because he is an officer of Invesco Ltd., ultimate parent of the Adviser. |
T-1 Invesco Short Duration High Yield Municipal Fund
Trustees and Officers—(continued)
| | | | | | | | |
Name, Year of Birth and Position(s) Held with the Trust | | Trustee and/ or Officer Since | | Principal Occupation(s)
During Past 5 Years | | Number of
Funds in Fund
Complex
Overseen by
Trustee | | Other Directorship(s) Held by Trustee During
Past 5 Years |
| Independent Trustees | | | | | | | | |
Bruce L. Crockett — 1944 Trustee and Chair | | 2003 | | Chairman, Crockett Technologies Associates (technology consulting company) Formerly: Director, Captaris (unified messaging provider); Director, President and Chief Executive Officer, COMSAT Corporation; Chairman, Board of Governors of INTELSAT (international communications company); ACE Limited (insurance company); Independent Directors Council and Investment Company Institute: Member of the Audit Committee, Investment Company Institute; Member of the Executive Committee and Chair of the Governance Committee, Independent Directors Council | | 229 | | Director and Chairman of the Audit Committee, ALPS (Attorneys Liability Protection Society) (insurance company); Director and Member of the Audit Committee and Compensation Committee, Ferroglobe PLC (metallurgical company) |
David C. Arch — 1945 Trustee | | 2010 | | Chairman of Blistex Inc. (consumer health care products manufacturer); Member, World Presidents’ Organization | | 229 | | Board member of the Illinois Manufacturers’ Association |
Beth Ann Brown — 1968 Trustee | | 2019 | | Independent Consultant Formerly: Head of Intermediary Distribution, Managing Director, Strategic Relations, Managing Director, Head of National Accounts, Senior Vice President, National Account Manager and Senior Vice President, Key Account Manager, Columbia Management Investment Advisers LLC; Vice President, Key Account Manager, Liberty Funds Distributor, Inc.; and Trustee of certain Oppenheimer Funds | | 229 | | Director, Board of Directors of Caron Engineering Inc.; Advisor, Board of Advisors of Caron Engineering Inc.; President and Director, Acton Shapleigh Youth Conservation Corps (non -profit); and Vice President and Director of Grahamtastic Connection(non-profit) |
Jack M. Fields — 1952 Trustee | | 2003 | | Chief Executive Officer, Twenty First Century Group, Inc. (government affairs company); and Chairman, Discovery Learning Alliance(non-profit) Formerly: Owner and Chief Executive Officer, Dos Angeles Ranch L.P. (cattle, hunting, corporate entertainment); Director, Insperity, Inc. (formerly known as Administaff) (human resources provider); Chief Executive Officer, Texana Timber LP (sustainable forestry company); Director of Cross Timbers Quail Research Ranch(non-profit); and member of the U.S. House of Representatives | | 229 | | None |
Cynthia Hostetler — 1962 Trustee | | 2017 | | Non-Executive Director and Trustee of a number of public and private business corporations Formerly: Director, Aberdeen Investment Funds (4 portfolios); Head of Investment Funds and Private Equity, Overseas Private Investment Corporation; President, First Manhattan Bancorporation, Inc.; Attorney, Simpson Thacher & Bartlett LLP | | 229 | | Vulcan Materials Company (construction materials company); Trilinc Global Impact Fund; Genesee & Wyoming, Inc. (railroads); Artio Global Investment LLC (mutual fund complex); Edgen Group, Inc. (specialized energy and infrastructure products distributor); Investment Company Institute (professional organization); Independent Directors Council (professional organization) |
Eli Jones — 1961 Trustee | | 2016 | | Professor and Dean, Mays Business School — Texas A&M University Formerly: Professor and Dean, Walton College of Business, University of Arkansas and E.J. Ourso College of Business, Louisiana State University; Director, Arvest Bank | | 229 | | Insperity, Inc. (formerly known as Administaff) (human resources provider) |
Elizabeth Krentzman — 1959 Trustee | | 2019 | | Formerly: Principal and Chief Regulatory Advisor for Asset Management Services and U.S. Mutual Fund Leader of Deloitte & Touche LLP; General Counsel of the Investment Company Institute (trade association); National Director of the Investment Management Regulatory Consulting Practice, Principal, Director and Senior Manager of Deloitte & Touche LLP; Assistant Director of the Division of Investment Management — Office of Disclosure and Investment Adviser Regulation of the U.S. Securities and Exchange Commission and various positions with the Division of Investment Management — Office of Regulatory Policy of the U.S. Securities and Exchange Commission; Associate at Ropes & Gray LLP; Advisory Board Member of the Securities and Exchange Commission Historical Society; and Trustee of certain Oppenheimer Funds | | 229 | | Trustee of the University of Florida National Board Foundation and Audit Committee Member; Member of the Cartica Funds Board of Directors (private investment funds); Member of the University of Florida Law Center Association, Inc. Board of Trustees and Audit Committee Member |
Anthony J. LaCava, Jr. — 1956 Trustee | | 2019 | | Formerly: Director and Member of the Audit Committee, Blue Hills Bank (publicly traded financial institution) and Managing Partner, KPMG LLP | | 229 | | Blue Hills Bank; Chairman, Bentley University; Member, Business School Advisory Council; and Nominating Committee, KPMG LLP |
T-2 Invesco Short Duration High Yield Municipal Fund
Trustees and Officers—(continued)
| | | | | | | | |
Name, Year of Birth and Position(s) Held with the Trust | | Trustee and/ or Officer Since | | Principal Occupation(s)
During Past 5 Years | | Number of
Funds in Fund
Complex
Overseen by
Trustee | | Other Directorship(s) Held by Trustee During
Past 5 Years |
| Independent Trustees—(continued) |
Prema Mathai-Davis — 1950 Trustee | | 2003 | | Retired Co-Owner & Partner of Quantalytics Research, LLC, (a FinTech Investment Research Platform for the Self-Directed Investor) | | 229 | | None |
Joel W. Motley — 1952 Trustee | | 2019 | | Director of Office of Finance, Federal Home Loan Bank; Member of the Vestry of Trinity Wall Street; Managing Director of Carmona Motley Inc. (privately held financial advisor); Member of the Finance and Budget Committee of the Council on Foreign Relations, Member of the Investment Committee and Board of Human Rights Watch and Member of the Investment Committee and Board of Historic Hudson Valley(non-profit cultural organization) Formerly: Managing Director of Public Capital Advisors, LLC (privately held financial advisor); Managing Director of Carmona Motley Hoffman, Inc. (privately held financial advisor); Trustee of certain Oppenheimer Funds; and Director of Columbia Equity Financial Corp. (privately held financial advisor) | | 229 | | Director of Greenwall Foundation (bioethics research foundation); Member of Board and Investment Committee of The Greenwall Foundation; Director of Southern Africa Legal Services Foundation; Board Member and Investment Committee Member of Pulitzer Center for Crisis Reporting(non-profit journalism) |
Teresa M. Ressel — 1962 Trustee | | 2017 | | Non-executive director and trustee of a number of public and private business corporations Formerly: Chief Financial Officer, Olayan America, The Olayan Group (international investor/commercial/industrial); Chief Executive Officer, UBS Securities LLC; Group Chief Operating Officer, Americas, UBS AG; Assistant Secretary for Management & Budget and CFO, US Department of the Treasury | | 229 | | Atlantic Power Corporation (power generation company); ON Semiconductor Corp. (semiconductor supplier) |
Ann Barnett Stern — 1957 Trustee | | 2017 | | President and Chief Executive Officer, Houston Endowment Inc. (private philanthropic institution) Formerly: Executive Vice President and General Counsel, Texas Children’s Hospital; Attorney, Beck, Redden and Secrest, LLP; Business Law Instructor, University of St. Thomas; Attorney, Andrews & Kurth LLP | | 229 | | Federal Reserve Bank of Dallas |
Raymond Stickel, Jr. — 1944 Trustee | | 2005 | | Retired Formerly: Director, Mainstay VP Series Funds, Inc. (25 portfolios); Partner, Deloitte & Touche | | 229 | | None |
Robert C. Troccoli — 1949 Trustee | | 2016 | | Retired Formerly: Adjunct Professor, University of Denver — Daniels College of Business; Senior Partner, KPMG LLP | | 229 | | None |
Daniel S. Vandivort — 1954 Trustee | | 2019 | | Treasurer, Chairman of the Audit and Finance Committee, and Trustee, Board of Trustees, Huntington Disease Foundation of America; and President, Flyway Advisory Services LLC (consulting and property management) Formerly: Trustee and Governance Chair, of certain Oppenheimer Funds | | 229 | | Chairman and Lead Independent Director, Chairman of the Audit Committee, and Director, Board of Directors, Value Line Funds |
James D. Vaughn — 1945 Trustee | | 2019 | | Retired Formerly: Managing Partner, Deloitte & Touche LLP; Trustee and Chairman of the Audit Committee, Schroder Funds; Board Member, Mile High United Way, Boys and Girls Clubs, Boy Scouts, Colorado Business Committee for the Arts, Economic Club of Colorado and Metro Denver Network (economic development corporation); and Trustee of certain Oppenheimer Funds | | 229 | | Board member and Chairman of Audit Committee of AMG National Trust Bank; Trustee and Investment Committee member, University of South Dakota Foundation; Board member, Audit Committee Member and past Board Chair, Junior Achievement(non-profit) |
Christopher L. Wilson — 1957 Trustee, Vice Chair and Chair Designate | | 2017 | | Retired Formerly: Director, TD Asset Management USA Inc. (mutual fund complex) (22 portfolios); Managing Partner, CT2, LLC (investing and consulting firm); President/Chief Executive Officer, Columbia Funds, Bank of America Corporation; President/Chief Executive Officer, CDC IXIS Asset Management Services, Inc.; Principal & Director of Operations, Scudder Funds, Scudder, Stevens & Clark, Inc.; Assistant Vice President, Fidelity Investments | | 229 | | ISO New England, Inc.(non-profit organization managing regional electricity market) |
T-3 Invesco Short Duration High Yield Municipal Fund
Trustees and Officers—(continued)
| | | | | | | | |
Name, Year of Birth and Position(s) Held with the Trust | | Trustee and/ or Officer Since | | Principal Occupation(s)
During Past 5 Years | | Number of
Funds in Fund
Complex
Overseen by
Trustee | | Other Directorship(s) Held by Trustee During
Past 5 Years |
| Other Officers | | | | | | | | |
Sheri Morris — 1964 President, Principal Executive Officer and Treasurer | | 2003 | | President, Principal Executive Officer and Treasurer, The Invesco Funds; Vice President, Invesco Advisers, Inc. (formerly known as Invesco Institutional (N.A.), Inc.) (registered investment adviser); and Vice President, Invesco Exchange-Traded Fund Trust, Invesco Exchange-Traded Fund Trust II, Invesco India Exchange-Traded Fund Trust, Invesco Actively Managed Exchange-Traded Fund Trust, Invesco Actively Managed Exchange-Traded Commodity Fund Trust and Invesco Exchange-Traded Self-Indexed Fund Trust; and Vice President, OppenheimerFunds, Inc. Formerly: Vice President and Principal Financial Officer, The Invesco Funds; Vice President, Invesco AIM Advisers, Inc., Invesco AIM Capital Management, Inc. and Invesco AIM Private Asset Management, Inc.; Assistant Vice President and Assistant Treasurer, The Invesco Funds and Assistant Vice President, Invesco Advisers, Inc., Invesco AIM Capital Management, Inc. and Invesco AIM Private Asset Management, Inc.; and Treasurer, Invesco Exchange-Traded Fund Trust, Invesco Exchange-Traded Fund Trust II, Invesco India Exchange-Traded Fund Trust and Invesco Actively Managed Exchange-Traded Fund Trust | | N/A | | N/A |
Russell C. Burk — 1958 Senior Vice President and Senior Officer | | 2005 | | Senior Vice President and Senior Officer, The Invesco Funds | | N/A | | N/A |
Jeffrey H. Kupor — 1968 Senior Vice President, Chief Legal Officer and Secretary | | 2018 | | Head of Legal of the Americas, Invesco Ltd.; Senior Vice President and Secretary, Invesco Advisers, Inc. (formerly known as Invesco Institutional (N.A.), Inc.) (registered investment adviser); Senior Vice President and Secretary, Invesco Distributors, Inc. (formerly known as Invesco AIM Distributors, Inc.); Vice President and Secretary, Invesco Investment Services, Inc. (formerly known as Invesco AIM Investment Services, Inc.) Senior Vice President, Chief Legal Officer and Secretary, The Invesco Funds; Secretary and General Counsel, Invesco Investment Advisers LLC (formerly known as Van Kampen Asset Management); Secretary and General Counsel, Invesco Capital Markets, Inc. (formerly known as Van Kampen Funds Inc.) and Chief Legal Officer, Invesco Exchange-Traded Fund Trust, Invesco Exchange-Traded Fund Trust II, Invesco India Exchange-Traded Fund Trust, Invesco Actively Managed Exchange-Traded Fund Trust, Invesco Actively Managed Exchange-Traded Commodity Fund Trust and Invesco Exchange-Traded Self-Indexed Fund Trust; Secretary, Invesco Indexing LLC; Secretary, W.L. Ross & Co., LLC Formerly: Secretary and Vice President, Jemstep, Inc.; Head of Legal, Worldwide Institutional, Invesco Ltd.; Secretary and General Counsel, INVESCO Private Capital Investments, Inc.; Senior Vice President, Secretary and General Counsel, Invesco Management Group, Inc. (formerly known as Invesco AIM Management Group, Inc.); Assistant Secretary, INVESCO Asset Management (Bermuda) Ltd.; Secretary and General Counsel, Invesco Private Capital, Inc.; Assistant Secretary and General Counsel, INVESCO Realty, Inc.; Secretary and General Counsel, Invesco Senior Secured Management, Inc.; and Secretary, Sovereign G./P. Holdings Inc. | | N/A | | N/A |
Andrew R. Schlossberg — 1974 Senior Vice President | | 2019 | | Head of the Americas and Senior Managing Director, Invesco Ltd.; Director and Senior Vice President, Invesco Advisers, Inc. (formerly known as Invesco Institutional (N.A.), Inc.) (registered investment adviser); Director and Chairman, Invesco Investment Services, Inc. (formerly known as Invesco AIM Investment Services, Inc.) (registered transfer agent); Senior Vice President, The Invesco Funds; Director, Invesco Investment Advisers LLC (formerly known as Van Kampen Asset Management); Director, President and Chairman, Invesco Insurance Agency, Inc. Formerly: Director, Invesco UK Limited; Director and Chief Executive, Invesco Asset Management Limited and Invesco Fund Managers Limited; Assistant Vice President, The Invesco Funds; Senior Vice President, Invesco Advisers, Inc. (formerly known as Invesco Institutional (N.A.), Inc.) (registered investment adviser); Director and Chief Executive, Invesco Administration Services Limited and Invesco Global Investment Funds Limited; Director, Invesco Distributors, Inc.; Head of EMEA, Invesco Ltd.; President, Invesco Actively Managed Exchange-Traded Commodity Fund Trust, Invesco Actively Managed Exchange-Traded Fund Trust, Invesco Exchange-Traded Fund Trust, Invesco Exchange-Traded Fund Trust II and Invesco India Exchange-Traded Fund Trust; Managing Director and Principal Executive Officer, Invesco Capital Management LLC | | N/A | | N/A |
T-4 Invesco Short Duration High Yield Municipal Fund
Trustees and Officers—(continued)
| | | | | | | | |
Name, Year of Birth and Position(s) Held with the Trust | | Trustee and/ or Officer Since | | Principal Occupation(s)
During Past 5 Years | | Number of
Funds in Fund
Complex
Overseen by
Trustee | | Other Directorship(s) Held by Trustee During
Past 5 Years |
| Other Officers—(continued) | | | | | | | | |
John M. Zerr — 1962
Senior Vice President | | 2006 | | Chief Operating Officer of the Americas; Senior Vice President, Invesco Advisers, Inc. (formerly known as Invesco Institutional (N.A.), Inc.) (registered investment adviser); Senior Vice President, Invesco Distributors, Inc. (formerly known as Invesco AIM Distributors, Inc.); Director and Vice President, Invesco Investment Services, Inc. (formerly known as Invesco AIM Investment Services, Inc.) Senior Vice President, The Invesco Funds; Managing Director, Invesco Capital Management LLC; Director, Invesco Investment Advisers LLC (formerly known as Van Kampen Asset Management); Senior Vice President, Invesco Capital Markets, Inc. (formerly known as Van Kampen Funds Inc.); Manager, Invesco Indexing LLC; Manager, Invesco Specialized Products, LLC; Director and Senior Vice President, Invesco Insurance Agency, Inc.; Member, Invesco Canada Funds Advisory Board; Director, President and Chief Executive Officer, Invesco Corporate Class Inc. (corporate mutual fund company); and Director, Chairman, President and Chief Executive Officer, Invesco Canada Ltd. (formerly known as Invesco Trimark Ltd./Invesco Trimark Ltèe) (registered investment adviser and registered transfer agent) Formerly: Director and Senior Vice President, Invesco Management Group, Inc. (formerly known as Invesco AIM Management Group, Inc.); Secretary and General Counsel, Invesco Management Group, Inc. (formerly known as Invesco AIM Management Group, Inc.); Secretary, Invesco Investment Services, Inc. (formerly known as Invesco AIM Investment Services, Inc.); Chief Legal Officer and Secretary, The Invesco Funds; Secretary and General Counsel, Invesco Investment Advisers LLC (formerly known as Van Kampen Asset Management); Secretary and General Counsel, Invesco Capital Markets, Inc. (formerly known as Van Kampen Funds Inc.); Chief Legal Officer, Invesco Exchange-Traded Fund Trust, Invesco Exchange-Traded Fund Trust II, Invesco India Exchange-Traded Fund Trust, Invesco Actively Managed Exchange-Traded Fund Trust, Invesco Actively Managed Exchange-Traded Commodity Fund Trust and Invesco Exchange-Traded Self-Indexed Fund Trust; Secretary, Invesco Indexing LLC; Director, Secretary, General Counsel and Senior Vice President, Van Kampen Exchange Corp.; Director, Vice President and Secretary, IVZ Distributors, Inc. (formerly known as INVESCO Distributors, Inc.); Director and Vice President, INVESCO Funds Group, Inc.; Director and Vice President, Van Kampen Advisors Inc.; Director, Vice President, Secretary and General Counsel, Van Kampen Investor Services Inc.; Director and Secretary, Invesco Distributors, Inc. (formerly known as Invesco AIM Distributors, Inc.); Director, Senior Vice President, General Counsel and Secretary, Invesco AIM Advisers, Inc. and Van Kampen Investments Inc.; Director, Vice President and Secretary, Fund Management Company; Director, Senior Vice President, Secretary, General Counsel and Vice President, Invesco AIM Capital Management, Inc.; Chief Operating Officer and General Counsel, Liberty Ridge Capital, Inc. (an investment adviser) | | N/A | | N/A |
Gregory G. McGreevey — 1962 Senior Vice President | | 2012 | | Senior Managing Director, Invesco Ltd.; Director, Chairman, President, and Chief Executive Officer, Invesco Advisers, Inc. (formerly known as Invesco Institutional (N.A.), Inc.) (registered investment adviser); Director, Invesco Mortgage Capital, Inc. and Invesco Senior Secured Management, Inc.; and Senior Vice President, The Invesco Funds; and President, SNW Asset Management Corporation Formerly: Senior Vice President, Invesco Management Group, Inc. and Invesco Advisers, Inc.; Assistant Vice President, The Invesco Funds | | N/A | | N/A |
Kelli Gallegos — 1970 Vice President, Principal Financial Officer and Assistant Treasurer | | 2008 | | Assistant Treasurer, Invesco Specialized Products, LLC; Vice President, Principal Financial Officer and Assistant Treasurer, The Invesco Funds; Principal Financial and Accounting Officer — Pooled Investments, Invesco Capital Management LLC; Vice President and Treasurer, Invesco Exchange-Traded Fund Trust, Invesco Exchange-Traded Fund Trust II, Invesco India Exchange-Traded Fund Trust, Invesco Actively Managed Exchange-Traded Fund Trust, Invesco Actively Managed Exchange-Traded Commodity Fund Trust and Invesco Exchange-Traded Self-Indexed Fund Trust Formerly: Assistant Treasurer, Invesco Exchange-Traded Fund Trust, Invesco Exchange-Traded Fund Trust II, Invesco India Exchange-Traded Fund Trust, Invesco Actively Managed Exchange-Traded Fund Trust, Invesco Actively Managed Exchange-Traded Commodity Fund Trust and Invesco Exchange-Traded Self-Indexed Fund Trust; Assistant Treasurer, Invesco Capital Management LLC; Assistant Vice President, The Invesco Funds | | N/A | | N/A |
T-5 Invesco Short Duration High Yield Municipal Fund
Trustees and Officers—(continued)
| | | | | | | | |
Name, Year of Birth and Position(s) Held with the Trust | | Trustee and/ or Officer Since | | Principal Occupation(s)
During Past 5 Years | | Number of
Funds in Fund
Complex
Overseen by
Trustee | | Other Directorship(s) Held by Trustee During
Past 5 Years |
| Other Officers—(continued) | | | | | | | | |
Crissie M. Wisdom — 1969 Anti-Money Laundering Compliance Officer | | 2013 | | Anti-Money Laundering Compliance Officer, Invesco Advisers, Inc. (formerly known as Invesco Institutional (N.A.), Inc.) (registered investment adviser), Invesco Capital Markets, Inc. (formerly known as Van Kampen Funds Inc.), Invesco Distributors, Inc., Invesco Investment Services, Inc., The Invesco Funds, and Invesco Exchange-Traded Fund Trust, Invesco Exchange-Traded Fund Trust II, Invesco India Exchange-Traded Fund Trust, Invesco Actively Managed Exchange-Traded Fund Trust, Invesco Actively Managed Exchange-Traded Commodity Fund Trust and Invesco Exchange-Traded Self-Indexed Fund Trust; Anti-Money Laundering Compliance Officer and Bank Secrecy Act Officer, INVESCO National Trust Company and Invesco Trust Company; and Fraud Prevention Manager and Controls and Risk Analysis Manager for Invesco Investment Services, Inc. Formerly: Anti-Money Laundering Compliance Officer, Van Kampen Exchange Corp. and Invesco Management Group, Inc. | | N/A | | N/A |
Robert R. Leveille — 1969 Chief Compliance Officer | | 2016 | | Chief Compliance Officer, Invesco Advisers, Inc. (registered investment adviser); and Chief Compliance Officer, The Invesco Funds Formerly: Chief Compliance Officer, Putnam Investments and the Putnam Funds | | N/A | | N/A |
The Statement of Additional Information of the Trust includes additional information about the Fund’s Trustees and is available upon request, without charge, by calling 1.800.959.4246. Please refer to the Fund’s Statement of Additional Information for information on the Fund’ssub-advisers.
| | | | | | |
Office of the Fund 11 Greenway Plaza, Suite 1000
Houston, TX 77046-1173 | | Investment Adviser Invesco Advisers, Inc.
1555 Peachtree Street, N.E.
Atlanta, GA 30309 | | Distributor Invesco Distributors, Inc.
11 Greenway Plaza, Suite 1000
Houston, TX 77046-1173 | | Auditors PricewaterhouseCoopers LLP
1000 Louisiana Street, Suite 5800 Houston, TX 77002-5021 |
| | | |
| | | | | | |
Counsel to the Fund Stradley Ronon Stevens & Young, LLP
2005 Market Street, Suite 2600
Philadelphia, PA 19103-7018 | | Counsel to the Independent Trustees Goodwin Procter LLP
901 New York Avenue, N.W.
Washington, D.C. 20001 | | Transfer Agent Invesco Investment Services, Inc.
11 Greenway Plaza, Suite 1000
Houston, TX 77046-1173 | | Custodian State Street Bank and Trust Company
225 Franklin Street
Boston, MA 02110-2801 |
T-6 Invesco Short Duration High Yield Municipal Fund
Go paperless with eDelivery
Visit invesco.com/edelivery to enjoy the convenience and security of anytime electronic access to your investment documents.
With eDelivery, you can elect to have any or all of the following materials delivered straight to your inbox to download, save and print from your own computer:
| • | Fund reports and prospectuses |
| • | Quarterly statements |
| • | Daily confirmations |
| • | Tax forms |
Invesco mailing information
Send general correspondence to Invesco Investment Services, Inc., P.O. Box 219078, Kansas City, MO 64121-9078.
Important notice regarding delivery of security holder documents
To reduce Fund expenses, only one copy of most shareholder documents may be mailed to shareholders with multiple accounts at the same address (Householding). Mailing of your shareholder documents may be householded indefinitely unless you instruct us otherwise. If you do not want the mailing of these documents to be combined with those for other members of your household, please contact Invesco Investment Services, Inc. at 800 959 4246 or contact your financial institution. We will begin sending you individual copies for each account within 30 days after receiving your request.
Fund holdings and proxy voting information
The Fund provides a complete list of its holdings four times in each fiscal year, at the quarter-ends. For the second and fourth quarters, the list appears in the Fund’s semiannual and annual reports to shareholders. For the first and third quarters, the Fund files the lists with the Securities and Exchange Commission (SEC) as an exhibit to its reports on Form N-PORT. The most recent list of portfolio holdings is available at invesco.com/completeqtrholdings. Shareholders can also look up the Fund’s Form N-PORT filings on the SEC website, sec.gov. The SEC file numbers for the Fund are shown below.
A description of the policies and procedures that the Fund uses to determine how to vote proxies relating to portfolio securities is available without charge, upon request, from our Client Services department at 800 959 4246, or at invesco.com/proxyguidelines. The information is also available on the SEC website, sec.gov.
Information regarding how the Fund voted proxies related to its portfolio securities during the most recent 12-month period ended June 30 is available at invesco.com/proxysearch. This information is also available on the SEC website, sec.gov.
Invesco Advisers, Inc. is an investment adviser; it provides investment advisory services to individual and institutional clients and does not sell securities. Invesco Distributors, Inc. is the US distributor for Invesco Ltd.’s retail mutual funds, exchange-traded funds and institutional money market funds. Both are wholly owned, indirect subsidiaries of Invesco Ltd.
| SEC file numbers: 811-09913 and 333-36074 | Invesco Distributors, Inc. | SDHYM-AR-1 |
| Annual Report to Shareholders | August 31, 2019 |
Invesco Small Cap Discovery Fund
Nasdaq:
A: VASCX ■ C: VCSCX ■ Y: VISCX ■ R5: VESCX ■ R6: VFSCX

Beginning on January 1, 2021, as permitted by regulations adopted by the Securities and Exchange Commission, paper copies of the Fund’s shareholder reports will no longer be sent by mail, unless you specifically request paper copies of the reports from the Fund or from your financial intermediary, such as a broker-dealer or bank. Instead, the reports will be made available on the Fund’s website, and you will be notified by mail each time a report is posted and provided with a website link to access the report.
If you already elected to receive shareholder reports electronically, you will not be affected by this change and you need not take any action. You may elect to receive shareholder reports and other communications from the Fund electronically by contacting your financial intermediary (such as a broker-dealer or bank) or, if you are a direct investor, by enrolling at invesco.com/edelivery.
You may elect to receive all future reports in paper free of charge. If you invest through a financial intermediary, you can contact your financial intermediary to request that you continue to receive paper copies of your shareholder reports. If you invest directly with the Fund, you can call (800) 959-4246 to let the Fund know you wish to continue receiving paper copies of your shareholder reports. Your election to receive reports in paper will apply to all funds held with your financial intermediary or all funds held with the fund complex if you invest directly with the Fund.
Dear Shareholders:
This annual report includes information about your Fund, including performance data and a complete list of its investments as of the close of the reporting period. Inside is a discussion of how your Fund was managed and the factors that affected its performance during the reporting period.
Throughout the reporting period, global equity markets remained volatile. Investor sentiment ranged from elation to fear. The reporting period began with several US equity indexes redefining new highs. The exuberance, however, ended in October 2018 as global equities, in particular US stocks, sold off, with the sharpest decline in December. The catalyst for the sell-off was a combination of ongoing trade concerns between the US and China, fears of a global economic slowdown and lower oil prices from a supply glut. Gains posted earlier in 2018 for global equities were erased, while US Treasury bonds, along with government and municipal bonds, rallied as investors fled to “safe haven” assets.
At the start of 2019, global equity markets rebounded strongly buoyed by more dovish central banks and optimism about a potential US-China trade deal. In May, US-China trade concerns and slowing global growth led to a global equity sell-off and rally in U.S. Treasuries. Despite the May sell-off, domestic equity markets rallied in June in anticipation of a U.S. Federal Reserve (the Fed) rate cut and closed the second quarter with modest gains. As the reporting period ended in August, market volatility once again increased as the US Treasury yield curve inverted several times magnifying concerns that the US economy could be headed into a recession.
During the reporting period, the Fed both raised and lowered the federal funds rate. Given signs of a strong economy, the Fed raised rates two times: in September and December 2018. In 2019, however, the Fed altered its outlook on further rate hikes leaving rates unchanged for the first half of the year. In July, the Fed lowered interest rates for the first time in 11 years. As 2019 unfolds, we’ll see how the interplay of interest rates, economic data, geopolitics and a host of other factors affect US and overseas equity and fixed income markets.
Investor uncertainty and market volatility, such as we witnessed during the reporting period, are unfortunate facts of life when it comes to investing. That’s why Invesco encourages investors to work with a professional financial adviser who can stress the importance of starting to save and invest early and the importance of adhering to a disciplined investment plan. A financial adviser who knows your unique financial situation, investment goals and risk tolerance can be an invaluable partner as you seek to achieve your financial goals. He or she can offer a long-term perspective when markets are volatile and time-tested advice and guidance when your financial situation or investment goals change.
Visit our website for more information on your investments
Our website, invesco.com/us, offers a wide range of market insights and investment perspectives. On the website, you’ll find detailed information about our funds, including performance, holdings and portfolio manager commentaries. You can access information about your account by completing a simple, secure online registration. To do so, select “Log In” on the right side of the homepage, and then select “Register for Individual Account Access.”
In addition to the resources accessible on our website and through our mobile app, you can obtain timely updates to help you stay informed about the markets and the economy by connecting with Invesco on Twitter, LinkedIn or Facebook. You can access our blog at blog.invesco.us.com. Our goal is to provide you the information you want, when and where you want it.
Finally, I’m pleased to share with you Invesco’s commitment to both the Principles for Responsible Investment and to considering environmental, social and governance issues in our robust investment process. I invite you to learn more at invesco.com/esg.
Have questions?
For questions about your account, contact an Invesco client services representative at 800 959 4246.
All of us at Invesco look forward to serving your investment management needs. Thank you for investing with us.
Sincerely,
Andrew Schlossberg
Head of the Americas,
Senior Managing Director, Invesco Ltd.
| 2 | Invesco Small Cap Discovery Fund |
Dear Shareholders:
Among the many important lessons I’ve learned in more than 40 years in a variety of business endeavors is the value of a trusted advocate.
As independent chair of the Invesco Funds Board, I can assure you that the members of the Board are strong advocates for the interests of investors in Invesco’s mutual funds. We work hard to represent your interests through oversight of the quality of the investment management services your funds receive and other matters important to your investment, including but not limited to:
| ■ | Ensuring that Invesco offers a diverse lineup of mutual funds that your financial adviser can use to strive to meet your financial needs as your investment goals change over time. |
| ■ | Monitoring how the portfolio management teams of the Invesco funds are performing in light of changing economic and market conditions. |
| ■ | Assessing each portfolio management team’s investment performance within the context of the investment strategy described in the fund’s prospectus. |
| ■ | Monitoring for potential conflicts of interests that may impact the nature of the services that your funds receive. |
We believe one of the most important services we provide our fund shareholders is the annual review of the funds’ advisory and sub-advisory contracts with Invesco Advisers and its affiliates. This review is required by the Investment Company Act of 1940 and focuses on the nature and quality of the services Invesco provides as the adviser to the Invesco funds and the reasonableness of the fees that it charges for those services. Each year, we spend months carefully reviewing information received from Invesco and a variety of independent sources, such as performance and fee data prepared by Lipper, Inc. (a subsidiary of Broadridge Financial Solutions, Inc.), an independent, third-party firm widely recognized as a leader in its field. We also meet with our independent legal counsel and other independent advisers to review and help us assess the information that we have received. Our goal is to assure that you receive quality investment management services for a reasonable fee.
I trust the measures outlined above provide assurance that you have a worthy advocate when it comes to choosing the Invesco Funds.
As always, please contact me at bruce@brucecrockett.com with any questions or concerns you may have. On behalf of the Board, we look forward to continuing to represent your interests and serving your needs.
Sincerely,
Bruce L. Crockett
Independent Chair
Invesco Funds Board of Trustees
| 3 | Invesco Small Cap Discovery Fund |
Management’s Discussion of Fund Performance
Performance summary
For the fiscal year ended August 31, 2019, Class A shares of Invesco Small Cap Discovery Fund (the Fund), at net asset value (NAV), outperformed the Russell 2000 Growth Index, the Fund’s style-specific benchmark.
Your Fund’s long-term performance appears later in this report.
Fund vs. Indexes
Total returns, August 31, 2018 to August 31, 2019, at net asset value (NAV). Performance shown does not include applicable contingent deferred sales charges (CDSC) or front-end sales charges, which would have reduced performance.
| Class A Shares* | –2.42% |
| Class C Shares* | –3.12 |
| Class Y Shares* | –2.17 |
| Class R5 Shares* | –2.13 |
| Class R6 Shares* | –2.04 |
| S&P 500 Index▼ (Broad Market Index) | 2.92 |
| Russell 2000 Growth Index▼ (Style-Specific Index) | –11.02 |
Lipper Small-Cap Growth Funds Index■
(Peer Group Index) | –4.41 |
Source(s):▼RIMES Technologies Corp.;■
Lipper Inc. | |
| *Performance includes litigation proceeds. Had these proceeds not been received, total returns would have been lower. |
Market conditions and your Fund
The fiscal year proved to be an increasingly volatile time for US equities. After a relatively quiet summer, market volatility noticeably rose in October 2018, as US equity markets suffered a sharp sell-off through year-end 2018, amid ongoing trade concerns between the US and China, fears of a global economic slowdown and lower oil prices from a supply glut, with oil prices plummeting from near $75 per barrel in early October 2018 to around $45 per barrel in late December 2018.1 In this environment, there was a flight to safety, as investors fled to defensive areas of the markets, such as health care, utilities and US Treasuries.
Given signs of a strong economy, the US Federal Reserve (the Fed) raised interest rates two times during the fiscal year: in September and December 2018.2 In contrast, the European Central Bank and central banks in several other
countries maintained extraordinarily accommodative monetary policies.
Following a sharp sell-off during the fourth quarter of 2018, equity markets rebounded in the first quarter of 2019, fueled by optimism about a potential US-China trade deal and the Fed’s indication that there would be no interest rate hikes in 2019, a surprising shift in monetary policy. The Fed’s more accommodative stance provided a supportive environment for equities and fixed income, even as US economic data were mixed, and overseas growth appeared to be slowing. Against this backdrop, the S&P 500 Index posted its best first quarter returns since 1998.
Although the S&P 500 Index posted modest gains for the second quarter of 2019, the US stock market experienced increased volatility. After four consecutive months of rising stock markets, the market sold off in May 2019, along with bond yields and oil prices, as investors
weighed the impact of the lingering trade war between the US and China, as well as potential tariffs imposed on Mexico. In addition, economic data showed a slowing domestic and global economy. During the July 2019 meeting, the Fed lowered rates by 25 basis points. (A basis point is one one-hundredth of a percentage point.) This was the first time the Fed lowered rates in more than a decade.2
Market volatility increased in August 2019, as the US Treasury yield curve inverted several times, causing jitters for investors who were concerned that a US recession would be imminent. As a result, much of August saw a “risk off” sentiment, with investors crowding into perceived “safe haven” asset classes, such as US Treasuries and gold. However, a more dovish tone from the Fed provided some support to risk assets. With rising volatility in the markets, the S&P 500 Index posted a modestly positive return for the fiscal year.
During the fiscal year, the Fund produced a negative return but outperformed its style-specific benchmark. Relative outperformance was led by positive stock selection in the industrials, consumer discretionary and health care sectors. Stock selection in and an overweight allocation to the information technology (IT) sector also contributed to the Fund’s performance relative to its style-specific benchmark. In addition, the Fund’s ancillary cash position helped buoy results in periods of heightened stock market volatility during the fiscal year. Conversely, stock selection in and overweight exposure to the energy sector, as well as stock selection in the communication services sector, detracted from relative returns. Finally, the Fund’s underweight position in the real estate sector, and not having exposure to the utilities sector, were relative detractors from the Fund’s performance.
| Portfolio Composition |
| By sector % of total net assets |
| Information Technology | 25.72% |
| Health Care | 23.14 |
| Industrials | 16.92 |
| Consumer Discretionary | 15.67 |
| Financials | 6.63 |
| Materials | 2.78 |
| Communication Services | 2.55 |
| Consumer Staples | 2.11 |
| Other Sectors, Each Less than 2% of Net Assets | 2.67 |
| Money Market Funds Plus Other Assets Less Liabilities | 1.81 |
| Top 10 Equity Holdings* |
| % of total net assets |
| 1. | Black Knight, Inc. | 1.69% |
| 2. | Aerojet Rocketdyne Holdings, Inc. | 1.67 |
| 3. | Trex Co., Inc. | 1.66 |
| 4. | Casella Waste Systems, Inc., Class A | 1.64 |
| 5. | HubSpot, Inc. | 1.58 |
| 6. | Brink’s Co. (The) | 1.57 |
| 7. | Repligen Corp. | 1.55 |
| 8. | Rapid7, Inc. | 1.54 |
| 9. | Lattice Semiconductor Corp. | 1.45 |
| 10. | IAA, Inc. | 1.43 |
| Total Net Assets | $545.8 million |
| Total Number of Holdings* | 104 |
| The Fund’s holdings are subject to change, and there is no assurance that the Fund will continue to hold any particular security. |
| *Excluding money market fund holdings. |
| Data presented here are as of August 31, 2019. |
| 4 | Invesco Small Cap Discovery Fund |
During the fiscal year,Lattice Semiconductor was the leading contributor to performance on an absolute basis. The IT company is based in Hillsboro, Oregon and manufactures high-performance programmable logic devices. The company underwent management changes that were well-regarded and its new management team has instituted a number of initiatives to expand its profitability, including exiting less important segments, price optimization and cost reductions.
Within the IT sector,Universal Display was the leading contributor to the Fund’s performance relative to the style-specific benchmark for the fiscal year. Universal Display develops and manufactures organic light-emitting diodes (OLED) technologies and materials. The company benefited as smartphones began upgrading from liquid crystal display screens to OLED screens. Universal Display also rallied behind optimism surrounding foldable OLED cellphones, and expanded its customer list for its core materials and intellectual property in OLED.
Within the consumer discretionary sector,Planet Fitnesswas the leading absolute contributor to the Fund’s performance for the fiscal year. The New Hampshire-based fitness company surpassed revenue and earnings estimates due to strong franchise and membership growth. The company’s equipment segment also benefited from its franchise growth as new locations were opened. Same-store sales also increased over the fiscal year as its high profit, low-cost business model provided stability during periods of market volatility.
Although the health care sector was an overall contributor to the Fund’s performance relative to the style-specific benchmark for the fiscal year,Inogen was the leading individual detractor on an absolute basis. Inogen sells portable oxygen machines to consumers and medical distributors. The company’s product is considered best-in-class compared to competing oxygenators. Inogen sold off after it consecutively reported weaker-than-expected quarterly results and company management suggested slower growth for future earnings. We sold our position in the stock before the close of the fiscal year.
During the fiscal year, the leading individual detractor from the Fund’s performance versus the style-specific benchmark was energy sector constituent,Centennial Resource Development. The Denver-based independent oil producer has assets in the core of the Delaware Basin, which is a sub-basin of the Perm-
ian Basin in West Texas. The stock struggled as a result of a lower growth outlook and a significant deviation in its oil development plan due to oil price volatility. We sold our position in Centennial Resource Development during the fiscal year.
The IT sector was an overall contributor to the Fund’s performance relative to the style-specific benchmark for the fiscal year. However, educational technology company2U was the leading relative detractor from the Fund’s performance. 2U partners with colleges and universities to offer online degree programs. The company has struggled for several reasons, including higher student selectivity among its partner schools, lower application submissions and a delay in the rollout of a major MBA program launch.
We wish to remind you that all positioning changes are based on a bottom-up stock selection process. Our portfolio construction is designed to manage risk and ensure alignment with small-cap market sector exposure within modest over- and underweights. At the close of the fiscal year, the Fund’s underweight exposures relative to the Russell 2000 Growth Index were to the health care, real estate, industrials, utilities, consumer staples and materials sectors. Conversely, the Fund’s overweight exposures relative to the Russell 2000 Growth Index were to the IT, consumer discretionary, financials, energy and communication services sectors.
At the close of the fiscal year, our view was that the growth environment is slowing as the benefits of the Tax Cuts and Jobs Act of 2017 and deregulations were offset by rising labor costs and trade pressures. In such an environment, true growth will likely remain scarce, and we believe the market will favor companies that can produce sustainable, above-average earnings and cash flow growth in spite of the economic cycle. Stocks may remain volatile and we caution investors against making investment decisions based on short-term performance.
On June 21, 2019, Juan Hartsfield replaced Matthew Hart as lead manager of Invesco Small Cap Discovery Fund and Clay Manley became co-manager along with existing co-manager Justin Sander.
We thank you for your commitment to the Invesco Small Cap Discovery Fund.
| 2 | Source: US Federal Reserve |
The views and opinions expressed in management’s discussion of Fund performance are those of Invesco Advisers, Inc. These views and opinions are
subject to change at any time based on factors such as market and economic conditions. These views and opinions may not be relied upon as investment advice or recommendations, or as an offer for a particular security. The information is not a complete analysis of every aspect of any market, country, industry, security or the Fund. Statements of fact are from sources considered reliable, but Invesco Advisers, Inc. makes no representation or warranty as to their completeness or accuracy. Although historical performance is no guarantee of future results, these insights may help you understand our investment management philosophy.
See important Fund and, if applicable, index disclosures later in this report.
Juan Hartsfield
Chartered Financial Analyst, Portfolio Manager, is lead manager of Invesco Small Cap Discovery Fund. He joined Invesco in 2004. Mr. Hartsfield earned a BS in petroleum engineering from The University of Texas at Austin and an MBA from the University of Michigan.
Clay Manley
Chartered Financial Analyst, Portfolio Manager, is manager of Invesco Small Cap Discovery Fund. He joined Invesco in 2001. Mr. Manley earned a BA with cum laude honors in history and geology from Vanderbilt University and an MBA with concentrations in finance and accounting from the Goizueta Business School at Emory University.
Justin Sander
Chartered Financial Analyst, Portfolio Manager, is manager of Invesco Small Cap Discovery Fund. He joined Invesco in 2013. Mr. Sander earned a BBA degree in finance from Texas State University and an MBA with a specialization in investments from the McCombs School of Business at The University of Texas at Austin.
| 5 | Invesco Small Cap Discovery Fund |
Your Fund’s Long-Term Performance
Results of a $10,000 Investment — Oldest Share Class(es)
Fund and index data from 8/31/09
| 1 | Source: Lipper Inc. |
| 2 | Source: RIMES Technologies Corp. |
Past performance cannot guarantee comparable future results.
The data shown in the chart include reinvested distributions, applicable sales charges and Fund expenses including
management fees. Index results include reinvested dividends, but they do not reflect sales charges. Performance of the peer group, if applicable, reflects fund expenses and management fees; perfor-
mance of a market index does not. Performance shown in the chart and table(s) does not reflect deduction of taxes a shareholder would pay on Fund distributions or sale of Fund shares.
| 6 | Invesco Small Cap Discovery Fund |
| Average Annual Total Returns |
| As of 8/31/19, including maximum applicable sales charges |
| Class A Shares | |
| Inception (11/27/00) | 5.42% |
| 10 Years | 12.17 |
| 5 Years | 8.15 |
| 1 Year | –7.76 |
| Class C Shares | |
| Inception (11/27/00) | 5.32% |
| 10 Years | 11.97 |
| 5 Years | 8.60 |
| 1 Year | –3.88 |
| Class Y Shares | |
| Inception (2/2/06) | 8.29% |
| 10 Years | 13.09 |
| 5 Years | 9.64 |
| 1 Year | –2.17 |
| Class R5 Shares | |
| 10 Years | 13.13% |
| 5 Years | 9.82 |
| 1 Year | –2.13 |
| Class R6 Shares | |
| 10 Years | 13.16% |
| 5 Years | 9.88 |
| 1 Year | –2.04 |
| Performance includes litigation proceeds. Had these proceeds not been received, total returns would have been lower. |
Effective June 1, 2010, Class A, Class C and Class I shares of the predecessor fund, Van Kampen Small Cap Growth Fund, advised by Van Kampen Asset Management were reorganized into Class A, Class C and Class Y shares, respectively, of Invesco Van Kampen Small Cap Growth Fund (renamed Invesco Small Cap Discovery Fund). Returns shown above, prior to June 1, 2010, for Class A, Class C and Class Y shares are blended returns of the predecessor fund and Invesco Small Cap Discovery Fund. Share class returns will differ from the predecessor fund because of different expenses.
Class R5 shares incepted on September 24, 2012. Performance shown prior to that date is that of the Fund’s and the predecessor fund’s Class A shares and includes the 12b-1 fees applicable to Class A shares.
Class R6 shares incepted on September 24, 2012. Performance shown prior to that date is that of the Fund’s and the predecessor fund’s Class A shares and includes the 12b-1 fees applicable to Class A shares.
| Average Annual Total Returns |
| As of 6/30/19, the most recent calendar quarter end, including maximum applicable sales charges |
| Class A Shares | |
| Inception (11/27/00) | 5.51% |
| 10 Years | 12.86 |
| 5 Years | 8.06 |
| 1 Year | 1.03 |
| Class C Shares | |
| Inception (11/27/00) | 5.40% |
| 10 Years | 12.69 |
| 5 Years | 8.53 |
| 1 Year | 5.51 |
| Class Y Shares | |
| Inception (2/2/06) | 8.45% |
| 10 Years | 13.80 |
| 5 Years | 9.58 |
| 1 Year | 7.25 |
| Class R5 Shares | |
| 10 Years | 13.83% |
| 5 Years | 9.77 |
| 1 Year | 7.34 |
| Class R6 Shares | |
| 10 Years | 13.86% |
| 5 Years | 9.82 |
| 1 Year | 7.49 |
| Performance includes litigation proceeds. Had these proceeds not been received, total returns would have been lower. |
The performance data quoted represent past performance and cannot guarantee comparable future results; current performance may be lower or higher. Please visit invesco.com/performance for the most recent month-end performance. Performance figures reflect reinvested distributions, changes in net asset value and the effect of the maximum sales charge unless otherwise stated. Investment return and principal value will fluctuate so that you may have a gain or loss when you sell shares.
The total annual Fund operating expense ratio set forth in the most recent Fund prospectus as of the date of this report for Class A, Class C, Class Y, Class R5 and Class R6 shares was 1.37%, 2.08%, 1.12%, 0.98% and 0.89%, respectively. The expense ratios presented above may vary from the expense ratios presented in other sections of this report that are based on expenses incurred during the period covered by this report.
Class A share performance reflects the maximum 5.50% sales charge, and Class C share performance reflects the
applicable contingent deferred sales charge (CDSC) for the period involved. The CDSC on Class C shares is 1% for the first year after purchase. Class Y, Class R5 and Class R6 shares do not have a front-end sales charge or a CDSC; therefore, performance is at net asset value.
The performance of the Fund’s share classes will differ primarily due to different sales charge structures and class expenses.
Fund performance reflects any applicable fee waivers and/or expense reimbursements. Had the adviser not waived fees and/or reimbursed expenses currently or in the past, returns would have been lower. See current prospectus for more information.
| 7 | Invesco Small Cap Discovery Fund |
Invesco Small Cap Discovery Fund’s investment objective is to seek capital appreciation.
| ■ | Unless otherwise stated, information presented in this report is as of August 31, 2019, and is based on total net assets. |
| ■ | Unless otherwise noted, all data provided by Invesco. |
| ■ | To access your Fund’s reports/prospectus, visit invesco.com/fundreports. |
About share classes
| ■ | Class Y shares are available only to certain investors. Please see the prospectus for more information. |
| ■ | Class R5 shares andClass R6 shares are available for use by retirement plans that meet certain standards and for institutional investors. Class R6 shares are also available through intermediaries that have established an agreement with Invesco Distributors, Inc. to make such shares available for use in retail omnibus accounts. Please see the prospectus for more information. |
Principal risks of investing in the Fund
| ■ | Foreign securities risk.The Fund’s foreign investments may be adversely affected by political and social instability, changes in economic or taxation policies, difficulty in enforcing obligations, decreased liquidity or increased volatility. Foreign investments also involve the risk of the possible seizure, nationalization or expropriation of the issuer or foreign deposits (in which the Fund could lose its entire investments in a certain market) and the possible adoption of foreign governmental restrictions such as exchange controls. Unless the Fund has hedged its foreign securities risk, foreign securities risk also involves the risk of negative foreign currency rate fluctuations, which may cause the value of securities denominated in such foreign currency (or other instruments through which the Fund has exposure to foreign currencies) to decline in value. Currency exchange rates may fluctuate significantly over short periods of time. Currency hedging strategies, if used, are not always successful. |
| ■ | Growth investing risk.Growth stocks tend to be more expensive relative to the issuing company’s earnings or assets compared with other types of stock. As a result, they tend to be |
| | more sensitive to changes in, or investors’ expectations of, the issuing company’s earnings and can be more volatile. |
| ■ | Initial public offerings (IPO) risk.The prices of IPO securities often fluctuate more than prices of securities of companies with longer trading histories and sometimes experience significant price drops shortly after their initial issuance. In addition, companies offering securities in IPOs may have less experienced management or limited operating histories. |
| ■ | Management risk.The Fund is actively managed and depends heavily on the Adviser’s judgment about markets, interest rates or the attractiveness, relative values, liquidity, or potential appreciation of particular investments made for the Fund’s portfolio. The Fund could experience losses if these judgments prove to be incorrect. Additionally, legislative, regulatory, or tax developments may adversely affect management of the Fund and, therefore, the ability of the Fund to achieve its investment objective. |
| ■ | Market risk.The market values of the Fund’s investments, and therefore the value of the Fund’s shares, will go up and down, sometimes rapidly or unpredictably. Market risk may affect a single issuer, industry or section of the economy, or it may affect the market as a whole. Individual stock prices tend to go up and down more dramatically than those of certain other types of investments, such as bonds. During a general downturn in the financial markets, multiple asset classes may decline in value. When markets perform well, there can be no assurance that specific investments held by the Fund will rise in value. |
| ■ | Sector focus risk.The Fund may from time to time invest a significant amount of its assets (i.e. over 25%) in one market sector or group of related industries. In this event, the Fund’s performance will depend to a greater extent on the overall condition of the sector or group of industries and |
| | there is increased risk that the Fund will lose significant value if conditions adversely affect that sector or group of industries. |
| ■ | Small- and mid-capitalization companies risks.Small- and mid-capitalization companies tend to be more vulnerable to changing market conditions, may have little or no operating history or track record of success, and may have more limited product lines and markets, less experienced management and fewer financial resources than larger companies. These companies’ securities may be more volatile and less liquid than those of more established companies, and their returns may vary, sometimes significantly, from the overall securities market. |
About indexes used in this report
| ■ | TheS&P 500® Index is an unmanaged index considered representative of the US stock market. |
| ■ | TheRussell 2000® Growth Index is an unmanaged index considered representative of small-cap growth stocks. The Russell 2000 Growth Index is a trademark/service mark of the Frank Russell Co. Russell® is a trademark of the Frank Russell Co. |
| ■ | TheLipper Small-Cap Growth Funds Index is an unmanaged index considered representative of small-cap growth funds tracked by Lipper. |
| ■ | The Fund is not managed to track the performance of any particular index, including the index(es) described here, and consequently, the performance of the Fund may deviate significantly from the performance of the index(es). |
| ■ | A direct investment cannot be made in an index. Unless otherwise indicated, index results include reinvested dividends, and they do not reflect sales charges. Performance of the peer group, if applicable, reflects fund expenses; performance of a market index does not. |
This report must be accompanied or preceded by a currently effective Fund prospectus, which contains more complete information, including sales charges and expenses. Investors should read it carefully before investing.
NOT FDIC INSURED | MAY LOSE VALUE | NO BANK GUARANTEE
| 8 | Invesco Small Cap Discovery Fund |
Other information
| ■ | The returns shown in management’s discussion of Fund performance are based on net asset values (NAVs) calculated for shareholder transactions. Generally accepted accounting principles require adjustments to be made to the net assets of the Fund at period end for financial reporting purposes, and as such, the NAVs for shareholder transactions and the returns based on those NAVs may differ from the NAVs and returns reported in the Financial Highlights. |
| ■ | Industry classifications used in this report are generally according to the Global Industry Classification Standard, which was developed by and is the exclusive property and a service mark of MSCI Inc. and Standard & Poor’s. |
| 9 | Invesco Small Cap Discovery Fund |
Schedule of Investments(a)
August 31, 2019
| | Shares | Value |
| Common Stocks & Other Equity Interests–98.19% |
| Aerospace & Defense–4.44% |
| Aerojet Rocketdyne Holdings, Inc.(b) | 174,617 | $9,120,246 |
| BWX Technologies, Inc. | 47,563 | 2,815,730 |
| Cubic Corp. | 70,275 | 4,867,949 |
| Mercury Systems, Inc.(b) | 86,497 | 7,406,738 |
| | | | 24,210,663 |
| Alternative Carriers–0.82% |
| Iridium Communications, Inc.(b) | 185,991 | 4,497,262 |
| Apparel, Accessories & Luxury Goods–0.39% |
| G-III Apparel Group Ltd.(b) | 103,224 | 2,117,124 |
| Application Software–9.87% |
| Anaplan, Inc.(b) | 89,476 | 4,861,231 |
| Blackline, Inc.(b) | 84,393 | 4,298,136 |
| Guidewire Software, Inc.(b) | 54,791 | 5,269,798 |
| HubSpot, Inc.(b) | 43,064 | 8,599,020 |
| Q2 Holdings, Inc.(b) | 62,364 | 5,609,642 |
| RealPage, Inc.(b) | 119,778 | 7,626,265 |
| Trade Desk, Inc. (The), Class A(b) | 16,820 | 4,133,851 |
| Tyler Technologies, Inc.(b) | 25,919 | 6,649,260 |
| Zendesk, Inc.(b) | 84,861 | 6,805,852 |
| | | | 53,853,055 |
| Asset Management & Custody Banks–0.52% |
| Blucora, Inc.(b) | 125,567 | 2,835,303 |
| Auto Parts & Equipment–1.17% |
| Fox Factory Holding Corp.(b) | 88,413 | 6,369,272 |
| Biotechnology–5.70% |
| Amicus Therapeutics, Inc.(b) | 320,028 | 3,165,077 |
| Coherus Biosciences, Inc.(b)(c) | 176,734 | 3,921,728 |
| Eagle Pharmaceuticals, Inc.(b) | 52,929 | 2,984,666 |
| Neurocrine Biosciences, Inc.(b) | 57,629 | 5,729,475 |
| Repligen Corp.(b) | 91,208 | 8,465,015 |
| Sage Therapeutics, Inc.(b) | 21,875 | 3,755,281 |
| Sarepta Therapeutics, Inc.(b) | 34,136 | 3,077,360 |
| | | | 31,098,602 |
| Brewers–1.33% |
| Boston Beer Co., Inc. (The), Class A(b) | 16,525 | 7,244,890 |
| Building Products–1.66% |
| Trex Co., Inc.(b) | 106,214 | 9,084,483 |
| Casinos & Gaming–0.95% |
| Penn National Gaming, Inc.(b) | 270,886 | 5,192,885 |
| Construction Materials–1.36% |
| Summit Materials, Inc., Class A(b) | 352,781 | 7,401,345 |
| | Shares | Value |
| Consumer Finance–0.49% |
| Green Dot Corp., Class A(b) | 86,717 | $2,651,806 |
| Data Processing & Outsourced Services–2.66% |
| Black Knight, Inc.(b) | 148,474 | 9,242,506 |
| Euronet Worldwide, Inc.(b) | 34,350 | 5,260,359 |
| | | | 14,502,865 |
| Distributors–1.20% |
| Pool Corp. | 33,499 | 6,578,534 |
| Diversified Support Services–2.20% |
| IAA, Inc.(b) | 159,529 | 7,792,992 |
| KAR Auction Services, Inc. | 159,529 | 4,237,090 |
| | | | 12,030,082 |
| Education Services–3.58% |
| Bright Horizons Family Solutions, Inc.(b) | 36,397 | 6,007,325 |
| Chegg, Inc.(b) | 94,964 | 3,764,373 |
| Grand Canyon Education, Inc.(b) | 46,587 | 5,851,327 |
| Strategic Education, Inc. | 23,282 | 3,940,013 |
| | | | 19,563,038 |
| Electrical Components & Equipment–0.42% |
| Generac Holdings, Inc.(b) | 29,121 | 2,271,147 |
| Electronic Components–0.68% |
| II-VI, Inc.(b) | 98,815 | 3,706,551 |
| Electronic Equipment & Instruments–1.75% |
| FLIR Systems, Inc. | 108,268 | 5,334,365 |
| OSI Systems, Inc.(b) | 40,431 | 4,245,659 |
| | | | 9,580,024 |
| Environmental & Facilities Services–1.64% |
| Casella Waste Systems, Inc., Class A(b) | 196,863 | 8,957,266 |
| Financial Exchanges & Data–2.17% |
| Cboe Global Markets, Inc. | 53,900 | 6,422,724 |
| Morningstar, Inc. | 33,480 | 5,409,698 |
| | | | 11,832,422 |
| General Merchandise Stores–0.59% |
| Ollie’s Bargain Outlet Holdings, Inc.(b) | 58,190 | 3,226,635 |
| Health Care Equipment–6.56% |
| DexCom, Inc.(b) | 22,066 | 3,786,746 |
| Hill-Rom Holdings, Inc. | 41,697 | 4,489,933 |
| Insulet Corp.(b) | 46,681 | 7,196,810 |
| Integra LifeSciences Holdings Corp.(b) | 89,846 | 5,392,557 |
| LivaNova PLC(b) | 66,317 | 5,148,189 |
| Masimo Corp.(b) | 32,264 | 4,944,458 |
| Penumbra, Inc.(b) | 33,243 | 4,838,518 |
| | | | 35,797,211 |
See accompanying Notes to Financial Statements which are an integral part of the financial statements.
| 10 | Invesco Small Cap Discovery Fund |
| | Shares | Value |
| Health Care REITs–0.68% |
| Physicians Realty Trust | 213,386 | �� $3,695,846 |
| Health Care Services–2.50% |
| BioTelemetry, Inc.(b) | 82,619 | 3,275,843 |
| LHC Group, Inc.(b) | 62,923 | 7,456,376 |
| Premier, Inc., Class A(b) | 82,326 | 2,902,815 |
| | | | 13,635,034 |
| Health Care Supplies–2.99% |
| Haemonetics Corp.(b) | 36,490 | 4,872,510 |
| ICU Medical, Inc.(b) | 17,580 | 2,843,565 |
| Lantheus Holdings, Inc.(b) | 161,512 | 3,514,501 |
| Neogen Corp.(b) | 72,104 | 5,084,774 |
| | | | 16,315,350 |
| Health Care Technology–0.44% |
| HMS Holdings Corp.(b) | 66,302 | 2,422,012 |
| Industrial Machinery–4.00% |
| Altra Industrial Motion Corp. | 204,987 | 5,327,612 |
| Crane Co. | 54,928 | 4,187,711 |
| Gardner Denver Holdings, Inc.(b) | 128,496 | 3,685,265 |
| Graco, Inc. | 83,716 | 3,814,938 |
| Welbilt, Inc.(b) | 306,900 | 4,830,606 |
| | | | 21,846,132 |
| Interactive Home Entertainment–0.71% |
| Take-Two Interactive Software, Inc.(b) | 29,348 | 3,873,056 |
| Internet & Direct Marketing Retail–0.83% |
| Etsy, Inc.(b) | 86,218 | 4,551,448 |
| Investment Banking & Brokerage–1.77% |
| E*TRADE Financial Corp. | 82,088 | 3,426,353 |
| LPL Financial Holdings, Inc. | 83,092 | 6,227,745 |
| | | | 9,654,098 |
| IT Consulting & Other Services–2.32% |
| Booz Allen Hamilton Holding Corp. | 65,457 | 4,942,658 |
| EPAM Systems, Inc.(b) | 10,152 | 1,942,382 |
| KBR, Inc. | 225,944 | 5,766,091 |
| | | | 12,651,131 |
| Leisure Facilities–0.98% |
| Planet Fitness, Inc., Class A(b) | 75,672 | 5,343,200 |
| Leisure Products–0.77% |
| Brunswick Corp. | 90,138 | 4,200,431 |
| Life Sciences Tools & Services–2.40% |
| Bio-Techne Corp. | 36,020 | 6,900,352 |
| Syneos Health, Inc.(b) | 117,672 | 6,181,310 |
| | | | 13,081,662 |
| Managed Health Care–0.71% |
| HealthEquity, Inc.(b) | 65,032 | 3,860,300 |
| | Shares | Value |
| Metal & Glass Containers–0.74% |
| Berry Global Group, Inc.(b) | 103,042 | $4,033,064 |
| Movies & Entertainment–1.02% |
| World Wrestling Entertainment, Inc., Class A | 77,862 | 5,561,683 |
| Multi-line Insurance–1.02% |
| Assurant, Inc. | 45,126 | 5,550,498 |
| Oil & Gas Exploration & Production–1.15% |
| Parsley Energy, Inc., Class A(b) | 352,072 | 6,305,610 |
| Packaged Foods & Meats–0.79% |
| Lancaster Colony Corp. | 29,456 | 4,297,630 |
| Pharmaceuticals–1.85% |
| Catalent, Inc.(b) | 104,611 | 5,517,184 |
| GW Pharmaceuticals PLC, ADR (United Kingdom)(b) | 32,123 | 4,574,637 |
| | | | 10,091,821 |
| Property & Casualty Insurance–0.67% |
| Hanover Insurance Group, Inc. (The) | 27,395 | 3,647,644 |
| Research & Consulting Services–0.98% |
| CoStar Group, Inc.(b) | 8,721 | 5,362,281 |
| Restaurants–3.45% |
| Dunkin’ Brands Group, Inc. | 70,512 | 5,813,009 |
| Texas Roadhouse, Inc. | 51,517 | 2,651,065 |
| Wendy’s Co. (The) | 256,171 | 5,635,762 |
| Wingstop, Inc. | 47,085 | 4,716,505 |
| | | | 18,816,341 |
| Security & Alarm Services–1.57% |
| Brink’s Co. (The) | 113,834 | 8,566,008 |
| Semiconductor Equipment–1.41% |
| Entegris, Inc. | 180,355 | 7,724,605 |
| Semiconductors–4.51% |
| Lattice Semiconductor Corp.(b) | 400,666 | 7,889,114 |
| Monolithic Power Systems, Inc. | 42,414 | 6,385,852 |
| Silicon Laboratories, Inc.(b) | 43,057 | 4,693,213 |
| Universal Display Corp. | 27,439 | 5,637,891 |
| | | | 24,606,070 |
| Specialized Consumer Services–0.84% |
| ServiceMaster Global Holdings, Inc.(b) | 80,706 | 4,603,470 |
| Specialized REITs–0.83% |
| CoreSite Realty Corp. | 39,000 | 4,531,020 |
| Specialty Chemicals–0.68% |
| Ingevity Corp.(b) | 48,934 | 3,727,303 |
| Specialty Stores–0.91% |
| Five Below, Inc.(b) | 40,527 | 4,979,552 |
See accompanying Notes to Financial Statements which are an integral part of the financial statements.
| 11 | Invesco Small Cap Discovery Fund |
| | Shares | Value |
| Systems Software–2.52% |
| Qualys, Inc.(b) | 66,962 | $5,331,515 |
| Rapid7, Inc.(b) | 156,960 | 8,427,182 |
| | | | 13,758,697 |
| Total Common Stocks & Other Equity Interests (Cost $422,585,157) | 535,895,462 |
| Money Market Funds–1.81% |
| Invesco Government & Agency Portfolio, Institutional Class, 2.02%(d) | 3,452,117 | 3,452,118 |
| Invesco Liquid Assets Portfolio, Institutional Class, 2.14%(d) | 2,465,975 | 2,466,961 |
| Invesco Treasury Portfolio, Institutional Class, 1.98%(d) | 3,945,277 | 3,945,277 |
| Total Money Market Funds (Cost $9,864,179) | 9,864,356 |
| TOTAL INVESTMENTS IN SECURITIES (excluding investments purchased with cash collateral from securities on loan)-100.00% (Cost $432,449,336) | | | $545,759,818 |
| | Shares | Value |
| Investments Purchased with Cash Collateral from Securities on Loan |
| Money Market Funds–0.31% |
| Invesco Government & Agency Portfolio, Institutional Class, 2.02%(d)(e) | 1,270,276 | $1,270,276 |
| Invesco Liquid Assets Portfolio, Institutional Class, 2.14%(d)(e) | 423,256 | 423,425 |
| Total Investments Purchased with Cash Collateral from Securities on Loan (Cost $1,693,701) | 1,693,701 |
| TOTAL INVESTMENTS IN SECURITIES–100.31% (Cost $434,143,037) | 547,453,519 |
| OTHER ASSETS LESS LIABILITIES—(0.31)% | (1,698,417) |
| NET ASSETS–100.00% | $545,755,102 |
Investment Abbreviations:
| ADR | – American Depositary Receipt |
| REIT | – Real Estate Investment Trust |
Notes to Schedule of Investments:
| (a) | Industry and/or sector classifications used in this report are generally according to the Global Industry Classification Standard, which was developed by and is the exclusive property and a service mark of MSCI Inc. and Standard & Poor’s. |
| (b) | Non-income producing security. |
| (c) | All or a portion of this security was out on loan at August 31, 2019. |
| (d) | The money market fund and the Fund are affiliated by having the same investment adviser. The rate shown is the 7-day SEC standardized yield as of August 31, 2019. |
| (e) | The security has been segregated to satisfy the commitment to return the cash collateral received in securities lending transactions upon the borrower’s return of the securities loaned. See Note 1I. |
See accompanying Notes to Financial Statements which are an integral part of the financial statements.
| 12 | Invesco Small Cap Discovery Fund |
Statement of Assets and Liabilities
August 31, 2019
| Assets: | |
Investments in securities, at value
(Cost $422,585,157)* | $535,895,462 |
| Investments in affiliated money market funds, at value (Cost $11,557,880) | 11,558,057 |
| Receivable for: | |
| Dividends | 224,530 |
| Fund shares sold | 483,824 |
| Investments sold | 2,927,087 |
| Investment for trustee deferred compensation and retirement plans | 120,169 |
| Other assets | 24,245 |
| Total assets | 551,233,374 |
| Liabilities: | |
| Payable for: | |
| Investments purchased | 2,365,856 |
| Fund shares reacquired | 408,645 |
| Amount due custodian | 375,130 |
| Collateral upon return of securities loaned | 1,693,701 |
| Accrued fees to affiliates | 398,062 |
| Accrued trustees’ and officers’ fees and benefits | 3,250 |
| Accrued other operating expenses | 102,035 |
| Trustee deferred compensation and retirement plans | 131,593 |
| Total liabilities | 5,478,272 |
| Net assets applicable to shares outstanding | $545,755,102 |
| Net assets consist of: | |
| Shares of beneficial interest | $359,465,038 |
| Distributable earnings | 186,290,064 |
| | $545,755,102 |
| Net Assets: |
| Class A | $372,768,909 |
| Class C | $21,180,275 |
| Class Y | $52,510,776 |
| Class R5 | $41,252,136 |
| Class R6 | $58,043,006 |
| Shares outstanding, no par value, with an unlimited number of shares authorized: |
| Class A | 38,605,633 |
| Class C | 3,151,031 |
| Class Y | 5,043,781 |
| Class R5 | 3,893,738 |
| Class R6 | 5,452,826 |
| Class A: | |
| Net asset value per share | $9.66 |
Maximum offering price per share
(Net asset value of $9.66 ÷ 94.50%) | $10.22 |
| Class C: | |
| Net asset value and offering price per share | $6.72 |
| Class Y: | |
| Net asset value and offering price per share | $10.41 |
| Class R5: | |
| Net asset value and offering price per share | $10.59 |
| Class R6: | |
| Net asset value and offering price per share | $10.64 |
| * | At August 31, 2019, securities with an aggregate value of $1,657,694 were on loan to brokers. |
See accompanying Notes to Financial Statements which are an integral part of the financial statements.
| 13 | Invesco Small Cap Discovery Fund |
Statement of Operations
For the year ended August 31, 2019
| Investment income: | |
| Dividends (net of foreign withholding taxes of $4,466) | $2,525,830 |
| Dividends from affiliated money market funds (includes securities lending income of $471,816) | 879,479 |
| Total investment income | 3,405,309 |
| Expenses: | |
| Advisory fees | 4,673,540 |
| Administrative services fees | 107,872 |
| Custodian fees | 11,618 |
| Distribution fees: | |
| Class A | 906,795 |
| Class C | 278,681 |
| Transfer agent fees — A, C and Y | 1,059,659 |
| Transfer agent fees — R5 | 46,688 |
| Transfer agent fees — R6 | 6,192 |
| Trustees’ and officers’ fees and benefits | 28,889 |
| Registration and filing fees | 89,597 |
| Reports to shareholders | 62,816 |
| Professional services fees | 62,069 |
| Other | 19,108 |
| Total expenses | 7,353,524 |
| Less: Fees waived and/or expense offset arrangement(s) | (26,524) |
| Net expenses | 7,327,000 |
| Net investment income (loss) | (3,921,691) |
| Realized and unrealized gain (loss) from: | |
| Net realized gain from Investment securities (includes net gains from securities sold to affiliates of $138,067) | 92,020,252 |
| Change in net unrealized appreciation (depreciation) of Investment securities | (111,372,515) |
| Net realized and unrealized gain (loss) | (19,352,263) |
| Net increase (decrease) in net assets resulting from operations | $(23,273,954) |
See accompanying Notes to Financial Statements which are an integral part of the financial statements.
| 14 | Invesco Small Cap Discovery Fund |
Statement of Changes in Net Assets
For the years ended August 31, 2019 and 2018
| | 2019 | 2018 |
| Operations: | | |
| Net investment income (loss) | $(3,921,691) | $(4,963,701) |
| Net realized gain | 92,020,252 | 90,076,992 |
| Change in net unrealized appreciation (depreciation) | (111,372,515) | 83,380,295 |
| Net increase (decrease) in net assets resulting from operations | (23,273,954) | 168,493,586 |
| Distributions to shareholders from distributable earnings(1): | | |
| Class A | (50,304,891) | (48,027,547) |
| Class B | — | (291,638) |
| Class C | (7,298,136) | (6,961,591) |
| Class Y | (10,688,318) | (13,692,566) |
| Class R5 | (5,946,663) | (3,141,297) |
| Class R6 | (10,572,174) | (9,838,633) |
| Total distributions from distributable earnings | (84,810,182) | (81,953,272) |
| Share transactions–net: | | |
| Class A | 26,424,728 | 7,305,397 |
| Class B | — | (2,229,770) |
| Class C | (12,670,255) | 2,295,245 |
| Class Y | (24,728,221) | (17,083,313) |
| Class R5 | (1,587,130) | 20,759,143 |
| Class R6 | (22,176,330) | 3,449,059 |
| Net increase (decrease) in net assets resulting from share transactions | (34,737,208) | 14,495,761 |
| Net increase (decrease) in net assets | (142,821,344) | 101,036,075 |
| Net assets: | | |
| Beginning of year | 688,576,446 | 587,540,371 |
| End of year | $545,755,102 | $688,576,446 |
| (1) | The Securities and Exchange Commission eliminated the requirement to disclose distribution components separately, except for tax return of capital. For the year ended August 31, 2018, distributions to shareholders from distributable earnings consisted of distributions from net realized gains. |
See accompanying Notes to Financial Statements which are an integral part of the financial statements.
| 15 | Invesco Small Cap Discovery Fund |
Financial Highlights
August 31, 2019
The following schedule presents financial highlights for a share of the Fund outstanding throughout the periods indicated.
| | Net asset
value,
beginning
of period | Net
investment
income
(loss)(a) | Net gains
(losses)
on securities
(both
realized and
unrealized) | Total from
investment
operations | Distributions
from net
realized
gains | Net asset
value, end
of period | Total
return(b) | Net assets,
end of period
(000’s omitted) | Ratio of
expenses
to average
net assets
with fee waivers
and/or
expenses
absorbed | Ratio of
expenses
to average net
assets without
fee waivers
and/or
expenses
absorbed | Ratio of net
investment
income
(loss)
to average
net assets | Portfolio
turnover(c) |
| Class A |
| Year ended 08/31/19 | $11.74 | $(0.07) | $(0.52)(d) | $(0.59) | $(1.49) | $9.66 | (2.42)%(d) | $372,769 | 1.33%(e) | 1.33%(e) | (0.75)%(e) | 74% |
| Year ended 08/31/18 | 10.38 | (0.09)(f) | 2.98 | 2.89 | (1.53) | 11.74 | 31.26 | 410,080 | 1.36 | 1.36 | (0.89)(f) | 49 |
| Year ended 08/31/17 | 9.05 | (0.08) | 1.58 | 1.50 | (0.17) | 10.38 | 16.87 | 351,214 | 1.39 | 1.39 | (0.88) | 39 |
| Year ended 08/31/16 | 10.60 | (0.08) | (0.02) | (0.10) | (1.45) | 9.05 | (0.61) | 439,098 | 1.36 | 1.37 | (0.89) | 39 |
| Year ended 08/31/15 | 11.83 | (0.09) | 0.61 | 0.52 | (1.75) | 10.60 | 5.24 | 512,763 | 1.32 | 1.32 | (0.85) | 63 |
| Class C |
| Year ended 08/31/19 | 8.78 | (0.10) | (0.47)(d) | (0.57) | (1.49) | 6.72 | (3.12)(d)(g) | 21,180 | 2.03(e)(g) | 2.03(e)(g) | (1.45)(e)(g) | 74 |
| Year ended 08/31/18 | 8.18 | (0.13)(f) | 2.26 | 2.13 | (1.53) | 8.78 | 30.23(g) | 44,642 | 2.07(g) | 2.07(g) | (1.60)(f)(g) | 49 |
| Year ended 08/31/17 | 7.21 | (0.12) | 1.26 | 1.14 | (0.17) | 8.18 | 16.16(g) | 38,679 | 2.13(g) | 2.13(g) | (1.62)(g) | 39 |
| Year ended 08/31/16 | 8.81 | (0.12) | (0.03) | (0.15) | (1.45) | 7.21 | (1.39)(g) | 47,459 | 2.08(g) | 2.09(g) | (1.61)(g) | 39 |
| Year ended 08/31/15 | 10.19 | (0.15) | 0.52 | 0.37 | (1.75) | 8.81 | 4.50 | 62,773 | 2.07 | 2.07 | (1.60) | 63 |
| Class Y |
| Year ended 08/31/19 | 12.48 | (0.05) | (0.53)(d) | (0.58) | (1.49) | 10.41 | (2.17)(d) | 52,511 | 1.08(e) | 1.08(e) | (0.50)(e) | 74 |
| Year ended 08/31/18 | 10.93 | (0.07)(f) | 3.15 | 3.08 | (1.53) | 12.48 | 31.44 | 91,973 | 1.11 | 1.11 | (0.64)(f) | 49 |
| Year ended 08/31/17 | 9.49 | (0.06) | 1.67 | 1.61 | (0.17) | 10.93 | 17.25 | 96,321 | 1.14 | 1.14 | (0.63) | 39 |
| Year ended 08/31/16 | 11.02 | (0.06) | (0.02) | (0.08) | (1.45) | 9.49 | (0.39) | 75,188 | 1.11 | 1.12 | (0.64) | 39 |
| Year ended 08/31/15 | 12.20 | (0.07) | 0.64 | 0.57 | (1.75) | 11.02 | 5.51 | 97,497 | 1.07 | 1.07 | (0.60) | 63 |
| Class R5 |
| Year ended 08/31/19 | 12.66 | (0.04) | (0.54)(d) | (0.58) | (1.49) | 10.59 | (2.13)(d) | 41,252 | 0.96(e) | 0.96(e) | (0.38)(e) | 74 |
| Year ended 08/31/18 | 11.04 | (0.06)(f) | 3.21 | 3.15 | (1.53) | 12.66 | 31.79 | 49,402 | 0.97 | 0.97 | (0.50)(f) | 49 |
| Year ended 08/31/17 | 9.57 | (0.05) | 1.69 | 1.64 | (0.17) | 11.04 | 17.42 | 23,137 | 0.94 | 0.94 | (0.43) | 39 |
| Year ended 08/31/16 | 11.08 | (0.04) | (0.02) | (0.06) | (1.45) | 9.57 | (0.18) | 1,698 | 0.91 | 0.92 | (0.44) | 39 |
| Year ended 08/31/15 | 12.23 | (0.05) | 0.65 | 0.60 | (1.75) | 11.08 | 5.77 | 6,784 | 0.94 | 0.94 | (0.47) | 63 |
| Class R6 |
| Year ended 08/31/19 | 12.70 | (0.03) | (0.54)(d) | (0.57) | (1.49) | 10.64 | (2.04)(d) | 58,043 | 0.87(e) | 0.87(e) | (0.29)(e) | 74 |
| Year ended 08/31/18 | 11.07 | (0.05)(f) | 3.21 | 3.16 | (1.53) | 12.70 | 31.80 | 92,480 | 0.88 | 0.88 | (0.41)(f) | 49 |
| Year ended 08/31/17 | 9.59 | (0.04) | 1.69 | 1.65 | (0.17) | 11.07 | 17.49 | 75,929 | 0.90 | 0.90 | (0.39) | 39 |
| Year ended 08/31/16 | 11.09 | (0.04) | (0.01) | (0.05) | (1.45) | 9.59 | (0.08) | 73,299 | 0.86 | 0.87 | (0.39) | 39 |
| Year ended 08/31/15 | 12.25 | (0.04) | 0.63 | 0.59 | (1.75) | 11.09 | 5.66 | 76,687 | 0.85 | 0.85 | (0.38) | 63 |
| (a) | Calculated using average shares outstanding. |
| (b) | Includes adjustments in accordance with accounting principles generally accepted in the United States of America and as such, the net asset value for financial reporting purposes and the returns based upon those net asset values may differ from the net asset value and returns for shareholder transactions. Does not include sales charges and is not annualized for periods less than one year, if applicable. |
| (c) | Portfolio turnover is calculated at the fund level and is not annualized for periods less than one year, if applicable. |
| (d) | Includes litigation proceeds received during the period. Had these litigation proceeds not been received, Net gains (losses) on securities (both realized and unrealized) per share would have been $(0.63), $(0.58), $(0.64), $(0.65) and $(0.65) for Class A, Class C, Class Y, Class R5, and Class R6 shares, respectively. Total returns would have been lower. |
| (e) | Ratios are based on average daily net assets (000’s omitted) of $362,718, $29,584, $73,479, $46,739 and $77,285 for Class A, Class C, Class Y, Class R5 and Class R6 shares, respectively. |
| (f) | Net investment income (loss) per share and the ratio of net investment income (loss) to average net assets includes significant dividends received during the year ended August, 31, 2018. Net investment income per share and the ratio of net investment income to average net assets excluding the significant dividends are $(0.10) and (0.96)%, $(0.14) and (1.67)%, $(0.08) and (0.71)%, $(0.07) and (0.57)% and $(0.06) and (0.48)% for Class A, Class C, Class Y, Class R5 and Class R6 shares, respectively. |
| (g) | The total return, ratio of expenses to average net assets and ratio of net investment income (loss) to average net assets reflect actual 12b-1 fees of 0.94%, 0.96%, 0.99% and 0.97% for the years ended August 31, 2019, 2018, 2017 and 2016 respectively. |
See accompanying Notes to Financial Statements which are an integral part of the financial statements.
| 16 | Invesco Small Cap Discovery Fund |
Notes to Financial Statements
August 31, 2019
NOTE 1—Significant Accounting Policies
Invesco Small Cap Discovery Fund (the “Fund”) is a series portfolio of AIM Counselor Series Trust (Invesco Counselor Series Trust) (the “Trust”). The Trust is a Delaware statutory trust registered under the Investment Company Act of 1940, as amended (the “1940 Act”), as an open-end series management investment company authorized to issue an unlimited number of shares of beneficial interest. Information presented in these financial statements pertains only to the Fund. Matters affecting the Fund or each class will be voted on exclusively by the shareholders of the Fund or each class.
The Fund’s investment objective is to seek capital appreciation.
The Fund currently consists of five different classes of shares: Class A, Class C, Class Y, Class R5 and Class R6. Class Y shares are available only to certain investors. Class A shares are sold with a front-end sales charge unless certain waiver criteria are met. Under certain circumstances, load waived shares may be subject to contingent deferred sales charges ("CDSC"). Class C shares are sold with a CDSC. Class Y, Class R5 and Class R6 shares are sold at net asset value. Class C shares held for ten years after purchase are eligible for automatic conversion into Class A shares of the same Fund (the "Conversion Feature"). The automatic conversion pursuant to the Conversion Feature will generally occur at the end of the month following the tenth anniversary after a purchase of Class C shares.
The Fund is an investment company and accordingly follows the investment company accounting and reporting guidance in accordance with Financial Accounting Standards Board Accounting Standards Codification Topic 946,Financial Services – Investment Companies.
The following is a summary of the significant accounting policies followed by the Fund in the preparation of its financial statements.
| A. | Security Valuations – Securities, including restricted securities, are valued according to the following policy. |
Debt obligations (including convertible securities) and unlisted equities are fair valued using an evaluated quote provided by an independent pricing service. Evaluated quotes provided by the pricing service may be determined without exclusive reliance on quoted prices, and may reflect appropriate factors such as institution-size trading in similar groups of securities, developments related to specific securities, dividend rate (for unlisted equities), yield (for debt obligations), quality, type of issue, coupon rate (for debt obligations), maturity (for debt obligations), individual trading characteristics and other market data. Pricing services generally value debt obligations assuming orderly transactions of institutional round lot size, but a fund may hold or transact in the same securities in smaller, odd lot sizes. Odd lots often trade at lower prices than institutional round lots. Debt obligations are subject to interest rate and credit risks. In addition, all debt obligations involve some risk of default with respect to interest and/or principal payments.
A security listed or traded on an exchange (except convertible securities) is valued at its last sales price or official closing price as of the close of the customary trading session on the exchange where the security is principally traded, or lacking any sales or official closing price on a particular day, the security may be valued at the closing bid price on that day. Securities traded in the over-the-counter market are valued based on prices furnished by independent pricing services or market makers. When such securities are valued by an independent pricing service they may be considered fair valued. Futures contracts are valued at the final settlement price set by an exchange on which they are principally traded. Listed options are valued at the mean between the last bid and asked prices from the exchange on which they are principally traded. Options not listed on an exchange are valued by an independent source at the mean between the last bid and asked prices. For purposes of determining net asset value ("NAV") per share, futures and option contracts generally are valued 15 minutes after the close of the customary trading session of the New York Stock Exchange (“NYSE”).
Investments in open-end and closed-end registered investment companies that do not trade on an exchange are valued at the end-of-day net asset value per share. Investments in open-end and closed-end registered investment companies that trade on an exchange are valued at the last sales price or official closing price as of the close of the customary trading session on the exchange where the security is principally traded.
Foreign securities’ (including foreign exchange contracts) prices are converted into U.S. dollar amounts using the applicable exchange rates as of the close of the NYSE. If market quotations are available and reliable for foreign exchange-traded equity securities, the securities will be valued at the market quotations. Because trading hours for certain foreign securities end before the close of the NYSE, closing market quotations may become unreliable. If between the time trading ends on a particular security and the close of the customary trading session on the NYSE, events occur that the investment adviser determines are significant and make the closing price unreliable, the Fund may fair value the security. If the event is likely to have affected the closing price of the security, the security will be valued at fair value in good faith using procedures approved by the Board of Trustees. Adjustments to closing prices to reflect fair value may also be based on a screening process of an independent pricing service to indicate the degree of certainty, based on historical data, that the closing price in the principal market where a foreign security trades is not the current value as of the close of the NYSE. Foreign securities’ prices meeting the approved degree of certainty that the price is not reflective of current value will be priced at the indication of fair value from the independent pricing service. Multiple factors may be considered by the independent pricing service in determining adjustments to reflect fair value and may include information relating to sector indices, American Depositary Receipts and domestic and foreign index futures. Foreign securities may have additional risks including exchange rate changes, potential for sharply devalued currencies and high inflation, political and economic upheaval, the relative lack of issuer information, relatively low market liquidity and the potential lack of strict financial and accounting controls and standards.
Securities for which market prices are not provided by any of the above methods may be valued based upon quotes furnished by independent sources. The last bid price may be used to value equity securities. The mean between the last bid and asked prices is used to value debt obligations, including corporate loans.
Securities for which market quotations are not readily available or became unreliable are valued at fair value as determined in good faith by or under the supervision of the Trust’s officers following procedures approved by the Board of Trustees. Issuer specific events, market trends, bid/asked quotes of brokers and information providers and other market data may be reviewed in the course of making a good faith determination of a security’s fair value.
The Fund may invest in securities that are subject to interest rate risk, meaning the risk that the prices will generally fall as interest rates rise and, conversely, the prices will generally rise as interest rates fall. Specific securities differ in their sensitivity to changes in interest rates
| 17 | Invesco Small Cap Discovery Fund |
depending on their individual characteristics. Changes in interest rates may result in increased market volatility, which may affect the value and/or liquidity of certain Fund investments.
Valuations change in response to many factors including the historical and prospective earnings of the issuer, the value of the issuer’s assets, general economic conditions, interest rates, investor perceptions and market liquidity. Because of the inherent uncertainties of valuation, the values reflected in the financial statements may materially differ from the value received upon actual sale of those investments.
| B. | Securities Transactions and Investment Income — Securities transactions are accounted for on a trade date basis. Realized gains or losses on sales are computed on the basis of specific identification of the securities sold. Interest income (net of withholding tax, if any) is recorded on the accrual basis from settlement date. Dividend income (net of withholding tax, if any) is recorded on the ex-dividend date. |
The Fund may periodically participate in litigation related to Fund investments. As such, the Fund may receive proceeds from litigation settlements. Any proceeds received are included in the Statement of Operations as realized gain (loss) for investments no longer held and as unrealized gain (loss) for investments still held.
Brokerage commissions and mark ups are considered transaction costs and are recorded as an increase to the cost basis of securities purchased and/or a reduction of proceeds on a sale of securities. Such transaction costs are included in the determination of net realized and unrealized gain (loss) from investment securities reported in the Statement of Operations and the Statement of Changes in Net Assets and the net realized and unrealized gains (losses) on securities per share in the Financial Highlights. Transaction costs are included in the calculation of the Fund’s net asset value and, accordingly, they reduce the Fund’s total returns. These transaction costs are not considered operating expenses and are not reflected in net investment income reported in the Statement of Operations and the Statement of Changes in Net Assets, or the net investment income per share and the ratios of expenses and net investment income reported in the Financial Highlights, nor are they limited by any expense limitation arrangements between the Fund and the investment adviser.
The Fund allocates income and realized and unrealized capital gains and losses to a class based on the relative net assets of each class.
| C. | Country Determination — For the purposes of making investment selection decisions and presentation in the Schedule of Investments, the investment adviser may determine the country in which an issuer is located and/or credit risk exposure based on various factors. These factors include the laws of the country under which the issuer is organized, where the issuer maintains a principal office, the country in which the issuer derives 50% or more of its total revenues and the country that has the primary market for the issuer’s securities, as well as other criteria. Among the other criteria that may be evaluated for making this determination are the country in which the issuer maintains 50% or more of its assets, the type of security, financial guarantees and enhancements, the nature of the collateral and the sponsor organization. Country of issuer and/or credit risk exposure has been determined to be the United States of America, unless otherwise noted. |
| D. | Distributions– Distributions from net investment income and net realized capital gain, if any, are generally declared and paid annually and recorded on the ex-dividend date. The Fund may elect to treat a portion of the proceeds from redemptions as distributions for federal income tax purposes. |
| E. | Federal Income Taxes –The Fund intends to comply with the requirements of Subchapter M of the Internal Revenue Code of 1986, as amended (the “Internal Revenue Code”), necessary to qualify as a regulated investment company and to distribute substantially all of the Fund’s taxable earnings to shareholders. As such, the Fund will not be subject to federal income taxes on otherwise taxable income (including net realized capital gain) that is distributed to shareholders. Therefore, no provision for federal income taxes is recorded in the financial statements. |
The Fund recognizes the tax benefits of uncertain tax positions only when the position is more likely than not to be sustained. Management has analyzed the Fund’s uncertain tax positions and concluded that no liability for unrecognized tax benefits should be recorded related to uncertain tax positions. Management is not aware of any tax positions for which it is reasonably possible that the total amounts of unrecognized tax benefits will change materially in the next 12 months.
The Fund files tax returns in the U.S. Federal jurisdiction and certain other jurisdictions. Generally, the Fund is subject to examinations by such taxing authorities for up to three years after the filing of the return for the tax period.
| F. | Expenses – Fees provided for under the Rule 12b-1 plan of a particular class of the Fund are charged to the operations of such class. Transfer agency fees and expenses and other shareholder recordkeeping fees and expenses attributable to Class R5 and Class R6 are allocated to each share class based on relative net assets. Sub-accounting fees attributable to Class R5 are charged to the operations of the class. Transfer agency fees and expenses and other shareholder recordkeeping fees and expenses relating to all other classes are allocated among those classes based on relative net assets. All other expenses are allocated among the classes based on relative net assets. |
| G. | Accounting Estimates – The preparation of financial statements in conformity with accounting principles generally accepted in the United States of America (“GAAP”) requires management to make estimates and assumptions that affect the reported amounts of assets and liabilities at the date of the financial statements and the reported amounts of revenues and expenses during the reporting period including estimates and assumptions related to taxation. Actual results could differ from those estimates by a significant amount. In addition, the Fund monitors for material events or transactions that may occur or become known after the period-end date and before the date the financial statements are released to print. |
| H. | Indemnifications – Under the Trust’s organizational documents, each Trustee, officer, employee or other agent of the Trust is indemnified against certain liabilities that may arise out of the performance of their duties to the Fund. Additionally, in the normal course of business, the Fund enters into contracts, including the Fund’s servicing agreements, that contain a variety of indemnification clauses. The Fund’s maximum exposure under these arrangements is unknown as this would involve future claims that may be made against the Fund that have not yet occurred. The risk of material loss as a result of such indemnification claims is considered remote. |
| I. | Securities Lending – The Fund may lend portfolio securities having a market value up to one-third of the Fund’s total assets. Such loans are secured by collateral equal to no less than the market value of the loaned securities determined daily by the securities lending provider. Such collateral will be cash or debt securities issued or guaranteed by the U.S. Government or any of its sponsored agencies. Cash collateral received in connection with these loans is invested in short-term money market instruments or affiliated money market funds and is shown as such on the Schedule of Investments. The Fund bears the risk of loss with respect to the investment of collateral. It is the Fund’s policy to obtain additional collateral from or return excess collateral to the borrower by the end of the next business day, following the valuation date of the securities loaned. Therefore, the value of the collateral held may be temporarily less than the value of the securities on loan. When loaning securities, the Fund retains certain benefits of owning the securities, including the economic equivalent of dividends or interest generated by the security. Lending securities entails a risk of loss to the Fund if, and to the extent that, the market value of the securities loaned were to increase and the |
| 18 | Invesco Small Cap Discovery Fund |
| | borrower did not increase the collateral accordingly, and the borrower failed to return the securities. The securities loaned are subject to termination at the option of the borrower or the Fund. Upon termination, the borrower will return to the Fund the securities loaned and the Fund will return the collateral. Upon the failure of the borrower to return the securities, collateral may be liquidated and the securities may be purchased on the open market to replace the loaned securities. The Fund could experience delays and costs in gaining access to the collateral and the securities may lose value during the delay which could result in potential losses to the Fund. Some of these losses may be indemnified by the lending agent. The Fund bears the risk of any deficiency in the amount of the collateral available for return to the borrower due to any loss on the collateral invested. Dividends received on cash collateral investments for securities lending transactions, which are net of compensation to counterparties, are included inDividends from affiliated money market funds on the Statement of Operations. The aggregate value of securities out on loan, if any, is shown as a footnote on the Statement of Assets and Liabilities. |
NOTE 2—Advisory Fees and Other Fees Paid to Affiliates
Invesco Small Cap Discovery Fund (the “Fund”) is a series portfolio of AIM Counselor Series Trust (Invesco Counselor Series Trust) (the “Trust”). The Trust is a Delaware statutory trust registered under the Investment Company Act of 1940, as amended (the “1940 Act”), as an open-end series management investment company authorized to issue an unlimited number of shares of beneficial interest. Information presented in these financial statements pertains only to the Fund. Matters affecting the Fund or each class will be voted on exclusively by the shareholders of the Fund or each class.
| Average Daily Net Assets | Rate |
| First $500 million | 0.80% |
| Next $500 million | 0.75% |
| Over $1 billion | 0.70% |
For the year ended August 31, 2019, the effective advisory fees incurred by the Fund was 0.79%.
Under the terms of a master sub-advisory agreement between the Adviser and each of Invesco Asset Management Deutschland GmbH, Invesco Asset Management Limited, Invesco Asset Management (Japan) Limited, Invesco Hong Kong Limited, Invesco Senior Secured Management, Inc. and Invesco Canada Ltd. (collectively, the "Affiliated Sub-Advisers") the Adviser, not the Fund, will pay 40% of the fees paid to the Adviser to any such Affiliated Sub-Adviser(s) that provide(s) discretionary investment management services to the Fund based on the percentage of assets allocated to such Affiliated Sub-Adviser(s).
The Adviser has contractually agreed, through at least June 30, 2020, to waive advisory fees and/or reimburse expenses to the extent necessary to limit total annual fund operating expenses after fee waiver and/or expense reimbursement (excluding certain items discussed below) of Class A, Class C, Class Y, Class R5 and Class R6 shares to 2.00%, 2.75%, 1.75%, 1.75% and 1.75%, respectively, of average daily net assets (the "expense limits"). In determining the Adviser’s obligation to waive advisory fees and/or reimburse expenses, the following expenses are not taken into account, and could cause total annual fund operating expenses after fee waiver and/or reimbursement to exceed the numbers reflected above: (1) interest; (2) taxes; (3) dividend expense on short sales; (4) extraordinary or non-routine items, including litigation expenses; and (5) expenses that the Fund has incurred but did not actually pay because of an expense offset arrangement. Unless Invesco continues the fee waiver agreement, it will terminate on June 30, 2020. During its term, the fee waiver agreement cannot be terminated or amended to increase the expense limits or reduce the advisory fee waivers without approval of the Board of Trustees. The Adviser did not waive fees and/or reimburse expenses during the period under this expense limit.
Further, the Adviser has contractually agreed, through at least June 30, 2021, to waive the advisory fee payable by the Fund in an amount equal to 100% of the net advisory fees the Adviser receives from the affiliated money market funds on investments by the Fund of uninvested cash (excluding investments of cash collateral from securities lending) in such affiliated money market funds.
For the year ended August 31, 2019, the Adviser waived advisory fees of $21,591.
The Trust has entered into a master administrative services agreement with Invesco pursuant to which the Fund has agreed to pay Invesco for certain administrative costs incurred in providing accounting services to the Fund. For the year ended August 31, 2019, expenses incurred under the agreement are shown in the Statement of Operations asAdministrative services fees. Also, Invesco has entered into a sub-administration agreement whereby State Street Bank and Trust Company (“SSB”) serves as custodian and fund accountant and provides certain administrative services to the Fund.
The Trust has entered into a transfer agency and service agreement with Invesco Investment Services, Inc. (“IIS”) pursuant to which the Fund has agreed to pay IIS a fee for providing transfer agency and shareholder services to the Fund and reimburse IIS for certain expenses incurred by IIS in the course of providing such services. IIS may make payments to intermediaries that provide omnibus account services, sub-accounting services and/or networking services. All fees payable by IIS to intermediaries that provide omnibus account services or sub-accounting services are charged back to the Fund, subject to certain limitations approved by the Trust’s Board of Trustees. For the year ended August 31, 2019, expenses incurred under the agreement are shown in the Statement of Operations asTransfer agent fees.
The Trust has entered into master distribution agreements with Invesco Distributors, Inc. (“IDI”) to serve as the distributor for the Class A, Class C, Class Y, Class R5 and Class R6 shares of the Fund. The Trust has adopted plans pursuant to Rule 12b-1 under the 1940 Act with respect to the Fund’s Class A and Class C shares (collectively, the “Plans”). The Fund, pursuant to the Plans, pays IDI compensation at the annual rate of 0.25% of the Fund’s average daily net assets of Class A shares and 1.00% of the average daily net assets of Class C shares. The fees are accrued daily and paid monthly. Of the Plan payments, up to 0.25% of the average daily net assets of each class of shares may be paid to furnish continuing personal shareholder services to customers who purchase and own shares of such classes. Any amounts not paid as a service fee under the Plans would constitute an asset-based sales charge. Rules of the Financial Industry Regulatory Authority (“FINRA”) impose a cap on the total sales charges, including asset-based sales charges, that may be paid by any class of shares of the Fund. For the year ended August 31, 2019, expenses incurred under the Plans are shown in the Statement of Operations asDistribution fees.
Front-end sales commissions and CDSC (collectively, the “sales charges”) are not recorded as expenses of the Fund. Front-end sales commissions are deducted from proceeds from the sales of Fund shares prior to investment in Class A shares of the Fund. CDSC are deducted from redemption proceeds prior to remittance to the shareholder. During the year ended August 31, 2019, IDI advised the Fund that IDI retained $67,785 in front-end
| 19 | Invesco Small Cap Discovery Fund |
sales commissions from the sale of Class A shares and $2,126 and $2,492 from Class A and Class C shares, respectively, for CDSC imposed upon redemptions by shareholders.
For the year ended August 31, 2019, the Fund incurred $11,605 in brokerage commissions with Invesco Capital Markets, Inc., an affiliate of the Adviser and IDI, for portfolio transactions executed on behalf of the Fund.
Certain officers and trustees of the Trust are officers and directors of the Adviser, IIS and/or IDI.
NOTE 3—Additional Valuation Information
GAAP defines fair value as the price that would be received to sell an asset or paid to transfer a liability in an orderly transaction between market participants at the measurement date, under current market conditions. GAAP establishes a hierarchy that prioritizes the inputs to valuation methods, giving the highest priority to readily available unadjusted quoted prices in an active market for identical assets (Level 1) and the lowest priority to significant unobservable inputs (Level 3), generally when market prices are not readily available or are unreliable. Based on the valuation inputs, the securities or other investments are tiered into one of three levels. Changes in valuation methods may result in transfers in or out of an investment’s assigned level:
Level 1 — Prices are determined using quoted prices in an active market for identical assets.
Level 2 — Prices are determined using other significant observable inputs. Observable inputs are inputs that other market participants may use in pricing a security. These may include quoted prices for similar securities, interest rates, prepayment speeds, credit risk, yield curves, loss severities, default rates, discount rates, volatilities and others.
Level 3 — Prices are determined using significant unobservable inputs. In situations where quoted prices or observable inputs are unavailable (for example, when there is little or no market activity for an investment at the end of the period), unobservable inputs may be used. Unobservable inputs reflect the Fund’s own assumptions about the factors market participants would use in determining fair value of the securities or instruments and would be based on the best available information.
As of August 31, 2019, all of the securities in this Fund were valued based on Level 1 inputs (see the Schedule of Investments for security categories). The level assigned to the securities valuations may not be an indication of the risk or liquidity associated with investing in those securities. Because of the inherent uncertainties of valuation, the values reflected in the financial statements may materially differ from the value received upon actual sale of those investments.
NOTE 4—Security Transactions with Affiliated Funds
The Fund is permitted to purchase or sell securities from or to certain other Invesco Funds under specified conditions outlined in procedures adopted by the Board of Trustees of the Trust. The procedures have been designed to ensure that any purchase or sale of securities by the Fund from or to another fund or portfolio that is or could be considered an affiliate by virtue of having a common investment adviser (or affiliated investment advisers), common Trustees and/or common officers complies with Rule 17a-7 of the 1940 Act. Further, as defined under the procedures, each transaction is effected at the current market price. Pursuant to these procedures, for the year ended August 31, 2019, the Fund engaged in securities purchases of $0 and securities sales of $2,432,922, which resulted in net realized gains of $138,067.
NOTE 5—Expense Offset Arrangement(s)
The expense offset arrangement is comprised of transfer agency credits which result from balances in demand deposit accounts used by the transfer agent for clearing shareholder transactions. For the year ended August 31, 2019, the Fund received credits from this arrangement, which resulted in the reduction of the Fund’s total expenses of $4,933.
NOTE 6—Trustees’ and Officers’ Fees and Benefits
Trustees’ and Officers’ Fees and Benefits include amounts accrued by the Fund to pay remuneration to certain Trustees and Officers of the Fund.Trustees have the option to defer compensation payable by the Fund, andTrustees’ andOfficers’ Fees and Benefits also include amounts accrued by the Fund to fund such deferred compensation amounts. Those Trustees who defer compensation have the option to select various Invesco Funds in which their deferral accounts shall be deemed to be invested. Finally, certain current Trustees were eligible to participate in a retirement plan that provided for benefits to be paid upon retirement to Trustees over a period of time based on the number of years of service. The Fund may have certain former Trustees who also participate in a retirement plan and receive benefits under such plan.Trustees’ andOfficers’ Fees and Benefits include amounts accrued by the Fund to fund such retirement benefits. Obligations under the deferred compensation and retirement plans represent unsecured claims against the general assets of the Fund.
NOTE 7—Cash Balances
The Fund is permitted to temporarily carry a negative or overdrawn balance in its account with SSB, the custodian bank. Such balances, if any at period-end, are shown in the Statement of Assets and Liabilities under the payable captionAmount due custodian. To compensate the custodian bank for such overdrafts, the overdrawn Fund may either (1) leave funds as a compensating balance in the account so the custodian bank can be compensated by earning the additional interest; or (2) compensate by paying the custodian bank at a rate agreed upon by the custodian bank and Invesco, not to exceed the contractually agreed upon rate. The Fund may not purchase additional securities when any borrowings from banks or broker-dealers exceed 5% of the Fund’s total assets, or when any borrowings from an Invesco Fund are outstanding.
| 20 | Invesco Small Cap Discovery Fund |
NOTE 8—Distributions to Shareholders and Tax Components of Net Assets
| Tax Character of Distributions to Shareholders Paid During the Fiscal Years Ended August 31, 2019 and August 31, 2018 |
| | 2019 | 2018 |
| Ordinary income | $702,413 | $— |
| Long-term capital gain | 84,107,769 | 81,953,272 |
| Total distributions | $84,810,182 | $81,953,272 |
| Tax Components of Net Assets at Period-End: |
| | 2019 |
| Undistributed long-term capital gain | $75,942,130 |
| Net unrealized appreciation — investments | 113,026,997 |
| Temporary book/tax differences | (112,785) |
| Late-Year ordinary loss deferral | (2,566,278) |
| Shares of beneficial interest | 359,465,038 |
| Total net assets | $545,755,102 |
The difference between book-basis and tax-basis unrealized appreciation (depreciation) is due to differences in the timing of recognition of gains and losses on investments for tax and book purposes. The Fund’s net unrealized appreciation difference is attributable primarily to wash sales.
The temporary book/tax differences are a result of timing differences between book and tax recognition of income and/or expenses. The Fund’s temporary book/tax differences are the result of the trustee deferral of compensation and retirement plan benefits.
Capital loss carryforward is calculated and reported as of a specific date. Results of transactions and other activity after that date may affect the amount of capital loss carryforward actually available for the Fund to utilize. Capital losses generated in years beginning after December 22, 2010 can be carried forward for an unlimited period, whereas previous losses expire in eight tax years. Capital losses with an expiration period may not be used to offset capital gains until all net capital losses without an expiration date have been utilized. Capital loss carryforwards with no expiration date will retain their character as either short-term or long-term capital losses instead of as short-term capital losses as under prior law. The ability to utilize capital loss carryforwards in the future may be limited under the Internal Revenue Code and related regulations based on the results of future transactions.
The Fund does not have a capital loss carryforward as of August 31, 2019.
NOTE 9—Investment Transactions
The aggregate amount of investment securities (other than short-term securities, U.S. Treasury obligations and money market funds, if any) purchased and sold by the Fund during the year ended August 31, 2019 was $423,804,577 and $537,008,637, respectively. Cost of investments, including any derivatives, on a tax basis includes the adjustments for financial reporting purposes as of the most recently completed federal income tax reporting period-end.
| Unrealized Appreciation (Depreciation) of Investments on a Tax Basis |
| Aggregate unrealized appreciation of investments | $137,033,007 |
| Aggregate unrealized (depreciation) of investments | (24,006,010) |
| Net unrealized appreciation of investments | $113,026,997 |
Cost of investments for tax purposes is $434,426,522.
NOTE 10—Reclassification of Permanent Differences
Primarily as a result of differing book/tax treatment of net operating losses, on August 31, 2019, undistributed net investment income (loss) was increased by $4,764,496, undistributed net realized gain was decreased by $2 and shares of beneficial interest was decreased by $4,764,494. This reclassification had no effect on the net assets of the Fund.
NOTE 11—Share Information
| | Summary of Share Activity |
| | Years ended August 31, |
| | 2019(a) | | 2018 |
| | Shares | Amount | | Shares | Amount |
| Sold: | | | | | |
| Class A | 6,464,164 | $62,670,442 | | 6,459,981 | $68,980,444 |
| Class B(b) | - | - | | 920 | 8,474 |
| Class C | 654,624 | 4,575,767 | | 1,137,617 | 9,252,454 |
| Class Y | 1,041,297 | 10,822,191 | | 3,533,312 | 39,828,572 |
| Class R5 | 1,728,062 | 17,962,351 | | 2,245,993 | 25,810,473 |
| Class R6 | 1,229,388 | 12,290,229 | | 2,790,961 | 31,225,274 |
| 21 | Invesco Small Cap Discovery Fund |
| | Summary of Share Activity |
| | Years ended August 31, |
| | 2019(a) | | 2018 |
| | Shares | Amount | | Shares | Amount |
| Issued as reinvestment of dividends: | | | | | |
| Class A | 6,098,826 | $48,912,588 | | 4,935,765 | $47,037,844 |
| Class B(b) | - | - | | 35,283 | 286,498 |
| Class C | 1,234,732 | 6,926,845 | | 926,228 | 6,641,056 |
| Class Y | 1,130,893 | 9,759,607 | | 1,252,407 | 12,674,363 |
| Class R5 | 677,921 | 5,945,363 | | 306,338 | 3,139,965 |
| Class R6 | 1,195,183 | 10,529,567 | | 954,071 | 9,807,849 |
| Conversion of Class B shares to Class A shares:(c) | | | | | |
| Class A | - | - | | 161,561 | 1,659,234 |
| Class B | - | - | | (189,455) | (1,659,234) |
| Automatic conversion of Class C shares to Class A shares: | | | | | |
| Class A | 1,566,804 | 13,688,805 | | - | - |
| Class C | (2,243,526) | (13,688,805) | | - | - |
| Reacquired: | | | | | |
| Class A | (10,464,590) | (98,847,107) | | (10,448,448) | (110,372,125) |
| Class B(b) | - | - | | (96,249) | (865,508) |
| Class C | (1,580,493) | (10,484,062) | | (1,708,956) | (13,598,265) |
| Class Y | (4,496,554) | (45,310,019) | | (6,233,218) | (69,586,248) |
| Class R5 | (2,415,659) | (25,494,844) | | (744,237) | (8,191,295) |
| Class R6 | (4,254,506) | (44,996,126) | | (3,323,420) | (37,584,064) |
| Net increase (decrease) in share activity | (2,433,434) | $(34,737,208) | | 1,996,454 | $14,495,761 |
| (a) | There are entities that are record owners of more than 5% of the outstanding shares of the Fund and in the aggregate own 40% of the outstanding shares of the Fund. IDI has an agreement with these entities to sell Fund shares. The Fund, Invesco and/or Invesco affiliates may make payments to these entities, which are considered to be related to the Fund, for providing services to the Fund, Invesco and/or Invesco affiliates including but not limited to services such as securities brokerage, distribution, third party record keeping and account servicing. The Fund has no knowledge as to whether all or any portion of the shares owned of record by these entities are also owned beneficially. |
| (b) | Class B shares activity for the period September 1, 2017 through January 26, 2018 (date of conversion). |
| (c) | Effective as of the close of business January 26, 2018, all outstanding Class B shares were converted to Class A shares. |
| 22 | Invesco Small Cap Discovery Fund |
Report of Independent Registered Public Accounting Firm
To the Board of Trustees of AIM Counselor Series Trust (Invesco Counselor Series Trust) and Shareholders of Invesco Small Cap Discovery Fund
Opinion on the Financial Statements
We have audited the accompanying statement of assets and liabilities, including the schedule of investments, of Invesco Small Cap Discovery Fund (one of the funds constituting AIM Counselor Series Trust (Invesco Counselor Series Trust), hereafter referred to as the "Fund") as of August 31, 2019, the related statement of operations for the year ended August 31, 2019, the statement of changes in net assets for each of the two years in the period ended August 31, 2019, including the related notes, and the financial highlights for each of the five years in the period ended August 31, 2019 (collectively referred to as the "financial statements"). In our opinion, the financial statements present fairly, in all material respects, the financial position of the Fund as of August 31, 2019, the results of its operations for the year then ended, the changes in its net assets for each of the two years in the period ended August 31, 2019 and the financial highlights for each of the five years in the period ended August 31, 2019 in conformity with accounting principles generally accepted in the United States of America.
Basis for Opinion
These financial statements are the responsibility of the Fund’s management. Our responsibility is to express an opinion on the Fund’s financial statements based on our audits. We are a public accounting firm registered with the Public Company Accounting Oversight Board (United States) (PCAOB) and are required to be independent with respect to the Fund in accordance with the U.S. federal securities laws and the applicable rules and regulations of the Securities and Exchange Commission and the PCAOB.
We conducted our audits of these financial statements in accordance with the standards of the PCAOB. Those standards require that we plan and perform the audit to obtain reasonable assurance about whether the financial statements are free of material misstatement, whether due to error or fraud.
Our audits included performing procedures to assess the risks of material misstatement of the financial statements, whether due to error or fraud, and performing procedures that respond to those risks. Such procedures included examining, on a test basis, evidence regarding the amounts and disclosures in the financial statements. Our audits also included evaluating the accounting principles used and significant estimates made by management, as well as evaluating the overall presentation of the financial statements. Our procedures included confirmation of securities owned as of August 31, 2019 by correspondence with the custodian, transfer agent and brokers; when replies were not received from brokers, we performed other auditing procedures. We believe that our audits provide a reasonable basis for our opinion.
/s/ PricewaterhouseCoopers LLP
Houston, Texas
October 29, 2019
We have served as the auditor of one or more of the investment companies in the Invesco group of investment companies since at least 1995. We have not been able to determine the specific year we began serving as auditor.
| 23 | Invesco Small Cap Discovery Fund |
Calculating your ongoing Fund expenses
Example
As a shareholder of the Fund, you incur two types of costs: (1) transaction costs, which may include sales charges (loads) on purchase payments or contingent deferred sales charges on redemptions, if any; and (2) ongoing costs, including management fees, distribution and/or service (12b-1) fees, and other Fund expenses. This example is intended to help you understand your ongoing costs (in dollars) of investing in the Fund and to compare these costs with ongoing costs of investing in other mutual funds. The example is based on an investment of $1,000 invested at the beginning of the period and held for the entire period March 1, 2019 through August 31, 2019.
Actual expenses
The table below provides information about actual account values and actual expenses. You may use the information in this table, together with the amount you invested, to estimate the expenses that you paid over the period. Simply divide your account value by $1,000 (for example, an $8,600 account value divided by $1,000 = 8.6), then multiply the result by the number in the table under the heading entitled “Actual Expenses Paid During Period” to estimate the expenses you paid on your account during this period.
Hypothetical example for comparison purposes
The table below also provides information about hypothetical account values and hypothetical expenses based on the Fund’s actual expense ratio and an assumed rate of return of 5% per year before expenses, which is not the Fund’s actual return.
The hypothetical account values and expenses may not be used to estimate the actual ending account balance or expenses you paid for the period. You may use this information to compare the ongoing costs of investing in the Fund and other funds. To do so, compare this 5% hypothetical example with the 5% hypothetical examples that appear in the shareholder reports of the other funds.
Please note that the expenses shown in the table are meant to highlight your ongoing costs only and do not reflect any transaction costs, such as sales charges (loads) on purchase payments or contingent deferred sales charges on redemptions, if any. Therefore, the hypothetical information is useful in comparing ongoing costs only, and will not help you determine the relative total costs of owning different funds. In addition, if these transaction costs were included, your costs would have been higher.
| | Beginning
Account Value (03/01/19) | ACTUAL | HYPOTHETICAL
(5% annual return before
expenses) | Annualized
Expense
Ratio |
Ending
Account Value
(08/31/19)1 | Expenses
Paid During
Period2 | Ending
Account Value
(08/31/19) | Expenses
Paid During
Period2 |
| Class A | $1,000.00 | $1,048.90 | $6.97 | $1,018.40 | $6.87 | 1.35% |
| Class C | 1,000.00 | 1,045.10 | 10.26 | 1,015.17 | 10.11 | 1.99 |
| Class Y | 1,000.00 | 1,049.40 | 5.68 | 1,019.66 | 5.60 | 1.10 |
| Class R5 | 1,000.00 | 1,050.60 | 4.96 | 1,020.37 | 4.89 | 0.96 |
| Class R6 | 1,000.00 | 1,050.30 | 4.50 | 1,020.82 | 4.43 | 0.87 |
| 1 | The actual ending account value is based on the actual total return of the Fund for the period March 1, 2019 through August 31, 2019, after actual expenses and will differ from the hypothetical ending account value which is based on the Fund’s expense ratio and a hypothetical annual return of 5% before expenses. |
| 2 | Expenses are equal to the Fund’s annualized expense ratio as indicated above multiplied by the average account value over the period, multiplied by 184/365 to reflect the most recent fiscal half year. |
| 24 | Invesco Small Cap Discovery Fund |
Approval of Investment Advisory and Sub-Advisory Contracts
At meetings held on June 10, 2019, the Board of Trustees (the Board or the Trustees) of AIM Counselor Series Trust (Invesco Counselor Series Trust) as a whole, and the independent Trustees, who comprise over 75% of the Board, voting separately, approved the continuance of the Invesco Small Cap Discovery Fund’s (the Fund) Master Investment Advisory Agreement with Invesco Advisers, Inc. (Invesco Advisers and the investment advisory agreement) and the Master IntergroupSub-Advisory Contract for Mutual Funds with Invesco Asset Management Deutschland GmbH, Invesco Asset Management Limited, Invesco Asset Management (Japan) Limited, Invesco Hong Kong Limited, Invesco Senior Secured Management, Inc. and Invesco Canada Ltd. (collectively, the AffiliatedSub-Advisers and thesub-advisory contracts) for another year, effective July 1, 2019. After evaluating the factors discussed below, among others, the Board approved the renewal of the Fund’s investment advisory agreement and thesub-advisory contracts and determined that the compensation payable by the Fund to Invesco Advisers and by Invesco Advisers to the AffiliatedSub-Advisers is fair and reasonable.
The Board’s Evaluation Process
The Board’s Investments Committee has established threeSub-Committees, which meet throughout the year to review the performance of funds advised by Invesco Advisers (the Invesco Funds). As part of a regularly scheduled basis ofin-person Board meetings, theSub-Committees meet with portfolio managers for their assigned Invesco Funds and other members of management to review detailed information about investment performance and portfolio attributes of these funds. The Board took into account evaluations and reports that it received from the Investments Committee andSub-Committees, as well as the information provided to such committees and the Board throughout the year, in considering whether to approve each Invesco Fund’s investment advisory agreement andsub-advisory contracts.
As part of the contract renewal process, the Board reviews and considers information provided in response to detailed requests for information submitted to management by the independent Trustees with assistance from legal counsel to the independent Trustees. The Board receives comparative investment performance and fee data regarding the Invesco Funds prepared by Invesco Advisers and Broadridge Financial Solutions, Inc. (Broadridge), an independent mutual fund data provider. The Board also receives an independent written evaluation from the Senior Officer, an officer of the Invesco Funds who reports directly to the independent Trustees. The Senior Officer’s evaluation is prepared as part of his responsibility to manage the process by which the Invesco Funds’ proposed management fees
are negotiated during the annual contract renewal process to ensure they are negotiated in a manner that is at arms’ length and reasonable. In addition to meetings with Invesco Advisers and fund counsel throughout the year, the independent Trustees also discuss the continuance of the investment advisory agreement andsub-advisory contracts in separate sessions with the Senior Officer and with independent legal counsel.
The discussion below is a summary of the Senior Officer’s independent written evaluation with respect to the Fund’s investment advisory agreement, as well as a discussion of the material factors and related conclusions that formed the basis for the Board’s approval of the Fund’s investment advisory agreement andsub-advisory contracts. The Trustees’ review and conclusions are based on the comprehensive consideration of all information presented to them during the course of the year and in prior years and are not the result of any single determinative factor. Moreover, one Trustee may have weighed a particular piece of information or factor differently than another Trustee. This information is current as of June 10, 2019.
Factors and Conclusions and Summary of Independent Written Fee Evaluation
| A. | Nature, Extent and Quality of Services Provided by Invesco Advisers and the AffiliatedSub-Advisers |
The Board reviewed the nature, extent and quality of the advisory services provided to the Fund by Invesco Advisers under the Fund’s investment advisory agreement, and the credentials and experience of the officers and employees of Invesco Advisers who provide these services, including the Fund’s portfolio manager(s). The Board’s review included consideration of Invesco Advisers’ investment process oversight and structure, credit analysis and investment risk management. The Board also considerednon-advisory services that Invesco Advisers and its affiliates provide to the Invesco Funds such as various back office support functions, third party oversight, internal audit, valuation, portfolio trading and legal and compliance. The Board also received and reviewed information about Invesco Advisers’ role as administrator of the Invesco Funds’ liquidity risk management program. The Board also reviewed and considered the benefits to shareholders of investing in a fund that is part of the Invesco family of funds under the umbrella of Invesco Ltd., Invesco Advisers’ parent company, and noted Invesco Ltd.’s depth and experience in conducting an investment management business, as well as its commitment of financial and other resources to such business. The Board reviewed and considered information about the resources that Invesco Advisers intends to continue to
commit to managing the Invesco family of funds following Invesco Ltd.’s acquisition of OppenheimerFunds, Inc. and its subsidiaries. The Board concluded that the nature, extent and quality of the services provided to the Fund by Invesco Advisers are appropriate and satisfactory.
The Board reviewed the services that may be provided by the AffiliatedSub-Advisers under thesub-advisory contracts and the credentials and experience of the officers and employees of the AffiliatedSub-Advisers who provide these services. The Board noted the AffiliatedSub-Advisers’ expertise with respect to certain asset classes and that the AffiliatedSub-Advisers have offices and personnel that are located in financial centers around the world. As a result, the Board noted that the AffiliatedSub-Advisers can provide research and investment analysis on the markets and economies of various countries in which the Fund may invest, make recommendations regarding securities and assist with security trades. The Board concluded that thesub-advisory contracts may benefit the Fund and its shareholders by permitting Invesco Advisers to use the resources and talents of the AffiliatedSub-Advisers in managing the Fund. The Board concluded that the nature, extent and quality of the services that may be provided by the AffiliatedSub-Advisers are appropriate and satisfactory.
| B. | Fund Investment Performance |
The Board considered Fund investment performance as a relevant factor in considering whether to approve the investment advisory agreement. The Board did not view Fund investment performance as a relevant factor in considering whether to approve thesub-advisory contracts for the Fund, as no AffiliatedSub-Adviser currently manages assets of the Fund.
The Board compared the Fund’s investment performance over multiple time periods ending December 31, 2018 to the performance of funds in the Broadridge performance universe and against the LipperSmall-Cap Growth Funds Index. The Board noted that performance of Class A shares of the Fund was in the third quintile of its performance universe for the one year period and the fourth quintile for the three and five year periods (the first quintile being the best performing funds and the fifth quintile being the worst performing funds). The Board noted that performance of Class A shares of the Fund was below the performance of the Index for the one, three and five year periods. The Board noted that the Fund’s overweight exposure to the health care sector and underweight exposure to certain defensive sectors detracted from Fund performance. The Trustees also reviewed more recent Fund performance and this review did not change their conclusions.
25 Invesco Small Cap Discovery Fund
| C. | Advisory andSub-Advisory Fees and Fund Expenses |
The Board compared the Fund’s contractual management fee rate to the contractual management fee rates of funds in the Fund’s Broadridge expense group. The Board noted that the contractual management fee rate for Class A shares of the Fund was below the median contractual management fee rate of funds in its expense group. The Board noted that the term “contractual management fee” for funds in the expense group may include both advisory and certainnon-portfolio management administrative services fees, but that Broadridge does not provide information on a fund by fund basis as to what is included. The Board also reviewed the methodology used by Broadridge in providing expense group information, which includes using each fund’s contractual management fee schedule (including any applicable breakpoints) as reported in the most recent prospectus or statement of additional information for each fund in the expense group. The Board also considered comparative information regarding the Fund’s total expense ratio and its various components.
The Board noted that Invesco Advisers has contractually agreed to waive fees and/or limit expenses of the Fund for the term disclosed in the Fund’s registration statement in an amount necessary to limit total annual operating expenses to a specified percentage of average daily net assets for each class of the Fund.
The Board also considered the fees charged by Invesco Advisers and the AffiliatedSub-Advisers to other similarly managed client accounts. The Board noted that Invesco Advisers or the AffiliatedSub-Advisers may charge lower fees to large institutional clients. Invesco Advisers reviewed with the Board differences in the scope of services it provides to the Invesco Funds relative to certain other types of client accounts, including management of cash flows as a result of redemptions and purchases, necessary infrastructure such as officers, office space, technology, legal and distribution, oversight of service providers, costs and business risks associated with launching new funds and sponsoring and maintaining the product line, preparation of annual registration statement updates and financial information and compliance with federal and state laws and regulations.
The Board also compared the Fund’s effective advisory fee rate (the advisory fee rate after advisory fee waivers and before other expense limitations/waivers) to the effective advisory fee rates of other similarly managed third-party mutual funds advised orsub-advised by Invesco Advisers and its affiliates, based on asset balances as of December 31, 2018.
The Board also considered the services that may be provided by the AffiliatedSub-Advisers pursuant to thesub-advisory contracts, as well as the fees payable by Invesco Advisers to the AffiliatedSub-Advisers pursuant to thesub-advisory contracts.
| D. | Economies of Scale and Breakpoints |
The Board considered the extent to which there may be economies of scale in the provision of advisory services to the Fund. The Board considered Invesco’s reinvestment in its business, including investments in business infrastructure and cybersecurity. The Board also considered that the Fund benefits from economies of scale through contractual breakpoints in the Fund’s advisory fee schedule, which generally operate to reduce the Fund’s expense ratio as it grows in size. The Board noted that the Fund shares directly in economies of scale through lower fees charged by third party service providers based on the combined size of the Invesco Funds. The Board noted that the Fund may also benefit from economies of scale through initial fee setting, fee waivers and expense reimbursements.
| E. | Profitability and Financial Resources |
The Board reviewed information from Invesco Advisers concerning the costs of the advisory and other services that Invesco Advisers and its affiliates provide to the Fund and the Invesco Funds and the profitability of Invesco Advisers and its affiliates in providing these services. The Board considered the methodology used for calculating profitability and noted the periodic review of such methodology by an independent consultant. The Board noted that Invesco Advisers continues to operate at a net profit from services Invesco Advisers and its affiliates provide to the Invesco Funds and the Fund. The Board did not deem the level of profits realized by Invesco Advisers and its affiliates from providing services to the Fund to be excessive given the nature, extent and quality of the services provided. The Board received information from Invesco Advisers demonstrating that Invesco Advisers and the AffiliatedSub-Advisers are financially sound and have the resources necessary to perform their obligations under the investment advisory agreement andsub-advisory contracts.
| F. | Collateral Benefits to Invesco Advisers and its Affiliates |
The Board considered various other benefits received by Invesco Advisers and its affiliates from the relationship with the Fund, including the fees received for providing administrative, transfer agency and distribution services to the Fund. The Board considered comparative information regarding fees charged for these services, including information provided by Broadridge and other independent sources. The Board considered the performance of Invesco Advisers and its affiliates in providing these services and the organizational structure employed to provide these services. The Board also considered that these services are provided to the Fund pursuant to written contracts that are reviewed and approved on an annual basis by the Board; and that the services are required for the operation of the Fund.
The Board considered the benefits realized by Invesco Advisers and the AffiliatedSub-Advisers as a result of portfolio brokerage transactions executed through “soft dollar” arrangements.
The Board noted that soft dollar arrangements may result in the Fund bearing costs to purchase research that may be used by Invesco Advisers or the AffiliatedSub-Advisers with other clients and may reduce Invesco Advisers’ or the AffiliatedSub-Advisers’ expenses. The Board also considered that it receives periodic reports from Invesco representing that these arrangements are consistent with regulatory requirements. The Board did not deem the soft dollar arrangements to be inappropriate.
The Board considered that the Fund’s uninvested cash and cash collateral from any securities lending arrangements may be invested in money market funds advised by Invesco Advisers pursuant to procedures approved by the Board. The Board considered information regarding the returns of the affiliated money market funds relative to comparable overnight investments, as well as the costs to the Fund of such investments. The Board noted that Invesco Advisers receives advisory fees from these affiliated money market funds attributable to such investments, although Invesco Advisers has contractually agreed to waive through varying periods the advisory fees payable by the Invesco Funds with respect to certain investments in the affiliated money market funds. The waiver is in an amount equal to 100% of the net advisory fee Invesco Advisers receives from the affiliated money market funds with respect to the Fund’s investment in the affiliated money market funds of uninvested cash, but not cash collateral. The Board concluded that the amount of advisory fees received by Invesco Advisers from the Fund’s investment of cash collateral from any securities lending arrangements in the affiliated money market funds is fair and reasonable.
The Board also considered that an affiliated broker may receive commissions for executing certain trades for the Fund. Invesco Advisers and the AffiliatedSub-Advisers may use the affiliated broker to, among other things, control order routing and minimize information leakage, and the Board was advised that such trades are executed in compliance with rules under the federal securities laws and consistent with best execution obligations.
26 Invesco Small Cap Discovery Fund
Tax Information
Form 1099-DIV, Form 1042-S and other year–end tax information provide shareholders with actual calendar year amounts that should be included in their tax returns. Shareholders should consult their tax advisers.
The following distribution information is being provided as required by the Internal Revenue Code or to meet a specific state’s requirement.
The Fund designates the following amounts or, if subsequently determined to be different, the maximum amount allowable for its fiscal year ended August 31, 2019:
| Federal and State Income Tax | |
| Long-Term Capital Gain Distributions | $84,107,769 |
| Qualified Dividend Income* | 100.00% |
| Corporate Dividends Received Deduction* | 100.00% |
| U.S. Treasury Obligations* | 0.00% |
| * | The above percentages are based on ordinary income dividends paid to shareholders during the Fund’s fiscal year. |
| 27 | Invesco Small Cap Discovery Fund |
Trustees and Officers
The address of each trustee and officer is AIM Counselor Series Trust (Invesco Counselor Series Trust) (the “Trust”), 11 Greenway Plaza, Suite 1000, Houston, Texas 77046-1173. The trustees serve for the life of the Trust, subject to their earlier death, incapacitation, resignation, retirement or removal as more specifically provided in the Trust’s organizational documents. Each officer serves for a one year term or until their successors are elected and qualified. Column two below includes length of time served with predecessor entities, if any.
| | | | | | | | |
Name, Year of Birth and Position(s) Held with the Trust | | Trustee and/ or Officer Since | | Principal Occupation(s) During Past 5 Years | | Number of Funds in Fund
Complex
Overseen by
Trustee | | Other Directorship(s) Held by Trustee During Past 5 Years |
| Interested Persons | | | | | | | | |
Martin L. Flanagan1 — 1960 Trustee and Vice Chair | | 2007 | | Executive Director, Chief Executive Officer and President, Invesco Ltd. (ultimate parent of Invesco and a global investment management firm); Trustee and Vice Chair, The Invesco Funds; Vice Chair, Investment Company Institute; and Member of Executive Board, SMU Cox School of Business Formerly: Advisor to the Board, Invesco Advisers, Inc. (formerly known as Invesco Institutional (N.A.), Inc.); Chairman and Chief Executive Officer, Invesco Advisers, Inc. (registered investment adviser); Director, Chairman, Chief Executive Officer and President, Invesco Holding Company (US), Inc. (formerly IVZ Inc.) (holding company), Invesco Group Services, Inc. (service provider) and Invesco North American Holdings, Inc. (holding company); Director, Chief Executive Officer and President, Invesco Holding Company Limited (parent of Invesco and a global investment management firm); Director, Invesco Ltd.; Chairman, Investment Company Institute and President,Co-Chief Executive Officer,Co-President, Chief Operating Officer and Chief Financial Officer, Franklin Resources, Inc. (global investment management organization) | | 229 | | None |
Philip A. Taylor2 — 1954 Trustee | | 2006 | | Vice Chair, Invesco Ltd.; Trustee, The Invesco Funds Formerly: Director, Invesco Canada Ltd. (formerly known as Invesco Trimark Ltd./Invesco Trimark Ltèe) (registered investment adviser and registered transfer agent); Head of the Americas and Senior Managing Director, Invesco Ltd.; Director, Invesco Advisers, Inc. (formerly known as Invesco Institutional (N.A.), Inc.) (registered investment adviser); Director and Chairman, Invesco Investment Services, Inc. (formerly known as Invesco AIM Investment Services, Inc.) (registered transfer agent); Chief Executive Officer, Invesco Corporate Class Inc. (corporate mutual fund company); Chairman and Chief Executive Officer, Invesco Canada Ltd. (formerly known as Invesco Trimark Ltd./Invesco Trimark Ltèe) (registered investment adviser and registered transfer agent); Senior Vice President, The Invesco Funds; Director, Invesco Investment Advisers LLC (formerly known as Van Kampen Asset Management); Director, Chairman, Chief Executive Officer and President, Invesco Management Group, Inc. (formerly known as Invesco AIM Management Group, Inc.) (financial services holding company);Co-Chairman,Co-President andCo-Chief Executive Officer, Invesco Advisers, Inc. (formerly known as Invesco Institutional (N.A.), Inc.) (registered investment adviser); Director, Chief Executive Officer and President, Van Kampen Exchange Corp; President and Principal Executive Officer, The Invesco Funds (other than AIM Treasurer’s Series Trust (Invesco Treasurer’s Series Trust), Short-Term Investments Trust and Invesco Management Trust); Executive Vice President, The Invesco Funds (AIM Treasurer’s Series Trust (Invesco Treasurer’s Series Trust), Short-Term Investments Trust and Invesco Management Trust only); Director and President, INVESCO Funds Group, Inc. (registered investment adviser and registered transfer agent); Director and Chairman, IVZ Distributors, Inc. (formerly known as INVESCO Distributors, Inc.) (registered broker dealer); Director, President and Chairman, Invesco Inc. (holding company), Invesco Canada Holdings Inc. (holding company), Trimark Investments Ltd./Placements Trimark Ltèe and Invesco Financial Services Ltd/Services Financiers Invesco Ltèe; Chief Executive Officer, Invesco Canada Fund Inc. (corporate mutual fund company); Director and Chairman, Van Kampen Investor Services Inc.; Director, Chief Executive Officer and President, 1371 Preferred Inc. (holding company) and Van Kampen Investments Inc.; Director and President, AIM GP Canada Inc. (general partner for limited partnerships) and Van Kampen Advisors, Inc.; Director and Chief Executive Officer, Invesco Trimark Dealer Inc. (registered broker dealer); Director, Invesco Distributors, Inc. (formerly known as Invesco AIM Distributors, Inc.) (registered broker dealer); Manager, Invesco Capital Management LLC; Director, Chief Executive Officer and President, Invesco Advisers, Inc.; Director, Chairman, Chief Executive Officer and President, Invesco AIM Capital Management, Inc.; President, Invesco Trimark Dealer Inc. and Invesco Trimark Ltd./Invesco Trimark Ltèe; Director and President, AIM Trimark Corporate Class Inc. and AIM Trimark Canada Fund Inc.; Senior Managing Director, Invesco Holding Company Limited; Director and Chairman, Fund Management Company (former registered broker dealer); President and Principal Executive Officer, The Invesco Funds (AIM Treasurer’s Series Trust (Invesco Treasurer’s Series Trust), and Short-Term Investments Trust only); President, AIM Trimark Global Fund Inc. and AIM Trimark Canada Fund Inc. | | 229 | | None |
| 1 | Mr. Flanagan is considered an interested person (within the meaning of Section 2(a)(19) of the 1940 Act) of the Trust because he is an officer of the Adviser to the Trust, and an officer and a director of Invesco Ltd., ultimate parent of the Adviser. |
| 2 | Mr. Taylor is considered an interested person (within the meaning of Section 2(a)(19) of the 1940 Act) of the Trust because he is an officer of Invesco Ltd., ultimate parent of the Adviser. |
T-1 Invesco Small Cap Discovery Fund
Trustees and Officers—(continued)
| | | | | | | | |
Name, Year of Birth and Position(s) Held with the Trust | | Trustee and/ or Officer Since | | Principal Occupation(s)
During Past 5 Years | | Number of
Funds in Fund
Complex
Overseen by
Trustee | | Other Directorship(s) Held by Trustee During
Past 5 Years |
| Independent Trustees | | | | | | | | |
Bruce L. Crockett — 1944 Trustee and Chair | | 2003 | | Chairman, Crockett Technologies Associates (technology consulting company) Formerly: Director, Captaris (unified messaging provider); Director, President and Chief Executive Officer, COMSAT Corporation; Chairman, Board of Governors of INTELSAT (international communications company); ACE Limited (insurance company); Independent Directors Council and Investment Company Institute: Member of the Audit Committee, Investment Company Institute; Member of the Executive Committee and Chair of the Governance Committee, Independent Directors Council | | 229 | | Director and Chairman of the Audit Committee, ALPS (Attorneys Liability Protection Society) (insurance company); Director and Member of the Audit Committee and Compensation Committee, Ferroglobe PLC (metallurgical company) |
David C. Arch — 1945 Trustee | | 2010 | | Chairman of Blistex Inc. (consumer health care products manufacturer); Member, World Presidents’ Organization | | 229 | | Board member of the Illinois Manufacturers’ Association |
Beth Ann Brown — 1968 Trustee | | 2019 | | Independent Consultant Formerly: Head of Intermediary Distribution, Managing Director, Strategic Relations, Managing Director, Head of National Accounts, Senior Vice President, National Account Manager and Senior Vice President, Key Account Manager, Columbia Management Investment Advisers LLC; Vice President, Key Account Manager, Liberty Funds Distributor, Inc.; and Trustee of certain Oppenheimer Funds | | 229 | | Director, Board of Directors of Caron Engineering Inc.; Advisor, Board of Advisors of Caron Engineering Inc.; President and Director, Acton Shapleigh Youth Conservation Corps (non -profit); and Vice President and Director of Grahamtastic Connection(non-profit) |
Jack M. Fields — 1952 Trustee | | 2003 | | Chief Executive Officer, Twenty First Century Group, Inc. (government affairs company); and Chairman, Discovery Learning Alliance(non-profit) Formerly: Owner and Chief Executive Officer, Dos Angeles Ranch L.P. (cattle, hunting, corporate entertainment); Director, Insperity, Inc. (formerly known as Administaff) (human resources provider); Chief Executive Officer, Texana Timber LP (sustainable forestry company); Director of Cross Timbers Quail Research Ranch(non-profit); and member of the U.S. House of Representatives | | 229 | | None |
Cynthia Hostetler — 1962 Trustee | | 2017 | | Non-Executive Director and Trustee of a number of public and private business corporations Formerly: Director, Aberdeen Investment Funds (4 portfolios); Head of Investment Funds and Private Equity, Overseas Private Investment Corporation; President, First Manhattan Bancorporation, Inc.; Attorney, Simpson Thacher & Bartlett LLP | | 229 | | Vulcan Materials Company (construction materials company); Trilinc Global Impact Fund; Genesee & Wyoming, Inc. (railroads); Artio Global Investment LLC (mutual fund complex); Edgen Group, Inc. (specialized energy and infrastructure products distributor); Investment Company Institute (professional organization); Independent Directors Council (professional organization) |
Eli Jones — 1961 Trustee | | 2016 | | Professor and Dean, Mays Business School — Texas A&M University Formerly: Professor and Dean, Walton College of Business, University of Arkansas and E.J. Ourso College of Business, Louisiana State University; Director, Arvest Bank | | 229 | | Insperity, Inc. (formerly known as Administaff) (human resources provider) |
Elizabeth Krentzman — 1959 Trustee | | 2019 | | Formerly: Principal and Chief Regulatory Advisor for Asset Management Services and U.S. Mutual Fund Leader of Deloitte & Touche LLP; General Counsel of the Investment Company Institute (trade association); National Director of the Investment Management Regulatory Consulting Practice, Principal, Director and Senior Manager of Deloitte & Touche LLP; Assistant Director of the Division of Investment Management — Office of Disclosure and Investment Adviser Regulation of the U.S. Securities and Exchange Commission and various positions with the Division of Investment Management — Office of Regulatory Policy of the U.S. Securities and Exchange Commission; Associate at Ropes & Gray LLP; Advisory Board Member of the Securities and Exchange Commission Historical Society; and Trustee of certain Oppenheimer Funds | | 229 | | Trustee of the University of Florida National Board Foundation and Audit Committee Member; Member of the Cartica Funds Board of Directors (private investment funds); Member of the University of Florida Law Center Association, Inc. Board of Trustees and Audit Committee Member |
Anthony J. LaCava, Jr. — 1956 Trustee | | 2019 | | Formerly: Director and Member of the Audit Committee, Blue Hills Bank (publicly traded financial institution) and Managing Partner, KPMG LLP | | 229 | | Blue Hills Bank; Chairman, Bentley University; Member, Business School Advisory Council; and Nominating Committee, KPMG LLP |
T-2 Invesco Small Cap Discovery Fund
Trustees and Officers—(continued)
| | | | | | | | |
Name, Year of Birth and Position(s) Held with the Trust | | Trustee and/ or Officer Since | | Principal Occupation(s)
During Past 5 Years | | Number of
Funds in Fund
Complex
Overseen by
Trustee | | Other Directorship(s) Held by Trustee During
Past 5 Years |
| Independent Trustees—(continued) |
Prema Mathai-Davis — 1950 Trustee | | 2003 | | Retired Co-Owner & Partner of Quantalytics Research, LLC, (a FinTech Investment Research Platform for the Self-Directed Investor) | | 229 | | None |
Joel W. Motley — 1952 Trustee | | 2019 | | Director of Office of Finance, Federal Home Loan Bank; Member of the Vestry of Trinity Wall Street; Managing Director of Carmona Motley Inc. (privately held financial advisor); Member of the Finance and Budget Committee of the Council on Foreign Relations, Member of the Investment Committee and Board of Human Rights Watch and Member of the Investment Committee and Board of Historic Hudson Valley(non-profit cultural organization) Formerly: Managing Director of Public Capital Advisors, LLC (privately held financial advisor); Managing Director of Carmona Motley Hoffman, Inc. (privately held financial advisor); Trustee of certain Oppenheimer Funds; and Director of Columbia Equity Financial Corp. (privately held financial advisor) | | 229 | | Director of Greenwall Foundation (bioethics research foundation); Member of Board and Investment Committee of The Greenwall Foundation; Director of Southern Africa Legal Services Foundation; Board Member and Investment Committee Member of Pulitzer Center for Crisis Reporting(non-profit journalism) |
Teresa M. Ressel — 1962 Trustee | | 2017 | | Non-executive director and trustee of a number of public and private business corporations Formerly: Chief Financial Officer, Olayan America, The Olayan Group (international investor/commercial/industrial); Chief Executive Officer, UBS Securities LLC; Group Chief Operating Officer, Americas, UBS AG; Assistant Secretary for Management & Budget and CFO, US Department of the Treasury | | 229 | | Atlantic Power Corporation (power generation company); ON Semiconductor Corp. (semiconductor supplier) |
Ann Barnett Stern — 1957 Trustee | | 2017 | | President and Chief Executive Officer, Houston Endowment Inc. (private philanthropic institution) Formerly: Executive Vice President and General Counsel, Texas Children’s Hospital; Attorney, Beck, Redden and Secrest, LLP; Business Law Instructor, University of St. Thomas; Attorney, Andrews & Kurth LLP | | 229 | | Federal Reserve Bank of Dallas |
Raymond Stickel, Jr. — 1944 Trustee | | 2005 | | Retired Formerly: Director, Mainstay VP Series Funds, Inc. (25 portfolios); Partner, Deloitte & Touche | | 229 | | None |
Robert C. Troccoli — 1949 Trustee | | 2016 | | Retired Formerly: Adjunct Professor, University of Denver — Daniels College of Business; Senior Partner, KPMG LLP | | 229 | | None |
Daniel S. Vandivort — 1954 Trustee | | 2019 | | Treasurer, Chairman of the Audit and Finance Committee, and Trustee, Board of Trustees, Huntington Disease Foundation of America; and President, Flyway Advisory Services LLC (consulting and property management) Formerly: Trustee and Governance Chair, of certain Oppenheimer Funds | | 229 | | Chairman and Lead Independent Director, Chairman of the Audit Committee, and Director, Board of Directors, Value Line Funds |
James D. Vaughn — 1945 Trustee | | 2019 | | Retired Formerly: Managing Partner, Deloitte & Touche LLP; Trustee and Chairman of the Audit Committee, Schroder Funds; Board Member, Mile High United Way, Boys and Girls Clubs, Boy Scouts, Colorado Business Committee for the Arts, Economic Club of Colorado and Metro Denver Network (economic development corporation); and Trustee of certain Oppenheimer Funds | | 229 | | Board member and Chairman of Audit Committee of AMG National Trust Bank; Trustee and Investment Committee member, University of South Dakota Foundation; Board member, Audit Committee Member and past Board Chair, Junior Achievement(non-profit) |
Christopher L. Wilson — 1957 Trustee, Vice Chair and Chair Designate | | 2017 | | Retired Formerly: Director, TD Asset Management USA Inc. (mutual fund complex) (22 portfolios); Managing Partner, CT2, LLC (investing and consulting firm); President/Chief Executive Officer, Columbia Funds, Bank of America Corporation; President/Chief Executive Officer, CDC IXIS Asset Management Services, Inc.; Principal & Director of Operations, Scudder Funds, Scudder, Stevens & Clark, Inc.; Assistant Vice President, Fidelity Investments | | 229 | | ISO New England, Inc.(non-profit organization managing regional electricity market) |
T-3 Invesco Small Cap Discovery Fund
Trustees and Officers—(continued)
| | | | | | | | |
Name, Year of Birth and Position(s) Held with the Trust | | Trustee and/ or Officer Since | | Principal Occupation(s)
During Past 5 Years | | Number of
Funds in Fund
Complex
Overseen by
Trustee | | Other Directorship(s) Held by Trustee During
Past 5 Years |
| Other Officers | | | | | | | | |
Sheri Morris — 1964 President, Principal Executive Officer and Treasurer | | 2003 | | President, Principal Executive Officer and Treasurer, The Invesco Funds; Vice President, Invesco Advisers, Inc. (formerly known as Invesco Institutional (N.A.), Inc.) (registered investment adviser); and Vice President, Invesco Exchange-Traded Fund Trust, Invesco Exchange-Traded Fund Trust II, Invesco India Exchange-Traded Fund Trust, Invesco Actively Managed Exchange-Traded Fund Trust, Invesco Actively Managed Exchange-Traded Commodity Fund Trust and Invesco Exchange-Traded Self-Indexed Fund Trust; and Vice President, OppenheimerFunds, Inc. Formerly: Vice President and Principal Financial Officer, The Invesco Funds; Vice President, Invesco AIM Advisers, Inc., Invesco AIM Capital Management, Inc. and Invesco AIM Private Asset Management, Inc.; Assistant Vice President and Assistant Treasurer, The Invesco Funds and Assistant Vice President, Invesco Advisers, Inc., Invesco AIM Capital Management, Inc. and Invesco AIM Private Asset Management, Inc.; and Treasurer, Invesco Exchange-Traded Fund Trust, Invesco Exchange-Traded Fund Trust II, Invesco India Exchange-Traded Fund Trust and Invesco Actively Managed Exchange-Traded Fund Trust | | N/A | | N/A |
Russell C. Burk — 1958 Senior Vice President and Senior Officer | | 2005 | | Senior Vice President and Senior Officer, The Invesco Funds | | N/A | | N/A |
Jeffrey H. Kupor — 1968 Senior Vice President, Chief Legal Officer and Secretary | | 2018 | | Head of Legal of the Americas, Invesco Ltd.; Senior Vice President and Secretary, Invesco Advisers, Inc. (formerly known as Invesco Institutional (N.A.), Inc.) (registered investment adviser); Senior Vice President and Secretary, Invesco Distributors, Inc. (formerly known as Invesco AIM Distributors, Inc.); Vice President and Secretary, Invesco Investment Services, Inc. (formerly known as Invesco AIM Investment Services, Inc.) Senior Vice President, Chief Legal Officer and Secretary, The Invesco Funds; Secretary and General Counsel, Invesco Investment Advisers LLC (formerly known as Van Kampen Asset Management); Secretary and General Counsel, Invesco Capital Markets, Inc. (formerly known as Van Kampen Funds Inc.) and Chief Legal Officer, Invesco Exchange-Traded Fund Trust, Invesco Exchange-Traded Fund Trust II, Invesco India Exchange-Traded Fund Trust, Invesco Actively Managed Exchange-Traded Fund Trust, Invesco Actively Managed Exchange-Traded Commodity Fund Trust and Invesco Exchange-Traded Self-Indexed Fund Trust; Secretary, Invesco Indexing LLC; Secretary, W.L. Ross & Co., LLC Formerly: Secretary and Vice President, Jemstep, Inc.; Head of Legal, Worldwide Institutional, Invesco Ltd.; Secretary and General Counsel, INVESCO Private Capital Investments, Inc.; Senior Vice President, Secretary and General Counsel, Invesco Management Group, Inc. (formerly known as Invesco AIM Management Group, Inc.); Assistant Secretary, INVESCO Asset Management (Bermuda) Ltd.; Secretary and General Counsel, Invesco Private Capital, Inc.; Assistant Secretary and General Counsel, INVESCO Realty, Inc.; Secretary and General Counsel, Invesco Senior Secured Management, Inc.; and Secretary, Sovereign G./P. Holdings Inc. | | N/A | | N/A |
Andrew R. Schlossberg — 1974 Senior Vice President | | 2019 | | Head of the Americas and Senior Managing Director, Invesco Ltd.; Director and Senior Vice President, Invesco Advisers, Inc. (formerly known as Invesco Institutional (N.A.), Inc.) (registered investment adviser); Director and Chairman, Invesco Investment Services, Inc. (formerly known as Invesco AIM Investment Services, Inc.) (registered transfer agent); Senior Vice President, The Invesco Funds; Director, Invesco Investment Advisers LLC (formerly known as Van Kampen Asset Management); Director, President and Chairman, Invesco Insurance Agency, Inc. Formerly: Director, Invesco UK Limited; Director and Chief Executive, Invesco Asset Management Limited and Invesco Fund Managers Limited; Assistant Vice President, The Invesco Funds; Senior Vice President, Invesco Advisers, Inc. (formerly known as Invesco Institutional (N.A.), Inc.) (registered investment adviser); Director and Chief Executive, Invesco Administration Services Limited and Invesco Global Investment Funds Limited; Director, Invesco Distributors, Inc.; Head of EMEA, Invesco Ltd.; President, Invesco Actively Managed Exchange-Traded Commodity Fund Trust, Invesco Actively Managed Exchange-Traded Fund Trust, Invesco Exchange-Traded Fund Trust, Invesco Exchange-Traded Fund Trust II and Invesco India Exchange-Traded Fund Trust; Managing Director and Principal Executive Officer, Invesco Capital Management LLC | | N/A | | N/A |
T-4 Invesco Small Cap Discovery Fund
Trustees and Officers—(continued)
| | | | | | | | |
Name, Year of Birth and Position(s) Held with the Trust | | Trustee and/ or Officer Since | | Principal Occupation(s)
During Past 5 Years | | Number of
Funds in Fund
Complex
Overseen by
Trustee | | Other Directorship(s) Held by Trustee During
Past 5 Years |
| Other Officers—(continued) | | | | | | | | |
John M. Zerr — 1962
Senior Vice President | | 2006 | | Chief Operating Officer of the Americas; Senior Vice President, Invesco Advisers, Inc. (formerly known as Invesco Institutional (N.A.), Inc.) (registered investment adviser); Senior Vice President, Invesco Distributors, Inc. (formerly known as Invesco AIM Distributors, Inc.); Director and Vice President, Invesco Investment Services, Inc. (formerly known as Invesco AIM Investment Services, Inc.) Senior Vice President, The Invesco Funds; Managing Director, Invesco Capital Management LLC; Director, Invesco Investment Advisers LLC (formerly known as Van Kampen Asset Management); Senior Vice President, Invesco Capital Markets, Inc. (formerly known as Van Kampen Funds Inc.); Manager, Invesco Indexing LLC; Manager, Invesco Specialized Products, LLC; Director and Senior Vice President, Invesco Insurance Agency, Inc.; Member, Invesco Canada Funds Advisory Board; Director, President and Chief Executive Officer, Invesco Corporate Class Inc. (corporate mutual fund company); and Director, Chairman, President and Chief Executive Officer, Invesco Canada Ltd. (formerly known as Invesco Trimark Ltd./Invesco Trimark Ltèe) (registered investment adviser and registered transfer agent) Formerly: Director and Senior Vice President, Invesco Management Group, Inc. (formerly known as Invesco AIM Management Group, Inc.); Secretary and General Counsel, Invesco Management Group, Inc. (formerly known as Invesco AIM Management Group, Inc.); Secretary, Invesco Investment Services, Inc. (formerly known as Invesco AIM Investment Services, Inc.); Chief Legal Officer and Secretary, The Invesco Funds; Secretary and General Counsel, Invesco Investment Advisers LLC (formerly known as Van Kampen Asset Management); Secretary and General Counsel, Invesco Capital Markets, Inc. (formerly known as Van Kampen Funds Inc.); Chief Legal Officer, Invesco Exchange-Traded Fund Trust, Invesco Exchange-Traded Fund Trust II, Invesco India Exchange-Traded Fund Trust, Invesco Actively Managed Exchange-Traded Fund Trust, Invesco Actively Managed Exchange-Traded Commodity Fund Trust and Invesco Exchange-Traded Self-Indexed Fund Trust; Secretary, Invesco Indexing LLC; Director, Secretary, General Counsel and Senior Vice President, Van Kampen Exchange Corp.; Director, Vice President and Secretary, IVZ Distributors, Inc. (formerly known as INVESCO Distributors, Inc.); Director and Vice President, INVESCO Funds Group, Inc.; Director and Vice President, Van Kampen Advisors Inc.; Director, Vice President, Secretary and General Counsel, Van Kampen Investor Services Inc.; Director and Secretary, Invesco Distributors, Inc. (formerly known as Invesco AIM Distributors, Inc.); Director, Senior Vice President, General Counsel and Secretary, Invesco AIM Advisers, Inc. and Van Kampen Investments Inc.; Director, Vice President and Secretary, Fund Management Company; Director, Senior Vice President, Secretary, General Counsel and Vice President, Invesco AIM Capital Management, Inc.; Chief Operating Officer and General Counsel, Liberty Ridge Capital, Inc. (an investment adviser) | | N/A | | N/A |
Gregory G. McGreevey — 1962 Senior Vice President | | 2012 | | Senior Managing Director, Invesco Ltd.; Director, Chairman, President, and Chief Executive Officer, Invesco Advisers, Inc. (formerly known as Invesco Institutional (N.A.), Inc.) (registered investment adviser); Director, Invesco Mortgage Capital, Inc. and Invesco Senior Secured Management, Inc.; and Senior Vice President, The Invesco Funds; and President, SNW Asset Management Corporation Formerly: Senior Vice President, Invesco Management Group, Inc. and Invesco Advisers, Inc.; Assistant Vice President, The Invesco Funds | | N/A | | N/A |
Kelli Gallegos — 1970 Vice President, Principal Financial Officer and Assistant Treasurer | | 2008 | | Assistant Treasurer, Invesco Specialized Products, LLC; Vice President, Principal Financial Officer and Assistant Treasurer, The Invesco Funds; Principal Financial and Accounting Officer — Pooled Investments, Invesco Capital Management LLC; Vice President and Treasurer, Invesco Exchange-Traded Fund Trust, Invesco Exchange-Traded Fund Trust II, Invesco India Exchange-Traded Fund Trust, Invesco Actively Managed Exchange-Traded Fund Trust, Invesco Actively Managed Exchange-Traded Commodity Fund Trust and Invesco Exchange-Traded Self-Indexed Fund Trust Formerly: Assistant Treasurer, Invesco Exchange-Traded Fund Trust, Invesco Exchange-Traded Fund Trust II, Invesco India Exchange-Traded Fund Trust, Invesco Actively Managed Exchange-Traded Fund Trust, Invesco Actively Managed Exchange-Traded Commodity Fund Trust and Invesco Exchange-Traded Self-Indexed Fund Trust; Assistant Treasurer, Invesco Capital Management LLC; Assistant Vice President, The Invesco Funds | | N/A | | N/A |
T-5 Invesco Small Cap Discovery Fund
Trustees and Officers—(continued)
| | | | | | | | |
Name, Year of Birth and Position(s) Held with the Trust | | Trustee and/ or Officer Since | | Principal Occupation(s)
During Past 5 Years | | Number of
Funds in Fund
Complex
Overseen by
Trustee | | Other Directorship(s) Held by Trustee During
Past 5 Years |
| Other Officers—(continued) | | | | | | | | |
Crissie M. Wisdom — 1969 Anti-Money Laundering Compliance Officer | | 2013 | | Anti-Money Laundering Compliance Officer, Invesco Advisers, Inc. (formerly known as Invesco Institutional (N.A.), Inc.) (registered investment adviser), Invesco Capital Markets, Inc. (formerly known as Van Kampen Funds Inc.), Invesco Distributors, Inc., Invesco Investment Services, Inc., The Invesco Funds, and Invesco Exchange-Traded Fund Trust, Invesco Exchange-Traded Fund Trust II, Invesco India Exchange-Traded Fund Trust, Invesco Actively Managed Exchange-Traded Fund Trust, Invesco Actively Managed Exchange-Traded Commodity Fund Trust and Invesco Exchange-Traded Self-Indexed Fund Trust; Anti-Money Laundering Compliance Officer and Bank Secrecy Act Officer, INVESCO National Trust Company and Invesco Trust Company; and Fraud Prevention Manager and Controls and Risk Analysis Manager for Invesco Investment Services, Inc. Formerly: Anti-Money Laundering Compliance Officer, Van Kampen Exchange Corp. and Invesco Management Group, Inc. | | N/A | | N/A |
Robert R. Leveille — 1969 Chief Compliance Officer | | 2016 | | Chief Compliance Officer, Invesco Advisers, Inc. (registered investment adviser); and Chief Compliance Officer, The Invesco Funds Formerly: Chief Compliance Officer, Putnam Investments and the Putnam Funds | | N/A | | N/A |
The Statement of Additional Information of the Trust includes additional information about the Fund’s Trustees and is available upon request, without charge, by calling 1.800.959.4246. Please refer to the Fund’s Statement of Additional Information for information on the Fund’ssub-advisers.
| | | | | | |
Office of the Fund 11 Greenway Plaza, Suite 1000
Houston, TX 77046-1173 | | Investment Adviser Invesco Advisers, Inc.
1555 Peachtree Street, N.E.
Atlanta, GA 30309 | | Distributor Invesco Distributors, Inc.
11 Greenway Plaza, Suite 1000
Houston, TX 77046-1173 | | Auditors PricewaterhouseCoopers LLP
1000 Louisiana Street, Suite 5800 Houston, TX 77002-5021 |
| | | |
| | | | | | |
Counsel to the Fund Stradley Ronon Stevens & Young, LLP
2005 Market Street, Suite 2600
Philadelphia, PA 19103-7018 | | Counsel to the Independent Trustees Goodwin Procter LLP
901 New York Avenue, N.W.
Washington, D.C. 20001 | | Transfer Agent Invesco Investment Services, Inc.
11 Greenway Plaza, Suite 1000
Houston, TX 77046-1173 | | Custodian State Street Bank and Trust Company
225 Franklin Street
Boston, MA 02110-2801 |
T-6 Invesco Small Cap Discovery Fund
Go paperless with eDelivery
Visit invesco.com/edelivery to enjoy the convenience and security of anytime electronic access to your investment documents.
With eDelivery, you can elect to have any or all of the following materials delivered straight to your inbox to download, save and print from your own computer:
| • | Fund reports and prospectuses |
| • | Quarterly statements |
| • | Daily confirmations |
| • | Tax forms |
Invesco mailing information
Send general correspondence to Invesco Investment Services, Inc., P.O. Box 219078, Kansas City, MO 64121-9078.
Important notice regarding delivery of security holder documents
To reduce Fund expenses, only one copy of most shareholder documents may be mailed to shareholders with multiple accounts at the same address (Householding). Mailing of your shareholder documents may be householded indefinitely unless you instruct us otherwise. If you do not want the mailing of these documents to be combined with those for other members of your household, please contact Invesco Investment Services, Inc. at 800 959 4246 or contact your financial institution. We will begin sending you individual copies for each account within 30 days after receiving your request.
Fund holdings and proxy voting information
The Fund provides a complete list of its holdings four times in each fiscal year, at the quarter-ends. For the second and fourth quarters, the list appears in the Fund’s semiannual and annual reports to shareholders. For the first and third quarters, the Fund files the lists with the Securities and Exchange Commission (SEC) as an exhibit to its reports on Form N-PORT. The most recent list of portfolio holdings is available at invesco.com/completeqtrholdings. Shareholders can also look up the Fund’s Form N-PORT filings on the SEC website, sec.gov. The SEC file numbers for the Fund are shown below.
A description of the policies and procedures that the Fund uses to determine how to vote proxies relating to portfolio securities is available without charge, upon request, from our Client Services department at 800 959 4246, or at invesco.com/proxyguidelines. The information is also available on the SEC website, sec.gov.
Information regarding how the Fund voted proxies related to its portfolio securities during the most recent 12-month period ended June 30 is available at invesco.com/proxysearch. This information is also available on the SEC website, sec.gov.
Invesco Advisers, Inc. is an investment adviser; it provides investment advisory services to individual and institutional clients and does not sell securities. Invesco Distributors, Inc. is the US distributor for Invesco Ltd.’s retail mutual funds, exchange-traded funds and institutional money market funds. Both are wholly owned, indirect subsidiaries of Invesco Ltd.
| SEC file numbers: 811-09913 and 333-36074 | Invesco Distributors, Inc. | VK-SCD-AR-1 |
| Annual Report to Shareholders | August 31, 2019 |
Invesco Strategic Real Return Fund
Nasdaq:
A: SRRAX ■ C: SRRCX ■ R: SRRQX ■ Y: SRRYX ■ R5: SRRFX ■ R6: SRRSX

Beginning on January 1, 2021, as permitted by regulations adopted by the Securities and Exchange Commission, paper copies of the Fund’s shareholder reports will no longer be sent by mail, unless you specifically request paper copies of the reports from the Fund or from your financial intermediary, such as a broker-dealer or bank. Instead, the reports will be made available on the Fund’s website, and you will be notified by mail each time a report is posted and provided with a website link to access the report.
If you already elected to receive shareholder reports electronically, you will not be affected by this change and you need not take any action. You may elect to receive shareholder reports and other communications from the Fund electronically by contacting your financial intermediary (such as a broker-dealer or bank) or, if you are a direct investor, by enrolling at invesco.com/edelivery.
You may elect to receive all future reports in paper free of charge. If you invest through a financial intermediary, you can contact your financial intermediary to request that you continue to receive paper copies of your shareholder reports. If you invest directly with the Fund, you can call (800) 959-4246 to let the Fund know you wish to continue receiving paper copies of your shareholder reports. Your election to receive reports in paper will apply to all funds held with your financial intermediary or all funds held with the fund complex if you invest directly with the Fund.
Dear Shareholders:
This annual report includes information about your Fund, including performance data and a complete list of its investments as of the close of the reporting period. Inside is a discussion of how your Fund was managed and the factors that affected its performance during the reporting period.
Throughout the reporting period, global equity markets remained volatile. Investor sentiment ranged from elation to fear. The reporting period began with several US equity indexes redefining new highs. The exuberance, however, ended in October 2018 as global equities, in particular US stocks, sold off, with the sharpest decline in December. The catalyst for the sell-off was a combination of ongoing trade concerns between the US and China, fears of a global economic slowdown and lower oil prices from a supply glut. Gains posted earlier in 2018 for global equities were erased, while US Treasury bonds, along with government and municipal bonds, rallied as investors fled to “safe haven” assets.
At the start of 2019, global equity markets rebounded strongly buoyed by more dovish central banks and optimism about a potential US-China trade deal. In May, US-China trade concerns and slowing global growth led to a global equity sell-off and rally in U.S. Treasuries. Despite the May sell-off, domestic equity markets rallied in June in anticipation of a U.S. Federal Reserve (the Fed) rate cut and closed the second quarter with modest gains. As the reporting period ended in August, market volatility once again increased as the US Treasury yield curve inverted several times magnifying concerns that the US economy could be headed into a recession.
During the reporting period, the Fed both raised and lowered the federal funds rate. Given signs of a strong economy, the Fed raised rates two times: in September and December 2018. In 2019, however, the Fed altered its outlook on further rate hikes leaving rates unchanged for the first half of the year. In July, the Fed lowered interest rates for the first time in 11 years. As 2019 unfolds, we’ll see how the interplay of interest rates, economic data, geopolitics and a host of other factors affect US and overseas equity and fixed income markets.
Investor uncertainty and market volatility, such as we witnessed during the reporting period, are unfortunate facts of life when it comes to investing. That’s why Invesco encourages investors to work with a professional financial adviser who can stress the importance of starting to save and invest early and the importance of adhering to a disciplined investment plan. A financial adviser who knows your unique financial situation, investment goals and risk tolerance can be an invaluable partner as you seek to achieve your financial goals. He or she can offer a long-term perspective when markets are volatile and time-tested advice and guidance when your financial situation or investment goals change.
Visit our website for more information on your investments
Our website, invesco.com/us, offers a wide range of market insights and investment perspectives. On the website, you’ll find detailed information about our funds, including performance, holdings and portfolio manager commentaries. You can access information about your account by completing a simple, secure online registration. To do so, select “Log In” on the right side of the homepage, and then select “Register for Individual Account Access.”
In addition to the resources accessible on our website and through our mobile app, you can obtain timely updates to help you stay informed about the markets and the economy by connecting with Invesco on Twitter, LinkedIn or Facebook. You can access our blog at blog.invesco.us.com. Our goal is to provide you the information you want, when and where you want it.
Finally, I’m pleased to share with you Invesco’s commitment to both the Principles for Responsible Investment and to considering environmental, social and governance issues in our robust investment process. I invite you to learn more at invesco.com/esg.
Have questions?
For questions about your account, contact an Invesco client services representative at 800 959 4246.
All of us at Invesco look forward to serving your investment management needs. Thank you for investing with us.
Sincerely,
Andrew Schlossberg
Head of the Americas,
Senior Managing Director, Invesco Ltd.
| 2 | Invesco Strategic Real Return Fund |
Dear Shareholders:
Among the many important lessons I’ve learned in more than 40 years in a variety of business endeavors is the value of a trusted advocate.
As independent chair of the Invesco Funds Board, I can assure you that the members of the Board are strong advocates for the interests of investors in Invesco’s mutual funds. We work hard to represent your interests through oversight of the quality of the investment management services your funds receive and other matters important to your investment, including but not limited to:
| ■ | Ensuring that Invesco offers a diverse lineup of mutual funds that your financial adviser can use to strive to meet your financial needs as your investment goals change over time. |
| ■ | Monitoring how the portfolio management teams of the Invesco funds are performing in light of changing economic and market conditions. |
| ■ | Assessing each portfolio management team’s investment performance within the context of the investment strategy described in the fund’s prospectus. |
| ■ | Monitoring for potential conflicts of interests that may impact the nature of the services that your funds receive. |
We believe one of the most important services we provide our fund shareholders is the annual review of the funds’ advisory and sub-advisory contracts with Invesco Advisers and its affiliates. This review is required by the Investment Company Act of 1940 and focuses on the nature and quality of the services Invesco provides as the adviser to the Invesco funds and the reasonableness of the fees that it charges for those services. Each year, we spend months carefully reviewing information received from Invesco and a variety of independent sources, such as performance and fee data prepared by Lipper, Inc. (a subsidiary of Broadridge Financial Solutions, Inc.), an independent, third-party firm widely recognized as a leader in its field. We also meet with our independent legal counsel and other independent advisers to review and help us assess the information that we have received. Our goal is to assure that you receive quality investment management services for a reasonable fee.
I trust the measures outlined above provide assurance that you have a worthy advocate when it comes to choosing the Invesco Funds.
As always, please contact me at bruce@brucecrockett.com with any questions or concerns you may have. On behalf of the Board, we look forward to continuing to represent your interests and serving your needs.
Sincerely,
Bruce L. Crockett
Independent Chair
Invesco Funds Board of Trustees
| 3 | Invesco Strategic Real Return Fund |
Management’s Discussion of Fund Performance
Performance summary
For the fiscal year ended August 31, 2019, Class A shares of Invesco Strategic Real Return Fund (the Fund), at net asset value (NAV), underperformed the Custom Invesco Strategic Real Return Index, the Fund’s style-specific benchmark.
Your Fund’s long-term performance appears later in this report.
Fund vs. Indexes
Total returns, August 31, 2018 to August 31, 2019, at net asset value (NAV). Performance shown does not include applicable contingent deferred sales charges (CDSC) or front-end sales charges, which would have reduced performance.
| Class A Shares | 5.44% |
| Class C Shares | 4.65 |
| Class R Shares | 5.18 |
| Class Y Shares | 5.59 |
| Class R5 Shares | 5.59 |
| Class R6 Shares | 5.59 |
| ICE BofAML US Inflation-Linked Treasury Index▼ (Broad Market Index)* | 7.80 |
ICE BofAML Current 10-Year US Treasury Index■
(Former Broad Market Index)* | 15.06 |
Custom Invesco Strategic Real Return Index♦
(Style-Specific Index) | 6.20 |
| Lipper Inflation Protected Bond Funds Index▲ (Peer Group Index) | 5.72 |
| Source(s):▼RIMES Technologies Corp.;■ Bloomberg L.P.;♦ Invesco, FactSet Research Systems Inc., RIMES Technologies Corp.;▲Lipper Inc. |
| *The Fund has elected to use the ICE BofAML US Inflation-Linked Treasury Index as its broad market benchmark rather than the ICE BofAML Current 10-Year US Treasury Index because the ICE BofAML US Inflation-Linked Treasury Index more closely reflects the performance of the types of securities in which the Fund invests. |
Market conditions and your Fund
The fiscal year began with a steady flow of positive US economic data that began to show signs of slowing by the end of 2018 and into 2019. The US economy continued to add jobs, pushing the unemployment rate to a low of 3.6% in May 2019, but increased slightly to end the fiscal year at 3.7%.1 Against this backdrop, the US Federal Reserve (the Fed) began the fiscal year raising the federal funds target rate from a range of 1.75% to 2.00% to a range of 2.25% to 2.50% through implementing two interest rate hikes in September 2018 and December 2018.2 This tightening monetary policy, coupled with concerns over trade policies, geopolitical tensions and global economic growth, caused markets to recede and prompted the Fed to decrease its target rate in July 2019 to a range of 2.00% to 2.25%.2
The 10-year US Treasury yield began the fiscal year at 2.86% and slowly increased to a high of 3.23% in October 2018 due to continued strength of inflation and the high probability of additional Fed rate hikes throughout the remainder of 2018.3 While economic data at the beginning of the fiscal year was positive, the slowdown experienced at the end of 2018 dramatically changed the outlook for 2019 and the 10-year US Treasury yield declined steadily throughout the remainder of the fiscal year to end at 1.50%, 136 basis points lower than at the beginning of the fiscal year.3 (A basis point is one one-hundredth of a percent-age point.) Inflation also declined during this period with the Consumer Price Index ending the fiscal year at 1.7% annual growth, down 1.0% from its peak in August 2018 as energy prices subsided.1
In this environment, US Treasury inflation protected securities (TIPS) posted
positive returns, which were driven by lower real rates. TIPS underperformed their nominal US Treasury counterparts on a maturity-matched basis as yields on nominal US Treasuries decreased more than real yields for TIPS during the fiscal year. The difference between yields on a maturity-matched basis and nominal yields on US Treasuries and TIPS is a measure of inflation expectations, also known as breakeven inflation (the amount of inflation needed for TIPS to break even with nominal US Treasuries). During the fiscal year, inflation expectations decreased as nominal rates decreased more than real rates, thus breakeven inflation decreased.
The high yield market ended the fiscal year up 6.56%.4 Overall, credit fundamentals remained resilient but earnings reports started to show signs of slowing at the end of the fiscal year.
The senior loan market started the fiscal year with solid returns, but as investors modified their interest rate expectations return volatility increased. After an initial slump at the beginning of the fiscal year, the asset class saw positive returns toward the end of the fiscal year.
The Fund employs a diversified investment approach in an attempt to manage inflation risk. The Fund invests in bank loans (through investment in an affiliated underlying fund) and high yield securities, in addition to TIPS. Historically, these three asset classes have performed well in inflationary environments, while offering competitive yields. In addition to the three primary asset classes, the investment team may make opportunistic investments in other asset classes that it believes have favorable prospects for current income in inflationary environments.
The Fund generated positive returns for the fiscal year but underperformed its style-specific benchmark, the Custom Invesco Strategic Real Return Index. While the Fund’s underweight allocation
| Portfolio Composition |
| By security type, based on Net Assets |
| as of August 31, 2019 |
| U.S. Treasury Securities | 44.84% |
| Common Stocks & Other Equity Interests | 30.09 |
| U.S. Dollar Denominated Bonds & Notes | 22.06 |
| Preferred Stocks | 1.87 |
| Money Market Funds Plus Other Assets Less Liabilities | 1.14 |
| Top Five Debt Issuers* |
| % of total net assets |
| 1. | U.S. Treasury | 44.9% |
| 2. | NXP B.V./NXP Funding LLC | 0.5 |
| 3. | Altice France S.A. | 0.5 |
| 4. | Virgin Media Secured Finance PLC | 0.5 |
| 5. | Unitymedia Hessen GmbH & Co. KG/Unitymedia NRW GmbH | 0.5 |
| Total Net Assets | $43.7 million |
| Total Number of Holdings* | 334 |
| The Fund’s holdings are subject to change, and there is no assurance that the Fund will continue to hold any particular security. |
| *Excluding money market fund holdings. |
| Data presented here are as of August 31, 2019. |
| 4 | Invesco Strategic Real Return Fund |
to high yield securities was a contributor to the Fund’s relative performance, security selection within high yield securities detracted from relative returns.
The Fund remains largely invested in bank loans (indirectly through an affiliated underlying fund as discussed above), high yield bonds and TIPS with opportunistic allocations to convertible securities. The Fund’s allocation to convertible securities contributed to Fund performance for the fiscal year.
We wish to remind you that the Fund is subject to interest rate risk, meaning when interest rates rise, the value of fixed income securities tends to fall. The degree to which the value of fixed income securities may decline due to rising interest rates may vary depending on the speed and magnitude of the increase in interest rates, as well as individual security characteristics, such as price, maturity, duration and coupon and market forces, such as supply and demand for similar securities.
The Fund’s exposure to bank loans (through its investment in an affiliated underlying fund) includes senior secured loans, which are an asset class that behaves differently from many traditional fixed income investments. The interest income generated by a portfolio of senior secured loans is usually determined by a fixed credit spread over the London Interbank Offered Rate (Libor). Because senior secured loans generally have a very short duration and the coupons or interest rates are usually adjusted every 30 to 90 days as Libor changes, the yield on the portfolio adjusts. Interest rate risk refers to the tendency for traditional fixed income prices to decline when interest rates rise. For senior secured loans, however, interest rates and income are variable and the prices of loans are, therefore, less sensitive to interest rate changes than traditional fixed income bonds — and senior secured loans can provide a natural hedge against rising interest rates.
We are monitoring interest rates, as well as the market, economic and geopolitical factors that may impact the direction, speed and magnitude of changes to interest rates across the maturity spectrum, including the potential impact of monetary policy changes by the Fed and certain central banks. If interest rates decrease further, markets may experience increased volatility, which may affect the value and/or liquidity of certain of the Fund’s investments or the market price of the Fund’s shares.
During the fiscal year, the Fund achieved returns from diversified inflation-sensitive securities. This remains a key goal of the Fund.
Thank you for your investment in Invesco Strategic Real Return Fund.
| 1 | Source: Bureau of Labor Statistics |
| 2 | Source: US Federal Reserve |
| 3 | Source: US Department of the Treasury |
The views and opinions expressed in management’s discussion of Fund performance are those of Invesco Advisers, Inc. These views and opinions are subject to change at any time based on factors such as market and economic conditions. These views and opinions may not be relied upon as investment advice or recommendations, or as an offer for a particular security. The information is not a complete analysis of every aspect of any market, country, industry, security or the Fund. Statements of fact are from sources considered reliable, but Invesco Advisers, Inc. makes no representation or warranty as to their completeness or accuracy. Although historical performance is no guarantee of future results, these insights may help you understand our investment management philosophy.
See important Fund and, if applicable, index disclosures later in this report.
Robert Young
Chartered Financial Analyst, Portfolio Manager, is lead manager of Invesco Strategic Real Return Fund. He joined Invesco in 2001. Mr. Young earned a BA in economics from Cornell University and an MBA in finance and international business from Fordham University.
Thomas Ewald
Portfolio Manager, is manager of Invesco Strategic Real Return Fund. He joined Invesco or its investment advisory affiliates in 2000. Mr. Ewald earned a BA from Harvard College and an MBA from the Darden School of Business at the University of Virginia.
Scott Roberts
Chartered Financial Analyst, Portfolio Manager, is manager of Invesco Strategic Real Return Fund. He joined Invesco in 2000. Mr. Roberts earned a BBA in finance from the University of Houston.
Brian Schneider
Chartered Financial Analyst, Portfolio Manager, is manager of Invesco Strategic Real Return Fund. He joined Invesco in 1987. Mr. Schneider earned a BA in economics and an MBA from Bellarmine University (formerly Bellarmine College).
| 5 | Invesco Strategic Real Return Fund |
Your Fund’s Long-Term Performance
Results of a $10,000 Investment — Oldest Share Class(es) since Inception
Fund and index data from 4/30/14
| 1 | Source: Bloomberg L.P. |
| 2 | Source(s): Invesco, FactSet Research Systems Inc., RIMES Technologies Corp. |
| 3 | Source: RIMES Technologies Corp. |
| 4 | Source: Lipper Inc. |
Past performance cannot guarantee comparable future results.
The Fund has elected to use the ICE BofAML US Inflation-Linked Treasury Index as its broad market benchmark rather than the ICE BofAML Current 10-Year US Treasury Index because the ICE BofAML US Inflation-Linked Treasury Index more closely reflects the performance of the types of securities in which
the Fund invests. Because this is the first reporting period since we have adopted the new index, SEC guidelines require that we compare performance to both the old and new indexes.
The data shown in the chart include reinvested distributions, applicable sales charges and Fund expenses including management fees. Index results include
reinvested dividends, but they do not reflect sales charges. Performance of the peer group, if applicable, reflects fund expenses and management fees; performance of a market index does not. Performance shown in the chart and table(s) does not reflect deduction of taxes a shareholder would pay on Fund distributions or sale of Fund shares.
| 6 | Invesco Strategic Real Return Fund |
| Average Annual Total Returns |
| As of 8/31/19, including maximum applicable sales charges |
| Class A Shares | |
| Inception (4/30/14) | 2.43% |
| 5 Years | 2.11 |
| 1 Year | 2.76 |
| Class C Shares | |
| Inception (4/30/14) | 2.15% |
| 5 Years | 1.86 |
| 1 Year | 3.65 |
| Class R Shares | |
| Inception (4/30/14) | 2.67% |
| 5 Years | 2.37 |
| 1 Year | 5.18 |
| Class Y Shares | |
| Inception (4/30/14) | 3.18% |
| 5 Years | 2.89 |
| 1 Year | 5.59 |
| Class R5 Shares | |
| Inception (4/30/14) | 3.18% |
| 5 Years | 2.89 |
| 1 Year | 5.59 |
| Class R6 Shares | |
| Inception (4/30/14) | 3.18% |
| 5 Years | 2.89 |
| 1 Year | 5.59 |
The performance data quoted represent past performance and cannot guarantee comparable future results; current performance may be lower or higher. Please visit invesco.com/performance for the most recent month-end performance. Performance figures reflect reinvested distributions, changes in net asset value and the effect of the maximum sales charge unless otherwise stated. Investment return and principal value will fluctuate so that you may have a gain or loss when you sell shares.
The net annual Fund operating expense ratio set forth in the most recent Fund prospectus as of the date of this report for Class A, Class C, Class R, Class Y, Class R5 and Class R6 shares was 0.82%, 1.57%, 1.07%, 0.57%, 0.57%, and 0.57%, respectively.1,2,3The total annual Fund operating expense ratio set forth in the most recent Fund prospectus as of the date of this report for Class A, Class C, Class R, Class Y, Class R5 and Class R6 shares was 1.88%, 2.63%, 2.13%, 1.63%, 1.56% and 1.56%, respectively.1 The expense ratios presented above may vary from the expense ratios presented in other
| Average Annual Total Returns |
| As of 6/30/19, the most recent calendar quarter end, including maximum applicable sales charges |
| Class A Shares | |
| Inception (4/30/14) | 2.20% |
| 5 Years | 1.87 |
| 1 Year | 2.04 |
| Class C Shares | |
| Inception (4/30/14) | 1.94% |
| 5 Years | 1.62 |
| 1 Year | 2.82 |
| Class R Shares | |
| Inception (4/30/14) | 2.46% |
| 5 Years | 2.15 |
| 1 Year | 4.34 |
| Class Y Shares | |
| Inception (4/30/14) | 2.96% |
| 5 Years | 2.65 |
| 1 Year | 4.87 |
| Class R5 Shares | |
| Inception (4/30/14) | 2.96% |
| 5 Years | 2.65 |
| 1 Year | 4.76 |
| Class R6 Shares | |
| Inception (4/30/14) | 2.99% |
| 5 Years | 2.67 |
| 1 Year | 4.87 |
sections of this report that are based on expenses incurred during the period covered by this report.
Class A share performance reflects the maximum 2.50% sales charge, and Class C share performance reflects the applicable contingent deferred sales charge (CDSC) for the period involved. The CDSC on Class C shares is 1% for the first year after purchase. Class R, Class Y, Class R5 and Class R6 shares do not have a front-end sales charge or a CDSC; therefore, performance is at net asset value.
The performance of the Fund’s share classes will differ primarily due to different sales charge structures and class expenses.
Fund performance reflects any applicable fee waivers and/or expense reimbursements. Had the adviser not waived fees and/or reimbursed expenses currently or in the past, returns would have been lower. See current prospectus for more information.
| 1 | The expense ratio includes acquired fund fees and expenses of the underlying funds in which the Fund invests of 0.21%. |
| 2 | Total annual Fund operating expenses after any contractual fee waivers and/or expense reimbursements by the adviser in effect |
| | through at least December 31, 2019. See current prospectus for more information. |
| 3 | Total annual Fund operating expenses after any contractual fee waivers by the adviser in effect through at least June 30, 2021. See current prospectus for more information. |
| 7 | Invesco Strategic Real Return Fund |
Invesco Strategic Real Return Fund’s investment objective is to seek to mitigate the effects of unanticipated inflation and to provide current income.
| ■ | Unless otherwise stated, information presented in this report is as of August 31, 2019, and is based on total net assets. |
| ■ | Unless otherwise noted, all data provided by Invesco. |
| ■ | To access your Fund’s reports/prospectus, visit invesco.com/fundreports. |
About share classes
| ■ | Class R shares are generally available only to employer sponsored retirement and benefit plans. Please see the prospectus for more information. |
| ■ | Class Y shares are available only to certain investors. Please see the prospectus for more information. |
| ■ | Class R5 sharesand Class R6 sharesare available for use by retirement plans that meet certain standards and for institutional investors. Class R6 shares are also available through intermediaries that have established an agreement with Invesco Distributors, Inc. to make such shares available for use in retail omnibus accounts. Please see the prospectus for more information. |
Principal risks of investing in the Fund
| ■ | Asset-backed securities risk. Asset-backed securities are subject to prepayment or call risk, which is the risk that a borrower’s payments may be received earlier or later than expected due to changes in prepayment rates on underlying loans, which could result in the Fund reinvesting these early payments at lower interest rates, thereby reducing the Fund’s income. Asset-backed securities also are subject to extension risk, which is the risk that a rise in interest rates could reduce the rate of prepayments, causing the price of the asset-backed securities and the Fund’s share price to fall. |
| ■ | Bank loan risk. There are a number of risks associated with an investment in bank loans including credit risk, interest rate risk, liquidity risk and prepayment risk. For the Fund, these risks related to bank loans are associated with the underlying funds in which the Fund invests. Lack of an active trading market, restrictions on resale, irregular trading activity, wide bid/ask spreads and extended trade settlement periods may impair the Fund’s |
| | ability to sell bank loans within its desired time frame or at an acceptable price and its ability to accurately value existing and prospective investments. Extended trade settlement periods may result in cash not being immediately available to the Fund. As a result, the Fund may have to sell other investments or engage in borrowing transactions to raise cash to meet its obligations. The risk of holding bank loans is also directly tied to the risk of insolvency or bankruptcy of the issuing banks. These risks could cause the Fund to lose income or principal on a particular investment, which in turn could affect the Fund’s returns. The value of bank loans can be affected by and sensitive to changes in government regulation and to economic downturns in the United States and abroad. Bank loans generally are floating rate loans, which are subject to interest rate risk as the interest paid on the floating rate loans adjusts periodically based on changes in widely accepted reference rates. |
| ■ | Changing fixed income market conditions risk. The current low interest rate environment was created in part by the Federal Reserve Board (FRB) and certain foreign central banks keeping the federal funds and equivalent foreign rates near historical lows. Increases in the federal funds and equivalent foreign rates may expose fixed income markets to heightened volatility and reduced liquidity for certain fixed income investments, particularly those with longer maturities. In addition, decreases in fixed income dealer market-making capacity may also potentially lead to heightened volatility and reduced liquidity in the fixed income markets. As a result, the value of the Fund’s investments and share price may decline. Changes in central bank policies could also result in higher than normal shareholder |
| | redemptions, which could potentially increase portfolio turnover and the Fund’s transaction costs. |
| ■ | Collateralized loan obligations risk. CLOs are subject to the risks of substantial losses due to actual defaults by underlying borrowers, which will be greater during periods of economic or financial stress. CLOs may also lose value due to collateral defaults and disappearance of subordinate tranches, market anticipation of defaults, and investor aversion to CLO securities as a class. The risks of CLOs will be greater if the Fund invests in CLOs that hold loans of uncreditworthy borrowers or if the Fund holds subordinate tranches of the CLO that absorbs losses from the defaults before senior tranches. In addition, CLOs are subject to interest rate risk and credit risk. |
| ■ | Convertible securities risk. The market values of convertible securities are affected by market interest rates, the risk of actual issuer default on interest or principal payments and the value of the underlying common stock into which the convertible security may be converted. Additionally, a convertible security is subject to the same types of market and issuer risks as apply to the underlying common stock. In addition, certain convertible securities are subject to involuntary conversions and may undergo principal write-downs upon the occurrence of certain triggering events, and, as a result, are subject to an increased risk of loss. Convertible securities may be rated below investment grade. |
| ■ | Debt securities risk. The prices of debt securities held by the Fund will be affected by changes in interest rates, the creditworthiness of the issuer and other factors. An increase in prevailing interest rates typically causes the value of existing debt securities to fall and often has a greater impact on longer-duration debt securities and higher quality debt securities. Falling |
This report must be accompanied or preceded by a currently effective Fund prospectus, which contains more complete information, including sales charges and expenses. Investors should read it carefully before investing.
NOT FDIC INSURED | MAY LOSE VALUE | NO BANK GUARANTEE
| 8 | Invesco Strategic Real Return Fund |
| | interest rates will cause the Fund to reinvest the proceeds of debt securities that have been repaid by the issuer at lower interest rates. Falling interest rates may also reduce the Fund’s distributable income because interest payments on floating rate debt instruments held by the Fund will decline. The Fund could lose money on investments in debt securities if the issuer or borrower fails to meet its obligations to make interest payments and/or to repay principal in a timely manner. Changes in an issuer’s financial strength, the market’s perception of such strength or in the credit rating of the issuer or the security may affect the value of debt securities. The Adviser’s credit analysis may fail to anticipate such changes, which could result in buying a debt security at an inopportune time or failing to sell a debt security in advance of a price decline or other credit event. |
| ■ | Defaulted securities risk. Defaulted securities pose a greater risk that principal will not be repaid than non-defaulted securities. Defaulted securities and any securities received in an exchange for such securities may be subject to restrictions on resale. |
| ■ | Derivatives risk. The value of a derivative instrument depends largely on (and is derived from) the value of an underlying security, currency, commodity, interest rate, index or other asset (each referred to as an underlying asset). In addition to risks relating to the underlying assets, the use of derivatives may include other, possibly greater, risks, including counterparty, leverage and liquidity risks. Counterparty risk is the risk that the counterparty to the derivative contract will default on its obligation to pay the Fund the amount owed or otherwise perform under the derivative contract. Derivatives create leverage risk because they do not require payment up front equal to the economic exposure created by holding a position in the derivative. As a result, an adverse change in the value of the underlying asset could result in the Fund sustaining a loss that is substantially greater than the amount invested in the derivative or the anticipated value of the underlying asset, which may make the Fund’s returns more volatile and increase the risk of loss. Derivative instruments may also be less liquid than more traditional investments and the Fund may be unable to sell or close out its deriva- |
| | tive positions at a desirable time or price. This risk may be more acute under adverse market conditions, during which the Fund may be most in need of liquidating its derivative positions. Derivatives may also be harder to value, less tax efficient and subject to changing government regulation that could impact the Fund’s ability to use certain derivatives or their cost. Derivatives strategies may not always be successful. For example, derivatives used for hedging or to gain or limit exposure to a particular market segment may not provide the expected benefits, particularly during adverse market conditions. |
| ■ | Exchange-traded funds risk. In addition to the risks associated with the underlying assets held by the exchange-traded fund, investments in exchange-traded funds are subject to the following additional risks: (1) an exchange-traded fund’s shares may trade above or below its net asset value; (2) an active trading market for the exchange-traded fund’s shares may not develop or be maintained; (3) trading an exchange-traded fund’s shares may be halted by the listing exchange; (4) a passively managed exchange-traded fund may not track the performance of the reference asset; and (5) a passively managed exchange-traded fund may hold troubled securities. Investment in exchange-traded funds may involve duplication of management fees and certain other expenses, as the Fund indirectly bears its proportionate share of any expenses paid by the exchange-traded funds in which it invests. Further, certain exchange-traded funds in which the Fund may invest are leveraged, which may result in economic leverage, permitting the Fund to gain exposure that is greater than would be the case in an unlevered instrument and potentially resulting in greater volatility. |
| ■ | Financial services sector risk. The Fund may be susceptible to adverse economic or regulatory occurrences affecting the financial services sector. Financial services companies are subject to extensive government regulation and are disproportionately affected by unstable interest rates, each of which could adversely affect the profitability of such companies. Financial services companies may also have concentrated portfolios, which makes them especially vulnerable to unstable economic conditions. |
| ■ | Foreign securities risk. An underlying fund’s foreign investments may be adversely affected by political and social instability, changes in economic or taxation policies, difficulty in enforcing obligations, decreased liquidity or increased volatility. Foreign investments also involve the risk of the possible seizure, nationalization or expropriation of the issuer or foreign deposits (in which an underlying fund could lose its entire investments in a certain market) and the possible adoption of foreign governmental restrictions such as exchange controls. Unless an underlying fund has hedged its foreign securities risk, foreign securities risk also involves the risk of negative foreign currency rate fluctuations, which may cause the value of securities denominated in such foreign currency (or other instruments through which an underlying fund has exposure to foreign currencies) to decline in value. Currency exchange rates may fluctuate significantly over short periods of time. Currency hedging strategies, if used, are not always successful. |
| ■ | High yield debt securities (junk bond) risk. Investments in high yield debt securities (“junk bonds”) and other lower-rated securities will subject the Fund to substantial risk of loss. These securities are considered to be speculative with respect to the issuer’s ability to pay interest and principal when due, are more susceptible to default or decline in market value and are less liquid than investment grade debt securities. Prices of high yield debt securities tend to be very volatile. |
| ■ | Indexing risk. Certain portions of the Fund’s assets are managed pursuant to an indexing approach (Indexed Assets) and, therefore, the adverse performance of a particular security necessarily will not result in the elimination of the security from the Indexed Assets. Ordinarily, the Fund will not sell portfolio securities of the Indexed Assets except to reflect additions or deletions of the securities that comprise the index the Fund seeks to track with respect to the Indexed Assets (Underlying Index), or as may be necessary to raise cash to pay Fund shareholders who sell Fund shares. As such, the Indexed Assets, and therefore the Fund, will be negatively affected by declines in the securities represented by the Underlying Index. Also, there is no guarantee that |
| 9 | Invesco Strategic Real Return Fund |
| | the Fund will be able to correlate the performance of the Indexed Assets with that of the Underlying Index. |
| ■ | Inflation-indexed securities risk. The values of inflation-indexed securities generally fluctuate in response to changes in real interest rates, and the Fund’s income from its investments in these securities is likely to fluctuate considerably more than the income distributions of its investments in more traditional fixed-income securities. |
| ■ | Inflation-indexed securities tax risk. Any increase in the principal amount of an inflation-indexed security may be included for tax purposes in the Fund’s gross income, even though no cash attributable to such gross income has been received by the Fund. In such event, the Fund may be required to make annual distributions to shareholders that exceed the cash it has otherwise received. In order to pay such distributions, the Fund may be required to raise cash by selling portfolio investments. The sale of such investments could result in capital gains to the Fund and additional capital gain distributions to shareholders. In addition, adjustments during the taxable year for deflation to an inflation-indexed bond held by the Fund may cause amounts previously distributed to shareholders in the taxable year as income to be characterized as a return of capital. |
| ■ | Investment companies risk. Investing in other investment companies could result in the duplication of certain fees, including management and administrative fees, and may expose the Fund to the risks of owning the underlying investments that the other investment company holds. |
| ■ | Liquidity risk. The Fund may be unable to sell illiquid investments at the time or price it desires and, as a result, could lose its entire investment in such investments. Liquid securities can become illiquid during periods of market stress. If a significant amount of the Fund’s securities become illiquid, the Fund may not be able to timely pay redemption proceeds and may need to sell securities at significantly reduced prices. |
| ■ | Management risk. Certain portions of the Fund’s assets are actively managed and depend heavily on the Adviser’s judgment about markets, interest rates or the attractiveness, relative values, liquidity, or potential appreciation of particular investments |
| | made for the Fund’s portfolio. The Fund could experience losses if these judgments prove to be incorrect. Because the Fund’s investment process relies heavily on its asset allocation process, market movements that are counter to the portfolio managers’ expectations may have a significant adverse effect on the Fund’s net asset value. Additionally, legislative, regulatory, or tax developments may adversely affect management of the Fund and, therefore, the ability of the Fund to achieve its investment objective. |
| ■ | Market risk. The market values of the Fund’s investments, and therefore the value of the Fund’s shares, will go up and down, sometimes rapidly or unpredictably. Market risk may affect a single issuer, industry or section of the economy, or it may affect the market as a whole. Individual stock prices tend to go up and down more dramatically than those of certain other types of investments, such as bonds. During a general downturn in the financial markets, multiple asset classes may decline in value. When markets perform well, there can be no assurance that specific investments held by the Fund will rise in value. |
| ■ | Preferred securities risk. Preferred securities are subject to issuer-specific and market risks applicable generally to equity securities. Preferred securities also may be subordinated to bonds or other debt instruments, subjecting them to a greater risk of non-payment, may be less liquid than many other securities, such as common stocks, and generally offer no voting rights with respect to the issuer. |
| ■ | Reverse repurchase agreement risk. If the market value of securities to be repurchased declines below the repurchase price, or the other party defaults on its obligation, the Fund may be delayed or prevented from completing the transaction. In the event the buyer of securities under a reverse repurchase agreement files for bankruptcy or becomes insolvent, the Fund’s use of the proceeds from the sale of the securities may be restricted. When the Fund engages in reverse repurchase agreements, changes in the value of the Fund’s investments will have a larger effect on its share price than if it did not engage in these transactions due to the effect of leverage, which will make the Fund’s returns more volatile and |
| | increase the risk of loss. Additionally, interest expenses related to reverse repurchase agreements could exceed the rate of return on other investments held by the Fund, thereby reducing returns to shareholders. |
| ■ | Risk of subordinated debt. Perpetual subordinated debt is a type of hybrid instrument that has no maturity date for the return of principal and does not need to be redeemed by the issuer. These investments typically have lower credit ratings and lower priority than other obligations of an issuer during bankruptcy, presenting a greater risk for nonpayment. This risk increases as the priority of the obligation becomes lower. Payments on these securities may be subordinated to all existing and future liabilities and obligations of subsidiaries and associated companies of an issuer. Additionally, some perpetual subordinated debt does not restrict the ability of an issuer’s subsidiaries to incur further unsecured indebtedness. |
| ■ | Sampling risk. The use by the TIPS Portfolio of a representative sampling approach will result in its holding a smaller number of securities than are in the Underlying Index and in the TIPS Portfolio holding securities not included in the Underlying Index. As a result, an adverse development respecting an issuer of securities held by the TIPS Portfolio could result in a greater decline in the Fund’s NAV than would be the case if all of the securities in the Underlying Index were held. The use by the TIPS Portfolio of a representative sampling approach may also include the risk that it may not track the return of the Underlying Index as well as it would have if the TIPS Portfolio held all of the securities in the Underlying Index. |
| ■ | Short position risk. Because the Fund’s potential loss on a short position arises from increases in the value of the asset sold short, the Fund will incur a loss on a short position, which is theoretically unlimited, if the price of the asset sold short increases from the short sale price. The counterparty to a short position or other market factors may prevent the Fund from closing out a short position at a desirable time or price and may reduce or eliminate any gain or result in a loss. In a rising market, the Fund’s short positions will cause the Fund to underperform the overall market and its peers that do not engage in shorting. If the Fund holds both long and short |
| 10 | Invesco Strategic Real Return Fund |
| | positions, and both positions decline simultaneously, the short positions will not provide any buffer (hedge) from declines in value of the Fund’s long positions. Certain types of short positions involve leverage, which may exaggerate any losses, potentially more than the actual cost of the investment, and will increase the volatility of the Fund’s returns. |
| ■ | US government obligations risk. Obligations of US government agencies and authorities receive varying levels of support and may not be backed by the full faith and credit of the US government, which could affect the Fund’s ability to recover should they default. No assurance can be given that the US government will provide financial support to its agencies and authorities if it is not obligated by law to do so. |
| ■ | When-issued, delayed delivery and forward commitment risks. When-issued and delayed delivery transactions subject the Fund to market risk because the value or yield of a security at delivery may be more or less than the purchase price or yield generally available when delivery occurs, and counterparty risk because the Fund relies on the buyer or seller, as the case may be, to consummate the transaction. These transactions also have a leveraging effect on the Fund because the Fund commits to purchase securities that it does not have to pay for until a later date, which increases the Fund’s overall investment exposure and, as a result, its volatility. |
About indexes used in this report
| ■ | TheICE BofAML Current 10-Year US Treasury Index is composed of the most recently issued 10-year US Treasury Note. |
| ■ | TheICE BofAML US Inflation-Linked Treasury Indextracks the performance of US dollar-denominated, inflation-linked sovereign debt publicly issued by the US government in its domestic market. |
| ■ | TheCustom Invesco Strategic Real Return Index is composed of 45% ICE BofAML US Inflation-Linked Treasury Index, 30% S&P/LSTA Leveraged Loan Index and 25% ICE BofAML US High Yield Constrained Index. |
| ■ | The Lipper Inflation Protected Bond Funds Indexis an unmanaged index considered representative of inflation protected bond funds tracked by Lipper. |
| ■ | TheS&P/LSTA Leveraged Loan Index reflects the performance of US dollar-denominated institutional leveraged loans. |
| ■ | TheICE BofAML US High Yield Constrained Index tracks the performance of US high yield bonds. |
| ■ | The Fund is not managed to track the performance of any particular index, including the index(es) described here, and consequently, the performance of the Fund may deviate significantly from the performance of the index(es). |
| ■ | A direct investment cannot be made in an index. Unless otherwise indicated, index results include reinvested dividends, and they do not reflect sales charges. Performance of the peer group, if applicable, reflects fund expenses; performance of a market index does not. |
| ■ | CE Data Indices and its affiliates (ICE BofAML) indices and related information, the name “ICE BofAML“ and related trademarks, are intellectual property licensed from ICE BofAML, and may not be copied, used or distributed without ICE BofAML’s prior written approval. The licensee’s products have not been passed on as to their legality or suitability, and are not regulated, issued, endorsed, sold, guaranteed or promoted by ICE BofAML. ICE BOFAML MAKES NO WARRANTIES AND BEARS NO LIABILITY WITH RESPECT TO THE INDICES, ANY RELATED INFORMATION, ITS TRADEMARKS, OR THE PRODUCT(S) (INCLUDING WITHOUT LIMITATION, THEIR QUALITY, ACCURACY, SUITABILITY AND/OR COMPLETENESS). |
Other information
| ■ | The returns shown in management’s discussion of Fund performance are based on net asset values (NAVs) calculated for shareholder transactions. Generally accepted accounting principles require adjustments to be made to the net assets of the Fund at period end for financial reporting purposes, and as such, the NAVs for shareholder transactions and the returns based on those NAVs may differ from the NAVs and returns reported in the Financial Highlights. |
| ■ | Industry classifications used in this report are generally according to the Global Industry Classification Standard, which was developed by and is the exclusive property and a service mark of MSCI Inc. and Standard & Poor’s. |
| 11 | Invesco Strategic Real Return Fund |
Schedule of Investments(a)
August 31, 2019
| | Principal
Amount | Value |
| U.S. Treasury Securities–44.84% |
| U.S. Treasury Inflation — Indexed Bonds–15.33%(b) |
| 2.38%, 01/15/2025 | | $527,781 | $593,377 |
| 2.00%, 01/15/2026 | | 361,348 | 406,415 |
| 2.38%, 01/15/2027 | | 289,973 | 340,076 |
| 1.75%, 01/15/2028 | | 258,346 | 295,535 |
| 3.63%, 04/15/2028 | | 367,884 | 480,934 |
| 2.50%, 01/15/2029 | | 230,014 | 283,258 |
| 3.88%, 04/15/2029 | | 420,843 | 575,462 |
| 3.38%, 04/15/2032 | | 100,869 | 142,594 |
| 2.13%, 02/15/2040 | | 246,021 | 337,841 |
| 2.13%, 02/15/2041 | | 385,747 | 535,192 |
| 0.75%, 02/15/2042 | | 360,930 | 395,324 |
| 0.63%, 02/15/2043 | | 361,299 | 383,950 |
| 1.38%, 02/15/2044 | | 348,616 | 432,698 |
| 0.75%, 02/15/2045 | | 343,831 | 375,530 |
| 1.00%, 02/15/2046 | | 304,848 | 353,047 |
| 0.88%, 02/15/2047 | | 283,101 | 320,283 |
| 1.00%, 02/15/2048 | | 265,287 | 310,291 |
| 1.00%, 02/15/2049 | | 120,113 | 141,797 |
| | | | 6,703,604 |
| U.S. Treasury Inflation — Indexed Notes–29.51%(b) |
| 1.13%, 01/15/2021 | | 605,600 | 608,381 |
| 0.13%, 04/15/2021 | | 677,618 | 670,927 |
| 0.63%, 07/15/2021 | | 556,188 | 559,482 |
| 0.13%, 01/15/2022 | | 644,724 | 640,641 |
| 0.13%, 04/15/2022 | | 642,997 | 638,804 |
| 0.13%, 07/15/2022 | | 624,641 | 623,971 |
| 0.13%, 01/15/2023 | | 629,305 | 628,000 |
| 0.63%, 04/15/2023 | | 672,445 | 682,768 |
| 0.38%, 07/15/2023 | | 632,544 | 640,714 |
| 0.63%, 01/15/2024 | | 629,236 | 644,620 |
| 0.50%, 04/15/2024 | | 453,969 | 463,301 |
| 0.13%, 07/15/2024 | | 608,841 | 613,732 |
| 0.25%, 01/15/2025 | | 615,550 | 623,122 |
| 0.38%, 07/15/2025 | | 603,673 | 618,577 |
| 0.63%, 01/15/2026 | | 629,756 | 653,923 |
| 0.13%, 07/15/2026 | | 549,683 | 556,224 |
| 0.38%, 01/15/2027 | | 566,238 | 581,417 |
| 0.38%, 07/15/2027 | | 534,340 | 551,677 |
| 0.50%, 01/15/2028 | | 563,960 | 587,113 |
| 0.75%, 07/15/2028 | | 519,394 | 555,622 |
| 0.88%, 01/15/2029 | | 507,205 | 549,160 |
| 0.25%, 07/15/2029 | | 205,279 | 211,202 |
| | | | 12,903,378 |
| Total U.S. Treasury Securities (Cost $18,674,744) | 19,606,982 |
| | Shares | Value |
| Common Stocks & Other Equity Interests–30.09% |
| Fixed Income Fund–30.09% |
Invesco Floating Rate Fund, Class R6(c)
(Cost $13,447,866) | 1,780,815 | $13,160,222 |
| | Principal
Amount | |
| U.S. Dollar Denominated Bonds & Notes–22.06% |
| Aerospace & Defense–0.69% |
| Bombardier, Inc. (Canada), | | |
| 8.75%, 12/01/2021(d) | | $19,000 | 20,686 |
| 5.75%, 03/15/2022(d) | | 23,000 | 23,316 |
| 6.13%, 01/15/2023(d) | | 24,000 | 23,940 |
| 7.50%, 03/15/2025(d) | | 19,000 | 18,573 |
| 7.88%, 04/15/2027(d) | | 28,000 | 27,195 |
| Moog, Inc., 5.25%, 12/01/2022(d) | | 12,000 | 12,255 |
| TransDigm, Inc., | | |
| 6.50%, 07/15/2024 | | 4,000 | 4,145 |
| 6.50%, 05/15/2025 | | 53,000 | 55,451 |
| 6.25%, 03/15/2026(d) | | 50,000 | 54,061 |
| 6.38%, 06/15/2026 | | 23,000 | 24,225 |
| Triumph Group, Inc., 7.75%, 08/15/2025 | | 36,000 | 36,180 |
| | | | 300,027 |
| Agricultural & Farm Machinery–0.13% |
| Titan International, Inc., 6.50%, 11/30/2023 | | 70,000 | 56,175 |
| Air Freight & Logistics–0.01% |
| XPO Logistics, Inc., 6.50%, 06/15/2022(d) | | 6,000 | 6,147 |
| Alternative Carriers–0.24% |
| CenturyLink, Inc., | | |
| Series S, 6.45%, 06/15/2021 | | 18,000 | 19,012 |
| Series Y, 7.50%, 04/01/2024 | | 24,000 | 26,700 |
| Level 3 Financing, Inc., | | |
| 5.38%, 05/01/2025 | | 44,000 | 45,870 |
| 5.25%, 03/15/2026 | | 14,000 | 14,630 |
| | | | 106,212 |
| Aluminum–0.04% |
| Novelis Corp., 6.25%, 08/15/2024(d) | | 18,000 | 18,900 |
| Apparel Retail–0.21% |
| L Brands, Inc., | | |
| 5.63%, 02/15/2022 | | 46,000 | 48,530 |
| 6.88%, 11/01/2035 | | 8,000 | 6,800 |
| 6.75%, 07/01/2036 | | 2,000 | 1,690 |
| Michaels Stores, Inc., 8.00%, 07/15/2027(d) | | 34,000 | 32,690 |
| | | | 89,710 |
See accompanying Notes to Financial Statements which are an integral part of the financial statements.
| 12 | Invesco Strategic Real Return Fund |
| | Principal
Amount | Value |
| Asset Management & Custody Banks–0.05% |
| Prime Security Services Borrower LLC/Prime Finance, Inc., 9.25%, 05/15/2023(d) | | $21,000 | $22,123 |
| Auto Parts & Equipment–0.18% |
| Dana Financing Luxembourg S.a.r.l., 5.75%, 04/15/2025(d) | | 30,000 | 30,750 |
| Delphi Technologies PLC, 5.00%, 10/01/2025(d) | | 15,000 | 13,012 |
| Flexi-Van Leasing, Inc., 10.00%, 02/15/2023(d) | | 12,000 | 11,790 |
| Tenneco, Inc., 5.38%, 12/15/2024 | | 25,000 | 21,625 |
| | | | 77,177 |
| Automobile Manufacturers–0.12% |
| J.B. Poindexter & Co., Inc., 7.13%, 04/15/2026(d) | | 50,000 | 51,375 |
| Automotive Retail–0.34% |
| Capitol Investment Merger Sub 2 LLC, 10.00%, 08/01/2024(d) | | 10,000 | 10,400 |
| Lithia Motors, Inc., 5.25%, 08/01/2025(d) | | 7,000 | 7,271 |
| Murphy Oil USA, Inc., 5.63%, 05/01/2027 | | 42,000 | 44,310 |
| Penske Automotive Group, Inc., 5.50%, 05/15/2026 | | 83,000 | 87,254 |
| | | | 149,235 |
| Broadcasting–0.65% |
| AMC Networks, Inc., 5.00%, 04/01/2024 | | 68,000 | 70,210 |
| Clear Channel Worldwide Holdings, Inc., 9.25%, 02/15/2024(d) | | 59,000 | 64,826 |
| Gray Television, Inc., 7.00%, 05/15/2027(d) | | 16,000 | 17,555 |
| iHeartCommunications, Inc., | | |
| 8.38%, 05/01/2027 | | 29,000 | 31,429 |
| 5.25%, 08/15/2027(d) | | 20,000 | 21,078 |
| Liberty Interactive LLC, | | |
Conv.,
1.75%, 10/05/2023(d)(e) | | 25,000 | 32,349 |
| 3.50%, 01/15/2031 | | 50,000 | 48,344 |
| | | | 285,791 |
| Cable & Satellite–2.90% |
| Altice Financing S.A. (Luxembourg), 6.63%, 02/15/2023(d) | | 200,000 | 206,750 |
| CCO Holdings LLC/CCO Holdings Capital Corp., | | |
| 5.75%, 09/01/2023 | | 20,000 | 20,442 |
| 5.75%, 02/15/2026(d) | | 111,000 | 117,799 |
| CSC Holdings, LLC, 6.75%, 11/15/2021 | | 97,000 | 105,003 |
| DISH DBS Corp., | | |
| 7.88%, 09/01/2019 | | 25,000 | 25,000 |
| 5.88%, 11/15/2024 | | 102,000 | 97,415 |
| DISH Network Corp., 3.38%, 08/15/2026 | | 100,000 | 92,275 |
| | Principal
Amount | Value |
| Cable & Satellite–(continued) |
| Unitymedia Hessen GmbH & Co. KG/Unitymedia NRW GmbH (Germany), 5.00%, 01/15/2025(d) | | $201,000 | $208,310 |
| Virgin Media Secured Finance PLC (United Kingdom), 5.50%, 08/15/2026(d) | | 200,000 | 209,750 |
| VTR Finance B.V. (Chile), 6.88%, 01/15/2024(d) | | 180,000 | 186,525 |
| | | | 1,269,269 |
| Casinos & Gaming–0.41% |
| Boyd Gaming Corp., | | |
| 6.88%, 05/15/2023 | | 8,000 | 8,328 |
| 6.38%, 04/01/2026 | | 61,000 | 64,889 |
| MGM Resorts International, | | |
| 7.75%, 03/15/2022 | | 40,000 | 45,009 |
| 4.63%, 09/01/2026 | | 17,000 | 17,680 |
| Scientific Games International, Inc., 10.00%, 12/01/2022 | | 13,000 | 13,536 |
| Wynn Las Vegas LLC/Wynn Las Vegas Capital Corp., 5.50%, 03/01/2025(d) | | 28,000 | 29,610 |
| | | | 179,052 |
| Coal & Consumable Fuels–0.12% |
| SunCoke Energy Partners L.P./SunCoke Energy Partners Finance Corp., 7.50%, 06/15/2025(d) | | 55,000 | 52,284 |
| Commodity Chemicals–0.23% |
| Koppers, Inc., 6.00%, 02/15/2025(d) | | 57,000 | 55,717 |
| Nufarm Australia Ltd./Nufarm Americas, Inc. (Australia), 5.75%, 04/30/2026(d) | | 12,000 | 11,370 |
| Olin Corp., 5.63%, 08/01/2029 | | 31,000 | 32,279 |
| | | | 99,366 |
| Communications Equipment–0.21% |
| CommScope Technologies LLC, 6.00%, 06/15/2025(d) | | 45,000 | 40,387 |
| Hughes Satellite Systems Corp., | | |
| 7.63%, 06/15/2021 | | 17,000 | 18,403 |
| 5.25%, 08/01/2026 | | 31,000 | 32,976 |
| | | | 91,766 |
| Construction & Engineering–0.14% |
| AECOM, 5.13%, 03/15/2027 | | 23,000 | 24,139 |
| William Lyon Homes, Inc., | | |
| 6.00%, 09/01/2023 | | 5,000 | 5,212 |
| 6.63%, 07/15/2027(d) | | 33,000 | 33,165 |
| | | | 62,516 |
| Consumer Finance–0.51% |
| Ally Financial, Inc., | | |
| 8.00%, 03/15/2020 | | 15,000 | 15,457 |
| 5.13%, 09/30/2024 | | 65,000 | 72,800 |
| 4.63%, 03/30/2025 | | 10,000 | 10,963 |
See accompanying Notes to Financial Statements which are an integral part of the financial statements.
| 13 | Invesco Strategic Real Return Fund |
| | Principal
Amount | Value |
| Consumer Finance–(continued) |
| Navient Corp., | | |
| 8.00%, 03/25/2020 | | $20,000 | $20,650 |
| 7.25%, 01/25/2022 | | 60,000 | 66,000 |
| 7.25%, 09/25/2023 | | 33,000 | 36,754 |
| | | | 222,624 |
| Copper–0.19% |
| Freeport-McMoRan, Inc., 5.40%, 11/14/2034 | | 37,000 | 35,705 |
| Taseko Mines Ltd. (Canada), 8.75%, 06/15/2022(d) | | 49,000 | 46,917 |
| | | | 82,622 |
| Diversified Banks–0.11% |
| Royal Bank of Scotland Group PLC (The) (United Kingdom), 6.00%, 12/19/2023 | | 45,000 | 49,040 |
| Diversified Chemicals–0.08% |
| Chemours Co. (The), | | |
| 6.63%, 05/15/2023 | | 6,000 | 6,128 |
| 7.00%, 05/15/2025 | | 21,000 | 20,790 |
| Trinseo Materials Operating S.C.A./Trinseo Materials Finance, Inc., 5.38%, 09/01/2025(d) | | 8,000 | 7,540 |
| | | | 34,458 |
| Diversified Metals & Mining–0.10% |
| Hudbay Minerals, Inc. (Canada), 7.63%, 01/15/2025(d) | | 41,000 | 41,819 |
| Diversified REITs–0.04% |
| CyrusOne L.P./CyrusOne Finance Corp., | | |
| 5.00%, 03/15/2024 | | 9,000 | 9,315 |
| 5.38%, 03/15/2027 | | 9,000 | 9,596 |
| | | | 18,911 |
| Electric Utilities–0.11% |
| NextEra Energy Capital Holdings, Inc., Series K, Investment Units, 5.25%, 06/01/2076 | | 1,500 | 40,755 |
| Southern Co. (The), Series B, 5.50%, 03/15/2057(f) | | 7,000 | 7,267 |
| | | | 48,022 |
| Electrical Components & Equipment–0.14% |
| EnerSys, 5.00%, 04/30/2023(d) | | 60,000 | 62,100 |
| Electronic Equipment & Instruments–0.08% |
| Itron, Inc., 5.00%, 01/15/2026(d) | | 15,000 | 15,375 |
| MTS Systems Corp., 5.75%, 08/15/2027(d) | | 17,000 | 17,808 |
| | | | 33,183 |
| Environmental & Facilities Services–0.22% |
| Core & Main L.P., 6.13%, 08/15/2025(d) | | 30,000 | 30,600 |
| GFL Environmental, Inc. (Canada), 7.00%, 06/01/2026(d) | | 46,000 | 47,840 |
| | Principal
Amount | Value |
| Environmental & Facilities Services–(continued) |
| Waste Pro USA, Inc., 5.50%, 02/15/2026(d) | | $16,000 | $16,720 |
| | | | 95,160 |
| Financial Exchanges & Data–0.05% |
| MSCI, Inc., 5.25%, 11/15/2024(d) | | 20,000 | 20,864 |
| Food Distributors–0.11% |
| US Foods, Inc., 5.88%, 06/15/2024(d) | | 46,000 | 47,724 |
| Food Retail–0.23% |
| Albertsons Cos. LLC/Safeway, Inc./New Albertson’s, Inc./Albertson’s LLC, | | |
| 6.63%, 06/15/2024 | | 42,000 | 44,205 |
| 7.50%, 03/15/2026(d) | | 27,000 | 30,172 |
| 5.88%, 02/15/2028(d) | | 25,000 | 26,409 |
| | | | 100,786 |
| Forest Products–0.06% |
| Norbord, Inc. (Canada), 5.75%, 07/15/2027(d) | | 26,000 | 26,520 |
| Gas Utilities–0.22% |
| AmeriGas Partners, L.P./AmeriGas Finance Corp., | | |
| 5.63%, 05/20/2024 | | 15,000 | 15,994 |
| 5.88%, 08/20/2026 | | 13,000 | 14,182 |
| Suburban Propane Partners, L.P./Suburban Energy Finance Corp., 5.50%, 06/01/2024 | | 65,000 | 66,300 |
| | | | 96,476 |
| Health Care Equipment–0.15% |
| Hill-Rom Holdings, Inc., 5.00%, 02/15/2025(d) | | 33,000 | 34,072 |
| Teleflex, Inc., 4.88%, 06/01/2026 | | 28,000 | 29,637 |
| | | | 63,709 |
| Health Care Facilities–0.91% |
| Acadia Healthcare Co., Inc., 6.50%, 03/01/2024 | | 40,000 | 41,500 |
| Community Health Systems, Inc., 6.25%, 03/31/2023 | | 24,000 | 23,312 |
| Encompass Health Corp., 5.75%, 09/15/2025 | | 30,000 | 31,688 |
| HCA, Inc., | | |
| 5.38%, 02/01/2025 | | 10,000 | 11,125 |
| 5.25%, 04/15/2025 | | 67,000 | 74,872 |
| 5.88%, 02/15/2026 | | 32,000 | 36,584 |
| 5.38%, 09/01/2026 | | 10,000 | 11,175 |
| 5.50%, 06/15/2047 | | 45,000 | 51,785 |
| Tenet Healthcare Corp., | | |
| 8.13%, 04/01/2022 | | 9,000 | 9,730 |
| 6.75%, 06/15/2023 | | 104,000 | 107,250 |
| | | | 399,021 |
See accompanying Notes to Financial Statements which are an integral part of the financial statements.
| 14 | Invesco Strategic Real Return Fund |
| | Principal
Amount | Value |
| Health Care REITs–0.08% |
| MPT Operating Partnership L.P./MPT Finance Corp., 5.00%, 10/15/2027 | | $34,000 | $36,380 |
| Health Care Services–0.42% |
| AMN Healthcare, Inc., 5.13%, 10/01/2024(d) | | 10,000 | 10,300 |
| CHS/Community Health Systems, Inc., 8.00%, 03/15/2026(d) | | 26,000 | 25,025 |
| Eagle Holding Co. II, LLC, 8.38% PIK Rate, 7.63% Cash Rate, 05/15/2022(d)(g) | | 11,000 | 11,138 |
| Envision Healthcare Corp., 8.75%, 10/15/2026(d) | | 14,000 | 7,700 |
| Hadrian Merger Sub, Inc., 8.50%, 05/01/2026(d) | | 32,000 | 30,720 |
| MPH Acquisition Holdings LLC, 7.13%, 06/01/2024(d) | | 53,000 | 47,637 |
| Polaris Intermediate Corp., 9.25% PIK Rate, 8.50% Cash Rate, 12/01/2022(d)(g) | | 23,000 | 19,435 |
| Surgery Center Holdings, Inc., | | |
| 6.75%, 07/01/2025(d) | | 7,000 | 6,024 |
| 10.00%, 04/15/2027(d) | | 18,000 | 17,280 |
| Team Health Holdings, Inc., 6.38%, 02/01/2025(d) | | 10,000 | 6,750 |
| | | | 182,009 |
| Home Improvement Retail–0.04% |
| Hillman Group, Inc. (The), 6.38%, 07/15/2022(d) | | 18,000 | 16,065 |
| Homebuilding–0.40% |
| Beazer Homes USA, Inc., | | |
| 8.75%, 03/15/2022 | | 39,000 | 40,852 |
| 6.75%, 03/15/2025 | | 22,000 | 22,248 |
| 5.88%, 10/15/2027 | | 3,000 | 2,858 |
| KB Home, 8.00%, 03/15/2020 | | 13,000 | 13,406 |
| Lennar Corp., 5.25%, 06/01/2026 | | 14,000 | 15,295 |
| Meritage Homes Corp., | | |
| 7.15%, 04/15/2020 | | 5,000 | 5,156 |
| 6.00%, 06/01/2025 | | 8,000 | 8,870 |
| Taylor Morrison Communities, Inc., 5.75%, 01/15/2028(d) | | 21,000 | 22,365 |
| Taylor Morrison Communities, Inc./Taylor Morrison Holdings II, Inc., 5.88%, 04/15/2023(d) | | 42,000 | 44,940 |
| | | | 175,990 |
| Household Products–0.28% |
| Reynolds Group Issuer Inc./Reynolds Group Issuer LLC/Reynolds Group Issuer (Luxembourg) S.A., 7.00%, 07/15/2024(d) | | 57,000 | 59,031 |
| Reynolds Group Issuer, Inc./LLC, 5.13%, 07/15/2023(d) | | 13,000 | 13,397 |
| Spectrum Brands, Inc., 5.75%, 07/15/2025 | | 48,000 | 50,160 |
| | | | 122,588 |
| | Principal
Amount | Value |
| Independent Power Producers & Energy Traders–0.35% |
| AES Corp. (The), 5.50%, 04/15/2025 | | $59,000 | $61,731 |
| Calpine Corp., 5.50%, 02/01/2024 | | 20,000 | 20,225 |
| NRG Energy, Inc., 6.63%, 01/15/2027 | | 67,000 | 72,611 |
| | | | 154,567 |
| Industrial Machinery–0.30% |
| Cleaver-Brooks, Inc., 7.88%, 03/01/2023(d) | | 58,000 | 53,505 |
| EnPro Industries, Inc., 5.75%, 10/15/2026 | | 29,000 | 30,450 |
| Mueller Industries, Inc., 6.00%, 03/01/2027 | | 47,000 | 47,705 |
| | | | 131,660 |
| Integrated Oil & Gas–0.06% |
| Petrobras Global Finance B.V. (Brazil), 5.75%, 02/01/2029 | | 25,000 | 27,138 |
| Integrated Telecommunication Services–1.33% |
| Altice France S.A. (France), 7.38%, 05/01/2026(d) | | 200,000 | 214,000 |
| Cincinnati Bell, Inc., | | |
| 7.00%, 07/15/2024(d) | | 11,000 | 10,093 |
| 8.00%, 10/15/2025(d) | | 3,000 | 2,648 |
| CommScope, Inc., 8.25%, 03/01/2027(d) | | 37,000 | 36,399 |
| Frontier Communications Corp., | | |
| 10.50%, 09/15/2022 | | 96,000 | ��50,280 |
| 11.00%, 09/15/2025 | | 23,000 | 11,788 |
| Intelsat Jackson Holdings S.A. (Luxembourg), | | |
| 5.50%, 08/01/2023 | | 51,000 | 46,665 |
| 8.50%, 10/15/2024(d) | | 25,000 | 24,875 |
| 9.75%, 07/15/2025(d) | | 14,000 | 14,437 |
| Telecom Italia Capital S.A. (Italy), | | |
| 6.38%, 11/15/2033 | | 2,000 | 2,125 |
| 7.20%, 07/18/2036 | | 25,000 | 28,000 |
| T-Mobile USA, Inc., 6.50%, 01/15/2026 | | 128,000 | 137,920 |
| | | | 579,230 |
| Interactive Media & Services–0.19% |
| Cumulus Media New Holdings, Inc., 6.75%, 07/01/2026(d) | | 28,000 | 28,910 |
| Diamond Sports Group LLC/Diamond Sports Finance Co., | | |
| 5.38%, 08/15/2026(d) | | 30,000 | 31,575 |
| 6.63%, 08/15/2027(d) | | 20,000 | 21,000 |
| | | | 81,485 |
| Internet & Direct Marketing Retail–0.07% |
| Booking Holdings, Inc., Conv., 0.90%, 09/15/2021 | | 25,000 | 29,071 |
| Leisure Facilities–0.09% |
| Cedar Fair L.P./Canada’s Wonderland Co./Magnum Management Corp., 5.38%, 06/01/2024 | | 15,000 | 15,506 |
See accompanying Notes to Financial Statements which are an integral part of the financial statements.
| 15 | Invesco Strategic Real Return Fund |
| | Principal
Amount | Value |
| Leisure Facilities–(continued) |
| Six Flags Entertainment Corp., 4.88%, 07/31/2024(d) | | $23,000 | $23,863 |
| | | | 39,369 |
| Leisure Products–0.04% |
| Mattel, Inc., 6.75%, 12/31/2025(d) | | 18,000 | 18,540 |
| Life & Health Insurance–0.12% |
| MetLife, Inc., Series D, 5.88%(h) | | 50,000 | 53,670 |
| Managed Health Care–0.15% |
| Centene Corp., 5.38%, 06/01/2026(d) | | 17,000 | 18,216 |
| WellCare Health Plans, Inc., | | |
| 5.25%, 04/01/2025 | | 30,000 | 31,524 |
| 5.38%, 08/15/2026(d) | | 14,000 | 14,963 |
| | | | 64,703 |
| Metal & Glass Containers–0.17% |
| Ball Corp., 5.25%, 07/01/2025 | | 25,000 | 28,125 |
| Berry Global, Inc., 5.50%, 05/15/2022 | | 23,000 | 23,473 |
| Flex Acquisition Co., Inc., 7.88%, 07/15/2026(d) | | 21,000 | 19,057 |
| OI European Group B.V., 4.00%, 03/15/2023(d) | | 5,000 | 5,050 |
| | | | 75,705 |
| Mortgage REITs–0.30% |
| Starwood Property Trust, Inc., Conv., 4.38%, 04/01/2023 | | 125,000 | 129,805 |
| Movies & Entertainment–0.30% |
| AMC Entertainment Holdings, Inc., | | |
| 5.75%, 06/15/2025 | | 33,000 | 31,474 |
| 6.13%, 05/15/2027 | | 34,000 | 31,535 |
| Netflix, Inc., | | |
| 5.75%, 03/01/2024 | | 43,000 | 47,353 |
| 5.88%, 11/15/2028 | | 20,000 | 22,425 |
| | | | 132,787 |
| Multi-line Insurance–0.12% |
| Acrisure LLC/Acrisure Finance, Inc., 8.13%, 02/15/2024(d) | | 6,000 | 6,476 |
| AXA S.A. (France), Conv., 7.25%, 05/15/2021(d) | | 45,000 | 46,043 |
| | | | 52,519 |
| Oil & Gas Drilling–0.49% |
| Diamond Offshore Drilling, Inc., 4.88%, 11/01/2043(i) | | 10,000 | 5,750 |
| Ensign Drilling, Inc. (Canada), 9.25%, 04/15/2024(d) | | 23,000 | 21,562 |
| Noble Holding International Ltd., 7.75%, 01/15/2024 | | 65,000 | 43,550 |
| Precision Drilling Corp. (Canada), | | |
| 6.50%, 12/15/2021 | | 2,361 | 2,367 |
| 7.75%, 12/15/2023 | | 3,000 | 2,978 |
| 5.25%, 11/15/2024 | | 15,000 | 12,938 |
| | Principal
Amount | Value |
| Oil & Gas Drilling–(continued) |
| Targa Resources Partners L.P./Targa Resources Partners Finance Corp., | | |
| 5.25%, 05/01/2023 | | $17,000 | $17,335 |
| 5.13%, 02/01/2025 | | 18,000 | 18,540 |
| 5.88%, 04/15/2026 | | 11,000 | 11,564 |
| Transocean, Inc., 7.50%, 04/15/2031 | | 58,000 | 45,167 |
| Valaris PLC, 7.75%, 02/01/2026 | | 49,000 | 31,350 |
| | | | 213,101 |
| Oil & Gas Equipment & Services–0.16% |
| Calfrac Holdings L.P. (Canada), 8.50%, 06/15/2026(d) | | 20,000 | 12,700 |
| McDermott Technology Americas Inc. / McDermott Technology US Inc., 10.63%, 05/01/2024(d) | | 15,000 | 10,650 |
| SESI, L.L.C., 7.13%, 12/15/2021 | | 63,000 | 44,730 |
| | | | 68,080 |
| Oil & Gas Exploration & Production–1.67% |
| Ascent Resources Utica Holdings, LLC/ARU Finance Corp., 10.00%, 04/01/2022(d) | | 26,000 | 26,325 |
| Brazos Valley Longhorn LLC/Brazos Valley Longhorn Finance Corp., 6.88%, 02/01/2025 | | 20,000 | 17,900 |
| California Resources Corp., 8.00%, 12/15/2022(d) | | 27,000 | 15,660 |
| Callon Petroleum Co., | | |
| 6.13%, 10/01/2024 | | 52,000 | 50,700 |
| 6.38%, 07/01/2026 | | 11,000 | 10,725 |
| Centennial Resource Production, LLC, 6.88%, 04/01/2027(d) | | 70,000 | 70,350 |
| Denbury Resources, Inc., 5.50%, 05/01/2022 | | 15,000 | 6,450 |
| EP Energy LLC/Everest Acquisition Finance, Inc., 8.00%, 11/29/2024(d) | | 29,000 | 12,760 |
| Genesis Energy L.P. / Genesis Energy Finance Corp., 6.25%, 05/15/2026 | | 44,000 | 42,257 |
| Gulfport Energy Corp., 6.00%, 10/15/2024 | | 63,000 | 46,147 |
| Jagged Peak Energy LLC, 5.88%, 05/01/2026 | | 34,000 | 34,289 |
| NGL Energy Partners L.P./NGL Energy Finance Corp., 7.50%, 04/15/2026(d) | | 34,000 | 34,510 |
| Oasis Petroleum, Inc., 6.88%, 01/15/2023 | | 44,000 | 40,040 |
| QEP Resources, Inc., | | |
| 6.88%, 03/01/2021 | | 33,000 | 32,917 |
| 5.25%, 05/01/2023 | | 6,000 | 5,280 |
| 5.63%, 03/01/2026 | | 27,000 | 22,005 |
| Range Resources Corp., 5.88%, 07/01/2022 | | 33,000 | 31,763 |
| SM Energy Co., | | |
| 6.13%, 11/15/2022 | | 43,000 | 40,205 |
| 6.75%, 09/15/2026 | | 25,000 | 21,375 |
| 6.63%, 01/15/2027 | | 4,000 | 3,420 |
See accompanying Notes to Financial Statements which are an integral part of the financial statements.
| 16 | Invesco Strategic Real Return Fund |
| | Principal
Amount | Value |
| Oil & Gas Exploration & Production–(continued) |
| Southwestern Energy Co., | | |
| 7.50%, 04/01/2026 | | $14,000 | $12,323 |
| 7.75%, 10/01/2027 | | 50,000 | 43,750 |
| Whiting Petroleum Corp., 6.25%, 04/01/2023 | | 50,000 | 39,500 |
| WPX Energy, Inc., 5.25%, 09/15/2024 | | 66,000 | 67,320 |
| | | | 727,971 |
| Oil & Gas Refining & Marketing–0.17% |
| Calumet Specialty Products Partners L.P./Calumet Finance Corp., 7.63%, 01/15/2022 | | 9,000 | 8,573 |
| NuStar Logistics, L.P., 6.00%, 06/01/2026 | | 29,000 | 31,175 |
| Parkland Fuel Corp. (Canada), 6.00%, 04/01/2026(d) | | 32,000 | 33,720 |
| | | | 73,468 |
| Oil & Gas Storage & Transportation–0.41% |
| Antero Midstream Partners L.P./Antero Midstream Finance Corp., 5.38%, 09/15/2024 | | 56,000 | 53,060 |
| Energy Transfer Operating, L.P., | | |
| Series A, 6.25%(f)(h) | | 17,000 | 15,861 |
| 5.88%, 01/15/2024 | | 67,000 | 75,022 |
| SemGroup Corp., 6.38%, 03/15/2025 | | 25,000 | 23,750 |
| Williams Cos., Inc. (The), 7.88%, 09/01/2021 | | 10,000 | 11,045 |
| | | | 178,738 |
| Other Diversified Financial Services–0.22% |
| Lions Gate Capital Holdings LLC, 6.38%, 02/01/2024(d) | | 32,000 | 33,878 |
| LPL Holdings, Inc., 5.75%, 09/15/2025(d) | | 15,000 | 15,825 |
| Tempo Acquisition LLC/Tempo Acquisition Finance Corp., 6.75%, 06/01/2025(d) | | 41,000 | 42,324 |
| VFH Parent LLC/Orchestra Co-Issuer, Inc., 6.75%, 06/15/2022(d) | | 5,000 | 5,166 |
| | | | 97,193 |
| Packaged Foods & Meats–0.23% |
| B&G Foods, Inc., 5.25%, 04/01/2025 | | 32,000 | 32,570 |
| JBS USA LUX S.A./JBS USA Finance, Inc., 5.75%, 06/15/2025(d) | | 48,000 | 50,100 |
| TreeHouse Foods, Inc., 6.00%, 02/15/2024(d) | | 18,000 | 18,743 |
| | | | 101,413 |
| Paper Products–0.22% |
| Mercer International, Inc. (Germany), | | |
| 7.75%, 12/01/2022 | | 2,000 | 2,055 |
| 6.50%, 02/01/2024 | | 50,000 | 51,687 |
| 5.50%, 01/15/2026 | | 6,000 | 5,941 |
| Schweitzer-Mauduit International, Inc., 6.88%, 10/01/2026(d) | | 37,000 | 38,203 |
| | | | 97,886 |
| | Principal
Amount | Value |
| Pharmaceuticals–0.46% |
| Bausch Health Americas, Inc., 9.25%, 04/01/2026(d) | | $25,000 | $28,375 |
| Bausch Health Cos., Inc., | | |
| 5.50%, 11/01/2025(d) | | 11,000 | 11,577 |
| 9.00%, 12/15/2025(d) | | 79,000 | 88,875 |
| 5.75%, 08/15/2027(d) | | 9,000 | 9,675 |
| HLF Financing S.a.r.l. LLC/Herbalife International, Inc., 7.25%, 08/15/2026(d) | | 29,000 | 28,674 |
| Par Pharmaceutical, Inc., 7.50%, 04/01/2027(d) | | 19,000 | 17,765 |
| Teva Pharmaceutical Finance IV, B.V. (Israel), 3.65%, 11/10/2021 | | 15,000 | 14,325 |
| | | | 199,266 |
| Publishing–0.10% |
| Meredith Corp., 6.88%, 02/01/2026 | | 43,000 | 45,580 |
| Regional Banks–0.10% |
| CIT Group, Inc., 5.00%, 08/15/2022 | | 42,000 | 44,881 |
| Research & Consulting Services–0.11% |
| Equinix, Inc., 5.88%, 01/15/2026 | | 44,000 | 46,915 |
| Restaurants–0.19% |
| 1011778 BC ULC/New Red Finance, Inc. (Canada), 5.00%, 10/15/2025(d) | | 42,000 | 43,470 |
| Aramark Services, Inc., 5.00%, 04/01/2025(d) | | 24,000 | 24,856 |
| IRB Holding Corp., 6.75%, 02/15/2026(d) | | 14,000 | 14,105 |
| | | | 82,431 |
| Security & Alarm Services–0.04% |
| Brink’s Co. (The), 4.63%, 10/15/2027(d) | | 15,000 | 15,300 |
| Semiconductors–0.49% |
| NXP B.V./NXP Funding LLC (Netherlands), 4.63%, 06/01/2023(d) | | 200,000 | 214,010 |
| Specialized Consumer Services–0.20% |
| ServiceMaster Co., LLC (The), | | |
| 5.13%, 11/15/2024(d) | | 68,000 | 71,545 |
| 7.45%, 08/15/2027 | | 15,000 | 16,706 |
| | | | 88,251 |
| Specialized REITs–0.27% |
| GLP Capital, L.P. / GLP Financing II, Inc., 5.38%, 04/15/2026 | | 25,000 | 27,504 |
| Iron Mountain US Holdings, Inc., 5.38%, 06/01/2026(d) | | 34,000 | 35,275 |
| Iron Mountain, Inc., | | |
| 6.00%, 08/15/2023 | | 12,000 | 12,300 |
| 5.75%, 08/15/2024 | | 6,000 | 6,090 |
| 5.25%, 03/15/2028(d) | | 12,000 | 12,510 |
| SBA Communications Corp., 4.88%, 09/01/2024 | | 25,000 | 25,969 |
| | | | 119,648 |
See accompanying Notes to Financial Statements which are an integral part of the financial statements.
| 17 | Invesco Strategic Real Return Fund |
| | Principal
Amount | Value |
| Specialty Chemicals–0.23% |
| Ashland LLC, 4.75%, 08/15/2022 | | $16,000 | $16,875 |
| Element Solutions, Inc., 5.88%, 12/01/2025(d) | | 26,000 | 27,300 |
| PolyOne Corp., 5.25%, 03/15/2023 | | 22,000 | 23,732 |
| PQ Corp., 6.75%, 11/15/2022(d) | | 11,000 | 11,456 |
| Rayonier A.M. Products, Inc., 5.50%, 06/01/2024(d) | | 33,000 | 22,127 |
| | | | 101,490 |
| Steel–0.18% |
| ArcelorMittal (Luxembourg), 7.00%, 10/15/2039 | | 16,000 | 19,177 |
| Cleveland-Cliffs, Inc., 5.75%, 03/01/2025 | | 38,000 | 38,190 |
| United States Steel Corp., 6.88%, 08/15/2025 | | 21,000 | 20,035 |
| | | | 77,402 |
| Technology Distributors–0.03% |
| CDW LLC/CDW Finance Corp., 5.00%, 09/01/2025 | | 14,000 | 14,674 |
| Technology Hardware, Storage & Peripherals–0.10% |
| Dell International LLC/EMC Corp., 7.13%, 06/15/2024(d) | | 43,000 | 45,332 |
| Textiles–0.32% |
| Eagle Intermediate Global Holding B.V./Ruyi US Finance LLC (China), 7.50%, 05/01/2025(d) | | 150,000 | 141,375 |
| Trading Companies & Distributors–0.23% |
| H&E Equipment Services, Inc., 5.63%, 09/01/2025 | | 14,000 | 14,718 |
| United Rentals North America, Inc., | | |
| 5.50%, 07/15/2025 | | 48,000 | 50,220 |
| 6.50%, 12/15/2026 | | 11,000 | 12,004 |
| 5.25%, 01/15/2030 | | 23,000 | 24,667 |
| | | | 101,609 |
| Trucking–0.14% |
| Avis Budget Car Rental LLC/Avis Budget Finance, Inc., | | |
| 5.50%, 04/01/2023 | | 6,000 | 6,135 |
| 5.25%, 03/15/2025(d) | | 8,000 | 8,170 |
| Kenan Advantage Group, Inc. (The), 7.88%, 07/31/2023(d) | | 54,000 | 48,195 |
| | | | 62,500 |
| Wireless Telecommunication Services–0.51% |
| Intelsat Connect Finance S.A. (Luxembourg), 9.50%, 02/15/2023(d) | | 16,000 | 14,320 |
| Sprint Capital Corp., 8.75%, 03/15/2032 | | 23,000 | 28,865 |
| | Principal
Amount | Value |
| Wireless Telecommunication Services–(continued) |
| Sprint Corp., | | |
| 7.25%, 09/15/2021 | | $63,000 | $67,927 |
| 7.88%, 09/15/2023 | | 64,000 | 72,160 |
| 7.63%, 02/15/2025 | | 14,000 | 15,697 |
| 7.63%, 03/01/2026 | | 22,000 | 24,777 |
| | | | 223,746 |
| Total U.S. Dollar Denominated Bonds & Notes (Cost $9,522,785) | 9,645,705 |
| | Shares | |
| Preferred Stocks–1.87% |
| Agricultural Products–0.12% |
| Bunge Ltd., $4.88 Conv. Pfd. | 525 | 53,025 |
| Asset Management & Custody Banks–0.11% |
| AMG Capital Trust II, $2.58 Conv. Pfd. | 1,000 | 46,935 |
| Diversified Banks–0.70% |
| Bank of America Corp., Series L, $72.50 Conv. Pfd. | 110 | 162,140 |
| Wells Fargo & Co., Class A, Series L, $75.00 Conv. Pfd. | 100 | 145,110 |
| | | | 307,250 |
| Health Care Equipment–0.14% |
| Becton, Dickinson and Co., Series A, $3.06 Conv. Pfd. | 1,000 | 61,870 |
| Industrial Machinery–0.23% |
| Colfax Corp., $5.75 Conv. Pfd. | 250 | 30,847 |
| Fortive Corp., Series A, $50.00 Conv. Pfd. | 25 | 23,390 |
| Stanley Black & Decker, Inc., Series C, $5.38 Conv. Investment Units | 500 | 47,560 |
| | | | 101,797 |
| Integrated Telecommunication Services–0.05% |
| AT&T, Inc., 5.63%, Pfd. | 861 | 23,557 |
| Multi-line Insurance–0.14% |
| Assurant, Inc., Series D, $6.50 Conv. Pfd. | 500 | 61,275 |
| Multi-Utilities–0.24% |
| CenterPoint Energy, Inc., Series B, $3.50 Conv. Pfd. | 1,000 | 49,450 |
| Dominion Energy, Inc., Series A, $7.25 Conv. Pfd. | 90 | 9,176 |
| Sempra Energy, Series A, $6.00 Conv. Pfd. | 400 | 46,104 |
| | | | 104,730 |
| Oil & Gas Storage & Transportation–0.06% |
| El Paso Energy Capital Trust I, $2.38 Conv. Pfd. | 500 | 26,010 |
| Specialized REITs–0.08% |
| Crown Castle International Corp., Series A, $68.75 Conv. Pfd. | 25 | 32,634 |
| Total Preferred Stocks (Cost $758,188) | 819,083 |
See accompanying Notes to Financial Statements which are an integral part of the financial statements.
| 18 | Invesco Strategic Real Return Fund |
| | Shares | Value |
| Money Market Funds–0.75% |
| Invesco Government & Agency Portfolio, Institutional Class, 2.02%(j) | 114,688 | $114,688 |
| Invesco Liquid Assets Portfolio, Institutional Class, 2.14%(j) | 81,887 | 81,919 |
| Invesco Treasury Portfolio, Institutional Class, 1.98%(j) | 131,071 | 131,071 |
| Total Money Market Funds (Cost $327,678) | 327,678 |
| TOTAL INVESTMENTS IN SECURITIES–99.61% (Cost $42,731,261) | 43,559,670 |
| OTHER ASSETS LESS LIABILITIES—0.39% | 169,396 |
| NET ASSETS–100.00% | $43,729,066 |
Investment Abbreviations:
| Conv. | – Convertible |
| Pfd. | – Preferred |
| PIK | – Pay-in-Kind |
| REIT | – Real Estate Investment Trust |
Notes to Schedule of Investments:
| (a) | Industry and/or sector classifications used in this report are generally according to the Global Industry Classification Standard, which was developed by and is the exclusive property and a service mark of MSCI Inc. and Standard & Poor’s. |
| (b) | Principal amount of security and interest payments are adjusted for inflation. See Note 1I. |
| (c) | Invesco Floating Rate Fund and the Fund are affiliated by either having the same investment adviser or an investment adviser under common control with the Fund’s investment adviser. The value of this security as of August 31, 2019 represented 30.09% of the Fund’s Net Assets. See Note 5. |
| (d) | Security purchased or received in a transaction exempt from registration under the Securities Act of 1933, as amended (the “1933 Act”). The security may be resold pursuant to an exemption from registration under the 1933 Act, typically to qualified institutional buyers. The aggregate value of these securities at August 31, 2019 was $4,448,659, which represented 10.17% of the Fund’s Net Assets. |
| (e) | Security has an irrevocable call by the issuer or mandatory put by the holder. Maturity date reflects such call or put. |
| (f) | Interest or dividend rate is redetermined periodically. Rate shown is the rate in effect on August 31, 2019. |
| (g) | All or a portion of this security is Pay-in-Kind. Pay-in-Kind securities pay interest income in the form of securities. |
| (h) | Perpetual bond with no specified maturity date. |
| (i) | The borrower has filed for protection in federal bankruptcy court. |
| (j) | The money market fund and the Fund are affiliated by having the same investment adviser. The rate shown is the 7-day SEC standardized yield as of August 31, 2019. |
See accompanying Notes to Financial Statements which are an integral part of the financial statements.
| 19 | Invesco Strategic Real Return Fund |
Statement of Assets and Liabilities
August 31, 2019
| Assets: | |
Investments in securities, at value
(Cost $28,955,717) | $30,071,770 |
Investments in affiliates, at value
(Cost $13,775,544) | 13,487,900 |
| Cash | 7,008 |
| Receivable for: | |
| Dividends | 5,143 |
| Fund expenses absorbed | 6,574 |
| Investments sold | 50,856 |
| Fund shares sold | 75,154 |
| Interest | 193,191 |
| Investment for trustee deferred compensation and retirement plans | 9,126 |
| Other assets | 30,037 |
| Total assets | 43,936,759 |
| Liabilities: | |
| Payable for: | |
| Investments purchased | 36,554 |
| Fund shares reacquired | 77,185 |
| Accrued fees to affiliates | 16,546 |
| Accrued trustees’ and officers’ fees and benefits | 2,497 |
| Accrued other operating expenses | 65,785 |
| Trustee deferred compensation and retirement plans | 9,126 |
| Total liabilities | 207,693 |
| Net assets applicable to shares outstanding | $43,729,066 |
| Net assets consist of: | |
| Shares of beneficial interest | $44,108,318 |
| Distributable earnings | (379,252) |
| | $43,729,066 |
| Net Assets: |
| Class A | $23,249,323 |
| Class C | $1,502,519 |
| Class R | $450,583 |
| Class Y | $17,961,444 |
| Class R5 | $16,042 |
| Class R6 | $549,155 |
| Shares outstanding, no par value, with an unlimited number of shares authorized: |
| Class A | 2,404,483 |
| Class C | 155,507 |
| Class R | 46,597 |
| Class Y | 1,857,150 |
| Class R5 | 1,659 |
| Class R6 | 56,761 |
| Class A: | |
| Net asset value per share | $9.67 |
Maximum offering price per share
(Net asset value of $9.67 ÷ 97.50%) | $9.92 |
| Class C: | |
| Net asset value and offering price per share | $9.66 |
| Class R: | |
| Net asset value and offering price per share | $9.67 |
| Class Y: | |
| Net asset value and offering price per share | $9.67 |
| Class R5: | |
| Net asset value and offering price per share | $9.67 |
| Class R6: | |
| Net asset value and offering price per share | $9.67 |
See accompanying Notes to Financial Statements which are an integral part of the financial statements.
| 20 | Invesco Strategic Real Return Fund |
Statement of Operations
For the year ended August 31, 2019
| Investment income: | |
| Dividends from affiliates | $696,355 |
| Interest (net of foreign withholding taxes of $21) | 694,323 |
| Treasury Inflation-Protected Securities inflation adjustments | 307,762 |
| Dividends | 52,081 |
| Total investment income | 1,750,521 |
| Expenses: | |
| Advisory fees | 176,811 |
| Administrative services fees | 20,877 |
| Custodian fees | 2,303 |
| Distribution fees: | |
| Class A | 57,832 |
| Class C | 15,574 |
| Class R | 1,802 |
| Transfer agent fees — A, C, R and Y | 45,726 |
| Transfer agent fees — R5 | 10 |
| Transfer agent fees — R6 | 414 |
| Trustees’ and officers’ fees and benefits | 20,293 |
| Registration and filing fees | 84,568 |
| Licensing fees | 7,965 |
| Reports to shareholders | 20,134 |
| Professional services fees | 55,605 |
| Other | 22,124 |
| Total expenses | 532,038 |
| Less: Fees waived, expenses reimbursed and/or expense offset arrangement(s) | (302,139) |
| Net expenses | 229,899 |
| Net investment income | 1,520,622 |
| Realized and unrealized gain (loss) from: | |
| Net realized gain (loss) from Investment securities | (373,674) |
| Change in net unrealized appreciation of Investment securities | 1,228,265 |
| Net realized and unrealized gain | 854,591 |
| Net increase in net assets resulting from operations | $2,375,213 |
See accompanying Notes to Financial Statements which are an integral part of the financial statements.
| 21 | Invesco Strategic Real Return Fund |
Statement of Changes in Net Assets
For the years ended August 31, 2019 and 2018
| | 2019 | 2018 |
| Operations: | | |
| Net investment income | $1,520,622 | $1,218,560 |
| Net realized gain (loss) | (373,674) | 2,451 |
| Change in net unrealized appreciation (depreciation) | 1,228,265 | (457,754) |
| Net increase in net assets resulting from operations | 2,375,213 | 763,257 |
| Distributions to shareholders from distributable earnings(1): | | |
| Class A | (962,850) | (712,713) |
| Class C | (53,758) | (52,782) |
| Class R | (13,862) | (6,588) |
| Class Y | (824,823) | (529,747) |
| Class R5 | (458) | (412) |
| Class R6 | (18,096) | (13,255) |
| Total distributions from distributable earnings | (1,873,847) | (1,315,497) |
| Share transactions–net: | | |
| Class A | 1,827,759 | 6,100,632 |
| Class C | (270,066) | 259,600 |
| Class R | 221,737 | 71,826 |
| Class Y | (476,473) | 8,210,353 |
| Class R5 | 6,322 | — |
| Class R6 | 196,206 | 78,611 |
| Net increase in net assets resulting from share transactions | 1,505,485 | 14,721,022 |
| Net increase in net assets | 2,006,851 | 14,168,782 |
| Net assets: | | |
| Beginning of year | 41,722,215 | 27,553,433 |
| End of year | $43,729,066 | $41,722,215 |
| (1) | The Securities and Exchange Commission eliminated the requirement to disclose distribution components separately, except for tax return of capital. For the year ended August 31, 2018, distributions to shareholders from distributable earnings consisted of distributions from net investment income. |
See accompanying Notes to Financial Statements which are an integral part of the financial statements.
| 22 | Invesco Strategic Real Return Fund |
Financial Highlights
August 31, 2019
The following schedule presents financial highlights for a share of the Fund outstanding throughout the periods indicated.
| | Net asset
value,
beginning
of period | Net
investment
income(a) | Net gains
(losses)
on securities
(both
realized and
unrealized) | Total from
investment
operations | Dividends
from net
investment
income | Net asset
value, end
of period | Total
return(b) | Net assets,
end of period
(000’s omitted) | Ratio of
expenses
to average
net assets
with fee waivers
and/or
expenses
absorbed(c) | Ratio of
expenses
to average net
assets without
fee waivers
and/or
expenses
absorbed | Ratio of net
investment
income
to average
net assets | Portfolio
turnover(d) |
| Class A |
| Year ended 08/31/19 | $9.56 | $0.32 | $0.18 | $0.50 | $(0.39) | $9.67 | 5.44% | $23,249 | 0.60%(e) | 1.28%(e) | 3.36%(e) | 32% |
| Year ended 08/31/18 | 9.74 | 0.35 | (0.14) | 0.21 | (0.39) | 9.56 | 2.18 | 21,140 | 0.60 | 1.67 | 3.68 | 20 |
| Year ended 08/31/17 | 9.77 | 0.30 | 0.01 | 0.31 | (0.34) | 9.74 | 3.27 | 15,358 | 0.59 | 1.81 | 3.11 | 32 |
| Year ended 08/31/16 | 9.62 | 0.30 | 0.14 | 0.44 | (0.29) | 9.77 | 4.72 | 10,130 | 0.61 | 2.34 | 3.13 | 35 |
| Year ended 08/31/15 | 10.11 | 0.26 | (0.49) | (0.23) | (0.26) | 9.62 | (2.26) | 8,936 | 0.60 | 2.25 | 2.71 | 25 |
| Class C |
| Year ended 08/31/19 | 9.55 | 0.25 | 0.18 | 0.43 | (0.32) | 9.66 | 4.65 | 1,503 | 1.35(e) | 2.03(e) | 2.61(e) | 32 |
| Year ended 08/31/18 | 9.74 | 0.28 | (0.15) | 0.13 | (0.32) | 9.55 | 1.31 | 1,770 | 1.35 | 2.42 | 2.93 | 20 |
| Year ended 08/31/17 | 9.77 | 0.23 | 0.01 | 0.24 | (0.27) | 9.74 | 2.49 | 1,538 | 1.34 | 2.56 | 2.36 | 32 |
| Year ended 08/31/16 | 9.61 | 0.23 | 0.15 | 0.38 | (0.22) | 9.77 | 4.04 | 549 | 1.36 | 3.09 | 2.38 | 35 |
| Year ended 08/31/15 | 10.10 | 0.19 | (0.49) | (0.30) | (0.19) | 9.61 | (3.00) | 459 | 1.35 | 3.00 | 1.96 | 25 |
| Class R |
| Year ended 08/31/19 | 9.56 | 0.29 | 0.19 | 0.48 | (0.37) | 9.67 | 5.18 | 451 | 0.85(e) | 1.53(e) | 3.11(e) | 32 |
| Year ended 08/31/18 | 9.74 | 0.33 | (0.15) | 0.18 | (0.36) | 9.56 | 1.92 | 217 | 0.85 | 1.92 | 3.43 | 20 |
| Year ended 08/31/17 | 9.77 | 0.28 | 0.01 | 0.29 | (0.32) | 9.74 | 3.00 | 148 | 0.84 | 2.06 | 2.86 | 32 |
| Year ended 08/31/16 | 9.62 | 0.28 | 0.14 | 0.42 | (0.27) | 9.77 | 4.46 | 76 | 0.86 | 2.59 | 2.88 | 35 |
| Year ended 08/31/15 | 10.11 | 0.24 | (0.49) | (0.25) | (0.24) | 9.62 | (2.51) | 35 | 0.85 | 2.50 | 2.46 | 25 |
| Class Y |
| Year ended 08/31/19 | 9.57 | 0.34 | 0.18 | 0.52 | (0.42) | 9.67 | 5.59 | 17,961 | 0.35(e) | 1.03(e) | 3.61(e) | 32 |
| Year ended 08/31/18 | 9.75 | 0.38 | (0.15) | 0.23 | (0.41) | 9.57 | 2.44 | 18,242 | 0.35 | 1.42 | 3.93 | 20 |
| Year ended 08/31/17 | 9.78 | 0.33 | 0.01 | 0.34 | (0.37) | 9.75 | 3.52 | 10,228 | 0.34 | 1.56 | 3.36 | 32 |
| Year ended 08/31/16 | 9.62 | 0.32 | 0.15 | 0.47 | (0.31) | 9.78 | 5.09 | 7,616 | 0.36 | 2.09 | 3.38 | 35 |
| Year ended 08/31/15 | 10.11 | 0.29 | (0.49) | (0.20) | (0.29) | 9.62 | (2.02) | 7,209 | 0.35 | 2.00 | 2.96 | 25 |
| Class R5 |
| Year ended 08/31/19 | 9.57 | 0.34 | 0.18 | 0.52 | (0.42) | 9.67 | 5.59 | 16 | 0.35(e) | 1.03(e) | 3.61(e) | 32 |
| Year ended 08/31/18 | 9.75 | 0.38 | (0.15) | 0.23 | (0.41) | 9.57 | 2.43 | 10 | 0.35 | 1.35 | 3.93 | 20 |
| Year ended 08/31/17 | 9.78 | 0.33 | 0.01 | 0.34 | (0.37) | 9.75 | 3.52 | 10 | 0.34 | 1.52 | 3.36 | 32 |
| Year ended 08/31/16 | 9.62 | 0.32 | 0.15 | 0.47 | (0.31) | 9.78 | 5.09 | 10 | 0.35 | 2.14 | 3.39 | 35 |
| Year ended 08/31/15 | 10.11 | 0.29 | (0.49) | (0.20) | (0.29) | 9.62 | (2.02) | 10 | 0.35 | 2.07 | 2.96 | 25 |
| Class R6 |
| Year ended 08/31/19 | 9.57 | 0.34 | 0.18 | 0.52 | (0.42) | 9.67 | 5.59 | 549 | 0.35(e) | 1.03(e) | 3.61(e) | 32 |
| Year ended 08/31/18 | 9.75 | 0.38 | (0.15) | 0.23 | (0.41) | 9.57 | 2.43 | 345 | 0.35 | 1.35 | 3.93 | 20 |
| Year ended 08/31/17 | 9.78 | 0.33 | 0.01 | 0.34 | (0.37) | 9.75 | 3.52 | 272 | 0.34 | 1.52 | 3.36 | 32 |
| Year ended 08/31/16 | 9.62 | 0.32 | 0.15 | 0.47 | (0.31) | 9.78 | 5.09 | 10 | 0.35 | 2.14 | 3.39 | 35 |
| Year ended 08/31/15 | 10.11 | 0.29 | (0.49) | (0.20) | (0.29) | 9.62 | (2.02) | 10 | 0.35 | 2.07 | 2.96 | 25 |
| (a) | Calculated using average shares outstanding. |
| (b) | Includes adjustments in accordance with accounting principles generally accepted in the United States of America and as such, the net asset value for financial reporting purposes and the returns based upon those net asset values may differ from the net asset value and returns for shareholder transactions. Does not include sales charges and is not annualized for periods less than one year, if applicable. |
| (c) | In addition to the fees and expenses which the Fund bears directly, the Fund indirectly bears a pro rata share of the fees and expenses of the underlying funds in which the Fund invests. Because the underlying funds have varied expenses and fee levels and the Fund may own different proportions at different times, the amount of fees and expenses incurred indirectly the Fund will vary. Estimated underlying fund expenses are not expenses that are incurred directly by the Fund. They are expenses that are incurred directly by the underlying funds are deducted from the value of the funds the Fund invests in. The effect of the estimated underlying fund expenses that the Fund bears indirectly is included in the Fund’s total return. Estimated acquired fund fees from underlying funds were 0.23%, 0.21%, 0.22%, 0.23% and 0.22% for the years ended August 31, 2019, 2018, 2017, 2016 and 2015, respectively. |
| (d) | Portfolio turnover is calculated at the fund level and is not annualized for periods less than one year, if applicable. |
| (e) | Ratios are based on average daily net assets (000’s omitted) of $23,133, $1,557, $360, $18,727, $10 and $414 for Class A, Class C, Class R, Class Y, Class R5 and Class R6 shares, respectively. |
See accompanying Notes to Financial Statements which are an integral part of the financial statements.
| 23 | Invesco Strategic Real Return Fund |
Notes to Financial Statements
August 31, 2019
NOTE 1—Significant Accounting Policies
Invesco Strategic Real Return Fund (the “Fund”) is a series portfolio of AIM Counselor Series Trust (Invesco Counselor Series Trust) (the “Trust”). The Trust is a Delaware statutory trust registered under the Investment Company Act of 1940, as amended (the “1940 Act”), as an open-end series management investment company authorized to issue an unlimited number of shares of beneficial interest. Information presented in these financial statements pertains only to the Fund. Matters affecting the Fund or each class will be voted on exclusively by the shareholders of the Fund or each class.
The Fund’s investment objective is to seek to mitigate the effects of unanticipated inflation and to provide current income.
The Fund currently consists of six different classes of shares: Class A, Class C, Class R, Class Y, Class R5 and Class R6. Class Y shares are available only to certain investors. Class A shares are sold with a front-end sales charge unless certain waiver criteria are met. Under certain circumstances, load waived shares may be subject to contingent deferred sales charges ("CDSC"). Class C shares are sold with a CDSC. Class R, Class Y, Class R5 and Class R6 shares are sold at net asset value. Class C shares held for ten years after purchase are eligible for automatic conversion into Class A shares of the same Fund (the "Conversion Feature"). The automatic conversion pursuant to the Conversion Feature will generally occur at the end of the month following the tenth anniversary after a purchase of Class C shares.
The Fund is an investment company and accordingly follows the investment company accounting and reporting guidance in accordance with Financial Accounting Standards Board Accounting Standards Codification Topic 946,Financial Services – Investment Companies.
The following is a summary of the significant accounting policies followed by the Fund in the preparation of its financial statements.
| A. | Security Valuations – Securities, including restricted securities, are valued according to the following policy. |
Debt obligations (including convertible securities) and unlisted equities are fair valued using an evaluated quote provided by an independent pricing service. Evaluated quotes provided by the pricing service may be determined without exclusive reliance on quoted prices, and may reflect appropriate factors such as institution-size trading in similar groups of securities, developments related to specific securities, dividend rate (for unlisted equities), yield (for debt obligations), quality, type of issue, coupon rate (for debt obligations), maturity (for debt obligations), individual trading characteristics and other market data. Pricing services generally value debt obligations assuming orderly transactions of institutional round lot size, but a fund may hold or transact in the same securities in smaller, odd lot sizes. Odd lots often trade at lower prices than institutional round lots. Debt obligations are subject to interest rate and credit risks. In addition, all debt obligations involve some risk of default with respect to interest and/or principal payments.
A security listed or traded on an exchange (except convertible securities) is valued at its last sales price or official closing price as of the close of the customary trading session on the exchange where the security is principally traded, or lacking any sales or official closing price on a particular day, the security may be valued at the closing bid price on that day. Securities traded in the over-the-counter market are valued based on prices furnished by independent pricing services or market makers. When such securities are valued by an independent pricing service they may be considered fair valued. Futures contracts are valued at the final settlement price set by an exchange on which they are principally traded. Listed options are valued at the mean between the last bid and asked prices from the exchange on which they are principally traded. Options not listed on an exchange are valued by an independent source at the mean between the last bid and asked prices. For purposes of determining net asset value ("NAV") per share, futures and option contracts generally are valued 15 minutes after the close of the customary trading session of the New York Stock Exchange (“NYSE”).
Investments in open-end and closed-end registered investment companies that do not trade on an exchange are valued at the end-of-day net asset value per share. Investments in open-end and closed-end registered investment companies that trade on an exchange are valued at the last sales price or official closing price as of the close of the customary trading session on the exchange where the security is principally traded.
Foreign securities’ (including foreign exchange contracts) prices are converted into U.S. dollar amounts using the applicable exchange rates as of the close of the NYSE. If market quotations are available and reliable for foreign exchange-traded equity securities, the securities will be valued at the market quotations. Because trading hours for certain foreign securities end before the close of the NYSE, closing market quotations may become unreliable. If between the time trading ends on a particular security and the close of the customary trading session on the NYSE, events occur that the investment adviser determines are significant and make the closing price unreliable, the Fund may fair value the security. If the event is likely to have affected the closing price of the security, the security will be valued at fair value in good faith using procedures approved by the Board of Trustees. Adjustments to closing prices to reflect fair value may also be based on a screening process of an independent pricing service to indicate the degree of certainty, based on historical data, that the closing price in the principal market where a foreign security trades is not the current value as of the close of the NYSE. Foreign securities’ prices meeting the approved degree of certainty that the price is not reflective of current value will be priced at the indication of fair value from the independent pricing service. Multiple factors may be considered by the independent pricing service in determining adjustments to reflect fair value and may include information relating to sector indices, American Depositary Receipts and domestic and foreign index futures. Foreign securities may have additional risks including exchange rate changes, potential for sharply devalued currencies and high inflation, political and economic upheaval, the relative lack of issuer information, relatively low market liquidity and the potential lack of strict financial and accounting controls and standards.
Securities for which market prices are not provided by any of the above methods may be valued based upon quotes furnished by independent sources. The last bid price may be used to value equity securities. The mean between the last bid and asked prices is used to value debt obligations, including corporate loans.
Securities for which market quotations are not readily available or became unreliable are valued at fair value as determined in good faith by or under the supervision of the Trust’s officers following procedures approved by the Board of Trustees. Issuer specific events, market trends, bid/asked quotes of brokers and information providers and other market data may be reviewed in the course of making a good faith determination of a security’s fair value.
The Fund may invest in securities that are subject to interest rate risk, meaning the risk that the prices will generally fall as interest rates rise and, conversely, the prices will generally rise as interest rates fall. Specific securities differ in their sensitivity to changes in interest rates
| 24 | Invesco Strategic Real Return Fund |
depending on their individual characteristics. Changes in interest rates may result in increased market volatility, which may affect the value and/or liquidity of certain Fund investments.
Valuations change in response to many factors including the historical and prospective earnings of the issuer, the value of the issuer’s assets, general economic conditions, interest rates, investor perceptions and market liquidity. Because of the inherent uncertainties of valuation, the values reflected in the financial statements may materially differ from the value received upon actual sale of those investments.
| B. | Securities Transactions and Investment Income – Securities transactions are accounted for on a trade date basis. Realized gains or losses on sales are computed on the basis of specific identification of the securities sold. Interest income (net of withholding tax, if any) is recorded on the accrual basis from settlement date. Bond premiums and discounts are amortized and/or accreted over the lives of the respective securities. Pay-in-kind interest income and non-cash dividend income received in the form of securities in-lieu of cash are recorded at the fair value of the securities received. Dividend income (net of withholding tax, if any) is recorded on the ex-dividend date. |
The Fund may periodically participate in litigation related to Fund investments. As such, the Fund may receive proceeds from litigation settlements. Any proceeds received are included in the Statement of Operations as realized gain (loss) for investments no longer held and as unrealized gain (loss) for investments still held.
Brokerage commissions and mark ups are considered transaction costs and are recorded as an increase to the cost basis of securities purchased and/or a reduction of proceeds on a sale of securities. Such transaction costs are included in the determination of net realized and unrealized gain (loss) from investment securities reported in the Statement of Operations and the Statement of Changes in Net Assets and the net realized and unrealized gains (losses) on securities per share in the Financial Highlights. Transaction costs are included in the calculation of the Fund’s net asset value and, accordingly, they reduce the Fund’s total returns. These transaction costs are not considered operating expenses and are not reflected in net investment income reported in the Statement of Operations and the Statement of Changes in Net Assets, or the net investment income per share and the ratios of expenses and net investment income reported in the Financial Highlights, nor are they limited by any expense limitation arrangements between the Fund and the investment adviser.
The Fund allocates income and realized and unrealized capital gains and losses to a class based on the relative net assets of each class.
| C. | Country Determination — For the purposes of making investment selection decisions and presentation in the Schedule of Investments, the investment adviser may determine the country in which an issuer is located and/or credit risk exposure based on various factors. These factors include the laws of the country under which the issuer is organized, where the issuer maintains a principal office, the country in which the issuer derives 50% or more of its total revenues and the country that has the primary market for the issuer’s securities, as well as other criteria. Among the other criteria that may be evaluated for making this determination are the country in which the issuer maintains 50% or more of its assets, the type of security, financial guarantees and enhancements, the nature of the collateral and the sponsor organization. Country of issuer and/or credit risk exposure has been determined to be the United States of America, unless otherwise noted. |
| D. | Distributions — Distributions from net investment income, if any, are declared and paid monthly. Distributions from net realized capital gain, if any, are generally declared and paid annually and recorded on the ex-dividend date. The Fund may elect to treat a portion of the proceeds from redemptions as distributions for federal income tax purposes. |
| E. | Federal Income Taxes –The Fund intends to comply with the requirements of Subchapter M of the Internal Revenue Code of 1986, as amended (the “Internal Revenue Code”), necessary to qualify as a regulated investment company and to distribute substantially all of the Fund’s taxable earnings to shareholders. As such, the Fund will not be subject to federal income taxes on otherwise taxable income (including net realized capital gain) that is distributed to shareholders. Therefore, no provision for federal income taxes is recorded in the financial statements. |
The Fund recognizes the tax benefits of uncertain tax positions only when the position is more likely than not to be sustained. Management has analyzed the Fund’s uncertain tax positions and concluded that no liability for unrecognized tax benefits should be recorded related to uncertain tax positions. Management is not aware of any tax positions for which it is reasonably possible that the total amounts of unrecognized tax benefits will change materially in the next 12 months.
The Fund files tax returns in the U.S. Federal jurisdiction and certain other jurisdictions. Generally, the Fund is subject to examinations by such taxing authorities for up to three years after the filing of the return for the tax period.
| F. | Expenses — Fees provided for under the Rule 12b-1 plan of a particular class of the Fund are charged to the operations of such class. Transfer agency fees and expenses and other shareholder recordkeeping fees and expenses attributable to Class R5 and Class R6 are allocated to each share class based on relative net assets. Sub-accounting fees attributable to Class R5 are charged to the operations of the class. Transfer agency fees and expenses and other shareholder recordkeeping fees and expenses relating to all other classes are allocated among those classes based on relative net assets. All other expenses are allocated among the classes based on relative net assets. |
| G. | Accounting Estimates — The preparation of financial statements in conformity with accounting principles generally accepted in the United States of America (“GAAP”) requires management to make estimates and assumptions that affect the reported amounts of assets and liabilities at the date of the financial statements and the reported amounts of revenues and expenses during the reporting period including estimates and assumptions related to taxation. Actual results could differ from those estimates by a significant amount. In addition, the Fund monitors for material events or transactions that may occur or become known after the period-end date and before the date the financial statements are released to print. |
| H. | Indemnifications — Under the Trust’s organizational documents, each Trustee, officer, employee or other agent of the Trust is indemnified against certain liabilities that may arise out of the performance of their duties to the Fund. Additionally, in the normal course of business, the Fund enters into contracts, including the Fund’s servicing agreements, that contain a variety of indemnification clauses. The Fund’s maximum exposure under these arrangements is unknown as this would involve future claims that may be made against the Fund that have not yet occurred. The risk of material loss as a result of such indemnification claims is considered remote. |
| I. | Treasury Inflation-Protected Securities— The Fund may invest in Treasury Inflation-Protected Securities (“TIPS”). TIPS are fixed income securities whose principal value is periodically adjusted to the rate of inflation. The principal value of TIPS will be adjusted upward or downward, and any increase or decrease in the principal amount of TIPS will be shown asTreasury Inflation-Protected Securities inflation adjustments in the Statement of Operations, even though investors do not receive their principal until maturity. |
| 25 | Invesco Strategic Real Return Fund |
NOTE 2—Advisory Fees and Other Fees Paid to Affiliates
The Trust has entered into a master investment advisory agreement with Invesco Advisers, Inc. (the "Adviser" or "Invesco"). Under the terms of the investment advisory agreement, the Fund accrues daily and pays monthly an advisory fee to the Adviser based on the annual rate of the Fund’s average daily net assets as follows:
| Average Daily Net Assets | Rate |
| First $1 billion | 0.40% |
| Next $2.5 billion | 0.35% |
| Over $3.5 billion | 0.33% |
For the year ended August 31, 2019, the effective advisory fees incurred by the Fund was 0.40%.
Under the terms of a master sub-advisory agreement between the Adviser and each of Invesco Asset Management Deutschland GmbH, Invesco Asset Management Limited, Invesco Asset Management (Japan) Limited, Invesco Hong Kong Limited, Invesco Senior Secured Management, Inc. and Invesco Canada Ltd. and separate sub-advisory agreements with Invesco Capital Management LLC and Invesco Asset Management (India) Private Limited (collectively, the "Affiliated Sub-Advisers") the Adviser, not the Fund, will pay 40% of the fees paid to the Adviser to any such Affiliated Sub-Adviser(s) that provide(s) discretionary investment management services to the Fund based on the percentage of assets allocated to such Affiliated Sub-Adviser(s).
The Adviser has contractually agreed, through at least December 31, 2019 to waive advisory fees and/or reimburse expenses to the extent necessary to limit total annual fund operating expenses after fee waiver and/or expense reimbursement (including prior fiscal year-ended Acquired Fund Fees and Expenses of 0.21% and excluding certain items discussed below) of Class A, Class C, Class R, Class Y, Class R5 and Class R6 shares to 0.82%, 1.57%, 1.07%, 0.57%, 0.57% and 0.57%, respectively, of average daily net assets (the "expense limits"). In determining the Adviser’s obligation to waive advisory fees and/or reimburse expenses, the following expenses are not taken into account, and could cause the total annual fund operating expenses after fee waiver and/or expense reimbursement to exceed the numbers reflected above: (1) interest; (2) taxes; (3) dividend expense on short sales; (4) extraordinary or non-routine items, including litigation expenses; and (5) expenses that the Fund has incurred but did not actually pay because of an expense offset arrangement. Acquired Fund Fees and Expenses are not operating expenses of the Fund directly, but are fees and expenses, including management fees, of the investment companies in which the Fund invests. As a result, the total annual fund operating expenses after expense reimbursement may exceed the expense limits above. Unless Invesco continues the fee waiver agreement, it will terminate on December 31, 2019. During its term, the fee waiver agreement cannot be terminated or amended to increase the expense limits or reduce the advisory fee waivers without approval of the Board of Trustees.
Further, the Adviser has contractually agreed, through at least June 30, 2021, to waive the advisory fee payable by the Fund in an amount equal to 100% of the net advisory fees the Adviser receives from the affiliated money market funds on investments by the Fund of uninvested cash in such affiliated money market funds.
For the year ended August 31, 2019, the Adviser waived advisory fees of $176,811, reimbursed fund level expenses of $79,177 and reimbursed class level expenses of $24,041, $1,619, $375, $19,463, $10 and $414 of Class A, Class C, Class R, Class Y, Class R5 and Class R6 shares, respectively.
The Trust has entered into a master administrative services agreement with Invesco pursuant to which the Fund has agreed to pay Invesco for certain administrative costs incurred in providing accounting services to the Fund. For the year ended August 31, 2019, expenses incurred under the agreement are shown in the Statement of Operations asAdministrative services fees. Also, Invesco has entered into a sub-administration agreement whereby State Street Bank and Trust Company (“SSB”) serves as custodian and fund accountant and provides certain administrative services to the Fund.
The Trust has entered into a transfer agency and service agreement with Invesco Investment Services, Inc. (“IIS”) pursuant to which the Fund has agreed to pay IIS a fee for providing transfer agency and shareholder services to the Fund and reimburse IIS for certain expenses incurred by IIS in the course of providing such services. IIS may make payments to intermediaries that provide omnibus account services, sub-accounting services and/or networking services. All fees payable by IIS to intermediaries that provide omnibus account services or sub-accounting services are charged back to the Fund, subject to certain limitations approved by the Trust’s Board of Trustees. For the year ended August 31, 2019, expenses incurred under the agreement are shown in the Statement of Operations asTransfer agent fees.
The Trust has entered into master distribution agreements with Invesco Distributors, Inc. (“IDI”) to serve as the distributor for the Class A, Class C, Class R, Class Y, Class R5 and Class R6 shares of the Fund. The Trust has adopted plans pursuant to Rule 12b-1 under the 1940 Act with respect to the Fund’s Class A, Class C and Class R shares (collectively, the “Plans”). The Fund, pursuant to the Plans, pays IDI compensation at the annual rate of 0.25% of the Fund’s average daily net assets of Class A shares, 1.00% of the average daily net assets of Class C shares and 0.50% of the average daily net assets of Class R shares. The fees are accrued daily and paid monthly. Of the Plan payments, up to 0.25% of the average daily net assets of each class of shares may be paid to furnish continuing personal shareholder services to customers who purchase and own shares of such classes. Any amounts not paid as a service fee under the Plans would constitute an asset-based sales charge. Rules of the Financial Industry Regulatory Authority (“FINRA”) impose a cap on the total sales charges, including asset-based sales charges, that may be paid by any class of shares of the Fund. For the year ended August 31, 2019, expenses incurred under the Plans are shown in the Statement of Operations as Distribution fees.
Front-end sales commissions and CDSC (collectively, the “sales charges”) are not recorded as expenses of the Fund. Front-end sales commissions are deducted from proceeds from the sales of Fund shares prior to investment in Class A shares of the Fund. CDSC are deducted from redemption proceeds prior to remittance to the shareholder. During the year ended August 31, 2019, IDI advised the Fund that IDI retained $3,482 in front-end sales commissions from the sale of Class A shares and $2,858 and $895 from Class A and Class C shares, respectively, for CDSC imposed upon redemptions by shareholders.
Certain officers and trustees of the Trust are officers and directors of the Adviser, IIS and/or IDI.
| 26 | Invesco Strategic Real Return Fund |
NOTE 3—Additional Valuation Information
GAAP defines fair value as the price that would be received to sell an asset or paid to transfer a liability in an orderly transaction between market participants at the measurement date, under current market conditions. GAAP establishes a hierarchy that prioritizes the inputs to valuation methods, giving the highest priority to readily available unadjusted quoted prices in an active market for identical assets (Level 1) and the lowest priority to significant unobservable inputs (Level 3), generally when market prices are not readily available or are unreliable. Based on the valuation inputs, the securities or other investments are tiered into one of three levels. Changes in valuation methods may result in transfers in or out of an investment’s assigned level:
Level 1 – Prices are determined using quoted prices in an active market for identical assets.
Level 2 – Prices are determined using other significant observable inputs. Observable inputs are inputs that other market participants may use in pricing a security. These may include quoted prices for similar securities, interest rates, prepayment speeds, credit risk, yield curves, loss severities, default rates, discount rates, volatilities and others.
Level 3 – Prices are determined using significant unobservable inputs. In situations where quoted prices or observable inputs are unavailable (for example, when there is little or no market activity for an investment at the end of the period), unobservable inputs may be used. Unobservable inputs reflect the Fund’s own assumptions about the factors market participants would use in determining fair value of the securities or instruments and would be based on the best available information.
The following is a summary of the tiered valuation input levels, as of August 31, 2019. The level assigned to the securities valuations may not be an indication of the risk or liquidity associated with investing in those securities. Because of the inherent uncertainties of valuation, the values reflected in the financial statements may materially differ from the value received upon actual sale of those investments.
| | Level 1 | Level 2 | Level 3 | Total |
| Investments in Securities | | | | |
| U.S. Treasury Securities | $— | $19,606,982 | $— | $19,606,982 |
| Common Stocks & Other Equity Interests | 13,160,222 | — | — | 13,160,222 |
| U.S. Dollar Denominated Bonds & Notes | 40,755 | 9,604,950 | — | 9,645,705 |
| Preferred Stocks | 772,148 | 46,935 | — | 819,083 |
| Money Market Funds | 327,678 | — | — | 327,678 |
| Total Investments | $14,300,803 | $29,258,867 | $— | $43,559,670 |
NOTE 4—Investments in Affiliates
The Fund’s Adviser and the adviser for Invesco Floating Rate Fund are subsidiaries of Invesco Ltd. and therefore, Invesco Floating Rate Fund is considered to be affiliated with the Fund. The following is a summary of the transactions in, and earnings from, investments in Invesco Floating Rate Fund (excluding affiliated money market funds) for the year ended August 31, 2019.
| | Value
08/31/18 | Purchases
at Cost | Proceeds
from Sales | Change in
Unrealized
Appreciation
(Depreciation) | Realized
Gain (Loss) | Value
08/31/19 | Dividend
Income |
| Invesco Floating Rate Fund - Class R6 | $12,517,778 | $4,248,130 | $(3,250,445) | $(115,127) | $(240,114) | $13,160,222 | $693,448 |
NOTE 5—Expense Offset Arrangement(s)
The expense offset arrangement is comprised of transfer agency credits which result from balances in demand deposit accounts used by the transfer agent for clearing shareholder transactions. For the year ended August 31, 2019, the Fund received credits from this arrangement, which resulted in the reduction of the Fund’s total expenses of $229.
NOTE 6—Trustees’ and Officers’ Fees and Benefits
Trustees’ and Officers’ Fees and Benefits include amounts accrued by the Fund to pay remuneration to certain Trustees and Officers of the Fund. Trustees have the option to defer compensation payable by the Fund, andTrustees’ and Officers’ Fees and Benefits also include amounts accrued by the Fund to fund such deferred compensation amounts. Those Trustees who defer compensation have the option to select various Invesco Funds in which their deferral accounts shall be deemed to be invested. Obligations under the deferred compensation plan represent unsecured claims against the general assets of the Fund.
NOTE 7—Cash Balances
The Fund is permitted to temporarily carry a negative or overdrawn balance in its account with SSB, the custodian bank. Such balances, if any at period-end, are shown in the Statement of Assets and Liabilities under the payable captionAmount due custodian. To compensate the custodian bank for such overdrafts, the overdrawn Fund may either (1) leave funds as a compensating balance in the account so the custodian bank can be compensated by earning the additional interest; or (2) compensate by paying the custodian bank at a rate agreed upon by the custodian bank and Invesco, not to exceed the contractually agreed upon rate. The Fund may not purchase additional securities when any borrowings from banks or broker-dealers exceed 5% of the Fund’s total assets, or when any borrowings from an Invesco Fund are outstanding.
| 27 | Invesco Strategic Real Return Fund |
NOTE 8—Distributions to Shareholders and Tax Components of Net Assets
| Tax Character of Distributions to Shareholders Paid During the Fiscal Years Ended August 31, 2019 and August 31, 2018 |
| | 2019 | 2018 |
| Ordinary income | $1,873,847 | $1,315,497 |
| Tax Components of Net Assets at Period-End: |
| | 2019 |
| Net unrealized appreciation — investments | $299,247 |
| Temporary book/tax differences | (7,150) |
| Capital loss carryforward | (671,349) |
| Shares of beneficial interest | 44,108,318 |
| Total net assets | $43,729,066 |
The difference between book-basis and tax-basis unrealized appreciation (depreciation) is due to differences in the timing of recognition of gains and losses on investments for tax and book purposes. The Fund’s net unrealized appreciation difference is attributable primarily to wash sales and bond premium amortization.
The temporary book/tax differences are a result of timing differences between book and tax recognition of income and/or expenses. The Fund’s temporary book/tax differences are the result of the trustee deferral of compensation and retirement plan benefits.
Capital loss carryforward is calculated and reported as of a specific date. Results of transactions and other activity after that date may affect the amount of capital loss carryforward actually available for the Fund to utilize. The ability to utilize capital loss carryforward in the future may be limited under the Internal Revenue Code and related regulations based on the results of future transactions.
The Fund has a capital loss carryforward as of August 31, 2019, as follows:
| Capital Loss Carryforward* |
| Expiration | Short-Term | Long-Term | Total |
| Not subject to expiration | $151,355 | $519,994 | $671,349 |
| * | Capital loss carryforward as of the date listed above is reduced for limitations, if any, to the extent required by the Internal Revenue Code and may be further limited depending upon a variety of factors, including the realization of net unrealized gains or losses as of the date of any reorganization. |
NOTE 9—Investment Transactions
The aggregate amount of investment securities (other than short-term securities, U.S. Treasury obligations and money market funds, if any) purchased and sold by the Fund during the year ended August 31, 2019 was $7,741,177 and $6,469,050, respectively. During the same period, purchases and sales of U.S. Treasury obligations were $7,225,806 and $7,640,268, respectively. Cost of investments, including any derivatives, on a tax basis includes the adjustments for financial reporting purposes as of the most recently completed federal income tax reporting period-end.
| Unrealized Appreciation (Depreciation) of Investments on a Tax Basis |
| Aggregate unrealized appreciation of investments | $972,012 |
| Aggregate unrealized (depreciation) of investments | (672,765) |
| Net unrealized appreciation of investments | $299,247 |
Cost of investments for tax purposes is $43,260,423.
NOTE 10—Reclassification of Permanent Differences
Primarily as a result of differing book/tax treatment of bond premium amortization, on August 31, 2019, undistributed net investment income (loss) was increased by $121,882, undistributed net realized gain (loss) was decreased by $114,080 and shares of beneficial interest was decreased by $7,802. This reclassification had no effect on the net assets of the Fund.
NOTE 11—Share Information
| | Summary of Share Activity |
| | Years ended August 31, |
| | 2019(a) | | 2018 |
| | Shares | Amount | | Shares | Amount |
| Sold: | | | | | |
| Class A | 762,001 | $7,187,400 | | 1,011,272 | $9,721,532 |
| Class C | 72,597 | 688,966 | | 96,900 | 929,965 |
| Class R | 32,033 | 298,642 | | 13,872 | 133,785 |
| Class Y | 636,803 | 6,010,857 | | 988,153 | 9,460,482 |
| Class R5 | 653 | 6,280 | | - | - |
| Class R6 | 22,074 | 208,755 | | 22,219 | 215,133 |
| 28 | Invesco Strategic Real Return Fund |
| | Summary of Share Activity |
| | Years ended August 31, |
| | 2019(a) | | 2018 |
| | Shares | Amount | | Shares | Amount |
| Issued as reinvestment of dividends: | | | | | |
| Class A | 65,534 | $617,888 | | 42,051 | $403,563 |
| Class C | 4,674 | 43,964 | | 4,794 | 46,027 |
| Class R | 1,429 | 13,493 | | 648 | 6,225 |
| Class Y | 49,955 | 470,736 | | 21,198 | 203,084 |
| Class R5 | 5 | 42 | | - | - |
| Class R6 | 1,870 | 17,679 | | 1,337 | 12,843 |
| Automatic conversion of Class C shares to Class A shares: | | | | | |
| Class A | 54,803 | 509,097 | | - | - |
| Class C | (54,861) | (509,097) | | - | - |
| Reacquired: | | | | | |
| Class A | (688,348) | (6,486,626) | | (418,880) | (4,024,463) |
| Class C | (52,118) | (493,899) | | (74,472) | (716,392) |
| Class R | (9,514) | (90,398) | | (7,085) | (68,184) |
| Class Y | (736,601) | (6,958,066) | | (151,723) | (1,453,213) |
| Class R6 | (3,204) | (30,228) | | (15,403) | (149,365) |
| Net increase in share activity | 159,785 | $1,505,485 | | 1,534,881 | $14,721,022 |
| (a) | There are entities that are record owners of more than 5% of the outstanding shares of the Fund and in the aggregate own 45% of the outstanding shares of the Fund. IDI has an agreement with these entities to sell Fund shares. The Fund, Invesco and/or Invesco affiliates may make payments to these entities, which are considered to be related to the Fund, for providing services to the Fund, Invesco and/or Invesco affiliates including but not limited to services such as securities brokerage, distribution, third party record keeping and account servicing. The Fund has no knowledge as to whether all or any portion of the shares owned of record by these entities are also owned beneficially. |
| | In addition, 33% of the outstanding shares of the Fund are owned by the Adviser or an affiliate of the Adviser. |
NOTE 12—Subsequent Event
On September 18, 2019, the Board of Trustees of AIM Counselor Series Trust (Invesco Counselor Series Trust) approved a Plan of Liquidation and Dissolution, which authorizes the termination, liquidation and dissolution of the Fund. In order to effect such liquidation, the Fund will close to investments by new accounts after the close of business on September 20, 2019. The Fund will be liquidated on or before October 30, 2019.
| 29 | Invesco Strategic Real Return Fund |
Report of Independent Registered Public Accounting Firm
To the Board of Trustees of AIM Counselor Series Trust (Invesco Counselor Series Trust) and Shareholders of Invesco Strategic Real Return Fund
Opinion on the Financial Statements
We have audited the accompanying statement of assets and liabilities, including the schedule of investments, of Invesco Strategic Real Return Fund (one of the funds constituting AIM Counselor Series Trust (Invesco Counselor Series Trust), hereafter referred to as the "Fund") as of August 31, 2019, the related statement of operations for the year ended August 31, 2019, the statement of changes in net assets for each of the two years in the period ended August 31, 2019, including the related notes, and the financial highlights for each of the five years in the period ended August 31, 2019 (collectively referred to as the "financial statements"). In our opinion, the financial statements present fairly, in all material respects, the financial position of the Fund as of August 31, 2019, the results of its operations for the year then ended, the changes in its net assets for each of the two years in the period ended August 31, 2019 and the financial highlights for each of the five years in the period ended August 31, 2019 in conformity with accounting principles generally accepted in the United States of America.
Basis for Opinion
These financial statements are the responsibility of the Fund’s management. Our responsibility is to express an opinion on the Fund’s financial statements based on our audits. We are a public accounting firm registered with the Public Company Accounting Oversight Board (United States) (PCAOB) and are required to be independent with respect to the Fund in accordance with the U.S. federal securities laws and the applicable rules and regulations of the Securities and Exchange Commission and the PCAOB.
We conducted our audits of these financial statements in accordance with the standards of the PCAOB. Those standards require that we plan and perform the audit to obtain reasonable assurance about whether the financial statements are free of material misstatement, whether due to error or fraud.
Our audits included performing procedures to assess the risks of material misstatement of the financial statements, whether due to error or fraud, and performing procedures that respond to those risks. Such procedures included examining, on a test basis, evidence regarding the amounts and disclosures in the financial statements. Our audits also included evaluating the accounting principles used and significant estimates made by management, as well as evaluating the overall presentation of the financial statements. Our procedures included confirmation of securities owned as of August 31, 2019 by correspondence with the custodian, transfer agent and brokers; when replies were not received from brokers, we performed other auditing procedures. We believe that our audits provide a reasonable basis for our opinion.
/s/ PricewaterhouseCoopers LLP
Houston, Texas
October 29, 2019
We have served as the auditor of one or more of the investment companies in the Invesco group of investment companies since at least 1995. We have not been able to determine the specific year we began serving as auditor.
| 30 | Invesco Strategic Real Return Fund |
Calculating your ongoing Fund expenses
Example
As a shareholder of the Fund, you incur two types of costs: (1) transaction costs, which may include sales charges (loads) on purchase payments or contingent deferred sales charges on redemptions, if any; and (2) ongoing costs, including management fees, distribution and/or service (12b-1) fees, and other Fund expenses. This example is intended to help you understand your ongoing costs (in dollars) of investing in the Fund and to compare these costs with ongoing costs of investing in other mutual funds. The example is based on an investment of $1,000 invested at the beginning of the period and held for the entire period March 1, 2019 through August 31, 2019.
Actual expenses
The table below provides information about actual account values and actual expenses. You may use the information in this table, together with the amount you invested, to estimate the expenses that you paid over the period. Simply divide your account value by $1,000 (for example, an $8,600 account value divided by $1,000 = 8.6), then multiply the result by the number in the table under the heading entitled “Actual Expenses Paid During Period” to estimate the expenses you paid on your account during this period.
Hypothetical example for comparison purposes
The table below also provides information about hypothetical account values and hypothetical expenses based on the Fund’s actual expense ratio and an assumed rate of return of 5% per year before expenses, which is not the Fund’s actual return.
The hypothetical account values and expenses may not be used to estimate the actual ending account balance or expenses you paid for the period. You may use this information to compare the ongoing costs of investing in the Fund and other funds. To do so, compare this 5% hypothetical example with the 5% hypothetical examples that appear in the shareholder reports of the other funds.
Please note that the expenses shown in the table are meant to highlight your ongoing costs only and do not reflect any transaction costs, such as sales charges (loads) on purchase payments or contingent deferred sales charges on redemptions, if any. Therefore, the hypothetical information is useful in comparing ongoing costs only, and will not help you determine the relative total costs of owning different funds. In addition, if these transaction costs were included, your costs would have been higher.
| | Beginning
Account Value (03/01/19) | ACTUAL | HYPOTHETICAL
(5% annual return before
expenses) | Annualized
Expense
Ratio |
Ending
Account Value
(08/31/19)1 | Expenses
Paid During
Period2 | Ending
Account Value
(08/31/19) | Expenses
Paid During
Period2 |
| Class A | $1,000.00 | $1,049.00 | $3.10 | $1,022.18 | $3.06 | 0.60% |
| Class C | 1,000.00 | 1,045.10 | 6.96 | 1,018.40 | 6.87 | 1.35 |
| Class R | 1,000.00 | 1,047.70 | 4.39 | 1,020.92 | 4.33 | 0.85 |
| Class Y | 1,000.00 | 1,050.30 | 1.81 | 1,023.44 | 1.79 | 0.35 |
| Class R5 | 1,000.00 | 1,050.30 | 1.81 | 1,023.44 | 1.79 | 0.35 |
| Class R6 | 1,000.00 | 1,050.30 | 1.81 | 1,023.44 | 1.79 | 0.35 |
| 1 | The actual ending account value is based on the actual total return of the Fund for the period March 1, 2019 through August 31, 2019, after actual expenses and will differ from the hypothetical ending account value which is based on the Fund’s expense ratio and a hypothetical annual return of 5% before expenses. |
| 2 | Expenses are equal to the Fund’s annualized expense ratio as indicated above multiplied by the average account value over the period, multiplied by 184/365 to reflect the most recent fiscal half year. |
| 31 | Invesco Strategic Real Return Fund |
Approval of Investment Advisory and Sub-Advisory Agreements
At meetings held on June 10, 2019, the Board of Trustees (the Board or the Trustees) of AIM Counselor Series Trust (Invesco Counselor Series Trust) as a whole, and the independent Trustees, who comprise over 75% of the Board, voting separately, approved the continuance of the Invesco Strategic Real Return Fund’s (the Fund) Master Investment Advisory Agreement with Invesco Advisers, Inc. (Invesco Advisers and the investment advisory agreement) and the Master IntergroupSub-Advisory Contract for Mutual Funds with Invesco Asset Management Deutschland GmbH, Invesco Asset Management Limited, Invesco Asset Management (Japan) Limited, Invesco Hong Kong Limited, Invesco Senior Secured Management, Inc., Invesco Canada Ltd. and separatesub-advisory contracts with Invesco Capital Management LLC and Invesco Asset Management (India) Private Limited (collectively, the AffiliatedSub-Advisers and thesub-advisory contracts) for another year, effective July 1, 2019. After evaluating the factors discussed below, among others, the Board approved the renewal of the Fund’s investment advisory agreement and thesub-advisory contracts and determined that the compensation payable by the Fund to Invesco Advisers and by Invesco Advisers to the AffiliatedSub-Advisers is fair and reasonable.
The Board’s Evaluation Process
The Board’s Investments Committee has established threeSub-Committees, which meet throughout the year to review the performance of funds advised by Invesco Advisers (the Invesco Funds). As part of a regularly scheduled basis ofin-person Board meetings, theSub-Committees meet with portfolio managers for their assigned Invesco Funds and other members of management to review detailed information about investment performance and portfolio attributes of these funds. The Board took into account evaluations and reports that it received from the Investments Committee andSub-Committees, as well as the information provided to such committees and the Board throughout the year, in considering whether to approve each Invesco Fund’s investment advisory agreement andsub-advisory contracts.
As part of the contract renewal process, the Board reviews and considers information provided in response to detailed requests for information submitted to management by the independent Trustees with assistance from legal counsel to the independent Trustees. The Board receives comparative investment performance and fee data regarding the Invesco Funds prepared by Invesco Advisers and Broadridge Financial Solutions, Inc. (Broadridge), an independent mutual fund data provider. The Board also receives an independent written evaluation from the Senior Officer, an officer of the Invesco Funds who reports directly to the independent Trustees. The Senior Officer’s
evaluation is prepared as part of his responsibility to manage the process by which the Invesco Funds’ proposed management fees are negotiated during the annual contract renewal process to ensure they are negotiated in a manner that is at arms’ length and reasonable. In addition to meetings with Invesco Advisers and fund counsel throughout the year, the independent Trustees also discuss the continuance of the investment advisory agreement andsub-advisory contracts in separate sessions with the Senior Officer and with independent legal counsel.
The discussion below is a summary of the Senior Officer’s independent written evaluation with respect to the Fund’s investment advisory agreement, as well as a discussion of the material factors and related conclusions that formed the basis for the Board’s approval of the Fund’s investment advisory agreement andsub-advisory contracts. The Trustees’ review and conclusions are based on the comprehensive consideration of all information presented to them during the course of the year and in prior years and are not the result of any single determinative factor. Moreover, one Trustee may have weighed a particular piece of information or factor differently than another Trustee. This information is current as of June 10, 2019.
Factors and Conclusions and Summary of Independent Written Fee Evaluation
| A. | Nature, Extent and Quality of Services Provided by Invesco Advisers and the AffiliatedSub-Advisers |
The Board reviewed the nature, extent and quality of the advisory services provided to the Fund by Invesco Advisers under the Fund’s investment advisory agreement, and the credentials and experience of the officers and employees of Invesco Advisers who provide these services, including the Fund’s portfolio manager(s). The Board’s review included consideration of Invesco Advisers’ investment process oversight and structure, credit analysis and investment risk management. The Board also considerednon-advisory services that Invesco Advisers and its affiliates provide to the Invesco Funds such as various back office support functions, third party oversight, internal audit, valuation, portfolio trading and legal and compliance. The Board also received and reviewed information about Invesco Advisers’ role as administrator of the Invesco Funds’ liquidity risk management program. The Board also reviewed and considered the benefits to shareholders of investing in a fund that is part of the Invesco family of funds under the umbrella of Invesco Ltd., Invesco Advisers’ parent company, and noted Invesco Ltd.’s depth and experience in conducting an investment management business, as well as its commitment of financial and other resources to
such business. The Board reviewed and considered information about the resources that Invesco Advisers intends to continue to commit to managing the Invesco family of funds following Invesco Ltd.’s acquisition of OppenheimerFunds, Inc. and its subsidiaries. The Board concluded that the nature, extent and quality of the services provided to the Fund by Invesco Advisers are appropriate and satisfactory.
The Board reviewed the services that may be provided by the AffiliatedSub-Advisers under thesub-advisory contracts and the credentials and experience of the officers and employees of the AffiliatedSub-Advisers who provide these services. The Board noted the AffiliatedSub-Advisers’ expertise with respect to certain asset classes and that the AffiliatedSub-Advisers have offices and personnel that are located in financial centers around the world. As a result, the Board noted that the AffiliatedSub-Advisers can provide research and investment analysis on the markets and economies of various countries in which the Fund may invest, make recommendations regarding securities and assist with security trades. The Board concluded that thesub-advisory contracts may benefit the Fund and its shareholders by permitting Invesco Advisers to use the resources and talents of the AffiliatedSub-Advisers in managing the Fund. The Board concluded that the nature, extent and quality of the services that may be provided by the AffiliatedSub-Advisers are appropriate and satisfactory.
| B. | Fund Investment Performance |
The Board considered Fund investment performance as a relevant factor in considering whether to approve the investment advisory agreement as well as thesub-advisory contracts for the Fund, as Invesco Senior Secured Management, Inc. currently manages assets of the Fund.
The Board noted that the Fund was new and compared the Fund’s investment performance over multiple time periods ending December 31, 2018 to the performance of funds in the Broadridge performance universe and against the Lipper Inflation Protected Bond Funds Index. The Board noted that performance of Class A shares of the Fund was in the third quintile of its performance universe for the one year period and the first quintile for the three year period (the first quintile being the best performing funds and the fifth quintile being the worst performing funds). The Board noted that performance of Class A shares of the Fund was below the performance of the Index for the one year period and above the performance of the Index for the three year period. The Trustees also reviewed more recent Fund performance and this review did not change their conclusions.
32 Invesco Strategic Real Return Fund
| C. | Advisory andSub-Advisory Fees and Fund Expenses |
The Board compared the Fund’s contractual management fee rate to the contractual management fee rates of funds in the Fund’s Broadridge expense group. The Board noted that the contractual management fee rate for Class A shares of the Fund was below the median contractual management fee rate of funds in its expense group. The Board noted that the term “contractual management fee” for funds in the expense group may include both advisory and certainnon-portfolio management administrative services fees, but that Broadridge does not provide information on a fund by fund basis as to what is included. The Board also reviewed the methodology used by Broadridge in providing expense group information, which includes using each fund’s contractual management fee schedule (including any applicable breakpoints) as reported in the most recent prospectus or statement of additional information for each fund in the expense group. The Board also considered comparative information regarding the Fund’s total expense ratio and its various components.
The Board noted that Invesco Advisers has contractually agreed to waive fees and/or limit expenses of the Fund for the term disclosed in the Fund’s registration statement in an amount necessary to limit total annual operating expenses to a specified percentage of average daily net assets for each class of the Fund.
The Board also considered the fees charged by Invesco Advisers and the AffiliatedSub-Advisers to other similarly managed client accounts. The Board noted that Invesco Advisers or the AffiliatedSub-Advisers may charge lower fees to large institutional clients. Invesco Advisers reviewed with the Board differences in the scope of services it provides to the Invesco Funds relative to certain other types of client accounts, including management of cash flows as a result of redemptions and purchases, necessary infrastructure such as officers, office space, technology, legal and distribution, oversight of service providers, costs and business risks associated with launching new funds and sponsoring and maintaining the product line, preparation of annual registration statement updates and financial information and compliance with federal and state laws and regulations.
The Board also considered the services that may be provided by the AffiliatedSub-Advisers pursuant to thesub-advisory contracts, as well as the fees payable by Invesco Advisers to the AffiliatedSub-Advisers pursuant to thesub-advisory contracts. The Board noted that Invesco Advisers retains overall responsibility for, and provides services to,sub-advised Invesco Funds, including oversight of the AffiliatedSub-Advisers as well as the additional services described herein other thanday-to-day portfolio management.
| D. | Economies of Scale and Breakpoints |
The Board considered the extent to which there may be economies of scale in the provision of advisory services to the Fund. The Board considered Invesco’s reinvestment in its business, including investments in business infrastructure and cybersecurity. The Board also considered that the Fund may benefit from economies of scale through contractual breakpoints in the Fund’s advisory fee schedule, which generally operate to reduce the Fund’s expense ratio as it grows in size. The Board noted that the Fund shares directly in economies of scale through lower fees charged by third party service providers based on the combined size of the Invesco Funds. The Board noted that the Fund may also benefit from economies of scale through initial fee setting, fee waivers and expense reimbursements.
| E. | Profitability and Financial Resources |
The Board reviewed information from Invesco Advisers concerning the costs of the advisory and other services that Invesco Advisers and its affiliates provide to the Fund and the Invesco Funds and the profitability of Invesco Advisers and its affiliates in providing these services. The Board considered the methodology used for calculating profitability and noted the periodic review of such methodology by an independent consultant. The Board noted that Invesco Advisers continues to operate at a net profit from services Invesco Advisers and its affiliates provide to the Invesco Funds. The Board received information from Invesco Advisers demonstrating that Invesco Advisers and the AffiliatedSub-Advisers are financially sound and have the resources necessary to perform their obligations under the investment advisory agreement andsub-advisory contracts.
| F. | Collateral Benefits to Invesco Advisers and its Affiliates |
The Board considered various other benefits received by Invesco Advisers and its affiliates from the relationship with the Fund, including the fees received for providing administrative, transfer agency and distribution services to the Fund. The Board considered comparative information regarding fees charged for these services, including information provided by Broadridge and other independent sources. The Board considered the performance of Invesco Advisers and its affiliates in providing these services and the organizational structure employed to provide these services. The Board also considered that these services are provided to the Fund pursuant to written contracts that are reviewed and approved on an annual basis by the Board; and that the services are required for the operation of the Fund.
The Board considered the benefits realized by Invesco Advisers and the AffiliatedSub-Advisers as a result of portfolio brokerage transactions executed through “soft dollar” arrangements. Invesco Advisers noted that the Fund does not execute brokerage transactions through “soft dollar” arrangements to any significant degree.
The Board considered that the Fund’s uninvested cash and cash collateral from any
securities lending arrangements may be invested in money market funds advised by Invesco Advisers pursuant to procedures approved by the Board. The Board considered information regarding the returns of the affiliated money market funds relative to comparable overnight investments, as well as the costs to the Fund of such investments. The Board noted that Invesco Advisers receives advisory fees from these affiliated money market funds attributable to such investments, although Invesco Advisers has contractually agreed to waive through varying periods the advisory fees payable by the Invesco Funds with respect to certain investments in the affiliated money market funds. The waiver is in an amount equal to 100% of the net advisory fee Invesco Advisers receives from the affiliated money market funds with respect to the Fund’s investment in the affiliated money market funds of uninvested cash, but not cash collateral. The Board concluded that the amount of advisory fees received by Invesco Advisers from the Fund’s investment of cash collateral from any securities lending arrangements in the affiliated money market funds is fair and reasonable.
33 Invesco Strategic Real Return Fund
Tax Information
Form 1099-DIV, Form 1042-S and other year–end tax information provide shareholders with actual calendar year amounts that should be included in their tax returns. Shareholders should consult their tax advisers.
The following distribution information is being provided as required by the Internal Revenue Code or to meet a specific state’s requirement.
The Fund designates the following amounts or, if subsequently determined to be different, the maximum amount allowable for its fiscal year ended August 31, 2019:
| Federal and State Income Tax | |
| Qualified Dividend Income* | 2.50% |
| Corporate Dividends Received Deduction* | 2.48% |
| U.S. Treasury Obligations* | 11.68% |
| Tax-Exempt Interest Dividends* | 0% |
| * | The above percentages are based on ordinary income dividends paid to shareholders during the Fund’s fiscal year. |
| 34 | Invesco Strategic Real Return Fund |
Trustees and Officers
The address of each trustee and officer is AIM Counselor Series Trust (Invesco Counselor Series Trust) (the “Trust”), 11 Greenway Plaza, Suite 1000, Houston, Texas 77046-1173. The trustees serve for the life of the Trust, subject to their earlier death, incapacitation, resignation, retirement or removal as more specifically provided in the Trust’s organizational documents. Each officer serves for a one year term or until their successors are elected and qualified. Column two below includes length of time served with predecessor entities, if any.
| | | | | | | | |
Name, Year of Birth and Position(s) Held with the Trust | | Trustee and/ or Officer Since | | Principal Occupation(s) During Past 5 Years | | Number of Funds in Fund
Complex
Overseen by
Trustee | | Other Directorship(s) Held by Trustee During Past 5 Years |
| Interested Persons | | | | | | | | |
Martin L. Flanagan1 — 1960 Trustee and Vice Chair | | 2007 | | Executive Director, Chief Executive Officer and President, Invesco Ltd. (ultimate parent of Invesco and a global investment management firm); Trustee and Vice Chair, The Invesco Funds; Vice Chair, Investment Company Institute; and Member of Executive Board, SMU Cox School of Business Formerly: Advisor to the Board, Invesco Advisers, Inc. (formerly known as Invesco Institutional (N.A.), Inc.); Chairman and Chief Executive Officer, Invesco Advisers, Inc. (registered investment adviser); Director, Chairman, Chief Executive Officer and President, Invesco Holding Company (US), Inc. (formerly IVZ Inc.) (holding company), Invesco Group Services, Inc. (service provider) and Invesco North American Holdings, Inc. (holding company); Director, Chief Executive Officer and President, Invesco Holding Company Limited (parent of Invesco and a global investment management firm); Director, Invesco Ltd.; Chairman, Investment Company Institute and President,Co-Chief Executive Officer,Co-President, Chief Operating Officer and Chief Financial Officer, Franklin Resources, Inc. (global investment management organization) | | 229 | | None |
Philip A. Taylor2 — 1954 Trustee | | 2006 | | Vice Chair, Invesco Ltd.; Trustee, The Invesco Funds Formerly: Director, Invesco Canada Ltd. (formerly known as Invesco Trimark Ltd./Invesco Trimark Ltèe) (registered investment adviser and registered transfer agent); Head of the Americas and Senior Managing Director, Invesco Ltd.; Director, Invesco Advisers, Inc. (formerly known as Invesco Institutional (N.A.), Inc.) (registered investment adviser); Director and Chairman, Invesco Investment Services, Inc. (formerly known as Invesco AIM Investment Services, Inc.) (registered transfer agent); Chief Executive Officer, Invesco Corporate Class Inc. (corporate mutual fund company); Chairman and Chief Executive Officer, Invesco Canada Ltd. (formerly known as Invesco Trimark Ltd./Invesco Trimark Ltèe) (registered investment adviser and registered transfer agent); Senior Vice President, The Invesco Funds; Director, Invesco Investment Advisers LLC (formerly known as Van Kampen Asset Management); Director, Chairman, Chief Executive Officer and President, Invesco Management Group, Inc. (formerly known as Invesco AIM Management Group, Inc.) (financial services holding company);Co-Chairman,Co-President andCo-Chief Executive Officer, Invesco Advisers, Inc. (formerly known as Invesco Institutional (N.A.), Inc.) (registered investment adviser); Director, Chief Executive Officer and President, Van Kampen Exchange Corp; President and Principal Executive Officer, The Invesco Funds (other than AIM Treasurer’s Series Trust (Invesco Treasurer’s Series Trust), Short-Term Investments Trust and Invesco Management Trust); Executive Vice President, The Invesco Funds (AIM Treasurer’s Series Trust (Invesco Treasurer’s Series Trust), Short-Term Investments Trust and Invesco Management Trust only); Director and President, INVESCO Funds Group, Inc. (registered investment adviser and registered transfer agent); Director and Chairman, IVZ Distributors, Inc. (formerly known as INVESCO Distributors, Inc.) (registered broker dealer); Director, President and Chairman, Invesco Inc. (holding company), Invesco Canada Holdings Inc. (holding company), Trimark Investments Ltd./Placements Trimark Ltèe and Invesco Financial Services Ltd/Services Financiers Invesco Ltèe; Chief Executive Officer, Invesco Canada Fund Inc. (corporate mutual fund company); Director and Chairman, Van Kampen Investor Services Inc.; Director, Chief Executive Officer and President, 1371 Preferred Inc. (holding company) and Van Kampen Investments Inc.; Director and President, AIM GP Canada Inc. (general partner for limited partnerships) and Van Kampen Advisors, Inc.; Director and Chief Executive Officer, Invesco Trimark Dealer Inc. (registered broker dealer); Director, Invesco Distributors, Inc. (formerly known as Invesco AIM Distributors, Inc.) (registered broker dealer); Manager, Invesco Capital Management LLC; Director, Chief Executive Officer and President, Invesco Advisers, Inc.; Director, Chairman, Chief Executive Officer and President, Invesco AIM Capital Management, Inc.; President, Invesco Trimark Dealer Inc. and Invesco Trimark Ltd./Invesco Trimark Ltèe; Director and President, AIM Trimark Corporate Class Inc. and AIM Trimark Canada Fund Inc.; Senior Managing Director, Invesco Holding Company Limited; Director and Chairman, Fund Management Company (former registered broker dealer); President and Principal Executive Officer, The Invesco Funds (AIM Treasurer’s Series Trust (Invesco Treasurer’s Series Trust), and Short-Term Investments Trust only); President, AIM Trimark Global Fund Inc. and AIM Trimark Canada Fund Inc. | | 229 | | None |
| 1 | Mr. Flanagan is considered an interested person (within the meaning of Section 2(a)(19) of the 1940 Act) of the Trust because he is an officer of the Adviser to the Trust, and an officer and a director of Invesco Ltd., ultimate parent of the Adviser. |
| 2 | Mr. Taylor is considered an interested person (within the meaning of Section 2(a)(19) of the 1940 Act) of the Trust because he is an officer of Invesco Ltd., ultimate parent of the Adviser. |
T-1 Invesco Strategic Real Return Fund
Trustees and Officers—(continued)
| | | | | | | | |
Name, Year of Birth and Position(s) Held with the Trust | | Trustee and/ or Officer Since | | Principal Occupation(s)
During Past 5 Years | | Number of
Funds in Fund
Complex
Overseen by
Trustee | | Other Directorship(s) Held by Trustee During
Past 5 Years |
| Independent Trustees | | | | | | | | |
Bruce L. Crockett — 1944 Trustee and Chair | | 2003 | | Chairman, Crockett Technologies Associates (technology consulting company) Formerly: Director, Captaris (unified messaging provider); Director, President and Chief Executive Officer, COMSAT Corporation; Chairman, Board of Governors of INTELSAT (international communications company); ACE Limited (insurance company); Independent Directors Council and Investment Company Institute: Member of the Audit Committee, Investment Company Institute; Member of the Executive Committee and Chair of the Governance Committee, Independent Directors Council | | 229 | | Director and Chairman of the Audit Committee, ALPS (Attorneys Liability Protection Society) (insurance company); Director and Member of the Audit Committee and Compensation Committee, Ferroglobe PLC (metallurgical company) |
David C. Arch — 1945 Trustee | | 2010 | | Chairman of Blistex Inc. (consumer health care products manufacturer); Member, World Presidents’ Organization | | 229 | | Board member of the Illinois Manufacturers’ Association |
Beth Ann Brown — 1968 Trustee | | 2019 | | Independent Consultant Formerly: Head of Intermediary Distribution, Managing Director, Strategic Relations, Managing Director, Head of National Accounts, Senior Vice President, National Account Manager and Senior Vice President, Key Account Manager, Columbia Management Investment Advisers LLC; Vice President, Key Account Manager, Liberty Funds Distributor, Inc.; and Trustee of certain Oppenheimer Funds | | 229 | | Director, Board of Directors of Caron Engineering Inc.; Advisor, Board of Advisors of Caron Engineering Inc.; President and Director, Acton Shapleigh Youth Conservation Corps (non -profit); and Vice President and Director of Grahamtastic Connection(non-profit) |
Jack M. Fields — 1952 Trustee | | 2003 | | Chief Executive Officer, Twenty First Century Group, Inc. (government affairs company); and Chairman, Discovery Learning Alliance(non-profit) Formerly: Owner and Chief Executive Officer, Dos Angeles Ranch L.P. (cattle, hunting, corporate entertainment); Director, Insperity, Inc. (formerly known as Administaff) (human resources provider); Chief Executive Officer, Texana Timber LP (sustainable forestry company); Director of Cross Timbers Quail Research Ranch(non-profit); and member of the U.S. House of Representatives | | 229 | | None |
Cynthia Hostetler — 1962 Trustee | | 2017 | | Non-Executive Director and Trustee of a number of public and private business corporations Formerly: Director, Aberdeen Investment Funds (4 portfolios); Head of Investment Funds and Private Equity, Overseas Private Investment Corporation; President, First Manhattan Bancorporation, Inc.; Attorney, Simpson Thacher & Bartlett LLP | | 229 | | Vulcan Materials Company (construction materials company); Trilinc Global Impact Fund; Genesee & Wyoming, Inc. (railroads); Artio Global Investment LLC (mutual fund complex); Edgen Group, Inc. (specialized energy and infrastructure products distributor); Investment Company Institute (professional organization); Independent Directors Council (professional organization) |
Eli Jones — 1961 Trustee | | 2016 | | Professor and Dean, Mays Business School — Texas A&M University Formerly: Professor and Dean, Walton College of Business, University of Arkansas and E.J. Ourso College of Business, Louisiana State University; Director, Arvest Bank | | 229 | | Insperity, Inc. (formerly known as Administaff) (human resources provider) |
Elizabeth Krentzman — 1959 Trustee | | 2019 | | Formerly: Principal and Chief Regulatory Advisor for Asset Management Services and U.S. Mutual Fund Leader of Deloitte & Touche LLP; General Counsel of the Investment Company Institute (trade association); National Director of the Investment Management Regulatory Consulting Practice, Principal, Director and Senior Manager of Deloitte & Touche LLP; Assistant Director of the Division of Investment Management — Office of Disclosure and Investment Adviser Regulation of the U.S. Securities and Exchange Commission and various positions with the Division of Investment Management — Office of Regulatory Policy of the U.S. Securities and Exchange Commission; Associate at Ropes & Gray LLP; Advisory Board Member of the Securities and Exchange Commission Historical Society; and Trustee of certain Oppenheimer Funds | | 229 | | Trustee of the University of Florida National Board Foundation and Audit Committee Member; Member of the Cartica Funds Board of Directors (private investment funds); Member of the University of Florida Law Center Association, Inc. Board of Trustees and Audit Committee Member |
Anthony J. LaCava, Jr. — 1956 Trustee | | 2019 | | Formerly: Director and Member of the Audit Committee, Blue Hills Bank (publicly traded financial institution) and Managing Partner, KPMG LLP | | 229 | | Blue Hills Bank; Chairman, Bentley University; Member, Business School Advisory Council; and Nominating Committee, KPMG LLP |
T-2 Invesco Strategic Real Return Fund
Trustees and Officers—(continued)
| | | | | | | | |
Name, Year of Birth and Position(s) Held with the Trust | | Trustee and/ or Officer Since | | Principal Occupation(s)
During Past 5 Years | | Number of
Funds in Fund
Complex
Overseen by
Trustee | | Other Directorship(s) Held by Trustee During
Past 5 Years |
| Independent Trustees—(continued) |
Prema Mathai-Davis — 1950 Trustee | | 2003 | | Retired Co-Owner & Partner of Quantalytics Research, LLC, (a FinTech Investment Research Platform for the Self-Directed Investor) | | 229 | | None |
Joel W. Motley — 1952 Trustee | | 2019 | | Director of Office of Finance, Federal Home Loan Bank; Member of the Vestry of Trinity Wall Street; Managing Director of Carmona Motley Inc. (privately held financial advisor); Member of the Finance and Budget Committee of the Council on Foreign Relations, Member of the Investment Committee and Board of Human Rights Watch and Member of the Investment Committee and Board of Historic Hudson Valley(non-profit cultural organization) Formerly: Managing Director of Public Capital Advisors, LLC (privately held financial advisor); Managing Director of Carmona Motley Hoffman, Inc. (privately held financial advisor); Trustee of certain Oppenheimer Funds; and Director of Columbia Equity Financial Corp. (privately held financial advisor) | | 229 | | Director of Greenwall Foundation (bioethics research foundation); Member of Board and Investment Committee of The Greenwall Foundation; Director of Southern Africa Legal Services Foundation; Board Member and Investment Committee Member of Pulitzer Center for Crisis Reporting(non-profit journalism) |
Teresa M. Ressel — 1962 Trustee | | 2017 | | Non-executive director and trustee of a number of public and private business corporations Formerly: Chief Financial Officer, Olayan America, The Olayan Group (international investor/commercial/industrial); Chief Executive Officer, UBS Securities LLC; Group Chief Operating Officer, Americas, UBS AG; Assistant Secretary for Management & Budget and CFO, US Department of the Treasury | | 229 | | Atlantic Power Corporation (power generation company); ON Semiconductor Corp. (semiconductor supplier) |
Ann Barnett Stern — 1957 Trustee | | 2017 | | President and Chief Executive Officer, Houston Endowment Inc. (private philanthropic institution) Formerly: Executive Vice President and General Counsel, Texas Children’s Hospital; Attorney, Beck, Redden and Secrest, LLP; Business Law Instructor, University of St. Thomas; Attorney, Andrews & Kurth LLP | | 229 | | Federal Reserve Bank of Dallas |
Raymond Stickel, Jr. — 1944 Trustee | | 2005 | | Retired Formerly: Director, Mainstay VP Series Funds, Inc. (25 portfolios); Partner, Deloitte & Touche | | 229 | | None |
Robert C. Troccoli — 1949 Trustee | | 2016 | | Retired Formerly: Adjunct Professor, University of Denver — Daniels College of Business; Senior Partner, KPMG LLP | | 229 | | None |
Daniel S. Vandivort — 1954 Trustee | | 2019 | | Treasurer, Chairman of the Audit and Finance Committee, and Trustee, Board of Trustees, Huntington Disease Foundation of America; and President, Flyway Advisory Services LLC (consulting and property management) Formerly: Trustee and Governance Chair, of certain Oppenheimer Funds | | 229 | | Chairman and Lead Independent Director, Chairman of the Audit Committee, and Director, Board of Directors, Value Line Funds |
James D. Vaughn — 1945 Trustee | | 2019 | | Retired Formerly: Managing Partner, Deloitte & Touche LLP; Trustee and Chairman of the Audit Committee, Schroder Funds; Board Member, Mile High United Way, Boys and Girls Clubs, Boy Scouts, Colorado Business Committee for the Arts, Economic Club of Colorado and Metro Denver Network (economic development corporation); and Trustee of certain Oppenheimer Funds | | 229 | | Board member and Chairman of Audit Committee of AMG National Trust Bank; Trustee and Investment Committee member, University of South Dakota Foundation; Board member, Audit Committee Member and past Board Chair, Junior Achievement(non-profit) |
Christopher L. Wilson — 1957 Trustee, Vice Chair and Chair Designate | | 2017 | | Retired Formerly: Director, TD Asset Management USA Inc. (mutual fund complex) (22 portfolios); Managing Partner, CT2, LLC (investing and consulting firm); President/Chief Executive Officer, Columbia Funds, Bank of America Corporation; President/Chief Executive Officer, CDC IXIS Asset Management Services, Inc.; Principal & Director of Operations, Scudder Funds, Scudder, Stevens & Clark, Inc.; Assistant Vice President, Fidelity Investments | | 229 | | ISO New England, Inc.(non-profit organization managing regional electricity market) |
T-3 Invesco Strategic Real Return Fund
Trustees and Officers—(continued)
| | | | | | | | |
Name, Year of Birth and Position(s) Held with the Trust | | Trustee and/ or Officer Since | | Principal Occupation(s)
During Past 5 Years | | Number of
Funds in Fund
Complex
Overseen by
Trustee | | Other Directorship(s) Held by Trustee During
Past 5 Years |
| Other Officers | | | | | | | | |
Sheri Morris — 1964 President, Principal Executive Officer and Treasurer | | 2003 | | President, Principal Executive Officer and Treasurer, The Invesco Funds; Vice President, Invesco Advisers, Inc. (formerly known as Invesco Institutional (N.A.), Inc.) (registered investment adviser); and Vice President, Invesco Exchange-Traded Fund Trust, Invesco Exchange-Traded Fund Trust II, Invesco India Exchange-Traded Fund Trust, Invesco Actively Managed Exchange-Traded Fund Trust, Invesco Actively Managed Exchange-Traded Commodity Fund Trust and Invesco Exchange-Traded Self-Indexed Fund Trust; and Vice President, OppenheimerFunds, Inc. Formerly: Vice President and Principal Financial Officer, The Invesco Funds; Vice President, Invesco AIM Advisers, Inc., Invesco AIM Capital Management, Inc. and Invesco AIM Private Asset Management, Inc.; Assistant Vice President and Assistant Treasurer, The Invesco Funds and Assistant Vice President, Invesco Advisers, Inc., Invesco AIM Capital Management, Inc. and Invesco AIM Private Asset Management, Inc.; and Treasurer, Invesco Exchange-Traded Fund Trust, Invesco Exchange-Traded Fund Trust II, Invesco India Exchange-Traded Fund Trust and Invesco Actively Managed Exchange-Traded Fund Trust | | N/A | | N/A |
Russell C. Burk — 1958 Senior Vice President and Senior Officer | | 2005 | | Senior Vice President and Senior Officer, The Invesco Funds | | N/A | | N/A |
Jeffrey H. Kupor — 1968 Senior Vice President, Chief Legal Officer and Secretary | | 2018 | | Head of Legal of the Americas, Invesco Ltd.; Senior Vice President and Secretary, Invesco Advisers, Inc. (formerly known as Invesco Institutional (N.A.), Inc.) (registered investment adviser); Senior Vice President and Secretary, Invesco Distributors, Inc. (formerly known as Invesco AIM Distributors, Inc.); Vice President and Secretary, Invesco Investment Services, Inc. (formerly known as Invesco AIM Investment Services, Inc.) Senior Vice President, Chief Legal Officer and Secretary, The Invesco Funds; Secretary and General Counsel, Invesco Investment Advisers LLC (formerly known as Van Kampen Asset Management); Secretary and General Counsel, Invesco Capital Markets, Inc. (formerly known as Van Kampen Funds Inc.) and Chief Legal Officer, Invesco Exchange-Traded Fund Trust, Invesco Exchange-Traded Fund Trust II, Invesco India Exchange-Traded Fund Trust, Invesco Actively Managed Exchange-Traded Fund Trust, Invesco Actively Managed Exchange-Traded Commodity Fund Trust and Invesco Exchange-Traded Self-Indexed Fund Trust; Secretary, Invesco Indexing LLC; Secretary, W.L. Ross & Co., LLC Formerly: Secretary and Vice President, Jemstep, Inc.; Head of Legal, Worldwide Institutional, Invesco Ltd.; Secretary and General Counsel, INVESCO Private Capital Investments, Inc.; Senior Vice President, Secretary and General Counsel, Invesco Management Group, Inc. (formerly known as Invesco AIM Management Group, Inc.); Assistant Secretary, INVESCO Asset Management (Bermuda) Ltd.; Secretary and General Counsel, Invesco Private Capital, Inc.; Assistant Secretary and General Counsel, INVESCO Realty, Inc.; Secretary and General Counsel, Invesco Senior Secured Management, Inc.; and Secretary, Sovereign G./P. Holdings Inc. | | N/A | | N/A |
Andrew R. Schlossberg — 1974 Senior Vice President | | 2019 | | Head of the Americas and Senior Managing Director, Invesco Ltd.; Director and Senior Vice President, Invesco Advisers, Inc. (formerly known as Invesco Institutional (N.A.), Inc.) (registered investment adviser); Director and Chairman, Invesco Investment Services, Inc. (formerly known as Invesco AIM Investment Services, Inc.) (registered transfer agent); Senior Vice President, The Invesco Funds; Director, Invesco Investment Advisers LLC (formerly known as Van Kampen Asset Management); Director, President and Chairman, Invesco Insurance Agency, Inc. Formerly: Director, Invesco UK Limited; Director and Chief Executive, Invesco Asset Management Limited and Invesco Fund Managers Limited; Assistant Vice President, The Invesco Funds; Senior Vice President, Invesco Advisers, Inc. (formerly known as Invesco Institutional (N.A.), Inc.) (registered investment adviser); Director and Chief Executive, Invesco Administration Services Limited and Invesco Global Investment Funds Limited; Director, Invesco Distributors, Inc.; Head of EMEA, Invesco Ltd.; President, Invesco Actively Managed Exchange-Traded Commodity Fund Trust, Invesco Actively Managed Exchange-Traded Fund Trust, Invesco Exchange-Traded Fund Trust, Invesco Exchange-Traded Fund Trust II and Invesco India Exchange-Traded Fund Trust; Managing Director and Principal Executive Officer, Invesco Capital Management LLC | | N/A | | N/A |
T-4 Invesco Strategic Real Return Fund
Trustees and Officers—(continued)
| | | | | | | | |
Name, Year of Birth and Position(s) Held with the Trust | | Trustee and/ or Officer Since | | Principal Occupation(s)
During Past 5 Years | | Number of
Funds in Fund
Complex
Overseen by
Trustee | | Other Directorship(s) Held by Trustee During
Past 5 Years |
| Other Officers—(continued) | | | | | | | | |
John M. Zerr — 1962
Senior Vice President | | 2006 | | Chief Operating Officer of the Americas; Senior Vice President, Invesco Advisers, Inc. (formerly known as Invesco Institutional (N.A.), Inc.) (registered investment adviser); Senior Vice President, Invesco Distributors, Inc. (formerly known as Invesco AIM Distributors, Inc.); Director and Vice President, Invesco Investment Services, Inc. (formerly known as Invesco AIM Investment Services, Inc.) Senior Vice President, The Invesco Funds; Managing Director, Invesco Capital Management LLC; Director, Invesco Investment Advisers LLC (formerly known as Van Kampen Asset Management); Senior Vice President, Invesco Capital Markets, Inc. (formerly known as Van Kampen Funds Inc.); Manager, Invesco Indexing LLC; Manager, Invesco Specialized Products, LLC; Director and Senior Vice President, Invesco Insurance Agency, Inc.; Member, Invesco Canada Funds Advisory Board; Director, President and Chief Executive Officer, Invesco Corporate Class Inc. (corporate mutual fund company); and Director, Chairman, President and Chief Executive Officer, Invesco Canada Ltd. (formerly known as Invesco Trimark Ltd./Invesco Trimark Ltèe) (registered investment adviser and registered transfer agent) Formerly: Director and Senior Vice President, Invesco Management Group, Inc. (formerly known as Invesco AIM Management Group, Inc.); Secretary and General Counsel, Invesco Management Group, Inc. (formerly known as Invesco AIM Management Group, Inc.); Secretary, Invesco Investment Services, Inc. (formerly known as Invesco AIM Investment Services, Inc.); Chief Legal Officer and Secretary, The Invesco Funds; Secretary and General Counsel, Invesco Investment Advisers LLC (formerly known as Van Kampen Asset Management); Secretary and General Counsel, Invesco Capital Markets, Inc. (formerly known as Van Kampen Funds Inc.); Chief Legal Officer, Invesco Exchange-Traded Fund Trust, Invesco Exchange-Traded Fund Trust II, Invesco India Exchange-Traded Fund Trust, Invesco Actively Managed Exchange-Traded Fund Trust, Invesco Actively Managed Exchange-Traded Commodity Fund Trust and Invesco Exchange-Traded Self-Indexed Fund Trust; Secretary, Invesco Indexing LLC; Director, Secretary, General Counsel and Senior Vice President, Van Kampen Exchange Corp.; Director, Vice President and Secretary, IVZ Distributors, Inc. (formerly known as INVESCO Distributors, Inc.); Director and Vice President, INVESCO Funds Group, Inc.; Director and Vice President, Van Kampen Advisors Inc.; Director, Vice President, Secretary and General Counsel, Van Kampen Investor Services Inc.; Director and Secretary, Invesco Distributors, Inc. (formerly known as Invesco AIM Distributors, Inc.); Director, Senior Vice President, General Counsel and Secretary, Invesco AIM Advisers, Inc. and Van Kampen Investments Inc.; Director, Vice President and Secretary, Fund Management Company; Director, Senior Vice President, Secretary, General Counsel and Vice President, Invesco AIM Capital Management, Inc.; Chief Operating Officer and General Counsel, Liberty Ridge Capital, Inc. (an investment adviser) | | N/A | | N/A |
Gregory G. McGreevey — 1962 Senior Vice President | | 2012 | | Senior Managing Director, Invesco Ltd.; Director, Chairman, President, and Chief Executive Officer, Invesco Advisers, Inc. (formerly known as Invesco Institutional (N.A.), Inc.) (registered investment adviser); Director, Invesco Mortgage Capital, Inc. and Invesco Senior Secured Management, Inc.; and Senior Vice President, The Invesco Funds; and President, SNW Asset Management Corporation Formerly: Senior Vice President, Invesco Management Group, Inc. and Invesco Advisers, Inc.; Assistant Vice President, The Invesco Funds | | N/A | | N/A |
Kelli Gallegos — 1970 Vice President, Principal Financial Officer and Assistant Treasurer | | 2008 | | Assistant Treasurer, Invesco Specialized Products, LLC; Vice President, Principal Financial Officer and Assistant Treasurer, The Invesco Funds; Principal Financial and Accounting Officer — Pooled Investments, Invesco Capital Management LLC; Vice President and Treasurer, Invesco Exchange-Traded Fund Trust, Invesco Exchange-Traded Fund Trust II, Invesco India Exchange-Traded Fund Trust, Invesco Actively Managed Exchange-Traded Fund Trust, Invesco Actively Managed Exchange-Traded Commodity Fund Trust and Invesco Exchange-Traded Self-Indexed Fund Trust Formerly: Assistant Treasurer, Invesco Exchange-Traded Fund Trust, Invesco Exchange-Traded Fund Trust II, Invesco India Exchange-Traded Fund Trust, Invesco Actively Managed Exchange-Traded Fund Trust, Invesco Actively Managed Exchange-Traded Commodity Fund Trust and Invesco Exchange-Traded Self-Indexed Fund Trust; Assistant Treasurer, Invesco Capital Management LLC; Assistant Vice President, The Invesco Funds | | N/A | | N/A |
T-5 Invesco Strategic Real Return Fund
Trustees and Officers—(continued)
| | | | | | | | |
Name, Year of Birth and Position(s) Held with the Trust | | Trustee and/ or Officer Since | | Principal Occupation(s)
During Past 5 Years | | Number of
Funds in Fund
Complex
Overseen by
Trustee | | Other Directorship(s) Held by Trustee During
Past 5 Years |
| Other Officers—(continued) | | | | | | | | |
Crissie M. Wisdom — 1969 Anti-Money Laundering Compliance Officer | | 2013 | | Anti-Money Laundering Compliance Officer, Invesco Advisers, Inc. (formerly known as Invesco Institutional (N.A.), Inc.) (registered investment adviser), Invesco Capital Markets, Inc. (formerly known as Van Kampen Funds Inc.), Invesco Distributors, Inc., Invesco Investment Services, Inc., The Invesco Funds, and Invesco Exchange-Traded Fund Trust, Invesco Exchange-Traded Fund Trust II, Invesco India Exchange-Traded Fund Trust, Invesco Actively Managed Exchange-Traded Fund Trust, Invesco Actively Managed Exchange-Traded Commodity Fund Trust and Invesco Exchange-Traded Self-Indexed Fund Trust; Anti-Money Laundering Compliance Officer and Bank Secrecy Act Officer, INVESCO National Trust Company and Invesco Trust Company; and Fraud Prevention Manager and Controls and Risk Analysis Manager for Invesco Investment Services, Inc. Formerly: Anti-Money Laundering Compliance Officer, Van Kampen Exchange Corp. and Invesco Management Group, Inc. | | N/A | | N/A |
Robert R. Leveille — 1969 Chief Compliance Officer | | 2016 | | Chief Compliance Officer, Invesco Advisers, Inc. (registered investment adviser); and Chief Compliance Officer, The Invesco Funds Formerly: Chief Compliance Officer, Putnam Investments and the Putnam Funds | | N/A | | N/A |
The Statement of Additional Information of the Trust includes additional information about the Fund’s Trustees and is available upon request, without charge, by calling 1.800.959.4246. Please refer to the Fund’s Statement of Additional Information for information on the Fund’ssub-advisers.
| | | | | | |
Office of the Fund 11 Greenway Plaza, Suite 1000
Houston, TX 77046-1173 | | Investment Adviser Invesco Advisers, Inc.
1555 Peachtree Street, N.E.
Atlanta, GA 30309 | | Distributor Invesco Distributors, Inc.
11 Greenway Plaza, Suite 1000
Houston, TX 77046-1173 | | Auditors PricewaterhouseCoopers LLP
1000 Louisiana Street, Suite 5800 Houston, TX 77002-5021 |
| | | |
| | | | | | |
Counsel to the Fund Stradley Ronon Stevens & Young, LLP
2005 Market Street, Suite 2600
Philadelphia, PA 19103-7018 | | Counsel to the Independent Trustees Goodwin Procter LLP
901 New York Avenue, N.W.
Washington, D.C. 20001 | | Transfer Agent Invesco Investment Services, Inc.
11 Greenway Plaza, Suite 1000
Houston, TX 77046-1173 | | Custodian State Street Bank and Trust Company
225 Franklin Street
Boston, MA 02110-2801 |
T-6 Invesco Strategic Real Return Fund
Go paperless with eDelivery
Visit invesco.com/edelivery to enjoy the convenience and security of anytime electronic access to your investment documents.
With eDelivery, you can elect to have any or all of the following materials delivered straight to your inbox to download, save and print from your own computer:
| • | Fund reports and prospectuses |
| • | Quarterly statements |
| • | Daily confirmations |
| • | Tax forms |
Invesco mailing information
Send general correspondence to Invesco Investment Services, Inc., P.O. Box 219078, Kansas City, MO 64121-9078.
Important notice regarding delivery of security holder documents
To reduce Fund expenses, only one copy of most shareholder documents may be mailed to shareholders with multiple accounts at the same address (Householding). Mailing of your shareholder documents may be householded indefinitely unless you instruct us otherwise. If you do not want the mailing of these documents to be combined with those for other members of your household, please contact Invesco Investment Services, Inc. at 800 959 4246 or contact your financial institution. We will begin sending you individual copies for each account within 30 days after receiving your request.
Fund holdings and proxy voting information
The Fund provides a complete list of its holdings four times in each fiscal year, at the quarter-ends. For the second and fourth quarters, the list appears in the Fund’s semiannual and annual reports to shareholders. For the first and third quarters, the Fund files the lists with the Securities and Exchange Commission (SEC) as an exhibit to its reports on Form N-PORT. The most recent list of portfolio holdings is available at invesco.com/completeqtrholdings. Shareholders can also look up the Fund’s Form N-PORT filings on the SEC website, sec.gov. The SEC file numbers for the Fund are shown below.
A description of the policies and procedures that the Fund uses to determine how to vote proxies relating to portfolio securities is available without charge, upon request, from our Client Services department at 800 959 4246, or at invesco.com/proxyguidelines. The information is also available on the SEC website, sec.gov.
Information regarding how the Fund voted proxies related to its portfolio securities during the most recent 12-month period ended June 30 is available at invesco.com/proxysearch. This information is also available on the SEC website, sec.gov.
Invesco Advisers, Inc. is an investment adviser; it provides investment advisory services to individual and institutional clients and does not sell securities. Invesco Distributors, Inc. is the US distributor for Invesco Ltd.’s retail mutual funds, exchange-traded funds and institutional money market funds. Both are wholly owned, indirect subsidiaries of Invesco Ltd.
| SEC file numbers: 811-09913 and 333-36074 | Invesco Distributors, Inc. | SRR-AR-1 |
| | | | |
 | | | | Annual Report 8/31/2019 |
| | |
| | | | Invesco Oppenheimer Capital Appreciation Fund* Beginning on January 1, 2021, as permitted by regulations adopted by the Securities and Exchange Commission, paper copies of the Fund’s shareholder reports will no longer be sent by mail, unless you specifically request paper copies of the reports from the Fund or from your financial intermediary, such as a broker-dealer or bank. Instead, the reports will be made available on the Fund’s website, and you will be notified by mail each time a report is posted and provided with a website link to access the report. If you already elected to receive shareholder reports electronically, you will not be affected by this change and you need not take any action. You may elect to receive shareholder reports and other communications from the Fund electronically by contacting your financial intermediary (such as a broker-dealer or bank) or, if you are a direct investor, by enrolling at invesco. com/edelivery. You may elect to receive all future reports in paper free of charge. If you invest through a financial intermediary, you can contact your financial intermediary to request that you continue to receive paper copies of your shareholder reports. If you invest directly with the Fund, you can call 800 959 4246 to let the Fund know you wish to continue receiving paper copies of your shareholder reports. Your election to receive reports in paper will apply to all funds held with your financial intermediary or all funds held with the fund complex if you invest directly with the Fund. *Prior to the close of business on May 24, 2019, the Fund’s name was Oppenheimer Capital Appreciation Fund. See Important Update on the following page for more information. |
Important Update
On October 18, 2018, Massachusetts Mutual Life Insurance Company, an indirect corporate parent of OppenheimerFunds, Inc. and its subsidiaries OFI Global Asset Management, Inc., OFI SteelPath, Inc. and OFI Advisors, LLC, announced that it had entered into an agreement whereby Invesco Ltd., a global investment management company would acquire OppenheimerFunds and its subsidiaries (together, “OppenheimerFunds”). After the close of business on May 24, 2019 Invesco Ltd. completed the acquisition of OppenheimerFunds. This Fund was included in that acquisition and as of that date, became part of the Invesco family of funds. Please visit invesco.com for more information or call Invesco’s Client Services team at800-959-4246.
Table of Contents
Class A Shares
AVERAGE ANNUAL TOTAL RETURNS AT8/31/19
| | | | | | | | |
| | | Class A Shares of the Fund | | | | |
| | | Without Sales Charge | | With Sales Charge | | S&P 500 Index | | Russell 1000 Growth
Index |
| 1-Year | | 2.97% | | -2.69% | | 2.92% | | 4.27% |
| 5-Year | | 8.96 | | 7.74 | | 10.11 | | 13.06 |
| 10-Year | | 11.73 | | 11.10 | | 13.45 | | 15.42 |
Performance quoted is past performance and cannot guarantee comparable future results; current performance may be lower or higher. Visit invesco.com for the most recentmonth-end performance. Performance figures reflect reinvested distributions and changes in net asset value (NAV). Investment return and principal value will vary so that you may have a gain or a loss when you sell shares. Fund returns include changes in share price, reinvested distributions and a 5.50% maximum applicable sales charge except where “without sales charge” is indicated. As the result of a reorganization after the close of business on May 24, 2019, the returns of the Fund for periods on or prior to May 24, 2019 reflect performance of the Oppenheimer predecessor fund. Share class returns will differ from those of the predecessor fund because they have different expenses. Returns for periods of less than one year are not annualized. Returns do not consider capital gains or income taxes on an individual’s investment. See Fund prospectus and
3 INVESCO OPPENHEIMER CAPITAL APPRECIATION FUND
summary prospectus for more information on share classes, sales charges and new fee agreements, if any. Fund literature is available at invesco.com.
4 INVESCO OPPENHEIMER CAPITAL APPRECIATION FUND
Fund Performance Discussion
For the fiscal year ended August 31, 2019, Class A shares of Invesco Oppenheimer Capital Appreciation Fund (the Fund), at net asset value (NAV), underperformed the Russell 1000 Growth Index, the Fund’s benchmark.
On June 21, 2019, Erik Voss and Ido Cohen became the Lead Portfolio Manager andCo-Portfolio Manager, respectively, of the Fund.
MARKET CONDITIONS AND YOUR FUND
The fiscal year proved to be an increasingly volatile time for US equities. After a relatively quiet summer, market volatility noticeably rose in October 2018, as US equity markets suffered a sharpsell-off throughyear-end 2018, amid ongoing trade concerns between the US and China, fears of a global economic slowdown and lower oil prices from a supply glut, with oil prices plummeting from near $75 per barrel in early October 2018 to
around $45 per barrel in late December 2018.1 In this environment, there was a flight to safety, as investors fled to defensive areas of the markets, such as health care, utilities and US Treasuries.
Given signs of a strong economy, the US Federal Reserve (the Fed) raised interest rates two times during the fiscal year: in September and December 2018. In contrast, the
COMPARISON OF CHANGE IN VALUE OF $10,000 HYPOTHETICAL INVESTMENTS IN:

5 INVESCO OPPENHEIMER CAPITAL APPRECIATION FUND
European Central Bank and central banks in several other countries maintained extraordinarily accommodative monetary policies.
Following a sharp selloff during the fourth quarter of 2019, equity markets rebounded in the first quarter of 2019, fueled by optimism about a potentialUS-China trade deal and the Fed’s indication that there would be no interest rate hikes in 2019, a surprising shift in monetary policy. The Fed’s more accommodative stance provided a supportive environment for equities and fixed income, even as US economic data were mixed and overseas growth appeared to be slowing. Against this backdrop, the S&P 500 Index posted its best first quarter returns since
1998.
Although the S&P 500 Index posted modest gains for the second quarter of 2019, the US stock market experienced increased volatility. After four consecutive months of rising stock markets, the marketsold-off in May, along with bond yields and oil prices, as investors weighed the impact of the lingering trade war between the US and China, as well as potential tariffs imposed on Mexico. In addition, economic data showed a slowing domestic and global economy. During the July meeting, the Fed lowered rates by 25 basis points. This was the first time the Fed lowered rates in more than a decade.2
Market volatility increased in August, as the US Treasury yield curve inverted several times, causing jitters for investors who were
concerned that a US recession would be imminent. As a result, much of August saw a “risk off” sentiment, with investors crowding into “safe haven” asset classes, such as US Treasuries and gold. However, a more dovish tone from the Fed provided some support to risk assets. With rising volatility in the markets, the S&P 500 Index posted a modest positive return for the fiscal year.
In this environment, the Fund’s Class A shares at NAV produced a small gain but underperformed the benchmark during the fiscal year. Stock selection and underweight exposure in the consumer staples sector, an overweight in the energy sector, stock selection in the materials sector and a lack of holdings in the real estate sector were key detractors from relative performance. Positively, the Fund benefited from stock selection in the information technology and consumer discretionary sectors.
At the stock level, Apple detracted from absolute returns during the fiscal year as annual iPhone sales fell short of expectations and recent production data suggested a worse-than-feared cutback in orders.
An overweight in eCommerce leader Amazon was both an absolute and benchmark-relative detractor. Amazon came under pressure following 3rd quarter 2018 results and suffered from the general rotation out of growth stocks and towards defensive areas of the market in the final quarter of 2018. The stock recovered until June 2019, when the U.S. Department of Justice announced
6 INVESCO OPPENHEIMER CAPITAL APPRECIATION FUND
an anti-trust review of “market-leading online platforms”. We believed there was extremely low risk of abreak-up or a major alteration of the business model of any of the large technology companies over the near term. Accordingly, we viewed the downward market moves as an over-reaction. Further, we believe Amazon is well positioned to benefit from increased penetration in food and consumables within eCommerce.
Finally, an overweight exposure in the energy sector, includingout-of-benchmark exposure to Husky Energy, detracted from both absolute and relative performance. The Fund had been overweight energy based on a view that global crude oil inventories had normalized. Oil supply surprised to the upside given a surprise reduction in sanctions on Iran and oil prices plummeted in December 2018. Due to elevated oil inventories, excess spare capacity and risks to global demand growth, the overweight position in energy was reduced. We have since exited this position.
Within information technology, an overweight in Microsoft was beneficial to both absolute and benchmark-relative returns during the fiscal year. Microsoft reported a record fiscal year in July 2019, noting increases in sales and profits. Microsoft benefitted from continued hypergrowth in its Azure cloud computing service and double-digit growth within its core server tools. Strong performance within the software industry generally also helped to drive the stock’s performance during the fiscal year.
An overweight in Mastercard, the leading global payments and technology company, was also beneficial to absolute and benchmark-relative returns. Mastercard has experienced growth in core products during the fiscal year. Additionally, recent acquisitions such as Transfast and new partnerships such as P27 in the Nordics (not fund holdings) may help the company evolve it is real-timeaccount-to-account and cross-border payments.
Within consumer staples, an overweight in Starbucks was also beneficial to absolute and relative performance, particularly during the volatility that spiked among equity markets during the fourth quarter of 2018. We have since exited this position.
Our view is that we are in a slowing growth environment as the benefits of US tax stimulus and deregulation are being offset by rising labor costs and trade pressures. In such an environment, true growth will likely remain scarce, and we believe the market will favor companies that can produce growth and compound earnings in spite of the economic cycle. We believe that change is the fuel for growth, thus we are seeking to identify “share-takers”, companies that we think can gain market share from technology-enabled advantages in their business models and from disruptive shifts in consumer behavior. Though we anticipate a possible economic slowing, we seek to prudently balance the Fund between dynamic growth opportunities and more durable growth opportunities.
7 INVESCO OPPENHEIMER CAPITAL APPRECIATION FUND
Thank you for your commitment to the
Invesco Oppenheimer Capital Appreciation Fund.
1 Source: Bloomberg
2 Source: US Federal Reserve
8 INVESCO OPPENHEIMER CAPITAL APPRECIATION FUND
Top Holdings and Allocations
TOP TEN COMMON STOCK HOLDINGS
| | | | |
| Amazon.com, Inc. | | | 8.7 | % |
| Alphabet, Inc., Cl. C | | | 4.9 | |
| Facebook, Inc., Cl. A | | | 4.8 | |
| Mastercard, Inc., Cl. A | | | 4.4 | |
| Microsoft Corp. | | | 3.9 | |
| Lowe’s Cos., Inc. | | | 3.0 | |
| salesforce.com, Inc. | | | 2.5 | |
| Alibaba Group Holding Ltd., Sponsored ADR | | | 2.5 | |
| Visa, Inc., Cl. A | | | 2.1 | |
| Apple, Inc. | | | 2.0 | |
Portfolio holdings and allocations are subject to change. Percentages are as of August 31, 2019, and are based on net assets.
TOP TEN COMMON STOCK INDUSTRIES
| | | | |
| Internet & Catalog Retail | | | 12.4 | % |
| Software | | | 11.0 | |
| Interactive Media & Services | | | 9.7 | |
| IT Services | | | 8.4 | |
| Entertainment | | | 7.4 | |
| Semiconductors & Semiconductor Equipment | | | 5.4 | |
| Health Care Equipment & Supplies | | | 4.1 | |
| Health Care Providers & Services | | | 3.9 | |
| Aerospace & Defense | | | 3.6 | |
| Commercial Services & Supplies | | | 3.6 | |
Portfolio holdings and allocations are subject to change. Percentages are as of August 31, 2019, and are based on net assets.
SECTOR ALLOCATION
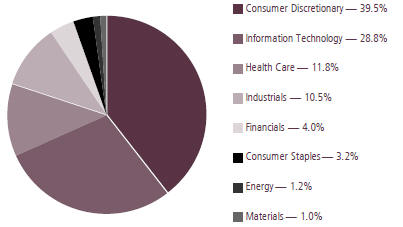
Portfolio holdings and allocations are subject to change. Percentages are as of August 31, 2019, and are based on the total market value of common stocks.
For more current Fund holdings, please visit invesco.com.
9 INVESCO OPPENHEIMER CAPITAL APPRECIATION FUND
Share Class Performance
AVERAGE ANNUAL TOTAL RETURNS WITHOUT SALES CHARGE AS OF 8/31/19
| | | | | | | | | | | | | | | | |
| | | Inception
Date | | | 1-Year | | | 5-Year | | | 10-Year | |
| Class A (OPTFX) | | | 1/22/81 | | | | 2.97 | % | | | 8.96 | % | | | 11.73 | % |
| Class C (OTFCX) | | | 12/1/93 | | | | 2.17 | | | | 8.13 | | | | 10.87 | |
| Class R (OTCNX) | | | 3/1/01 | | | | 2.68 | | | | 8.68 | | | | 11.45 | |
| Class Y (OTCYX) | | | 11/3/97 | | | | 3.19 | | | | 9.21 | | | | 12.06 | |
| Class R5* (CPTUX) | | | 5/24/19 | | | | 3.07 | | | | 8.99 | | | | 11.74 | |
| Class R6 (OPTIX) | | | 12/29/11 | | | | 3.66 | | | | 9.47 | | | | N/A | |
AVERAGE ANNUAL TOTAL RETURNS WITH SALES CHARGE AS OF 8/31/19
| | | | | | | | | | | | | | | | |
| | | Inception
Date | | | 1-Year | | | 5-Year | | | 10-Year | |
| Class A (OPTFX) | | | 1/22/81 | | | | -2.69 | % | | | 7.74 | % | | | 11.10 | % |
| Class C (OTFCX) | | | 12/1/93 | | | | 1.26 | | | | 8.13 | | | | 10.87 | |
| Class R (OTCNX) | | | 3/1/01 | | | | 2.68 | | | | 8.68 | | | | 11.45 | |
| Class Y (OTCYX) | | | 11/3/97 | | | | 3.19 | | | | 9.21 | | | | 12.06 | |
| Class R5* (CPTUX) | | | 5/24/19 | | | | 3.07 | | | | 8.99 | | | | 11.74 | |
| Class R6 (OPTIX) | | | 12/29/11 | | | | 3.66 | | | | 9.47 | | | | N/A | |
*Class R5 shares’ performance shown prior to the inception date is that of the predecessor fund’s Class A shares at net asset value (NAV) and includes the12b-1 fees applicable to Class A shares. Class A shares’ performance reflects any applicable fee waivers and/or expense reimbursements.
Performance quoted is past performance and cannot guarantee comparable future results; current performance may be lower or higher. Visit invesco.com for the most recentmonth-end performance. Performance figures reflect reinvested distributions and changes in net asset value (NAV). Investment return and principal value will vary so that you may have a gain or a loss when you sell shares. Performance shown at NAV does not include the applicablefront-end sales charge, which would have reduced the performance. The current maximum initial sales charge for Class A shares is 5.50%, and the contingent deferred sales charge for Class C shares is 1% for the1-year period. Class R, Class Y, Class R5 and Class R6 shares have no sales charge; therefore, performance is at NAV. Effective after the close of business on May 24, 2019, Class A, Class C, Class R, Class Y, and Class I shares of the predecessor fund were reorganized into Class A, Class C, Class R, Class Y, and Class R6 shares, respectively, of the Fund. Class R5 shares’ performance shown prior to the inception date is that of the predecessor fund’s Class A shares at NAV and includes the12b-1 fees applicable to Class A shares. Class A shares’ performance reflects any applicable fee waivers and/or expense reimbursements. Returns shown for Class A, Class C, Class R, Class Y, Class R5, and Class R6 shares are blended returns of the predecessor fund and the Fund. Share class returns will differ from those of the predecessor fund because of different expenses. See Fund prospectuses and summary prospectuses for more information on share classes, sales charges and new fee agreements, if any. Fund literature is available at invesco.com.
10 INVESCO OPPENHEIMER CAPITAL APPRECIATION FUND
The Fund’s performance is compared to the performance of the S&P 500 Index and the Russell 1000 Growth Index. The S&P 500 Index is a capitalization-weighted index of 500 stocks intended to be a representative sample of leading companies in leading industries within the U.S. economy. The Russell 1000 Growth Index measures the performance of thelarge-cap growth segment of the U.S. equity universe. It includes those Russell 1000 companies with higherprice-to-book ratios and higher forecasted growth values. The indices areunmanaged and cannot be purchased directly by investors. While index comparisons may be useful to provide a benchmark for the Fund’s performance, it must be noted that the Fund’s investments are not limited to the investments comprising theindices. Index performance includes reinvestment of income, but does not reflect transaction costs, fees, expenses or taxes. Index performance is shown for illustrative purposes only as a benchmark for the Fund’s performance, and does not predict or depict performance of the Fund. The Fund’s performance reflects the effects of the Fund’s business and operating expenses.
The views and opinions expressed in management’s discussion of Fund performance are those of Invesco Advisers, Inc. These views and opinions are subject to change at any time based on factors such as market and economic conditions. These views and opinions may not be relied upon as investment advice or recommendations, or as an offer for a particular security. The information is not a complete analysis of every aspect of any market, country, industry, security or the Fund. Statements of fact are from sources considered reliable, but Invesco Advisers, Inc. makes no representation or warranty as to their completeness or accuracy. Although historical performance is no guarantee of future results, these insights may help you understand our investment management philosophy.
Before investing, investors should carefully read the prospectus and/or summary prospectus and carefully consider the investment objectives, risks, charges and expenses. For this and more complete information about the fund(s), investors should ask their advisors for a prospectus/summary prospectus or visit invesco. com/fundprospectus.
Shares of Invesco funds are not deposits or obligations of any bank, are not guaranteed by any bank, are not insured by the FDIC or any other agency, and involve investment risks, including the possible loss of the principal amount invested.
11 INVESCO OPPENHEIMER CAPITAL APPRECIATION FUND
Fund Expenses
Fund Expenses. As a shareholder of the Fund, you incur two types of costs: (1) transaction costs, which may include sales charges (loads) on purchase payments and/or contingent deferred sales charges on redemptions; and (2) ongoing costs, including management fees; distribution and service fees; and other Fund expenses. These examples are intended to help you understand your ongoing costs (in dollars) of investing in the Fund and to compare these costs with the ongoing costs of investing in other mutual funds.
The examples are based on an investment of $1,000.00 invested at the beginning of the period and held for the entire6-month period ended August 31, 2019.
Actual Expenses. The first section of the table provides information about actual account values and actual expenses. You may use the information in this section for the class of shares you hold, together with the amount you invested, to estimate the expense that you paid over the period. Simply divide your account value by $1,000.00 (for example, an $8,600.00 account value divided by $1,000.00 = 8.60), then multiply the result by the number in the first section under the heading entitled “Expenses Paid During 6 Months Ended August 31, 2019” to estimate the expenses you paid on your account during this period.
Hypothetical Example for Comparison Purposes.The second section of the table provides information about hypothetical account values and hypothetical expenses based on the Fund’s actual expense ratio for each class of shares, and an assumed rate of return of 5% per year for each class before expenses, which is not the Fund’s actual return. The hypothetical account values and expenses may not be used to estimate the actual ending account balance or expenses you paid for the period. You may use this information to compare the ongoing costs of investing in the Fund and other funds. To do so, compare this 5% hypothetical example for the class of shares you hold with the 5% hypothetical examples that appear in the shareholder reports of the other funds.
Please note that the expenses shown in the table are meant to highlight your ongoing costs only and do not reflect any transactional costs, such asfront-end or contingent deferred sales charges (loads). Therefore, the “hypothetical” section of the table is useful in comparing ongoing costs only, and will not help you determine the relative total costs of owning different funds. In addition, if these transactional costs were included, your costs would have been higher.
12 INVESCO OPPENHEIMER CAPITAL APPRECIATION FUND
| | | | | | | | | | | | |
| Actual | | Beginning
Account Value March 1, 2019 | | | Ending
Account Value
August 31, 2019 | | | Expenses Paid During
6 Months Ended August 31, 20191,2 | |
Class A | | $ | 1,000.00 | | | $ | 1,095.00 | | | $ | 5.45 | |
Class C | | | 1,000.00 | | | | 1,090.70 | | | | 9.53 | |
Class R | | | 1,000.00 | | | | 1,093.40 | | | | 6.88 | |
Class Y | | | 1,000.00 | | | | 1,096.10 | | | | 4.23 | |
Class R5 | | | 1,000.00 | | | | 1,096.00 | | | | 1.93 | |
Class R6 | | | 1,000.00 | | | | 1,097.30 | | | | 3.34 | |
| |
Hypothetical (5% return before expenses) | | | | | |
Class A | | | 1,000.00 | | | | 1,020.01 | | | | 5.26 | |
Class C | | | 1,000.00 | | | | 1,016.13 | | | | 9.19 | |
Class R | | | 1,000.00 | | | | 1,018.65 | | | | 6.64 | |
Class Y | | | 1,000.00 | | | | 1,021.17 | | | | 4.08 | |
Class R5 | | | 1,000.00 | | | | 1,021.78 | | | | 3.47 | |
Class R6 | | | 1,000.00 | | | | 1,022.03 | | | | 3.22 | |
1. Actual expenses paid for Class A, C, R, Y, and R6are equal to the Fund’s annualized expense ratio for that class, multiplied by the average account value over the period, multiplied by 184/365(to reflect theone-half year period). Actual expenses paid for Class R5 are equal to the Fund’s annualized expense ratio for that class, multiplied by the average account value over the period, multiplied by 99/365to reflect the period from after the close of business on May 24, 2019 (inception of offering) to August 31, 2019.
2.Hypothetical expenses paid for all classes are equal to the Fund’s annualized expense ratio for that class, multiplied by the average account value over the period, multiplied by 184/365(to reflect theone-half year period).
Those annualized expense ratios, excluding indirect expenses from affiliated funds, based on the6-month period ended August 31, 2019 for Classes A, C, R, Y and R6 and for the period from after the close of business on May 24, 2019 (inception of offering) to August 31, 2019 for Class R5 are as follows:
| | | | |
| Class | | Expense Ratios | |
Class A | | | 1.03 | % |
Class C | | | 1.80 | |
Class R | | | 1.30 | |
Class Y | | | 0.80 | |
Class R5 | | | 0.68 | |
Class R6 | | | 0.63 | |
The expense ratios reflect voluntary and/or contractual waivers and/or reimbursements of expenses by the Fund’s Manager. Some of these undertakings may be modified or terminated at any time, as indicated in the Fund’s prospectus. The “Financial Highlights” tables in the
13 INVESCO OPPENHEIMER CAPITAL APPRECIATION FUND
Fund’s financial statements, included in this report, also show the gross expense ratios, without such waivers or reimbursements and reduction to custodian expenses, if applicable.
14 INVESCO OPPENHEIMER CAPITAL APPRECIATION FUND
SCHEDULE OF INVESTMENTSAugust 31, 2019
| | | | | | | | |
| | | Shares | | | Value | |
| Common Stocks—99.7% | | | | | | | | |
| Consumer Discretionary—39.4% | | | | | |
| Diversified Consumer Services—0.4% | |
| Service Corp. International | | | 331,190 | | | $ | 15,334,097 | |
| Entertainment—7.4% | | | | | | | | |
| Activision Blizzard, Inc. | | | 1,576,940 | | | | 79,793,164 | |
| Electronic Arts, Inc.1 | | | 497,500 | | | | 46,605,800 | |
| IMAX Corp.1 | | | 606,740 | | | | 12,693,001 | |
| Netflix, Inc.1 | | | 63,720 | | | | 18,717,750 | |
| Nintendo Co. Ltd. | | | 191,600 | | | | 72,521,683 | |
| Take-Two Interactive Software, Inc.1 | | | 382,090 | | | | 50,424,417 | |
| Vivendi SA | | | 547,660 | | | | 15,384,020 | |
| | | | | | | | |
| | | | | | | | 296,139,835 | |
| Hotels, Restaurants & Leisure—3.3% | | | | | |
| Cedar Fair LP | | | 670,457 | | | | 37,532,183 | |
| Norwegian Cruise Line Holdings Ltd.1 | | | 1,223,290 | | | | 62,081,968 | |
| Restaurant Brands International, Inc. | | | 172,350 | | | | 13,520,857 | |
| Royal Caribbean Cruises Ltd. | | | 175,760 | | | | 18,328,253 | |
| | | | | | | | |
| | | | | | | | 131,463,261 | |
| Household Durables—1.3% | | | | | |
| Sony Corp. | | | 912,800 | | | | 51,984,331 | |
| Interactive Media & Services—9.7% | | | | | |
| Alphabet, Inc., Cl. C1 | | | 163,380 | | | | 194,111,778 | |
| Facebook, Inc., Cl. A1 | | | 1,039,012 | | | | 192,913,358 | |
| | | | | | | | |
| | | | | | | | 387,025,136 | |
| Internet & Catalog Retail—12.4% | | | | | |
| Alibaba Group Holding Ltd., Sponsored ADR1 | | | 555,708 | | | | 97,265,571 | |
| Amazon.com, Inc.1 | | | 195,670 | | | | 347,566,664 | |
| Booking Holdings, Inc.1 | | | 24,240 | | | | 47,665,779 | |
| | | | | | | | |
| | | | | | | | 492,498,014 | |
| Media—1.4% | | | | | |
| Altice USA, Inc., Cl. A1 | | | 996,600 | | | | 28,781,808 | |
| Charter Communications, Inc., Cl. A1 | | | 42,070 | | | | 17,231,451 | |
| | | | | | | | |
| | | Shares | | | Value | |
| Media (Continued) | | | | | |
| DISH Network Corp., Cl. A1 | | | 263,040 | | | $ | 8,827,623 | |
| | | | | | | | |
| | | | | | | | 54,840,882 | |
| Specialty Retail—3.5% | | | | | |
| CarMax, Inc.1 | | | 245,720 | | | | 20,463,562 | |
| Lowe’s Cos., Inc. | | | 1,072,820 | | | | 120,370,404 | |
| | | | | | | | |
| | | | | | | | 140,833,966 | |
| Consumer Staples—3.2% | | | | | | | | |
| Food Products—3.2% | | | | | | | | |
| Conagra Brands, Inc. | | | 628,370 | | | | 17,820,573 | |
| Lamb Weston Holdings, Inc. | | | 375,370 | | | | 26,422,294 | |
| Mondelez International, Inc., Cl. A | | | 404,620 | | | | 22,343,116 | |
| Nomad Foods Ltd.1 | | | 479,930 | | | | 9,670,590 | |
| Tyson Foods, Inc., Cl. A | | | 551,950 | | | | 51,353,428 | |
| | | | | | | | |
| | | | | | | | 127,610,001 | |
| Energy—1.2% | | | | | | | | |
| Oil, Gas & Consumable Fuels—1.2% | | | | | |
| Magellan Midstream Partners LP | | | 89,825 | | | | 5,989,531 | |
| Marathon Petroleum Corp. | | | 216,990 | | | | 10,678,078 | |
| PBF Energy, Inc., Cl. A | | | 462,120 | | | | 10,952,244 | |
| Viper Energy Partners LP | | | 674,981 | | | | 19,554,200 | |
| | | | | | | | |
| | | | | | | | 47,174,053 | |
| Financials—4.0% | | | | | | | | |
| Capital Markets—3.5% | | | | | | | | |
| Apollo Global Management LLC, Cl. A | | | 866,635 | | | | 32,698,139 | |
| Ares Management Corp., Cl. A | | | 1,266,740 | | | | 36,862,134 | |
| Goldman Sachs Group, Inc. (The) | | | 57,770 | | | | 11,779,881 | |
| Intercontinental Exchange, Inc. | | | 225,680 | | | | 21,096,566 | |
| Legg Mason, Inc. | | | 220,790 | | | | 8,122,864 | |
| London Stock Exchange Group plc | | | 174,030 | | | | 14,736,343 | |
| LPL Financial Holdings, Inc. | | | 203,820 | | | | 15,276,309 | |
15 INVESCO OPPENHEIMER CAPITAL APPRECIATION FUND
SCHEDULE OF INVESTMENTSContinued
| | | | | | | | |
| | | Shares | | | Value | |
| Capital Markets (Continued) | | | | | |
| S&P Global, Inc. | | | 4,260 | | | $ | 1,108,409 | |
| | | | | | | | |
| | | | | | | | 141,680,645 | |
| Commercial Banks—0.3% | |
| SVB Financial Group1 | | | 51,550 | | | | 10,032,661 | |
| Insurance—0.2% | | | | | |
| Reinsurance Group of America, Inc., Cl. A | | | 50,110 | | | | 7,715,437 | |
| Health Care—11.8% | | | | | | | | |
| Biotechnology—0.5% | | | | | | | | |
| Alnylam Pharmaceuticals, Inc.1 | | | 111,410 | | | | 8,989,673 | |
| Bluebird Bio, Inc.1 | | | 33,980 | | | | 3,510,474 | |
| Moderna, Inc.1 | | | 288,730 | | | | 4,541,723 | |
| Sage Therapeutics, Inc.1 | | | 23,360 | | | | 4,010,211 | |
| | | | | | | | |
| | | | | | | | 21,052,081 | |
| Health Care Equipment & Supplies—4.1% | |
| Baxter International, Inc. | | | 407,710 | | | | 35,858,094 | |
| Boston Scientific Corp.1 | | | 1,173,670 | | | | 50,150,919 | |
| Intuitive Surgical, Inc.1 | | | 67,520 | �� | | | 34,525,677 | |
| Teleflex, Inc. | | | 121,790 | | | | 44,321,817 | |
| | | | | | | | |
| | | | | | | | 164,856,507 | |
| Health Care Providers & Services—3.9% | | | | | |
| Humana, Inc. | | | 51,420 | | | | 14,562,658 | |
| Laboratory Corp. of America Holdings1 | | | 244,030 | | | | 40,889,667 | |
| LHC Group, Inc.1 | | | 230,120 | | | | 27,269,220 | |
| UnitedHealth Group, Inc. | | | 311,700 | | | | 72,937,800 | |
| | | | | | | | |
| | | | | | | | 155,659,345 | |
| Life Sciences Tools & Services—2.0% | | | | | |
| Avantor, Inc.1 | | | 594,410 | | | | 10,402,175 | |
| Illumina, Inc.1 | | | 209,160 | | | | 58,845,074 | |
| Thermo Fisher Scientific, Inc. | | | 28,650 | | | | 8,224,269 | |
| | | | | | | | |
| | | | | | | | 77,471,518 | |
| Pharmaceuticals—1.3% | | | | | |
| Merck & Co., Inc. | | | 457,720 | | | | 39,579,049 | |
| Novo Nordisk AS, Cl. B | | | 148,703 | | | | 7,752,759 | |
| | | | | | | | |
| | | Shares | | | Value | |
| Pharmaceuticals (Continued) | | | | | |
| Zoetis, Inc., Cl. A | | | 36,520 | | | $ | 4,616,858 | |
| | | | | | | | |
| | | | | | | | 51,948,666 | |
| Industrials—10.4% | | | | | | | | |
| Aerospace & Defense—3.6% | | | | | | | | |
| Airbus SE | | | 375,830 | | | | 51,820,892 | |
| Boeing Co. (The) | | | 38,540 | | | | 14,032,029 | |
| L3Harris Technologies, Inc. | | | 61,140 | | | | 12,925,607 | |
| Lockheed Martin Corp. | | | 69,860 | | | | 26,833,925 | |
| Teledyne Technologies, Inc.1 | | | 126,950 | | | | 39,175,500 | |
| | | | | | | | |
| | | | | | | | 144,787,953 | |
| Commercial Services & Supplies—3.6% | |
| Cintas Corp. | | | 171,320 | | | | 45,194,216 | |
| Clean Harbors, Inc.1 | | | 339,110 | | | | 24,941,540 | |
| IAA, Inc.1 | | | 528,460 | | | | 25,815,271 | |
| KAR Auction Services, Inc. | | | 302,880 | | | | 8,044,493 | |
| Waste Connections, Inc. | | | 135,870 | | | | 12,486,453 | |
| Waste Management, Inc. | | | 230,830 | | | | 27,549,561 | |
| | | | | | | | |
| | | | | | | | 144,031,534 | |
| Industrial Conglomerates—0.5% | | | | | | | | |
| Roper Technologies, Inc. | | | 53,510 | | | | 19,625,328 | |
| Machinery—0.9% | | | | | | | | |
| Deere & Co. | | | 137,460 | | | | 21,293,928 | |
| Stanley Black & Decker, Inc. | | | 99,250 | | | | 13,186,355 | |
| | | | | | | | |
| | | | | | | | 34,480,283 | |
| Road & Rail—1.8% | | | | | | | | |
| Kansas City Southern | | | 212,290 | | | | 26,706,082 | |
| Lyft, Inc., Cl. A1 | | | 245,400 | | | | 12,017,238 | |
| Uber Technologies, Inc.1 | | | 371,080 | | | | 12,086,076 | |
| Union Pacific Corp. | | | 141,600 | | | | 22,933,536 | |
| | | | | | | | |
| | | | | | | | 73,742,932 | |
| Information Technology—28.7% | |
| Communications Equipment—1.9% | |
| Motorola Solutions, Inc. | | | 409,750 | | | | 74,127,872 | |
16 INVESCO OPPENHEIMER CAPITAL APPRECIATION FUND
| | | | | | | | |
| | | Shares | | | Value | |
| IT Services—8.4% | | | | | | | | |
| Fidelity National Information Services, Inc. | | | 286,617 | | | $ | 39,042,968 | |
| Mastercard, Inc., Cl. A | | | 628,420 | | | | 176,818,535 | |
| PayPal Holdings, Inc.1 | | | 334,100 | | | | 36,433,605 | |
| Visa, Inc., Cl. A | | | 458,590 | | | | 82,922,244 | |
| | | | | | | | |
| | | | | | | | 335,217,352 | |
| Semiconductors & Semiconductor Equipment—5.4% | |
| Applied Materials, Inc. | | | 877,420 | | | | 42,133,708 | |
| ASML Holding NV | | | 201,050 | | | | 44,755,741 | |
| NVIDIA Corp. | | | 123,200 | | | | 20,637,232 | |
| QUALCOMM, Inc. | | | 479,960 | | | | 37,326,489 | |
| Semtech Corp.1 | | | 749,860 | | | | 31,471,624 | |
| Silicon Motion Technology Corp., ADR | | | 1,221,840 | | | | 39,428,777 | |
| | | | | | | | |
| | | | | | | | 215,753,571 | |
| Software—11.0% | | | | | | | | |
| Adobe, Inc.1 | | | 93,700 | | | | 26,658,587 | |
| Microsoft Corp. | | | 1,122,650 | | | | 154,768,529 | |
| Palo Alto Networks, Inc.1 | | | 222,090 | | | | 45,221,966 | |
| RealPage, Inc.1 | | | 519,280 | | | | 33,062,558 | |
| salesforce.com, Inc.1 | | | 637,050 | | | | 99,424,393 | |
| ServiceNow, Inc.1 | | | 140,300 | | | | 36,736,152 | |
| Splunk, Inc.1 | | | 129,150 | | | | 14,441,553 | |
| Trade Desk, Inc. (The), Cl. A1 | | | 117,440 | | | | 28,863,229 | |
| | | | | | | | |
| | | | | | | | 439,176,967 | |
| Technology Hardware, Storage & Peripherals—2.0% | |
| Apple, Inc. | | | 391,178 | | | | 81,654,496 | |
| Materials—1.0% | | | | | |
| Chemicals—1.0% | | | | | |
| Linde plc | | | 35,670 | | | | 6,738,420 | |
| Sherwin-Williams Co. (The) | | | 31,190 | | | | 16,429,332 | |
| Westlake Chemical Corp. | | | 279,280 | | | | 16,363,015 | |
| | | | | | | | |
| | | | | | | 39,530,767 | |
| | | | | | | | |
Total Common Stocks (Cost $3,041,115,480) | | | | | | | 3,977,449,491 | |
| | | | | | | | |
| | | Shares | | | Value | |
| Investment Company—0.1% | | | | | | | | |
Invesco Government & Agency Portfolio, Institutional Class, 2.02%2(Cost $3,486,080) | | | 3,486,080 | | | $ | 3,486,118 | |
Total Investments, at Value
(Cost $3,044,601,560) | | | 99.8% | | | | 3,980,935,609 | |
| Net Other Assets (Liabilities) | | | 0.2 | | | | 9,298,585 | |
| | | | |
| Net Assets | | | 100.0% | | | $ | 3,990,234,194 | |
| | | | |
17 INVESCO OPPENHEIMER CAPITAL APPRECIATION FUND
SCHEDULE OF INVESTMENTSContinued
Footnotes to Schedule of Investments
1.Non-income producing security.
2. The money market fund and the Fund are affiliated by having the same investment adviser. The rate shown is the7-day SEC standardized yield as of August 31, 2019.
See accompanying Notes to Financial Statements.
18 INVESCO OPPENHEIMER CAPITAL APPRECIATION FUND
STATEMENT OF ASSETS AND LIABILITIESAugust 31, 2019
| | | | |
| Assets | | | | |
| Investments, at value—see accompanying schedule of investments: | | | | |
| Unaffiliated companies (cost $3,041,115,480) | | $ | 3,977,449,491 | |
| Affiliated companies (cost $3,486,080) | | | 3,486,118 | |
| | | | |
| | | 3,980,935,609 | |
| Cash | | | 5,000,000 | |
| Receivables and other assets: | | | | |
| Investments sold | | | 12,319,875 | |
| Dividends | | | 1,934,649 | |
| Shares of beneficial interest sold | | | 781,851 | |
| Other | | | 593,081 | |
| | | | |
| Total assets | | | 4,001,565,065 | |
| Liabilities | | | | |
| Payables and other liabilities: | | | | |
| Investments purchased | | | 3,820,564 | |
| Shares of beneficial interest redeemed | | | 3,756,087 | |
| Transfer and shareholder servicing agent fees | | | 1,335,539 | |
| Trustees’ compensation | | | 1,134,556 | |
| Distribution and service plan fees | | | 972,628 | |
| Advisory fees | | | 130,810 | |
| Shareholder communications | | | 117,600 | |
| Administration fees | | | 773 | |
| Other | | | 62,314 | |
| | | | |
| Total liabilities | | | 11,330,871 | |
| Net Assets | | $ | 3,990,234,194 | |
| | | | |
| | | | |
| Composition of Net Assets | | | | |
| Shares of beneficial interest | | $ | 2,241,248,334 | |
| Total distributable earnings | | | 1,748,985,860 | |
| | | | |
| Net Assets | | $ | 3,990,234,194 | |
| | | | |
19 INVESCO OPPENHEIMER CAPITAL APPRECIATION FUND
STATEMENT OF ASSETS AND LIABILITIESContinued
| | | | |
| Net Asset Value Per Share | | | | |
| Class A Shares: | | | | |
| |
| Net asset value and redemption price per share (based on net assets of $3,566,268,695 and 57,170,018 shares of beneficial interest outstanding) | | $ | 62.38 | |
| |
| Maximum offering price per share (net asset value plus sales charge of 5.50% of offering price) | | $ | 66.01 | |
| |
| Class C Shares: | | | | |
| |
| Net asset value, redemption price (excludes applicable contingent deferred sales charge) and offering price per share (based on net assets of $201,750,876 and 4,462,070 shares of beneficial interest outstanding) | | $ | 45.21 | |
| |
| Class R Shares: | | | | |
| |
| Net asset value, redemption price and offering price per share (based on net assets of $117,018,984 and 2,007,852 shares of beneficial interest outstanding) | | $ | 58.28 | |
| |
| Class Y Shares: | | | | |
| |
| Net asset value, redemption price and offering price per share (based on net assets of $95,437,909 and 1,401,817 shares of beneficial interest outstanding) | | $ | 68.08 | |
| |
| Class R5 Shares: | | | | |
| |
| Net asset value, redemption price and offering price per share (based on net assets of $10,644 and 170.474 shares of beneficial interest outstanding) | | $ | 62.44 | |
| |
| Class R6 Shares: | | | | |
| |
| Net asset value, redemption price and offering price per share (based on net assets of $9,747,086 and 142,095 shares of beneficial interest outstanding) | | $ | 68.60 | |
See accompanying Notes to Financial Statements.
20 INVESCO OPPENHEIMER CAPITAL APPRECIATION FUND
STATEMENT OF OPERATIONSFor the Year Ended August 31, 2019
| | | | |
| Investment Income | | | | |
| Dividends: | | | | |
| Unaffiliated companies (net of foreign withholding taxes of $213,030) | | $ | 39,526,294 | |
| Affiliated companies | | | 1,241,763 | |
| Interest | | | 69,690 | |
| Total investment income | | | 40,837,747 | |
| Expenses | | | | |
| |
| Advisory fees | | | 25,024,275 | |
| Administration fees | | | 147,893 | |
| Distribution and service plan fees: | | | | |
| Class A | | | 7,512,186 | |
| Class C | | | 3,393,250 | |
| Class R | | | 537,249 | |
| Transfer and shareholder servicing agent fees: | | | | |
| Class A | | | 6,430,860 | |
| Class C | | | 657,704 | |
| Class R | | | 209,690 | |
| Class Y | | | 194,708 | |
| Class R5 | | | 2 | |
| Class R6 | | | 90,470 | |
| Shareholder communications: | | | | |
| Class A | | | 141,215 | |
| Class C | | | 12,692 | |
| Class R | | | 5,096 | |
| Class Y | | | 4,507 | |
| Class R6 | | | 378 | |
| Custodian fees and expenses | | | 105,897 | |
| Borrowing fees | | | 97,164 | |
| Trustees’ compensation | | | 57,556 | |
| Other | | | 166,463 | |
| Total expenses | | | 44,789,255 | |
| Less waivers and reimbursements of expenses | | | (84,787 | ) |
| Net expenses | | | 44,704,468 | |
| Net Investment Loss | | | (3,866,721 | ) |
21 INVESCO OPPENHEIMER CAPITAL APPRECIATION FUND
STATEMENT OF OPERATIONSContinued
| | | | |
| Realized and Unrealized Gain (Loss) | | | | |
| Net realized gain on: | | | | |
| Investment transactions in unaffiliated companies (includes net gains from securities sold to affiliates of $1,276,681) | | $ | 822,879,773 | |
| Foreign currency transactions | | | 729 | |
| Net realized gain | | | 822,880,502 | |
| Net change in unrealized appreciation/(depreciation) on: | | | | |
| Investment transactions in: | | | | |
Unaffiliated companies | | | (805,375,775 | ) |
Affiliated companies | | | 38 | |
| Translation of assets and liabilities denominated in foreign currencies | | | (4,380 | ) |
| Net change in unrealized appreciation/(depreciation) | | | (805,380,117 | ) |
| Net Increase in Net Assets Resulting from Operations | | $ | 13,633,664 | |
| | | | |
See accompanying Notes to Financial Statements.
22 INVESCO OPPENHEIMER CAPITAL APPRECIATION FUND
STATEMENT OF CHANGES IN NET ASSETS
| | | | | | | | |
| | | Year Ended
August 31, 2019 | | Year Ended
August 31, 2018 |
| Operations | | | | | | | | |
| Net investment income (loss) | | $ | (3,866,721 | ) | | $ | 1,124,267 | |
| Net realized gain | | | 822,880,502 | | | | 359,141,792 | |
| Net change in unrealized appreciation/(depreciation) | | | (805,380,117 | ) | | | 595,518,515 | |
| Net increase in net assets resulting from operations | | | 13,633,664 | | | | 955,784,574 | |
| Dividends and/or Distributions to Shareholders1 | | | | | | | | |
| Distributions to shareholders from distributable earnings: | | | | | | | | |
| Class A | | | (249,261,777 | ) | | | (290,592,657 | ) |
| Class B | | | — | | | | (1,215,441 | ) |
| Class C | | | (37,330,769 | ) | | | (42,436,177 | ) |
| Class R | | | (8,511,813 | ) | | | (9,007,135 | ) |
| Class Y | | | (7,522,697 | ) | | | (13,136,316 | ) |
| Class R5 | | | — | | | | — | |
| Class R6 | | | (27,173,071 | ) | | | (98,157,545 | ) |
| Total distributions from distributable earnings | | | (329,800,127 | ) | | | (454,545,271 | ) |
| Beneficial Interest Transactions | | | | | | | | |
| Net increase (decrease) in net assets resulting from beneficial interest transactions: | | | | | | | | |
| Class A | | | 120,818,861 | | | | 371,143 | |
| Class B | | | — | | | | (18,960,850 | ) |
| Class C | | | (169,435,273 | ) | | | 2,063,037 | |
| Class R | | | 9,603,163 | | | | 10,239,630 | |
| Class Y | | | (13,087,747 | ) | | | (50,338,072 | ) |
| Class R5 | | | 10,000 | | | | — | |
| Class R6 | | | (956,913,657 | ) | | | (165,770,737 | ) |
| Total beneficial interest transactions | | | (1,009,004,653 | ) | | | (222,395,849 | ) |
| Net Assets | | | | | | | | |
| Total increase (decrease) | | | (1,325,171,116 | ) | | | 278,843,454 | |
| Beginning of period | | | 5,315,405,310 | | | | 5,036,561,856 | |
| End of period | | $ | 3,990,234,194 | | | $ | 5,315,405,310 | |
| | | | |
1.For the year ended August 31, 2019, distributions to shareholders from distributable earnings consisted of distributions from net investment income and distributions from net realized gains. The Securities and Exchange Commission eliminated the requirement to disclose the distribution components separately, except for a tax return of capital. For the year ended August 31, 2018, distributions from net investment income were $429,192, $340,631 and $4,316,201 for Class A, Class Y and Class R6 shares, respectively, and distributions from net realized gains were $290,163,465, $1,215,441, $42,436,177, $9,007,135, $12,795,685 and $93,841,344 for Class A, Class B, Class C, Class R, Class Y and Class R6 shares, respectively.
See accompanying Notes to Financial Statements.
23 INVESCO OPPENHEIMER CAPITAL APPRECIATION FUND
FINANCIAL HIGHLIGHTS
| | | | | | | | | | | | | | | | | | | | |
Class A | | Year Ended | | | Year Ended | | | Year Ended | | | Year Ended | | | Year Ended | |
| | August 31, 2019 | | | August 31, 2018 | | | August 31, 2017 | | | August 31, 2016 | | | August 31, 2015 | |
| Per Share Operating Data | | | | | | | | | | | | | | | | | | | | |
| Net asset value, beginning of period | | | $65.82 | | | | $59.87 | | | | $52.99 | | | | $58.99 | | | | $66.40 | |
| Income (loss) from investment operations: | | | | | | | | | | | | | | | | | | | | |
| Net investment income (loss)1 | | | (0.03) | | | | (0.00)2 | | | | 0.04 | | | | 0.07 | | | | (0.06) | |
| Net realized and unrealized gain | | | 1.23 | | | | 11.40 | | | | 9.01 | | | | 1.36 | | | | 2.21 | |
| Total from investment operations | | | 1.20 | | | | 11.40 | | | | 9.05 | | | | 1.43 | | | | 2.15 | |
| Dividends and/or distributions to shareholders: | | | | | | | | | | | | | | | | | | | | |
| Dividends from net investment income | | | 0.00 | | | | (0.01) | | | | (0.04) | | | | 0.00 | | | | 0.00 | |
| Distributions from net realized gain | | | (4.64) | | | | (5.44) | | | | (2.13) | | | | (7.43) | | | | (9.56) | |
| Total dividends and/or distributions to shareholders | | | (4.64) | | | | (5.45) | | | | (2.17) | | | | (7.43) | | | | (9.56) | |
| Net asset value, end of period | | | $62.38 | | | | $65.82 | | | | $59.87 | | | | $52.99 | | | | $58.99 | |
| | | | |
| | | | | | | | | | | | | | | | | | | | |
| Total Return, at Net Asset Value3 | | | 2.97% | | | | 20.23% | | | | 17.90% | | | | 2.02% | | | | 3.16% | |
| | | | | | | | | | | | | | | | | | | | |
| Ratios/Supplemental Data | | | | | | | | | | | | | | | | | | | | |
| Net assets, end of period (in thousands) | | | $3,566,269 | | | | $3,606,256 | | | | $3,266,760 | | | | $3,112,543 | | | | $3,368,384 | |
| Average net assets (in thousands) | | | $3,350,370 | | | | $3,403,324 | | | | $3,120,844 | | | | $3,198,528 | | | | $3,497,054 | |
| Ratios to average net assets:4 | | | | | | | | | | | | | | | | | | | | |
| Net investment income (loss) | | | (0.06)% | | | | (0.01)% | | | | 0.08% | | | | 0.14% | | | | (0.10)% | |
| Expenses excluding specific expenses listed below | | | 1.03% | | | | 1.03% | | | | 1.05% | | | | 1.05% | | | | 1.04% | |
| Interest and fees from borrowings5 | | | 0.00% | | | | 0.00% | | | | 0.00% | | | | 0.00% | | | | 0.00% | |
| Total expenses6 | | | 1.03% | | | | 1.03% | | | | 1.05% | | | | 1.05% | | | | 1.04% | |
| Expenses after payments, waivers and/or reimbursements and reduction to custodian expenses | | | 1.03%7 | | | | 1.03%7 | | | | 1.04% | | | | 1.05%7 | | | | 1.04%7 | |
| Portfolio turnover rate8 | | | 64% | | | | 29% | | | | 63% | | | | 79% | | | | 66% | |
1. Per share amounts calculated based on the average shares outstanding during the period.
2. Less than $0.005 per share.
3. Assumes an initial investment on the business day before the first day of the fiscal period, with all dividends and distributions reinvested in additional shares on the reinvestment date, and redemption at the net asset value calculated on the last business day of the fiscal period. Sales charges are not reflected in the total returns. Total returns are not annualized for periods less than one full year. Returns do not reflect the deduction of taxes that a shareholder would pay on fund distributions or the redemption of fund shares.
4. Annualized for periods less than one full year.
5. Less than 0.005%.
6. Total expenses including indirect expenses from affiliated fund fees and expenses were as follows:
| | | | | | |
| Year Ended August 31, 2019 | | | 1.03 | % | | |
| Year Ended August 31, 2018 | | | 1.03 | % |
| Year Ended August 31, 2017 | | | 1.05 | % |
| Year Ended August 31, 2016 | | | 1.05 | % |
| Year Ended August 31, 2015 | | | 1.04 | % | | |
7. Waiver was less than 0.005%.
8. Portfolio turnover is calculated at the fund level and is not annualized for periods less than one year, if applicable.
See accompanying Notes to Financial Statements.
24 INVESCO OPPENHEIMER CAPITAL APPRECIATION FUND
| | | | | | | | | | | | | | | | | | | | |
| | | Year Ended | | | Year Ended | | | Year Ended | | | Year Ended | | | Year Ended | |
| Class C | | August 31, 2019 | | | August 31, 2018 | | | August 31, 2017 | | | August 31, 2016 | | | August 31, 2015 | |
| Per Share Operating Data | | | | | | | | | | | | | | | | | | | | |
| Net asset value, beginning of period | | | $49.50 | | | | $46.61 | | | | $42.02 | | | | $48.56 | | | | $56.67 | |
| Income (loss) from investment operations: | | | | | | | | | | | | | | | | | | | | |
| Net investment loss1 | | | (0.36) | | | | (0.36) | | | | (0.30) | | | | (0.27) | | | | (0.45) | |
| Net realized and unrealized gain | | | 0.71 | | | | 8.69 | | | | 7.02 | | | | 1.16 | | | | 1.90 | |
| Total from investment operations | | | 0.35 | | | | 8.33 | | | | 6.72 | | | | 0.89 | | | | 1.45 | |
| Dividends and/or distributions to shareholders: | | | | | | | | | | | | | | | | | | | | |
| Dividends from net investment income | | | 0.00 | | | | 0.00 | | | | 0.00 | | | | 0.00 | | | | 0.00 | |
| Distributions from net realized gain | | | (4.64) | | | | (5.44) | | | | (2.13) | | | | (7.43) | | | | (9.56) | |
| Total dividends and/or distributions to shareholders | | | (4.64) | | | | (5.44) | | | | (2.13) | | | | (7.43) | | | | (9.56) | |
| Net asset value, end of period | | | $45.21 | | | | $49.50 | | | | $46.61 | | | | $42.02 | | | | $48.56 | |
| | | | |
| | | | | | | | | | | | | | | | | | | | |
| Total Return, at Net Asset Value2 | | | 2.18% | | | | 19.33% | | | | 16.98% | | | | 1.26% | | | | 2.37% | |
| | | | | | | | | | | | | | | | | | | | |
| Ratios/Supplemental Data | | | | | | | | | | | | | | | | | | | | |
| Net assets, end of period (in thousands) | | | $201,751 | | | | $404,733 | | | | $376,618 | | | | $390,891 | | | | $430,473 | |
| Average net assets (in thousands) | | | $340,469 | | | | $386,071 | | | | $375,968 | | | | $408,311 | | | | $445,480 | |
| Ratios to average net assets:3 | | | | | | | | | | | | | | | | | | | | |
| Net investment loss | | | (0.83)% | | | | (0.77)% | | | | (0.69)% | | | | (0.62)% | | | | (0.86)% | |
| Expenses excluding specific expenses listed below | | | 1.80% | | | | 1.79% | | | | 1.82% | | | | 1.82% | | | | 1.80% | |
| Interest and fees from borrowings4 | | | 0.00% | | | | 0.00% | | | | 0.00% | | | | 0.00% | | | | 0.00% | |
| Total expenses5 | | | 1.80% | | | | 1.79% | | | | 1.82% | | | | 1.82% | | | | 1.80% | |
| Expenses after payments, waivers and/or reimbursements and reduction to custodian expenses | | | 1.80%6 | | | | 1.79%6 | | | | 1.81% | | | | 1.82%6 | | | | 1.80%6 | |
| Portfolio turnover rate7 | | | 64% | | | | 29% | | | | 63% | | | | 79% | | | | 66% | |
1. Per share amounts calculated based on the average shares outstanding during the period.
2. Assumes an initial investment on the business day before the first day of the fiscal period, with all dividends and distributions reinvested in additional shares on the reinvestment date, and redemption at the net asset value calculated on the last business day of the fiscal period. Sales charges are not reflected in the total returns. Total returns are not annualized for periods less than one full year. Returns do not reflect the deduction of taxes that a shareholder would pay on fund distributions or the redemption of fund shares.
3. Annualized for periods less than one full year.
4. Less than 0.005%.
5. Total expenses including indirect expenses from affiliated fund fees and expenses were as follows:
| | | | | | |
| Year Ended August 31, 2019 | | | 1.80 | % | | |
| Year Ended August 31, 2018 | | | 1.79 | % | | |
| Year Ended August 31, 2017 | | | 1.82 | % | | |
| Year Ended August 31, 2016 | | | 1.82 | % | | |
| Year Ended August 31, 2015 | | | 1.80 | % | | |
6. Waiver was less than 0.005%.
7. Portfolio turnover is calculated at the fund level and is not annualized for periods less than one year, if applicable.
See accompanying Notes to Financial Statements.
25 INVESCO OPPENHEIMER CAPITAL APPRECIATION FUND
FINANCIAL HIGHLIGHTSContinued
| | | | | | | | | | | | | | | | | | | | |
| | | Year Ended | | | Year Ended | | | Year Ended | | | Year Ended | | | Year Ended | |
| Class R | | August 31, 2019 | | | August 31, 2018 | | | August 31, 2017 | | | August 31, 2016 | | | August 31, 2015 | |
| Per Share Operating Data | | | | | | | | | | | | | | | | | | | | |
| Net asset value, beginning of period | | | $62.00 | | | | $56.82 | | | | $50.49 | | | | $56.68 | | | | $64.31 | |
| Income (loss) from investment operations: | | | | | | | | | | | | | | | | | | | | |
| Net investment loss1 | | | (0.18) | | | | (0.15) | | | | (0.10) | | | | (0.06) | | | | (0.21) | |
| Net realized and unrealized gain | | | 1.10 | | | | 10.77 | | | | 8.56 | | | | 1.30 | | | | 2.14 | |
| Total from investment operations | | | 0.92 | | | | 10.62 | | | | 8.46 | | | | 1.24 | | | | 1.93 | |
| Dividends and/or distributions to shareholders: | | | | | | | | | | | | | | | | | | | | |
| Dividends from net investment income | | | 0.00 | | | | 0.00 | | | | 0.00 | | | | 0.00 | | | | 0.00 | |
| Distributions from net realized gain | | | (4.64) | | | | (5.44) | | | | (2.13) | | | | (7.43) | | | | (9.56) | |
| Total dividends and/or distributions to shareholders | | | (4.64) | | | | (5.44) | | | | (2.13) | | | | (7.43) | | | | (9.56) | |
| Net asset value, end of period | | | $58.28 | | | | $62.00 | | | | $56.82 | | | | $50.49 | | | | $56.68 | |
| | | | |
| | | | | | | | | | | | | | | | | | | | |
| Total Return, at Net Asset Value2 | | | 2.68% | | | | 19.92% | | | | 17.60% | | | | 1.74% | | | | 2.89% | |
| | | | | | | | | | | | | | | | | | | | |
| Ratios/Supplemental Data | | | | | | | | | | | | | | | | | | | | |
| Net assets, end of period (in thousands) | | | $117,019 | | | | $112,845 | | | | $92,888 | | | | $83,248 | | | | $89,442 | |
| Average net assets (in thousands) | | | $109,282 | | | | $101,443 | | | | $86,076 | | | | $85,690 | | | | $94,706 | |
| Ratios to average net assets:3 | | | | | | | | | | | | | | | | | | | | |
| Net investment loss | | | (0.32)% | | | | (0.27)% | | | | (0.18)% | | | | (0.12)% | | | | (0.35)% | |
| Expenses excluding specific expenses listed below | | | 1.30% | | | | 1.29% | | | | 1.31% | | | | 1.31% | | | | 1.30% | |
| Interest and fees from borrowings4 | | | 0.00% | | | | 0.00% | | | | 0.00% | | | | 0.00% | | | | 0.00% | |
| Total expenses5 | | | 1.30% | | | | 1.29% | | | | 1.31% | | | | 1.31% | | | | 1.30% | |
| Expenses after payments, waivers and/or reimbursements and reduction to custodian expenses | | | 1.30%6 | | | | 1.29%6 | | | | 1.30% | | | | 1.31%6 | | | | 1.30%6 | |
| Portfolio turnover rate7 | | | 64% | | | | 29% | | | | 63% | | | | 79% | | | | 66% | |
1. Per share amounts calculated based on the average shares outstanding during the period.
2. Assumes an initial investment on the business day before the first day of the fiscal period, with all dividends and distributions reinvested in additional shares on the reinvestment date, and redemption at the net asset value calculated on the last business day of the fiscal period. Sales charges are not reflected in the total returns. Total returns are not annualized for periods less than one full year. Returns do not reflect the deduction of taxes that a shareholder would pay on fund distributions or the redemption of fund shares.
3. Annualized for periods less than one full year.
4. Less than 0.005%.
5. Total expenses including indirect expenses from affiliated fund fees and expenses were as follows:
| | | | | | |
| Year Ended August 31, 2019 | | | 1.30 | % | | |
| Year Ended August 31, 2018 | | | 1.29 | % | | |
| Year Ended August 31, 2017 | | | 1.31 | % | | |
| Year Ended August 31, 2016 | | | 1.31 | % | | |
| Year Ended August 31, 2015 | | | 1.30 | % | | |
6. Waiver was less than 0.005%.
7. Portfolio turnover is calculated at the fund level and is not annualized for periods less than one year, if applicable.
See accompanying Notes to Financial Statements.
26 INVESCO OPPENHEIMER CAPITAL APPRECIATION FUND
| | | | | | | | | | | | | | | | | | | | |
| | | Year Ended | | | Year Ended | | | Year Ended | | | Year Ended | | | Year Ended | |
| Class Y | | August 31, 2019 | | | August 31, 2018 | | | August 31, 2017 | | | August 31, 2016 | | | August 31, 2015 | |
| Per Share Operating Data | | | | | | | | | | | | | | | | | | | | |
| Net asset value, beginning of period | | | $71.23 | | | | $64.36 | | | | $56.79 | | | | $62.57 | | | | $69.73 | |
| Income (loss) from investment operations: | | | | | | | | | | | | | | | | | | | | |
| Net investment income1 | | | 0.11 | | | | 0.15 | | | | 0.16 | | | | 0.22 | | | | 0.09 | |
| Net realized and unrealized gain | | | 1.40 | | | | 12.30 | | | | 9.69 | | | | 1.43 | | | | 2.31 | |
| Total from investment operations | | | 1.51 | | | | 12.45 | | | | 9.85 | | | | 1.65 | | | | 2.40 | |
| Dividends and/or distributions to shareholders: | | | | | | | | | | | | | | | | | | | | |
| Dividends from net investment income | | | (0.02) | | | | (0.14) | | | | (0.15) | | | | 0.00 | | | | 0.00 | |
| Distributions from net realized gain | | | (4.64) | | | | (5.44) | | | | (2.13) | | | | (7.43) | | | | (9.56) | |
| Total dividends and/or distributions to shareholders | | | (4.66) | | | | (5.58) | | | | (2.28) | | | | (7.43) | | | | (9.56) | |
| Net asset value, end of period | | | $68.08 | | | | $71.23 | | | | $64.36 | | | | $56.79 | | | | $62.57 | |
| | | | |
| | | | | | | | | | | | | | | | | | | | |
| Total Return, at Net Asset Value2 | | | 3.20% | | | | 20.51% | | | | 18.16% | | | | 2.28% | | | | 3.38% | |
| | | | | | | | | | | | | | | | | | | | |
| Ratios/Supplemental Data | | | | | | | | | | | | | | | | | | | | |
| Net assets, end of period (in thousands) | | | $95,438 | | | | $115,119 | | | | $149,511 | | | | $119,008 | | | | $146,485 | |
| Average net assets (in thousands) | | | $101,266 | | | | $161,873 | | | | $129,570 | | | | $136,687 | | | | $148,398 | |
| Ratios to average net assets:3 | | | | | | | | | | | | | | | | | | | | |
| Net investment income | | | 0.17% | | | | 0.22% | | | | 0.27% | | | | 0.38% | | | | 0.13% | |
| Expenses excluding specific expenses listed below | | | 0.80% | | | | 0.80% | | | | 0.82% | | | | 0.82% | | | | 0.81% | |
| Interest and fees from borrowings4 | | | 0.00% | | | | 0.00% | | | | 0.00% | | | | 0.00% | | | | 0.00% | |
| Total expenses5 | | | 0.80% | | | | 0.80% | | | | 0.82% | | | | 0.82% | | | | 0.81% | |
| Expenses after payments, waivers and/or reimbursements and reduction to custodian expenses | | | 0.80%6 | | | | 0.80%6 | | | | 0.81% | | | | 0.82%6 | | | | 0.81%6 | |
| Portfolio turnover rate7 | | | 64% | | | | 29% | | | | 63% | | | | 79% | | | | 66% | |
1. Per share amounts calculated based on the average shares outstanding during the period.
2. Assumes an initial investment on the business day before the first day of the fiscal period, with all dividends and distributions reinvested in additional shares on the reinvestment date, and redemption at the net asset value calculated on the last business day of the fiscal period. Sales charges are not reflected in the total returns. Total returns are not annualized for periods less than one full year. Returns do not reflect the deduction of taxes that a shareholder would pay on fund distributions or the redemption of fund shares.
3. Annualized for periods less than one full year.
4. Less than 0.005%.
5. Total expenses including indirect expenses from affiliated fund fees and expenses were as follows:
| | | | | | |
| Year Ended August 31, 2019 | | | 0.80 | % | | |
| Year Ended August 31, 2018 | | | 0.80 | % | | |
| Year Ended August 31, 2017 | | | 0.82 | % | | |
| Year Ended August 31, 2016 | | | 0.82 | % | | |
| Year Ended August 31, 2015 | | | 0.81 | % | | |
6. Waiver was less than 0.005%.
7. Portfolio turnover is calculated at the fund level and is not annualized for periods less than one year, if applicable.
See accompanying Notes to Financial Statements.
27 INVESCO OPPENHEIMER CAPITAL APPRECIATION FUND
FINANCIAL HIGHLIGHTSContinued
| | | | |
| Class R5 | | Period Ended
August 31,
20191 | |
| Per Share Operating Data | | | | |
| Net asset value, beginning of period | | | $58.66 | |
| Income (loss) from investment operations: | | | | |
| Net investment income2 | | | 0.05 | |
| Net realized and unrealized gain | | | 3.73 | |
| Total from investment operations | | | 3.78 | |
| Dividends and/or distributions to shareholders: | | | | |
| Dividends from net investment income | | | 0.00 | |
| Distributions from net realized gain | | | 0.00 | |
| Total dividends and/or distributions to shareholders | | | 0.00 | |
| Net asset value, end of period | | | $62.44 | |
| | | | |
| | | | |
| Total Return, at Net Asset Value3 | | | 6.44% | |
| | | | |
| Ratios/Supplemental Data | | | | |
| Net assets, end of period (in thousands) | | | $11 | |
| Average net assets (in thousands) | | | $10 | |
| Ratios to average net assets:4 | | | | |
| Net investment income | | | 0.29% | |
| Expenses excluding specific expenses listed below | | | 0.68% | |
| Interest and fees from borrowings4 | | | 0.00% | |
| Total expenses5 | | | 0.68% | |
| Expenses after payments, waivers and/or reimbursements and reduction to custodian expenses | | | 0.68% | |
| Portfolio turnover rate6 | | | 64% | |
1. For the period from after the close of business on May 24, 2019 (inception of offering) to August 31, 2019.
2. Per share amounts calculated based on the average shares outstanding during the period.
3. Assumes an initial investment on the business day before the first day of the fiscal period, with all dividends and distributions reinvested in additional shares on the reinvestment date, and redemption at the net asset value calculated on the last business day of the fiscal period. Sales charges are not reflected in the total returns. Total returns are not annualized for periods less than one full year. Returns do not reflect the deduction of taxes that a shareholder would pay on fund distributions or the redemption of fund shares.
4. Annualized for periods less than one full year.
5. Total expenses including indirect expenses from affiliated fund fees and expenses were as follows:
| | | | | | |
| Period Ended August 31, 2019 | | | 0.68 | % | | |
6. Portfolio turnover is calculated at the fund level and is not annualized for periods less than one year, if applicable.
See accompanying Notes to Financial Statements.
28 INVESCO OPPENHEIMER CAPITAL APPRECIATION FUND
| | | | | | | | | | | | | | | | | | | | |
| Class R6 | | Year Ended
August 31,
2019 | | | Year Ended
August 31,
2018 | | | Year Ended
August 31,
2017 | | | Year Ended
August 31,
2016 | | | Year Ended
August 31,
2015 | |
| Per Share Operating Data | | | | | | | | | | | | | | | | | | | | |
| Net asset value, beginning of period | | | $71.57 | | | | $64.64 | | | | $57.04 | | | | $62.72 | | | | $69.75 | |
| Income (loss) from investment operations: | | | | | | | | | | | | | | | | | | | | |
| Net investment income1 | | | 0.23 | | | | 0.26 | | | | 0.29 | | | | 0.32 | | | | 0.22 | |
| Net realized and unrealized gain | | | 1.58 | | | | 12.36 | | | | 9.71 | | | | 1.43 | | | | 2.31 | |
| Total from investment operations | | | 1.81 | | | | 12.62 | | | | 10.00 | | | | 1.75 | | | | 2.53 | |
| Dividends and/or distributions to shareholders: | | | | | | | | | | | | | | | | | | | | |
| Dividends from net investment income | | | (0.14) | | | | (0.25) | | | | (0.27) | | | | 0.00 | | | | 0.00 | |
| Distributions from net realized gain | | | (4.64) | | | | (5.44) | | | | (2.13) | | | | (7.43) | | | | (9.56) | |
| Total dividends and/or distributions to shareholders | | | (4.78) | | | | (5.69) | | | | (2.40) | | | | (7.43) | | | | (9.56) | |
| Net asset value, end of period | | | $68.60 | | | | $71.57 | | | | $64.64 | | | | $57.04 | | | | $62.72 | |
| | | | |
| | | | | | | | | | | | | | | | | | | | |
| Total Return, at Net Asset Value2 | | | 3.66% | | | | 20.70% | | | | 18.40% | | | | 2.45% | | | | 3.60% | |
| | | | | | | | | | | | | | | | | | | | |
| Ratios/Supplemental Data | | | | | | | | | | | | | | | | | | | | |
| Net assets, end of period (in thousands) | | | $9,747 | | | | $1,076,452 | | | | $1,131,656 | | | | $988,213 | | | | $1,009,353 | |
| Average net assets (in thousands) | | | $300,952 | | | | $1,101,304 | | | | $1,046,626 | | | | $987,503 | | | | $1,050,463 | |
| Ratios to average net assets:3 | | | | | | | | | | | | | | | | | | | | |
| Net investment income | | | 0.33% | | | | 0.39% | | | | 0.49% | | | | 0.56% | | | | 0.33% | |
| Expenses excluding specific expenses listed below | | | 0.63% | | | | 0.63% | | | | 0.63% | | | | 0.63% | | | | 0.62% | |
| Interest and fees from borrowings4 | | | 0.00% | | | | 0.00% | | | | 0.00% | | | | 0.00% | | | | 0.00% | |
| Total expenses5 | | | 0.63% | | | | 0.63% | | | | 0.63% | | | | 0.63% | | | | 0.62% | |
| Expenses after payments, waivers and/or reimbursements and reduction to custodian expenses | | | 0.63%6 | | | | 0.63%6 | | | | 0.63%6 | | | | 0.63%6 | | | | 0.62%6 | |
| Portfolio turnover rate7 | | | 64% | | | | 29% | | | | 63% | | | | 79% | | | | 66% | |
1. Per share amounts calculated based on the average shares outstanding during the period.
2. Assumes an initial investment on the business day before the first day of the fiscal period, with all dividends and distributions reinvested in additional shares on the reinvestment date, and redemption at the net asset value calculated on the last business day of the fiscal period. Sales charges are not reflected in the total returns. Total returns are not annualized for periods less than one full year. Returns do not reflect the deduction of taxes that a shareholder would pay on fund distributions or the redemption of fund shares.
3. Annualized for periods less than one full year.
4. Less than 0.005%.
5. Total expenses including indirect expenses from affiliated fund fees and expenses were as follows:
| | | | | | |
| Year Ended August 31, 2019 | | | 0.63 | % | | |
| Year Ended August 31, 2018 | | | 0.63 | % | | |
| Year Ended August 31, 2017 | | | 0.63 | % | | |
| Year Ended August 31, 2016 | | | 0.63 | % | | |
| Year Ended August 31, 2015 | | | 0.62 | % | | |
6. Waiver was less than 0.005%.
7. Portfolio turnover is calculated at the fund level and is not annualized for periods less than one year, if applicable.
See accompanying Notes to Financial Statements.
29 INVESCO OPPENHEIMER CAPITAL APPRECIATION FUND
NOTES TO FINANCIAL STATEMENTSAugust 31, 2019
Note 1 – Significant Accounting Policies
Invesco Oppenheimer Capital Appreciation Fund (the “Fund”) is a series portfolio of AIM Counselor Series Trust (Invesco Counselor Series Trust) (the “Trust”). The Trust is a Delaware statutory trust registered under the Investment Company Act of 1940, as amended (the “1940 Act”), as anopen-end series management investment company authorized to issue an unlimited number of shares of beneficial interest. Information presented in these financial statements pertains only to the Fund. Matters affecting the Fund or each class will be voted on exclusively by the shareholders of such Fund or each class.
Prior to the close of business on May 24, 2019, the Fund operated as Oppenheimer Capital Appreciation Fund (the “Acquired Fund” or “Predecessor Fund”). The Acquired Fund was reorganized after the close of business on May 24, 2019 (the “Reorganization Date”) through the transfer of all of its assets and liabilities to the Fund (the “Reorganization”).
Upon closing of the Reorganization, holders of the Acquired Fund’s Class A, Class C, Class R, and Class Y shares received the corresponding class of shares of the Fund and holders of the Acquired Fund’s Class I shares received Class R6 shares of the Fund. Information for the Acquired Fund’s Class I shares prior to the Reorganization is included with Class R6 shares throughout this report. Class R5 shares commenced operations on the Reorganization Date.
The Fund’s investment objective is to seek capital appreciation.
The Fund currently consists of six different classes of shares: Class A, Class C, Class R, Class Y, Class R5 and Class R6. Class Y shares are available only to certain investors. Class A shares are sold with afront-end sales charge unless certain waiver criteria are met and under certain circumstances load waived shares may be subject to contingent deferred sales charges (“CDSC”). Class C shares are sold with a CDSC. Class R, Class Y, Class R5 and Class R6 shares are sold at net asset value.
The Fund is an investment company and accordingly follows the investment company accounting and reporting guidance in accordance with Financial Accounting Standards Board Accounting Standards Codification Topic 946, Financial Services – Investment Companies.
The following is a summary of the significant accounting policies followed by the Fund in the preparation of its financial statements.
A. Security Valuations– Securities, including restricted securities, are valued according to the following policy.
A security listed or traded on an exchange (except convertible securities) is valued at its last sales price or official closing price as of the close of the customary trading session on the exchange where the security is principally traded, or lacking any sales or official closing price on a particular day, the security may be valued at the closing bid price on that day. Securities traded in theover-the-counter market are valued based on prices furnished by independent pricing services or market makers. When such securities are valued by an independent pricing service they may be considered fair valued. Futures contracts are valued at the final settlement price set by an exchange on which they are principally traded. Listed options are valued at the mean between the last bid and asked prices from the exchange on which they are principally traded. Options not listed on an exchange are valued by an independent source at the mean between the last bid and asked prices. For purposes of
30 INVESCO OPPENHEIMER CAPITAL APPRECIATION FUND
determining net asset value (“NAV”) per share, futures and option contracts generally are valued 15 minutes after the close of the customary trading session of the New York Stock Exchange (“NYSE”).
Investments inopen-end andclosed-end registered investment companies that do not trade on an exchange are valued at theend-of-day net asset value per share. Investments inopen-end andclosed-end registered investment companies that trade on an exchange are valued at the last sales price or official closing price as of the close of the customary trading session on the exchange where the security is principally traded.
Debt obligations (including convertible securities) and unlisted equities are fair valued using an evaluated quote provided by an independent pricing service. Evaluated quotes provided by the pricing service may be determined without exclusive reliance on quoted prices, and may reflect appropriate factors such asinstitution-size trading in similar groups of securities, developments related to specific securities, dividend rate (for unlisted equities), yield (for debt obligations), quality, type of issue, coupon rate (for debt obligations), maturity (for debt obligations), individual trading characteristics and other market data. Pricing services generally value debt obligations assuming orderly transactions of institutional round lot size, but a fund may hold or transact in the same securities in smaller, odd lot sizes. Odd lots often trade at lower prices than institutional round lots. Debt obligations are subject to interest rate and credit risks. In addition, all debt obligations involve some risk of default with respect to interest and/or principal payments.
Foreign securities’ (including foreign exchange contracts) prices are converted into U.S. dollar amounts using the applicable exchange rates as of the close of the NYSE. If market quotations are available and reliable for foreign exchange-traded equity securities, the securities will be valued at the market quotations. Because trading hours for certain foreign securities end before the close of the NYSE, closing market quotations may become unreliable. If between the time trading ends on a particular security and the close of the customary trading session on the NYSE, events occur that the investment adviser determines are significant and make the closing price unreliable, the Fund may fair value the security. If the event is likely to have affected the closing price of the security, the security will be valued at fair value in good faith using procedures approved by the Board of Trustees. Adjustments to closing prices to reflect fair value may also be based on a screening process of an independent pricing service to indicate the degree of certainty, based on historical data, that the closing price in the principal market where a foreign security trades is not the current value as of the close of the NYSE. Foreign securities’ prices meeting the approved degree of certainty that the price is not reflective of current value will be priced at the indication of fair value from the independent pricing service. Multiple factors may be considered by the independent pricing service in determining adjustments to reflect fair value and may include information relating to sector indices, American Depositary Receipts and domestic and foreign index futures. Foreign securities may have additional risks including exchange rate changes, potential for sharply devalued currencies and high inflation, political and economic upheaval, the relative lack of issuer information, relatively low market liquidity and the potential lack of strict financial and accounting controls and standards.
31 INVESCO OPPENHEIMER CAPITAL APPRECIATION FUND
NOTES TO FINANCIAL STATEMENTSContinued
Securities for which market prices are not provided by any of the above methods may be valued based upon quotes furnished by independent sources. The last bid price may be used to value equity securities. The mean between the last bid and asked prices is used to value debt obligations, including corporate loans.
Securities for which market quotations are not readily available or became unreliable are valued at fair value as determined in good faith by or under the supervision of the Trust’s officers following procedures approved by the Board of Trustees. Issuer specific events, market trends, bid/asked quotes of brokers and information providers and other market data may be reviewed in the course of making a good faith determination of a security’s fair value.
The Fund may invest in securities that are subject to interest rate risk, meaning the risk that the prices will generally fall as interest rates rise and, conversely, the prices will generally rise as interest rates fall. Specific securities differ in their sensitivity to changes in interest rates depending on their individual characteristics. Changes in interest rates may result in increased market volatility, which may affect the value and/or liquidity of certain Fund investments.
Valuations change in response to many factors including the historical and prospective earnings of the issuer, the value of the issuer’s assets, general economic conditions, interest rates, investor perceptions and market liquidity. Because of the inherent uncertainties of valuation, the values reflected in the financial statements may materially differ from the value received upon actual sale of those investments.
| B. | Securities Transactions and Investment Income - Securities transactions are accounted for on a trade date basis. Realized gains or losses on sales are computed on the basis of specific identification of the securities sold. Interest income (net of withholding tax, if any) is recorded on the accrual basis from settlement date. Dividend income (net of withholding tax, if any) is recorded on theex-dividend date. |
The Fund may periodically participate in litigation related to Fund investments. As such, the Fund may receive proceeds from litigation settlements. Any proceeds received are included in the Statement of Operations as realized gain (loss) for investments no longer held and as unrealized gain (loss) for investments still held.
Brokerage commissions and mark ups are considered transaction costs and are recorded as an increase to the cost basis of securities purchased and/or a reduction of proceeds on a sale of securities. Such transaction costs are included in the determination of net realized and unrealized gain (loss) from investment transactions reported in the Statement of Operations and the Statement of Changes in Net Assets and the net realized and unrealized gains (losses) on securities per share in the Financial Highlights. Transaction costs are included in the calculation of the Fund’s net asset value and, accordingly, they reduce the Fund’s total returns. These transaction costs are not considered operating expenses and are not reflected in net investment income reported in the Statement of Operations and the Statement of Changes in Net Assets, or the net investment income per share and the ratios of expenses and net investment income reported in the Financial Highlights, nor are they limited by any expense limitation arrangements between the Fund and the investment adviser.
32 INVESCO OPPENHEIMER CAPITAL APPRECIATION FUND
The Fund allocates income and realized and unrealized capital gains and losses to a class based on the relative net assets of each class.
| C. | Country Determination- For the purposes of making investment selection decisions and presentation in the Schedule of Investments, the investment adviser may determine the country in which an issuer is located and/or credit risk exposure based on various factors. These factors include the laws of the country under which the issuer is organized, where the issuer maintains a principal office, the country in which the issuer derives 50% or more of its total revenues and the country that has the primary market for the issuer’s securities, as well as other criteria. Among the other criteria that may be evaluated for making this determination are the country in which the issuer maintains 50% or more of its assets, the type of security, financial guarantees and enhancements, the nature of the collateral and the sponsor organization. Country of issuer and/or credit risk exposure has been determined to be the United States of America, unless otherwise noted. |
| D. | Distributions - Dividends and distributions to shareholders, which are determined in accordance with income tax regulations and may differ from accounting principles generally accepted in the United States of America (“GAAP”), are recorded on theex-dividend date. Income and capital gain distributions, if any, are declared and paid annually or at other times as determined necessary by the Adviser. |
| E. | Federal Income Taxes - The Fund intends to comply with provisions of the Internal Revenue Code applicable to regulated investment companies and to distribute substantially all of its investment company taxable income, including any net realized gain on investments not offset by capital loss carryforwards, if any, to shareholders. Therefore, no federal income or excise tax provision is required. The Fund files income tax returns in U.S. federal and applicable state jurisdictions. The statute of limitations on the Fund’s tax return filings generally remains open for the three preceding fiscal reporting period ends. The Fund has analyzed its tax positions for the fiscal year ended August 31, 2019, including open tax years, and does not believe there are any uncertain tax positions requiring recognition in the Fund’s financial statements. |
The tax components of capital shown in the following table represent distribution requirements the Fund must satisfy under the income tax regulations, losses the Fund may be able to offset against income and gains realized in future years and unrealized appreciation or depreciation of securities and other investments for federal income tax purposes.
| | | | | | | | | | | | |
Undistributed Net Investment Income | | Undistributed
Long-Term
Gain | | | Accumulated
Loss
Carryforward1,2
| | | Net Unrealized
Appreciation
Based on cost of
Securities and
Other Investments
for Federal Income
Tax Purposes | |
| $898,485 | | | $827,884,826 | | | | $— | | | | $921,329,273 | |
1. During the reporting period, the Fund did not utilize any capital loss carryforward.
2. During the previous reporting period, the Fund did not utilize any capital loss carryforward.
33 INVESCO OPPENHEIMER CAPITAL APPRECIATION FUND
NOTES TO FINANCIAL STATEMENTSContinued
Net investment income (loss) and net realized gain (loss) may differ for financial statement and tax purposes. The character of dividends and distributions made during the fiscal year from net investment income or net realized gains are determined in accordance with federal income tax requirements, which may differ from the character of net investment income or net realized gains presented in those financial statements in accordance with U.S. GAAP. Also, due to timing of dividends and distributions, the fiscal year in which amounts are distributed may differ from the fiscal year in which the income or net realized gain was recorded by the Fund.
Accordingly, the following amounts have been reclassified for the reporting period. Net assets of the Fund were unaffected by the reclassifications.
| | | | |
Increase toPaid-in Capital | | Reduction to Accumulated
Net Investment
Loss | |
| |
| $19,521 | | | $19,521 | |
The tax character of distributions paid during the reporting periods:
| | | | | | | | |
| | | Year Ended
August 31, 2019 | | | Year Ended
August 31, 2018 | |
| |
| Distributions paid from: | | | | | | | | |
| Ordinary income | | $ | 31,789,306 | | | $ | 158,332,775 | |
| Long-term capital gain | | | 298,010,821 | | | | 296,212,496 | |
| | | | |
| Total | | $ | 329,800,127 | | | $ | 454,545,271 | |
| | | | |
The aggregate cost of securities and other investments and the composition of unrealized appreciation and depreciation of securities and other investments for federal income tax purposes at period end are noted in the following table. The primary difference between book and tax appreciation or depreciation of securities and other investments, if applicable, is attributable to the tax deferral of losses or tax realization of financial statement unrealized gain or loss.
| | | | | | | | |
| Federal tax cost of securities | | $ | 3,059,601,782 | | | | | |
| | | | |
| Gross unrealized appreciation | | $ | 1,009,425,845 | | | | | |
| Gross unrealized depreciation | | | (88,096,572 | ) | | | | |
| | | | |
| Net unrealized appreciation | | $ | 921,329,273 | | | | | |
| | | | |
| F. | Expenses - Fees provided for under the Rule12b-1 plan of a particular class of the Fund are charged to the operations of such class. Transfer agency fees and expenses and other shareholder recordkeeping fees and expenses attributable to Class R5 and Class R6 are allocated to each share class based on relative net assets.Sub-accounting fees attributable to Class R5 are charged to the operations of the class. Transfer agency fees and expenses and other shareholder recordkeeping fees and expenses relating to all other classes are allocated among those classes based on relative net assets. All other expenses are allocated among the classes based on relative net assets. |
| G. | Accounting Estimates - The financial statements are prepared on a basis in conformity |
34 INVESCO OPPENHEIMER CAPITAL APPRECIATION FUND
| | with GAAP, which requires management to make estimates and assumptions that affect the reported amounts of assets and liabilities at the date of the financial statements and the reported amounts of revenues and expenses during the reporting period including estimates and assumptions related to taxation. Actual results could differ from those estimates by a significant amount. In addition, the Fund monitors for material events or transactions that may occur or become known after theperiod-end date and before the date the financial statements are released to print. |
| H. | Indemnifications - Under the Trust’s organizational documents, each Trustee, officer, employee or other agent of the Trust is indemnified against certain liabilities that may arise out of the performance of their duties to the Fund. Additionally, in the normal course of business, the Fund enters into contracts, including the Fund’s servicing agreements, that contain a variety of indemnification clauses. The Fund’s maximum exposure under these arrangements is unknown as this would involve future claims that may be made against the Fund that have not yet occurred. The risk of material loss as a result of such indemnification claims is considered remote. |
| I. | Foreign Currency Translations - Foreign currency is valued at the close of the NYSE based on quotations posted by banks and major currency dealers. Portfolio securities and other assets and liabilities denominated in foreign currencies are translated into U.S. dollar amounts at the date of valuation. Purchases and sales of portfolio securities (net of foreign taxes withheld on disposition) and income items denominated in foreign currencies are translated into U.S. dollar amounts on the respective dates of such transactions. The Fund does not separately account for the portion of the results of operations resulting from changes in foreign exchange rates on investments and the fluctuations arising from changes in market prices of securities held. The combined results of changes in foreign exchange rates and the fluctuation of market prices on investments (net of estimated foreign tax withholding) are included with the net realized and unrealized gain or loss from investments in the Statement of Operations. Reported net realized foreign currency gains or losses arise from (1) sales of foreign currencies, (2) currency gains or losses realized between the trade and settlement dates on securities transactions, and (3) the difference between the amounts of dividends, interest, and foreign withholding taxes recorded on the Fund’s books and the U.S. dollar equivalent of the amounts actually received or paid. Net unrealized foreign currency gains and losses arise from changes in the fair values of assets and liabilities, other than investments in securities at fiscal period end, resulting from changes in exchange rates. The Fund may invest in foreign securities, which may be subject to foreign taxes on income, gains on investments or currency repatriation, a portion of which may be recoverable. Foreign taxes, if any, are recorded based on the tax regulations and rates that exist in the foreign markets in which the Fund invests and are shown in the Statement of Operations. |
| J. | Master Limited Partnerships - The Fund invests in Master Limited Partnerships (“MLPs”). MLPs are publicly traded partnerships and limited liability companies taxed as partnerships under the Internal Revenue Code of 1986, as amended (the “Internal Revenue Code”). The Fund invests in MLPs engaged in, among other things, the transportation, storage, processing, refining, marketing, exploration, production and mining of minerals and |
35 INVESCO OPPENHEIMER CAPITAL APPRECIATION FUND
NOTES TO FINANCIAL STATEMENTSContinued
| | natural resources. The Fund is a partner in each MLP; accordingly, the Fund is required to take into account the Fund’s allocable share of income, gains, losses, deductions, expenses, and tax credits recognized by each MLP. |
| | MLP’s may be less liquid and subject to more abrupt or erratic price movements than conventional publicly traded securities. |
Note 2 – Advisory Fees and Other Fees Paid to Affiliates
The Trust has entered into a master investment advisory agreement with Invesco Advisers, Inc. (the “Adviser” or “Invesco”). Under the terms of the investment advisory agreement, the Fund accrues daily and pays monthly an advisory fee to the Adviser based on the annual rate of the Fund’s average daily net assets as follows:
| | | | |
| Fee Schedule* | | | |
| Up to $200 million | | | 0.75 | % |
| Next $200 million | | | 0.72 | |
| Next $200 million | | | 0.69 | |
| Next $200 million | | | 0.66 | |
| Next $700 million | | | 0.60 | |
| Next $1 billion | | | 0.58 | |
| Next $2 billion | | | 0.56 | |
| Next $2 billion | | | 0.54 | |
| Next $2 billion | | | 0.52 | |
| Next $2.5 billion | | | 0.50 | |
| Over $11 billion | | | 0.48 | |
*The advisory fee paid by the Fund shall be reduced by any amounts paid by the Fund under the administrative services agreement with the Adviser.
For the yearended August 31, 2019, the effective advisory fees incurred by the Fund was 0.60%.
From the beginning of the fiscal period until the date of the Reorganization, the Acquired Fund paid $18,652,347in advisory fees to OFI Global Asset Management, Inc. based on the annual rates above of the Acquired Fund’s average daily net assets.
Under the terms of a mastersub-advisory agreement between the Adviser and each of Invesco Asset Management Deutschland GmbH, Invesco Asset Management Limited, Invesco Asset Management (Japan) Limited, Invesco Hong Kong Limited, Invesco Senior Secured Management, Inc. and Invesco Canada Ltd. and separatesub-advisory agreements with Invesco Capital Management LLC, and Invesco Asset Management (India) Private Limited (collectively, the “AffiliatedSub-Advisers”) the Adviser, not the Fund, will pay 40% of the fees paid to the Adviser to any such AffiliatedSub-Adviser(s) that provide(s) discretionary investment management services to the Fund based on the percentage of assets allocated to suchSub-Adviser(s). Invesco has also entered into aSub-Advisory Agreement with OppenheimerFunds, Inc. to provide discretionary management services to the Funds.
Effective on the Reorganization Date, the Adviser has contractually agreed, through at least May 31, 2021, to waive advisory fees and/or reimburse expenses of all shares to the extent necessary to limit the total annual fund operating expenses after fee waiver and/or expense
36 INVESCO OPPENHEIMER CAPITAL APPRECIATION FUND
reimbursement (excluding certain items discussed below) ofClass A, Class C, Class R, Class Y, Class R5 and Class R6 shares to 1.05%, 1.80%, 1.30%, 0.80%, 0.68% and 0.63%,respectively, of the Fund’s average daily net assets (the “expense limits”). In determining the Adviser’s obligation to waive advisory fees and/or reimburse expenses, the following expenses are not taken into account, and could cause total annual fund operating expenses after fee waivers and/or expense reimbursement to exceed the numbers reflected above: (1) interest; (2) taxes; (3) dividend expenses on short sales; (4) extraordinary ornon-routine items, including litigation expenses; and (5) expenses that the Fund has incurred but did not actually pay because of an expense offset arrangement. Unless Invesco continues the fee waiver agreement, it will terminate May 31, 2021. During its term, the fee waiver agreement cannot be terminated or amended to increase the expense limits or reduce the advisory fee waiver without approval of the Board of Trustees.
Further, the Adviser has contractually agreed, through at least June 30, 2021, to waive the advisory fee payable by the Fund in an amount equal to 100% of the net advisory fees the Adviser receives from the affiliated money market funds on investments by the Fund of uninvested cash in such affiliated money market funds.
For the year ended August 31, 2019, the Adviser waived advisory fees of $52,138.
The Trust has entered into a master administrative services agreement with Invesco pursuant to which the Fund has agreed to pay Invesco for certain administrative costs incurred in providing accounting services to the Fund. For the yearended August 31, 2019, expenses incurred under the agreement are shown in the Statement of Operations as Administration fees. Additionally, Invesco has entered into service agreements whereby JPMorgan Chase Bank serves as custodian to the Fund. Prior to the Reorganization, the Acquired Fund paid administrative fees to OFI Global Asset Management, Inc.
The Trust has entered into a transfer agency and service agreement with Invesco Investment Services, Inc. (“IIS”) pursuant to which the Fund has agreed to pay IIS a fee for providing transfer agency and shareholder services to the Fund and reimburse IIS for certain expenses incurred by IIS in the course of providing such services. IIS may make payments to intermediaries that provide omnibus account services,sub-accounting services and/or networking services. All fees payable by IIS to intermediaries that provide omnibus account services orsub-accounting services are charged back to the Fund, subject to certain limitations approved by the Trust’s Board of Trustees. Prior to the Reorganization, the Acquired Fund paid transfer agent fees to OFI Global Asset Management, Inc. and Shareholder Services, Inc. For the yearended August 31, 2019, expenses incurred under these agreements are shown in the Statement of Operations as Transfer and shareholder servicing agent fees.
The Trust has entered into master distribution agreements with Invesco Distributors, Inc. (“IDI”) to serve as the distributor for theClass A, Class C, Class R, Class Y, Class R5 and Class R6 shares of the Fund. The Trust has adopted plans pursuant to Rule12b-1 under the 1940 Act with respect to the Fund’s Class A, Class C and Class R shares(collectively the “Plan”). The Fund, pursuant to the Class A Plan, reimbursed IDI in an amount up to an annual rate of 0.25% of the average daily net assets of Class A shares. The Fund pursuant to the Class C and Class R Plan, pays IDI compensation at the annual rate of 1.00% of the average daily net assets of Class C and 0.50% of the average daily net assets of Class R shares. The fees are
37 INVESCO OPPENHEIMER CAPITAL APPRECIATION FUND
NOTES TO FINANCIAL STATEMENTSContinued
accrued daily and paid monthly. Of the Plan payments, up to 0.25% of the average daily net assets of each class of shares may be paid to furnish continuing personal shareholder services to customers who purchase and own shares of such classes. Any amounts not paid as a service fee under the Plan would constitute an asset-based sales charge. Rules of the Financial Industry Regulatory Authority (“FINRA”) impose a cap on the total sales charges, including asset-based sales charges, that may be paid by any class of shares of the Fund plans. Prior to the Reorganization, the Acquired Fund paid distribution fees to OppenheimerFunds Distributor, Inc. For the yearended August 31, 2019, expenses incurred under the plans are shown in the Statement of Operations as Distribution and service plan fees.
Front-end sales commissions and CDSC (collectively, the “sales charges”) are not recorded as expenses of the Fund.Front-end sales commissions are deducted from proceeds from the sales of Fund shares prior to investment in Class A shares of the Fund. CDSC are deducted from redemption proceeds prior to remittance to the shareholder. During the year ended August 31, 2019, IDI advised the Fund that IDI retained $84,390 infront-end sales commissions from the sale of Class A shares and $352 and $3,921 from Class A and Class C shares, respectively, for CDSC imposed on redemptions by shareholders. From the beginning of the fiscal year to the date of the Reorganization, OppenheimerFunds Distributor, Inc. retained $439,409 in front–end sales commissions from the sale of Class A shares and $1,610 and $10,766 from Class A and Class C shares, respectively, for CDSC imposed on redemption by shareholders.
Certain officers and trustees of the Trust are officers and directors of the Adviser, IIS and/or IDI.
Note 3 – Additional Valuation Information
GAAP defines fair value as the price that would be received to sell an asset or paid to transfer a liability in an orderly transaction between market participants at the measurement date, under current market conditions. GAAP establishes a hierarchy that prioritizes the inputs to valuation methods, giving the highest priority to readily available unadjusted quoted prices in an active market for identical assets (Level 1) and the lowest priority to significant unobservable inputs (Level 3), generally when market prices are not readily available or are unreliable. Based on the valuation inputs, the securities or other investments are tiered into one of three levels. Changes in valuation methods may result in transfers in or out of an investment’s assigned level:
Level 1 — Prices are determined using quoted prices in an active market for identical assets.
Level 2 — Prices are determined using other significant observable inputs. Observable inputs are inputs that other market participants may use in pricing a security. These may include quoted prices for similar securities, interest rates, prepayment speeds, credit risk, yield curves, loss severities, default rates, discount rates, volatilities and others.
Level 3 — Prices are determined using significant unobservable inputs. In situations where quoted prices or observable inputs are unavailable (for example, when there is little or no market activity for an investment at the end of the period), unobservable inputs may be
38 INVESCO OPPENHEIMER CAPITAL APPRECIATION FUND
used. Unobservable inputs reflect the Fund’s own assumptions about the factors market participants would use in determining fair value of the securities or instruments and would be based on the best available information.
The following is a summary of the tiered valuation input levels, as of August 31, 2019. The level assigned to the securities valuations may not be an indication of the risk or liquidity associated with investing in those securities. Because of the inherent uncertainties of valuation, the values reflected in the financial statements may materially differ from the value received upon actual sale of those investments.
| | | | | | | | | | | | | | | | |
| | | Level 1—
Unadjusted
Quoted Prices | | | Level 2—
Other Significant
Observable Inputs | | | Level 3—
Significant
Unobservable
Inputs | | | Value | |
| Assets Table | | | | | | | | | | | | | | | | |
| Investments, at Value: | | | | | | | | | | | | | | | | |
| Common Stocks | | | | | | | | | | | | | | | | |
Consumer Discretionary | | $ | 1,430,229,488 | | | $ | 139,890,034 | | | $ | — | | | $ | 1,570,119,522 | |
Consumer Staples | | | 127,610,001 | | | | — | | | | — | | | | 127,610,001 | |
Energy | | | 47,174,053 | | | | — | | | | — | | | | 47,174,053 | |
Financials | | | 144,692,400 | | | | 14,736,343 | | | | — | | | | 159,428,743 | |
Health Care | | | 463,235,358 | | | | 7,752,759 | | | | — | | | | 470,988,117 | |
Industrials | | | 364,847,138 | | | | 51,820,892 | | | | — | | | | 416,668,030 | |
Information Technology | | | 1,145,930,258 | | | | — | | | | — | | | | 1,145,930,258 | |
Materials | | | 39,530,767 | | | | — | | | | — | | | | 39,530,767 | |
| Investment Company | | | 3,486,118 | | | | — | | | | — | | | | 3,486,118 | |
| | | | |
| Total Assets | | $ | 3,766,735,581 | | | $ | 214,200,028 | | | $ | — | | | $ | 3,980,935,609 | |
| | | | |
Forward currency exchange contracts and futures contracts, if any, are reported at their unrealized appreciation/depreciation at measurement date, which represents the change in the contract’s value from trade date. All additional assets and liabilities included in the above table are reported at their market value at measurement date.
Note 4 – Security Transactions with Affiliated Funds
The Fund is permitted to purchase or sell securities from or to certain other Invesco Funds under specified conditions outlined in procedures adopted by the Board of Trustees of the Trust. The procedures have been designed to ensure that any purchase or sale of securities by the Fund from or to another fund or portfolio that is or could be considered an affiliate by virtue of having a common investment adviser (or affiliated investment advisers), common Trustees and/or common officers complies with Rule17a-7 of the 1940 Act. Further, as defined under the procedures, each transaction is effected at the current market price. Pursuant to these procedures for the period September 1, 2018 to May 24, 2019,the Predecessor Fund engaged in transactions with affiliates as listed: Securities purchases of $28,427,347 and securities sales of $3,373,692, which resulted in net realized gainsof $1,276,681. For the period May 25, 2019 to August 31, 2019, the Fund engaged in transactions with affiliates as listed: Securities purchases of $56,111,384
39 INVESCO OPPENHEIMER CAPITAL APPRECIATION FUND
NOTES TO FINANCIAL STATEMENTSContinued
Note 5 – Expense Offset Arrangements
The expense offset arrangement is comprised of custodian credits which result from periodic overnight cash balances at the custodian. For theyearended August 31, 2019, the Fund received credits from this arrangement, which resulted in the reduction of the Fund’s total expenses of $32,649.
Note 6 – Trustee and Officer Fees and Benefits
The Fund has adopted an unfunded retirement plan (the “Plan”) for the Fund’s Independent Trustees. Benefits are based on years of service and fees paid to each Trustee during their period of service. The Plan was frozen with respect to adding new participants effective December 31, 2006 (the “Freeze Date”) and existing Plan Participants as of the Freeze Date will continue to receive accrued benefits under the Plan. Active Independent Trustees as of the Freeze Date have each elected a distribution method with respect to their benefits under the Plan.
During the reporting period, the Fund’s projected benefit obligations, payments to retired Trustees and accumulated liability were as follows:
| | | | |
| Projected Benefit Obligations Increased | | $ | — | |
| Payments Made to Retired Trustees | | | 31,173 | |
| Accumulated Liability as of August 31, 2019 | | | 547,892 | |
Certain trustees have executed a Deferred Compensation Agreement pursuant to which they have the option to elect to defer receipt of all or a portion of the annual compensation they are entitled to receive from the Fund. For purposes of determining the amount owed to the Trustee under the plan, deferred amounts are treated as though equal dollar amounts had been invested in shares of the Fund or in other Invesco and/or Invesco Oppenheimer funds selected by the Trustee. The Fund purchases shares of the funds selected for deferral by the Trustee in amounts equal to his or her deemed investment, resulting in a Fund asset equal to the deferred compensation liability. Such assets are included as a component of “Other” within the asset section of the Statement of Assets and Liabilities. Deferral of Trustees’ fees under the plan will not affect the net assets of the Fund and will not materially affect the Fund’s assets, liabilities or net investment income per share. Amounts will be deferred until distributed in accordance with the compensation deferral plan.
Note 7 – Cash Balances
The Fund is permitted to temporarily carry a negative or overdrawn balance in its account with
40 INVESCO OPPENHEIMER CAPITAL APPRECIATION FUND
JPMorgan Chase Bank, the custodian bank. Such balances, if any atperiod-end, are shown in the Statement of Assets and Liabilities under the payable caption Amount due custodian. To compensate the custodian bank for such overdrafts, the overdrawn Fund may either (1) leave funds as a compensating balance in the account so the custodian bank can be compensated by earning the additional interest; or (2) compensate by paying the custodian bank at a rate agreed upon by the custodian bank and Invesco, not to exceed the contractually agreed upon rate.
Note 8 – Investment Transactions
The aggregate amount of investment securities (other than short-term securities, U.S. Treasury obligations and money market funds, if any) purchased and sold by the Fund during the yearended August 31, 2019 was $2,688,864,713 and $4,016,412,883, respectively. Cost of investments, including any derivatives, on a tax basis includes the adjustments for financial reporting purposes as of the most recently completed federal income tax reportingperiod-end.
Note 9 – Share Information
Transactions in shares of beneficial interest were as follows:
| | | | | | | | | | | | | | | | | | | | |
| | | Year Ended August 31, 2019 | | | | | | Year Ended August 31, 2018 | |
| | | Shares | | | Amount | | | | | | Shares | | | Amount | |
| Class A | | | | | | | | | | | | | | | | | | | | |
| Sold | | | 5,618,810 | | | $ | 338,399,644 | | | | | | | | 3,127,997 | | | $ | 190,995,806 | |
| Dividends and/or distributions reinvested | | | 4,548,104 | | | | 243,823,507 | | | | | | | | 4,872,258 | | | | 283,662,873 | |
| Redeemed | | | (7,782,718 | ) | | | (461,404,290 | ) | | | | | | | (7,780,948 | ) | | | (474,287,536 | ) |
| | | | | | | | | | | | | | | | | | | | |
| Net increase (decrease) | | | 2,384,196 | | | $ | 120,818,861 | | | | | | | | 219,307 | | | $ | 371,143 | |
| | | | | | | | | | | | | | | | | | | | |
| | | | | | | | | | | | | | | | | | | | | |
| Class B | | | | | | | | | | | | | | | | | | | | |
| Sold | | | — | | | $ | — | | | | | | | | 1,839 | | | $ | 86,908 | |
| Dividends and/or distributions reinvested | | | — | | | | — | | | | | | | | 27,203 | | | | 1,208,897 | |
| Redeemed1 | | | — | | | | — | | | | | | | | (436,004 | ) | | | (20,256,655 | ) |
| | | | | | | | | | | | | | | | | | | | |
| Net increase (decrease) | | | — | | | $ | — | | | | | | | | (406,962 | ) | | $ | (18,960,850 | ) |
| | | | | | | | | | | | | | | | | | | | |
| | | | | | | | | | | | | | | | | | | | | |
| Class C | | | | | | | | | | | | | | | | | | | | |
| Sold | | | 912,330 | | | $ | 39,038,118 | | | | | | | | 907,781 | | | $ | 42,117,915 | |
| Dividends and/or distributions reinvested | | | 948,556 | | | | 37,060,086 | | | | | | | | 957,203 | | | | 42,145,661 | |
| Redeemed | | | (5,574,581 | ) | | | (245,533,477 | ) | | | | | | | (1,768,657 | ) | | | (82,200,539 | ) |
| | | | | | | | | | | | | | | | | | | | |
| Net increase (decrease) | | | (3,713,695 | ) | | $ | (169,435,273 | ) | | | | | | | 96,327 | | | $ | 2,063,037 | |
| | | | | | | | | | | | | | | | | | | | |
41 INVESCO OPPENHEIMER CAPITAL APPRECIATION FUND
NOTES TO FINANCIAL STATEMENTSContinued
| | | | | | | | | | | | | | | | | | | | |
| | | Year Ended August 31, 2019 | | | | | | Year Ended August 31, 2018 | |
| | | Shares | | | Amount | | | | | | Shares | | | Amount | |
| Class R | | | | | | | | | | | | | | | | | | | | |
| Sold | | | 411,414 | | | $ | 22,912,188 | | | | | | | | 363,207 | | | $ | 20,969,561 | |
| Dividends and/or distributions reinvested | | | 166,430 | | | | 8,353,141 | | | | | | | | 160,529 | | | | 8,819,470 | |
| Redeemed | | | (390,045 | ) | | | (21,662,166 | ) | | | | | | | (338,517 | ) | | | (19,549,401 | ) |
| | | | | | | | | | | | | | | | | | | | |
| Net increase (decrease) | | | 187,799 | | | $ | 9,603,163 | | | | | | | | 185,219 | | | $ | 10,239,630 | |
| | | | | | | | | | | | | | | | | | | | |
| | | | | | | | | | | | | | | | | | | | | |
| Class Y | | | | | | | | | | | | | | | | | | | | |
| Sold | | | 547,310 | | | $ | 35,925,762 | | | | | | | | 790,136 | | | $ | 51,929,057 | |
| Dividends and/or distributions reinvested | | | 112,640 | | | | 6,580,415 | | | | | | | | 190,858 | | | | 12,006,908 | |
| Redeemed | | | (874,285 | ) | | | (55,593,924 | ) | | | | | | | (1,688,024 | ) | | | (114,274,037 | ) |
| | | | | | | | | | | | | | | | | | | | |
| Net increase (decrease) | | | (214,335 | ) | | $ | (13,087,747 | ) | | | | | | | (707,030 | ) | | $ | (50,338,072 | ) |
| | | | | | | | | | | | | | | | | | | | |
| | | | | | | | | | | | | | | | | | | | | |
| Class R52 | | | | | | | | | | | | | | | | | | | | |
| Sold | | | 170 | | | $ | 10,000 | | | | | | | | — | | | $ | — | |
| Dividends and/or distributions reinvested | | | — | | | | — | | | | | | | | — | | | | — | |
| Redeemed | | | — | | | | — | | | | | | | | — | | | | — | |
| | | | | | | | | | | | | | | | | | | | |
| Net increase (decrease) | | | 170 | | | $ | 10,000 | | | | | | | | — | | | $ | — | |
| | | | | | | | | | | | | | | | | | | | |
| | | | | | | | | | | | | | | | | | | | | |
| Class R6 | | | | | | | | | | | | | | | | | | | | |
| Sold | | | 210,393 | | | $ | 13,504,655 | | | | | | | | 696,977 | | | $ | 46,045,355 | |
| Dividends and/or distributions reinvested | | | 462,953 | | | | 27,142,957 | | | | | | | | 1,554,848 | | | | 98,157,545 | |
| Redeemed | | | (15,570,886 | ) | | | (997,561,269 | ) | | | | | | | (4,720,284 | ) | | | (309,973,637 | ) |
| | | | | | | | | | | | | | | | | | | | |
| Net increase (decrease) | | | (14,897,540 | ) | | $ | (956,913,657 | ) | | | | | | | (2,468,459 | ) | | $ | (165,770,737 | ) |
| | | | | | | | | | | | | | | | | | | | |
1. All outstanding Class B shares converted to Class A shares on June 1, 2018.
2. Commencement date after the close of business on May 24, 2019.
Note 10 – Borrowings
Joint Credit Facility. A number of mutual funds managed by the Adviser participate in a $1.95 billion revolving credit facility (the “Facility”) intended to provide short-term financing, if necessary, subject to certain restrictions in connection with atypical redemption activity. Expenses and fees related to the Facility are paid by the participating funds and are disclosed separately or as other expenses on the Statement of Operations. The Fund did not utilize the Facility during the reporting period.The Facility terminated May 24, 2019.
42 INVESCO OPPENHEIMER CAPITAL APPRECIATION FUND
REPORT OF INDEPENDENT REGISTERED PUBLIC ACCOUNTING FIRM
To the Board of Trustees of AIM Counselor Series Trust (Invesco Counselor Series Trust) and Shareholders of Invesco Oppenheimer Capital Appreciation Fund
Opinion on the Financial Statements
We have audited the accompanying statement of assets and liabilities, including the schedule of investments, of Invesco Oppenheimer Capital Appreciation Fund (one of the funds constituting AIM Counselor Series Trust (Invesco Counselor Series Trust), referred to hereafter as the “Fund”) as of August 31, 2019, the related statement of operations and the statement of changes in net assets for the year ended August 31, 2019, including the related notes, and the financial highlights for each of the periods ended August 31, 2019 (collectively referred to as the “financial statements”). In our opinion, the financial statements present fairly, in all material respects, the financial position of the Fund as of August 31, 2019, the results of its operations and changes in its net assets for the year ended August 31, 2019 and the financial highlights for each of the periods ended August 31, 2019 in conformity with accounting principles generally accepted in the United States of America.
The financial statements of Invesco Oppenheimer Capital Appreciation Fund (formerly known as Oppenheimer Capital Appreciation Fund) as of and for the year ended August 31, 2018 and the financial highlights for each of the periods ended on or prior to August 31, 2018 (not presented herein, other than the statement of changes in net assets and the financial highlights) were audited by other auditors whose report dated October 25, 2018 expressed an unqualified opinion on those financial statements and financial highlights.
Basis for Opinion
These financial statements are the responsibility of the Fund’s management. Our responsibility is to express an opinion on the Fund’s financial statements based on our audit. We are a public accounting firm registered with the Public Company Accounting Oversight Board (United States) (PCAOB) and are required to be independent with respect to the Fund in accordance with the U.S. federal securities laws and the applicable rules and regulations of the Securities and Exchange Commission and the PCAOB.
We conducted our audit of these financial statements in accordance with the standards of the PCAOB. Those standards require that we plan and perform the audit to obtain reasonable assurance about whether the financial statements are free of material misstatement, whether due to error or fraud.
Our audit included performing procedures to assess the risks of material misstatement of the financial statements, whether due to error or fraud, and performing procedures that respond to those risks. Such procedures included examining, on a test basis, evidence regarding the amounts and disclosures in the financial statements. Our audit also included evaluating the accounting principles used and significant estimates made by management, as well as evaluating the overall presentation of the financial statements. Our procedures included confirmation of securities owned as of August 31, 2019 by correspondence with the custodian, transfer agent and brokers; when replies were not received from brokers, we performed other auditing procedures. We believe that our audit provides a reasonable basis for our opinion.
/s/PricewaterhouseCoopers LLP
Houston, TX
October 29, 2019
We have served as the auditor of one or more investment companies in the Invesco group of investment companies since at least 1995. We have not been able to determine the specific year we began serving as auditor.
43 INVESCO OPPENHEIMER CAPITAL APPRECIATION FUND
INDEPENDENT REGISTERED PUBLIC ACCOUNTING FIRM
The Audit Committee of the Board of Trustees appointed, and the Board of Trustees ratified and approved, PricewaterhouseCoopers LLP (“PwC”) as the independent registered public accounting firm of the Fund for the fiscal periods ending after May 24, 2019. Prior to the close of business on May 24, 2019, the Predecessor Fund was a separate series of an unaffiliated investment company and its financial statements were audited by a different independent registered public accounting firm (the “Prior Auditor”).
Effective after the close of business on May 24, 2019, the Prior Auditor resigned as the independent registered public accounting firm of the Fund. The Prior Auditor’s report on the financial statements of the Predecessor Fund for the past two fiscal years did not contain an adverse or disclaimer of opinion, and was not qualified or modified as to uncertainty, audit scope or accounting principles. During the Predecessor Fund’s two most recent fiscal years and through the close of business on May 24, 2019, there were no (1) disagreements with the Prior Auditor on any matter of accounting principles or practices, financial statement disclosure, or auditing scope or procedure, which disagreements, if not resolved to the Prior Auditor’s satisfaction, would have caused it to make reference to that matter in connection with its report; or (2) “reportable events,” as that term is defined in Item 304(a)(1)(v) of RegulationS-K under the Securities Exchange Act of 1934.
44 INVESCO OPPENHEIMER CAPITAL APPRECIATION FUND
FEDERAL INCOME TAX INFORMATIONUnaudited
In early 2019, if applicable, shareholders of record received information regarding all dividends and distributions paid to them by the Fund during calendar year 2018.
Capital gain distributions of $4.20068 per share were paid to Class A, Class C, Class R, Class Y and Class R6 shareholders, respectively, on December 13, 2018. Whether received in stock or in cash, the capital gain distribution should be treated by shareholders as a gain from the sale of the capital assets held for more than one year (long-term capital gains).
Dividends, if any, paid by the Fund during the reporting period which are not designated as capital gain distributions should be multiplied by the maximum amount allowable but not less than 100% to arrive at the amount eligible for the corporate dividend-received deduction.
A portion, if any, of the dividends paid by the Fund during the reporting period which are not designated as capital gain distributions are eligible for lower individual income tax rates to the extent that the Fund has received qualified dividend income as stipulated by recent tax legislation. The maximum amount allowable but not less than $38,209,548 of the Fund’s fiscal year taxable income may be eligible for the lower individual income tax rates. In early 2019, shareholders of record received information regarding the percentage of distributions that are eligible for lower individual income tax rates.
Recent tax legislation allows a regulated investment company to designate distributions not designated as capital gain distributions, as either interest related dividends or short-term capital gain dividends, both of which are exempt from the U.S. withholding tax applicable to non U.S. taxpayers. For the reporting period, the maximum amount allowable but not less than $0 of the ordinary distributions to be paid by the Fund qualifies as an interest related dividend and the maximum amount allowable but not less than $915,145 of the short-term capital gain distribution to be paid by the Fund qualifies as a short-term capital gain dividend.
The foregoing information is presented to assist shareholders in reporting distributions received from the Fund to the Internal Revenue Service. Because of the complexity of the federal regulations which may affect your individual tax return and the many variations in state and local tax regulations, we recommend that you consult your tax advisor for specific guidance.
45 INVESCO OPPENHEIMER CAPITAL APPRECIATION FUND
APPROVAL OF INVESTMENT ADVISORY ANDSUB-ADVISORY CONTRACTSUnaudited
At meetings held on December 14, 2018, the Board of Trustees (the Board or the Trustees) of AIM Counselor Series Trust (Invesco Counselor Series Trust) (the Trust) as a whole, and the independent Trustees, who comprise over 75% of the Board, voting separately, approved (i) an amendment to the Trust’s Master Investment Advisory Agreement with Invesco Advisers, Inc. (Invesco Advisers and the investment advisory agreement) to add Invesco Oppenheimer Capital Appreciation Fund (the Fund), (ii) an amendment to the Master IntergroupSub-Advisory Contract for Mutual Funds with Invesco Asset Management Deutschland GmbH, Invesco Asset Management Limited, Invesco Asset Management (Japan) Limited, Invesco Hong Kong Limited, Invesco Senior Secured Management, Inc. and Invesco Canada Ltd. to add the Fund, (iii) an amendment to the separatesub-advisory contract with Invesco Capital Management LLC to add the Fund, (iv) an amendment to the separatesub-advisory contract with Invesco Asset Management (India) Private Limited to add the Fund, and (v) an initialsub-advisory contract with OppenheimerFunds, Inc. (collectively, the AffiliatedSub-Advisers and thesub-advisory contracts). Additionally, on March 26, 2019, the Boardre-approved an initialsub-advisory contract with OppenheimerFunds, Inc. following its change of control as a result of the acquisition of OppenheimerFunds, Inc. and its subsidiaries, including the Oppenheimer mutual funds (each, an Oppenheimer Fund), by Invesco Ltd. (the OFI Transaction). After evaluating the factors discussed below, among others, the Board approved the Fund’s investment advisory agreement and thesub-advisory contracts and determined that the compensation payable by the Fund to Invesco Advisers and by Invesco Advisers to the AffiliatedSub-Advisers is fair and reasonable.
The Board’s Evaluation Process
The Board noted that it had previously approved establishing the Fund at the Board meeting held on October 23, 2018 and that the Fund was formed to acquire the assets and liabilities of an Oppenheimer Fund (the Acquired Fund) with the same investment objective and substantially similar principal investment strategies and risks. At the time of approval, the Fund had no assets and no performance history and the portfolio managers were not employed by Invesco Advisers or any of the AffiliatedSub-Advisers except OppenheimerFunds, Inc., which was not affiliated with Invesco at that time.
In approving the investment advisory agreement andsub-advisory contracts, the Board followed a process similar to the process that it follows in annually reviewing and approving investment advisory agreements andsub-advisory contracts for the series portfolios of funds advised by Invesco Advisers and considered the information provided in the most recent annual review process for those funds as well as the information provided with respect to the Fund. As part of the approval process, the Board reviewed and considered information provided in response to detailed requests for information submitted to management by the independent Trustees with assistance from legal counsel to the independent Trustees. The Board reviewed comparative investment performance and fee data prepared by Invesco Advisers and an independent mutual fund data provider. The Board was assisted in its review by the Senior Officer, an officer of the Invesco Funds who reports directly to the independent Trustees, and by independent legal counsel.
46 INVESCO OPPENHEIMER CAPITAL APPRECIATION FUND
The discussion below serves as a summary of the material factors and related conclusions that formed the basis for the Board’s approval of the Fund’s investment advisory agreement andsub-advisory contracts. The Trustees’ review and conclusions are based on the comprehensive consideration of all information presented to them and are not the result of any single determinative factor. Moreover, one Trustee may have weighed a particular piece of information or factor differently than another Trustee. This information is current as of December 14, 2018 and March 26, 2019 for thesub-advisory contract with OppenheimerFunds, Inc.
Factors and Conclusions and Summary of Independent Written Fee Evaluation
A. Nature, Extent and Quality of Services Provided by Invesco Advisers and the AffiliatedSub-Advisers
The Board reviewed the nature, extent and quality of the advisory services to be provided to the Fund by Invesco Advisers under the Fund’s investment advisory agreement, and the credentials and experience of the officers and employees of Invesco Advisers who will provide these services. The Board’s review included consideration of the investment process oversight and structure, credit analysis and investment risk management to be employed in providing advisory services to the Fund. The Board also considerednon-advisory services that Invesco Advisers and its affiliates provide to the Invesco Funds and will provide to the Fund, such as various back office support functions, third party oversight, internal audit, valuation, portfolio trading and legal and compliance. The Board also received and reviewed information about Invesco Advisers’ role as administrator of the Invesco Funds’ liquidity risk management program. The Board also reviewed and considered the benefits to shareholders of investing in a fund that is part of the Invesco family of funds under the umbrella of Invesco Ltd., Invesco Advisers’ parent company, and noted Invesco Ltd.’s depth and experience in conducting an investment management business, as well as its commitment of financial and other resources to such business. The Board reviewed and considered information about the resources that Invesco Advisers intends to continue to commit to managing the Invesco family of funds, including the Fund, following the OFI Transaction. The Board concluded that the nature, extent and quality of the services to be provided to the Fund by Invesco Advisers are appropriate and satisfactory.
The Board reviewed the services that may be provided by the AffiliatedSub-Advisers under thesub-advisory contracts and the credentials and experience of the officers and employees of the AffiliatedSub-Advisers who provide these services. The Board noted the AffiliatedSub-Advisers’ expertise with respect to certain asset classes and that the AffiliatedSub-Advisers have offices and personnel that are located in financial centers around the world. As a result, the Board noted that the AffiliatedSub-Advisers can provide research and investment analysis on the markets and economies of various countries in which the Fund may invest, make recommendations regarding securities and assist with security trades. The Board concluded that thesub-advisory contracts may benefit the Fund and its shareholders by permitting Invesco Advisers to use the resources and talents of the AffiliatedSub-Advisers
47 INVESCO OPPENHEIMER CAPITAL APPRECIATION FUND
APPROVAL OF INVESTMENT ADVISORY ANDSUB-ADVISORY CONTRACTSUnaudited / Continued
in managing the Fund. The Board concluded that the nature, extent and quality of the services that may be provided by the AffiliatedSub-Advisers are appropriate and satisfactory.
B. Fund Investment Performance
The Board noted that the Fund would continue the historical performance information of the Acquired Fund following the consummation of the OFI Transaction. The Board considered the performance of the Acquired Fund and the fact that, at the closing of the OFI Transaction, management anticipates that the Fund will be managed pursuant to substantially similar investment strategies and by substantially the same portfolio management team as managed the Acquired Fund. The Board did not view Fund performance as a relevant factor in considering whether to approve thesub-advisory contracts for the Fund, as no Affiliated Sub- Adviser currently manages assets of the Fund.
The Board compared the Fund’s investment performance over multiple time periods ending December 31, 2017 to the performance of funds in the Morningstar performance universe and against the Fund’s benchmark index. The Trustees also reviewed more recent Fund performance and this review did not change their conclusions.
C. Advisory andSub-Advisory Fees and Fund Expenses
The Board compared the Fund’s contractual management fee rate to the contractual management fee rates of funds in the Fund’s Morningstar expense group. The Board also considered comparative information regarding the Fund’s total expense ratio and its various components.
The Board noted that Invesco Advisers has contractually agreed to waive fees and/or limit expenses of the Fund for at least two years from the closing date of the OFI Transaction in an amount necessary to limit total annual operating expenses to a specified percentage of average daily net assets for each class of the Fund.
The Board also considered the fees charged by Invesco Advisers and the Affiliated Sub- Advisers to other similarly managed client accounts. The Board noted that Invesco Advisers or the AffiliatedSub-Advisers may charge lower fees to large institutional clients. Invesco Advisers reviewed with the Board differences in the scope of services it provides to the Invesco Funds relative to certain other types of client accounts, including management of cash flows as a result of redemptions and purchases, necessary infrastructure such as officers, office space, technology, legal and distribution, oversight of service providers, costs and business risks associated with launching new funds and sponsoring and maintaining the product line, preparation of annual registration statement updates and financial information and compliance with federal and state laws and regulations.
The Board also considered the services that may be provided by the AffiliatedSub-Advisers pursuant to thesub-advisory contracts, as well as the fees payable by Invesco Advisers to the AffiliatedSub-Advisers pursuant to thesub-advisory contracts.
48 INVESCO OPPENHEIMER CAPITAL APPRECIATION FUND
D. Economies of Scale and Breakpoints
The Board considered the extent to which there may be economies of scale in the provision of advisory services to the Fund. The Board considered Invesco’s reinvestment in its business, including investments in business infrastructure and cybersecurity. The Board also considered that the Fund may benefit from economies of scale through contractual breakpoints in the Fund’s advisory fee schedule, which generally operate to reduce the Fund’s expense ratio as it grows in size. The Board noted that the Fund will share directly in economies of scale through lower fees charged by third party service providers based on the combined size of the Invesco Funds. The Board noted that the Fund may also benefit from economies of scale through initial fee setting, fee waivers and expense reimbursements.
E. Profitability and Financial Resources
The Board reviewed information from the 2018 contract renewal process provided by Invesco Advisers concerning the costs of the advisory and other services that Invesco Advisers and its affiliates provide to the Invesco Funds and the profitability of Invesco Advisers and its affiliates in providing these services. The Board considered the methodology used for calculating profitability and noted the periodic review of such methodology by an independent consultant. The Board noted that Invesco Advisers will continue to operate at a net profit from services Invesco Advisers and its affiliates provide to the Invesco Funds. The Board did not deem the level of profits realized by Invesco Advisers and its affiliates from providing services to the Invesco Funds, and the profits estimated to be realized by the Fund, to be excessive given the nature, extent and quality of the services provided. The Board received information from Invesco Advisers demonstrating that Invesco Advisers and the AffiliatedSub-Advisers are financially sound and have the resources necessary to perform their obligations under the investment advisory agreement andsub-advisory contracts.
F. Collateral Benefits to Invesco Advisers and its Affiliates
The Board considered various other benefits to be received by Invesco Advisers and its affiliates from the relationship with the Fund, including the fees to be received for providing administrative, transfer agency and distribution services to the Fund. The Board considered the performance of Invesco Advisers and its affiliates in providing these services to other Invesco Funds and the organizational structure employed to provide these services. The Board also considered that these services will be provided to the Fund pursuant to written contracts that are reviewed and approved on an annual basis by the Board; and that the services are required for the operation of the Fund.
The Board considered the benefits realized by Invesco Advisers and the Affiliated Sub- Advisers as a result of portfolio brokerage transactions executed through “soft dollar” arrangements. The Board noted that soft dollar arrangements may result in the Fund bearing costs to purchase research that may be used by Invesco Advisers or the AffiliatedSub-Advisers with other clients and may reduce Invesco Advisers’ or the AffiliatedSub-Advisers’
49 INVESCO OPPENHEIMER CAPITAL APPRECIATION FUND
APPROVAL OF INVESTMENT ADVISORY ANDSUB-ADVISORY CONTRACTSUnaudited / Continued
expenses. The Board also considered that it will receive periodic reports from Invesco representing that these arrangements are consistent with regulatory requirements. The Board did not deem the soft dollar arrangements to be inappropriate.
The Board considered that the Fund’s uninvested cash and cash collateral from any securities lending arrangements may be invested in money market funds advised by Invesco Advisers pursuant to procedures approved by the Board. The Board considered that Invesco Advisers will receive advisory fees from these affiliated money market funds attributable to such investments, although Invesco Advisers has contractually agreed to waive through varying periods the advisory fees payable by the Invesco Funds with respect to certain investments in the affiliated money market funds. The waiver is in an amount equal to 100% of the net advisory fee Invesco Advisers will receive from the affiliated money market funds with respect to the Fund’s investment in the affiliated money market funds of uninvested cash, but not cash collateral. The Board concluded that the amount of advisory fees to be received by Invesco Advisers from the Fund’s investment of cash collateral from any securities lending arrangements in the affiliated money market funds is fair and reasonable.
The Board also considered that an affiliated broker may receive commissions for executing certain trades for the Fund. Invesco Advisers and the AffiliatedSub-Advisers may use the affiliated broker to, among other things, control order routing and minimize information leakage, and the Board was advised that such trades will be executed in compliance with rules under the federal securities laws and consistent with best execution obligations.
50 INVESCO OPPENHEIMER CAPITAL APPRECIATION FUND
PORTFOLIO PROXY VOTING POLICIES AND GUIDELINES;
UPDATES TO SCHEDULE OF INVESTMENTSUnaudited
Go paperless with eDelivery
Visit invesco.com/edelivery to enjoy the convenience and security of anytime electronic access to your investment documents.
With eDelivery, you can elect to have any or all of the following materials delivered straight to your inbox to download, save and print from your own computer:
● Fund reports and prospectuses
● Quarterly statements
● Daily confirmations
● Tax forms
Invesco mailing information
Send general correspondence to Invesco Investment Services, Inc., P.O. Box 219078, Kansas City, MO 64121-9078.
Important notice regarding delivery of security holder documents
To reduce Fund expenses, only one copy of most shareholder documents may be mailed to shareholders with multiple accounts at the same address (Householding). Mailing of your shareholder documents may be householded indefinitely unless you instruct us otherwise. If you do not want the mailing of these documents to be combined with those for other members of your household, please contact Invesco Investment Services, Inc. at 800 959 4246 or contact your financial institution. We will begin sending you individual copies for each account within 30 days after receiving your request.
Fund holdings and proxy voting information
The Fund provides a complete list of its holdings four times in each fiscal year, at the quarter ends. For the second and fourth quarters, the lists appear in the Fund’s semiannual and annual reports to shareholders. For the first and third quarters, the Fund files the lists with the Securities and Exchange Commission (SEC) on FormN-PORT. The most recent list of portfolio holdings is available at invesco. com/completeqtrholdings. Shareholders can also look up the Fund’s FormsN-PORT on the SEC website at sec.gov.
A description of the policies and procedures that the Fund uses to determine how to vote proxies relating to portfolio securities is available without charge, upon request, from our Client Services department at 800 959 4246 or at invesco.com/proxyguidelines. The information is also available on the SEC website, sec.gov.
Information regarding how the Fund voted proxies related to its portfolio securities during the most recent12-month period ended June 30 is available at invesco.com/proxysearch. The information is also available on the SEC website, sec.gov.
Invesco Advisers, Inc. is an investment adviser; it provides investment advisory services to individual and institutional clients and does not sell securities. Invesco Distributors, Inc. is the US distributor for Invesco Ltd.’s retail mutual funds, exchange-traded funds and institutional money market funds. Both are wholly owned, indirect subsidiaries of Invesco Ltd.
51 INVESCO OPPENHEIMER CAPITAL APPRECIATION FUND
SHAREHOLDER PROXY Unaudited
A Special Meeting (“Meeting”) of Shareholders of Invesco Oppenheimer Capital Appreciation Fund was held on April 12, 2019. The Meeting was held for the following purpose:
(1) Approval of an Agreement and Plan of Reorganization that provides for the reorganization of Oppenheimer Capital Appreciation Fund into Invesco Oppenheimer Capital Appreciation Fund.
The results of the voting on the above matter was as follows:
| | | | | | | | | | | | | | | | |
| Matter | | Votes For | | | Votes Against | | | Votes Abstain | | | Broker
Non-Votes | |
| (1) Approval of an Agreement and Plan of Reorganization | | | 42,513,108 | | | | 2,885,494 | | | | 2,358,375 | | | | 0 | |
52 INVESCO OPPENHEIMER CAPITAL APPRECIATION FUND
TRUSTEES AND OFFICERS Unaudited
The address of each trustee and officer is AIM Counselor Series Trust (Invesco Counselor Series Trust) (the “Trust”), 11 Greenway Plaza, Suite 1000, Houston, Texas 77046-1173. The trustees serve for the life of the Trust, subject to their earlier death, incapacitation, resignation, retirement or removal as more specifically provided in the Trust’s organizational documents. Each officer serves for a one year term or until their successors are elected and qualified. Column two below includes length of time served with predecessor entities, if any.
| | | | | | | | |
Name, Year of Birth and Position(s) Held with the Trust | | Trustee
and/or
Officer
Since | | Principal Occupation(s) During Past 5 Years | | Number of Funds
in Fund Complex
Overseen by Trustee | | Other Directorship(s)
Held by Trustee During Past 5 Years |
INTERESTED PERSONS | | | | | | | | |
Martin L. Flanagan1— 1960 Trustee and Vice Chair | | 2007 | | Executive Director, Chief Executive Officer and President, Invesco Ltd. (ultimate parent of Invesco and a global investment management firm); Trustee and Vice Chair, The Invesco Funds; Vice Chair, Investment Company Institute; and Member of Executive Board, SMU Cox School of Business Formerly: Advisor to the Board, Invesco Advisers, Inc. (formerly known as Invesco Institutional (N.A.), Inc.); Chairman and Chief Executive Officer, Invesco Advisers, Inc. (registered investment adviser); Director, Chairman, Chief Executive Officer and President, Invesco Holding Company (US), Inc. (formerly IVZ Inc.) (holding company), Invesco Group Services, Inc. (service provider) and Invesco North American Holdings, Inc. (holding company); Director, Chief Executive Officer and President, Invesco Holding Company Limited (parent of Invesco and a global investment management firm); Director, Invesco Ltd.; Chairman, Investment Company Institute and President,Co-Chief Executive Officer,Co-President, Chief Operating Officer and Chief Financial Officer, Franklin Resources, Inc. (global investment management organization) | | 230 | | None |
Philip A. Taylor2— 1954 Trustee | | 2006 | | Vice Chair, Invesco Ltd.; Trustee, The Invesco Funds Formerly: Director, Invesco Canada Ltd. (formerly known as Invesco Trimark Ltd./ Invesco Trimark Ltèe) (registered investment adviser and registered transfer agent); Head of the Americas and Senior Managing Director, Invesco Ltd.; Director, Invesco Advisers, Inc. (formerly known as Invesco Institutional (N.A.), Inc.) (registered investment adviser); | | 230 | | None |
1 Mr. Flanagan is considered an interested person (within the meaning of Section 2(a)(19) of the 1940 Act) of the Trust because he is an officer of the Adviser to the Trust, and an officer and a director of Invesco Ltd., ultimate parent of the Adviser. |
| 2 Mr. Taylor is considered an interested person (within the meaning of Section 2(a)(19) of the 1940 Act) of the Trust because he is an officer of Invesco Ltd., ultimate parent of the Adviser. |
53 INVESCO OPPENHEIMER CAPITAL APPRECIATION FUND
TRUSTEES AND OFFICERSUnaudited / Continued
| | | | | | | | |
Name, Year of Birth and Position(s) Held with the Trust | | Trustee
and/or
Officer
Since | | Principal Occupation(s) During Past 5 Years | | Number of Funds in Fund Complex
Overseen by Trustee | | Other Directorship(s)
Held by Trustee
During Past 5 Years |
INTERESTED PERSONS (CONTINUED) | | | | | | | | |
| Philip A. Taylor (Continued) | | | | Director and Chairman, Invesco Investment Services, Inc. (formerly known as Invesco AIM Investment Services, Inc.) (registered transfer agent); Chief Executive Officer, Invesco Corporate Class Inc. (corporate mutual fund company); Chairman and Chief Executive Officer, Invesco Canada Ltd. (formerly known as Invesco Trimark Ltd./ Invesco Trimark Ltèe) (registered investment adviser and registered transfer agent); Senior Vice President, The Invesco Funds; Director, Invesco Investment Advisers LLC (formerly known as Van Kampen Asset Management); Director, Chairman, Chief Executive Officer and President, Invesco Management Group, Inc. (formerly known as Invesco AIM Management Group, Inc.) (financial services holding company);Co-Chairman,Co-President andCo-Chief Executive Officer, Invesco Advisers, Inc. (formerly known as Invesco Institutional (N.A.), Inc.) (registered investment adviser); Director, Chief Executive Officer and President, Van Kampen Exchange Corp; President and Principal Executive Officer, The Invesco Funds (other than AIM Treasurer’s Series Trust (Invesco Treasurer’s Series Trust), Short-Term Investments Trust and Invesco Management Trust); Executive Vice President, The Invesco Funds (AIM Treasurer’s Series Trust (Invesco Treasurer’s Series Trust), Short-Term Investments Trust and Invesco Management Trust only); Director and President, INVESCO Funds Group, Inc. (registered investment adviser and registered transfer agent); Director and Chairman, IVZ Distributors, Inc. (formerly known as INVESCO Distributors, Inc.) (registered broker dealer); Director, President and Chairman, Invesco Inc. (holding company), Invesco Canada Holdings Inc. (holding company), Trimark Investments Ltd./ Placements Trimark Ltèe and Invesco Financial Services Ltd/Services Financiers Invesco Ltèe; Chief Executive Officer, Invesco Canada Fund Inc. (corporate mutual fund company); Director and Chairman, Van Kampen Investor Services Inc.; Director, Chief Executive Officer and President, 1371 Preferred Inc. (holding | | | | |
54 INVESCO OPPENHEIMER CAPITAL APPRECIATION FUND
| | | | | | | | |
Name, Year of Birth and Position(s) Held with the Trust | | Trustee
and/or
Officer
Since | | Principal Occupation(s) During Past 5 Years | | Number of Funds in Fund Complex
Overseen by Trustee | | Other Directorship(s)
Held by Trustee
During Past 5 Years |
INTERESTED PERSONS (CONTINUED) | | | | | | | | |
| Philip A. Taylor (Continued) | | | | company) and Van Kampen Investments Inc.; Director and President, AIM GP Canada Inc. (general partner for limited partnerships) and Van Kampen Advisors, Inc.; Director and Chief Executive Officer, Invesco Trimark Dealer Inc. (registered broker dealer); Director, Invesco Distributors, Inc. (formerly known as Invesco AIM Distributors, Inc.) (registered broker dealer); Manager, Invesco Capital Management LLC; Director, Chief Executive Officer and President, Invesco Advisers, Inc.; Director, Chairman, Chief Executive Officer and President, Invesco AIM Capital Management, Inc.; President, Invesco Trimark Dealer Inc. and Invesco Trimark Ltd./Invesco Trimark Ltèe; Director and President, AIM Trimark Corporate Class Inc. and AIM Trimark Canada Fund Inc.; Senior Managing Director, Invesco Holding Company Limited; Director and Chairman, Fund Management Company (former registered broker dealer); President and Principal Executive Officer, The Invesco Funds (AIM Treasurer’s Series Trust (Invesco Treasurer’s Series Trust), and Short-Term Investments Trust only); President, AIM Trimark Global Fund Inc. and AIM Trimark Canada Fund Inc. | | | | |
55 INVESCO OPPENHEIMER CAPITAL APPRECIATION FUND
TRUSTEES AND OFFICERSUnaudited / Continued
| | | | | | | | |
Name, Year of Birth and Position(s) Held with the Trust | | Trustee
and/or
Officer
Since | | Principal Occupation(s) During Past 5 Years | | Number of Funds in Fund Complex
Overseen by Trustee | | Other Directorship(s)
Held by Trustee
During Past 5 Years |
INDEPENDENT TRUSTEES | | | | | | | | |
Bruce L. Crockett – 1944 Trustee and Chair | | 2003 | | Chairman, Crockett Technologies Associates (technology consulting company) Formerly: Director, Captaris (unified messaging provider); Director, President and Chief Executive Officer, COMSAT Corporation; Chairman, Board of Governors of INTELSAT (international communications company); ACE Limited (insurance company); Independent Directors Council and Investment Company Institute: Member of the Audit Committee, Investment Company Institute; Member of the Executive Committee and Chair of the Governance Committee, Independent Directors Council | | 230 | | Director and Chairman of the Audit Committee, ALPS (Attorneys Liability Protection Society) (insurance company); Director and Member of the Audit Committee and Compensation Committee, Ferroglobe PLC (metallurgical company) |
David C. Arch – 1945 Trustee | | 2010 | | Chairman of Blistex Inc. (consumer health care products manufacturer); Member, World Presidents’ Organization | | 230 | | Board member of the Illinois Manufacturers’ Association |
Beth Ann Brown – 1968 Trustee | | 2019 | | Independent Consultant Formerly: Head of Intermediary Distribution, Managing Director, Strategic Relations, Managing Director, Head of National Accounts, Senior Vice President, National Account Manager and Senior Vice President, Key Account Manager, Columbia Management Investment Advisers LLC; Vice President, Key Account Manager, Liberty Funds Distributor, Inc.; and Trustee of certain Oppenheimer Funds | | 230 | | Director, Board of Directors of Caron Engineering Inc.; Advisor, Board of Advisors of Caron Engineering Inc.; President and Director, of Acton Shapleigh Youth Conservation Corps (non -profit); and Vice President and Director of Grahamtastic Connection (non- profit) |
Jack M. Fields – 1952 Trustee | | 2003 | | Chief Executive Officer, Twenty First Century Group, Inc. (government affairs company); and Chairman, Discovery Learning Alliance(non-profit) Formerly: Owner and Chief Executive Officer, Dos Angeles Ranch L.P. (cattle, hunting, corporate entertainment); Director, Insperity, Inc. (formerly known as Administaff) (human resources provider); Chief Executive Officer, Texana Timber LP (sustainable forestry | | 230 | | None |
56 INVESCO OPPENHEIMER CAPITAL APPRECIATION FUND
| | | | | | | | |
Name, Year of Birth and Position(s) Held with the Trust | | Trustee
and/or
Officer
Since | | Principal Occupation(s) During Past 5 Years | | Number of Funds
in Fund Complex
Overseen by Trustee | | Other Directorship(s)
Held by Trustee During Past 5 Years |
INDEPENDENT TRUSTEES (CONTINUED) | | | | | | | | |
| Jack M. Fields (Continued) | | | | company); Director of Cross Timbers Quail Research Ranch(non-profit); and member of the U.S. House of Representatives | | | | |
Cynthia Hostetler —1962 Trustee | | 2017 | | Non-Executive Director and Trustee of a number of public and private business corporations Formerly: Director, Aberdeen Investment Funds (4 portfolios); Head of Investment Funds and Private Equity, Overseas Private Investment Corporation; President, First Manhattan Bancorporation, Inc.; Attorney, Simpson Thacher & Bartlett LLP | | 230 | | Vulcan Materials Company (construction materials company); Trilinc Global Impact Fund; Genesee & Wyoming, Inc. (railroads); Artio Global Investment LLC (mutual fund complex); Edgen Group, Inc. (specialized energy and infrastructure products distributor); Investment Company Institute (professional organization); Independent Directors Council (professional organization) |
Eli Jones – 1961 Trustee | | 2016 | | Professor and Dean, Mays Business School - Texas A&M University Formerly: Professor and Dean, Walton College of Business, University of Arkansas and E.J. Ourso College of Business, Louisiana State University; Director, Arvest Bank | | 230 | | Insperity, Inc. (formerly known as Administaff) (human resources provider) |
Elizabeth Krentzman – 1959 Trustee | | 2019 | | Formerly: Principal and Chief Regulatory Advisor for Asset Management Services and U.S. Mutual Fund Leader of Deloitte & Touche LLP; General Counsel of the Investment Company Institute (trade association); National Director of the Investment Management Regulatory Consulting Practice, Principal, Director and Senior Manager of Deloitte & Touche LLP; Assistant Director of the Division of Investment Management - Office of Disclosure and Investment Adviser Regulation of the U.S. Securities and Exchange Commission and various positions with the Division of Investment Management – Office of Regulatory Policy of the U.S. Securities and Exchange Commission; Associate at Ropes & Gray LLP.; Advisory Board Member of the | | 230 | | Trustee of the University of Florida National Board Foundation and Audit Committee Member; Member of the Cartica Funds Board of Directors (private investment funds); Member of the University of Florida Law Center Association, Inc. Board of Trustees and Audit Committee Member |
57 INVESCO OPPENHEIMER CAPITAL APPRECIATION FUND
TRUSTEES AND OFFICERSUnaudited / Continued
| | | | | | | | |
Name, Year of Birth and Position(s) Held with the Trust | | Trustee
and/or
Officer
Since | | Principal Occupation(s) During Past 5 Years | | Number of Funds
in Fund Complex
Overseen by Trustee | | Other Directorship(s)
Held by Trustee During Past 5 Years |
INDEPENDENT TRUSTEES (CONTINUED) | | | | | | | | |
Elizabeth Krentzman (Continued) | | | | Securities and Exchange Commission Historical Society; and Trustee of certain Oppenheimer Funds | | | | |
Anthony J. LaCava, Jr. – 1956 Trustee | | 2019 | | Formerly: Director and Member of the Audit Committee, Blue Hills Bank (publicly traded financial institution) and Managing Partner, KPMG LLP | | 230 | | Blue Hills Bank; Chairman of Bentley University; Member, Business School Advisory Council; and Nominating Committee, KPMG LLP |
Prema Mathai-Davis – 1950 Trustee | | 2003 | | Retired Co-Owner & Partner of Quantalytics Research, LLC, (a FinTech Investment Research Platform for the Self-Directed Investor) | | 230 | | None |
Joel W. Motley – 1952 Trustee | | 2019 | | Director of Office of Finance, Federal Home Loan Bank; Member of the Vestry of Trinity Wall Street; Managing Director of Carmona Motley Inc. (privately held financial advisor); Member of the Finance and Budget Committee of the Council on Foreign Relations, Member of the Investment Committee and Board of Human Rights Watch and Member of the Investment Committee and Board of Historic Hudson Valley (non-profit cultural organization). Formerly: Managing Director of Public Capital Advisors, LLC (privately held financial advisor); Managing Director of Carmona Motley Hoffman, Inc. (privately held financial advisor); Trustee of certain Oppenheimer Funds; and Director of Columbia Equity Financial Corp. (privately held financial advisor) | | 230 | | Director of Greenwall Foundation (bioethics research foundation); Member of Board and Investment Committee of The Greenwall Foundation; Director of Southern Africa Legal Services Foundation; Board Member and Investment Committee Member of Pulitzer Center for Crisis Reporting(non-profit journalism) |
Teresa M. Ressel — 1962 Trustee | | 2017 | | Non-executive director and trustee of a number of public and private business corporations Formerly: Chief Financial Officer, Olayan America, The Olayan Group (international investor/commercial/industrial); Chief Executive Officer, UBS Securities LLC; Group Chief Operating Officer, Americas, UBS AG; Assistant Secretary for Management & Budget and CFO, US Department of the Treasury | | 230 | | Atlantic Power Corporation (power generation company); ON Semiconductor Corp. (semiconductor supplier) |
58 INVESCO OPPENHEIMER CAPITAL APPRECIATION FUND
| | | | | | | | |
Name, Year of Birth and Position(s) Held with the Trust | | Trustee
and/or
Officer
Since | | Principal Occupation(s) During Past 5 Years | | Number of Funds
in Fund Complex
Overseen by Trustee | | Other Directorship(s)
Held by Trustee During Past 5 Years |
INDEPENDENT TRUSTEES (CONTINUED) | | | | | | | | |
Ann Barnett Stern – 1957 Trustee | | 2017 | | President and Chief Executive Officer, Houston Endowment Inc. (private philanthropic institution) Formerly: Executive Vice President and General Counsel, Texas Children’s Hospital; Attorney, Beck, Redden and Secrest, LLP; Business Law Instructor, University of St. Thomas; Attorney, Andrews & Kurth LLP | | 230 | | Federal Reserve Bank of Dallas |
Raymond Stickel, Jr. – 1944 Trustee | | 2005 | | Retired Formerly: Director, Mainstay VP Series Funds, Inc. (25 portfolios); Partner, Deloitte & Touche | | 230 | | None |
Robert C. Troccoli – 1949 Trustee | | 2016 | | Retired Formerly: Adjunct Professor, University of Denver – Daniels College of Business, Senior Partner, KPMG LLP | | 230 | | None |
Daniel S. Vandivort –1954 Trustee | | 2019 | | Treasurer, Chairman of the Audit and Finance Committee, and Trustee, Board of Trustees, Huntington Disease Foundation of America; and President, Flyway Advisory Services LLC (consulting and property management). Formerly: Trustee and Governance Chair, of certain Oppenheimer Funds | | 230 | | Chairman and Lead Independent Director, Chairman of the Audit Committee, and Director, Board of Directors, Value Line Funds |
James D. Vaughn – 1945 Trustee | | 2019 | | Retired Formerly: Managing Partner, Deloitte & Touche LLP; Trustee and Chairman of the Audit Committee, Schroder Funds; Board Member, Mile High United Way, Boys and Girls Clubs, Boy Scouts, Colorado Business Committee for the Arts, Economic Club of Colorado and Metro Denver Network (economic development corporation); and Trustee of certain Oppenheimer Funds | | 230 | | Board member and Chairman of Audit Committee of AMG National Trust Bank; Trustee and Investment Committee member, University of South Dakota Foundation; Board member, Audit Committee Member and past Board Chair, Junior Achievement(non-profit) |
Christopher L. Wilson – 1957 Trustee, Vice Chair and Chair Designate | | 2017 | | Retired Formerly: Director, TD Asset Management USA Inc. (mutual fund complex) (22 portfolios); Managing Partner, CT2, LLC (investing and | | 230 | | ISO New England, Inc.(non-profit organization managing regional electricity market) |
59 INVESCO OPPENHEIMER CAPITAL APPRECIATION FUND
TRUSTEES AND OFFICERSUnaudited / Continued
| | | | | | | | |
Name, Year of Birth and Position(s) Held with the Trust | | Trustee
and/or
Officer
Since | | Principal Occupation(s) During Past 5 Years | | Number of Funds
in Fund Complex
Overseen by Trustee | | Other Directorship(s)
Held by Trustee During Past 5 Years |
INDEPENDENT TRUSTEES (CONTINUED) | | | | | | | | |
Christopher L. Wilson (Continued) | | | | consulting firm); President/Chief Executive Officer, Columbia Funds, Bank of America Corporation; President/Chief Executive Officer, CDC IXIS Asset Management Services, Inc.; Principal & Director of Operations, Scudder Funds, Scudder, Stevens & Clark, Inc.; Assistant Vice President, Fidelity Investments | | | | |
60 INVESCO OPPENHEIMER CAPITAL APPRECIATION FUND
| | | | | | | | |
Name, Year of Birth and Position(s) Held with the Trust | | Trustee
and/or
Officer
Since | | Principal Occupation(s) During Past 5 Years | | Number of Funds
in Fund Complex
Overseen by Trustee | | Other Directorship(s)
Held by Trustee During Past 5 Years |
OTHER OFFICERS | | | | | | | | |
Sheri Morris — 1964 President, Principal Executive Officer and Treasurer | | 2003 | | President, Principal Executive Officer and Treasurer, The Invesco Funds; Vice President, Invesco Advisers, Inc. (formerly known as Invesco Institutional (N.A.), Inc.) (registered investment adviser); and Vice President, Invesco Exchange-Traded Fund Trust, Invesco Exchange-Traded Fund Trust II, Invesco India Exchange-Traded Fund Trust, Invesco Actively Managed Exchange-Traded Fund Trust, Invesco Actively Managed Exchange-Traded Commodity Fund Trust and Invesco Exchange- Traded Self-Indexed Fund Trust, and Vice President, OppenheimerFunds, Inc. Formerly: Vice President and Principal Financial Officer, The Invesco Funds; Vice President, Invesco AIM Advisers, Inc., Invesco AIM Capital Management, Inc. and Invesco AIM Private Asset Management, Inc.; Assistant Vice President and Assistant Treasurer, The Invesco Funds and Assistant Vice President, Invesco Advisers, Inc., Invesco AIM Capital Management, Inc. and Invesco AIM Private Asset Management, Inc.; and Treasurer, Invesco Exchange-Traded Fund Trust, Invesco Exchange-Traded Fund Trust II, Invesco India Exchange-Traded Fund Trust and Invesco Actively Managed Exchange-Traded Fund Trust | | N/A | | N/A |
Russell C. Burk — 1958 Senior Vice President and Senior Officer | | 2005 | | Senior Vice President and Senior Officer, The Invesco Funds | | N/A | | N/A |
Jeffrey H. Kupor – 1968 Senior Vice President, Chief Legal Officer and Secretary | | 2018 | | Head of Legal of the Americas, Invesco Ltd.; Senior Vice President and Secretary, Invesco Advisers, Inc. (formerly known as Invesco Institutional (N.A.), Inc.) (registered investment adviser); Senior Vice President and Secretary, Invesco Distributors, Inc. (formerly known as Invesco AIM Distributors, Inc.); Vice President and Secretary, Invesco Investment Services, Inc. (formerly known as Invesco AIM Investment Services, Inc.) Senior Vice President, Chief Legal Officer and Secretary, The Invesco Funds; Secretary and General Counsel, Invesco Investment Advisers LLC (formerly known as Van Kampen Asset Management); Secretary and General Counsel, Invesco Capital Markets, Inc. (formerly known as Van Kampen Funds Inc.) and Chief Legal Officer, Invesco Exchange-Traded Fund Trust, | | N/A | | N/A |
61 INVESCO OPPENHEIMER CAPITAL APPRECIATION FUND
TRUSTEES AND OFFICERSUnaudited / Continued
| | | | | | | | | | |
Name, Year of Birth and
Position(s) Held with the Trust | | Trustee
and/or
Officer
Since | | Principal Occupation(s)
During Past 5 Years | | | | Number of Funds in
Fund Complex
Overseen by Trustee | | Other Directorship(s)
Held by Trustee During Past 5 Years |
OTHER OFFICERS (CONTINUED) | | | | | | | | | | |
| Jeffrey H. Kupor (Continued) | | | | Invesco Exchange-Traded Fund Trust II, Invesco India Exchange-Traded Fund Trust, Invesco Actively Managed Exchange-Traded Fund Trust, Invesco Actively Managed Exchange- Traded Commodity Fund Trust and Invesco Exchange-Traded Self-Indexed Fund Trust; Secretary, Invesco Indexing LLC; Secretary, W.L. Ross & Co., LLC Formerly: Secretary and Vice President, Jemstep, Inc.; Head of Legal, Worldwide Institutional, Invesco Ltd.; Secretary and General Counsel, INVESCO Private Capital Investments, Inc.; Senior Vice President, Secretary and General Counsel, Invesco Management Group, Inc. (formerly known as Invesco AIM Management Group, Inc.); Assistant Secretary, INVESCO Asset Management (Bermuda) Ltd.; Secretary and General Counsel, Invesco Private Capital, Inc.; Assistant Secretary and General Counsel, INVESCO Realty, Inc.; Secretary and General Counsel, Invesco Senior Secured Management, Inc.; and Secretary, Sovereign G./P. Holdings Inc. | | | | | | |
Andrew R. Schlossberg – 1974 Senior Vice President | | 2019 | | Head of the Americas and Senior Managing Director, Invesco Ltd.; Director and Senior Vice President, Invesco Advisers, Inc. (formerly known as Invesco Institutional (N.A.), Inc.) (registered investment adviser); Director and Chairman, Invesco Investment Services, Inc. (formerly known as Invesco AIM Investment Services, Inc.) (registered transfer agent); Senior Vice President, The Invesco Funds; Director, Invesco Investment Advisers LLC (formerly known as Van Kampen Asset Management); Director, President and Chairman, Invesco Insurance Agency, Inc. Formerly: Director, Invesco UK Limited; Director and Chief Executive, Invesco Asset Management Limited and Invesco Fund Managers Limited; Assistant Vice President, The Invesco Funds; Senior Vice President, Invesco Advisers, Inc. (formerly known as Invesco Institutional (N.A.), Inc.) (registered investment adviser); Director and Chief Executive, Invesco Administration Services Limited and Invesco Global Investment Funds | | | | N/A | | N/A |
62 INVESCO OPPENHEIMER CAPITAL APPRECIATION FUND
| | | | | | | | | | |
Name, Year of Birth and
Position(s) Held with the Trust | | Trustee
and/or
Officer
Since | | Principal Occupation(s)
During Past 5 Years | | | | Number of Funds in
Fund Complex
Overseen by Trustee | | Other Directorship(s)
Held by Trustee During Past 5 Years |
OTHER OFFICERS (CONTINUED) | | | | | | | | | | |
| Andrew R. Schlossberg (Continued) | | | | Limited; Director, Invesco Distributors, Inc.; Head of EMEA, Invesco Ltd.; President, Invesco Actively Managed Exchange-Traded Commodity Fund Trust, Invesco Actively Managed Exchange-Traded Fund Trust, Invesco Exchange-Traded Fund Trust, Invesco Exchange-Traded Fund Trust II and Invesco India Exchange-Traded Fund Trust; Managing Director and Principal Executive Officer, Invesco Capital Management LLC | | | | | | |
John M. Zerr – 1962 Senior Vice President | | 2006 | | Chief Operating Officer of the Americas; Senior Vice President, Invesco Advisers, Inc. (formerly known as Invesco Institutional (N.A.), Inc.) (registered investment adviser); Senior Vice President, Invesco Distributors, Inc. (formerly known as Invesco AIM Distributors, Inc.); Director and Vice President, Invesco Investment Services, Inc. (formerly known as Invesco AIM Investment Services, Inc.) Senior Vice President, The Invesco Funds; Managing Director, Invesco Capital Management LLC; Director, Invesco Investment Advisers LLC (formerly known as Van Kampen Asset Management); Senior Vice President, Invesco Capital Markets, Inc. (formerly known as Van Kampen Funds Inc.); Manager, Invesco Indexing LLC; Manager, Invesco Specialized Products, LLC; Director and Senior Vice President, Invesco Insurance Agency, Inc.; Member, Invesco Canada Funds Advisory Board; Director, President and Chief Executive Officer, Invesco Corporate Class Inc. (corporate mutual fund company); and Director, Chairman, President and Chief Executive Officer, Invesco Canada Ltd. (formerly known as Invesco Trimark Ltd./Invesco Trimark Ltèe) (registered investment adviser and registered transfer agent) Formerly: Director and Senior Vice President, Invesco Management Group, Inc. (formerly known as Invesco AIM Management Group, Inc.); Secretary and General Counsel, Invesco Management Group, Inc. (formerly known as Invesco AIM Management Group, Inc.); Secretary, Invesco Investment Services, Inc. (formerly known as Invesco AIM Investment Services, Inc.); Chief Legal Officer and Secretary, The Invesco Funds; Secretary and | | | | N/A | | N/A |
63 INVESCO OPPENHEIMER CAPITAL APPRECIATION FUND
TRUSTEES AND OFFICERSUnaudited / Continued
| | | | | | | | | | |
Name, Year of Birth and
Position(s) Held with the Trust | | Trustee
and/or
Officer
Since | | Principal Occupation(s)
During Past 5 Years | | | | Number of Funds in
Fund Complex
Overseen by Trustee | | Other Directorship(s)
Held by Trustee During Past 5 Years |
OTHER OFFICERS (CONTINUED) | | | | | | | | | | |
| John M. Zerr (Continued) | | | | General Counsel, Invesco Investment Advisers LLC (formerly known as Van Kampen Asset Management); Secretary and General Counsel, Invesco Capital Markets, Inc. (formerly known as Van Kampen Funds Inc.); Chief Legal Officer, Invesco Exchange-Traded Fund Trust, Invesco Exchange-Traded Fund Trust II, Invesco India Exchange-Traded Fund Trust, Invesco Actively Managed Exchange-Traded Fund Trust, Invesco Actively Managed Exchange- Traded Commodity Fund Trust and Invesco Exchange-Traded Self-Indexed Fund Trust; Secretary, Invesco Indexing LLC; Director, Secretary, General Counsel and Senior Vice President, Van Kampen Exchange Corp.; Director, Vice President and Secretary, IVZ Distributors, Inc. (formerly known as INVESCO Distributors, Inc.); Director and Vice President, INVESCO Funds Group, Inc.; Director and Vice President, Van Kampen Advisors Inc.; Director, Vice President, Secretary and General Counsel, Van Kampen Investor Services Inc.; Director and Secretary, Invesco Distributors, Inc. (formerly known as Invesco AIM Distributors, Inc.); Director, Senior Vice President, General Counsel and Secretary, Invesco AIM Advisers, Inc. and Van Kampen Investments Inc.; Director, Vice President and Secretary, Fund Management Company; Director, Senior Vice President, Secretary, General Counsel and Vice President, Invesco AIM Capital Management, Inc.; Chief Operating Officer and General Counsel, Liberty Ridge Capital, Inc. (an investment adviser) | | | | | | |
Gregory G. McGreevey – 1962 Senior Vice President | | 2012 | | Senior Managing Director, Invesco Ltd.; Director, Chairman, President, and Chief Executive Officer, Invesco Advisers, Inc. (formerly known as Invesco Institutional (N.A.), Inc.) (registered investment adviser); Director, Invesco Mortgage Capital, Inc. and Invesco Senior Secured Management, Inc.; and Senior Vice President, The Invesco Funds; and President, SNW Asset Management Corporation Formerly: Senior Vice President, Invesco Management Group, Inc. and Invesco Advisers, Inc.; Assistant Vice President, The Invesco Funds | | | | N/A | | N/A |
64 INVESCO OPPENHEIMER CAPITAL APPRECIATION FUND
| | | | | | | | | | |
Name, Year of Birth and
Position(s) Held with the Trust | | Trustee
and/or
Officer
Since | | Principal Occupation(s)
During Past 5 Years | | | | Number of Funds in
Fund Complex
Overseen by Trustee | | Other Directorship(s)
Held by Trustee During Past 5 Years |
OTHER OFFICERS (CONTINUED) | | | | | | | | | | |
Kelli Gallegos – 1970 Vice President, Principal Financial Officer and Assistant Treasurer | | 2008 | | Assistant Treasurer, Invesco Specialized Products, LLC; Vice President, Principal Financial Officer and Assistant Treasurer, The Invesco Funds; Principal Financial and Accounting Officer–Pooled Investments, Invesco Capital Management LLC; Vice President and Treasurer, Invesco Exchange- Traded Fund Trust, Invesco Exchange-Traded Fund Trust II, Invesco India Exchange-Traded Fund Trust, Invesco Actively Managed Exchange-Traded Fund Trust, Invesco Actively Managed Exchange-Traded Commodity Fund Trust and Invesco Exchange-Traded Self- Indexed Fund Trust Formerly: Assistant Treasurer, Invesco Exchange-Traded Fund Trust, Invesco Exchange-Traded Fund Trust II, Invesco India Exchange-Traded Fund Trust, Invesco Actively Managed Exchange-Traded Fund Trust, Invesco Actively Managed Exchange-Traded Commodity Fund Trust and Invesco Exchange-Traded Self-Indexed Fund Trust; Assistant Treasurer, Invesco Capital Management LLC; Assistant Vice President, The Invesco Funds | | | | N/A | | N/A |
Crissie M. Wisdom – 1969 Anti-Money Laundering Compliance Officer | | 2013 | | Anti-Money Laundering Compliance Officer, Invesco Advisers, Inc. (formerly known as Invesco Institutional (N.A.), Inc.) (registered investment adviser), Invesco Capital Markets, Inc. (formerly known as Van Kampen Funds Inc.), Invesco Distributors, Inc., Invesco Investment Services, Inc., The Invesco Funds, and Invesco Exchange-Traded Fund Trust, Invesco Exchange-Traded Fund Trust II, Invesco India Exchange-Traded Fund Trust, Invesco Actively Managed Exchange-Traded Fund Trust, Invesco Actively Managed Exchange-Traded Commodity Fund Trust and Invesco Exchange-Traded Self-Indexed Fund Trust; Anti-Money Laundering Compliance Officer and Bank Secrecy Act Officer, INVESCO National Trust Company and Invesco Trust Company; and Fraud Prevention Manager and Controls and Risk Analysis Manager for Invesco Investment Services, Inc. Formerly: Anti-Money Laundering Compliance Officer, Van Kampen Exchange Corp. and Invesco Management Group, Inc. | | | | N/A | | N/A |
65 INVESCO OPPENHEIMER CAPITAL APPRECIATION FUND
TRUSTEES AND OFFICERSUnaudited / Continued
| | | | | | | | | | |
Name, Year of Birth and
Position(s) Held with the Trust | | Trustee
and/or
Officer
Since | | Principal Occupation(s)
During Past 5 Years | | | | Number of Funds in
Fund Complex
Overseen by Trustee | | Other Directorship(s)
Held by Trustee During Past 5 Years |
OTHER OFFICERS (CONTINUED) | | | | | | | | | | |
Robert R. Leveille – 1969 Chief Compliance Officer | | 2016 | | Chief Compliance Officer, Invesco Advisers, Inc. (registered investment adviser); and Chief Compliance Officer, The Invesco Funds Formerly: Chief Compliance Officer, Putnam Investments and the Putnam Funds | | | | N/A | | N/A |
The Statement of Additional Information of the Trust includes additional information about the Fund’s Trustees and is available upon request, without charge, by calling 1.800.959.4246. Please refer to the Fund’s Statement of Additional Information for information on the Fund’ssub-advisers.
Office of the Fund
11 Greenway Plaza,
Suite 1000
Houston, TX 77046-1173
Counsel to the Fund
Stradley Ronon Stevens & Young, LLP
2005 Market Street,
Suite 2600
Philadelphia, PA 19103-7018
Investment Adviser
Invesco Advisers, Inc.
1555 Peachtree Street, N.E.
Atlanta, GA 30309
Counsel to the
Independent Trustees
Goodwin Procter LLP
901 New York Avenue, N.W.
Washington, D.C. 20001
Distributor
Invesco Distributors, Inc.
11 Greenway Plaza,
Suite 1000
Houston, TX
77046-1173
Transfer Agent
Invesco Investment
Services, Inc.
11 Greenway Plaza,
Suite 1000
Houston, TX
77046-1173
Auditors
PricewaterhouseCoopers
LLP
1000 Louisiana Street,
Suite 5800
Houston, TX 77002-5021
Custodian
JPMorgan Chase Bank
4 Chase Metro Tech
Center
Brooklyn, NY 11245
66 INVESCO OPPENHEIMER CAPITAL APPRECIATION FUND
Invesco recognizes the importance of protecting your personal and financial information when you visit our website located atwww.invesco.com (the “Website”). The following information is designed to help you understand the information collection practices at this Website. We will not sell, share or rent your personally identifiable information to others in contravention of this Privacy Policy. When we refer to ourselves as “we” or “Invesco” in this Privacy Policy, we mean our entire company including our affiliates, such as subsidiaries.
By visiting this Website, you are accepting the practices described in this Privacy Policy. If you do not agree to this policy, you may not use this Website. This Privacy Policy is subject to change without notice, from time to time in our sole discretion. You acknowledge that by accessing the Website after we have posted changes to this Privacy Policy, you are agreeing to this Privacy Policy as modified. Please review the Terms of Use1 to learn of other terms and conditions applicable to your use of the Website.
Please note that this Privacy Policy is not an exclusive statement of our privacy principles across all products and services. Other privacy principles or policies may apply depending on the products or services you obtain from Invesco, or the jurisdiction in which you transact with Invesco.
This Privacy Policy was last updated on May 6, 2018.
Information We Collect and Use
We collect personal information you choose to submit to the Website in order to process transactions requested by you and meet our contractual obligations. For example, you can choose to provide your name, contact information, social security number, or tax identification number in connection with accessing your account, or you can choose to provide your personal information when you fill out a secure account question form. Any information collected about you from the Website can, from time to time, be associated with other identifying information we have about you.
In addition, we may gather information about you automatically through your use of the Website, e.g. your IP address, how you navigate the Website, the organization from which you are accessing the Website, and the websites that you access before and after you visit the Website.
When you access the Website, we may also collect information such as unique device identifiers, your screen resolution and other device settings, information about your location, and analytical information about how you use the device from which you are viewing the Website. Where applicable, we may ask your permission before collecting certain information, such as precise geolocation information.
From time to time, we use or augment the personal information we have about you with information obtained from third parties. For example, we use third party information to confirm contact or financial information or to better understand your interests by associating demographic information from third parties with the information you have provided.
How We Use Personal Information
We use your personal information to respond to your inquiries and provide the products and services you request. We also use your information from time to time to deliver the content and services we believe
1 NTD
67 INVESCO OPPENHEIMER CAPITAL APPRECIATION FUND
| | | | |
| | INVESCO’S PRIVACY NOTICEContinued |
| | |
you will find the most relevant and to provide customer service and support.
We also use the information you provide to further develop and improve our products and services. We aggregate and/orde-identify data about visitors to the Website for various business purposes including product and service development and improvement activities.
How We Share Personal Information
We collaborate with other companies and individuals to perform services for us and on our behalf and we collaborate with our affiliates, other companies and individuals with respect to particular products or services (“Providers”). Examples of Providers include data analysis firms, customer service and support providers, email and SMS vendors, andweb-hosting and development companies. Some Providers collect information for us or on our behalf on our Website. These Providers can be provided with access to personal information needed to perform their functions.
We reserve the right to disclose your personal information as required by law, when we believe disclosure is necessary to comply with a regulatory requirement, judicial proceeding, court order or legal process served on us, to protect the safety, rights or property of our customers, the public or Invesco or to enforce the Terms of Use.
If we sell or transfer a business unit (such as a subsidiary) or an asset (such as a website) to another company, we will share your personal information with such company. You will receive notice of such an event and the new entity will inform you of any changes to the practices in this Privacy Policy. If the new entity wishes to make additional use of your information, you have the right to decline such use at that time.
We occasionally disclose aggregate orde-identified data that is not personally identifiable with third parties.
Cookies and Other Tools
Invesco and its Providers collect information about you by using cookies, tracking pixels and other technologies. We use this information to better understand, customize and improve user experience with our websites, services and offerings as well as to manage our advertising. For example, we use web analytics services that use these technologies to gather information to help us understand how visitors engage with and navigate our Website, e.g., how and when pages in a site are visited and by how many visitors. We are also able to offer our visitors a more customized, relevant experience on our sites using these technologies by delivering content and functionality based on your preferences and interests.
Depending on their purpose, some cookies will only operate for the length of a single browsing session, while others have a longer life span to ensure that they fulfill their longer-term purposes. Your web browser can be set to allow you to control whether you will accept cookies or reject cookies, to notify you each time a cookie is sent to your browser, or to delete cookies that have already been set. If your browser is set to reject cookies, certain aspects of the Website that are cookie-enabled will not recognize you when you return to the website, and some Website functionality may be lost. The “Help” section of your browser may tell you how to prevent your browser from accepting cookies. To find out more about cookies, visitwww.aboutcookies.org.
68 INVESCO OPPENHEIMER CAPITAL APPRECIATION FUND
Security
No data transmission over the internet can be 100% secure, so Invesco cannot ensure or warrant the security of any information you submit to us on this Website. However, Invesco seeks to protect your personal information from unauthorized access or use when you transact business on our Website using technical, administrative and procedural measures. Invesco makes no representation as to the reasonableness, efficacy, or appropriateness of the measures we use to safeguard such information.
Users are responsible for maintaining the secrecy of their own passwords. If you have reason to believe that your interaction with us is no longer secure (for example, if you feel that the security of any account you might have with us has been compromised), please immediately notify us by contacting us as specified below.
Transfer of Data to Other Countries
Any information you provide to Invesco through use of the Website may be stored and processed, transferred between and accessed from the United States, Canada and other countries which do not guarantee the same level of protection of personal information as the one in which you reside. However, Invesco will handle your personal information in accordance with this Privacy Policy regardless of where your personal information is stored/accessed.
Children’s Privacy
We are committed to protecting the privacy of children. We do not knowingly collect personal information from children under the age of 18. If you are under the age of 18, do not provide us with any personal information.
Contact Us
Please contact us if you have any questions or concerns about your personal information or require assistance in managing your choices.
Invesco Ltd.
1555 Peachtree St. NE
Atlanta, GA 30309
By phone:
(404)439-3236
By fax:
(404)962-8288
By email:
Anne.Gerry@invesco.com
Please update your account information by logging in or contact us by email or telephone as specified above to update your account information whenever such information ceases to be complete or accurate.
You may also contact us to:
69 INVESCO OPPENHEIMER CAPITAL APPRECIATION FUND
| | | | |
| | INVESCO’S PRIVACY NOTICEContinued |
| | |
• Request that we amend, rectify, delete or update the personal data we hold about you;
• Where possible (e.g. in relation to marketing) amend or update your choices around processing;
• Request a copy of personal data held by us.
Disclaimer
Where the Website contains links to third-party websites/content/services that are not owned or controlled by Invesco, Invesco is not responsible for how these properties operate or treat your personal information so we recommend that you read the privacy policies and terms associated with these third party properties carefully.
70 INVESCO OPPENHEIMER CAPITAL APPRECIATION FUND
THIS PAGE INTENTIONALLY LEFT BLANK.
Explore High-Conviction Investing with Invesco

Go paperless with eDelivery
Visit invesco.com/edelivery to enjoy the convenience and security of anytime electronic access to your investment documents.
With eDelivery, you can elect to have any or all of the following materials delivered straight to your inbox to download, save and print from your own computer:
| ◾ Fund | reports and prospectuses |
Invesco mailing information
Send general correspondence to Invesco Investment Services, Inc., P.O. Box 219078, Kansas City, MO 64121-9078.

| | | | |
| | Invesco Distributors, Inc. | | O-CAPA-AR-1 10282019 |
| | | | |
 | | | | Shareholder Report for the Eleven Months Ended 8/31/2019 |
| | |
| | | | Invesco Oppenheimer Discovery Fund* Beginning on January 1, 2021, as permitted by regulations adopted by the Securities and Exchange Commission, paper copies of the Fund’s shareholder reports will no longer be sent by mail, unless you specifically request paper copies of the reports from the Fund or from your financial intermediary, such as a broker-dealer or bank. Instead, the reports will be made available on the Fund’s website, and you will be notified by mail each time a report is posted and provided with a website link to access the report. If you already elected to receive shareholder reports electronically, you will not be affected by this change and you need not take any action. You may elect to receive shareholder reports and other communications from the Fund electronically by contacting your financial intermediary (such as a broker-dealer or bank) or, if you are a direct investor, by enrolling at invesco. com/edelivery. You may elect to receive all future reports in paper free of charge. If you invest through a financial intermediary, you can contact your financial intermediary to request that you continue to receive paper copies of your shareholder reports. If you invest directly with the Fund, you can call 800 959 4246 to let the Fund know you wish to continue receiving paper copies of your shareholder reports. Your election to receive reports in paper will apply to all funds held with your financial intermediary or all funds held with the fund complex if you invest directly with the Fund. *Prior to the close of business on May 24, 2019, the Fund’s name was Oppenheimer Discovery Fund. See Important Update on the following page for more information. |
Important Update
On October 18, 2018, Massachusetts Mutual Life Insurance Company, an indirect corporate parent of OppenheimerFunds, Inc. and its subsidiaries OFI Global Asset Management, Inc., OFI SteelPath, Inc. and OFI Advisors, LLC, announced that it had entered into an agreement whereby Invesco Ltd., a global investment management company would acquire OppenheimerFunds and its subsidiaries (together, “OppenheimerFunds”). After the close of business on May 24, 2019 Invesco Ltd. completed the acquisition of OppenheimerFunds. This Fund was included in that acquisition and as of that date, became part of the Invesco family of funds. Please visit invesco.com for more information or call Invesco’s Client Services team at800-959-4246.
Table of Contents
Class A Shares
AVERAGE ANNUAL TOTAL RETURNS AT8/31/19
| | | | | | | | | | |
| | | Class A Shares of the Fund | | | | | | |
| | | Without Sales
Charge | | With Sales Charge | | Russell 2000
Growth Index | | Russell 2000
Index �� | | S&P 500 Index |
| 1-Year | | 3.64% | | -2.07% | | -11.02% | | -12.89% | | 2.92% |
| 5-Year | | 12.86 | | 11.59 | | 8.06 | | 6.41 | | 10.11 |
| 10-Year | | 15.88 | | 15.22 | | 13.06 | | 11.59 | | 13.45 |
Performance quoted is past performance and cannot guarantee comparable future results; current performance may be lower or higher. Visit invesco.com for the most recentmonth-end performance. Performance figures reflect reinvested distributions and changes in net asset value (NAV). Investment return and principal value will vary so that you may have a gain or a loss when you sell shares. Fund returns include changes in share price, reinvested distributions and a 5.50% maximum applicable sales charge except where “without sales charge” is indicated. As the result of a reorganization after the close of business on May 24, 2019, the returns of the Fund for periods on or prior to May 24, 2019 reflect performance of the Oppenheimer predecessor fund. Share class returns will differ from those of the predecessor fund because they have different expenses. Returns for periods of less than one year are not annualized. Returns do not consider capital gains or income taxes on an individual’s investment. See Fund prospectus and
3 INVESCO OPPENHEIMER DISCOVERY FUND
summary prospectus for more information on share classes, sales charges and new fee agreements, if any. Fund literature is available at invesco.com.
4 INVESCO OPPENHEIMER DISCOVERY FUND
Fund Performance Discussion
The Fund’s Class A shares (without sales charge) produced a total return of 3.64% during the one-year reporting period, outperforming the Russell 2000 Growth Index’s (the “Index”) return of-11.02%. The Fund’s outperformance versus the Index was largely the result of very favorable stock selection in the Information Technology, Industrials, and Consumer Discretionary sectors. The Fund marginally underperformed the Index in the Real Estate and Utilities sectors, due to an underweight allocation to these areas.
MARKET OVERVIEW
The reporting period encompassed a difficult environment forsmall-cap equities in general, as the major U.S. small cap indices have significantly lagged the large andmid-cap portions of the U.S. equity market over the last fiscal period. The last quarter of 2018, in particular, saw a significantsell-off in small-caps, and even after a rally to begin 2019,small-cap markets have still not regained their high-water mark that occurred in September of 2018. After years of relatively
smooth upward equity moves, volatility has made a comeback. This has been due to a combination of the U.S. Administration’s trade wars, a rise in geopolitical tensions, and the prospect of rising interest rates interrupting the upward march of the equity markets. Uncertainty has hurt equities in general, butsmall-cap equities in particular, due to the“risk-off” behavior of investors searching for more stability. In general, the market has traded sideways to close the reporting period
COMPARISON OF CHANGE IN VALUE OF $10,000 HYPOTHETICAL INVESTMENTS IN:
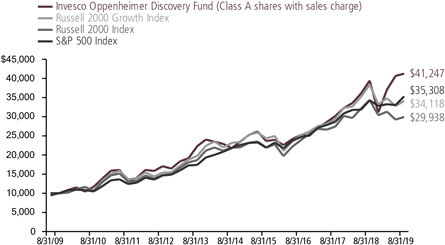
5 INVESCO OPPENHEIMER DISCOVERY FUND
as investors try to balance fear and greed in the face of conflicting economic data and heated political rhetoric from leaders across the world.
FUND REVIEW
Top performing stocks for the Fund this reporting period included Roku, Inc., Coupa Software, Inc. and Trade Desk, Inc.
Roku is one of the leading platforms for streaming TV in the U.S. The company has posted strong results as consumers continue to cut the cord and plug into Roku, demonstrating both the secular shift towardsover-the-top video consumption and management’s adept ability to exploit the trend.
Coupa Software is a software company that enables businesses to manage their spending in a more centralized, efficient manner. Theirsoftware-as-a-service cloud delivery model is superior to that of legacy players in the space, and they are rapidly growing their market share while also continuing penetration with existing customers.
Trade Desk is a technology company that empowers buyers of digital advertising. The company comfortably beat 4Q18 street consensus and guided to higher than expected revenue for fiscal year 2019.
Detractors from the Fund’s performance this reporting period included Ligand Pharmaceuticals, Inc., Inogen, Inc. and
SiteOne Landscape Supply, Inc.
Ligand Pharmaceuticals is a biopharma company that operates a lean business model licensing its intellectual property to numerous partners in return for milestones and royalties. The stock underperformed during the period due to a critical research report that questioned the long-term value of Ligand’s portfolio of future milestone payments. We have exited this position.
Inogen, Inc. is a leader in the portable oxygen concentrator segment of the $3 billion domestic home oxygen therapy market. They reported strong revenue growth but accelerated hiring of new salespeople, which has hurt profitability. We exited our position during the reporting period.
SiteOne Landscape Supply distributes commercial and residential landscape supplies. Its shares experienced volatility related to weak performance among housing related securities. We have exited our position.
STRATEGY & OUTLOOK
Our long-term investment process remains the same. We seek dynamic companies with above-average, sustainable revenue and earnings growth that we believe are positioned to outperform. This includes leading firms in structurally attractive industries with committed management teams that have proven records of performance.
6 INVESCO OPPENHEIMER DISCOVERY FUND
Looking forward, we expect the growth rate of the U.S. economy to moderate from roughly 3% in 2018 to around 2% this year while remaining stronger than many other economies around the world. Prior interest rate increases by the Federal Reserve, waning benefit from fiscal stimulus, weaker overseas economies and trade war fallout are the primary reasons for this slowdown. Moderating economic growth and rising cost pressure will combine to materially slow the pace of earnings growth in 2019. Meanwhile, market volatility has increased from unusually low levels, partly due to political and policy turmoil in Washington D.C.
While the recent sharp advance in equity prices may be followed by short-term consolidation, we are optimistic about the prospects for small andmid-cap growth stocks. Although equity valuations have rebounded, our holdings growth trajectory remains superior to the current corporate profit environment, with strong EPS growth for the companies in the Discovery Fund during the reporting period. We believe that companies with strong secular growth profiles will outperform those in cyclical industries over the intermediate future.
7 INVESCO OPPENHEIMER DISCOVERY FUND
Top Holdings and Allocations
| | | | |
TOP TEN COMMON STOCK HOLDINGS | |
| Repligen Corp. | | | 2.4 | % |
| RBC Bearings, Inc. | | | 2.1 | |
| Trade Desk, Inc. (The), Cl. A | | | 2.1 | |
| Pool Corp. | | | 2.1 | |
| Insulet Corp. | | | 2.1 | |
| Bright Horizons Family Solutions, Inc. | | | 2.1 | |
| Planet Fitness, Inc., Cl. A | | | 2.0 | |
| Roku, Inc., Cl. A | | | 2.0 | |
| RingCentral, Inc., Cl. A | | | 2.0 | |
| Coupa Software, Inc. | | | 2.0 | |
Portfolio holdings and allocations are subject to change. Percentages are as of August 31, 2019, and are based on net assets.
| | | | |
TOP TEN COMMON STOCK INDUSTRIES | |
| Software | | | 17.0 | % |
| Health Care Equipment & Supplies | | | 9.3 | |
| Machinery | | | 6.8 | |
| Biotechnology | | | 5.7 | |
| Aerospace & Defense | | | 5.2 | |
| Hotels, Restaurants & Leisure | | | 4.8 | |
| IT Services | | | 4.1 | |
| Life Sciences Tools & Services | | | 3.9 | |
| Diversified Consumer Services | | | 3.7 | |
| Semiconductors & Semiconductor Equipment | | | 3.6 | |
Portfolio holdings and allocations are subject to change. Percentages are as of August 31, 2019, and are based on net assets.
SECTOR ALLOCATION
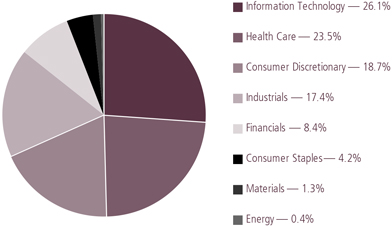
Portfolio holdings and allocations are subject to change. Percentages are as of August 31, 2019, and are based on the total market value of common stocks.
For more current Fund holdings, please visit invesco.com.
8 INVESCO OPPENHEIMER DISCOVERY FUND
Share Class Performance
AVERAGE ANNUAL TOTAL RETURNS WITHOUT SALES CHARGE AS OF 8/31/19
| | | | | | | | | | | | | | | | |
| | | Inception
Date | | | 1-Year | | | 5-Year | | | 10-Year | |
| Class A (OPOCX) | | | 9/11/86 | | | | 3.64 | % | | | 12.86 | % | | | 15.88 | % |
| Class C (ODICX) | | | 10/2/95 | | | | 2.85 | | | | 12.01 | | | | 14.99 | |
| Class R (ODINX) | | | 3/1/01 | | | | 3.36 | | | | 12.57 | | | | 15.57 | |
| Class Y (ODIYX) | | | 6/1/94 | | | | 3.89 | | | | 13.13 | | | | 16.23 | |
| Class R51 (DIGGX) | | | 5/24/19 | | | | 3.75 | | | | 12.88 | | | | 15.89 | |
| Class R6 (ODIIX) | | | 1/27/12 | | | | 4.06 | | | | 13.33 | | | | 14.77 | 2 |
AVERAGE ANNUAL TOTAL RETURNS WITH SALES CHARGE AS OF 8/31/19
| | | | | | | | | | | | | | | | |
| | | Inception
Date | | | 1-Year | | | 5-Year | | | 10-Year | |
| Class A (OPOCX) | | | 9/11/86 | | | | -2.07 | % | | | 11.59 | % | | | 15.22 | % |
| Class C (ODICX) | | | 10/2/95 | | | | 2.04 | | | | 12.01 | | | | 14.99 | |
| Class R (ODINX) | | | 3/1/01 | | | | 3.36 | | | | 12.57 | | | | 15.57 | |
| Class Y (ODIYX) | | | 6/1/94 | | | | 3.89 | | | | 13.13 | | | | 16.23 | |
| Class R51 (DIGGX) | | | 5/24/19 | | | | 3.75 | | | | 12.88 | | | | 15.89 | |
| Class R6 (ODIIX) | | | 1/27/12 | | | | 4.06 | | | | 13.33 | | | | 14.77 | 2 |
1 Class R5 shares’ performance shown prior to the inception date is that of the predecessor fund’s Class A shares at net asset value (NAV) and includes the12b-1 fees applicable to Class A shares. Class A shares’ performance reflects any applicable fee waivers and/or expense reimbursements.
2 Shows performance since inception.
Performance quoted is past performance and cannot guarantee comparable future results; current performance may be lower or higher. Visit invesco.com for the most recentmonth-end performance. Performance figures reflect reinvested distributions and changes in net asset value (NAV). Investment return and principal value will vary so that you may have a gain or a loss when you sell shares. Performance shown at NAV does not include the applicablefront-end sales charge, which would have reduced the performance. The current maximum initial sales charge for Class A shares is 5.50%, and the contingent deferred sales charge for Class C shares is 1% for the1-year period. Class R, Class Y, Class R5 and Class R6 shares have no sales charge; therefore, performance is at NAV. Effective after the close of business on May 24, 2019, Class A, Class C, Class R, Class Y, and Class I shares of the predecessor fund were reorganized into Class A, Class C, Class R, Class Y, and Class R6 shares, respectively, of the Fund. Class R5 shares’ performance shown prior to the inception date is that of the predecessor fund’s Class A shares at NAV and includes the12b-1 fees applicable to Class A shares. Class A shares’ performance reflects any applicable fee waivers and/or expense reimbursements. Returns shown for Class A, Class C, Class R, Class Y, Class R5, and Class R6 shares are blended returns of the predecessor fund and the Fund. Share class returns will differ from those of the predecessor fund because of different expenses. See Fund prospectuses and summary prospectuses for more information on share classes, sales charges and new fee agreements, if any. Fund literature is available at invesco.com.
9 INVESCO OPPENHEIMER DISCOVERY FUND
The Russell 2000 Growth Index measures the performance of thesmall-cap growth segment of the U.S. equity universe. It includes those Russell 2000 companies with higherprice-to-book ratios and higher forecasted growth values. The Russell 2000 Index measures the performance of thesmall-cap segment of the U.S. equity universe. The Russell 2000 Index is a subset of the Russell 3000 Index representing approximately 10% of the total market capitalization of that index. It includes approximately 2000 of the smallest securities based on a combination of their market cap and current index membership. The S&P 500 Index is a capitalization-weighted index of 500 stocks intended to be a representative sample of leading companies in leading industries within the U.S. economy. The indices are unmanaged and cannot be purchased directly by investors. While index comparisons may be useful to provide a benchmark for the Fund’s performance, it must be noted that the Fund’s investments are not limited to the investments comprising the indices. Index performance includes reinvestment of income, but does not reflect transaction costs, fees, expenses or taxes. Index performance is shown for illustrative purposes only as a benchmark for the Fund’s performance, and does not predict or depict performance of the Fund. The Fund’s performance reflects the effects of the Fund’s business and operating expenses.
The views and opinions expressed in management’s discussion of Fund performance are those of Invesco Advisers, Inc. These views and opinions are subject to change at any time based on factors such as market and economic conditions. These views and opinions may not be relied upon as investment advice or recommendations, or as an offer for a particular security. The information is not a complete analysis of every aspect of any market, country, industry, security or the Fund. Statements of fact are from sources considered reliable, but Invesco Advisers, Inc. makes no representation or warranty as to their completeness or accuracy. Although historical performance is no guarantee of future results, these insights may help you understand our investment management philosophy.
Before investing, investors should carefully read the prospectus and/or summary prospectus and carefully consider the investment objectives, risks, charges and expenses. For this and more complete information about the fund(s), investors should ask their advisors for a prospectus/summary prospectus or visit invesco. com/fundprospectus.
Shares of Invesco funds are not deposits or obligations of any bank, are not guaranteed by any bank, are not insured by the FDIC or any other agency, and involve investment risks, including the possible loss of the principal amount invested.
10 INVESCO OPPENHEIMER DISCOVERY FUND
Fund Expenses
Fund Expenses. As a shareholder of the Fund, you incur two types of costs: (1) transaction costs, which may include sales charges (loads) on purchase payments and/or contingent deferred sales charges on redemptions; and (2) ongoing costs, including management fees; distribution and service fees; and other Fund expenses. These examples are intended to help you understand your ongoing costs (in dollars) of investing in the Fund and to compare these costs with the ongoing costs of investing in other mutual funds.
The examples are based on an investment of $1,000.00 invested at the beginning of the period and held for the entire6-month period ended August 31, 2019.
Actual Expenses. The first section of the table provides information about actual account values and actual expenses. You may use the information in this section for the class of shares you hold, together with the amount you invested, to estimate the expense that you paid over the period. Simply divide your account value by $1,000.00 (for example, an $8,600.00 account value divided by $1,000.00 = 8.60), then multiply the result by the number in the first section under the heading entitled “Expenses Paid During 6 Months Ended August 31, 2019” to estimate the expenses you paid on your account during this period.
Hypothetical Example for Comparison Purposes.The second section of the table provides information about hypothetical account values and hypothetical expenses based on the Fund’s actual expense ratio for each class of shares, and an assumed rate of return of 5% per year for each class before expenses, which is not the Fund’s actual return. The hypothetical account values and expenses may not be used to estimate the actual ending account balance or expenses you paid for the period. You may use this information to compare the ongoing costs of investing in the Fund and other funds. To do so, compare this 5% hypothetical example for the class of shares you hold with the 5% hypothetical examples that appear in the shareholder reports of the other funds.
Please note that the expenses shown in the table are meant to highlight your ongoing costs only and do not reflect any transactional costs, such asfront-end or contingent deferred sales charges (loads). Therefore, the “hypothetical” section of the table is useful in comparing ongoing costs only, and will not help you determine the relative total costs of owning different funds. In addition, if these transactional costs were included, your costs would have been higher.
11 INVESCO OPPENHEIMER DISCOVERY FUND
| | | | | | | | | | | | |
| Actual | | Beginning Account Value March 1, 2019 | | | Ending
Account Value
August 31, 2019 | | | Expenses Paid During
6 Months Ended
August 31, 20191,2 | |
Class A | | $ | 1,000.00 | | | $ | 1,107.90 | | | $ | 5.70 �� | |
Class C | | | 1,000.00 | | | | 1,103.60 | | | | 9.80 | |
Class R | | | 1,000.00 | | | | 1,106.40 | | | | 7.08 | |
Class Y | | | 1,000.00 | | | | 1,109.40 | | | | 4.42 | |
Class R5 | | | 1,000.00 | | | | 1,109.10 | | | | 2.09 | |
Class R6 | | | 1,000.00 | | | | 1,110.20 | | | | 3.52 | |
| |
Hypothetical (5% return before expenses) | | | | | |
Class A | | | 1,000.00 | | | | 1,019.81 | | | | 5.46 | |
Class C | | | 1,000.00 | | | | 1,015.93 | | | | 9.39 | |
Class R | | | 1,000.00 | | | | 1,018.50 | | | | 6.79 | |
Class Y | | | 1,000.00 | | | | 1,021.02 | | | | 4.24 | |
Class R5 | | | 1,000.00 | | | | 1,021.53 | | | | 3.73 | |
Class R6 | | | 1,000.00 | | | | 1,021.88 | | | | 3.37 | |
1. Actual expenses paid for Class A, C, R, Y, and R6 are equal to the Fund’s annualized expense ratio for that class, multiplied by the average account value over the period, multiplied by 184/365(to reflect theone-half year period). Actual expenses paid for Class R5 are equal to the Fund’s annualized expense ratio for that class, multiplied by the average account value over the period, multiplied by 99/365 to reflect the period from after the close of business on May 24, 2019 (inception of offering) to August 31, 2019.
2.Hypothetical expenses paid for all classes are equal to the Fund’s annualized expense ratio for that class, multiplied by the average account value over the period, multiplied by 184/365(to reflect theone-half year period).
Those annualized expense ratios, excluding indirect expenses from affiliated funds, based on the6-month period ended August 31, 2019 for Classes A, C, R, Y and R6and for the period from after the close of business on May 24, 2019 (inception of offering) to August 31, 2019 for Class R5 are as follows:
| | | | |
| Class | | Expense Ratios | |
Class A | | | 1.07 | % |
Class C | | | 1.84 | |
Class R | | | 1.33 | |
Class Y | | | 0.83 | |
Class R5 | | | 0.73 | |
Class R6 | | | 0.66 | |
The expense ratios reflect voluntary and/or contractual waivers and/or reimbursements of expenses by the Fund’s Manager. Some of these undertakings may be modified or terminated at any time, as indicated in the Fund’s prospectus. The “Financial Highlights” tables in the
12 INVESCO OPPENHEIMER DISCOVERY FUND
Fund’s financial statements, included in this report, also show the gross expense ratios, without such waivers or reimbursements and reduction to custodian expenses, if applicable.
13 INVESCO OPPENHEIMER DISCOVERY FUND
SCHEDULE OF INVESTMENTSAugust 31, 2019
| | | | | | | | |
| | | Shares | | | Value | |
| Common Stocks—97.5% | | | | | | | | |
| Consumer Discretionary—18.3% | | | | | |
| Distributors—2.1% | | | | | | | | |
| Pool Corp. | | | 286,250 | | | $ | 56,213,775 | |
| Diversified Consumer Services—3.7% | | | | | | | | |
| Bright Horizons Family Solutions, Inc.1 | | | 338,078 | | | | 55,799,774 | |
| Strategic Education, Inc. | | | 255,340 | | | | 43,211,188 | |
| | | | | | | | 99,010,962 | |
| Entertainment—0.8% | | | | | |
| Zynga, Inc., Cl. A1 | | | 3,985,100 | | | | 22,754,921 | |
| Hotels, Restaurants & Leisure—4.8% | | | | | |
| Choice Hotels International, Inc. | | | 241,310 | | | | 21,954,384 | |
| Eldorado Resorts, Inc.1 | | | 173,080 | | | | 6,665,311 | |
| Planet Fitness, Inc., Cl. A1 | | | 775,800 | | | | 54,779,238 | |
| Wingstop, Inc. | | | 455,450 | | | | 45,622,426 | |
| | | | | | | | 129,021,359 | |
| Household Durables—2.0% | | | | | |
| Roku, Inc., Cl. A1 | | | 360,990 | | | | 54,639,446 | |
| Internet & Catalog Retail—1.6% | | | | | |
| Etsy, Inc.1 | | | 839,720 | | | | 44,328,819 | |
| Media—1.3% | | | | | |
| Cable One, Inc. | | | 26,220 | | | | 34,023,596 | |
| Multiline Retail—0.4% | | | | | |
| Ollie’s Bargain Outlet Holdings, Inc.1 | | | 192,190 | | | | 10,656,936 | |
| Specialty Retail—1.2% | | | | | |
| Boot Barn Holdings, Inc.1 | | | 975,830 | | | | 33,422,178 | |
| Textiles, Apparel & Luxury Goods—0.4% | | | | | |
| Canada Goose Holdings, Inc.1 | | | 322,720 | | | | 12,037,456 | |
| Consumer Staples—4.1% | | | | | | | | |
| Beverages—0.4% | | | | | |
| Boston Beer Co., Inc. (The), Cl. A1 | | | 23,240 | | | | 10,188,881 | |
| Food & Staples Retailing—0.4% | | | | | |
| Grocery Outlet Holding Corp.1 | | | 278,280 | | | | 11,256,426 | |
| | | | | | | | |
| | | Shares | | | Value | |
| Food Products—3.3% | | | | | |
| Freshpet, Inc.1 | | | 636,810 | | | $ | 31,254,635 | |
| Nomad Foods Ltd.1 | | | 668,860 | | | | 13,477,529 | |
| Post Holdings, Inc.1 | | | 97,230 | | | | 9,692,858 | |
| Simply Good Foods Co. (The)1 | | | 1,194,890 | | | | 35,404,591 | |
| | | | | | | | 89,829,613 | |
| Energy—0.4% | | | | | | | | |
| Oil, Gas & Consumable Fuels—0.4% | | | | | |
Matador Resources Co.1 | | | 731,540 | | | | 11,448,601 | |
| Financials—8.2% | | | | | | | | |
| Capital Markets—2.6% | | | | | |
| Hamilton Lane, Inc., Cl. A | | | 633,387 | | | | 39,358,668 | |
| LPL Financial Holdings, Inc. | | | 427,470 | | | | 32,038,877 | |
| | | | | | | | 71,397,545 | |
| Commercial Banks—0.4% | | | | | |
Pinnacle Financial Partners, Inc. | | | 182,990 | | | | 9,638,083 | |
| Insurance—3.2% | | | | | |
| eHealth, Inc.1 | | | 261,740 | | | | 21,805,560 | |
| Kemper Corp. | | | 202,030 | | | | 14,138,059 | |
| Kinsale Capital Group, Inc. | | | 302,306 | | | | 29,695,518 | |
| Primerica, Inc. | | | 184,670 | | | | 22,007,124 | |
| | | | | | | | 87,646,261 | |
| Real Estate Investment Trusts (REITs)—2.0% | | | | | |
| Americold Realty Trust | | | 281,790 | | | | 10,262,792 | |
| CoreSite Realty Corp. | | | 161,800 | | | | 18,797,924 | |
| First Industrial Realty Trust, Inc. | | | 627,330 | | | | 24,434,503 | |
| | | | | | | | 53,495,219 | |
| Health Care—22.9% | | | | | | | | |
| Biotechnology—5.7% | | | | | |
| Agios Pharmaceuticals, Inc.1 | | | 323,920 | | | | 12,292,764 | |
| Amicus Therapeutics, Inc.1 | | | 873,580 | | | | 8,639,706 | |
| CareDx, Inc.1 | | | 537,140 | | | | 12,257,535 | |
| Genomic Health, Inc.1 | | | 462,720 | | | | 35,472,115 | |
| Global Blood Therapeutics, Inc.1 | | | 212,020 | | | | 9,748,680 | |
14 INVESCO OPPENHEIMER DISCOVERY FUND
| | | | | | | | |
| | | Shares | | | Value | |
| Biotechnology (Continued) | | | | | |
| Repligen Corp.1 | | | 697,503 | | | $ | 64,735,253 | |
| Veracyte, Inc.1 | | | 399,230 | | | | 10,579,595 | |
| | | | | | | | 153,725,648 | |
| Health Care Equipment & Supplies—9.3% | |
| CryoPort, Inc.1 | | | 428,580 | | | | 9,325,901 | |
| Glaukos Corp.1 | | | 298,970 | | | | 19,226,761 | |
| Haemonetics Corp.1 | | | 120,700 | | | | 16,117,071 | |
| Insulet Corp.1 | | | 363,750 | | | | 56,079,337 | |
| iRhythm Technologies, Inc.1 | | | 326,810 | | | | 24,876,777 | |
| Masimo Corp.1 | | | 297,250 | | | | 45,553,562 | |
| Novocure Ltd.1 | | | 245,840 | | | | 22,337,022 | |
| Penumbra, Inc.1 | | | 186,230 | | | | 27,105,777 | |
| Tandem Diabetes Care, Inc.1 | | | 214,550 | | | | 15,539,857 | |
| Wright Medical Group NV1 | | | 779,620 | | | | 16,255,077 | |
| | | | | | | | 252,417,142 | |
| Health Care Providers & Services—1.5% | |
| Addus HomeCare Corp.1 | | | 76,360 | | | | 6,718,153 | |
| Amedisys, Inc.1 | | | 175,960 | | | | 22,647,811 | |
| HealthEquity, Inc.1 | | | 206,330 | | | | 12,247,749 | |
| | | | | | | | 41,613,713 | |
| Health Care Technology—2.5% | |
| Inspire Medical Systems, Inc.1 | | | 331,380 | | | | 23,034,224 | |
| Omnicell, Inc.1 | | | 393,170 | | | | 28,229,606 | |
| Teladoc Health, Inc.1 | | | 311,260 | | | | 18,015,729 | |
| | | | | | | | 69,279,559 | |
| Life Sciences Tools & Services—3.9% | |
| Adaptive Biotechnologies Corp.1 | | | 87,027 | | | | 4,425,323 | |
| Bio-Techne Corp. | | | 256,590 | | | | 49,154,946 | |
| Medpace Holdings, Inc.1 | | | 279,460 | | | | 22,611,109 | |
| PRA Health Sciences, Inc.1 | | | 301,274 | | | | 29,777,922 | |
| | | | | | | | 105,969,300 | |
| Industrials—16.9% | | | | | | | | |
| Aerospace & Defense—5.2% | |
| Aerojet Rocketdyne Holdings, Inc.1 | | | 661,640 | | | | 34,557,457 | |
| HEICO Corp. | | | 198,305 | | | | 28,688,784 | |
| Hexcel Corp. | | | 81,370 | | | | 6,847,286 | |
| | | | | | | | |
| | | Shares | | | Value | |
| Aerospace & Defense (Continued) | | | | | |
| Kratos Defense & Security Solutions, Inc.1 | | | 913,440 | | | $ | 18,241,397 | |
| Mercury Systems, Inc.1 | | | 623,603 | | | | 53,399,125 | |
| | | | | | | | 141,734,049 | |
| Building Products—0.9% | | | | | |
| Trex Co., Inc.1 | | | 278,300 | | | | 23,802,999 | |
| Commercial Services & Supplies—3.0% | |
| Casella Waste Systems, Inc., Cl. A1 | | | 861,480 | | | | 39,197,340 | |
| Clean Harbors, Inc.1 | | | 269,900 | | | | 19,851,145 | |
| IAA, Inc.1 | | | 434,113 | | | | 21,206,420 | |
| | | | | | | | 80,254,905 | |
| Machinery—6.8% | | | | | |
| Chart Industries, Inc.1 | | | 517,700 | | | | 32,532,268 | |
| ITT, Inc. | | | 475,690 | | | | 27,076,275 | |
| John Bean Technologies Corp. | | | 121,760 | | | | 12,458,483 | |
| Kornit Digital Ltd.1 | | | 697,550 | | | | 19,677,886 | |
| RBC Bearings, Inc.1 | | | 356,490 | | | | 56,870,850 | |
| Woodward, Inc. | | | 344,470 | | | | 37,151,089 | |
| | | | | | | | 185,766,851 | |
| Professional Services—1.0% | | | | | |
| Insperity, Inc. | | | 278,920 | | | | 27,629,815 | |
| Information Technology—25.5% | | | | | | | | |
| Electronic Equipment, Instruments, & Components—0.8% | |
| Novanta, Inc.1 | | | 272,630 | | | | 20,447,250 | |
| IT Services—4.1% | | | | | |
| Euronet Worldwide, Inc.1 | | | 219,660 | | | | 33,638,732 | |
| ManTech International Corp., Cl. A | | | 480,320 | | | | 33,756,890 | |
| MongoDB, Inc., Cl. A1 | | | 288,910 | | | | 44,003,882 | |
| | | | | | | | 111,399,504 | |
| Semiconductors & Semiconductor Equipment—3.6% | |
| Lattice Semiconductor Corp.1 | | | 1,388,690 | | | | 27,343,306 | |
| MKS Instruments, Inc. | | | 186,430 | | | | 14,595,605 | |
15 INVESCO OPPENHEIMER DISCOVERY FUND
SCHEDULE OF INVESTMENTSContinued
| | | | | | | | |
| | | Shares | | | Value | |
| Semiconductors & Semiconductor Equipment (Continued) | |
| Monolithic Power Systems, Inc. | | | 279,827 | | | $ | 42,130,753 | |
| Silicon Laboratories, Inc.1 | | | 128,520 | | | | 14,008,680 | |
| | | | | | | | 98,078,344 | |
| Software—17.0% | | | | | |
| Alteryx, Inc., Cl. A1 | | | 264,780 | | | | 37,717,911 | |
| Anaplan, Inc.1 | | | 566,760 | | | | 30,792,071 | |
| Avalara, Inc.1 | | | 172,810 | | | | 14,574,796 | |
| Coupa Software, Inc.1 | | | 387,010 | | | | 53,767,299 | |
| CyberArk Software Ltd.1 | | | 143,770 | | | | 16,151,122 | |
| Envestnet, Inc.1 | | | 234,820 | | | | 13,434,052 | |
| Everbridge, Inc.1 | | | 358,467 | | | | 30,899,855 | |
| Globant SA1 | | | 33,500 | | | | 3,180,155 | |
| HubSpot, Inc.1 | | | 260,501 | | | | 52,016,840 | |
| Medallia, Inc.1 | | | 216,110 | | | | 7,697,838 | |
| Pagerduty, Inc.1 | | | 74,020 | | | | 2,906,765 | |
| Paylocity Holding Corp.1 | | | 305,820 | | | | 33,401,660 | |
| Q2 Holdings, Inc.1 | | | 345,690 | | | | 31,094,816 | |
| Rapid7, Inc.1 | | | 422,650 | | | | 22,692,079 | |
| RingCentral, Inc., Cl. A1 | | | 384,210 | | | | 54,223,557 | |
| | | | | | | | |
| | | Shares | | | Value | |
| Software (Continued) | | | | | |
| Trade Desk, Inc. (The), Cl. A1 | | | 230,320 | | | $ | 56,605,746 | |
| | | | | | | | 461,156,562 | |
| Materials—1.2% | | | | | | | | |
| Chemicals—0.7% | | | | | |
| Ingevity Corp.1 | | | 253,580 | | | | 19,315,189 | |
| Containers & Packaging—0.5% | | | | | | | | |
| Graphic Packaging Holding Co. | | | 998,550 | | | | 13,789,975 | |
Total Common Stocks (Cost $1,855,673,466) | | | | | | | 2,647,390,882 | |
| Investment Company—2.2% | | | | | | | | |
Invesco Government & Agency Portfolio, Institutional Class, 2.02%2
(Cost $59,236,466) | | | 59,236,466 | | | | 59,237,118 | |
Total Investments, at Value (Cost $1,914,909,932) | | | 99.7% | | | | 2,706,628,000 | |
| Net Other Assets (Liabilities) | | | 0.3 | | | | 9,434,411 | |
| Net Assets | | | 100.0% | | | $ | 2,716,062,411 | |
| | | | | | | | |
Footnotes to Schedule of Investments
1.Non-income producing security.
2. The money market fund and the Fund are affiliated by having the same investment adviser. The rate shown is the7-day SEC standardized yield as of August 31, 2019.
See accompanying Notes to Financial Statements.
16 INVESCO OPPENHEIMER DISCOVERY FUND
STATEMENT OF ASSETS AND LIABILITIESAugust 31, 2019
| | | | |
| Assets | | | | |
| Investments, at value—see accompanying schedule of investments: | | | | |
| Unaffiliated companies (cost $1,855,673,466) | | $ | 2,647,390,882 | |
| Affiliated companies (cost $59,236,466) | | | 59,237,118 | |
| | | | |
| | | 2,706,628,000 | |
| Cash | | | 948,579 | |
| Receivables and other assets: | | | | |
| Investments sold | | | 25,213,887 | |
| Shares of beneficial interest sold | | | 1,208,474 | |
| Dividends | | | 565,324 | |
| Other | | | 163,867 | |
| | | | |
Total assets | | | 2,734,728,131 | |
| Liabilities | | | | |
| Payables and other liabilities: | | | | |
| Investments purchased | | | 12,765,959 | |
| Shares of beneficial interest redeemed | | | 3,841,438 | |
| Transfer and shareholder servicing agent fees | | | 1,057,325 | |
| Distribution and service plan fees | | | 393,715 | |
| Trustees’ compensation | | | 254,100 | |
| Shareholder communications | | | 218,000 | |
| Advisory fees | | | 92,495 | |
| Administration fees | | | 655 | |
| Other | | | 42,033 | |
| | | | |
Total liabilities | | | 18,665,720 | |
Net Assets | | $ | 2,716,062,411 | |
| | | | |
| | | | |
| Composition of Net Assets | | | | |
| Shares of beneficial interest | | $ | 1,797,761,342 | |
| Total distributable earnings | | | 918,301,069 | |
| | | | |
| Net Assets | | $ | 2,716,062,411 | |
| | | | |
17 INVESCO OPPENHEIMER DISCOVERY FUND
STATEMENT OF ASSETS AND LIABILITIESContinued
| | | | |
| Net Asset Value Per Share | | | | |
| Class A Shares: | | | | |
| |
| Net asset value and redemption price per share (based on net assets of $1,432,063,733 and 17,043,755 shares of beneficial interest outstanding) | | $ | 84.02 | |
| |
| Maximum offering price per share (net asset value plus sales charge of 5.50% of offering price) | | $ | 88.91 | |
| |
| Class C Shares: | | | | |
| |
| Net asset value, redemption price (excludes applicable contingent deferred sales charge) and offering price per share (based on net assets of $78,074,588 and 1,406,786 shares of beneficial interest outstanding) | | $ | 55.50 | |
| |
| Class R Shares: | | | | |
| |
| Net asset value, redemption price and offering price per share (based on net assets of $53,737,496 and 703,064 shares of beneficial interest outstanding) | | $ | 76.43 | |
| |
| Class Y Shares: | | | | |
| |
| Net asset value, redemption price and offering price per share (based on net assets of $882,529,833 and 9,104,347 shares of beneficial interest outstanding) | | $ | 96.93 | |
| |
| Class R5 Shares: | | | | |
| |
| Net asset value, redemption price and offering price per share (based on net assets of $11,354.36 and 135 shares of beneficial interest outstanding) | | $ | 84.11 | |
| |
| Class R6 Shares: | | | | |
| |
| Net asset value, redemption price and offering price per share (based on net assets of $269,645,407 and 2,725,887 shares of beneficial interest outstanding) | | $ | 98.92 | |
See accompanying Notes to Financial Statements.
18 INVESCO OPPENHEIMER DISCOVERY FUND
STATEMENT OF
OPERATIONS
| | | | | | | | |
| | | Eleven Months Ended
August 31, 2019 | | Year Ended
September 30, 2018 |
| Investment Income | | | | | | | | |
| Dividends: | | | | | | | | |
| Unaffiliated companies | | | $ 6,929,614 | | | $ | 6,361,961 | |
| Affiliated companies | | | 1,393,007 | | | | 788,530 | |
| Interest | | | 19,826 | | | | 17,036 | |
| Total investment income | | | 8,342,447 | | | | 7,167,527 | |
| Expenses | | | | | | | | |
| | |
| Advisory fees | | | 14,155,690 | | | | 14,721,592 | |
| Administration fees | | | 100,173 | | | | — | |
| Distribution and service plan fees: | | | | | | | | |
| Class A | | | 2,800,653 | | | | 3,108,644 | |
| Class B | | | — | | | | 24,123 | |
| Class C | | | 1,147,588 | | | | 1,473,121 | |
| Class R | | | 226,260 | | | | 253,246 | |
| Transfer and shareholder servicing agent fees: | | | | | | | | |
| Class A | | | 2,352,978 | | | | 2,648,628 | |
| Class B | | | — | | | | 5,111 | |
| Class C | | | 226,835 | | | | 297,791 | |
| Class R | | | 89,847 | | | | 102,763 | |
| Class Y | | | 1,387,386 | | | | 1,259,212 | |
| Class R5 | | | 2 | | | | — | |
| Class R6 | | | 51,359 | | | | 58,056 | |
| Shareholder communications: | | | | | | | | |
| Class A | | | 126,668 | | | | 15,854 | |
| Class B | | | — | | | | 636 | |
| Class C | | | 8,429 | | | | 2,036 | |
| Class R | | | 4,566 | | | | 671 | |
| Class Y | | | 75,319 | | | | 11,053 | |
| Class R5 | | | 1 | | | | — | |
| Class R6 | | | 23,801 | | | | 5,261 | |
| Borrowing fees | | | 45,541 | | | | 76,420 | |
| Trustees’ compensation | | | 35,841 | | | | 36,404 | |
| Custodian fees and expenses | | | 12,511 | | | | 12,144 | |
| Other | | | 81,092 | | | | 92,511 | |
| Total expenses | | | 22,952,540 | | | | 24,205,277 | |
| Less waivers and reimbursements of expenses | | | (178,442 | ) | | | (124,394 | ) |
| Net expenses | | | 22,774,098 | | | | 24,080,883 | |
| Net Investment Loss | | | (14,431,651 | ) | | | (16,913,356 | ) |
19 INVESCO OPPENHEIMER DISCOVERY FUND
STATEMENT OF
OPERATIONSContinued
| | | | | | | | |
| | | Eleven Months Ended
August 31, 2019 | | | Year Ended
September 30, 2018 |
| Realized and Unrealized Gain | | | | | | | | |
| Net realized gain on investment transactions in unaffiliated companies | | | $ 146,099,558 | | | $ | 388,319,330 | |
| Net change in unrealized appreciation/(depreciation) on: | | | | | | | | |
| | |
| Investment transactions in: | | | | | | | | |
| | |
Unaffiliated companies | | | (24,323,696 | ) | | | 255,222,433 | |
| | |
Affiliated companies | | | 652 | | | | — | |
| | |
| Net change in unrealized appreciation/(depreciation) | | | (24,323,044 | ) | | | 255,222,433 | |
| Net Increase in Net Assets Resulting from Operations | | | $ 107,344,863 | | | $ | 626,628,407 | |
| | | | |
| | | | |
See accompanying Notes to Financial Statements.
20 INVESCO OPPENHEIMER DISCOVERY FUND
STATEMENT OF CHANGES IN NET ASSETS
| | | | | | | | | | | | |
| | | Eleven Months
Ended
August 31, 2019 | | Year Ended
September 30, 2018 | | Year Ended
September 30, 2017 |
| | | | |
| Operations | | | | | | | | | | | | |
| Net investment loss | | $ | (14,431,651 | ) | | $ | (16,913,356 | ) | | $ | (13,678,519 | ) |
| Net realized gain | | | 146,099,558 | | | | 388,319,330 | | | | 269,499,647 | |
| Net change in unrealized appreciation/(depreciation) | | | (24,323,044 | ) | | | 255,222,433 | | | | 91,674,584 | |
| | | | |
| Net increase in net assets resulting from operations | | | 107,344,863 | | | | 626,628,407 | | | | 347,495,712 | |
| Dividends and/or Distributions to Shareholders1 | | | | | | | | | | | | |
| Distributions to shareholders from distributable earnings: | | | | | | | | | | | | |
| Class A | | | (179,388,791 | ) | | | (140,360,259 | ) | | | (48,230,462 | ) |
| Class B | | | — | | | | (744,703 | ) | | | (797,340 | ) |
| Class C | | | (27,366,801 | ) | | | (21,255,871 | ) | | | (7,335,598 | ) |
| Class R | | | (7,472,621 | ) | | | (5,925,983 | ) | | | (2,196,039 | ) |
| Class Y | | | (87,711,278 | ) | | | (55,450,431 | ) | | | (15,681,586 | ) |
| Class R5 | | | — | | | | — | | | | — | |
| Class R6 | | | (27,886,666 | ) | | | (16,852,427 | ) | | | (3,438,997 | ) |
| | | | |
| Total distributions from distributable earnings | | | (329,826,157 | ) | | | (240,589,674 | ) | | | (77,680,022 | ) |
| | | | |
| Beneficial Interest Transactions | | | | | | | | | | | | |
| Net increase (decrease) in net assets resulting from beneficial interest transactions: | | | | | | | | | | | | |
| Class A | | | 115,239,397 | | | | 21,856,796 | | | | (153,858,464 | ) |
| Class B | | | — | | | | (7,076,245 | ) | | | (11,115,182 | ) |
| Class C | | | (55,069,706 | ) | | | 2,015,272 | | | | (18,123,268 | ) |
| Class R | | | 4,308,971 | | | | (1,304,448 | ) | | | (9,192,531 | ) |
| Class Y | | | 142,156,860 | | | | 159,246,749 | | | | 18,795,168 | |
| Class R5 | | | 10,497 | | | | — | | | | — | |
| Class R6 | | | 28,790,000 | | | | 65,963,804 | | | | 41,438,199 | |
| | | | |
| Total beneficial interest transactions | | | 235,436,019 | | | | 240,701,928 | | | | (132,056,078 | ) |
| Net Assets | | | | | | | | | | | | |
| Total increase | | | 12,954,725 | | | | 626,740,661 | | | | 137,759,612 | |
| Beginning of period | | | 2,703,107,686 | | | | 2,076,367,025 | | | | 1,938,607,413 | |
| | | | |
| End of period | | $ | 2,716,062,411 | | | $ | 2,703,107,686 | | | $ | 2,076,367,025 | |
| | | | |
1. The Securities and Exchange Commission eliminated the requirement to disclose the distribution components separately, except for a tax return of capital. For the year ended September 30, 2018, and September 30, 2017 distributions to shareholders from distributable earnings consisted of distributions from net realized gains.
See accompanying Notes to Financial Statements.
21 INVESCO OPPENHEIMER DISCOVERY FUND
FINANCIAL HIGHLIGHTS
| | | | | | | | | | | | | | | | | | | | | | | | |
| | | Eleven Months
Ended | | | Year Ended | | | Year Ended | | | Year Ended | | | Year Ended | | | Year Ended | |
| Class A | | August 31,
2019 | | | September
30, 2018 | | | September
30, 2017 | | | September
30, 2016 | | | September
30, 2015 | | | September
30, 2014 | |
| Per Share Operating Data | | | | | | | | | | | | | | | | | | | | | | | | |
| Net asset value, beginning of period | | | $94.78 | | | | $81.76 | | | | $71.38 | | | | $71.30 | | | | $72.35 | | | | $79.80 | |
| Income (loss) from investment operations: | | | | | | | | | | | | | | | | | | | | | | | | |
| Net investment loss1 | | | (0.50) | | | | (0.65) | | | | (0.53) | | | | (0.51) | | | | (0.49)2 | | | | (0.66) | |
| Net realized and unrealized gain (loss) | | | 1.69 | | | | 23.33 | | | | 13.84 | | | | 5.23 | | | | 6.45 | | | | (0.80) | |
| Total from investment operations | | | 1.19 | | | | 22.68 | | | | 13.31 | | | | 4.72 | | | | 5.96 | | | | (1.46) | |
| Dividends and/or distributions to shareholders: | | | | | | | | | | | | | | | | | | | | | | | | |
| Distributions from net realized gain | | | (11.95) | | | | (9.66) | | | | (2.93) | | | | (4.64) | | | | (7.01) | | | | (5.99) | |
| Net asset value, end of period | | | $84.02 | | | | $94.78 | | | | $81.76 | | | | $71.38 | | | | $71.30 | | | | $72.35 | |
| | | | |
| | | | | | | | | | | | | | | | | | | | | | | | |
| Total Return, at Net Asset Value3 | | | 4.57% | | | | 30.77% | | | | 19.44%4 | | | | 6.81%4 | | | | 8.43% | | | | (2.21)% | |
| | | | | | | | | | | | | | | | | | | | | | | | |
| Ratios/Supplemental Data | | | | | | | | | | | | | | | | | | | | | | | | |
| Net assets, end of period (in thousands) | | | $1,432,064 | | | | $1,442,859 | | | | $1,208,643 | | | | $1,202,463 | | | | $1,244,242 | | | | $1,258,537 | |
| Average net assets (in thousands) | | | $1,297,109 | | | | $1,319,450 | | | | $1,173,288 | | | | $1,182,925 | | | | $1,334,300 | | | | $1,469,328 | |
| Ratios to average net assets:5 | | | | | | | | | | | | | | | | | | | | | | | | |
| Net investment loss | | | (0.70)% | | | | (0.76)% | | | | (0.72)% | | | | (0.76)% | | | | (0.66)%2 | | | | (0.87)% | |
| Expenses excluding specific expenses listed below | | | 1.08% | | | | 1.07% | | | | 1.11% | | | | 1.11% | | | | 1.10% | | | | 1.12% | |
| Interest and fees from borrowings | | | 0.00%6 | | | | 0.00%6 | | | | 0.00%6 | | | | 0.00%6 | | | | 0.00%6 | | | | 0.00% | |
| Total expenses7 | | | 1.08% | | | | 1.07% | | | | 1.11% | | | | 1.11% | | | | 1.10% | | | | 1.12% | |
| Expenses after payments, waivers and/or reimbursements and reduction to custodian expenses | | | 1.08%8 | | | | 1.07%8 | | | | 1.10% | | | | 1.11%8 | | | | 1.10%8 | | | | 1.12%8 | |
| Portfolio turnover rate9 | | | 83% | | | | 91% | | | | 107% | | | | 89% | | | | 88% | | | | 87% | |
22 INVESCO OPPENHEIMER DISCOVERY FUND
1. Per share amounts calculated based on the average shares outstanding during the period.
2. Net investment loss per share and the net investment loss ratio include $0.10 and 0.13%, respectively, resulting from a special dividend from HSN, Inc. in February 2015.
3. Assumes an initial investment on the business day before the first day of the fiscal period, with all dividends and distributions reinvested in additional shares on the reinvestment date, and redemption at the net asset value calculated on the last business day of the fiscal period. Sales charges are not reflected in the total returns. Total returns are not annualized for periods less than one full year. Returns do not reflect the deduction of taxes that a shareholder would pay on fund distributions or the redemption of fund shares.
4. The return does not include adjustments in accordance with generally accepted accounting principles required at the period end for financial reporting purposes.
5. Annualized for periods less than one full year.
6. Less than 0.005%.
7. Total expenses including indirect expenses from affiliated fund fees and expenses were as follows:
| | | | | | |
| Eleven Months Ended August 31, 2019 | | | 1.08 | % | | |
| Year Ended September 30, 2018 | | | 1.07 | % |
| Year Ended September 30, 2017 | | | 1.11 | % | | |
| Year Ended September 30, 2016 | | | 1.11 | % |
| Year Ended September 30, 2015 | | | 1.10 | % | | |
| Year Ended September 30, 2014 | | | 1.12 | % |
8. Waiver was less than 0.005%.
9. Portfolio turnover is calculated at the fund level and is not annualized for periods less than one year, if applicable.
See accompanying Notes to Financial Statements.
23 INVESCO OPPENHEIMER DISCOVERY FUND
FINANCIAL HIGHLIGHTSContinued
| | | | | | | | | | | | | | | | | | | | | | | | |
Class C | | Eleven Months
Ended | | | Year Ended | | | Year Ended | | | Year Ended | | | Year Ended | | | Year Ended | |
| | August 31,
2019 | | | September
30, 2018 | | | September
30, 2017 | | | September
30, 2016 | | | September
30, 2015 | | | September
30, 2014 | |
| Per Share Operating Data | | | | | | | | | | | | | | | | | | | | | | | | |
| Net asset value, beginning of period | | | $67.90 | | | | $61.61 | | | | $54.91 | | | | $56.27 | | | | $58.89 | | | | $66.50 | |
| Income (loss) from investment operations: | | | | | | | | | | | | | | | | | | | | | | | | |
| Net investment loss1 | | | (0.70) | | | | (0.94) | | | | (0.83) | | | | (0.79) | | | | (0.84)2 | | | | (1.02) | |
| Net realized and unrealized gain (loss) | | | 0.25 | | | | 16.89 | | | | 10.46 | | | | 4.07 | | | | 5.23 | | | | (0.60) | |
| Total from investment operations | | | (0.45) | | | | 15.95 | | | | 9.63 | | | | 3.28 | | | | 4.39 | | | | (1.62) | |
| Dividends and/or distributions to shareholders: | | | | | | | | | | | | | | | | | | | | | | | | |
| Distributions from net realized gain | | | (11.95) | | | | (9.66) | | | | (2.93) | | | | (4.64) | | | | (7.01) | | | | (5.99) | |
| Net asset value, end of period | | | $55.50 | | | | $67.90 | | | | $61.61 | | | | $54.91 | | | | $56.27 | | | | $58.89 | |
| | | | |
| | | | | | | | | | | | | | | | | | | | | | | | |
| Total Return, at Net Asset Value3 | | | 3.84% | | | | 29.78% | | | | 18.52%4 | | | | 6.02%4 | | | | 7.62% | | | | (2.94)% | |
| | | | | | | | | | | | | | | | | | | | | | | | |
| Ratios/Supplemental Data | | | | | | | | | | | | | | | | | | | | | | | | |
| Net assets, end of period (in thousands) | | | $78,075 | | | | $159,027 | | | | $139,622 | | | | $141,939 | | | | $156,114 | | | | $163,675 | |
| Average net assets (in thousands) | | | $125,025 | | | | $148,239 | | | | $136,955 | | | | $144,380 | | | | $169,437 | | | | $187,330 | |
| Ratios to average net assets:5 | | | | | | | | | | | | | | | | | | | | | | | | |
| Net investment loss | | | (1.47)% | | | | (1.52)% | | | | (1.48)% | | | | (1.52)% | | | | (1.41)%2 | | | | (1.62)% | |
| Expenses excluding specific expenses listed below | | | 1.84% | | | | 1.83% | | | | 1.86% | | | | 1.87% | | | | 1.86% | | | | 1.88% | |
| Interest and fees from borrowings | | | 0.00%6 | | | | 0.00%6 | | | | 0.00%6 | | | | 0.00%6 | | | | 0.00%6 | | | | 0.00% | |
| Total expenses7 | | | 1.84% | | | | 1.83% | | | | 1.86% | | | | 1.87% | | | | 1.86% | | | | 1.88% | |
| Expenses after payments, waivers and/or reimbursements and reduction to custodian expenses | | | 1.84%8 | | | | 1.83%8 | | | | 1.85% | | | | 1.87%8 | | | | 1.86%8 | | | | 1.88%8 | |
| Portfolio turnover rate9 | | | 83% | | | | 91% | | | | 107% | | | | 89% | | | | 88% | | | | 87% | |
24 INVESCO OPPENHEIMER DISCOVERY FUND
1. Per share amounts calculated based on the average shares outstanding during the period.
2. Net investment loss per share and the net investment loss ratio include $0.08 and 0.13%, respectively, resulting from a special dividend from HSN, Inc. in February 2015.
3. Assumes an initial investment on the business day before the first day of the fiscal period, with all dividends and distributions reinvested in additional shares on the reinvestment date, and redemption at the net asset value calculated on the last business day of the fiscal period. Sales charges are not reflected in the total returns. Total returns are not annualized for periods less than one full year. Returns do not reflect the deduction of taxes that a shareholder would pay on fund distributions or the redemption of fund shares.
4. The return does not include adjustments in accordance with generally accepted accounting principles required at the period end for financial reporting purposes.
5. Annualized for periods less than one full year.
6. Less than 0.005%.
7. Total expenses including indirect expenses from affiliated fund fees and expenses were as follows:
| | | | | | |
| Eleven Months Ended August 31, 2019 | | | 1.84 | % | | |
| Year Ended September 30, 2018 | | | 1.83 | % | | |
| Year Ended September 30, 2017 | | | 1.86 | % | | |
| Year Ended September 30, 2016 | | | 1.87 | % | | |
| Year Ended September 30, 2015 | | | 1.86 | % | | |
| Year Ended September 30, 2014 | | | 1.88 | % | | |
8. Waiver was less than 0.005%.
9. Portfolio turnover is calculated at the fund level and is not annualized for periods less than one year, if applicable.
See accompanying Notes to Financial Statements.
25 INVESCO OPPENHEIMER DISCOVERY FUND
FINANCIAL HIGHLIGHTSContinued
| | | | | | | | | | | | | | | | | | | | | | | | |
| Class R | | Eleven Months
Ended | | | Year Ended | | | Year Ended | | | Year Ended | | | Year Ended | | | Year Ended | |
| | August 31,
2019 | | | September
30, 2018 | | | September
30, 2017 | | | September
30, 2016 | | | September
30, 2015 | | | September
30, 2014 | |
| Per Share Operating Data | | | | | | | | | | | | | | | | | | | | | | | | |
| Net asset value, beginning of period | | | $87.70 | | | | $76.52 | | | | $67.17 | | | | $67.52 | | | | $69.02 | | | | $76.59 | |
| Income (loss) from investment operations: | | | | | | | | | | | | | | | | | | | | | | | | |
| Net investment loss1 | | | (0.62) | | | | (0.81) | | | | (0.68) | | | | (0.65) | | | | (0.65)2 | | | | (0.83) | |
| Net realized and unrealized gain (loss) | | | 1.30 | | | | 21.65 | | | | 12.96 | | | | 4.94 | | | | 6.16 | | | | (0.75) | |
| Total from investment operations | | | 0.68 | | | | 20.84 | | | | 12.28 | | | | 4.29 | | | | 5.51 | | | | (1.58) | |
| Dividends and/or distributions to shareholders: | | | | | | | | | | | | | | | | | | | | | | | | |
| Distributions from net realized gain | | | (11.95) | | | | (9.66) | | | | (2.93) | | | | (4.64) | | | | (7.01) | | | | (5.99) | |
| Net asset value, end of period | | | $76.43 | | | | $87.70 | | | | $76.52 | | | | $67.17 | | | | $67.52 | | | | $69.02 | |
| | | | |
| | | | | | | | | | | | | | | | | | | | | | | | |
| Total Return, at Net Asset Value3 | | | 4.32% | | | | 30.43% | | | | 19.11%4 | | | | 6.56%4 | | | | 8.13% | | | | (2.45)% | |
| | | | | | | | | | | | | | | | | | | | | | | | |
| Ratios/Supplemental Data | | | | | | | | | | | | | | | | | | | | | | | | |
| Net assets, end of period (in thousands) | | | $53,737 | | | | $54,734 | | | | $48,470 | | | | $51,465 | | | | $52,500 | | | | $55,092 | |
| Average net assets (in thousands) | | | $49,521 | | | | $51,151 | | | | $48,973 | | | | $49,740 | | | | $56,234 | | | | $62,176 | |
| Ratios to average net assets:5 | | | | | | | | | | | | | | | | | | | | | | | | |
| Net investment loss | | | (0.96)% | | | | (1.02)% | | | | (0.98)% | | | | (1.02)% | | | | (0.91)%2 | | | | (1.14)% | |
| Expenses excluding specific expenses listed below | | | 1.33% | | | | 1.33% | | | | 1.37% | | | | 1.37% | | | | 1.36% | | | | 1.39% | |
| Interest and fees from borrowings | | | 0.00%6 | | | | 0.00%6 | | | | 0.00%6 | | | | 0.00%6 | | | | 0.00%6 | | | | 0.00% | |
| Total expenses7 | | | 1.33% | | | | 1.33% | | | | 1.37% | | | | 1.37% | | | | 1.36% | | | | 1.39% | |
| Expenses after payments, waivers and/or reimbursements and reduction to custodian expenses | | | 1.33%8 | | | | 1.33%8 | | | | 1.36% | | | | 1.37%8 | | | | 1.36%8 | | | | 1.39%8 | |
| Portfolio turnover rate9 | | | 83% | | | | 91% | | | | 107% | | | | 89% | | | | 88% | | | | 87% | |
26 INVESCO OPPENHEIMER DISCOVERY FUND
1. Per share amounts calculated based on the average shares outstanding during the period.
2. Net investment loss per share and the net investment loss ratio include $0.10 and 0.13%, respectively, resulting from a special dividend from HSN, Inc. in February 2015.
3. Assumes an initial investment on the business day before the first day of the fiscal period, with all dividends and distributions reinvested in additional shares on the reinvestment date, and redemption at the net asset value calculated on the last business day of the fiscal period. Sales charges are not reflected in the total returns. Total returns are not annualized for periods less than one full year. Returns do not reflect the deduction of taxes that a shareholder would pay on fund distributions or the redemption of fund shares.
4. The return does not include adjustments in accordance with generally accepted accounting principles required at the period end for financial reporting purposes.
5. Annualized for periods less than one full year.
6. Less than 0.005%.
7. Total expenses including indirect expenses from affiliated fund fees and expenses were as follows:
| | | | | | |
| Eleven Months Ended August 31, 2019 | | | 1.33 | % | | |
| Year Ended September 30, 2018 | | | 1.33 | % | | |
| Year Ended September 30, 2017 | | | 1.37 | % | | |
| Year Ended September 30, 2016 | | | 1.37 | % | | |
| Year Ended September 30, 2015 | | | 1.36 | % | | |
| Year Ended September 30, 2014 | | | 1.39 | % | | |
8. Waiver was less than 0.005%.
9. Portfolio turnover is calculated at the fund level and is not annualized for periods less than one year, if applicable.
See accompanying Notes to Financial Statements.
27 INVESCO OPPENHEIMER DISCOVERY FUND
FINANCIAL HIGHLIGHTSContinued
| | | | | | | | | | | | | | | | | | | | | | | | |
| Class Y | | Eleven Months
Ended | | | Year Ended | | | Year Ended | | | Year Ended | | | Year Ended | | | Year Ended | |
| | August 31, 2019 | | | September 30, 2018 | | | September 30, 2017 | | | September 30, 2016 | | | September 30, 2015 | | | September 30, 2014 | |
| Per Share Operating Data | | | | | | | | | | | | | | | | | | | | | | | | |
| Net asset value, beginning of period | | | $106.92 | | | | $90.84 | | | | $78.81 | | | | $78.08 | | | | $78.42 | | | | $85.80 | |
| Income (loss) from investment operations: | | | | | | | | | | | | | | | | | | | | | | | | |
| Net investment loss1 | | | (0.38) | | | | (0.51) | | | | (0.39) | | | | (0.39) | | | | (0.35)2 | | | | (0.50) | |
| Net realized and unrealized gain (loss) | | | 2.34 | | | | 26.25 | | | | 15.35 | | | | 5.76 | | | | 7.02 | | | | (0.89) | |
| Total from investment operations | | | 1.96 | | | | 25.74 | | | | 14.96 | | | | 5.37 | | | | 6.67 | | | | (1.39) | |
| Dividends and/or distributions to shareholders: | | | | | | | | | | | | | | | | | | | | | | | | |
| Distributions from net realized gain | | | (11.95) | | | | (9.66) | | | | (2.93) | | | | (4.64) | | | | (7.01) | | | | (5.99) | |
| Net asset value, end of period | | | $96.93 | | | | $106.92 | | | | $90.84 | | | | $78.81 | | | | $78.08 | | | | $78.42 | |
| | | | |
| | | | | | | | | | | | | | | | | | | | | | | | |
| Total Return, at Net Asset Value3 | | | 4.80% | | | | 31.07% | | | | 19.70%4 | | | | 7.08%4 | | | | 8.69% | | | | (1.96)% | |
| | | | | | | | | | | | | | | | | | | | | | | | |
| | | | | | | |
| Ratios/Supplemental Data | | | | | | | | | | | | | | | | | | | | | | | | |
| Net assets, end of period (in thousands) | | | $882,530 | | | | $791,784 | | | | $518,827 | | | | $433,404 | | | | $454,040 | | | | $438,275 | |
| Average net assets (in thousands) | | | $764,724 | | | | $629,608 | | | | $453,060 | | | | $427,985 | | | | $449,539 | | | | $467,755 | |
| Ratios to average net assets:5 | | | | | | | | | | | | | | | | | | | | | | | | |
| Net investment loss | | | (0.47)% | | | | (0.53)% | | | | (0.48)% | | | | (0.52)% | | | | (0.42)%2 | | | | (0.61)% | |
| Expenses excluding specific expenses listed below | | | 0.84% | | | | 0.84% | | | | 0.87% | | | | 0.87% | | | | 0.86% | | | | 0.87% | |
| Interest and fees from borrowings | | | 0.00%6 | | | | 0.00%6 | | | | 0.00%6 | | | | 0.00%6 | | | | 0.00%6 | | | | 0.00% | |
| Total expenses7 | | | 0.84% | | | | 0.84% | | | | 0.87% | | | | 0.87% | | | | 0.86% | | | | 0.87% | |
| Expenses after payments, waivers and/or reimbursements and reduction to custodian expenses | | | 0.84%8 | | | | 0.84%8 | | | | 0.86% | | | | 0.87%8 | | | | 0.86%8 | | | | 0.87%8 | |
| Portfolio turnover rate9 | | | 83% | | | | 91% | | | | 107% | | | | 89% | | | | 88% | | | | 87% | |
28 INVESCO OPPENHEIMER DISCOVERY FUND
1. Per share amounts calculated based on the average shares outstanding during the period.
2. Net investment loss per share and the net investment loss ratio include $0.11 and 0.13%, respectively, resulting from a special dividend from HSN, Inc. in February 2015.
3. Assumes an initial investment on the business day before the first day of the fiscal period, with all dividends and distributions reinvested in additional shares on the reinvestment date, and redemption at the net asset value calculated on the last business day of the fiscal period. Sales charges are not reflected in the total returns. Total returns are not annualized for periods less than one full year. Returns do not reflect the deduction of taxes that a shareholder would pay on fund distributions or the redemption of fund shares.
4. The return does not include adjustments in accordance with generally accepted accounting principles required at the period end for financial reporting purposes.
5. Annualized for periods less than one full year.
6. Less than 0.005%.
7. Total expenses including indirect expenses from affiliated fund fees and expenses were as follows:
| | | | | | |
| Eleven Months Ended August 31, 2019 | | | 0.84 | % | | |
| Year Ended September 30, 2018 | | | 0.84 | % | | |
| Year Ended September 30, 2017 | | | 0.87 | % | | |
| Year Ended September 30, 2016 | | | 0.87 | % | | |
| Year Ended September 30, 2015 | | | 0.86 | % | | |
| Year Ended September 30, 2014 | | | 0.87 | % | | |
8. Waiver was less than 0.005%.
9. Portfolio turnover is calculated at the fund level and is not annualized for periods less than one year, if applicable.
See accompanying Notes to Financial Statements.
29 INVESCO OPPENHEIMER DISCOVERY FUND
FINANCIAL HIGHLIGHTSContinued
| | | | |
| Class R5 | | Period
Ended
August 31,
20191 | |
| Per Share Operating Data | | | | |
| Net asset value, beginning of period | | | $77.56 | |
| Income (loss) from investment operations: | | | | |
| Net investment loss2 | | | (0.08) | |
| Net realized and unrealized gain | | | 6.63 | |
| Total from investment operations | | | 6.55 | |
| Dividends and/or distributions to shareholders: | | | | |
| Distributions from net realized gain | | | 0.00 | |
| Net asset value, end of period | | | $84.11 | |
| | | | |
| | | | |
| | | | |
| Total Return, at Net Asset Value3 | | | 8.44% | |
| | | | |
| | |
| Ratios/Supplemental Data | | | | |
| Net assets, end of period (in thousands) | | | $11 | |
| Average net assets (in thousands) | | | $11 | |
| Ratios to average net assets:4 | | | | |
| Net investment loss | | | (0.34)% | |
| Expenses excluding specific expenses listed below | | | 0.71% | |
| Interest and fees from borrowings | | | 0.00% | |
| Total expenses5 | | | 0.71% | |
| Expenses after payments, waivers and/or reimbursements and reduction to custodian expenses | | | 0.71% | |
| Portfolio turnover rate6 | | | 83% | |
1. For the period from after the close of business on May 24, 2019 (inception of offering) to August 31, 2019.
2. Per share amounts calculated based on the average shares outstanding during the period.
3. Assumes an initial investment on the business day before the first day of the fiscal period, with all dividends and distributions reinvested in additional shares on the reinvestment date, and redemption at the net asset value calculated on the last business day of the fiscal period. Sales charges are not reflected in the total returns. Total returns are not annualized for periods less than one full year. Returns do not reflect the deduction of taxes that a shareholder would pay on fund distributions or the redemption of fund shares.
4. Annualized for periods less than one full year.
5. Total expenses including indirect expenses from affiliated fund fees and expenses were as follows:
| | | | | | |
| Period Ended August 31, 2019 | | | 0.71 | % | | |
6. Portfolio turnover is calculated at the fund level and is not annualized for periods less than one year, if applicable.
See accompanying Notes to Financial Statements.
30 INVESCO OPPENHEIMER DISCOVERY FUND
| | | | | | | | | | | | | | | | | | | | | | | | |
| | | | | | |
| Class R6 | | Eleven Months
Ended
August 31,
2019 | | | Year Ended September
30, 2018 | | | Year Ended
September
30, 2017 | | | Year Ended September
30, 2016 | | | Year Ended
September
30, 2015 | | | Year Ended September
30, 2014 | |
| Per Share Operating Data | | | | | | | | | | | | | | | | | | | | | | | | |
| Net asset value, beginning of period | | | $108.66 | | | | $92.03 | | | | $79.66 | | | | $78.73 | | | | $78.88 | | | | $86.11 | |
| Income (loss) from investment operations: | | | | | | | | | | | | | | | | | | | | | | | | |
| Net investment loss1 | | | (0.25) | | | | (0.35) | | | | (0.25) | | | | (0.24) | | | | (0.19)2 | | | | (0.34) | |
| Net realized and unrealized gain (loss) | | | 2.46 | | | | 26.64 | | | | 15.55 | | | | 5.81 | | | | 7.05 | | | | (0.90) | |
| Total from investment operations | | | 2.21 | | | | 26.29 | | | | 15.30 | | | | 5.57 | | | | 6.86 | | | | (1.24) | |
| Dividends and/or distributions to shareholders: | | | | | | | | | | | | | | | | | | | | | | | | |
| Distributions from net realized gain | | | (11.95) | | | | (9.66) | | | | (2.93) | | | | (4.64) | | | | (7.01) | | | | (5.99) | |
| Net asset value, end of period | | | $98.92 | | | | $108.66 | | | | $92.03 | | | | $79.66 | | | | $78.73 | | | | $78.88 | |
| | | | |
| | | | | | | | | | | | | | | | | | | | | | | | |
| Total Return, at Net Asset Value3 | | | 4.96% | | | | 31.29% | | | | 19.92%4 | | | | 7.28%4 | | | | 8.88% | | | | (1.75)% | |
| | | | | | | | | | | | | | | | | | | | | | | | |
| | | | | | | |
| Ratios/Supplemental Data | | | | | | | | | | | | | | | | | | | | | | | | |
| Net assets, end of period (in thousands) | | | $269,645 | | | | $254,704 | | | | $153,563 | | | | $91,907 | | | | $76,083 | | | | $51,668 | |
| Average net assets (in thousands) | | | $243,024 | | | | $193,907 | | | | $123,543 | | | | $81,211 | | | | $70,840 | | | | $51,768 | |
| Ratios to average net assets:5 | | | | | | | | | | | | | | | | | | | | | | | | |
| Net investment loss | | | (0.30)% | | | | (0.36)% | | | | (0.30)% | | | | (0.33)% | | | | (0.23)%2 | | | | (0.41)% | |
| Expenses excluding specific expenses listed below | | | 0.67% | | | | 0.67% | | | | 0.68% | | | | 0.68% | | | | 0.67% | | | | 0.67% | |
| Interest and fees from borrowings | | | 0.00%6 | | | | 0.00%6 | | | | 0.00%6 | | | | 0.00%6 | | | | 0.00%6 | | | | 0.00% | |
| Total expenses7 | | | 0.67% | | | | 0.67% | | | | 0.68% | | | | 0.68% | | | | 0.67% | | | | 0.67% | |
| Expenses after payments, waivers and/or reimbursements and reduction to custodian expenses | | | 0.67% | | | | 0.67%8 | | | | 0.68%8 | | | | 0.68%8 | | | | 0.67%8 | | | | 0.67%8 | |
| Portfolio turnover rate9 | | | 83% | | | | 91% | | | | 107% | | | | 89% | | | | 88% | | | | 87% | |
31 INVESCO OPPENHEIMER DISCOVERY FUND
FINANCIAL HIGHLIGHTSContinued
1. Per share amounts calculated based on the average shares outstanding during the period.
2. Net investment loss per share and the net investment loss ratio include $0.11 and 0.20%, respectively, resulting from a special dividend from HSN, Inc. in February 2015.
3. Assumes an initial investment on the business day before the first day of the fiscal period, with all dividends and distributions reinvested in additional shares on the reinvestment date, and redemption at the net asset value calculated on the last business day of the fiscal period. Sales charges are not reflected in the total returns. Total returns are not annualized for periods less than one full year. Returns do not reflect the deduction of taxes that a shareholder would pay on fund distributions or the redemption of fund shares.
4. The return does not include adjustments in accordance with generally accepted accounting principles required at the period end for financial reporting purposes.
5. Annualized for periods less than one full year.
6. Less than 0.005%.
7. Total expenses including indirect expenses from affiliated fund fees and expenses were as follows:
| | | | | | |
| Eleven Months Ended August 31, 2019 | | | 0.67 | % | | |
| Year Ended September 30, 2018 | | | 0.67 | % | | |
| Year Ended September 30, 2017 | | | 0.68 | % | | |
| Year Ended September 30, 2016 | | | 0.68 | % | | |
| Year Ended September 30, 2015 | | | 0.67 | % | | |
| Year Ended September 30, 2014 | | | 0.67 | % | | |
8. Waiver was less than 0.005%.
9. Portfolio turnover is calculated at the fund level and is not annualized for periods less than one year, if applicable.
See accompanying Notes to Financial Statements.
32 INVESCO OPPENHEIMER DISCOVERY FUND
NOTES TO FINANCIAL STATEMENTSAugust 31, 2019
Note 1 – Significant Accounting Policies
Invesco Oppenheimer Discovery Fund (the “Fund”) is a series portfolio of AIM Counselor Series Trust (Invesco Counselor Series Trust) (the “Trust”). The Trust is a Delaware statutory trust registered under the Investment Company Act of 1940, as amended (the “1940 Act”), as anopen-end series management investment company authorized to issue an unlimited number of shares of beneficial interest. Information presented in these financial statements pertains only to the Fund. Matters affecting the Fund or each class will be voted on exclusively by the shareholders of such Fund or each class.
Prior to the close of business on May 24, 2019, the Fund operated as Oppenheimer Discovery Fund (the “Acquired Fund” or “Predecessor Fund”). The Acquired Fund was reorganized after the close of business on May 24, 2019 (the “Reorganization Date”) through the transfer of all of its assets and liabilities to the Fund (the “Reorganization”).
Upon closing of the Reorganization, holders of the Acquired Fund’s Class A, Class C, Class R, and Class Y shares received the corresponding class of shares of the Fund and holders of the Acquired Fund’s Class I shares received Class R6 shares of the Fund. Information for the Acquired Fund’s Class I shares prior to the Reorganization is included with Class R6 shares throughout this report. Class R5 shares commenced operations on the Reorganization Date.
Effective August 31, 2019, the Fund’s fiscal year end changed from September 30toAugust 31.
The Fund’s investment objective is to seek capital appreciation.
The Fund currently consists of six different classes of shares: Class A, Class C, Class R, Class Y, Class R5 and Class R6. Class Y shares are available only to certain investors. Class A shares are sold with afront-end sales charge unless certain waiver criteria are met and under certain circumstances load waived shares may be subject to contingent deferred sales charges (“CDSC”). Class C shares are sold with a CDSC. Class R, Class Y, Class R5 and Class R6 shares are sold at net asset value.
The Fund is an investment company and accordingly follows the investment company accounting and reporting guidance in accordance with Financial Accounting Standards Board Accounting Standards Codification Topic 946, Financial Services – Investment Companies.
The following is a summary of the significant accounting policies followed by the Fund in the preparation of its financial statements.
A. Security Valuations– Securities, including restricted securities, are valued according to the following policy.
A security listed or traded on an exchange (except convertible securities) is valued at its last sales price or official closing price as of the close of the customary trading session on the exchange where the security is principally traded, or lacking any sales or official closing price on a particular day, the security may be valued at the closing bid price on that day. Securities traded in theover-the-counter market are valued based on prices furnished by independent pricing services or market makers. When such securities are valued by an independent pricing service they may be considered fair valued. Futures contracts are valued at the final settlement price set by an exchange on which they are principally traded. Listed options are valued at the mean between the last bid and asked prices from the exchange
33 INVESCO OPPENHEIMER DISCOVERY FUND
NOTES TO FINANCIAL STATEMENTSContinued
on which they are principally traded. Options not listed on an exchange are valued by an independent source at the mean between the last bid and asked prices. For purposes of determining net asset value (“NAV”) per share, futures and option contracts generally are valued 15 minutes after the close of the customary trading session of the New York Stock Exchange (“NYSE”).
Investments inopen-end andclosed-end registered investment companies that do not trade on an exchange are valued at theend-of-day net asset value per share. Investments inopen-end andclosed-end registered investment companies that trade on an exchange are valued at the last sales price or official closing price as of the close of the customary trading session on the exchange where the security is principally traded.
Debt obligations (including convertible securities) and unlisted equities are fair valued using an evaluated quote provided by an independent pricing service. Evaluated quotes provided by the pricing service may be determined without exclusive reliance on quoted prices, and may reflect appropriate factors such asinstitution-size trading in similar groups of securities, developments related to specific securities, dividend rate (for unlisted equities), yield (for debt obligations), quality, type of issue, coupon rate (for debt obligations), maturity (for debt obligations), individual trading characteristics and other market data. Pricing services generally value debt obligations assuming orderly transactions of institutional round lot size, but a fund may hold or transact in the same securities in smaller, odd lot sizes. Odd lots often trade at lower prices than institutional round lots. Debt obligations are subject to interest rate and credit risks. In addition, all debt obligations involve some risk of default with respect to interest and/or principal payments.
Foreign securities’ (including foreign exchange contracts) prices are converted into U.S. dollar amounts using the applicable exchange rates as of the close of the NYSE. If market quotations are available and reliable for foreign exchange-traded equity securities, the securities will be valued at the market quotations. Because trading hours for certain foreign securities end before the close of the NYSE, closing market quotations may become unreliable. If between the time trading ends on a particular security and the close of the customary trading session on the NYSE, events occur that the investment adviser determines are significant and make the closing price unreliable, the Fund may fair value the security. If the event is likely to have affected the closing price of the security, the security will be valued at fair value in good faith using procedures approved by the Board of Trustees. Adjustments to closing prices to reflect fair value may also be based on a screening process of an independent pricing service to indicate the degree of certainty, based on historical data, that the closing price in the principal market where a foreign security trades is not the current value as of the close of the NYSE. Foreign securities’ prices meeting the approved degree of certainty that the price is not reflective of current value will be priced at the indication of fair value from the independent pricing service. Multiple factors may be considered by the independent pricing service in determining adjustments to reflect fair value and may include information relating to sector indices, American Depositary Receipts and domestic and foreign index futures. Foreign securities may have additional risks including exchange rate changes, potential for sharply devalued currencies and high inflation, political and economic upheaval, the relative lack of issuer information,
34 INVESCO OPPENHEIMER DISCOVERY FUND
relatively low market liquidity and the potential lack of strict financial and accounting controls and standards.
Securities for which market prices are not provided by any of the above methods may be valued based upon quotes furnished by independent sources. The last bid price may be used to value equity securities. The mean between the last bid and asked prices is used to value debt obligations, including corporate loans.
Securities for which market quotations are not readily available or became unreliable are valued at fair value as determined in good faith by or under the supervision of the Trust’s officers following procedures approved by the Board of Trustees. Issuer specific events, market trends, bid/asked quotes of brokers and information providers and other market data may be reviewed in the course of making a good faith determination of a security’s fair value.
The Fund may invest in securities that are subject to interest rate risk, meaning the risk that the prices will generally fall as interest rates rise and, conversely, the prices will generally rise as interest rates fall. Specific securities differ in their sensitivity to changes in interest rates depending on their individual characteristics. Changes in interest rates may result in increased market volatility, which may affect the value and/or liquidity of certain Fund investments.
Valuations change in response to many factors including the historical and prospective earnings of the issuer, the value of the issuer’s assets, general economic conditions, interest rates, investor perceptions and market liquidity. Because of the inherent uncertainties of valuation, the values reflected in the financial statements may materially differ from the value received upon actual sale of those investments.
| B. | Securities Transactions and Investment Income -Securities transactions are accounted for on a trade date basis. Realized gains or losses on sales are computed on the basis of specific identification of the securities sold. Interest income (net of withholding tax, if any) is recorded on the accrual basis from settlement date. Dividend income (net of withholding tax, if any) is recorded on theex-dividend date. |
The Fund may periodically participate in litigation related to Fund investments. As such, the Fund may receive proceeds from litigation settlements. Any proceeds received are included in the Statement of Operations as realized gain (loss) for investments no longer held and as unrealized gain (loss) for investments still held.
Brokerage commissions and mark ups are considered transaction costs and are recorded as an increase to the cost basis of securities purchased and/or a reduction of proceeds on a sale of securities. Such transaction costs are included in the determination of net realized and unrealized gain (loss) from investment transactions reported in the Statement of Operations and the Statement of Changes in Net Assets and the net realized and unrealized gains (losses) on securities per share in the Financial Highlights. Transaction costs are included in the calculation of the Fund’s net asset value and, accordingly, they reduce the Fund’s total returns. These transaction costs are not considered operating expenses and are not reflected in net investment income reported in the Statement of Operations and the Statement of Changes in Net Assets, or the net investment income per share and the ratios of expenses and net investment income reported in the Financial Highlights, nor are
35 INVESCO OPPENHEIMER DISCOVERY FUND
NOTES TO FINANCIAL STATEMENTSContinued
they limited by any expense limitation arrangements between the Fund and the investment adviser.
The Fund allocates income and realized and unrealized capital gains and losses to a class based on the relative net assets of each class.
| C. | Country Determination- For the purposes of making investment selection decisions and presentation in the Schedule of Investments, the investment adviser may determine the country in which an issuer is located and/or credit risk exposure based on various factors. These factors include the laws of the country under which the issuer is organized, where the issuer maintains a principal office, the country in which the issuer derives 50% or more of its total revenues and the country that has the primary market for the issuer’s securities, as well as other criteria. Among the other criteria that may be evaluated for making this determination are the country in which the issuer maintains 50% or more of its assets, the type of security, financial guarantees and enhancements, the nature of the collateral and the sponsor organization. Country of issuer and/or credit risk exposure has been determined to be the United States of America, unless otherwise noted. |
| D. | Distributions -Dividends and distributions to shareholders, which are determined in accordance with income tax regulations and may differ from accounting principles generally accepted in the United States of America (“GAAP”), are recorded on theex-dividend date. Income and capital gain distributions, if any, are declared and paid annually or at other times as determined necessary by the Adviser. |
| E. | Federal Income Taxes -The Fund intends to comply with provisions of the Internal Revenue Code applicable to regulated investment companies and to distribute substantially all of its investment company taxable income, including any net realized gain on investments not offset by capital loss carryforwards, if any, to shareholders. Therefore, no federal income or excise tax provision is required. The Fund files income tax returns in U.S. federal and applicable state jurisdictions. The statute of limitations on the Fund’s tax return filings generally remains open for the three preceding fiscal reporting period ends. The Fund has analyzed its tax positions for the fiscal year ended August 31, 2019, including open tax years, and does not believe there are any uncertain tax positions requiring recognition in the Fund’s financial statements. |
The tax components of capital shown in the following table represent distribution requirements the Fund must satisfy under the income tax regulations, losses the Fund may be able to offset against income and gains realized in future years and unrealized appreciation or depreciation of securities and other investments for federal income tax purposes.
| | | | | | | | | | | | |
Undistributed Net Investment Income1 | | Undistributed
Long-Term
Gain | | | Accumulated
Loss
Carryforward2,3
| | | Net Unrealized
Appreciation
Based on cost of
Securities and
Other Investments
for Federal Income
Tax Purposes | |
| $— | | | $149,481,837 | | | | $— | | | | $780,657,609 | |
36 INVESCO OPPENHEIMER DISCOVERY FUND
1.At period end, the Fund elected to defer $11,601,896 of late year ordinary losses.
2. During the reporting period, the Fund did not utilize any capital loss carryforward.
3.During the previous reporting period, the Fund did not utilize any capital loss carryforward.
Net investment income (loss) and net realized gain (loss) may differ for financial statement and tax purposes. The character of dividends and distributions made during the fiscal year from net investment income or net realized gains are determined in accordance with federal income tax requirements, which may differ from the character of net investment income or net realized gains presented in those financial statements in accordance with U.S. GAAP. Also, due to timing of dividends and distributions, the fiscal year in which amounts are distributed may differ from the fiscal year in which the income or net realized gain was recorded by the Fund.
Accordingly, the following amounts have been reclassified for the reporting period. Net assets of the Fund were unaffected by the reclassifications.
| | | | |
Reduction toPaid-in Capital | | Increase to Accumulated
Net Investment
Income | |
| |
| $2,839,621 | | | $2,839,621 | |
The tax character of distributions paid during the reporting periods:
| | | | | | | | |
| | | Eleven Months | | | | |
| | | Ended August 31, | | | Year Ended | |
| | | 2019 | | | September 30, 2018 | |
| |
| Distributions paid from: | | | | | | | | |
| Ordinary income | | $ | 24,397,901 | | | $ | — | |
| Long-term capital gain | | | 305,428,256 | | | | 240,589,674 | |
| | | | |
| Total | | $ | 329,826,157 | | | $ | 240,589,674 | |
| | | | |
The aggregate cost of securities and other investments and the composition of unrealized appreciation and depreciation of securities and other investments for federal income tax purposes at period end are noted in the following table. The primary difference between book and tax appreciation or depreciation of securities and other investments, if applicable, is attributable to the tax deferral of losses or tax realization of financial statement unrealized gain or loss.
| | | | | | | | |
| Federal tax cost of securities | | $ | 1,925,970,991 | | | | | |
| | | | |
| Gross unrealized appreciation | | $ | 836,840,375 | | | | | |
| Gross unrealized depreciation | | | (56,183,366 | ) | | | | |
| | | | |
| Net unrealized appreciation | | $ | 780,657,009 | | | | | |
| | | | |
| F. | Expenses -Fees provided for under the Rule12b-1 plan of a particular class of the Fund are charged to the operations of such class. Transfer agency fees and expenses and other |
37 INVESCO OPPENHEIMER DISCOVERY FUND
NOTES TO FINANCIAL STATEMENTSContinued
| | shareholder recordkeeping fees and expenses attributable to Class R5 and Class R6 are allocated to each share class based on relative net assets.Sub-accounting fees attributable to Class R5 are charged to the operations of the class. Transfer agency fees and expenses and other shareholder recordkeeping fees and expenses relating to all other classes are allocated among those classes based on relative net assets. All other expenses are allocated among the classes based on relative net assets. |
| G. | Accounting Estimates -The financial statements are prepared on a basis in conformity with GAAP, which requires management to make estimates and assumptions that affect the reported amounts of assets and liabilities at the date of the financial statements and the reported amounts of revenues and expenses during the reporting period including estimates and assumptions related to taxation. Actual results could differ from those estimates by a significant amount. In addition, the Fund monitors for material events or transactions that may occur or become known after theperiod-end date and before the date the financial statements are released to print. |
| H. | Indemnifications -Under the Trust’s organizational documents, each Trustee, officer, employee or other agent of the Trust is indemnified against certain liabilities that may arise out of the performance of their duties to the Fund. Additionally, in the normal course of business, the Fund enters into contracts, including the Fund’s servicing agreements, that contain a variety of indemnification clauses. The Fund’s maximum exposure under these arrangements is unknown as this would involve future claims that may be made against the Fund that have not yet occurred. The risk of material loss as a result of such indemnification claims is considered remote. |
Note 2 – Advisory Fees and Other Fees Paid to Affiliates
The Trust has entered into a master investment advisory agreement with Invesco Advisers, Inc. (the “Adviser” or “Invesco”). Under the terms of the investment advisory agreement, the Fund accrues daily and pays monthly an advisory fee to the Adviser based on the annual rate of the Fund’s average daily net assets as follows:
| | | | |
| Fee Schedule* | | |
| Up to $200 million | | | 0.75% | |
| Next $200 million | | | 0.72 | |
| Next $200 million | | | 0.69 | |
| Next $200 million | | | 0.66 | |
| Next $700 million | | | 0.60 | |
| Next $3.5 billion | | | 0.58 | |
| Over $5 billion | | | 0.55 | |
*The advisory fee paid by the Fund shall be reduced by any amounts paid by the Fund under the administrative services agreement with the Adviser.
For the eleven monthsended August 31, 2019, the effective advisory fees incurred by the Fund was 0.62%.
From the beginning of the fiscal period until the date of the Reorganization, the Acquired Fund paid $9,689,912 in advisory fees to OFI Global Asset Management, Inc. based on the
38 INVESCO OPPENHEIMER DISCOVERY FUND
annual rates above of the Acquired Fund’s average daily net assets.
Under the terms of a mastersub-advisory agreement between the Adviser and each of Invesco Asset Management Deutschland GmbH, Invesco Asset Management Limited, Invesco Asset Management (Japan) Limited, Invesco Hong Kong Limited, Invesco Senior Secured Management, Inc. and Invesco Canada Ltd. and separatesub-advisory agreements with Invesco Capital Management LLC, and Invesco Asset Management (India) Private Limited (collectively, the “AffiliatedSub-Advisers”) the Adviser, not the Fund, will pay 40% of the fees paid to the Adviser to any such AffiliatedSub-Adviser(s) that provide(s) discretionary investment management services to the Fund based on the percentage of assets allocated to suchSub-Adviser(s). Invesco has also entered into aSub-Advisory Agreement with OppenheimerFunds, Inc. to provide discretionary management services to the Funds.
Effective on the Reorganization Date, the Adviser has contractually agreed, through at least May 31, 2021, to waive advisory fees and/or reimburse expenses of all shares to the extent necessary to limit the total annual fund operating expenses after fee waiver and/or expense reimbursement (excluding certain items discussed below) of Class A, Class C, Class R, Class Y, Class R5 and Class R6 shares to 1.08%, 1.84%, 1.33%, 0.84%, 0.73% and 0.68%, respectively, of the Fund’s average daily net assets (the “expense limits”). In determining the Adviser’s obligation to waive advisory fees and/or reimburse expenses, the following expenses are not taken into account, and could cause total annual fund operating expenses after fee waivers and/or expense reimbursement to exceed the numbers reflected above: (1) interest; (2) taxes; (3) dividend expenses on short sales; (4) extraordinary ornon-routine items, including litigation expenses; and (5) expenses that the Fund has incurred but did not actually pay because of an expense offset arrangement. Unless Invesco continues the fee waiver agreement, it will terminate May 31, 2021. During its term, the fee waiver agreement cannot be terminated or amended to increase the expense limits or reduce the advisory fee waiver without approval of the Board of Trustees.
Further, the Adviser has contractually agreed, through at least June 30, 2021, to waive the advisory fee payable by the Fund in an amount equal to 100% of the net advisory fees the Adviser receives from the affiliated money market funds on investments by the Fund of uninvested cash in such affiliated money market funds.
For the eleven months ended August 31, 2019, the Adviser waived advisory fees of $61,480 and reimbursed class level expenses of $63,743, $2,501, $4,197, and $46,521 for Class A, Class C, Class R, and Class Y, respectively.
The Trust has entered into a master administrative services agreement with Invesco pursuant to which the Fund has agreed to pay Invesco for certain administrative costs incurred in providing accounting services to the Fund. For the eleven months ended August 31, 2019, expenses incurred under the agreement are shown in the Statement of Operations as Administration fees. Additionally, Invesco has entered into service agreements whereby Citibank, N.A., serves as custodian to the Fund. Prior to the Reorganization, the Acquired Fund paid administrative fees to OFI Global Asset Management, Inc.
The Trust has entered into a transfer agency and service agreement with Invesco Investment Services, Inc. (“IIS”) pursuant to which the Fund has agreed to pay IIS a fee for providing transfer agency and shareholder services to the Fund and reimburse IIS for certain
39 INVESCO OPPENHEIMER DISCOVERY FUND
NOTES TO FINANCIAL STATEMENTSContinued
expenses incurred by IIS in the course of providing such services. IIS may make payments to intermediaries that provide omnibus account services,sub-accounting services and/or networking services. All fees payable by IIS to intermediaries that provide omnibus account services orsub-accounting services are charged back to the Fund, subject to certain limitations approved by the Trust’s Board of Trustees. Prior to the Reorganization, the Acquired Fund paid transfer agent fees to OFI Global Asset Management, Inc. and Shareholder Services, Inc. For the eleven months ended August 31, 2019, expenses incurred under these agreements are shown in the Statement of Operations as Transfer and shareholder servicing agent fees.
The Trust has entered into master distribution agreements with Invesco Distributors, Inc. (“IDI”) to serve as the distributor for theClass A, Class C, Class R, Class Y, Class R5 and Class R6 shares of the Fund. The Trust has adopted plans pursuant to Rule12b-1 under the 1940 Act with respect to the Fund’s Class A, Class C and Class R shares(collectively the “Plan”). The Fund, pursuant to the Class A Plan, reimbursed IDI in an amount up to an annual rate of 0.25% of the average daily net assets of Class A shares. The Fund pursuant to the Class C and Class R Plan, pays IDI compensation at the annual rate of 1.00% of the average daily net assets of Class C and 0.50% of the average daily net assets of Class R shares. The fees are accrued daily and paid monthly. Of the Plan payments, up to 0.25% of the average daily net assets of each class of shares may be paid to furnish continuing personal shareholder services to customers who purchase and own shares of such classes. Any amounts not paid as a service fee under the Plan would constitute an asset-based sales charge. Rules of the Financial Industry Regulatory Authority (“FINRA”) impose a cap on the total sales charges, including asset-based sales charges, that may be paid by any class of shares of the Fund plans. Prior to the Reorganization, the Acquired Fund paid distribution fees to OppenheimerFunds Distributor, Inc. For the eleven months ended August 31, 2019, expenses incurred under the plans are shown in the Statement of Operations as Distribution and service plan fees.
Front-end sales commissions and CDSC (collectively, the “sales charges”) are not recorded as expenses of the Fund.Front-end sales commissions are deducted from proceeds from the sales of Fund shares prior to investment in Class A shares of the Fund. CDSC are deducted from redemption proceeds prior to remittance to the shareholder. During the eleven months ended August 31, 2019, IDI advised the Fund that IDI retained $17,238 infront-end sales commissions from the sale of Class A shares and $1 and $856 from Class A and Class C shares, respectively, for CDSC imposed on redemptions by shareholders. From the beginning of the fiscal year to the date of the Reorganization, OppenheimerFunds Distributor, Inc. retained $63,780 in front–end sales commissions from the sale of Class A shares and $0 and $2,122 from Class A and Class C shares, respectively, for CDSC imposed on redemption by shareholders.
Certain officers and trustees of the Trust are officers and directors of the Adviser, IIS and/or IDI.
Note 3 – Additional Valuation Information
GAAP defines fair value as the price that would be received to sell an asset or paid to transfer a liability in an orderly transaction between market participants at the measurement date,
40 INVESCO OPPENHEIMER DISCOVERY FUND
under current market conditions. GAAP establishes a hierarchy that prioritizes the inputs to valuation methods, giving the highest priority to readily available unadjusted quoted prices in an active market for identical assets (Level 1) and the lowest priority to significant unobservable inputs (Level 3), generally when market prices are not readily available or are unreliable. Based on the valuation inputs, the securities or other investments are tiered into one of three levels. Changes in valuation methods may result in transfers in or out of an investment’s assigned level:
Level 1 — Prices are determined using quoted prices in an active market for identical assets.
Level 2 — Prices are determined using other significant observable inputs. Observable inputs are inputs that other market participants may use in pricing a security. These may include quoted prices for similar securities, interest rates, prepayment speeds, credit risk, yield curves, loss severities, default rates, discount rates, volatilities and others.
Level 3 — Prices are determined using significant unobservable inputs. In situations where quoted prices or observable inputs are unavailable (for example, when there is little or no market activity for an investment at the end of the period), unobservable inputs may be used. Unobservable inputs reflect the Fund’s own assumptions about the factors market participants would use in determining fair value of the securities or instruments and would be based on the best available information.
As of August 31, 2019, all of the securities in this Fund were valued based on Level 1 inputs (see the Schedule of Investments for security categories). The level assigned to the securities valuations may not be an indication of the risk or liquidity associated with investing in those securities. Because of the inherent uncertainties of valuation, the values reflected in the financial statements may materially differ from the value received upon actual sale of those investments.
Note 4 – Security Transactions with Affiliated Funds
The Fund is permitted to purchase or sell securities from or to certain other Invesco Funds under specified conditions outlined in procedures adopted by the Board of Trustees of the Trust. The procedures have been designed to ensure that any purchase or sale of securities by the Fund from or to another fund or portfolio that is or could be considered an affiliate by virtue of having a common investment adviser (or affiliated investment advisers), common Trustees and/or common officers complies with Rule17a-7 of the 1940 Act. Further, as defined under the procedures, each transaction is effected at the current market price. Pursuant to these procedures for the period October 1, 2018 to May 24, 2019,the Predecessor Fund engaged in transactions with affiliates as listed: Securities sales of $2,228,820, which resulted in net realized gains of $302,900. For the period May 25, 2019 to August 31, 2019, the Fund engaged in transactions with affiliates as listed: Securities sales of $4,954,301, which resulted in net realized gains of $99,091.
41 INVESCO OPPENHEIMER DISCOVERY FUND
NOTES TO FINANCIAL STATEMENTSContinued
Note 5 – Trustee and Officer Fees and Benefits
The Predecessor Fund has adopted an unfunded retirement plan (the “Plan”) for the Fund’s Independent Trustees. Benefits are based on years of service and fees paid to each Trustee during their period of service. The Plan was frozen with respect to adding new participants effective December 31, 2006 (the “Freeze Date”) and existing Plan Participants as of the Freeze Date will continue to receive accrued benefits under the Plan. Active Independent Trustees as of the Freeze Date have each elected a distribution method with respect to their benefits under the Plan.
During the reporting period, the Fund’s projected benefit obligations, payments to retired Trustees and accumulated liability were as follows:
| | | | |
Projected Benefit Obligations Increased | | $ | 2,785 | |
Payments Made to Retired Trustees | | | 10,034 | |
Accumulated Liability as of August 31, 2019 | | | 110,154 | |
Certain trustees have executed a Deferred Compensation Agreement pursuant to which they have the option to elect to defer receipt of all or a portion of the annual compensation they are entitled to receive from the Fund. For purposes of determining the amount owed to the Trustee under the plan, deferred amounts are treated as though equal dollar amounts had been invested in shares of the Fund or in other Invesco and/or Invesco Oppenheimer funds selected by the Trustee. The Fund purchases shares of the funds selected for deferral by the Trustee in amounts equal to his or her deemed investment, resulting in a Fund asset equal to the deferred compensation liability. Such assets are included as a component of “Other” within the asset section of the Statement of Assets and Liabilities. Deferral of Trustees’ fees under the plan will not affect the net assets of the Fund and will not materially affect the Fund’s assets, liabilities or net investment income per share. Amounts will be deferred until distributed in accordance with the compensation deferral plan.
Note 6 – Cash Balances
The Fund is permitted to temporarily carry a negative or overdrawn balance in its account with Citibank, N.A., the custodian bank. Such balances, if any atperiod-end, are shown in the Statement of Assets and Liabilities under the payable caption Amount due custodian. To compensate the custodian bank for such overdrafts, the overdrawn Fund may either (1) leave funds as a compensating balance in the account so the custodian bank can be compensated by earning the additional interest; or (2) compensate by paying the custodian bank at a rate agreed upon by the custodian bank and Invesco, not to exceed the contractually agreed upon rate.
Note 7 – Investment Transactions
The aggregate amount of investment securities (other than short-term securities, U.S. Treasury
42 INVESCO OPPENHEIMER DISCOVERY FUND
obligations and money market funds, if any) purchased and sold by the Fund during theeleven monthsended August 31, 2019 was $2,033,540,823 and $2,155,298,431, respectively. Cost of investments, including any derivatives, on a tax basis includes the adjustments for financial reporting purposes as of the most recently completed federal income tax reportingperiod-end.
Note 8 – Share Information
Transactions in shares of beneficial interest were as follows:
| | | | | | | | | | | | | | | | | | | | | | | | |
| | | Eleven Months Ended
August 31, 20191 | | | Year Ended September 30, 2018 | | | Year Ended September 30, 2017 | |
| | | Shares | | | Amount | | | Shares | | | Amount | | | Shares | | | Amount | |
| Class A | | | | | | | | | | | | | | | | | | | | | | | | |
| Sold | | | 1,476,972 | | | $ | 117,130,009 | | | | 849,742 | | | $ | 72,180,230 | | | | 773,705 | | | | $ 56,992,890 | |
| Dividends and/or distributions reinvested | | | 2,643,860 | | | | 175,869,552 | | | | 1,819,991 | | | | 137,409,312 | | | | 685,854 | | | | 47,118,168 | |
| Redeemed | | | (2,301,009 | ) | | | (177,760,164 | ) | | | (2,229,176 | ) | | | (187,732,746 | ) | | | (3,521,042 | ) | | | (257,969,522 | ) |
| | | | | | | | | | | | | | | | | | | | | | | | |
| Net increase (decrease) | | | 1,819,823 | | | $ | 115,239,397 | | | | 440,557 | | | $ | 21,856,796 | | | | (2,061,483 | ) | | | $(153,858,464 | ) |
| | | | | | | | | | | | | | | | | | | | | | | | |
| | | | | | | | | | | | | | | | | | | | | | | | | |
| Class B | | | | | | | | | | | | | | | | | | | | | | | | |
| Sold | | | — | | | $ | — | | | | 344 | | | $ | 20,579 | | | | 1,479 | | | | $ 78,954 | |
| Dividends and/or distributions reinvested | | | — | | | | — | | | | 14,290 | | | | 743,792 | | | | 15,749 | | | | 790,141 | |
| Redeemed2 | | | — | | | | — | | | | (136,690 | ) | | | (7,840,616 | ) | | | (224,087 | ) | | | (11,984,277 | ) |
| | | | | | | | | | | | | | | | | | | | | | | | |
| Net decrease | | | — | | | $ | — | | | | (122,056 | ) | | $ | (7,076,245 | ) | | | (206,859 | ) | | | $(11,115,182 | ) |
| | | | | | | | | | | | | | | | | | | | | | | | |
| | | | | | | | | | | | | | | | | | | | | | | | | |
| Class C | | | | | | | | | | | | | | | | | | | | | | | | |
| Sold | | | 210,389 | | | $ | 10,535,363 | | | | 186,599 | | | $ | 11,533,313 | | | | 156,824 | | | | $ 8,725,541 | |
| Dividends and/or distributions reinvested | | | 611,268 | | | | 27,005,837 | | | | 384,584 | | | | 20,929,050 | | | | 136,985 | | | | 7,135,530 | |
| Redeemed | | | (1,757,108 | ) | | | (92,610,906) | | | | (495,236 | ) | | | (30,447,091 | ) | | | (612,561 | ) | | | (33,984,339 | ) |
| | | | | | | | | | | | | | | | | | | | | | | | |
| Net increase (decrease) | | | (935,451 | ) | | | $(55,069,706) | | | | 75,947 | | | $ | 2,015,272 | | | | (318,752 | ) | | | $(18,123,268 | ) |
| | | | | | | | | | | | | | | | | | | | | | | | |
| | | | | | | | | | | | | | | | | | | | | | | | | |
| Class R | | | | | | | | | | | | | | | | | | | | | | | | |
| Sold | | | 134,747 | | | $ | 9,594,804 | | | | 91,822 | | | $ | 7,216,024 | | | | 103,690 | | | | $ 7,136,646 | |
| Dividends and/or distributions reinvested | | | 120,611 | | | | 7,312,628 | | | | 82,351 | | | | 5,765,394 | | | | 32,915 | | | | 2,121,058 | |
| Redeemed | | | (176,401 | ) | | | (12,598,461 | ) | | | (183,467 | ) | | | (14,285,866 | ) | | | (269,402 | ) | | | (18,450,235 | ) |
| | | | | | | | | | | | | | | | | | | | | | | | |
| Net increase (decrease) | | | 78,957 | | | $ | 4,308,971 | | | | (9,294 | ) | | $ | (1,304,448 | ) | | | (132,797 | ) | | | $ (9,192,531 | ) |
| | | | | | | | | | | | | | | | | | | | | | | | |
43 INVESCO OPPENHEIMER DISCOVERY FUND
NOTES TO FINANCIAL STATEMENTSContinued
| | | | | | | | | | | | | | | | | | | | | | | | |
| | | |
| | | Eleven Months Ended
August 31, 20191 | | | Year Ended September 30, 2018 | | | Year Ended September 30, 2017 | |
| | | Shares | | | Amount | | | Shares | | | Amount | | | Shares | | | Amount | |
| Class Y | | | | | | | | | | | | | | | | | | | | | | | | |
| Sold | | | 4,076,290 | | | $ | 361,589,572 | | | | 3,300,856 | | | $ | 319,180,547 | | | | 1,921,540 | | | $ | 157,753,019 | |
| Dividends and/or distributions reinvested | | | 1,124,201 | | | | 86,125,039 | | | | 640,584 | | | | 54,456,069 | | | | 202,529 | | | | 15,430,655 | |
| Redeemed | | | (3,501,865 | ) | | | (305,557,751 | ) | | | (2,246,955 | ) | | | (214,389,867 | ) | | | (1,912,116 | ) | | | (154,388,506 | ) |
| | | | | | | | | | | | | | | | | | | | | | | | |
| Net increase | | | 1,698,626 | | | $ | 142,156,860 | | | | 1,694,485 | | | $ | 159,246,749 | | | | 211,953 | | | $ | 18,795,168 | |
| | | | | | | | | | | | | | | | | | | | | | | | |
| | | | | | | | | | | | | | | | | | | | | | | | | |
| Class R53 | | | | | | | | | | | | | | | | | | | | | | | | |
| Sold | | | 135 | | | $ | 10,497 | | | | — | | | $ | — | | | | — | | | $ | — | |
| Dividends and/or distributions reinvested | | | — | | | | — | | | | — | | | | — | | | | — | | | | — | |
| Redeemed | | | — | | | | — | | | | — | | | | — | | | | — | | | | — | |
| | | | | | | | | | | | | | | | | | | | | | | | |
| Net increase | | | 135 | | | $ | 10,497 | | | | — | | | $ | — | | | | — | | | $ | — | |
| | | | | | | | | | | | | | | | | | | | | | | | |
| | | | | | | | | | | | | | | | | | | | | | | | | |
| Class R6 | | | | | | | | | | | | | | | | | | | | | | | | |
| Sold | | | 597,631 | | | $ | 53,150,583 | | | | 897,349 | | | $ | 89,781,306 | | | | 799,023 | | | | $65,281,231 | |
| Dividends and/or distributions reinvested | | | 357,109 | | | | 27,886,666 | | | | 195,322 | | | | 16,852,427 | | | | 44,610 | | | | 3,438,520 | |
| Redeemed | | | (572,925 | ) | | | (52,247,249 | ) | | | (417,164 | ) | | | (40,669,929 | ) | | | (328,771 | ) | | | (27,281,552 | ) |
| | | | | | | | | | | | | | | | | | | | | | | | |
| Net increase | | | 381,815 | | | $ | 28,790,000 | | | | 675,507 | | | $ | 65,963,804 | | | | 514,862 | | | $ | 41,438,199 | |
| | | | | | | | | | | | | | | | | | | | | | | | |
1.There are entities that are record owners of more than 5% of the outstanding shares of the Fund and own 17% of the outstanding shares of the Fund. IDI has an agreement with these entities to sell Fund shares. The Fund, Invesco and/or Invesco affiliates may make payments to these entities, which are considered to be related to the Fund, for providing services to the Fund, Invesco and/or Invesco affiliates, including but not limited to services such as securities brokerage, distribution, third party record keeping and account servicing. The Fund has no knowledge as to whether all or any portion of the shares owned of record by these entities are also owned beneficially.
2. All outstanding Class B shares converted to Class A shares on June 1, 2018.
3. Commencement date after the close of business on May 24, 2019.
Note 9 - Borrowings
Joint Credit Facility.A number of mutual funds managed by the Adviser participate in a $1.95 billion revolving credit facility (the “Facility”) intended to provide short-term financing, if necessary, subject to certain restrictions in connection with atypical redemption activity. Expenses and fees related to the Facility are paid by the participating funds and are disclosed separately or as other expenses on the Statement of Operations. The Fund did not utilize the Facility during the reporting period.The Facility terminated May 24, 2019.
44 INVESCO OPPENHEIMER DISCOVERY FUND
REPORT OF INDEPENDENT REGISTERED PUBLIC ACCOUNTING FIRM
Tothe Board of Trustees of AIM Counselor Series Trust (Invesco Counselor Series Trust) and Shareholders of Invesco Oppenheimer Discovery Fund
Opinion on the Financial Statements
We have audited the accompanying statement of assets and liabilities, including the schedule of investments, of Invesco Oppenheimer Discovery Fund (one of the funds constituting AIM Counselor Series Trust (Invesco Counselor Series Trust), referred to hereafter as the “Fund”) as of August 31, 2019, the related statement of operationsand the statement of changes in net assets for the period from October 1, 2018 to August 31, 2019, including the related notes, and the financial highlights for each of the periods ended August 31, 2019 (collectively referred to as the “financial statements”). In our opinion, the financial statements present fairly, in all material respects, the financial position of the Fund as of August 31, 2019, the results of its operations and changes in its net assets for the period from October 1, 2018 August 31, 2019 and the financial highlights for each of the periods ended August 31, 2019 in conformity with accounting principles generally accepted in the United States of America.
The financial statements of Invesco Oppenheimer Discovery Fund (formerly known as Oppenheimer Discovery Fund) as of and for the period ended September 30, 2018 and the financial highlights for each of the periods ended on or prior to September 30, 2018 (not presented herein, other than the statement of operations, the statement of changes in net assets and the financial highlights) were audited by other auditors whose report dated November 21, 2018 expressed an unqualified opinion on those financial statements and financial highlights.
Basis for Opinion
These financial statements are the responsibility of the Fund’s management. Our responsibility is to express an opinion on the Fund’s financial statements based on our audit. We are a public accounting firm registered with the Public Company Accounting Oversight Board (United States) (PCAOB) and are required to be independent with respect to the Fund in accordance with the U.S. federal securities laws and the applicable rules and regulations of the Securities and Exchange Commission and the PCAOB.
We conducted our audit of these financial statements in accordance with the standards of the PCAOB. Those standards require that we plan and perform the audit to obtain reasonable assurance about whether the financial statements are free of material misstatement, whether due to error or fraud.
Our audit included performing procedures to assess the risks of material misstatement of the financial statements, whether due to error or fraud, and performing procedures that respond to those risks. Such procedures included examining, on a test basis, evidence regarding the amounts and disclosures in the financial statements. Our audit also included evaluating the accounting principles used and significant estimates made by management, as well as evaluating the overall presentation of the financial statements. Our procedures included confirmation of securities owned as of August 31, 2019 by correspondence with the custodian, transfer agent and brokers; when replies were not received from brokers, we performed other auditing procedures. We believe that our audit provides a reasonable basis for our opinion.
45 INVESCO OPPENHEIMER DISCOVERY FUND
REPORT OF INDEPENDENT REGISTERED PUBLIC ACCOUNTING FIRM
/s/PricewaterhouseCoopers LLP
Houston, TX
October 29, 2019
We have served as the auditor of one or more investment companies in the Invesco group of investment companies since at least 1995. We have not been able to determine the specific year we began serving as auditor.
46 INVESCO OPPENHEIMER DISCOVERY FUND
INDEPENDENT REGISTERED PUBLIC ACCOUNTING FIRM
The Audit Committee of the Board of Trustees appointed, and the Board of Trustees ratified and approved, PricewaterhouseCoopers LLP (“PwC”) as the independent registered public accounting firm of the Fund for the fiscal periods ending after May 24, 2019. Prior to the close of business on May 24, 2019, the Predecessor Fund was a separate series of an unaffiliated investment company and its financial statements were audited by a different independent registered public accounting firm (the “Prior Auditor”).
Effective after the close of business on May 24, 2019, the Prior Auditor resigned as the independent registered public accounting firm of the Fund. The Prior Auditor’s report on the financial statements of the Predecessor Fund for the past two fiscal years did not contain an adverse or disclaimer of opinion, and was not qualified or modified as to uncertainty, audit scope or accounting principles. During the Predecessor Fund’s two most recent fiscal years and through the close of business on May 24, 2019, there were no (1) disagreements with the Prior Auditor on any matter of accounting principles or practices, financial statement disclosure, or auditing scope or procedure, which disagreements, if not resolved to the Prior Auditor’s satisfaction, would have caused it to make reference to that matter in connection with its report; or (2) “reportable events,” as that term is defined in Item 304(a)(1)(v) of RegulationS-K under the Securities Exchange Act of 1934.
47 INVESCO OPPENHEIMER DISCOVERY FUND
FEDERAL INCOME TAX INFORMATIONUnaudited
In early 2019, if applicable, shareholders of record received information regarding all dividends and distributions paid to them by the Fund during calendar year 2018.
Capital gain distributions of $11.05787 per share were paid to Class A, Class C, Class R, Class Y and Class R6 shareholders, respectively, on December 7, 2018. Whether received in stock or in cash, the capital gain distribution should be treated by shareholders as a gain from the sale of the capital assets held for more than one year (long-term capital gains).
None of the dividends paid by the Fund during the reporting period are eligible for the corporate dividend-received deduction.
A portion, if any, of the dividends paid by the Fund during the reporting period which are not designated as capital gain distributions are eligible for lower individual income tax rates to the extent that the Fund has received qualified dividend income as stipulated by recent tax legislation. The maximum amount allowable but not less than $6,571,830 of the Fund’s fiscal year taxable income may be eligible for the lower individual income tax rates. In early 2019, shareholders of record received information regarding the percentage of distributions that are eligible for lower individual income tax rates.
The foregoing information is presented to assist shareholders in reporting distributions received from the Fund to the Internal Revenue Service. Because of the complexity of the federal regulations which may affect your individual tax return and the many variations in state and local tax regulations, we recommend that you consult your tax advisor for specific guidance.
48 INVESCO OPPENHEIMER DISCOVERY FUND
APPROVAL OF INVESTMENT ADVISORY ANDSUB-ADVISORY CONTRACTSUnaudited
At meetings held on December 14, 2018, the Board of Trustees (the Board or the Trustees) of AIM Counselor Series Trust (Invesco Counselor Series Trust) (the Trust) as a whole, and the independent Trustees, who comprise over 75% of the Board, voting separately, approved (i) an amendment to the Trust’s Master Investment Advisory Agreement with Invesco Advisers, Inc. (Invesco Advisers and the investment advisory agreement) to add Invesco Oppenheimer Discovery Fund (the Fund), (ii) an amendment to the Master IntergroupSub-Advisory Contract for Mutual Funds with Invesco Asset Management Deutschland GmbH, Invesco Asset Management Limited, Invesco Asset Management (Japan) Limited, Invesco Hong Kong Limited, Invesco Senior Secured Management, Inc. and Invesco Canada Ltd. to add the Fund, (iii) an amendment to the separatesub-advisory contract with Invesco Capital Management LLC to add the Fund, (iv) an amendment to the separatesub-advisory contract with Invesco Asset Management (India) Private Limited to add the Fund, and (v) an initialsub-advisory contract with OppenheimerFunds, Inc. (collectively, the AffiliatedSub-Advisers and thesub-advisory contracts). Additionally, on March 26, 2019, the Boardre-approved an initialsub-advisory contract with OppenheimerFunds, Inc. following its change of control as a result of the acquisition of OppenheimerFunds, Inc. and its subsidiaries, including the Oppenheimer mutual funds (each, an Oppenheimer Fund), by Invesco Ltd. (the OFI Transaction). After evaluating the factors discussed below, among others, the Board approved the Fund’s investment advisory agreement and thesub-advisory contracts and determined that the compensation payable by the Fund to Invesco Advisers and by Invesco Advisers to the AffiliatedSub-Advisers is fair and reasonable.
The Board’s Evaluation Process
The Board noted that it had previously approved establishing the Fund at the Board meeting held on October 23, 2018 and that the Fund was formed to acquire the assets and liabilities of an Oppenheimer Fund (the Acquired Fund) with the same investment objective and substantially similar principal investment strategies and risks. At the time of approval, the Fund had no assets and no performance history and the portfolio managers were not employed by Invesco Advisers or any of the AffiliatedSub-Advisers except OppenheimerFunds, Inc., which was not affiliated with Invesco at that time.
In approving the investment advisory agreement andsub-advisory contracts, the Board followed a process similar to the process that it follows in annually reviewing and approving investment advisory agreements andsub-advisory contracts for the series portfolios of funds advised by Invesco Advisers and considered the information provided in the most recent annual review process for those funds as well as the information provided with respect to the Fund. As part of the approval process, the Board reviewed and considered information provided in response to detailed requests for information submitted to management by the independent Trustees with assistance from legal counsel to the independent Trustees. The Board reviewed comparative investment performance and fee data prepared by Invesco Advisers and an independent mutual fund data provider. The Board was assisted in its review by the Senior Officer, an officer of the Invesco Funds who reports directly to the independent Trustees, and by independent legal counsel.
49 INVESCO OPPENHEIMER DISCOVERY FUND
APPROVAL OF INVESTMENT ADVISORY ANDSUB-ADVISORY CONTRACTSUnaudited / Continued
The discussion below serves as a summary of the material factors and related conclusions that formed the basis for the Board’s approval of the Fund’s investment advisory agreement andsub-advisory contracts. The Trustees’ review and conclusions are based on the comprehensive consideration of all information presented to them and are not the result of any single determinative factor. Moreover, one Trustee may have weighed a particular piece of information or factor differently than another Trustee. This information is current as of December 14, 2018 and March 26, 2019 for thesub-advisory contract with OppenheimerFunds, Inc.
Factors and Conclusions and Summary of Independent Written Fee Evaluation
A. Nature, Extent and Quality of Services Provided by Invesco Advisers and the AffiliatedSub-Advisers
The Board reviewed the nature, extent and quality of the advisory services to be provided to the Fund by Invesco Advisers under the Fund’s investment advisory agreement, and the credentials and experience of the officers and employees of Invesco Advisers who will provide these services. The Board’s review included consideration of the investment process oversight and structure, credit analysis and investment risk management to be employed in providing advisory services to the Fund. The Board also considerednon-advisory services that Invesco Advisers and its affiliates provide to the Invesco Funds and will provide to the Fund, such as various back office support functions, third party oversight, internal audit, valuation, portfolio trading and legal and compliance. The Board also received and reviewed information about Invesco Advisers’ role as administrator of the Invesco Funds’ liquidity risk management program. The Board also reviewed and considered the benefits to shareholders of investing in a fund that is part of the Invesco family of funds under the umbrella of Invesco Ltd., Invesco Advisers’ parent company, and noted Invesco Ltd.’s depth and experience in conducting an investment management business, as well as its commitment of financial and other resources to such business. The Board reviewed and considered information about the resources that Invesco Advisers intends to continue to commit to managing the Invesco family of funds, including the Fund, following the OFI Transaction. The Board concluded that the nature, extent and quality of the services to be provided to the Fund by Invesco Advisers are appropriate and satisfactory.
The Board reviewed the services that may be provided by the AffiliatedSub-Advisers under thesub-advisory contracts and the credentials and experience of the officers and employees of the AffiliatedSub-Advisers who provide these services. The Board noted the AffiliatedSub-Advisers’ expertise with respect to certain asset classes and that the AffiliatedSub-Advisers have offices and personnel that are located in financial centers around the world. As a result, the Board noted that the AffiliatedSub-Advisers can provide research and investment analysis on the markets and economies of various countries in which the Fund may invest, make recommendations regarding securities and assist with security trades. The Board concluded that thesub-advisory contracts may benefit the Fund and its shareholders by permitting Invesco Advisers to use the resources and talents of the AffiliatedSub-Advisers
50 INVESCO OPPENHEIMER DISCOVERY FUND
in managing the Fund. The Board concluded that the nature, extent and quality of the services that may be provided by the AffiliatedSub-Advisers are appropriate and satisfactory.
B. Fund Investment Performance
The Board noted that the Fund would continue the historical performance information of the Acquired Fund following the consummation of the OFI Transaction. The Board considered the performance of the Acquired Fund and the fact that, at the closing of the OFI Transaction, management anticipates that the Fund will be managed pursuant to substantially similar investment strategies and by substantially the same portfolio management team as managed the Acquired Fund. The Board did not view Fund performance as a relevant factor in considering whether to approve thesub-advisory contracts for the Fund, as no Affiliated Sub- Adviser currently manages assets of the Fund.
The Board compared the Fund’s investment performance over multiple time periods ending December 31, 2017 to the performance of funds in the Morningstar performance universe and against the Fund’s benchmark index. The Trustees also reviewed more recent Fund performance and this review did not change their conclusions.
C. Advisory andSub-Advisory Fees and Fund Expenses
The Board compared the Fund’s contractual management fee rate to the contractual management fee rates of funds in the Fund’s Morningstar expense group. The Board also considered comparative information regarding the Fund’s total expense ratio and its various components.
The Board noted that Invesco Advisers has contractually agreed to waive fees and/or limit expenses of the Fund for at least two years from the closing date of the OFI Transaction in an amount necessary to limit total annual operating expenses to a specified percentage of average daily net assets for each class of the Fund.
The Board also considered the fees charged by Invesco Advisers and the Affiliated Sub- Advisers to other similarly managed client accounts. The Board noted that Invesco Advisers or the AffiliatedSub-Advisers may charge lower fees to large institutional clients. Invesco Advisers reviewed with the Board differences in the scope of services it provides to the Invesco Funds relative to certain other types of client accounts, including management of cash flows as a result of redemptions and purchases, necessary infrastructure such as officers, office space, technology, legal and distribution, oversight of service providers, costs and business risks associated with launching new funds and sponsoring and maintaining the product line, preparation of annual registration statement updates and financial information and compliance with federal and state laws and regulations.
The Board also compared the Fund’s effective advisory fee rate (the advisory fee rate after advisory fee waivers and before other expense limitations/waivers) to the effective advisory fee rates of other similarly managed third-party mutual funds advised orsub-advised by Invesco Advisers and its affiliates, based on asset balances as of December 31, 2017.
51 INVESCO OPPENHEIMER DISCOVERY FUND
APPROVAL OF INVESTMENT ADVISORY ANDSUB-ADVISORY CONTRACTSUnaudited / Continued
The Board also considered the services that may be provided by the AffiliatedSub-Advisers pursuant to thesub-advisory contracts, as well as the fees payable by Invesco Advisers to the AffiliatedSub-Advisers pursuant to thesub-advisory contracts.
D. Economies of Scale and Breakpoints
The Board considered the extent to which there may be economies of scale in the provision of advisory services to the Fund. The Board considered Invesco’s reinvestment in its business, including investments in business infrastructure and cybersecurity. The Board also considered that the Fund may benefit from economies of scale through contractual breakpoints in the Fund’s advisory fee schedule, which generally operate to reduce the Fund’s expense ratio as it grows in size. The Board noted that the Fund will share directly in economies of scale through lower fees charged by third party service providers based on the combined size of the Invesco Funds. The Board noted that the Fund may also benefit from economies of scale through initial fee setting, fee waivers and expense reimbursements.
E. Profitability and Financial Resources
The Board reviewed information from the 2018 contract renewal process provided by Invesco Advisers concerning the costs of the advisory and other services that Invesco Advisers and its affiliates provide to the Invesco Funds and the profitability of Invesco Advisers and its affiliates in providing these services. The Board considered the methodology used for calculating profitability and noted the periodic review of such methodology by an independent consultant. The Board noted that Invesco Advisers will continue to operate at a net profit from services Invesco Advisers and its affiliates provide to the Invesco Funds. The Board did not deem the level of profits realized by Invesco Advisers and its affiliates from providing services to the Invesco Funds, and the profits estimated to be realized by the Fund, to be excessive given the nature, extent and quality of the services provided. The Board received information from Invesco Advisers demonstrating that Invesco Advisers and the AffiliatedSub-Advisers are financially sound and have the resources necessary to perform their obligations under the investment advisory agreement andsub-advisory contracts.
F. Collateral Benefits to Invesco Advisers and its Affiliates
The Board considered various other benefits to be received by Invesco Advisers and its affiliates from the relationship with the Fund, including the fees to be received for providing administrative, transfer agency and distribution services to the Fund. The Board considered the performance of Invesco Advisers and its affiliates in providing these services to other Invesco Funds and the organizational structure employed to provide these services. The Board also considered that these services will be provided to the Fund pursuant to written contracts that are reviewed and approved on an annual basis by the Board; and that the services are required for the operation of the Fund.
52 INVESCO OPPENHEIMER DISCOVERY FUND
The Board considered the benefits realized by Invesco Advisers and the Affiliated Sub-Advisers as a result of portfolio brokerage transactions executed through “soft dollar” arrangements. The Board noted that soft dollar arrangements may result in the Fund bearing costs to purchase research that may be used by Invesco Advisers or the AffiliatedSub-Advisers with other clients and may reduce Invesco Advisers’ or the AffiliatedSub-Advisers’ expenses. The Board also considered that it will receive periodic reports from Invesco representing that these arrangements are consistent with regulatory requirements. The Board did not deem the soft dollar arrangements to be inappropriate.
The Board considered that the Fund’s uninvested cash and cash collateral from any securities lending arrangements may be invested in money market funds advised by Invesco Advisers pursuant to procedures approved by the Board. The Board considered that Invesco Advisers will receive advisory fees from these affiliated money market funds attributable to such investments, although Invesco Advisers has contractually agreed to waive through varying periods the advisory fees payable by the Invesco Funds with respect to certain investments in the affiliated money market funds. The waiver is in an amount equal to 100% of the net advisory fee Invesco Advisers will receive from the affiliated money market funds with respect to the Fund’s investment in the affiliated money market funds of uninvested cash, but not cash collateral. The Board concluded that the amount of advisory fees to be received by Invesco Advisers from the Fund’s investment of cash collateral from any securities lending arrangements in the affiliated money market funds is fair and reasonable.
The Board also considered that an affiliated broker may receive commissions for executing certain trades for the Fund. Invesco Advisers and the AffiliatedSub-Advisers may use the affiliated broker to, among other things, control order routing and minimize information leakage, and the Board was advised that such trades will be executed in compliance with rules under the federal securities laws and consistent with best execution obligations.
53 INVESCO OPPENHEIMER DISCOVERY FUND
PORTFOLIO PROXY VOTING POLICIES AND GUIDELINES;
UPDATES TO SCHEDULE OF INVESTMENTSUnaudited
Go paperless with eDelivery
Visit invesco.com/edelivery to enjoy the convenience and security of anytime electronic access to your investment documents.
With eDelivery, you can elect to have any or all of the following materials delivered straight to your inbox to download, save and print from your own computer:
● Fund reports and prospectuses
● Quarterly statements
● Daily confirmations
● Tax forms
Invesco mailing information
Send general correspondence to Invesco Investment Services, Inc., P.O. Box 219078, Kansas City, MO 64121-9078.
Important notice regarding delivery of security holder documents
To reduce Fund expenses, only one copy of most shareholder documents may be mailed to shareholders with multiple accounts at the same address (Householding). Mailing of your shareholder documents may be householded indefinitely unless you instruct us otherwise. If you do not want the mailing of these documents to be combined with those for other members of your household, please contact Invesco Investment Services, Inc. at 800 959 4246 or contact your financial institution. We will begin sending you individual copies for each account within 30 days after receiving your request.
Fund holdings and proxy voting information
The Fund provides a complete list of its holdings four times in each fiscal year, at the quarter ends. For the second and fourth quarters, the lists appear in the Fund’s semiannual and annual reports to shareholders. For the first and third quarters, the Fund files the lists with the Securities and Exchange Commission (SEC) on FormN-PORT. The most recent list of portfolio holdings is available at invesco. com/completeqtrholdings. Shareholders can also look up the Fund’s FormsN-PORT on the SEC website at sec.gov.
A description of the policies and procedures that the Fund uses to determine how to vote proxies relating to portfolio securities is available without charge, upon request, from our Client Services department at 800 959 4246 or at invesco.com/proxyguidelines. The information is also available on the SEC website, sec.gov.
Information regarding how the Fund voted proxies related to its portfolio securities during the most recent12-month period ended June 30 is available at invesco.com/proxysearch. The information is also available on the SEC website, sec.gov.
Invesco Advisers, Inc. is an investment adviser; it provides investment advisory services to individual and institutional clients and does not sell securities. Invesco Distributors, Inc. is the US distributor for Invesco Ltd.’s retail mutual funds, exchange-traded funds and institutional money market funds. Both are wholly owned, indirect subsidiaries of Invesco Ltd.
54 INVESCO OPPENHEIMER DISCOVERY FUND
SHAREHOLDER PROXYUnaudited
A Special Meeting (“Meeting”) of Shareholders of Invesco Oppenheimer Discovery Fund was held on April 12, 2019. The Meeting was held for the following purpose:
(1) Approval of an Agreement and Plan of Reorganization that provides for the reorganization of Oppenheimer Discovery Fund into Invesco Oppenheimer Discovery Fund.
The results of the voting on the above matter was as follows:
| | | | | | | | | | | | | | | | |
| Matter | | Votes For | | | Votes
Against | | | Votes
Abstain | | | Broker
Non-Votes | |
| (1) Approval of an Agreement and Plan of Reorganization | | | 14,878,473 | | | | 992,362 | | | | 967,472 | | | | 0 | |
55 INVESCO OPPENHEIMER DISCOVERY FUND
TRUSTEES AND OFFICERSUnaudited
The address of each trustee and officer is AIM Counselor Series Trust (Invesco Counselor Series Trust) (the “Trust”), 11 Greenway Plaza, Suite 1000, Houston, Texas 77046-1173. The trustees serve for the life of the Trust, subject to their earlier death, incapacitation, resignation, retirement or removal as more specifically provided in the Trust’s organizational documents. Each officer serves for a one year term or until their successors are elected and qualified. Column two below includes length of time served with predecessor entities, if any.
| | | | | | | | |
Name, Year of Birth and Position(s) Held with the Trust | | Trustee
and/or
Officer
Since | | Principal Occupation(s) During Past 5 Years | | Number of Funds in Fund Complex Overseen by Trustee | | Other Directorship(s) Held by Trustee During Past 5 Years |
INTERESTED PERSONS | | | | | | | | |
| Martin L. Flanagan1— 1960 Trustee and Vice Chair | | 2007 | | Executive Director, Chief Executive Officer and President, Invesco Ltd. (ultimate parent of Invesco and a global investment management firm); Trustee and Vice Chair, The Invesco Funds; Vice Chair, Investment Company Institute; and Member of Executive Board, SMU Cox School of Business Formerly: Advisor to the Board, Invesco Advisers, Inc. (formerly known as Invesco Institutional (N.A.), Inc.); Chairman and Chief Executive Officer, Invesco Advisers, Inc. (registered investment adviser); Director, Chairman, Chief Executive Officer and President, Invesco Holding Company (US), Inc. (formerly IVZ Inc.) (holding company), Invesco Group Services, Inc. (service provider) and Invesco North American Holdings, Inc. (holding company); Director, Chief Executive Officer and President, Invesco Holding Company Limited (parent of Invesco and a global investment management firm); Director, Invesco Ltd.; Chairman, Investment Company Institute and President,Co-Chief Executive Officer,Co-President, Chief Operating Officer and Chief Financial Officer, Franklin Resources, Inc. (global investment management organization) | | 230 | | None |
| Philip A. Taylor2— 1954 Trustee | | 2006 | | Vice Chair, Invesco Ltd.; Trustee, The Invesco Funds Formerly: Director, Invesco Canada Ltd. (formerly known as Invesco Trimark Ltd./ Invesco Trimark Ltèe) (registered investment adviser and registered transfer agent); Head of the Americas and Senior Managing Director, Invesco Ltd.; Director, Invesco Advisers, Inc. (formerly known as Invesco Institutional (N.A.), Inc.) (registered investment adviser); | | 230 | | None |
| |
1 Mr. Flanagan is considered an interested person (within the meaning of Section 2(a)(19) of the 1940 Act) of the Trust because he is an officer of the Adviser to the Trust, and an officer and a director of Invesco Ltd., ultimate parent of the Adviser. |
| |
2 Mr. Taylor is considered an interested person (within the meaning of Section 2(a)(19) of the 1940 Act) of the Trust because he is an officer of Invesco Ltd., ultimate parent of the Adviser. |
56 INVESCO OPPENHEIMER DISCOVERY FUND
| | | | | | | | |
Name, Year of Birth and Position(s) Held with the Trust | | Trustee
and/or
Officer
Since | | Principal Occupation(s) During Past 5 Years | | Number of Funds in Fund Complex Overseen by Trustee | | Other Directorship(s) Held by Trustee During Past 5 Years |
| INTERESTED PERSONS (CONTINUED) | | | | | | | | |
| Philip A. Taylor (Continued) | | | | Director and Chairman, Invesco Investment Services, Inc. (formerly known as Invesco AIM Investment Services, Inc.) (registered transfer agent); Chief Executive Officer, Invesco Corporate Class Inc. (corporate mutual fund company); Chairman and Chief Executive Officer, Invesco Canada Ltd. (formerly known as Invesco Trimark Ltd./ Invesco Trimark Ltèe) (registered investment adviser and registered transfer agent); Senior Vice President, The Invesco Funds; Director, Invesco Investment Advisers LLC (formerly known as Van Kampen Asset Management); Director, Chairman, Chief Executive Officer and President, Invesco Management Group, Inc. (formerly known as Invesco AIM Management Group, Inc.) (financial services holding company);Co-Chairman,Co-President andCo-Chief Executive Officer, Invesco Advisers, Inc. (formerly known as Invesco Institutional (N.A.), Inc.) (registered investment adviser); Director, Chief Executive Officer and President, Van Kampen Exchange Corp; President and Principal Executive Officer, The Invesco Funds (other than AIM Treasurer’s Series Trust (Invesco Treasurer’s Series Trust), Short-Term Investments Trust and Invesco Management Trust); Executive Vice President, The Invesco Funds (AIM Treasurer’s Series Trust (Invesco Treasurer’s Series Trust), Short-Term Investments Trust and Invesco Management Trust only); Director and President, INVESCO Funds Group, Inc. (registered investment adviser and registered transfer agent); Director and Chairman, IVZ Distributors, Inc. (formerly known as INVESCO Distributors, Inc.) (registered broker dealer); Director, President and Chairman, Invesco Inc. (holding company), Invesco Canada Holdings Inc. (holding company), Trimark Investments Ltd./ Placements Trimark Ltèe and Invesco Financial Services Ltd/Services Financiers Invesco Ltèe; Chief Executive Officer, Invesco Canada Fund Inc. (corporate mutual fund company); Director and Chairman, Van Kampen Investor Services Inc.; Director, Chief Executive Officer and President, 1371 Preferred Inc. (holding | | | | |
57 INVESCO OPPENHEIMER DISCOVERY FUND
TRUSTEES AND OFFICERSUnaudited / Continued
| | | | | | | | |
Name, Year of Birth and Position(s) Held with the Trust | | Trustee
and/or
Officer
Since | | Principal Occupation(s) During Past 5 Years | | Number of Funds
in Fund Complex
Overseen by Trustee | | Other Directorship(s)
Held by Trustee During
Past 5 Years |
INTERESTED PERSONS (CONTINUED) | | | | | | | | |
| Philip A. Taylor (Continued) | | | | company) and Van Kampen Investments Inc.; Director and President, AIM GP Canada Inc. (general partner for limited partnerships) and Van Kampen Advisors, Inc.; Director and Chief Executive Officer, Invesco Trimark Dealer Inc. (registered broker dealer); Director, Invesco Distributors, Inc. (formerly known as Invesco AIM Distributors, Inc.) (registered broker dealer); Manager, Invesco Capital Management LLC; Director, Chief Executive Officer and President, Invesco Advisers, Inc.; Director, Chairman, Chief Executive Officer and President, Invesco AIM Capital Management, Inc.; President, Invesco Trimark Dealer Inc. and Invesco Trimark Ltd./Invesco Trimark Ltèe; Director and President, AIM Trimark Corporate Class Inc. and AIM Trimark Canada Fund Inc.; Senior Managing Director, Invesco Holding Company Limited; Director and Chairman, Fund Management Company (former registered broker dealer); President and Principal Executive Officer, The Invesco Funds (AIM Treasurer’s Series Trust (Invesco Treasurer’s Series Trust), and Short-Term Investments Trust only); President, AIM Trimark Global Fund Inc. and AIM Trimark Canada Fund Inc. | | | | |
58 INVESCO OPPENHEIMER DISCOVERY FUND
| | | | | | | | |
Name, Year of Birth and Position(s) Held with the Trust | | Trustee
and/or
Officer
Since | | Principal Occupation(s) During Past 5 Years | | Number of Funds in Fund Complex Overseen by Trustee | | Other Directorship(s)
Held by Trustee During
Past 5 Years |
INDEPENDENT TRUSTEES | | | | | | | | |
Bruce L. Crockett – 1944 Trustee and Chair | | 2003 | | Chairman, Crockett Technologies Associates (technology consulting company) Formerly: Director, Captaris (unified messaging provider); Director, President and Chief Executive Officer, COMSAT Corporation; Chairman, Board of Governors of INTELSAT (international communications company); ACE Limited (insurance company); Independent Directors Council and Investment Company Institute: Member of the Audit Committee, Investment Company Institute; Member of the Executive Committee and Chair of the Governance Committee, Independent Directors Council | | 230 | | Director and Chairman of the Audit Committee, ALPS (Attorneys Liability Protection Society) (insurance company); Director and Member of the Audit Committee and Compensation Committee, Ferroglobe PLC (metallurgical company) |
David C. Arch – 1945 Trustee | | 2010 | | Chairman of Blistex Inc. (consumer health care products manufacturer); Member, World Presidents’ Organization | | 230 | | Board member of the Illinois Manufacturers’ Association |
Beth Ann Brown – 1968 Trustee | | 2019 | | Independent Consultant Formerly: Head of Intermediary Distribution, Managing Director, Strategic Relations, Managing Director, Head of National Accounts, Senior Vice President, National Account Manager and Senior Vice President, Key Account Manager, Columbia Management Investment Advisers LLC; Vice President, Key Account Manager, Liberty Funds Distributor, Inc.; and Trustee of certain Oppenheimer Funds | | 230 | | Director, Board of Directors of Caron Engineering Inc.; Advisor, Board of Advisors of Caron Engineering Inc.; President and Director, of Acton Shapleigh Youth Conservation Corps (non -profit); and Vice President and Director of Grahamtastic Connection (non-profit) |
Jack M. Fields – 1952 Trustee | | 2003 | | Chief Executive Officer, Twenty First Century Group, Inc. (government affairs company); and Chairman, Discovery Learning Alliance(non-profit) Formerly: Owner and Chief Executive Officer, Dos Angeles Ranch L.P. (cattle, hunting, corporate entertainment); Director, Insperity, Inc. (formerly known as Administaff) (human resources provider); Chief Executive Officer, Texana Timber LP (sustainable forestry | | 230 | | None |
| | | | | |
| | | | | | | | | |
59 INVESCO OPPENHEIMER DISCOVERY FUND
TRUSTEES AND OFFICERSUnaudited / Continued
| | | | | | | | |
Name, Year of Birth and Position(s) Held with the Trust | | Trustee
and/or
Officer
Since | | Principal Occupation(s) During Past 5 Years | | Number of Funds in Fund Complex Overseen by Trustee | | Other Directorship(s)
Held by Trustee During
Past 5 Years |
INDEPENDENT TRUSTEES (CONTINUED) | | | | | | | | |
| Jack M. Fields (Continued) | | | | company); Director of Cross Timbers Quail Research Ranch(non-profit); and member of the U.S. House of Representatives | | | | |
Cynthia Hostetler —1962 Trustee | | 2017 | | Non-Executive Director and Trustee of a number of public and private business corporations Formerly: Director, Aberdeen Investment Funds (4 portfolios); Head of Investment Funds and Private Equity, Overseas Private Investment Corporation; President, First Manhattan Bancorporation, Inc.; Attorney, Simpson Thacher & Bartlett LLP | | 230 | | Vulcan Materials Company (construction materials company); Trilinc Global Impact Fund; Genesee & Wyoming, Inc. (railroads); Artio Global Investment LLC (mutual fund complex); Edgen Group, Inc. (specialized energy and infrastructure products distributor); Investment Company Institute (professional organization); Independent Directors Council (professional organization) |
Eli Jones – 1961 Trustee | | 2016 | | Professor and Dean, Mays Business School - Texas A&M University Formerly: Professor and Dean, Walton College of Business, University of Arkansas and E.J. Ourso College of Business, Louisiana State University; Director, Arvest Bank | | 230 | | Insperity, Inc. (formerly known as Administaff) (human resources provider) |
Elizabeth Krentzman – 1959 Trustee | | 2019 | | Formerly: Principal and Chief Regulatory Advisor for Asset Management Services and U.S. Mutual Fund Leader of Deloitte & Touche LLP; General Counsel of the Investment Company Institute (trade association); National Director of the Investment Management Regulatory Consulting Practice, Principal, Director and Senior Manager of Deloitte & Touche LLP; Assistant Director of the Division of Investment Management - Office of Disclosure and Investment Adviser Regulation of the U.S. Securities and Exchange Commission and various positions with the Division of Investment Management – Office of Regulatory Policy of the U.S. Securities and Exchange Commission; Associate at Ropes & Gray LLP.; Advisory Board Member of the | | 230 | | Trustee of the University of Florida National Board Foundation and Audit Committee Member; Member of the Cartica Funds Board of Directors (private investment funds); Member of the University of Florida Law Center Association, Inc. Board of Trustees and Audit Committee Member |
60 INVESCO OPPENHEIMER DISCOVERY FUND
| | | | | | | | |
Name, Year of Birth and Position(s) Held with the Trust | | Trustee
and/or
Officer
Since | | Principal Occupation(s) During Past 5 Years | | Number of Funds in Fund Complex Overseen by Trustee | | Other Directorship(s)
Held by Trustee During
Past 5 Years |
INDEPENDENT TRUSTEES
(CONTINUED) | | | | | | | | |
| Elizabeth Krentzman (Continued) | | | | Securities and Exchange Commission Historical Society; and Trustee of certain Oppenheimer Funds | | | | |
Anthony J. LaCava, Jr. – 1956 Trustee | | 2019 | | Formerly: Director and Member of the Audit Committee, Blue Hills Bank (publicly traded financial institution) and Managing Partner, KPMG LLP | | 230 | | Blue Hills Bank; Chairman of Bentley University; Member, Business School Advisory Council; and Nominating Committee, KPMG LLP |
Prema Mathai-Davis – 1950 Trustee | | 2003 | | Retired Co-Owner & Partner of Quantalytics Research, LLC, (a FinTech Investment Research Platform for the Self-Directed Investor) | | 230 | | None |
Joel W. Motley – 1952 Trustee | | 2019 | | Director of Office of Finance, Federal Home Loan Bank; Member of the Vestry of Trinity Wall Street; Managing Director of Carmona Motley Hoffman, Inc. (privately held financial advisor); Member of the Finance and Budget Committee of the Council on Foreign Relations, Member of the Investment Committee and Board of Human Rights Watch and Member of the Investment Committee and Board of Historic Hudson Valley (non-profit cultural organization). Formerly: Managing Director of Public Capital Advisors, LLC (privately held financial advisor); Managing Director of Carmona Motley Hoffman, Inc. (privately held financial advisor); Trustee of certain Oppenheimer Funds; and Director of Columbia Equity Financial Corp. (privately held financial advisor) | | 230 | | Director of Greenwall Foundation (bioethics research foundation); Member of Board and Investment Committee of The Greenwall Foundation; Director of Southern Africa Legal Services Foundation; Board Member and Investment Committee Member of Pulitzer Center for Crisis Reporting(non-profit journalism) |
Teresa M. Ressel — 1962 Trustee | | 2017 | | Non-executive director and trustee of a number of public and private business corporations Formerly: Chief Financial Officer, Olayan America, The Olayan Group (international investor/commercial/industrial); Chief Executive Officer, UBS Securities LLC; Group Chief Operating Officer, Americas, UBS AG; Assistant Secretary for Management & Budget and CFO, US Department of the Treasury | | 230 | | Atlantic Power Corporation (power generation company); ON Semiconductor Corp. (semiconductor supplier) |
61 INVESCO OPPENHEIMER DISCOVERY FUND
TRUSTEES AND OFFICERSUnaudited / Continued
| | | | | | | | |
Name, Year of Birth and Position(s) Held with the Trust | | Trustee
and/or
Officer
Since | | Principal Occupation(s) During Past 5 Years | | Number of Funds in Fund Complex Overseen by Trustee | | Other Directorship(s)
Held by Trustee During
Past 5 Years |
| INDEPENDENT TRUSTEES (CONTINUED) | | | | | | | | |
Ann Barnett Stern – 1957
Trustee | | 2017 | | President and Chief Executive Officer, Houston Endowment Inc. (private philanthropic institution) Formerly: Executive Vice President and General Counsel, Texas Children’s Hospital; Attorney, Beck, Redden and Secrest, LLP; Business Law Instructor, University of St. Thomas; Attorney, Andrews & Kurth LLP | | 230 | | Federal Reserve Bank of Dallas |
Raymond Stickel, Jr. – 1944
Trustee | | 2005 | | Retired Formerly: Director, Mainstay VP Series Funds, Inc. (25 portfolios); Partner, Deloitte & Touche | | 230 | | None |
Robert C. Troccoli – 1949
Trustee | | 2016 | | Retired Formerly: Adjunct Professor, University of Denver – Daniels College of Business, Senior Partner, KPMG LLP | | 230 | | None |
Daniel S. Vandivort –1954
Trustee | | 2019 | | Treasurer, Chairman of the Audit and Finance Committee, and Trustee, Board of Trustees, Huntington Disease Foundation of America; and President, Flyway Advisory Services LLC (consulting and property management). Formerly: Trustee and Governance Chair, of certain Oppenheimer Funds | | 230 | | Chairman and Lead Independent Director, Chairman of the Audit Committee, and Director, Board of Directors, Value Line Funds |
James D. Vaughn – 1945
Trustee | | 2019 | | Retired Formerly: Managing Partner, Deloitte & Touche LLP; Trustee and Chairman of the Audit Committee, Schroder Funds; Board Member, Mile High United Way, Boys and Girls Clubs, Boy Scouts, Colorado Business Committee for the Arts, Economic Club of Colorado and Metro Denver Network (economic development corporation); and Trustee of certain Oppenheimer Funds | | 230 | | Board member and Chairman of Audit Committee of AMG National Trust Bank; Trustee and Investment Committee member, University of South Dakota Foundation; Board member, Audit Committee Member and past Board Chair, Junior Achievement(non-profit) |
Christopher L. Wilson – 1957 Trustee, Vice Chair and Chair Designate | | 2017 | | Retired Formerly: Director, TD Asset Management USA Inc. (mutual fund complex) (22 portfolios); Managing Partner, CT2, LLC (investing and | | 230 | | ISO New England, Inc.(non-profit organization managing regional electricity market) |
62 INVESCO OPPENHEIMER DISCOVERY FUND
| | | | | | | | |
Name, Year of Birth and Position(s) Held with the Trust | | Trustee
and/or
Officer
Since | | Principal Occupation(s) During Past 5 Years | | Number of Funds in Fund Complex Overseen by Trustee | | Other Directorship(s)
Held by Trustee During
Past 5 Years |
| INDEPENDENT TRUSTEES (CONTINUED) | | | | | | | | |
| Christopher L. Wilson (Continued) | | | | consulting firm); President/Chief Executive Officer, Columbia Funds, Bank of America Corporation; President/Chief Executive Officer, CDC IXIS Asset Management Services, Inc.; Principal & Director of Operations, Scudder Funds, Scudder, Stevens & Clark, Inc.; Assistant Vice President, Fidelity Investments | | | | |
63 INVESCO OPPENHEIMER DISCOVERY FUND
TRUSTEES AND OFFICERSUnaudited / Continued
| | | | | | | | |
Name, Year of Birth and
Position(s) Held with the Trust | | Trustee
and/or
Officer
Since | | Principal Occupation(s)
During Past 5 Years | | Number of Funds
in Fund Complex
Overseen by Trustee | | Other Directorship(s)
Held by Trustee During
Past 5 Years |
| OTHER OFFICERS | | | | | | | | |
Sheri Morris — 1964
President, Principal Executive Officer and Treasurer | | 2003 | | President, Principal Executive Officer and Treasurer, The Invesco Funds; Vice President, Invesco Advisers, Inc. (formerly known as Invesco Institutional (N.A.), Inc.) (registered investment adviser); and Vice President, Invesco Exchange-Traded Fund Trust, Invesco Exchange-Traded Fund Trust II, Invesco India Exchange-Traded Fund Trust, Invesco Actively Managed Exchange-Traded Fund Trust, Invesco Actively Managed Exchange-Traded Commodity Fund Trust and Invesco Exchange- Traded Self-Indexed Fund Trust, and Vice President, OppenheimerFunds, Inc. Formerly: Vice President and Principal Financial Officer, The Invesco Funds; Vice President, Invesco AIM Advisers, Inc., Invesco AIM Capital Management, Inc. and Invesco AIM Private Asset Management, Inc.; Assistant Vice President and Assistant Treasurer, The Invesco Funds and Assistant Vice President, Invesco Advisers, Inc., Invesco AIM Capital Management, Inc. and Invesco AIM Private Asset Management, Inc.; and Treasurer, Invesco Exchange-Traded Fund Trust, Invesco Exchange-Traded Fund Trust II, Invesco India Exchange-Traded Fund Trust and Invesco Actively Managed Exchange-Traded Fund Trust | | N/A | | N/A |
Russell C. Burk — 1958
Senior Vice President and Senior Officer | | 2005 | | Senior Vice President and Senior Officer, The Invesco Funds | | N/A | | N/A |
Jeffrey H. Kupor – 1968
Senior Vice President, Chief Legal Officer and Secretary | | 2018 | | Head of Legal of the Americas, Invesco Ltd.; Senior Vice President and Secretary, Invesco Advisers, Inc. (formerly known as Invesco Institutional (N.A.), Inc.) (registered investment adviser); Senior Vice President and Secretary, Invesco Distributors, Inc. (formerly known as Invesco AIM Distributors, Inc.); Vice President and Secretary, Invesco Investment Services, Inc. (formerly known as Invesco AIM Investment Services, Inc.) Senior Vice President, Chief Legal Officer and Secretary, The Invesco Funds; Secretary and General Counsel, Invesco Investment Advisers LLC (formerly known as Van Kampen Asset Management); Secretary and General Counsel, Invesco Capital Markets, Inc. (formerly known as Van Kampen Funds Inc.) and Chief Legal Officer, Invesco Exchange-Traded Fund Trust, | | N/A | | N/A |
64 INVESCO OPPENHEIMER DISCOVERY FUND
| | | | | | | | |
Name, Year of Birth and
Position(s) Held with the Trust | | Trustee
and/or
Officer
Since | | Principal Occupation(s)
During Past 5 Years | | Number of Funds
in Fund Complex
Overseen by Trustee | | Other Directorship(s)
Held by Trustee During
Past 5 Years |
OTHER OFFICERS (CONTINUED) | | | | | | | | |
| Jeffrey H. Kupor (Continued) | | | | Invesco Exchange-Traded Fund Trust II, Invesco India Exchange-Traded Fund Trust, Invesco Actively Managed Exchange-Traded Fund Trust, Invesco Actively Managed Exchange- Traded Commodity Fund Trust and Invesco Exchange-Traded Self-Indexed Fund Trust; Secretary, Invesco Indexing LLC; Secretary, W.L. Ross & Co., LLC Formerly: Secretary and Vice President, Jemstep, Inc.; Head of Legal, Worldwide Institutional, Invesco Ltd.; Secretary and General Counsel, INVESCO Private Capital Investments, Inc.; Senior Vice President, Secretary and General Counsel, Invesco Management Group, Inc. (formerly known as Invesco AIM Management Group, Inc.); Assistant Secretary, INVESCO Asset Management (Bermuda) Ltd.; Secretary and General Counsel, Invesco Private Capital, Inc.; Assistant Secretary and General Counsel, INVESCO Realty, Inc.; Secretary and General Counsel, Invesco Senior Secured Management, Inc.; and Secretary, Sovereign G./P. Holdings Inc. | | | | |
Andrew R. Schlossberg – 1974
Senior Vice President | | 2019 | | Head of the Americas and Senior Managing Director, Invesco Ltd.; Director and Senior Vice President, Invesco Advisers, Inc. (formerly known as Invesco Institutional (N.A.), Inc.) (registered investment adviser); Director and Chairman, Invesco Investment Services, Inc. (formerly known as Invesco AIM Investment Services, Inc.) (registered transfer agent); Senior Vice President, The Invesco Funds; Director, Invesco Investment Advisers LLC (formerly known as Van Kampen Asset Management); Director, President and Chairman, Invesco Insurance Agency, Inc. Formerly: Director, Invesco UK Limited; Director and Chief Executive, Invesco Asset Management Limited and Invesco Fund Managers Limited; Assistant Vice President, The Invesco Funds; Senior Vice President, Invesco Advisers, Inc. (formerly known as Invesco Institutional (N.A.), Inc.) (registered investment adviser); Director and Chief Executive, Invesco Administration Services Limited and Invesco Global Investment Funds | | N/A | | N/A |
65 INVESCO OPPENHEIMER DISCOVERY FUND
TRUSTEES AND OFFICERSUnaudited / Continued
| | | | | | | | | | |
Name, Year of Birth and Position(s) Held with the Trust | | Trustee
and/or
Officer
Since | | Principal Occupation(s)
During Past 5 Years | | | | Number of Funds
in Fund Complex
Overseen by Trustee | | Other Directorship(s)
Held by Trustee During
Past 5 Years |
OTHER OFFICERS (CONTINUED) | | | | | | | | | | |
| Andrew R. Schlossberg (Continued) | | | | Limited; Director, Invesco Distributors, Inc.; Head of EMEA, Invesco Ltd.; President, Invesco Actively Managed Exchange-Traded Commodity Fund Trust, Invesco Actively Managed Exchange-Traded Fund Trust, Invesco Exchange-Traded Fund Trust, Invesco Exchange-Traded Fund Trust II and Invesco India Exchange-Traded Fund Trust; Managing Director and Principal Executive Officer, Invesco Capital Management LLC | | | | | | |
John M. Zerr — 1962 Senior Vice President | | 2006 | | Chief Operating Officer of the Americas; Senior Vice President, Invesco Advisers, Inc. (formerly known as Invesco Institutional (N.A.), Inc.) (registered investment adviser); Senior Vice President, Invesco Distributors, Inc. (formerly known as Invesco AIM Distributors, Inc.); Director and Vice President, Invesco Investment Services, Inc. (formerly known as Invesco AIM Investment Services, Inc.) Senior Vice President, The Invesco Funds; Managing Director, Invesco Capital Management LLC; Director, Invesco Investment Advisers LLC (formerly known as Van Kampen Asset Management); Senior Vice President, Invesco Capital Markets, Inc. (formerly known as Van Kampen Funds Inc.); Manager, Invesco Indexing LLC; Manager, Invesco Specialized Products, LLC; Director and Senior Vice President, Invesco Insurance Agency, Inc.; Member, Invesco Canada Funds Advisory Board; Director, President and Chief Executive Officer, Invesco Corporate Class Inc. (corporate mutual fund company); and Director, Chairman, President and Chief Executive Officer, Invesco Canada Ltd. (formerly known as Invesco Trimark Ltd./Invesco Trimark Ltèe) (registered investment adviser and registered transfer agent) Formerly: Director and Senior Vice President, Invesco Management Group, Inc. (formerly known as Invesco AIM Management Group, Inc.); Secretary and General Counsel, Invesco Management Group, Inc. (formerly known as Invesco AIM Management Group, Inc.); Secretary, Invesco Investment Services, Inc. (formerly known as Invesco AIM Investment Services, Inc.); Chief Legal Officer and Secretary, The Invesco Funds; Secretary and | | | | N/A | | N/A |
66 INVESCO OPPENHEIMER DISCOVERY FUND
| | | | | | | | | | |
Name, Year of Birth and Position(s) Held with the Trust | | Trustee
and/or
Officer
Since | | Principal Occupation(s)
During Past 5 Years | | | | Number of Funds
in Fund Complex
Overseen by Trustee | | Other Directorship(s)
Held by Trustee During
Past 5 Years |
OTHER OFFICERS (CONTINUED) | | | | | | | | | | |
| John M. Zerr (Continued) | | | | General Counsel, Invesco Investment Advisers LLC (formerly known as Van Kampen Asset Management); Secretary and General Counsel, Invesco Capital Markets, Inc. (formerly known as Van Kampen Funds Inc.); Chief Legal Officer, Invesco Exchange-Traded Fund Trust, Invesco Exchange-Traded Fund Trust II, Invesco India Exchange-Traded Fund Trust, Invesco Actively Managed Exchange-Traded Fund Trust, Invesco Actively Managed Exchange- Traded Commodity Fund Trust and Invesco Exchange-Traded Self-Indexed Fund Trust; Secretary, Invesco Indexing LLC; Director, Secretary, General Counsel and Senior Vice President, Van Kampen Exchange Corp.; Director, Vice President and Secretary, IVZ Distributors, Inc. (formerly known as INVESCO Distributors, Inc.); Director and Vice President, INVESCO Funds Group, Inc.; Director and Vice President, Van Kampen Advisors Inc.; Director, Vice President, Secretary and General Counsel, Van Kampen Investor Services Inc.; Director and Secretary, Invesco Distributors, Inc. (formerly known as Invesco AIM Distributors, Inc.); Director, Senior Vice President, General Counsel and Secretary, Invesco AIM Advisers, Inc. and Van Kampen Investments Inc.; Director, Vice President and Secretary, Fund Management Company; Director, Senior Vice President, Secretary, General Counsel and Vice President, Invesco AIM Capital Management, Inc.; Chief Operating Officer and General Counsel, Liberty Ridge Capital, Inc. (an investment adviser) | | | | | | |
| Gregory G. McGreevey - 1962 Senior Vice President | | 2012 | | Senior Managing Director, Invesco Ltd.; Director, Chairman, President, and Chief Executive Officer, Invesco Advisers, Inc. (formerly known as Invesco Institutional (N.A.), Inc.) (registered investment adviser); Director, Invesco Mortgage Capital, Inc. and Invesco Senior Secured Management, Inc.; and Senior Vice President, The Invesco Funds; and President, SNW Asset Management Corporation Formerly: Senior Vice President, Invesco Management Group, Inc. and Invesco Advisers, Inc.; Assistant Vice President, The Invesco Funds | | | | N/A | | N/A |
67 INVESCO OPPENHEIMER DISCOVERY FUND
TRUSTEES AND OFFICERSUnaudited / Continued
| | | | | | | | | | |
Name, Year of Birth and Position(s) Held with the Trust | | Trustee
and/or
Officer
Since | | Principal Occupation(s)
During Past 5 Years | | | | Number of Funds
in Fund Complex
Overseen by Trustee | | Other Directorship(s)
Held by Trustee During
Past 5 Years |
OTHER OFFICERS (CONTINUED) | | | | | | | | | | |
Kelli Gallegos – 1970 Vice President, Principal Financial Officer and Assistant Treasurer | | 2008 | | Assistant Treasurer, Invesco Specialized Products, LLC; Vice President, Principal Financial Officer and Assistant Treasurer, The Invesco Funds; Principal Financial and Accounting Officer –Pooled Investments, Invesco Capital Management LLC; Vice President and Treasurer, Invesco Exchange-Traded Fund Trust, Invesco Exchange-Traded Fund Trust II, Invesco India Exchange-Traded Fund Trust, Invesco Actively Managed Exchange-Traded Fund Trust, Invesco Actively Managed Exchange-Traded Commodity Fund Trust and Invesco Exchange-Traded Self- Indexed Fund Trust Formerly: Assistant Treasurer, Invesco Exchange-Traded Fund Trust, Invesco Exchange-Traded Fund Trust II, Invesco India Exchange-Traded Fund Trust, Invesco Actively Managed Exchange-Traded Fund Trust, Invesco Actively Managed Exchange-Traded Commodity Fund Trust and Invesco Exchange-Traded Self-Indexed Fund Trust; Assistant Treasurer, Invesco Capital Management LLC; Assistant Vice President, The Invesco Funds | | | | N/A | | N/A |
Crissie M. Wisdom – 1969 Anti-Money Laundering Compliance Officer | | 2013 | | Anti-Money Laundering Compliance Officer, Invesco Advisers, Inc. (formerly known as Invesco Institutional (N.A.), Inc.) (registered investment adviser), Invesco Capital Markets, Inc. (formerly known as Van Kampen Funds Inc.), Invesco Distributors, Inc., Invesco Investment Services, Inc., The Invesco Funds, and Invesco Exchange-Traded Fund Trust, Invesco Exchange-Traded Fund Trust II, Invesco India Exchange-Traded Fund Trust, Invesco Actively Managed Exchange-Traded Fund Trust, Invesco Actively Managed Exchange-Traded Commodity Fund Trust and Invesco Exchange-Traded Self-Indexed Fund Trust; Anti-Money Laundering Compliance Officer and Bank Secrecy Act Officer, INVESCO National Trust Company and Invesco Trust Company; and Fraud Prevention Manager and Controls and Risk Analysis Manager for Invesco Investment Services, Inc. Formerly: Anti-Money Laundering Compliance Officer, Van Kampen Exchange Corp. and Invesco Management Group, Inc. | | | | N/A | | N/A |
68 INVESCO OPPENHEIMER DISCOVERY FUND
| | | | | | | | | | |
Name, Year of Birth and Position(s) Held with the Trust | | Trustee
and/or
Officer
Since | | Principal Occupation(s)
During Past 5 Years | | | | Number of Funds
in Fund Complex
Overseen by Trustee | | Other Directorship(s)
Held by Trustee During
Past 5 Years |
OTHER OFFICERS (CONTINUED) | | | | | | | | | | |
Robert R. Leveille – 1969 Chief Compliance Officer | | 2016 | | Chief Compliance Officer, Invesco Advisers, Inc. (registered investment adviser); and Chief Compliance Officer, The Invesco Funds Formerly: Chief Compliance Officer, Putnam Investments and the Putnam Funds | | | | N/A | | N/A |
The Statement of Additional Information of the Trust includes additional information about the Fund’s Trustees and is available upon request, without charge, by calling 1.800.959.4246. Please refer to the Fund’s Statement of Additional Information for information on the Fund’ssub-advisers.
Office of the Fund
11 Greenway Plaza,
Suite 1000
Houston, TX 77046-1173
Counsel to the Fund
Stradley Ronon Stevens & Young, LLP
2005 Market Street,
Suite 2600
Philadelphia, PA 19103-7018
Investment Adviser
Invesco Advisers, Inc.
1555 Peachtree Street, N.E.
Atlanta, GA 30309
Counsel to the Independent Trustees
Goodwin Procter LLP
901 New York Avenue, N.W. Washington, D.C. 20001
Distributor
Invesco Distributors, Inc.
11 Greenway Plaza,
Suite 1000
Houston, TX
77046-1173
Transfer Agent
Invesco Investment Services, Inc.
11 Greenway Plaza,
Suite 1000
Houston, TX
77046-1173
Auditors
PricewaterhouseCoopers
LLP
1000 Louisiana Street,
Suite 5800
Houston, TX 77002-5021
Custodian
Citibank, N.A.
111 Wall Street
New York, NY 10005
69 INVESCO OPPENHEIMER DISCOVERY FUND
Invesco recognizes the importance of protecting your personal and financial information when you visit our website located atwww.invesco.com (the “Website”). The following information is designed to help you understand the information collection practices at this Website. We will not sell, share or rent your personally identifiable information to others in contravention of this Privacy Policy. When we refer to ourselves as “we” or “Invesco” in this Privacy Policy, we mean our entire company including our affiliates, such as subsidiaries.
By visiting this Website, you are accepting the practices described in this Privacy Policy. If you do not agree to this policy, you may not use this Website. This Privacy Policy is subject to change without notice, from time to time in our sole discretion. You acknowledge that by accessing the Website after we have posted changes to this Privacy Policy, you are agreeing to this Privacy Policy as modified. Please review the Terms of Use1 to learn of other terms and conditions applicable to your use of the Website.
Please note that this Privacy Policy is not an exclusive statement of our privacy principles across all products and services. Other privacy principles or policies may apply depending on the products or services you obtain from Invesco, or the jurisdiction in which you transact with Invesco.
This Privacy Policy was last updated on May 6, 2018.
Information We Collect and Use
We collect personal information you choose to submit to the Website in order to process transactions requested by you and meet our contractual obligations. For example, you can choose to provide your name, contact information, social security number, or tax identification number in connection with accessing your account, or you can choose to provide your personal information when you fill out a secure account question form. Any information collected about you from the Website can, from time to time, be associated with other identifying information we have about you.
In addition, we may gather information about you automatically through your use of the Website, e.g. your IP address, how you navigate the Website, the organization from which you are accessing the Website, and the websites that you access before and after you visit the Website.
When you access the Website, we may also collect information such as unique device identifiers, your screen resolution and other device settings, information about your location, and analytical information about how you use the device from which you are viewing the Website. Where applicable, we may ask your permission before collecting certain information, such as precise geolocation information.
From time to time, we use or augment the personal information we have about you with information obtained from third parties. For example, we use third party information to confirm contact or financial information or to better understand your interests by associating demographic information from third parties with the information you have provided.
How We Use Personal Information
We use your personal information to respond to your inquiries and provide the products and services you request. We also use your information from time to time to deliver the content and services we believe
1 NTD
70 INVESCO OPPENHEIMER DISCOVERY FUND
you will find the most relevant and to provide customer service and support.
We also use the information you provide to further develop and improve our products and services. We aggregate and/orde-identify data about visitors to the Website for various business purposes including product and service development and improvement activities.
How We Share Personal Information
We collaborate with other companies and individuals to perform services for us and on our behalf and we collaborate with our affiliates, other companies and individuals with respect to particular products or services (“Providers”). Examples of Providers include data analysis firms, customer service and support providers, email and SMS vendors, andweb-hosting and development companies. Some Providers collect information for us or on our behalf on our Website. These Providers can be provided with access to personal information needed to perform their functions.
We reserve the right to disclose your personal information as required by law, when we believe disclosure is necessary to comply with a regulatory requirement, judicial proceeding, court order or legal process served on us, to protect the safety, rights or property of our customers, the public or Invesco or to enforce the Terms of Use.
If we sell or transfer a business unit (such as a subsidiary) or an asset (such as a website) to another company, we will share your personal information with such company. You will receive notice of such an event and the new entity will inform you of any changes to the practices in this Privacy Policy. If the new entity wishes to make additional use of your information, you have the right to decline such use at that time.
We occasionally disclose aggregate orde-identified data that is not personally identifiable with third parties.
Cookies and Other Tools
Invesco and its Providers collect information about you by using cookies, tracking pixels and other technologies. We use this information to better understand, customize and improve user experience with our websites, services and offerings as well as to manage our advertising. For example, we use web analytics services that use these technologies to gather information to help us understand how visitors engage with and navigate our Website, e.g., how and when pages in a site are visited and by how many visitors. We are also able to offer our visitors a more customized, relevant experience on our sites using these technologies by delivering content and functionality based on your preferences and interests.
Depending on their purpose, some cookies will only operate for the length of a single browsing session, while others have a longer life span to ensure that they fulfill their longer-term purposes. Your web browser can be set to allow you to control whether you will accept cookies or reject cookies, to notify you each time a cookie is sent to your browser, or to delete cookies that have already been set. If your browser is set to reject cookies, certain aspects of the Website that are cookie-enabled will not recognize you when you return to the website, and some Website functionality may be lost. The “Help” section of your browser may tell you how to prevent your browser from accepting cookies. To find out more about cookies, visitwww.aboutcookies.org.
71 INVESCO OPPENHEIMER DISCOVERY FUND
| | | | |
| | INVESCO’S PRIVACY NOTICEContinued |
| | |
Security
No data transmission over the internet can be 100% secure, so Invesco cannot ensure or warrant the security of any information you submit to us on this Website. However, Invesco seeks to protect your personal information from unauthorized access or use when you transact business on our Website using technical, administrative and procedural measures. Invesco makes no representation as to the reasonableness, efficacy, or appropriateness of the measures we use to safeguard such information.
Users are responsible for maintaining the secrecy of their own passwords. If you have reason to believe that your interaction with us is no longer secure (for example, if you feel that the security of any account you might have with us has been compromised), please immediately notify us by contacting us as specified below.
Transfer of Data to Other Countries
Any information you provide to Invesco through use of the Website may be stored and processed, transferred between and accessed from the United States, Canada and other countries which do not guarantee the same level of protection of personal information as the one in which you reside. However, Invesco will handle your personal information in accordance with this Privacy Policy regardless of where your personal information is stored/accessed.
Children’s Privacy
We are committed to protecting the privacy of children. We do not knowingly collect personal information from children under the age of 18. If you are under the age of 18, do not provide us with any personal information.
Contact Us
Please contact us if you have any questions or concerns about your personal information or require assistance in managing your choices.
Invesco Ltd.
1555 Peachtree St. NE
Atlanta, GA 30309
By phone:
(404)439-3236
By fax:
(404)962-8288
By email:
Anne.Gerry@invesco.com
Please update your account information by logging in or contact us by email or telephone as specified above to update your account information whenever such information ceases to be complete or accurate.
You may also contact us to:
72 INVESCO OPPENHEIMER DISCOVERY FUND
• Request that we amend, rectify, delete or update the personal data we hold about you;
• Where possible (e.g. in relation to marketing) amend or update your choices around processing;
• Request a copy of personal data held by us.
Disclaimer
Where the Website contains links to third-party websites/content/services that are not owned or controlled by Invesco, Invesco is not responsible for how these properties operate or treat your personal information so we recommend that you read the privacy policies and terms associated with these third party properties carefully.
73 INVESCO OPPENHEIMER DISCOVERY FUND
THIS PAGE INTENTIONALLY LEFT BLANK.
THIS PAGE INTENTIONALLY LEFT BLANK.
THIS PAGE INTENTIONALLY LEFT BLANK.
THIS PAGE INTENTIONALLY LEFT BLANK.
THIS PAGE INTENTIONALLY LEFT BLANK.
THIS PAGE INTENTIONALLY LEFT BLANK.
Explore High-Conviction Investing with Invesco

Go paperless with eDelivery
Visit invesco.com/edelivery to enjoy the convenience and security of anytime electronic access to your investment documents.
With eDelivery, you can elect to have any or all of the following materials delivered straight to your inbox to download, save and print from your own computer:
◾ Fund reports and prospectuses
◾ Quarterly statements
◾ Daily confirmations
◾ Tax forms
Invesco mailing information
Send general correspondence to Invesco Investment Services, Inc., P.O. Box 219078, Kansas City, MO 64121-9078.

| | | | |
| | Invesco Distributors, Inc. | | O-DIS-AR-1 10282019 |
| | |
 | | Shareholder Report for the Eleven Months Ended 8/31/2019 |
| | Invesco Oppenheimer Master Loan Fund* Beginning on January 1, 2021, as permitted by regulations adopted by the Securities and Exchange Commission, paper copies of the Fund’s shareholder reports will no longer be sent by mail, unless you specifically request paper copies of the reports from the Fund or from your financial intermediary, such as a broker-dealer or bank. Instead, the reports will be made available on the Fund’s website, and you will be notified by mail each time a report is posted and provided with a website link to access the report. If you already elected to receive shareholder reports electronically, you will not be affected by this change and you need not take any action. You may elect to receive shareholder reports and other communications from the Fund electronically by contacting your financial intermediary (such as a broker-dealer or bank) or, if you are a direct investor, by enrolling at invesco. com/edelivery. You may elect to receive all future reports in paper free of charge. If you invest through a financial intermediary, you can contact your financial intermediary to request that you continue to receive paper copies of your shareholder reports. If you invest directly with the Fund, you can call 800 959 4246 to let the Fund know you wish to continue receiving paper copies of your shareholder reports. Your election to receive reports in paper will apply to all funds held with your financial intermediary or all funds held with the fund complex if you invest directly with the Fund. *Prior to the close of business on May 24, 2019, the Fund’s name was Oppenheimer Master Loan Fund, LLC. See Important Update on the following page for more information. |
Important Update
On October 18, 2018, Massachusetts Mutual Life Insurance Company, an indirect corporate parent of OppenheimerFunds, Inc. and its subsidiaries OFI Global Asset Management, Inc., OFI SteelPath, Inc. and OFI Advisors, LLC, announced that it had entered into an agreement whereby Invesco Ltd., a global investment management company would acquire OppenheimerFunds and its subsidiaries (together, “OppenheimerFunds”). After the close of business on May 24, 2019 Invesco Ltd. completed the acquisition of OppenheimerFunds. This Fund was included in that acquisition and as of that date, became part of the Invesco family of funds. Please visit invesco.com for more information or call Invesco’s Client Services team at800-959-4246.
AVERAGE ANNUAL TOTAL RETURNS AT 8/31/19
| | | | | | |
| | | Invesco Oppenheimer Master J.P. Morgan Leveraged | | Credit Suisse |
| | | Loan Fund | | Loan Index | | Leveraged Loan Index |
| | | |
| 1-Year | | -1.21% | | 3.61% | | 3.38% |
| | | |
| 5-Year | | 3.36 | | 4.20 | | 3.92 |
| | | |
| 10-Year | | 5.91 | | 5.78 | | 5.68 |
Performance quoted is past performance and cannot guarantee comparable future results; current performance may be lower or higher. Visit invesco.com for the most recentmonth-end performance. Performance figures reflect reinvested distributions and changes in net asset value (NAV). Investment return and principal value will vary so that you may have a gain or a loss when you sell shares. Fund returns include changes in share price and reinvested. Returns for periods of less than one year are cumulative and not annualized. As the result of a reorganization after the close of business on May 24, 2019, the returns of the Fund for periods on or prior to May 24, 2019 reflect performance of the Oppenheimer predecessor fund. Share class returns will differ from those of the predecessor fund because they have different expenses. Returns do not consider capital gains or income taxes on an individual’s investment. See Fund prospectus and summary prospectus for more information on share classes, sales charges and new fee agreements, if any. Fund literature is available at invesco.com.
3 INVESCO OPPENHEIMER MASTER LOAN FUND
Fund Performance Discussion
The Master Loan Fund returned-1.21% during theone-year reporting period ending August 31, 2019, underperforming the J.P. Morgan Leveraged Loan Index (the “Index”), which returned +3.61%.
MARKET HIGHLIGHTS
During the fiscal period ending August 31, 2019 the markets saw increased volatility as growing trade tensions with China, a slowing global economy and a reversal in Fed policy from a tightening stance to one of easing heightened investor uncertainty. At the end of that time period the Federal Reserve cut interest rates 25 basis points, and the yield of the UST 10 year dropped 122 basis points from a high of 3.23% in November, 2018 to 2.01%. Commodity prices also experienced increased volatility with Oil and Natural Gas
trading down 14% and 20% respectively.
The J.P. Morgan Leveraged Loan Index returned +3.61% for the period and continued to demonstrate less sensitivity to the increased volatility across equity and commodity markets and a declining interest rate environment. In comparison, high yield, as represented by the J.P. Morgan Domestic High Yield Index, returned 6.42% as dissipated fears of rising rates spurred renewed investor appetite for the asset class.
COMPARISON OF CHANGE IN VALUE OF $10,000 HYPOTHETICAL INVESTMENTS IN:

4 INVESCO OPPENHEIMER MASTER LOAN FUND
FUND REVIEW
The primary detractors from relative performance this period were security selection in the Diversified Media and Metals & Mining sectors. The loans of a company in the Diversified Media sector experienced significant pressure as the issuer’s equity sponsor unexpectedly ceased the funding it had been providing to company. The secured creditors have organized anAd-Hoc committee and are working towards restructuring the company’s balance sheet to maximize recoveries on the loans. In the Metals and Mining sector the securities of two coal producers experienced pressure as the Coal industry has been out of favor and commodity prices have declined. We are constructive on each of these companies, as our valuations exceed currently depressed trading levels.
During the reporting period, the Fund experienced its strongest outperformance versus the Index from security selection in the Gaming sector, as it was announced that one of our Gaming companies was being acquired at a premium, which resulted in substantial price appreciation. Another strong driver of performance was from security selection in the Transportation sector.
STRATEGY & OUTLOOK
At the end of the reporting period, relative to the Index, the Fund had modest overweights in the Broadcasting, Metals and Mining, and Telecommunications sectors and modest underweights in the Technology, Healthcare,
and Retail sectors. As a result of the elevated volatility in the markets, the team identified attractive opportunities in some lower single B rated loans, as they experienced more price pressure than larger double B rated loans.
At period end, the overall credit quality of the loan market is also solid with defaults of approximately 1.5%. While select sectors, such as Healthcare and Retail, are experiencing challenges specific to their industries, we believe credit fundamentals can continue to remain solid.
5 INVESCO OPPENHEIMER MASTER LOAN FUND
Top Holdings and Allocations
| | | | |
TOP FIVE DEBT HOLDINGS | | | | |
| Monarchy Enterprises Holdings BV, Sr. Sec. Credit Facilities 1st Lien Term Loan, 8.612% [LIBOR4+650], 10/13/22 | | | 1.7 | % |
| Tesla, Inc., 5.30% Sr. Unsec. Nts., 8/15/25 | | | 1.7 | |
| Caesars Growth Properties Holdings LLC, Sr. Sec. Credit Facilities 1st Lien Term Loan, 4.862% [LIBOR4+275], 12/23/24 | | | 1.5 | |
| Murray Energy Corp., Sr. Sec. Credit Facilities 1st Lien Term Loan, Tranche B2, 9.362% [LIBOR4+725], 10/17/22 | | | 1.4 | |
| Western Express, Inc., Sr. Sec. Credit Facilities 2nd Lien Term Loan, 10.374% [LIBOR4+825], 2/23/22 | | | 1.3 | |
| CenturyLink, Inc., Sr. Sec. Credit Facilities 1st Lien Term Loan, Tranche B, 4.862% [LIBOR4+275], 1/31/25 | | | 1.2 | |
Portfolio holdings and allocations are subject to change. Percentages are as of August 31, 2019, and are based on net assets.
| | | | |
| CREDIT RATING BREAKDOWN | |
| NRSRO
ONLY
TOTAL |
|
| BBB | | | 1.6 | % |
| BB | | | 28.7 | |
| B | | | 48.1 | |
| CCC | | | 4.4 | |
| CC | | | 0.1 | |
| Unrated | | | 17.1 | |
The percentages above are based on the market value of the Fund’s securities as of August 31, 2019, and are subject to change. Except for securities labeled “Unrated,” all securities have been rated by at least one Nationally Recognized Statistical Rating Organization (“NRSRO”), such as S&P Global Ratings (“S&P”). For securities rated only by an NRSRO other than S&P, Invesco Advisers, Inc. (the “Adviser”) converts that rating to the equivalent S&P rating. If two or more NRSROs have assigned a rating to a security, the highest S&P equivalent rating is used. For securities not rated by an NRSRO, the Adviser uses its own credit analysis to assign ratings in categories similar to those of S&P. The use of similar categories is not an indication that the Adviser’s credit analysis process is consistent or comparable with any NRSRO’s process were that NRSRO to rate the same security. Fund assets invested in Invesco Oppenheimer Institutional Government Money Market Fund are assigned that fund’s S&P rating, which is currently AAA. For the purposes of this table, “investment-grade” securities are securities rated within the NRSROs’ four highest rating categories (AAA, AA, A and BBB). Unrated securities do not necessarily indicate low credit quality, and may or may not be the equivalent of investment-grade. Please consult the Fund’s prospectus and Statement of Additional Information for further information.
6 INVESCO OPPENHEIMER MASTER LOAN FUND
Fund Expenses
Fund Expenses. As a shareholder of the Fund, you incur two types of costs: (1) transaction costs, which may include sales charges (loads) on purchase payments and/or contingent deferred sales charges on redemptions; and (2) ongoing costs, including management fees; distribution and service fees; and other Fund expenses. These examples are intended to help you understand your ongoing costs (in dollars) of investing in the Fund and to compare these costs with the ongoing costs of investing in other mutual funds.
The examples are based on an investment of $1,000.00 invested at the beginning of the period and held for the entire6-month period ended August 31, 2019.
Actual Expenses. The first section of the table provides information about actual account values and actual expenses. You may use the information in this section, together with the amount you invested, to estimate the expense that you paid over the period. Simply divide your account value by $1,000.00 (for example, an $8,600.00 account value divided by $1,000.00 = 8.60), then multiply the result by the number in the first section under the heading entitled “Expenses Paid During 6 Months Ended August 31, 2019” to estimate the expenses you paid on your account during this period.
Hypothetical Example for Comparison Purposes.The second section of the table provides information about hypothetical account values and hypothetical expenses based on the Fund’s actual expense ratio, and an assumed rate of return of 5% per year before expenses, which is not the Fund’s actual return. The hypothetical account values and expenses may not be used to estimate the actual ending account balance or expenses you paid for the period. You may use this information to compare the ongoing costs of investing in the Fund and other funds. To do so, compare this 5% hypothetical example with the 5% hypothetical examples that appear in the shareholder reports of the other funds.
Please note that the expenses shown in the table are meant to highlight your ongoing costs only and do not reflect any transactional costs, such asfront-end or contingent deferred sales charges (loads). Therefore, the “hypothetical” section of the table is useful in comparing ongoing costs only, and will not help you determine the relative total costs of owning different funds. In addition, if these transactional costs were included, your costs would have been higher.
7 INVESCO OPPENHEIMER MASTER LOAN FUND
| | | | | | | | | | | | |
| Actual | | Beginning Account Value March 1, 2019 | | | Ending Account Value August 31, 2019 | | | Expenses Paid During 6 Months Ended August 31, 2019 | |
| | $ | 1,000.00 | | | $ | 983.40 | | | $ | 2.95 | |
| | | |
Hypothetical (5% return before expenses) | | | | | | | | | |
| | | 1,000.00 | | | | 1,022.23 | | | | 3.01 | |
Expenses are equal to the Fund’s annualized expense ratio, multiplied by the average account value over the period, multiplied by 184/365 (to reflect theone-half year period). The annualized expense ratio, excluding indirect expenses from affiliated funds, based on the6-month period ended August 31, 2019 is as follows:
The expense ratio reflects voluntary and/or contractual waivers and/or reimbursements of expenses by the Fund’s Manager. Some of these undertakings may be modified or terminated at any time, as indicated in the Fund’s prospectus. The “Financial Highlights” table in the Fund’s financial statements, included in this report, also shows the gross expense ratio, without such waivers or reimbursements and reduction to custodian expenses, if applicable.
8 INVESCO OPPENHEIMER MASTER LOAN FUND
SCHEDULE OF INVESTMENTSAugust 31, 2019
| | | | | | | | |
| | | Principal Amount | | | Value |
| Corporate Loans*—91.0% | | | | | | | | |
| Consumer Discretionary—28.2% | | | | | | | | |
| Distributors—1.1% | | | | | | | | |
Albertson’s LLC, Sr. Sec. Credit Facilities 1st Lien Term Loan: Tranche B7, 4.862%, [LIBOR12+275], 11/17/251 | | $ | 543,982 | | | $ | 546,533 | |
| Tranche B8, 4.862%, [LIBOR12+275], 8/17/261 | | | 574,890 | | | | 577,868 | |
| Alphabet Holdings Co., Inc., Sr. Sec. Credit Facilities 1st Lien Term Loan, 5.612%, [LIBOR4+350], 9/26/241 | | | 862,364 | | | | 805,055 | |
| Bass Pro Group LLC, Sr. Sec. Credit Facilities 1st Lien Term Loan, Tranche B, 7.112%, [LIBOR12+500], 9/25/241 | | | 2,418,916 | | | | 2,307,234 | |
| Belk, Inc., Sr. Sec. Credit Facilities 1st Lien Term Loan, Tranche B, 6.944%, [LIBOR4+475], 12/12/221 | | | 598,951 | | | | 470,673 | |
| Jo-Ann Stores LLC, Sr. Sec. Credit Facilities 1st Lien Term Loan, Tranche B, 7.259%, [LIBOR4+500], 10/20/231 | | | 319,149 | | | | 248,006 | |
| Petco Animal Supplies, Inc., Sr. Sec. Credit Facilities 1st Lien Term Loan, Tranche B1, 5.506%, [LIBOR4+325], 1/26/231 | | | 911,176 | | | | 657,564 | |
| United Natural Foods, Inc., Sr. Sec. Credit Facilities 1st Lien Term Loan, Tranche B, 6.362%, [LIBOR12+425], 10/22/251 | | | 2,007,250 | | | | 1,667,694 | |
| | | | | | | | |
| | | | | | | 7,280,627 | |
| | | | | | | | | |
| Diversified Consumer Services—1.2% | | | | | | | | |
| 4L Technologies, Inc., Sr. Sec. Credit Facilities 1st Lien Term Loan, Tranche B, 6.612%, [LIBOR4+450], 5/8/201 | | | 4,586,681 | | | | 2,557,075 | |
| IQOR US, Inc., Sr. Sec. Credit Facilities 1st Lien Term Loan, Tranche B, 7.319%, [LIBOR4+500], 4/1/211 | | | 5,167,635 | | | | 4,767,144 | |
| IQOR US, Inc., Sr. Sec. Credit Facilities 2nd Lien Term Loan, 11.069%, [LIBOR4+875], 4/1/221 | | | 760,036 | | | | 578,893 | |
| | | | | | | | |
| | | | | | | 7,903,112 | |
| | | | | | | | | |
| Hotels, Restaurants & Leisure—6.5% | | | | | | | | |
| 24 Hour Fitness Worldwide, Inc., Sr. Sec. Credit Facilities 1st Lien Term Loan, Tranche B, 5.734%, [LIBOR12+350], 5/30/251 | | | 357,990 | | | | 348,951 | |
| Caesars Growth Properties Holdings LLC, Sr. Sec. Credit Facilities 1st Lien Term Loan, 4.862%, [LIBOR4+275], 12/23/241 | | | 10,164,324 | | | | 10,030,307 | |
| CDS US Intermediate Holdings, Inc., Sr. Sec. Credit Facilities 1st Lien Term Loan, Tranche B, 6.08%, [LIBOR4+375], 7/8/221 | | | 841,362 | | | | 807,707 | |
| Churchill Downs, Inc., Sr. Sec. Credit Facilities 1st Lien Term Loan, Tranche B, 4.12%, [LIBOR12+200], 12/27/241 | | | 845,791 | | | | 847,905 | |
| CityCenter Holdings LLC, Sr. Sec. Credit Facilities 1st Lien Term Loan, Tranche B, 4.362%, [LIBOR12+225], 4/18/241 | | | 1,864,058 | | | | 1,866,388 | |
| Delta 2 Lux Sarl, Sr. Sec. Credit Facilities 1st Lien Term Loan, Tranche B3, 4.612%, [LIBOR12+250], 2/1/241 | | | 3,333,031 | | | | 3,274,186 | |
| Eldorado Resorts, Inc., Sr. Sec. Credit Facilities 1st Lien Term Loan, Tranche B,4.375%-4.50%, [LIBOR4+225], 4/17/241 | | | 1,442,628 | | | | 1,441,503 | |
| Everi Payments, Inc., Sr. Sec. Credit Facilities 1st Lien Term Loan, Tranche B, 5.112%, [LIBOR12+300], 5/9/241 | | | 2,235,163 | | | | 2,238,516 | |
| Four Seasons Hotels Ltd., Sr. Sec. Credit Facilities 1st Lien Term Loan, 4.112%, [LIBOR12+200], 11/30/231 | | | 184,852 | | | | 185,339 | |
9 INVESCO OPPENHEIMER MASTER LOAN FUND
SCHEDULE OF INVESTMENTSContinued
| | | | | | | | |
| | | Principal Amount | | | Value |
| Hotels, Restaurants & Leisure (Continued) | | | | | | | | |
| Gateway Casinos & Entertainment Ltd., Sr. Sec. Credit Facilities 1st Lien Term Loan, Tranche B, 5.33%, [LIBOR4+300], 12/1/231 | | $ | 1,195,989 | | | $ | 1,184,627 | |
| GVC Holdings plc, Sr. Sec. Credit Facilities 1st Lien Term Loan, Tranche B2, 4.652%, [LIBOR4+275], 3/29/241 | | | 1,238,234 | | | | 1,240,364 | |
| LTI Holdings, Inc., Sr. Sec. Credit Facilities 1st Lien Term Loan, 5.612%, [LIBOR12+350], 9/6/251 | | | 553,637 | | | | 524,108 | |
| Nascar Holdings Inc., Sr. Sec. Credit Facilities 1st Lien Term Loan, Tranche B, 5.275%, 7/26/261 | | | 1,005,000 | | | | 1,011,492 | |
| Scientific Games International, Inc., Sr. Sec. Credit Facilities 1st Lien Term Loan, Tranche B5,4.862%-4.896%, [LIBOR6+275], 8/14/241 | | | 6,444,976 | | | | 6,379,173 | |
| SeaWorld Parks & Entertainment, Inc., Sr. Sec. Credit Facilities 1st Lien Term Loan, Tranche B5, 5.112%, [LIBOR4+300], 4/1/241 | | | 1,800,977 | | | | 1,802,949 | |
| Stars Group Holdings BV, Sr. Sec. Credit Facilities 1st Lien Term Loan, Tranche B, 6.101%, [LIBOR4+350], 7/10/251 | | | 3,892,594 | | | | 3,909,352 | |
| Station Casinos LLC, Sr. Sec. Credit Facilities 1st Lien Term Loan, Tranche B, 4.62%, [LIBOR12+250], 6/8/231 | | | 3,324,532 | | | | 3,335,453 | |
| Topgolf International, Inc., Sr. Sec. Credit Facilities 1st Lien Term Loan, 7.701%, [LIBOR12+550], 2/8/261 | | | 204,488 | | | | 206,021 | |
| Town Sports International LLC, Sr. Sec. Credit Facilities 1st Lien Term Loan, Tranche B, 5.612%, [LIBOR12+350], 11/15/201 | | | 1,936,700 | | | | 1,810,815 | |
| Weight Watchers International, Inc., Sr. Sec. Credit Facilities 1st Lien Term Loan, Tranche B,6.98%-7.07%, [LIBOR12+475], 11/29/241 | | | 580,514 | | | | 581,332 | |
| Wyndham Hotels & Resorts, Inc., Sr. Sec. Credit Facilities 1st Lien Term Loan, Tranche B, 3.862%, [LIBOR4+200], 5/30/251 | | | 250,600 | | | | 251,679 | |
| | | | | | | | |
| | | | | | | 43,278,167 | |
| | | | | | | | | |
| Household Durables—3.4% | | | | | | | | |
| ABG Intermediate Holdings 2 LLC, Sr. Sec. Credit Facilities 1st Lien Term Loan, 5.612%, [LIBOR4+350], 9/27/241 | | | 1,825,156 | | | | 1,821,168 | |
| American Greetings Corp., Sr. Sec. Credit Facilities 1st Lien Term Loan, Tranche B, 6.612%, [LIBOR12+450], 4/6/241 | | | 1,979,920 | | | | 1,970,020 | |
| Callaway Golf Co., Sr. Sec. Credit Facilities 1st Lien Term Loan, Tranche B, 6.713%, [LIBOR12+450], 12/14/251 | | | 317,373 | | | | 322,100 | |
| Coty, Inc., Sr. Sec. Credit Facilities 1st Lien Term Loan, Tranche B, 4.463%, [LIBOR4+225], 4/7/251 | | | 2,819,188 | | | | 2,736,727 | |
| International Textile Group, Inc., Sr. Sec. Credit Facilities 1st Lien Term Loan, 7.23%, [LIBOR4+500], 5/1/241 | | | 1,065,948 | | | | 959,354 | |
| Lifetime Brands, Inc., Sr. Sec. Credit Facilities 1st Lien Term Loan, Tranche B,5.612%-5.902%, [LIBOR12+350], 2/28/251 | | | 326,942 | | | | 317,134 | |
| PetSmart, Inc., Sr. Sec. Credit Facilities 1st Lien Term Loan, Tranche B, 6.21%, [LIBOR12+400], 3/11/221 | | | 2,149,967 | | | | 2,092,187 | |
| Revlon Consumer Products Corp., Sr. Sec. Credit Facilities 1st Lien Term Loan, Tranche B, 5.624%, [LIBOR12+350], 9/7/231 | | | 4,649,497 | | | | 3,728,897 | |
| Rodan & Fields LLC, Sr. Sec. Credit Facilities 1st Lien Term Loan, Tranche B, 6.195%, [LIBOR12+400], 6/16/251 | | | 2,432,795 | | | | 2,125,046 | |
10 INVESCO OPPENHEIMER MASTER LOAN FUND
| | | | | | | | |
| | | Principal Amount | | | Value |
| Household Durables (Continued) | | | | | | | | |
| Serta Simmons Bedding LLC, Sr. Sec. Credit Facilities 1st Lien Term Loan, Tranche B,5.682%-5.701%, [LIBOR4+350], 11/8/231 | | $ | 6,752,973 | | | $ | 4,535,735 | |
| SIWF Holdings, Inc., Sr. Sec. Credit Facilities 1st Lien Term Loan, 6.395%, [LIBOR12+425], 6/15/251 | | | 1,715,456 | | | | 1,699,374 | |
| Varsity Brands Holdings Co., Inc., Sr. Sec. Credit Facilities 1st Lien Term Loan, 5.612%, [LIBOR12+350], 12/16/241 | | | 283,474 | | | | 276,614 | |
| | | | | | | | |
| | | | | | | 22,584,356 | |
| | | | | | | | | |
| Media—15.9% | | | | | | | | |
| Acosta, Inc., Sr. Sec. Credit Facilities 1st Lien Term Loan, Tranche B, 5.362%, [LIBOR4+325], 9/26/211 | | | 3,767 | | | | 1,312 | |
| Altice Financing SA, Sr. Sec. Credit Facilities 1st Lien Term Loan: | | | | | | | | |
| Tranche B, 4.945%, [LIBOR4+275], 7/15/251 | | | 2,734,252 | | | | 2,658,485 | |
| Tranche B13, 6.197%, [LIBOR4+400], 8/14/261 | | | 4,198,275 | | | | 4,170,734 | |
| CBS Radio, Inc., Sr. Sec. Credit Facilities 1st Lien Term Loan, Tranche B1, 4.89%, [LIBOR4+275], 11/18/241 | | | 749,151 | | | | 749,698 | |
| Checkout Holding Corp., Sr. Sec. Credit Facilities 1st Lien Exit Term Loan, 9.682%, [LIBOR12+750], 2/15/231 | | | 1,252,278 | | | | 1,039,391 | |
| Checkout Holding Corp., Sr. Sec. Credit Facilities 1st Lien Exit Term Loan, 9.50% PIK Rate, 3.314% Cash Rate, LIBOR12+100], 8/15/231,2 | | | 1,271,631 | | | | 604,025 | |
| CSC Holdings LLC, Sr. Sec. Credit Facilities 1st Lien Term Loan, Tranche B, 4.445%, [LIBOR12+225], 7/17/251 | | | 3,246,405 | | | | 3,238,289 | |
| Deluxe Entertainment Services Group, Inc., Sr. Sec. Credit Facilities 1st Lien Term Loan,9.668%-11.75%, [LIBOR6+750], 2/28/201,3 | | | 479,908 | | | | 443,915 | |
| Deluxe Entertainment Services Group, Inc., Sr. Sec. Credit Facilities 1st Lien Term Loan, Tranche B, 7.756%, [LIBOR4+550], 2/28/201 | | | 3,851,613 | | | | 652,848 | |
| Deluxe Entertainment Services Group, Inc., Sr. Sec. Credit Facilities 1st Lien Term Loan, Delayed Draw, 0.50%, 2/28/201,3,4 | | | 33,777 | | | | 31,243 | |
| EW Scripps Co. (The), Sr. Sec. Credit Facilities 1st Lien Term Loan, Tranche B, 4.862%, [LIBOR12+275], 5/1/261 | | | 2,372,813 | | | | 2,377,024 | |
| Gray Television, Inc., Sr. Sec. Credit Facilities 1st Lien Term Loan, Tranche B, 5.014%, [LIBOR12+250], 1/2/261 | | | 5,000,000 | | | | 5,008,325 | |
| Harland Clarke Holdings Corp., Sr. Sec. Credit Facilities 1st Lien Term Loan, Tranche B7, 7.08%, [LIBOR4+475], 11/3/231 | | | 827,815 | | | | 650,456 | |
| iHeartCommunications, Inc., Sr. Sec. Credit Facilities 1st Lien Exit Term Loan, 6.23%, [LIBOR12+400], 5/1/261 | | | 2,220,196 | | | | 2,230,331 | |
| Intelsat Jackson Holdings SA, Sr. Sec. Credit Facilities 1st Lien Term Loan, Tranche B3, 5.895%, [LIBOR4+375], 11/27/231 | | | 3,120,000 | | | | 3,123,900 | |
| ION Media Networks, Inc., Sr. Sec. Credit Facilities 1st Lien Term Loan, Tranche B4, 5.125%, [LIBOR12+300], 12/18/241 | | | 6,950,000 | | | | 6,948,228 | |
| Liberty Cablevision of Puerto Rico LLC, Sr. Sec. Credit Facilities 1st Lien Term Loan, 5.695%, [LIBOR4+350], 1/7/221 | | | 2,324,094 | | | | 2,309,568 | |
| MacDonald Dettwiler & Associates Ltd., Sr. Sec. Credit Facilities 1st Lien Term Loan, Tranche B, 4.87%, [LIBOR4+250], 10/4/241 | | | 1,627,703 | | | | 1,431,019 | |
11 INVESCO OPPENHEIMER MASTER LOAN FUND
SCHEDULE OF INVESTMENTSContinued
| | | | | | | | |
| | | Principal Amount | | | Value |
| Media (Continued) | | | | | | | | |
| MediArena Acquisition BV, Sr. Sec. Credit Facilities 1st Lien Term Loan, 8.07%, [LIBOR4+575], 8/13/211 | | $ | 2,512,505 | | | $ | 2,492,103 | |
| Metro-Goldwyn-Mayer, Inc., Sr. Sec. Credit Facilities 1st Lien Term Loan, Tranche B, 4.62%, [LIBOR4+250], 7/3/251,3 | | | 1,760,000 | | | | 1,757,800 | |
| Metro-Goldwyn-Mayer, Inc., Sr. Sec. Credit Facilities 2nd Lien Term Loan, Tranche B, 6.62%, [LIBOR4+450], 7/3/261 | | | 995,000 | | | | 972,613 | |
| MH Sub I LLC, Sr. Sec. Credit Facilities 1st Lien Term Loan, 6.093%, [LIBOR12+375], 9/13/241 | | | 2,000,000 | | | | 1,987,080 | |
| Monarchy Enterprises Holdings BV, Sr. Sec. Credit Facilities 1st Lien Term Loan, 8.612%, [LIBOR4+650], 10/13/221,3 | | | 11,700,000 | | | | 11,641,500 | |
| NEP Group, Inc., Sr. Sec. Credit Facilities 1st Lien Term Loan, Tranche B, 5.362%, [LIBOR4+325], 10/20/251 | | | 6,791,087 | | | | 6,645,079 | |
| Nexstar Broadcasting, Inc., Sr. Sec. Credit Facilities 1st Lien Term Loan, Tranche B, 5.253%, [LIBOR4+275], 6/19/261 | | | 6,900,000 | | | | 6,912,317 | |
| Radiate Holdco LLC, Sr. Sec. Credit Facilities 1st Lien Term Loan, 5.112%, [LIBOR12+300], 2/1/241 | | | 4,885,434 | | | | 4,846,766 | |
| Red Ventures LLC, Sr. Sec. Credit Facilities 1st Lien Term Loan, Tranche B, 5.112%, [LIBOR12+300], 11/8/241 | | | 2,000,000 | | | | 2,001,720 | |
| SFR Group SA, Sr. Sec. Credit Facilities 1st Lien Term Loan, Tranche B, 4.862%, [LIBOR4+275], 7/31/251 | | | 1,893,495 | | | | 1,834,323 | |
| Sinclair Television Group Inc., Sr. Sec. Credit Facilities 1st Lien Term Loan: | | | | | | | | |
| Tranche B, 5.42%, [LIBOR12+325], 7/18/261 | | | 1,020,000 | | | | 1,022,336 | |
| Tranche B, 4.70%, [LIBOR4+250], 9/30/261 | | | 658,945 | | | | 659,630 | |
| SpeedCast International Ltd., Sr. Sec. Credit Facilities 1st Lien Term Loan, Tranche B, 5.08%, [LIBOR4+275], 5/3/251 | | | 1,360,796 | | | | 1,267,241 | |
| Technicolor SA, Sr. Sec. Credit Facilities 1st Lien Term Loan, Tranche B, 4.874%, [LIBOR4+275], 12/6/231 | | | 1,069,198 | | | | 958,268 | |
| Telenet Financing USD LLC, Sr. Sec. Credit Facilities 1st Lien Term Loan, Tranche B, 4.445%, [LIBOR12+225], 8/15/261 | | | 2,830,000 | | | | 2,826,816 | |
| Univision Communications, Inc., Sr. Sec. Credit Facilities 1st Lien Term Loan, Tranche C5, 4.862%, [LIBOR12+275], 3/15/241 | | | 5,279,847 | | | | 5,060,153 | |
| Virgin Media Bristol LLC, Sr. Sec. Credit Facilities 1st Lien Term Loan, Tranche K, 4.695%, [LIBOR12+250], 1/15/261 | | | 4,265,000 | | | | 4,269,500 | |
| WideOpenWest Finance LLC, Sr. Sec. Credit Facilities 1st Lien Term Loan, Tranche B, 5.395%, [LIBOR12+325], 8/18/231 | | | 4,028,410 | | | | 3,882,380 | |
| William Morris Endeavor Entertainment LLC, Sr. Sec. Credit Facilities 1st Lien Term Loan, Tranche B1, 4.87%, [LIBOR6+275], 5/18/251 | | | 1,410,000 | | | | 1,375,455 | |
| Ziggo Secured Finance Partnership, Sr. Sec. Credit Facilities 1st Lien Term Loan, Tranche E, 4.695%, [LIBOR12+250], 4/15/251 | | | 6,145,000 | | | | 6,112,032 | |
| | | | | | | | |
| | | | | | | 106,193,903 | |
| | | | | | | | | |
| Multiline Retail—0.1% | | | | | | | | |
| Neiman Marcus Group Ltd. LLC, Sr. Sec. Credit Facilities 1st Lien Term Loan, 1.00% PIK Rate, 7.729% Cash Rate, [LIBOR12+650], 10/25/231,2 | | | 1,425,256 | | | | 1,169,608 | |
12 INVESCO OPPENHEIMER MASTER LOAN FUND
| | | | | | | | |
| | | Principal Amount | | | Value |
| Consumer Staples—2.8% | | | | | | | | |
| Beverages—2.8% | | | | | | | | |
| 1011778 BC ULC, Sr. Sec. Credit Facilities 1st Lien Term Loan, Tranche B, 4.362%, [LIBOR12+225], 2/16/241 | | $ | 1,700,000 | | | $ | 1,699,974 | |
| Chobani LLC, Sr. Sec. Credit Facilities 1st Lien Term Loan, Tranche B, 5.84%, [LIBOR12+350], 10/10/231 | | | 2,000,000 | | | | 1,973,000 | |
| Dole Food Co., Inc., Sr. Sec. Credit Facilities 1st Lien Term Loan, Tranche B,4.862%-4.917%, [LIBOR12+275], 4/6/241 | | | 2,370,737 | | | | 2,345,548 | |
| Hearthside Group Holdings LLC, Sr. Sec. Credit Facilities 1st Lien Term Loan, 5.80%, [LIBOR12+368.75], 5/23/251 | | | 1,408,083 | | | | 1,372,916 | |
| Hostess Brands LLC, Sr. Sec. Credit Facilities 1st Lien Term Loan,4.362%-4.833%, [LIBOR12+225], 8/3/221 | | | 1,165,074 | | | | 1,164,760 | |
| IRB Holding Corp., Sr. Sec. Credit Facilities 1st Lien Term Loan, 5.55%, [LIBOR12+325], 2/5/251 | | | 3,070,411 | | | | 3,053,385 | |
| KFC Holding Co., Sr. Sec. Credit Facilities 1st Lien Term Loan, Tranche B, 3.932%, [LIBOR12+175], 4/3/251 | | | 346,121 | | | | 346,228 | |
| Nomad Foods Europe Midco Ltd., Sr. Sec. Credit Facilities 1st Lien Term Loan, 4.445%, [LIBOR12+225], 5/15/241 | | | 2,052,285 | | | | 2,044,589 | |
| NPC International, Inc., Sr. Sec. Credit Facilities 1st Lien Term Loan, 5.612%, [LIBOR12+350], 4/19/241 | | | 767,519 | | | | 559,905 | |
| Sigma US Corp., Sr. Sec. Credit Facilities 1st Lien Term Loan, Tranche B, 5.32%, [LIBOR4+325], 7/2/251 | | | 3,040,727 | | | | 3,029,325 | |
| Sunshine Investments BV, Sr. Sec. Credit Facilities 1st Lien Term Loan, Tranche B3, 5.768%, [LIBOR4+325], 3/28/251 | | | 1,267,200 | | | | 1,270,368 | |
| | | | | | | | |
| | | | | | | 18,859,998 | |
| | | | | | | | | |
| Energy—3.6% | | | | | | | | |
| Energy Equipment & Services—3.0% | | | | | | | | |
| AL Midcoast Holdings LLC, Sr. Sec. Credit Facilities 1st Lien Term Loan, Tranche B, 7.83%, [LIBOR4+550], 8/1/251 | | | 1,240,949 | | | | 1,218,457 | |
| Ascent Resources - Marcellus LLC, Sr. Sec. Credit Facilities 1st Lien Term Loan, 8.695%, [LIBOR12+650], 3/30/231,3 | | | 843,555 | | | | 818,248 | |
| Bison Midstream Holdings LLC, Sr. Sec. Credit Facilities 1st Lien Term Loan, Tranche B, 6.169%, [LIBOR12+400], 5/21/251 | | | 320,115 | | | | 289,169 | |
| Blackstone CQP Holdco LP, Sr. Sec. Credit Facilities 1st Lien Term Loan, Tranche B, 5.953%, [LIBOR4+350], 9/30/241 | | | 2,000,000 | | | | 2,003,130 | |
| Eastern Power LLC, Sr. Sec. Credit Facilities 1st Lien Term Loan, Tranche B, 5.984%, [LIBOR12+375], 10/2/231 | | | 2,954,774 | | | | 2,968,824 | |
| Fieldwood Energy LLC, Sr. Sec. Credit Facilities 1st Lien Term Loan, 7.506%, [LIBOR12+525], 4/11/221 | | | 2,848,091 | | | | 2,524,120 | |
| HGIM Corp., Sr. Sec. Credit Facilities 1st Lien Term Loan, Tranche B, 8.034%, [LIBOR4+600], 7/2/231 | | | 960,901 | | | | 872,018 | |
| Larchmont Resources LLC, Sr. Sec. Credit Facilities 1st Lien Term Loan, Tranche A, 9.61%, [LIBOR4+700], 8/7/201,3 | | | 102,510 | | | | 96,615 | |
| Limetree Bay Terminals LLC, Sr. Sec. Credit Facilities 1st Lien Term Loan,6.112%-6.24%, [LIBOR12+400], 2/15/241 | | | 2,160,582 | | | | 2,074,159 | |
| McDermott Technology Americas, Inc., Sr. Sec. Credit Facilities 1st Lien Term Loan, Tranche B, 7.112%, [LIBOR12+500], 5/12/251 | | | 662,274 | | | | 609,710 | |
| Seadrill Operating LP, Sr. Sec. Credit Facilities 1st Lien Term Loan, Tranche B, 8.33%, [LIBOR4+600], 2/21/211 | | | 4,100,490 | | | | 2,445,943 | |
13 INVESCO OPPENHEIMER MASTER LOAN FUND
SCHEDULE OF INVESTMENTSContinued
| | | | | | | | |
| | | Principal Amount | | | Value |
| Energy Equipment & Services (Continued) | | | | | | | | |
| Sheridan Investment Partners II LP, Sr. Sec. Credit Facilities 1st Lien Term Loan, Tranche B, 6.13%, [LIBOR4+350], 12/16/201,5 | | $ | 3,666,887 | | | $ | 2,071,791 | |
| Sheridan Production PartnersII-A LP, Sr. Sec. Credit Facilities 1st Lien Term Loan, Tranche B, 6.13%, [LIBOR4+350], 12/16/201,5 | | | 510,679 | | | | 288,534 | |
| Sheridan Production PartnersII-M LP, Sr. Sec. Credit Facilities 1st Lien Term Loan, Tranche B, 6.13%, [LIBOR4+350], 12/16/201,5 | | | 188,943 | | | | 106,753 | |
| Ultra Resources, Inc., Sr. Sec. Credit Facilities 1st Lien Exit Term Loan, 0.25% PIK Rate, 6.02% Cash Rate, [LIBOR4+400], 4/12/241,2 | | | 2,786,085 | | | | 1,923,178 | |
| | | | | | | | |
| | | | | | | 20,310,649 | |
| | | | | | | | | |
| Oil, Gas & Consumable Fuels—0.6% | | | | | | | | |
| Southcross Energy Partners LP, Sr. Sec. Credit Facilities Debtor in Possession 1st Lien Term Loan, 10.50%,[PRIME12+525], 10/1/191 | | | 820,473 | | | | 836,882 | |
| Southcross Energy Partners LP, Sr. Sec. Credit Facilities 1st Lien Term Loan, Tranche B, 10.50%,[PRIME4+525], 8/4/211,5 | | | 2,601,063 | | | | 1,963,803 | |
| Southcross Energy Partners LP, Sr. Sec. Credit Facilities Debtor in Possession 1st Lien Term Loan, 15.652% PIK Rate, 12.20% Cash Rate, [LIBOR12+1,000], 10/1/191,2 | | | 806,430 | | | | 822,558 | |
| Southcross Energy Partners LP, Sr. Sec. Credit Facilities Debtor in Possession 1st Lien Term Loan, 15.652% PIK Rate, 10.50% Cash Rate,[PRIME12+525], 10/1/191,2 | | | 179,173 | | | | 174,245 | |
| | | | | | | | |
| | | | | | | 3,797,488 | |
| | | | | | | | | |
| Financials—5.1% | | | | | | | | |
| Commercial Banks—4.5% | | | | | | | | |
| Acrisure LLC, Sr. Sec. Credit Facilities 1st Lien Term Loan, Tranche B,5.862%-6.362%, [LIBOR4+375], 11/22/231 | | | 2,796,062 | | | | 2,773,545 | |
| Alliant Holdings Intermediate LLC, Sr. Sec. Credit Facilities 1st Lien Term Loan, Tranche B, 5.269%, [LIBOR12+300], 5/9/251 | | | 2,461,944 | | | | 2,399,066 | |
| AmWINS Group, Inc., Sr. Sec. Credit Facilities 1st Lien Term Loan,4.862%-4.979%, [LIBOR12+275], 1/25/241 | | | 1,890,306 | | | | 1,891,327 | |
| Amynta Agency Borrower, Inc., Sec. Credit Facilities 1st Lien Term Loan, 6.612%, [LIBOR12+450], 2/28/251,3 | | | 1,125,199 | | | | 1,077,378 | |
| Aretec Group, Inc., Sr. Sec. Credit Facilities 1st Lien Term Loan, 6.362%, [LIBOR12+425], 10/1/251 | | | 5,898,218 | | | | 5,761,822 | |
| DTZ US Borrower LLC, Sr. Sec. Credit Facilities 1st Lien Term Loan, Tranche B, 5.362%, [LIBOR12+325], 8/21/251 | | | 2,121,214 | | | | 2,124,194 | |
| GGP Nimbus LP, Sr. Sec. Credit Facilities 1st Lien Term Loan, Tranche B, 4.612%, [LIBOR12+250], 8/27/251 | | | 2,593,485 | | | | 2,531,889 | |
| HUB International Ltd., Sr. Sec. Credit Facilities 1st Lien Term Loan, Tranche B, 5.267%, [LIBOR4+300], 4/25/251 | | | 3,500,043 | | | | 3,436,394 | |
| Hyperion Insurance Group Ltd., Sr. Sec. Credit Facilities 1st Lien Term Loan, Tranche B, 5.75%, [LIBOR12+350], 12/20/241 | | | 677,382 | | | | 677,680 | |
| iStar, Inc., Sr. Sec. Credit Facilities 1st Lien Term Loan, Tranche B,4.919%-4.979%, [LIBOR12+275], 6/28/231 | | | 1,663,191 | | | | 1,667,349 | |
14 INVESCO OPPENHEIMER MASTER LOAN FUND
| | | | | | | | |
| | | Principal Amount | | | Value |
| Commercial Banks (Continued) | | | | | | | | |
| NFP Corp., Sr. Sec. Credit Facilities 1st Lien Term Loan, Tranche B, 5.112%, [LIBOR12+300], 1/8/241 | | $ | 1,961,467 | | | $ | 1,924,994 | |
| Uniti Group, Inc., Sr. Sec. Credit Facilities 1st Lien Term Loan, 7.112%, [LIBOR12+500], 10/24/221 | | | 1,097,969 | | | | 1,064,206 | |
| USI, Inc., Sr. Sec. Credit Facilities 1st Lien Term Loan, Tranche B, 5.33%, [LIBOR4+300], 5/16/241 | | | 2,758,974 | | | | 2,698,056 | |
| | | | | | | | |
| | | | | | | 30,027,900 | |
| | | | | | | | | |
| Consumer Finance—0.4% | | | | | | | | |
| PGX Holdings, Inc., Sr. Sec. Credit Facilities 1st Lien Term Loan, 7.37%, [LIBOR12+525], 9/29/201 | | | 2,234,018 | | | | 2,077,637 | |
| PGX Holdings, Inc., Sr. Sec. Credit Facilities 2nd Lien Term Loan, 11.24%, [LIBOR12+900], 9/29/211,3 | | | 647,089 | | | | 582,380 | |
| | | | | | | | |
| | | | | | | 2,660,017 | |
| | | | | | | | | |
| Insurance—0.2% | | | | | | | | |
| AssuredPartners, Inc., Sr. Sec. Credit Facilities 1st Lien Term Loan, Tranche B, 5.612%, [LIBOR12+325], 10/22/241 | | | 1,361,841 | | | | 1,357,463 | |
| | | | | | | | | |
| Health Care—6.7% | | | | | | | | |
| Health Care Equipment & Supplies—6.7% | | | | | | | | |
| 21st Century Oncology, Inc., Sr. Sec. Credit Facilities 1st Lien Exit Term Loan, Tranche B, 8.455%, [LIBOR4+612.5], 1/16/231 | | | 1,052,790 | | | | 953,438 | |
| Acadia Healthcare Co., Inc., Sr. Sec. Credit Facilities 1st Lien Term Loan, Tranche B4, 4.612%, [LIBOR12+250], 2/16/231 | | | 994,907 | | | | 997,021 | |
| Alliance HealthCare Services, Inc., Sr. Sec. Credit Facilities 1st Lien Term Loan, 6.612%, [LIBOR4+450], 10/24/231 | | | 1,303,101 | | | | 1,224,915 | |
| Amneal Pharmaceuticals LLC, Sr. Sec. Credit Facilities 1st Lien Term Loan, Tranche B, 5.625%, [LIBOR4+350], 5/4/251 | | | 367,609 | | | | 335,444 | |
| Ardent Health Partners LLC, Sr. Sec. Credit Facilities 1st Lien Term Loan, Tranche B, 6.612%, [LIBOR12+450], 6/30/251 | | | 2,665,811 | | | | 2,673,342 | |
| Bausch Health Cos., Inc., Sr. Sec. Credit Facilities 1st Lien Term Loan, Tranche B, 5.201%, [LIBOR4+300], 6/2/251 | | | 1,500,000 | | | | 1,504,507 | |
| Change Healthcare Holdings LLC, Sr. Sec. Credit Facilities 1st Lien Term Loan, Tranche B, 4.612%, [LIBOR12+275], 3/1/241 | | | 3,437,206 | | | | 3,404,983 | |
| Endo International plc, Sr. Sec. Credit Facilities 1st Lien Term Loan, Tranche B, 6.375%, [LIBOR12+425], 4/29/241 | | | 1,736,752 | | | | 1,590,934 | |
| Enterprise Merger Sub, Inc., Sr. Sec. Credit Facilities 1st Lien Term Loan, 5.862%, [LIBOR4+375], 10/10/251 | | | 4,724,991 | | | | 3,677,295 | |
| Gentiva Health Services, Inc., Sr. Sec. Credit Facilities 1st Lien Term Loan, 5.875%, [LIBOR4+375], 7/2/251 | | | 2,162,029 | | | | 2,166,093 | |
| GoodRX, Inc., Sr. Sec. Credit Facilities 1st Lien Term Loan, 4.932%, [LIBOR4+300], 10/10/251 | | | 1,814,230 | | | | 1,803,798 | |
| Jaguar Holding Co. II, Sr. Sec. Credit Facilities 1st Lien Term Loan,4.612%-4.902%, [LIBOR4+250], 8/18/221 | | | 713,898 | | | | 710,925 | |
| Kinetic Concepts, Inc., Sr. Sec. Credit Facilities 1st Lien Term Loan, Tranche B, 5.58%, [LIBOR4+325], 2/2/241 | | | 690,676 | | | | 692,403 | |
| LifeCare Holdings LLC, Sr. Sec. Credit Facilities 1st Lien Exit Term Loan, Tranche B, 5.703%, [LIBOR4+525], 11/30/211,5 | | | 1,652,716 | | | | 123,954 | |
15 INVESCO OPPENHEIMER MASTER LOAN FUND
SCHEDULE OF INVESTMENTSContinued
| | | | | | | | |
| | | Principal Amount | | | Value |
| Health Care Equipment & Supplies (Continued) | | | | | | | | |
| LifeScan Global Corp., Sr. Sec. Credit Facilities 1st Lien Term Loan, 8.66%, [LIBOR4+600], 10/1/241 | | $ | 1,800,781 | | | $ | 1,700,837 | |
| Mallinckrodt International Finance SA, Sr. Sec. Credit Facilities 1st Lien Term Loan, Tranche B, 5.08%, [LIBOR4+275], 9/24/241 | | | 1,341,426 | | | | 1,051,343 | |
| MPH Acquisition Holdings LLC, Sr. Sec. Credit Facilities 1st Lien Term Loan, Tranche B, 5.08%, [LIBOR4+300], 6/7/231 | | | 4,466,120 | | | | 4,164,657 | |
| New Trident Holdco, Inc., Sr. Sec. Credit Facilities 1st Lien Term Loan, 3.00% PIK Rate, Tranche B, 8/1/221,2,3,5 | | | 1,107,680 | | | | 22,154 | |
| One Call Corp., Sr. Sec. Credit Facilities 1st Lien Term Loan, Tranche B, 7.408%, [LIBOR12+525], 11/27/221 | | | 3,015,270 | | | | 2,543,591 | |
| Ortho-Clinical Diagnostics SA, Sr. Sec. Credit Facilities 1st Lien Term Loan, Tranche B, 5.563%, [LIBOR4+325], 6/30/251 | | | 3,399,356 | | | | 3,215,587 | |
| PAREXEL International Corp., Sr. Sec. Credit Facilities 1st Lien Term Loan, Tranche B, 4.862%, [LIBOR4+300], 9/27/241 | | | 810,025 | | | | 765,400 | |
| Select Medical Corp., Sr. Sec. Credit Facilities 1st Lien Term Loan, Tranche B, 4.85%, [LIBOR12+250], 3/6/251 | | | 2,510,890 | | | | 2,504,613 | |
| Surgery Center Holdings, Inc., Sr. Sec. Credit Facilities 1st Lien Term Loan, 5.37%, [LIBOR4+325], 9/2/241 | | | 2,408,661 | | | | 2,301,777 | |
| Team Health Holdings, Inc., Sr. Sec. Credit Facilities 1st Lien Term Loan, Tranche B, 4.862%, [LIBOR12+275], 2/6/241 | | | 2,985,327 | | | | 2,414,383 | |
| VVC Holding Corp., Sr. Sec. Credit Facilities 1st Lien Term Loan, Tranche B, 6.681%, [LIBOR4+450], 2/11/261 | | | 1,760,588 | | | | 1,755,640 | |
| Wink Holdco, Inc., Sr. Sec. Credit Facilities 1st Lien Term Loan, 5.112%, [LIBOR4+300], 12/2/241 | | | 666,595 | | | | 650,767 | |
| | | | | | | | |
| | | | | | | 44,949,801 | |
| | | | | | | | | |
| Industrials—17.1% | | | | | | | | |
| Aerospace & Defense—0.4% | | | | | | | | |
| Genuine Financial Holdings LLC, Sr. Sec. Credit Facilities 1st Lien Term Loan, 5.862%, [LIBOR4+375], 7/11/251 | | | 2,671,501 | | | | 2,609,161 | |
| | | | | | | | | |
| Commercial Services & Supplies—8.3% | | | | | | | | |
| Access CIG LLC, Sr. Sec. Credit Facilities 1st Lien Term Loan, 6.069%, [LIBOR4+375], 2/27/251 | | | 1,073,138 | | | | 1,056,370 | |
| AI Aqua Merger Sub, Inc., Sr. Sec. Credit Facilities 1st Lien Term Loan, Tranche B1, 5.652%, [LIBOR12+325], 12/13/231 | | | 5,519,741 | | | | 5,285,389 | |
| Asurion LLC, Sr. Sec. Credit Facilities 1st Lien Term Loan: | | | | | | | | |
| Tranche B4, 5.112%, [LIBOR12+300], 8/4/221 | | | 4,686,971 | | | | 4,694,916 | |
| Tranche B6, 5.112%, [LIBOR12+300], 11/3/231 | | | 911,672 | | | | 913,217 | |
| Tranche B7, 5.112%, [LIBOR12+300], 11/3/241 | | | 990,000 | | | | 991,648 | |
| ATS Consolidated, Inc., Sr. Sec. Credit Facilities 1st Lien Term Loan, Tranche B, 5.862%, [LIBOR12+375], 2/28/251 | | | 2,840,972 | | | | 2,855,177 | |
| Blackhawk Network Holdings, Inc., Sr. Sec. Credit Facilities 1st Lien Term Loan, 5.112%, [LIBOR4+300], 6/15/251 | | | 5,761,912 | | | | 5,727,715 | |
| Boing US Holdco, Inc., Sr. Sec. Credit Facilities 1st Lien Term Loan, 5.463%, [LIBOR4+325], 10/3/241 | | | 2,712,170 | | | | 2,656,231 | |
| Casmar Australia Pty Ltd., Sr. Sec. Credit Facilities 1st Lien Term Loan, Tranche B, 6.616%, [LIBOR4+450], 12/8/231 | | | 2,660,162 | | | | 2,460,650 | |
16 INVESCO OPPENHEIMER MASTER LOAN FUND
| | | | | | | | |
| | | Principal Amount | | | Value |
| Commercial Services & Supplies (Continued) | | | | | | | | |
| CM Acquisition Co., Sr. Sec. Credit Facilities 2nd Lien Term Loan, 12.262%, [LIBOR4+1,000], 7/26/231 | | $ | 942,069 | | | $ | 951,490 | |
| Garda World Security Corp., Sr. Sec. Credit Facilities 1st Lien Term Loan, Tranche B, 6.02%, [LIBOR4+350], 5/24/241 | | | 997,449 | | | | 999,274 | |
| IG Investments Holdings LLC, Sr. Sec. Credit Facilities 1st Lien Term Loan,6.112%-6.33%, [LIBOR12+400], 5/23/251 | | | 695,032 | | | | 690,546 | |
| Inmar, Inc., Sr. Sec. Credit Facilities 1st Lien Term Loan, 6.33%, [LIBOR4+400], 5/1/241 | | | 3,368,482 | | | | 3,196,555 | |
| IQOR US, Inc., Sr. Sec. Credit Facilities 1st Lien Term Loan, 7.819%, [LIBOR4+550], 4/1/211 | | | 1,265,000 | | | | 1,166,963 | |
| Monitronics International, Inc., Sr. Sec. Credit Facilities 1st Lien Term Loan, Tranche B2, 10.00%, [PRIME4+450], 9/30/221 | | | 1,256,567 | | | | 1,186,281 | |
| North American Lifting Holdings, Inc., Sr. Sec. Credit Facilities 1st Lien Term Loan, 6.83%, [LIBOR4+450], 11/27/201 | | | 1,332,220 | | | | 1,242,715 | |
| Prime Security services Borrower LLC, Sr. Sec. Credit Facilities 1st Lien Term Loan, Tranche B, 5.07%, 5/2/221 | | | 2,000,000 | | | | 2,000,730 | |
| Securus Technologies Holdings LLC, Sr. Sec. Credit Facilities 1st Lien Term Loan, 6.83%, [LIBOR12+450], 11/1/241 | | | 5,390,513 | | | | 4,843,376 | |
| Staples, Inc., Sr. Sec. Credit Facilities 1st Lien Term Loan, Tranche B, 7.197%, [LIBOR12+500], 4/16/261 | | | 4,104,713 | | | | 3,952,612 | |
| Travelport Finance Luxembourg Sarl, Sr. Sec. Credit Facilities 1st Lien Term Loan, 7.541%, [LIBOR4+500], 3/18/261 | | | 6,200,000 | | | | 5,725,700 | |
| TruGreen LP, Sr. Sec. Credit Facilities 1st Lien Term Loan, Tranche B, 5.984%, [LIBOR12+375], 3/19/261 | | | 329,175 | | | | 331,234 | |
| US Ecology, Inc., Sr. Sec. Credit Facilities 1st Lien Term Loan, Tranche B, 4.787%, 8/14/261 | | | 495,000 | | | | 497,631 | |
| Ventia Deco LLC, Sr. Sec. Credit Facilities 1st Lien Term Loan, 5.842%, [LIBOR4+350], 6/25/261,3 | | | 1,883,787 | | | | 1,886,142 | |
| | | | | | | | |
| | | | | | | 55,312,562 | |
| | | | | | | | | |
| Industrial Conglomerates—3.7% | | | | | | | | |
| Energy Acquisition Co., Inc., Sr. Sec. Credit Facilities 1st Lien Term Loan, 6.58%, [LIBOR4+425], 6/22/251,3 | | | 439,628 | | | | 402,260 | |
| Gates Global LLC, Sr. Sec. Credit Facilities 1st Lien Term Loan, Tranche B, 4.862%, [LIBOR4+300], 4/1/241 | | | 1,740,508 | | | | 1,701,042 | |
| GrafTech Finance, Inc., Sr. Sec. Credit Facilities 1st Lien Term Loan, Tranche B, 5.612%, [LIBOR12+350], 2/12/251 | | | 2,597,500 | | | | 2,533,640 | |
| Space Exploration Technologies Corp., Sr. Sec. Credit Facilities 1st Lien Term Loan, 6.362%, [LIBOR12+425], 11/21/251,3 | | | 3,407,875 | | | | 3,416,395 | |
| Titan Acquisition Ltd., Sr. Sec. Credit Facilities 1st Lien Term Loan, 5.112%, [LIBOR12+300], 3/28/251 | | | 1,387,307 | | | | 1,334,132 | |
TransDigm, Inc., Sr. Sec. Credit Facilities 1st Lien Term Loan: Tranche E, 4.83%, [LIBOR12+250], 5/30/251 | | | 2,536,775 | | | | 2,515,453 | |
| Tranche F, 4.83%, [LIBOR12+250], 6/9/231 | | | 926,748 | | | | 921,781 | |
| Tranche G, 4.83%, [LIBOR4+250], 8/22/241 | | | 2,529,705 | | | | 2,509,632 | |
| Vertiv Intermediate Holding II Corp., Sr. Sec. Credit Facilities 1st Lien Term Loan, Tranche B, 6.33%, [LIBOR12+400], 11/30/231 | | | 5,306,853 | | | | 5,006,140 | |
| Welbilt, Inc., Sr. Sec. Credit Facilities 1st Lien Term Loan, Tranche B, 4.782%, [LIBOR4+250], 10/23/251 | | | 2,000,000 | | | | 1,985,830 | |
17 INVESCO OPPENHEIMER MASTER LOAN FUND
SCHEDULE OF INVESTMENTSContinued
| | | | | | | | |
| | | Principal Amount | | | Value |
| Industrial Conglomerates (Continued) | | | | | | | | |
| WP CPP Holdings LLC, Sr. Sec. Credit Facilities 1st Lien Term Loan, 6.01%, [LIBOR4+375], 4/30/251 | | $ | 2,429,656 | | | $ | 2,431,187 | |
| | | | | | | | |
| | | | | | | 24,757,492 | |
| | | | | | | | | |
| Professional Services—0.6% | | | | | | | | |
| AVSC Holding Corp., Sr. Sec. Credit Facilities 1st Lien Term Loan, Tranche B,5.387%-5.58%, [LIBOR4+325], 3/3/251 | | | 4,106,881 | | | | 3,993,942 | |
| | | | | | | | | |
| Road & Rail—2.5% | | | | | | | | |
| American Airlines, Inc., Sr. Sec. Credit Facilities 1st Lien Term Loan, Tranche B, 4.061%, [LIBOR12+175], 6/27/251 | | | 1,183,050 | | | | 1,162,347 | |
| Arctic LNG Carriers Ltd., Sr. Sec. Credit Facilities 1st Lien Term Loan, Tranche B, 6.83%, [LIBOR12+450], 5/18/231 | | | 2,295,984 | | | | 2,260,591 | |
| Daseke Cos., Inc., Sr. Sec. Credit Facilities 1st Lien Term Loan, 7.112%, [LIBOR12+500], 2/27/241,3 | | | 1,784,887 | | | | 1,740,264 | |
| Kenan Advantage Group, Inc. (The), Sr. Sec. Credit Facilities 1st Lien Term Loan: | | | | | | | | |
| Tranche B1, 5.112%, [LIBOR12+300], 7/29/221 | | | 1,402,107 | | | | 1,356,538 | |
| Tranche B2, 5.112%, [LIBOR12+300], 7/29/221 | | | 156,442 | | | | 151,358 | |
| Kestrel Bidco, Inc., Sr. Sec. Credit Facilities 1st Lien Term Loan, 5.266%, 8/7/261 | | | 1,259,000 | | | | 1,263,923 | |
| Western Express, Inc., Sr. Sec. Credit Facilities 2nd Lien Term Loan, 10.374%, [LIBOR4+825], 2/23/221,3 | | | 8,023,792 | | | | 8,546,141 | |
| | | | | | | | |
| | | | | | | 16,481,162 | |
| | | | | | | | | |
| Transportation Infrastructure—1.6% | | | | | | | | |
| American Axle & Manufacturing, Inc., Sr. Sec. Credit Facilities 1st Lien Term Loan, Tranche B,4.40%-4.52%, [LIBOR12+225], 4/6/241 | | | 526,317 | | | | 516,967 | |
| Mavis Tire Express Services Corp., Sr. Sec. Credit Facilities 1st Lien Term Loan, 5.362%, [LIBOR4+325], 3/20/251 | | | 1,296,336 | | | | 1,274,467 | |
| Mavis Tire Express Services Corp., Sr. Sec. Credit Facilities 1st Lien Term Loan, Delayed Draw, 2.00%, 3/20/25 1,4 | | | 123,759 | | | | 121,672 | |
| Navistar, Inc., Sr. Sec. Credit Facilities 1st Lien Term Loan, Tranche B, 5.70%, [LIBOR12+350], 11/6/241 | | | 1,621,790 | | | | 1,619,771 | |
| Panther BF Aggregator 2 LP, Sr. Sec. Credit Facilities 1st Lien Term Loan, Tranche B, 5.612%, [LIBOR12+350], 4/30/261 | | | 2,070,000 | | | | 2,044,125 | |
| Superior Industries International, Inc., Sr. Sec. Credit Facilities 1st Lien Term Loan, Tranche B, 6.112%, [LIBOR12+400], 5/22/241 | | | 3,114,538 | | | | 2,997,742 | |
| Tenneco, Inc., Sr. Sec. Credit Facilities 1st Lien Term Loan, Tranche B, 5.112%, [LIBOR4+275], 10/1/251 | | | 1,000,000 | | | | 934,440 | |
| TI Group Automotive Systems LLC, Sr. Sec. Credit Facilities 1st Lien Term Loan, Tranche B, 4.612%, [LIBOR12+275], 6/30/221 | | | 1,404,450 | | | | 1,396,374 | |
| | | | | | | | |
| | | | | | | 10,905,558 | |
| | | | | | | | | |
| Information Technology—10.1% | | | | | | | | |
| Internet Software & Services—9.4% | | | | | | | | |
| Almonde, Inc., Sr. Sec. Credit Facilities 1st Lien Term Loan, Tranche B, 5.734%, [LIBOR4+350], 6/13/241 | | | 1,881,458 | | | | 1,819,266 | |
18 INVESCO OPPENHEIMER MASTER LOAN FUND
| | | | | | | | |
| | | Principal Amount | | | Value |
| Internet Software & Services (Continued) | | | | | | | | |
| American Teleconferencing Services Ltd., Sr. Sec. Credit Facilities 1st Lien Term Loan, 8.723%, [LIBOR6+650], 12/8/211 | | $ | 1,013,445 | | | $ | 631,376 | |
| Avaya, Inc., Sr. Sec. Credit Facilities 1st Lien Exit Term Loan, Tranche B,6.43%-6.445%, [LIBOR6+425], 12/15/241 | | | 9,722,664 | | | | 9,570,747 | |
| Banff Merger Sub, Inc., Sr. Sec. Credit Facilities 1st Lien Term Loan, Tranche B, 6.58%, [LIBOR4+425], 10/2/251 | | | 3,121,557 | | | | 2,956,380 | |
| Blackboard, Inc., Sr. Sec. Credit Facilities 1st Lien Term Loan, Tranche B4, 7.30%, [LIBOR4+500], 6/30/211 | | | 739,599 | | | | 738,675 | |
| Colorado Buyer, Inc., Sr. Sec. Credit Facilities 1st Lien Term Loan, 5.21%, [LIBOR4+300], 5/1/241 | | | 2,522,827 | | | | 2,371,457 | |
| Infor US, Inc., Sr. Sec. Credit Facilities 1st Lien Term Loan, Tranche B, 5.08%, [LIBOR4+275], 2/1/221 | | | 2,997,376 | | | | 2,999,249 | |
| Internap Corp., Sr. Sec. Credit Facilities 1st Lien Term Loan, 0.75% PIK Rate, 8.57% Cash Rate, [LIBOR12+575], 4/6/221,2 | | | 1,996,960 | | | | 1,452,788 | |
| MA FinanceCo LLC, Sr. Sec. Credit Facilities 1st Lien Term Loan: | | | | | | | | |
| Tranche B, 4.612%, [LIBOR12+275], 6/21/241 | | | 934,238 | | | | 910,882 | |
| Tranche B2, 4.484%, [LIBOR4+250], 11/19/211 | | | 796,919 | | | | 792,935 | |
| McAfee LLC, Sr. Sec. Credit Facilities 1st Lien Term Loan, Tranche B, 6.152%, [LIBOR12+375], 9/30/241 | | | 2,500,000 | | | | 2,505,163 | |
| Mitchell International, Inc., Sr. Sec. Credit Facilities 1st Lien Term Loan, Tranche B, 5.362%, [LIBOR12+325], 11/29/241 | | | 848,716 | | | | 797,369 | |
| Plantronics, Inc., Sr. Sec. Credit Facilities 1st Lien Term Loan, 4.612%, [LIBOR12+250], 7/2/251 | | | 2,301,785 | | | | 2,296,031 | |
| Quest Software US Holdings, Inc., Sr. Sec. Credit Facilities 1st Lien Term Loan, 6.506%, [LIBOR4+425], 5/16/251 | | | 2,076,191 | | | | 2,027,535 | |
| Riverbed Technology, Inc., Sr. Sec. Credit Facilities 1st Lien Term Loan, Tranche B, 5.49%, [LIBOR12+325], 4/24/221 | | | 5,786,459 | | | | 4,866,673 | |
| Seattle SpinCo, Inc., Sr. Sec. Credit Facilities 1st Lien Term Loan, Tranche B, 4.612%, [LIBOR12+275], 6/21/241 | | | 6,315,318 | | | | 6,157,435 | |
| Shutterfly, Inc., Sr. Sec. Credit Facilities 1st Lien Term Loan, Tranche B2, 4.87%, [LIBOR12+275], 8/17/241 | | | 1,058,587 | | | | 1,059,216 | |
| SolarWinds Holdings, Inc., Sr. Sec. Credit Facilities 1st Lien Term Loan, 4.862%, [LIBOR12+300], 2/5/241 | | | 1,037,239 | | | | 1,037,726 | |
| Solera LLC, Sr. Sec. Credit Facilities 1st Lien Term Loan, Tranche B, 4.862%, [LIBOR12+275], 3/3/231 | | | 1,704,562 | | | | 1,698,179 | |
| SS&C Technologies Holdings Europe Sarl, Sr. Sec. Credit Facilities 1st Lien Term Loan, Tranche B4, 4.362%, [LIBOR4+250], 4/16/251 | | | 1,508,673 | | | | 1,512,354 | |
| SS&C Technologies, Inc., Sr. Sec. Credit Facilities 1st Lien Term Loan, Tranche B1, 4.362%, [LIBOR4+250], 4/16/251 | | | 2,232,402 | | | | 2,237,849 | |
| Sungard AS New Holdings III LLC, Sr. Sec. Credit Facilities 1st Lien Term Loan, 2.50% PIK Rate, 6.388% Cash Rate, 11/3/221,2 | | | 232,097 | | | | 191,867 | |
| Tempo Acquisition LLC, Sr. Sec. Credit Facilities 1st Lien Term Loan, Tranche B, 5.112%, [LIBOR12+300], 5/1/241 | | | 3,453,691 | | | | 3,458,733 | |
| TIBCO Software, Inc., Sec. Credit Facilities 1st Lien Term Loan, 6.25%, [LIBOR12+400], 6/30/261 | | | 370,000 | | | | 370,463 | |
| TTM Technologies, Inc., Sr. Sec. Credit Facilities 1st Lien Term Loan, 4.73%, [LIBOR4+250], 9/28/241 | | | 3,033,065 | | | | 3,031,791 | |
19 INVESCO OPPENHEIMER MASTER LOAN FUND
SCHEDULE OF INVESTMENTSContinued
| | | | | | | | |
| | | Principal Amount | | | Value |
| Internet Software & Services (Continued) | | | | | | | | |
| Veritas US, Inc., Sr. Sec. Credit Facilities 1st Lien Term Loan, Tranche B1,6.612%-6.83%, [LIBOR12+450], 1/27/231 | | $ | 3,276,485 | | | $ | 3,121,228 | |
| Xperi Corp., Sr. Sec. Credit Facilities 1st Lien Term Loan, Tranche B, 4.612%, [LIBOR12+250], 12/1/231 | | | 1,662,614 | | | | 1,645,988 | |
| | | | | | | | |
| | | | | | | 62,259,355 | |
| | | | | | | | | |
| IT Services—0.7% | | | | | | | | |
| Pi US Mergerco, Inc., Sr. Sec. Credit Facilities 1st Lien Term Loan: | | | | | | | | |
| Tranche B, 5.362%, [LIBOR12+350], 1/3/251 | | | 1,609,591 | | | | 1,595,845 | |
| Tranche B1, 5.362%, [LIBOR12+350], 1/3/251 | | | 3,267,462 | | | | 3,239,557 | |
| | | | | | | | |
| | | | | | | 4,835,402 | |
| | | | | | | | | |
| Materials—9.4% | | | | | | | | |
| Chemicals—3.4% | | | | | | | | |
| Alpha 3 BV, Sr. Sec. Credit Facilities 1st Lien Term Loan, Tranche B1, 5.33%, [LIBOR4+300], 1/31/241 | | | 2,828,173 | | | | 2,754,386 | |
| Consolidated Energy Finance SA, Sr. Sec. Credit Facilities 1st Lien Term Loan, Tranche B, 4.825%, [LIBOR12+250], 5/7/251,3 | | | 1,994,962 | | | | 1,920,151 | |
| Cyanco Intermediate Corp., Sr. Sec. Credit Facilities 1st Lien Term Loan, 5.612%, [LIBOR4+350], 3/16/251 | | | 1,773,861 | | | | 1,771,271 | |
| Hexicon, Inc., Sec. Credit Facilities 1st Lien Exit Term Loan, Tranche B, 5.82%, [LIBOR4+350], 7/1/261,3 | | | 495,000 | | | | 495,000 | |
| INEOS US Finance LLC, Sr. Sec. Credit Facilities 1st Lien Term Loan, Tranche B, 4.258%, 4/1/241 | | | 2,000,000 | | | | 1,968,190 | |
| Messer Industries USA, Inc., Sr. Sec. Credit Facilities 1st Lien Term Loan, Tranche B, 4.83%, [LIBOR4+250], 3/1/261 | | | 2,000,000 | | | | 1,990,360 | |
| Momentive Performance Materials USA LLC, Sr. Sec. Credit Facilities 1st Lien Term Loan, Tranche B, 5.59%, [LIBOR4+325], 5/15/241 | | | 1,005,000 | | | | 988,669 | |
| New Arclin US Holding Corp., Sr. Sec. Credit Facilities 1st Lien Term Loan, 5.612%, [LIBOR4+350], 2/14/241,3 | | | 1,755,679 | | | | 1,742,512 | |
| OCI Partners LP, Sr. Sec. Credit Facilities 1st Lien Term Loan, Tranche B, 6.33%, [LIBOR4+425], 3/13/251,3 | | | 865,651 | | | | 864,569 | |
| Polar US Borrower LLC, Sr. Sec. Credit Facilities 1st Lien Term Loan,7.063%-7.351%, [LIBOR4+475], 10/15/251,3 | | | 1,376,516 | | | | 1,323,176 | |
| Starfruit US Holdco LLC, Sr. Sec. Credit Facilities 1st Lien Term Loan, Tranche B, 5.463%, [LIBOR12+325], 10/1/251 | | | 3,960,075 | | | | 3,837,135 | |
| Tronox Finance LLC, Sr. Sec. Credit Facilities 1st Lien Term Loan, Tranche B, 4.862%, [LIBOR4+300], 9/23/241 | | | 2,745,326 | | | | 2,729,032 | |
| | | | | | | | |
| | | | | | | 22,384,451 | |
| | | | | | | | | |
| Construction Materials—1.4% | | | | | | | | |
| Pisces Midco, Inc., Sr. Sec. Credit Facilities 1st Lien Term Loan, Tranche B, 5.951%, [LIBOR4+375], 4/12/251 | | | 1,731,979 | | | | 1,686,515 | |
| Quikrete Holdings, Inc., Sr. Sec. Credit Facilities 1st Lien Term Loan, 4.862%, [LIBOR12+275], 11/15/231 | | | 3,850,769 | | | | 3,817,479 | |
| Realogy Group LLC, Sr. Sec. Credit Facilities 1st Lien Term Loan, Tranche B, 4.42%, [LIBOR12+225], 2/8/251 | | | 2,000,000 | | | | 1,936,660 | |
20 INVESCO OPPENHEIMER MASTER LOAN FUND
| | | | | | | | |
| | | Principal Amount | | | Value |
| Construction Materials (Continued) | | | | | | | | |
| VC GB Holdings, Inc., Sr. Sec. Credit Facilities 1st Lien Term Loan, 5.112%, [LIBOR12+325], 2/28/241,3 | | $ | 1,619,218 | | | $ | 1,601,002 | |
| | | | | | | | |
| | | | | | | 9,041,656 | |
| | | | | | | | | |
| Containers & Packaging—2.4% | | | | | | | | |
| Ball Metalpack Finco LLC, Sr. Sec. Credit Facilities 1st Lien Term Loan, Tranche B, 6.624%, [LIBOR12+450], 7/31/251 | | | 900,900 | | | | 877,251 | |
| Berry Global Inc., Sr. Sec. Credit Facilities 1st Lien Term Loan, 4.701%, [LIBOR12+250], 7/1/261 | | | 2,375,000 | | | | 2,377,506 | |
| BWAY Corp., Sr. Sec. Credit Facilities 1st Lien Term Loan, 5.59%, [LIBOR12+325], 4/3/241 | | | 4,354,777 | | | | 4,243,643 | |
| Clearwater Paper Corp., Sr. Sec. Credit Facilities 1st Lien Term Loan, Tranche B, 5.438%, [LIBOR4+325], 7/26/261,3 | | | 575,000 | | | | 577,156 | |
| Flex Acquisition Co., Inc., Sr. Sec. Credit Facilities 1st Lien Term Loan, 5.569%, [LIBOR4+325], 6/29/251 | | | 2,889,814 | | | | 2,762,590 | |
| Plastipak Holdings, Inc., Sr. Sec. Credit Facilities 1st Lien Term Loan, Tranche B, 4.62%, [LIBOR12+250], 10/14/241 | | | 1,520,430 | | | | 1,517,770 | |
| Pro Mach Group, Inc., Sr. Sec. Credit Facilities 1st Lien Term Loan, Tranche B, 4.932%, [LIBOR4+300], 3/7/251 | | | 553,014 | | | | 533,429 | |
| Reynolds Group Holdings, Inc., Sr. Sec. Credit Facilities 1st Lien Term Loan, 4.862%, [LIBOR12+300], 2/5/231 | | | 3,395,339 | | | | 3,397,462 | |
| | | | | | | | |
| | | | | | | 16,286,807 | |
| | | | | | | | | |
| Metals & Mining—2.1% | | | | | | | | |
| Covia Holdings Corp., Sr. Sec. Credit Facilities 1st Lien Term Loan, 6.313%, [LIBOR4+375], 6/1/251 | | | 533,810 | | | | 442,692 | |
| Murray Energy Corp., Sr. Sec. Credit Facilities 1st Lien Term Loan: | | | | | | | | |
| Tranche B2, 9.362%, [LIBOR4+725], 10/17/221 | | | 19,202,312 | | | | 9,518,874 | |
| Tranche B3, 9.862%, [LIBOR12+775], 10/17/221 | | | 5,454,160 | | | | 2,699,809 | |
| Peabody Energy Corp., Sr. Sec. Credit Facilities 1st Lien Term Loan, Tranche B, 4.862%, [LIBOR12+275], 3/31/251 | | | 1,193,306 | | | | 1,179,142 | |
| | | | | | | | |
| | | | | | | 13,840,517 | |
| | | | | | | | | |
| Paper & Forest Products—0.1% | | | | | | | | |
| Thor Industries, Inc., Sr. Sec. Credit Facilities 1st Lien Term Loan, Tranche B, 6.00%, [LIBOR4+375], 2/1/261 | | | 801,391 | | | | 781,023 | |
| | | | | | | | | |
| Telecommunication Services—5.8% | | | | | | | | |
| Diversified Telecommunication Services—5.8% | | | | | | | | |
| CenturyLink, Inc., Sr. Sec. Credit Facilities 1st Lien Term Loan, Tranche B, 4.862%, [LIBOR4+275], 1/31/251 | | | 8,014,907 | | | | 7,913,479 | |
| Cincinnati Bell, Inc., Sr. Sec. Credit Facilities 1st Lien Term Loan, Tranche B, 5.484%, [LIBOR12+325], 10/2/241 | | | 2,000,000 | | | | 1,996,070 | |
| Consolidated Communications, Inc., Sr. Sec. Credit Facilities 1st Lien Term Loan, Tranche B, 5.12%, [LIBOR12+300], 10/5/231 | | | 4,166,779 | | | | 4,001,254 | |
| Digicel International Finance Ltd, Sr. Sec. Credit Facilities 1st Lien Term Loan, Tranche B, 5.34%, [LIBOR4+325], 5/27/241 | | | 2,502,732 | | | | 2,142,339 | |
| Frontier Communications Corp., Sr. Sec. Credit Facilities 1st Lien Term Loan, Tranche B, 5.87%, [LIBOR12+375], 6/15/241 | | | 1,770,345 | | | | 1,753,871 | |
21 INVESCO OPPENHEIMER MASTER LOAN FUND
SCHEDULE OF INVESTMENTSContinued
| | | | | | | | |
| | | Principal Amount | | | Value |
| Diversified Telecommunication Services (Continued) | | | | | | | | |
| Sunguard Equity., Sr. Sec. Credit Debtor in Possession Facilities 1st Lien Term Loan,12.20%-12.22%, [LIBOR12+1,000], 10/7/191,3 | | $ | 695,579 | | | $ | 688,623 | |
| Fusion Connect, Inc., Sr. Sec. Credit Facilities 1st Lien Term Loan, 11.597% PIK Rate, [LIBOR4+750], 5/4/231,2,5 | | | 5,774,720 | | | | 3,638,073 | |
| IPC Corp., Sr. Sec. Credit Facilities 1st Lien Term Loan, Tranche B, 7.09%, [LIBOR4+450], 8/6/211 | | | 3,913,281 | | | | 3,267,590 | |
| IPC Corp., Sr. Sec. Credit Facilities 2nd Lien Term Loan, 12.09% PIK Rate, [LIBOR4+950], 2/4/221,2 | | | 2,189,596 | | | | 704,316 | |
| NeuStar, Inc., Sr. Sec. Credit Facilities 1st Lien Term Loan, Tranche B4, 5.612%, [LIBOR12+350], 8/8/241 | | | 2,346,121 | | | | 2,281,603 | |
| Sprint Communications, Inc., Sr. Sec. Credit Facilities 1st Lien Term Loan: | | | | | | | | |
| Tranche B, 4.625%, [LIBOR12+250], 2/2/241 | | | 7,430,457 | | | | 7,393,305 | |
| Tranche B1, 5.50%, [LIBOR12+300], 2/2/241 | | | 2,000,000 | | | | 1,998,440 | |
| Windstream Services LLC, Sr. Sec. Credit Facilities Term Loan, Tranche B6, 10.25%, [PRIME4+500], 3/29/211,5 | | | 1,051,014 | | | | 1,071,672 | |
| | | | | | | | |
| | | | | | | 38,850,635 | |
| | | | | | | | | |
| Utilities—2.2% | | | | | | | | |
| Electric Utilities—2.2% | | | | | | | | |
| Calpine Construction Finance Co. LP, Sr. Sec. Credit Facilities 1st Lien Term Loan, 4.612%, [LIBOR12+250], 1/15/251 | | | 1,254,085 | | | | 1,252,518 | |
| Calpine Corp., Sr. Sec. Credit Facilities 1st Lien Term Loan: | | | | | | | | |
| Tranche B10, 4.612%, [LIBOR12+250], 8/12/261 | | | 578,596 | | | | 577,873 | |
| Tranche B5, 4.83%, [LIBOR4+250], 1/15/241 | | | 831,380 | | | | 831,713 | |
| EFS Cogen Holdings I LLC, Sr. Sec. Credit Facilities 1st Lien Term Loan, Tranche B,5.49%-5.58%, [LIBOR12+325], 6/28/231 | | | 1,382,951 | | | | 1,380,185 | |
| Frontera Generation Holdings LLC, Sr. Sec. Credit Facilities 1st Lien Term Loan, Tranche B, 6.451%, [LIBOR12+425], 5/2/251 | | | 2,579,994 | | | | 2,463,894 | |
| Kestrel Acquisition LLC., Sr. Sec. Credit Facilities 1st Lien Term Loan, Tranche B, 6.66%, [LIBOR12+425], 6/2/251 | | | 1,014,228 | | | | 974,926 | |
| Lightstone Holdco LLC, Sr. Sec. Credit Facilities 1st Lien Term Loan: | | | | | | | | |
| Tranche B, 5.862%, [LIBOR12+375], 1/30/241 | | | 2,481,142 | | | | 2,396,784 | |
| Tranche C, 5.862%, [LIBOR12+375], 1/30/241 | | | 139,996 | | | | 135,236 | |
| MRP Generation Holdings LLC, Sr. Sec. Credit Facilities 1st Lien Term Loan, Tranche B, 9.33%, [LIBOR4+700], 10/18/221,3 | | | 1,089,200 | | | | 1,081,031 | |
| Sandy Creek Energy Associates LP, Sr. Sec. Credit Facilities 1st Lien Term Loan, Tranche B, 6.33%, [LIBOR4+400], 11/9/201 | | | 2,024,487 | | | | 1,772,691 | |
| Talent Energy Supply LLC, Sr. Sec. Credit Facilities 1st Lien Term Loan, Tranche B, 6.088%, [LIBOR12+375], 7/8/261,3 | | | 1,705,000 | | | | 1,683,688 | |
| | | | | | | | |
| | | | | | | 14,550,539 | |
| | | | | | | | |
| Total Corporate Loans (Cost $648,792,884) | | | | | | | 607,263,351 | |
| | | | | | | | | |
| Corporate Bonds and Notes—2.8% | |
| EricksonAir-Crane, Inc., 6.00% Sub. Nts., 11/2/203,5 | | | 644,070 | | | | — | |
| iHeartCommunications, Inc., 8.375% Sr. Unsec. Nts., 5/1/27 | | | 217,372 | | | | 235,577 | |
| Peabody Energy Corp., 6.375% Sr. Sec. Nts., 3/31/256 | | | 6,170,000 | | | | 6,443,794 | |
| Tesla, Inc., 5.30% Sr. Unsec. Nts., 8/15/256 | | | 12,450,000 | | | | 11,158,312 | |
22 INVESCO OPPENHEIMER MASTER LOAN FUND
| | | | | | | | |
| | | Principal Amount | | | Value |
| Corporate Bonds and Notes (Continued) | |
| United States Steel Corp., 6.25% Sr. Unsec. Nts., 3/15/26 | | $ | 1,135,000 | | | $ | 1,008,028 | |
| | | | | | | | |
| Total Corporate Bonds and Notes (Cost $19,208,461) | | | | | | | 18,845,711 | |
| | |
| | | Shares | | | |
| Common Stocks—4.3% | |
| Arch Coal, Inc., Cl. A | | | 179,075 | | | | 13,709,982 | |
| Ascent Resources - Marcellus LLC, Cl. A7 | | | 606,015 | | | | 1,643,816 | |
| Avaya Holdings Corp.7 | | | 280,586 | | | | 3,961,874 | |
| Caesars Entertainment Corp.7 | | | 100 | | | | 1,151 | |
| Catalina Marketing Corp. (Pacifico, Inc.)3,7 | | | 19,788 | | | | 103,887 | |
| Clear Channel Outdoor Holdings, Inc., Cl. A7 | | | 879,218 | | | | 2,285,967 | |
| Crossmark Holdings, Inc.3,7 | | | 12,561 | | | | 942,075 | |
| Everyware Global, Inc.3,7 | | | 106,918 | | | | 160,377 | |
| Gymboree Corp. (The)3,8 | | | 76,198 | | | | 57,149 | |
| Gymboree Holding Corp.3,8 | | | 217,169 | | | | 217 | |
| Harvey Gulf International Marine LLC3,7 | | | 12,360 | | | | 154,500 | |
| iHeartMedia, Inc., Cl. A7 | | | 373,898 | | | | 5,159,792 | |
| Larchmont Resources LLC3,7 | | | 136 | | | | 34,075 | |
| Millennium Corporate Claim Litigation Trust3,7 | | | 5,431 | | | | — | |
| Millennium Lender Claim Litigation Trust3,7 | | | 10,862 | | | | — | |
| New Millennium Holdco, Inc.7 | | | 111,266 | | | | 9,736 | |
| Quicksilver Resources, Inc.3,7 | | | 11,634,576 | | | | — | |
| Sabine Oil & Gas Holdings, Inc. | | | 1,419 | | | | 74,497 | |
| Sunguard Equity7 | | | 3,420 | | | | 101,459 | |
| Templar Energy, Cl. A3,7 | | | 154,052 | | | | — | |
| | | | | | | | |
| Total Common Stocks (Cost $51,369,016) | | | | | | | 28,400,554 | |
| | |
| | | Units | | | |
| Rights, Warrants and Certificates—0.0% | |
| Ascent Resources - Marcellus LLC Wts., Exp. 4/3/233,7 | | | 156,901 | | | | 4,707 | |
| Media General, Inc. Rts., Exp. 12/31/493,7,9 | | | 781,336 | | | | 45,317 | |
| Sabine Oil Tranche 1 Wts., Strike Price $4.49, Exp. 8/11/263,7 | | | 4,424 | | | | 46,452 | |
| Sabine Oil Tranche 2 Wts., Strike Price $2.72, Exp. 8/11/263,7 | | | 929 | | | | 11,613 | |
| | | | | | | | |
| Total Rights, Warrants and Certificates (Cost $607,580) | | | | | | | 108,089 | |
| | |
| | | Shares | | | |
| Investment Company—8.2% | |
| Invesco Government & Agency Portfolio, Institutional Class, 2.02%10(Cost $55,070,437) | | | 55,070,437 | | | | 55,071,042 | |
| Total Investments, at Value (Cost $775,048,378) | | | 106.3% | | | | 709,688,747 | |
| Net Other Assets (Liabilities) | | | (6.3) | | | | (42,174,635 | ) |
| Net Assets | | | 100.0% | | | $ | 667,514,112 | |
| | | | | | | | |
Footnotes to Statement of Investments
* Variable rate senior loan interests often require prepayments from excess cash flow or permit the borrower to repay at its election. The degree to which borrowers repay, whether as a contractual requirement or at their election, cannot be predicted with accuracy. As a result, the actual remaining maturity may be substantially less than the stated maturities shown. However, it is anticipated that the variable rate senior loan interests will have an expected average life of three to five years.
23 INVESCO OPPENHEIMER MASTER LOAN FUND
SCHEDULE OF INVESTMENTSContinued
Footnotes to Statement of Investments (Continued)
1.Variable rate senior loan interests are, at present, not readily marketable, not registered under the Securities Act of 1933, as amended (the “1933 Act”), and may be subject to contractual and legal restrictions on sale. Variable rate senior loan interests in the Fund’s portfolio generally have variable rates which adjust to a base, such as the London Interbank Offered Rate (“LIBOR”), on set dates, typically every 30 days but not greater than one year; and/ or have interest rates that float at a margin above a widely recognized base lending rate such as the Prime Rate of a designated U.S. bank.
2.Interest or dividend ispaid-in-kind, when applicable.
3.The value of this security was determined using significant unobservable inputs. See Note 3 of the accompanying Notes.
4.All or a portion of this holding is subject to unfunded loan commitments. The state interest rate reflects the weighted average of the reference rate and spread for the funded portion, if any, and the commitment fees on the portion of the loan that is unfunded. See Note 9.
5.This security is not accruing income because its issuer has missed or is expected to miss interest and/or principal payments. The rate shown is the contractual interest rate.
6.Security purchased or received in a transaction exempt from registration under the Securities Act of 1933, as amended (the “1933 Act”). The security may be resold pursuant to an exemption from registration under the 1933 Act, typically to qualified institutional buyers. The aggregate value of these securities at August 31, 2019 was $17,602,106, which represented 2.64% of the Fund’s Net Assets.
7.Non-income producing security.
8.Is or was an affiliate, as defined in the Investment Company Act of 1940, as amended, at or during the reporting period, by virtue of the Fund owning at least 5% of the voting securities of the issuer or as a result of the Fund and the issuer having the same investment adviser. Transactions during the reporting period in which the issuer was an affiliate are as follows:
| | | | | | | | | | | | | | | | |
| | | Shares
September 30,
2018 | | | Gross
Additions | | | Gross
Reductions | | | Shares August 31, 2019 | |
| |
| Common Stock | | | | | | | | | | | | | | | | |
| Gymboree Corp. (The)a | | | 76,198 | | | | — | | | | — | | | | 76,198 | |
| Gymboree Holding Corp.a | | | 217,169 | | | | — | | | | — | | | | 217,169 | |
| | | | |
| | | Value | | | Income | | | Realized
Gain (Loss) | | | Change in
Unrealized
Gain (Loss) | |
| |
| Common Stock | | | | | | | | | | | | | | | | |
| Gymboree Corp. (The)a | | $ | —b | | | $ | 1,796 | | | $ | — | | | $ | (881,077) | |
| Gymboree Holding Corp.a | | | —b | | | | 5,120 | | | | — | | | | (2,673,785) | |
| | | | |
| Total | | $ | — | | | $ | 6,916 | | | $ | — | | | $ | (3,554,862) | |
| | | | |
a. No longer an affiliate as of August 31, 2019.
b. The security is no longer an affiliate, therefore, the value has been excluded from this table.
9.Security received as the result of issuer reorganization.
10.The money market fund and the Fund are affiliated by having the same investment adviser. The rate shown is the7-day SEC standardized yield as of August 31, 2019.
Glossary:
Definitions
| | |
| LIBOR4 | | London Interbank Offered Rate-Quarterly |
| LIBOR6 | | London Interbank OfferedRate-Bi-Monthly |
| LIBOR12 | | London Interbank Offered Rate-Monthly |
24 INVESCO OPPENHEIMER MASTER LOAN FUND
Definitions (Continued)
| | |
| PRIME4 | | United States Prime Rate-Quarterly |
| PRIME12 | | United States Prime Rate-Monthly |
See accompanying Notes to Financial Statements.
25 INVESCO OPPENHEIMER MASTER LOAN FUND
STATEMENT OF ASSETS AND LIABILITIESAugust 31, 2019
| | | | |
| |
| Assets | | | | |
| Investments, at value—see accompanying schedule of investments: | | | | |
| Unaffiliated companies (cost $719,977,941) | | $ | 654,617,705 | |
| Affiliated companies (cost $55,070,437) | | | 55,071,042 | |
| | | | |
| | | 709,688,747 | |
| |
| Cash | | | 4,051,151 | |
| |
| Receivables and other assets: | | | | |
| Investments sold | | | 11,549,031 | |
| Interest and dividends | | | 2,224,327 | |
| Other | | | 287,632 | |
| | | | |
| Total assets | | | 727,800,888 | |
| |
| Liabilities | | | | |
| Payables and other liabilities: | | | | |
| Investments purchased | | | 59,866,253 | |
| Trustees’ compensation | | | 81,145 | |
| Shareholder communications | | | 14,769 | |
| Advisory fees | | | 10,862 | |
| Transfer and shareholder servicing agent fees | | | 9,192 | |
| Shares of beneficial interest redeemed | | | 5,833 | |
| Administration fees | | | 108 | |
| Other | | | 298,614 | |
| | | | |
Total liabilities | | | 60,286,776 | |
| |
| Net Assets—applicable to 38,787,636 shares of beneficial interest outstanding | | $ | 667,514,112 | |
| | | | |
| | | | | |
| |
| |
| Net Asset Value, Redemption Price and Offering Price Per Share | | | $17.21 | |
See accompanying Notes to Financial Statements.
26 INVESCO OPPENHEIMER MASTER LOAN FUND
STATEMENT
OF OPERATIONS
| | | | | | | | |
| | | Eleven Months Ended
August 31, 2019 | | Year Ended
September 30, 2018 | |
| Investment Income | | | | | | | | |
| Interest | | $ | 52,991,409 | | | $ | 81,303,792 | |
| |
| Dividends: | | | | | | | | |
| Unaffiliated companies | | | 423,594 | | | | 516,197 | |
| Affiliated companies | | | 785,489 | | | | 1,237,124 | |
| |
| Other income affiliated companies | | | 6,916 | | | | 8,031 | |
| |
| Other income | | | 168,483 | | | | 590,741 | |
| | | | |
| Total investment income | | | 54,375,891 | | | | 83,655,885 | |
| | | | | | | | |
| Expenses | | | | | | | | |
| Advisory fees | | | 2,530,758 | | | | 4,268,701 | |
| |
| Administration fees | | | 25,050 | | | | — | |
| |
| Transfer and shareholder servicing agent fees | | | 42,597 | | | | 71,145 | |
| |
| Shareholder communications | | | 19,888 | | | | 15,547 | |
| |
| Borrowing fees | | | 1,191,318 | | | | — | |
| |
| Custodian fees and expenses | | | 220,700 | | | | 324,825 | |
| |
| Legal, auditing and other professional fees | | | 206,775 | | | | 451,862 | |
| |
| Directors’ compensation | | | 27,974 | | | | 44,570 | |
| |
| Other | | | 14,800 | | | | 20,991 | |
| | | | |
| Total expenses | | | 4,279,860 | | | | 5,197,641 | |
| Less waivers and reimbursements of expenses | | | (34,456 | ) | | | (90,560) | |
| | | | |
Net expenses | | | 4,245,404 | | | | 5,107,081 | |
| Net Investment Income | | | 50,130,487 | | | | 78,548,804 | |
| | | | | | | | |
| Realized and Unrealized Gain (Loss) | | | | | | | | |
| Net realized gain (loss) on investment transactions in unaffiliated companies (includes net gains (losses) from securities sold to affiliates of $(2,866,555) and $(329,053), respectively) | | | (11,843,872 | ) | | | 9,365,637 | |
| |
| Net change in unrealized appreciation/(depreciation) on Investment transactions in: | | | | | | | | |
Unaffiliated companies | | | (51,045,315 | ) | | | (2,679,837) | |
Affiliated companies | | | (3,554,257 | ) | | | (4,135,301) | |
| | | | |
Net change in unrealized appreciation/(depreciation) | | | (54,599,572 | ) | | | (6,815,138) | |
| | | | | | | | |
| |
| Net Increase (Decrease) in Net Assets Resulting from Operations | | $ | (16,312,957 | ) | | $ | 81,099,303 | |
| | | | |
See accompanying Notes to Financial Statements.
27 INVESCO OPPENHEIMER MASTER LOAN FUND
STATEMENT OF CHANGES IN NET ASSETS
| | | | | | | | | | | | |
| | | Eleven Months
Ended
August 31, 2019 | | Year Ended
September 30, 2018 | | Year Ended
September 30, 2017 |
| Operations | | | | | | | | | | | | |
| Net investment income | | $ | 50,130,487 | | | $ | 78,548,804 | | | $ | 85,603,736 | |
| Net realized gain (loss) | | | (11,843,872 | ) | | | 9,365,637 | | | | (1,729,811 | ) |
| Net change in unrealized appreciation/(depreciation) | | | (54,599,572 | ) | | | (6,815,138 | ) | | | 6,367,731 | |
| | | | |
| Net increase (decrease) in net assets resulting from operations | | | (16,312,957 | ) | | | 81,099,303 | | | | 90,241,656 | |
| Beneficial Interest Transactions | | | | | | | | | | | | |
| Net decrease in net assets resulting from beneficial interest transactions: | | | | | | | | | | | | |
| Proceeds from contributions | | | 125,652,122 | | | | 34,938,290 | | | | 214,217,992 | |
| Payments for withdrawals | | | (794,738,817 | ) | | | (321,874,525 | ) | | | (152,387,750 | ) |
| | | | |
| Total beneficial interest transactions | | | (669,086,695 | ) | | | (286,936,235 | ) | | | 61,830,242 | |
| Net Assets | | | | | | | | | | | | |
| Total increase (decrease) | | | (685,399,652 | ) | | | (205,836,932 | ) | | | 152,071,898 | |
| Beginning of period | | | 1,352,913,764 | | | | 1,558,750,696 | | | | 1,406,678,798 | |
| | | | |
| End of period | | $ | 667,514,112 | | | $ | 1,352,913,764 | | | $ | 1,558,750,696 | |
| | | | |
See accompanying Notes to Financial Statements.
28 INVESCO OPPENHEIMER MASTER LOAN FUND
FINANCIAL HIGHLIGHTS
| | | | | | | | | | | | | | | | | | | | | | | | |
| Class R6 | | Eleven Months
Ended
August 31,
2019 | | | Year Ended
September
30, 2018 | | | Year Ended
September
30, 2017 | | | Year Ended
September
30, 2016 | | | Year Ended
September
30, 2015 | | | Year Ended
September
30, 2014 | |
| |
| Per Share Operating Data | | | | | | | | | | | | | | | | | | | | | | | | |
| Net asset value, beginning of period | | | $17.56 | | | | $16.58 | | | | $15.61 | | | | $14.64 | | | | $14.51 | | | | $13.84 | |
| |
| Income (loss) from investment operations: | | | | | | | | | | | | | | | | | | | | | | | | |
| Net investment income1 | | | 0.94 | | | | 0.94 | | | | 0.92 | | | | 0.84 | | | | 0.74 | | | | 0.74 | |
| Net realized and unrealized gain (loss) | | | (1.29) | | | | 0.04 | | | | 0.05 | | | | 0.13 | | | | (0.61) | | | | (0.07) | |
| | | | |
| Total from investment operations | | | (0.35) | | | | 0.98 | | | | 0.97 | | | | 0.97 | | | | 0.13 | | | | 0.67 | |
| |
| Net asset value, end of period | | | $17.21 | | | | $17.56 | | | | $16.58 | | | | $15.61 | | | | $14.64 | | | | $14.51 | |
| | | | |
| | | | | | | | | | | | | | | | | | | | | | | | |
| |
| Total Return, at Net Asset Value2 | | | (1.99)% | | | | 5.91% | | | | 6.21% | | | | 6.63% | | | | 0.90% | | | | 4.84% | |
| | | | | | | | | | | | | | | | | | | | | | | | |
| |
| Ratios/Supplemental Data | | | | | | | | | | | | | | | | | | | | | | | | |
| Net assets, end of period (in thousands) | | | $667,514 | | | | $1,352,914 | | | | $1,558,751 | | | | $1,406,679 | | | | $1,271,836 | | | | $1,501,073 | |
| |
| Average net assets (in thousands) | | | $925,389 | | | | $1,422,464 | | | | $1,521,122 | | | | $1,205,754 | | | | $1,321,015 | | | | $1,398,916 | |
| |
| Ratios to average net assets:3 | | | | | | | | | | | | | | | | | | | | | | | | |
| Net investment income | | | 5.90% | | | | 5.52% | | | | 5.63% | | | | 5.70% | | | | 5.06% | | | | 5.15% | |
| Expenses excluding specific expenses listed below | | | 0.36% | | | | 0.37% | | | | 0.36% | | | | 0.36% | | | | 0.35% | | | | 0.34% | |
| Interest and fees from borrowings | | | 0.14% | | | | 0.00% | | | | 0.00% | | | | 0.00% | | | | 0.00% | | | | 0.00% | |
| | | | |
| Total expenses4 | | | 0.50% | | | | 0.37% | | | | 0.36% | | | | 0.36% | | | | 0.35% | | | | 0.34% | |
| Expenses after payments, waivers and/or reimbursements and reduction to custodian expenses | | | 0.50%5 | | | | 0.36% | | | | 0.35% | | | | 0.36%5 | | | | 0.35%5 | | | | 0.33% | |
| |
| Portfolio turnover rate6 | | | 42% | | | | 66% | | | | 80% | | | | 74% | | | | 57% | | | | 73% | |
29 INVESCO OPPENHEIMER MASTER LOAN FUND
FINANCIAL HIGHLIGHTSContinued
1. Per share amounts calculated based on the average shares outstanding during the period.
2. Assumes an initial investment on the business day before the first day of the fiscal period, with all dividends and distributions reinvested in additional shares on the reinvestment date, and redemption at the net asset value calculated on the last business day of the fiscal period. Sales charges are not reflected in the total returns. Total returns are not annualized for periods less than one full year. Returns do not reflect the deduction of taxes that a shareholder would pay on fund distributions or the redemption of fund shares.
3. Annualized for periods less than one full year.
4. Total expenses including indirect expenses from affiliated fund fees and expenses were as follows:
| | | | | | |
| | Eleven Months Ended August 31, 2019 | | | 0.50 | % |
| | Year Ended September 30, 2018 | | | 0.38 | % |
| | Year Ended September 30, 2017 | | | 0.37 | % |
| | Year Ended September 30, 2016 | | | 0.36 | % |
| | Year Ended September 30, 2015 | | | 0.35 | % |
| | Year Ended September 30, 2014 | | | 0.35 | % |
5. Waiver was less than 0.005%.
6. Portfolio turnover is calculated at the fund level and is not annualized for periods less than one year, if applicable.
See accompanying Notes to Financial Statements.
30 INVESCO OPPENHEIMER MASTER LOAN FUND
NOTES TO FINANCIAL STATEMENTSAugust 31, 2019
Note 1 - Significant Accounting Policies
Invesco Oppenheimer Master Loan Fund (the “Fund”) is a series portfolio of AIM Counselor Series Trust (Invesco Counselor Series Trust) (the “Trust”). The Trust is a Delaware statutory trust registered under the Investment Company Act of 1940, as amended (the “1940 Act”), as anopen-end series management investment company authorized to issue an unlimited number of shares of beneficial interest. Information presented in these financial statements pertains only to the Fund. Matters affecting the Fund or each class will be voted on exclusively by the shareholders of such Fund or each class.
Prior to the close of business on May 24, 2019, the Fund operated as Oppenheimer Master Loan Fund, LLC (the “Acquired Fund” or “Predecessor Fund”). The Acquired Fund was reorganized after the close of business on May 24, 2019 (the “Reorganization Date”) through the transfer of all of its assets and liabilities to the Fund (the “Reorganization”).
Upon closing of the Reorganization, holders of the Acquired Fund’s Class I shares received the Class R6 shares of the Fund. Information for the Acquired Fund’s shares prior to the Reorganization is included with Class R6 throughout this report.
Effective August 31, 2019, the Fund changed its fiscal year end from September 30 to August 31.
The Fund’s investment objective is to seek income.
The Fund’s shares have not been registered under the Securities Act of 1933, as amended (the “1933 Act”), which means that the Fund’s shares may not be sold publicly. However, the Trust may sell the Fund’s shares through private placements pursuant to available exemptions from registration under the 1933 Act. Shares of the Fund are sold only to other investment companies.
For federal income tax purposes, the Fund qualifies as a partnership, and each investor in the Fund is treated as the owner of its proportionate share of the net assets, income, expenses, and realized and unrealized gains and losses of the Fund. Accordingly, as a “passthrough” entity, the Fund pays no dividends or capital gain distributions.
The Fund currently offers Class R6. Class R6 shares are sold at net asset value.
The following is a summary of the significant accounting policies followed by the Fund in the preparation of its financial statements.
A. Security Valuations - Securities, including restricted securities, are valued according to the following policy.
Debt obligations (including convertible securities) and unlisted equities are fair valued using an evaluated quote provided by an independent pricing service. Evaluated quotes provided by the pricing service may be determined without exclusive reliance on quoted prices, and may reflect appropriate factors such asinstitution-size trading in similar groups of securities, developments related to specific securities, dividend rate (for unlisted equities), yield (for debt obligations), quality, type of issue, coupon rate (for debt obligations), maturity (for debt obligations), individual trading characteristics and other market data. Pricing services generally value debt obligations assuming orderly transactions of institutional round lot size, but a fund may hold or transact in the same securities in smaller, odd lot sizes. Odd lots often trade at lower prices than institutional round lots. Debt obligations are
31 INVESCO OPPENHEIMER MASTER LOAN FUND
NOTES TO FINANCIAL STATEMENTSContinued
subject to interest rate and credit risks. In addition, all debt obligations involve some risk of default with respect to interest and/or principal payments.
A security listed or traded on an exchange (except convertible securities) is valued at its last sales price or official closing price as of the close of the customary trading session on the exchange where the security is principally traded, or lacking any sales or official closing price on a particular day, the security may be valued at the closing bid price on that day. Securities traded in theover-the-counter market are valued based on prices furnished by independent pricing services or market makers. When such securities are valued by an independent pricing service they may be considered fair valued. Futures contracts are valued at the final settlement price set by an exchange on which they are principally traded. Listed options are valued at the mean between the last bid and asked prices from the exchange on which they are principally traded. Options not listed on an exchange are valued by an independent source at the mean between the last bid and asked prices. For purposes of determining net asset value (“NAV”) per share, futures and option contracts generally are valued 15 minutes after the close of the customary trading session of the New York Stock Exchange (“NYSE”).
Investments inopen-end andclosed-end registered investment companies that do not trade on an exchange are valued at theend-of-day net asset value per share. Investments inopen-end andclosed-end registered investment companies that trade on an exchange are valued at the last sales price or official closing price as of the close of the customary trading session on the exchange where the security is principally traded.
Swap agreements are fair valued using an evaluated quote, if available, provided by an independent pricing service. Evaluated quotes provided by the pricing service are valued based on a model which may includeend-of-day net present values, spreads, ratings, industry, company performance and returns of referenced assets. Centrally cleared swap agreements are valued at the daily settlement price determined by the relevant exchange or clearinghouse.
Foreign securities’ (including foreign exchange contracts) prices are converted into U.S. dollar amounts using the applicable exchange rates as of the close of the NYSE. If market quotations are available and reliable for foreign exchange-traded equity securities, the securities will be valued at the market quotations. Because trading hours for certain foreign securities end before the close of the NYSE, closing market quotations may become unreliable. If between the time trading ends on a particular security and the close of the customary trading session on the NYSE, events occur that the investment adviser determines are significant and make the closing price unreliable, the Fund may fair value the security. If the event is likely to have affected the closing price of the security, the security will be valued at fair value in good faith using procedures approved by the Board of Trustees. Adjustments to closing prices to reflect fair value may also be based on a screening process of an independent pricing service to indicate the degree of certainty, based on historical data, that the closing price in the principal market where a foreign security trades is not the current value as of the close of the NYSE. Foreign securities’ prices meeting the approved degree of certainty that the price is not reflective of current value will be priced at the indication of fair value from the independent pricing service. Multiple
32 INVESCO OPPENHEIMER MASTER LOAN FUND
factors may be considered by the independent pricing service in determining adjustments to reflect fair value and may include information relating to sector indices, American Depositary Receipts and domestic and foreign index futures. Foreign securities may have additional risks including exchange rate changes, potential for sharply devalued currencies and high inflation, political and economic upheaval, the relative lack of issuer information, relatively low market liquidity and the potential lack of strict financial and accounting controls and standards.
Securities for which market prices are not provided by any of the above methods may be valued based upon quotes furnished by independent sources. The last bid price may be used to value equity securities. The mean between the last bid and asked prices is used to value debt obligations, including corporate loans.
Securities for which market quotations are not readily available or became unreliable are valued at fair value as determined in good faith by or under the supervision of the Trust’s officers following procedures approved by the Board of Trustees. Issuer specific events, market trends, bid/asked quotes of brokers and information providers and other market data may be reviewed in the course of making a good faith determination of a security’s fair value.
The Fund may invest in securities that are subject to interest rate risk, meaning the risk that the prices will generally fall as interest rates rise and, conversely, the prices will generally rise as interest rates fall. Specific securities differ in their sensitivity to changes in interest rates depending on their individual characteristics. Changes in interest rates may result in increased market volatility, which may affect the value and/or liquidity of certain Fund investments.
Valuations change in response to many factors including the historical and prospective earnings of the issuer, the value of the issuer’s assets, general economic conditions, interest rates, investor perceptions and market liquidity. Because of the inherent uncertainties of valuation, the values reflected in the financial statements may materially differ from the value received upon actual sale of those investments.
| B. | Securities Transactions and Investment Income -Securities transactions are accounted for on a trade date basis. Realized gains or losses on sales are computed on the basis of specific identification of the securities sold. Interest income (net of withholding tax, if any) is recorded on the accrual basis from settlement date. Bond premiums and discounts are amortized and/or accreted over the lives of the respective securities.Pay-in-kind interest income andnon-cash dividend income received in the form of securitiesin-lieu of cash are recorded at the fair value of the securities received. Paydown gains and losses on mortgage and asset-backed securities are recorded as adjustments to interest income. Dividend income (net of withholding tax, if any) is recorded on theex-dividend date. |
The Fund may periodically participate in litigation related to Fund investments. As such, the Fund may receive proceeds from litigation settlements. Any proceeds received are included in the Statement of Operations as realized gain (loss) for investments no longer held and as unrealized gain (loss) for investments still held.
Brokerage commissions and mark ups are considered transaction costs and are recorded as an increase to the cost basis of securities purchased and/or a reduction of proceeds on
33 INVESCO OPPENHEIMER MASTER LOAN FUND
NOTES TO FINANCIAL STATEMENTSContinued
a sale of securities. Such transaction costs are included in the determination of net realized and unrealized gain (loss) from investment transactions reported in the Statement of Operations and the Statement of Changes in Net Assets and the net realized and unrealized gains (losses) on securities per share in the Financial Highlights. Transaction costs are included in the calculation of the Fund’s net asset value and, accordingly, they reduce the Fund’s total returns. These transaction costs are not considered operating expenses and are not reflected in net investment income reported in the Statement of Operations and the Statement of Changes in Net Assets, or the net investment income per share and the ratios of expenses and net investment income reported in the Financial Highlights, nor are they limited by any expense limitation arrangements between the Fund and the investment adviser.
| C. | Country Determination- For the purposes of making investment selection decisions and presentation in the Schedule of Investments, the investment adviser may determine the country in which an issuer is located and/or credit risk exposure based on various factors. These factors include the laws of the country under which the issuer is organized, where the issuer maintains a principal office, the country in which the issuer derives 50% or more of its total revenues and the country that has the primary market for the issuer’s securities, as well as other criteria. Among the other criteria that may be evaluated for making this determination are the country in which the issuer maintains 50% or more of its assets, the type of security, financial guarantees and enhancements, the nature of the collateral and the sponsor organization. Country of issuer and/or credit risk exposure has been determined to be the United States of America, unless otherwise noted. |
| D. | Federal Income Taxes -The Fund, as an entity, will not be subject to U.S. federal income tax. The Fund will be treated for U.S. federal income tax purposes as a partnership, and not as an association taxable as a corporation. Therefore, a tax provision is not required. Each shareholder is required for U.S. federal income tax purposes to take into account, in its taxable year with which (or within which a taxable year of the Fund ends), its distributive share of all items of Fund income, gains, losses, and deductions for such taxable year of the Fund. A shareholder must take such items into account even if the Fund does not distribute cash or other property to such shareholder during its taxable year. |
Although the Fund is treated as a partnership for Federal tax purposes, it is intended that the Fund’s assets, income and distributions will be managed in such a way that investment in the Fund would not cause an investor that is a regulated investment company under Subchapter M of the Code (“RIC”) to fail that qualification.
The Fund has analyzed its tax positions for the fiscal year ended August 30, 2019, including open tax years, and does not believe there are any uncertain tax positions requiring recognition in the Fund’s financial statements.
| E. | Accounting Estimates -The financial statements are prepared on a basis in conformity with accounting principles generally accepted in the United States of America (“GAAP”), which requires management to make estimates and assumptions that affect the reported amounts of assets and liabilities at the date of the financial statements and the reported amounts of revenues and expenses during the reporting period including estimates and assumptions related to taxation. Actual results could differ from those estimates by a |
34 INVESCO OPPENHEIMER MASTER LOAN FUND
significant amount. In addition, the Fund monitors for material events or transactions that may occur or become known after theperiod-end date and before the date the financial statements are released to print.
| F. | Indemnifications -Under the Trust’s organizational documents, each Trustee, officer, employee or other agent of the Trust is indemnified against certain liabilities that may arise out of the performance of their duties to the Fund. Additionally, in the normal course of business, the Fund enters into contracts, including the Fund’s servicing agreements, that contain a variety of indemnification clauses. The Fund’s maximum exposure under these arrangements is unknown as this would involve future claims that may be made against the Fund that have not yet occurred. The risk of material loss as a result of such indemnification claims is considered remote. |
| G. | Securities on a When-Issued or Delayed Delivery Basis -The Fund may purchase securities on a “when-issued” basis, and may purchase or sell securities on a “delayed delivery” basis, with payment and delivery scheduled for a future date. No income accrues to the Fund on the securities in connection with such transactions prior to the date the Fund actually takes delivery of the securities. These transactions are subject to market fluctuations and are subject to the risk that the value at delivery may be more or less than the trade date purchase price. Although the Fund will generally purchase these securities with the intention on acquiring such securities, they may sell such securities prior to the settlement date. |
| H. | Industry Focus -To the extent that the Fund invests a greater amount of its assets in securities of issuers in the banking and financial services industries, the Fund’s performance will depend to a greater extent on the overall condition of those industries. The value of these securities can be sensitive to changes in government regulation, interest rates and economic downturns in the U.S. and abroad. |
| I. | Bank Loan Risk -Although the resale, or secondary market for floating rate loans has grown substantially over the past decade, both in overall size and number of market participants, there is no organized exchange or board of trade on which floating rate loans are traded. Instead, the secondary market for floating rate loans is a private, unregulated interdealer or interbank resale market. Such a market may therefore be subject to irregular trading activity, wide bid/ask spreads, and extended trade settlement periods, which may impair the Fund’s ability to sell bank loans within its desired time frame or at an acceptable price and its ability to accurately value existing and prospective investments. Extended trade settlement periods may result in cash not being immediately available to the Fund. As a result, the Fund may have to sell other investments or engage in borrowing transactions to raise cash to meet its obligations. Similar to other asset classes, bank loan funds may be exposed to counterparty credit risk, or the risk than an entity with which the Fund has unsettled or open transactions may fail to or be unable to perform on its commitments. The Fund seeks to manage counterparty credit risk by entering into transactions only with counterparties that it believes have the financial resources to honor their obligations and by monitoring the financial stability of those counterparties. |
| J. | Other Risks- The Fund may invest all or substantially all of its assets in senior secured floating rate loans and senior secured debt securities that are determined to be rated |
35 INVESCO OPPENHEIMER MASTER LOAN FUND
NOTES TO FINANCIAL STATEMENTSContinued
below investment grade. These securities are generally considered to have speculative characteristics and are subject to greater risk of loss of principal and interest than higher rated securities. The value of lower quality debt securities and floating rate loans can be more volatile due to increased sensitivity to adverse issuer, political, regulatory, market or economic developments.
The Fund invests in corporate loans from U.S. ornon-U.S. companies (the “Borrowers”). The investment of the Fund in a corporate loan may take the form of participation interests or assignments. If the Fund purchases a participation interest from a syndicate of lenders (“Lenders”) or one of the participants in the syndicate (“Participant”), one or more of which administers the loan on behalf of all the Lenders (the “Agent Bank”), the Fund would be required to rely on the Lender that sold the participation interest not only for the enforcement of the Fund’s rights against the Borrower but also for the receipt and processing of payments due to the Fund under the corporate loans. As such, the Fund is subject to the credit risk of the Borrower and the Participant. Lenders and Participants interposed between the Fund and a Borrower, together with Agent Banks, are referred to as “Intermediate Participants”.
| K. | Leverage Risk- The Fund may utilize leverage to seek to enhance the yield of the Fund by borrowing. There are risks associated with borrowing in an effort to increase the yield and distributions on the shares, including that the costs of the financial leverage may exceed the income from investments made with such leverage, the higher volatility of the net asset value of the shares, and that fluctuations in the interest rates on the borrowing may affect the yield and distributions to the shareholders. There can be no assurance that the Fund’s leverage strategy will be successful. |
Note 2 - Advisory Fees and Other Fees Paid to Affiliates
The Trust has entered into a master investment advisory agreement with Invesco Advisers, Inc. (the “Adviser” or “Invesco”). Under the terms of the investment advisory agreement, the Fund accrues daily and pays monthly an advisory fee to the Adviser based on the annual rate of 0.30% of the Fund’s average daily net assets.
From the beginning of the fiscal period until the date of the Reorganization, the Acquired Fund paid $2,003,705in advisory fees to OFI Global Asset Management, Inc. based on the annual rates above of the Acquired Fund’s average daily net assets.
Under the terms of a mastersub-advisory agreement between the Adviser and each of Invesco Asset Management Deutschland GmbH, Invesco Asset Management Limited, Invesco Asset Management (Japan) Limited, Invesco Hong Kong Limited, Invesco Senior Secured Management, Inc. and Invesco Canada Ltd. and separatesub-advisory agreements with Invesco Capital Management LLC, and Invesco Asset Management (India) Private Limited (collectively, the “AffiliatedSub-Advisers”) the Adviser, not the Fund, will pay 40% of the fees paid to the Adviser to any such AffiliatedSub-Adviser(s) that provide(s) discretionary investment management services to the Fund based on the percentage of assets allocated to suchSub-Adviser(s). Invesco has also entered into aSub-Advisory Agreement with OppenheimerFunds, Inc. to provide discretionary management services to the Funds.
36 INVESCO OPPENHEIMER MASTER LOAN FUND
Effective on the Reorganization Date, the Adviser has contractually agreed, through at least May 31, 2021, to waive advisory fees and/or reimburse expenses of all shares to the extent necessary to limit the total annual fund operating expenses after fee waiver and/or expense reimbursement (excluding certain items discussed below) to 0.38% of the Fund’s average daily net assets (the “expense limits”). In determining the Adviser’s obligation to waive advisory fees and/or reimburse expenses, the following expenses are not taken into account, and could cause total annual fund operating expenses after fee waivers and/or expense reimbursement to exceed the numbers reflected above: (1) interest; (2) taxes; (3) dividend expenses on short sales; (4) extraordinary ornon-routine items, including litigation expenses; and (5) expenses that the Fund has incurred but did not actually pay because of an expense offset arrangement. Unless Invesco continues the fee waiver agreement, it will terminate May 31, 2021. During its term, the fee waiver agreement cannot be terminated or amended to increase the expense limits or reduce the advisory fee waiver without approval of the Board of Trustees.
Further, the Adviser has contractually agreed, through at least June 30, 2021, to waive the advisory fee payable by the Fund in an amount equal to 100% of the net advisory fees the Adviser receives from the affiliated money market funds on investments by the Fund of uninvested cash in such affiliated money market funds.
For periodended August 31, 2019, the Adviser waived advisory fees of $34,456.
The Trust has entered into a master administrative services agreement with Invesco pursuant to which the Fund has agreed to pay Invesco for certain administrative costs incurred in providing accounting services to the Fund. For the period ended August 31, 2019, expenses incurred under the agreement are shown in the Statement of Operations as Administration fees. Additionally, Invesco has entered into service agreements whereby Deutsche Bank Trust Company Americas (the Custodian) serves as custodian to the Fund. Prior to the Reorganization, the Acquired Fund paid administrative fees to OFI Global Asset Management, Inc.
The Trust has entered into a transfer agency and service agreement with Invesco Investment Services, Inc. (“IIS”) pursuant to which the Fund has agreed to pay IIS a fee for providing transfer agency and shareholder services to the Fund and reimburse IIS for certain expenses incurred by IIS in the course of providing such services. IIS may make payments to intermediaries that provide omnibus account services,sub-accounting services and/or networking services. All fees payable by IIS to intermediaries that provide omnibus account services orsub-accounting services are charged back to the Fund, subject to certain limitations approved by the Trust’s Board of Trustees. Prior to the Reorganization, the Acquired Fund paid transfer agent fees to OFI Global Asset Management, Inc. and Shareholder Services, Inc. For the periodended August 31, 2019, expenses incurred under these agreements are shown in the Statement of Operations as Transfer and shareholder servicing agent fees.
Certain officers and trustees of the Trust are officers and directors of the Adviser, IIS and/or IDI.
37 INVESCO OPPENHEIMER MASTER LOAN FUND
NOTES TO FINANCIAL STATEMENTSContinued
Note 3 - Additional Valuation Information
GAAP defines fair value as the price that would be received to sell an asset or paid to transfer a liability in an orderly transaction between market participants at the measurement date, under current market conditions. GAAP establishes a hierarchy that prioritizes the inputs to valuation methods, giving the highest priority to readily available unadjusted quoted prices in an active market for identical assets (Level 1) and the lowest priority to significant unobservable inputs (Level 3), generally when market prices are not readily available or are unreliable. Based on the valuation inputs, the securities or other investments are tiered into one of three levels. Changes in valuation methods may result in transfers in or out of an investment’s assigned level:
Level 1 — Prices are determined using quoted prices in an active market for identical assets.
Level 2 — Prices are determined using other significant observable inputs. Observable inputs are inputs that other market participants may use in pricing a security. These may include quoted prices for similar securities, interest rates, prepayment speeds, credit risk, yield curves, loss severities, default rates, discount rates, volatilities and others.
Level 3 — Prices are determined using significant unobservable inputs. In situations where quoted prices or observable inputs are unavailable (for example, when there is little or no market activity for an investment at the end of the period), unobservable inputs may be used. Unobservable inputs reflect the Fund’s own assumptions about the factors market participants would use in determining fair value of the securities or instruments and would be based on the best available information.
The following is a summary of the tiered valuation input levels, as of August 31, 2019. The level assigned to the securities valuations may not be an indication of the risk or liquidity associated with investing in those securities. Because of the inherent uncertainties of valuation, the values reflected in the financial statements may materially differ from the value received upon actual sale of those investments.
| | | | | | | | | | | | | | | | |
| | | | | | | | | Level 3— | | | | |
| | | Level 1— | | | Level 2— | | | Significant | | | | |
| | | Unadjusted | | | Other Significant | | | Unobservable | | | | |
| | | Quoted Prices | | | Observable Inputs | | | Inputs | | | Value | |
| Assets Table | | | | | | | | | | | | | | | | |
| Investments, at Value: | | | | | | | | | | | | | | | | |
| Corporate Loans | | $ | — | | | $ | 562,824,008 | | | $ | 44,439,343 | | | $ | 607,263,351 | |
| Corporate Bonds and Notes | | | — | | | | 18,845,711 | | | | 0 | | | | 18,845,711 | |
| Common Stocks | | | 25,118,766 | | | | 1,829,508 | | | | 1,452,280 | | | | 28,400,554 | |
| Rights, Warrants and Certificates | | | — | | | | — | | | | 108,089 | | | | 108,089 | |
| Investment Company | | | 55,071,042 | | | | — | | | | — | | | | 55,071,042 | |
| | | | |
| Total Assets | | $ | 80,189,808 | | | $ | 583,499,227 | | | $ | 45,999,712 | | | $ | 709,688,747 | |
| | | | |
38 INVESCO OPPENHEIMER MASTER LOAN FUND
The following is a reconciliation of assets in which significant unobservable inputs (level 3) were used in determining fair value:
| | | | | | | | | | | | | | | | | | | | |
| | | | | | | | | | | | Change in | | | Accretion/ | |
| | | | | | Value as of | | | | | | unrealized | | | (amortization) | |
| | | | | | September 30, | | | Realized gain | | | appreciation/ | | | of premium/ | |
| | | | | | 2018 | | | (loss) | | | depreciation | | | discounta | |
| Assets Table | | | | | | | | | | | | | | | | | | | | |
| Investments, at Value: | | | | | | | | | | | | | | | | | | | | |
| Corporate Loans | | | | | | $ | 25,148,106 | | | $ | (42,278 | ) | | $ | (1,035,744 | ) | | $ | 45,180 | |
| Corporate Bonds and Notes | | | | | | | 1 | | | | — | | | | (1 | ) | | | — | |
| Common Stocks | | | | | | | 567,394 | | | | (1,208,213 | ) | | | (3,706,556 | ) | | | — | |
| Rights, Warrants and Certificates | | | | | | | 84,652 | | | | — | | | | 23,437 | | | | — | |
| | | | | | | | |
| Total Assets | | | | | | $ | 25,800,153 | | | $ | (1,250,491 | ) | | $ | (4,718,864 | ) | | $ | 45,180 | |
| | | | | | | | |
| | | | | |
| a.Included in net investment income. | | | | | | | | | | | | | | | | | | | | |
| | | | | |
| | | | | | | | | | | | | | | Value as of | |
| | | | | | | | | Transfers into | | | Transfers out of | | | August 31, | |
| | | Purchases | | | Sales | | | Level 3 | | | Level 3 | | | 2019 | |
| Assets Table | | | | | | | | | | | | | | | | | | | | |
| Investments, at Value: | | | | | | | | | | | | | | | | | | | | |
| Corporate Loans | | $ | 19,934,726 | | | $ | (14,237,579 | ) | | $ | 14,626,932 | | | $ | — | | | $ | 44,439,343 | |
| Corporate Bonds and Notes | | | — | | | | — | | | | — | | | | — | | | | 0 | |
| Common Stocks | | | 1,468,952 | | | | (65,028 | ) | | | 4,466,774 | | | | (71,043 | ) | | | 1,452,280 | |
| Rights, Warrants and Certificates | | | — | | | | — | | | | — | | | | — | | | | 108,089 | |
| | | | |
| Total Assets | | $ | 21,403,678 | | | $ | (14,302,607 | ) | | $ | 19,093,706 | | | $ | (71,043 | ) | | $ | 45,999,712 | |
| | | | |
The total change in unrealized appreciation/depreciation included in the Statement of Operations attributable to Level 3 investments still held at period end:
| | | | |
| | | Change in | |
| | | unrealized | |
| | | appreciation/ | |
| | | depreciation | |
| Assets Table | | | | |
| Investments, at Value: | | | | |
| Corporate Loans | | $ | (1,035,744) | |
| Corporate Bonds and Notes | | | (1) | |
| Common Stocks | | | (4,829,474) | |
| Rights, Warrants and Certificates | | | 23,437 | |
| | | | |
| Total Assets | | $ | (5,841,782) | |
| | | | |
39 INVESCO OPPENHEIMER MASTER LOAN FUND
NOTES TO FINANCIAL STATEMENTSContinued
The following table summarizes the valuation techniques and significant unobservable inputs used in determining fair value measurements for those investments classified as Level 3 at period end:
| | | | | | | | | | | | | | | | | | | | |
| | | Value as of | | | | | | | | Range of | | | | |
| | | August 31, | | Valuation | | | Unobservable | | | Unobservable | | | Unobservable | |
| | | 2019 | | Technique | | | Input | | | Inputs | | | Input Used | |
| Assets Table | | | | | | | | | | | | | | | | | | | | |
| Investments, at Value: | | | | | | | | | | | | | | | | | | | | |
| Corporate Loans | | $ | 35,893,202 | | | | Broker Quote | | | | N/A | | | | N/A | | | | N/A (a) | |
| Corporate Loans | | | 8,546,141 | | |
| Discounted
Cash Flow
Model |
| |
| Illiquidity
Discount |
| | | N/A | | | | 3.69% (b) | |
| | | | | | | | | | | Implied rating | | | | N/A | | | | BB+ | |
| | | | | | | | | |
| Yield to
Maturity |
| | | N/A | | | | 3.81% | |
| Common Stocks | | | 1,452,280 | | | | Broker Quote | | | | N/A | | | | N/A | | | | N/A (a) | |
| Rights, Warrants and Certificates | | | 45,317 | | |
| Estimated
Recovery
Proceeds |
| |
| Auction
Proceeds |
| | | N/A | | |
| $0.058/share
(c) |
|
| Rights, Warrants and Certificates | | | 62,772 | | | | Pricing Service | | | | N/A | | | | N/A | | | | N/A (a) | |
| | | | | | | | | | | | | | | | | | | | |
| Total | | $ | 45,999,712 | | | | | | | | | | | | | | | | | |
| | | | | | | | | | | | | | | | | | | | |
(a) Securities classified as Level 3 whose unadjusted values were provided by a pricing service or broker-dealer for which such inputs are unobservable. The Adviser periodically reviews pricing vendor and broker methodologies and inputs to confirm they are determined using unobservable inputs and have been appropriately classified. Such securities’ fair valuations could change significantly based on changes in unobservable inputs used by the pricing service or broker.
(b) The Fund fair values certain corporate loans using a discounted cash flow model which incorporates the Company’s EBITDA and leverage to determine an implied rating. The yield to maturity on other issues with similar leverage and rating is used as a basis for the discount rate, with an additional illiquidity discount applied. The illiquidity discount was determined based on the implied discount rate at origination. The Adviser periodically reviews the financial statements and monitors such investments for additional market information or the occurrence of a significant event which would warrant are-evaluation of the security’s fair valuation. Such security’s fair valuation could increase (decrease) significantly based on a decrease (increase) in the illiquidity discount. Such security’s fair valuation could also increase (decrease) based on an increase (decrease) in the implied rating or a decrease (increase) in the yield to maturity on other issues.
(c) The Fund fair values certain rights received following a merger at the estimated amount of future recovery proceeds from the sale of assets. The Adviser monitors such investments for additional market information or the occurrence of a significant event which would warrant are-evaluation of the security’s fair valuation. A significant increase (decrease) in the auction proceeds will result in a significant increase (decrease) to the fair value of the investment.
Note 4 - Security Transactions with Affiliated Funds
The Fund is permitted to purchase or sell securities from or to certain other Invesco Funds under specified conditions outlined in procedures adopted by the Board of Trustees of the Trust. The procedures have been designed to ensure that any purchase or sale of securities by the Fund from or to another fund or portfolio that is or could be considered an affiliate by virtue of having a common investment adviser (or affiliated investment advisers), common
40 INVESCO OPPENHEIMER MASTER LOAN FUND
Trustees and/or common officers complies with Rule17a-7 of the 1940 Act. Further, as defined under the procedures, each transaction is effected at the current market price. Pursuant to these procedures for the period October 1, 2018 to May 24, 2019,the Predecessor Fund engaged in transactions with affiliates as listed: securities sales of $92,605,333, which resulted in net realized lossesof $2,866,555. For the period May 25, 2019 to August 31,
2019, the Fund did not engage in transactions with affiliates.
Note 5 - Director and Officer Fees and Benefits
Certain Directors have executed a Deferred Compensation Agreement pursuant to which they have the option to elect to defer receipt of all or a portion of the annual compensation they are entitled to receive from the Fund. For purposes of determining the amount owed to the Directors under the plan, deferred amounts are treated as though equal dollar amounts had been invested in shares of the Fund or in other Invesco and/or Invesco Oppenheimer funds selected by the Directors. The Fund purchases shares of the funds selected for deferral by the Directors in amounts equal to his or her deemed investment, resulting in a Fund asset equal to the deferred compensation liability. Such assets are included as a component of “Other” within the asset section of the Statement of Assets and Liabilities. Deferral of Directors’ fees under the plan will not affect the net assets of the Fund and will not materially affect the Fund’s assets, liabilities or net investment income per share. Amounts will be deferred until distributed in accordance with the compensation deferral plan.
Note 6 - Cash Balances
The Fund may borrow for leveraging in an amount up to 5% of the Fund’s total assets (excluding the amount borrowed) at the time the borrowing is made. In doing so, the Fund is permitted to temporarily carry a negative or overdrawn balance in its account with The Deutsche Bank Trust Company Americas, the custodian bank. Such balances, if any at period end, are shown in the Statement of Assets and Liabilities under the payable caption Amount due custodian. To compensate the custodian bank for such overdrafts, the overdrawn Fund may either (1) leave funds as a compensating balance in the account so the custodian bank can be compensated by earning the additional interest; or (2) compensate by paying the custodian bank at a rate agreed upon by the custodian bank and Invesco, not to exceed the contractually agreed upon rate. The Fund may not purchase additional securities when any borrowings from banks exceed 5% of the Fund’s total assets.
Note 7 - Investment Transactions
The aggregate amount of investment securities (other than short-term securities, U.S. Treasury obligations and money market funds, if any) purchased and sold by the Fund during theperiodended August 31, 2019 was $371,296,231 and $1,008,629,162, respectively.
41 INVESCO OPPENHEIMER MASTER LOAN FUND
NOTES TO FINANCIAL STATEMENTSContinued
Note 8 - Share Information
Transactions in shares of beneficial interest were as follows:
| | | | | | | | | | | | | | | | | | | | | | | | |
| | | Eleven Months Ended | | | | | | Year Ended | | | | | | Year Ended |
| | | August 31, 20191 | | | September 30, 2018 | | | September 30, 2017 | |
| | | Shares | | | Amount | | | Shares | | | Amount | | | Shares | | | Amount |
| Contributions | | | 7,261,978 | | | $ | 125,652,122 | | | | 2,054,263 | | | $ | 34,938,290 | | | | 13,281,509 | | | $ | 214,217,992 | |
| Withdrawals | | | (45,522,618) | | | | (794,738,817) | | | | (19,004,662) | | | | (321,874,525) | | | | (9,401,916) | | | | (152,387,750) | |
| | | | |
| Net increase (decrease) | | | (38,260,640) | | | $ | (669,086,695) | | | | (16,950,399) | | | $ | (286,936,235) | | | | 3,879,593 | | | $ | 61,830,242 | |
| | | | |
1.In addition, 93% of the outstanding shares of the Fund are owned by the Adviser or an affiliate of the Adviser.
Note 9 - Unfunded Loan Commitments
As ofAugust 31, 2019, the Fund had unfunded loan commitments, which could be extended at the option of the borrower, pursuant to the following loan agreements with the following borrowers:
| | | | | | | | | | | | |
| Borrower | | Type | | | Principal Amount | | | Value | |
| Mavis Tire Express Services Corp. | | | Delay Draw Term Loan | | | | $123,759 | | | | $ 121,672 | |
| Deluxe Entertainment Services Group, Inc. | | | Delay Draw Term Loan | | | | 33,777 | | | | 31,243 | |
| | | | | | | | | | | | |
| | | | | | | | | | | $ 152,915 | |
| | | | | | | | | | | | |
Note 10 - Borrowings
Borrowings.The Fund can borrow money from banks in amounts up to one third of its total assets (including the amount borrowed) less all liabilities and indebtedness other than borrowings (meaning that the value of those assets must be at least 300% of the amount borrowed). The Fund can use those borrowings for investment-related purposes such as purchasing senior loans and other portfolio securities. The Fund also may borrow to meet redemption obligations or for temporary and emergency purposes. When the Fund invests borrowed money in senior loans or other portfolio securities, it is using a speculative investment technique known as leverage and changes in the value of the Fund’s investments will have a larger effect on its share price than if it did not borrow because of the effect of leverage.
The Fund will pay interest and may pay other fees in connection with loans. If the Fund does borrow, it will be subject to greater expenses than funds that do not borrow. The interest on borrowed money and the other fees incurred in conjunction with loans are an expense that might reduce the Fund’s yield and return. Expenses incurred by the Fund with respect to interest on borrowings and related fees are disclosed separately or as other expenses on the Statement of Operations.
At period end, the Fund had no borrowings outstanding.
Details of the borrowings for the reporting period are as follows:
42 INVESCO OPPENHEIMER MASTER LOAN FUND
REPORT OF INDEPENDENT REGISTERED PUBLIC ACCOUNTING FIRM
Tothe Board of Trustees of AIM Counselor Series Trust (Invesco Counselor Series Trust) and Shareholders of Invesco Oppenheimer Master Loan Fund
Opinion on the Financial Statements
We have audited the accompanying statement of assets and liabilities, including the schedule of investments, of Invesco Oppenheimer Master Loan Fund (one of the funds constituting AIM Counselor Series Trust (Invesco Counselor Series Trust), referred to hereafter as the “Fund”) as of August 31, 2019, the related statement of operationsand the statement of changes in net assets for the period from October 1, 2018 to August 31, 2019, including the related notes, and the financial highlights for the period ended August 31, 2019 (collectively referred to as the “financial statements”). In our opinion, the financial statements present fairly, in all material respects, the financial position of the Fund as of August 31, 2019, the results of its operations and changes in its net assets for the period from October 1, 2018 to August 31, 2019 and the financial highlights for the period ended August 31, 2019 in conformity with accounting principles generally accepted in the United States of America.
The financial statements of Invesco Oppenheimer Master Loan Fund (formerly known as Oppenheimer Master Loan Fund) as of and for the period ended September 30, 2018 and the financial highlights for each of the periods ended on or prior to September 30, 2018 (not presented herein, other than the statement of operations, the statement of changes in net assets and the financial highlights) were audited by other auditors whose report dated November 21, 2018 expressed an unqualified opinion on those financial statements and financial highlights.
Basis for Opinion
These financial statements are the responsibility of the Fund’s management. Our responsibility is to express an opinion on the Fund’s financial statements based on our audit. We are a public accounting firm registered with the Public Company Accounting Oversight Board (United States) (PCAOB) and are required to be independent with respect to the Fund in accordance with the U.S. federal securities laws and the applicable rules and regulations of the Securities and Exchange Commission and the PCAOB.
We conducted our audit of these financial statements in accordance with the standards of the PCAOB. Those standards require that we plan and perform the audit to obtain reasonable assurance about whether the financial statements are free of material misstatement, whether due to error or fraud.
Our audit included performing procedures to assess the risks of material misstatement of the financial statements, whether due to error or fraud, and performing procedures that respond to those risks. Such procedures included examining, on a test basis, evidence regarding the amounts and disclosures in the financial statements. Our audit also included evaluating the accounting principles used and significant estimates made by management, as well as evaluating the overall presentation of the financial statements. Our procedures included confirmation of securities owned as of August 31, 2019 by correspondence with the custodian, transfer agent and agent banks; when replies were not received from agent banks, we performed other auditing procedures. We believe that our audit provides a reasonable basis for our opinion.
/s/PricewaterhouseCoopers LLP
Houston, TX
October 29, 2019
43 INVESCO OPPENHEIMER MASTER LOAN FUND
REPORT OF INDEPENDENT REGISTERED PUBLIC ACCOUNTING FIRM
We have served as the auditor of one or more investment companies in the Invesco group of investment companies since at least 1995. We have not been able to determine the specific year we began serving as auditor.
44 INVESCO OPPENHEIMER MASTER LOAN FUND
INDEPENDENT REGISTERED PUBLIC ACCOUNTING FIRM
The Audit Committee of the Board of Trustees appointed, and the Board of Trustees ratified and approved, PricewaterhouseCoopers LLP (“PwC”) as the independent registered public accounting firm of the Fund for the fiscal periods ending after May 24, 2019. Prior to the close of business on May 24, 2019, the Predecessor Fund was a separate series of an unaffiliated investment company and its financial statements were audited by a different independent registered public accounting firm (the “Prior Auditor”).
Effective after the close of business on May 24, 2019, the Prior Auditor resigned as the independent registered public accounting firm of the Fund. The Prior Auditor’s report on the financial statements of the Predecessor Fund for the past two fiscal years did not contain an adverse or disclaimer of opinion, and was not qualified or modified as to uncertainty, audit scope or accounting principles. During the Predecessor Fund’s two most recent fiscal years and through the close of business on May 24, 2019, there were no (1) disagreements with the Prior Auditor on any matter of accounting principles or practices, financial statement disclosure, or auditing scope or procedure, which disagreements, if not resolved to the Prior Auditor’s satisfaction, would have caused it to make reference to that matter in connection with its report; or (2) “reportable events,” as that term is defined in Item 304(a)(1)(v) of RegulationS-K under the Securities Exchange Act of 1934.
45 INVESCO OPPENHEIMER MASTER LOAN FUND
APPROVAL OF INVESTMENT ADVISORY ANDSUB-ADVISORY
Unaudited
At meetings held on December 14, 2018, the Board of Trustees (the Board or the Trustees) of AIM Counselor Series Trust (Invesco Counselor Series Trust) (the Trust) as a whole, and the independent Trustees, who comprise over 75% of the Board, voting separately, approved (i) an amendment to the Trust’s Master Investment Advisory Agreement with Invesco Advisers, Inc. (Invesco Advisers and the investment advisory agreement) to add Invesco Oppenheimer Master Loan Fund (the Fund), (ii) an amendment to the Master IntergroupSub-Advisory Contract for Mutual Funds with Invesco Asset Management Deutschland GmbH, Invesco Asset Management Limited, Invesco Asset Management (Japan) Limited, Invesco Hong Kong Limited, Invesco Senior Secured Management, Inc. and Invesco Canada Ltd. to add the Fund, (iii) an amendment to the separatesub-advisory contract with Invesco Capital Management LLC to add the Fund, (iv) an amendment to the separatesub-advisory contract with Invesco Asset Management (India) Private Limited to add the Fund, and (v) an initialsub-advisory contract with OppenheimerFunds, Inc. (collectively, the AffiliatedSub-Advisers and thesub-advisory contracts). Additionally, on March 26, 2019, the Boardre-approved an initialsub-advisory contract with OppenheimerFunds, Inc. following its change of control as a result of the acquisition of OppenheimerFunds, Inc. and its subsidiaries, including the Oppenheimer mutual funds (each, an Oppenheimer Fund), by Invesco Ltd. (the OFI Transaction). After evaluating the factors discussed below, among others, the Board approved the Fund’s investment advisory agreement and thesub-advisory contracts and determined that the compensation payable by the Fund to Invesco Advisers and by Invesco Advisers to the AffiliatedSub-Advisers is fair and reasonable.
The Board’s Evaluation Process
The Board noted that it had previously approved establishing the Fund at the Board meeting held on October 23, 2018 and that the Fund was formed to acquire the assets and liabilities of an Oppenheimer Fund (the Acquired Fund) with the same investment objective and substantially similar principal investment strategies and risks. At the time of approval, the Fund had no assets and no performance history and the portfolio managers were not employed by Invesco Advisers or any of the AffiliatedSub-Advisers except OppenheimerFunds, Inc., which was not affiliated with Invesco at that time.
In approving the investment advisory agreement andsub-advisory contracts, the Board followed a process similar to the process that it follows in annually reviewing and approving investment advisory agreements andsub-advisory contracts for the series portfolios of funds advised by Invesco Advisers and considered the information provided in the most recent annual review process for those funds as well as the information provided with respect to the Fund. As part of the approval process, the Board reviewed and considered information provided in response to detailed requests for information submitted to management by the independent Trustees with assistance from legal counsel to the independent Trustees. The Board reviewed comparative investment performance and fee data prepared by Invesco Advisers and an independent mutual fund data provider. The Board was assisted in its review by the Senior Officer, an officer of the Invesco Funds who reports directly to the independent Trustees, and by independent legal counsel.
46 INVESCO OPPENHEIMER MASTER LOAN FUND
The discussion below serves as a summary of the material factors and related conclusions that formed the basis for the Board’s approval of the Fund’s investment advisory agreement andsub-advisory contracts. The Trustees’ review and conclusions are based on the comprehensive consideration of all information presented to them and are not the result of any single determinative factor. Moreover, one Trustee may have weighed a particular piece of information or factor differently than another Trustee. This information is current as of December 14, 2018 and March 26, 2019 for thesub-advisory contract with OppenheimerFunds, Inc.
Factors and Conclusions and Summary of Independent Written Fee Evaluation
A. Nature, Extent and Quality of Services Provided by Invesco Advisers and the AffiliatedSub-Advisers
The Board reviewed the nature, extent and quality of the advisory services to be provided to the Fund by Invesco Advisers under the Fund’s investment advisory agreement, and the credentials and experience of the officers and employees of Invesco Advisers who will provide these services. The Board’s review included consideration of the investment process oversight and structure, credit analysis and investment risk management to be employed in providing advisory services to the Fund. The Board also considerednon-advisory services that Invesco Advisers and its affiliates provide to the Invesco Funds and will provide to the Fund, such as various back office support functions, third party oversight, internal audit, valuation, portfolio trading and legal and compliance. The Board also received and reviewed information about Invesco Advisers’ role as administrator of the Invesco Funds’ liquidity risk management program. The Board also reviewed and considered the benefits to shareholders of investing in a fund that is part of the Invesco family of funds under the umbrella of Invesco Ltd., Invesco Advisers’ parent company, and noted Invesco Ltd.’s depth and experience in conducting an investment management business, as well as its commitment of financial and other resources to such business. The Board reviewed and considered information about the resources that Invesco Advisers intends to continue to commit to managing the Invesco family of funds, including the Fund, following the OFI Transaction. The Board concluded that the nature, extent and quality of the services to be provided to the Fund by Invesco Advisers are appropriate and satisfactory.
The Board reviewed the services that may be provided by the AffiliatedSub-Advisers under thesub-advisory contracts and the credentials and experience of the officers and employees of the AffiliatedSub-Advisers who provide these services. The Board noted the AffiliatedSub-Advisers’ expertise with respect to certain asset classes and that the AffiliatedSub-Advisers have offices and personnel that are located in financial centers around the world. As a result, the Board noted that the AffiliatedSub-Advisers can provide research and investment analysis on the markets and economies of various countries in which the Fund may invest, make recommendations regarding securities and assist with security trades. The Board concluded that thesub-advisory contracts may benefit the Fund and its shareholders by permitting Invesco Advisers to use the resources and talents of the AffiliatedSub-Advisers
47 INVESCO OPPENHEIMER MASTER LOAN FUND
APPROVAL OF INVESTMENT ADVISORY ANDSUB-ADVISORY
Unaudited / Continued
in managing the Fund. The Board concluded that the nature, extent and quality of the services that may be provided by the AffiliatedSub-Advisers are appropriate and satisfactory.
B. Fund Investment Performance
The Board noted that the Fund would continue the historical performance information of the Acquired Fund following the consummation of the OFI Transaction. The Board considered the performance of the Acquired Fund and the fact that, at the closing of the OFI Transaction, management anticipates that the Fund will be managed pursuant to substantially similar investment strategies and by substantially the same portfolio management team as managed the Acquired Fund. The Board did not view Fund performance as a relevant factor in considering whether to approve thesub-advisory contracts for the Fund, as no Affiliated Sub-Adviser currently manages assets of the Fund.
The Board compared the Fund’s investment performance over multiple time periods ending December 31, 2017 to the performance of funds in the Morningstar performance universe and against the Fund’s benchmark index. The Trustees also reviewed more recent Fund performance and this review did not change their conclusions.
C. Advisory andSub-Advisory Fees and Fund Expenses
The Board compared the Fund’s contractual management fee rate to the contractual management fee rates of funds in the Fund’s Morningstar expense group. The Board also considered comparative information regarding the Fund’s total expense ratio and its various components.
The Board noted that Invesco Advisers has contractually agreed to waive fees and/or limit expenses of the Fund for at least two years from the closing date of the OFI Transaction in an amount necessary to limit total annual operating expenses to a specified percentage of average daily net assets for each class of the Fund.
The Board also reviewed the Fund’s effective advisory fee rate (the advisory fee rate after advisory fee waivers and before other expense limitations/waivers) in relation to the effective advisory fee rates of other similarly managed mutual funds or client accounts in the Fund’s Lipper category advised orsub-advised by Invesco Advisers and its affiliates, based on asset balances as of December 31, 2017.
The Board also considered the services that may be provided by the AffiliatedSub-Advisers pursuant to thesub-advisory contracts, as well as the fees payable by Invesco Advisers to the AffiliatedSub-Advisers pursuant to thesub-advisory contracts.
D. Economies of Scale and Breakpoints
The Board considered the extent to which there may be economies of scale in the provision of advisory services to the Fund. The Board considered Invesco’s reinvestment in its business, including investments in business infrastructure and cybersecurity. The Board noted that the Fund will not benefit from economies of scale through contractual breakpoints, but
48 INVESCO OPPENHEIMER MASTER LOAN FUND
will share in economies of scale through lower fees charged by third party service providers based on the combined size of the Invesco Funds. The Board noted that the Fund may also benefit from economies of scale through initial fee setting, fee waivers and expense reimbursements.
E. Profitability and Financial Resources
The Board reviewed information from the 2018 contract renewal process provided by Invesco Advisers concerning the costs of the advisory and other services that Invesco Advisers and its affiliates provide to the Invesco Funds and the profitability of Invesco Advisers and its affiliates in providing these services. The Board considered the methodology used for calculating profitability and noted the periodic review of such methodology by an independent consultant. The Board noted that Invesco Advisers will continue to operate at a net profit from services Invesco Advisers and its affiliates provide to the Invesco Funds. The Board did not deem the level of profits realized by Invesco Advisers and its affiliates from providing services to the Invesco Funds, and the profits estimated to be realized by the Fund, to be excessive given the nature, extent and quality of the services provided. The Board received information from Invesco Advisers demonstrating that Invesco Advisers and the AffiliatedSub-Advisers are financially sound and have the resources necessary to perform their obligations under the investment advisory agreement andsub-advisory contracts.
F. Collateral Benefits to Invesco Advisers and its Affiliates
The Board considered various other benefits to be received by Invesco Advisers and its affiliates from the relationship with the Fund, including the fees to be received for providing administrative, transfer agency and distribution services to the Fund. The Board considered the performance of Invesco Advisers and its affiliates in providing these services to other Invesco Funds and the organizational structure employed to provide these services. The Board also considered that these services will be provided to the Fund pursuant to written contracts that are reviewed and approved on an annual basis by the Board; and that the services are required for the operation of the Fund.
The Board considered the benefits realized by Invesco Advisers and the Affiliated Sub-Advisers as a result of portfolio brokerage transactions executed through “soft dollar” arrangements. Invesco Advisers noted that the Fund will not execute brokerage transactions through “soft dollar” arrangements to any significant degree.
The Board considered that the Fund’s uninvested cash and cash collateral from any securities lending arrangements may be invested in money market funds advised by Invesco Advisers pursuant to procedures approved by the Board. The Board considered that Invesco Advisers will receive advisory fees from these affiliated money market funds attributable to such investments, although Invesco Advisers has contractually agreed to waive through varying periods the advisory fees payable by the Invesco Funds with respect to certain investments in the affiliated money market funds. The waiver is in an amount equal to 100% of the net advisory fee Invesco Advisers will receive from the affiliated money market funds
49 INVESCO OPPENHEIMER MASTER LOAN FUND
APPROVAL OF INVESTMENT ADVISORY ANDSUB-ADVISORY
Unaudited / Continued
with respect to the Fund’s investment in the affiliated money market funds of uninvested cash, but not cash collateral. The Board concluded that the amount of advisory fees to be received by Invesco Advisers from the Fund’s investment of cash collateral from any securities lending arrangements in the affiliated money market funds is fair and reasonable.
50 INVESCO OPPENHEIMER MASTER LOAN FUND
PORTFOLIO PROXY VOTING POLICIES AND GUIDELINES;
UPDATES TO SCHEDULE OF INVESTMENTSUnaudited
Go paperless with eDelivery
Visit invesco.com/edelivery to enjoy the convenience and security of anytime electronic access to your investment documents.
With eDelivery, you can elect to have any or all of the following materials delivered straight to your inbox to download, save and print from your own computer:
● Fund reports and prospectuses
● Quarterly statements
● Daily confirmations
● Tax forms
Invesco mailing information
Send general correspondence to Invesco Investment Services, Inc., P.O. Box 219078, Kansas City, MO 64121-9078.
Important notice regarding delivery of security holder documents
To reduce Fund expenses, only one copy of most shareholder documents may be mailed to shareholders with multiple accounts at the same address (Householding). Mailing of your shareholder documents may be householded indefinitely unless you instruct us otherwise. If you do not want the mailing of these documents to be combined with those for other members of your household, please contact Invesco Investment Services, Inc. at 800 959 4246 or contact your financial institution. We will begin sending you individual copies for each account within 30 days after receiving your request.
Fund holdings and proxy voting information
The Fund provides a complete list of its holdings four times in each fiscal year, at the quarter ends. For the second and fourth quarters, the lists appear in the Fund’s semiannual and annual reports to shareholders. For the first and third quarters, the Fund files the lists with the Securities and Exchange Commission (SEC) on FormN-PORT. The most recent list of portfolio holdings is available at invesco.com/completeqtrholdings. Shareholders can also look up the Fund’s FormsN-PORT on the SEC website at sec.gov.
A description of the policies and procedures that the Fund uses to determine how to vote proxies relating to portfolio securities is available without charge, upon request, from our Client Services department at 800 959 4246 or at invesco.com/proxyguidelines. The information is also available on the SEC website, sec.gov.
Information regarding how the Fund voted proxies related to its portfolio securities during the most recent12-month period ended June 30 is available at invesco.com/proxysearch. The information is also available on the SEC website, sec.gov.
Invesco Advisers, Inc. is an investment adviser; it provides investment advisory services to individual and institutional clients and does not sell securities. Invesco Distributors, Inc. is the US distributor for Invesco Ltd.’s retail mutual funds, exchange-traded funds and institutional money market funds. Both are wholly owned, indirect subsidiaries of Invesco Ltd.
51 INVESCO OPPENHEIMER MASTER LOAN FUND
SHAREHOLDER PROXYUnaudited
A Special Meeting (“Meeting”) of Shareholders of Invesco Oppenheimer Master Loan Fund was held on April 12, 2019. The Meeting was held for the following purpose:
(1) Approval of an Agreement and Plan of Reorganization that provides for the reorganization of Oppenheimer Master Loan Fund, LLC into Invesco Oppenheimer Master Loan Fund.
The results of the voting on the above matter was as follows:
| | | | | | | | | | | | | | | | |
| Matter | | Votes For | | | Votes
Against | | | Votes
Abstain | | | Broker
Non-Votes | |
| (1) Approval of an Agreement and Plan of Reorganization | | | 64,004,297 | | | | 0 | | | | 0 | | | | 0 | |
52 INVESCO OPPENHEIMER MASTER LOAN FUND
TRUSTEES AND OFFICERSUnaudited
The address of each trustee and officer is AIM Counselor Series Trust (Invesco Counselor Series Trust) (the “Trust”), 11 Greenway Plaza, Suite 1000, Houston, Texas 77046-1173. The trustees serve for the life of the Trust, subject to their earlier death, incapacitation, resignation, retirement or removal as more specifically provided in the Trust’s organizational documents. Each officer serves for a one year term or until their successors are elected and qualified. Column two below includes length of time served with predecessor entities, if any.
| | | | | | | | | | | | |
| | | | | | | |
Name, Year of Birth and Position(s) Held with the Trust | | Trustee
and/or
Officer
Since | | Principal Occupation(s) During Past 5 Years | | | | Number of Funds in Fund Complex
Overseen by Trustee | | | | Other Directorship(s)
Held by Trustee During
Past 5 Years |
| | | | | | | |
INTERESTED PERSONS | | | | | | | | | | | | |
| | | | | | | |
Martin L. Flanagan1— 1960 Trustee and Vice Chair | | 2007 | | Executive Director, Chief Executive Officer and President, Invesco Ltd. (ultimate parent of Invesco and a global investment management firm); Trustee and Vice Chair, The Invesco Funds; Vice Chair, Investment Company Institute; and Member of Executive Board, SMU Cox School of Business Formerly: Advisor to the Board, Invesco Advisers, Inc. (formerly known as Invesco Institutional (N.A.), Inc.); Chairman and Chief Executive Officer, Invesco Advisers, Inc. (registered investment adviser); Director, Chairman, Chief Executive Officer and President, Invesco Holding Company (US), Inc. (formerly IVZ Inc.) (holding company), Invesco Group Services, Inc. (service provider) and Invesco North American Holdings, Inc. (holding company); Director, Chief Executive Officer and President, Invesco Holding Company Limited (parent of Invesco and a global investment management firm); Director, Invesco Ltd.; Chairman, Investment Company Institute and President,Co-Chief Executive Officer,Co-President, Chief Operating Officer and Chief Financial Officer, Franklin Resources, Inc. (global investment management organization) | | | | 230 | | | | None |
| | | | | | | |
Philip A. Taylor2— 1954 Trustee | | 2006 | | Vice Chair, Invesco Ltd.; Trustee, The Invesco Funds Formerly: Director, Invesco Canada Ltd. (formerly known as Invesco Trimark Ltd./ Invesco Trimark Ltèe) (registered investment adviser and registered transfer agent); Head of the Americas and Senior Managing Director, Invesco Ltd.; Director, Invesco Advisers, Inc. (formerly known as Invesco Institutional (N.A.), Inc.) (registered investment adviser); | | | | 230 | | | | None |
| |
| 1 Mr. Flanagan is considered an interested person (within the meaning of Section 2(a)(19) of the 1940 Act) of the Trust because he is an officer of the Adviser to the Trust, and an officer and a director of Invesco Ltd., ultimate parent of the Adviser. |
| |
| 2 Mr. Taylor is considered an interested person (within the meaning of Section 2(a)(19) of the 1940 Act) of the Trust because he is an officer of Invesco Ltd., ultimate parent of the Adviser. |
53 INVESCO OPPENHEIMER MASTER LOAN FUND
TRUSTEES AND OFFICERSUnaudited / Continued
| | | | | | | | | | | | |
| | | | | | | |
Name, Year of Birth and Position(s) Held with the Trust | | Trustee
and/or
Officer
Since | | Principal Occupation(s) During Past 5 Years | | | | Number of Funds in Fund Complex
Overseen by Trustee | | | | Other Directorship(s)
Held by Trustee During
Past 5 Years |
| | | | | | | |
| INTERESTED PERSONS (CONTINUED) | | | | | | | | | | | | |
| | | | | | | |
| Philip A. Taylor (Continued) | | | | Director and Chairman, Invesco Investment Services, Inc. (formerly known as Invesco AIM Investment Services, Inc.) (registered transfer agent); Chief Executive Officer, Invesco Corporate Class Inc. (corporate mutual fund company); Chairman and Chief Executive Officer, Invesco Canada Ltd. (formerly known as Invesco Trimark Ltd./ Invesco Trimark Ltèe) (registered investment adviser and registered transfer agent); Senior Vice President, The Invesco Funds; Director, Invesco Investment Advisers LLC (formerly known as Van Kampen Asset Management); Director, Chairman, Chief Executive Officer and President, Invesco Management Group, Inc. (formerly known as Invesco AIM Management Group, Inc.) (financial services holding company);Co-Chairman,Co-President andCo-Chief Executive Officer, Invesco Advisers, Inc. (formerly known as Invesco Institutional (N.A.), Inc.) (registered investment adviser); Director, Chief Executive Officer and President, Van Kampen Exchange Corp; President and Principal Executive Officer, The Invesco Funds (other than AIM Treasurer’s Series Trust (Invesco Treasurer’s Series Trust), Short-Term Investments Trust and Invesco Management Trust); Executive Vice President, The Invesco Funds (AIM Treasurer’s Series Trust (Invesco Treasurer’s Series Trust), Short-Term Investments Trust and Invesco Management Trust only); Director and President, INVESCO Funds Group, Inc. (registered investment adviser and registered transfer agent); Director and Chairman, IVZ Distributors, Inc. (formerly known as INVESCO Distributors, Inc.) (registered broker dealer); Director, President and Chairman, Invesco Inc. (holding company), Invesco Canada Holdings Inc. (holding company), Trimark Investments Ltd./ Placements Trimark Ltèe and Invesco Financial Services Ltd/Services Financiers Invesco Ltèe; Chief Executive Officer, Invesco Canada Fund Inc. (corporate mutual fund company); Director and Chairman, Van Kampen Investor Services Inc.; Director, Chief Executive Officer and President, 1371 Preferred Inc. (holding | | | | | | | | |
54 INVESCO OPPENHEIMER MASTER LOAN FUND
| | | | | | | | | | | | |
| | | | | | | |
Name, Year of Birth and Position(s) Held with the Trust | | Trustee
and/or
Officer
Since | | Principal Occupation(s) During Past 5 Years | | | | Number of Funds in Fund Complex
Overseen by Trustee | | | | Other Directorship(s)
Held by Trustee During
Past 5 Years |
| | | | | | | |
| INTERESTED PERSONS (CONTINUED) | | | | | | | | | | | | |
| | | | | | | |
| Philip A. Taylor (Continued) | | | | company) and Van Kampen Investments Inc.; Director and President, AIM GP Canada Inc. (general partner for limited partnerships) and Van Kampen Advisors, Inc.; Director and Chief Executive Officer, Invesco Trimark Dealer Inc. (registered broker dealer); Director, Invesco Distributors, Inc. (formerly known as Invesco AIM Distributors, Inc.) (registered broker dealer); Manager, Invesco Capital Management LLC; Director, Chief Executive Officer and President, Invesco Advisers, Inc.; Director, Chairman, Chief Executive Officer and President, Invesco AIM Capital Management, Inc.; President, Invesco Trimark Dealer Inc. and Invesco Trimark Ltd./Invesco Trimark Ltèe; Director and President, AIM Trimark Corporate Class Inc. and AIM Trimark Canada Fund Inc.; Senior Managing Director, Invesco Holding Company Limited; Director and Chairman, Fund Management Company (former registered broker dealer); President and Principal Executive Officer, The Invesco Funds (AIM Treasurer’s Series Trust (Invesco Treasurer’s Series Trust), and Short-Term Investments Trust only); President, AIM Trimark Global Fund Inc. and AIM Trimark Canada Fund Inc. | | | | | | | | |
55 INVESCO OPPENHEIMER MASTER LOAN FUND
TRUSTEES AND OFFICERSUnaudited / Continued
| | | | | | | | | | | | |
| | | | | | | |
Name, Year of Birth and Position(s) Held with the Trust | | Trustee
and/or
Officer
Since | | Principal Occupation(s) During Past 5 Years | | | | Number of Funds in Fund Complex
Overseen by Trustee | | | | Other Directorship(s)
Held by Trustee During
Past 5 Years |
| | | | | | | |
| INDEPENDENT TRUSTEES | | | | | | | | | | | | |
| | | | | | | |
Bruce L. Crockett – 1944 Trustee and Chair | | 2003 | | Chairman, Crockett Technologies Associates (technology consulting company) Formerly: Director, Captaris (unified messaging provider); Director, President and Chief Executive Officer, COMSAT Corporation; Chairman, Board of Governors of INTELSAT (international communications company); ACE Limited (insurance company); Independent Directors Council and Investment Company Institute: Member of the Audit Committee, Investment Company Institute; Member of the Executive Committee and Chair of the Governance Committee, Independent Directors Council | | | | 230 | | | | Director and Chairman of the Audit Committee, ALPS (Attorneys Liability Protection Society) (insurance company); Director and Member of the Audit Committee and Compensation Committee, Ferroglobe PLC (metallurgical company) |
| | | | | | | |
David C. Arch – 1945 Trustee | | 2010 | | Chairman of Blistex Inc. (consumer health care products manufacturer); Member, World Presidents’ Organization | | | | 230 | | | | Board member of the Illinois Manufacturers’ Association |
| | | | | | | |
Beth Ann Brown – 1968 Trustee | | 2019 | | Independent Consultant Formerly: Head of Intermediary Distribution, Managing Director, Strategic Relations, Managing Director, Head of National Accounts, Senior Vice President, National Account Manager and Senior Vice President, Key Account Manager, Columbia Management Investment Advisers LLC; Vice President, Key Account Manager, Liberty Funds Distributor, Inc.; and Trustee of certain Oppenheimer Funds | | | | 230 | | | | Director, Board of Directors of Caron Engineering Inc.; Advisor, Board of Advisors of Caron Engineering Inc.; President and Director, of Acton Shapleigh Youth Conservation Corps (non -profit); and Vice President and Director of Grahamtastic Connection (non- profit) |
| | | | | | | |
Jack M. Fields – 1952 Trustee | | 2003 | | Chief Executive Officer, Twenty First Century Group, Inc. (government affairs company); and Chairman, Discovery Learning Alliance(non-profit) Formerly: Owner and Chief Executive Officer, Dos Angeles Ranch L.P. (cattle, hunting, corporate entertainment); Director, Insperity, Inc. (formerly known as Administaff) (human resources provider); Chief Executive Officer, Texana Timber LP (sustainable forestry | | | | 230 | | | | None |
| | | | | | | |
| | | | | | | | | | | | | |
56 INVESCO OPPENHEIMER MASTER LOAN FUND
| | | | | | | | | | | | |
| | | | | | | |
Name, Year of Birth and Position(s) Held with the Trust | | Trustee
and/or
Officer
Since | | Principal Occupation(s) During Past 5 Years | | | | Number of Funds in Fund Complex
Overseen by Trustee | | | | Other Directorship(s)
Held by Trustee During
Past 5 Years |
| | | | | | | |
| INDEPENDENT TRUSTEES (CONTINUED) | | | | | | | | | | | | |
| | | | | | | |
| Jack M. Fields (Continued) | | | | company); Director of Cross Timbers Quail Research Ranch(non-profit); and member of the U.S. House of Representatives | | | | | | | | |
| | | | | | | |
Cynthia Hostetler —1962 Trustee | | 2017 | | Non-Executive Director and Trustee of a number of public and private business corporations Formerly: Director, Aberdeen Investment Funds (4 portfolios); Head of Investment Funds and Private Equity, Overseas Private Investment Corporation; President, First Manhattan Bancorporation, Inc.; Attorney, Simpson Thacher & Bartlett LLP | | | | 230 | | | | Vulcan Materials Company (construction materials company); Trilinc Global Impact Fund; Genesee & Wyoming, Inc. (railroads); Artio Global Investment LLC (mutual fund complex); Edgen Group, Inc. (specialized energy and infrastructure products distributor); Investment Company Institute (professional organization); Independent Directors Council (professional organization) |
| | | | | | | |
Eli Jones – 1961 Trustee | | 2016 | | Professor and Dean, Mays Business School - Texas A&M University Formerly: Professor and Dean, Walton College of Business, University of Arkansas and E.J. Ourso College of Business, Louisiana State University; Director, Arvest Bank | | | | 230 | | | | Insperity, Inc. (formerly known as Administaff) (human resources provider) |
| | | | | | | |
Elizabeth Krentzman – 1959 Trustee | | 2019 | | Formerly: Principal and Chief Regulatory Advisor for Asset Management Services and U.S. Mutual Fund Leader of Deloitte & Touche LLP; General Counsel of the Investment Company Institute (trade association); National Director of the Investment Management Regulatory Consulting Practice, Principal, Director and Senior Manager of Deloitte & Touche LLP; Assistant Director of the Division of Investment Management - Office of Disclosure and Investment Adviser Regulation of the U.S. Securities and Exchange Commission and various positions with the Division of Investment Management – Office of Regulatory Policy of the U.S. Securities and Exchange Commission; Associate at Ropes & Gray LLP.; Advisory Board Member of the | | | | 230 | | | | Trustee of the University of Florida National Board Foundation and Audit Committee Member; Member of the Cartica Funds Board of Directors (private investment funds); Member of the University of Florida Law Center Association, Inc. Board of Trustees and Audit Committee Member |
57 INVESCO OPPENHEIMER MASTER LOAN FUND
TRUSTEES AND OFFICERSUnaudited / Continued
| | | | | | | | | | | | |
| | | | | | | |
Name, Year of Birth and Position(s) Held with the Trust | | Trustee
and/or
Officer
Since | | Principal Occupation(s) During Past 5 Years | | | | Number of Funds in Fund Complex
Overseen by Trustee | | | | Other Directorship(s)
Held by Trustee During
Past 5 Years |
| | | | | | | |
| INDEPENDENT TRUSTEES (CONTINUED) | | | | | | | | | | | | |
| | | | | | | |
| Elizabeth Krentzman (Continued) | | | | Securities and Exchange Commission Historical Society; and Trustee of certain Oppenheimer Funds | | | | | | | | |
| | | | | | | |
Anthony J. LaCava, Jr. – 1956 Trustee | | 2019 | | Formerly: Director and Member of the Audit Committee, Blue Hills Bank (publicly traded financial institution) and Managing Partner, KPMG LLP | | | | 230 | | | | Blue Hills Bank; Chairman of Bentley University; Member, Business School Advisory Council; and Nominating Committee, KPMG LLP |
| | | | | | | |
Prema Mathai-Davis – 1950 Trustee | | 2003 | | Retired Co-Owner & Partner of Quantalytics Research, LLC, (a FinTech Investment Research Platform for the Self-Directed Investor) | | | | 230 | | | | None |
| | | | | | | |
Joel W. Motley – 1952 Trustee | | 2019 | | Director of Office of Finance, Federal Home Loan Bank; Member of the Vestry of Trinity Wall Street; Managing Director of Carmona Motley Hoffman, Inc. (privately held financial advisor); Member of the Finance and Budget Committee of the Council on Foreign Relations, Member of the Investment Committee and Board of Human Rights Watch and Member of the Investment Committee and Board of Historic Hudson Valley (non-profit cultural organization). Formerly: Managing Director of Public Capital Advisors, LLC (privately held financial advisor); Managing Director of Carmona Motley Hoffman, Inc. (privately held financial advisor); Trustee of certain Oppenheimer Funds; and Director of Columbia Equity Financial Corp. (privately held financial advisor) | | | | 230 | | | | Director of Greenwall Foundation (bioethics research foundation); Member of Board and Investment Committee of The Greenwall Foundation; Director of Southern Africa Legal Services Foundation; Board Member and Investment Committee Member of Pulitzer Center for Crisis Reporting(non-profit journalism) |
| | | | | | | |
Teresa M. Ressel — 1962 Trustee | | 2017 | | Non-executive director and trustee of a number of public and private business corporations Formerly: Chief Financial Officer, Olayan America, The Olayan Group (international investor/commercial/industrial); Chief Executive Officer, UBS Securities LLC; Group Chief Operating Officer, Americas, UBS AG; Assistant Secretary for Management & Budget and CFO, US Department of the Treasury | | | | 230 | | | | Atlantic Power Corporation (power generation company); ON Semiconductor Corp. (semiconductor supplier) |
58 INVESCO OPPENHEIMER MASTER LOAN FUND
| | | | | | | | | | | | |
| | | | | | | |
Name, Year of Birth and Position(s) Held with the Trust | | Trustee
and/or
Officer
Since | | Principal Occupation(s) During Past 5 Years | | | | Number of Funds in Fund Complex
Overseen by Trustee | | | | Other Directorship(s)
Held by Trustee During
Past 5 Years |
| | | | | | | |
| INDEPENDENT TRUSTEES (CONTINUED) | | | | | | | | | | | | |
| | | | | | | |
Ann Barnett Stern – 1957 Trustee | | 2017 | | President and Chief Executive Officer, Houston Endowment Inc. (private philanthropic institution) Formerly: Executive Vice President and General Counsel, Texas Children’s Hospital; Attorney, Beck, Redden and Secrest, LLP; Business Law Instructor, University of St. Thomas; Attorney, Andrews & Kurth LLP | | | | 230 | | | | Federal Reserve Bank of Dallas |
| | | | | | | |
Raymond Stickel, Jr. – 1944 Trustee | | 2005 | | Retired Formerly: Director, Mainstay VP Series Funds, Inc. (25 portfolios); Partner, Deloitte & Touche | | | | 230 | | | | None |
| | | | | | | |
Robert C. Troccoli – 1949 Trustee | | 2016 | | Retired Formerly: Adjunct Professor, University of Denver – Daniels College of Business, Senior Partner, KPMG LLP | | | | 230 | | | | None |
| | | | | | | |
Daniel S. Vandivort – 1954 Trustee | | 2019 | | Treasurer, Chairman of the Audit and Finance Committee, and Trustee, Board of Trustees, Huntington Disease Foundation of America; and President, Flyway Advisory Services LLC (consulting and property management). Formerly: Trustee and Governance Chair, of certain Oppenheimer Funds | | | | 230 | | | | Chairman and Lead Independent Director, Chairman of the Audit Committee, and Director, Board of Directors, Value Line Funds |
| | | | | | | |
James D. Vaughn – 1945 Trustee | | 2019 | | Retired Formerly: Managing Partner, Deloitte & Touche LLP; Trustee and Chairman of the Audit Committee, Schroder Funds; Board Member, Mile High United Way, Boys and Girls Clubs, Boy Scouts, Colorado Business Committee for the Arts, Economic Club of Colorado and Metro Denver Network (economic development corporation); and Trustee of certain Oppenheimer Funds | | | | 230 | | | | Board member and Chairman of Audit Committee of AMG National Trust Bank; Trustee and Investment Committee member, University of South Dakota Foundation; Board member, Audit Committee Member and past Board Chair, Junior Achievement(non-profit) |
| | | | | | | |
Christopher L. Wilson – 1957 Trustee, Vice Chair and Chair Designate | | 2017 | | Retired Formerly: Director, TD Asset Management USA Inc. (mutual fund complex) (22 portfolios); Managing Partner, CT2, LLC (investing and | | | | 230 | | | | ISO New England, Inc.(non-profit organization managing regional electricity market) |
59 INVESCO OPPENHEIMER MASTER LOAN FUND
TRUSTEES AND OFFICERSUnaudited / Continued
| | | | | | | | | | | | |
| | | | | | | |
Name, Year of Birth and Position(s) Held with the Trust | | Trustee
and/or
Officer
Since | | Principal Occupation(s) During Past 5 Years | | | | Number of Funds in Fund Complex
Overseen by Trustee | | | | Other Directorship(s)
Held by Trustee During
Past 5 Years |
| | | | | | | |
| INDEPENDENT TRUSTEES (CONTINUED) | | | | | | | | | | | | |
| | | | | | | |
| Christopher L. Wilson (Continued) | | | | consulting firm); President/Chief Executive Officer, Columbia Funds, Bank of America Corporation; President/Chief Executive Officer, CDC IXIS Asset Management Services, Inc.; Principal & Director of Operations, Scudder Funds, Scudder, Stevens & Clark, Inc.; Assistant Vice President, Fidelity Investments | | | | | | | | |
60 INVESCO OPPENHEIMER MASTER LOAN FUND
| | | | | | | | | | | | |
| | | | | | | |
Name, Year of Birth and Position(s) Held with the Trust | | Trustee
and/or
Officer
Since | | Principal Occupation(s) During Past 5 Years | | | | Number of Funds in Fund Complex
Overseen by Trustee | | | | Other Directorship(s)
Held by Trustee During
Past 5 Years |
| | | | | | | |
| OTHER OFFICERS | | | | | | | | | | | | |
| | | | | | | |
Sheri Morris — 1964 President, Principal Executive Officer and Treasurer | | 2003 | | President, Principal Executive Officer and Treasurer, The Invesco Funds; Vice President, Invesco Advisers, Inc. (formerly known as Invesco Institutional (N.A.), Inc.) (registered investment adviser); and Vice President, Invesco Exchange-Traded Fund Trust, Invesco Exchange-Traded Fund Trust II, Invesco India Exchange-Traded Fund Trust, Invesco Actively Managed Exchange-Traded Fund Trust, Invesco Actively Managed Exchange-Traded Commodity Fund Trust and Invesco Exchange- Traded Self-Indexed Fund Trust, and Vice President, OppenheimerFunds, Inc. Formerly: Vice President and Principal Financial Officer, The Invesco Funds; Vice President, Invesco AIM Advisers, Inc., Invesco AIM Capital Management, Inc. and Invesco AIM Private Asset Management, Inc.; Assistant Vice President and Assistant Treasurer, The Invesco Funds and Assistant Vice President, Invesco Advisers, Inc., Invesco AIM Capital Management, Inc. and Invesco AIM Private Asset Management, Inc.; and Treasurer, Invesco Exchange-Traded Fund Trust, Invesco Exchange-Traded Fund Trust II, Invesco India Exchange-Traded Fund Trust and Invesco Actively Managed Exchange-Traded Fund Trust | | | | N/A | | | | N/A |
| | | | | | | |
Russell C. Burk — 1958 Senior Vice President and Senior Officer | | 2005 | | Senior Vice President and Senior Officer, The Invesco Funds | | | | N/A | | | | N/A |
| | | | | | | |
Jeffrey H. Kupor – 1968 Senior Vice President, Chief Legal Officer and Secretary | | 2018 | | Head of Legal of the Americas, Invesco Ltd.; Senior Vice President and Secretary, Invesco Advisers, Inc. (formerly known as Invesco Institutional (N.A.), Inc.) (registered investment adviser); Senior Vice President and Secretary, Invesco Distributors, Inc. (formerly known as Invesco AIM Distributors, Inc.); Vice President and Secretary, Invesco Investment Services, Inc. (formerly known as Invesco AIM Investment Services, Inc.) Senior Vice President, Chief Legal Officer and Secretary, The Invesco Funds; Secretary and General Counsel, Invesco Investment Advisers LLC (formerly known as Van Kampen Asset Management); Secretary and General Counsel, Invesco Capital Markets, Inc. (formerly known as Van Kampen Funds Inc.) and Chief Legal Officer, Invesco Exchange-Traded Fund Trust, | | | | N/A | | | | N/A |
61 INVESCO OPPENHEIMER MASTER LOAN FUND
TRUSTEES AND OFFICERSUnaudited / Continued
| | | | | | | | | | | | |
| | | | | | | |
Name, Year of Birth and Position(s) Held with the Trust | | Trustee
and/or
Officer
Since | | Principal Occupation(s) During Past 5 Years | | | | Number of Funds in Fund Complex
Overseen by Trustee | | | | Other Directorship(s)
Held by Trustee During
Past 5 Years |
| | | | | | | |
| OTHER OFFICERS (CONTINUED) | | | | | | | | | | | | |
| | | | | | | |
| Jeffrey H. Kupor (Continued) | | | | Invesco Exchange-Traded Fund Trust II, Invesco India Exchange-Traded Fund Trust, Invesco Actively Managed Exchange-Traded Fund Trust, Invesco Actively Managed Exchange- Traded Commodity Fund Trust and Invesco Exchange-Traded Self-Indexed Fund Trust; Secretary, Invesco Indexing LLC; Secretary, W.L. Ross & Co., LLC Formerly: Secretary and Vice President, Jemstep, Inc.; Head of Legal, Worldwide Institutional, Invesco Ltd.; Secretary and General Counsel, INVESCO Private Capital Investments, Inc.; Senior Vice President, Secretary and General Counsel, Invesco Management Group, Inc. (formerly known as Invesco AIM Management Group, Inc.); Assistant Secretary, INVESCO Asset Management (Bermuda) Ltd.; Secretary and General Counsel, Invesco Private Capital, Inc.; Assistant Secretary and General Counsel, INVESCO Realty, Inc.; Secretary and General Counsel, Invesco Senior Secured Management, Inc.; and Secretary, Sovereign G./P. Holdings Inc. | | | | | | | | |
| | | | | | | |
Andrew R. Schlossberg – 1974 Senior Vice President | | 2019 | | Head of the Americas and Senior Managing Director, Invesco Ltd.; Director and Senior Vice President, Invesco Advisers, Inc. (formerly known as Invesco Institutional (N.A.), Inc.) (registered investment adviser); Director and Chairman, Invesco Investment Services, Inc. (formerly known as Invesco AIM Investment Services, Inc.) (registered transfer agent); Senior Vice President, The Invesco Funds; Director, Invesco Investment Advisers LLC (formerly known as Van Kampen Asset Management); Director, President and Chairman, Invesco Insurance Agency, Inc. Formerly: Director, Invesco UK Limited; Director and Chief Executive, Invesco Asset Management Limited and Invesco Fund Managers Limited; Assistant Vice President, The Invesco Funds; Senior Vice President, Invesco Advisers, Inc. (formerly known as Invesco Institutional (N.A.), Inc.) (registered investment adviser); Director and Chief Executive, Invesco Administration Services Limited and Invesco Global Investment Funds | | | | N/A | | | | N/A |
62 INVESCO OPPENHEIMER MASTER LOAN FUND
| | | | | | | | | | | | |
| | | | | | | |
Name, Year of Birth and Position(s) Held with the Trust | | Trustee
and/or
Officer
Since | | Principal Occupation(s) During Past 5 Years | | | | Number of Funds in Fund Complex
Overseen by Trustee | | | | Other Directorship(s)
Held by Trustee During
Past 5 Years |
| | | | | | | |
| OTHER OFFICERS (CONTINUED) | | | | | | | | | | | | |
| | | | | | | |
| Andrew R. Schlossberg (Continued) | | | | Limited; Director, Invesco Distributors, Inc.; Head of EMEA, Invesco Ltd.; President, Invesco Actively Managed Exchange-Traded Commodity Fund Trust, Invesco Actively Managed Exchange-Traded Fund Trust, Invesco Exchange-Traded Fund Trust, Invesco Exchange-Traded Fund Trust II and Invesco India Exchange-Traded Fund Trust; Managing Director and Principal Executive Officer, Invesco Capital Management LLC | | | | | | | | |
| | | | | | | |
John M. Zerr — 1962 Senior Vice President | | 2006 | | Chief Operating Officer of the Americas; Senior Vice President, Invesco Advisers, Inc. (formerly known as Invesco Institutional (N.A.), Inc.) (registered investment adviser); Senior Vice President, Invesco Distributors, Inc. (formerly known as Invesco AIM Distributors, Inc.); Director and Vice President, Invesco Investment Services, Inc. (formerly known as Invesco AIM Investment Services, Inc.) Senior Vice President, The Invesco Funds; Managing Director, Invesco Capital Management LLC; Director, Invesco Investment Advisers LLC (formerly known as Van Kampen Asset Management); Senior Vice President, Invesco Capital Markets, Inc. (formerly known as Van Kampen Funds Inc.); Manager, Invesco Indexing LLC; Manager, Invesco Specialized Products, LLC; Director and Senior Vice President, Invesco Insurance Agency, Inc.; Member, Invesco Canada Funds Advisory Board; Director, President and Chief Executive Officer, Invesco Corporate Class Inc. (corporate mutual fund company); and Director, Chairman, President and Chief Executive Officer, Invesco Canada Ltd. (formerly known as Invesco Trimark Ltd./Invesco Trimark Ltèe) (registered investment adviser and registered transfer agent) Formerly: Director and Senior Vice President, Invesco Management Group, Inc. (formerly known as Invesco AIM Management Group, Inc.); Secretary and General Counsel, Invesco Management Group, Inc. (formerly known as Invesco AIM Management Group, Inc.); Secretary, Invesco Investment Services, Inc. (formerly known as Invesco AIM Investment Services, Inc.); Chief Legal Officer and Secretary, The Invesco Funds; Secretary and | | | | N/A | | | | N/A |
63 INVESCO OPPENHEIMER MASTER LOAN FUND
TRUSTEES AND OFFICERSUnaudited / Continued
| | | | | | | | | | | | |
| | | | | | | |
Name, Year of Birth and Position(s) Held with the Trust | | Trustee
and/or
Officer
Since | | Principal Occupation(s) During Past 5 Years | | | | Number of Funds in Fund Complex
Overseen by Trustee | | | | Other Directorship(s)
Held by Trustee During
Past 5 Years |
| | | | | | | |
| OTHER OFFICERS (CONTINUED) | | | | | | | | | | | | |
| | | | | | | |
| John M. Zerr (Continued) | | | | General Counsel, Invesco Investment Advisers LLC (formerly known as Van Kampen Asset Management); Secretary and General Counsel, Invesco Capital Markets, Inc. (formerly known as Van Kampen Funds Inc.); Chief Legal Officer, Invesco Exchange-Traded Fund Trust, Invesco Exchange-Traded Fund Trust II, Invesco India Exchange-Traded Fund Trust, Invesco Actively Managed Exchange-Traded Fund Trust, Invesco Actively Managed Exchange- Traded Commodity Fund Trust and Invesco Exchange-Traded Self-Indexed Fund Trust; Secretary, Invesco Indexing LLC; Director, Secretary, General Counsel and Senior Vice President, Van Kampen Exchange Corp.; Director, Vice President and Secretary, IVZ Distributors, Inc. (formerly known as INVESCO Distributors, Inc.); Director and Vice President, INVESCO Funds Group, Inc.; Director and Vice President, Van Kampen Advisors Inc.; Director, Vice President, Secretary and General Counsel, Van Kampen Investor Services Inc.; Director and Secretary, Invesco Distributors, Inc. (formerly known as Invesco AIM Distributors, Inc.); Director, Senior Vice President, General Counsel and Secretary, Invesco AIM Advisers, Inc. and Van Kampen Investments Inc.; Director, Vice President and Secretary, Fund Management Company; Director, Senior Vice President, Secretary, General Counsel and Vice President, Invesco AIM Capital Management, Inc.; Chief Operating Officer and General Counsel, Liberty Ridge Capital, Inc. (an investment adviser) | | | | | | | | |
| | | | | | | |
Gregory G. McGreevey - 1962 Senior Vice President | | 2012 | | Senior Managing Director, Invesco Ltd.; Director, Chairman, President, and Chief Executive Officer, Invesco Advisers, Inc. (formerly known as Invesco Institutional (N.A.), Inc.) (registered investment adviser); Director, Invesco Mortgage Capital, Inc. and Invesco Senior Secured Management, Inc.; and Senior Vice President, The Invesco Funds; and President, SNW Asset Management Corporation Formerly: Senior Vice President, Invesco Management Group, Inc. and Invesco Advisers, Inc.; Assistant Vice President, The Invesco Funds | | | | N/A | | | | N/A |
64 INVESCO OPPENHEIMER MASTER LOAN FUND
| | | | | | | | | | | | |
| | | | | | | |
Name, Year of Birth and Position(s) Held with the Trust | | Trustee
and/or
Officer
Since | | Principal Occupation(s) During Past 5 Years | | | | Number of Funds in Fund Complex
Overseen by Trustee | | | | Other Directorship(s)
Held by Trustee During
Past 5 Years |
| | | | | | | |
| OTHER OFFICERS (CONTINUED) | | | | | | | | | | | | |
| | | | | | | |
Kelli Gallegos – 1970 Vice President, Principal Financial Officer and Assistant Treasurer | | 2008 | | Assistant Treasurer, Invesco Specialized Products, LLC; Vice President, Principal Financial Officer and Assistant Treasurer, The Invesco Funds; Principal Financial and Accounting Officer –Pooled Investments, Invesco Capital Management LLC; Vice President and Treasurer, Invesco Exchange- Traded Fund Trust, Invesco Exchange-Traded Fund Trust II, Invesco India Exchange-Traded Fund Trust, Invesco Actively Managed Exchange-Traded Fund Trust, Invesco Actively Managed Exchange-Traded Commodity Fund Trust and Invesco Exchange-Traded Self- Indexed Fund Trust Formerly: Assistant Treasurer, Invesco Exchange-Traded Fund Trust, Invesco Exchange-Traded Fund Trust II, Invesco India Exchange-Traded Fund Trust, Invesco Actively Managed Exchange-Traded Fund Trust, Invesco Actively Managed Exchange-Traded Commodity Fund Trust and Invesco Exchange- Traded Self-Indexed Fund Trust; Assistant Treasurer, Invesco Capital Management LLC; Assistant Vice President, The Invesco Funds | | | | N/A | | | | N/A |
| | | | | | | |
Crissie M. Wisdom – 1969 Anti-Money Laundering Compliance Officer | | 2013 | | Anti-Money Laundering Compliance Officer, Invesco Advisers, Inc. (formerly known as Invesco Institutional (N.A.), Inc.) (registered investment adviser), Invesco Capital Markets, Inc. (formerly known as Van Kampen Funds Inc.), Invesco Distributors, Inc., Invesco Investment Services, Inc., The Invesco Funds, and Invesco Exchange-Traded Fund Trust, Invesco Exchange-Traded Fund Trust II, Invesco India Exchange-Traded Fund Trust, Invesco Actively Managed Exchange-Traded Fund Trust, Invesco Actively Managed Exchange- Traded Commodity Fund Trust and Invesco Exchange-Traded Self-Indexed Fund Trust; Anti-Money Laundering Compliance Officer and Bank Secrecy Act Officer, INVESCO National Trust Company and Invesco Trust Company; and Fraud Prevention Manager and Controls and Risk Analysis Manager for Invesco Investment Services, Inc. Formerly: Anti-Money Laundering Compliance Officer, Van Kampen Exchange Corp. and Invesco Management Group, Inc. | | | | N/A | | | | N/A |
65 INVESCO OPPENHEIMER MASTER LOAN FUND
TRUSTEES AND OFFICERSUnaudited / Continued
| | | | | | | | | | | | |
| | | | | | | |
Name, Year of Birth and Position(s) Held with the Trust | | Trustee
and/or
Officer
Since | | Principal Occupation(s) During Past 5 Years | | | | Number of Funds in Fund Complex
Overseen by Trustee | | | | Other Directorship(s)
Held by Trustee During
Past 5 Years |
| | | | | | | |
| OTHER OFFICERS (CONTINUED) | | | | | | | | | | | | |
| | | | | | | |
Robert R. Leveille – 1969 Chief Compliance Officer | | 2016 | | Chief Compliance Officer, Invesco Advisers, Inc. (registered investment adviser); and Chief Compliance Officer, The Invesco Funds Formerly: Chief Compliance Officer, Putnam Investments and the Putnam Funds | | | | N/A | | | | N/A |
The Statement of Additional Information of the Trust includes additional information about the Fund’s Trustees and is available upon request, without charge, by calling 1.800.959.4246. Please refer to the Fund’s Statement of Additional Information for information on the Fund’ssub-advisers.
| | | | | | | | | | |
| | | Office of the Fund | | Investment Adviser | | Distributor | | Auditors | | |
| | 11 Greenway Plaza, | | Invesco Advisers, Inc. | | Invesco Distributors, Inc. | | PricewaterhouseCoopers | | |
| | Suite 1000 | | 1555 Peachtree Street, N.E. | | 11 Greenway Plaza, | | LLP | | |
| | Houston, TX 77046-1173 | | Atlanta, GA 30309 | | Suite 1000 | | 1000 Louisiana Street, | | |
| | | | | | Houston, TX | | Suite 5800 | | |
| | | | | | 77046-1173 | | Houston, TX 77002-5021 | | |
| | | Counsel to the Fund | | Counsel to the | | Transfer Agent | | Custodian | | |
| | Stradley Ronon Stevens & Young, | | Independent Trustees | | Invesco Investment | | The Deutsche Bank Trust | | |
| | LLP | | Goodwin Procter LLP | | Services, Inc. | | Company Americas | | |
| | 2005 Market Street, | | 901 New York Avenue, N.W. | | 11 Greenway Plaza, | | 60 Wall Street, 17th | | |
| | Suite 2600 | | Washington, D.C. 20001 | | Suite 1000 | | Floor, NYC60-1701 | | |
| | Philadelphia, PA 19103-7018 | | | | Houston, TX | | New York, NY | | |
| | | | | | 77046-1173 | | 10005-2848 | | |
66 INVESCO OPPENHEIMER MASTER LOAN FUND
Invesco recognizes the importance of protecting your personal and financial information when you visit our website located atwww.invesco.com (the “Website”). The following information is designed to help you understand the information collection practices at this Website. We will not sell, share or rent your personally identifiable information to others in contravention of this Privacy Policy. When we refer to ourselves as “we” or “Invesco” in this Privacy Policy, we mean our entire company including our affiliates, such as subsidiaries.
By visiting this Website, you are accepting the practices described in this Privacy Policy. If you do not agree to this policy, you may not use this Website. This Privacy Policy is subject to change without notice, from time to time in our sole discretion. You acknowledge that by accessing the Website after we have posted changes to this Privacy Policy, you are agreeing to this Privacy Policy as modified. Please review the Terms of Use1 to learn of other terms and conditions applicable to your use of the Website.
Please note that this Privacy Policy is not an exclusive statement of our privacy principles across all products and services. Other privacy principles or policies may apply depending on the products or services you obtain from Invesco, or the jurisdiction in which you transact with Invesco.
This Privacy Policy was last updated on May 6, 2018.
Information We Collect and Use
We collect personal information you choose to submit to the Website in order to process transactions requested by you and meet our contractual obligations. For example, you can choose to provide your name, contact information, social security number, or tax identification number in connection with accessing your account, or you can choose to provide your personal information when you fill out a secure account question form. Any information collected about you from the Website can, from time to time, be associated with other identifying information we have about you.
In addition, we may gather information about you automatically through your use of the Website, e.g. your IP address, how you navigate the Website, the organization from which you are accessing the Website, and the websites that you access before and after you visit the Website.
When you access the Website, we may also collect information such as unique device identifiers, your screen resolution and other device settings, information about your location, and analytical information about how you use the device from which you are viewing the Website. Where applicable, we may ask your permission before collecting certain information, such as precise geolocation information.
From time to time, we use or augment the personal information we have about you with information obtained from third parties. For example, we use third party information to confirm contact or financial information or to better understand your interests by associating demographic information from third parties with the information you have provided.
How We Use Personal Information
We use your personal information to respond to your inquiries and provide the products and services you request. We also use your information from time to time to deliver the content and services we believe
1 NTD
67 INVESCO OPPENHEIMER MASTER LOAN FUND
| | | | |
| | INVESCO’S PRIVACY NOTICE Continued | | |
| | |
you will find the most relevant and to provide customer service and support.
We also use the information you provide to further develop and improve our products and services. We aggregate and/orde-identify data about visitors to the Website for various business purposes including product and service development and improvement activities.
How We Share Personal Information
We collaborate with other companies and individuals to perform services for us and on our behalf and we collaborate with our affiliates, other companies and individuals with respect to particular products or services (“Providers”). Examples of Providers include data analysis firms, customer service and support providers, email and SMS vendors, andweb-hosting and development companies. Some Providers collect information for us or on our behalf on our Website. These Providers can be provided with access to personal information needed to perform their functions.
We reserve the right to disclose your personal information as required by law, when we believe disclosure is necessary to comply with a regulatory requirement, judicial proceeding, court order or legal process served on us, to protect the safety, rights or property of our customers, the public or Invesco or to enforce the Terms of Use.
If we sell or transfer a business unit (such as a subsidiary) or an asset (such as a website) to another company, we will share your personal information with such company. You will receive notice of such an event and the new entity will inform you of any changes to the practices in this Privacy Policy. If the new entity wishes to make additional use of your information, you have the right to decline such use at that time.
We occasionally disclose aggregate orde-identified data that is not personally identifiable with third parties.
Cookies and Other Tools
Invesco and its Providers collect information about you by using cookies, tracking pixels and other technologies. We use this information to better understand, customize and improve user experience with our websites, services and offerings as well as to manage our advertising. For example, we use web analytics services that use these technologies to gather information to help us understand how visitors engage with and navigate our Website, e.g., how and when pages in a site are visited and by how many visitors. We are also able to offer our visitors a more customized, relevant experience on our sites using these technologies by delivering content and functionality based on your preferences and interests.
Depending on their purpose, some cookies will only operate for the length of a single browsing session, while others have a longer life span to ensure that they fulfill their longer-term purposes. Your web browser can be set to allow you to control whether you will accept cookies or reject cookies, to notify you each time a cookie is sent to your browser, or to delete cookies that have already been set. If your browser is set to reject cookies, certain aspects of the Website that are cookie-enabled will not recognize you when you return to the website, and some Website functionality may be lost. The “Help” section of your browser may tell you how to prevent your browser from accepting cookies. To find out more about cookies, visitwww.aboutcookies.org.
68 INVESCO OPPENHEIMER MASTER LOAN FUND
Security
No data transmission over the internet can be 100% secure, so Invesco cannot ensure or warrant the security of any information you submit to us on this Website. However, Invesco seeks to protect your personal information from unauthorized access or use when you transact business on our Website using technical, administrative and procedural measures. Invesco makes no representation as to the reasonableness, efficacy, or appropriateness of the measures we use to safeguard such information.
Users are responsible for maintaining the secrecy of their own passwords. If you have reason to believe that your interaction with us is no longer secure (for example, if you feel that the security of any account you might have with us has been compromised), please immediately notify us by contacting us as specified below.
Transfer of Data to Other Countries
Any information you provide to Invesco through use of the Website may be stored and processed, transferred between and accessed from the United States, Canada and other countries which do not guarantee the same level of protection of personal information as the one in which you reside. However, Invesco will handle your personal information in accordance with this Privacy Policy regardless of where your personal information is stored/accessed.
Children’s Privacy
We are committed to protecting the privacy of children. We do not knowingly collect personal information from children under the age of 18. If you are under the age of 18, do not provide us with any personal information.
Contact Us
Please contact us if you have any questions or concerns about your personal information or require assistance in managing your choices.
Invesco Ltd.
1555 Peachtree St. NE
Atlanta, GA 30309
By phone:
(404)439-3236
By fax:
(404)962-8288
By email:
Anne.Gerry@invesco.com
Please update your account information by logging in or contact us by email or telephone as specified above to update your account information whenever such information ceases to be complete or accurate.
You may also contact us to:
69 INVESCO OPPENHEIMER MASTER LOAN FUND
| | | | |
| | INVESCO’S PRIVACY NOTICE Continued | | |
| | |
● Request that we amend, rectify, delete or update the personal data we hold about you;
● Where possible (e.g. in relation to marketing) amend or update your choices around processing;
● Request a copy of personal data held by us.
Disclaimer
Where the Website contains links to third-party websites/content/services that are not owned or controlled by Invesco, Invesco is not responsible for how these properties operate or treat your personal information so we recommend that you read the privacy policies and terms associated with these third party properties carefully.
70 INVESCO OPPENHEIMER MASTER LOAN FUND
THIS PAGE INTENTIONALLY LEFT BLANK.
Explore High-Conviction Investing with Invesco

Go paperless with eDelivery
Visit invesco.com/edelivery to enjoy the convenience and security of anytime
electronic access to your investment documents.
With eDelivery, you can elect to have any or all of the following materials delivered
straight to your inbox to download, save and print from your own computer:
∎ Fund reports and prospectuses
∎ Quarterly statements
∎ Daily confirmations
∎ Tax forms
Invesco mailing information
Send general correspondence to Invesco Investment Services, Inc., P.O. Box
219078, Kansas City, MO 64121-9078.

| | | | | | |
| | Invesco Distributors, Inc. | | | O-MLF-AR-1 10272019 | |

Shareholder Report for the
Three Months Ended 8/31/2019
Invesco
Oppenheimer
Short Term
Municipal Fund*
Beginning on January 1, 2021, as permitted by regulations adopted by the Securities and Exchange Commission, paper copies of the Fund’s shareholder reports will no longer be sent by mail, unless you specifically request paper copies of the reports from the Fund or from your financial intermediary, such as a broker-dealer or bank. Instead, the reports will be made available on the Fund’s website, and you will be notified by mail each time a report is posted and provided with a website link to access the report.
If you already elected to receive shareholder reports electronically, you will not be affected by this change and you need not take any action. You may elect to receive shareholder reports and other communications from the Fund electronically by contacting your financial intermediary (such as a broker-dealer or bank) or, if you are a direct investor, by enrolling at invesco. com/edelivery.
You may elect to receive all future reports in paper free of charge. If you invest through a financial intermediary, you can contact your financial intermediary to request that you continue to receive paper copies of your shareholder reports. If you invest directly with the Fund, you can call 800 959 4246 to let the Fund know you wish to continue receiving paper copies of your shareholder reports. Your election to receive reports in paper will apply to all funds held with your financial intermediary or all funds held with the fund complex if you invest directly with the Fund.
*Prior to the close of business on May 24, 2019, the Fund’s name was Oppenheimer Short Term Municipal Fund. See Important Update on the following page for more information.
Important Update
On October 18, 2018, Massachusetts Mutual Life Insurance Company, an indirect corporate parent of OppenheimerFunds, Inc. and its subsidiaries OFI Global Asset Management, Inc., OFI SteelPath, Inc. and OFI Advisors, LLC, announced that it had entered into an agreement whereby Invesco Ltd., a global investment management company would acquire OppenheimerFunds and its subsidiaries (together, “OppenheimerFunds”). After the close of business on May 24, 2019 Invesco Ltd. completed the acquisition of OppenheimerFunds. This Fund was included in that acquisition and as of that date, became part of the Invesco family of funds. Please visit invesco.com for more information or call Invesco’s Client Services team at 800-959-4246.
Table of Contents
Class A Shares
AVERAGE ANNUAL TOTAL RETURNS AT 8/31/19
| | | | | | |
| | | Class A Shares of the Fund | | |
| | | Without Sales Charge | | With Sales Charge | | Bloomberg Barclays
Municipal 1-Year Index |
| 3-Month | | 1.03% | | -1.60% | | 0.78% |
| 1-Year | | 3.32 | | 0.62 | | 2.65 |
| 5-Year | | 1.87 | | 1.33 | | 1.13 |
| Since Inception (12/6/10) | | 2.29 | | 2.00 | | 1.08 |
Performance quoted is past performance and cannot guarantee comparable future results; current performance may be lower or higher.Visit invesco.com for the most recent month-end performance. Performance figures reflect reinvested distributions and changes in net asset value (NAV). Investment return and principal value will vary so that you may have a gain or a loss when you sell shares. Fund returns include changes in share price, reinvested distributions and a 2.50% maximum applicable sales charge except where “without sales charge” is indicated. Returns for periods of less than one year are not annualized. As the result of a reorganization after the close of business on May 24, 2019, the returns of the Fund for periods on or prior to May 24, 2019 reflect performance of the Oppenheimer predecessor fund. Share class returns will differ from those of the predecessor fund because they have different expenses. Returns do not consider capital gains or income taxes on an individual’s investment. See Fund prospectus and summary prospectus for more information on share classes, sales charges and new fee agreements, if any. Fund literature is available at invesco.com.
3 INVESCO OPPENHEIMER SHORT TERM MUNICIPAL FUND
Fund Performance Discussion
The Fund’s Class A shares (without sales charge) returned 3.32% during the reporting period. In comparison, the Fund’s Class A shares outperformed the Bloomberg Barclays Municipal 1-Year Bond Index (the “Index”), which returned 2.65%. Please note that the fiscal year-end for the fund has changed from May 31 to August 31. The below discussion of the Fund’s performance as of August 31 2019.
MARKET OVERVIEW
The broad municipal bond market experienced positive returns for the fifth consecutive year in 2018, and performance remained strong throughout this fiscal year. Investment grade municipal bonds returned 8.72% and high yield municipal bonds returned 9.81% during the fiscal year.1 Performance was particularly strong during the first eight months of 2019, with investment grade municipals returning 7.61% and high yield municipals returning 9.91%.1
The fiscal year was characterized by supportive technical conditions (supply and demand balances) as new issuance of municipal bonds totaled $351 billion — down nearly 15% from the previous fiscal year.2 Flows into the municipal bond asset class were positive for the last 34 weeks of the fiscal year.3 A consistently positive flow pattern, coupled with continued limited supply, resulted in strong performance across the municipal bond market. Fund flows totaled $52.1 billion from September 2018 through August 2019.3
For the fiscal year, the high yield municipal bond market outperformed the investment grade bond segment, led by improved price discovery on Puerto Rico bonds as a result of developments in the commonwealth’s debt restructuring, as well as strong performance of high yield general obligation securities.
Municipal bonds withstood considerable headwinds during the fiscal year, including interest rate movements that had the 10-year US Treasury yield breaching 2.00% in July 2019.4 Additionally, the US government shutdown, which occurred midway through the fiscal year and lasted 35 days, along with ongoing US-China trade negotiations and Brexit developments, created a challenging market environment. Both investment grade municipals and high yield municipals posted negative returns for the months of September and October 2018. Worsening market conditions exposed the municipal bond market to more sensitivity relating to a sell-off in US Treasuries in September. Despite these challenges, the municipal bond market performed positively for the fiscal year as technical conditions continued to provide tailwinds.
4 INVESCO OPPENHEIMER SHORT TERM MUNICIPAL FUND
Concerns about future interest rate hikes led to an increased demand for US Treasuries and investment grade municipal bonds alike, and yields continued to fall as high yield securities rallied. The yield curve for 30-year, AAA-rated municipal bonds continued to flatten as trade tensions between the US and China increased worries about inflationary pressures.
During the fiscal year, the US Federal Reserve (the Fed) raised the federal funds rate two times in September and December 2018 before lowering it in July 2019.5 The two rate hikes, the eighth and ninth since December 2008, were anticipated and reflected increased confidence in the US economy amid low unemployment, relatively stable inflation and overall robust economic growth. This expansionary monetary policy significantly flattened the US Treasury yield curve with a slight inversion on the short end occurring in December 2018.
However, the Fed’s dovish stance at the beginning of calendar year 2019 took the market by surprise, leading economists to change their predictions from two interest rate increases in 2019, to just one. Despite favorable growth and labor trends, the Fed ultimately reversed course and lowered the federal funds rate in July, citing uncertainty about the global economic outlook. The US Treasury curve was inverted at fiscal year-end with the yield on the 2-year US Treasury note exceeding the 10-year note.4 Economist views were mixed as to whether this inversion, the
first since December 2005, signaled a possible recession.
As anticipated, US midterm election results had a positive impact on municipal securities as perceived threats to municipal tax exemptions, further tax reform and changes to the Affordable Care Act were greatly reduced. News of a possible ban on flavored e-cigarettes and menthol cigarettes made headlines, which caused a short-lived decline in the valuations of below investment grade tobacco settlement bonds. Meanwhile, year-end demand for yield and coupon payments caused the asset class to end 2018 on a strong note. Investors affected by the Tax Cuts and Jobs Acts of 2017, which instituted a $10,000 cap on state and local tax deductions, poured a record $18.9 billion into municipal bond funds in the first eight weeks of calendar year 2019, the most recorded over that period in at least 13 years.3
At the close of the fiscal year, we believed municipal fundamentals remained strong and viewed the ongoing impact of the Tax Cut and Jobs Act as a potential market factor. As a result, we believe demand for municipal bond investments could remain strong as retail investors continue to seek tax-exempt income.
Over the fiscal year, security selection in many sectors - including the general obligation (G.O.), hospital/healthcare sectors, and municipal leases, the Fund’s largest, second largest, and eighth-largest sectors, respectively - significantly contributed to the Fund’s performance. The gas and water
5 INVESCO OPPENHEIMER SHORT TERM MUNICIPAL FUND
utilities sectors and the education sector, among other sectors, were also strong contributors to the Fund’s performance. The Fund’s holdings in the single-family housing and marine/aviation facilities sectors produced the strongest single-sector returns this fiscal year. While none of the Fund’s sectors detracted from performance, the Fund’s holdings in some sectors - including the airlines, student housing, and not-for-profit organizations sectors (representing less than one-tenth of 1% of assets at fiscal year-end) - were underperformers relative to the Bloomberg Barclays Municipal 1-Year Index.
We wish to remind you that the Fund is subject to interest rate risk, meaning when interest rates rise, the value of fixed income securities tends to fall. The degree to which the value of fixed income securities may decline due to rising interest rates may vary depending on the speed and magnitude of the increase in interest rates, as well as individual security characteristics, such as price, maturity, duration and coupon and market forces, such as supply and demand for similar securities. We are monitoring interest rates, as well as the market, economic and geopolitical factors that may impact the direction, speed and magnitude of changes to interest rates across the maturity spectrum, including the potential impact of monetary policy changes by the Fed and certain foreign central banks. If interest rates rise, markets may experience increased volatility, which may affect the value and/or liquidity of certain of the Fund’s investments.
Oppenheimer Short Term Municipal Fund (the predecessor fund) was renamed Invesco Oppenheimer Short Term Municipal Fund after the close of business on May 24, 2019, when Invesco’s acquisition of OppenheimerFunds was finalized. Prior to the commencement of the Fund’s operations, Charlie Pulire managed the predecessor fund since 2010. Effective June 21, 2019, the portfolio management team of this fund was changed to Mr. Pulire (lead manager) and Mark Paris.
Thank you for investing in Invesco
Oppenheimer Short Term Municipal Fund and for sharing our long-term investment horizon.
1 Source: FactSet Research Systems Inc
2 Source: The Bond Buyer
3 Source: Strategic Insight
4 Source: US Department of the Treasury
5 Source: US Federal Reserve
The views and opinions expressed in management’s discussion of Fund performance are those of Invesco Advisers, Inc. These views and opinions are subject to change at any time based on factors such as market and economic conditions. These views and opinions may not be relied upon as investment advice or recommendations, or as an offer for a particular security. The information is not a complete analysis of every aspect of any market, country, industry, security or the Fund. Statements of fact are from sources considered reliable, but Invesco Advisers, Inc. makes no representation or warranty as to their completeness or accuracy. Although historical performance is no guarantee of future results, these insights may help you understand our investment
6 INVESCO OPPENHEIMER SHORT TERM MUNICIPAL FUND
Top Holdings and Allocations
TOP TEN CATEGORIES
| | | | |
| General Obligation | | | 16.3 | % |
| Hospital/Healthcare | | | 10.5 | |
| Housing - Multi-Family | | | 6.6 | |
| Diversified Financial Services | | | 5.9 | |
| Water Utilities | | | 5.7 | |
| Gas Utilities | | | 5.6 | |
| Electric Utilities | | | 5.2 | |
| Municipal Leases | | | 4.9 | |
| Education | | | 4.4 | |
| Sales Tax Revenue | | | 3.7 | |
Portfolio holdings and allocations are subject to change. Percentages are as of August 31, 2019 and are based on total assets.
CREDIT ALLOCATION
| | | | | | |
| | | NRSRO-
Rated | | Adviser-
Rated | | Total |
AAA | | 9.4% | | 1.2% | | 10.6% |
AA | | 39.0 | | 0.7 | | 39.7 |
A | | 33.6 | | 1.6 | | 35.2 |
BBB | | 7.2 | | 3.7 | | 10.9 |
BB or lower | | 2.5 | | 1.1 | | 3.6 |
Total | | 91.7% | | 8.3% | | 100.0% |
The percentages above are based on the market value of the securities as of August 31, 2019 and are subject to change. Invesco Advisers, Inc. (the Adviser) determines the credit allocation of the Fund’s assets using ratings by nationally recognized statistical rating organizations (NRSROs), such as S&P Global Ratings (S&P). For any security rated by an NRSRO other than S&P, the Adviser converts that security’s rating to the equivalent S&P rating. If two or more NSROs have assigned a rating to a security, the highest rating is used. For securities not rated by an NRSRO, the Adviser uses its own credit analysis to assign ratings in categories similar to those of S&P. The use of similar categories is not an indication that the Adviser’s credit analysis process is consistent or comparable with any NRSRO’s process were that NRSRO to rate the same security.
For the purposes of this Credit Allocation table, securities rated within the NRSROs’ four highest categories—AAA, AA, A and BBB—are investment-grade securities. For further details, please consult the Fund’s prospectus or Statement of Additional Information.
7 INVESCO OPPENHEIMER SHORT TERM MUNICIPAL FUND
Performance
AVERAGE ANNUAL TOTAL RETURNS WITHOUT SALES CHARGE AS OF 8/31/19
| | | | | | | | | | | | | | | | | | | | |
| | | Inception | | | | | | | | | | | | Since | |
| | | Date | | | 3-Month | | | 1-Year | | | 5-Year | | | Inception | |
| Class A (ORSTX) | | | 12/6/10 | | | | 1.03 | % | | | 3.32 | % | | | 1.87 | % | | | 2.29 | % |
| Class C (ORSCX) | | | 12/6/10 | | | | 0.84 | | | | 2.55 | | | | 1.10 | | | | 1.52 | |
| Class Y (ORSYX) | | | 12/6/10 | | | | 1.09 | | | | 3.58 | | | | 2.12 | | | | 2.54 | |
| Class R6 (STMUX)* | | | 5/24/19 | | | | 1.10 | | | | 3.38 | | | | 1.88 | | | | 2.30 | |
AVERAGE ANNUAL TOTAL RETURNS WITH SALES CHARGE AS OF 8/31/19
| | | | | | | | | | | | | | | | | | | | |
| | | Inception | | | | | | | | | | | | Since | |
| | | Date | | | 3-Month | | | 1-Year | | | 5-Year | | | Inception | |
| Class A (ORSTX) | | | 12/6/10 | | | | -1.60 | % | | | 0.62 | % | | | 1.33 | % | | | 2.00 | % |
| Class C (ORSCX) | | | 12/6/10 | | | | -0.16 | | | | 1.55 | | | | 1.10 | | | | 1.52 | |
| Class Y (ORSYX) | | | 12/6/10 | | | | 1.09 | | | | 3.58 | | | | 2.12 | | | | 2.54 | |
| Class R6 (STMUX)* | | | 5/24/19 | | | | 1.10 | | | | 3.38 | | | | 1.88 | | | | 2.30 | |
*Class R6 shares’ performance shown prior to the inception date after the close of business on May 24, 2019 is that of the predecessor fund’s Class A shares at net asset value (NAV) and includes the 12b-1 fees applicable to Class A shares. Class A shares’ performance reflects any applicable fee waivers and/or expense reimbursements.
8 INVESCO OPPENHEIMER SHORT TERM MUNICIPAL FUND
COMPARISON OF CHANGE IN VALUE OF $10,000 HYPOTHETICAL INVESTMENTS IN:
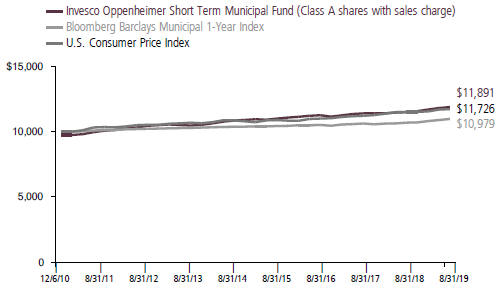
Performance quoted is past performance and cannot guarantee comparable future results; current performance may be lower or higher.Visit invesco.com for the most recent month-end performance. Performance figures reflect reinvested distributions and changes in net asset value (NAV). Investment return and principal value will vary so that you may have a gain or a loss when you sell shares. Performance shown at NAV does not include the applicable front-end sales charge, which would have reduced the performance. The current maximum initial sales charge for Class A shares is 2.50%, and the contingent deferred sales charge for Class C shares is 1% for the 1-year period. Class Y shares have no sales charge; therefore, performance is at NAV. Effective after the close of business on May 24, 2019, Class A, Class C and Class Y shares of the predecessor fund were reorganized into Class A, Class C and Class Y shares, respectively, of the Fund. Class R6 shares’ performance shown prior to the inception date is that of the predecessor fund’s Class A shares at NAV and includes the 12b-1 fees applicable to Class A shares. Class A shares’ performance reflects any applicable fee waivers and/or expense reimbursements. Returns shown for Class A, Class C, Class R6 and Class Y shares are blended returns of the predecessor fund and the Fund. Share class returns will differ from those of the predecessor fund because of different expenses. Returns for periods of less than one year are not annualized. See Fund prospectuses and summary prospectuses for more information on share classes, sales charges and new fee agreements, if any. Fund literature is available at invesco.com.
The Fund’s performance is compared to the performance of the Bloomberg Barclays Municipal Bond 1-Year (1-2) Index, which consists of investment-grade municipal bonds having remaining maturities of 1 to 2 years. The Fund’s performance is also compared to the Consumer Price Index, a non-securities index that measures changes in the inflation rate. The Indices are unmanaged, and an investment cannot be made into an index. While index comparisons may be useful to provide a benchmark for the Fund’s performance, it must be noted that the Fund’s investments are not limited to the investments comprising the indices. Index performance includes reinvestment of income, but does not reflect transaction
9 INVESCO OPPENHEIMER SHORT TERM MUNICIPAL FUND
costs, fees, expenses or taxes. Index performance is shown for illustrative purposes only as a benchmark for the Fund’s performance and does not predict or depict performance of the Fund. The Fund’s performance reflects the effects of the Fund’s business and operating expenses.
Before investing, investors should carefully read the prospectus and/or summary prospectus and carefully consider the investment objectives, risks, charges and expenses. For this and more complete information about the fund(s), investors should ask their advisors for a prospectus/summary prospectus or visit invesco. com/fundprospectus.
Shares of Invesco funds are not deposits or obligations of any bank, are not guaranteed by any bank, are not insured by the FDIC or any other agency, and involve investment risks, including the possible loss of the principal amount invested.
10 INVESCO OPPENHEIMER SHORT TERM MUNICIPAL FUND
Fund Expenses
Fund Expenses. As a shareholder of the Fund, you incur two types of costs: (1) transaction costs, which may include sales charges (loads) on purchase payments and/or contingent deferred sales charges on redemptions; and (2) ongoing costs, including management fees; distribution and service fees; and other Fund expenses. These examples are intended to help you understand your ongoing costs (in dollars) of investing in the Fund and to compare these costs with the ongoing costs of investing in other mutual funds.
The examples are based on an investment of $1,000.00 invested at the beginning of the period and held for the entire 6-month period ended August 31, 2019.
Actual Expenses. The first section of the table provides information about actual account values and actual expenses. You may use the information in this section for the class of shares you hold, together with the amount you invested, to estimate the expense that you paid over the period. Simply divide your account value by $1,000.00 (for example, an $8,600.00 account value divided by $1,000.00 = 8.60), then multiply the result by the number in the first section under the heading entitled “Expenses Paid During 6 Months Ended August 31, 2019” to estimate the expenses you paid on your account during this period.
Hypothetical Example for Comparison Purposes.The second section of the table provides information about hypothetical account values and hypothetical expenses based on the Fund’s actual expense ratio for each class of shares, and an assumed rate of return of 5% per year for each class before expenses, which is not the Fund’s actual return. The hypothetical account values and expenses may not be used to estimate the actual ending account balance or expenses you paid for the period. You may use this information to compare the ongoing costs of investing in the Fund and other funds. To do so, compare this 5% hypothetical example for the class of shares you hold with the 5% hypothetical examples that appear in the shareholder reports of the other funds.
Please note that the expenses shown in the table are meant to highlight your ongoing costs only and do not reflect any transactional costs, such as front-end or contingent deferred sales charges (loads). Therefore, the “hypothetical” section of the table is useful in comparing ongoing costs only, and will not help you determine the relative total costs of owning different funds. In addition, if these transactional costs were included, your costs would have been higher.
11 INVESCO OPPENHEIMER SHORT TERM MUNICIPAL FUND
| | | | | | | | | | | | |
| Actual | | Beginning
Account Value
March 1, 2019 | | | Ending Account Value
August 31, 2019 | | | Expenses
Paid During
6 Months Ended
August 31, 20191,2 | |
| Class A | | $ | 1,000.00 | | | $ | 1,020.30 | | | $ | 4.18 | |
| Class C | | | 1,000.00 | | | | 1,016.40 | | | | 8.01 | |
| Class Y | | | 1,000.00 | | | | 1,021.50 | | | | 2.91 | |
| Class R6 | | | 1,000.00 | | | | 1,020.90 | | | | 1.37 | |
| | | |
| Hypothetical | | | | | | | | | | | | |
| (5% return before expenses) | | | | | | | | | | | | |
| Class A | | | 1,000.00 | | | | 1,021.07 | | | | 4.19 | |
| Class C | | | 1,000.00 | | | | 1,017.29 | | | | 8.01 | |
| Class Y | | | 1,000.00 | | | | 1,022.33 | | | | 2.91 | |
| Class R6 | | | 1,000.00 | | | | 1,022.68 | | | | 2.55 | |
1. Actual expenses paid for Class A, C and Y are equal to the Fund’s annualized expense ratio for that class, multiplied by the average account value over the period, multiplied by 184/365 (to reflect the one-half year period). Actual expenses paid for Class R5 are equal to the Fund’s annualized expense ratio for that class, multiplied by the average account value over the period, multiplied by 99/365 to reflect the period from after the close of business on May 24, 2019 (inception of offering) to August 31, 2019.
2.Hypothetical expenses paid for all classes are equal to the Fund’s annualized expense ratio for that class, multiplied by the average account value over the period, multiplied by 184/365 (to reflect the one-half year period).
Those annualized expense ratios, excluding indirect expenses from affiliated funds, based on the 6-month period ended August 31, 2019 for Classes A, C and Y and for the period from after the close of business on May 24, 2019 (inception of offering) to August 31, 2019 for Class R5 are as follows:
| | | | |
| Class | | Expense Ratios |
| Class A | | | 0.82 | % |
| Class C | | | 1.57 | |
| Class Y | | | 0.57 | |
| Class R6 | | | 0.50 | |
12 INVESCO OPPENHEIMER SHORT TERM MUNICIPAL FUND
SCHEDULE OF INVESTMENTSAugust 31, 2019
| | | | | | | | | | | | | | | | | | |
Principal
Amount | | | | Coupon | | | Maturity | | | Effective
Maturity* | | | Value | |
| Municipal Bonds and Notes—99.2% | | | | | | | | | | | | | | | | |
| Alabama—0.2% | | | | | | | | | | | | | | | | |
| $645,000 | | AL Health Care Authority for Baptist Health of Alabama | | | 5.000% | | | | 11/15/2021 | | | | 09/30/2019 | A | | $ | 647,103 | |
| 205,000 | | AL Public Hsg. Authority, Series B | | | 4.450 | | | | 01/01/2024 | | | | 09/30/2019 | A | | | 206,400 | |
| 10,000 | | Baldwin County, AL Public Building Authority | | | 4.375 | | | | 06/01/2028 | | | | 09/30/2019 | A | | | 10,025 | |
| 210,000 | | Bibb County, AL Limited Obligation School Warrant | | | 2.400 | | | | 05/01/2025 | | | | 05/01/2021 | A | | | 213,652 | |
| 20,000 | | Birmingham, AL GO | | | 4.250 | | | | 06/01/2024 | | | | 09/30/2019 | A | | | 20,044 | |
| 185,000 | | Daleville, AL Board of Education | | | 2.800 | | | | 10/01/2022 | | | | 09/30/2019 | A | | | 185,209 | |
| 10,000 | | Daphne, AL Utilities Board | | | 4.000 | | | | 06/01/2020 | | | | 09/30/2019 | A | | | 10,021 | |
| 420,000 | | Hueytown, AL GO Warrants | | | 2.600 | | | | 02/15/2026 | | | | 09/30/2019 | A | | | 420,361 | |
| 10,000 | | Lee County, AL Public Building Authority (DHR Building) | | | 4.250 | | | | 09/01/2022 | | | | 09/30/2019 | A | | | 10,024 | |
| 235,000 | | Mobile, AL Improvement District (McGowin Park) | | | 4.000 | | | | 08/01/2020 | | | | 05/20/2020 | B | | | 237,451 | |
| 260,000 | | Northport, AL GO | | | 4.000 | | | | 09/01/2021 | | | | 09/30/2019 | A | | | 260,530 | |
| 210,000 | | Pinson, AL GO Warrants | | | 2.750 | | | | 07/01/2026 | | | | 09/30/2019 | A | | | 210,220 | |
| 140,000 | | Thomasville, AL GO | | | 4.000 | | | | 02/15/2027 | | | | 09/30/2019 | A | | | 140,339 | |
| 50,000 | | University of Alabama (Huntsville) | | | 4.375 | | | | 07/01/2027 | | | | 09/30/2019 | A | | | 50,130 | |
| 200,000 | | Wetumpka, AL GO Warrants | | | 2.850 | | | | 11/01/2022 | | | | 10/14/2019 | A | | | 200,340 | |
| | | | | | | | | | | | | | | | | 2,821,849 | |
| | | | | | | | | | | | | | | | | | | |
| Alaska—0.6% | | | | | | | | | | | | | | | | |
| 7,160,000 | | Koyukuk, AK Revenue (Tanana Chiefs Conference Health Care Facility-Dena’ Nena’ Henash) | | | 7.000 | | | | 10/01/2023 | | | | 10/01/2019 | A | | | 7,191,146 | |
| 150,000 | | University of Alaska | | | 4.000 | | | | 10/01/2023 | | | | 10/01/2019 | A | | | 150,337 | |
| | | | | | | | | | | | | | | | | 7,341,483 | |
| | | | | | | | | | | | | | | | | | | |
| Arizona—1.5% | | | | | | | | | | | | | | | | |
| 10,000 | | AZ Board of Regents COP (University of Arizona & Arizona State University BioMed) | | | 4.375 | | | | 06/01/2024 | | | | 09/30/2019 | A | | | 10,024 | |
| 105,000 | | AZ Game & Fish Department (Administration Building) | | | 5.000 | | | | 07/01/2032 | | | | 09/30/2019 | A | | | 105,286 | |
| 2,650,000 | | Maricopa County, AZ Pollution Control (Southern California Edison Co.) | | | 5.000 | | | | 06/01/2035 | | | | 06/01/2020 | A | | | 2,711,135 | |
| 25,000 | | Maricopa County, AZ School District No. 7 (Wilson Elementary) | | | 4.500 | | | | 07/01/2024 | | | | 09/30/2019 | A | | | 25,056 | |
| 175,000 | | Pima County, AZ IDA (Excalibur Charter School)1 | | | 5.000 | | | | 09/01/2026 | | | | 06/09/2023 | B | | | 186,461 | |
| 295,000 | | Pima County, AZ IDA (Paideia Academies) | | | 4.125 | | | | 07/01/2029 | | | | 03/07/2024 | A | | | 300,959 | |
| 50,000 | | Pima County, AZ Street & Highway Revenue | | | 4.000 | | | | 07/01/2020 | | | | 09/30/2019 | A | | | 50,107 | |
| 275,000 | | Pinal County, AZ Unified School District No. 43 (Apache Junction) | | | 4.000 | | | | 07/01/2020 | | | | 01/01/2020 | A | | | 277,739 | |
13 INVESCO OPPENHEIMER SHORT TERM MUNICIPAL FUND
SCHEDULE OF INVESTMENTSContinued
| | | | | | | | | | | | | | | | | | |
Principal
Amount | | | | Coupon | | | Maturity | | | Effective
Maturity* | | | Value | |
| Arizona (Continued) | | | | | | | | | | | | | |
| $11,000,000 | | Public Hsg. Capital Fund Multi-State Revenue Trust II Floaters Series 2017-XG0138 Trust | | | 1.850%2 | | | | 07/01/2033 | | | | 09/06/2019 | A | | $ | 11,000,000 | |
| 240,000 | | Salt River, AZ Agricultural Improvement & Power District | | | 5.000 | | | | 01/01/2020 | | | | 09/30/2019 | A | | | 240,564 | |
| 1,880,000 | | Westpark, AZ Community Facilities District | | | 4.000 | | | | 07/15/2025 | | | | 02/22/2023 | B | | | 2,021,620 | |
| 875,000 | | Yavapai County, AZ IDA (Arizona Agribusiness and Equine Center)1 | | | 3.900 | | | | 09/01/2024 | | | | 04/11/2022 | B | | | 894,093 | |
| 1,135,000 | | Yavapai County, AZ IDA (Arizona Agribusiness and Equine Center) | | | 7.625 | | | | 03/01/2031 | | | | 02/09/2021 | D | | | 1,236,140 | |
| 10,000 | | Yuma, AZ Municipal Properties Corp. | | | 4.500 | | | | 07/01/2025 | | | | 09/30/2019 | A | | | 10,022 | |
| | | | | | | | | | | | | | | | | 19,069,206 | |
| | | | | | | | | | | | | | | | | | | |
| Arkansas—0.0% | | | | | | | | | | | | | | | | |
| 25,000 | | AR Devel. Finance Authority (Arkansas Enterprises for the Developmentally Disabled) | | | 5.250 | | | | 11/01/2019 | | | | 09/30/2019 | A | | | 25,076 | |
| | | | | | | | | | | | | | | | | | | |
| California—7.5% | | | | | | | | | | | | | | | | |
| 7,335,000 | | Alhambra, CA COP (Police Facilities)1 | | | 6.750 | | | | 09/01/2023 | | | | 10/13/2021 | B | | | 8,016,788 | |
| 5,000,000 | | Anaheim, CA Public Financing Authority | | | 6.000 | | | | 09/01/2024 | | | | 01/03/2023 | B | | | 5,804,300 | |
| 20,000 | | Barstow, CA Redevel. Agency | | | 4.700 | | | | 09/01/2022 | | | | 09/30/2019 | A | | | 20,057 | |
| 450,000 | | Beaumont, CA Financing Authority, Series B | | | 5.000 | | | | 09/01/2022 | | | | 09/01/2022 | | | | 493,965 | |
| 475,000 | | Beaumont, CA Financing Authority, Series B | | | 5.000 | | | | 09/01/2023 | | | | 09/01/2023 | | | | 535,244 | |
| 25,000 | | CA County Tobacco Securitization Agency (TASC) | | | 5.750 | | | | 06/01/2029 | | | | 09/30/2019 | A | | | 25,251 | |
| 5,250,000 | | CA Educational Facilities Authority (Claremont Graduate University) Floaters Series 2017-7007 Trust | | | 1.750 2 | | | | 03/01/2042 | | | | 09/12/2019 | A | | | 5,250,000 | |
| 40,000 | | CA Industry Public Facilities Authority | | | 5.000 | | | | 01/01/2025 | | | | 01/01/2020 | A | | | 41,338 | |
| 570,000 | | CA Pollution Control Financing Authority (Calplant I) | | | 7.000 | | | | 07/01/2022 | | | | 10/09/2021 | B | | | 587,584 | |
| 30,000 | | CA Public Works (California Community Colleges) | | | 4.250 | | | | 04/01/2020 | | | | 09/30/2019 | A | | | 30,071 | |
| 170,000 | | CA Public Works (California Community Colleges) | | | 4.500 | | | | 10/01/2026 | | | | 09/30/2019 | A | | | 170,411 | |
| 50,000 | | CA Public Works (California Community Colleges) | | | 5.250 | | | | 09/01/2019 | | | | 09/01/2019 | | | | 50,000 | |
| 25,000 | | CA Public Works (Dept. of Corrections) | | | 5.500 | | | | 10/01/2019 | | | | 10/01/2019 | | | | 25,082 | |
| 200,000 | | CA Statewide CDA (588 Charleston Project) | | | 5.000 | | | | 11/01/2019 | | | | 11/01/2019 | | | | 201,056 | |
14 INVESCO OPPENHEIMER SHORT TERM MUNICIPAL FUND
| | | | | | | | | | | | | | | | | | |
Principal
Amount | | | | Coupon | | | Maturity | | | Effective
Maturity* | | | Value | |
| California (Continued) | | | | | | | | | | | | | |
| $1,275,000 | | CA Statewide CDA (Bakersfield Reassessment District)1 | | | 5.000% | | | | 09/02/2022 | | | | 01/14/2021 | B | | $ | 1,373,379 | |
| 25,000,000 | | CA Statewide CDA (Harbor Park Apartments) SPEARS | | | 1.700 2 | | | | 04/01/2052 | | | | 09/11/2019 | A | | | 25,000,000 | |
| 35,000 | | CA Water Resource Devel. GO, Series Q | | | 4.750 | | | | 03/01/2021 | | | | 09/30/2019 | A | | | 35,097 | |
| 225,000 | | Castaic, CA Union School District | | | 2.859 3 | | | | 11/01/2019 | | | | 11/01/2019 | | | | 224,516 | |
| 5,000 | | Ceres, CA Redevel. Agency Tax Allocation | | | 4.250 | | | | 11/01/2024 | | | | 09/30/2019 | A | | | 5,012 | |
| 5,000 | | Diablo, CA Water District | | | 4.000 | | | | 01/01/2023 | | | | 09/30/2019 | A | | | 5,011 | |
| 10,000,000 | | El Centro, CA Financing Authority (El Centro Regional Medical Center) Tender Option Bond Series 2018-XF1072 Trust | | | 1.580 2 | | | | 07/01/2058 | | | | 09/11/2019 | A | | | 10,000,000 | |
| 5,000 | | Fresno, CA Sewer System | | | 5.250 | | | | 09/01/2019 | | | | 09/01/2019 | | | | 5,000 | |
| 4,545,000 | | Fullerton, CA Public Financing Authority | | | 5.000 | | | | 09/01/2024 | | | | 03/01/2020 | A | | | 4,635,764 | |
| 1,200,000 | | Howell Mountain, CA Elementary School District | | | 3.418 3 | | | | 08/01/2027 | | | | 09/10/2024 | B | | | 971,352 | |
| 580,000 | | Imperial, CA PFA (Wastewater Facility) | | | 5.000 | | | | 10/15/2019 | | | | 10/15/2019 | | | | 582,743 | |
| 610,000 | | Imperial, CA PFA (Wastewater Facility) | | | 5.000 | | | | 10/15/2020 | | | | 10/15/2020 | | | | 638,139 | |
| 845,000 | | Imperial, CA PFA (Water Facility) | | | 5.000 | | | | 10/15/2019 | | | | 10/15/2019 | | | | 848,997 | |
| 885,000 | | Imperial, CA PFA (Water Facility) | | | 5.000 | | | | 10/15/2020 | | | | 10/15/2020 | | | | 925,825 | |
| 1,000,000 | | Inglewood, CA Unified School District | | | 5.250 | | | | 10/15/2021 | | | | 04/13/2021 | B | | | 1,059,650 | |
| 495,000 | | Jefferson, CA Union High School District | | | 6.250 | | | | 08/01/2020 | | | | 03/02/2020 | B | | | 508,063 | |
| 10,000 | | Lodi, CA Wastewater System | | | 4.750 | | | | 10/01/2024 | | | | 09/30/2019 | A | | | 10,028 | |
| 25,000 | | Modesto, CA COP (Golf Course) | | | 5.000 | | | | 11/01/2023 | | | | 12/06/2021 | B | | | 26,119 | |
| 4,000,000 | | Montebello, CA Unified School District Floaters Series 2017-XF0576 Trust | | | 1.700 2 | | | | 08/01/2046 | | | | 09/06/2019 | A | | | 4,000,000 | |
| 615,000 | | Natomas, CA Unified School District1 | | | 5.950 | | | | 09/01/2021 | | | | 09/10/2020 | B | | | 642,570 | |
| 545,000 | | Northern, CA Inyo County Local Hospital District | | | 6.000 | | | | 12/01/2021 | | | | 08/09/2020 | A | | | 561,966 | |
| 40,000 | | Ontario, CA Improvement Bond Act 1915 Assessment District No. 1081 | | | 7.500 | | | | 09/02/2020 | | | | 12/05/2019 | A | | | 41,289 | |
| 700,000 | | Palomar Pomerado, CA Health Care District COP | | | 5.500 | | | | 11/01/2019 | | | | 11/01/2019 | | | | 704,949 | |
| 665,000 | | Riverside County, CA Community Facilities District (Lake Hills Crest) | | | 5.000 | | | | 09/01/2019 | | | | 09/01/2019 | | | | 665,000 | |
| 695,000 | | Riverside County, CA Community Facilities District (Lake Hills Crest) | | | 5.000 | | | | 09/01/2020 | | | | 09/01/2020 | | | | 718,505 | |
15 INVESCO OPPENHEIMER SHORT TERM MUNICIPAL FUND
SCHEDULE OF INVESTMENTSContinued
| | | | | | | | | | | | | | | | | | |
Principal
Amount | | | | Coupon | | | Maturity | | | Effective
Maturity* | | | Value | |
| California (Continued) | | | | | | | | | | | | | |
| $120,000 | | Riverside County, CA Improvement Bond Act 1915 (Rivercrest Assessment District No. 168) | | | 5.000% | | | | 09/02/2019 | | | | 09/02/2019 | | | $ | 120,000 | |
| 125,000 | | Riverside County, CA Improvement Bond Act 1915 (Rivercrest Assessment District No. 168) | | | 5.000 | | | | 09/02/2020 | | | | 09/02/2020 | | | | 128,464 | |
| 190,000 | | Riverside County, CA Redevel. Agency (215 Corridor Redevel.) | | | 6.500 | | | | 12/01/2021 | | | | 12/16/2020 | B | | | 205,709 | |
| 20,000 | | Rocklin, CA Unified School District Community Facilities District No. 1 | | | 4.125 | | | | 09/01/2019 | | | | 09/01/2019 | | | | 20,000 | |
| 20,000 | | Rocklin, CA Unified School District Community Facilities District No. 1 | | | 4.125 | | | | 09/01/2019 | | | | 09/01/2019 | | | | 20,000 | |
| 1,915,000 | | Sacramento, CA City Financing Authority, Series A | | | 5.400 | | | | 11/01/2020 | | | | 05/07/2020 | B | | | 1,965,901 | |
| 2,605,000 | | Sacramento, CA City Financing Authority, Series B | | | 5.400 | | | | 11/01/2020 | | | | 05/07/2020 | B | | | 2,674,241 | |
| 530,000 | | San Diego, CA Community Facilities District No. 3 Special Tax | | | 5.000 | | | | 09/01/2021 | | | | 09/01/2021 | | | | 563,676 | |
| 100,000 | | San Juan Capistrano, CA GO | | | 3.000 | | | | 08/01/2021 | | | | 09/30/2019 | A | | | 100,151 | |
| 300,000 | | Santa Clarita, CA Community Facilities District (Valencia Town Center) | | | 5.000 | | | | 11/15/2019 | | | | 11/15/2019 | | | | 302,106 | |
| 605,000 | | Santa Clarita, CA Community Facilities District (Valencia Town Center) | | | 5.000 | | | | 11/15/2020 | | | | 11/15/2020 | | | | 630,979 | |
| 365,000 | | Santa Clarita, CA Community Facilities District (Valencia Town Center) | | | 5.000 | | | | 11/15/2021 | | | | 11/15/2021 | | | | 392,915 | |
| 255,000 | | Saugus, CA Union School District Community Facilities District No. 2002-1 | | | 5.000 | | | | 09/01/2021 | | | | 09/01/2021 | | | | 272,031 | |
| 10,000 | | Southern CA Logistics Airport Authority | | | 4.125 | | | | 12/01/2020 | | | | 09/30/2019 | A | | | 10,089 | |
| 135,000 | | Southern CA Tobacco Securitization Authority | | | 4.750 | | | | 06/01/2025 | | | | 09/15/2019 | A | | | 135,640 | |
| 600,000 | | Vernon, CA Electric System | | | 5.125 | | | | 08/01/2021 | | | | 09/30/2019 | A | | | 602,034 | |
| 15,000 | | Westlands, CA Water District | | | 4.500 | | | | 09/01/2023 | | | | 09/30/2019 | A | | | 15,038 | |
| 5,000 | | Westlands, CA Water District | | | 4.500 | | | | 09/01/2024 | | | | 09/30/2019 | A | | | 5,013 | |
| 250,000 | | Westlands, CA Water District | | | 5.000 | | | | 09/01/2021 | | | | 09/01/2021 | | | | 269,613 | |
| 250,000 | | Westlands, CA Water District | | | 5.000 | | | | 09/01/2022 | | | | 09/01/2022 | | | | 279,260 | |
| 10,185,000 | | Whittier, CA Health Facilities (PIH/IC/IMC/DRMCH Obligated Group) | | | 4.900 | | | | 06/01/2026 | | | | 04/27/2021 | A | | | 10,776,341 | |
| | | | | | | | | | | | | | | | | 94,929,322 | |
| | | | | | | | | | | | | | | | | | | |
| Colorado—1.0% | | | | | | | | | | | | | | | | |
| 65,000 | | Arkansas River, CO Power Authority | | | 5.000 | | | | 10/01/2020 | | | | 04/07/2020 | B | | | 66,374 | |
16 INVESCO OPPENHEIMER SHORT TERM MUNICIPAL FUND
| | | | | | | | | | | | | | | | | | |
Principal
Amount | | | | Coupon | | | Maturity | | | Effective
Maturity* | | | Value | |
| Colorado (Continued) | | | | | | | | | | | | | |
| $20,000 | | Arvada, CO Water Enterprise | | | 4.000% | | | | 11/01/2019 | | | | 09/30/2019 | A | | $ | 20,043 | |
| 235,000 | | Aurora, CO GO COP | | | 5.000 | | | | 12/01/2027 | | | | 12/01/2019 | A | | | 237,160 | |
| 9,100,000 | | CO Health Facilities Authority (National Jewish Medical & Research Center) | | | 1.460 2 | | | | 01/01/2035 | | | | 09/06/2019 | A | | | 9,100,000 | |
| 1,855,000 | | Public Authority for CO (Natural Gas Energy) | | | 6.125 | | | | 11/15/2023 | | | | 01/21/2022 | B | | | 2,055,915 | |
| 15,000 | | Pueblo County, CO GO COP | | | 4.500 | | | | 12/01/2024 | | | | 09/30/2019 | A | | | 15,037 | |
| 1,435,000 | | Southglenn, CO Metropolitan District | | | 3.000 | | | | 12/01/2021 | | | | 12/16/2020 | B | | | 1,442,347 | |
| 5,000 | | Weld County, CO School District RE002 | | | 5.000 | | | | 12/01/2021 | | | | 09/30/2019 | A | | | 5,014 | |
| | | | | | | | | | | | | | | | | 12,941,890 | |
| | | | | | | | | | | | | | | | | | | |
| Connecticut—2.8% | | | | | | | | | | | | | | | | |
| 30,000 | | CT General Revenue (Clean Water & State Revolving Fund) | | | 5.000 | | | | 10/01/2020 | | | | 10/01/2019 | A | | | 30,089 | |
| 6,120,000 | | CT GO4 | | | 3.653 | | | | 06/01/2020 | | | | 06/01/2020 | | | | 6,196,439 | |
| 1,000,000 | | CT GO | | | 5.000 | | | | 06/01/2024 | | | | 06/01/2022 | A | | | 1,100,850 | |
| 11,915,000 | | CT GO | | | 5.000 | | | | 06/01/2025 | | | | 06/01/2022 | A | | | 13,130,449 | |
| 5,350,000 | | CT GO | | | 5.000 | | | | 11/01/2025 | | | | 11/01/2021 | A | | | 5,783,029 | |
| 5,050,000 | | CT GO | | | 5.000 | | | | 03/01/2027 | | | | 03/01/2023 | A | | | 5,682,614 | |
| 3,245,000 | | CT GO | | | 5.000 | | | | 11/01/2028 | | | | 11/01/2021 | A | | | 3,495,287 | |
| 200,000 | | CT H&EFA (Supported Child Care) | | | 3.000 | | | | 07/01/2020 | | | | 07/01/2020 | | | | 203,344 | |
| 100,000 | | Monroe, CT GO | | | 4.000 | | | | 05/01/2022 | | | | 09/30/2019 | A | | | 100,229 | |
| 65,000 | | Naugatuck, CT GO | | | 5.875 | | | | 02/15/2021 | | | | 08/16/2020 | B | | | 67,721 | |
| 25,000 | | New Haven, CT GO | | | 4.500 | | | | 08/01/2030 | | | | 08/01/2021 | A | | | 26,100 | |
| 5,000 | | Willington, CT GO | | | 4.000 | | | | 12/01/2023 | | | | 09/30/2019 | A | | | 5,012 | |
| | | | | | | | | | | | | | | | | 35,821,163 | |
| | | | | | | | | | | | | | | | | | | |
| District of Columbia—0.5% | | | | | | | | | | | | | | | | |
| 625,000 | | District of Columbia (Kipp Charter School) | | | 5.000 | | | | 07/01/2023 | | | | 01/21/2022 | B | | | 681,931 | |
| 50,000 | | District of Columbia Revenue | | | 5.000 | | | | 06/01/2032 | | | | 09/30/2019 | A | | | 50,142 | |
| 4,775,000 | | District of Columbia Water & Sewer Authority | | | 5.500 | | | | 10/01/2023 | | | | 11/09/2021 | B | | | 5,228,912 | |
| | | | | | | | | | | | | | | | | 5,960,985 | |
| | | | | | | | | | | | | | | | | | | |
| Florida—8.9% | | | | | | | | | | | | | | | | |
| 3,750,000 | | Atlantic Beach, FL Health Care Facilities (Naval Continuing Care Retirement Foundation) | | | 3.000 | | | | 11/15/2023 | | | | 05/15/2020 | A | | | 3,782,212 | |
| 150,000 | | Belle Isle, FL Charter School (Cornerstone Charter Academy & Cornerstone Charter High School Obligated Group) | | | 5.500 | | | | 10/01/2022 | | | | 04/27/2021 | B | | | 156,883 | |
| 560,000 | | Bonaventure, FL Devel. District Special Assessment | | | 5.125 | | | | 11/01/2022 | | | | 09/30/2019 | A | | | 561,322 | |
17 INVESCO OPPENHEIMER SHORT TERM MUNICIPAL FUND
SCHEDULE OF INVESTMENTSContinued
| | | | | | | | | | | | | | | | | | |
Principal
Amount | | | | Coupon | | | Maturity | | | Effective
Maturity* | | | Value | |
| Florida (Continued) | | | | | | | | | | | | | |
| $50,000 | | Dade County, FL HFA (Baptist Hospital of Miami) | | | 5.750% | | | | 05/01/2021 | | | | 11/05/2020 | B | | $ | 52,657 | |
| 55,000 | | FL Capital Projects Financing Authority (Florida Universities Student Hsg.)1 | | | 5.125 | | | | 10/01/2021 | | | | 09/30/2019 | A | | | 55,079 | |
| 1,240,000 | | FL Capital Trust Agency (Gardens Apartments) | | | 3.500 | | | | 07/01/2025 | | | | 11/07/2022 | B | | | 1,059,729 | |
| 75,000 | | FL Dept. of Children & Families (South Florida Evaluation Treatment) | | | 5.000 | | | | 10/01/2021 | | | | 09/30/2019 | A | | | 75,219 | |
| 3,535,000 | | FL HFC (Homeowner Mtg.) | | | 3.650 | | | | 07/01/2041 | | | | 11/01/2020 | A | | | 3,703,867 | |
| 20,000 | | FL HFC (Homeowner Mtg.) | | | 4.500 | | | | 07/01/2024 | | | | 09/14/2019 | A | | | 20,018 | |
| 5,800,000 | | FL Mid-Bay Bridge Authority | | | 6.875 | | | | 10/01/2022 | | | | 10/01/2022 | | | | 6,336,674 | |
| 1,695,000 | | FL Municipal Power Agency | | | 5.000 | | | | 10/01/2024 | | | | 10/01/2022 | A | | | 1,883,535 | |
| 25,000 | | FL Water Pollution Control | | | 4.625 | | | | 01/15/2023 | | | | 09/30/2019 | A | | | 25,063 | |
| 33,930,000 | | Jea, FL Electric System | | | 1.370 2 | | | | 10/01/2034 | | | | 09/06/2019 | A | | | 33,930,000 | |
| 100,000 | | Jea, FL St. John’s River Power Park System | | | 4.000 | | | | 10/01/2032 | | | | 09/30/2019 | A | | | 100,240 | |
| 2,335,000 | | Jea, FL St. John’s River Power Park System | | | 5.000 | | | | 10/01/2021 | | | | 10/01/2019 | A | | | 2,341,515 | |
| 20,000,000 | | Jea, FL Water & Sewer System | | | 1.320 2 | | | | 10/01/2042 | | | | 09/06/2019 | A | | | 20,000,000 | |
| 15,000 | | Oldsmar, FL Water & Sewer | | | 5.120 3 | | | | 07/01/2020 | | | | 04/26/2020 | B | | | 14,271 | |
| 10,000 | | Palm Bay, FL Water & Sewer | | | 4.125 | | | | 07/01/2025 | | | | 09/30/2019 | A | | | 10,027 | |
| 23,360,000 | | Palm Beach County, FL Health Facilities Authority (Morselife) RIBS | | | 1.650 2 | | | | 10/01/2054 | | | | 09/10/2019 | A | | | 23,360,000 | |
| 5,000 | | Port St. Lucie, FL Special Assessment | | | 4.375 | | | | 07/01/2023 | | | | 09/30/2019 | A | | | 5,014 | |
| 100,000 | | Sarasota County, FL Public Hospital Board (Miles-Sarasota Memorial Hospital)4 | | | 0.000 | | | | 10/01/2021 | | | | 10/01/2021 | | | | 103,763 | |
| 275,000 | | Sarasota County, FL Public Hospital Board (Sarasota Memorial Hospital) | | | 5.250 | | | | 07/01/2024 | | | | 09/07/2023 | B | | | 313,461 | |
| 255,000 | | Seminole County, FL Water & Sewer | | | 6.000 | | | | 10/01/2019 | | | | 10/01/2019 | | | | 255,949 | |
| 570,000 | | South Lake County, FL Hospital District (South Lake Hospital) | | | 6.000 | | | | 04/01/2029 | | | | 09/30/2019 | A | | | 571,630 | |
| 4,540,000 | | St. Lucie County, FL Utility System | | | 6.000 | | | | 10/01/2020 | | | | 04/06/2020 | B | | | 4,666,121 | |
| 10,000 | | Sunrise Lakes, FL Phase 4 Recreation District | | | 4.000 | | | | 08/01/2022 | | | | 09/30/2019 | A | | | 10,024 | |
| 5,000 | | Sunrise Lakes, FL Phase 4 Recreation District | | | 4.000 | | | | 08/01/2023 | | | | 09/30/2019 | A | | | 5,012 | |
| 20,000 | | Sunrise Lakes, FL Phase 4 Recreation District | | | 4.125 | | | | 08/01/2024 | | | | 09/30/2019 | A | | | 20,052 | |
| 330,000 | | Tampa, FL Sports Authority (Tampa Bay Arena) | | | 5.750 | | | | 10/01/2020 | | | | 04/04/2020 | B | | | 338,719 | |
18 INVESCO OPPENHEIMER SHORT TERM MUNICIPAL FUND
| | | | | | | | | | | | | | | | | | |
Principal
Amount | | | | Coupon | | | Maturity | | | Effective
Maturity* | | | Value | |
| Florida (Continued) | | | | | | | | | | | | | |
| $8,930,000 | | Twin Creeks North, FL Community Devel. District Floaters Series 2017-XF1066 Trust | | | 1.650%2 | | | | 11/01/2047 | | | | 09/12/2019 | A | | $ | 8,930,000 | |
| 10,000 | | Winter Park, FL Electric | | | 4.500 | | | | 10/01/2024 | | | | 10/01/2019 | A | | | 10,027 | |
| | | | | | | | | | | | | | | | | 112,698,083 | |
| | | | | | | | | | | | | | | | | | | |
| Georgia—6.7% | | | | | | | | | | | | | | | | |
| 5,000 | | Atlanta & Fulton County, GA Recreation Authority | | | 4.125 | | | | 12/01/2022 | | | | 09/30/2019 | A | | | 5,011 | |
| 10,000 | | Cherokee County, GA Res Rec (Ball Ground Recycling) | | | 4.750 | | | | 07/01/2031 | | | | 09/30/2019 | A | | | 10,016 | |
| 265,000 | | Cobb-Marietta, GA Coliseum & Exhibit Hall Authority | | | 5.250 | | | | 10/01/2019 | | | | 10/01/2019 | | | | 265,784 | |
| 40,000 | | College Park, GA (Atlanta International Airport) | | | 4.375 | | | | 01/01/2026 | | | | 09/30/2019 | A | | | 40,102 | |
| 5,000 | | Columbus, GA Devel. Authority | | | 4.000 | | | | 11/01/2019 | | | | 09/30/2019 | A | | | 5,011 | |
| 30,000,000 | | GA Main Street Natural Gas [US0 001M+83] | | | 2.324 5 | | | | 08/01/2048 | | | | 09/01/2023 | A | | | 30,120,000 | |
| 36,595,000 | | GA Main Street Natural Gas | | | 4.000 2 | | | | 04/01/2048 | | | | 06/01/2023 | A | | | 40,115,805 | |
| 3,700,000 | | GA Main Street Natural Gas | | | 4.000 2 | | | | 08/01/2048 | | | | 09/01/2023 | A | | | 4,071,887 | |
| 65,000 | | GA Municipal Assoc. (Atlanta Detention Center) | | | 5.000 | | | | 12/01/2023 | | | | 09/30/2019 | A | | | 65,188 | |
| 990,000 | | GA Municipal Electric Authority4 | | | 2.840 | | | | 01/01/2020 | | | | 01/01/2020 | | | | 993,079 | |
| 1,305,000 | | GA Municipal Electric Authority4 | | | 2.840 | | | | 01/01/2021 | | | | 01/01/2021 | | | | 1,320,595 | |
| 575,000 | | GA Private Colleges & University Authority (Mercer University) | | | 5.000 | | | | 10/01/2020 | | | | 10/01/2020 | | | | 596,873 | |
| 280,000 | | GA Private Colleges & University Authority (Spelman College) | | | 5.250 | | | | 06/01/2021 | | | | 09/30/2019 | A | | | 280,832 | |
| 5,000 | | Gwinnett County, GA Hospital Authority | | | 4.500 | | | | 10/01/2024 | | | | 09/30/2019 | A | | | 5,012 | |
| 2,000,000 | | Houston County, GA Healthcare System | | | 5.000 | | | | 10/01/2031 | | | | 07/02/2023 | A | | | 2,229,220 | |
| 90,000 | | Metropolitan Atlanta, GA Rapid Transit Authority | | | 6.250 | | | | 07/01/2020 | | | | 07/01/2020 | | | | 93,573 | |
| 30,000 | | Milledgeville & Baldwin County, GA Devel. Authority (Georgia College & State University Foundation Property) | | | 4.500 | | | | 09/01/2025 | | | | 09/30/2019 | A | | | 30,048 | |
| 4,800,000 | | Morgan County, GA Hospital Authority (USDA Replacement Hospital) | | | 2.750 | | | | 09/01/2019 | | | | 09/01/2019 | | | | 4,800,000 | |
| 25,000 | | Valdosta, GA Hsg. Authority (Valdosta State University Student Hsg.) | | | 4.500 | | | | 08/01/2028 | | | | 09/30/2019 | A | | | 25,064 | |
| | | | | | | | | | | | | | | | | 85,073,100 | |
| | | | | | | | | | | | | | | | | | | |
| Idaho—0.0% | | | | | | | | | | | | | | | | |
| 85,000 | | University of Idaho | | | 5.250 2 | | | | 04/01/2041 | | | | 03/23/2021 | C | | | 89,894 | |
19 INVESCO OPPENHEIMER SHORT TERM MUNICIPAL FUND
SCHEDULE OF INVESTMENTSContinued
| | | | | | | | | | | | | | | | | | |
Principal
Amount | | | | Coupon | | | Maturity | | | Effective
Maturity* | | | Value | |
| Illinois—10.5% | | | | | | | | | | | | | |
| $210,000 | | Bellwood, IL GO | | | 5.000% | | | | 12/01/2026 | | | | 12/01/2026 | | | $ | 255,076 | |
| 205,000 | | Bolingbrook, IL Park District | | | 5.250 | | | | 01/01/2020 | | | | 01/01/2020 | | | | 207,640 | |
| 350,000 | | Bradley, IL (Bradley Commons) | | | 5.000 | | | | 01/01/2020 | | | | 01/01/2020 | | | | 352,877 | |
| 380,000 | | Bradley, IL (Bradley Commons) | | | 5.000 | | | | 01/01/2021 | | | | 01/01/2021 | | | | 391,890 | |
| 400,000 | | Bradley, IL (Bradley Commons) | | | 5.000 | | | | 01/01/2022 | | | | 01/01/2022 | | | | 420,212 | |
| 7,105,000 | | Centerpoint, IL Intermodal Center Program | | | 4.000 2 | | | | 06/15/2023 | | | | 06/15/2023 | | | | 7,227,917 | |
| 500,000 | | Chicago, IL Board of Education (School Reform) | | | 2.893 3 | | | | 12/01/2022 | | | | 12/01/2022 | | | | 472,410 | |
| 4,745,000 | | Chicago, IL Board of Education (School Reform) | | | 3.093 3 | | | | 12/01/2020 | | | | 12/01/2020 | | | | 4,613,136 | |
| 2,000,000 | | Chicago, IL Board of Education (School Reform) | | | 3.244 3 | | | | 12/01/2021 | | | | 12/01/2021 | | | | 1,898,660 | |
| 6,555,000 | | Chicago, IL Board of Education, Series 1992A | | | 6.000 | | | | 01/01/2020 | | | | 01/01/2020 | | | | 6,631,628 | |
| 200,000 | | Chicago, IL Board of Education, Series 2005A | | | 5.500 | | | | 12/01/2023 | | | | 12/01/2023 | | | | 225,868 | |
| 6,110,000 | | Chicago, IL City Colleges | | | 3.895 3 | | | | 01/01/2024 | | | | 01/01/2024 | | | | 5,508,043 | |
| 15,000 | | Chicago, IL GO | | | 4.250 | | | | 12/01/2026 | | | | 09/30/2019 | A | | | 15,030 | |
| 105,000 | | Chicago, IL GO | | | 5.000 | | | | 12/01/2020 | | | | 09/30/2019 | A | | | 105,366 | |
| 175,000 | | Chicago, IL GO | | | 5.000 | | | | 01/01/2027 | | | | 09/30/2019 | A | | | 175,611 | |
| 245,000 | | Chicago, IL GO | | | 5.000 | | | | 01/01/2027 | | | | 09/30/2019 | A | | | 245,669 | |
| 730,000 | | Chicago, IL GO | | | 5.125 | | | | 01/01/2022 | | | | 01/01/2020 | B | | | 750,331 | |
| 450,000 | | Chicago, IL GO | | | 5.250 | | | | 01/01/2020 | | | | 01/01/2020 | | | | 455,454 | |
| 830,000 | | Chicago, IL Public Building Commission | | | 7.000 | | | | 01/01/2020 | | | | 01/01/2020 | | | | 845,936 | |
| 2,085,000 | | Chicago, IL State University (Auxiliary Facilities System) | | | 5.500 | | | | 12/01/2023 | | | | 01/10/2022 | B | | | 2,251,216 | |
| 905,000 | | Chicago, IL Waterworks | | | 5.000 | | | | 11/01/2025 | | | | 09/30/2019 | A | | | 907,652 | |
| 65,000 | | Collinsville, IL Area Recreation District | | | 4.000 | | | | 12/01/2027 | | | | 09/30/2019 | A | | | 65,046 | |
| 300,000 | | Collinsville, IL Area Recreation District | | | 4.400 | | | | 12/01/2022 | | | | 09/30/2019 | A | | | 300,858 | |
| 630,000 | | Collinsville, IL Area Recreation District | | | 4.500 | | | | 12/01/2023 | | | | 09/30/2019 | A | | | 631,846 | |
| 1,800,000 | | Cook County, IL Community College District No. 508 (City Colleges Chicago) | | | 5.000 | | | | 12/01/2021 | | | | 12/01/2021 | | | | 1,905,030 | |
| 1,055,000 | | Cook County, IL Community High School District No. 219 Niles Township | | | 5.500 | | | | 12/01/2019 | | | | 12/01/2019 | | | | 1,066,257 | |
| 500,000 | | Cook County, IL School District No. 127.5 Chicago Ridge | | | 3.750 | | | | 12/01/2020 | | | | 09/30/2019 | A | | | 500,985 | |
| 250,000 | | Cook County, IL School District No. 148 Dolton | | | 4.500 | | | | 12/01/2027 | | | | 12/01/2019 | A | | | 252,035 | |
| 700,000 | | Cook County, IL School District No. 159 Matteson-Richton Park | | | 2.948 3 | | | | 12/01/2020 | | | | 12/01/2020 | | | | 686,686 | |
| 810,000 | | Cook County, IL School District No. 88 Bellwood | | | 4.100 | | | | 12/01/2023 | | | | 12/01/2019 | A | | | 814,714 | |
20 INVESCO OPPENHEIMER SHORT TERM MUNICIPAL FUND
| | | | | | | | | | | | | | | | | | |
Principal
Amount | | | | Coupon | | | Maturity | | | Effective
Maturity* | | | Value | |
| Illinois (Continued) | | | | | | | | | | | | | |
| $105,000 | | Eastern Illinois University (Auxiliary Facilities System) | | | 4.125% | | | | 04/01/2022 | | | | 09/30/2019 | A | | $ | 105,025 | |
| 685,000 | | IL Civic Center | | | 6.250 | | | | 12/15/2020 | | | | 06/21/2020 | B | | | 702,043 | |
| 440,000 | | IL Finance Authority (BHF Chicago Hsg. Group)6 | | | 4.250 | | | | 12/01/2027 | | | | 03/02/2024 | B | | | 132,000 | |
| 1,540,000 | | IL Finance Authority (Rehabilitation Institute of Chicago) | | | 5.000 | | | | 07/01/2021 | | | | 07/01/2021 | | | | 1,637,513 | |
| 1,000,000 | | IL Finance Authority (Rehabilitation Institute of Chicago) | | | 5.000 | | | | 07/01/2022 | | | | 07/01/2022 | | | | 1,097,110 | |
| 1,000,000 | | IL Finance Authority (Rehabilitation Institute of Chicago) | | | 5.000 | | | | 07/01/2023 | | | | 07/01/2023 | | | | 1,127,180 | |
| 2,085,000 | | IL GO | | | 4.000 | | | | 05/01/2024 | | | | 05/01/2024 | | | | 2,223,256 | |
| 7,500,000 | | IL GO | | | 5.000 | | | | 08/01/2022 | | | | 08/01/2022 | | | | 8,148,600 | |
| 3,500,000 | | IL GO | | | 5.000 | | | | 10/01/2022 | | | | 10/01/2022 | | | | 3,808,490 | |
| 7,250,000 | | IL GO | | | 5.000 | | | | 01/01/2023 | | | | 01/01/2020 | A | | | 7,340,408 | |
| 2,000,000 | | IL GO | | | 5.000 | | | | 11/01/2025 | | | | 11/01/2025 | | | | 2,293,560 | |
| 5,000 | | IL Health Facilities Authority (Franciscan Sisters Health Care)1 | | | 6.250 | | | | 09/01/2021 | | | | 09/15/2020 | B | | | 5,252 | |
| 30,000 | | IL Hsg. Devel. Authority | | | 4.600 | | | | 09/01/2025 | | | | 09/30/2019 | A | | | 30,077 | |
| 90,000 | | IL Medical District COP | | | 5.000 | | | | 06/01/2022 | | | | 09/30/2019 | A | | | 90,144 | |
| 1,270,000 | | IL Regional Transportation Authority | | | 6.700 | | | | 11/01/2021 | | | | 11/16/2020 | B | | | 1,349,934 | |
| 125,000 | | IL Sales Tax | | | 6.500 | | | | 06/15/2022 | | | | 12/20/2021 | B | | | 130,080 | |
| 31,700,000 | | IL Sales Tax Securitization Corp. Floaters Series 2018-XL0093 Trust | | | 1.550 2 | | | | 01/01/2048 | | | | 09/11/2019 | A | | | 31,700,000 | |
| 400,000 | | Iroquois & Kankakee Counties, IL Community Unit School District No. 4 | | | 4.125 | | | | 11/01/2019 | | | | 09/30/2019 | A | | | 400,972 | |
| 600,000 | | Kankakee County, IL Community Unit School District No. 1 | | | 5.000 | | | | 02/01/2020 | | | | 02/01/2020 | | | | 609,150 | |
| 300,000 | | Kankakee, IL GO | | | 3.800 | | | | 01/01/2020 | | | | 09/30/2019 | A | | | 300,636 | |
| 1,000,000 | | Madison Macoupin Counties, IL Community College Districts No. 536 | | | 5.000 | | | | 11/01/2021 | | | | 11/01/2021 | | | | 1,074,420 | |
| 310,000 | | Matteson, IL Waterworks | | | 4.000 | | | | 12/01/2019 | | | | 09/30/2019 | A | | | 310,468 | |
| 1,700,000 | | Melrose Park, IL GO | | | 5.000 | | | | 12/15/2022 | | | | 12/15/2021 | A | | | 1,839,128 | |
| 1,010,000 | | Minooka, IL GO | | | 5.000 | | | | 01/01/2022 | | | | 01/15/2021 | B | | | 1,052,531 | |
| 240,000 | | North Chicago, IL GO | | | 4.000 | | | | 11/01/2019 | | | | 09/30/2019 | A | | | 240,434 | |
| 600,000 | | Northern IL University COP | | | 4.000 | | | | 09/01/2019 | | | | 09/01/2019 | | | | 600,000 | |
| 120,000 | | Riverdale, IL GO | | | 4.800 | | | | 01/01/2023 | | | | 09/30/2019 | A | | | 120,186 | |
| 300,000 | | Saint Clair County, IL School District No. 189 East Saint Louis | | | 5.100 | | | | 01/01/2020 | | | | 01/01/2020 | | | | 300,762 | |
| 120,000 | | Southwestern IL Devel. Authority (Granite City) | | | 5.250 | | | | 03/01/2023 | | | | 09/30/2019 | A | | | 120,097 | |
| 1,080,000 | | Southwestern IL Devel. Authority (Memorial Group) | | | 6.375 | | | | 11/01/2023 | | | | 05/31/2022 | B | | | 1,220,281 | |
21 INVESCO OPPENHEIMER SHORT TERM MUNICIPAL FUND
SCHEDULE OF INVESTMENTSContinued
| | | | | | | | | | | | | | | | | | |
Principal
Amount | | | | Coupon | | | Maturity | | | Effective
Maturity* | | | Value | |
| Illinois (Continued) | | | | | | | | | | | | | |
| $330,000 | | Sterling, IL Park District | | | 4.000% | | | | 12/15/2019 | | | | 12/15/2019 | | | $ | 331,488 | |
| 2,110,000 | | University of Illinois Board of Trustees COP | | | 5.250 | | | | 10/01/2022 | | | | 09/30/2019 | A | | | 2,116,604 | |
| 1,020,000 | | University of Illinois Board of Trustees COP | | | 5.250 | | | | 10/01/2026 | | | | 09/30/2019 | A | | | 1,023,193 | |
| 15,000 | | West Chicago, IL Fire Protection District | | | 4.750 | | | | 01/01/2029 | | | | 09/30/2019 | A | | | 15,031 | |
| 20,455,000 | | Will County, IL Community Unit School District No. 365 (Valley View) | | | 3.443 3 | | | | 11/01/2023 | | | | 11/01/2023 | | | | 19,110,084 | |
| 750,000 | | Will County, IL School District No. 88A Richland | | | 4.100 | | | | 10/01/2025 | | | | 10/01/2019 | A | | | 751,478 | |
| | | | | | | | | | | | | | | | | 133,638,694 | |
| | | | | | | | | | | | | | | | | | | |
| Indiana—2.0% | | | | | | | | | | | | | | | | |
| 8,590,000 | | Gary, IN Sanitary District | | | 5.050 | | | | 01/15/2029 | | | | 12/30/2021 | A | | | 9,309,240 | |
| 890,000 | | Gary/Chicago, IN International Airport Authority | | | 5.500 | | | | 02/01/2025 | | | | 09/30/2019 | A | | | 892,955 | |
| 410,000 | | IN Finance Authority (Sisters of St. Francis Health) | | | 5.000 | | | | 11/01/2019 | | | | 09/30/2019 | A | | | 412,673 | |
| 9,075,000 | | IN Transportation Finance Authority | | | 5.500 | | | | 12/01/2022 | | | | 06/26/2021 | B | | | 9,765,880 | |
| 3,000,000 | | Indiana, IN Bond Bank Special Program Floaters Series 2015-XF0115 | | | 1.600 2 | | | | 10/15/2019 | | | | 09/06/2019 | A | | | 3,000,000 | |
| 615,000 | | Merrillville, IN Economic Devel. (Belvedere Hsg.) | | | 5.050 | | | | 04/01/2026 | | | | 06/11/2023 | B | | | 614,293 | |
| 835,000 | | Michigan City, IN Multifamily Hsg. (Silver Birch Project) | | | 4.500 | | | | 01/01/2026 | | | | 08/17/2023 | B | | | 846,139 | |
| | | | | | | | | | | | | | | | | 24,841,180 | |
| | | | | | | | | | | | | | | | | | | |
| Iowa—0.9% | | | | | | | | | | | | | | | | |
| 20,000 | | Ankeny, IA GO | | | 4.000 | | | | 06/01/2026 | | | | 09/30/2019 | A | | | 20,047 | |
| 890,000 | | Corning, IA Community School District | | | 4.125 | | | | 05/01/2023 | | | | 05/01/2020 | A | | | 906,945 | |
| 10,000,000 | | IA Finance Authority (MerH/ProcH/ProcHC/SLHS/SLMHC/AMemH/ IHSys/CIHS/FinH/MMCI/CIHC/CIHP/SLHlth/AHlthS/TRMC/SLHR/ NIHC/FTSHG/TRHS/TMCT/UAH/MerHS/MHlthSC Obligated Group) Floaters Series2018-007 | | | 1.400 2 | | | | 02/15/2035 | | | | 09/06/2019 | A | | | 10,000,000 | |
| 5,000 | | IA HFA (Multifamily Hsg.) | | | 6.000 | | | | 04/01/2021 | | | | 10/01/2019 | A | | | 5,015 | |
| 90,000 | | IA Higher Education Loan Authority (Upper Iowa University)1 | | | 5.000 | | | | 09/01/2020 | | | | 04/01/2020 | B | | | 91,907 | |
| 100,000 | | Waverly-Shell Rock, IA Community School District | | | 3.625 | | | | 06/01/2023 | | | | 09/30/2019 | A | | | 100,172 | |
| | | | | | | | | | | | | | | | | 11,124,086 | |
22 INVESCO OPPENHEIMER SHORT TERM MUNICIPAL FUND
| | | | | | | | | | | | | | | | | | |
Principal
Amount | | | | Coupon | | | Maturity | | | Effective
Maturity* | | | Value | |
| Kansas—0.2% | | | | | | | | | | | | | | | | |
| $2,000,000 | | KS Devel. Finance Authority (Stormont-Vail Healthcare) | | | 5.000% | | | | 11/15/2023 | | | | 11/15/2019 | A | | $ | 2,015,440 | |
| 30,000 | | KS Devel. Finance Authority (University of Kansas Hospital Authority) | | | 4.375 | | | | 06/15/2028 | | | | 09/15/2019 | A | | | 30,029 | |
| | | | | | | | | | | | | | | | | 2,045,469 | |
| | | | | | | | | | | | | | | | | | | |
| Kentucky—2.1% | | | | | | | | | | | | | | | | |
| 10,000 | | Jefferson County, KY Capital Projects | | | 4.250 | | | | 06/01/2022 | | | | 09/30/2019 | A | | | 10,026 | |
| 25,000 | | Jefferson County, KY Capital Projects | | | 4.375 | | | | 06/01/2028 | | | | 09/30/2019 | A | | | 25,071 | |
| 3,370,000 | | KY Asset Liability Commission [US 0003M+55] | | | 2.060 5 | | | | 11/01/2025 | | | | 04/01/2024 | B | | | 3,318,641 | |
| 1,605,000 | | KY EDFA (Masonic Homes of Kentucky/Masonic Home Independent Living II Obligated Group) | | | 3.250 | | | | 05/15/2022 | | | | 09/19/2019 | A | | | 1,605,193 | |
| 7,665,000 | | KY Property & Building Commission | | | 5.000 | | | | 08/01/2020 | | | | 08/01/2020 | | | | 7,927,986 | |
| 4,750,000 | | KY Property & Building Commission | | | 5.000 | | | | 05/01/2027 | | | | 05/01/2027 | | | | 5,856,655 | |
| 5,000,000 | | KY Property & Building Commission | | | 5.000 | | | | 05/01/2028 | | | | 05/01/2028 | | | | 6,274,650 | |
| 5,000 | | KY Rural Water Finance Corp. | | | 4.125 | | | | 02/01/2023 | | | | 09/24/2019 | A | | | 5,009 | |
| 10,000 | | KY Rural Water Finance Corp. | | | 4.750 | | | | 02/01/2028 | | | | 09/24/2019 | A | | | 10,023 | |
| 10,000 | | Paducah, KY Electric Plant Board | | | 4.375 | | | | 10/01/2022 | | | | 10/11/2019 | A | | | 10,034 | |
| 50,000 | | Paducah, KY Electric Plant Board | | | 4.500 | | | | 10/01/2023 | | | | 10/11/2019 | A | | | 50,176 | |
| 315,000 | | Pikeville, KY Hospital (Pikeville Medical Center) | | | 6.250 | | | | 03/01/2024 | | | | 03/01/2021 | A | | | 338,886 | |
| 1,060,000 | | Pikeville, KY Hospital (Pikeville Medical Center) | | | 6.250 | | | | 03/01/2024 | | | | 03/01/2021 | A | | | 1,126,600 | |
| | | | | | | | | | | | | | | | | 26,558,950 | |
| | | | | | | | | | | | | | | | | | | |
| Louisiana—0.7% | | | | | | | | | | | | | | | | |
| 5,000,000 | | LA GO | | | 5.000 | | | | 09/01/2019 | | | | 09/01/2019 | | | | 5,000,000 | |
| 1,760,000 | | LA Public Facilities Authority (Loyola University New Orleans) | | | 2.650 3 | | | | 10/01/2020 | | | | 10/01/2020 | | | | 1,723,093 | |
| 1,750,000 | | LA Tobacco Settlement Financing Corp. (TASC) | | | 5.000 | | | | 05/15/2020 | | | | 05/15/2020 | | | | 1,794,765 | |
| 390,000 | | Monroe, LA Sales Tax | | | 3.000 | | | | 03/01/2020 | | | | 09/30/2019 | A | | | 390,515 | |
| | | | | | | | | | | | | | | | | 8,908,373 | |
| | | | | | | | | | | | | | | | | | | |
| Maine—0.1% | | | | | | | | | | | | | | | | |
| 1,550,000 | | ME Educational Authority (Student Loan) | | | 4.750 | | | | 12/01/2024 | | | | 12/01/2022 | A | | | 1,691,546 | |
| 5,000 | | ME H&HEFA | | | 4.200 | | | | 07/01/2023 | | | | 09/30/2019 | A | | | 5,012 | |
| | | | | | | | | | | | | | | | | 1,696,558 | |
23 INVESCO OPPENHEIMER SHORT TERM MUNICIPAL FUND
SCHEDULE OF INVESTMENTSContinued
| | | | | | | | | | | | | | | | | | |
Principal
Amount | | | | Coupon | | | Maturity | | | Effective
Maturity* | | | Value | |
| Maryland—0.7% | | | | | | | | | | | | | |
| $295,000 | | Caroline County, MD GO | | | 3.850% | | | | 06/01/2021 | | | | 09/30/2019 | A | | $ | 297,502 | |
| 10,000 | | Caroline County, MD GO | | | 4.000 | | | | 11/01/2021 | | | | 09/30/2019 | A | | | 10,022 | |
| 45,000 | | MD Community Devel. Administration (Dept. of Hsg. & Community Devel.) | | | 4.400 | | | | 07/01/2021 | | | | 09/30/2019 | A | | | 45,107 | |
| 7,005,000 | | MD H&HEFA (Medstar Health) | | | 5.000 | | | | 08/15/2027 | | | | 08/15/2023 | A | | | 7,966,646 | |
| 20,000 | | Montgomery County, MD Hsg. Opportunities Commission (Multifamily Mtg.), Series A | | | 4.625 | | | | 07/01/2032 | | | | 09/30/2019 | A | | | 20,033 | |
| 30,000 | | University System of Maryland | | | 4.000 | | | | 04/01/2020 | | | | 09/30/2019 | A | | | 30,065 | |
| 10,000 | | University System of Maryland | | | 4.000 | | | | 04/01/2021 | | | | 09/30/2019 | A | | | 10,021 | |
| | | | | | | | | | | | | | | | | 8,379,396 | |
| | | | | | | | | | | | | | | | | | | |
| Massachusetts—2.2% | | | | | | | | | | | | | | | | |
| 20,000 | | Boston, MA Hsg. Authority | | | 4.125 | | | | 04/01/2021 | | | | 09/30/2019 | A | | | 20,045 | |
| 30,000 | | Boston, MA Hsg. Authority | | | 5.000 | | | | 04/01/2027 | | | | 09/30/2019 | A | | | 30,087 | |
| 35,000 | | Boston, MA Hsg. Authority | | | 5.000 | | | | 04/01/2028 | | | | 09/30/2019 | A | | | 35,101 | |
| 100,000 | | Boston, MA Water & Sewer | | | 5.000 | | | | 11/01/2020 | | | | 09/30/2019 | A | | | 100,291 | |
| 180,000 | | Boston, MA Water & Sewer | | | 5.250 | | | | 11/01/2019 | | | | 11/01/2019 | | | | 181,219 | |
| 525,000 | | Boston, MA Water & Sewer | | | 5.250 | | | | 11/01/2019 | | | | 11/01/2019 | | | | 528,554 | |
| 50,000 | | Chesire, MA GO | | | 4.750 | | | | 02/01/2024 | | | | 09/30/2019 | A | | | 50,149 | |
| 10,000 | | Lynn, MA GO | | | 4.500 | | | | 07/15/2024 | | | | 09/30/2019 | A | | | 10,026 | |
| 2,600,000 | | MA Bay Transportation Authority4 | | | 0.000 | | | | 07/01/2020 | | | | 07/01/2020 | | | | 2,622,854 | |
| 1,280,000 | | MA Bay Transportation Authority | | | 7.000 | | | | 03/01/2021 | | | | 03/01/2021 | | | | 1,356,595 | |
| 2,000,000 | | MA Devel. Finance Agency (Berkshire Health System/Berkshire Medical Center/Fairview Hospital Obligated Group) | | | 5.000 | | | | 10/01/2022 | | | | 10/01/2021 | A | | | 2,148,340 | |
| 395,000 | | MA Devel. Finance Agency (Visual & Performing Arts) | | | 6.000 | | | | 08/01/2021 | | | | 02/05/2021 | B | | | 418,933 | |
| 10,910,000 | | MA GO4 | | | 2.528 | | | | 11/01/2019 | | | | 11/01/2019 | | | | 10,931,711 | |
| 490,000 | | MA H&EFA (Milford Regional Medical Center) | | | 5.000 | | | | 07/15/2022 | | | | 09/30/2019 | A | | | 493,915 | |
| 3,250,000 | | MA H&EFA (Milford Regional Medical Center) | | | 5.000 | | | | 07/15/2027 | | | | 09/30/2019 | A | | | 3,279,542 | |
| 4,000,000 | | MA School Building Authority | | | 5.000 | | | | 08/15/2025 | | | | 08/15/2022 | A | | | 4,455,160 | |
| 830,000 | | MA Special Obligation (Consolidated Loan)4 | | | 0.000 | | | | 06/01/2020 | | | | 06/01/2020 | | | | 842,284 | |
| 20,000 | | Natick, MA GO | | | 4.000 | | | | 06/15/2031 | | | | 09/30/2019 | A | | | 20,043 | |
| 10,000 | | North Reading, MA GO | | | 4.000 | | | | 09/15/2023 | | | | 09/30/2019 | A | | | 10,022 | |
| 25,000 | | Waltham, MA GO | | | 4.000 | | | | 09/15/2024 | | | | 09/30/2019 | A | | | 25,055 | |
| 15,000 | | Waltham, MA GO | | | 4.200 | | | | 09/15/2027 | | | | 09/30/2019 | A | | | 15,035 | |
| 25,000 | | Winchester, MA GO | | | 4.375 | | | | 07/01/2027 | | | | 09/30/2019 | A | | | 25,063 | |
| 5,000 | | Worcester, MA GO | | | 4.000 | | | | 11/01/2020 | | | | 09/30/2019 | A | | | 5,011 | |
| 10,000 | | Worcester, MA GO | | | 4.000 | | | | 09/15/2021 | | | | 09/30/2019 | A | | | 10,021 | |
| 15,000 | | Worcester, MA GO | | | 4.125 | | | | 09/15/2023 | | | | 09/30/2019 | A | | | 15,033 | |
| 10,000 | | Worcester, MA GO | | | 4.200 | | | | 11/01/2024 | | | | 09/30/2019 | A | | | 10,022 | |
| | | | | | | | | | | | | | | | | 27,640,111 | |
24 INVESCO OPPENHEIMER SHORT TERM MUNICIPAL FUND
| | | | | | | | | | | | | | | | | | |
Principal
Amount | | | | Coupon | | | Maturity | | | Effective
Maturity* | | | Value | |
| Michigan—1.7% | | | | | | | | | | | | | |
| $200,000 | | Allen Park, MI GO | | | 4.000% | | | | 04/01/2020 | | | | 09/30/2019 | A | | $ | 200,462 | |
| 220,000 | | Charyl Stockwell Academy, MI Public School Academy1 | | | 4.875 | | | | 10/01/2023 | | | | 11/04/2021 | B | | | 225,916 | |
| 99,200 | | Detroit, MI GO | | | 5.250 | | | | 04/01/2020 | | | | 09/30/2019 | A | | | 99,207 | |
| 40,000 | | Eaton Rapids, MI Public Schools | | | 4.000 | | | | 05/01/2020 | | | | 09/30/2019 | A | | | 40,083 | |
| 10,000 | | Flat Rock, MI Tax Increment Finance Authority | | | 4.750 | | | | 10/01/2021 | | | | 09/30/2019 | A | | | 10,024 | |
| 85,000 | | Harper Woods, MI GO | | | 4.200 | | | | 05/01/2020 | | | | 09/30/2019 | A | | | 85,178 | |
| 10,000 | | Howell Township, MI GO | | | 4.500 | | | | 06/01/2022 | | | | 09/30/2019 | A | | | 10,025 | |
| 20,000 | | Howell, MI GO | | | 4.050 | | | | 03/01/2020 | | | | 03/01/2020 | | | | 20,284 | |
| 12,375,000 | | Kent, MI Hospital Finance Authority (Spectrum Health System/Spectrum Health Hospitals Obligated Group) | | | 5.500 | | | | 11/15/2025 | | | | 11/15/2021 | A | | | 13,479,221 | |
| 25,000 | | Leslie, MI Public Schools | | | 4.000 | | | | 05/01/2023 | | | | 09/30/2019 | A | | | 25,051 | |
| 3,000,000 | | MI Building Authority, Series II | | | 5.000 | | | | 10/15/2026 | | | | 10/15/2019 | A | | | 3,013,380 | |
| 1,740,000 | | MI Finance Authority (Lawrence Technological University) | | | 5.000 | | | | 02/01/2022 | | | | 02/12/2021 | B | | | 1,802,449 | |
| 120,000 | | MI Hsg. Devel. Authority, Series A | | | 4.750 | | | | 10/01/2019 | | | | 10/01/2019 | | | | 120,308 | |
| 105,000 | | Muskegon Heights, MI Water System | | | 4.000 | | | | 11/01/2021 | | | | 11/01/2019 | A | | | 105,427 | |
| 185,000 | | Muskegon Heights, MI Water System | | | 4.000 | | | | 11/01/2026 | | | | 11/01/2019 | A | | | 185,764 | |
| 1,400,000 | | Summit Academy North, MI Public School Academy | | | 4.000 | | | | 11/01/2024 | | | | 11/11/2023 | B | | | 1,405,782 | |
| 15,000 | | Taylor, MI Tax Increment Finance Authority | | | 4.000 | | | | 05/01/2021 | | | | 09/30/2019 | A | | | 15,031 | |
| 375,000 | | Wayne, MI GO | | | 4.400 | | | | 10/01/2021 | | | | 10/01/2019 | A | | | 375,315 | |
| 15,000 | | Western MI University | | | 4.250 | | | | 11/15/2021 | | | | 09/30/2019 | A | | | 15,036 | |
| 350,000 | | Wyoming, MI Public Schools | | | 3.500 | | | | 05/01/2020 | | | | 09/30/2019 | A | | | 350,567 | |
| 10,000 | | Ypsilanti, MI School District | | | 4.000 | | | | 05/01/2020 | | | | 09/30/2019 | A | | | 10,020 | |
| | | | | | | | | | | | | | | | | 21,594,530 | |
| | | | | | | | | | | | | | | | | | | |
| Minnesota—1.5% | | | | | | | | | | | | | |
| 205,000 | | Arlington, MN GO | | | 3.000 | | | | 12/01/2019 | | | | 09/30/2019 | A | | | 205,346 | |
| 2,000,000 | | Dakota County, MN Community Devel. Agency (WSP Senior Hsg.) | | | 3.800 2 | | | | 07/01/2022 | | | | 07/01/2020 | A | | | 2,014,840 | |
| 2,415,000 | | Duluth, MN Independent School District No. 709 COP | | | 5.000 | | | | 02/01/2023 | | | | 02/01/2023 | | | | 2,699,101 | |
| 35,000 | | Lakeville, MN Independent School District No. 194 | | | 5.000 | | | | 02/01/2020 | | | | 02/01/2020 | | | | 35,570 | |
| 5,000 | | Mankato, MN Independent School District No. 77 | | | 4.000 | | | | 02/01/2021 | | | | 09/30/2019 | A | | | 5,011 | |
| 1,890,000 | | Minneapolis, MN Multifamily Hsg. (Riverside Homes) | | | 3.750 2 | | | | 11/01/2021 | | | | 11/01/2019 | A | | | 1,892,325 | |
| 15,000 | | MN Governmental Agency Finance Group | | | 4.125 | | | | 03/01/2027 | | | | 09/24/2019 | A | | | 15,026 | |
| 5,000 | | New Prague, MN GO | | | 4.150 | | | | 02/01/2024 | | | | 09/30/2019 | A | | | 5,010 | |
| 10,000 | | North Mankato, MN GO | | | 4.000 | | | | 12/01/2024 | | | | 09/30/2019 | A | | | 10,022 | |
25 INVESCO OPPENHEIMER SHORT TERM MUNICIPAL FUND
SCHEDULE OF INVESTMENTSContinued
| | | | | | | | | | | | | | | | | | |
Principal
Amount | | | | Coupon | | | Maturity | | | Effective
Maturity* | | | Value | |
| Minnesota (Continued) | | | | | | | | | | | | | |
| $25,000 | | Southern MN Municipal Power Agency | | | 4.500% | | | | 01/01/2020 | | | | 09/30/2019 | A | | $ | 25,064 | |
| 4,310,000 | | St. Paul, MN Hsg. & Redevel. Authority (Legends Berry Senior Apartments) | | | 3.750 2 | | | | 09/01/2021 | | | | 03/01/2020 | A | | | 4,327,283 | |
| 1,930,000 | | St. Paul, MN Hsg. & Redevel. Authority (Millberry Apartments) | | | 3.750 2 | | | | 03/01/2021 | | | | 09/19/2019 | A | | | 1,930,637 | |
| 4,500,000 | | St. Paul, MN Hsg. & Redevel. Authority (Un Flats Apartments) | | | 2.750 2 | | | | 02/01/2022 | | | | 09/19/2019 | A | | | 4,500,405 | |
| 655,000 | | St. Paul, MN Hsg. & Redevel. Authority Charter School (St. Paul City School) | | | 4.500 | | | | 07/01/2028 | | | | 05/25/2024 | A | | | 678,318 | |
| 45,000 | | Tri-County, MN Independent School District No. 2358 | | | 4.000 | | | | 02/01/2027 | | | | 09/30/2019 | A | | | 45,102 | |
| 205,000 | | Woodbury, MN Charter School (MSA Building Company) | | | 3.650 | | | | 12/01/2020 | | | | 12/01/2020 | | | | 210,033 | |
| | | | | | | | | | | | | | | | | 18,599,093 | |
| | | | | | | | | | | | | | | | | | | |
| Mississippi—0.2% | | | | | | | | | | | | | |
| 10,000 | | Mississippi Valley, MS State University Educational Building Corp. | | | 4.000 | | | | 03/01/2022 | | | | 09/30/2019 | A | | | 10,021 | |
| 25,000 | | MS Business Finance Commission (Huntington Ingalls Industries) | | | 4.550 | | | | 12/01/2028 | | | | 09/30/2019 | A | | | 25,015 | |
| 860,000 | | MS Devel. Bank (Jackson Public School District) | | | 5.000 | | | | 10/01/2023 | | | | 07/13/2022 | B | | | 943,506 | |
| 800,000 | | MS Devel. Bank (Jackson Water & Sewer System) | | | 5.250 | | | | 12/01/2022 | | | | 12/01/2022 | | | | 889,480 | |
| 55,000 | | Ridgeland, MS Tax Increment (City of Ridgeland) | | | 5.375 | | | | 10/01/2029 | | | | 10/01/2019 | A | | | 55,153 | |
| | | | | | | | | | | | | | | | | 1,923,175 | |
| | | | | | | | | | | | | | | | | | | |
| Missouri—1.3% | | | | | | | | | | | | | |
| 90,000 | | Brentwood, MO Tax Increment (Hanley Stadium Redevel.) | | | 3.200 | | | | 11/01/2021 | | | | 05/01/2020 | B | | | 90,728 | |
| 12,000 | | Cass County, MO GO COP | | | 4.000 | | | | 04/01/2020 | | | | 09/30/2019 | A | | | 12,024 | |
| 25,000 | | Clay County, MO Reorganized School District No. R-1 | | | 4.250 | | | | 03/01/2020 | | | | 09/30/2019 | A | | | 25,058 | |
| 25,000 | | Johnson County, MO GO COP | | | 4.125 | | | | 12/01/2019 | | | | 09/30/2019 | A | | | 25,048 | |
| 285,000 | | Kansas City, MO IDA (Sales Tax) | | | 4.250 | | | | 04/01/2026 | | | | 07/30/2023 | B | | | 299,675 | |
| 25,000 | | Maryville, MO Waterworks & Sewage System | | | 4.200 | | | | 01/01/2032 | | | | 09/30/2019 | A | | | 25,045 | |
| 675,000 | | MO Devel. Finance Board (Branson Landing) | | | 6.000 | | | | 06/01/2020 | | | | 06/01/2020 | | | | 697,761 | |
| 5,000 | | MO Environmental Improvement & Energy Resources Authority | | | 4.250 | | | | 07/01/2026 | | | | 09/30/2019 | A | | | 5,013 | |
| 15,000 | | MO Environmental Improvement & Energy Resources Authority | | | 5.000 | | | | 01/01/2020 | | | | 09/30/2019 | A | | | 15,045 | |
26 INVESCO OPPENHEIMER SHORT TERM MUNICIPAL FUND
| | | | | | | | | | | | | | | | | | |
Principal
Amount | | | | Coupon | | | Maturity | | | Effective
Maturity* | | | Value | |
| Missouri (Continued) | | | | | | | | | | | | | |
| $10,000,000 | | MO H&EFA (SSM Health Care Corp.) | | | 1.340%2 | | | | 06/01/2036 | | | | 09/06/2019 | A | | $ | 10,000,000 | |
| 3,130,000 | | MO H&EFA (Webster University) | | | 5.000 | | | | 04/01/2026 | | | | 04/01/2026 | | | | 3,613,961 | |
| 65,000 | | MO Hsg. Devel. Commission1 | | | 4.250 | | | | 11/01/2030 | | | | 05/01/2021 | A | | | 66,722 | |
| 850,000 | | Raytown, MO Annual Appropriation-Supported Tax (Raytown Live Redevel. Plan) | | | 5.125 | | | | 12/01/2025 | | | | 09/30/2019 | A | | | 851,369 | |
| 95,000 | | Springfield, MO Public Building Corp. (Jordan Valley Project) | | | 4.151 3 | | | | 06/01/2025 | | | | 12/18/2023 | B | | | 78,309 | |
| 1,130,000 | | St. Louis County, MO IDA (Friendship Village)1 | | | 5.000 | | | | 09/01/2023 | | | | 10/07/2021 | B | | | 1,199,088 | |
| 70,000 | | St. Louis County, MO IDA (FVWC/FVSC/FVSL/FVO Obligated Group)1 | | | 3.000 | | | | 09/01/2022 | | | | 03/18/2021 | B | | | 72,105 | |
| | | | | | | | | | | | | | | | | 17,076,951 | |
| | | | | | | | | | | | | | | | | | | |
| Montana—0.0% | | | | | | | | | | | | | |
| 10,000 | | Ravalli County, MT School District No. 7 | | | 4.000 | | | | 07/01/2023 | | | | 09/30/2019 | A | | | 10,023 | |
| | | | | | | | | | | | | | | | | | | |
| Nebraska—0.9% | | | | | | | | | | | | | |
| 11,945,000 | | Omaha, NE Public Power District (Nebraska City Station Unit 2) Floaters Series 2016-XF1053 Trust | | | 1.450 2 | | | | 02/01/2049 | | | | 09/10/2019 | A | | | 11,945,000 | |
| | | | | | | | | | | | | | | | | | | |
| Nevada—0.0% | | | | | | | | | | | | | |
| 60,000 | | Reno, NV Hospital (RRMC/RTCS/RSMMC Obligated Group) | | | 5.500 | | | | 06/01/2023 | | | | 09/25/2019 | A | | | 60,161 | |
| | | | | | | | | | | | | | | | | | | |
| New Hampshire—0.2% | | | | | | | | | | | | | |
| 2,750,000 | | NH H&EFA (Hillside Village) | | | 3.500 | | | | 07/01/2022 | | | | 10/01/2019 | A | | | 2,753,190 | |
| 5,000 | | NH Municipal Bond Bank | | | 4.000 | | | | 08/15/2021 | | | | 09/30/2019 | A | | | 5,011 | |
| 15,000 | | NH Municipal Bond Bank | | | 4.000 | | | | 02/15/2023 | | | | 09/30/2019 | A | | | 15,032 | |
| | | | | | | | | | | | | | | | | 2,773,233 | |
| | | | | | | | | | | | | | | | | | | |
| New Jersey—8.1% | | | | | | | | | | | | | |
| 250,000 | | Atlantic City, NJ GO | | | 5.000 | | | | 03/01/2027 | | | | 03/01/2027 | | | | 309,640 | |
| 3,935,000 | | Atlantic City, NJ GO Floaters Series 2017-XF2482 Trust | | | 1.590 2 | | | | 03/01/2042 | | | | 09/06/2019 | A | | | 3,935,000 | |
| 1,610,000 | | Camden County, NJ Improvement Authority (Rowan University) | | | 5.000 | | | | 12/01/2027 | | | | 12/01/2023 | A | | | 1,838,395 | |
| 3,515,000 | | Casino Reinvestment Devel. Authority of NJ | | | 5.000 | | | | 11/01/2023 | | | | 11/01/2023 | | | | 3,894,761 | |
| 1,500,000 | | Casino Reinvestment Devel. Authority of NJ | | | 5.250 | | | | 01/01/2024 | | | | 09/30/2019 | A | | | 1,503,825 | |
| 1,000,000 | | Casino Reinvestment Devel. Authority of NJ (Hotel Room Fee) | | | 5.250 | | | | 01/01/2022 | | | | 09/30/2019 | A | | | 1,002,690 | |
| 55,000 | | Essex County, NJ Improvement Authority (Newark) | | | 5.000 | | | | 11/01/2020 | | | | 05/06/2020 | B | | | 56,327 | |
| 9,000,000 | | Lyndhurst Township, NJ GO | | | 2.750 | | | | 09/12/2019 | | | | 09/12/2019 | | | | 9,002,970 | |
27 INVESCO OPPENHEIMER SHORT TERM MUNICIPAL FUND
SCHEDULE OF INVESTMENTSContinued
| | | | | | | | | | | | | | | | | | |
Principal
Amount | | | | Coupon | | | Maturity | | | Effective
Maturity* | | | Value | |
| New Jersey (Continued) | | | | | | | | | | | | | |
| $50,000 | | Mountain Lakes, NJ GO | | | 5.000% | | | | 11/15/2020 | | | | 11/15/2019 | A | | $ | 50,399 | |
| 1,000,000 | | NJ Building Authority | | | 5.000 | | | | 06/15/2025 | | | | 06/15/2025 | | | | 1,214,700 | |
| 1,500,000 | | NJ Building Authority | | | 5.000 | | | | 06/15/2025 | | | | 06/15/2025 | | | | 1,777,230 | |
| 1,520,000 | | NJ EDA | | | 5.000 | | | | 06/15/2022 | | | | 06/15/2022 | | | | 1,659,247 | |
| 405,000 | | NJ EDA (Cigarette Tax) | | | 5.000 | | | | 06/15/2020 | | | | 06/15/2020 | | | | 416,109 | |
| 6,500,000 | | NJ EDA (Cigarette Tax) | | | 5.000 | | | | 06/15/2023 | | | | 06/15/2022 | A | | | 7,079,800 | |
| 10,000 | | NJ EDA (Friends of Teaneck Community Charter School)1 | | | 3.500 | | | | 09/01/2022 | | | | 03/21/2021 | B | | | 10,118 | |
| 6,840,000 | | NJ EDA (Motor Vehicle Surcharges) | | | 5.250 | | | | 07/01/2025 | | | | 07/01/2025 | | | | 8,099,449 | |
| 820,000 | | NJ EDA (Motor Vehicle Surcharges) | | | 5.250 | | | | 07/01/2025 | | | | 07/01/2025 | | | | 1,011,487 | |
| 15,000 | | NJ EDA (Municipal Loan Pool) | | | 4.625 | | | | 11/15/2020 | | | | 09/30/2019 | A | | | 15,042 | |
| 2,000,000 | | NJ EDA (School Facilities Construction) | | | 5.000 | | | | 03/01/2023 | | | | 03/01/2023 | | | | 2,231,480 | |
| 3,000,000 | | NJ EDA (School Facilities Construction) | | | 5.000 | | | | 03/01/2025 | | | | 03/01/2023 | A | | | 3,319,710 | |
| 3,010,000 | | NJ EDA (School Facilities Construction) | | | 5.500 | | | | 09/01/2023 | | | | 09/01/2023 | | | | 3,445,607 | |
| 6,000,000 | | NJ EDA (School Facilities Construction) | | | 5.500 | | | | 09/01/2024 | | | | 09/01/2024 | | | | 7,072,920 | |
| 1,000,000 | | NJ Educational Facilities Authority (Higher Education) | | | 5.000 | | | | 06/15/2026 | | | | 06/15/2024 | A | | | 1,140,870 | |
| 400,000 | | NJ Health Care Facilities Financing Authority (Greystone Park Psychiatric Hospital) | | | 5.000 | | | | 09/15/2023 | | | | 09/15/2023 | | | | 453,180 | |
| 5,000 | | NJ Higher Education Student Assistance Authority (Student Loans) | | | 4.750 | | | | 12/01/2021 | | | | 12/01/2019 | A | | | 5,043 | |
| 25,000 | | NJ Higher Education Student Assistance Authority (Student Loans) | | | 5.100 | | | | 12/01/2026 | | | | 12/01/2019 | A | | | 25,235 | |
| 90,000 | | NJ Hsg. & Mtg. Finance Agency | | | 5.000 | | | | 05/01/2021 | | | | 09/30/2019 | A | | | 90,667 | |
| 3,500,000 | | NJ Transportation Trust Fund Authority | | | 5.000 | | | | 06/15/2024 | | | | 06/15/2024 | | | | 4,057,130 | |
| 1,645,000 | | NJ Transportation Trust Fund Authority | | | 5.000 | | | | 06/15/2025 | | | | 06/15/2022 | A | | | 1,800,913 | |
| 5,000,000 | | NJ Transportation Trust Fund Authority | | | 5.000 | | | | 06/15/2028 | | | | 06/15/2026 | A | | | 6,016,400 | |
| 4,505,000 | | NJ Transportation Trust Fund Authority | | | 5.250 | | | | 12/15/2023 | | | | 12/15/2023 | | | | 5,186,111 | |
| 1,370,000 | | NJ Transportation Trust Fund Authority | | | 5.250 | | | | 12/15/2023 | | | | 12/15/2023 | | | | 1,588,227 | |
| 460,000 | | NJ Transportation Trust Fund Authority | | | 5.250 | | | | 06/15/2026 | | | | 06/15/2021 | A | | | 491,087 | |
| 12,160,000 | | NJ Transportation Trust Fund Authority | | | 5.500 | | | | 12/15/2019 | | | | 12/15/2019 | | | | 12,305,069 | |
| 5,000,000 | | NJ Transportation Trust Fund Authority | | | 5.500 | | | | 12/15/2020 | | | | 12/15/2020 | | | | 5,271,000 | |
28 INVESCO OPPENHEIMER SHORT TERM MUNICIPAL FUND
| | | | | | | | | | | | | | | | | | |
Principal
Amount | | | | Coupon | | | Maturity | | | Effective
Maturity* | | | Value | |
| New Jersey (Continued) | | | | | | | | | | | | | |
| $1,000,000 | | NJ Transportation Trust Fund Authority | | | 5.500% | | | | 12/15/2022 | | | | 12/15/2022 | | | $ | 1,133,780 | |
| 3,930,000 | | NJ Transportation Trust Fund Authority | | | 5.750 | | | | 06/15/2020 | | | | 06/15/2020 | | | | 4,067,786 | |
| 515,000 | | North Caldwell, NJ School District | | | 4.000 | | | | 02/15/2023 | | | | 02/15/2020 | A | | | 522,292 | |
| 125,000 | | Salem County, NJ Improvement Authority (Stand Up for Salem) | | | 5.375 | | | | 08/15/2028 | | | | 09/30/2019 | A | | | 125,306 | |
| 25,000 | | Vineland, NJ GO | | | 5.000 | | | | 03/01/2021 | | | | 08/31/2020 | B | | | 25,989 | |
| | | | | | | | | | | | | | | | | 103,252,991 | |
| | | | | | | | | | | | | | | | | | | |
| New Mexico—0.4% | | | | | | | | | | | | | |
| 10,000 | | Carlsbad, NM Joint Water & Sewer | | | 4.625 | | | | 06/01/2024 | | | | 09/30/2019 | A | | | 10,025 | |
| 210,000 | | Farmington, NM Hospital (San Juan Regional Medical Center) | | | 5.000 | | | | 06/01/2023 | | | | 09/30/2019 | A | | | 210,630 | |
| 1,555,000 | | NM Hospital Equipment Loan Council (Gerald Champion Memorial Hospital) | | | 4.750 | | | | 07/01/2022 | | | | 07/12/2021 | B | | | 1,627,650 | |
| 1,550,000 | | NM Hospital Equipment Loan Council (Haverland Carter Lifestyle) | | | 2.250 | | | | 07/01/2023 | | | | 01/01/2021 | A | | | 1,553,580 | |
| 1,550,000 | | NM Hospital Equipment Loan Council (Haverland Carter Lifestyle) | | | 2.375 | | | | 07/01/2024 | | | | 01/01/2021 | A | | | 1,553,627 | |
| 105,000 | | Saltillo, NM Public Improvement District | | | 4.000 | | | | 10/01/2024 | | | | 10/01/2024 | | | | 118,141 | |
| 160,000 | | Saltillo, NM Public Improvement District | | | 4.000 | | | | 10/01/2025 | | | | 10/01/2025 | | | | 183,462 | |
| 180,000 | | University of New Mexico | | | 6.000 | | | | 06/01/2021 | | | | 12/06/2020 | B | | | 190,708 | |
| 55,000 | | University of New Mexico | | | 6.500 | | | | 06/01/2021 | | | | 09/16/2020 | A | | | 58,686 | |
| | | | | | | | | | | | | | | | | 5,506,509 | |
| | | | | | | | | | | | | | | | | | | |
| New York—7.7% | | | | | | | | | | | | | |
| 1,285,000 | | Buffalo & Erie County, NY Industrial Land Devel. (Medaille College) | | | 5.000 | | | | 04/01/2022 | | | | 04/13/2021 | B | | | 1,325,221 | |
| 26,190,000 | | Build NYC Resource Corp. (Blue School) Floaters Series 2018-XF1071 Trust | | | 1.650 2 | | | | 09/01/2046 | | | | 09/13/2019 | A | | | 26,190,000 | |
| 19,125,000 | | Build NYC Resource Corp. (Richmond Medical Center) Floaters Series 2019-XF1080 Trust | | | 1.700 2 | | | | 12/01/2050 | | | | 09/13/2019 | A | | | 19,125,000 | |
| 750,000 | | Dutchess County, NY IDA (Bard College) | | | 5.000 | | | | 08/01/2022 | | | | 09/30/2019 | A | | | 750,660 | |
| 5,000 | | Hyde Park, NY GO | | | 4.100 | | | | 06/01/2023 | | | | 09/30/2019 | A | | | 5,013 | |
| 160,000 | | Jefferson County, NY IDA Solid Waste Disposal (Reenergy Black River LLC) | | | 4.750 | | | | 01/01/2020 | | | | 01/01/2020 | | | | 159,970 | |
| 1,781,845 | | Johnson City, NY GO | | | 4.000 | | | | 10/03/2019 | | | | 10/03/2019 | | | | 1,783,680 | |
| 25,000 | | Marlborough, NY GO | | | 4.000 | | | | 06/15/2020 | | | | 09/30/2019 | A | | | 25,055 | |
29 INVESCO OPPENHEIMER SHORT TERM MUNICIPAL FUND
SCHEDULE OF INVESTMENTSContinued
| | | | | | | | | | | | | | | | | | |
Principal
Amount | | | | Coupon | | | Maturity | | | Effective
Maturity* | | | Value | |
| New York (Continued) | | | | | | | | | | | | | |
| $3,000,000 | | Nassau County, NY Tobacco Settlement Corp. (TASC) | | | 5.250%7 | | | | 06/01/2026 | | | | 12/01/2019 | A | | $ | 2,999,910 | |
| 500,000 | | New Rochelle, NY City School District | | | 4.000 | | | | 11/15/2020 | | | | 11/15/2019 | A | | | 503,110 | |
| 345,000 | | NY Counties Tobacco Trust VI (TASC) | | | 4.000 | | | | 06/01/2020 | | | | 06/01/2020 | | | | 351,151 | |
| 350,000 | | NY Counties Tobacco Trust VI (TASC) | | | 5.000 | | | | 06/01/2021 | | | | 06/01/2021 | | | | 370,262 | |
| 300,000 | | NY Counties Tobacco Trust VI (TASC) | | | 5.000 | | | | 06/01/2022 | | | | 06/01/2022 | | | | 326,364 | |
| 685,000 | | NY Counties Tobacco Trust VI (TASC) | | | 5.000 | | | | 06/01/2023 | | | | 06/01/2023 | | | | 762,871 | |
| 460,000 | | NY Counties Tobacco Trust VI (TASC) | | | 5.000 | | | | 06/01/2026 | | | | 06/01/2026 | | | | 539,235 | |
| 95,000 | | NY Triborough Bridge & Tunnel Authority | | | 6.125 | | | | 01/01/2021 | | | | 04/20/2020 | B | | | 97,958 | |
| 6,455,000 | | NYC GO | | | 5.000 | | | | 08/01/2022 | | | | 08/01/2021 | A | | | 6,945,580 | |
| 9,070,000 | | NYC GO | | | 5.000 | | | | 10/01/2022 | | | | 10/01/2022 | | | | 10,148,786 | |
| 20,000,000 | | NYC Transitional Finance Authority (Future Tax) | | | 1.450 2 | | | | 11/01/2029 | | | | 09/03/2019 | A | | | 20,000,000 | |
| 45,000 | | NYC Trust for Cultural Resources (Carnegie Hall/Carnegie Hall Society Obligated Group) | | | 5.000 | | | | 12/01/2029 | | | | 12/01/2019 | A | | | 45,436 | |
| 825,000 | | NYS DA (ALIA-PSCH) | | | 4.800 | | | | 12/01/2023 | | | | 12/15/2021 | B | | | 845,666 | |
| 1,165,000 | | NYS Local Government Assistance Corp. | | | 5.000 | | | | 04/01/2021 | | | | 04/01/2021 | | | | 1,213,907 | |
| 1,715,000 | | NYS UDC (State Facilities) | | | 5.700 | | | | 04/01/2020 | | | | 04/01/2020 | | | | 1,759,281 | |
| 695,000 | | Orange County, NY Funding Corp. (Mount St. Mary College) | | | 4.000 | | | | 07/01/2024 | | | | 07/01/2022 | A | | | 737,437 | |
| 1,025,000 | | Port Authority NY/NJ (JFK International Air Terminal) | | | 5.000 | | | | 12/01/2020 | | | | 06/05/2020 | B | | | 1,054,407 | |
| 60,000 | | Ramapo, NY GO | | | 4.000 | | | | 08/01/2020 | | | | 09/30/2019 | A | | | 60,130 | |
| 100,000 | | Ramapo, NY GO | | | 4.000 | | | | 08/01/2021 | | | | 09/30/2019 | A | | | 100,222 | |
| 10,000 | | Rochester, NY GO | | | 4.000 | | | | 10/01/2020 | | | | 09/30/2019 | A | | | 10,022 | |
| 30,000 | | Suffolk County, NY IDA (Dowling College)6,8 | | | 6.700 | | | | 12/01/2020 | | | | 12/01/2020 | | | | 0 | |
| | | | | | | | | | | | | | | | | 98,236,334 | |
| | | | | | | | | | | | | | | | | | | |
| North Carolina—0.4% | | | | | | | | | | | | | |
| 10,000 | | Buncombe County, NC GO COP | | | 4.250 | | | | 06/01/2024 | | | | 09/30/2019 | A | | | 10,024 | |
| 2,485,000 | | Charlotte, NC COP | | | 3.000 | | | | 06/01/2022 | | | | 09/30/2019 | A | | | 2,488,628 | |
| 10,000 | | Haywood County, NC GO | | | 4.125 | | | | 03/01/2027 | | | | 09/30/2019 | A | | | 10,023 | |
| 35,000 | | Johnson County, NC GO | | | 4.000 | | | | 02/01/2020 | | | | 09/30/2019 | A | | | 35,077 | |
| 2,875,000 | | NC Medical Care Commission Retirement Facilities (Salemtowne) | | | 3.550 | | | | 10/01/2024 | | | | 04/01/2020 | A | | | 2,891,273 | |
| 5,000 | | NC Municipal Power Agency No. 1 (Catawba Electric) | | | 4.250 | | | | 01/01/2022 | | | | 09/30/2019 | A | | | 5,010 | |
| 5,000 | | University of North Carolina System | | | 4.250 | | | | 10/01/2021 | | | | 09/30/2019 | A | | | 5,012 | |
30 INVESCO OPPENHEIMER SHORT TERM MUNICIPAL FUND
| | | | | | | | | | | | | | | | | | |
Principal
Amount | | | | Coupon | | | Maturity | | | Effective
Maturity* | | | Value | |
| North Carolina (Continued) | | | | | | | | | | | | | |
| $10,000 | | University of North Carolina System | | | 4.750% | | | | 10/01/2028 | | | | 09/30/2019 | A | | $ | 10,024 | |
| 5,000 | | University of North Carolina System (NCATSU/UNCC/UNCG/UNCW/UNCA Obligated Group) | | | 5.000 | | | | 04/01/2022 | | | | 09/30/2019 | A | | | 5,014 | |
| 5,000 | | Winston-Salem, NC GO COP | | | 4.250 | | | | 06/01/2021 | | | | 09/30/2019 | A | | | 5,012 | |
| | | | | | | | | | | | | | | | | 5,465,097 | |
| | | | | | | | | | | | | | | | | | | |
| North Dakota—0.6% | | | | | | | | | | | | | |
| 3,495,000 | | Burleigh County, ND Sales Tax | | | 3.250 | | | | 11/01/2023 | | | | 11/01/2021 | A | | | 3,587,373 | |
| 10,000 | | Grand Forks, ND GO | | | 4.125 | | | | 12/01/2020 | | | | 09/30/2019 | A | | | 10,024 | |
| 1,265,000 | | Grand Forks, ND Health Care System (Altru Health System) | | | 4.000 | | | | 12/01/2027 | | | | 12/01/2021 | A | | | 1,314,272 | |
| 1,000,000 | | Horace, ND GO1 | | | 2.350 | | | | 10/01/2021 | | | | 10/01/2021 | | | | 999,640 | |
| 1,500,000 | | Horace, ND GO | | | 2.500 | | | | 08/01/2021 | | | | 08/01/2020 | A | | | 1,513,335 | |
| 100,000 | | West Fargo, ND GO | | | 4.100 | | | | 11/01/2022 | | | | 09/30/2019 | A | | | 100,232 | |
| | | | | | | | | | | | | | | | | 7,524,876 | |
| | | | | | | | | | | | | | | | | | | |
| Ohio—1.4% | | | | | | | | | | | | | |
| 75,000 | | Akron, OH Waterworks | | | 4.000 | | | | 03/01/2022 | | | | 09/30/2019 | A | | | 75,157 | |
| 1,355,000 | | Butler County, OH Hospital Facilities (UCH/UCHS/UCMC/WCHosp/UCPC Obligated Group) | | | 5.500 | | | | 11/01/2022 | | | | 11/01/2020 | A | | | 1,424,864 | |
| 2,905,000 | | Cleveland, OH Waterworks (Dept. of Public Utilities Division) | | | 5.500 | | | | 01/01/2021 | | | | 07/07/2020 | B | | | 3,012,630 | |
| 670,000 | | Cleveland-Cuyahoga County, OH Port Authority | | | 5.750 | | | | 11/15/2020 | | | | 05/21/2020 | B | | | 690,569 | |
| 10,000 | | Dayton, OH GO | | | 4.625 | | | | 12/01/2029 | | | | 09/30/2019 | A | | | 10,024 | |
| 30,000 | | Deerfield Township, OH Tax Increment | | | 5.000 | | | | 12/01/2025 | | | | 09/30/2019 | A | | | 30,083 | |
| 150,000 | | Frontier, OH Local School District | | | 6.500 | | | | 12/01/2019 | | | | 12/01/2019 | | | | 151,905 | |
| 10,000 | | Greene County, OH University Hsg. (Central State University) | | | 5.000 | | | | 09/01/2024 | | | | 09/26/2019 | A | | | 10,005 | |
| 10,000 | | Milton-Union, OH Exempted Village School District (School Energy Conservation) | | | 4.000 | | | | 12/01/2024 | | | | 09/30/2019 | A | | | 10,022 | |
| 225,000 | | Muskingum County, OH GO | | | 4.000 | | | | 12/01/2021 | | | | 12/01/2019 | A | | | 226,604 | |
| 2,000,000 | | OH Air Quality Devel. Authority (First Energy Generation)6 | | | 5.625 | | | | 06/01/2018 | | | | 06/01/2018 | | | | 2,040,000 | |
| 1,600,000 | | OH Higher Education Facility Commission (CCCFL/CCFnd/ LH/FHMH/MedHosp/CCFLH/CCHSE/CCHlthS/CCAH Obligated Group) | | | 1.420 2 | | | | 01/01/2039 | | | | 09/06/2019 | A | | | 1,600,000 | |
| 1,830,000 | | OH Higher Educational Facility Commission (Hiram College) | | | 6.000 | | | | 10/01/2021 | | | | 09/30/2019 | A | | | 1,833,148 | |
31 INVESCO OPPENHEIMER SHORT TERM MUNICIPAL FUND
SCHEDULE OF INVESTMENTSContinued
| | | | | | | | | | | | | | | | | | |
Principal
Amount | | | | Coupon | | | Maturity | | | Effective
Maturity* | | | Value | |
| Ohio (Continued) | | | | | | | | | | | | | |
| $2,460,000 | | OH Higher Educational Facility Commission (University of Dayton)4 | | | 2.983% | | | | 12/01/2023 | | | | 12/01/2023 | | | $ | 2,533,579 | |
| 3,000,000 | | OH Hospital (Aultman Health Foundation) | | | 5.000 | | | | 12/01/2023 | | | | 12/01/2023 | | | | 3,259,320 | |
| 875,000 | | OH River South Authority (Lazarus Building Redevel.) | | | 5.750 | | | | 12/01/2027 | | | | 09/30/2019 | A | | | 877,144 | |
| 10,000 | | Olmstead Falls, OH City School District | | | 4.400 | | | | 12/01/2019 | | | | 09/30/2019 | A | | | 10,024 | |
| 50,000 | | Sandusky, OH GO | | | 4.000 | | | | 12/01/2019 | | | | 09/30/2019 | A | | | 50,111 | |
| 20,000 | | Scioto County, OH GO | | | 4.250 | | | | 12/01/2026 | | | | 09/30/2019 | A | | | 20,042 | |
| 25,000 | | Stark County, OH GO | | | 4.375 | | | | 12/01/2024 | | | | 09/30/2019 | A | | | 25,072 | |
| | | | | | | | | | | | | | | | | 17,890,303 | |
| | | | | | | | | | | | | | | | | | | |
| Oklahoma—0.3% | | | | | | | | | | | | | |
| 475,000 | | McGee Creek, OK Water Authority | | | 6.000 | | | | 01/01/2023 | | | | 07/29/2021 | B | | | 513,494 | |
| 2,190,000 | | OK Devel. Finance Authority (Haverland Carter Lifestyle Group/La Vida Llena/Sommerset Neighborhood Obligated Group) | | | 5.000 | | | | 07/01/2025 | | | | 03/03/2023 | B | | | 2,399,342 | |
| 150,000 | | OK Devel. Finance Authority (Master Oklahoma Higher Education) | | | 4.000 | | | | 12/01/2023 | | | | 12/01/2019 | A | | | 151,098 | |
| 320,000 | | OK Municipal Power Authority | | | 5.750 | | | | 01/01/2024 | | | | 11/24/2021 | B | | | 351,805 | |
| 14,211 | | Oklahoma County, OK HFA (Single Family Mtg.)1 | | | 4.300 | | | | 10/01/2020 | | | | 09/30/2019 | A | | | 14,245 | |
| | | | | | | | | | | | | | | | | 3,429,984 | |
| | | | | | | | | | | | | | | | | | | |
| Oregon—0.2% | | | | | | | | | | | | | |
| 1,150,000 | | Clackamas County, OR Hospital Facilities Authority (Mary’s Woods at Marylhurst) | | | 2.800 | | | | 05/15/2024 | | | | 11/15/2019 | A | | | 1,151,610 | |
| 765,000 | | Clackamas County, OR Hospital Facilities Authority (Mary’s Woods at Marylhurst) | | | 3.200 | | | | 05/15/2025 | | | | 05/15/2020 | A | | | 770,355 | |
| 5,000 | | Clackamas County, OR School District No. 86 | | | 4.350 | | | | 06/15/2025 | | | | 09/30/2019 | A | | | 5,011 | |
| 270,000 | | Molalla, OR Sewer | | | 4.000 | | | | 03/01/2022 | | | | 03/01/2020 | A | | | 273,281 | |
| 80,000 | | OR Health & Science University | | | 2.975 3 | | | | 07/01/2021 | | | | 01/10/2021 | B | | | 76,425 | |
| | | | | | | | | | | | | | | | | 2,276,682 | |
| | | | | | | | | | | | | | | | | | | |
| Other Territory—1.9% | | | | | | | | | | | | | |
| 19,755,000 | | Public Hsg. Capital Fund Multi-State Revenue Trust I Floaters Series 2017-XG0136 Trust | | | 1.850 2 | | | | 12/01/2029 | | | | 09/06/2019 | A | | | 19,755,000 | |
| 3,430,000 | | Public Hsg. Capital Fund Multi-State Revenue Trust II Floaters Series 2017-XG0137 Trust | | | 1.850 2 | | | | 09/01/2027 | | | | 09/06/2019 | A | | | 3,430,000 | |
32 INVESCO OPPENHEIMER SHORT TERM MUNICIPAL FUND
| | | | | | | | | | | | | | | | | | |
Principal
Amount | | | | Coupon | | | Maturity | | | Effective
Maturity* | | | Value | |
| Other Territory (Continued) | | | | | | | | | | | | | |
| $297,800 | | Public Hsg. Capital Fund Multi-State Revenue Trust III | | | 5.000% | | | | 07/01/2022 | | | | 05/17/2020 | A | | $ | 299,735 | |
| | | | | | | | | | | | | | | | | 23,484,735 | |
| | | | | | | | | | | | | | | | | | | |
| Pennsylvania—4.6% | | | | | | | | | | | | | |
| 445,000 | | Allegheny County, PA HEBA (Robert Morris University) | | | 5.000 | | | | 10/15/2026 | | | | 02/24/2025 | B | | | 511,336 | |
| 465,000 | | Allegheny County, PA Redevel. Authority (Pittsburgh Mills) | | | 5.600 | | | | 07/01/2023 | | | | 02/04/2022 | B | | | 463,693 | |
| 1,780,000 | | Bangor, PA Area School District | | | 2.500 | | | | 03/15/2023 | | | | 09/30/2019 | A | | | 1,781,282 | |
| 2,550,000 | | Berks County, PA Municipal Authority (Reading Hospital Medical Center) [MUNIPSA+150] | | | 2.850 5 | | | | 11/01/2039 | | | | 07/01/2020 | A | | | 2,573,715 | |
| 310,000 | | Coatesville, PA Area School District | | | 5.000 | | | | 12/01/2021 | | | | 12/01/2021 | | | | 333,445 | |
| 400,000 | | Coatesville, PA Area School District | | | 5.000 | | | | 12/01/2022 | | | | 12/01/2022 | | | | 443,336 | |
| 400,000 | | Coatesville, PA Area School District | | | 5.000 | | | | 12/01/2023 | | | | 06/01/2023 | A | | | 449,464 | |
| 425,000 | | Coatesville, PA Area School District | | | 5.000 | | | | 12/01/2024 | | | | 06/01/2023 | A | | | 477,522 | |
| 45,000 | | Erie County, PA Hospital Authority (St. Mary’s Home of Erie) | | | 4.500 | | | | 07/01/2023 | | | | 09/30/2019 | A | | | 45,115 | |
| 3,100,000 | | Erie County, PA Hospital Authority (St. Vincent’s Health) | | | 7.000 | | | | 07/01/2027 | | | | 07/01/2020 | A | | | 3,248,149 | |
| 365,000 | | Hazleton, PA GO | | | 4.100 | | | | 12/01/2019 | | | | 09/30/2019 | A | | | 366,015 | |
| 2,075,000 | | Luzerne County, PA GO | | | 5.000 | | | | 05/15/2022 | | | | 05/15/2022 | | | | 2,269,926 | |
| 2,260,000 | | Luzerne County, PA GO | | | 5.000 | | | | 05/15/2023 | | | | 05/15/2023 | | | | 2,538,997 | |
| 2,795,000 | | Luzerne County, PA GO | | | 5.000 | | | | 11/15/2023 | | | | 11/15/2023 | | | | 3,183,813 | |
| 1,525,000 | | Luzerne County, PA GO | | | 6.750 | | | | 11/01/2023 | | | | 11/01/2019 | A | | | 1,537,764 | |
| 500,000 | | Luzerne County, PA GO | | | 7.000 | | | | 11/01/2026 | | | | 11/01/2019 | A | | | 504,390 | |
| 1,380,000 | | Montgomery County, PA HEHA (Holy Redeemer Health System) | | | 5.000 | | | | 10/01/2022 | | | | 10/01/2022 | | | | 1,497,341 | |
| 1,165,000 | | Montgomery County, PA HEHA (Holy Redeemer Health System) | | | 5.000 | | | | 10/01/2024 | | | | 10/01/2024 | | | | 1,323,568 | |
| 500,000 | | Oswayo Valley, PA School District | | | 2.000 | | | | 02/15/2020 | | | | 09/30/2019 | A | | | 500,220 | |
| 6,040,000 | | PA Convention Center Authority | | | 6.000 | | | | 09/01/2019 | | | | 09/01/2019 | | | | 6,040,000 | |
| 2,750,000 | | PA EDFA (US Airways Group) | | | 8.000 | | | | 05/01/2029 | | | | 05/01/2020 | A | | | 2,863,905 | |
| 5,000 | | PA HEFA | | | 4.000 | | | | 06/15/2021 | | | | 09/30/2019 | A | | | 5,010 | |
| 5,000 | | PA HEFA | | | 4.000 | | | | 06/15/2022 | | | | 09/30/2019 | A | | | 5,011 | |
| 15,000 | | PA HEFA (Pennsylvania State System of Higher Education)1 | | | 5.000 | | | | 06/15/2021 | | | | 09/30/2019 | A | | | 15,042 | |
| 6,200,000 | | PA State Public School Building Authority (Philadelphia School District) | | | 5.000 | | | | 06/01/2023 | | | | 06/01/2023 | | | | 7,008,108 | |
| 1,500,000 | | PA Turnpike Commission [MUNIPSA+60] | | | 1.950 5 | | | | 12/01/2023 | | | | 06/01/2023 | A | | | 1,516,665 | |
33 INVESCO OPPENHEIMER SHORT TERM MUNICIPAL FUND
SCHEDULE OF INVESTMENTSContinued
| | | | | | | | | | | | | | | | | | |
Principal
Amount | | | | Coupon | | | Maturity | | | Effective
Maturity* | | | Value | |
| Pennsylvania (Continued) | | | | | | | | | | | | | |
| $1,765,000 | | Philadelphia, PA Authority for Industrial Devel. (Cathedral Village) | �� | | 5.000% | | | | 04/01/2033 | | | | 04/01/2023 | A | | $ | 1,880,431 | |
| 155,000 | | Philadelphia, PA Authority for Industrial Devel. (Mathematics Science & Technology Community Charter School) | | | 5.000 | | | | 08/01/2020 | | | | 08/01/2020 | | | | 160,289 | |
| 520,000 | | Philadelphia, PA Authority for Industrial Devel. (Tacony Academy Charter School) | | | 6.250 | | | | 06/15/2023 | | | | 01/13/2022 | B | | | 559,255 | |
| 290,000 | | Philadelphia, PA Regional Port Authority | | | 5.000 | | | | 09/01/2019 | | | | 09/01/2019 | | | | 290,000 | |
| 440,000 | | Pittsburgh, PA Urban Redevel. Authority (Eva P Mitchell Hsg.) | | | 4.200 | | | | 10/20/2024 | | | | 10/20/2019 | A | | | 441,553 | |
| 5,000,000 | | Pittsburgh, PA Water & Sewer Authority [US0001M+64] | | | 2.201 5 | | | | 09/01/2040 | | | | 06/01/2020 | A | | | 5,001,900 | |
| 1,955,000 | | Pottsville, PA Hospital Authority (LVHN/LVlyH/LVHM/SRehC/SRMC/ NPHC/SMCSJS/PMCtr/PHSys Obligated Group) | | | 5.750 | | | | 07/01/2022 | | | | 07/15/2021 | B | | | 2,110,129 | |
| 1,025,000 | | Reading, PA School District | | | 3.125 | | | | 04/01/2024 | | | | 09/30/2019 | A | | | 1,025,687 | |
| 70,000 | | Sayre, PA HEFA (Guthrie Clinic) [US0003M+78] | | | 2.469 5 | | | | 12/01/2024 | | | | 12/01/2019 | A | | | 70,148 | |
| 655,000 | | Southmoreland, PA School District | | | 2.250 | | | | 04/01/2024 | | | | 09/30/2019 | A | | | 655,570 | |
| 500,000 | | St. Mary Hospital Authority, PA Health System (Catholic Health East) | | | 5.000 | | | | 11/15/2021 | | | | 05/15/2020 | A | | | 513,640 | |
| 400,000 | | Sto Rox, PA School District | | | 2.750 | | | | 12/15/2019 | | | | 09/30/2019 | A | | | 400,460 | |
| 660,000 | | Tinicum Township, PA (Delaware County Sewage Authority)1 | | | 4.250 | | | | 09/01/2022 | | | | 09/23/2019 | A | | | 661,808 | |
| 1,025,000 | | Washington County, PA Redevel. Authority | | | 5.000 | | | | 07/01/2028 | | | | 02/22/2026 | A | | | 1,101,803 | |
| 1,010,000 | | Wilkes-Barre, PA Area School District | | | 5.000 | | | | 08/01/2024 | | | | 08/01/2024 | | | | 1,182,205 | |
| 1,160,000 | | Wilkes-Barre, PA Area School District | | | 5.000 | | | | 08/01/2026 | | | | 08/01/2026 | | | | 1,419,074 | |
| | | | | | | | | | | | | | | | | 58,976,784 | |
| | | | | | | | | | | | | | | | | | | |
| Rhode Island—0.1% | | | | | | | | | | | | | |
| 10,000 | | RI Clean Water Finance Agency | | | 4.500 | | | | 10/01/2022 | | | | 10/01/2022 | | | | 11,042 | |
| 50,000 | | RI Economic Devel. Corp. (University of Rhode Island Steam Generation Facility) | | | 5.000 | | | | 11/01/2019 | | | | 09/30/2019 | A | | | 50,155 | |
| 1,000,000 | | RI Student Loan Authority | | | 3.250 | | | | 12/01/2022 | | | | 12/01/2020 | A | | | 1,020,330 | |
| 155,000 | | RI Student Loan Authority | | | 4.100 | | | | 12/01/2019 | | | | 09/30/2019 | A | | | 155,400 | |
| | | | | | | | | | | | | | | | | 1,236,927 | |
34 INVESCO OPPENHEIMER SHORT TERM MUNICIPAL FUND
| | | | | | | | | | | | | | | | | | |
Principal
Amount | | | | Coupon | | | Maturity | | | Effective
Maturity* | | | Value | |
| South Carolina—1.4% | | | | | | | | | | | | | |
| $620,000 | | Florence-Darlington, SC Commission for Technical Education | | | 5.000% | | | | 03/01/2028 | | | | 09/01/2023 | A | | $ | 691,548 | |
| 10,000 | | Greenville County, SC Special Source | | | 4.000 | | | | 04/01/2020 | | | | 09/30/2019 | A | | | 10,021 | |
| 25,000 | | SC Jobs-EDA (FMU Student Hsg.) | | | 4.250 | | | | 08/01/2024 | | | | 09/30/2019 | A | | | 25,045 | |
| 6,500,000 | | SC Jobs-EDA (Royal Live Oaks Academy of the Arts & Sciences Charter School) | | | 3.000 | | | | 08/01/2020 | | | | 02/01/2020 | A | | | 6,522,490 | |
| 10,000,000 | | SC Public Service Authority (Santee Cooper) Tender Option Bonds Series 2016-XM0384 Trust | | | 1.600 2 | | | | 06/01/2037 | | | | 09/11/2019 | A | | | 10,000,000 | |
| | | | | | | | | | | | | | | | | 17,249,104 | |
| | | | | | | | | | | | | | | | | | | |
| South Dakota—0.2% | | | | | | | | | | | | | |
| 400,000 | | Minnehaha County, SD | | | 6.000 | | | | 12/01/2023 | | | | 12/01/2020 | A | | | 419,512 | |
| 2,045,000 | | Minnehaha County, SD COP | | | 2.125 | | | | 12/01/2020 | | | | 09/30/2019 | A | | | 2,046,329 | |
| | | | | | | | | | | | | | | | | 2,465,841 | |
| | | | | | | | | | | | | | | | | | | |
| Tennessee—0.5% | | | | | | | | | | | | | |
| 1,250,000 | | Bristol, TN Industrial Devel. Board | | | 4.846 3 | | | | 12/01/2019 | | | | 12/01/2019 | | | | 1,238,362 | |
| 1,000,000 | | Bristol, TN Industrial Devel. Board | | | 4.909 3 | | | | 12/01/2020 | | | | 12/01/2020 | | | | 951,670 | |
| 5,000 | | Chattanooga, TN GO | | | 4.000 | | | | 02/01/2031 | | | | 09/30/2019 | A | | | 5,010 | |
| 50,000 | | Columbia, TN Waterworks | | | 5.125 | | | | 12/01/2022 | | | | 09/30/2019 | A | | | 50,148 | |
| 245,000 | | Elizabethton, TN H&EFB (MSHA/BRMMC/SCCH/NCH Obligated Group) | | | 7.000 | | | | 07/01/2020 | | | | 09/30/2019 | A | | | 256,500 | |
| 10,000 | | Metropolitan Government Nashville & Davidson Counties, TN Electric | | | 4.250 | | | | 05/15/2023 | | | | 09/24/2019 | A | | | 10,019 | |
| 100,000 | | South Blount County, TN Utility District | | | 4.000 | | | | 12/01/2022 | | | | 12/01/2019 | A | | | 100,706 | |
| 3,090,000 | | TN Energy Acquisition Gas Corp. | | | 5.000 | | | | 02/01/2022 | | | | 02/01/2022 | | | | 3,337,633 | |
| 450,000 | | TN Energy Acquisition Gas Corp. | | | 5.250 | | | | 09/01/2019 | | | | 09/01/2019 | | | | 450,000 | |
| 5,000 | | TN Local Devel. Authority | | | 4.125 | | | | 03/01/2023 | | | | 09/30/2019 | A | | | 5,011 | |
| | | | | | | | | | | | | | | | | 6,405,059 | |
| | | | | | | | | | | | | | | | | | | |
| Texas—14.1% | | | | | | | | | | | | | |
| 530,000 | | Arlington, TX Higher Education Finance Corp. (Leadership Prep School) | | | 4.000 | | | | 06/15/2026 | | | | 05/27/2021 | A | | | 540,489 | |
| 29,920,000 | | Austin, TX GO | | | 5.250 | | | | 05/15/2025 | | | | 06/26/2023 | B | | | 34,534,562 | |
| 1,200,000 | | Board of Managers Joint Guadalupe County-City of Seguin, TX Hospital | | | 5.000 | | | | 12/01/2023 | | | | 12/01/2023 | | | | 1,312,764 | |
| 1,865,000 | | Board of Managers Joint Guadalupe County-City of Seguin, TX Hospital | | | 5.000 | | | | 12/01/2024 | | | | 12/01/2024 | | | | 2,074,775 | |
35 INVESCO OPPENHEIMER SHORT TERM MUNICIPAL FUND
SCHEDULE OF INVESTMENTSContinued
| | | | | | | | | | | | | | | | | | |
Principal
Amount | | | | Coupon | | | Maturity | | | Effective
Maturity* | | | Value | |
| Texas (Continued) | | | | | | | | | | | | | |
| $125,000 | | Borden County, TX Independent School District | | | 4.250% | | | | 02/15/2022 | | | | 09/30/2019 | A | | $ | 125,279 | |
| 50,000 | | Borden County, TX Independent School District | | | 4.375 | | | | 02/15/2023 | | | | 09/30/2019 | A | | | 50,114 | |
| 300,000 | | Bridgestone, TX Municipal Utility District | | | 5.500 | | | | 11/01/2020 | | | | 11/01/2019 | A | | | 302,097 | |
| 100,000 | | Bryan, TX Waterworks & Sewer | | | 4.125 | | | | 07/01/2023 | | | | 09/05/2019 | A | | | 100,008 | |
| 50,000 | | Burney Road, TX Municipal Utility District-Fort Bend County | | | 4.000 | | | | 09/01/2024 | | | | 09/30/2019 | A | | | 50,114 | |
| 85,000 | | Cleburne, TX Waterworks & Sewer System | | | 4.000 | | | | 02/15/2020 | | | | 09/30/2019 | A | | | 85,169 | |
| 665,000 | | Clifton, TX Higher Education Finance Corp. (International American Education Federation) | | | 5.000 | | | | 08/15/2021 | | | | 08/15/2021 | | | | 694,459 | |
| 675,000 | | El Paso County, TX Hospital District COP | | | 5.000 | | | | 08/15/2025 | | | | 08/15/2023 | A | | | 753,489 | |
| 275,000 | | Elgin, TX GO | | | 4.400 | | | | 07/15/2027 | | | | 09/30/2019 | A | | | 275,564 | |
| 1,085,000 | | Fort Bend County, TX Levee Improvement District No. 11, Series 2008 | | | 4.050 | | | | 09/01/2027 | | | | 09/30/2019 | A | | | 1,087,658 | |
| 1,785,000 | | Fort Bend County, TX Levee Improvement District No. 11, Series 2011 | | | 3.625 | | | | 09/01/2029 | | | | 09/30/2019 | A | | | 1,787,445 | |
| 495,000 | | Fort Bend County, TX Municipal Utility District No. 116, Series 2012 | | | 3.000 | | | | 09/01/2019 | | | | 09/01/2019 | | | | 495,000 | |
| 515,000 | | Fort Bend County, TX Municipal Utility District No. 118, Series 2012 | | | 3.000 | | | | 09/01/2019 | | | | 09/01/2019 | | | | 515,000 | |
| 210,000 | | Fort Bend County, TX Municipal Utility District No. 118, Series 2013 | | | 3.000 | | | | 09/01/2019 | | | | 09/01/2019 | | | | 210,000 | |
| 210,000 | | Fort Bend County, TX Municipal Utility District No. 121, Series 2012A | | | 3.000 | | | | 09/01/2019 | | | | 09/01/2019 | | | | 210,000 | |
| 140,000 | | Fort Bend County, TX Municipal Utility District No. 138, Series 2015 | | | 2.000 | | | | 09/01/2019 | | | | 09/01/2019 | | | | 140,000 | |
| 115,000 | | Fort Bend County, TX Municipal Utility District No. 171 | | | 5.000 | | | | 09/01/2019 | | | | 09/01/2019 | | | | 115,000 | |
| 20,000 | | Fort Bend County, TX Municipal Utility District No. 30, Series 2010 | | | 4.000 | | | | 09/01/2019 | | | | 09/01/2019 | | | | 20,000 | |
| 300,000 | | Fort Bend County, TX Municipal Utility District No. 30, Series 2012 | | | 3.000 | | | | 09/01/2019 | | | | 09/01/2019 | | | | 300,000 | |
| 235,000 | | Fort Bend County, TX Municipal Utility District No. 34, Series 2012 | | | 2.000 | | | | 09/01/2019 | | | | 09/01/2019 | | | | 235,000 | |
| 120,000 | | Fort Bend County, TX Municipal Utility District No. 34, Series 2015 | | | 2.000 | | | | 09/01/2019 | | | | 09/01/2019 | | | | 120,000 | |
36 INVESCO OPPENHEIMER SHORT TERM MUNICIPAL FUND
| | | | | | | | | | | | | | | | | | |
Principal
Amount | | | | Coupon | | | Maturity | | | Effective
Maturity* | | | Value | |
| Texas (Continued) | | | | | | | | | | | | | |
| $275,000 | | Garland, TX Independent School District | | | 3.000% | | | | 02/15/2020 | | | | 09/30/2019 | A | | $ | 275,434 | |
| 650,000 | | Grant Road, TX Public Utility District | | | 3.000 | | | | 10/01/2019 | | | | 10/01/2019 | | | | 650,754 | |
| 530,000 | | Harris County, TX Cultural Education Facilities Finance Corp. (TXCH/TXCHF Obligated Group) | | | 5.000 | | | | 10/01/2029 | | | | 10/01/2019 | A | | | 531,558 | |
| 50,000 | | Harris County, TX Flood Control District | | | 5.000 | | | | 10/01/2020 | | | | 09/30/2019 | A | | | 50,750 | |
| 1,650,000 | | Harris County, TX Flood Control District | | | 5.000 | | | | 10/01/2022 | | | | 09/30/2019 | A | | | 1,674,750 | |
| 535,000 | | Harris County, TX Flood Control District | | | 5.000 | | | | 10/01/2023 | | | | 09/30/2019 | A | | | 543,025 | |
| 405,000 | | Harris County, TX Fresh Water Supply District No. 61 | | | 3.000 | | | | 09/01/2019 | | | | 09/01/2019 | | | | 405,000 | |
| 350,000 | | Harris County, TX Municipal Utility District No. 151 | | | 2.000 | | | | 09/01/2019 | | | | 09/01/2019 | | | | 350,000 | |
| 340,000 | | Harris County, TX Municipal Utility District No. 151 | | | 3.000 | | | | 09/01/2019 | | | | 09/01/2019 | | | | 340,000 | |
| 330,000 | | Harris County, TX Municipal Utility District No. 151 | | | 4.000 | | | | 09/01/2020 | | | | 09/30/2019 | A | | | 330,676 | |
| 250,000 | | Harris County, TX Municipal Utility District No. 222 | | | 2.000 | | | | 09/01/2019 | | | | 09/01/2019 | | | | 250,000 | |
| 605,000 | | Harris County, TX Municipal Utility District No. 276 | | | 3.000 | | | | 09/01/2019 | | | | 09/01/2019 | | | | 605,000 | |
| 410,000 | | Harris County, TX Municipal Utility District No. 290 | | | 3.000 | | | | 09/01/2026 | | | | 09/01/2020 | A | | | 415,150 | |
| 915,000 | | Harris County, TX Municipal Utility District No. 367 | | | 3.500 | | | | 09/01/2019 | | | | 09/01/2019 | | | | 915,000 | |
| 590,000 | | Harris County, TX Municipal Utility District No. 370 | | | 2.750 | | | | 12/01/2019 | | | | 12/01/2019 | | | | 592,207 | |
| 345,000 | | Harris County, TX Municipal Utility District No. 372 | | | 3.500 | | | | 09/01/2019 | | | | 09/01/2019 | | | | 345,000 | |
| 2,510,000 | | Harris County, TX Municipal Utility District No. 53 | | | 2.000 | | | | 09/01/2019 | | | | 09/01/2019 | | | | 2,510,000 | |
| 235,000 | | Harris County, TX Municipal Utility District No. 70 | | | 2.000 | | | | 10/01/2019 | | | | 10/01/2019 | | | | 235,134 | |
| 325,000 | | Harris County, TX Water Control & Improvement District No. 110 | | | 3.000 | | | | 09/01/2019 | | | | 09/01/2019 | | | | 325,000 | |
| 275,000 | | Harris County, TX Water Control & Improvement District No. 89 | | | 4.000 | | | | 10/01/2019 | | | | 10/01/2019 | | | | 275,542 | |
| 490,000 | | Hunt, TX Memorial Hospital District | | | 3.700 | | | | 02/15/2020 | | | | 09/30/2019 | A | | | 492,474 | |
| 10,000 | | Hutchins, TX GO | | | 4.000 | | | | 02/15/2025 | | | | 09/30/2019 | A | | | 10,024 | |
| 500,000 | | Irving, TX GO | | | 5.000 | | | | 09/15/2021 | | | | 09/17/2019 | A | | | 500,715 | |
| 250,000 | | Lubbock, TX Independent School District | | | 4.000 | | | | 02/15/2020 | | | | 09/30/2019 | A | | | 250,567 | |
| 140,000 | | Maverick County, TX GO COP | | | 5.000 | | | | 03/01/2020 | | | | 09/30/2019 | A | | | 140,482 | |
37 INVESCO OPPENHEIMER SHORT TERM MUNICIPAL FUND
SCHEDULE OF INVESTMENTSContinued
| | | | | | | | | | | | | | | | | | |
Principal
Amount | | | | Coupon | | | Maturity | | | Effective
Maturity* | | | Value | |
| Texas (Continued) | | | | | | | | | | | | | |
| $365,000 | | New Hope, TX Cultural Educational Facilities Finance Corp. Student Hsg. (A&M University - Collegiate Hsg. San Antonio I) | | | 5.000% | | | | 04/01/2022 | | | | 04/01/2022 | | | $ | 383,739 | |
| 385,000 | | New Hope, TX Cultural Educational Facilities Finance Corp. Student Hsg. (A&M University - Collegiate Hsg. San Antonio I) | | | 5.000 | | | | 04/01/2023 | | | | 04/01/2023 | | | | 411,176 | |
| 405,000 | | New Hope, TX Cultural Educational Facilities Finance Corp. Student Hsg. (A&M University - Collegiate Hsg. San Antonio I) | | | 5.000 | | | | 04/01/2024 | | | | 04/01/2024 | | | | 438,963 | |
| 6,570,000 | | North Central TX HFDC (Presbyterian Healthcare) | | | 5.750 | | | | 06/01/2026 | | | | 08/22/2023 | B | | | 7,735,781 | |
| 10,000 | | North TX Municipal Water District (Parker Creek) | | | 5.125 | | | | 06/01/2023 | | | | 09/30/2019 | A | | | 10,036 | |
| 365,000 | | Northeast Travis County, TX Utility District | | | 3.000 | | | | 09/01/2020 | | | | 09/30/2019 | A | | | 365,456 | |
| 25,000 | | Northpointe, TX Water Control & Improvement District No. 96 | | | 4.250 | | | | 09/01/2027 | | | | 09/30/2019 | A | | | 25,051 | |
| 100,000 | | Rayford Road, TX Municipal Utility District | | | 4.000 | | | | 03/01/2023 | | | | 09/30/2019 | A | | | 100,230 | |
| 80,000 | | Red River, TX Health Facilities Devel. Corp. (Wichita Falls Retirement Foundation) | | | 4.700 | | | | 01/01/2022 | | | | 01/12/2021 | B | | | 82,535 | |
| 490,000 | | Robstown, TX GO COP | | | 3.345 3 | | | | 03/01/2024 | | | | 03/01/2024 | | | | 437,232 | |
| 150,000 | | Rowlett, TX Special Assessment (Bayside Public Improvement District) | | | 4.900 | | | | 09/15/2024 | | | | 10/23/2022 | B | | | 148,443 | |
| 50,000 | | San Antonio, TX Airport System | | | 5.250 | | | | 07/01/2032 | | | | 09/30/2019 | A | | | 50,892 | |
| 300,000 | | Sienna Plantation, TX Municipal Utility Distron No. 2 | | | 2.000 | | | | 10/01/2019 | | | | 10/01/2019 | | | | 300,204 | |
| 130,000 | | Spencer Road, TX Public Utility District | | | 2.000 | | | | 09/01/2019 | | | | 09/01/2019 | | | | 130,000 | |
| 960,000 | | Tarrant County, TX Cultural Education Facilities Finance Corp. (Buckner Senior Living Ventana) | | | 3.875 | | | | 11/15/2022 | | | | 09/30/2019 | A | | | 960,624 | |
| 10,275,000 | | Texas City, TX Industrial Devel. Corp. (ARCO Pipe Line Co.) | | | 7.375 | | | | 10/01/2020 | | | | 10/01/2020 | | | | 10,926,435 | |
| 795,000 | | Timber Lane, TX Utility District | | | 3.000 | | | | 08/01/2020 | | | | 09/30/2019 | A | | | 795,986 | |
| 29,075,000 | | TX Municipal Gas Acquisition & Supply Corp. | | | 6.250 | | | | 12/15/2026 | | | | 12/10/2023 | B | | | 34,306,465 | |
| 28,835,000 | | TX Municipal Gas Acquisition & Supply Corp. II [MUNIPSA+55]1 | | | 1.900 5 | | | | 09/15/2027 | | | | 01/15/2020 | A | | | 28,461,587 | |
| 1,000,000 | | TX Municipal Gas Acquisition & Supply Corp. III | | | 5.000 | | | | 12/15/2020 | | | | 12/15/2020 | | | | 1,045,470 | |
38 INVESCO OPPENHEIMER SHORT TERM MUNICIPAL FUND
| | | | | | | | | | | | | | | | | | |
Principal
Amount | | | | Coupon | | | Maturity | | | Effective
Maturity* | | | Value | |
| Texas (Continued) | | | | | | | | | | | | | |
| $3,000,000 | | TX SA Energy Acquisition Public Facility Corp. (Gas Supply) | | | 5.500% | | | | 08/01/2020 | | | | 08/01/2020 | | | $ | 3,107,820 | |
| 19,000,000 | | TX Veterans GO | | | 1.320 2 | | | | 06/01/2042 | | | | 09/06/2019 | A | | | 19,000,000 | |
| 10,000,000 | | TX Veterans GO | | | 1.390 2 | | | | 06/01/2050 | | | | 09/06/2019 | A | | | 10,000,000 | |
| 10,000 | | Woodlands Township, TX GO | | | 4.000 | | | | 03/01/2028 | | | | 09/30/2019 | A | | | 10,020 | |
| 530,000 | | Woodlands Township, TX Sales & Hotel Occupancy Tax | | | 4.000 | | | | 03/01/2021 | | | | 09/30/2019 | A | | | 531,177 | |
| | | | | | | | | | | | | | | | | 178,913,550 | |
| | | | | | | | | | | | | | | | | | | |
| Utah—0.8% | | | | | | | | | | | | | |
| 10,000 | | UT Associated Municipal Power Systems | | | 4.250 | | | | 06/01/2020 | | | | 09/30/2019 | A | | | 10,023 | |
| 10,000,000 | | UT Hsg. Corp. (Red Rocks Apartments) Floaters Series 2019-XF1081 Trust | | | 1.750 2 | | | | 03/01/2062 | | | | 09/02/2019 | A | | | 10,000,000 | |
| 25,000 | | Washington County, UT Water Conservancy District | | | 4.000 | | | | 10/01/2020 | | | | 09/30/2019 | A | | | 25,058 | |
| | | | | | | | | | | | | | | | | 10,035,081 | |
| | | | | | | | | | | | | | | | | | | |
| Vermont—0.0% | | | | | | | | | | | | | |
| 200,000 | | Burlington, VT GO | | | 5.000 | | | | 11/01/2021 | | | | 11/01/2021 | | | | 215,328 | |
| | | | | | | | | | | | | | | | | | | |
| Virginia—0.3% | | | | | | | | | | | | | | | | |
| 20,000 | | Bristol, VA Utility System | | | 5.000 | | | | 07/15/2021 | | | | 01/18/2021 | B | | | 20,951 | |
| 5,000 | | Manassas Park, VA GO | | | 5.000 | | | | 01/01/2022 | | | | 09/30/2019 | A | | | 5,015 | |
| 95,000 | | Upper Occoquan, VA Sewage Authority | | | 5.150 | | | | 07/01/2020 | | | | 07/01/2020 | | | | 98,062 | |
| 2,695,000 | | Upper Occoquan, VA Sewage Authority | | | 5.150 | | | | 07/01/2020 | | | | 07/01/2020 | | | | 2,781,860 | |
| 1,045,000 | | VA College Building Authority Educational Facilities (Washington & Lee University) | | | 5.375 | | | | 01/01/2021 | | | | 07/16/2020 | B | | | 1,082,087 | |
| | | | | | | | | | | | | | | | | 3,987,975 | |
| | | | | | | | | | | | | | | | | | | |
| Washington—0.4% | | | | | | | | | | | | | |
| 700,000 | | Central Puget Sound, WA Regional Transit Authority | | | 5.250 | | | | 02/01/2021 | | | | 08/07/2020 | B | | | 726,971 | |
| 25,000 | | Kelso County, WA Hsg. Authority (Chinook & Columbia Apartments) | | | 5.600 | | | | 03/01/2028 | | | | 09/30/2019 | A | | | 25,024 | |
| 5,000 | | King & Snohomish Counties, WA School District No. 417 (Northshore) | | | 4.250 | | | | 12/01/2021 | | | | 09/30/2019 | A | | | 5,012 | |
| 100,000 | | Snohomish County, WA GO | | | 4.000 | | | | 12/01/2019 | | | | 09/30/2019 | A | | | 100,215 | |
| 290,000 | | Snohomish County, WA Public Utility District No. 1 | | | 6.800 | | | | 01/01/2020 | | | | 01/01/2020 | | | | 295,417 | |
| 3,205,000 | | WA GO | | | 5.000 | | | | 07/01/2023 | | | | 07/01/2023 | | | | 3,675,622 | |
| 20,000 | | Yakima, WA Irrigation System | | | 4.500 | | | | 09/01/2024 | | | | 09/30/2019 | A | | | 20,056 | |
| | | | | | | | | | | | | | | | | 4,848,317 | |
39 INVESCO OPPENHEIMER SHORT TERM MUNICIPAL FUND
SCHEDULE OF INVESTMENTSContinued
| | | | | | | | | | | | | | | | | | |
Principal
Amount | | | | Coupon | | | Maturity | | | Effective
Maturity* | | | Value |
| Wisconsin—0.9% | | | | | | | | | | | | | |
| $3,360,000 | | Southeast WI Professional Baseball Park District | | | 5.500% | | | | 12/15/2026 | | | | 12/30/2025 | B | | $ | 4,189,618 | |
| 3,000,000 | | TN Energy Acquisition Gas Corp. | | | 2.650 | | | | 11/01/2020 | | | | 11/01/2019 | A | | | 3,003,810 | |
| 635,000 | | West DePere, WI School District | | | 2.250 | | | | 10/01/2022 | | | | 10/01/2020 | A | | | 641,769 | |
| 165,000 | | West DePere, WI School District | | | 2.600 | | | | 10/01/2025 | | | | 10/01/2020 | A | | | 167,267 | |
| 1,585,000 | | WI Center District | | | 5.250 | | | | 12/15/2023 | | | | 07/28/2022 | B | | | 1,758,478 | |
| 160,000 | | WI Public Finance Authority Charter School (Voyager Foundation) | | | 4.125 | | | | 10/01/2024 | | | | 10/27/2021 | A | | | 167,771 | |
| 800,000 | | WI Public Finance Authority Higher Education Facilities (Wittenberg University) | | | 4.000 | | | | 12/01/2020 | | | | 12/01/2020 | | | | 814,856 | |
| 405,000 | | WI Public Financing Authority Multifamily Hsg. (Trinity-Eagle’s Point) | | | 4.000 | | | | 01/01/2024 | | | | 01/29/2022 | B | | | 417,709 | |
| | | | | | | | | | | | | | | | | 11,161,278 | |
| | | | | | | | | | | | | | | | | | |
| | | | | |
| | | | | | | | | | | | | | | | | | | |
| Total Investments, at Value (Cost $1,237,796,630)—99.2% | | | | | | | | | | | | | | | 1,258,149,789 | |
| Net Other Assets (Liabilities)—0.8 | | | | | | | | | | | | | | | 10,152,725 | |
| | | | | | | | | | | | | | | | | | |
| Net Assets—100.0% | | | | | | | | | | | | | | $ | 1,268,302,514 | |
| | | | | | | | | | | | | | | | | | |
| | | | | | | | | | | | | | | | |
Footnotes to Statement of Investments
| * | Call Date, Put Date or Average Life of Sinking Fund, if applicable, as detailed. |
A. Optional call date; corresponds to the most conservative yield calculation.
B. Average life due to mandatory, or expected, sinking fund principal payments prior to maturity.
C. Average life due to mandatory, or expected, sinking fund principal payments prior to the applicable optional call date.
1. All or a portion of the security position is when-issued or delayed delivery to be delivered and settled after period end. See Note 1 of the accompanying Notes.
2. This interest rate resets periodically. Interest rate shown reflects the rate in effect at period end. The rate on this variable rate security is not based on a published reference rate and spread but is determined by the issuer or agent based on current market conditions.
3. Zero coupon bond reflects effective yield on the original acquisition date.
4. Denotes an inflation-indexed security: coupon or principal are indexed to a consumer price index.
5. Represents the current interest rate for a variable or increasing rate security, which may be fixed for a predetermined period. The interest rate is, or will be as of an established date, determined as [Referenced Rate + Basis-point spread].
6. This security is not accruing income because its issuer has missed or is expected to miss interest and/or principal payments. The rate shown is the contractual interest rate.
7. Denotes a step bond: a zero coupon bond that converts to a fixed or variable interest rate at a designated future date.
8. The value of this security was determined using significant unobservable inputs. See Note 3 of the accompanying Notes.
| | |
To simplify the listings of securities, abbreviations are used per the table below: |
| AHlthS | | Allen Health Systems |
40 INVESCO OPPENHEIMER SHORT TERM MUNICIPAL FUND
| | |
To simplify the listings of securities, abbreviations are used per the table below: (Continued) |
| ALIA | | Alliance of Long Island Agencies |
| AMemH | | Allen Memorial Hospital |
| BHF | | Baptist Health Floyd |
| BRMMC | | Blue Ridge Medical Management Corporation |
| CCAH | | Cleveland Clinic Avon Hospital |
| CCFnd | | Cleveland Clinic Foundation |
| CCFLH | | Cleveland Clinic Florida Hospital |
| CCHlthS | | Cleveland Clinic Health System |
| CCHSE | | Cleveland Clinic Health System - East Region |
| CDA | | Communities Devel. Authority |
| CIHC | | Central Iowa Hospital Corp. |
| CIHP | | Central Iowa Health Properties |
| CIHS | | Central Iowa Health System |
| COP | | Certificates of Participation |
| DA | | Dormitory Authority |
| DHR | | Department of Human Resources |
| DRMCH | | Downey Regional Medical Center Hospital |
| EDA | | Economic Devel. Authority |
| EDFA | | Economic Devel. Finance Authority |
| FHMH | | Fairview Hospital/OH Marymount Hospital |
| FinH | | Finley Hospital |
| FMU | | Francis Marion University |
| FTSHG | | Finley Tri-States Health Group |
| FVO | | FV Operations |
| FVSC | | Friendship Village of South County |
| FVSL | | Friendship Village St. Louis |
| FVWC | | Friendship Village of West County |
| GO | | General Obligation |
| H&EFA | | Health and Educational Facilities Authority |
| H&EFB | | Health and Educational Facilities Board |
| H&HEFA | | Hospitals and Higher Education Facilities Authority |
| HEBA | | Higher Education Building Authority |
| HEFA | | Higher Education Facilities Authority |
| HEHA | | Higher Education and Health Authority |
| HFA | | Housing Finance Agency |
| HFC | | Housing Finance Corp. |
| HFDC | | Health Facilities Devel. Corp. |
| IC | | Interhealth Corporation |
| IDA | | Industrial Devel. Agency |
| IHSys | | Iowa Health System |
| IMC | | IHC Management Corporation |
| JFK | | John Fitzgerald Kennedy |
| LH | | Lowman Home |
| LVHM | | Lehigh Valley Hospital-Muhlenberg |
| LVHN | | Lehigh Valley Health Network |
| LVlyH | | Lehigh Valley Hospital |
| MedHosp | | Medina Hospital |
| MerH | | Meriter Hospital |
| MerHS | | Meriter Health Services |
| MHlthSC | | Methodist Health Services Corp. |
41 INVESCO OPPENHEIMER SHORT TERM MUNICIPAL FUND
SCHEDULE OF INVESTMENTSContinued
| | |
To simplify the listings of securities, abbreviations are used per the table below: (Continued) |
| MMCI | | Methodist Medical Center of Illinois |
| MSHA | | Mountain State Health Alliance |
| MUNIPSA | | SIFMA Municipal Swap Index Yield |
| NCATSU | | North Carolina Agricultural & Technical State University |
| NCH | | Norton Community Hospital |
| NIHC | | Northwest Iowa Hospital Corp. |
| NPHC | | Northeastern Pennsylvania Health Corp. |
| NY/NJ | | New York/New Jersey |
| NYC | | New York City |
| NYS | | New York State |
| PFA | | Public Financing Authority |
| PHSys | | Pocono Health System |
| PIH | | Presbyterian Intercommunity Hospital |
| PMCtr | | Pocono Medical Center |
| ProcH | | Proctor Hospital |
| ProcHC | | Proctor Health Care |
| PSCH | | Professional Service Centers for the Handicapped, Inc. |
| Res Rec | | Resource Recovery Facility |
| RIBS | | Residual Interest Bonds |
| RRMC | | Renown Regional Medical Center |
| RSMMC | | Renown South Meadows Medical Center |
| RTCS | | Renown Transitional Care Services |
| SCCH | | Smyth County Community Hospital |
| SLHlth | | St. Luke’s Healthcare |
| SLHR | | St. Luke’s Health Resources |
| SLHS | | St. Luke’s Health System |
| SLMHC | | St. Luke’s Methodist Hospital Corp. |
| SMCSJS | | Schuylkill Medical Center South Jackson Street |
| SPEARS | | Short Puttable Exempt Adjustable Receipts |
| SRehC | | Simpson Retirement Communities |
| SRMC | | Schuylkill Regional Medical Center |
| TASC | | Tobacco Settlement Asset-Backed Bonds |
| TMCT | | Trinity Medical Center-Terrace |
| TRHS | | Trinity Regional Health System |
| TRMC | | Trinity Regional Medical Center |
| TXCH | | Texas Children’s Hospital |
| TXCHF | | Texas Children’s Hospital Foundation |
| UAH | | Unitypoint at Home |
| UCH | | UC Health |
| UCHS | | UC Healthcare System |
| UCMC | | University of Cincinnati Medical Center |
| UCPC | | University of Cincinnati Physicians Company |
| UDC | | Urban Development Corporation |
| UNCA | | University of North Carolina at Asheville |
| UNCC | | University of North Carolina at Charlotte |
| UNCG | | University of North Carolina at Greensboro |
| UNCW | | University of North Carolina at Wilmington |
| US0001M | | ICE LIBOR USD 1 Month |
| US0003M | | ICE LIBOR USD 3 Month |
| USDA | | U.S. Department of Agriculture |
42 INVESCO OPPENHEIMER SHORT TERM MUNICIPAL FUND
| | |
To simplify the listings of securities, abbreviations are used per the table below: (Continued) |
| WCHosp | | West Chester Hospital |
| WSP | | West St. Paul |
See accompanying Notes to Financial Statements.
43 INVESCO OPPENHEIMER SHORT TERM MUNICIPAL FUND
STATEMENT OF ASSETS AND LIABILITIESAugust 31, 2019
| | | | |
| Assets | | | | |
| Investments, at value (cost $1,237,796,630)—see accompanying schedule of investments | | $ | 1,258,149,789 | |
Cash | | | 25,542,569 | |
| Receivables and other assets: | | | | |
| Interest | | | 12,069,263 | |
| Investments sold | | | 10,233,184 | |
| Shares of beneficial interest sold | | | 4,388,510 | |
| Other | | | 322,520 | |
| | | | |
| Total assets | | | 1,310,705,835 | |
| | | | |
| Liabilities | | | | |
| Payables and other liabilities: | | | | |
| Investments purchased | | | 31,135,000 | |
| Shares of beneficial interest redeemed | | | 10,416,699 | |
| Dividends | | | 306,029 | |
| Transfer and shareholder servicing agent fees | | | 210,436 | |
| Distribution and service plan fees | | | 142,965 | |
| Shareholder communications | | | 40,950 | |
| Advisory fees | | | 27,772 | |
| Trustees’ compensation | | | 25,038 | |
| Administration fees | | | 983 | |
| Other | | | 97,449 | |
| | | | |
| Total liabilities | | | 42,403,321 | |
| | | | |
Net Assets | | $ | 1,268,302,514 | |
| | | | |
| | | | |
| | | | |
| Composition of Net Assets | | | | |
| Shares of beneficial interest | | $ | 1,260,979,625 | |
Total distributable earnings | | | 7,322,889 | |
Net Assets | | $ | 1,268,302,514 | |
| | | | |
| | | | |
44 INVESCO OPPENHEIMER SHORT TERM MUNICIPAL FUND
| | | | |
| Net Asset Value Per Share | | | | |
| Class A Shares: | | | | |
| |
| Net asset value and redemption price per share (based on net assets of $405,333,583 and 107,597,495 shares of beneficial interest outstanding) | | | $3.77 | |
| |
| Maximum offering price per share (net asset value plus sales charge of 2.50% of offering price) | | | $3.87 | |
| |
| Class C Shares: | | | | |
| |
| Net asset value, redemption price (excludes applicable contingent deferred sales charge) and offering price per share (based on net assets of $65,379,164 and 17,354,607 shares of beneficial interest outstanding) | | | $3.77 | |
| |
| Class Y Shares: | | | | |
| |
| Net asset value, redemption price and offering price per share (based on net assets of $797,579,718 and 211,720,831 shares of beneficial interest outstanding) | | | $3.77 | |
| |
| Class R6 Shares: | | | | |
| |
| Net asset value, redemption price and offering price per share (based on net assets of $10,049 and 2,667 shares of beneficial interest outstanding) | | | $3.77 | |
See accompanying Notes to Financial Statements.
45 INVESCO OPPENHEIMER SHORT TERM MUNICIPAL FUND
STATEMENT OF OPERATIONS
| | | | | | | | |
| | | Three Months Ended
August 31, 2019 | | Year Ended
May 31, 2019 |
| Investment Income | | | | | | | | |
Interest | | $ | 8,129,425 | | | $ | 32,002,501 | |
| Expenses | | | | | | | | |
Advisory fees | | | 1,271,291 | | | | 4,920,700 | |
Administration fees | | | 45,013 | | | | 1,903 | |
Distribution and service plan fees: | | | | | | | | |
Class A | | | 255,624 | | | | 1,022,628 | |
Class C | | | 173,944 | | | | 835,397 | |
Transfer and shareholder servicing agent fees: | | | | | | | | |
Class A | | | 76,688 | | | | 410,510 | |
Class C | | | 13,046 | | | | 83,338 | |
Class Y | | | 149,692 | | | | 687,852 | |
Shareholder communications: | | | | | | | | |
Class A | | | 9,578 | | | | 9,225 | |
Class C | | | 1,564 | | | | 5,062 | |
Class Y | | | 18,558 | | | | 28,288 | |
Borrowing fees | | | 177,799 | | | | 836,267 | |
Trustees’ compensation | | | 5,898 | | | | 17,347 | |
Interest expense on borrowings | | | 5,585 | | | | 56,115 | |
Custodian fees and expenses | | | 1,828 | | | | 17,885 | |
Other | | | 49,983 | | | | 82,736 | |
| | | | |
Total expenses | | | 2,256,091 | | | | 9,015,253 | |
Net Investment Income | | | 5,873,334 | | | | 22,987,248 | |
| Realized and Unrealized Gain (Loss) | | | | | | | | |
Net realized loss on investment transactions | | | (227,974 | ) | | | (2,288,743 | ) |
Net change in unrealized appreciation on investment transactions | | | 6,004,761 | | | | 13,150,258 | |
| Net Increase in Net Assets Resulting from Operations | | $ | 11,650,121 | | | $ | 33,848,763 | |
| | | | |
| | | | | | | | |
See accompanying Notes to Financial Statements.
46 INVESCO OPPENHEIMER SHORT TERM MUNICIPAL FUND
STATEMENT OF CHANGES IN NET ASSETS
| | | | | | | | | | | | |
| | | Three Months
Ended August 31, 2019 | | Year Ended
May 31, 2019 | | | Year Ended
May 31, 2018 | |
| Operations | | | | | | | | | | | | |
Net investment income | | $ | 5,873,334 | | | $ | 22,987,248 | | | $ | 20,442,180 | |
Net realized loss | | | (227,974 | ) | | | (2,288,743 | ) | | | (2,893,431 | ) |
Net change in unrealized appreciation/(depreciation) | | | 6,004,761 | | | | 13,150,258 | | | | (7,641,120 | ) |
| | | | |
Net increase in net assets resulting from operations | | | 11,650,121 | | | | 33,848,763 | | | | 9,907,629 | |
| | | | | | | | | | | | |
| Dividends and/or Distributions to Shareholders1 | | | | | | | | | | | | |
Distributions to shareholders from distributable earnings: | | | | | | | | | | | | |
Class A | | | (1,990,356 | ) | | | (7,838,017 | ) | | | (7,491,930 | ) |
Class C | | | (209,414 | ) | | | (960,175 | ) | | | (974,990 | ) |
Class Y | | | (4,386,921 | ) | | | (14,819,567 | ) | | | (10,875,260 | ) |
Class R6 | | | (56 | ) | | | (2 | ) | | | — | |
| | | | |
Total distributions from distributable earnings | | | (6,586,747 | ) | | | (23,617,761 | ) | | | (19,342,180 | ) |
| | | | | | | | | | | | |
| Beneficial Interest Transactions | | | | | | | | | | | | |
Net increase (decrease) in net assets resulting from beneficial interest transactions: | | | | | | | | | | | | |
Class A | | | 1,203,429 | | | | (14,219,864 | ) | | | 1,283,215 | |
Class C | | | (12,385,868 | ) | | | (13,930,941 | ) | | | (13,590,596 | ) |
Class Y | | | 8,190,765 | | | | 185,259,304 | | | | 111,625,373 | |
Class R6 | | | — | | | | 10,000 | | | | — | |
| | | | |
Total beneficial interest transactions | | | (2,991,674 | ) | | | 157,118,499 | | | | 99,317,992 | |
| | | | | | | | | | | | |
| Net Assets | | | | | | | | | | | | |
Total increase | | | 2,071,700 | | | | 167,349,501 | | | | 89,883,441 | |
Beginning of period | | | 1,266,230,814 | | | | 1,098,881,313 | | | | 1,008,997,872 | |
| | | | |
End of period | | $ | 1,268,302,514 | | | $ | 1,266,230,814 | | | $ | 1,098,881,313 | |
| | | | |
| | | | | | | | | | | | |
1. The Securities Exchange Commission eliminated the requirement to disclose the distribution components separately, except for tax return of capital. For the year ended May 31, 2018, distributions to shareholders from distributable earnings consisted of distributions from net investment income.
See accompanying Notes to Financial Statements.
47 INVESCO OPPENHEIMER SHORT TERM MUNICIPAL FUND
FINANCIAL HIGHLIGHTS
| | | | | | | | | | | | | | | | | | | | | | | | |
| Class A | | Three Months
Ended
August 31,
2019 | | | Year Ended
May 31,
2019 | | | Year Ended
May 31,
2018 | | | Year Ended
May 31,
2017 | | | Year Ended
May 31,
2016 | | | Year Ended
May 29,
20151 | |
| Per Share Operating Data | | | | | | | | | | | | | | | | | | | | | | | | |
| Net asset value, beginning of period | | | $3.75 | | | | $3.72 | | | | $3.75 | | | | $3.75 | | | | $3.74 | | | | $3.76 | |
| Income (loss) from investment operations: | | | | | | | | | | | | | | | | | | | | | | | | |
| Net investment income2 | | | 0.02 | | | | 0.07 | | | | 0.07 | | | | 0.06 | | | | 0.07 | | | | 0.07 | |
| Net realized and unrealized gain (loss) | | | 0.02 | | | | 0.03 | | | | (0.04) | | | | 0.00 | | | | 0.01 | | | | (0.02) | |
| Total from investment operations | | | 0.04 | | | | 0.10 | | | | 0.03 | | | | 0.06 | | | | 0.08 | | | | 0.05 | |
| Dividends and/or distributions to shareholders: | | | | | | | | | | | | | | | | | | | | | | | | |
| Dividends from net investment income | | | (0.02) | | | | (0.07) | | | | (0.06) | | | | (0.06) | | | | (0.07) | | | | (0.07) | |
| Net asset value, end of period | | | $3.77 | | | | $3.75 | | | | $3.72 | | | | $3.75 | | | | $3.75 | | | | $3.74 | |
| | | | | | | | | | | | | | | | | | | | | | | | |
| | | | | | | | | | | | | | | | | | | | | | | | |
| Total Return, at Net Asset Value3 | | | 1.03% | | | | 2.74% | | | | 0.94% | | | | 1.54% | | | | 2.19% | | | | 1.39% | |
| | | | | | | | | | | | | | | | | | | | | | | | |
| Ratios/Supplemental Data | | | | | | | | | | | | | | | | | | | | | | | | |
| Net assets, end of period (in thousands) | | | $405,334 | | | | $402,504 | | | | $413,457 | | | | $415,924 | | | | $401,211 | | | | $277,507 | |
| Average net assets (in thousands) | | | $406,866 | | | | $411,521 | | | | $431,418 | | | | $430,013 | | | | $343,886 | | | | $266,606 | |
| Ratios to average net assets:4 | | | | | | | | | | | | | | | | | | | | | | | | |
| Net investment income | | | 1.72% | | | | 1.85% | | | | 1.84% | | | | 1.55% | | | | 1.78% | | | | 1.97% | |
| Expenses excluding specific expenses listed below | | | 0.76% | | | | 0.77% | | | | 0.79% | | | | 0.79% | | | | 0.80% | | | | 0.81% | |
| Interest and fees from borrowings | | | 0.06% | | | | 0.08% | | | | 0.07% | | | | 0.06% | | | | 0.03% | | | | 0.05% | |
| Total expenses | | | 0.82% | | | | 0.85% | | | | 0.86% | | | | 0.85% | | | | 0.83% | | | | 0.86% | |
| Expenses after payments, waivers and/or reimbursements and reduction to custodian expenses | | | 0.82% | | | | 0.85% | | | | 0.86% | | | | 0.85% | | | | 0.83% | | | | 0.86% | |
| Portfolio turnover rate5 | | | 13% | | | | 69% | | | | 80% | | | | 65% | | | | 51% | | | | 58% | |
1. Represents the last business day of the Fund’s reporting period.
2. Per share amounts calculated based on the average shares outstanding during the period.
3. Assumes an initial investment on the business day before the first day of the fiscal period, with all dividends and distributions reinvested in additional shares on the reinvestment date, and redemption at the net asset value calculated on the last business day of the fiscal period. Sales charges are not reflected in the total returns. Total returns are not annualized for periods less than one full year. Returns do not reflect the deduction of taxes that a shareholder would pay on fund distributions or the redemption of fund shares.
4. Annualized for periods less than one full year.
5. Portfolio turnover is calculated at the fund level and is not annualized for periods less than one year, if applicable.
See accompanying Notes to Financial Statements.
48 INVESCO OPPENHEIMER SHORT TERM MUNICIPAL FUND
| | | | | | | | | | | | | | | | | | | | | | | | |
| Class C | | Three Months
Ended
August 31,
2019 | | | Year Ended
May 31,
2019 | | | Year Ended
May 31,
2018 | | | Year Ended
May 31,
2017 | | | Year Ended
May 31,
2016 | | | Year Ended
May 29,
20151 | |
| Per Share Operating Data | | | | | | | | | | | | | | | | | | | | | | | | |
| Net asset value, beginning of period | | | $3.75 | | | | $3.72 | | | | $3.75 | | | | $3.75 | | | | $3.74 | | | | $3.76 | |
| Income (loss) from investment operations: | | | | | | | | | | | | | | | | | | | | | | | | |
| Net investment income2 | | | 0.01 | | | | 0.04 | | | | 0.04 | | | | 0.03 | | | | 0.04 | | | | 0.05 | |
| Net realized and unrealized gain (loss) | | | 0.02 | | | | 0.03 | | | | (0.03) | | | | 0.00 | | | | 0.01 | | | | (0.03) | |
| Total from investment operations | | | 0.03 | | | | 0.07 | | | | 0.01 | | | | 0.03 | | | | 0.05 | | | | 0.02 | |
| Dividends and/or distributions to shareholders: | | | | | | | | | | | | | | | | | | | | | | | | |
| Dividends from net investment income | | | (0.01) | | | | (0.04) | | | | (0.04) | | | | (0.03) | | | | (0.04) | | | | (0.04) | |
| Net asset value, end of period | | | $3.77 | | | | $3.75 | | | | $3.72 | | | | $3.75 | | | | $3.75 | | | | $3.74 | |
| | | | | | | | | | | | | | | | | | | | | | | | |
| | | | | | | | | | | | | | | | | | | | | | | | |
| Total Return, at Net Asset Value3 | | | 0.84% | | | | 1.97% | | | | 0.18% | | | | 0.78% | | | | 1.43% | | | | 0.63% | |
| | | | | | | | | | | | | | | | | | | | | | | | |
| Ratios/Supplemental Data | | | | | | | | | | | | | | | | | | | | | | | | |
| Net assets, end of period (in thousands) | | | $65,379 | | | | $77,493 | | | | $90,796 | | | | $105,243 | | | | $102,888 | | | | $65,412 | |
| Average net assets (in thousands) | | | $69,054 | | | | $83,507 | | | | $99,420 | | | | $109,641 | | | | $82,289 | | | | $59,997 | |
| Ratios to average net assets:4 | | | | | | | | | | | | | | | | | | | | | | | | |
| Net investment income | | | 0.97% | | | | 1.09% | | | | 1.09% | | | | 0.80% | | | | 1.02% | | | | 1.21% | |
| Expenses excluding specific expenses listed below | | | 1.51% | | | | 1.53% | | | | 1.54% | | | | 1.54% | | | | 1.56% | | | | 1.57% | |
| Interest and fees from borrowings | | | 0.06% | | | | 0.08% | | | | 0.07% | | | | 0.06% | | | | 0.03% | | | | 0.05% | |
| Total expenses | | | 1.57% | | | | 1.61% | | | | 1.61% | | | | 1.60% | | | | 1.59% | | | | 1.62% | |
| Expenses after payments, waivers and/or reimbursements and reduction to custodian expenses | | | 1.57% | | | | 1.61% | | | | 1.61% | | | | 1.60% | | | | 1.59% | | | | 1.62%5 | |
| Portfolio turnover rate6 | | | 13% | | | | 69% | | | | 80% | | | | 65% | | | | 51% | | | | 58% | |
1. Represents the last business day of the Fund’s reporting period.
2. Per share amounts calculated based on the average shares outstanding during the period.
3. Assumes an initial investment on the business day before the first day of the fiscal period, with all dividends and distributions reinvested in additional shares on the reinvestment date, and redemption at the net asset value calculated on the last business day of the fiscal period. Sales charges are not reflected in the total returns. Total returns are not annualized for periods less than one full year. Returns do not reflect the deduction of taxes that a shareholder would pay on fund distributions or the redemption of fund shares.
4. Annualized for periods less than one full year.
5. Waiver was less than 0.005%.
6. Portfolio turnover is calculated at the fund level and is not annualized for periods less than one year, if applicable.
See accompanying Notes to Financial Statements.
49 INVESCO OPPENHEIMER SHORT TERM MUNICIPAL FUND
FINANCIAL HIGHLIGHTS Continued
| | | | | | | | | | | | | | | | | | | | | | | | |
| Class Y | | Three Months
Ended
August 31,
2019 | | | Year Ended
May 31,
2019 | | | Year Ended
May 31,
2018 | | | Year Ended
May 31,
2017 | | | Year Ended
May 31,
2016 | | | Year Ended
May 29,
20151 | |
| Per Share Operating Data | | | | | | | | | | | | | | | | | | | | | | | | |
| Net asset value, beginning of period | | | $3.75 | | | | $3.72 | | | | $3.75 | | | | $3.76 | | | | $3.74 | | | | $3.76 | |
| Income (loss) from investment operations: | | | | | | | | | | | | | | | | | | | | | | | | |
| Net investment income2 | | | 0.02 | | | | 0.08 | | | | 0.08 | | | | 0.07 | | | | 0.08 | | | | 0.08 | |
| Net realized and unrealized gain (loss) | | | 0.02 | | | | 0.03 | | | | (0.04) | | | | (0.01) | | | | 0.02 | | | | (0.02) | |
| Total from investment operations | | | 0.04 | | | | 0.11 | | | | 0.04 | | | | 0.06 | | | | 0.10 | | | | 0.06 | |
| Dividends and/or distributions to shareholders: | | | | | | | | | | | | | | | | | | | | | | | | |
| Dividends from net investment income | | | (0.02) | | | | (0.08) | | | | (0.07) | | | | (0.07) | | | | (0.08) | | | | (0.08) | |
| Net asset value, end of period | | | $3.77 | | | | $3.75 | | | | $3.72 | | | | $3.75 | | | | $3.76 | | | | $3.74 | |
| | | | | | | | | | | | | | | | | | | | | | | | |
| | | | | | | | | | | | | | | | | | | | | | | | |
| Total Return, at Net Asset Value3 | | | 1.09% | | | | 3.00% | | | | 1.19% | | | | 1.52% | | | | 2.72% | | | | 1.64% | |
| | | | | | | | | | | | | | | | | | | | | | | | |
| Ratios/Supplemental Data | | | | | | | | | | | | | | | | | | | | | | | | |
| Net assets, end of period (in thousands) | | | $797,580 | | | | $786,224 | | | | $594,628 | | | | $487,831 | | | | $347,680 | | | | $281,883 | |
| Average net assets (in thousands) | | | $794,101 | | | | $690,733 | | | | $545,355 | | | | $432,229 | | | | $302,602 | | | | $143,236 | |
| Ratios to average net assets:4 | | | | | | | | | | | | | | | | | | | | | | | | |
| Net investment income | | | 1.97% | | | | 2.09% | | | | 2.09% | | | | 1.80% | | | | 2.02% | | | | 2.16% | |
| Expenses excluding specific expenses listed below | | | 0.51% | | | | 0.52% | | | | 0.54% | | | | 0.54% | | | | 0.55% | | | | 0.56% | |
| Interest and fees from borrowings | | | 0.06% | | | | 0.08% | | | | 0.07% | | | | 0.06% | | | | 0.03% | | | | 0.05% | |
| Total expenses | | | 0.57% | | | | 0.60% | | | | 0.61% | | | | 0.60% | | | | 0.58% | | | | 0.61% | |
| Expenses after payments, waivers and/or reimbursements and reduction to custodian expenses | | | 0.57% | | | | 0.60% | | | | 0.61% | | | | 0.60% | | | | 0.58% | | | | 0.61%5 | |
| Portfolio turnover rate6 | | | 13% | | | | 69% | | | | 80% | | | | 65% | | | | 51% | | | | 58% | |
1. Represents the last business day of the Fund’s reporting period.
2. Per share amounts calculated based on the average shares outstanding during the period.
3. Assumes an initial investment on the business day before the first day of the fiscal period, with all dividends and distributions reinvested in additional shares on the reinvestment date, and redemption at the net asset value calculated on the last business day of the fiscal period. Sales charges are not reflected in the total returns. Total returns are not annualized for periods less than one full year. Returns do not reflect the deduction of taxes that a shareholder would pay on fund distributions or the redemption of fund shares.
4. Annualized for periods less than one full year.
5. Waiver was less than 0.005%.
6. Portfolio turnover is calculated at the fund level and is not annualized for periods less than one year, if applicable.
Seeaccompanying Notes to Financial Statements.
50 INVESCO OPPENHEIMER SHORT TERM MUNICIPAL FUND
| | | | | | | | |
| Class R6 | | Three Months
Ended
August 31,
2019 | | | Period Ended
May 31, 20191 | |
| Per Share Operating Data | | | | | | | | |
Net asset value, beginning of period | | | $3.75 | | | | $3.75 | |
Income (loss) from investment operations: | | | | | | | | |
Net investment income2 | | | 0.02 | | | | 0.003 | |
Net realized and unrealized gain | | | 0.02 | | | | 0.003 | |
Total from investment operations | | | 0.04 | | | | 0.003 | |
| | | | | | | | | |
Dividends and/or distributions to shareholders: | | | | | | | | |
Dividends from net investment income | | | (0.02) | | | | (0.00)3 | |
Net asset value, end of period | | | $3.77 | | | | $3.75 | |
| | | | | | | | |
| | | | | | | | |
| Total Return, at Net Asset Value4 | | | 1.10% | | | | 2.73% | |
| | | | | | | | |
| Ratios/Supplemental Data | | | | | | | | |
Net assets, end of period (in thousands) | | | $10 | | | | $10 | |
Average net assets (in thousands) | | | $10 | | | | $10 | |
Ratios to average net assets:5 | | | | | | | | |
Net investment income | | | 2.05% | | | | 2.20% | |
Expenses excluding specific expenses listed below | | | 0.44% | | | | 0.42% | |
Interest and fees from borrowings | | | 0.06% | | | | 0.08% | |
Total expenses | | | 0.50% | | | | 0.50% | |
Expenses after payments, waivers and/or reimbursements and reduction to custodian expenses | | | 0.50% | | | | 0.50% | |
Portfolio turnover rate6 | | | 13% | | | | 69% | |
1. For the period from after the close of business on May 24, 2019 (inception of offering) to May 31, 2019.
2. Per share amounts calculated based on the average shares outstanding during the period.
3. Less than $0.005 per share.
4. Assumes an initial investment on the business day before the first day of the fiscal period, with all dividends and distributions reinvested in additional shares on the reinvestment date, and redemption at the net asset value calculated on the last business day of the fiscal period. Sales charges are not reflected in the total returns. Total returns are not annualized for periods less than one full year. Returns do not reflect the deduction of taxes that a shareholder would pay on fund distributions or the redemption of fund shares.
5. Annualized for periods less than one full year.
6. Portfolio turnover is calculated at the fund level and is not annualized for periods less than one year, if applicable.
See accompanying Notes to Financial Statements.
51 INVESCO OPPENHEIMER SHORT TERM MUNICIPAL FUND
NOTES TO FINANCIAL STATEMENTSAugust 31, 2019
Note 1 - Significant Accounting Policies
Invesco Oppenheimer Short Term Municipal Fund (the “Fund”) is a series portfolio of AIM Counselor Series Trust (Invesco Counselor Series Trust) (the “Trust”). The Trust is a Delaware statutory trust registered under the Investment Company Act of 1940, as amended (the “1940 Act”), as an open-end series management investment company authorized to issue an unlimited number of shares of beneficial interest. Information presented in these financial statements pertains only to the Fund. Matters affecting the Fund or each class will be voted on exclusively by the shareholders of such Fund or each class.
Prior to the close of business on May 24, 2019, the Fund operated as Oppenheimer Short Term Municipal Fund (the “Acquired Fund” or “Predecessor Fund”). The Acquired Fund was reorganized after the close of business on May 24, 2019 (the “Reorganization Date”) through the transfer of all of its assets and liabilities to the Fund (the “Reorganization”).
Upon closing of the Reorganization, holders of the Acquired Fund’s Class A, Class C, and Class Y shares received the corresponding class of shares of the Fund. Class R6 shares commenced operations on the Reorganization Date.
Effective August 31, 2019, the Fund changed its fiscal year end from May 31 to August 31.
The Fund’s investment objective is to seek tax-free income.
The Fund currently consists of four different classes of shares: Class A, Class C, Class Y, and Class R6. Class Y shares are available only to certain investors. Class A shares are sold with a front-end sales charge unless certain waiver criteria are met and under certain circumstances load waived shares may be subject to contingent deferred sales charges (“CDSC”). Class C shares are sold with a CDSC. Class Y and Class R6 shares are sold at net asset value.
The Fund is an investment company and accordingly follows the investment company accounting and reporting guidance in accordance with Financial Accounting Standards Board Accounting Standards Codification Topic 946, Financial Services – Investment Companies.
The following is a summary of the significant accounting policies followed by the Fund in the preparation of its financial statements.
| A. | Security Valuations– Securities, including restricted securities, are valued according to the following policy. |
Securities are fair valued using an evaluated quote provided by an independent pricing service approved by the Board of Trustees. Evaluated quotes provided by the pricing service may be determined without exclusive reliance on quoted prices, and may reflect appropriate factors such as institution-size trading in similar groups of securities, developments related to specific securities, dividend rate (for unlisted equities), yield (for debt obligations), quality, type of issue, coupon rate (for debt obligations), maturity (for debt obligations), individual trading characteristics and other market data. Pricing services generally value debt obligations assuming orderly transactions of institutional round lot size, but a fund may hold or transact in the same securities in smaller, odd lot sizes. Odd lots often trade at lower prices than institutional round lots. Debt obligations are subject to interest rate and credit risks. In addition, all debt obligations involve some risk of default with respect to interest and/or principal payments.
52 INVESCO OPPENHEIMER SHORT TERM MUNICIPAL FUND
Securities for which market quotations either are not readily available or became unreliable are valued at fair value as determined in good faith by or under the supervision of the Trust’s officers following procedures approved by the Board of Trustees. Some of the factors which may be considered in determining fair value are fundamental analytical data relating to the investment; the nature and duration of any restrictions on transferability or disposition; trading in similar securities by the same issuer or comparable companies; relevant political, economic or issuer specific news; and other relevant factors under the circumstances.
The Fund may invest in securities that are subject to interest rate risk, meaning the risk that the prices will generally fall as interest rates rise and, conversely, the prices will generally rise as interest rates fall. Specific securities differ in their sensitivity to changes in interest rates depending on their individual characteristics. Changes in interest rates may result in increased market volatility, which may affect the value and/or liquidity of certain Fund investments.
Valuations change in response to many factors including the historical and prospective earnings of the issuer, the value of the issuer’s assets, general economic conditions, interest rates, investor perceptions and market liquidity. Because of the inherent uncertainties of valuation, the values reflected in the financial statements may materially differ from the value received upon actual sale of those investments.
| B. | Securities Transactions and Investment Income -Securities transactions are accounted for on a trade date basis. Realized gains or losses on sales are computed on the basis of specific identification of the securities sold. Interest income (net of withholding tax, if any) is recorded on the accrual basis from settlement date. Bond premiums and discounts are amortized and/or accreted over the lives of the respective securities. Pay-in-kind interest income and non-cash dividend income received in the form of securities in-lieu of cash are recorded at the fair value of the securities received. Paydown gains and losses on mortgage and asset-backed securities are recorded as adjustments to interest income. Dividend income (net of withholding tax, if any) is recorded on the ex-dividend date. |
The Fund may periodically participate in litigation related to Fund investments. As such, the Fund may receive proceeds from litigation settlements. Any proceeds received are included in the Statement of Operations as realized gain (loss) for investments no longer held and as unrealized gain (loss) for investments still held.
Brokerage commissions and mark ups are considered transaction costs and are recorded as an increase to the cost basis of securities purchased and/or a reduction of proceeds on a sale of securities. Such transaction costs are included in the determination of net realized and unrealized gain (loss) from investment transactions reported in the Statement of Operations and the Statement of Changes in Net Assets and the net realized and unrealized gains (losses) on securities per share in the Financial Highlights. Transaction costs are included in the calculation of the Fund’s net asset value and, accordingly, they reduce the Fund’s total returns. These transaction costs are not considered operating expenses and are not reflected in net investment income reported in the Statement of Operations and the Statement of Changes in Net Assets, or the net investment income per share and the ratios of expenses and net investment income reported in the Financial Highlights, nor are
53 INVESCO OPPENHEIMER SHORT TERM MUNICIPAL FUND
NOTES TO FINANCIAL STATEMENTSContinued
they limited by any expense limitation arrangements between the Fund and the investment adviser.
The Fund allocates income and realized and unrealized capital gains and losses to a class based on the relative net assets of each class.
| C. | Country Determination- For the purposes of making investment selection decisions and presentation in the Schedule of Investments, the investment adviser may determine the country in which an issuer is located and/or credit risk exposure based on various factors. These factors include the laws of the country under which the issuer is organized, where the issuer maintains a principal office, the country in which the issuer derives 50% or more of its total revenues and the country that has the primary market for the issuer’s securities, as well as other criteria. Among the other criteria that may be evaluated for making this determination are the country in which the issuer maintains 50% or more of its assets, the type of security, financial guarantees and enhancements, the nature of the collateral and the sponsor organization. Country of issuer and/or credit risk exposure has been determined to be the United States of America, unless otherwise noted. |
| D. | Distributions -Dividends and distributions to shareholders, which are determined in accordance with income tax regulations and may differ from accounting principles generally accepted in the United States of America (“GAAP”), are recorded on the ex-dividend date. Income distributions, if any, are declared daily and paid monthly. Capital gain distributions, if any, are declared and paid annually or at other times as determined necessary by the Adviser. |
| E. | Federal Income Taxes -The Fund intends to comply with provisions of the Internal Revenue Code applicable to regulated investment companies and to distribute substantially all of its investment company taxable income, including any net realized gain on investments not offset by capital loss carryforwards, if any, to shareholders. Therefore, no federal income or excise tax provision is required. The Fund files income tax returns in U.S. federal and applicable state jurisdictions. The statute of limitations on the Fund’s tax return filings generally remains open for the three preceding fiscal reporting period ends. The Fund has analyzed its tax positions for the fiscal year ended August 31, 2019, including open tax years, and does not believe there are any uncertain tax positions requiring recognition in the Fund’s financial statements. |
The tax components of capital shown in the following table represent distribution requirements the Fund must satisfy under the income tax regulations, losses the Fund may be able to offset against income and gains realized in future years and unrealized appreciation or depreciation of securities and other investments for federal income tax purposes.
54 INVESCO OPPENHEIMER SHORT TERM MUNICIPAL FUND
| | | | | | | | | | | | |
Undistributed Net Investment Income | | Undistributed Long-Term Gain | | | Accumulated Loss Carryforward1,2,3 | | | Net Unrealized
Appreciation
Based on cost of
Securities and
Other Investments
for Federal Income
Tax Purposes | |
| |
| $518,977 | | | $— | | | | $13,023,514 | | | | $20,154,234 | |
1.At period end, the Fund had $13,023,514 of net capital loss carryforward available to offset future realized capital gains, if any, and thereby reduce future taxable gain distributions.
2. During the reporting period, the Fund did not utilize any capital loss carryforward.
3.During the previous reporting period, the Fund did not utilize any capital loss carryforward.
Net investment income (loss) and net realized gain (loss) may differ for financial statement and tax purposes. The character of dividends and distributions made during the fiscal year from net investment income or net realized gains are determined in accordance with federal income tax requirements, which may differ from the character of net investment income or net realized gains presented in those financial statements in accordance with U.S. GAAP. Also, due to timing of dividends and distributions, the fiscal year in which amounts are distributed may differ from the fiscal year in which the income or net realized gain was recorded by the Fund.
The tax character of distributions paid during the reporting periods:
| | | | | | | | |
| | | Three Months Ended
August 31, 2019 | | | Year Ended
May 31, 2019 | |
| |
| Distributions paid from: | | | | | | | | |
| Exempt-interest dividends | | $ | 6,586,747 | | | $ | 23,274,633 | |
| Ordinary income | | | — | | | | 343,128 | |
| | | | |
| Total | | $ | 6,586,747 | | | $ | 23,617,761 | |
| | | | |
The aggregate cost of securities and other investments and the composition of unrealized appreciation and depreciation of securities and other investments for federal income tax purposes at period end are noted in the following table. The primary difference between book and tax appreciation or depreciation of securities and other investments, if applicable, is attributable to the tax deferral of losses or tax realization of financial statement unrealized gain or loss.
| | | | |
| Federal tax cost of securities | | $ | 1,237,995,555 | |
| | | | |
| Gross unrealized appreciation | | $ | 21,477,708 | |
| Gross unrealized depreciation | | | (1,323,474 | ) |
| | | | |
| Net unrealized appreciation | | $ | 20,154,234 | |
| | | | |
| F. | Expenses -Fees provided for under the Rule 12b-1 plan of a particular class of the Fund are charged to the operations of such class. Transfer agency fees and expenses and other shareholder recordkeeping fees and expenses attributable to Class R6 are allocated to each share class based on relative net assets. Transfer agency fees and expenses and other |
55 INVESCO OPPENHEIMER SHORT TERM MUNICIPAL FUND
NOTES TO FINANCIAL STATEMENTSContinued
| | shareholder recordkeeping fees and expenses relating to all other classes are allocated among those classes based on relative net assets. All other expenses are allocated among the classes based on relative net assets. |
| G. | Accounting Estimates -The financial statements are prepared on a basis in conformity with GAAP, which requires management to make estimates and assumptions that affect the reported amounts of assets and liabilities at the date of the financial statements and the reported amounts of revenues and expenses during the reporting period including estimates and assumptions related to taxation. Actual results could differ from those estimates by a significant amount. In addition, the Fund monitors for material events or transactions that may occur or become known after the period-end date and before the date the financial statements are released to print. |
| H. | Indemnifications -Under the Trust’s organizational documents, each Trustee, officer, employee or other agent of the Trust is indemnified against certain liabilities that may arise out of the performance of their duties to the Fund. Additionally, in the normal course of business, the Fund enters into contracts, including the Fund’s servicing agreements, that contain a variety of indemnification clauses. The Fund’s maximum exposure under these arrangements is unknown as this would involve future claims that may be made against the Fund that have not yet occurred. The risk of material loss as a result of such indemnification claims is considered remote. |
| I. | Securities on a When-Issued or Delayed Delivery Basis -The Fund may purchase securities on a “when-issued” basis, and may purchase or sell securities on a “delayed delivery” basis, with payment and delivery scheduled for a future date. No income accrues to the Fund on the securities in connection with such transactions prior to the date the Fund actually takes delivery of the securities. These transactions are subject to market fluctuations and are subject to the risk that the value at delivery may be more or less than the trade date purchase price. Although the Fund will generally purchase these securities with the intention on acquiring such securities, they may sell such securities prior to the settlement date. |
| J. | Other Risks- The value of, payment of interest on, repayment of principal for and the ability to sell a municipal security may be affected by constitutional amendments, legislative enactments, executive orders, administrative regulations, voter initiatives and the economics of the regions in which the issuers are located. |
Since many municipal securities are issued to finance similar projects, especially those relating to education, health care, transportation and utilities, conditions in those sectors can affect the overall municipal securities market and the Fund’s investments in municipal securities.
There is some risk that a portion or all of the interest received from certain tax-free municipal securities could become taxable as a result of determinations by the Internal Revenue Service.
56 INVESCO OPPENHEIMER SHORT TERM MUNICIPAL FUND
Note 2 - Advisory Fees and Other Fees Paid to Affiliates
The Trust has entered into a master investment advisory agreement with Invesco Advisers, Inc. (the “Adviser” or “Invesco”). Under the terms of the investment advisory agreement, the Fund accrues daily and pays monthly an advisory fee to the Adviser based on the annual rate of the Fund’s average daily net assets as follows:
| | | | |
| Fee Schedule* | | | |
| |
| Up to $100 million | | | 0.500% | |
| Next $150 million | | | 0.450 | |
| Next $250 million | | | 0.425 | |
| Next $500 million | | | 0.400 | |
| Next $4 billion | | | 0.370 | |
| Over $5 billion | | | 0.350 | |
*The advisory fee paid by the Fund shall be reduced by any amounts paid by the Fund under the administrative services agreement with the Adviser.
For the period ended August 31, 2019, the effective advisory fees incurred by the Fund was 0.40%.
Under the terms of a master sub-advisory agreement between the Adviser and each of Invesco Asset Management Deutschland GmbH, Invesco Asset Management Limited, Invesco Asset Management (Japan) Limited, Invesco Hong Kong Limited, Invesco Senior Secured Management, Inc. and Invesco Canada Ltd. and separate sub-advisory agreements with Invesco Capital Management LLC, and Invesco Asset Management (India) Private Limited (collectively, the “Affiliated Sub-Advisers”) the Adviser, not the Fund, will pay 40% of the fees paid to the Adviser to any such Affiliated Sub-Adviser(s) that provide(s) discretionary investment management services to the Fund based on the percentage of assets allocated to such Sub-Adviser(s). Invesco has also entered into a Sub-Advisory Agreement with OppenheimerFunds, Inc. to provide discretionary management services to the Funds.
Effective on the Reorganization Date, the Adviser has contractually agreed, through at least May 31, 2021, to waive advisory fees and/or reimburse expenses of all shares to the extent necessary to limit the total annual fund operating expenses after fee waiver and/or expense reimbursement (excluding certain items discussed below) of Class A, Class C, Class Y and Class R6 shares to 0.79%, 1.54%, 0.54% and 0.44%, respectively, of the Fund’s average daily net assets (the “expense limits”). In determining the Adviser’s obligation to waive advisory fees and/or reimburse expenses, the following expenses are not taken into account, and could cause total annual fund operating expenses after fee waivers and/or expense reimbursement to exceed the numbers reflected above: (1) interest; (2) taxes; (3) dividend expenses on short sales; (4) extraordinary or non-routine items, including litigation expenses; and (5) expenses that the Fund has incurred but did not actually pay because of an expense offset arrangement. Unless Invesco continues the fee waiver agreement, it will terminate May 31, 2021. During its term, the fee waiver agreement cannot be terminated or amended to increase the expense limits or reduce the advisory fee waiver without approval of the Board of Trustees.
During the reporting period, the Adviser and OFI Global Asset Management, Inc. did not waive fees and/or reimburse the Fund or Acquired Fund, respectively in relation to this
57 INVESCO OPPENHEIMER SHORT TERM MUNICIPAL FUND
NOTES TO FINANCIAL STATEMENTSContinued
arrangement.
The Trust has entered into a master administrative services agreement with Invesco pursuant to which the Fund has agreed to pay Invesco for certain administrative costs incurred in providing accounting services to the Fund. For the period ended August 31, 2019, expenses incurred under the agreement are shown in the Statement of Operations as Administration fees. Additionally, Invesco has entered into service agreements whereby Citibank, N.A. serves as custodian to the Fund. Prior to the Reorganization, the Acquired Fund paid administrative fees to OFI Global Asset Management, Inc.
The Trust has entered into a transfer agency and service agreement with Invesco Investment Services, Inc. (“IIS”) pursuant to which the Fund has agreed to pay IIS a fee for providing transfer agency and shareholder services to the Fund and reimburse IIS for certain expenses incurred by IIS in the course of providing such services. IIS may make payments to intermediaries that provide omnibus account services, sub-accounting services and/or networking services. All fees payable by IIS to intermediaries that provide omnibus account services or sub-accounting services are charged back to the Fund, subject to certain limitations approved by the Trust’s Board of Trustees. Prior to the Reorganization, the Acquired Fund paid transfer agent fees to OFI Global Asset Management, Inc. and Shareholder Services, Inc. For the period ended August 31, 2019, expenses incurred under these agreements are shown in the Statement of Operations as Transfer and shareholder servicing agent fees.
The Trust has entered into master distribution agreements with Invesco Distributors, Inc. (“IDI”) to serve as the distributor for the Class A, Class C, Class Y and Class R6 shares of the Fund. The Trust has adopted plans pursuant to Rule 12b-1 under the 1940 Act with respect to the Fund’s Class A and Class C shares (collectively the “Plan”). The Fund, pursuant to the Class A Plan, reimbursed IDI in an amount up to an annual rate of 0.25% of the average daily net assets of Class A shares. The Fund pursuant to the Class C Plan, pays IDI compensation at the annual rate of 1.00% of the average daily net assets of Class C. The fees are accrued daily and paid monthly. Of the Plan payments, up to 0.25% of the average daily net assets of each class of shares may be paid to furnish continuing personal shareholder services to customers who purchase and own shares of such classes. Any amounts not paid as a service fee under the Plan would constitute an asset-based sales charge. Rules of the Financial Industry Regulatory Authority (“FINRA”) impose a cap on the total sales charges, including asset-based sales charges, that may be paid by any class of shares of the Fund plans. Prior to the Reorganization, the Acquired Fund paid distribution fees to OppenheimerFunds Distributor, Inc. For the period ended August 31, 2019, expenses incurred under the plans are shown in the Statement of Operations as Distribution and service plan fees.
Front-end sales commissions and CDSC (collectively, the “sales charges”) are not recorded as expenses of the Fund. Front-end sales commissions are deducted from proceeds from the sales of Fund shares prior to investment in Class A shares of the Fund. CDSC are deducted from redemption proceeds prior to remittance to the shareholder. During the period ended August 31, 2019, IDI advised the Fund that IDI retained $4,103 in front-end sales commissions from the sale of Class A shares and $14,831 and $493 from Class A and Class C shares, respectively, for CDSC imposed on redemptions by shareholders.
58 INVESCO OPPENHEIMER SHORT TERM MUNICIPAL FUND
Certain officers and trustees of the Trust are officers and directors of the Adviser, IIS and/or IDI.
Note 3 - Additional Valuation Information
GAAP defines fair value as the price that would be received to sell an asset or paid to transfer a liability in an orderly transaction between market participants at the measurement date, under current market conditions. GAAP establishes a hierarchy that prioritizes the inputs to valuation methods, giving the highest priority to readily available unadjusted quoted prices in an active market for identical assets (Level 1) and the lowest priority to significant unobservable inputs (Level 3), generally when market prices are not readily available or are unreliable. Based on the valuation inputs, the securities or other investments are tiered into one of three levels. Changes in valuation methods may result in transfers in or out of an investment’s assigned level:
Level 1 — Prices are determined using quoted prices in an active market for identical assets.
Level 2 — Prices are determined using other significant observable inputs. Observable inputs are inputs that other market participants may use in pricing a security. These may include quoted prices for similar securities, interest rates, prepayment speeds, credit risk, yield curves, loss severities, default rates, discount rates, volatilities and others.
Level 3 — Prices are determined using significant unobservable inputs. In situations where quoted prices or observable inputs are unavailable (for example, when there is little or no market activity for an investment at the end of the period), unobservable inputs may be used. Unobservable inputs reflect the Fund’s own assumptions about the factors market participants would use in determining fair value of the securities or instruments and would be based on the best available information.
The following is a summary of the tiered valuation input levels, as of August 31, 2019. The level assigned to the securities valuations may not be an indication of the risk or liquidity associated with investing in those securities. Because of the inherent uncertainties of valuation, the values reflected in the financial statements may materially differ from the value received upon actual sale of those investments.
| | | | | | | | | | | | | | | | |
| | | Level 1—
Unadjusted
Quoted Prices | | | Level 2—
Other Significant
Observable Inputs | | | Level 3—
Significant
Unobservable
Inputs | | | Value | |
| |
| Assets Table | | | | | | | | | | | | | | | | |
| Investments, at Value: | | | | | | | | | | | | | | | | |
| Municipal Bonds and Notes | | | | | | | | | | | | | | | | |
Alabama | | | $ — | | | | $ 2,821,849 | | | | $ — | | | | $ 2,821,849 | |
Alaska | | | — | | | | 7,341,483 | | | | — | | | | 7,341,483 | |
Arizona | | | — | | | | 19,069,206 | | | | — | | | | 19,069,206 | |
Arkansas | | | — | | | | 25,076 | | | | — | | | | 25,076 | |
California | | | — | | | | 94,929,322 | | | | — | | | | 94,929,322 | |
Colorado | | | — | | | | 12,941,890 | | | | — | | | | 12,941,890 | |
59 INVESCO OPPENHEIMER SHORT TERM MUNICIPAL FUND
NOTES TO FINANCIAL STATEMENTSContinued
| | | | | | | | | | | | | | | | |
| | | Level 1—
Unadjusted
Quoted Prices | | | Level 2— Other Significant
Observable Inputs | | | Level 3—
Significant
Unobservable
Inputs | | | Value | |
| |
| Municipal Bonds and Notes (Continued) | | | | | | | | | | | | | | | | |
Connecticut | | $ | — | | | $ | 35,821,163 | | | $ | — | | | $ | 35,821,163 | |
District of Columbia | | | — | | | | 5,960,985 | | | | — | | | | 5,960,985 | |
Florida | | | — | | | | 112,698,083 | | | | — | | | | 112,698,083 | |
Georgia | | | — | | | | 85,073,100 | | | | — | | | | 85,073,100 | |
Idaho | | | — | | | | 89,894 | | | | — | | | | 89,894 | |
Illinois | | | — | | | | 133,638,694 | | | | — | | | | 133,638,694 | |
Indiana | | | — | | | | 24,841,180 | | | | — | | | | 24,841,180 | |
Iowa | | | — | | | | 11,124,086 | | | | — | | | | 11,124,086 | |
Kansas | | | — | | | | 2,045,469 | | | | — | | | | 2,045,469 | |
Kentucky | | | — | | | | 26,558,950 | | | | — | | | | 26,558,950 | |
Louisiana | | | — | | | | 8,908,373 | | | | — | | | | 8,908,373 | |
Maine | | | — | | | | 1,696,558 | | | | — | | | | 1,696,558 | |
Maryland | | | — | | | | 8,379,396 | | | | — | | | | 8,379,396 | |
Massachusetts | | | — | | | | 27,640,111 | | | | — | | | | 27,640,111 | |
Michigan | | | — | | | | 21,594,530 | | | | — | | | | 21,594,530 | |
Minnesota | | | — | | | | 18,599,093 | | | | — | | | | 18,599,093 | |
Mississippi | | | — | | | | 1,923,175 | | | | — | | | | 1,923,175 | |
Missouri | | | — | | | | 17,076,951 | | | | — | | | | 17,076,951 | |
Montana | | | — | | | | 10,023 | | | | — | | | | 10,023 | |
Nebraska | | | — | | | | 11,945,000 | | | | — | | | | 11,945,000 | |
Nevada | | | — | | | | 60,161 | | | | — | | | | 60,161 | |
New Hampshire | | | — | | | | 2,773,233 | | | | — | | | | 2,773,233 | |
New Jersey | | | — | | | | 103,252,991 | | | | — | | | | 103,252,991 | |
New Mexico | | | — | | | | 5,506,509 | | | | — | | | | 5,506,509 | |
New York | | | — | | | | 98,236,334 | | | | 0 | | | | 98,236,334 | |
North Carolina | | | — | | | | 5,465,097 | | | | — | | | | 5,465,097 | |
North Dakota | | | — | | | | 7,524,876 | | | | — | | | | 7,524,876 | |
Ohio | | | — | | | | 17,890,303 | | | | — | | | | 17,890,303 | |
Oklahoma | | | — | | | | 3,429,984 | | | | — | | | | 3,429,984 | |
Oregon | | | — | | | | 2,276,682 | | | | — | | | | 2,276,682 | |
Other Territory | | | — | | | | 23,484,735 | | | | — | | | | 23,484,735 | |
Pennsylvania | | | — | | | | 58,976,784 | | | | — | | | | 58,976,784 | |
Rhode Island | | | — | | | | 1,236,927 | | | | — | | | | 1,236,927 | |
South Carolina | | | — | | | | 17,249,104 | | | | — | | | | 17,249,104 | |
South Dakota | | | — | | | | 2,465,841 | | | | — | | | | 2,465,841 | |
Tennessee | | | — | | | | 6,405,059 | | | | — | | | | 6,405,059 | |
Texas | | | — | | | | 178,913,550 | | | | — | | | | 178,913,550 | |
Utah | | | — | | | | 10,035,081 | | | | — | | | | 10,035,081 | |
Vermont | | | — | | | | 215,328 | | | | — | | | | 215,328 | |
Virginia | | | — | | | | 3,987,975 | | | | — | | | | 3,987,975 | |
Washington | | | — | | | | 4,848,317 | | | | — | | | | 4,848,317 | |
Wisconsin | | | — | | | | 11,161,278 | | | | — | | | | 11,161,278 | |
| | | | |
| Total Assets | | $ | — | | | $ | 1,258,149,789 | | | $ | 0 | | | $ | 1,258,149,789 | |
| | | | |
60 INVESCO OPPENHEIMER SHORT TERM MUNICIPAL FUND
Note 4 - Trustee and Officer Fees and Benefits
Certain Trustees have executed a Deferred Compensation Agreement pursuant to which they have the option to elect to defer receipt of all or a portion of the annual compensation they are entitled to receive from the Fund. For purposes of determining the amount owed to the Trustees under the plan, deferred amounts are treated as though equal dollar amounts had been invested in shares of the Fund or in other Invesco and/or Invesco Oppenheimer funds selected by the Trustees. The Fund purchases shares of the funds selected for deferral by the Trustees in amounts equal to his or her deemed investment, resulting in a Fund asset equal to the deferred compensation liability. Such assets are included as a component of “Other” within the asset section of the Statement of Assets and Liabilities. Deferral of Trustees’ fees under the plan will not affect the net assets of the Fund and will not materially affect the Fund’s assets, liabilities or net investment income per share. Amounts will be deferred until distributed in accordance with the compensation deferral plan.
Note 5 - Cash Balances
The Fund is permitted to temporarily carry a negative or overdrawn balance in its account with Citibank, N.A., the custodian bank. Such balances, if any at period-end, are shown in the Statement of Assets and Liabilities under the payable caption Amount due custodian. To compensate the custodian bank for such overdrafts, the overdrawn Fund may either (1) leave funds as a compensating balance in the account so the custodian bank can be compensated by earning the additional interest; or (2) compensate by paying the custodian bank at a rate agreed upon by the custodian bank and Invesco, not to exceed the contractually agreed upon rate.
Note 6 - Investment Transactions
The aggregate amount of investment securities (other than short-term securities, U.S. Treasury obligations and money market funds, if any) purchased and sold by the Fund during the period ended August 31, 2019 was $205,807,651 and $159,139,487, respectively.
Note 7 - Share Information
Transactions in shares of beneficial interest were as follows:
61 INVESCO OPPENHEIMER SHORT TERM MUNICIPAL FUND
NOTES TO FINANCIAL STATEMENTSContinued
| | | | | | | | | | | | | | | | | | | | | | | | |
| | | Three Months Ended | | | | | | | | | | | | | |
| | | August 31, 20191 | | | Year Ended May 31, 20192 | | | Year Ended May 31, 2018 | |
| | | Shares | | | Amount | | | Shares | | | Amount | | | Shares | | | Amount | |
Class A | | | | | | | | | | | | | | | | | | | | | | | | |
Sold | | | 10,911,443 | | | | $ 41,046,904 | | | | 42,496,264 | | | $ | 158,088,932 | | | | 54,853,897 | | | $ | 205,355,189 | |
Dividends and/or distributions reinvested | | | 503,906 | | | | 1,896,383 | | | | 2,077,677 | | | | 7,737,479 | | | | 1,927,769 | | | | 7,207,511 | |
Redeemed | | | (11,093,691 | ) | | | (41,739,858 | ) | | | (48,385,562 | ) | | | (180,046,275 | ) | | | (56,496,633 | ) | | | (211,279,485 | ) |
Net increase (decrease) | | | 321,658 | | | | $ 1,203,429 | | | | (3,811,621 | ) | | $ | (14,219,864 | ) | | | 285,033 | | | $ | 1,283,215 | |
| | | | | | | | | | | | | | | | | | | | | | | | |
| | | | | | | | | | | | | | | | | | | | | | | | | |
Class C | | | | | | | | | | | | | | | | | | | | | | | | |
Sold | | | 881,071 | | | | $ 3,316,170 | | | | 3,612,387 | | | $ | 13,442,110 | | | | 6,833,905 | | | $ | 25,575,292 | |
Dividends and/or distributions reinvested | | | 53,866 | | | | 202,452 | | | | 258,250 | | | | 960,175 | | | | 255,804 | | | | 956,229 | |
Redeemed | | | (4,236,668 | ) | | | (15,904,490 | ) | | | (7,613,944 | ) | | | (28,333,226 | ) | | | (10,729,524 | ) | | | (40,122,117 | ) |
Net decrease | | | (3,301,731 | ) | | | $ (12,385,868 | ) | | | (3,743,307 | ) | | $ | (13,930,941 | ) | | | (3,639,815 | ) | | $ | (13,590,596 | ) |
| | | | | | | | | | | | | | | | | | | | | | | | |
| | | | | | | | | | | | | | | | | | | | | | | | | |
Class Y | | | | | | | | | | | | | | | | | | | | | | | | |
Sold | | | 27,513,436 | | | | $ 103,445,698 | | | | 146,563,331 | | | $ | 545,579,704 | | | | 103,440,434 | | | $ | 386,959,198 | |
Dividends and/or distributions reinvested | | | 1,115,957 | | | | 4,199,772 | | | | 3,923,704 | | | | 14,615,423 | | | | 2,844,085 | | | | 10,631,865 | |
Redeemed | | | (26,455,053 | ) | | | (99,454,705 | ) | | | (100,691,849 | ) | | | (374,935,823 | ) | | | (76,475,938 | ) | | | (285,965,690 | ) |
Net increase | | | 2,174,340 | | | | $ 8,190,765 | | | | 49,795,186 | | | $ | 185,259,304 | | | | 29,808,581 | | | $ | 111,625,373 | |
| | | | | | | | | | | | | | | | | | | | | | | | |
| | | | | | | | | | | | | | | | | | | | | | | | | |
Class R63 | | | | | | | | | | | | | | | | | | | | | | | | |
Sold | | | — | | | | $ — | | | | 2,667 | | | $ | 10,000 | | | | — | | | $ | — | |
Dividends and/or distributions reinvested | | | — | | | | — | | | | — | | | | — | | | | — | | | | — | |
Redeemed | | | — | | | | — | | | | — | | | | — | | | | — | | | | — | |
Net increase | | | — | | | | $ — | | | | 2,667 | | | $ | 10,000 | | | | — | | | $ | — | |
| | | | | | | | | | | | | | | | | | | | | | | | |
1.There are entities that are record owners of more than 5% of the outstanding shares of the Fund and own 58% of the outstanding shares of the Fund. IDI has an agreement with these entities to sell Fund shares. The Fund, Invesco and/or Invesco affiliates may make payments to these entities, which are considered to be related to the Fund, for providing services to the Fund, Invesco and/or Invesco affiliates, including but not limited to services such as securities brokerage, distribution, third party record keeping and account servicing. The Fund has no knowledge as to whether all or any portion of the shares owned of record by these entities are also owned beneficially.
2.There are entities that are record owners of more than 5% of the outstanding shares of the Fund and own 67% of the outstanding shares of the Fund. IDI has an agreement with these entities to sell Fund shares. The Fund, Invesco and/or Invesco affiliates may make payments to these entities, which are considered to be related to the Fund, for providing services to the Fund, Invesco and/or Invesco affiliates, including but not limited to services such as securities brokerage, distribution, third party record keeping and account servicing. The Fund has no knowledge as to whether all or any portion of the shares owned of record by these entities are also owned beneficially.
3. Commencement date after the close of business on May 24, 2019.
62 INVESCO OPPENHEIMER SHORT TERM MUNICIPAL FUND
Note 8 - Borrowings
The Fund may utilize financial leverage to the maximum extent allowable under the 1940 Act, a fund generally may not borrow money greater than 331/3 of the Fund’s total assets.
On May 24, 2019, the Fund entered into a $2.5 billion Revolving Credit and Security Agreement with conduit lenders and Citibank N.A. which enables the Fund to participate with certain other Funds in a committed secured borrowing facility that permits borrowings up to $2.5 billion, collectively by certain Funds. This revolving agreement is secured by the assets of the Fund. In connection with this agreement, for the period June 1, 2019 to August 31, 2019, the Fund incurred fees of $183,384. The average daily balance of borrowings under this agreement is $888,043 with a weighted average interest rate of 2.43%. Expenses under the credit agreement are shown in the Statement of Operations as Interest expense on borrowings.
63 INVESCO OPPENHEIMER SHORT TERM MUNICIPAL FUND
REPORT OF INDEPENDENT REGISTERED PUBLIC ACCOUNTING FIRM
To the Board of Trustees of AIM Counselor Series Trust (Invesco Counselor Series Trust) and Shareholders of Invesco Oppenheimer Short Term Municipal Fund
Opinion on the Financial Statements
We have audited the accompanying statement of assets and liabilities, including the schedule of investments, of Invesco Oppenheimer Short Term Municipal Fund (one of the funds constituting AIM Counselor Series Trust (Invesco Counselor Series Trust), referred to hereafter as the “Fund”) as of August 31, 2019, the related statements of operations and of changes in net assets for each of the periods indicated in the table below, including the related notes, and the financial highlights for each of the periods indicated in the table below (collectively referred to as the “financial statements”). In our opinion, the financial statements present fairly, in all material respects, the financial position of the Fund as of August 31, 2019, the results of its operations, the changes in its net assets and the financial highlights for each of the periods indicated in the table below, in conformity with accounting principles generally accepted in the United States of America.
| | |
Statement of Operations and Statement of Changes in Net Assets | | Financial Highlights |
For the period from June 1, 2019 through August 31, 2019 and the
year ended May 31, 2019 | | For the period from June 1, 2019 through August 31, 2019 and the year ended May 31, 2019 for Class A, Class C and Class Y For the period from June 1, 2019 through August 31, 2019 and the period from May 24, 2019 (inception of offering) through May 31, 2019 for Class R6 |
The financial statements of Invesco Oppenheimer Short Term Municipal Fund (formerly known as Oppenheimer Short Term Municipal Fund) as of and for the year ended May 31, 2018 and the financial highlights for each of the periods ended on or prior to May 31, 2018 (not presented herein, other than the statement of changes in net assets and the financial highlights) were audited by other auditors whose report dated July 25, 2018 expressed an unqualified opinion on those financial statements and financial highlights.
Basis for Opinion
These financial statements are the responsibility of the Fund’s management. Our responsibility is to express an opinion on the Fund’s financial statements based on our audits. We are a public accounting firm registered with the Public Company Accounting Oversight Board (United States) (PCAOB) and are required to be independent with respect to the Fund in accordance with the U.S. federal securities laws and the applicable rules and regulations of the Securities and Exchange Commission and the PCAOB.
We conducted our audits of these financial statements in accordance with the standards of the PCAOB. Those standards require that we plan and perform the audit to obtain reasonable assurance about whether the financial statements are free of material misstatement, whether due to error or fraud.
Our audits included performing procedures to assess the risks of material misstatement of the financial statements, whether due to error or fraud, and performing procedures that respond to those risks. Such procedures included examining, on a test basis, evidence regarding the amounts and disclosures in the financial statements. Our audits also included evaluating the accounting principles used and significant estimates made by management, as well as evaluating the overall presentation of the financial statements. Our procedures included confirmation of securities owned as of August 31, 2019 by correspondence with the custodian, transfer agent and brokers; when replies were not received from brokers, we performed other
64 INVESCO OPPENHEIMER SHORT TERM MUNICIPAL FUND
auditing procedures. We believe that our audits provide a reasonable basis for our opinion.
/s/PricewaterhouseCoopers LLP
Houston, TX
October 29, 2019
We have served as the auditor of one or more investment companies in the Invesco group of investment companies since at least 1995. We have not been able to determine the specific year we began serving as auditor.
65 INVESCO OPPENHEIMER SHORT TERM MUNICIPAL FUND
FEDERAL INCOME TAX INFORMATIONUnaudited
In early 2019, if applicable, shareholders of record received information regarding all dividends and distributions paid to them by the Fund during calendar year 2018.
None of the dividends paid by the Fund during the reporting period are eligible for the corporate dividend-received deduction. 100% of the dividends were derived from interest on municipal bonds and are not subject to federal income taxes. To the extent a shareholder is subject to any state or local tax laws, some or all of the dividends received may be taxable.
The foregoing information is presented to assist shareholders in reporting distributions received from the Fund to the Internal Revenue Service. Because of the complexity of the federal regulations which may affect your individual tax return and the many variations in state and local tax regulations, we recommend that you consult your tax advisor for specific guidance.
66 INVESCO OPPENHEIMER SHORT TERM MUNICIPAL FUND
PORTFOLIO PROXY VOTING POLICIES AND GUIDELINES;
UPDATES TO SCHEDULE OF INVESTMENTSUnaudited
Go paperless with eDelivery
Visit invesco.com/edelivery to enjoy the convenience and security of anytime electronic access to your investment documents.
With eDelivery, you can elect to have any or all of the following materials delivered straight to your inbox to download, save and print from your own computer:
● Fund reports and prospectuses
● Quarterly statements
● Daily confirmations
● Tax forms
Invesco mailing information
Send general correspondence to Invesco Investment Services, Inc., P.O. Box 219078, Kansas City, MO 64121-9078.
Important notice regarding delivery of security holder documents
To reduce Fund expenses, only one copy of most shareholder documents may be mailed to shareholders with multiple accounts at the same address (Householding). Mailing of your shareholder documents may be householded indefinitely unless you instruct us otherwise. If you do not want the mailing of these documents to be combined with those for other members of your household, please contact Invesco Investment Services, Inc. at 800 959 4246 or contact your financial institution. We will begin sending you individual copies for each account within 30 days after receiving your request.
Fund holdings and proxy voting information
The Fund provides a complete list of its holdings four times in each fiscal year, at the quarter ends. For the second and fourth quarters, the lists appear in the Fund’s semiannual and annual reports to shareholders. For the first and third quarters, the Fund files the lists with the Securities and Exchange Commission (SEC) on Form N-PORT. The most recent list of portfolio holdings is available at invesco. com/completeqtrholdings. Shareholders can also look up the Fund’s Forms N-PORT on the SEC website at sec.gov.
A description of the policies and procedures that the Fund uses to determine how to vote proxies relating to portfolio securities is available without charge, upon request, from our Client Services department at 800 959 4246 or at invesco.com/proxyguidelines. The information is also available on the SEC website, sec.gov.
Information regarding how the Fund voted proxies related to its portfolio securities during the most recent 12-month period ended June 30 is available at invesco.com/proxysearch. The information is also available on the SEC website, sec.gov.
Invesco Advisers, Inc. is an investment adviser; it provides investment advisory services to individual and institutional clients and does not sell securities. Invesco Distributors, Inc. is the US distributor for Invesco Ltd.’s retail mutual funds, exchange-traded funds and institutional money market funds. Both are wholly owned, indirect subsidiaries of Invesco Ltd.
67 INVESCO OPPENHEIMER SHORT TERM MUNICIPAL FUND
TRUSTEES AND OFFICERS Unaudited
The address of each trustee and officer is AIM Counselor Series Trust (Invesco Counselor Series Trust) (the “Trust”), 11 Greenway Plaza, Suite 1000, Houston, Texas 77046-1173. The trustees serve for the life of the Trust, subject to their earlier death, incapacitation, resignation, retirement or removal as more specifically provided in the Trust’s organizational documents. Each officer serves for a one year term or until their successors are elected and qualified. Column two below includes length of time served with predecessor entities, if any.
| | | | | | | | |
| | | | | |
Name, Year of Birth and Position(s) Held with the Trust | | Trustee and/or Officer Since | | Principal Occupation(s) During Past 5 Years | | Number of Funds in Fund Complex
Overseen by Trustee | | Other Directorship(s)
Held by Trustee During
Past 5 Years |
| | | | | |
INTERESTED PERSONS | | | | | | | | |
| | | | | |
Martin L. Flanagan1— 1960 Trustee and Vice Chair | | 2007 | | Executive Director, Chief Executive Officer and President, Invesco Ltd. (ultimate parent of Invesco and a global investment management firm); Trustee and Vice Chair, The Invesco Funds; Vice Chair, Investment Company Institute; and Member of Executive Board, SMU Cox School of Business Formerly: Advisor to the Board, Invesco Advisers, Inc. (formerly known as Invesco Institutional (N.A.), Inc.); Chairman and Chief Executive Officer, Invesco Advisers, Inc. (registered investment adviser); Director, Chairman, Chief Executive Officer and President, Invesco Holding Company (US), Inc. (formerly IVZ Inc.) (holding company), Invesco Group Services, Inc. (service provider) and Invesco North American Holdings, Inc. (holding company); Director, Chief Executive Officer and President, Invesco Holding Company Limited (parent of Invesco and a global investment management firm); Director, Invesco Ltd.; Chairman, Investment Company Institute and President, Co-Chief Executive Officer, Co-President, Chief Operating Officer and Chief Financial Officer, Franklin Resources, Inc. (global investment management organization) | | 230 | | None |
| | | | | |
Philip A. Taylor2— 1954 Trustee | | 2006 | | Vice Chair, Invesco Ltd.; Trustee, The Invesco Funds Formerly: Director, Invesco Canada Ltd. (formerly known as Invesco Trimark Ltd./Invesco Trimark Ltèe) (registered investment adviser and registered transfer agent); Head of the Americas and Senior Managing Director, Invesco Ltd.; Director, Invesco Advisers, Inc. (formerly known as Invesco Institutional (N.A.), Inc.) (registered investment adviser); | | 230 | | None |
| |
1 Mr. Flanagan is considered an interested person (within the meaning of Section 2(a)(19) of the 1940 Act) of the Trust because he is an officer of the Adviser to the Trust, and an officer and a director of Invesco Ltd., ultimate parent of the Adviser. |
| |
2 Mr. Taylor is considered an interested person (within the meaning of Section 2(a)(19) of the 1940 Act) of the Trust because he is an officer of Invesco Ltd., ultimate parent of the Adviser. |
68 INVESCO OPPENHEIMER SHORT TERM MUNICIPAL FUND
| | | | | | | | |
| | | | | |
Name, Year of Birth and Position(s) Held with the Trust | | Trustee and/or Officer Since | | Principal Occupation(s) During Past 5 Years | | Number of Funds in Fund Complex
Overseen by Trustee | | Other Directorship(s)
Held by Trustee During
Past 5 Years |
| | | | | |
INTERESTED PERSONS
(CONTINUED) | | | | | | | | |
| | | | | |
| Philip A. Taylor (Continued) | | | | Director and Chairman, Invesco Investment Services, Inc. (formerly known as Invesco AIM Investment Services, Inc.) (registered transfer agent); Chief Executive Officer, Invesco Corporate Class Inc. (corporate mutual fund company); Chairman and Chief Executive Officer, Invesco Canada Ltd. (formerly known as Invesco Trimark Ltd./Invesco Trimark Ltèe) (registered investment adviser and registered transfer agent); Senior Vice President, The Invesco Funds; Director, Invesco Investment Advisers LLC (formerly known as Van Kampen Asset Management); Director, Chairman, Chief Executive Officer and President, Invesco Management Group, Inc. (formerly known as Invesco AIM Management Group, Inc.) (financial services holding company); Co-Chairman, Co-President and Co-Chief Executive Officer, Invesco Advisers, Inc. (formerly known as Invesco Institutional (N.A.), Inc.) (registered investment adviser); Director, Chief Executive Officer and President, Van Kampen Exchange Corp; President and Principal Executive Officer, The Invesco Funds (other than AIM Treasurer’s Series Trust (Invesco Treasurer’s Series Trust), Short-Term Investments Trust and Invesco Management Trust); Executive Vice President, The Invesco Funds (AIM Treasurer’s Series Trust (Invesco Treasurer’s Series Trust), Short-Term Investments Trust and Invesco Management Trust only); Director and President, INVESCO Funds Group, Inc. (registered investment adviser and registered transfer agent); Director and Chairman, IVZ Distributors, Inc. (formerly known as INVESCO Distributors, Inc.) (registered broker dealer); Director, President and Chairman, Invesco Inc. (holding company), Invesco Canada Holdings Inc. (holding company), Trimark Investments Ltd./Placements Trimark Ltèe and Invesco Financial Services Ltd/Services Financiers Invesco Ltèe; Chief Executive Officer, Invesco Canada Fund Inc. (corporate mutual fund company); Director and Chairman, Van Kampen Investor Services Inc.; Director, Chief Executive Officer and President, 1371 Preferred Inc. (holding | | | | |
69 INVESCO OPPENHEIMER SHORT TERM MUNICIPAL FUND
TRUSTEES AND OFFICERSUnaudited / Continued
| | | | | | | | |
| | | | | |
Name, Year of Birth and Position(s) Held with the Trust | | Trustee and/or Officer Since | | Principal Occupation(s) During Past 5 Years | | Number of Funds in Fund Complex
Overseen by Trustee | | Other Directorship(s)
Held by Trustee During
Past 5 Years |
| | | | | |
INTERESTED PERSONS
(CONTINUED) | | | | | | | | |
| | | | | |
| Philip A. Taylor (Continued) | | | | company) and Van Kampen Investments Inc.; Director and President, AIM GP Canada Inc. (general partner for limited partnerships) and Van Kampen Advisors, Inc.; Director and Chief Executive Officer, Invesco Trimark Dealer Inc. (registered broker dealer); Director, Invesco Distributors, Inc. (formerly known as Invesco AIM Distributors, Inc.) (registered broker dealer); Manager, Invesco Capital Management LLC; Director, Chief Executive Officer and President, Invesco Advisers, Inc.; Director, Chairman, Chief Executive Officer and President, Invesco AIM Capital Management, Inc.; President, Invesco Trimark Dealer Inc. and Invesco Trimark Ltd./Invesco Trimark Ltèe; Director and President, AIM Trimark Corporate Class Inc. and AIM Trimark Canada Fund Inc.; Senior Managing Director, Invesco Holding Company Limited; Director and Chairman, Fund Management Company (former registered broker dealer); President and Principal Executive Officer, The Invesco Funds (AIM Treasurer’s Series Trust (Invesco Treasurer’s Series Trust), and Short-Term Investments Trust only); President, AIM Trimark Global Fund Inc. and AIM Trimark Canada Fund Inc. | | | | |
70 INVESCO OPPENHEIMER SHORT TERM MUNICIPAL FUND
| | | | | | | | |
| | | | | |
Name, Year of Birth and Position(s) Held with the Trust | | Trustee and/or Officer Since | | Principal Occupation(s) During Past 5 Years | | Number of Funds in Fund Complex
Overseen by Trustee | | Other Directorship(s)
Held by Trustee During
Past 5 Years |
| | | | | |
| INDEPENDENT TRUSTEES | | | | | | | | |
| | | | | |
Bruce L. Crockett – 1944 Trustee and Chair | | 2003 | | Chairman, Crockett Technologies Associates (technology consulting company) Formerly: Director, Captaris (unified messaging provider); Director, President and Chief Executive Officer, COMSAT Corporation; Chairman, Board of Governors of INTELSAT (international communications company); ACE Limited (insurance company); Independent Directors Council and Investment Company Institute: Member of the Audit Committee, Investment Company Institute; Member of the Executive Committee and Chair of the Governance Committee, Independent Directors Council | | 230 | | Director and Chairman of the Audit Committee, ALPS (Attorneys Liability Protection Society) (insurance company); Director and Member of the Audit Committee and Compensation Committee, Ferroglobe PLC (metallurgical company) |
| | | | | |
David C. Arch – 1945 Trustee | | 2010 | | Chairman of Blistex Inc. (consumer health care products manufacturer); Member, World Presidents’ Organization | | 230 | | Board member of the Illinois Manufacturers’ Association |
| | | | | |
Beth Ann Brown – 1968 Trustee | | 2019 | | Independent Consultant Formerly: Head of Intermediary Distribution, Managing Director, Strategic Relations, Managing Director, Head of National Accounts, Senior Vice President, National Account Manager and Senior Vice President, Key Account Manager, Columbia Management Investment Advisers LLC; Vice President, Key Account Manager, Liberty Funds Distributor, Inc.; and Trustee of certain Oppenheimer Funds | | 230 | | Director, Board of Directors of Caron Engineering Inc.; Advisor, Board of Advisors of Caron Engineering Inc.; President and Director, of Acton Shapleigh Youth Conservation Corps (non-profit); and Vice President and Director of Grahamtastic Connection (non-profit) |
| | | | | |
Jack M. Fields – 1952 Trustee | | 2003 | | Chief Executive Officer, Twenty First Century Group, Inc. (government affairs company); and Chairman, Discovery Learning Alliance (non-profit) Formerly: Owner and Chief Executive Officer, Dos Angeles Ranch L.P. (cattle, hunting, corporate entertainment); Director, Insperity, Inc. (formerly known as Administaff) (human resources provider); Chief Executive Officer, Texana Timber LP (sustainable forestry | | 230 | | None |
| |
| |
71 INVESCO OPPENHEIMER SHORT TERM MUNICIPAL FUND
TRUSTEES AND OFFICERSUnaudited / Continued
| | | | | | | | |
| | | | | |
Name, Year of Birth and Position(s) Held with the Trust | | Trustee and/or Officer Since | | Principal Occupation(s) During Past 5 Years | | Number of Funds in Fund Complex
Overseen by Trustee | | Other Directorship(s)
Held by Trustee During
Past 5 Years |
| | | | | |
INDEPENDENT TRUSTEES (CONTINUED) | | | | | | | | |
| | | | | |
| Jack M. Fields (Continued) | | | | company); Director of Cross Timbers Quail Research Ranch (non-profit); and member of the U.S. House of Representatives | | | | |
| | | | | |
Cynthia Hostetler —1962 Trustee | | 2017 | | Non-Executive Director and Trustee of a number of public and private business corporations Formerly: Director, Aberdeen Investment Funds (4 portfolios); Head of Investment Funds and Private Equity, Overseas Private Investment Corporation; President, First Manhattan Bancorporation, Inc.; Attorney, Simpson Thacher & Bartlett LLP | | 230 | | Vulcan Materials Company (construction materials company); Trilinc Global Impact Fund; Genesee & Wyoming, Inc. (railroads); Artio Global Investment LLC (mutual fund complex); Edgen Group, Inc. (specialized energy and infrastructure products distributor); Investment Company Institute (professional organization); Independent Directors Council (professional organization) |
| | | | | |
Eli Jones – 1961 Trustee | | 2016 | | Professor and Dean, Mays Business School - Texas A&M University Formerly: Professor and Dean, Walton College of Business, University of Arkansas and E.J. Ourso College of Business, Louisiana State University; Director, Arvest Bank | | 230 | | Insperity, Inc. (formerly known as Administaff) (human resources provider) |
| | | | | |
Elizabeth Krentzman – 1959 Trustee | | 2019 | | Formerly: Principal and Chief Regulatory Advisor for Asset Management Services and U.S. Mutual Fund Leader of Deloitte & Touche LLP; General Counsel of the Investment Company Institute (trade association); National Director of the Investment Management Regulatory Consulting Practice, Principal, Director and Senior Manager of Deloitte & Touche LLP; Assistant Director of the Division of Investment Management - Office of Disclosure and Investment Adviser Regulation of the U.S. Securities and Exchange Commission and various positions with the Division of Investment Management – Office of Regulatory Policy of the U.S. Securities and Exchange Commission; Associate at Ropes & Gray LLP.; Advisory Board Member of the | | 230 | | Trustee of the University of Florida National Board Foundation and Audit Committee Member; Member of the Cartica Funds Board of Directors (private investment funds); Member of the University of Florida Law Center Association, Inc. Board of Trustees and Audit Committee Member |
72 INVESCO OPPENHEIMER SHORT TERM MUNICIPAL FUND
| | | | | | | | |
| | | | | |
Name, Year of Birth and Position(s) Held with the Trust | | Trustee and/or Officer Since | | Principal Occupation(s) During Past 5 Years | | Number of Funds in Fund Complex
Overseen by Trustee | | Other Directorship(s)
Held by Trustee During
Past 5 Years |
| | | | | |
INDEPENDENT TRUSTEES (CONTINUED) | | | | | | | | |
| | | | | |
| Elizabeth Krentzman (Continued) | | | | Securities and Exchange Commission Historical Society; and Trustee of certain Oppenheimer Funds | | | | |
| | | | | |
| Anthony J. LaCava, Jr. – 1956 Trustee | | 2019 | | Formerly: Director and Member of the Audit Committee, Blue Hills Bank (publicly traded financial institution) and Managing Partner, KPMG LLP | | 230 | | Blue Hills Bank; Chairman of Bentley University; Member, Business School Advisory Council; and Nominating Committee, KPMG LLP |
| | | | | |
Prema Mathai-Davis – 1950 Trustee | | 2003 | | Retired Co-Owner & Partner of Quantalytics Research, LLC, (a FinTech Investment Research Platform for the Self-Directed Investor) | | 230 | | None |
| | | | | |
Joel W. Motley – 1952 Trustee | | 2019 | | Director of Office of Finance, Federal Home Loan Bank; Member of the Vestry of Trinity Wall Street; Managing Director of Carmona Motley Hoffman, Inc. (privately held financial advisor); Member of the Finance and Budget Committee of the Council on Foreign Relations, Member of the Investment Committee and Board of Human Rights Watch and Member of the Investment Committee and Board of Historic Hudson Valley (non-profit cultural organization). Formerly: Managing Director of Public Capital Advisors, LLC (privately held financial advisor); Managing Director of Carmona Motley Hoffman, Inc. (privately held financial advisor); Trustee of certain Oppenheimer Funds; and Director of Columbia Equity Financial Corp. (privately held financial advisor) | | 230 | | Director of Greenwall Foundation (bioethics research foundation); Member of Board and Investment Committee of The Greenwall Foundation; Director of Southern Africa Legal Services Foundation; Board Member and Investment Committee Member of Pulitzer Center for Crisis Reporting (non-profit journalism) |
| | | | | |
Teresa M. Ressel — 1962 Trustee | | 2017 | | Non-executive director and trustee of a number of public and private business corporations Formerly: Chief Financial Officer, Olayan America, The Olayan Group (international investor/commercial/industrial); Chief Executive Officer, UBS Securities LLC; Group Chief Operating Officer, Americas, UBS AG; Assistant Secretary for Management & Budget and CFO, US Department of the Treasury | | 230 | | Atlantic Power Corporation (power generation company); ON Semiconductor Corp. (semiconductor supplier) |
73 INVESCO OPPENHEIMER SHORT TERM MUNICIPAL FUND
TRUSTEES AND OFFICERSUnaudited / Continued
| | | | | | | | |
| | | | | |
Name, Year of Birth and Position(s) Held with the Trust | | Trustee and/or Officer Since | | Principal Occupation(s) During Past 5 Years | | Number of Funds in Fund Complex
Overseen by Trustee | | Other Directorship(s)
Held by Trustee During
Past 5 Years |
| | | | | |
INDEPENDENT TRUSTEES (CONTINUED) | | | | | | | | |
| | | | | |
Ann Barnett Stern – 1957 Trustee | | 2017 | | President and Chief Executive Officer, Houston Endowment Inc. (private philanthropic institution) Formerly: Executive Vice President and General Counsel, Texas Children’s Hospital; Attorney, Beck, Redden and Secrest, LLP; Business Law Instructor, University of St. Thomas; Attorney, Andrews & Kurth LLP | | 230 | | Federal Reserve Bank of Dallas |
| | | | | |
Raymond Stickel, Jr. – 1944 Trustee | | 2005 | | Retired Formerly: Director, Mainstay VP Series Funds, Inc. (25 portfolios); Partner, Deloitte & Touche | | 230 | | None |
| | | | | |
Robert C. Troccoli – 1949 Trustee | | 2016 | | Retired Formerly: Adjunct Professor, University of Denver – Daniels College of Business, Senior Partner, KPMG LLP | | 230 | | None |
| | | | | |
Daniel S. Vandivort –1954 Trustee | | 2019 | | Treasurer, Chairman of the Audit and Finance Committee, and Trustee, Board of Trustees, Huntington Disease Foundation of America; and President, Flyway Advisory Services LLC (consulting and property management). Formerly: Trustee and Governance Chair, of certain Oppenheimer Funds | | 230 | | Chairman and Lead Independent Director, Chairman of the Audit Committee, and Director, Board of Directors, Value Line Funds |
| | | | | |
James D. Vaughn – 1945 Trustee | | 2019 | | Retired Formerly: Managing Partner, Deloitte & Touche LLP; Trustee and Chairman of the Audit Committee, Schroder Funds; Board Member, Mile High United Way, Boys and Girls Clubs, Boy Scouts, Colorado Business Committee for the Arts, Economic Club of Colorado and Metro Denver Network (economic development corporation); and Trustee of certain Oppenheimer Funds | | 230 | | Board member and Chairman of Audit Committee of AMG National Trust Bank; Trustee and Investment Committee member, University of South Dakota Foundation; Board member, Audit Committee Member and past Board Chair, Junior Achievement (non-profit) |
| | | | | |
| Christopher L. Wilson – 1957 Trustee, Vice Chair and Chair Designate | | 2017 | | Retired Formerly: Director, TD Asset Management USA Inc. (mutual fund complex) (22 portfolios); Managing Partner, CT2, LLC (investing and | | 230 | | ISO New England, Inc. (non-profit organization managing regional electricity market) |
74 INVESCO OPPENHEIMER SHORT TERM MUNICIPAL FUND
| | | | | | | | |
| | | | | |
Name, Year of Birth and Position(s) Held with the Trust | | Trustee and/or Officer Since | | Principal Occupation(s) During Past 5 Years | | Number of Funds in Fund Complex
Overseen by Trustee | | Other Directorship(s)
Held by Trustee During
Past 5 Years |
| | | | | |
INDEPENDENT TRUSTEES (CONTINUED) | | | | | | | | |
| | | | | |
| Christopher L. Wilson (Continued) | | | | consulting firm); President/Chief Executive Officer, Columbia Funds, Bank of America Corporation; President/Chief Executive Officer, CDC IXIS Asset Management Services, Inc.; Principal & Director of Operations, Scudder Funds, Scudder, Stevens & Clark, Inc.; Assistant Vice President, Fidelity Investments | | | | |
75 INVESCO OPPENHEIMER SHORT TERM MUNICIPAL FUND
TRUSTEES AND OFFICERSUnaudited / Continued
| | | | | | | | |
| | | | | |
Name, Year of Birth and Position(s) Held with the Trust | | Trustee and/or Officer Since | | Principal Occupation(s) During Past 5 Years | | Number of Funds in Fund Complex
Overseen by Trustee | | Other Directorship(s)
Held by Trustee During Past 5 Years |
| | | | | |
| OTHER OFFICERS | | | | | | | | |
| | | | | |
Sheri Morris — 1964 President, Principal Executive Officer and Treasurer | | 2003 | | President, Principal Executive Officer and Treasurer, The Invesco Funds; Vice President, Invesco Advisers, Inc. (formerly known as Invesco Institutional (N.A.), Inc.) (registered investment adviser); and Vice President, Invesco Exchange-Traded Fund Trust, Invesco Exchange-Traded Fund Trust II, Invesco India Exchange-Traded Fund Trust, Invesco Actively Managed Exchange-Traded Fund Trust, Invesco Actively Managed Exchange-Traded Commodity Fund Trust and Invesco Exchange-Traded Self-Indexed Fund Trust, and Vice President, OppenheimerFunds, Inc. Formerly: Vice President and Principal Financial Officer, The Invesco Funds; Vice President, Invesco AIM Advisers, Inc., Invesco AIM Capital Management, Inc. and Invesco AIM Private Asset Management, Inc.; Assistant Vice President and Assistant Treasurer, The Invesco Funds and Assistant Vice President, Invesco Advisers, Inc., Invesco AIM Capital Management, Inc. and Invesco AIM Private Asset Management, Inc.; and Treasurer, Invesco Exchange-Traded Fund Trust, Invesco Exchange-Traded Fund Trust II, Invesco India Exchange-Traded Fund Trust and Invesco Actively Managed Exchange-Traded Fund Trust | | N/A | | N/A |
| | | | | |
Russell C. Burk — 1958 Senior Vice President and Senior Officer | | 2005 | | Senior Vice President and Senior Officer, The Invesco Funds | | N/A | | N/A |
| | | | | |
Jeffrey H. Kupor – 1968 Senior Vice President, Chief Legal Officer and Secretary | | 2018 | | Head of Legal of the Americas, Invesco Ltd.; Senior Vice President and Secretary, Invesco Advisers, Inc. (formerly known as Invesco Institutional (N.A.), Inc.) (registered investment adviser); Senior Vice President and Secretary, Invesco Distributors, Inc. (formerly known as Invesco AIM Distributors, Inc.); Vice President and Secretary, Invesco Investment Services, Inc. (formerly known as Invesco AIM Investment Services, Inc.) Senior Vice President, Chief Legal Officer and Secretary, The Invesco Funds; Secretary and General Counsel, Invesco Investment Advisers LLC (formerly known as Van Kampen Asset Management); Secretary and General Counsel, Invesco Capital Markets, Inc. (formerly known as Van Kampen Funds Inc.) and Chief Legal Officer, Invesco Exchange-Traded Fund Trust, | | N/A | | N/A |
76 INVESCO OPPENHEIMER SHORT TERM MUNICIPAL FUND
| | | | | | | | |
| | | | | |
Name, Year of Birth and Position(s) Held with the Trust | | Trustee and/or Officer Since | | Principal Occupation(s) During Past 5 Years | | Number of Funds in Fund Complex
Overseen by Trustee | | Other Directorship(s)
Held by Trustee During Past 5 Years |
| | | | | |
OTHER OFFICERS
(CONTINUED) | | | | | | | | |
| | | | | |
| Jeffrey H. Kupor (Continued) | | | | Invesco Exchange-Traded Fund Trust II, Invesco India Exchange-Traded Fund Trust, Invesco Actively Managed Exchange-Traded Fund Trust, Invesco Actively Managed Exchange-Traded Commodity Fund Trust and Invesco Exchange-Traded Self-Indexed Fund Trust; Secretary, Invesco Indexing LLC; Secretary, W.L. Ross & Co., LLC Formerly: Secretary and Vice President, Jemstep, Inc.; Head of Legal, Worldwide Institutional, Invesco Ltd.; Secretary and General Counsel, INVESCO Private Capital Investments, Inc.; Senior Vice President, Secretary and General Counsel, Invesco Management Group, Inc. (formerly known as Invesco AIM Management Group, Inc.); Assistant Secretary, INVESCO Asset Management (Bermuda) Ltd.; Secretary and General Counsel, Invesco Private Capital, Inc.; Assistant Secretary and General Counsel, INVESCO Realty, Inc.; Secretary and General Counsel, Invesco Senior Secured Management, Inc.; and Secretary, Sovereign G./P. Holdings Inc. | | | | |
| | | | | |
Andrew R. Schlossberg – 1974 Senior Vice President | | 2019 | | Head of the Americas and Senior Managing Director, Invesco Ltd.; Director and Senior Vice President, Invesco Advisers, Inc. (formerly known as Invesco Institutional (N.A.), Inc.) (registered investment adviser); Director and Chairman, Invesco Investment Services, Inc. (formerly known as Invesco AIM Investment Services, Inc.) (registered transfer agent); Senior Vice President, The Invesco Funds; Director, Invesco Investment Advisers LLC (formerly known as Van Kampen Asset Management); Director, President and Chairman, Invesco Insurance Agency, Inc. Formerly: Director, Invesco UK Limited; Director and Chief Executive, Invesco Asset Management Limited and Invesco Fund Managers Limited; Assistant Vice President, The Invesco Funds; Senior Vice President, Invesco Advisers, Inc. (formerly known as Invesco Institutional (N.A.), Inc.) (registered investment adviser); Director and Chief Executive, Invesco Administration Services Limited and Invesco Global Investment Funds | | N/A | | N/A |
77 INVESCO OPPENHEIMER SHORT TERM MUNICIPAL FUND
TRUSTEES AND OFFICERSUnaudited / Continued
| | | | | | | | |
| | | | | |
Name, Year of Birth and Position(s) Held with the Trust | | Trustee and/or Officer Since | | Principal Occupation(s) During Past 5 Years | | Number of Funds in Fund Complex
Overseen by Trustee | | Other Directorship(s)
Held by Trustee During Past 5 Years |
| | | | | |
OTHER OFFICERS
(CONTINUED) | | | | | | | | |
| | | | | |
| Andrew R. Schlossberg (Continued) | | | | Limited; Director, Invesco Distributors, Inc.; Head of EMEA, Invesco Ltd.; President, Invesco Actively Managed Exchange-Traded Commodity Fund Trust, Invesco Actively Managed Exchange-Traded Fund Trust, Invesco Exchange-Traded Fund Trust, Invesco Exchange-Traded Fund Trust II and Invesco India Exchange-Traded Fund Trust; Managing Director and Principal Executive Officer, Invesco Capital Management LLC | | | | |
| | | | | |
John M. Zerr — 1962 Senior Vice President | | 2006 | | Chief Operating Officer of the Americas; Senior Vice President, Invesco Advisers, Inc. (formerly known as Invesco Institutional (N.A.), Inc.) (registered investment adviser); Senior Vice President, Invesco Distributors, Inc. (formerly known as Invesco AIM Distributors, Inc.); Director and Vice President, Invesco Investment Services, Inc. (formerly known as Invesco AIM Investment Services, Inc.) Senior Vice President, The Invesco Funds; Managing Director, Invesco Capital Management LLC; Director, Invesco Investment Advisers LLC (formerly known as Van Kampen Asset Management); Senior Vice President, Invesco Capital Markets, Inc. (formerly known as Van Kampen Funds Inc.); Manager, Invesco Indexing LLC; Manager, Invesco Specialized Products, LLC; Director and Senior Vice President, Invesco Insurance Agency, Inc.; Member, Invesco Canada Funds Advisory Board; Director, President and Chief Executive Officer, Invesco Corporate Class Inc. (corporate mutual fund company); and Director, Chairman, President and Chief Executive Officer, Invesco Canada Ltd. (formerly known as Invesco Trimark Ltd./Invesco Trimark Ltèe) (registered investment adviser and registered transfer agent) Formerly: Director and Senior Vice President, Invesco Management Group, Inc. (formerly known as Invesco AIM Management Group, Inc.); Secretary and General Counsel, Invesco Management Group, Inc. (formerly known as Invesco AIM Management Group, Inc.); Secretary, Invesco Investment Services, Inc. (formerly known as Invesco AIM Investment Services, Inc.); Chief Legal Officer and Secretary, The Invesco Funds; Secretary and | | N/A | | N/A |
78 INVESCO OPPENHEIMER SHORT TERM MUNICIPAL FUND
| | | | | | | | |
| | | | | |
Name, Year of Birth and Position(s) Held with the Trust | | Trustee and/or Officer Since | | Principal Occupation(s) During Past 5 Years | | Number of Funds in Fund Complex
Overseen by Trustee | | Other Directorship(s)
Held by Trustee During Past 5 Years |
| | | | | |
OTHER OFFICERS
(CONTINUED) | | | | | | | | |
| | | | | |
| John M. Zerr (Continued) | | | | General Counsel, Invesco Investment Advisers LLC (formerly known as Van Kampen Asset Management); Secretary and General Counsel, Invesco Capital Markets, Inc. (formerly known as Van Kampen Funds Inc.); Chief Legal Officer, Invesco Exchange-Traded Fund Trust, Invesco Exchange-Traded Fund Trust II, Invesco India Exchange-Traded Fund Trust, Invesco Actively Managed Exchange-Traded Fund Trust, Invesco Actively Managed Exchange-Traded Commodity Fund Trust and Invesco Exchange-Traded Self-Indexed Fund Trust; Secretary, Invesco Indexing LLC; Director, Secretary, General Counsel and Senior Vice President, Van Kampen Exchange Corp.; Director, Vice President and Secretary, IVZ Distributors, Inc. (formerly known as INVESCO Distributors, Inc.); Director and Vice President, INVESCO Funds Group, Inc.; Director and Vice President, Van Kampen Advisors Inc.; Director, Vice President, Secretary and General Counsel, Van Kampen Investor Services Inc.; Director and Secretary, Invesco Distributors, Inc. (formerly known as Invesco AIM Distributors, Inc.); Director, Senior Vice President, General Counsel and Secretary, Invesco AIM Advisers, Inc. and Van Kampen Investments Inc.; Director, Vice President and Secretary, Fund Management Company; Director, Senior Vice President, Secretary, General Counsel and Vice President, Invesco AIM Capital Management, Inc.; Chief Operating Officer and General Counsel, Liberty Ridge Capital, Inc. (an investment adviser) | | | | |
| | | | | |
Gregory G. McGreevey - 1962 Senior Vice President | | 2012 | | Senior Managing Director, Invesco Ltd.; Director, Chairman, President, and Chief Executive Officer, Invesco Advisers, Inc. (formerly known as Invesco Institutional (N.A.), Inc.) (registered investment adviser); Director, Invesco Mortgage Capital, Inc. and Invesco Senior Secured Management, Inc.; and Senior Vice President, The Invesco Funds; and President, SNW Asset Management Corporation Formerly: Senior Vice President, Invesco Management Group, Inc. and Invesco Advisers, Inc.; Assistant Vice President, The Invesco Funds | | N/A | | N/A |
79 INVESCO OPPENHEIMER SHORT TERM MUNICIPAL FUND
TRUSTEES AND OFFICERSUnaudited / Continued
| | | | | | | | |
| | | | | |
Name, Year of Birth and Position(s) Held with the Trust | | Trustee and/or Officer Since | | Principal Occupation(s) During Past 5 Years | | Number of Funds in Fund Complex
Overseen by Trustee | | Other Directorship(s)
Held by Trustee During Past 5 Years |
| | | | | |
OTHER OFFICERS
(CONTINUED) | | | | | | | | |
| | | | | |
Kelli Gallegos – 1970 Vice President, Principal Financial Officer and Assistant Treasurer | | 2008 | | Assistant Treasurer, Invesco Specialized Products, LLC; Vice President, Principal Financial Officer and Assistant Treasurer, The Invesco Funds; Principal Financial and Accounting Officer –Pooled Investments, Invesco Capital Management LLC; Vice President and Treasurer, Invesco Exchange-Traded Fund Trust, Invesco Exchange-Traded Fund Trust II, Invesco India Exchange-Traded Fund Trust, Invesco Actively Managed Exchange-Traded Fund Trust, Invesco Actively Managed Exchange-Traded Commodity Fund Trust and Invesco Exchange-Traded Self-Indexed Fund Trust Formerly: Assistant Treasurer, Invesco Exchange-Traded Fund Trust, Invesco Exchange-Traded Fund Trust II, Invesco India Exchange-Traded Fund Trust, Invesco Actively Managed Exchange-Traded Fund Trust, Invesco Actively Managed Exchange-Traded Commodity Fund Trust and Invesco Exchange-Traded Self-Indexed Fund Trust; Assistant Treasurer, Invesco Capital Management LLC; Assistant Vice President, The Invesco Funds | | N/A | | N/A |
| | | | | |
Crissie M. Wisdom – 1969 Anti-Money Laundering Compliance Officer | | 2013 | | Anti-Money Laundering Compliance Officer, Invesco Advisers, Inc. (formerly known as Invesco Institutional (N.A.), Inc.) (registered investment adviser), Invesco Capital Markets, Inc. (formerly known as Van Kampen Funds Inc.), Invesco Distributors, Inc., Invesco Investment Services, Inc., The Invesco Funds, and Invesco Exchange-Traded Fund Trust, Invesco Exchange-Traded Fund Trust II, Invesco India Exchange-Traded Fund Trust, Invesco Actively Managed Exchange-Traded Fund Trust, Invesco Actively Managed Exchange-Traded Commodity Fund Trust and Invesco Exchange-Traded Self-Indexed Fund Trust; Anti-Money Laundering Compliance Officer and Bank Secrecy Act Officer, INVESCO National Trust Company and Invesco Trust Company; and Fraud Prevention Manager and Controls and Risk Analysis Manager for Invesco Investment Services, Inc. Formerly: Anti-Money Laundering Compliance Officer, Van Kampen Exchange Corp. and Invesco Management Group, Inc. | | N/A | | N/A |
80 INVESCO OPPENHEIMER SHORT TERM MUNICIPAL FUND
| | | | | | | | |
| | | | | |
Name, Year of Birth and Position(s) Held with the Trust | | Trustee and/or Officer Since | | Principal Occupation(s) During Past 5 Years | | Number of Funds in Fund Complex
Overseen by Trustee | | Other Directorship(s)
Held by Trustee During Past 5 Years |
| | | | | |
OTHER OFFICERS
(CONTINUED) | | | | | | | | |
| | | | | |
Robert R. Leveille – 1969 Chief Compliance Officer | | 2016 | | Chief Compliance Officer, Invesco Advisers, Inc. (registered investment adviser); and Chief Compliance Officer, The Invesco Funds Formerly: Chief Compliance Officer, Putnam Investments and the Putnam Funds | | N/A | | N/A |
The Statement of Additional Information of the Trust includes additional information about the Fund’s Trustees and is available upon request, without charge, by calling 1.800.959.4246. Please refer to the Fund’s Statement of Additional Information for information on the Fund’s sub-advisers.
| | | | | | |
| Office of the Fund | | Investment Adviser | | Distributor | | Auditors |
| 11 Greenway Plaza, | | Invesco Advisers, Inc. | | Invesco Distributors, Inc. | | PricewaterhouseCoopers |
| Suite 1000 | | 1555 Peachtree Street, N.E. | | 11 Greenway Plaza, | | LLP |
| Houston, TX 77046-1173 | | Atlanta, GA 30309 | | Suite 1000 | | 1000 Louisiana Street, |
| | | | Houston, TX | | Suite 5800 |
| | | | 77046-1173 | | Houston, TX 77002-5021 |
| Counsel to the Fund | | Counsel to the | | Transfer Agent | | Custodian |
| Stradley Ronon Stevens & Young, | | Independent Trustees | | Invesco Investment | | Citibank, N.A. |
| LLP | | Goodwin Procter LLP | | Services, Inc. | | 111 Wall Street |
| 2005 Market Street, | | 901 New York Avenue, N.W. | | 11 Greenway Plaza, | | New York, NY 10005 |
| Suite 2600 | | Washington, D.C. 20001 | | Suite 1000 | | |
| Philadelphia, PA 19103-7018 | | | | Houston, TX | | |
| | | | 77046-1173 | | |
81 INVESCO OPPENHEIMER SHORT TERM MUNICIPAL FUND
Invesco recognizes the importance of protecting your personal and financial information when you visit our website located atwww.invesco.com (the “Website”). The following information is designed to help you understand the information collection practices at this Website. We will not sell, share or rent your personally identifiable information to others in contravention of this Privacy Policy. When we refer to ourselves as “we” or “Invesco” in this Privacy Policy, we mean our entire company including our affiliates, such as subsidiaries.
By visiting this Website, you are accepting the practices described in this Privacy Policy. If you do not agree to this policy, you may not use this Website. This Privacy Policy is subject to change without notice, from time to time in our sole discretion. You acknowledge that by accessing the Website after we have posted changes to this Privacy Policy, you are agreeing to this Privacy Policy as modified. Please review the Terms of Use1 to learn of other terms and conditions applicable to your use of the Website.
Please note that this Privacy Policy is not an exclusive statement of our privacy principles across all products and services. Other privacy principles or policies may apply depending on the products or services you obtain from Invesco, or the jurisdiction in which you transact with Invesco.
This Privacy Policy was last updated on May 6, 2018.
Information We Collect and Use
We collect personal information you choose to submit to the Website in order to process transactions requested by you and meet our contractual obligations. For example, you can choose to provide your name, contact information, social security number, or tax identification number in connection with accessing your account, or you can choose to provide your personal information when you fill out a secure account question form. Any information collected about you from the Website can, from time to time, be associated with other identifying information we have about you.
In addition, we may gather information about you automatically through your use of the Website, e.g. your IP address, how you navigate the Website, the organization from which you are accessing the Website, and the websites that you access before and after you visit the Website.
When you access the Website, we may also collect information such as unique device identifiers, your screen resolution and other device settings, information about your location, and analytical information about how you use the device from which you are viewing the Website. Where applicable, we may ask your permission before collecting certain information, such as precise geolocation information.
From time to time, we use or augment the personal information we have about you with information obtained from third parties. For example, we use third party information to confirm contact or financial information or to better understand your interests by associating demographic information from third parties with the information you have provided.
How We Use Personal Information
We use your personal information to respond to your inquiries and provide the products and services you request. We also use your information from time to time to deliver the content and services we believe
1 NTD
82 INVESCO OPPENHEIMER SHORT TERM MUNICIPAL FUND
you will find the most relevant and to provide customer service and support.
We also use the information you provide to further develop and improve our products and services. We aggregate and/or de-identify data about visitors to the Website for various business purposes including product and service development and improvement activities.
How We Share Personal Information
We collaborate with other companies and individuals to perform services for us and on our behalf and we collaborate with our affiliates, other companies and individuals with respect to particular products or services (“Providers”). Examples of Providers include data analysis firms, customer service and support providers, email and SMS vendors, and web-hosting and development companies. Some Providers collect information for us or on our behalf on our Website. These Providers can be provided with access to personal information needed to perform their functions.
We reserve the right to disclose your personal information as required by law, when we believe disclosure is necessary to comply with a regulatory requirement, judicial proceeding, court order or legal process served on us, to protect the safety, rights or property of our customers, the public or Invesco or to enforce the Terms of Use.
If we sell or transfer a business unit (such as a subsidiary) or an asset (such as a website) to another company, we will share your personal information with such company. You will receive notice of such an event and the new entity will inform you of any changes to the practices in this Privacy Policy. If the new entity wishes to make additional use of your information, you have the right to decline such use at that time.
We occasionally disclose aggregate or de-identified data that is not personally identifiable with third parties.
Cookies and Other Tools
Invesco and its Providers collect information about you by using cookies, tracking pixels and other technologies. We use this information to better understand, customize and improve user experience with our websites, services and offerings as well as to manage our advertising. For example, we use web analytics services that use these technologies to gather information to help us understand how visitors engage with and navigate our Website, e.g., how and when pages in a site are visited and by how many visitors. We are also able to offer our visitors a more customized, relevant experience on our sites using these technologies by delivering content and functionality based on your preferences and interests.
Depending on their purpose, some cookies will only operate for the length of a single browsing session, while others have a longer life span to ensure that they fulfill their longer-term purposes. Your web browser can be set to allow you to control whether you will accept cookies or reject cookies, to notify you each time a cookie is sent to your browser, or to delete cookies that have already been set. If your browser is set to reject cookies, certain aspects of the Website that are cookie-enabled will not recognize you when you return to the website, and some Website functionality may be lost. The “Help” section of your browser may tell you how to prevent your browser from accepting cookies. To find out more about cookies, visitwww.aboutcookies.org.
83 INVESCO OPPENHEIMER SHORT TERM MUNICIPAL FUND
| | | | |
| | INVESCO’S PRIVACY NOTICEContinued |
Security
No data transmission over the internet can be 100% secure, so Invesco cannot ensure or warrant the security of any information you submit to us on this Website. However, Invesco seeks to protect your personal information from unauthorized access or use when you transact business on our Website using technical, administrative and procedural measures. Invesco makes no representation as to the reasonableness, efficacy, or appropriateness of the measures we use to safeguard such information.
Users are responsible for maintaining the secrecy of their own passwords. If you have reason to believe that your interaction with us is no longer secure (for example, if you feel that the security of any account you might have with us has been compromised), please immediately notify us by contacting us as specified below.
Transfer of Data to Other Countries
Any information you provide to Invesco through use of the Website may be stored and processed, transferred between and accessed from the United States, Canada and other countries which do not guarantee the same level of protection of personal information as the one in which you reside. However, Invesco will handle your personal information in accordance with this Privacy Policy regardless of where your personal information is stored/accessed.
Children’s Privacy
We are committed to protecting the privacy of children. We do not knowingly collect personal information from children under the age of 18. If you are under the age of 18, do not provide us with any personal information.
Contact Us
Please contact us if you have any questions or concerns about your personal information or require assistance in managing your choices.
Invesco Ltd.
1555 Peachtree St. NE
Atlanta, GA 30309
By phone:
(404) 439-3236
By fax:
(404) 962-8288
By email:
Anne.Gerry@invesco.com
Please update your account information by logging in or contact us by email or telephone as specified above to update your account information whenever such information ceases to be complete or accurate.
You may also contact us to:
84 INVESCO OPPENHEIMER SHORT TERM MUNICIPAL FUND
• Request that we amend, rectify, delete or update the personal data we hold about you;
• Where possible (e.g. in relation to marketing) amend or update your choices around processing;
• Request a copy of personal data held by us.
Disclaimer
Where the Website contains links to third-party websites/content/services that are not owned or controlled by Invesco, Invesco is not responsible for how these properties operate or treat your personal information so we recommend that you read the privacy policies and terms associated with these third party properties carefully.
85 INVESCO OPPENHEIMER SHORT TERM MUNICIPAL FUND
THIS PAGE INTENTIONALLY LEFT BLANK.
THIS PAGE INTENTIONALLY LEFT BLANK.
Explore High-Conviction Investing with Invesco

Go paperless with eDelivery
Visit invesco.com/edelivery to enjoy the convenience and security of anytime electronic access to your investment documents.
With eDelivery, you can elect to have any or all of the following materials delivered straight to your inbox to download, save and
print from your own computer:
| ∎ | | Fund reports and prospectuses |
Invesco mailing information
Send general correspondence to Invesco Investment Services, Inc., P.O. Box 219078, Kansas City, MO 64121-9078.
| | | | |
| | 
|
| | Invesco Distributors, Inc. | | O-STM-AR-1 10272019 |
There were no amendments to the Code of Ethics (the “Code”) that applies to the Registrant’s Principal Executive Officer (“PEO”) and Principal Financial Officer (“PFO”) during the period covered by the report. The Registrant did not grant any waivers, including implicit waivers, from any provisions of the Code to the PEO or PFO during the period covered by this report.
| ITEM 3. | AUDIT COMMITTEE FINANCIAL EXPERT. |
The Board of Trustees has determined that the Registrant has at least one audit committee financial expert serving on its Audit Committee. The Audit Committee financial experts are David C. Arch, Bruce L. Crockett, Cynthia Hostetler, Elizabeth Krentzman, Anthony J. LaCava, Jr., Teresa M. Ressel, Raymond Stickel, Jr. Robert C. Troccoli and James Vaughn. David C. Arch, Bruce L. Crockett, Cynthia Hostetler, Elizabeth Krentzman, Anthony J. LaCava, Jr., Teresa M. Ressel, Raymond Stickel, Jr. Robert C. Troccoli and James Vaughn are “independent” within the meaning of that term as used in FormN-CSR..
| ITEM 4. | PRINCIPAL ACCOUNTANT FEES AND SERVICES. |
During the reporting period, PricewaterhouseCoopers LLC (“PwC”) advised the Audit Committee of the following matters for consideration under the SEC’s auditor independence rules. PwC advised the Audit Committee that a PwC Director, a PwC Manager and a PwC Senior Associate each held financial interests in investment companies within the Invesco Fund Complex that were inconsistent with the requirements of Rule2-01(c)(1) of RegulationS-X. PwC noted, among other things, that during the time of its audit, the engagement team was not aware of the investments, (or with respect to the PwC Senior Associate was not aware until after the investments were confirmed as SEC exceptions), the individuals were not in the chain of command of the audit or the audit partners of Invesco or the affiliate of the Registrant, the services each individual provided were not relied upon by the audit engagement team with respect to the audit of the Registrant or its affiliates (or with respect to the PwC Senior Associate, the services were performed by an individual who did not have decision-making responsibility for matters that materially affected the audit and were reviewed by team members at least two levels higher than the PwC Senior Associate), and the investments were not material to the net worth of each individual or their respective immediate family members which they considered in reaching their conclusion. PwC advised the Audit Committee that it believes its objectivity and impartiality had not been adversely affected by these matters as they related to the audit of the Registrant.
On May 24, 2019, certain investment advisor subsidiaries of Invesco Ltd. assumed management responsibility from Oppenheimer Funds, Inc. (“OFI”) for 83open-end mutual funds and 20 exchange-traded funds (collectively, the “Oppenheimer Funds”). Assumption of management responsibility for the Oppenheimer Funds was accomplished through the reorganization of each Oppenheimer Fund into a new Invesco shell fund (collectively, the “New Invesco Funds”) that did not havepre-existing assets (together, the “Reorganizations”). The Reorganizations were part of the acquisition by Invesco Ltd. (together with its subsidiaries, “Invesco”) of the asset management business of OFI (including the Oppenheimer Funds) from Massachusetts Mutual Life Insurance Company (“MassMutual”), which was also consummated on May 24, 2019 (the “Acquisition”). Subsequent to the Acquisition, MassMutual became a significant shareholder of Invesco, and the Invesco Ltd. board of directors expanded by one director with the addition of a director selected by MassMutual.
Prior to the consummation of the Acquisition and the Reorganizations on May 24, 2019, PwC completed an independence assessment to evaluate the services and relationships with OFI and its affiliates, which became affiliates of Invesco upon the closing of the Acquisition. The assessment identified the following relationship and services that are inconsistent with the auditor independence rules under Rule2-01 of RegulationS-X (“Rule2-01”) if provided to an affiliate of an audit client. A retired PwC partner who
receives a benefit from PwC that is not fully funded, served as a member of Audit Committee of the Boards of Trustees of certain Oppenheimer Funds prior to the Acquisition (the“Pre-Reorganization Relationship”). Additionally, PwC provided certainnon-audit services including, expert legal services to one Oppenheimer Fund, custody of client assets in connection with payroll services, anon-audit service performed pursuant to a success-based fee,non-audit services in which PwC acted as an advocate on behalf of a MassMutual foreign affiliate and certain employee activities undertaken in connection with the provision ofnon-audit services for MassMutual and certain MassMutual foreign affiliates (collectively, the“Pre-Reorganization Services”).
PwC and the Audit Committees of the New Invesco Funds each considered the impact that thePre-Reorganization Relationship and Services have on PwC’s independence with respect to the New Invesco Funds. On the basis of the nature of the relationship and services performed, and in particular the mitigating factors described below, PwC concluded that a reasonable investor, possessing knowledge of all the relevant facts and circumstances regarding thePre-Reorganization Relationship and Services, would conclude that thePre-Reorganization Relationship and Services do not impair PwC’s ability to exhibit the requisite objectivity and impartiality to report on the financial statements of the New Invesco Funds for the years ending May 31, 2019 – April 30, 2020 (“PwC’s Conclusion”).
The Audit Committees of the Boards of Trustees of the New Invesco Funds, based upon PwC’s Conclusion and the concurrence of Invesco, considered the relevant facts and circumstances including the mitigating factors described below and, after careful consideration, concluded that PwC is capable of exercising objective and impartial judgment in connection with its audits of the financial statements of the New Invesco Funds that the respective Boards of Trustees oversees.
Mitigating factors that PwC and the Audit Committees considered in reaching their respective conclusions included, among others, the following factors:
| • | | none of thePre-Reorganization Relationship or Services created a mutuality of interest between PwC and the New Invesco Funds; |
| • | | PwC will not act in a management or employee capacity for the New Invesco Funds or their affiliates during any portion of PwC’s professional engagement period; |
| • | | other than the expert legal services,Pre-Reorganization Services that have been provided to OFI, MassMutual and their affiliates do not have any impact on the financial statements of the New Invesco Funds; |
| • | | as it relates to the expert legal services, while the service provided by PwC related to litigation involving one Oppenheimer Fund, the impact of the litigation on the Oppenheimer Fund’s financial statements was based upon OFI’s decision, and OFI management represented that the PwC service was not considered a significant component of its decision; |
| • | | while certain employees of OFI who were involved in the financial reporting process of the Oppenheimer Funds will be employed by Invesco subsequent to the Reorganizations, existing officers of other Invesco Funds will serve as Principal Executive Officer and Principal Financial Officer or equivalent roles for the New Invesco Funds, and are ultimately responsible for the accuracy of all financial statement assertions for the entirety of the financial reporting periods for the New Invesco Funds; |
| • | | thePre-Reorganization Services giving rise to the lack of independence were provided to, or entered into with, OFI, MassMutual and their affiliates at a time when PwC had no independence restriction with respect to these entities; |
| • | | with the exception of the expert legal service provided to one Oppenheimer Fund, none of thePre-Reorganization Services affected the operations or financial reporting of the New Invesco Funds; |
| • | | thePre-Reorganization Services provided by PwC to OFI, MassMutual and their affiliates were performed by persons who were not, and will not be, part of the audit engagement team for the New Invesco Funds; and |
| • | | the fees associated with thePre-Reorganization Services were not material to MassMutual, Invesco or PwC. |
(a) to (d)
Fees Billed by PwC Related to the Registrant
PwC billed the Registrant aggregate fees for services rendered to the Registrant for the last two fiscal years as follows:
| | | | | | | | | | |
| | | Fees Billed for Services
Rendered to the Registrant
forfiscal year end 2019 | | Fees Billed for Services Rendered
to the Registrant for fiscal year end
2018 |
Audit Fees | | | $ | 794,561 | | | | $ | 500,325 | |
Audit-Related Fees | | | $ | 0 | | | | $ | 49,000 | |
Tax Fees(1) | | | $ | 321,363 | | | | $ | 133.493 | |
All Other Fees | | | $ | 0 | | | | $ | 0 | |
| | | | | | | | | | |
Total Fees | | | $ | 1,115,924 | | | | $ | 682,818 | |
(g) PwC billed the Registrant aggregatenon-audit fees of $321,363 for the fiscal year ended 2019, and $182,493 for the fiscal year ended 2018, fornon-audit services rendered to the Registrant.
| | (1) | Audit-Related Fees for the fiscal year end August 31, 2018 include fees billed for agreed upon procedures for regulatory filings. |
| | (2) | Tax Fees for the fiscal year end August 31, 2019 includes fees billed for preparation of U.S. Tax Returns and Taxable Income calculations, including excise andyear-to-date estimates for variousbook-to-tax differences. Tax Fees for fiscal year end August 31, 2018 includes fees billed for reviewing tax returns and/or services related to tax compliance. |
Fees Billed by PwC Related to Invesco and Invesco Affiliates
PwC billed Invesco Advisers, Inc. (“Invesco”), the Registrant’s adviser, and any entity controlling, controlled by or under common control with Invesco that provides ongoing services to the Registrant (“Invesco Affiliates”) aggregate fees forpre-approvednon-audit services rendered to Invesco and Invesco Affiliates for the last two fiscal years as follows:
| | | | | | | | | | |
| | | Fees Billed for Non-Audit Services
Rendered to Invesco and Invesco
Affiliates for fiscal year end 2019 That
Were Required to bePre-Approved by the Registrant’s Audit Committee | | Fees Billed for Non-Audit Services
Rendered to Invesco and Invesco Affiliates
for fiscal year end 2018 That Were
Required to bePre-Approved by the Registrant’s Audit Committee |
Audit-Related Fees(1) | | | $ | 690,000 | | | | $ | 662,000 | |
Tax Fees | | | $ | 0 | | | | $ | 0 | |
All Other Fees | | | $ | 0 | | | | $ | 0 | |
| | | | | | | | | | |
Total Fees | | | $ | 690,000 | | | | $ | 662,000 | |
| | (1) | Audit-Related Fees for the year end 2019 include fees billed related to reviewing controls at a service organization. Audit-Related Fees for the year end 2018 include fees billed related to reviewing controls at a service organization. |
| | | (e)(2) There were no amounts that werepre-approved by the Audit Committee pursuant to the de minimis exception under Rule2-01 of RegulationS-X. |
(f) Not applicable.
(g) Including the fees for services not required to bepre-approved by the Registrant’s audit committee, PwC billed Invesco and Invesco Affiliates aggregatenon-audit fees of $3,901,000 for the fiscal year ended August 31, 2019, and $2,873,000 for the fiscal year ended August 31, 2018, fornon-audit services rendered to Invesco and Invesco Affiliates.
PwC provided audit services to the Investment Company complex of approximately $34 million.
(h) The Audit Committee also has considered whether the provision ofnon-audit services that were rendered to Invesco and Invesco Affiliates that were not required to bepre-approved pursuant to SEC regulations, if any, is compatible with maintaining PwC’s independence.
(e)(1)
PRE-APPROVAL OF AUDIT ANDNON-AUDIT SERVICES
POLICIES AND PROCEDURES
As adopted by the Audit Committees
of the Invesco Funds (the “Funds”)
Last Amended March 29, 2017
| | I. | Statement of Principles |
The Audit Committees (the “Audit Committee”) of the Boards of Trustees of the Funds (the “Board”) have adopted these policies and procedures (the “Procedures”) with respect to thepre-approval of audit andnon-audit services to be provided by the Funds’ independent auditor (the “Auditor”) to the Funds, and to the Funds’ investment adviser(s) and any entity controlling, controlled by, or under common control with the investment adviser(s) that provides ongoing services to the Funds (collectively, “Service Affiliates”).
Under Section 202 of the Sarbanes-Oxley Act of 2002, all audit andnon-audit services provided to the Funds by the Auditor must be preapproved by the Audit Committee. Rule2-01 of RegulationS-X requires that the Audit Committee alsopre-approve a Service Affiliate’s engagement of the Auditor fornon-audit services if the engagement relates directly to the operations and financial reporting of the Funds (a “Service Affiliate’s Covered Engagement”).
These Procedures set forth the procedures and the conditions pursuant to which the Audit Committee maypre-approve audit andnon-audit services for the Funds and a Service Affiliate’s Covered Engagement pursuant to rules and regulations of the Securities and Exchange Commission (“SEC”) and other organizations and regulatory bodies applicable to the Funds (“Applicable Rules”).1 They address both generalpre-approvals without consideration of specificcase-by-case services (“general pre-approvals”) and pre-approvals on acase-by-case basis (“specific pre-approvals”). Any services requiringpre-approval that are not within the scope of generalpre-approvals hereunder are subject to specificpre-approval. These Procedures also address the delegation by the Audit Committee ofpre-approval authority to the Audit Committee Chair or Vice Chair.
| | II. | Pre-Approval of Fund Audit Services |
1 Applicable Rules include, for example, New York Stock Exchange (“NYSE”) rules applicable to closed-end funds managed by Invesco and listed on NYSE.
The annual Fund audit services engagement, including terms and fees, is subject to specificpre-approval by the Audit Committee. Audit services include the annual financial statement audit and other procedures required to be performed by an independent auditor to be able to form an opinion on the Funds’ financial statements. The Audit Committee will receive, review and consider sufficient information concerning a proposed Fund audit engagement to make a reasonable evaluation of the Auditor’s qualifications and independence. The Audit Committee will oversee the Fund audit services engagement as necessary, including approving any changes in terms, audit scope, conditions and fees.
In addition to approving the Fund audit services engagement at least annually and specifically approving any changes, the Audit Committee may generally or specificallypre-approve engagements for other audit services, which are those services that only an independent auditor reasonably can provide. Other audit services may include services associated with SEC registration statements, periodic reports and other documents filed with the SEC.
| | III. | General and SpecificPre-Approval ofNon-Audit Fund Services |
The Audit Committee will consider, at least annually, the list of GeneralPre-ApprovedNon-Audit Services which list may be terminated or modified at any time by the Audit Committee. To inform the Audit Committee’s review and approval of GeneralPre-ApprovedNon-Audit Services, the Funds’ Treasurer (or his or her designee) and Auditor shall provide such information regarding independence or other matters as the Audit Committee may request.
Any services or fee ranges that are not within the scope of GeneralPre-ApprovedNon-Audit Services have not received generalpre-approval and require specificpre-approval. Each request for specificpre-approval by the Audit Committee for services to be provided by the Auditor to the Funds must be submitted to the Audit Committee by the Funds’ Treasurer (or his or her designee)and must include detailed information about the services to be provided, the fees or fee ranges to be charged, and other relevant information sufficient to allow the Audit Committee to consider whether topre-approve such engagement, including evaluating whether the provision of such services will impair the independence of the Auditor and is otherwise consistent with Applicable Rules.
| | IV. | Non-Audit Service Types |
The Audit Committee may provide either general or specificpre-approval of audit-related, tax or other services, each as described in more detail below.
“Audit-related services” are assurance and related services that are reasonably related to the performance of the audit or review of the Fund’s financial statements or that are traditionally performed by an independent auditor. Audit-related services include, among others, accounting consultations related to accounting, financial reporting or disclosure matters not classified as “Audit services”; assistance with understanding and implementing new accounting and financial reporting guidance from rulemaking authorities; services related to mergers, acquisitions or dispositions; compliance with ratings agency requirements and interfund lending activities; and assistance with internal control reporting requirements.
“Tax services” include, but are not limited to, the review and signing of the Funds’ federal tax returns, the review of required distributions by the Funds and consultations regarding tax matters such as the tax treatment of new investments or the impact of new regulations. The Audit Committee will not approve proposed services of the Auditor which the Audit Committee believes are to be provided in connection with a service or transaction initially recommended by the Auditor, the sole business purpose of which may be tax avoidance and the tax treatment of which may not be supported in the Internal Revenue Code and related regulations. The Audit Committee will consult with the Funds’ Treasurer (or his or her designee) and may consult with outside counsel or advisers as necessary to ensure the consistency of tax services rendered by the Auditor with the foregoing policy. The Auditor shall not represent any Fund or any Service Affiliate before a tax court, district court or federal court of claims.
Each request to provide tax services under either the general or specificpre-approval of the Audit Committee will include a description from the Auditor in writing of (i) the scope of the service, the fee structure for the engagement, and any side letter or other amendment to the engagement letter, or any other agreement (whether oral, written, or otherwise) between the Auditor and the Funds, relating to the service; and (ii) any compensation arrangement or other agreement, such as a referral agreement, a referral fee orfee-sharing arrangement, between the Auditor (or an affiliate of the Auditor) and any person (other than the Funds or Service Affiliates receiving the services) with respect to the promoting, marketing, or recommending of a transaction covered by the service. The Auditor will also discuss with the Audit Committee the potential effects of the services on the independence of the Auditor, and document the substance of its discussion with the Audit Committee.
The Audit Committee maypre-approve other non-audit services so long as the Audit Committee believes that the service will not impair the independence of the Auditor.Appendix I includes a list of services that the Auditor is prohibited from performing by the SEC rules.Appendix I also includes a list of services that would impair the Auditor’s independence unless the Audit Committee reasonably concludes that the results of the services will not be subject to audit procedures during an audit of the Funds’ financial statements.
| | V. | Pre-Approval of Service Affiliate’s Covered Engagements |
Rule2-01 of RegulationS-X requires that the Audit Committeepre-approve a Service Affiliate’s engagement of the Auditor fornon-audit services if the engagement relates directly to the operations and financial reporting of the Funds, defined above as a “Service Affiliate’s Covered Engagement”.
The Audit Committee may provide either general or specificpre-approval of any Service Affiliate’s Covered Engagement, including for audit-related, tax or other services, as described above, if the Audit Committee believes that the provision of the services to a Service Affiliate will not impair the independence of the Auditor with respect to the Funds. Any Service Affiliate’s Covered Engagements that are not within the scope of GeneralPre-ApprovedNon-Audit Services have not received generalpre-approval and require specificpre-approval.
Each request for specificpre-approval by the Audit Committee of a Service Affiliate’s Covered Engagement must be submitted to the Audit Committee by the Funds’ Treasurer (or his or her
designee)and must include detailed information about the services to be provided, the fees or fee ranges to be charged, a description of the current status of thepre-approval process involving other audit committees in the Invesco investment company complex (as defined in Rule2-201 of RegulationS-X) with respect to the proposed engagement, and other relevant information sufficient to allow the Audit Committee to consider whether the provision of such services will impair the independence of the Auditor from the Funds. Additionally, the Funds’ Treasurer (or his or her designee) and the Auditor will provide the Audit Committee with a statement that the proposed engagement requirespre-approval by the Audit Committee, the proposed engagement, in their view, will not impair the independence of the Auditor and is consistent with Applicable Rules, and the description of the proposed engagement provided to the Audit Committee is consistent with that presented to or approved by the Invesco audit committee.
Information about all Service Affiliate engagements of the Auditor fornon-audit services, whether or not subject topre-approval by the Audit Committee, shall be provided to the Audit Committee at least quarterly, to allow the Audit Committee to consider whether the provision of such services is compatible with maintaining the Auditor’s independence from the Funds. The Funds’ Treasurer and Auditor shall provide the Audit Committee with sufficiently detailed information about the scope of services provided and the fees for such services, to ensure that the Audit Committee can adequately consider whether the provision of such services is compatible with maintaining the Auditor’s independence from the Funds.
| | VI. | Pre-Approved Fee Levels or Established Amounts |
Pre-approved fee levels or ranges for audit andnon-audit services to be provided by the Auditor to the Funds, and for a Service Affiliate’s Covered Engagement, under generalpre-approval or specificpre-approval will be set periodically by the Audit Committee. Any proposed fees exceeding 110% of the maximumpre-approved fee levels or ranges for such services or engagements will be promptly presented to the Audit Committee and will require specificpre-approval by the Audit Committee before payment of any additional fees is made.
The Audit Committee hereby delegates, subject to the dollar limitations set forth below, specific authority to its Chair, or in his or her absence, Vice Chair, topre-approve audit andnon-audit services proposed to be provided by the Auditor to the Funds and/or a Service Affiliate’s Covered Engagement, between Audit Committee meetings. Such delegation does not preclude the Chair or Vice Chair from declining, on a case by case basis, to exercise his or her delegated authority and instead convening the Audit Committee to consider andpre-approve any proposed services or engagements.
Notwithstanding the foregoing, the Audit Committee mustpre-approve: (a) anynon-audit services to be provided to the Funds for which the fees are estimated to exceed $500,000; (b) any Service Affiliate’s Covered Engagement for which the fees are estimated to exceed $500,000; or (c) any cost increase to any previously approved service or engagement that exceeds the greater of $250,000 or 50% of the previously approved fees up to a maximum increase of $500,000.
| | VIII. | Compliance with Procedures |
Notwithstanding anything herein to the contrary, failure topre-approve any services or engagements that are not required to bepre-approved pursuant to the de minimis exception provided for in Rule2-01(c)(7)(i)(C) of RegulationS-X shall not constitute a violation of these Procedures. The Audit Committee has designated the Funds’ Treasurer to ensure services and engagements arepre-approved in compliance with these Procedures. The Funds’ Treasurer will immediately report to the Chair of the Audit Committee, or the Vice Chair in his or her absence, any breach of these Procedures that comes to the attention of the Funds’ Treasurer or any services or engagements that are not required to bepre-approved pursuant to the de minimis exception provided for in Rule2-01(c)(7)(i)(C) of RegulationS-X.
On at least an annual basis, the Auditor will provide the Audit Committee with a summary of allnon-audit services provided to any entity in the investment company complex (as defined in section2-01(f)(14) of RegulationS-X, including the Funds and Service Affiliates) that were notpre-approved, including the nature of services provided and the associated fees.
| | IX. | Amendments to Procedures |
All material amendments to these Procedures must be approved in advance by the Audit Committee.Non-material amendments to these Procedures may be made by the Legal and Compliance Departments and will be reported to the Audit Committee at the next regularly scheduled meeting of the Audit Committee.
Appendix I
Non-Audit Services That May Impair the Auditor’s Independence
The Auditor is not independent if, at any point during the audit and professional engagement, the Auditor provides the followingnon-audit services:
| | • | | Broker-dealer, investment adviser, or investment banking services ; |
| | • | | Expert services unrelated to the audit; |
| | • | | Any service or product provided for a contingent fee or a commission; |
| | • | | Services related to marketing, planning, or opining in favor of the tax treatment of confidential transactions or aggressive tax position transactions, a significant purpose of which is tax avoidance; |
| | • | | Tax services for persons in financial reporting oversight roles at the Fund; and |
| | • | | Any other service that the Public Company Oversight Board determines by regulation is impermissible. |
An Auditor is not independent if, at any point during the audit and professional engagement, the Auditor provides the followingnon-audit services unless it is reasonable to conclude that the results of the services will not be subject to audit procedures during an audit of the Funds’ financial statements:
| | • | | Bookkeeping or other services related to the accounting records or financial statements of the audit client; |
| | • | | Financial information systems design and implementation; |
| | • | | Appraisal or valuation services, fairness opinions, orcontribution-in-kind reports; |
| | • | | Actuarial services; and |
| | • | | Internal audit outsourcing services. |
| ITEM 5. | AUDIT COMMITTEE OF LISTED REGISTRANTS. |
Not applicable.
| ITEM 6. | SCHEDULE OF INVESTMENTS. |
Investments in securities of unaffiliated issuers is included as part of the reports to stockholders filed under Item 1 of this Form.
| ITEM 7. | DISCLOSURE OF PROXY VOTING POLICIES AND PROCEDURES FORCLOSED-END MANAGEMENT INVESTMENT COMPANIES. |
Not applicable.
| ITEM 8. | PORTFOLIO MANAGERS OFCLOSED-END MANAGEMENT COMPANIES. |
Not applicable.
| ITEM 9. | PURCHASES OF EQUITY SECURITIES BYCLOSED-END MANAGEMENT INVESTMENT COMPANY AND AFFILIATED PURCHASERS. |
Not applicable.
| ITEM 10. | SUBMISSION OF MATTERS TO A VOTE OF SECURITY HOLDERS. |
| ITEM 11. | CONTROLS AND PROCEDURES. |
| (a) | As of October 16, 2019, an evaluation was performed under the supervision and with the participation of the officers of the Registrant, including the PEO and PFO, to assess the effectiveness of the Registrant’s disclosure controls and procedures, as that term is defined in Rule30a-3(c) under the Investment Company Act of 1940 (the “Act”), as amended. Based on that evaluation, the Registrant’s officers, including the PEO and PFO, concluded that, as of October 16, 2019, the Registrant’s disclosure controls and procedures were reasonably designed to ensure: (1) that information required to be disclosed by the Registrant on FormN-CSR is recorded, processed, summarized and reported within the time periods specified by the rules and forms of the Securities and Exchange Commission; and (2) that material information relating to the Registrant is made known to the PEO and PFO as appropriate to allow timely decisions regarding required disclosure. |
| | (b) | There have been no changes in the Registrant’s internal control over financial reporting (as defined in Rule30a-3(d) under the Act) that occurred during the period covered by this report that have materially affected, or are reasonably likely to materially affect, the Registrant’s internal control over financial reporting. |
| ITEM 12. | DISCLOSURE OF SECURITIES LENDING ACTIVITIES FORCLOSED-END MANAGEMENT INVESTMENT COMPANIES. |
Not applicable.
| 13(a) (2) | Certifications of principal executive officer and principal financial officer as required by Rule30a-2(a) under the Investment Company Act of 1940. |
| 13(a) (4) | Registrant’s Independent Public Accountant, attached as Exhibit 99.ACCT |
| 13(b) | Certifications of principal executive officer and principal financial officer as required by Rule30a-2(b) under the Investment Company Act of 1940. |
SIGNATURES
Pursuant to the requirements of the Securities Exchange Act of 1934 and the Investment Company Act of 1940, the Registrant has duly caused this report to be signed on its behalf by the undersigned, thereunto duly authorized.
Registrant: AIM Counselor Series Trust (Invesco Counselor Series Trust)
| | |
By: | | /s/ Sheri Morris |
| | Sheri Morris |
| | Principal Executive Officer |
| |
Date: | | November 7, 2019 |
Pursuant to the requirements of the Securities and Exchange Act of 1934 and the Investment Company Act of 1940, this report has been signed below by the following persons on behalf of the Registrant and in the capacities and on the dates indicated.
| | |
By: | | /s/ Sheri Morris |
| | Sheri Morris |
| | Principal Executive Officer |
| |
Date: | | November 7, 2019 |
| | |
By: | | /s/ Kelli Gallegos |
| | Kelli Gallegos |
| | Principal Financial Officer |
| |
Date: | | November 7, 2019 |