UNITED STATES
SECURITIES AND EXCHANGE COMMISSION
Washington, D.C. 20549
FORM N-CSR
CERTIFIED SHAREHOLDER REPORT OF REGISTERED MANAGEMENT INVESTMENT
COMPANIES
Investment Company Act file number: 811-02809 and 811-10095
Name of Fund: BlackRock Value Opportunities Fund, Inc. and Master Value Opportunities LLC
Fund Address: 100 Bellevue Parkway, Wilmington, DE 19809
Name and address of agent for service: John M. Perlowski, Chief Executive Officer, BlackRock Value Opportunities Fund, Inc. and Master Value Opportunities LLC, 55 East 52nd Street, New York, NY 10055
Registrants’ telephone number, including area code: (800) 441-7762
Date of fiscal year end: 03/31/2017
Date of reporting period: 03/31/2017
Item 1 – Report to Stockholders
MARCH 31, 2017
| | | | |
| | | BlackRock Value Opportunities Fund, Inc. | | |
| | |
| Not FDIC Insured ◾ May Lose Value ◾ No Bank Guarantee | | |
Dear Shareholder,
In the 12 months ended March 31, 2017, risk assets, such as stocks and high-yield bonds, delivered strong performance, while U.S. Treasuries and other higher-quality assets generated negative returns. Markets showed great resilience during a period with big surprises, including the United Kingdom’s vote to leave the European Union and the outcome of the U.S. presidential election, which brought only brief spikes in equity market volatility. The more rate-sensitive high-quality assets, however, struggled as rising energy prices, modest wage increases and steady U.S. job growth led to expectations of higher inflation and anticipation of interest rate increases by the U.S. Federal Reserve (the “Fed”).
The global reflationary theme — rising nominal growth, wages and inflation — was the dominant driver of asset returns during the period, outweighing significant political upheavals and uncertainty. Reflationary expectations accelerated after the U.S. election and continued into the beginning of 2017, stoked by expectations for an extra boost to U.S. growth via fiscal policy. The primary tension surfacing in markets in 2017 has been between reflationary expectations and the realities of fiscal and monetary policy. Markets have been turning their attention to the Fed’s outlook for additional interest rate hikes, while assessing the probability of Congress passing meaningful fiscal stimulus amid political division and a limited budget.
Although economic momentum is gaining traction, the capacity for rapid global growth is restrained by structural factors, including an aging population, low productivity growth and excess savings, as well as cyclical factors, like the Fed leaning toward higher interest rates and the length of the current expansion. Tempered economic growth and high valuations across most assets have set the stage for muted long-term investment returns going forward.
Equity markets still present opportunities, although the disparity between winners and losers is widening — a dynamic that increases the risk and return potential of active investing. Fixed income investors are also facing challenges as bond markets recalibrate for higher inflation expectations after eight years of deflationary concerns. And in a world where political risk and policy uncertainty abound, there is no lack of potential catalysts for higher volatility.
In this environment, investors need to think globally, extend their scope across a broad array of asset classes and be nimble as market conditions change. We encourage you to talk with your financial advisor and visit blackrock.com for further insight about investing in today’s markets.
Sincerely,

Rob Kapito
President, BlackRock Advisors, LLC

Rob Kapito
President, BlackRock Advisors, LLC
| | | | |
| Total Returns as of March 31, 2017 |
| | | | | | | | |
| | | 6-month | | | 12-month | |
U.S. large cap equities (S&P 500® Index) | | | 10.12 | % | | | 17.17 | % |
U.S. small cap equities (Russell 2000® Index) | | | 11.52 | | | | 26.22 | |
International equities (MSCI Europe, Australasia, Far East Index) | | | 6.48 | | | | 11.67 | |
Emerging market equities (MSCI Emerging Markets Index) | | | 6.80 | | | | 17.21 | |
3-month Treasury bills (BofA Merrill Lynch 3-Month U.S. Treasury Bill Index) | | | 0.19 | | | | 0.36 | |
U.S. Treasury securities (BofA Merrill Lynch 10- Year U.S. Treasury Index) | | | (6.08 | ) | | | (3.97 | ) |
U.S. investment-grade bonds (Bloomberg Barclays U.S. Aggregate Bond Index) | | | (2.18 | ) | | | 0.44 | |
Tax-exempt municipal bonds (S&P Municipal Bond Index) | | | (1.93 | ) | | | 0.55 | |
U.S. high yield bonds (Bloomberg Barclays U.S. Corporate High Yield 2% Issuer Capped Index) | | | 4.50 | | | | 16.39 | |
|
| Past performance is no guarantee of future results. Index performance is shown for illustrative purposes only. You cannot invest directly in an index. | |
| | | | | | |
| 2 | | THIS PAGE NOT PART OF YOUR FUND REPORT | | | | |
| | |

| | Shareholders can sign up for e-mail notifications of quarterly statements, annual and semi-annual shareholder reports and prospectuses by enrolling in the electronic delivery program. Electronic copies of shareholder reports and prospectuses are also available on BlackRock’s website. TO ENROLL IN ELECTRONIC DELIVERY: Shareholders Who Hold Accounts with Investment Advisors, Banks or Brokerages: Please contact your financial advisor. Please note that not all investment advisors, banks or brokerages may offer this service. Shareholders Who Hold Accounts Directly with BlackRock: 1. Access the BlackRock website at blackrock.com 2. Select "Access Your Account" 3. Next, select "eDelivery" in the "Related Resources" box and follow the sign-up instructions |
| | | | | | |
| | | BLACKROCK VALUE OPPORTUNITIES FUND, INC. | | MARCH 31, 2017 | | 3 |
| | | | |
| Fund Summary as of March 31, 2017 | | | BlackRock Value Opportunities Fund, Inc. | |
BlackRock Value Opportunities Fund, Inc.’s (the “Fund”) investment objective is to seek long term growth of capital by investing in a diversified portfolio of securities, primarily common stock, of relatively small companies that management of the Fund believes have special investment value and emerging growth companies regardless of size.
On March 27, 2017, the Fund’s Board of Directors approved a proposal to change the name of the Fund to BlackRock Advantage U.S. Total Market Fund, Inc. The Board also approved certain changes to the Fund’s investment objective and investment strategies. The Fund is a feeder fund in a “master/feeder” structure and invests all of its assets in Master Value Opportunities LLC (the “Master LLC”). The Fund and the Master LLC currently have the same investment objective and investment strategies. On March 27, 2017, the Board of Directors of the Master LLC approved a change in the name of the Master LLC to Master Advantage U.S. Total Market LLC and approved the same changes to the Master LLC’s investment objective and investment strategies. In addition, fund management has determined to change the benchmark indices against which the Fund and the Master LLC compare their performance. Subject to shareholder approval of the change to the investment objective of the Fund and the Master LLC at a joint special meeting to be held on June 23, 2017, these changes are expected to become effective during the third quarter of 2017.
|
| Portfolio Management Commentary |
How did the Fund perform?
| • | | For the 12-month period ended March 31, 2017, the Fund, through its investment in Master LLC, underperformed its benchmark, the S&P SmallCap 600® Value Index. |
What factors influenced performance?
| • | | Stock selection in the real estate sector was the most significant detractor from performance during the year, with the weakness mostly concentrated in real estate investment trusts. Selection in the consumer staples sector also detracted, primarily as a result of the Master LLC’s holdings in the food & staples retailing industry. Stock selection in the paper & forest products industry further weighed on 12-month returns. |
| • | | The combination of an underweight position and favorable stock selection in the consumer discretionary sector, highlighted by strong stock-picking in the hotels, restaurants & leisure industry, was the largest contributor to performance. Stock selection also added value in the financials sector, led by performance in the banking industry, and in the industrials sector, where the Master LLC’s holdings in the marine industry added the most to returns. Stock selection in the health care and |
| | | energy sectors contributed positively as did no exposure to the underperforming telecommunications services sector. |
Describe recent portfolio activity.
| • | | During the year, the Master LLC increased its overweight position in information technology (“IT”) through additions to software and communications equipment stocks. The Master LLC also added to consumer staples, which brought the portfolio from an underweight position in the sector to an overweight. Additionally, the Master LLC substantially reduced the extent of its underweight in the consumer discretionary sector and added to its holdings in real estate. The Master LLC reduced its overweight exposure to the health care sector by trimming holdings in the health care equipment & supplies industry, and lowered its positions in energy and financials. |
Describe portfolio positioning at period end.
| • | | Relative to the S&P SmallCap 600® Value Index, the Master LLC ended the period with overweight positions in the IT, health care, real estate and energy sectors, and it was underweight in financials, industrials, telecommunications services and utilities. |
The views expressed reflect the opinions of BlackRock as of the date of this report and are subject to change based on changes in market, economic or other conditions. These views are not intended to be a forecast of future events and are no guarantee of future results.
| | | | | | |
| 4 | | BLACKROCK VALUE OPPORTUNITIES FUND, INC. | | MARCH 31, 2017 | | |
| | | | |
| | | | BlackRock Value Opportunities Fund, Inc. | |
|
| Total Return Based on a $10,000 Investment |
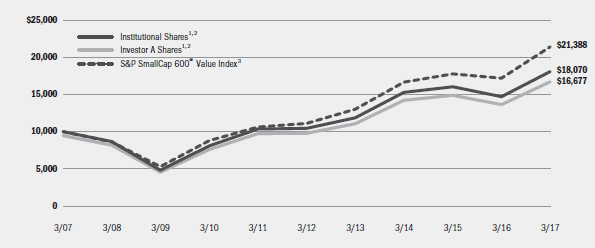
| | 1 | Assuming maximum sales charges, if any, transaction costs and other operating expenses, including administration fees. Institutional Shares do not have a sales charge. |
| | 2 | The Fund invests all of its assets in the Master LLC. The Master LLC invests primarily in common stock of small companies and emerging growth companies that the Master LLC’s management believes have special investment value. |
| | 3 | An unmanaged index that is a subset of the S&P 600® Index that consists of those stocks in the S&P 600® Index exhibiting the strongest value characteristics. |
|
| Performance Summary for the Period Ended March 31, 2017 |
| | | | | | | | | | | | | | | | | | | | | | | | | | | | | | | | | | | |
| | | | | Average Annual Total Returns4 |
| | | | | 1 Year | | 5 Years | | 10 Years |
| | | 6-Month
Total Returns | | w/o sales
charge | | w/sales charge | | w/o sales
charge | | w/sales
charge | | w/o sales
charge | | w/sales
charge |
Institutional | | | | 9.79 | % | | | | 22.72 | % | | | | N/A | | | | | 11.58 | % | | | | N/A | | | | | 6.09 | % | | | | N/A | |
Investor A | | | | 9.58 | | | | | 22.36 | | | | | 15.93 | % | | | | 11.31 | | | | | 10.11 | % | | | | 5.82 | | | | | 5.25 | % |
Investor B | | | | 9.15 | | | | | 21.00 | | | | | 16.50 | | | | | 10.18 | | | | | 9.90 | | | | | 5.00 | | | | | 5.00 | |
Investor C | | | | 9.16 | | | | | 21.33 | | | | | 20.33 | | | | | 10.36 | | | | | 10.36 | | | | | 4.85 | | | | | 4.85 | |
Class R | | | | 9.43 | | | | | 21.97 | | | | | N/A | | | | | 10.98 | | | | | N/A | | | | | 5.45 | | | | | N/A | |
S&P SmallCap 600® Value Index | | | | 12.13 | | | | | 24.32 | | | | | N/A | | | | | 13.99 | | | | | N/A | | | | | 7.90 | | | | | N/A | |
| | 4 | | Assuming maximum sales charges, if any. Average annual total returns with and without sales charges reflect reductions for distribution and service fees. See “About Fund Performance” on page 6 for a detailed description of share classes, including any related sales charges and fees. |
| | | | N/A—Not applicable as share class and index do not have a sales charge. |
| | | | Past performance is not indicative of future results. |
| | | | Performance results may include adjustments made for financial reporting purposes in accordance with U.S. generally accepted accounting principles. |
| | | | | | | | | | | | | | | | | | | | | | | | | | | | | | | | | | | |
| | | Actual | | Hypothetical6 | | |
| | | Beginning
Account Value
October 1, 2016 | | Ending
Account Value
March 31, 2017 | | Expenses Paid
During the Period5 | | Beginning
Account Value
October 1, 2016 | | Ending
Account Value
March 31, 2017 | | Expenses Paid
During the Period5 | | Annualized
Expense Ratio |
Institutional | | | $ | 1,000.00 | | | | $ | 1,097.90 | | | | $ | 4.81 | | | | $ | 1,000.00 | | | | $ | 1,020.34 | | | | $ | 4.63 | | | | | 0.92 | % |
Investor A | | | $ | 1,000.00 | | | | $ | 1,095.80 | | | | $ | 6.48 | | | | $ | 1,000.00 | | | | $ | 1,018.75 | | | | $ | 6.24 | | | | | 1.24 | % |
Investor B | | | $ | 1,000.00 | | | | $ | 1,091.90 | | | | $ | 10.69 | | | | $ | 1,000.00 | | | | $ | 1,014.71 | | | | $ | 10.30 | | | | | 2.05 | % |
Investor C | | | $ | 1,000.00 | | | | $ | 1,091.60 | | | | $ | 10.74 | | | | $ | 1,000.00 | | | | $ | 1,014.66 | | | | $ | 10.35 | | | | | 2.06 | % |
Class R | | | $ | 1,000.00 | | | | $ | 1,094.30 | | | | $ | 8.15 | | | | $ | 1,000.00 | | | | $ | 1,017.15 | | | | $ | 7.85 | | | | | 1.56 | % |
| | 5 | | For each class of the Fund, expenses are equal to the annualized expense ratio for the class, multiplied by the average account value over the period, multiplied by 182/365 (to reflect the one-half year period shown). Because the Fund invests significantly in the Master LLC, the expense table reflects the net expenses of both the Fund and the Master LLC in which it invests. |
| | 6 | | Hypothetical 5% annual return before expenses is calculated by prorating the number of days in the most recent fiscal half year divided by 365. |
| | | | See “Disclosure of Expenses” on page 6 for further information on how expenses were calculated. |
| | | | | | |
| | | BLACKROCK VALUE OPPORTUNITIES FUND, INC. | | MARCH 31, 2017 | | 5 |
| • | | Institutional Shares are not subject to any sales charge. These shares bear no ongoing distribution or service fees and are available only to certain eligible investors. |
| • | | Investor A Shares are subject to a maximum initial sales charge (front-end load) of 5.25% and a service fee of 0.25% per year (but no distribution fee). Certain redemptions of these shares may be subject to a contingent deferred sales charge (“CDSC”) where no initial sales charge was paid at the time of purchase. These shares are generally available through financial intermediaries. |
| • | | Investor B Shares are subject to a maximum CDSC of 4.50%, declining to 0% after six years. In addition, these shares are subject to a distribution fee of 0.75% per year and a service fee of 0.25% per year. These shares automatically convert to Investor A Shares after approximately eight years. (There is no initial sales charge for automatic share conversions.) All returns for periods greater than eight years reflect this conversion. These shares are only available through exchanges and distribution reinvestments by current holders and for purchase by certain employer-sponsored retirement plans. |
| • | | Investor C Shares are subject to a 1.00% CDSC if redeemed within one year of purchase. In addition, these shares are subject to a distribution fee of 0.75% per year and a service fee of 0.25% per year. These shares are generally available through financial intermediaries. |
| • | | Class R Shares are not subject to any sales charge. These shares are subject to a distribution fee of 0.25% per year and a service fee of 0.25% per year. These shares are available only to certain employer-sponsored retirement plans. |
Performance information reflects past performance and does not guarantee future results. Current performance may be lower or higher than the performance data quoted. Refer to www.blackrock.com/funds to obtain performance data current to the most recent month end. Performance results do not reflect the deduction of taxes that a shareholder would pay on fund distributions or the redemption of fund shares. Figures shown in the performance tables on the previous page assume reinvestment of all distributions, if any, at net asset value (“NAV”) on the ex-dividend date. Investment return and principal value of shares will fluctuate so that shares, when redeemed, may be worth more or less than their original cost. Distributions paid to each class of shares will vary because of the different levels of service, distribution and transfer agency fees applicable to each class, which are deducted from the income available to be paid to shareholders.
Shareholders of the Fund may incur the following charges: (a) transactional expenses, such as sales charges; and (b) operating expenses, including administration fees, service and distribution fees, including 12b-1 fees, acquired fund fees and expenses, and other fund expenses. The expense example shown on the previous page (which is based on a hypothetical investment of $1,000 invested on October 1, 2016 and held through March 31, 2017) is intended to assist shareholders both in calculating expenses based on an investment in the Fund and in comparing these expenses with similar costs of investing in other mutual funds.
The expense example provides information about actual account values and actual expenses. In order to estimate the expenses a shareholder paid during the period covered by this report, shareholders can divide their account value by $1,000 and then multiply the result by the number corresponding to their share class under the heading entitled “Expenses Paid During the Period.”
The expense example also provides information about hypothetical account values and hypothetical expenses based on the Fund’s actual expense ratio and an assumed rate of return of 5% per year before expenses. In order to assist shareholders in comparing the ongoing expenses of investing in the Fund and other funds, compare the 5% hypothetical examples with the 5% hypothetical examples that appear in shareholder reports of other funds.
The expenses shown in the expense example are intended to highlight shareholders’ ongoing costs only and do not reflect transactional expenses, such as sales charges, if any. Therefore, the hypothetical example is useful in comparing ongoing expenses only, and will not help shareholders determine the relative total expenses of owning different funds. If these transactional expenses were included, shareholder expenses would have been higher.
| | | | | | |
| 6 | | BLACKROCK VALUE OPPORTUNITIES FUND, INC. | | MARCH 31, 2017 | | |
| | | | |
| Statement of Assets and Liabilities | | | BlackRock Value Opportunities Fund, Inc. | |
| | | | |
| March 31, 2017 | | | |
| | | | |
| Assets | | | | |
Investments at value — Master LLC (cost — $578,065,704) | | $ | 679,635,266 | |
Receivables: | | | | |
Capital shares sold | | | 709,518 | |
Withdrawals from the Master LLC | | | 1,181,337 | |
Prepaid expenses | | | 56,436 | |
| | | | |
Total assets | | | 681,582,557 | |
| | | | |
| | | | |
| Liabilities | | | | |
Payables: | | | | |
Administration fees | | | 144,348 | |
Capital shares redeemed | | | 1,890,855 | |
Officer’s fees | | | 795 | |
Other accrued expenses | | | 65,514 | |
Other affiliates | | | 9,376 | |
Service and distribution fees | | | 203,444 | |
Transfer agent fees | | | 416,112 | |
| | | | |
Total liabilities | | | 2,730,444 | |
| | | | |
Net Assets | | $ | 678,852,113 | |
| | | | |
| | | | |
| Net Assets Consist of | | | | |
Paid-in capital | | $ | 528,816,333 | |
Undistributed net investment income | | | 167,240 | |
Accumulated net realized gain allocated from the Master LLC | | | 48,298,978 | |
Net unrealized appreciation (depreciation) allocated from the Master LLC | | | 101,569,562 | |
| | | | |
Net Assets | | $ | 678,852,113 | |
| | | | |
| | | | |
| Net Asset Value | | | | |
Institutional — Based on net assets of $155,557,600 and 4,460,127 shares outstanding, 100 million shares authorized, $0.10 par value | | $ | 34.88 | |
| | | | |
Investor A — Based on net assets of $366,669,417 and 10,860,382 shares outstanding, 100 million shares authorized, $0.10 par value | | $ | 33.76 | |
| | | | |
Investor B — Based on net assets of $145,378 and 5,336 shares outstanding, 100 million shares authorized, $0.10 par value | | $ | 27.24 | |
| | | | |
Investor C — Based on net assets of $130,475,623 and 5,161,373 shares outstanding, 100 million shares authorized, $0.10 par value | | $ | 25.28 | |
| | | | |
Class R — Based on net assets of $26,004,095 and 940,550 shares outstanding, 100 million shares authorized, $0.10 par value | | $ | 27.65 | |
| | | | |
See Notes to Financial Statements.
| | | | | | |
| | | BLACKROCK VALUE OPPORTUNITIES FUND, INC. | | MARCH 31, 2017 | | 7 |
| | | | |
| Statement of Operations | | | BlackRock Value Opportunities Fund, Inc. | |
| | | | |
| Year Ended March 31, 2017 | | | |
| | | | |
| Investment Income | | | | |
Net investment income allocated from the Master LLC: | | | | |
Dividends — unaffiliated1 | | $ | 7,749,191 | |
Securities lending income — affiliated — net | | | 179,482 | |
Dividends — affiliated | | | 11,240 | |
Foreign taxes withheld | | | (20,658 | ) |
Expenses | | | (3,797,343 | ) |
Fees waived | | | 2,275 | |
| | | | |
Total investment income | | | 4,124,187 | |
| | | | |
| | | | |
| Fund Expenses | | | | |
Service and distribution — class specific | | | 2,457,378 | |
Administration | | | 1,739,713 | |
Transfer agent — class specific | | | 1,239,723 | |
Officer | | | 474 | |
Miscellaneous | | | 181,306 | |
| | | | |
Total expenses | | | 5,618,594 | |
| | | | |
Net investment loss | | | (1,494,407 | ) |
| | | | |
| | | | |
| Realized and Unrealized Gain Allocated from the Master LLC | | | | |
Net realized gain from investments and capital gain distributions from affiliated investment companies | | | 106,078,077 | |
Net change in unrealized appreciation (depreciation) on investments and foreign currency translations | | | 32,926,989 | |
| | | | |
Total realized and unrealized gain | | | 139,005,066 | |
| | | | |
Net Increase in Net Assets Resulting from Operations | | $ | 137,510,659 | |
| | | | |
| | 1 | | Includes non-recurring dividends in the amount of $545,447. |
See Notes to Financial Statements.
| | | | | | |
| 8 | | BLACKROCK VALUE OPPORTUNITIES FUND, INC. | | MARCH 31, 2017 | | |
| | | | |
| Statements of Changes in Net Assets | | | BlackRock Value Opportunities Fund, Inc. | |
| | | | | | | | |
| | | Year Ended March 31, | |
| Increase (Decrease) in Net Assets: | | 2017 | | | 2016 | |
| | | | | | | | |
| Operations | | | | | | | | |
Net investment loss | | $ | (1,494,407 | ) | | $ | (1,544,932 | ) |
Net realized gain | | | 106,078,077 | | | | 15,212,003 | |
Net change in unrealized appreciation (depreciation) | | | 32,926,989 | | | | (82,984,949 | ) |
| | | | |
Net increase (decrease) in net assets resulting from operations | | | 137,510,659 | | | | (69,317,878 | ) |
| | | | |
| | | | | | | | |
| Distributions to Shareholders:1 | | | | | | | | |
From net investment income: | | | | | | | | |
Institutional | | | — | | | | (4,401,963 | ) |
Investor A | | | — | | | | (12,130,638 | ) |
Investor C | | | — | | | | (4,442,235 | ) |
Class R | | | — | | | | (789,491 | ) |
From net realized gain: | | | | | | | | |
Institutional | | | (5,156,179 | ) | | | — | |
Investor A | | | (13,235,696 | ) | | | — | |
Investor B | | | (9,957 | ) | | | — | |
Investor C | | | (6,361,342 | ) | | | — | |
Class R | | | (1,081,678 | ) | | | — | |
| | | | |
Decrease in net assets resulting from distributions to shareholders | | | (25,844,852 | ) | | | (21,764,327 | ) |
| | | | |
| | | | | | | | |
| Capital Share Transactions | | | | | | | | |
Net decrease in net assets derived from capital share transactions | | | (120,625,863 | ) | | | (59,204,122 | ) |
| | | | |
| | | | | | | | |
| Net Assets | | | | | | | | |
Total decrease in net assets | | | (8,960,056 | ) | | | (150,286,327 | ) |
Beginning of year | | | 687,812,169 | | | | 838,098,496 | |
| | | | |
End of year | | $ | 678,852,113 | | | $ | 687,812,169 | |
| | | | |
Undistributed (accumulated) net investment income (loss), end of year | | $ | 167,240 | | | $ | (1,433,639 | ) |
| | | | |
| | 1 | | Distributions for annual periods determined in accordance with U.S. federal income tax regulations. |
See Notes to Financial Statements.
| | | | | | |
| | | BLACKROCK VALUE OPPORTUNITIES FUND, INC. | | MARCH 31, 2017 | | 9 |
| | | | |
| Financial Highlights | | | BlackRock Value Opportunities Fund, Inc. | |
| | | | | | | | | | | | | | | | | | | | |
| | | Institutional | |
| | | Year Ended March 31, | |
| | | 2017 | | | 2016 | | | 2015 | | | 2014 | | | 2013 | |
| | | | | | | | | | | | | | | | | | | | |
| Per Share Operating Performance | | | | | | | | | | | | | | | | | | | | |
Net asset value, beginning of year | | $ | 29.38 | | | $ | 33.01 | | | $ | 31.51 | | | $ | 24.44 | | | $ | 21.52 | |
| | | | |
Net investment income1 | | | 0.06 | 2 | | | 0.04 | | | | 0.09 | | | | 0.08 | | | | 0.08 | |
Net realized and unrealized gain (loss) | | | 6.62 | | | | (2.72 | ) | | | 1.41 | | | | 6.99 | | | | 2.84 | |
| | | | |
Net increase (decrease) from investment operations | | | 6.68 | | | | (2.68 | ) | | | 1.50 | | | | 7.07 | | | | 2.92 | |
| | | | |
Distributions:3 | | | | | | | | | | | | | | | | | | | | |
From net investment income | | | — | | | | (0.95 | ) | | | — | | | | — | | | | — | |
From net realized gain | | | (1.18 | ) | | | — | | | | — | | | | — | | | | — | |
| | | | |
Total distributions | | | (1.18 | ) | | | (0.95 | ) | | | — | | | | — | | | | — | |
| | | | |
Net asset value, end of year | | $ | 34.88 | | | $ | 29.38 | | | $ | 33.01 | | | $ | 31.51 | | | $ | 24.44 | |
| | | | |
| | | | | | | | | | | | | | | | | | | | |
| Total Return4 | | | | | | | | | | | | | | | | | | | | |
Based on net asset value | | | 22.72 | % | | | (8.11 | )% | | | 4.76 | % | | | 28.93 | % | | | 13.57 | % |
| | | | |
| | | | | | | | | | | | | | | | | | | | |
| Ratios to Average Net Assets5,6 | | | | | | | | | | | | | | | | | | | | |
Total expenses | | | 0.94 | % | | | 1.08 | % | | | 1.00 | % | | | 0.97 | % | | | 0.99 | % |
| | | | |
Net investment income | | | 0.19 | %2 | | | 0.12 | % | | | 0.30 | % | | | 0.30 | % | | | 0.37 | % |
| | | | |
| | | | | | | | | | | | | | | | | | | | |
| Supplemental Data | | | | | | | | | | | | | | | | | | | | |
Net assets, end of year (000) | | $ | 155,558 | | | $ | 135,744 | | | $ | 166,487 | | | $ | 308,697 | | | $ | 280,316 | |
| | | | |
Portfolio turnover rate of the Master LLC | | | 68 | % | | | 71 | % | | | 55 | % | | | 61 | % | | | 51 | % |
| | | | |
| | 1 | | Based on average shares outstanding. |
| | 2 | | Net investment income per share and the ratio of net investment income to average net assets includes $0.03 per share and 0.08%, respectively, resulting from a special dividend. |
| | 3 | | Distributions for annual periods determined in accordance with U.S. federal income tax regulations. |
| | 4 | | Where applicable, assumes the reinvestment of distributions. |
| | 5 | | Includes the Fund’s share of the Master LLC’s allocated fees waived of less than 0.005%. |
| | 6 | | Includes the Fund’s share of the Master LLC’s allocated net expenses and/or net investment income. |
See Notes to Financial Statements.
| | | | | | |
| 10 | | BLACKROCK VALUE OPPORTUNITIES FUND, INC. | | MARCH 31, 2017 | | |
| | | | |
| Financial Highlights (continued) | | | BlackRock Value Opportunities Fund, Inc. | |
| | | | | | | | | | | | | | | | | | | | |
| | | Investor A | |
| | | Year Ended March 31, | |
| | | 2017 | | | 2016 | | | 2015 | | | 2014 | | | 2013 | |
| | | | | | | | | | | | | | | | | | | | |
| Per Share Operating Performance | | | | | | | | | | | | | | | | | | | | |
Net asset value, beginning of year | | $ | 28.55 | | | $ | 32.09 | | | $ | 30.70 | | | $ | 23.88 | | | $ | 21.08 | |
| | | | |
Net investment income (loss)1 | | | (0.03 | )2 | | | (0.02 | ) | | | 0.00 | 3 | | | 0.00 | 3 | | | 0.02 | |
Net realized and unrealized gain (loss) | | | 6.42 | | | | (2.64 | ) | | | 1.39 | | | | 6.82 | | | | 2.78 | |
| | | | |
Net increase (decrease) from investment operations | | | 6.39 | | | | (2.66 | ) | | | 1.39 | | | | 6.82 | | | | 2.80 | |
| | | | |
Distributions:4 | | | | | | | | | | | | | | | | | | | | |
From net investment income | | | — | | | | (0.88 | ) | | | — | | | | — | | | | — | |
From net realized gain | | | (1.18 | ) | | | — | | | | — | | | | — | | | | — | |
| | | | |
Total distributions | | | (1.18 | ) | | | (0.88 | ) | | | — | | | | — | | | | — | |
| | | | |
Net asset value, end of year | | $ | 33.76 | | | $ | 28.55 | | | $ | 32.09 | | | $ | 30.70 | | | $ | 23.88 | |
| | | | |
| | | | | | | | | | | | | | | | | | | | |
| Total Return5 | | | | | | | | | | | | | | | | | | | | |
Based on net asset value | | | 22.36 | % | | | (8.28 | )% | | | 4.53 | % | | | 28.56 | % | | | 13.28 | % |
| | | | |
| | | | | | | | | | | | | | | | | | | | |
| Ratios to Average Net Assets6,7 | | | | | | | | | | | | | | | | | | | | |
Total expenses | | | 1.24 | % | | | 1.26 | % | | | 1.24 | % | | | 1.25 | % | | | 1.26 | % |
| | | | |
Net investment income (loss) | | | (0.10 | )%2 | | | (0.06 | )% | | | 0.00 | %8 | | | 0.01 | % | | | 0.09 | % |
| | | | |
| | | | | | | | | | | | | | | | | | | | |
| Supplemental Data | | | | | | | | | | | | | | | | | | | | |
Net assets, end of year (000) | | $ | 366,669 | | | $ | 392,584 | | | $ | 458,593 | | | $ | 479,719 | | | $ | 416,998 | |
| | | | |
Portfolio turnover rate of the Master LLC | | | 68 | % | | | 71 | % | | | 55 | % | | | 61 | % | | | 51 | % |
| | | | |
| | 1 | | Based on average shares outstanding. |
| | 2 | | Net investment income per share and the ratio of net investment income to average net assets includes $0.03 per share and 0.08%, respectively, resulting from a special dividend. |
| | 3 | | Amount is less than $0.005 per share. |
| | 4 | | Distributions for annual periods determined in accordance with U.S. federal income tax regulations. |
| | 5 | | Where applicable, excludes the effects of any sales charges and assumes the reinvestment of distributions. |
| | 6 | | Includes the Fund’s share of the Master LLC’s allocated fees waived of less than 0.005%. |
| | 7 | | Includes the Fund’s share of the Master LLC’s allocated net expenses and/or net investment income. |
| | 8 | | Amount is less than 0.005%. |
See Notes to Financial Statements.
| | | | | | |
| | | BLACKROCK VALUE OPPORTUNITIES FUND, INC. | | MARCH 31, 2017 | | 11 |
| | | | |
| Financial Highlights (continued) | | | BlackRock Value Opportunities Fund, Inc. | |
| | | | | | | | | | | | | | | | | | | | |
| | | Investor B | |
| | | Year Ended March 31, | |
| | | 2017 | | | 2016 | | | 2015 | | | 2014 | | | 2013 | |
| | | | | | | | | | | | | | | | | | | | |
| Per Share Operating Performance | | | | | | | | | | | | | | | | | | | | |
Net asset value, beginning of year | | $ | 23.48 | | | $ | 25.85 | | | $ | 24.96 | | | $ | 19.63 | | | $ | 17.50 | |
| | | | |
Net investment loss1 | | | (0.31 | )2 | | | (0.33 | ) | | | (0.22 | ) | | | (0.24 | ) | | | (0.15 | ) |
Net realized and unrealized gain (loss) | | | 5.25 | | | | (2.04 | ) | | | 1.11 | | | | 5.57 | | | | 2.28 | |
| | | | |
Net increase (decrease) from investment operations | | | 4.94 | | | | (2.37 | ) | | | 0.89 | | | | 5.33 | | | | 2.13 | |
| | | | |
Distributions:3 | | | | | | | | | | | | | | | | | | | | |
From net investment income | | | — | | | | — | | | | — | | | | — | | | | — | |
From net realized gain | | | (1.18 | ) | | | — | | | | — | | | | — | | | | — | |
| | | | |
Total distributions | | | (1.18 | ) | | | — | | | | — | | | | — | | | | — | |
| | | | |
Net asset value, end of year | | $ | 27.24 | | | $ | 23.48 | | | $ | 25.85 | | | $ | 24.96 | | | $ | 19.63 | |
| | | | |
| | | | | | | | | | | | | | | | | | | | |
| Total Return4 | | | | | | | | | | | | | | | | | | | | |
Based on net asset value | | | 21.00 | % | | | (9.17 | )% | | | 3.57 | % | | | 27.15 | % | | | 12.17 | % |
| | | | |
| | | | | | | | | | | | | | | | | | | | |
| Ratios to Average Net Assets5,6 | | | | | | | | | | | | | | | | | | | | |
Total expenses | | | 2.38 | % | | | 2.31 | % | | | 2.18 | % | | | 2.37 | % | | | 2.24 | % |
| | | | |
Net investment loss | | | (1.23 | )%2 | | | (1.34 | )% | | | (0.90 | )% | | | (1.09 | )% | | | (0.90 | )% |
| | | | |
| | | | | | | | | | | | | | | | | | | | |
| Supplemental Data | | | | | | | | | | | | | | | | | | | | |
Net assets, end of year (000) | | $ | 145 | | | $ | 381 | | | $ | 6,716 | | | $ | 10,655 | | | $ | 22,579 | |
| | | | |
Portfolio turnover rate of the Master LLC | | | 68 | % | | | 71 | % | | | 55 | % | | | 61 | % | | | 51 | % |
| | | | |
| | 1 | | Based on average shares outstanding. |
| | 2 | | Net investment income per share and the ratio of net investment income to average net assets includes $0.03 per share and 0.08%, respectively, resulting from a special dividend. |
| | 3 | | Distributions for annual periods determined in accordance with U.S. federal income tax regulations. |
| | 4 | | Where applicable, excludes the effects of any sales charges and assumes the reinvestment of distributions. |
| | 5 | | Includes the Fund’s share of the Master LLC’s allocated fees waived of less than 0.005%. |
| | 6 | | Includes the Fund’s share of the Master LLC’s allocated net expenses and/or net investment income. |
See Notes to Financial Statements.
| | | | | | |
| 12 | | BLACKROCK VALUE OPPORTUNITIES FUND, INC. | | MARCH 31, 2017 | | |
| | | | |
| Financial Highlights (continued) | | | BlackRock Value Opportunities Fund, Inc. | |
| | | | | | | | | | | | | | | | | | | | |
| | | Investor C | |
| | | Year Ended March 31, | |
| | | 2017 | | | 2016 | | | 2015 | | | 2014 | | | 2013 | |
| | | | | | | | | | | | | | | | | | | | |
| Per Share Operating Performance | | | | | | | | | | | | | | | | | | | | |
Net asset value, beginning of year | | $ | 21.80 | | | $ | 24.72 | | | $ | 23.85 | | | $ | 18.71 | | | $ | 16.67 | |
| | | | |
Net investment loss1 | | | (0.22 | )2 | | | (0.20 | ) | | | (0.20 | ) | | | (0.18 | ) | | | (0.13 | ) |
Net realized and unrealized gain (loss) | | | 4.88 | | | | (2.03 | ) | | | 1.07 | | | | 5.32 | | | | 2.17 | |
| | | | |
Net increase (decrease) from investment operations | | | 4.66 | | | | (2.23 | ) | | | 0.87 | | | | 5.14 | | | | 2.04 | |
| | | | |
Distributions:3 | | | | | | | | | | | | | | | | | | | | |
From net investment income | | | — | | | | (0.69 | ) | | | — | | | | — | | | | — | |
From net realized gain | | | (1.18 | ) | | | — | | | | — | | | | — | | | | — | |
| | | | |
Total distributions | | | (1.18 | ) | | | (0.69 | ) | | | — | | | | — | | | | — | |
| | | | |
Net asset value, end of year | | $ | 25.28 | | | $ | 21.80 | | | $ | 24.72 | | | $ | 23.85 | | | $ | 18.71 | |
| | | | |
| | | | | | | | | | | | | | | | | | | | |
| Total Return4 | | | | | | | | | | | | | | | | | | | | |
Based on net asset value | | | 21.33 | % | | | (9.02 | )% | | | 3.65 | % | | | 27.47 | % | | | 12.24 | % |
| | | | |
| | | | | | | | | | | | | | | | | | | | |
| Ratios to Average Net Assets5 | | | | | | | | | | | | | | | | | | | | |
Total expenses | | | 2.07 | %6 | | | 2.09 | %6 | | | 2.08 | % | | | 2.11 | %6 | | | 2.17 | %6 |
| | | | |
Total expenses after fees waived | | | 2.07 | %6 | | | 2.09 | %6 | | | 2.07 | % | | | 2.11 | %6 | | | 2.17 | %6 |
| | | | |
Net investment loss | | | (0.93 | )%2,6 | | | (0.89 | )%6 | | | (0.83 | )% | | | (0.84 | )%6 | | | (0.82 | )%6 |
| | | | |
| | | | | | | | | | | | | | | | | | | | |
| Supplemental Data | | | | | | | | | | | | | | | | | | | | |
Net assets, end of year (000) | | $ | 130,476 | | | $ | 136,066 | | | $ | 180,679 | | | $ | 200,245 | | | $ | 176,629 | |
| | | | |
Portfolio turnover rate of the Master LLC | | | 68 | % | | | 71 | % | | | 55 | % | | | 61 | % | | | 51 | % |
| | | | |
| | 1 | | Based on average shares outstanding. |
| | 2 | | Net investment income per share and the ratio of net investment income to average net assets includes $0.03 per share and 0.08%, respectively, resulting from a special dividend. |
| | 3 | | Distributions for annual periods determined in accordance with U.S. federal income tax regulations. |
| | 4 | | Where applicable, excludes the effects of any sales charges and assumes the reinvestment of distributions. |
| | 5 | | Includes the Fund’s share of the Master LLC’s allocated net expenses and/or net investment income. |
| | 6 | | Includes the Fund’s share of the Master LLC’s allocated fees waived of less than 0.005%. |
See Notes to Financial Statements.
| | | | | | |
| | | BLACKROCK VALUE OPPORTUNITIES FUND, INC. | | MARCH 31, 2017 | | 13 |
| | | | |
| Financial Highlights (concluded) | | | BlackRock Value Opportunities Fund, Inc. | |
| | | | | | | | | | | | | | | | | | | | |
| | | Class R | |
| | | Year Ended March 31, | |
| | | 2017 | | | 2016 | | | 2015 | | | 2014 | | | 2013 | |
| | | | | | | | | | | | | | | | | | | | |
| Per Share Operating Performance | | | | | | | | | | | | | | | | | | | | |
Net asset value, beginning of year | | $ | 23.63 | | | $ | 26.74 | | | $ | 25.66 | | | $ | 20.02 | | | $ | 17.73 | |
| | | | |
Net investment loss1 | | | (0.11 | )2 | | | (0.08 | ) | | | (0.09 | ) | | | (0.06 | ) | | | (0.04 | ) |
Net realized and unrealized gain (loss) | | | 5.31 | | | | (2.20 | ) | | | 1.17 | | | | 5.70 | | | | 2.33 | |
| | | | |
Net increase (decrease) from investment operations | | | 5.20 | | | | (2.28 | ) | | | 1.08 | | | | 5.64 | | | | 2.29 | |
| | | | |
Distributions:3 | | | | | | | | | | | | | | | | | | | | |
From net investment income | | | — | | | | (0.83 | ) | | | — | | | | — | | | | — | |
From net realized gain | | | (1.18 | ) | | | — | | | | — | | | | — | | | | — | |
| | | | |
Total distributions | | | (1.18 | ) | | | (0.83 | ) | | | — | | | | — | | | | — | |
| | | | |
Net asset value, end of year | | $ | 27.65 | | | $ | 23.63 | | | $ | 26.74 | | | $ | 25.66 | | | $ | 20.02 | |
| | | | |
| | | | | | | | | | | | | | | | | | | | |
| Total Return4 | | | | | | | | | | | | | | | | | | | | |
Based on net asset value | | | 21.97 | % | | | (8.50 | )% | | | 4.21 | % | | | 28.17 | % | | | 12.92 | % |
| | | | |
| | | | | | | | | | | | | | | | | | | | |
| Ratios to Average Net Assets5,6 | | | | | | | | | | | | | | | | | | | | |
Total expenses | | | 1.55 | % | | | 1.51 | % | | | 1.59 | % | | | 1.54 | % | | | 1.59 | % |
| | | | |
Net investment loss | | | (0.42 | )%2 | | | (0.31 | )% | | | (0.34 | )% | | | (0.27 | )% | | | (0.23 | )% |
| | | | |
| | | | | | | | | | | | | | | | | | | | |
| Supplemental Data | | | | | | | | | | | | | | | | | | | | |
Net assets, end of year (000) | | $ | 26,004 | | | $ | 23,037 | | | $ | 25,624 | | | $ | 28,444 | | | $ | 27,877 | |
| | | | |
Portfolio turnover rate of the Master LLC | | | 68 | % | | | 71 | % | | | 55 | % | | | 61 | % | | | 51 | % |
| | | | |
| | 1 | | Based on average shares outstanding. |
| | 2 | | Net investment income per share and the ratio of net investment income to average net assets includes $0.03 per share and 0.08%, respectively, resulting from a special dividend. |
| | 3 | | Distributions for annual periods determined in accordance with U.S. federal income tax regulations. |
| | 4 | | Where applicable, assumes the reinvestment of distributions. |
| | 5 | | Includes the Fund’s share of the Master LLC’s allocated fees waived of less than 0.005%. |
| | 6 | | Includes the Fund’s share of the Master LLC’s allocated net expenses and/or net investment income. |
See Notes to Financial Statements.
| | | | | | |
| 14 | | BLACKROCK VALUE OPPORTUNITIES FUND, INC. | | MARCH 31, 2017 | | |
| | |
| Notes to Financial Statements | | BlackRock Value Opportunities Fund, Inc. |
1. Organization:
BlackRock Value Opportunities Fund, Inc. (the “Fund”) is registered under the Investment Company Act of 1940, as amended (the “1940 Act”). The Fund is registered as a diversified, open-end management investment company. The Fund is organized as a Maryland corporation. The Fund seeks to achieve its investment objective by investing all of its assets in Master Value Opportunities LLC (the “Master LLC”), an affiliate of the Fund, which has the same investment objective and strategies as the Fund. The value of the Fund’s investment in the Master LLC reflects the Fund’s proportionate interest in the net assets of the Master LLC. The performance of the Fund is directly affected by the performance of the Master LLC. At March 31, 2017, the percentage of the Master LLC owned by the Fund was 100%. The financial statements of the Master LLC, including the Schedule of Investments, are included elsewhere in this report and should be read in conjunction with the Fund’s financial statements.
The Fund offers multiple classes of shares. All classes of shares have identical voting, dividend, liquidation and other rights and are subject to the same terms and conditions, except that certain classes bear expenses related to the shareholder servicing and distribution of such shares. Institutional Shares are sold only to certain eligible investors. Class R Shares are available only to certain employer-sponsored retirement plans. Investor A and Investor C Shares are generally available through financial intermediaries. Investor B Shares are only available through exchanges and dividend and capital gain distribution reinvestments by existing shareholders, and for purchase by certain employer-sponsored retirement plans. Each class has exclusive voting rights with respect to matters relating to its shareholder servicing and distribution expenditures (except that Investor B shareholders may vote on material changes to the Investor A distribution and service plan).
| | | | | | |
| Share Class | | Initial Sales Charge | | CDSC | | Conversion Privilege |
| Institutional and Class R Shares | | No | | No | | None |
| Investor A Shares | | Yes | | No1 | | None |
Investor B Shares | | No | | Yes | | To Investor A Shares after approximately 8 years |
Investor C Shares | | No | | Yes | | None |
| | 1 | | Investor A Shares may be subject to a contingent deferred sales charge (“CDSC”) for certain redemptions where no initial sales charge was paid at the time of purchase. |
2. Significant Accounting Policies:
The financial statements are prepared in conformity with accounting principles generally accepted in the United States of America (“U.S. GAAP”), which may require management to make estimates and assumptions that affect the reported amounts of assets and liabilities in the financial statements, disclosure of contingent assets and liabilities at the date of the financial statements and the reported amounts of increases and decreases in net assets from operations during the reporting period. Actual results could differ from those estimates. The Fund is considered an investment company under U.S. GAAP and follows the accounting and reporting guidance applicable to investment companies. Below is a summary of significant accounting policies:
Investment Transactions and Investment Income: For financial reporting purposes, contributions to and withdrawals from the Master LLC are accounted on a trade date basis. The Fund records its proportionate share of the Master LLC’s income, expenses and realized and unrealized gains and losses on a daily basis. In addition, the Fund accrues its own expenses. Income, expenses and realized and unrealized gains and losses are allocated daily to each class based on its relative net assets.
Distributions: Distributions paid by the Fund are recorded on the ex-dividend date. Distributions of capital gains are recorded on the ex-dividend date and made at least annually. The character and timing of distributions are determined in accordance with U.S. federal income tax regulations, which may differ from U.S. GAAP.
Indemnifications: In the normal course of business, the Fund enters into contracts that contain a variety of representations that provide general indemnification. The Fund’s maximum exposure under these arrangements is unknown because it involves future potential claims against the Fund, which cannot be predicted with any certainty.
Other: Expenses directly related to the Fund or its classes are charged to the Fund or the applicable class. Other operating expenses shared by several funds, including other funds managed by the Manager, are prorated among those funds on the basis of relative net assets or other appropriate methods. Expenses directly related to the Fund and other shared expenses prorated to the Fund are allocated daily to each class based on its relative net assets or other appropriate methods.
3. Investment Valuation and Fair Value Measurements:
The Fund’s policy is to value its financial instruments at fair value. The Fund records its investment in the Master LLC at fair value based on the Fund’s proportionate interest in the net assets of the Master LLC. Valuation of securities held by the Master LLC is discussed in Note 3 of the Master LLC’s Notes to Financial Statements, which are included elsewhere in this report.
4. Administration Agreement and Other Transactions with Affiliates:
The PNC Financial Services Group, Inc. is the largest stockholder and an affiliate of BlackRock, Inc. (“BlackRock”) for 1940 Act purposes.
| | | | | | |
| | | BLACKROCK VALUE OPPORTUNITIES FUND, INC. | | MARCH 31, 2017 | | 15 |
| | | | |
| Notes to Financial Statements (continued) | | | BlackRock Value Opportunities Fund, Inc. | |
Administration: The Fund entered into an Administration Agreement with BlackRock Advisors, LLC (the “Administrator”), an indirect, wholly-owned subsidiary of BlackRock, to provide administrative services (other than investment advice and related portfolio activities). For such services, the Fund pays the Administrator a monthly fee at an annual rate of 0.25% of the average daily net assets of the Fund. The Fund does not pay an investment advisory fee or investment management fee.
Service and Distribution Fees: The Fund entered into a Distribution Agreement and a Distribution and Service Plan with BlackRock Investments, LLC (“BRIL”), an affiliate of the Administrator. Pursuant to the Distribution and Service Plan and in accordance with Rule 12b-1 under the 1940 Act, the Fund pays BRIL ongoing service and distribution fees. The fees are accrued daily and paid monthly at annual rates based upon the average daily net assets of the relevant share class of the Fund as follows:
| | | | | | | | | | |
| | | Investor A | | Investor B | | Investor C | | Class R | |
Distribution Fee | | — | | 0.75% | | 0.75% | | | 0.25% | |
Service Fee | | 0.25% | | 0.25% | | 0.25% | | | 0.25% | |
BRIL and broker-dealers, pursuant to sub-agreements with BRIL, provide shareholder servicing and distribution services to the Fund. The ongoing service and/or distribution fee compensates BRIL and each broker-dealer for providing shareholder servicing and/or distribution related services to the shareholders.
For the year ended March 31, 2017, the following table shows the class specific service and distribution fees borne directly by each share class of the Fund:
| | | | | | | | |
| Investor A | | Investor B | | Investor C | | Class R | | Total |
$972,171 | | $2,507 | | $1,359,454 | | $123,246 | | $2,457,378 |
Transfer Agent: Pursuant to written agreements, certain financial intermediaries, some of which may be affiliates, provide the Fund with sub-accounting, recordkeeping, sub-transfer agency and other administrative services with respect to sub-accounts they service. For these services, these entities receive an asset-based fee or an annual fee per shareholder account, which will vary depending on share class and/or net assets. For the year ended March 31, 2017, the Fund paid the following amounts to affiliates of BlackRock in return for these services, which are included in transfer agent — class specific in the Statement of Operations:
The Administrator maintains a call center that is responsible for providing certain shareholder services to the Fund. Shareholder services include responding to inquiries and processing subscriptions and redemptions based upon instructions from shareholders. For the year ended March 31, 2017, the Fund reimbursed the Administrator the following amounts for costs incurred in running the call center, which are included in transfer agent — class specific in the Statement of Operations:
| | | | | | | | | | |
| Institutional | | Investor A | | Investor B | | Investor C | | Class R | | Total |
$5,072 | | $4,571 | | $91 | | $1,179 | | $208 | | $11,121 |
For the year ended March 31, 2017, the following table shows the class specific transfer agent fees borne directly by each class of the Fund:
| | | | | | | | | | | | |
| Institutional | | Investor A | | Investor B | | Investor C | | Class R | | Total | |
| $175,406 | | $667,779 | | $1,386 | | $337,812 | | $57,340 | | $ | 1,239,723 | |
Other Fees: For the year ended March 31, 2017, affiliates earned underwriting discounts, direct commissions and dealer concessions on sales of the Fund’s Investor A Shares, which totaled $6,562.
For the year ended March 31, 2017, affiliates received CDSCs as follows:
| | | | |
Investor A | | $ | 328 | |
Investor B | | $ | 10 | |
Investor C | | $ | 2,033 | |
Interfund Lending: In accordance with an exemptive order (the “Order”) from the U.S. Securities and Exchange Commission, the Fund may participate in a joint lending and borrowing facility for temporary purposes (the “Interfund Lending Program”), subject to compliance with the terms and conditions of the Order, and to the extent permitted by the Fund’s investment policies and restrictions. The Fund is currently permitted to borrow and lend under the Interfund Lending Program.
A lending BlackRock fund may lend in aggregate up to 15% of its net assets, but may not lend more than 5% of its net assets to any one borrowing fund through the Interfund Lending Program. A borrowing BlackRock fund may not borrow through the Interfund Lending Program or from any other
| | | | | | |
| 16 | | BLACKROCK VALUE OPPORTUNITIES FUND, INC. | | MARCH 31, 2017 | | |
| | |
| Notes to Financial Statements (continued) | | BlackRock Value Opportunities Fund, Inc. |
source more than 33 1/3% of its total assets (or any lower threshold provided for by the fund’s investment restrictions). If a borrowing BlackRock fund’s total outstanding borrowings exceed 10% of its total assets, each of its outstanding interfund loans will be subject to collateralization of at least 102% of the outstanding principal value of the loan. All interfund loans are for temporary or emergency purposes and the interest rate to be charged will be the average of the highest current overnight repurchase agreement rate available to a lending fund and the bank loan rate, as calculated according to a formula established by the Board.
During the year ended March 31, 2017, the Fund did not participate in the Interfund Lending Program.
Officers and Directors: Certain officers and/or directors of the Fund are officers and/or directors of BlackRock or its affiliates. The Fund reimburses the Administrator for a portion of the compensation paid to the Fund’s Chief Compliance Officer, which is included in Officer in the Statement of Operations.
5. Income Tax Information:
It is the Fund’s policy to comply with the requirements of the Internal Revenue Code of 1986, as amended, applicable to regulated investment companies, and to distribute substantially all of its taxable income to its shareholders. Therefore, no U.S. federal income tax provision is required.
The Fund files U.S. federal and various state and local tax returns. No income tax returns are currently under examination. The statute of limitations on the Fund’s U.S. federal tax returns generally remains open for each of the four years ended March 31, 2017. The statutes of limitations on the Fund’s state and local tax returns may remain open for an additional year depending upon the jurisdiction.
Management has analyzed tax laws and regulations and their application to the Fund as of March 31, 2017, inclusive of the open tax return years, and does not believe that there are any uncertain tax positions that require recognition of a tax liability in the Fund’s financial statements.
U.S. GAAP requires that certain components of net assets be adjusted to reflect permanent differences between financial and tax reporting. These reclassifications have no effect on net assets or net asset values per share. As of period end, the following permanent differences attributable to a net operating loss and income recognized from real estate investment trusts were reclassified to the following accounts:
| | | | |
Undistributed net investment income | | $ | 3,095,286 | |
Accumulated net realized gain allocated from the Master LLC | | $ | (3,095,286 | ) |
The tax character of distributions paid was as follows:
| | | | | | |
| | | 3/31/17 | | | 3/31/16 |
Ordinary income | | | — | | | $21,764,327 |
Long-term capital gains | | $ | 25,844,852 | | | — |
Total | | $ | 25,844,852 | | | $21,764,327 |
As of period end, the tax components of accumulated net earnings were as follows:
| | | | |
Undistributed ordinary income | | $ | 20,417,348 | |
Undistributed long-term capital gains | | | 32,852,080 | |
Net unrealized gains1 | | | 96,766,352 | |
Total | | $ | 150,035,780 | |
| | 1 | | The difference between book-basis and tax-basis net unrealized gains was attributable primarily to tax deferral of losses on wash sales, income recognized from pass-through entities and the treatment of certain security lending transactions. |
During the year ended March 31, 2017, the Fund utilized $1,388,344 of its capital loss carryforward.
| | | | | | |
| | | BLACKROCK VALUE OPPORTUNITIES FUND, INC. | | MARCH 31, 2017 | | 17 |
| | |
| Notes to Financial Statements (concluded) | | BlackRock Value Opportunities Fund, Inc. |
6. Capital Share Transactions:
Transactions in capital shares for each class were as follows:
| | | | | | | | | | | | | | | | | | | | |
| | | Year Ended
March 31, 2017 | | | | | | Year Ended
March 31, 2016 | |
| | | Shares | | | Amount | | | | | | Shares | | | Amount | |
Institutional | | | | | | | | | | | | | | | | | | | | |
Shares sold | | | 957,200 | | | $ | 32,198,621 | | | | | | | | 517,523 | | | $ | 15,802,512 | |
Shares issued in reinvestment of distributions | | | 119,316 | | | | 4,189,176 | | | | | | | | 124,807 | | | | 3,645,605 | |
Shares redeemed | | | (1,236,476 | ) | | | (40,827,779 | ) | | | | | | | (1,065,824 | ) | | | (32,800,608 | ) |
| | | | | | | | | | | | |
Net decrease | | | (159,960 | ) | | $ | (4,439,982 | ) | | | | | | | (423,494 | ) | | $ | (13,352,491 | ) |
| | | | | | | | | | | | |
| | | | | | | | | | | | | | | | | | | | |
Investor A | | | | | | | | | | | | | | | | | | | | |
Shares sold and automatic conversion of shares | | | 1,875,723 | | | $ | 60,905,937 | | | | | | | | 1,810,934 | | | $ | 54,626,237 | |
Shares issued in reinvestment of distributions | | | 366,410 | | | | 12,465,230 | | | | | | | | 404,303 | | | | 11,482,185 | |
Shares redeemed | | | (5,130,807 | ) | | | (163,038,898 | ) | | | | | | | (2,755,931 | ) | | | (81,745,302 | ) |
| | | | | | | | | | | | |
Net decrease | | | (2,888,674 | ) | | $ | (89,667,731 | ) | | | | | | | (540,694 | ) | | $ | (15,636,880 | ) |
| | | | | | | | | | | | |
| | | | | | | | | | | | | | | | | | | | |
Investor B | | | | | | | | | | | | | | | | | | | | |
Shares sold | | | 216 | | | $ | 5,648 | | | | | | | | 2,549 | | | $ | 66,385 | |
Shares issued in reinvestment of distributions | | | 260 | | | | 7,151 | | | | | | | | — | | | | — | |
Shares redeemed and automatic conversion of shares | | | (11,355 | ) | | | (288,019 | ) | | | | | | | (246,088 | ) | | | (6,273,405 | ) |
| | | | | | | | | | | | |
Net decrease | | | (10,879 | ) | | $ | (275,220 | ) | | | | | | | (243,539 | ) | | $ | (6,207,020 | ) |
| | | | | | | | | | | | |
| | | | | | | | | | | | | | | | | | | | |
Investor C | | | | | | | | | | | | | | | | | | | | |
Shares sold | | | 405,534 | | | $ | 9,845,367 | | | | | | | | 505,714 | | | $ | 11,552,926 | |
Shares issued in reinvestment of distributions | | | 226,858 | | | | 5,793,887 | | | | | | | | 186,654 | | | | 4,057,860 | |
Shares redeemed | | | (1,712,857 | ) | | | (41,100,017 | ) | | | | | | | (1,758,720 | ) | | | (39,936,156 | ) |
| | | | | | | | | | | | |
Net decrease | | | (1,080,465 | ) | | $ | (25,460,763 | ) | | | | | | | (1,066,352 | ) | | $ | (24,325,370 | ) |
| | | | | | | | | | | | |
| | | | | | | | | | | | | | | | | | | | |
Class R | | | | | | | | | | | | | | | | | | | | |
Shares sold | | | 284,794 | | | $ | 7,429,402 | | | | | | | | 306,533 | | | $ | 7,440,199 | |
Shares issued in reinvestment of distributions | | | 38,762 | | | | 1,081,093 | | | | | | | | 33,541 | | | | 788,881 | |
Shares redeemed | | | (357,960 | ) | | | (9,292,662 | ) | | | | | | | (323,434 | ) | | | (7,911,441 | ) |
| | | | | | | | | | | | |
Net increase (decrease) | | | (34,404 | ) | | $ | (782,167 | ) | | | | | | | 16,640 | | | $ | 317,639 | |
| | | | | | | | | | | | |
Total Net Decrease | | | (4,174,382 | ) | | $ | (120,625,863 | ) | | | | | | | (2,257,439 | ) | | $ | (59,204,122 | ) |
| | | | | | | | | | | | |
7. Subsequent Events:
Management has evaluated the impact of all subsequent events on the Fund through the date the financial statements were issued and has determined that there were no subsequent events requiring adjustment or additional disclosure in the financial statements.
| | | | | | |
| 18 | | BLACKROCK VALUE OPPORTUNITIES FUND, INC. | | MARCH 31, 2017 | | |
| | |
| Report of Independent Registered Public Accounting Firm | | BlackRock Value Opportunities Fund, Inc. |
To the Board of Directors and Shareholders of BlackRock Value Opportunities Fund, Inc.:
We have audited the accompanying statement of assets and liabilities of BlackRock Value Opportunities Fund, Inc. (the “Fund”), as of March 31, 2017, and the related statement of operations for the year then ended, the statements of changes in net assets for each of the two years in the period then ended and the financial highlights for each of the five years in the period then ended. These financial statements and financial highlights are the responsibility of the Fund’s management. Our responsibility is to express an opinion on these financial statements and financial highlights based on our audits.
We conducted our audits in accordance with the standards of the Public Company Accounting Oversight Board (United States). Those standards require that we plan and perform the audit to obtain reasonable assurance about whether the financial statements and financial highlights are free of material misstatement. The Fund is not required to have, nor were we engaged to perform, an audit of its internal control over financial reporting. Our audit included consideration of internal control over financial reporting as a basis for designing audit procedures that are appropriate in the circumstances, but not for the purpose of expressing an opinion on the effectiveness of the Fund’s internal control over financial reporting. Accordingly, we express no such opinion. An audit also includes examining, on a test basis, evidence supporting the amounts and disclosures in the financial statements, assessing the accounting principles used and significant estimates made by management, as well as evaluating the overall financial statement presentation. We believe that our audits provide a reasonable basis for our opinion.
In our opinion, such financial statements and financial highlights referred to above present fairly, in all material respects, the financial position of BlackRock Value Opportunities Fund, Inc. as of March 31, 2017, the results of its operations for the year then ended, the changes in its net assets for each of the two years in the period then ended and the financial highlights for each of the five years in the period then ended, in conformity with accounting principles generally accepted in the United States of America.
Deloitte & Touche LLP
Philadelphia, Pennsylvania
May 25, 2017
| | | | |
| Important Tax Information (Unaudited) | | | | |
The Fund distributed long-term capital gains of $1.182515 per share to shareholders of record on December 5, 2016.
| | | | | | |
| | | BLACKROCK VALUE OPPORTUNITIES FUND, INC. | | MARCH 31, 2017 | | 19 |
| | |
| Master LLC Portfolio Information | | Master Value Opportunities LLC |
| | |
| Ten Largest Holdings | | Percent of
Net Assets |
Bob Evans Farms, Inc. | | 2% |
Merit Medical Systems, Inc. | | 2 |
LifePoint Health, Inc. | | 2 |
Landauer, Inc. | | 2 |
ILG, Inc. | | 1 |
Cable One, Inc. | | 1 |
LTC Properties, Inc. | | 1 |
CACI International, Inc., Class A | | 1 |
ALLETE, Inc. | | 1 |
Newpark Resources, Inc. | | 1 |
| | |
| Sector Allocation | | Percent of
Net Assets |
Consumer Discretionary | | 18% |
Industrials | | 17 |
Financials | | 15 |
Information Technology | | 14 |
Health Care | | 12 |
Materials | | 6 |
Real Estate | | 6 |
Energy | | 5 |
Consumer Staples | | 4 |
Utilities | | 3 |
Short-Term Securities | | 6 |
Liabilities in Excess of Other Assets | | (6) |
For Master LLC compliance purposes, the Master LLC’s sector classifications refer to one or more of the sector sub-classifications used by one or more widely recognized market indexes or ratings group indexes, and/or as defined by the investment adviser. These definitions may not apply for purposes of this report, which may combine such sector sub-classifications for reporting ease.
| | | | | | |
| 20 | | BLACKROCK VALUE OPPORTUNITIES FUND, INC. | | MARCH 31, 2017 | | |
| | | | |
| Schedule of Investments March 31, 2017 | | | Master Value Opportunities LLC | |
| | | (Percentages shown are based on Net Assets) | |
| | | | | | | | |
| Common Stocks | | Shares | | | Value | |
Aerospace & Defense — 1.2% | | | | | | | | |
Cubic Corp. | | | 152,600 | | | $ | 8,057,280 | |
Air Freight & Logistics — 2.1% | | | | | | | | |
Forward Air Corp. | | | 133,600 | | | | 6,355,352 | |
Hub Group, Inc., Class A (a) | | | 173,575 | | | | 8,053,880 | |
| | | | | | | | |
| | | | | | | | 14,409,232 | |
Auto Components — 1.6% | | | | | | | | |
Dorman Products, Inc. (a)(b) | | | 60,096 | | | | 4,935,684 | |
Gentherm, Inc. (a)(b) | | | 146,900 | | | | 5,765,825 | |
| | | | | | | | |
| | | | | | | | 10,701,509 | |
Banks — 6.4% | | | | | | | | |
Banner Corp. | | | 60,600 | | | | 3,371,784 | |
CenterState Banks, Inc. | | | 85,700 | | | | 2,219,630 | |
Green Bancorp, Inc. (a)(b) | | | 366,301 | | | | 6,520,158 | |
IBERIABANK Corp. | | | 21,900 | | | | 1,732,290 | |
NBT Bancorp, Inc. | | | 87,900 | | | | 3,258,453 | |
OFG Bancorp | | | 258,900 | | | | 3,055,020 | |
Opus Bank (a) | | | 211,700 | | | | 4,265,755 | |
TCF Financial Corp. | | | 255,800 | | | | 4,353,716 | |
Texas Capital Bancshares, Inc. (a)(b) | | | 55,400 | | | | 4,623,130 | |
TriState Capital Holdings, Inc. (a) | | | 350,390 | | | | 8,181,607 | |
UMB Financial Corp. | | | 28,500 | | | | 2,146,335 | |
| | | | | | | | |
| | | | | | | | 43,727,878 | |
Beverages — 1.7% | | | | | | | | |
Boston Beer Co., Inc., Class A (a)(b) | | | 53,467 | | | | 7,734,002 | |
Cott Corp. | | | 289,408 | | | | 3,577,083 | |
| | | | | | | | |
| | | | | | | | 11,311,085 | |
Biotechnology — 0.0% | | | | | | | | |
Xoma Corp. (a)(b) | | | 214 | | | | 1,522 | |
Capital Markets — 1.7% | | | | | | | | |
Financial Engines, Inc. | | | 138,100 | | | | 6,014,255 | |
Greenhill & Co., Inc. | | | 184,400 | | | | 5,402,920 | |
| | | | | | | | |
| | | | | | | | 11,417,175 | |
Chemicals — 0.9% | | | | | | | | |
HB Fuller Co. | | | 12,800 | | | | 659,968 | |
Kraton Corp. (a) | | | 114,095 | | | | 3,527,817 | |
Stepan Co. | | | 23,493 | | | | 1,851,483 | |
| | | | | | | | |
| | | | | | | | 6,039,268 | |
Commercial Services & Supplies — 2.1% | | | | | | | | |
ABM Industries, Inc. | | | 195,977 | | | | 8,544,597 | |
Advanced Disposal Services, Inc. (a)(b) | | | 225,943 | | | | 5,106,312 | |
Pitney Bowes, Inc. | | | 26,100 | | | | 342,171 | |
| | | | | | | | |
| | | | | | | | 13,993,080 | |
Communications Equipment — 3.2% | | | | | | | | |
Ciena Corp. (a) | | | 187,200 | | | | 4,419,792 | |
Finisar Corp. (a) | | | 152,200 | | | | 4,161,148 | |
NetScout Systems, Inc. (a) | | | 115,357 | | | | 4,377,798 | |
Viavi Solutions, Inc. (a) | | | 797,400 | | | | 8,548,128 | |
| | | | | | | | |
| | | | | | | | 21,506,866 | |
Construction & Engineering — 0.7% | | | | | | | | |
KBR, Inc. | | | 303,400 | | | | 4,560,102 | |
Consumer Finance — 1.0% | | | | | | | | |
EZCORP, Inc., Class A (a) | | | 85,000 | | | | 692,750 | |
Pra Group, Inc. (a)(b) | | | 185,200 | | | | 6,139,380 | |
| | | | | | | | |
| | | | | | | | 6,832,130 | |
Electric Utilities — 2.1% | | | | | | | | |
ALLETE, Inc. | | | 133,200 | | | | 9,018,972 | |
| | | | | | | | |
| Common Stocks | | Shares | | | Value | |
Electric Utilities (continued) | | | | | | | | |
El Paso Electric Co. | | | 111,900 | | | $ | 5,650,950 | |
| | | | | | | | |
| | | | | | | | 14,669,922 | |
Electrical Equipment — 0.4% | | | | | | | | |
Generac Holdings, Inc. (a)(b) | | | 71,700 | | | | 2,672,976 | |
Electronic Equipment, Instruments & Components — 2.4% | | | | | |
Anixter International, Inc. (a) | | | 85,500 | | | | 6,780,150 | |
FARO Technologies, Inc. (a) | | | 109,600 | | | | 3,918,200 | |
MTS Systems Corp. | | | 102,380 | | | | 5,636,019 | |
| | | | | | | | |
| | | | | | | | 16,334,369 | |
Energy Equipment & Services — 3.1% | | | | | | | | |
CARBO Ceramics, Inc. (a) | | | 116,468 | | | | 1,518,743 | |
Dril-Quip, Inc. (a)(b) | | | 95,200 | | | | 5,193,160 | |
Newpark Resources, Inc. (a)(b) | | | 1,094,800 | | | | 8,867,880 | |
Patterson-UTI Energy, Inc. | | | 53,600 | | | | 1,300,872 | |
Superior Energy Services, Inc. (a) | | | 289,178 | | | | 4,123,678 | |
| | | | | | | | |
| | | | | | | | 21,004,333 | |
Equity Real Estate Investment Trusts (REITs) — 5.0% | | | | | | | | |
Cedar Realty Trust, Inc. | | | 1,215,899 | | | | 6,103,813 | |
LTC Properties, Inc. | | | 193,276 | | | | 9,257,920 | |
Pebblebrook Hotel Trust (b) | | | 260,535 | | | | 7,610,227 | |
Pennsylvania Real Estate Investment Trust (b) | | | 485,519 | | | | 7,350,758 | |
Physicians Realty Trust | | | 172,002 | | | | 3,417,680 | |
| | | | | | | | |
| | | | | | | | 33,740,398 | |
Food & Staples Retailing — 1.2% | | | | | | | | |
Smart & Final Stores, Inc. (a)(b) | | | 177,300 | | | | 2,145,330 | |
SUPERVALU, Inc. (a) | | | 1,486,440 | | | | 5,737,658 | |
| | | | | | | | |
| | | | | | | | 7,882,988 | |
Food Products — 1.1% | | | | | | | | |
Nomad Holdings Ltd. (a)(b) | | | 357,400 | | | | 4,092,230 | |
Pinnacle Foods, Inc. | | | 64,102 | | | | 3,709,583 | |
| | | | | | | | |
| | | | | | | | 7,801,813 | |
Gas Utilities — 1.1% | | | | | | | | |
Northwest Natural Gas Co. | | | 64,700 | | | | 3,823,770 | |
South Jersey Industries, Inc. | | | 96,600 | | | | 3,443,790 | |
| | | | | | | | |
| | | | | | | | 7,267,560 | |
Health Care Equipment & Supplies — 4.9% | | | | | | | | |
Accuray, Inc. (a)(b) | | | 364,244 | | | | 1,730,159 | |
Halyard Health, Inc. (a) | | | 216,595 | | | | 8,250,104 | |
Invacare Corp. | | | 454,248 | | | | 5,405,551 | |
Merit Medical Systems, Inc. (a) | | | 402,503 | | | | 11,632,337 | |
OraSure Technologies, Inc. (a) | | | 485,253 | | | | 6,274,321 | |
| | | | | | | | |
| | | | | | | | 33,292,472 | |
Health Care Providers & Services — 4.3% | | | | | | | | |
Landauer, Inc. | | | 213,082 | | | | 10,387,747 | |
LifePoint Health, Inc. (a) | | | 160,807 | | | | 10,532,859 | |
Owens & Minor, Inc. | | | 247,134 | | | | 8,550,836 | |
| | | | | | | | |
| | | | | | | | 29,471,442 | |
Hotels, Restaurants & Leisure — 5.0% | | | | | | | | |
BJ’s Restaurants, Inc. (a) | | | 127,200 | | | | 5,138,880 | |
Bloomin’ Brands, Inc. | | | 285,670 | | | | 5,636,269 | |
Bob Evans Farms, Inc. | | | 183,619 | | | | 11,911,364 | |
ILG, Inc. | | | 463,181 | | | | 9,708,274 | |
Papa John’s International, Inc. | | | 19,507 | | | | 1,561,340 | |
| | | | | | | | |
| | | | | | | | 33,956,127 | |
See Notes to Financial Statements.
| | | | | | |
| | | BLACKROCK VALUE OPPORTUNITIES FUND, INC. | | MARCH 31, 2017 | | 21 |
| | | | |
| Schedule of Investments (continued) | | | Master Value Opportunities LLC | |
| | | | |
| | | | | | | | |
| Common Stocks | | Shares | | | Value | |
Household Durables — 0.4% | | | | | | | | |
Taylor Morrison Home Corp., Class A (a) | | | 121,629 | | | $ | 2,593,130 | |
Insurance — 5.0% | | | | | | | | |
American Equity Investment Life Holding Co. | | | 200,551 | | | | 4,739,020 | |
Employers Holdings, Inc. | | | 120,400 | | | | 4,569,180 | |
Heritage Insurance Holdings, Inc. | | | 280,500 | | | | 3,581,985 | |
Horace Mann Educators Corp. | | | 166,700 | | | | 6,843,035 | |
ProAssurance Corp. | | | 116,300 | | | | 7,007,075 | |
Selective Insurance Group, Inc. | | | 153,700 | | | | 7,246,955 | |
| | | | | | | | |
| | | | | | | | 33,987,250 | |
Internet & Direct Marketing Retail — 0.6% | | | | | | | | |
1-800-Flowers.com, Inc., Class A (a)(b) | | | 409,752 | | | | 4,179,470 | |
IT Services — 1.3% | | | | | | | | |
CACI International, Inc., Class A (a) | | | 77,900 | | | | 9,137,670 | |
Life Sciences Tools & Services — 0.9% | | | | | | | | |
Albany Molecular Research, Inc. (a)(b) | | | 230,852 | | | | 3,238,854 | |
Pacific Biosciences of California, Inc. (a)(b) | | | 550,723 | | | | 2,847,238 | |
| | | | | | | | |
| | | | | | | | 6,086,092 | |
Machinery — 6.2% | | | | | | | | |
Actuant Corp., Class A | | | 259,400 | | | | 6,835,190 | |
Albany International Corp., Class A | | | 102,100 | | | | 4,701,705 | |
Chart Industries, Inc. (a) | | | 127,046 | | | | 4,438,987 | |
Franklin Electric Co., Inc. | | | 125,200 | | | | 5,389,860 | |
Hillenbrand, Inc. | | | 192,300 | | | | 6,893,955 | |
Kennametal, Inc. | | | 64,200 | | | | 2,518,566 | |
Rexnord Corp. (a) | | | 197,200 | | | | 4,551,376 | |
SPX Corp. (a) | | | 266,000 | | | | 6,450,500 | |
Titan International, Inc. | | | 34,400 | | | | 355,696 | |
| | | | | | | | |
| | | | | | | | 42,135,835 | |
Marine — 0.6% | | | | | | | | |
Scorpio Bulkers, Inc. (a) | | | 472,033 | | | | 4,342,704 | |
Media — 1.4% | | | | | | | | |
Cable One, Inc. | | | 14,910 | | | | 9,310,848 | |
Metals & Mining — 2.7% | | | | | | | | |
AK Steel Holding Corp. (a) | | | 526,000 | | | | 3,781,940 | |
Century Aluminum Co. (a)(b) | | | 280,500 | | | | 3,559,545 | |
Haynes International, Inc. | | | 161,410 | | | | 6,152,949 | |
Materion Corp. | | | 141,486 | | | | 4,746,855 | |
| | | | | | | | |
| | | | | | | | 18,241,289 | |
Multiline Retail — 0.7% | | | | | | | | |
Dillard’s, Inc., Class A (b) | | | 50,400 | | | | 2,632,896 | |
Fred’s, Inc., Class A (b) | | | 179,790 | | | | 2,355,249 | |
| | | | | | | | |
| | | | | | | | 4,988,145 | |
Oil, Gas & Consumable Fuels — 1.9% | | | | | | | | |
Eclipse Resources Corp. (a) | | | 1,159,700 | | | | 2,945,638 | |
Energen Corp. (a) | | | 88,500 | | | | 4,817,940 | |
SM Energy Co. | | | 110,300 | | | | 2,649,406 | |
Whiting Petroleum Corp. (a) | | | 268,900 | | | | 2,543,794 | |
| | | | | | | | |
| | | | | | | | 12,956,778 | |
Paper & Forest Products — 2.7% | | | | | | | | |
Boise Cascade Co. (a) | | | 127,900 | | | | 3,414,930 | |
Clearwater Paper Corp. (a) | | | 94,900 | | | | 5,314,400 | |
Domtar Corp. | | | 134,900 | | | | 4,926,548 | |
PH Glatfelter Co. | | | 206,388 | | | | 4,486,875 | |
| | | | | | | | |
| | | | | | | | 18,142,753 | |
Pharmaceuticals — 1.3% | | | | | | | | |
Phibro Animal Health Corp., Class A | | | 315,384 | | | | 8,862,290 | |
Professional Services — 1.2% | | | | | | | | |
Huron Consulting Group, Inc. (a)(b) | | | 82,500 | | | | 3,473,250 | |
| | | | | | | | |
| Common Stocks | | Shares | | | Value | |
Professional Services (continued) | | | | | | | | |
TriNet Group, Inc. (a) | | | 175,400 | | | $ | 5,069,060 | |
| | | | | | | | |
| | | | | | | | 8,542,310 | |
Real Estate Management & Development — 1.0% | | | | | | | | |
Marcus & Millichap, Inc. (a) | | | 269,286 | | | | 6,619,050 | |
Road & Rail — 1.2% | | | | | | | | |
Celadon Group, Inc. | | | 365,800 | | | | 2,395,990 | |
Heartland Express, Inc. | | | 293,700 | | | | 5,888,685 | |
| | | | | | | | |
| | | | | | | | 8,284,675 | |
Semiconductors & Semiconductor Equipment — 2.9% | | | | | |
DSP Group, Inc. (a) | | | 380,186 | | | | 4,562,232 | |
Integrated Device Technology, Inc. (a) | | | 181,200 | | | | 4,289,004 | |
Microsemi Corp. (a) | | | 65,069 | | | | 3,353,006 | |
Rambus, Inc. (a) | | | 328,400 | | | | 4,315,176 | |
Veeco Instruments, Inc. (a) | | | 105,800 | | | | 3,158,130 | |
| | | | | | | | |
| | | | | | | | 19,677,548 | |
Software — 3.7% | | | | | | | | |
Bottomline Technologies, Inc. (a)(b) | | | 188,800 | | | | 4,465,120 | |
BroadSoft, Inc. (a) | | | 87,900 | | | | 3,533,580 | |
PTC, Inc. (a) | | | 79,800 | | | | 4,193,490 | |
TiVo Corp. | | | 264,928 | | | | 4,967,400 | |
Verint Systems, Inc. (a) | | | 115,300 | | | | 5,001,137 | |
Zynga, Inc., Class A (a) | | | 1,108,900 | | | | 3,160,365 | |
| | | | | | | | |
| | | | | | | | 25,321,092 | |
Specialty Retail — 4.4% | | | | | | | | |
Abercrombie & Fitch Co., Class A | | | 51,400 | | | | 613,202 | |
DSW, Inc., Class A | | | 73,582 | | | | 1,521,676 | |
Express, Inc. (a) | | | 382,500 | | | | 3,484,575 | |
Five Below, Inc. (a) | | | 123,800 | | | | 5,361,778 | |
Hibbett Sports, Inc. (a)(b) | | | 169,800 | | | | 5,009,100 | |
Monro Muffler Brake, Inc. | | | 137,359 | | | | 7,156,404 | |
Murphy USA, Inc. (a)(b) | | | 21,692 | | | | 1,592,627 | |
Party City Holdco, Inc. (a)(b) | | | 205,399 | | | | 2,885,856 | |
Penske Automotive Group, Inc. | | | 50,889 | | | | 2,382,114 | |
| | | | | | | | |
| | | | | | | | 30,007,332 | |
Technology Hardware, Storage & Peripherals — 0.8% | | | | | |
Diebold Nixdorf, Inc. | | | 170,800 | | | | 5,243,560 | |
Textiles, Apparel & Luxury Goods — 3.4% | | | | | | | | |
G-III Apparel Group Ltd. (a)(b) | | | 119,384 | | | | 2,613,316 | |
Oxford Industries, Inc. | | | 86,960 | | | | 4,979,330 | |
Skechers U.S.A., Inc., Class A (a) | | | 185,800 | | | | 5,100,210 | |
Steven Madden Ltd. (a) | | | 95,300 | | | | 3,673,815 | |
Vera Bradley, Inc. (a) | | | 80,400 | | | | 748,524 | |
Wolverine World Wide, Inc. | | | 249,870 | | | | 6,239,254 | |
| | | | | | | | |
| | | | | | | | 23,354,449 | |
Thrifts & Mortgage Finance — 0.8% | | | | | | | | |
Astoria Financial Corp. | | | 187,100 | | | | 3,837,421 | |
Northwest Bancshares, Inc. | | | 108,300 | | | | 1,823,772 | |
| | | | | | | | |
| | | | | | | | 5,661,193 | |
Tobacco — 0.1% | | | | | | | | |
Turning Point Brands, Inc. (a) | | | 33,851 | | | | 528,076 | |
Trading Companies & Distributors — 1.6% | | | | | | | | |
Applied Industrial Technologies, Inc. | | | 63,700 | | | | 3,939,845 | |
Kaman Corp. | | | 147,500 | | | | 7,099,175 | |
| | | | | | | | |
| | | | | | | | 11,039,020 | |
Total Common Stocks — 100.0% | | | | | | | 679,894,086 | |
| | | | | | | | |
| | | | | | | |
See Notes to Financial Statements.
| | | | | | |
| 22 | | BLACKROCK VALUE OPPORTUNITIES FUND, INC. | | MARCH 31, 2017 | | |
| | | | |
| Schedule of Investments (concluded) | | | Master Value Opportunities LLC | |
| | | | | | | | |
| | | | | | Value | |
Total Long-Term Investments (Cost — $578,327,495) — 100.0% | | | | | | $ | 679,894,086 | |
| | | | | | | | |
| Short-Term Securities | | Shares | | | | |
BlackRock Liquidity Funds, T-Fund, Institutional Class, 0.60% (c)(d) | | | 2,461,963 | | | | 2,461,963 | |
SL Liquidity Series, LLC, Money Market Series,
1.11% (c)(d)(e) | | | 41,390,199 | | | | 41,394,338 | |
| | | | | | | | |
| | | | | | Value | |
Total Short-Term Securities (Cost — $43,853,297) — 6.5% | | | | | | $ | 43,856,301 | |
Total Investments (Cost — $622,180,792) — 106.5% | | | | | | | 723,750,387 | |
Liabilities in Excess of Other Assets — (6.5)% | | | | | | | (44,115,121 | ) |
| | | | | | | | |
Net Assets — 100.0% | | | | | | $ | 679,635,266 | |
| | | | | | | | |
| | | | | | | | | |
|
| Notes to Schedule of Investments |
| (a) | Non-income producing security. |
| (b) | Security, or a portion of the security, is on loan. |
| (c) | Current yield as of period end. |
| (d) | During the year ended March 31, 2017, investments in issuers considered to be affiliates of the Master LLC for purposes of Section 2(a)(3) of the Investment Company Act of 1940, as amended, were as follows: |
| | | | | | | | | | | | | | | | | | | | | | | | | | | | |
| Affiliate | | Shares Held
at March 31,
2016 | | | Net
Activity | | | Shares Held
at March 31, 2017 | | | Value at
March 31,
2017 | | | Income | | | Net
Realized
Gain1 | | | Change in
Unrealized
Appreciation | |
BlackRock Liquidity Funds, TempFund, Institutional Class | | | 216,833 | | | | (216,833 | ) | | | — | | | | — | | | $ | 1,569 | | | | — | | | | — | |
BlackRock Liquidity Funds, T-Fund, Institutional Class | | | — | | | | 2,461,963 | | | | 2,461,963 | | | $ | 2,461,963 | | | | 9,671 | | | $ | 40 | | | | — | |
SL Liquidity Series, LLC, Money Market Series | | | 28,621,890 | | | | 12,768,309 | | | | 41,390,199 | | | | 41,394,338 | | | | 179,482 | 2 | | | 1,326 | | | $ | 3,004 | |
Total | | | | | | | | | | | | | | $ | 43,856,301 | | | $ | 190,722 | | | $ | 1,366 | | | $ | 3,004 | |
| | | | | | | | | | | | | | | | |
| | 1 | | Includes net capital gain distributions. |
| | 2 | | Represents securities lending income earned from the reinvestment of cash collateral from loaned securities, net of fees and collateral investment expenses, and other payments to and from borrowers of securities. |
| (e) | Security was purchased with the cash collateral from loaned securities. |
| • | | For Master LLC compliance purposes, the Master LLC’s industry classifications refer to one or more of the industry sub-classifications used by one or more widely recognized market indexes or ratings group indexes, and/or as defined by the investment adviser. These definitions may not apply for purposes of this report, which may combine such industry sub-classifications for reporting ease. |
|
| Fair Value Hierarchy as of Period End |
Various inputs are used in determining the fair value of investments. For information about the Master LLC’s policy regarding valuation of investments, refer to the Notes to Financial Statements.
The following table summarizes the Master LLC’s investments categorized in the disclosure hierarchy:
| | | | | | | | | | | | | | | | | | | | |
| | | Level 1 | | Level 2 | | Level 3 | | Total |
Assets: | | | | | | | | | | | | | | | | | | | | |
Investments: | | | | | | | | | | | | | | | | | | | | |
Long-Term Investments1: | | | | | | | | | | | | | | | | | | | | |
Common Stocks | | | $ | 679,894,086 | | | | | — | | | | | — | | | | $ | 679,894,086 | |
Short-Term Securities | | | | 2,461,963 | | | | | — | | | | | — | | | | | 2,461,963 | |
| | | | | |
Subtotal | | | $ | 682,356,049 | | | | | — | | | | | — | | | | $ | 682,356,049 | |
| | | | | |
Investments Valued at NAV2 | | | | | | | | | | | | | | | | | | | 41,394,338 | |
| | | | | | | | | | | | | | | | | | | | |
Total Investments | | | | | | | | | | | | | | | | | | $ | 723,750,387 | |
| | | | | | | | | | | | | | | | | | | | |
| | 1 | | See above Schedule of Investments for values in each industry. |
| | 2 | | As of March 31, 2017, certain investments of the Master LLC’s were valued using NAV per share as no quoted market value is available and therefore have been excluded from the fair value hierarchy. |
During the year ended March 31, 2017, there were no transfers between levels.
See Notes to Financial Statements.
| | | | | | |
| | | BLACKROCK VALUE OPPORTUNITIES FUND, INC. | | MARCH 31, 2017 | | 23 |
| | | | |
| Statement of Assets and Liabilities | | | Master Value Opportunities LLC | |
| | | | |
| March 31, 2017 | | | |
| | | | |
| Assets | | | | |
Investments at value — unaffiliated (including securities loaned at value of $40,506,809) (cost — $578,327,495) | | $ | 679,894,086 | |
Investments at value — affiliated (cost $43,853,297) | | | 43,856,301 | |
Receivables: | | | | |
Investments sold | | | 6,526,326 | |
Securities lending income — affiliated | | | 13,056 | |
Dividends — affiliated | | | 251 | |
Dividends — unaffiliated | | | 542,812 | |
Prepaid expenses | | | 2,929 | |
| | | | |
Total assets | | | 730,835,761 | |
| | | | |
| | | | |
| Liabilities | | | | |
Bank overdraft | | | 187,874 | |
Cash collateral on securities loaned at value | | | 41,390,008 | |
Payables: | | | | |
Investments purchased | | | 8,015,345 | |
Directors’ fees | | | 8,004 | |
Investment advisory fees | | | 288,961 | |
Other accrued expenses | | | 124,960 | |
Other affiliates | | | 4,006 | |
Withdrawals to investors | | | 1,181,337 | |
| | | | |
Total liabilities | | | 51,200,495 | |
| | | | |
Net Assets | | $ | 679,635,266 | |
| | | | |
| | | | |
| Net Assets Consist of | | | | |
Investor’s capital | | $ | 578,065,704 | |
Net unrealized appreciation (depreciation) | | | 101,569,562 | |
| | | | |
Net Assets | | $ | 679,635,266 | |
| | | | |
See Notes to Financial Statements.
| | | | | | |
| 24 | | BLACKROCK VALUE OPPORTUNITIES FUND, INC. | | MARCH 31, 2017 | | |
| | | | |
| Statement of Operations | | | Master Value Opportunities LLC | |
| | | | |
| Year Ended March 31, 2017 | | | |
| | | | |
| Investment Income | | | | |
Dividends — unaffiliated1 | | $ | 7,749,191 | |
Securities lending income — affiliated — net | | | 179,482 | |
Dividends — affiliated | | | 11,240 | |
Foreign taxes withheld | | | (20,658 | ) |
| | | | |
Total investment income | | | 7,919,255 | |
| | | | |
| | | | |
| Expenses | | | | |
Investment advisory | | | 3,483,378 | |
Accounting services | | | 148,830 | |
Custodian | | | 59,423 | |
Professional | | | 52,935 | |
Directors | | | 28,360 | |
Miscellaneous | | | 24,417 | |
| | | | |
Total expenses | | | 3,797,343 | |
Less fees waived by the Manager | | | (2,275 | ) |
| | | | |
Total expenses after fees waived | | | 3,795,068 | |
| | | | |
Net investment income | | | 4,124,187 | |
| | | | |
| | | | |
| Realized and Unrealized Gain (Loss) | | | | |
Net realized gain from: | | | | |
Investments — unaffiliated | | | 106,076,688 | |
Investments — affiliated | | | 1,326 | |
Capital gain distributions from investment companies — affiliated | | | 40 | |
| | | | |
| | | 106,078,054 | |
| | | | |
Net change in unrealized appreciation (depreciation) on: | | | | |
Investments — unaffiliated | | | 32,924,018 | |
Investments — affiliated | | | 3,004 | |
Foreign currency translations | | | (10 | ) |
| | | | |
| | | 32,927,012 | |
| | | | |
Total realized and unrealized gain | | | 139,005,066 | |
| | | | |
Net Increase in Net Assets Resulting from Operations | | $ | 143,129,253 | |
| | | | |
| | 1 | | Includes non-recurring dividends in the amount of $545,447. |
See Notes to Financial Statements.
| | | | | | |
| | | BLACKROCK VALUE OPPORTUNITIES FUND, INC. | | MARCH 31, 2017 | | 25 |
| | | | |
| Statements of Changes in Net Assets | | | Master Value Opportunities LLC | |
| | | | | | | | |
| | | Year Ended March 31, | |
| Increase (Decrease) in Net Assets: | | 2017 | | | 2016 | |
| | | | | | | | |
| Operations | | | | | | | | |
Net investment income | | $ | 4,124,187 | | | $ | 4,823,823 | |
Net realized gain | | | 106,078,054 | | | | 16,715,239 | |
Net change in unrealized appreciation (depreciation) | | | 32,927,012 | | | | (84,488,185 | ) |
| | | | |
Net increase (decrease) in net assets resulting from operations | | | 143,129,253 | | | | (62,949,123 | ) |
| | | | |
| | | | | | | | |
| Capital Transactions | | | | | | | | |
Proceeds from contributions | | | 110,386,634 | | | | 89,475,780 | |
Value of withdrawals | | | (262,514,012 | ) | | | (176,874,866 | ) |
| | | | |
Net decrease in net assets derived from capital transactions | | | (152,127,378 | ) | | | (87,399,086 | ) |
| | | | |
| | | | | | | | |
| Net Assets | | | | | | | | |
Total decrease in net assets | | | (8,998,125 | ) | | | (150,348,209 | ) |
Beginning of year | | | 688,633,391 | | | | 838,981,600 | |
| | | | |
End of year | | $ | 679,635,266 | | | $ | 688,633,391 | |
| | | | |
| | | | |
| Financial Highlights | | | Master Value Opportunities LLC | |
| | | | | | | | | | | | | | | | | | | | |
| | | Year Ended March 31, | |
| | | 2017 | | | 2016 | | | 2015 | | | 2014 | | | 2013 | |
| | | | | | | | | | | | | | | | | | | | |
| Total Return | | | | | | | | | | | | | | | | | | | | |
Total return | | | 23.13% | | | | (7.59 | )% | | | 5.21% | | | | 29.39% | | | | 14.01% | |
| | | | |
| | | | | | | | | | | | | | | | | | | | |
| Ratios to Average Net Assets | | | | | | | | | | | | | | | | | | | | |
Total expenses | | | 0.55% | | | | 0.55% | | | | 0.54% | | | | 0.54% | | | | 0.55% | |
| | | | |
Total expenses after fees waived | | | 0.54% | | | | 0.55% | | | | 0.54% | | | | 0.54% | | | | 0.55% | |
| | | | |
Net investment income | | | 0.59% | 1 | | | 0.65% | | | | 0.72% | | | | 0.72% | | | | 0.81% | |
| | | | |
| | | | | | | | | | | | | | | | | | | | |
| Supplemental Data | | | | | | | | | | | | | | | | | | | | |
Net assets, end of year (000) | | $ | 679,635 | | | $ | 688,633 | | | $ | 838,982 | | | $ | 1,035,066 | | | $ | 930,123 | |
| | | | |
Portfolio turnover rate | | | 68% | | | | 71% | | | | 55% | | | | 61% | | | | 51% | |
| | | | |
| | 1 | | Ratio of net investment income to average net assets includes 0.08%, resulting from a special dividend. |
See Notes to Financial Statements.
| | | | | | |
| 26 | | BLACKROCK VALUE OPPORTUNITIES FUND, INC. | | MARCH 31, 2017 | | |
| | | | |
| Notes to Financial Statements | | | Master Value Opportunities LLC | |
1. Organization:
Master Value Opportunities LLC (the “Master LLC”) is registered under the Investment Company Act of 1940, as amended (the “1940 Act”). The Master LLC is registered as a diversified, open-end management investment company. The Master LLC is organized as a Delaware limited liability company. The Limited Liability Company Agreement of the Master LLC permits the Board of Directors of the Master LLC (the “Board”) to issue non-transferable interests in the Master LLC, subject to certain limitations.
The Master LLC, together with certain other registered investment companies advised by BlackRock Advisors, LLC (the “Manager”) or its affiliates, is included in a complex of open-end funds referred to as the Equity-Bond Complex.
2. Significant Accounting Policies:
The financial statements are prepared in conformity with accounting principles generally accepted in the United States of America (“U.S. GAAP”), which may require management to make estimates and assumptions that affect the reported amounts of assets and liabilities in the financial statements, disclosure of contingent assets and liabilities at the date of the financial statements and the reported amounts of increases and decreases in net assets from operations during the reporting period. Actual results could differ from those estimates. The Master LLC is considered an investment company under U.S. GAAP and follows the accounting and reporting guidance applicable to investment companies. Below is a summary of significant accounting policies:
Foreign Currency: The Master LLC’s books and records are maintained in U.S. dollars. Purchases and sales of investments are recorded at the rates of exchange prevailing on the respective dates of such transactions. Generally, when the U.S. dollar rises in value against a foreign currency, the investments denominated in that currency will lose value; the opposite effect occurs if the U.S. dollar falls in relative value.
The Master LLC does not isolate the portion of the results of operations arising as a result of changes in the exchange rates from the changes in the market prices of investments held or sold for financial reporting purposes. Accordingly, the effects of changes in exchange rates on investments are not segregated in the Statement of Operations from the effects of changes in market prices of those investments, but are included as a component of net realized and unrealized gain (loss) from investments. The Master LLC reports realized currency gains (losses) on foreign currency related transactions as components of net realized gain (loss) for financial reporting purposes, whereas such components are generally treated as ordinary income for U.S. federal income tax purposes.
Investment Transactions and Investment Income: For financial reporting purposes, investment transactions are recorded on the dates the transactions are entered into (the trade dates). Realized gains and losses on investment transactions are determined on the identified cost basis. Dividend income is recorded on the ex-dividend date. Dividends from foreign securities where the ex-dividend date may have passed are subsequently recorded when the Master LLC is informed of the ex-dividend date. Under the applicable foreign tax laws, a withholding tax at various rates may be imposed on capital gains, dividends and interest. Upon notification from issuers, some of the dividend income received from a real estate investment trust may be redesignated as a reduction of cost of the related investment and/or realized gain.
Recent Accounting Standards: In April 2015, the Financial Accounting Standards Board issued “Disclosures for Investments in Certain Entities that Calculate Net Asset Value (“NAV”) per Share” which eliminates the requirement to categorize investments within the fair value hierarchy when fair value is based on the NAV per share and no quoted market value is available. As of March 31, 2017, certain investments of the Master LLC were valued using NAV per share as no quoted market value is available and therefore have been excluded from the fair value hierarchy.
Indemnifications: In the normal course of business, the Master LLC enters into contracts that contain a variety of representations that provide general indemnification. The Master LLC’s maximum exposure under these arrangements is unknown because it involves future potential claims against the Master LLC, which cannot be predicted with any certainty.
Other: Expenses directly related to the Master LLC are charged to the Master LLC. Other operating expenses shared by several funds, including other funds managed by the Manager, are prorated among those funds on the basis of relative net assets or other appropriate methods.
The Master LLC has an arrangement with its custodian whereby credits are earned on uninvested cash balances, which could be used to reduce custody fees and/or overdraft charges. The Master LLC may incur charges on certain uninvested cash balances and overdrafts, subject to certain conditions.
3. Investment Valuation and Fair Value Measurements:
Investment Valuation Policies: The Master LLC’s investments are valued at fair value (also referred to as “market value” within the financial statements) as of the close of trading on the New York Stock Exchange (“NYSE”) (generally 4:00 p.m., Eastern time). U.S. GAAP defines fair value as the price the Master LLC would receive to sell an asset or pay to transfer a liability in an orderly transaction between market participants at the measurement date. The Master LLC determines the fair values of its financial instruments using various independent dealers or pricing services under policies
| | | | | | |
| | | BLACKROCK VALUE OPPORTUNITIES FUND, INC. | | MARCH 31, 2017 | | 27 |
| | | | |
| Notes to Financial Statements (continued) | | | Master Value Opportunities LLC | |
approved by the Board. The BlackRock Global Valuation Methodologies Committee (the “Global Valuation Committee”) is the committee formed by management to develop global pricing policies and procedures and to oversee the pricing function for all financial instruments.
Fair Value Inputs and Methodologies: The following methods and inputs are used to establish the fair value of the Master LLC’s assets and liabilities:
| | • | | Equity investments traded on a recognized securities exchange are valued at the official closing price each day, if available. For equity investments traded on more than one exchange, the official closing price on the exchange where the stock is primarily traded is used. Equity investments traded on a recognized exchange for which there were no sales on that day may be valued at the last available bid (long positions) or ask (short positions) price. |
| | • | | Generally, trading in foreign instruments is substantially completed each day at various times prior to the close of trading on the NYSE. Occasionally, events affecting the values of such instruments may occur between the foreign market close and the close of trading on the NYSE that may not be reflected in the computation of the Master LLC’s net assets. Each business day, the Master LLC uses a pricing service to assist with the valuation of certain foreign exchange-traded equity securities and foreign exchange-traded and over-the-counter (“OTC”) options (the “Systematic Fair Value Price”). Using current market factors, the Systematic Fair Value Price is designed to value such foreign securities and foreign options at fair value as of the close of trading on the NYSE, which follows the close of the local markets. |
| | • | | Investments in open-end U.S. mutual funds are valued at NAV each business day. |
| | • | | The Master LLC values its investment in SL Liquidity Series, LLC, Money Market Series (the “Money Market Series”) at fair value, which is ordinarily based upon its pro rata ownership in the underlying fund’s net assets. The Money Market Series seeks current income consistent with maintaining liquidity and preserving capital. Although the Money Market Series is not registered under the 1940 Act, its investments may follow the parameters of investments by a money market fund that is subject to Rule 2a-7 under the 1940 Act. |
| | • | | Securities and other assets and liabilities denominated in foreign currencies are translated into U.S. dollars using exchange rates determined as of the close of trading on the NYSE. Forward foreign currency exchange contracts are valued at the mean between the bid and ask prices and are determined as of the close of trading on the NYSE. Interpolated values are derived when the settlement date of the contract is an interim date for which quotations are not available. |
If events (e.g., a company announcement, market volatility or a natural disaster) occur that are expected to materially affect the value of such investments, or in the event that the application of these methods of valuation results in a price for an investment that is deemed not to be representative of the market value of such investment, or if a price is not available, the investment will be valued by the Global Valuation Committee, or its delegate, in accordance with a policy approved by the Board as reflecting fair value (“Fair Valued Investments”). The fair valuation approaches that may be used by the Global Valuation Committee will include Market approach, Income approach and Cost approach. Valuation techniques such as discounted cash flow, use of market comparables and matrix pricing are types of valuation approaches and typically used in determining fair value. When determining the price for Fair Valued Investments, the Global Valuation Committee, or its delegate, seeks to determine the price that the Master LLC might reasonably expect to receive or pay from the current sale or purchase of that asset or liability in an arm’s-length transaction. Fair value determinations shall be based upon all available factors that the Global Valuation Committee, or its delegate, deems relevant and consistent with the principles of fair value measurement. The pricing of all Fair Valued Investments is subsequently reported to the Board or a committee thereof on a quarterly basis.
Fair Value Hierarchy: Various inputs are used in determining the fair value of investments. These inputs to valuation techniques are categorized into a fair value hierarchy consisting of three broad levels for financial statement purposes as follows:
| | • | | Level 1 — unadjusted price quotations in active markets/exchanges for identical assets or liabilities that the Master LLC has the ability to access |
| | • | | Level 2 — other observable inputs (including, but not limited to, quoted prices for similar assets or liabilities in markets that are active, quoted prices for identical or similar assets or liabilities in markets that are not active, inputs other than quoted prices that are observable for the assets or liabilities (such as interest rates, yield curves, volatilities, prepayment speeds, loss severities, credit risks and default rates) or other market-corroborated inputs) |
| | • | | Level 3 — unobservable inputs based on the best information available in the circumstances, to the extent observable inputs are not available (including the Master LLC’s own assumptions used in determining the fair value of investments) |
The hierarchy gives the highest priority to unadjusted quoted prices in active markets for identical assets or liabilities (Level 1 measurements) and the lowest priority to unobservable inputs (Level 3 measurements). Accordingly, the degree of judgment exercised in determining fair value is greatest for instruments categorized in Level 3. The inputs used to measure fair value may fall into different levels of the fair value hierarchy. In such cases, for disclosure purposes, the fair value hierarchy classification is determined based on the lowest level input that is significant to the fair value measurement in its entirety. Investments classified within Level 3 have significant unobservable inputs used by the Global Valuation Committee in determining
| | | | | | |
| 28 | | BLACKROCK VALUE OPPORTUNITIES FUND, INC. | | MARCH 31, 2017 | | |
| | | | |
| Notes to Financial Statements (continued) | | | Master Value Opportunities LLC | |
the price for Fair Valued Investments. Level 3 investments include equity or debt issued by privately held companies or funds. There may not be a secondary market, and/or there are a limited number of investors. Level 3 investments may also be adjusted to reflect illiquidity and/or non-transferability, with the amount of such discount estimated by the Global Valuation Committee in the absence of market information.
Changes in valuation techniques may result in transfers into or out of an assigned level within the hierarchy. In accordance with the Master LLC’s policy, transfers between different levels of the fair value hierarchy are deemed to have occurred as of the beginning of the reporting period. The categorization of a value determined for investments is based on the pricing transparency of the investments and is not necessarily an indication of the risks associated with investing in those securities.
4. Securities and Other Investments:
Warrants: Warrants entitle the Master LLC to purchase a specified number of shares of common stock and are non-income producing. The purchase price and number of shares are subject to adjustment under certain conditions until the expiration date of the warrants, if any. If the price of the underlying stock does not rise above the strike price before the warrant expires, the warrant generally expires without any value and the Master LLC will lose any amount it paid for the warrant. Thus, investments in warrants may involve more risk than investments in common stock. Warrants may trade in the same markets as their underlying stock; however, the price of the warrant does not necessarily move with the price of the underlying stock.
Securities Lending: The Master LLC may lend its securities to approved borrowers, such as brokers, dealers and other financial institutions. The borrower pledges and maintains with the Master LLC collateral consisting of cash, an irrevocable letter of credit issued by a bank, or securities issued or guaranteed by the U.S. Government. The initial collateral received by the Master LLC is required to have a value of at least 102% of the current value of the loaned securities for securities traded on U.S. exchanges and a value of at least 105% for all other securities. The collateral is maintained thereafter at a value equal to at least 100% of the current market value of the securities on loan. The market value of the loaned securities is determined at the close of each business day of the Master LLC and any additional required collateral is delivered to the Master LLC, or excess collateral returned by the Master LLC, on the next business day. During the term of the loan, the Master LLC is entitled to all distributions made on or in respect of the loaned securities but does not receive interest income on securities received as collateral. Loans of securities are terminable at any time and the borrower, after notice, is required to return borrowed securities within the standard time period for settlement of securities transactions.
The market value of any securities on loan, all of which were classified as common stocks in the Master LLC’s Schedule of Investments, and the value of any related collateral are shown separately in the Statement of Assets and Liabilities as a component of investments at value-unaffiliated, and collateral on securities loaned at value, respectively. As of period end, any securities on loan were collateralized by cash and/or U.S. Government obligations. Cash collateral invested by the securities lending agent, BlackRock Investment Management, LLC (“BIM”), if any, is disclosed in the Schedule of Investments.
Securities lending transactions are entered into by the Master LLC under Master Securities Lending Agreements (each, an “MSLA”), which provide the right, in the event of default (including bankruptcy or insolvency), for the non-defaulting party to liquidate the collateral and calculate a net exposure to the defaulting party or request additional collateral. In the event that a borrower defaults, the Master LLC, as lender, would offset the market value of the collateral received against the market value of the securities loaned. When the value of the collateral is greater than that of the market value of the securities loaned, the lender is left with a net amount payable to the defaulting party. However, bankruptcy or insolvency laws of a particular jurisdiction may impose restrictions on or prohibitions against such a right of offset in the event of an MSLA counterparty’s bankruptcy or insolvency. Under the MSLA, absent an event of default, the borrower can resell or re-pledge the loaned securities, and the Master LLC can reinvest cash collateral received in connection with loaned securities. Upon an event of default, the parties’ obligations to return the securities or collateral to the other party are extinguished, and the parties can resell or re-pledge the loaned securities or the collateral received in connection with the loaned securities in order to satisfy the defaulting party’s net payment obligation for all transactions under the MSLA. The defaulting party remains liable for any deficiency.
| | | | | | |
| | | BLACKROCK VALUE OPPORTUNITIES FUND, INC. | | MARCH 31, 2017 | | 29 |
| | | | |
| Notes to Financial Statements (continued) | | | Master Value Opportunities LLC | |
As of period end, the following table is a summary of the Master LLC’s securities lending agreements by counterparty which are subject to offset under an MSLA:
| | | | | | | | | | |
| Counterparty | | Securities Loaned
at Value | | | Cash Collateral
Received1 | | | Net Amount |
Citigroup Global Markets, Inc. | | | $ 7,370,874 | | | | $ (7,370,874 | ) | | — |
Credit Suisse Securities (USA) LLC | | | 886,422 | | | | (886,422 | ) | | — |
Deutsche Bank Securities, Inc. | | | 10,530,460 | | | | (10,530,460 | ) | | — |
Goldman Sachs & Co. | | | 4,943,443 | | | | (4,943,443 | ) | | — |
JP Morgan Securities LLC | | | 15,639,427 | | | | (15,639,427 | ) | | — |
Merrill Lynch, Pierce, Fenner & Smith, Inc. | | | 344,903 | | | | (344,903 | ) | | — |
Morgan Stanley | | | 318,600 | | | | (318,600 | ) | | — |
SG Americas Securities LLC | | | 419,580 | | | | (419,580 | ) | | — |
UBS Securities LLC | | | 53,100 | | | | (53,100 | ) | | — |
| | | |
Total | | | $40,506,809 | | | | $(40,506,809 | ) | | — |
| | | |
| | 1 | | Cash collateral with a value of $41,390,008 has been received in connection with securities lending agreements. Collateral received in excess of the value of securities loaned from the individual counterparty is not shown for financial reporting purposes in the above table. |
The risks of securities lending include the risk that the borrower may not provide additional collateral when required or may not return the securities when due. To mitigate these risks, the Master LLC benefits from a borrower default indemnity provided by BIM. BIM’s indemnity allows for full replacement of the securities loaned if the collateral received does not cover the value on the securities loaned in the event of borrower default. The Master LLC could incur a loss if the value of an investment purchased with cash collateral falls below the market value of loaned securities or if the value of an investment purchased with cash collateral falls below the value of the original cash collateral received.
5. Investment Advisory Agreement and Other Transactions with Affiliates:
The PNC Financial Services Group, Inc. is the largest stockholder and an affiliate of BlackRock, Inc. (“BlackRock”) for 1940 Act purposes.
Investment Advisory: The Master LLC entered into an Investment Advisory Agreement with the Manager, the Master LLC’s investment adviser, an indirect, wholly-owned subsidiary of BlackRock, to provide investment advisory and administration services. The Manager is responsible for the management of the Master LLC’s portfolio and provides the personnel, facilities, equipment and certain other services necessary to the operations of the Master LLC.
For such services, the Master LLC pays the Manager a monthly fee at an annual rate equal to the following percentages of the average daily value of the Master LLC’s net assets:
| | |
| Average Daily Net Assets | | Investment Advisory Fee |
First $1 Billion | | 0.500% |
$1 Billion - $1.5 Billion | | 0.475% |
Greater than $1.5 Billion | | 0.450% |
Expense Waivers and Reimbursements: With respect to the Master LLC, the Manager voluntarily agreed to waive its investment advisory fees by the amount of investment advisory fees the Master LLC pays to the Manager indirectly through its investment in affiliated money market funds (the “affiliated money market fund waiver”). This amount is included in fees waived by the Manager in the Statement of Operations. However, the Manager does not waive its investment advisory fees by the amount of investment advisory fees paid in connection with the Master LLC’s investments in other affiliated investment companies, if any. For the year ended March 31, 2017, the amount waived was $2,275.
Effective September 1, 2016, the Manager voluntarily agreed to waive its investment advisory fee with respect to any portion of the Master LLC’s assets invested in affiliated equity and fixed-income mutual funds and affiliated exchange-traded funds that have a contractual management fee. Prior to September 1, 2016, the Manager did not waive such fees. This voluntary waiver may be reduced or discontinued at any time without notice.
For the year ended March 31, 2017, the Master LLC reimbursed the Manager $7,775 for certain accounting services, which is included in accounting services in the Statement of Operations.
Securities Lending: The U.S. Securities and Exchange Commission has issued an exemptive order which permits BIM, an affiliate of the Manager, to serve as securities lending agent for the Master LLC, subject to applicable conditions. As securities lending agent, BIM bears all operational costs directly related to securities lending. The Master LLC is responsible for expenses in connection with the investment of cash collateral received for securities on loan (the “collateral investment expenses”). The cash collateral is invested in a private investment company managed by the Manager or its affiliates. However, BIM has agreed to cap the collateral investment expenses of the private investment company to an annual rate of 0.04%. The investment adviser to the private investment company will not charge any advisory fees with respect to shares purchased by the Master LLC. If the private investment company’s weekly liquid assets fall below 30% of its total assets, BIM, as managing member of the private investment company, is
| | | | | | |
| 30 | | BLACKROCK VALUE OPPORTUNITIES FUND, INC. | | MARCH 31, 2017 | | |
| | | | |
| Notes to Financial Statements (continued) | | | Master Value Opportunities LLC | |
permitted at any time, if it determines it to be in the best interests of the private investment company, to impose a liquidity fee of up to 2% of the value of units withdrawn or impose a redemption gate that temporarily suspends the right of withdrawal out of the private investment company. In addition, if the private investment company’s weekly liquid assets fall below 10% of its total assets at the end of any business day, the private investment company will impose a liquidity fee in the default amount of 1% of the amount withdrawn, generally effective as of the next business day, unless BIM determines that a higher (not to exceed 2%) or lower fee level or not imposing a liquidity fee is in the best interests of the private investment company. The shares of the private investment company purchased by the Master LLC would be subject to any such liquidity fee or redemption gate imposed.
Securities lending income is equal to the total of income earned from the reinvestment of cash collateral, net of fees and other payments to and from borrowers of securities, and less the collateral investment expenses. The Master LLC retains a portion of securities lending income and remits a remaining portion to BIM as compensation for its services as securities lending agent.
Pursuant to a securities lending agreement, the Master LLC retains 71.5% of securities lending income, and this amount retained can never be less than 65% of the total of securities lending income plus the collateral investment expenses.
In addition, commencing the business day following the date that the aggregate securities lending income earned across the Equity-Bond Complex in a calendar year exceeds a specified threshold, the Master LLC, pursuant to the securities lending agreement, will retain for the remainder of that calendar year securities lending income as follows: 75% of securities lending income, and this amount retained can never be less than 65% of the total of securities lending income plus the collateral investment expenses.
The share of securities lending income earned by the Master LLC is shown as securities lending income — affiliated — net in the Statement of Operations. For the year ended March 31, 2017, the Master LLC paid BIM $65,933 for securities lending agent services.
Officers and Directors: Certain officers and/or directors of the Master LLC are officers and/or directors of BlackRock or its affiliates.
Other Transactions: The Master LLC may purchase securities from, or sell securities to, an affiliated fund provided the affiliation is due solely to having a common investment adviser, common officers, or common directors. For the year ended March 31, 2017, the purchase and sale transactions and any net realized gains (losses) with affiliated funds in compliance with Rule 17a-7 under the 1940 Act were as follows:
| | | | |
| Purchases | | Sales | | Net Realized Gain |
$2,764,702 | | $736,770 | | $6,667 |
6. Purchases and Sales:
For the year ended March 31, 2017, purchases and sales of investments, excluding short-term securities, were $468,978,574 and $614,048,623, respectively.
7. Income Tax Information:
The Master LLC is disregarded as an entity separate from its owner for tax purposes. As such, the owner of the Master LLC is treated as the owner of the net assets, income, expenses and realized and unrealized gains and losses of the Master LLC. Therefore, no U.S. federal income tax provision is required. It is intended that the Master LLC’s assets will be managed so the owner of the Master LLC can satisfy the requirements of Subchapter M of the Internal Revenue Code of 1986, as amended.
Prior to July 3, 2014, the Master LLC was classified as a partnership for federal income tax purposes. As such, each investor in the Master LLC was treated as the owner of its proportionate share of net assets, income, expenses and realized and unrealized gains and losses of the Master LLC.
The Master LLC files U.S. federal and various state and local tax returns. No income tax returns are currently under examination. The statute of limitations on the Master LLC’s U.S. federal tax returns remains open for the year ended March 31, 2014 and the period ended July 3, 2014. The statutes of limitations on the Master LLC’s state and local tax returns may remain open for an additional year depending upon the jurisdiction.
Management has analyzed tax laws and regulations and their application to the Master LLC as of March 31, 2017, inclusive of the open tax return years, and does not believe that there are any uncertain tax positions that require recognition of a tax liability in the Master LLC’s financial statements.
As of March 31, 2017, gross unrealized appreciation and depreciation based on cost for U.S. federal income tax purposes were as follows:
| | | | |
Tax cost | | $ | 626,984,001 | |
| | | | |
Gross unrealized appreciation | | $ | 122,611,260 | |
Gross unrealized depreciation | | | (25,844,874 | ) |
| | | | |
Net unrealized appreciation | | $ | 96,766,386 | |
| | | | |
| | | | | | |
| | | BLACKROCK VALUE OPPORTUNITIES FUND, INC. | | MARCH 31, 2017 | | 31 |
| | |
| Notes to Financial Statements (concluded) | | Master Value Opportunities LLC |
8. Bank Borrowings:
The Master LLC, along with certain other funds managed by the Manager and its affiliates (“Participating Funds”), is a party to a 364-day, $2.1 billion credit agreement with a group of lenders. Under this agreement, the Master LLC may borrow to fund shareholder redemptions. Excluding commitments designated for certain individual funds, the Participating Funds, including the Master LLC, can borrow up to an aggregate commitment amount of $1.6 billion at any time outstanding, subject to asset coverage and other limitations as specified in the agreement. The credit agreement has the following terms: a fee of 0.12% per annum on unused commitment amounts and interest at a rate equal to the higher of (a) one-month LIBOR (but, in any event, not less than 0.00%) on the date the loan is made plus 0.80% per annum or (b) the Fed Funds rate (but, in any event, not less than 0.00%) in effect from time to time plus 0.80% per annum on amounts borrowed. The agreement expires in April 2017 unless extended or renewed. Prior to April 21, 2016, the credit agreement had a fee per annum of 0.06% on unused commitment amounts and interest at a rate equal to the higher of (a) one month LIBOR (but, in any event, not less than 0.00%) on the date the loan is made plus 0.80% per annum or (b) the Fed Funds rate (but, in any event, not less than 0.00%) in effect from time to time plus 0.80% per annum on amounts borrowed. Participating Funds paid administration, legal and arrangement fees, which, if applicable, are included in miscellaneous expenses in the Statement of Operations. These fees were allocated among such funds based upon portions of the aggregate commitment available to them and relative net assets of Participating Funds. During the year ended March 31, 2017, the Master LLC did not borrow under the credit agreement.
9. Principal Risks:
In the normal course of business, the Master LLC invests in securities and enters into transactions where risks exist due to fluctuations in the market (market risk) or failure of the issuer to meet all its obligations, including the ability to pay principal and interest when due (issuer credit risk). The value of securities held by the Master LLC may decline in response to certain events, including those directly involving the issuers of securities owned by the Master LLC. Changes arising from the general economy, the overall market and local, regional or global political and/or social instability, as well as currency, interest rate and price fluctuations, may also affect the securities’ value.
On October 11, 2016, BlackRock implemented certain changes required by amendments to Rule 2a-7 under the 1940 Act, which governs the operations of U.S. money market funds. The Master LLC may be exposed to additional risks when reinvesting cash collateral in money market funds that do not seek to maintain a stable NAV per share of $1.00 and which may be subject to redemption gates or liquidity fees under certain circumstances.
Valuation Risk: The market values of equities, such as common stocks and preferred securities or equity related investments, such as futures and options, may decline due to general market conditions which are not specifically related to a particular company. They may also decline due to factors which affect a particular industry or industries. The Master LLC may invest in illiquid investments and may experience difficulty in selling those investments in a timely manner at the price that they believe the investments are worth. Prices may fluctuate widely over short or extended periods in response to company, market or economic news. Markets also tend to move in cycles, with periods of rising and falling prices. This volatility may cause the Master LLC’s NAV to experience significant increases or decreases over short periods of time. If there is a general decline in the securities and other markets, the NAV of the Master LLC may lose value, regardless of the individual results of the securities and other instruments in which the Master LLC invests.
Counterparty Credit Risk: Similar to issuer credit risk, the Master LLC may be exposed to counterparty credit risk, or the risk that an entity with which the Master LLC has unsettled or open transactions may fail to or be unable to perform on its commitments. The Master LLC manages counterparty credit risk by entering into transactions only with counterparties that the Manager believes have the financial resources to honor their obligations and by monitoring the financial stability of those counterparties. Financial assets, which potentially expose the Master LLC to market, issuer and counterparty credit risks, consist principally of financial instruments and receivables due from counterparties. The extent of the Master LLC’s exposure to market, issuer and counterparty credit risks with respect to these financial assets is generally approximated by their value recorded in the Statement of Assets and Liabilities, less any collateral held by the Master LLC.
10. Subsequent Events:
Management’s evaluation of the impact of all subsequent events on the Master LLC’s financial statements was completed through the date the financial statements were issued and the following item was noted:
Effective April 20, 2017, the credit agreement was extended until April 2018 under the same terms.
| | | | | | |
| 32 | | BLACKROCK VALUE OPPORTUNITIES FUND, INC. | | MARCH 31, 2017 | | |
| | |
| Report of Independent Registered Public Accounting Firm | | Master Value Opportunities LLC |
To the Board of Directors and Investor of Master Value Opportunities LLC:
We have audited the accompanying statement of assets and liabilities of Master Value Opportunities LLC (the “Master LLC”), including the schedule of investments, as of March 31, 2017, and the related statement of operations for the year then ended, the statements of changes in net assets for each of the two years in the period then ended and the financial highlights for each of the five years in the period then ended. These financial statements and financial highlights are the responsibility of the Master LLC’s management. Our responsibility is to express an opinion on these financial statements and financial highlights based on our audits.
We conducted our audits in accordance with the standards of the Public Company Accounting Oversight Board (United States). Those standards require that we plan and perform the audit to obtain reasonable assurance about whether the financial statements and financial highlights are free of material misstatement. The Master LLC is not required to have, nor were we engaged to perform, an audit of its internal control over financial reporting. Our audits included consideration of internal control over financial reporting as a basis for designing audit procedures that are appropriate in the circumstances, but not for the purpose of expressing an opinion on the effectiveness of the Fund’s internal control over financial reporting. Accordingly, we express no such opinion. An audit also includes examining, on a test basis, evidence supporting the amounts and disclosures in the financial statements, assessing the accounting principles used and significant estimates made by management, as well as evaluating the overall financial statement presentation. Our procedures included confirmation of securities owned as of March 31, 2017, by correspondence with the custodian and brokers; where replies were not received from brokers, we performed other auditing procedures. We believe that our audits provide a reasonable basis for our opinion.
In our opinion, such financial statements and financial highlights referred to above present fairly, in all material respects, the financial position of Master Value Opportunities LLC as of March 31, 2017, the results of its operations for the year then ended, the changes in its net assets for each of the two years in the period then ended and the financial highlights for each of the five years in the period then ended, in conformity with accounting principles generally accepted in the United States of America.
Deloitte & Touche LLP
Philadelphia, Pennsylvania
May 25, 2017
| | | | | | |
| | | BLACKROCK VALUE OPPORTUNITIES FUND, INC. | | MARCH 31, 2017 | | 33 |
| | | | | | | | | | |
Name, Address1 and Year of Birth | | Position(s)
Held with
Fund/
Master LLC | | Length of Time
Served3 | | Principal Occupation(s) During Past 5 Years | | Number of BlackRock-
Advised Registered
Investment Companies
(“RICs”) Consisting of
Investment Portfolios
(“Portfolios”) Overseen | | Public Company and
Other Investment
Company Directorships
Held During Past
Five Years |
| Independent Directors2 | | | | | | | | |
Robert M. Hernandez 1944 | | Chair of the Board and Director | | Since
2007 | | Director, Vice Chairman and Chief Financial Officer of USX Corporation (energy and steel business) from 1991 to 2001; Director, RTI International Metals, Inc. from 1990 to 2015; Director, TE Connectivity (electronics) from 2006 to 2012. | | 28 RICs consisting of
98 Portfolios | | Chubb Limited (insurance company); Eastman Chemical Company |
James H. Bodurtha 1944 | | Director | | Since
2007 | | Director, The China Business Group, Inc. (consulting and investing firm) from 1996 to 2013 and Executive Vice President thereof from 1996 to 2003; Chairman of the Board, Berkshire Holding Corporation since 1980; Director, ICI Mutual since 2010. | | 28 RICs consisting of
98 Portfolios | | None |
Bruce R. Bond 1946 | | Director | | Since
2007 | | Trustee and Member of the Governance Committee, State Street Research Mutual Funds from 1997 to 2005; Board Member of Governance, Audit and Finance Committee, Avaya Inc. (computer equipment) from 2003 to 2007. | | 28 RICs consisting of
98 Portfolios | | None |
Donald W. Burton 1944 | | Director | | Since
2007 | | Managing General Partner, The Burton Partnership, LP (an investment partnership) from 1979 to 2017; Managing General Partner, The Burton Partnership (QP), LP (an investment partnership) since 2000; Managing General Partner, The South Atlantic Venture Funds from 1983 to 2012; Director, IDology, Inc. (technology solutions) since 2006; Director, Knology, Inc. (telecommunications) from 1996 to 2012; Director, Capital Southwest (financial) from 2006 to 2012; Director, Burtons Grill (restaurant) since 2013; Director, PDQ South Texas (restaurant) since 2013; Director, ITC/Talon (data) since 2015. | | 28 RICs consisting of
98 Portfolios | | None |
| Honorable Stuart E. Eizenstat 1943 | | Director | | Since
2007 | | Partner and Head of International Practice, Covington and Burling LLP (law firm) since 2001; International Advisory Board Member, The Coca-Cola Company from 2002 to 2011; Advisory Board Member, Veracity Worldwide, LLC (risk management) from 2007 to 2012; Member of the International Advisory Board GML Ltd. (energy) since 2003; Advisory Board Member, BT Americas (telecommunications) from 2004 to 2009. | | 28 RICs consisting of
98 Portfolios | | Alcatel-Lucent (telecom- munications); Global Specialty Metallurgical; UPS Corporation (delivery service); Ferroglobe (metals) |
Henry Gabbay 1947 | | Director | | Since
2007 | | Consultant, BlackRock, Inc. from 2007 to 2008; Managing Director, BlackRock, Inc. from 1989 to 2007; Chief Administrative Officer, BlackRock Advisors, LLC from 1998 to 2007; President of BlackRock Funds and BlackRock Allocation Target Shares (formerly, BlackRock Bond Allocation Target Shares) from 2005 to 2007 and Treasurer of certain closed-end funds in the BlackRock fund complex from 1989 to 2006. | | 28 RICs consisting of
98 Portfolios | | None |
Lena G. Goldberg 1949 | | Director | | Since
2016 | | Senior Lecturer, Harvard Business School since 2008; Executive Vice President, FMR LLC/Fidelity Investments (financial services) from 2007 to 2008, Executive Vice President and General Counsel thereof from 2002 to 2007, Senior Vice President and General Counsel thereof from 1999 to 2002, Vice President and General Counsel thereof from 1997 to 1999, Senior Vice President and Deputy General Counsel thereof in 1997, and Vice President and Corporate Counsel thereof from 1996 to 1997; Partner, Sullivan & Worcester LLP from 1985 to 1996 and Associate thereof from 1979 to 1985. | | 28 RICs consisting of
98 Portfolios | | None |
Henry R. Keizer 1956 | | Director | | Since
2016 | | Director, Park Indemnity Ltd. (captive insurer) since 2010; Director, MUFG Americas Holdings Corporation and MUFG Union Bank, N.A. (financial and bank holding company) from 2014 to 2016; Director, Montpelier Re Holdings, Ltd. (publicly held property and casual reinsurance) from 2013 to 2015; Director, American Institute of Certified Public Accountants from 2009 to 2011; Director, KPMG LLP (audit, tax and advisory services) in 2004 to 2005 and 2010 to 2012; Director, KPMG International in 2012, Deputy Chairman and Chief Operating Officer thereof from 2010 to 2012 and U.S. Vice Chairman of Audit thereof from 2005 to 2010; Global Head of Audit, KPMGI (consortium of KPMG firms) from 2006 to 2010; Director, YMCA of Greater New York from 2006 to 2010. | | 28 RICs consisting of
98 Portfolios | | Hertz Global Holdings (car rental); WABCO (commercial vehicle safety systems) |
| | | | | | |
| 34 | | BLACKROCK VALUE OPPORTUNITIES FUND, INC. | | MARCH 31, 2017 | | |
| | | | |
| Officers and Directors (continued) | | | | |
| | | | | | | | | | |
Name, Address1 and Year of Birth | | Position(s) Held with
Fund/ Master LLC | | Length of Time Served3 | | Principal Occupation(s) During Past 5 Years | | Number of BlackRock-
Advised Registered
Investment Companies
(“RICs”) Consisting of
Investment Portfolios
(“Portfolios”) Overseen | | Public Company and
Other Investment
Company Directorships
Held During Past
Five Years |
| Independent Directors2 (concluded) | | | | | | | | |
John F. O’Brien 1943 | | Director | | Since
2007 | | Trustee, Woods Hole Oceanographic Institute since 2003 and Chairman thereof from 2009 to 2015; Co-Founder and Managing Director, Board Leaders LLC (director education) since 2005. | | 28 RICs consisting of
98 Portfolios | | Cabot Corporation (chemicals); LKQ Corporation (auto parts manufacturing); TJX Companies, Inc. (retailer) |
Donald C. Opatrny 1952 | | Director | | Since
2015 | | Trustee, Member of the Executive Committee and Chair of the Investment Committee, Cornell University since 2004; Member of the Board and Investment Committee, University School since 2007; Member of the Investment Committee, Mellon Foundation from 2009 to 2015; President and Trustee, the Center for the Arts, Jackson Hole since 2011; Director, Athena Capital Advisors LLC (investment management firm) since 2013; Trustee and Chair of the Investment Committee, Community Foundation of Jackson Hole since 2014; Trustee, Artstor (a Mellon Foundation affiliate) from 2010 to 2015; President, Trustee and Member of the Investment Committee, The Aldrich Contemporary Art Museum from 2007 to 2014. | | 28 RICs consisting of
98 Portfolios | | None |
Roberta Cooper Ramo 1942 | | Director | | Since
2007 | | Shareholder and Attorney, Modrall, Sperling, Roehl, Harris & Sisk, P.A. (law firm) since 1993; Director, ECMC Group (service provider to students, schools and lenders) since 2001; President, The American Law Institute (non-profit) since 2008; Vice President, Santa Fe Opera (non-profit) since 2011; Chair, Think New Mexico (non-profit) since 2013; Chairman of the Board, Cooper’s Inc. (retail) from 1999 to 2011. | | 28 RICs consisting of
98 Portfolios | | None |
| Interested Directors4 | | | | | | | | |
Robert Fairbairn 1965 | | Director | | Since
2015 | | Senior Managing Director of BlackRock, Inc. since 2010; Global Head of BlackRock’s Retail and iShares® businesses since 2012; Member of BlackRock’s Global Executive and Global Operating Committees; Head of BlackRock’s Global Client Group from 2009 to 2012; Chairman of BlackRock’s international businesses from 2007 to 2010. | | 28 RICs consisting of
98 Portfolios | | None |
John M. Perlowski 1964 | | Director, President and Chief Executive Officer | | Since 2015 (Director); Since 2010 (President and Chief Executive Officer) | | Managing Director of BlackRock, Inc. since 2009; Head of BlackRock Global Fund & Accounting Services since 2009; Managing Director and Chief Operating Officer of the Global Product Group at Goldman Sachs Asset Management, L.P. from 2003 to 2009; Treasurer of Goldman Sachs Mutual Funds from 2003 to 2009 and Senior Vice President thereof from 2007 to 2009; Director of Goldman Sachs Offshore Funds from 2002 to 2009; Advisory Director of Family Resource Network (charitable foundation) since 2009. | | 129 RICs consisting of
318 Portfolios | | None |
| | 1 The address of each Director is c/o BlackRock, Inc., 55 East 52nd Street, New York, NY 10055. 2 Each Independent Director holds office until his or her successor is duly elected and qualifies or until his or her earlier death, resignation, retirement or removal as provided by the Fund’s/Master LLC’s by-laws or charter or statute, or until December 31 of the year in which he or she turns 75. The Board may determine to extend the terms of Independent Directors on a case-by-case basis, as appropriate. Interested Directors serve until their successor is duly elected and qualifies or until their earlier death, resignation, retirement or removal as provided by the Fund’s/Master LLC’s by-laws or statute, or until December 31 of the year in which they turn 72. 3 Following the combination of Merrill Lynch Investment Managers, L.P. (“MLIM”) and BlackRock, Inc. in September 2006, the various legacy MLIM and legacy BlackRock fund boards were realigned and consolidated into three new fund boards in 2007. As a result, although the chart shows certain Independent Directors as joining the Fund’s/Master LLC’s board in 2007, those Directors first became members of the boards of other legacy MLIM or legacy BlackRock funds as follows: James H. Bodurtha, 1995; Bruce R. Bond, 2005; Donald W. Burton, 2002; Honorable Stuart E. Eizenstat, 2001; Robert M. Hernandez, 1996; John F. O’Brien, 2005; and Roberta Cooper Ramo, 1999. 4 Messrs. Fairbairn and Perlowski are both “interested persons,” as defined in the 1940 Act, of the Fund/Master LLC based on their positions with BlackRock, Inc. and its affiliates. Mr. Perlowski is also a board member of the BlackRock Closed-End Complex and the BlackRock Equity-Liquidity Complex. |
| | | | | | |
| | | BLACKROCK VALUE OPPORTUNITIES FUND, INC. | | MARCH 31, 2017 | | 35 |
| | | | |
| Officers and Directors (concluded) | | | | |
| | | | | | |
Name, Address1 and Year of Birth | | Position(s) Held with Fund/ Master LLC | | Length of Time Served as an Officer | | Principal Occupation(s) During Past 5 Years |
Officers2 | | | | | | |
Jennifer McGovern 1977 | | Vice President | | Since 2014 | | Managing Director of BlackRock, Inc. since 2016; Director of BlackRock, Inc. from 2011 to 2015; Head of Product Structure and Oversight for BlackRock’s U.S. Wealth Advisory Group since 2013; Vice President of BlackRock, Inc. from 2008 to 2010. |
Neal J. Andrews 1966 | | Chief Financial Officer | | Since 2007 | | Managing Director of BlackRock, Inc. since 2006; Senior Vice President and Line of Business Head of Fund Accounting and Administration at PNC Global Investment Servicing (U.S.) Inc. from 1992 to 2006. |
Jay M. Fife 1970 | | Treasurer | | Since 2007 | | Managing Director of BlackRock, Inc. since 2007; Director of BlackRock, Inc. in 2006; Assistant Treasurer of the MLIM and Fund Asset Management, L.P. advised funds from 2005 to 2006; Director of MLIM Fund Services Group from 2001 to 2006. |
Charles Park 1967 | | Chief Compliance Officer | | Since 2014 | | Anti-Money Laundering Compliance Officer for the BlackRock-advised Funds in the Equity-Bond Complex, the Equity-Liquidity Complex and the Closed-End Complex from 2014 to 2015; Chief Compliance Officer of BlackRock Advisors, LLC and the BlackRock-advised Funds in the Equity-Bond Complex, the Equity-Liquidity Complex and the Closed-End Complex since 2014; Principal of and Chief Compliance Officer for iShares® Delaware Trust Sponsor LLC since 2012 and BlackRock Fund Advisors (“BFA”) since 2006; Chief Compliance Officer for the BFA-advised iShares® exchange traded funds since 2006; Chief Compliance Officer for BlackRock Asset Management International Inc. since 2012. |
Fernanda Piedra 1969 | | Anti-Money Laundering Compliance Officer | | Since 2015 | | Director of BlackRock, Inc. since 2014; Anti-Money Laundering Compliance Officer and Regional Head of Financial Crime for the Americas at BlackRock, Inc. since 2014; Head of Regulatory Changes and Remediation for the Asset Wealth Management Division of Deutsche Bank from 2010 to 2014; Vice President of Goldman Sachs (Anti-Money Laundering/Suspicious Activities Group) from 2004 to 2010. |
Benjamin Archibald 1975 | | Secretary | | Since
2012 | | Managing Director of BlackRock, Inc. since 2014; Director of BlackRock, Inc. from 2010 to 2013; Secretary of the iShares® exchange traded funds since 2015; Secretary of the BlackRock-advised mutual funds since 2012. |
| | 1 The address of each Officer is c/o BlackRock, Inc., Park Avenue Plaza, 55 East 52nd Street, New York, NY 10055. 2 Officers of the Fund/Master LLC serve at the pleasure of the Board. |
| | Further information about the Fund’s/Master LLC’s Officers and Directors is available in the Fund’s/Master LLC’s Statement of Additional Information, which can be obtained without charge by calling (800) 441-7762. |
Effective January 31, 2017, David H. Walsh and Fred G. Weiss retired as Directors of the Fund/Master LLC.
| | | | | | |
| | | | |
Investment Adviser and Administrator BlackRock Advisors, LLC Wilmington, DE 19809 | | Custodian The Bank of New York Mellon New York, NY 10286 | | Accounting Agent and Transfer Agent BNY Mellon Investment Servicing (US) Inc. Wilmington, DE 19809 | | Address of the Fund 100 Bellevue Parkway Wilmington, DE 19809 |
| | | | | | |
Distributor BlackRock Investments, LLC New York, NY 10022 | | Independent Registered Public Accounting Firm Deloitte & Touche LLP Philadelphia, PA 19103 | | Legal Counsel Willkie Farr & Gallagher LLP New York, NY 10019 | | |
| | | | | | |
| 36 | | BLACKROCK VALUE OPPORTUNITIES FUND, INC. | | MARCH 31, 2017 | | |
Householding
The Fund will mail only one copy of shareholder documents, including prospectuses, annual and semi-annual reports and proxy statements, to shareholders with multiple accounts at the same address. This practice is commonly called “householding” and is intended to reduce expenses and eliminate duplicate mailings of shareholder documents. Mailings of your shareholder documents may be householded indefinitely unless you instruct us otherwise. If you do not want the mailing of these documents to be combined with those for other members of your household, please call the Fund at (800) 441-7762.
Availability of Quarterly Schedule of Investments
The Fund/Master LLC file their complete schedule of portfolio holdings with the SEC for the first and third quarters of each fiscal year on Form N-Q. The Fund/Master LLC’s Forms N-Q are available on the SEC’s website at http://www.sec.gov and may also be reviewed and copied at the SEC’s Public Reference Room in Washington, D.C. Information on the operation of the Public Reference Room or how to access documents on the SEC’s website without charge may be obtained by calling (800) SEC-0330. The Fund/Master LLC’s Forms N-Q may also be obtained upon request and without charge by calling (800) 441-7762.
Availability of Proxy Voting Policies and Procedures
A description of the policies and procedures that the Fund/Master LLC use to determine how to vote proxies relating to portfolio securities is available upon request and without charge (1) by calling (800) 441-7762; (2) at http://www.blackrock.com; and (3) on the SEC’s website at http:// www.sec.gov.
Availability of Proxy Voting Record
Information about how the Fund/Master LLC voted proxies relating to securities held in the Fund/Master LLC’s portfolio during the most recent 12-month period ended June 30 is available upon request and without charge (1) at http://www.blackrock.com; or by calling (800) 441-7762 and (2) on the SEC’s website at http://www.sec.gov.
BlackRock’s Mutual Fund Family
BlackRock offers a diverse lineup of open-end mutual funds crossing all investment styles and managed by experts in equity, fixed-income and tax-exempt investing. Visit http://www.blackrock.com for more information.
Account Information
Call us at (800) 441-7762 from 8:00 AM to 6:00 PM ET on any business day to get information about your account balances, recent transactions and share prices. You can also reach us on the Web at http://www.blackrock.com/funds.
Automatic Investment Plans
Investor Class shareholders who want to invest regularly can arrange to have $50 or more automatically deducted from their checking or savings account and invested in any of the BlackRock funds.
Systematic Withdrawal Plans
Investor Class shareholders can establish a systematic withdrawal plan and receive periodic payments of $50 or more from their BlackRock funds, as long as their account balance is at least $10,000.
Retirement Plans
Shareholders may make investments in conjunction with Traditional, Rollover, Roth, Coverdell, Simple IRAs, SEP IRAs and 403(b) Plans.
| | | | | | |
| | | BLACKROCK VALUE OPPORTUNITIES FUND, INC. | | MARCH 31, 2017 | | 37 |
| | | | |
| Additional Information (concluded) | | | | |
|
BlackRock Privacy Principles |
BlackRock is committed to maintaining the privacy of its current and former fund investors and individual clients (collectively, “Clients”) and to safeguarding their non-public personal information. The following information is provided to help you understand what personal information BlackRock collects, how we protect that information and why in certain cases we share such information with select parties.
If you are located in a jurisdiction where specific laws, rules or regulations require BlackRock to provide you with additional or different privacy-related rights beyond what is set forth below, then BlackRock will comply with those specific laws, rules or regulations.
BlackRock obtains or verifies personal non-public information from and about you from different sources, including the following: (i) information we receive from you or, if applicable, your financial intermediary, on applications, forms or other documents; (ii) information about your transactions with us, our affiliates, or others; (iii) information we receive from a consumer reporting agency; and (iv) from visits to our websites.
BlackRock does not sell or disclose to non-affiliated third parties any non-public personal information about its Clients, except as permitted by law or as is necessary to respond to regulatory requests or to service Client accounts. These non-affiliated third parties are required to protect the confidentiality and security of this information and to use it only for its intended purpose.
We may share information with our affiliates to service your account or to provide you with information about other BlackRock products or services that may be of interest to you. In addition, BlackRock restricts access to non-public personal information about its Clients to those BlackRock employees with a legitimate business need for the information. BlackRock maintains physical, electronic and procedural safeguards that are designed to protect the non-public personal information of its Clients, including procedures relating to the proper storage and disposal of such information.
| | | | | | |
| 38 | | BLACKROCK VALUE OPPORTUNITIES FUND, INC. | | MARCH 31, 2017 | | |
This report is intended for current holders. It is not authorized for use as an offer of sale or a solicitation of an offer to buy shares of the Fund unless preceded or accompanied by the Fund’s current prospectus. Past performance results shown in this report should not be considered a representation of future performance. Investment returns and principal value of shares will fluctuate so that shares, when redeemed, may be worth more or less than their original cost. Statements and other information herein are as dated and are subject to change.

| | |
| |
VO-3/17-AR | |  |
| | |
Item 2 – | | Code of Ethics – Each registrant (or “Fund”) has adopted a code of ethics, as of the end of the period covered by this report, applicable to the registrant’s principal executive officer, principal financial officer, principal accounting officer or controller, or persons performing similar functions. During the period covered by this report, the code of ethics was amended to update certain information and to make other non-material changes. During the period covered by this report, there have been no waivers granted under the code of ethics. Each registrant undertakes to provide a copy of the code of ethics to any person upon request, without charge, by calling 1-800-441-7762. |
| |
Item 3 – | | Audit Committee Financial Expert – Each registrant’s board of directors (the “board of directors”), has determined that (i) the registrant has the following audit committee financial experts serving on its audit committee and (ii) each audit committee financial expert is independent: |
| |
| | Robert M. Hernandez Henry R. Keizer Stuart E. Eizenstat Bruce R. Bond |
| |
| | Under applicable securities laws, a person determined to be an audit committee financial expert will not be deemed an “expert” for any purpose, including without limitation for the purposes of Section 11 of the Securities Act of 1933, as a result of being designated or identified as an audit committee financial expert. The designation or identification of a person as an audit committee financial expert does not impose on such person any duties, obligations, or liabilities greater than the duties, obligations, and liabilities imposed on such person as a member of the audit committee and board of directors in the absence of such designation or identification. |
| |
Item 4 – | | Principal Accountant Fees and Services |
| |
| | The following table presents fees billed by Deloitte & Touche LLP (“D&T”) in each of the last two fiscal years for the services rendered to the Funds: |
| | | | | | | | | | | | | | | | |
| | | (a) Audit Fees | | (b) Audit-Related Fees1 | | (c) Tax Fees2 | | (d) All Other Fees |
| Entity Name | | Current
Fiscal Year
End | | Previous
Fiscal Year
End | | Current
Fiscal Year
End | | Previous
Fiscal Year
End | | Current
Fiscal Year
End | | Previous
Fiscal Year
End | | Current
Fiscal Year
End | | Previous
Fiscal Year
End |
| BlackRock Value Opportunities Fund, Inc. | | $8,160 | | $7,510 | | $0 | | $0 | | $13,107 | | $13,107 | | $0 | | $0 |
| Master Value Opportunities LLC | | $36,635 | | $37,855 | | $0 | | $0 | | $0 | | $0 | | $0 | | $0 |
| | |
| | The following table presents fees billed by D&T that were required to be approved by each registrant’s audit committee (the “Committee”) for services that relate directly to the operations or financial reporting of the Funds and that are rendered on behalf of BlackRock Advisors, LLC (“Investment Adviser” or “BlackRock”) and entities controlling, controlled by, or under common control with BlackRock (not including any sub-adviser whose role is primarily portfolio management and is subcontracted with or overseen by another investment adviser) that provide ongoing services to the Funds (“Affiliated Service Providers”): |
2
| | | | |
| | | Current Fiscal Year End | | Previous Fiscal Year End |
(b) Audit-Related Fees1 | | $0 | | $0 |
(c) Tax Fees2 | | $0 | | $0 |
(d) All Other Fees3 | | $2,129,000 | | $2,154,000 |
1 The nature of the services includes assurance and related services reasonably related to the performance of the audit or review of financial statements not included in Audit Fees, including accounting consultations, agreed-upon procedure reports, attestation reports, comfort letters, out-of-pocket expenses and internal control reviews not required by regulators.
2 The nature of the services includes tax compliance and/or tax preparation, including services relating to the filing or amendment of federal, state or local income tax returns, regulated investment company qualification reviews, taxable income and tax distribution calculations.
3 Non-audit fees of $2,129,000 and $2,154,000 for the current fiscal year and previous fiscal year, respectively, were paid to the Funds’ principal accountant in their entirety by BlackRock, in connection with services provided to the Affiliated Service Providers of each Fund and of certain other funds sponsored and advised by BlackRock or its affiliates for a service organization review and subscription to the Deloitte Accounting Research Tool. These amounts represent the aggregate fees paid by BlackRock and were not specifically allocated on a per fund basis.
(e)(1) Audit Committee Pre-Approval Policies and Procedures:
| | |
| | The Committee has adopted policies and procedures with regard to the pre-approval of services. Audit, audit-related and tax compliance services provided to the registrants on an annual basis require specific pre-approval by the Committee. The Committee also must approve other non-audit services provided to the registrants and those non-audit services provided to the Investment Adviser and Affiliated Service Providers that relate directly to the operations and the financial reporting of the registrants. Certain of these non-audit services that the Committee believes are (a) consistent with the SEC’s auditor independence rules and (b) routine and recurring services that will not impair the independence of the independent accountants may be approved by the Committee without consideration on a specific case-by-case basis (“general pre-approval”). The term of any general pre-approval is 12 months from the date of the pre-approval, unless the Committee provides for a different period. Tax or other non-audit services provided to the registrants which have a direct impact on the operations or financial reporting of the registrants will only be deemed pre-approved provided that any individual project does not exceed $10,000 attributable to the registrants or $50,000 per project. For this purpose, multiple projects will be aggregated to determine if they exceed the previously mentioned cost levels. |
| |
| | Any proposed services exceeding the pre-approved cost levels will require specific pre-approval by the Committee, as will any other services not subject to general pre-approval (e.g., unanticipated but permissible services). The Committee is informed of each service approved subject to general pre-approval at the next regularly scheduled in-person board meeting. At this meeting, an analysis of such services is presented to the Committee for ratification. The Committee may delegate to the Committee Chairman the authority to approve the provision of and fees for any specific engagement of permitted non-audit services, including services exceeding pre-approved cost levels. |
| |
| | (e)(2) None of the services described in each of Items 4(b) through (d) were approved by the Committee pursuant to the de minimis exception in paragraph (c)(7)(i)(C) of Rule 2-01 of Regulation S-X. |
| |
| | (f) Not Applicable |
| |
| | (g) The aggregate non-audit fees, defined as the sum of the fees shown under “Audit-Related Fees,” “Tax Fees” and “All Other Fees,” paid to the accountant for services rendered by the accountant to the registrants, the Investment Adviser and the Affiliated Service Providers were: |
3
| | | | |
| Entity Name | | Current Fiscal Year
End | | Previous Fiscal Year
End |
BlackRock Value Opportunities Fund, Inc. | | $13,107 | | $13,107 |
Master Value Opportunities LLC | | $0 | | $0 |
| | |
| | Additionally, the amounts billed by D&T in connection with services provided to the Affiliated Service Providers of the Fund and of other funds sponsored and advised by BlackRock or its affiliates during the current and previous fiscal years for a service organization review and subscription to the Deloitte Accounting Research Tool were: |
| | |
Current Fiscal Year
End | | Previous Fiscal Year
End |
| $2,129,000 | | $2,154,000 |
| | |
| | (h) The Committee has considered and determined that the provision of non-audit services that were rendered to the Investment Adviser and the Affiliated Service Providers that were not pre-approved pursuant to paragraph (c)(7)(ii) of Rule 2-01 of Regulation S-X is compatible with maintaining the principal accountant’s independence. |
| |
| Item 5 – | | Audit Committee of Listed Registrants – Not Applicable |
| |
| Item 6 – | | Investments |
| | (a) The registrants’ Schedules of Investments are included as part of the Report to Stockholders filed under Item 1 of this Form. |
| |
| | (b) Not Applicable due to no such divestments during the semi-annual period covered since the previous Form N-CSR filing. |
| |
| Item 7 – | | Disclosure of Proxy Voting Policies and Procedures for Closed-End Management Investment Companies – Not Applicable |
| |
| Item 8 – | | Portfolio Managers of Closed-End Management Investment Companies – Not Applicable |
| |
| Item 9 – | | Purchases of Equity Securities by Closed-End Management Investment Company and Affiliated Purchasers – Not Applicable |
| |
| Item 10 – | | Submission of Matters to a Vote of Security Holders – There have been no material changes to these procedures. |
| |
| Item 11 – | | Controls and Procedures |
| |
| | (a) The registrants’ principal executive and principal financial officers, or persons performing similar functions, have concluded that the registrants’ disclosure controls and procedures (as defined in Rule 30a-3(c) under the Investment Company Act of 1940, as amended (the “1940 Act”)) are effective as of a date within 90 days of the filing of this report based on the evaluation of these controls and procedures required |
4
| | |
| |
| | by Rule 30a-3(b) under the 1940 Act and Rule 15d-15(b) under the Securities Exchange Act of 1934, as amended. |
| |
| | (b) There were no changes in the registrants’ internal control over financial reporting (as defined in Rule 30a-3(d) under the 1940 Act) that occurred during the second fiscal quarter of the period covered by this report that have materially affected, or are reasonably likely to materially affect, the registrants’ internal control over financial reporting. |
| |
| Item 12 – | | Exhibits attached hereto |
| |
| | (a)(1) Code of Ethics – See Item 2 |
| |
| | (a)(2) Certifications – Attached hereto |
| |
| | (a)(3) Not Applicable |
| |
| | (b) Certifications – Attached hereto |
5
Pursuant to the requirements of the Securities Exchange Act of 1934 and the Investment Company Act of 1940, each registrant has duly caused this report to be signed on its behalf by the undersigned, thereunto duly authorized.
BlackRock Value Opportunities Fund, Inc. and Master Value Opportunities LLC
| | | | | | |
By: | | | | /s/ John M. Perlowski | | |
| | | | John M. Perlowski | | |
| | | | Chief Executive Officer (principal executive officer) of |
| | | | BlackRock Value Opportunities Fund, Inc. and Master Value Opportunities LLC |
Date: June 2, 2017
Pursuant to the requirements of the Securities Exchange Act of 1934 and the Investment Company Act of 1940, this report has been signed below by the following persons on behalf of each registrant and in the capacities and on the dates indicated.
| | | | | | |
By: | | | | /s/ John M. Perlowski | | |
| | | | John M. Perlowski | | |
| | | | Chief Executive Officer (principal executive officer) of |
| | | | BlackRock Value Opportunities Fund, Inc. and Master Value Opportunities LLC |
Date: June 2, 2017
| | | | | | |
| By: | | | | /s/ Neal J. Andrews | | |
| | | | Neal J. Andrews | | |
| | | | Chief Financial Officer (principal financial officer) of |
| | | | BlackRock Value Opportunities Fund, Inc. and Master Value Opportunities LLC |
Date: June 2, 2017
6