UNITED STATES
SECURITIES AND EXCHANGE COMMISSION
Washington, D.C. 20549
FORM N-CSR
CERTIFIED SHAREHOLDER REPORT OF REGISTERED MANAGEMENT INVESTMENT COMPANIES
Investment Company Act file number: 811-02809 and 811-10095
Name of Fund: BlackRock Advantage U.S. Total Market Fund, Inc. (Formerly BlackRock Value Opportunities
Fund, Inc.) and Master Advantage U.S. Total Market LLC (Formerly Master Value Opportunities LLC)
Fund Address: 100 Bellevue Parkway, Wilmington, DE 19809
Name and address of agent for service: John M. Perlowski, Chief Executive Officer, BlackRock Advantage U.S. Total Market Fund, Inc. (Formerly BlackRock Value Opportunities Fund, Inc.) and Master Advantage U.S. Total Market LLC (Formerly Master Value Opportunities LLC), 55 East 52nd Street, New York, NY 10055
Registrants’ telephone number, including area code: (800) 441-7762
Date of fiscal year end: 03/31/2018
Date of reporting period: 03/31/2018
Item 1 – Report to Stockholders
MARCH 31, 2018
| | |
ANNUAL REPORT | |  |
BlackRock Advantage U.S. Total Market Fund, Inc.
| | |
| | Not FDIC Insured ∎ May Lose Value ∎ No Bank Guarantee |
The Markets in Review
Dear Shareholder,
In the 12 months ended March 31, 2018, stocks posted solid performance, while bonds delivered mixed results. Solid corporate profits drove the equity market, while rising interest rates constrained bond returns.
The largest global economies experienced sustained and synchronized growth for the first time since the financial crisis, which led to strong equity performance worldwide. Emerging market stocks posted the strongest performance, as accelerating growth in China, the second-largest economy in the world, improved the outlook for corporate profits in most developing nations.
Short-term U.S. Treasury interest rates rose the fastest, while longer-term rates slightly increased, leading to a substantial flattening of the yield curve. The annual return for the three-month Treasury bill surpassed 1.0%, but remained well below the annual headline inflation rate of 2.4%. However, the ten-year U.S. Treasury — a bellwether of the bond market — posted a negative return, as rising energy prices, modest wage growth, and steady job creation drove expectations of higher inflation and interest rate increases by the U.S. Federal Reserve (the “Fed”). In credit markets, the investment-grade and high-yield bond markets posted modest returns in a relatively benign credit environment.
Even though it faced rising pressure to boost interest rates in 2017, the Fed only increased short-term interest rates three times during the last year. However, strong economic performance may justify a more rapid pace of rate hikes in 2018, as the actual inflation rate and investors’ expectations for inflation surpassed the Fed’s target of 2.0%. In addition, the Fed announced plans to reduce its $4.4 trillion balance sheet by $420 billion this year.
By contrast, the European Central Bank (“ECB”) and the Bank of Japan (“BoJ”) continued to expand their balance sheets despite nascent signs of sustained economic growth. Rising global growth, as well as limited bond supply, pressured other central banks to follow in the Fed’s footsteps. In October 2017, the ECB pledged to cut its bond purchases in half for 2018, while the BoJ reiterated its commitment to economic stimulus, even though the size of its balance sheet nearly matched the total output of the Japanese economy.
If the Fed maintains a measured pace of stimulus reduction, to the extent that inflation rises, it is likely to be accompanied by rising real growth. That could lead to a favorable combination of moderately higher inflation, steadily rising interest rates, and improving growth in 2018. Meanwhile, the market’s appetite for risk was mixed, as bond investors rotated to higher-quality assets, and stock investors continued to invest abroad. We continue to believe the primary risks to the economic expansion are trade protectionism, rapidly rising interest rates, and geopolitical tension. In particular, we are closely monitoring trade protectionism and the rise of populism in Western nations.
In December 2017, Congress passed a sweeping tax reform bill. The U.S. tax overhaul is likely to accentuate the existing reflationary themes, including faster growth and rising interest rates. Changing the corporate tax rate to a flat 21.0% will create many winners and losers among high-and-low tax companies, while the windfall from lower taxes could boost business and consumer spending.
In this environment, investors need to think globally, extend their scope across a broad array of asset classes, and be nimble as market conditions change. We encourage you to talk with your financial advisor and visit blackrock.com for further insight about investing in today’s markets.
Sincerely,

Rob Kapito
President, BlackRock Advisors, LLC

Rob Kapito
President, BlackRock Advisors, LLC
| | | | |
| Total Returns as of March 31, 2018 |
| | | 6-month | | 12-month |
U.S. large cap equities
(S&P 500® Index) | | 5.84% | | 13.99% |
U.S. small cap equities
(Russell 2000® Index) | | 3.25 | | 11.79 |
International equities
(MSCI Europe, Australasia, Far East Index) | | 2.63 | | 14.80 |
Emerging market equities
(MSCI Emerging Markets Index) | | 8.96 | | 24.93 |
3-month Treasury bills
(ICE BofAML 3-Month U.S. Treasury Bill Index) | | 0.64 | | 1.11 |
U.S. Treasury securities
(ICE BofAML 10-Year U.S. Treasury Index) | | (2.66) | | (1.13) |
U.S. investment grade bonds
(Bloomberg Barclays U.S. Aggregate Bond Index) | | (1.08) | | 1.20 |
Tax-exempt municipal bonds
(S&P Municipal Bond Index) | | (0.29) | | 2.53 |
U.S. high yield bonds
(Bloomberg Barclays U.S. Corporate High Yield 2% Issuer Capped Index) | | (0.39) | | 3.78 |
| Past performance is no guarantee of future results. Index performance is shown for illustrative purposes only. You cannot invest directly in an index. |
| | |
| 2 | | THIS PAGEISNOT PARTOF YOUR FUND REPORT |
Table of Contents

| | |
| Fund Summary as of March 31, 2018 | | BlackRock Advantage U.S. Total Market Fund, Inc. |
Investment Objective
BlackRock Advantage U.S. Total Market Fund, Inc.‘s (the “Fund”) investment objective is to seek long-term capital appreciation.
On March 27, 2017, the Board of Directors of the Fund approved a proposal to change the name of the Fund to BlackRock Advantage U.S. Total Market Fund, Inc. and the Board of Directors of Master Value Opportunities LLC (the “Master LLC”) approved a proposal to change the name of the Master LLC to Master Advantage U.S. Total Market LLC. The Fund is a feeder fund in a “master/feeder” structure and invests all of its assets in Master LLC. The Boards of Directors also approved certain changes to the respective investment objectives and investment strategies of the Fund and the Master LLC, as applicable. In conjunction with these changes, fund management has determined to change the benchmark indices against which the Fund and the Master LLC compare their performance. At a joint special meeting held on October 30, 2017, the shareholders of the Fund approved the change to the Fund’s and the Master LLC’s investment objectives. All of these changes became effective on December 15, 2017.
Portfolio Management Commentary
How did the Fund perform?
For the 12-month period ended March 31, 2018, the Fund, through its investment in the Master LLC, underperformed both its new benchmark, the Russell 3000® Index and its former benchmark, the S&P SmallCap 600® Value Index. Performance prior to December 15, 2017 is attributable to the previous portfolio management team.
What factors influenced performance?
From March 31, 2017 through December 15, 2017, stock selection in the industrials sector, particularly in commercial services & supplies and road & rail industries, was the largest detractor from performance. This was followed by stock selection in the information technology (“IT”) sector, which was weakest in the communications equipment and semiconductor industries. Selection in the health care providers & service industry also caused some underperformance, as did selection in the consumer discretionary and financials sectors.
Performance in the first quarter of 2018 was hindered by signals that capture value, namely fundamental insights that use top-line sales and cash flows. A quality-based insight that rewards stocks with lower risk compared to their peers also detracted, as investors continued to prefer growth assets in the risk-on environment that characterized the beginning of 2018. Select sentiment insights also weighed on results. Specifically, a signal that uses cell phone geolocation data to trace retail foot traffic for consumer sentiment detracted. A signal that follows informed investors’ positioning across U.S. equity markets was an additional detractor.
From March 31, 2017 through December 15, 2017, stock selection in the materials sector, particularly in the chemical and paper & forest products industries, was the largest contributor to returns. This was followed by stock selection in the consumer staples sector, which was strongest in the beverage industry due to the robust return of Boston Beer Company. The Master LLC also benefited from an underweight in the underperforming tobacco industry within the consumer staples sector. Stock selection in the real estate and energy sectors further contributed to relative performance.
Signals identifying company quality delivered strong results in the first quarter of 2018. An insight that evaluates stocks based on key corporate events, including initial public offerings, changes to chief executive officers, and revisions to forward guidance, contributed to performance. Additionally, a signal that favors stocks with founder-led ownership structures — a relationship that has empirically benefited equity returns over time — added value. An insight that rewards consistent dividend growth also performed well. Insights capturing sentiment and trends from market participants further added to performance. Specifically, proprietary text analysis of executive statements to capture longer-term trends in company fundamentals contributed positively, as did bond sentiment signals that were well positioned for expectations of rising rates.
Describe recent portfolio activity.
On December 15, 2017, BlackRock Value Opportunities Fund, Inc. changed its name to BlackRock Advantage U.S. Total Market Fund, Inc. Its benchmark changed from the S&P SmallCap 600® Value Index to the Russell 3000® Index on the same date. Concurrently, there were changes to the Fund’s investment strategy. Following the conversion, the Fund was managed by BlackRock’s Systematic Active Equity team, which incorporates a research-driven, systematic approach to identify differentiated performance opportunities across markets.
Describe portfolio positioning at period end.
The Master LLC remained largely sector neutral relative to the Russell 3000® Index. At the end of the period, the Master LLC had slight overweight positions in materials and health care and slight underweights in IT and energy.
The views expressed reflect the opinions of BlackRock as of the date of this report and are subject to change based on changes in market, economic or other conditions. These views are not intended to be a forecast of future events and are no guarantee of future results.
| | |
| 4 | | 2018 BLACKROCK ANNUAL REPORTTO SHAREHOLDERS |
| | |
| Fund Summary as of March 31, 2018 (continued) | | BlackRock Advantage U.S. Total Market Fund, Inc. |
Total Return Based on a $10,000 Investment
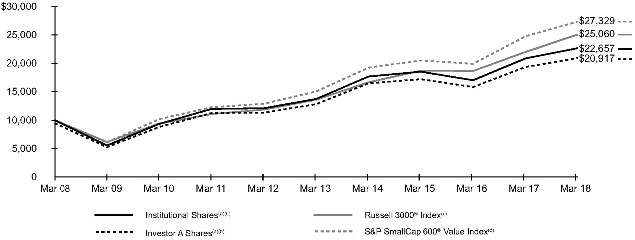
| (a) | Assuming maximum sales charges, if any, transaction costs and other operating expenses, including administration fees. Institutional Shares do not have a sales charge. |
| (b) | The Fund invests all of its assets in the Master LLC. The Master LLC invests primarily in common stock of small companies and emerging growth companies that the Master LLC’s management believes have special investment value. Under normal circumstances, at least 80% of the Fund’s net assets (plus the amount of any borrowings for investment purposes) in equity securities of U.S. issuers and derivatives that have similar economic characteristics to such securities. The Fund’s total returns prior to December 15, 2017 are the returns of the Fund when it followed a different investment objective and different investment strategies under the name “BlackRock Value Opportunities Fund, Inc.” |
| (c) | A float-adjusted, market capitalization–weighted index of the 3,000 largest U.S. companies based on total market capitalization that represents about 98% of the investable U.S. equity market. |
| (d) | An unmanaged index that is a subset of the S&P 600® Index that consists of those stocks in the S&P 600® Index exhibiting the strongest value characteristics. |
Performance Summary for the Period Ended March 31, 2018
| | | | | | | | | | | | | | | | | | | | | | | | | | | | | | | | | | | | | | |
| | | | | | | | Average Annual Total Returns(b),(e) | |
| | | | | | | | 1 Year | | | | | | 5 Years | | | | | | 10 Years | |
| | | 6-Month
Total Returns | | | | | w/o sales
charge | | | w/sales
charge | | | | | | w/o sales
charge | | | w/sales
charge | | | | | | w/o sales
charge | | | w/sales
charge | |
Institutional | | 2.43% | | | | | | | 8.48 | % | | | N/A | | | | | | | | 10.56 | % | | | N/A | | | | | | | | 8.52 | % | | | N/A | |
Investor A | | 2.27 | | | | | | | 8.20 | | | | 2.52 | % | | | | | | | 10.29 | | | | 9.11 | % | | | | | | | 8.24 | | | | 7.66 | % |
Investor C | | 1.92 | | | | | | | 7.35 | | | | 6.47 | | | | | | | | 9.38 | | | | 9.38 | | | | | | | | 7.27 | | | | 7.27 | |
Class K | | 2.43 | | | | | | | 8.48 | | | | N/A | | | | | | | | 10.56 | | | | N/A | | | | | | | | 8.52 | | | | N/A | |
Class R | | 2.15 | | | | | | | 7.87 | | | | N/A | | | | | | | | 9.97 | | | | N/A | | | | | | | | 7.88 | | | | N/A | |
S&P SmallCap 600® Value Index | | 2.65 | | | | | | | 10.50 | | | | N/A | | | | | | | | 12.69 | | | | N/A | | | | | | | | 10.58 | | | | N/A | |
Russell 3000® Index | | 5.65 | | | | | | | 13.81 | | | | N/A | | | | | | | | 13.03 | | | | N/A | | | | | | | | 9.62 | | | | N/A | |
| | (e) | Assuming maximum sales charges, if any. Average annual total returns with and without sales charges reflect reductions for distribution and service fees. See “About Fund Performance” on page 6 for a detailed description of share classes, including any related sales charges and fees, and how performance was calculated for certain share classes. | |
N/A — Not applicable as share class and index do not have a sales charge.
Past performance is not indicative of future results.
Performance results may include adjustments made for financial reporting purposes in accordance with U.S. generally accepted accounting principles.
Expense Example
| | | | | | | | | | | | | | | | | | | | | | | | | | | | | | | | |
| | | Actual | | | | | | Hypothetical(b) | | | | |
| | | Beginning
Account Value
(10/01/17) | | | Ending
Account Value
(03/31/18) | | | Expenses Paid During the Period(a) | | | | | | Beginning
Account Value
(10/01/17) | | | Ending
Account Value
(03/31/18) | | | Expenses Paid During the Period(a) | | | Annualized Expense Ratio | |
Institutional | | | $1,000.00 | | | | $1,024.30 | | | | $3.53 | | | | | | | | $1,000.00 | | | | $1,021.44 | | | | $3.53 | | | | 0.70 | % |
Investor A | | | 1,000.00 | | | | 1,022.70 | | | | 4.84 | | | | | | | | 1,000.00 | | | | 1,020.14 | | | | 4.84 | | | | 0.96 | |
Investor C | | | 1,000.00 | | | | 1,019.20 | | | | 8.81 | | | | | | | | 1,000.00 | | | | 1,016.21 | | | | 8.80 | | | | 1.75 | |
Class K | | | 1,000.00 | | | | 943.40 | | | | 0.74 | | | | | | | | 1,000.00 | | | | 1,008.14 | | | | 0.77 | | | | 0.43 | |
Class R | | | 1,000.00 | | | | 1,021.50 | | | | 6.10 | | | | | | | | 1,000.00 | | | | 1,018.90 | | | | 6.09 | | | | 1.21 | |
| | (a) | For each class of the Fund, expenses are equal to the annualized expense ratio for the class, multiplied by the average account value over the period, multiplied by 182/365 (to reflect the one-half year period shown). Because the Fund invests significantly in the Master LLC, the expense table reflects the net expenses of both the Fund and the Master LLC in which it invests. For Class K Shares, expenses are equal to the annualized expense ratio for the class, multiplied by the average account value over the period, multiplied by 65/365 (to reflect the period from January 25, 2018, the commencement of operations, to March 31, 2018). | |
| | (b) | Hypothetical 5% annual return before expenses is calculated by prorating the number of days in the most recent fiscal half year divided by 365. See “Disclosure of Expenses” on page 6 for further information on how expenses were calculated. | |
| | |
| About Fund Performance | | BlackRock Advantage U.S. Total Market Fund, Inc. |
Institutional and Class K Shares are not subject to any sales charge. These shares bear no ongoing distribution or service fees and are available only to certain eligible investors. Prior to the Fund’s Class K Shares inception date of January 25, 2018, Class K Share performance shown is that of Institutional Shares. The performance of the Fund’s Class K Shares would be substantially similar to Institutional Shares because Class K Shares and Institutional Shares invest in the same portfolio of securities and performance would only differ to the extent that Class K Shares and Institutional Shares have different expenses. The actual returns of Class K Shares would have been higher than those of the Institutional Shares because Class K Shares have lower expenses than the Institutional Shares.
Investor A Shares are subject to a maximum initial sales charge (front-end load) of 5.25% and a service fee of 0.25% per year (but no distribution fee). Certain redemptions of these shares may be subject to a contingent deferred sales charge (“CDSC”) where no initial sales charge was paid at the time of purchase. These shares are generally available through financial intermediaries.
Investor C Shares are subject to a 1.00% CDSC if redeemed within one year of purchase. In addition, these shares are subject to a distribution fee of 0.75% per year and a service fee of 0.25% per year. These shares are generally available through financial intermediaries.
Class R Shares are not subject to any sales charge. These shares are subject to a distribution fee of 0.25% per year and a service fee of 0.25% per year. These shares are available only to certain employer-sponsored retirement plans.
Performance information reflects past performance and does not guarantee future results. Current performance may be lower or higher than the performance data quoted. Refer to www.blackrock.com to obtain performance data current to the most recent month end. Performance results do not reflect the deduction of taxes that a shareholder would pay on fund distributions or the redemption of fund shares. Figures shown in the performance tables on the previous page assume reinvestment of all distributions, if any, at net asset value (“NAV”) on the ex-dividend date. Investment return and principal value of shares will fluctuate so that shares, when redeemed, may be worth more or less than their original cost. Distributions paid to each class of shares will vary because of the different levels of service, distribution and transfer agency fees applicable to each class, which are deducted from the income available to be paid to shareholders.
Disclosure of Expenses
Shareholders of the Fund may incur the following charges: (a) transactional expenses, such as sales charges; and (b) operating expenses, including administration fees, service and distribution fees, including 12b-1 fees, acquired fund fees and expenses, and other fund expenses. The expense example shown on the previous page (which is based on a hypothetical investment of $1,000 invested on October 1, 2017 and held through March 31, 2018) is intended to assist shareholders both in calculating expenses based on an investment in the Fund and in comparing these expenses with similar costs of investing in other mutual funds.
The expense example provides information about actual account values and actual expenses. In order to estimate the expenses a shareholder paid during the period covered by this report, shareholders can divide their account value by $1,000 and then multiply the result by the number corresponding to their share class under the heading entitled “Expenses Paid During the Period.”
The expense example also provides information about hypothetical account values and hypothetical expenses based on the Fund’s actual expense ratio and an assumed rate of return of 5% per year before expenses. In order to assist shareholders in comparing the ongoing expenses of investing in the Fund and other funds, compare the 5% hypothetical examples with the 5% hypothetical examples that appear in shareholder reports of other funds.
The expenses shown in the expense example are intended to highlight shareholders’ ongoing costs only and do not reflect transactional expenses, such as sales charges, if any. Therefore, the hypothetical example is useful in comparing ongoing expenses only, and will not help shareholders determine the relative total expenses of owning different funds. If these transactional expenses were included, shareholder expenses would have been higher.
Derivative Financial Instruments
The Master LLC may invest in various derivative financial instruments. These instruments are used to obtain exposure to a security, commodity, index, market, and/or other assets without owning or taking physical custody of securities, commodities and/or other referenced assets or to manage market, equity, credit, interest rate, foreign currency exchange rate, commodity and/or other risks. Derivative financial instruments may give rise to a form of economic leverage and involve risks, including the imperfect correlation between the value of a derivative financial instrument and the underlying asset, possible default of the counterparty to the transaction or illiquidity of the instrument. The Master LLC’s successful use of a derivative financial instrument depends on the investment adviser’s ability to predict pertinent market movements accurately, which cannot be assured. The use of these instruments may result in losses greater than if they had not been used, may limit the amount of appreciation the Master LLC can realize on an investment and/or may result in lower distributions paid to shareholders. The Master LLC’s investments in these instruments, if any, are discussed in detail in the Master LLC’s Notes to Financial Statements.
| | |
| 6 | | 2018 BLACKROCK ANNUAL REPORTTO SHAREHOLDERS |
Statement of Assets and Liabilities
March 31, 2018
| | | | |
| | | BlackRock Advantage U.S. Total
Market Fund | |
| |
ASSETS | | | | |
Investments at value — Master LLC (cost $512,731,931) | | $ | 508,016,146 | |
Receivables: | | | | |
Capital shares sold | | | 62,812 | |
Withdrawals from the Master LLC | | | 678,838 | |
Receivable from advisor | | | 351,001 | |
Deferred offering costs | | | 11,863 | |
Prepaid expenses | | | 42,665 | |
| | | | |
Total assets | | | 509,163,325 | |
| | | | |
| |
LIABILITIES | | | | |
Payables: | | | | |
Administration fees | | | 2 | |
Capital shares redeemed | | | 741,650 | |
Officer’s fees | | | 269 | |
Other accrued expenses | | | 182,660 | |
Other affiliates | | | 4,102 | |
Service and distribution fees | | | 133,663 | |
Transfer agent fees | | | 266,544 | |
| | | | |
Total liabilities | | | 1,328,890 | |
| | | | |
NET ASSETS | | $ | 507,834,435 | |
| | | | |
| |
NET ASSETS CONSIST OF | | | | |
Paid-in capital | | $ | 411,516,145 | |
Undistributed net investment income | | | 830,463 | |
Accumulated net realized gain allocated from the Master LLC | | | 100,203,612 | |
Net unrealized appreciation (depreciation) allocated from the Master LLC | | | (4,715,785 | ) |
| | | | |
NET ASSETS | | $ | 507,834,435 | |
| | | | |
| |
NET ASSET VALUE | | | | |
Institutional — Based on net assets of $113,465,891 and 3,508,616 shares outstanding, 100 million shares authorized, $0.10 par value | | $ | 32.34 | |
| | | | |
Investor A — Based on net assets of $309,125,187 and 9,900,044 shares outstanding, 100 million shares authorized, $0.10 par value | | $ | 31.22 | |
| | | | |
Investor C — Based on net assets of $59,781,331 and 2,671,558 shares outstanding, 100 million shares authorized, $0.10 par value | | $ | 22.38 | |
| | | | |
Class K — Based on net assets of $2,736,088 and 84,611 shares outstanding, 2 billion shares authorized, $0.10 par value | | $ | 32.34 | |
| | | | |
Class R — Based on net assets of $22,725,938 and 923,418 shares outstanding, 100 million shares authorized, $0.10 par value | | $ | 24.61 | |
| | | | |
See notes to financial statements.
Statement of Operations
Year Ended March 31, 2018
| | | | |
| | | BlackRock Advantage U.S. Total
Market Fund | |
| |
INVESTMENT INCOME | | | | |
Net investment income allocated from the Master LLC: | | | | |
Dividends — unaffiliated(a) | | $ | 8,544,665 | |
Securities lending income — affiliated — net | | | 210,063 | |
Dividends — affiliated | | | 33,528 | |
Interest | | | 289 | |
Foreign taxes withheld | | | (18,417 | ) |
Expenses | | | (3,367,471 | ) |
Fees waived | | | 2,404 | |
| | | | |
Total investment income | | | 5,405,061 | |
| | | | |
| |
FUND EXPENSES | | | | |
Service and distribution — class specific | | | 1,784,443 | |
Administration | | | 1,529,606 | |
Transfer agent — class specific | | | 1,015,226 | |
Printing | | | 488,065 | |
Professional | | | 145,789 | |
Registration | | | 102,617 | |
Offering | | | 7,489 | |
Officer | | | 35 | |
Miscellaneous | | | 21,734 | |
| | | | |
Total expenses | | | 5,095,004 | |
| | | | |
Fees waived and/or reimbursed by the Administrator | | | (399,282 | ) |
Transfer agent fees waived and/or reimbursed — class specific | | | (219,693 | ) |
Expenses reimbursed by Administrator | | | (293,714 | ) |
| | | | |
Total expenses after fees waived and reimbursed | | | 4,182,315 | |
| | | | |
Net investment income | | | 1,222,746 | |
| | | | |
| |
REALIZED AND UNREALIZED GAIN ALLOCATED FROM THE MASTER LLC | | | | |
Net realized gain from investments, capital gain distributions from investment companies, foreign currency transactions and futures contracts | | | 154,603,484 | |
Net change in unrealized appreciation (depreciation) on investments, foreign currency translations and futures contracts | | | (106,285,347 | ) |
| | | | |
Total realized and unrealized gain | | | 48,318,137 | |
| | | | |
NET INCREASE IN NET ASSETS RESULTING FROM OPERATIONS | | $ | 49,540,883 | |
| | | | |
| (a) | Includes non-recurring dividends in the amount of $1,231,868. |
See notes to financial statements.
| | |
| 8 | | 2018 BLACKROCK ANNUAL REPORTTO SHAREHOLDERS |
Statements of Changes in Net Assets
| | | | | | | | |
| | | BlackRock Advantage U.S. Total Market Fund | |
| | | For the Year Ended March 31, | |
| | | 2018 | | | 2017 | |
| | |
INCREASE (DECREASE) IN NET ASSETS | | | | | | | | |
| | |
OPERATIONS | | | | | | | | |
Net investment income (loss) | | $ | 1,222,746 | | | $ | (1,494,407 | ) |
Net realized gain | | | 154,603,484 | | | | 106,078,077 | |
Net change in unrealized appreciation (depreciation) | | | (106,285,347 | ) | | | 32,926,989 | |
| | | | | | | | |
Net increase in net assets resulting from operations | | | 49,540,883 | | | | 137,510,659 | |
| | | | | | | | |
| | |
DISTRIBUTIONS TO SHAREHOLDERS(a) | | | | | | | | |
From net investment income: | | | | | | | | |
Institutional | | | (403,360 | ) | | | — | |
Investor A | | | (172,514 | ) | | | — | |
From net realized gain: | | | | | | | | |
Institutional | | | (22,990,874 | ) | | | (5,156,179 | ) |
Investor A | | | (56,073,745 | ) | | | (13,235,696 | ) |
Investor B | | | (4,423 | ) | | | (9,957 | ) |
Investor C | | | (12,597,984 | ) | | | (6,361,342 | ) |
Class R | | | (4,577,358 | ) | | | (1,081,678 | ) |
| | | | | | | | |
Decrease in net assets resulting from distributions to shareholders | | | (96,820,258 | ) | | | (25,844,852 | ) |
| | | | | | | | |
| | |
CAPITAL SHARE TRANSACTIONS | | | | | | | | |
Net decrease in net assets derived from capital share transactions | | | (123,738,303 | ) | | | (120,625,863 | ) |
| | | | | | | | |
| | |
NET ASSETS | | | | | | | | |
Total decrease in net assets | | | (171,017,678 | ) | | | (8,960,056 | ) |
Beginning of year | | | 678,852,113 | | | | 687,812,169 | |
| | | | | | | | |
End of year | | $ | 507,834,435 | | | $ | 678,852,113 | |
| | | | | | | | |
Undistributed (accumulated) net investment income, end of year | | $ | 830,463 | | | $ | 167,240 | |
| | | | | | | | |
| (a) | Distributions for annual periods determined in accordance with U.S. federal income tax regulations. |
See notes to financial statements.
Financial Highlights
(For a share outstanding throughout each period)
| | | | | | | | | | | | | | | | | | | | |
| | | BlackRock Advantage U.S. Total Market Fund | |
| | | Institutional | |
| | | Year Ended March 31, | |
| | | 2018 | | | 2017 | | | 2016 | | | 2015 | | | 2014 | |
Net asset value, beginning of year | | $ | 34.88 | | | $ | 29.38 | | | $ | 33.01 | | | $ | 31.51 | | | $ | 24.44 | |
| | | | | | | | | | | | | | | | | | | | |
Net investment income(a) | | | 0.17 | (b) | | | 0.06 | (c) | | | 0.04 | | | | 0.09 | | | | 0.08 | |
Net realized and unrealized gain (loss) | | | 2.66 | | | | 6.62 | | | | (2.72 | ) | | | 1.41 | | | | 6.99 | |
| | | | | | | | | | | | | | | | | | | | |
Net increase (decrease) from investment operations | | | 2.83 | | | | 6.68 | | | | (2.68 | ) | | | 1.50 | | | | 7.07 | |
| | | | | | | | | | | | | | | | | | | | |
| Distributions(d) | | | | | | | | | | | | | | | |
From net investment income | | | (0.09 | ) | | | — | | | | (0.95 | ) | | | — | | | | — | |
From net realized gain | | | (5.28 | ) | | | (1.18 | ) | | | — | | | | — | | | | — | |
| | | | | | | | | | | | | | | | | | | | |
Total distributions | | | (5.37 | ) | | | (1.18 | ) | | | (0.95 | ) | | | — | | | | — | |
| | | | | | | | | | | | | | | | | | | | |
Net asset value, end of year | | $ | 32.34 | | | $ | 34.88 | | | $ | 29.38 | | | $ | 33.01 | | | $ | 31.51 | |
| | | | | | | | | | | | | | | | | | | | |
| | | | | |
Total Return(e) | | | | | | | | | | | | | | | | | | | | |
Based on net asset value | | | 8.48 | % | | | 22.72 | % | | | (8.11 | )% | | | 4.76 | % | | | 28.93 | % |
| | | | | | | | | | | | | | | | | | | | |
| | | | | |
Ratios to Average Net Assets(f)(g) | | | | | | | | | | | | | | | | | | | | |
Total expenses | | | 1.07 | % | | | 0.94 | % | | | 1.08 | % | | | 1.00 | % | | | 0.97 | % |
| | | | | | | | | | | | | | | | | | | | |
Total expenses after fees waived and/or reimbursed | | | 0.92 | % | | | 0.94 | % | | | 1.08 | % | | | 1.00 | % | | | 0.97 | % |
| | | | | | | | | | | | | | | | | | | | |
Net investment income | | | 0.52 | %(b) | | | 0.19 | %(c) | | | 0.12 | % | | | 0.30 | % | | | 0.30 | % |
| | | | | | | | | | | | | | | | | | | | |
| | | | | |
Supplemental Data | | | | | | | | | | | | | | | | | | | | |
Net assets, end of year (000) | | $ | 113,466 | | | $ | 155,558 | | | $ | 135,744 | | | $ | 166,487 | | | $ | 308,697 | |
| | | | | | | | | | | | | | | | | | | | |
Portfolio turnover rate of the Master LLC | | | 147 | % | | | 68 | % | | | 71 | % | | | 55 | % | | | 61 | % |
| | | | | | | | | | | | | | | | | | | | |
| (a) | Based on average shares outstanding. |
| (b) | Net investment income per share and the ratio of net investment income to average net assets includes $0.06 per share and 0.20%, respectively, resulting from a special dividend. |
| (c) | Net investment income per share and the ratio of net investment income to average net assets includes $0.03 per share and 0.08%, respectively, resulting from a special dividend. |
| (d) | Distributions for annual periods determined in accordance with U.S. federal income tax regulations. |
| (e) | Where applicable, assumes the reinvestment of distributions. |
| (f) | Includes the Fund’s share of the Master LLC’s allocated fees waived of less than 0.005%. |
| (g) | Includes the Fund’s share of the Master LLC’s allocated net expenses and/or net investment income. |
See notes to financial statements.
| | |
| 10 | | 2018 BLACKROCK ANNUAL REPORTTO SHAREHOLDERS |
Financial Highlights (continued)
(For a share outstanding throughout each period)
| | | | | | | | | | | | | | | | | | | | |
| | | BlackRock Advantage U.S. Total Market Fund (continued) | |
| | | Investor A | |
| | | Year Ended March 31, | |
| | | 2018 | | | 2017 | | | 2016 | | | 2015 | | | 2014 | |
Net asset value, beginning of year | | $ | 33.76 | | | $ | 28.55 | | | $ | 32.09 | | | $ | 30.70 | | | $ | 23.88 | |
| | | | | | | | | | | | | | | | | | | | |
Net investment income (loss)(a) | | | 0.08 | (b) | | | (0.03 | )(c) | | | (0.02 | ) | | | 0.00 | (d) | | | 0.00 | (d) |
Net realized and unrealized gain (loss) | | | 2.58 | | | | 6.42 | | | | (2.64 | ) | | | 1.39 | | | | 6.82 | |
| | | | | | | | | | | | | | | | | | | | |
Net increase (decrease) from investment operations | | | 2.66 | | | | 6.39 | | | | (2.66 | ) | | | 1.39 | | | | 6.82 | |
| | | | | | | | | | | | | | | | | | | | |
| Distributions(e) | | | | | | | | | | | | | | | |
From net investment income | | | (0.02 | ) | | | — | | | | (0.88 | ) | | | — | | | | — | |
From net realized gain | | | (5.18 | ) | | | (1.18 | ) | | | — | | | | — | | | | — | |
| | | | | | | | | | | | | | | | | | | | |
Total distributions | | | (5.20 | ) | | | (1.18 | ) | | | (0.88 | ) | | | — | | | | — | |
| | | | | | | | | | | | | | | | | | | | |
Net asset value, end of year | | $ | 31.22 | | | $ | 33.76 | | | $ | 28.55 | | | $ | 32.09 | | | $ | 30.70 | |
| | | | | | | | | | | | | | | | | | | | |
| | | | | |
Total Return(f) | | | | | | | | | | | | | | | | | | | | |
Based on net asset value | | | 8.20 | % | | | 22.36 | % | | | (8.28 | )% | | | 4.53 | % | | | 28.56 | % |
| | | | | | | | | | | | | | | | | | | | |
| | | | | |
Ratios to Average Net Assets(g)(h) | | | | | | | | | | | | | | | | | | | | |
Total expenses | | | 1.33 | % | | | 1.24 | % | | | 1.26 | % | | | 1.24 | % | | | 1.25 | % |
| | | | | | | | | | | | | | | | | | | | |
Total expenses after fees waived and/or reimbursed | | | 1.19 | % | | | 1.24 | % | | | 1.26 | % | | | 1.24 | % | | | 1.25 | % |
| | | | | | | | | | | | | | | | | | | | |
Net investment income (loss) | | | 0.23 | %(b) | | | (0.10 | )%(c) | | | (0.06 | )% | | | 0.00 | %(i) | | | 0.01 | % |
| | | | | | | | | | | | | | | | | | | | |
| | | | | |
Supplemental Data | | | | | | | | | | | | | | | | | | | | |
Net assets, end of year (000) | | $ | 309,125 | | | $ | 366,669 | | | $ | 392,584 | | | $ | 458,593 | | | $ | 479,719 | |
| | | | | | | | | | | | | | | | | | | | |
Portfolio turnover rate of the Master LLC | | | 147 | % | | | 68 | % | | | 71 | % | | | 55 | % | | | 61 | % |
| | | | | | | | | | | | | | | | | | | | |
| (a) | Based on average shares outstanding. |
| (b) | Net investment income per share and the ratio of net investment income to average net assets includes $0.06 per share and 0.20%, respectively, resulting from a special dividend. |
| (c) | Net investment income per share and the ratio of net investment income to average net assets includes $0.03 per share and 0.08%, respectively, resulting from a special dividend. |
| (d) | Amount is less than $0.005 per share. |
| (e) | Distributions for annual periods determined in accordance with U.S. federal income tax regulations. |
| (f) | Where applicable, excludes the effects of any sales charges and assumes the reinvestment of distributions. |
| (g) | Includes the Fund’s share of the Master LLC’s allocated fees waived of less than 0.005%. |
| (h) | Includes the Fund’s share of the Master LLC’s allocated net expenses and/or net investment income. |
| (i) | Amount is less than 0.005%. |
See notes to financial statements.
Financial Highlights (continued)
(For a share outstanding throughout each period)
| | | | | | | | | | | | | | | | | | | | |
| | | BlackRock Advantage U.S. Total Market Fund (continued) | |
| | | Investor C | |
| | | Year Ended March 31, | |
| | | 2018 | | | 2017 | | | 2016 | | | 2015 | | | 2014 | |
Net asset value, beginning of year | | $ | 25.28 | | | $ | 21.80 | | | $ | 24.72 | | | $ | 23.85 | | | $ | 18.71 | |
| | | | | | | | | | | | | | | | | | | | |
Net investment loss(a) | | | (0.12 | )(b) | | | (0.22 | )(c) | | | (0.20 | ) | | | (0.20 | ) | | | (0.18 | ) |
Net realized and unrealized gain (loss) | | | 1.91 | | | | 4.88 | | | | (2.03 | ) | | | 1.07 | | | | 5.32 | |
| | | | | | | | | | | | | | | | | | | | |
Net increase (decrease) from investment operations | | | 1.79 | | | | 4.66 | | | | (2.23 | ) | | | 0.87 | | | | 5.14 | |
| | | | | | | | | | | | | | | | | | | | |
| Distributions(d) | | | | | | | | | | | | | | | |
From net investment income | | | — | | | | — | | | | (0.69 | ) | | | — | | | | — | |
From net realized gain | | | (4.69 | ) | | | (1.18 | ) | | | — | | | | — | | | | — | |
| | | | | | | | | | | | | | | | | | | | |
Total distributions | | | (4.69 | ) | | | (1.18 | ) | | | (0.69 | ) | | | — | | | | — | |
| | | | | | | | | | | | | | | | | | | | |
Net asset value, end of year | | $ | 22.38 | | | $ | 25.28 | | | $ | 21.80 | | | $ | 24.72 | | | $ | 23.85 | |
| | | | | | | | | | | | | | | | | | | | |
| | | | | |
Total Return(e) | | | | | | | | | | | | | | | | | | | | |
Based on net asset value | | | 7.35 | % | | | 21.33 | % | | | (9.02 | )% | | | 3.65 | % | | | 27.47 | % |
| | | | | | | | | | | | | | | | | | | | |
| | | | | |
Ratios to Average Net Assets(f) | | | | | | | | | | | | | | | | | | | | |
Total expenses | | | 2.16 | %(g) | | | 2.07 | %(g) | | | 2.09 | %(g) | | | 2.08 | % | | | 2.11 | %(g) |
| | | | | | | | | | | | | | | | | | | | |
Total expenses after fees waived and/or reimbursed | | | 2.00 | %(g) | | | 2.07 | %(g) | | | 2.09 | %(g) | | | 2.07 | % | | | 2.11 | %(g) |
| | | | | | | | | | | | | | | | | | | | |
Net investment loss | | | (0.52 | )%(b) | | | (0.93 | )%(c)(g) | | | (0.89 | )%(g) | | | (0.83 | )% | | | (0.84 | )%(g) |
| | | | | | | | | | | | | | | | | | | | |
| | | | | |
Supplemental Data | | | | | | | | | | | | | | | | | | | | |
Net assets, end of year (000) | | $ | 59,781 | | | $ | 130,476 | | | $ | 136,066 | | | $ | 180,679 | | | $ | 200,245 | |
| | | | | | | | | | | | | | | | | | | | |
Portfolio turnover rate of the Master LLC | | | 147 | % | | | 68 | % | | | 71 | % | | | 55 | % | | | 61 | % |
| | | | | | | | | | | | | | | | | | | | |
| (a) | Based on average shares outstanding. |
| (b) | Net investment income per share and the ratio of net investment income to average net assets includes $0.06 per share and 0.20%, respectively, resulting from a special dividend. |
| (c) | Net investment income per share and the ratio of net investment income to average net assets includes $0.03 per share and 0.08%, respectively, resulting from a special dividend. |
| (d) | Distributions for annual periods determined in accordance with U.S. federal income tax regulations. |
| (e) | Where applicable, excludes the effects of any sales charges and assumes the reinvestment of distributions. |
| (f) | Includes the Fund’s share of the Master LLC’s allocated net expenses and/or net investment income. |
| (g) | Includes the Fund’s share of the Master LLC’s allocated fees waived of less than 0.005%. |
See notes to financial statements.
| | |
| 12 | | 2018 BLACKROCK ANNUAL REPORTTO SHAREHOLDERS |
Financial Highlights (continued)
(For a share outstanding throughout each period)
| | | | |
| | | BlackRock
Advantage
U.S. Total
Market Fund
(continued) | |
| | | Class K | |
| | | Period from
01/25/18(a) to
03/31/18 | |
Net asset value, beginning of period | | $ | 34.28 | |
| | | | |
Net investment loss(b) | | | (0.06 | ) |
Net realized and unrealized loss | | | (1.88 | ) |
| | | | |
Net decrease from investment operations | | | (1.94 | ) |
| | | | |
Net asset value, end of period | | $ | 32.34 | |
| | | | |
| |
Total Return(c) | | | | |
Based on net asset value | | | (5.66 | )%(d) |
| | | | |
| |
Ratios to Average Net Assets(e) | | | | |
Total expenses | | | 0.87 | %(f) |
| | | | |
Total expenses after fees waived and/or reimbursed | | | 0.43 | %(f) |
| | | | |
Net investment loss | | | (1.06 | )%(f) |
| | | | |
| |
Supplemental Data | | | | |
Net assets, end of period (000) | | $ | 2,736 | |
| | | | |
Portfolio turnover rate of the Master LLC | | | 147 | % |
| | | | |
| (a) | Commencement of operations. |
| (b) | Based on average shares outstanding. |
| (c) | Where applicable, assumes the reinvestment of distributions. |
| (d) | Aggregate total return. |
| (e) | Includes the Fund’s share of the Master LLC’s allocated net expenses and/or net investment income. |
See notes to financial statements.
Financial Highlights (continued)
(For a share outstanding throughout each period)
| | | | | | | | | | | | | | | | | | | | |
| | | BlackRock Advantage U.S. Total Market Fund (continued) | |
| | | Class R | |
| | | Year Ended March 31, | |
| | | 2018 | | | 2017 | | | 2016 | | | 2015 | | | 2014 | |
Net asset value, beginning of year | | $ | 27.65 | | | $ | 23.63 | | | $ | 26.74 | | | $ | 25.66 | | | $ | 20.02 | |
| | | | | | | | | | | | | | | | | | | | |
Net investment loss(a) | | | (0.00 | )(b)(c) | | | (0.11 | )(d) | | | (0.08 | ) | | | (0.09 | ) | | | (0.06 | ) |
Net realized and unrealized gain (loss) | | | 2.07 | | | | 5.31 | | | | (2.20 | ) | | | 1.17 | | | | 5.70 | |
| | | | | | | | | | | | | | | | | | | | |
Net increase (decrease) from investment operations | | | 2.07 | | | | 5.20 | | | | (2.28 | ) | | | 1.08 | | | | 5.64 | |
| | | | | | | | | | | | | | | | | | | | |
| Distributions(e) | | | | | | | | | | | | | | | |
From net investment income | | | — | | | | — | | | | (0.83 | ) | | | — | | | | — | |
From net realized gain | | | (5.11 | ) | | | (1.18 | ) | | | — | | | | — | | | | — | |
| | | | | | | | | | | | | | | | | | | | |
Total distributions | | | (5.11 | ) | | | (1.18 | ) | | | (0.83 | ) | | | — | | | | — | |
| | | | | | | | | | | | | | | | | | | | |
Net asset value, end of year | | $ | 24.61 | | | $ | 27.65 | | | $ | 23.63 | | | $ | 26.74 | | | $ | 25.66 | |
| | | | | | | | | | | | | | | | | | | | |
| | | | | |
Total Return(f) | | | | | | | | | | | | | | | | | | | | |
Based on net asset value | | | 7.87 | % | | | 21.97 | % | | | (8.50 | )% | | | 4.21 | % | | | 28.17 | % |
| | | | | | | | | | | | | | | | | | | | |
| | | | | |
Ratios to Average Net Assets(g)(h) | | | | | | | | | | | | | | | | | | | | |
Total expenses | | | 1.60 | % | | | 1.55 | % | | | 1.51 | % | | | 1.59 | % | | | 1.54 | % |
| | | | | | | | | | | | | | | | | | | | |
Total expenses after fees waived and/or reimbursed | | | 1.44 | % | | | 1.55 | % | | | 1.51 | % | | | 1.59 | % | | | 1.54 | % |
| | | | | | | | | | | | | | | | | | | | |
Net investment loss | | | (0.01 | )%(c) | | | (0.42 | )%(d) | | | (0.31 | )% | | | (0.34 | )% | | | (0.27 | )% |
| | | | | | | | | | | | | | | | | | | | |
| | | | | |
Supplemental Data | | | | | | | | | | | | | | | | | | | | |
Net assets, end of year (000) | | $ | 22,726 | | | $ | 26,004 | | | $ | 23,037 | | | $ | 25,624 | | | $ | 28,444 | |
| | | | | | | | | | | | | | | | | | | | |
Portfolio turnover rate of the Master LLC | | | 147 | % | | | 68 | % | | | 71 | % | | | 55 | % | | | 61 | % |
| | | | | | | | | | | | | | | | | | | | |
| (a) | Based on average shares outstanding. |
| (b) | Amount is greater than $(0.005) per share. |
| (c) | Net investment income per share and the ratio of net investment income to average net assets includes $0.06 per share and 0.20%, respectively, resulting from a special dividend. |
| (d) | Net investment income per share and the ratio of net investment income to average net assets includes $0.03 per share and 0.08%, respectively, resulting from a special dividend. |
| (e) | Distributions for annual periods determined in accordance with U.S. federal income tax regulations. |
| (f) | Where applicable, assumes the reinvestment of distributions. |
| (g) | Includes the Fund’s share of the Master LLC’s allocated fees waived of less than 0.005%. |
| (h) | Includes the Fund’s share of the Master LLC’s allocated net expenses and/or net investment income. |
See notes to financial statements.
| | |
| 14 | | 2018 BLACKROCK ANNUAL REPORTTO SHAREHOLDERS |
| | |
| Notes to Financial Statements | | BlackRock Advantage U.S. Total Market Fund, Inc. |
BlackRock Advantage U.S. Total Market Fund, Inc. (formerly known as BlackRock Value Opportunities Fund, Inc.) (the “Fund”) is registered under the Investment Company Act of 1940, as amended (the “1940 Act”). The Fund is registered as a diversified, open-end management investment company. The Fund is organized as a Maryland corporation. The Fund seeks to achieve its investment objective by investing all of its assets in Master Advantage U.S. Total Market LLC (formerly known as Master Value Opportunities LLC) (the “Master LLC”), an affiliate of the Fund, which has the same investment objective and strategies as the Fund. The value of the Fund’s investment in the Master LLC reflects the Fund’s proportionate interest in the net assets of the Master LLC. The performance of the Fund is directly affected by the performance of the Master LLC. At March 31, 2018, the percentage of the Master LLC owned by the Fund was 100%. The financial statements of the Master LLC, including the Schedule of Investments, are included elsewhere in this report and should be read in conjunction with the Fund’s financial statements.
The Fund offers multiple classes of shares. All classes of shares have identical voting, dividend, liquidation and other rights and are subject to the same terms and conditions, except that certain classes bear expenses related to the shareholder servicing and distribution of such shares. Institutional and Class K Shares are sold only to certain eligible investors. Class R Shares are available only to certain employer-sponsored retirement plans. Investor A and Investor C Shares are generally available through financial intermediaries. Each class has exclusive voting rights with respect to matters relating to its shareholder servicing and distribution expenditures (except that Investor B shareholders may vote on material changes to the Investor A distribution and service plan).
| | | | | | | | | | | | |
| Share Class | | Initial Sales
Charge | | | CDSC | | | Conversion Privilege | |
Institutional, Class K and Class R Shares | | | No | | | | No | | | | None | |
Investor A Shares | | | Yes | | | | No | (a) | | | None | |
Investor C Shares | | | No | | | | Yes | | | | None | |
| | (a) | Investor A Shares may be subject to a contingent deferred sales charge (“CDSC”) for certain redemptions where no initial sales charge was paid at the time of purchase. | |
On December 27, 2017, the Fund’s issued and outstanding Investor B Shares converted into Investor A Shares, with the same relative aggregate net asset value (“NAV”) as the original shares held immediately prior to the conversion.
| 2. | SIGNIFICANT ACCOUNTING POLICIES |
The financial statements are prepared in conformity with accounting principles generally accepted in the United States of America (“U.S. GAAP”), which may require management to make estimates and assumptions that affect the reported amounts of assets and liabilities in the financial statements, disclosure of contingent assets and liabilities at the date of the financial statements and the reported amounts of increases and decreases in net assets from operations during the reporting period. Actual results could differ from those estimates. The Fund is considered an investment company under U.S. GAAP and follows the accounting and reporting guidance applicable to investment companies. Below is a summary of significant accounting policies:
Investment Transactions and Income Recognition: For financial reporting purposes, contributions to and withdrawals from the Master LLC are accounted for on a trade date basis. The Fund records its proportionate share of the Master LLC’s income, expenses and realized and unrealized gains and losses on a daily basis. In addition, the Fund accrues its own expenses. Income, expenses and realized and unrealized gains and losses are allocated daily to each class based on its relative net assets.
Distributions: Distributions paid by the Fund are recorded on the ex-dividend date. Distributions of capital gains are recorded on the ex-dividend date and made at least annually. The character and timing of distributions are determined in accordance with U.S. federal income tax regulations, which may differ from U.S. GAAP.
Offering Costs: Offering costs are amortized over a 12-month period beginning with the commencement of operations of a class of shares.
Indemnifications: In the normal course of business, the Fund enters into contracts that contain a variety of representations that provide general indemnification. The Fund’s maximum exposure under these arrangements is unknown because it involves future potential claims against the Fund, which cannot be predicted with any certainty.
Other: Expenses directly related to the Fund or its classes are charged to the Fund or the applicable class. Other operating expenses shared by several funds, including other funds managed by the Manager, are prorated among those funds on the basis of relative net assets or other appropriate methods. Expenses directly related to the Fund and other shared expenses prorated to the Fund are allocated daily to each class based on its relative net assets or other appropriate methods.
| 3. | INVESTMENT VALUATION AND FAIR VALUE MEASUREMENTS |
The Fund’s policy is to value its financial instruments at fair value. The Fund records its investment in the Master LLC at fair value based on the Fund’s proportionate interest in the net assets of the Master LLC. Valuation of securities held by the Master LLC is discussed in Note 3 of the Master LLC’s Notes to Financial Statements, which are included elsewhere in this report.
| 4. | ADMINISTRATION AGREEMENT AND OTHER TRANSACTIONS WITH AFFILIATES |
The PNC Financial Services Group, Inc. is the largest stockholder and an affiliate of BlackRock, Inc. (“BlackRock”) for 1940 Act purposes.
Administration: The Fund entered into an Administration Agreement with BlackRock Advisors, LLC (the “Administrator”), an indirect, wholly-owned subsidiary of BlackRock, to provide administrative services (other than investment advice and related portfolio activities). For such services, the Fund pays the Administrator a monthly fee at an annual rate of 0.25% of the average daily net assets of the Fund. The Fund does not pay an investment advisory fee or investment management fee.
| | | | |
| NOTESTO FINANCIAL STATEMENTS | | | 15 | |
| | |
| Notes to Financial Statements (continued) | | BlackRock Advantage U.S. Total Market Fund, Inc. |
Service and Distribution Fees: The Fund entered into a Distribution Agreement and a Distribution and Service Plan with BlackRock Investments, LLC (“BRIL”), an affiliate of the Administrator. Pursuant to the Distribution and Service Plan and in accordance with Rule 12b-1 under the 1940 Act, the Fund pays BRIL ongoing service and distribution fees. The fees are accrued daily and paid monthly at annual rates based upon the average daily net assets of the relevant share class of the Fund as follows:
| | | | | | | | | | | | | | | | |
| | | Investor A | | | Investor B(a) | | | Investor C | | | Class R | |
Distribution Fee | | | — | % | | | 0.75 | % | | | 0.75 | % | | | 0.25 | % |
Service Fee | | | 0.25 | | | | 0.25 | | | | 0.25 | | | | 0.25 | |
| | (a) | On December 27, 2017, Investor B Shares converted into Investor A Shares. | |
BRIL and broker-dealers, pursuant to sub-agreements with BRIL, provide shareholder servicing and distribution services to the Fund. The ongoing service and/or distribution fee compensates BRIL and each broker-dealer for providing shareholder servicing and/or distribution related services to shareholders.
For the year ended March 31, 2018, the following table shows the class specific service and distribution fees borne directly by each share class of the Fund:
| | | | | | | | |
| Investor A | | Investor B(a) | | Investor C | | Class R | | Total |
$906,024 | | $372 | | $755,399 | | $122,648 | | $1,784,443 |
| | (a) | On December 27, 2017, Investor B Shares converted into Investor A Shares. | |
Transfer Agent: Pursuant to written agreements, certain financial intermediaries, some of which may be affiliates, provide the Fund with sub-accounting, recordkeeping, sub-transfer agency and other administrative services with respect to sub-accounts they service. For these services, these entities receive an asset-based fee or an annual fee per shareholder account, which will vary depending on share class and/or net assets. For the year ended March 31, 2018, the Fund paid the following amounts to affiliates of BlackRock in return for these services, which are included in transfer agent — class specific in the Statement of Operations:
| | | | |
Institutional | | $ | 1 | |
Investor A | | | 38 | |
The Administrator maintains a call center that is responsible for providing certain shareholder services to the Fund. Shareholder services include responding to inquiries and processing subscriptions and redemptions based upon instructions from shareholders. For the year ended March 31, 2018, the Fund reimbursed the Administrator the following amounts for costs incurred in running the call center, which are included in transfer agent — class specific in the Statement of Operations:
| | | | | | | | | | |
| Institutional | | Investor A | | Investor B(a) | | Investor C | | Class R | | Total |
$4,153 | | $4,292 | | $30 | | $1,189 | | $160 | | $9,824 |
| | (a) | On December 27, 2017, Investor B Shares converted into Investor A Shares. | |
For the year ended March 31, 2018, the following table shows the class specific transfer agent fees borne directly by each share class of the Fund:
| | | | | | | | | | |
| Institutional | | Investor A | | Investor B(a) | | Investor C | | Class R | | Total |
$225,091 | | $572,386 | | $244 | | $173,368 | | $44,137 | | $1,015,226 |
| | (a) | On December 27, 2017, Investor B Shares converted into Investor A Shares. | |
Other Fees: For the year ended March 31, 2018, affiliates earned underwriting discounts, direct commissions and dealer concessions on sales of the Fund’s Investor A Shares, which totaled $3,423.
For the year ended March 31, 2018, affiliates received CDSCs as follows:
| | | | |
Investor A | | $ | 195 | |
Investor C | | | 1,129 | |
Expense Reimbursements: For the year ended March 31, 2018, the Administrator reimbursed the Fund $293,714, which is shown as expenses reimbursed by the Administrator in the Statement of Operations.
With respect to Fund, the Administrator contractually agreed to waive and/or reimburse fees or expenses in order to limit expenses, excluding interest expense, dividend expense, tax expense, acquired fund fees and expenses, and certain other fund expenses, which constitute extraordinary expenses not incurred in the ordinary course of the Fund’s business (“expense limitation”). The current expense limitations as a percentage of average daily net assets are as follows:
| | | | |
Institutional | | | 0.48 | % |
Investor A | | | 0.73 | |
Investor B(a) | | | 1.48 | |
Investor C | | | 1.48 | |
Class K(b) | | | 0.43 | |
Class R | | | 0.98 | |
| | (a) | On December 27, 2017, Investor B Shares converted into Investor A Shares. | |
| | (b) | Effective January 25, 2018, implemented contractual cap upon launch through January 31, 2019. | |
| | |
| 16 | | 2018 BLACKROCK ANNUAL REPORTTO SHAREHOLDERS |
| | |
| Notes to Financial Statements (continued) | | BlackRock Advantage U.S. Total Market Fund, Inc. |
The Administrator has agreed not to reduce or discontinue these contractual expense limitations through July 31, 2019, unless approved by the Board, including a majority of the directors who are not “interested persons” of the Fund, as defined in the 1940 Act (“Independent Directors”), or by a vote of a majority of the outstanding voting securities of the Fund. For the year ended March 31, 2018, the Administrator waived and/or reimbursed $399,282, which is included in fees waived and/or reimbursed by the Administrator in the Statement of Operations.
These amounts waived and/or reimbursed are included in transfer agent fees waived and/or reimbursed — class specific in the Statement of Operations. For the year ended March 31, 2018, class specific expense waivers and/or reimbursements are as follows:
| | | | | | | | | | | | | | | | | | | | | | | | |
| | | Institutional | | | Investor A | | | Investor B(a) | | | Investor C | | | Class R | | | Total | |
Transfer agent fees waived and/or reimbursed — class specific | | | $50,087 | | | | $122,752 | | | | $1 | | | | $36,681 | | | | $10,172 | | | | $219,693 | |
| | (a) | On December 27, 2017, Investor B Shares converted into Investor A Shares. | |
Interfund Lending: In accordance with an exemptive order (the “Order”) from the U.S. Securities and Exchange Commission (“SEC”), the Fund may participate in a joint lending and borrowing facility for temporary purposes (the “Interfund Lending Program”), subject to compliance with the terms and conditions of the Order, and to the extent permitted by the Fund’s investment policies and restrictions. The Fund is currently permitted to borrow and lend under the Interfund Lending Program.
A lending BlackRock fund may lend in aggregate up to 15% of its net assets, but may not lend more than 5% of its net assets to any one borrowing fund through the Interfund Lending Program. A borrowing BlackRock fund may not borrow through the Interfund Lending Program or from any other source more than 33 1/3% of its total assets (or any lower threshold provided for by the fund’s investment restrictions). If a borrowing BlackRock fund’s total outstanding borrowings exceed 10% of its total assets, each of its outstanding interfund loans will be subject to collateralization of at least 102% of the outstanding principal value of the loan. All interfund loans are for temporary or emergency purposes and the interest rate to be charged will be the average of the highest current overnight repurchase agreement rate available to a lending fund and the bank loan rate, as calculated according to a formula established by the Board.
During the year ended March 31, 2018, the Fund did not participate in the Interfund Lending Program.
Directors and Officers: Certain directors and/or officers of the Fund are directors and/or officers of BlackRock or its affiliates. The Fund reimburses the Administrator for a portion of the compensation paid to the Fund’s Chief Compliance Officer, which is included in Officer in the Statement of Operations.
It is the Fund’s policy to comply with the requirements of the Internal Revenue Code of 1986, as amended, applicable to regulated investment companies, and to distribute substantially all of its taxable income to its shareholders. Therefore, no U.S. federal income tax provision is required.
The Fund files U.S. federal and various state and local tax returns. No income tax returns are currently under examination. The statute of limitations on the Fund’s U.S. federal tax returns generally remains open for each of the four years ended March 31, 2018. The statutes of limitations on the Fund’s state and local tax returns may remain open for an additional year depending upon the jurisdiction.
Management has analyzed tax laws and regulations and their application to the Fund as of March 31, 2018, inclusive of the open tax return years, and does not believe that there are any uncertain tax positions that require recognition of a tax liability in the Fund’s financial statements.
U.S. GAAP requires that certain components of net assets be adjusted to reflect permanent differences between financial and tax reporting. These reclassifications have no effect on net assets or net asset values per share. As of period end, the following permanent differences attributable to foreign currency transactions, the use of equalization and income recognized from real estate investment trusts were reclassified to the following accounts:
| | | | |
Paid-in capital | | $ | 6,438,115 | |
Undistributed net investment income | | | 16,351 | |
Accumulated net realized gain allocated from the Master LLC | | | (6,454,466 | ) |
The tax character of distributions paid was as follows:
| | | | | | | | |
| | | 03/31/18 | | | 03/31/17 | |
Ordinary income | | $ | 21,074,035 | (a) | | $ | — | |
Long-term capital gains | | | 82,184,338 | (a) | | | 25,844,852 | |
| | | | | | | | |
| | $ | 103,258,373 | | | $ | 25,844,852 | |
| | | | | | | | |
| | (a) | Distribution amounts may include a portion of the proceeds from redeemed shares. | |
As of period end, the tax components of accumulated net earnings (losses) were as follows:
| | | | |
Undistributed ordinary income | | $ | 17,383,966 | |
Undistributed long-term capital gains | | | 83,989,475 | |
Net unrealized losses(a) | | | (5,055,151 | ) |
| | | | |
| | $ | 96,318,290 | |
| | | | |
| | (a) | The difference between book-basis and tax-basis net unrealized losses was attributable primarily to the tax deferral of losses on wash sales, the realization for tax purposes of unrealized gains/losses on certain futures contracts and the income recognized from pass-through entities and the treatment of certain security lending transactions. | |
| | | | |
| NOTESTO FINANCIAL STATEMENTS | | | 17 | |
| | |
| Notes to Financial Statements (continued) | | BlackRock Advantage U.S. Total Market Fund, Inc. |
| 6. | CAPITAL SHARE TRANSACTIONS |
Transactions in capital shares for each class were as follows:
| | | | | | | | | | | | | | | | | | | | |
| | | Year Ended 03/31/18 | | | | | | Year Ended 03/31/17 | |
| | | Shares | | | Amount | | | | | | Shares | | | Amount | |
Institutional | | | | | | | | | | | | | | | | | | | | |
Shares sold | | | 659,587 | | | $ | 22,265,557 | | | | | | | | 957,200 | | | $ | 32,198,621 | |
Shares issued in reinvestment of distributions | | | 587,782 | | | | 19,330,026 | | | | | | | | 119,316 | | | | 4,189,176 | |
Shares redeemed | | | (2,198,880 | ) | | | (73,776,797 | ) | | | | | | | (1,236,476 | ) | | | (40,827,779 | ) |
| | | | | | | | | | | | | | | | | | | | |
Net decrease | | | (951,511 | ) | | $ | (32,181,214 | ) | | | | | | | (159,960 | ) | | $ | (4,439,982 | ) |
| | | | | | | | | | | | | | | | | | | | |
| | | | | |
Investor A | | | | | | | | | | | | | | | | | | | | |
Shares issued from conversion(a) | | | 971 | | | $ | 30,553 | | | | | | | | — | | | $ | — | |
Shares sold and automatic conversion of shares | | | 2,813,655 | | | | 93,273,559 | | | | | | | | 1,875,723 | | | | 60,905,937 | |
Shares issued in reinvestment of distributions | | | 1,636,524 | | | | 52,063,299 | | | | | | | | 366,410 | | | | 12,465,230 | |
Shares redeemed | | | (5,411,488 | ) | | | (176,035,090 | ) | | | | | | | (5,130,807 | ) | | | (163,038,898 | ) |
| | | | | | | | | | | | | | | | | | | | |
Net decrease | | | (960,338 | ) | | $ | (30,667,679 | ) | | | | | | | (2,888,674 | ) | | $ | (89,667,731 | ) |
| | | | | | | | | | | | | | | | | | | | |
| | | | | |
Investor B | | | | | | | | | | | | | | | | | | | | |
Shares sold | | | — | | | $ | — | | | | | | | | 216 | | | $ | 5,648 | |
Shares issued in reinvestment of distributions | | | 172 | | | | 4,423 | | | | | | | | 260 | | | | 7,151 | |
Shares converted(a) | | | (1,209 | ) | | | (30,553 | ) | | | | | | | — | | | | — | |
Shares redeemed and automatic conversion of shares | | | (4,299 | ) | | | (117,170 | ) | | | | | | | (11,355 | ) | | | (288,019 | ) |
| | | | | | | | | | | | | | | | | | | | |
Net decrease | | | (5,336 | ) | | $ | (143,300 | ) | | | | | | | (10,879 | ) | | $ | (275,220 | ) |
| | | | | | | | | | | | | | | | | | | | |
| | | | | |
Investor C | | | | | | | | | | | | | | | | | | | | |
Shares sold | | | 251,354 | | | $ | 5,975,208 | | | | | | | | 405,534 | | | $ | 9,845,367 | |
Shares issued in reinvestment of distributions | | | 526,476 | | | | 12,194,818 | | | | | | | | 226,858 | | | | 5,793,887 | |
Shares redeemed | | | (3,267,645 | ) | | | (81,067,474 | ) | | | | | | | (1,712,857 | ) | | | (41,100,017 | ) |
| | | | | | | | | | | | | | | | | | | | |
Net decrease | | | (2,489,815 | ) | | $ | (62,897,448 | ) | | | | | | | (1,080,465 | ) | | $ | (25,460,763 | ) |
| | | | | | | | | | | | | | | | | | | | |
| | | |
| | | Period from 01/25/18(b)
to 03/31/18 | | | | | | | |
Class K | | | | | | | | | | | | | | | | | | | | |
Shares sold | | | 84,863 | | | $ | 2,757,506 | | | | | | | | — | | | $ | — | |
Shares redeemed | | | (252 | ) | | | (8,067 | ) | | | | | | | — | | | | — | |
| | | | | | | | | | | | | | | | | | | | |
Net increase | | | 84,611 | | | $ | 2,749,439 | | | | | | | | — | | | $ | — | |
| | | | | | | | | | | | | | | | | | | | |
| | | |
| | | Year Ended 03/31/18 | | | | | | Year Ended 03/31/17 | |
Class R | | | | | | | | | | | | | | | | | | | | |
Shares sold | | | 142,833 | | | $ | 3,739,804 | | | | | | | | 284,794 | | | $ | 7,429,402 | |
Shares issued in reinvestment of distributions | | | 180,618 | | | | 4,576,033 | | | | | | | | 38,762 | | | | 1,081,093 | |
Shares redeemed | | | (340,583 | ) | | | (8,913,938 | ) | | | | | | | (357,960 | ) | | | (9,292,662 | ) |
| | | | | | | | | | | | | | | | | | | | |
Net decrease | | | (17,132 | ) | | $ | (598,101 | ) | | | | | | | (34,404 | ) | | $ | (782,167 | ) |
| | | | | | | | | | | | | | | | | | | | |
Total Net Decrease | | | (4,339,521 | ) | | $ | (123,738,303 | ) | | | | | | | (4,174,832 | ) | | $ | (120,625,863 | ) |
| | | | | | | | | | | | | | | | | | | | |
| | (a) | On December 27, 2017, Investor B Shares converted into Investor A Shares. | |
| | (b) | Commencement of operations. | |
As of March 31, 2018, BlackRock Financial Management, Inc., an affiliate of the Fund, owned 5,834 Class K Shares of the Fund.
Management has evaluated the impact of all subsequent events on the Fund through the date the financial statements were issued and has determined that there were no subsequent events requiring adjustment or additional disclosure in the financial statements.
| | |
| 18 | | 2018 BLACKROCK ANNUAL REPORTTO SHAREHOLDERS |
Report of Independent Registered Public Accounting Firm
To the Shareholders and Board of Directors of BlackRock Advantage U.S. Total Market Fund, Inc.:
Opinion on the Financial Statements and Financial Highlights
We have audited the accompanying statement of assets and liabilities of BlackRock Advantage U.S. Total Market Fund, Inc. (formerly, BlackRock Value Opportunities Fund, Inc.) (the “Fund”), as of March 31, 2018, the related statement of operations for the year then ended, the statements of changes in net assets for each of the two years in the period then ended, the financial highlights for each of the five years in the period then ended, and the related notes. In our opinion, the financial statements and financial highlights present fairly, in all material respects, the financial position of the Fund as of March 31, 2018, and the results of its operations for the year then ended, the changes in its net assets for each of the two years in the period then ended, and the financial highlights for each of the five years in the period then ended, in conformity with accounting principles generally accepted in the United States of America.
Basis for Opinion
These financial statements and financial highlights are the responsibility of the Fund’s management. Our responsibility is to express an opinion on the Fund’s financial statements and financial highlights based on our audits. We are a public accounting firm registered with the Public Company Accounting Oversight Board (United States) (PCAOB) and are required to be independent with respect to the Fund in accordance with the U.S. federal securities laws and the applicable rules and regulations of the Securities and Exchange Commission and the PCAOB.
We conducted our audits in accordance with the standards of the PCAOB. Those standards require that we plan and perform the audit to obtain reasonable assurance about whether the financial statements and financial highlights are free of material misstatement, whether due to error or fraud. The Fund is not required to have, nor were we engaged to perform, an audit of its internal control over financial reporting. As part of our audits we are required to obtain an understanding of internal control over financial reporting but not for the purpose of expressing an opinion on the effectiveness of the Fund’s internal control over financial reporting. Accordingly, we express no such opinion.
Our audits included performing procedures to assess the risks of material misstatement of the financial statements and financial highlights, whether due to error or fraud, and performing procedures that respond to those risks. Such procedures included examining, on a test basis, evidence regarding the amounts and disclosures in the financial statements and financial highlights. Our audits also included evaluating the accounting principles used and significant estimates made by management, as well as evaluating the overall presentation of the financial statements and financial highlights. Our procedures included confirmation of securities owned as of March 31, 2018, by correspondence with the custodian and brokers; when replies were not received from brokers, we performed other auditing procedures. We believe that our audits provide a reasonable basis for our opinion.
Deloitte & ToucheLLP
Philadelphia, Pennsylvania
May 23, 2018
We have served as the auditor of one or more BlackRock investment companies since 1992.
Important Tax Information (unaudited)
During the fiscal year ended March 31, 2018, the following information is provided with respect to the ordinary income distributions paid by the Fund:
| | | | | | | | |
| | | Payable Dates | |
| | | 07/21/17 | | | 12/05/17 | |
Qualified Dividend Income for Individuals(a) | | | 34.17 | % | | | 100 | % |
Dividends Qualifying for the Dividends Received Deduction for Corporations(a) | | | 34.90 | | | | 34.90 | |
Qualified Short-Term Capital Gains for non-U.S. Residents(b) | | | 100 | | | | — | |
| | (a) | The Fund hereby designates the percentage indicated above or the maximum amount allowable by law. | |
| | (b) | Represents the portion of the taxable ordinary income dividends eligible for exemption from U.S. withholding tax for nonresident aliens and foreign corporations. | |
Additionally, the Fund distributed long-term capital gains of $1.656795 and $2.442643 per share to shareholders of record on July 19, 2017 and December 1, 2017, respectively.
| | | | |
| REPORTOF INDEPENDENT REGISTERED ACCOUNTING FIRMAND IMPORTANT TAX INFORMATION | | | 19 | |
| | |
| Master Advantage U.S. Market Fund LLC as of March 31, 2018 | | Master Advantage U.S. Total Market LLC |
TEN LARGEST HOLDINGS
| | | | |
| Security | | Percent of
Net Assets | |
Apple Inc. | | | 3 | % |
Johnson & Johnson | | | 2 | |
Facebook, Inc., Class A | | | 2 | |
Amazon.com, Inc. | | | 2 | |
Mastercard, Inc., Class A | | | 2 | |
3M Co. | | | 2 | |
Microsoft Corp. | | | 1 | |
Texas Instruments, Inc. | | | 1 | |
McDonald’s Corp. | | | 1 | |
ConocoPhillips | | | 1 | |
SECTOR ALLOCATION
| | | | |
| Sector | | Percent of
Net Assets | |
Information Technology | | | 23 | % |
Financials | | | 15 | |
Consumer Discretionary | | | 14 | |
Health Care | | | 14 | |
Industrials | | | 10 | |
Consumer Staples | | | 7 | |
Energy | | | 5 | |
Real Estate | | | 4 | |
Materials | | | 4 | |
Utilities | | | 2 | |
Telecommunication Services | | | 1 | |
Short-Term Securities | | | 1 | |
Liabilities in Excess of Other Assets | | | — | (a) |
| | (a) | Amount is greater than (0.5%). | |
For Master LLC compliance purposes, the Master LLC’s sector classifications refer to one or more of the sector sub-classifications used by one or more widely recognized market indexes or ratings group indexes, and/or as defined by the investment adviser. These definitions may not apply for purposes of this report, which may combine such sector sub-classifications for reporting ease.
| | |
| 20 | | 2018 BLACKROCK ANNUAL REPORTTO SHAREHOLDERS |
| | |
Schedule of Investments March 31, 2018 | | Master Advantage U.S. Total Market LLC (Percentages shown are based on Net Assets) |
| | | | | | | | |
| Security | | Shares | | | Value | |
Common Stocks — 99.0% | |
| |
| Aerospace & Defense — 2.1% | | | | |
Boeing Co. | | | 2,786 | | | $ | 913,474 | |
Curtiss-Wright Corp. | | | 847 | | | | 114,404 | |
HEICO Corp., Class A | | | 16,826 | | | | 1,193,805 | |
KLX, Inc.(a) | | | 17,679 | | | | 1,256,270 | |
Orbital ATK, Inc. | | | 1,099 | | | | 145,738 | |
Raytheon Co. | | | 30,930 | | | | 6,675,313 | |
Rockwell Collins, Inc. | | | 3,025 | | | | 407,921 | |
| | | | | | | | |
| | | | | | | 10,706,925 | |
| Airlines — 0.4% | | | | | | |
Southwest Airlines Co. | | | 37,249 | | | | 2,133,623 | |
| | | | | | | | |
| Auto Components — 1.1% | | | | | | |
BorgWarner, Inc. | | | 19,235 | | | | 966,174 | |
Dana, Inc. | | | 31,781 | | | | 818,679 | |
Tenneco, Inc. | | | 71,367 | | | | 3,915,907 | |
| | | | | | | | |
| | | | | | | 5,700,760 | |
| Banks — 6.7% | | | | | | |
Bank of America Corp. | | | 188,637 | | | | 5,657,224 | |
Cadence Bancorp | | | 8,175 | | | | 222,605 | |
Cathay General Bancorp | | | 11,872 | | | | 474,643 | |
Citigroup, Inc. | | | 67,761 | | | | 4,573,868 | |
Citizens Financial Group, Inc. | | | 37,366 | | | | 1,568,625 | |
First Horizon National Corp. | | | 293,744 | | | | 5,531,200 | |
First Republic Bank | | | 56,593 | | | | 5,241,078 | |
JPMorgan Chase & Co. | | | 15,375 | | | | 1,690,789 | |
Wells Fargo & Co. | | | 64,588 | | | | 3,385,057 | |
Wintrust Financial Corp. | | | 64,759 | | | | 5,572,512 | |
| | | | | | | | |
| | | | | | | 33,917,601 | |
| Beverages — 0.7% | | | | | | |
Brown-Forman Corp., Class B | | | 3,469 | | | | 188,714 | |
Coca-Cola European Partners PLC | | | 35,952 | | | | 1,497,760 | |
Molson Coors Brewing Co., Class B | | | 4,833 | | | | 364,070 | |
PepsiCo, Inc. | | | 15,282 | | | | 1,668,030 | |
| | | | | | | | |
| | | | | | | 3,718,574 | |
| Biotechnology — 3.5% | | | | | | |
AbbVie, Inc. | | | 44,973 | | | | 4,256,694 | |
Amgen, Inc. | | | 5,953 | | | | 1,014,867 | |
Array BioPharma, Inc.(a) | | | 18,764 | | | | 306,228 | |
Celgene Corp.(a) | | | 36,125 | | | | 3,222,711 | |
Exelixis, Inc.(a) | | | 13,131 | | | | 290,852 | |
Gilead Sciences, Inc. | | | 78,435 | | | | 5,913,215 | |
Regeneron Pharmaceuticals, Inc.(a) | | | 2,590 | | | | 891,892 | |
United Therapeutics Corp.(a) | | | 15,530 | | | | 1,744,951 | |
| | | | | | | | |
| | | | | | | 17,641,410 | |
| Building Products — 0.4% | | | | | | |
Fortune Brands Home & Security, Inc. | | | 16,534 | | | | 973,687 | |
Trex Co., Inc.(a) | | | 2,536 | | | | 275,841 | |
Universal Forest Products, Inc. | | | 18,725 | | | | 607,626 | |
| | | | | | | | |
| | | | | | | 1,857,154 | |
| Capital Markets — 3.0% | | | | | | |
BGC Partners, Inc., Class A | | | 182,681 | | | | 2,457,059 | |
BrightSphere Investment Group PLC | | | 13,804 | | | | 217,551 | |
CME Group, Inc. | | | 3,624 | | | | 586,146 | |
Donnelley Financial Solutions, Inc.(a) | | | 8,546 | | | | 146,735 | |
Franklin Resources, Inc. | | | 26,324 | | | | 912,916 | |
Intercontinental Exchange, Inc. | | | 86,906 | | | | 6,302,423 | |
Invesco Ltd. | | | 3,964 | | | | 126,888 | |
Moelis & Co., Class A | | | 38,605 | | | | 1,963,064 | |
S&P Global, Inc. | | | 11,172 | | | | 2,134,522 | |
TD Ameritrade Holding Corp. | | | 5,811 | | | | 344,186 | |
| | | | | | | | |
| | | | | | | 15,191,490 | |
| | | | | | | | |
| Security | | Shares | | | Value | |
| Chemicals — 2.0% | | | | | | |
AdvanSix, Inc.(a) | | | 5,176 | | | $ | 180,021 | |
Air Products & Chemicals, Inc. | | | 38,207 | | | | 6,076,059 | |
Eastman Chemical Co. | | | 18,447 | | | | 1,947,634 | |
Trinseo SA | | | 15,064 | | | | 1,115,489 | |
WR Grace & Co. | | | 13,158 | | | | 805,664 | |
| | | | | | | | |
| | | | | | | 10,124,867 | |
| Commercial Services & Supplies — 0.4% | | | | | | |
Cimpress NV(a) | | | 643 | | | | 99,472 | |
Interface, Inc. | | | 46,302 | | | | 1,166,810 | |
Republic Services, Inc. | | | 11,223 | | | | 743,299 | |
RR Donnelley & Sons Co. | | | 26,278 | | | | 229,407 | |
| | | | | | | | |
| | | | | | | 2,238,988 | |
| Communications Equipment — 0.3% | | | | | | |
Cisco Systems, Inc. | | | 7,868 | | | | 337,459 | |
Motorola Solutions, Inc. | | | 7,752 | | | | 816,286 | |
NETGEAR, Inc.(a)(b) | | | 2,029 | | | | 116,059 | |
Palo Alto Networks, Inc.(a) | | | 1,950 | | | | 353,964 | |
| | | | | | | | |
| | | | | | | 1,623,768 | |
| Construction & Engineering — 0.1% | | | | | | |
Comfort Systems U.S.A., Inc. | | | 9,862 | | | | 406,807 | |
EMCOR Group, Inc. | | | 1,164 | | | | 90,711 | |
| | | | | | | | |
| | | | | | | 497,518 | |
| Consumer Finance — 0.8% | | | | | | |
Green Dot Corp., Class A(a) | | | 64,979 | | | | 4,169,053 | |
| | | | | | | | |
| Containers & Packaging — 0.8% | | | | | | |
Crown Holdings, Inc.(a) | | | 75,650 | | | | 3,839,237 | |
| | | | | | | | |
| Diversified Consumer Services — 0.3% | | | | | | |
H&R Block, Inc. | | | 30,878 | | | | 784,610 | |
Sotheby’s(a) | | | 11,666 | | | | 598,582 | |
| | | | | | | | |
| | | | | | | 1,383,192 | |
| Diversified Financial Services — 0.6% | | | | | | |
Berkshire Hathaway, Inc., Class B(a) | | | 16,182 | | | | 3,227,985 | |
| | | | | | | | |
| Diversified Telecommunication Services — 1.3% | |
AT&T Inc. | | | 128,250 | | | | 4,572,112 | |
Cogent Communications Holdings, Inc. | | | 4,107 | | | | 178,244 | |
Verizon Communications, Inc. | | | 33,724 | | | | 1,612,682 | |
| | | | | | | | |
| | | | | | | 6,363,038 | |
| Electric Utilities — 1.3% | | | | | | |
IDACORP, Inc. | | | 63,836 | | | | 5,634,804 | |
Portland General Electric Co. | | | 16,160 | | | | 654,642 | |
PPL Corp. | | | 13,964 | | | | 395,042 | |
Westar Energy, Inc. | | | 2,070 | | | | 108,861 | |
| | | | | | | | |
| | | | | | | 6,793,349 | |
| Electronic Equipment, Instruments & Components — 1.6% | |
Fitbit, Inc., Class A(a) | | | 211,945 | | | | 1,080,919 | |
Flex Ltd.(a) | | | 204,375 | | | | 3,337,444 | |
OSI Systems, Inc.(a) | | | 5,023 | | | | 327,851 | |
SYNNEX Corp. | | | 35,186 | | | | 3,529,859 | |
| | | | | | | | |
| | | | | | | 8,276,073 | |
| Energy Equipment & Services — 0.9% | | | | | | |
Halliburton Co. | | | 61,110 | | | | 2,868,503 | |
ProPetro Holding Corp.(a)(b) | | | 90,771 | | | | 1,442,351 | |
| | | | | | | | |
| | | | | | | 4,310,854 | |
| Equity Real Estate Investment Trusts (REITs) — 3.9% | |
Alexandria Real Estate Equities, Inc. | | | 27,353 | | | | 3,416,116 | |
EastGroup Properties, Inc. | | | 30,922 | | | | 2,556,013 | |
First Industrial Realty Trust, Inc. | | | 188,908 | | | | 5,521,781 | |
Ryman Hospitality Properties, Inc. | | | 24,709 | | | | 1,913,712 | |
| | | | |
| SCHEDULE OF INVESTMENTS | | | 21 | |
| | |
Schedule of Investments (continued) March 31, 2018 | | Master Advantage U.S. Total Market LLC (Percentages shown are based on Net Assets) |
| | | | | | | | |
| Security | | Shares | | | Value | |
| Equity Real Estate Investment Trusts (REITs) (continued) | |
Simon Property Group, Inc. | | | 40,802 | | | $ | 6,297,789 | |
| | | | | | | | |
| | | | | | | 19,705,411 | |
| Food & Staples Retailing — 1.8% | | | | | | |
Kroger Co. | | | 17,390 | | | | 416,317 | |
Performance Food Group Co.(a) | | | 110,158 | | | | 3,288,216 | |
SUPERVALU, Inc.(a) | | | 1 | | | | 15 | |
Walmart, Inc. | | | 60,654 | | | | 5,396,386 | |
| | | | | | | | |
| | | | | | | 9,100,934 | |
| Food Products — 1.7% | | | | | | |
Hershey Co. | | | 9,191 | | | | 909,541 | |
Kellogg Co. | | | 61,900 | | | | 4,024,119 | |
McCormick & Co., Inc., Non-Voting Shares | | | 2,916 | | | | 310,233 | |
Tyson Foods, Inc., Class A | | | 45,554 | | | | 3,334,097 | |
| | | | | | | | |
| | | | | | | 8,577,990 | |
| Gas Utilities — 0.3% | | | | | | |
Southwest Gas Holdings, Inc. | | | 13,134 | | | | 888,252 | |
UGI Corp. | | | 15,930 | | | | 707,611 | |
| | | | | | | | |
| | | | | | | 1,595,863 | |
| Health Care Equipment & Supplies — 2.3% | | | | | | |
Danaher Corp. | | | 67,868 | | | | 6,644,956 | |
Edwards Lifesciences Corp.(a) | | | 5,596 | | | | 780,754 | |
Masimo Corp.(a) | | | 17,958 | | | | 1,579,406 | |
Medtronic PLC | | | 32,630 | | | | 2,617,579 | |
| | | | | | | | |
| | | | | | | 11,622,695 | |
| Health Care Providers & Services — 2.7% | | | | | | |
Aetna, Inc. | | | 5,142 | | | | 868,998 | |
AmerisourceBergen Corp. | | | 2,986 | | | | 257,423 | |
Express Scripts Holding Co.(a) | | | 2,283 | | | | 157,710 | |
Humana, Inc. | | | 4,500 | | | | 1,209,735 | |
McKesson Corp. | | | 3,947 | | | | 556,014 | |
Quest Diagnostics, Inc. | | | 22,967 | | | | 2,303,590 | |
UnitedHealth Group, Inc. | | | 12,954 | | | | 2,772,156 | |
WellCare Health Plans, Inc.(a) | | | 28,737 | | | | 5,564,345 | |
| | | | | | | | |
| | | | | | | 13,689,971 | |
| Health Care Technology — 0.3% | | | | | | |
Veeva Systems, Inc., Class A(a) | | | 20,145 | | | | 1,470,988 | |
| | | | | | | | |
| Hotels, Restaurants & Leisure — 3.4% | | | | | | |
Carnival Corp. | | | 92,051 | | | | 6,036,705 | |
Extended Stay America, Inc. | | | 5,152 | | | | 101,855 | |
McDonald’s Corp. | | | 45,997 | | | | 7,193,011 | |
Texas Roadhouse, Inc. | | | 65,876 | | | | 3,806,315 | |
| | | | | | | | |
| | | | | | | 17,137,886 | |
| Household Durables — 0.8% | | | | | | |
iRobot Corp.(a) | | | 7,964 | | | | 511,209 | |
MDC Holdings, Inc. | | | 50,195 | | | | 1,401,444 | |
Taylor Morrison Home Corp., Class A(a) | | | 56,249 | | | | 1,309,477 | |
Whirlpool Corp. | | | 4,408 | | | | 674,909 | |
| | | | | | | | |
| | | | | | | 3,897,039 | |
| Household Products — 0.5% | | | | | | |
Colgate-Palmolive Co. | | | 38,254 | | | | 2,742,047 | |
| | | | | | | | |
| Industrial Conglomerates — 1.6% | | | | | | |
3M Co. | | | 35,079 | | | | 7,700,542 | |
General Electric Co. | | | 13,418 | | | | 180,875 | |
Honeywell International, Inc. | | | 2,741 | | | | 396,102 | |
| | | | | | | | |
| | | | | | | 8,277,519 | |
| Insurance — 2.5% | | | | | | |
Allstate Corp. | | | 44,149 | | | | 4,185,325 | |
Athene Holding Ltd., Class A(a) | | | 44,585 | | | | 2,131,609 | |
Employers Holdings, Inc. | | | 51,752 | | | | 2,093,368 | |
First American Financial Corp. | | | 2,067 | | | | 121,292 | |
| | | | | | | | |
| Security | | Shares | | | Value | |
| Insurance (continued) | | | | | | |
Hartford Financial Services Group, Inc. | | | 80,090 | | | $ | 4,126,237 | |
Reinsurance Group of America, Inc. | | | 1,219 | | | | 187,726 | |
| | | | | | | | |
| | | | | | | 12,845,557 | |
| Internet & Direct Marketing Retail — 2.3% | | | | | | |
Amazon.com, Inc.(a) | | | 6,498 | | | | 9,404,815 | |
Booking Holdings, Inc.(a) | | | 183 | | | | 380,711 | |
Netflix, Inc.(a) | | | 7,059 | | | | 2,084,876 | |
| | | | | | | | |
| | | | | | | 11,870,402 | |
| Internet Software & Services — 3.8% | | | | | | |
Alphabet, Inc., Class A(a) | | | 4,181 | | | | 4,336,282 | |
Alphabet, Inc., Class C(a) | | | 589 | | | | 607,724 | |
Etsy, Inc.(a) | | | 10,439 | | | | 292,918 | |
Facebook, Inc., Class A(a) | | | 66,001 | | | | 10,546,300 | |
New Relic, Inc.(a) | | | 14,152 | | | | 1,048,946 | |
Nutanix, Inc., Class A(a) | | | 2,760 | | | | 135,544 | |
Okta, Inc.(a) | | | 7,277 | | | | 289,988 | |
Twilio, Inc., Class A(a)(b) | | | 10,554 | | | | 402,952 | |
Twitter, Inc.(a) | | | 17,794 | | | | 516,204 | |
Yelp, Inc.(a) | | | 22,358 | | | | 933,447 | |
| | | | | | | | |
| | | | | | | 19,110,305 | |
| IT Services — 5.5% | | | | | | |
Accenture PLC, Class A | | | 20,612 | | | | 3,163,942 | |
EPAM Systems, Inc.(a) | | | 29,845 | | | | 3,417,849 | |
Euronet Worldwide, Inc.(a) | | | 30,172 | | | | 2,381,174 | |
First Data Corp., Class A(a) | | | 67,705 | | | | 1,083,280 | |
International Business Machines Corp. | | | 25,692 | | | | 3,941,924 | |
Mastercard, Inc., Class A | | | 48,438 | | | | 8,484,400 | |
Square, Inc., Class A(a) | | | 1,781 | | | | 87,625 | |
Visa, Inc., Class A | | | 46,332 | | | | 5,542,234 | |
| | | | | | | | |
| | | | | | | 28,102,428 | |
| Life Sciences Tools & Services — 0.2% | | | | | | |
Agilent Technologies, Inc. | | | 14,045 | | | | 939,610 | |
| | | | | | | | |
| Machinery — 4.0% | | | | | | |
Alamo Group, Inc. | | | 3,790 | | | | 416,521 | |
Cummins, Inc. | | | 3,085 | | | | 500,048 | |
Illinois Tool Works, Inc. | | | 39,512 | | | | 6,189,950 | |
Ingersoll-Rand PLC | | | 23,991 | | | | 2,051,470 | |
PACCAR, Inc. | | | 76,933 | | | | 5,090,657 | |
Rexnord Corp.(a) | | | 130,732 | | | | 3,880,126 | |
Watts Water Technologies, Inc., Class A | | | 4,468 | | | | 347,164 | |
Xylem, Inc. | | | 24,725 | | | | 1,901,847 | |
| | | | | | | | |
| | | | | | | 20,377,783 | |
| Media — 3.0% | | | | | | |
Comcast Corp., Class A | | | 139,206 | | | | 4,756,669 | |
Entravision Communications Corp., Class A | | | 20,640 | | | | 97,008 | |
Interpublic Group of Cos., Inc. | | | 13,696 | | | | 315,419 | |
John Wiley & Sons, Inc., Class A | | | 13,420 | | | | 854,854 | |
Lions Gate Entertainment Corp., Class A | | | 3,480 | | | | 89,888 | |
Time Warner, Inc. | | | 14,433 | | | | 1,365,073 | |
Tribune Media Co., Class A | | | 1,504 | | | | 60,927 | |
Walt Disney Co. | | | 60,745 | | | | 6,101,228 | |
World Wrestling Entertainment, Inc., Class A | | | 37,486 | | | | 1,349,871 | |
| | | | | | | | |
| | | | | | | 14,990,937 | |
| Metals & Mining — 1.0% | | | | | | |
Newmont Mining Corp. | | | 105,393 | | | | 4,117,705 | |
Worthington Industries, Inc. | | | 19,348 | | | | 830,416 | |
| | | | | | | | |
| | | | | | | 4,948,121 | |
| Mortgage Real Estate Investment Trusts (REITs) — 0.2% | |
Invesco Mortgage Capital, Inc. | | | 59,647 | | | | 977,018 | |
| | | | | | | | |
| Multiline Retail — 0.6% | | | | | | |
Kohl’s Corp. | | | 1,848 | | | | 121,062 | |
| | |
| 22 | | 2018 BLACKROCK ANNUAL REPORTTO SHAREHOLDERS |
| | |
Schedule of Investments (continued) March 31, 2018 | | Master Advantage U.S. Total Market LLC (Percentages shown are based on Net Assets) |
| | | | | | | | |
| Security | | Shares | | | Value | |
| Multiline Retail (continued) | | | | | | |
Target Corp. | | | 40,825 | | | $ | 2,834,480 | |
| | | | | | | | |
| | | | | | | 2,955,542 | |
| Multi-Utilities — 0.7% | | | | | | |
Avista Corp. | | | 1,200 | | | | 61,500 | |
CMS Energy Corp. | | | 62,424 | | | | 2,827,183 | |
NorthWestern Corp. | | | 13,942 | | | | 750,080 | |
| | | | | | | | |
| | | | | | | 3,638,763 | |
| Oil, Gas & Consumable Fuels — 4.0% | | | | | | |
Chevron Corp. | | | 3,413 | | | | 389,219 | |
ConocoPhillips | | | 114,436 | | | | 6,784,910 | |
CONSOL Energy, Inc.(a) | | | 13,918 | | | | 403,204 | |
CVR Energy, Inc. | | | 13,655 | | | | 412,654 | |
Exxon Mobil Corp. | | | 13,570 | | | | 1,012,458 | |
Marathon Oil Corp. | | | 5,050 | | | | 81,457 | |
Marathon Petroleum Corp. | | | 18,888 | | | | 1,380,902 | |
Matador Resources Co.(a) | | | 9,072 | | | | 271,344 | |
Occidental Petroleum Corp. | | | 75,077 | | | | 4,877,002 | |
ONEOK, Inc. | | | 5,546 | | | | 315,678 | |
Peabody Energy Corp. | | | 67,182 | | | | 2,452,143 | |
Whiting Petroleum Corp.(a) | | | 1,903 | | | | 64,398 | |
Williams Cos., Inc. | | | 81,886 | | | | 2,035,686 | |
| | | | | | | | |
| | | | | | | 20,481,055 | |
| Personal Products — 1.2% | | | | | | |
Estee Lauder Cos., Inc., Class A | | | 41,163 | | | | 6,162,924 | |
Herbalife Ltd.(a) | | | 1,317 | | | | 128,368 | |
| | | | | | | | |
| | | | | | | 6,291,292 | |
| Pharmaceuticals — 4.8% | | | | | | |
Bristol-Myers Squibb Co. | | | 64,969 | | | | 4,109,289 | |
Johnson & Johnson | | | 92,466 | | | | 11,849,518 | |
Merck & Co., Inc. | | | 48,603 | | | | 2,647,405 | |
Zoetis, Inc. | | | 70,349 | | | | 5,874,845 | |
| | | | | | | | |
| | | | | | | 24,481,057 | |
| Professional Services — 0.6% | | | | | | |
ASGN, Inc.(a) | | | 35,797 | | | | 2,931,058 | |
Korn/Ferry International | | | 1,817 | | | | 93,739 | |
WageWorks, Inc.(a) | | | 3,671 | | | | 165,929 | |
| | | | | | | | |
| | | | | | | 3,190,726 | |
| Road & Rail — 1.2% | | | | | | |
Norfolk Southern Corp. | | | 41,203 | | | | 5,594,543 | |
Union Pacific Corp. | | | 4,450 | | | | 598,214 | |
| | | | | | | | |
| | | | | | | 6,192,757 | |
| Semiconductors & Semiconductor Equipment — 4.4% | |
Applied Materials, Inc. | | | 1,030 | | | | 57,278 | |
Broadcom Ltd. | | | 4,350 | | | | 1,025,078 | |
Cirrus Logic, Inc.(a) | | | 44,053 | | | | 1,789,873 | |
Intel Corp. | | | 70,767 | | | | 3,685,545 | |
Maxim Integrated Products, Inc. | | | 71,422 | | | | 4,301,033 | |
Monolithic Power Systems, Inc. | | | 11,692 | | | | 1,353,583 | |
NVIDIA Corp. | | | 7,830 | | | | 1,813,350 | |
Skyworks Solutions, Inc. | | | 12,339 | | | | 1,237,108 | |
Texas Instruments, Inc. | | | 69,885 | | | | 7,260,353 | |
| | | | | | | | |
| | | | | | | 22,523,201 | |
| Software — 4.5% | | | | | | |
Activision Blizzard, Inc. | | | 53,211 | | | | 3,589,614 | |
Adobe Systems, Inc.(a) | | | 22,825 | | | | 4,932,026 | |
Bottomline Technologies, Inc.(a) | | | 11,442 | | | | 443,377 | |
Fair Isaac Corp.(a) | | | 5,193 | | | | 879,538 | |
Microsoft Corp. | | | 80,078 | | | | 7,308,719 | |
Oracle Corp. | | | 7,969 | | | | 364,582 | |
RingCentral, Inc., Class A(a) | | | 19,144 | | | | 1,215,644 | |
SS&C Technologies Holdings, Inc. | | | 8,970 | | | | 481,151 | |
Synopsys, Inc.(a) | | | 2,430 | | | | 202,273 | |
| | | | | | | | |
| Security | | Shares | | | Value | |
| Software (continued) | | | | | | |
Zendesk, Inc.(a) | | | 68,896 | | | $ | 3,298,052 | |
| | | | | | | | |
| | | | | | | 22,714,976 | |
| Specialty Retail — 1.2% | | | | | | |
Five Below, Inc.(a) | | | 10,063 | | | | 738,020 | |
Group 1 Automotive, Inc. | | | 1,176 | | | | 76,840 | |
Lithia Motors, Inc., Class A | | | 11,075 | | | | 1,113,259 | |
Penske Automotive Group, Inc. | | | 46,119 | | | | 2,044,455 | |
Tiffany & Co. | | | 22,678 | | | | 2,214,733 | |
| | | | | | | | |
| | | | | | | 6,187,307 | |
| Technology Hardware, Storage & Peripherals — 3.0% | |
Apple Inc. | | | 84,346 | | | | 14,151,572 | |
Pure Storage, Inc., Class A(a) | | | 64,539 | | | | 1,287,553 | |
| | | | | | | | |
| | | | | | | 15,439,125 | |
| Textiles, Apparel & Luxury Goods — 0.6% | |
NIKE, Inc., Class B | | | 912 | | | | 60,593 | |
Skechers U.S.A., Inc., Class A(a) | | | 59,238 | | | | 2,303,766 | |
Wolverine World Wide, Inc. | | | 15,208 | | | | 439,511 | |
| | | | | | | | |
| | | | | | | 2,803,870 | |
| Thrifts & Mortgage Finance — 1.0% | | | | | | |
Essent Group Ltd.(a) | | | 97,228 | | | | 4,138,024 | |
MGIC Investment Corp.(a) | | | 45,275 | | | | 588,575 | |
TFS Financial Corp. | | | 6,348 | | | | 93,252 | |
| | | | | | | | |
| | | | | | | 4,819,851 | |
| Tobacco — 0.9% | | | | | | |
Altria Group, Inc. | | | 70,540 | | | | 4,396,053 | |
| | | | | | | | |
| Trading Companies & Distributors — 0.2% | |
Applied Industrial Technologies, Inc. | | | 994 | | | | 72,463 | |
Beacon Roofing Supply, Inc.(a) | | | 16,351 | | | | 867,748 | |
Rush Enterprises, Inc., Class A(a) | | | 1,384 | | | | 58,806 | |
| | | | | | | | |
| | | | | | | 999,017 | |
Total Long-Term Investments — 99.0%
(Cost: $507,407,723) | | | | | | | 502,810,555 | |
| | | | | | | | |
| | |
Short-Term Securities — 1.2% | | | | | | | | |
BlackRock Liquidity Funds, T-Fund, Institutional Class, 1.53%(c)(e) | | | 4,539,033 | | | | 4,539,033 | |
SL Liquidity Series, LLC, Money Market Series, 1.85%(c)(d)(e) | | | 1,807,819 | | | | 1,807,638 | |
| | | | | | | | |
Total Short-Term Investments — 1.2%
(Cost: $6,346,671) | | | | 6,346,671 | |
| | | | | | | | |
| |
Total Investments — 100.2%
(Cost: $513,754,394) | | | | 509,157,226 | |
Liabilities in Excess of Other Assets — (0.2)% | | | | (1,141,080 | ) |
| | | | | | | | |
Net Assets — 100.0% | | | $ | 508,016,146 | |
| | | | | |
| | | | |
| SCHEDULE OF INVESTMENTS | | | 23 | |
| | |
Schedule of Investments (continued) March 31, 2018 | | Master Advantage U.S. Total Market LLC |
| (a) | Non-income producing security. |
| (b) | Security, or a portion of the security, is on loan. |
| (c) | Annualized 7-day yield as of period end. |
| (d) | Security was purchased with the cash collateral from loaned securities. |
| (e) | During the year ended March 31, 2018, investments in issuers considered to be affiliates of the Master LLC for purposes of Section 2(a)(3) of the Investment Company Act of 1940, as amended, were as follows: |
| | | | | | | | | | | | | | | | | | | | | | | | | | | | |
| Affiliate | | Shares
Held at
03/31/17 | | | Net
Activity | | | Shares
Held at
03/31/18 | | | Value at
03/31/18 | | | Income | | | Net
Realized
Gain
(Loss)(a) | | | Change in
Unrealized
Appreciation
(Depreciation) | |
BlackRock Liquidity Funds, T-Fund,
Institutional Class | | | 2,461,963 | | | | 2,077,070 | | | | 4,539,033 | | | $ | 4,539,033 | | | $ | 33,528 | | | $ | 28 | | | $ | — | |
SL Liquidity Series, LLC, Money Market Series | | | 41,390,199 | | | | (39,582,380 | ) | | | 1,807,819 | | | | 1,807,638 | | | | 210,063 | (b) | | | (9,148 | ) | | | (3,004 | ) |
| | | | | | | | | | | | | | | | | | | | | | | | | | | | |
| | | | | | | | | | | | | | $ | 6,346,671 | | | $ | 243,591 | | | $ | (9,120 | ) | | $ | (3,004 | ) |
| | | | | | | | | | | | | | | | | | | | | | | | | | | | |
| | (a) | Includes net capital gain distributions, if applicable. | |
| | (b) | Represents securities lending income earned from the reinvestment of cash collateral from loaned securities, net of fees and collateral investment expenses, and other payments to and from borrowers of securities. | |
For Master LLC compliance purposes, the Master LLC’s industry classifications refer to one or more of the industry sub-classifications used by one or more widely recognized market indexes or ratings group indexes, and/or as defined by the investment adviser. These definitions may not apply for purposes of this report, which may combine such industry subclassifications for reporting ease.
Derivative Financial Instruments Outstanding as of Period End
Futures Contracts
| | | | | | | | | | | | | | | | |
| Description | | Number of Contracts | | | Expiration
Date | | | Notional
Amount (000) | | | Value/
Unrealized
Appreciation
(Depreciation) | |
Long Contracts | | | | | | | | | | | | | | | | |
E-Mini S&P 500 Index | | | 43 | | | | 06/15/18 | | | | $5,682 | | | | $(118,599) | |
Derivative Financial Instruments Categorized by Risk Exposure
As of year end, the fair values of derivative financial instruments located in the Statement of Assets and Liabilities were as follows:
| | | | | | | | | | | | | | | | | | | | | | | | | | | | | | | | |
| Liabilities — Derivative Financial Instruments | | | | | Commodity
Contracts | | | Credit
Contracts | | | Equity
Contracts | | | Foreign
Currency
Exchange
Contracts | | | Interest
Rate
Contracts | | | Other
Contracts | | | Total | |
Futures contracts | |
| Net unrealized
depreciation |
(a) | | $ | — | | | $ | — | | | $ | 118,599 | | | $ | — | | | $ | — | | | $ | — | | | $ | 118,599 | |
| | | | | | | | | | | | | | | | | | | | | | | | | | | | | | | | |
| | (a) | Includes cumulative appreciation (depreciation) on futures, if any, as reported in the Schedule of Investments. Only current day’s variation margin is reported within the Statement of Assets and Liabilities. | |
For the year ended March 31, 2018, the effect of derivative financial instruments in the Statement of Operations were as follows:
| | | | | | | | | | | | | | | | | | | | | | | | | | | | |
| Net Realized Gain (Loss) from: | | Commodity
Contracts | | | Credit
Contracts | | | Equity
Contracts | | | Foreign
Currency
Exchange
Contracts | | | Interest
Rate
Contracts | | | Other
Contracts | | | Total | |
Futures contracts | | $ | — | | | $ | — | | | $ | 163,297 | | | $ | — | | | $ | — | | | $ | — | | | $ | 163,297 | |
| | | | | | | | | | | | | | | | | | | | | | | | | | | | |
| | | | | | | | | | | | | | | | | | | | | | | | | | | | | |
Net Change in Unrealized Appreciation (Depreciation) on: | | | | | | | | | | | | | | | | | | | | | | | | | | | | |
Futures contracts | | $ | — | | | $ | — | | | $ | (118,599 | ) | | $ | — | | | $ | — | | | $ | — | | | $ | (118,599 | ) |
| | | | | | | | | | | | | | | | | | | | | | | | | | | | |
Average Quarterly Balances of Outstanding Derivative Financial Instruments
| | | | |
Futures contracts: | | | | |
Average notional value — long | | $ | 2,591,363 | |
For more information about the Master LLC’s investment risks regarding derivative financial instruments, refer to the Notes to Financial Statements.
| | |
| 24 | | 2018 BLACKROCK ANNUAL REPORTTO SHAREHOLDERS |
| | |
Schedule of Investments (continued) March 31, 2018 | | Master Advantage U.S. Total Market LLC |
Fair Value Hierarchy as of Period End
Various inputs are used in determining the fair value of investments and derivative financial instruments. For information about the Master LLC’s policy regarding valuation of investments and derivative financial instruments, refer to the Notes to Financial Statements.
The following tables summarize the Master LLC’s investments categorized in the disclosure hierarchy:
| | | | | | | | | | | | | | | | |
| | | Level 1 | | | Level 2 | | | Level 3 | | | Total | |
Assets: | | | | | | | | | | | | | | | | |
Investments: | | | | | | | | | | | | | | | | |
Long-Term Investments(a): | | | | | | | | | | | | | | | | |
Common Stocks | | $ | 499,280,696 | | | $ | 3,529,859 | | | $ | — | | | $ | 502,810,555 | |
Short-Term Securities | | | 4,539,033 | | | | — | | | | — | | | | 4,539,033 | |
| | | | | | | | | | | | | | | | |
Subtotal | | $ | 503,819,729 | | | $ | 3,529,859 | | | $ | — | | | $ | 507,349,588 | |
| | | | | | | | | | | | | | | | |
Investments Valued at NAV(b) | | | | | | | | | | | | | | | 1,807,638 | |
| | | | | | | | | | | | | | | | |
Total Investments | | | | | | | | | | | | | | $ | 509,157,226 | |
| | | | | | | | | | | | | | | | |
Derivative Financial Instruments(c) | | | | | | | | | | | | | | | | |
Liabilities: | | | | | | | | | | | | | | | | |
Equity contracts | | $ | (118,599 | ) | | $ | — | | | $ | — | | | $ | (118,599 | ) |
| | | | | | | | | | | | | | | | |
| | (a) | See above Schedule of Investments for values in each industry. | |
| | (b) | As of March 31, 2018, certain investments of the Master LLC were fair valued using NAV per share as no quoted market value is available and therefore have been excluded from the fair value hierarchy. | |
| | (c) | Derivative financial instruments are futures contracts, which are valued at the unrealized appreciation (depreciation) on the instrument. | |
During the year ended March 31, 2018, there were no transfers between levels.
See notes to financial statements.
| | | | |
| SCHEDULE OF INVESTMENTS | | | 25 | |
Statement of Assets and Liabilities
March 31, 2018
| | | | |
| | | Master Advantage U.S. Total Market LLC | |
| |
ASSETS | | | | |
Investments at value — unaffiliated (including securities loaned at value of $1,800,362) (cost — $507,407,723) | | $ | 502,810,555 | |
Investments at value — affiliated (cost $6,346,671) | | | 6,346,671 | |
Cash | | | 59,600 | |
Cash pledged for futures contracts | | | 252,000 | |
Receivables: | | | | |
Investments sold | | | 6,497,313 | |
Securities lending income — affiliated | | | 374 | |
Contributions from investors | | | 238,602 | |
Dividends — affiliated | | | 5,798 | |
Dividends — unaffiliated | | | 663,101 | |
Prepaid expenses | | | 1,591 | |
| | | | |
Total assets | | | 516,875,605 | |
| | | | |
| |
LIABILITIES | | | | |
Cash collateral on securities loaned at value | | | 1,807,625 | |
Payables: | | | | |
Investments purchased | | | 5,985,116 | |
Directors’ fees | | | 6,745 | |
Investment advisory fees | | | 225,304 | |
Other accrued expenses | | | 151,922 | |
Other affiliates | | | 3,909 | |
Withdrawals to investors | | | 678,838 | |
| | | | |
Total liabilities | | | 8,859,459 | |
| | | | |
NET ASSETS | | $ | 508,016,146 | |
| | | | |
| |
NET ASSETS CONSIST OF | | | | |
Investor’s capital | | $ | 512,731,931 | |
Net unrealized appreciation (depreciation) | | | (4,715,785 | ) |
| | | | |
NET ASSETS | | $ | 508,016,146 | |
| | | | |
See notes to financial statements.
| | |
| 26 | | 2018 BLACKROCK ANNUAL REPORTTO SHAREHOLDERS |
Statement of Operations
Year Ended March 31, 2018
| | | | |
| | | Master
Advantage U.S.
Total Market LLC | |
| |
INVESTMENT INCOME | | | | |
Dividends — unaffiliated(a) | | $ | 8,544,665 | |
Securities lending income — affiliated — net | | | 210,063 | |
Dividends — affiliated | | | 33,528 | |
Foreign taxes withheld | | | (18,417 | ) |
Interest — unaffiliated | | | 289 | |
| | | | |
Total investment income | | | 8,770,128 | |
| | | | |
| |
EXPENSES | | | | |
Investment advisory | | | 3,062,667 | |
Accounting services | | | 106,348 | |
Custodian | | | 58,830 | |
Professional | | | 75,465 | |
Directors | | | 25,961 | |
Printing | | | 10,096 | |
Miscellaneous | | | 28,104 | |
| | | | |
Total expenses | | | 3,367,471 | |
Less fees waived by the Manager | | | (2,404 | ) |
| | | | |
Total expenses after fees waived | | | 3,365,067 | |
| | | | |
Net investment income | | | 5,405,061 | |
| | | | |
| |
REALIZED AND UNREALIZED GAIN (LOSS) | | | | |
Net realized gain (loss) from: | | | | |
Investments — unaffiliated | | | 154,449,299 | |
Investments — affiliated | | | (9,148 | ) |
Capital gain distributions from investment companies — affiliated | | | 28 | |
Foreign currency transactions | | | 8 | |
Futures contracts | | | 163,297 | |
| | | | |
| | | 154,603,484 | |
| | | | |
Net change in unrealized appreciation (depreciation) on: | | | | |
Investments — unaffiliated | | | (106,163,759 | ) |
Investments — affiliated | | | (3,004 | ) |
Futures contracts | | | (118,599 | ) |
Foreign currency translations | | | 15 | |
| | | | |
| | | (106,285,347 | ) |
| | | | |
Total realized and unrealized gain | | | 48,318,137 | |
| | | | |
NET INCREASE IN NET ASSETS RESULTING FROM OPERATIONS | | $ | 53,723,198 | |
| | | | |
| (a) | Includes non-recurring dividends in the amount of $1,231,868. |
See notes to financial statements.
Statements of Changes in Net Assets
| | | | | | | | |
| | | Master Advantage U.S. Total Market LLC | |
| | | Year Ended March 31, | |
| | | 2018 | | | 2017 | |
| | |
INCREASE (DECREASE) IN NET ASSETS | | | | | | | | |
| | |
OPERATIONS | | | | | | | | |
Net investment income | | $ | 5,405,061 | | | $ | 4,124,187 | |
Net realized gain | | | 154,603,484 | | | | 106,078,054 | |
Net change in unrealized appreciation (depreciation) | | | (106,285,347 | ) | | | 32,927,012 | |
| | | | | | | | |
Net increase in net assets resulting from operations | | | 53,723,198 | | | | 143,129,253 | |
| | | | | | | | |
| | |
CAPITAL TRANSACTIONS | | | | | | | | |
Proceeds from contributions | | | 68,970,062 | | | | 110,386,634 | |
Value of withdrawals | | | (294,312,380 | ) | | | (262,514,012 | ) |
| | | | | | | | |
Net decrease in net assets derived from capital transactions | | | (225,342,318 | ) | | | (152,127,378 | ) |
| | | | | | | | |
| | |
NET ASSETS | | | | | | | | |
Total decrease in net assets | | | (171,619,120 | ) | | | (8,998,125 | ) |
Beginning of year | | | 679,635,266 | | | | 688,633,391 | |
| | | | | | | | |
End of year | | $ | 508,016,146 | | | $ | 679,635,266 | |
| | | | | | | | |
Financial Highlights
| | | | | | | | | | | | | | | | | | | | |
| | | Master Advantage U.S. Total Market LLC | |
| | | Year Ended March 31, | |
| | | 2018 | | | 2017 | | | 2016 | | | 2015 | | | 2014 | |
| | | | | |
TOTAL RETURN | | | | | | | | | | | | | | | | | | | | |
Total return | | | 8.85 | % | | | 23.13 | % | | | (7.59 | )% | | | 5.21 | % | | | 29.39 | % |
| | | | | | | | | | | | | | | | | | | | |
| | | | | |
RATIOS TO AVERAGE NET ASSETS | | | | | | | | | | | | | | | | | | | | |
Total expenses | | | 0.55 | % | | | 0.55 | % | | | 0.55 | % | | | 0.54 | % | | | 0.54 | % |
| | | | | | | | | | | | | | | | | | | | |
Total expenses after fees waived | | | 0.55 | % | | | 0.54 | % | | | 0.55 | % | | | 0.54 | % | | | 0.54 | % |
| | | | | | | | | | | | | | | | | | | | |
Net investment income | | | 0.88 | %(a) | | | 0.59 | %(b) | | | 0.65 | % | | | 0.72 | % | | | 0.72 | % |
| | | | | | | | | | | | | | | | | | | | |
| | | | | |
SUPPLEMENTAL DATA | | | | | | | | | | | | | | | | | | | | |
Net assets, end of year (000) | | $ | 508,016 | | | $ | 679,635 | | | $ | 688,633 | | | $ | 838,982 | | | $ | 1,035,066 | |
| | | | | | | | | | | | | | | | | | | | |
Portfolio turnover rate | | | 147 | % | | | 68 | % | | | 71 | % | | | 55 | % | | | 61 | % |
| | | | | | | | | | | | | | | | | | | | |
| (a) | Ratio of net investment income to average net assets includes 0.20%, resulting from a special dividend. |
| (b) | Ratio of net investment income to average net assets includes 0.08%, resulting from a special dividend. |
See notes to financial statements.
| | |
| 28 | | 2018 BLACKROCK ANNUAL REPORTTO SHAREHOLDERS |
| | |
| Notes to Financial Statements | | Master Advantage U.S. Total Market LLC |
Master Advantage U.S. Total Market LLC (formerly known as Master Value Opportunities LLC) (the “Master LLC”) is registered under the Investment Company Act of 1940, as amended (the “1940 Act”). The Master LLC is registered as a diversified, open-end management investment company. The Master LLC is organized as a Delaware limited liability company. The Limited Liability Company Agreement of the Master LLC permits the Board of Directors of the Master LLC (the “Board”) to issue non-transferable interests in the Master LLC, subject to certain limitations.
The Master LLC, together with certain other registered investment companies advised by BlackRock Advisors, LLC (the “Manager”) or its affiliates, is included in a complex of open-end funds referred to as the Equity-Bond Complex.
| 2. | SIGNIFICANT ACCOUNTING POLICIES |
The financial statements are prepared in conformity with accounting principles generally accepted in the United States of America (“U.S. GAAP”), which may require management to make estimates and assumptions that affect the reported amounts of assets and liabilities in the financial statements, disclosure of contingent assets and liabilities at the date of the financial statements and the reported amounts of increases and decreases in net assets from operations during the reporting period. Actual results could differ from those estimates. The Master LLC is considered an investment company under U.S. GAAP and follows the accounting and reporting guidance applicable to investment companies. Below is a summary of significant accounting policies:
Investment Transactions and Income Recognition: For financial reporting purposes, investment transactions are recorded on the dates the transactions are entered into (the “trade dates”). Realized gains and losses on investment transactions are determined on the identified cost basis. Dividend income is recorded on the ex-dividend date. Dividends from foreign securities where the ex-dividend date may have passed are subsequently recorded when the Master LLC is informed of the ex-dividend date. Under the applicable foreign tax laws, a withholding tax at various rates may be imposed on capital gains, dividends and interest. Upon notification from issuers, a portion of the dividend income received from a real estate investment trust may be redesignated as a reduction of cost of the related investment and/or realized gain.
Foreign Currency Translation: The Master LLC’s books and records are maintained in U.S. dollars. Securities and other assets and liabilities denominated in foreign currencies are translated into U.S. dollars using exchange rates determined as of the close of trading on the New York Stock Exchange (“NYSE”). Purchases and sales of investments are recorded at the rates of exchange prevailing on the respective dates of such transactions. Generally, when the U.S. dollar rises in value against a foreign currency, the investments denominated in that currency will lose value; the opposite effect occurs if the U.S. dollar falls in relative value.
The Master LLC does not isolate the portion of the results of operations arising as a result of changes in the exchange rates from the changes in the market prices of investments held or sold for financial reporting purposes. Accordingly, the effects of changes in exchange rates on investments are not segregated in the Statement of Operations from the effects of changes in market prices of those investments, but are included as a component of net realized and unrealized gain (loss) from investments. The Master LLC reports realized currency gains (losses) on foreign currency related transactions as components of net realized gain (loss) for financial reporting purposes, whereas such components are generally treated as ordinary income for U.S. federal income tax purposes.
Indemnifications: In the normal course of business, the Master LLC enters into contracts that contain a variety of representations that provide general indemnification. The Master LLC’s maximum exposure under these arrangements is unknown because it involves future potential claims against the Master LLC, which cannot be predicted with any certainty.
Other: Expenses directly related to the Master LLC are charged to the Master LLC. Other operating expenses shared by several funds, including other funds managed by the Manager, are prorated among those funds on the basis of relative net assets or other appropriate methods.
The Master LLC has an arrangement with its custodian whereby credits are earned on uninvested cash balances, which could be used to reduce custody fees and/or overdraft charges. The Master LLC may incur charges on certain uninvested cash balances and overdrafts, subject to certain conditions.
| 3. | INVESTMENT VALUATION AND FAIR VALUE MEASUREMENTS |
Investment Valuation Policies: The Master LLC’s investments are valued at fair value (also referred to as “market value” within the financial statements) as of the close of trading on the NYSE (generally 4:00 p.m., Eastern time). U.S. GAAP defines fair value as the price the Master LLC would receive to sell an asset or pay to transfer a liability in an orderly transaction between market participants at the measurement date. The Master LLC determines the fair values of its financial instruments using various independent dealers or pricing services under policies approved by the Board. The BlackRock Global Valuation Methodologies Committee (the “Global Valuation Committee”) is the committee formed by management to develop global pricing policies and procedures and to oversee the pricing function for all financial instruments.
Fair Value Inputs and Methodologies: The following methods and inputs are used to establish the fair value of the Master LLC’s assets and liabilities:
| | • | | Equity investments traded on a recognized securities exchange are valued at the official closing price each day, if available. For equity investments traded on more than one exchange, the official closing price on the exchange where the stock is primarily traded is used. Equity investments traded on a recognized exchange for which there were no sales on that day may be valued at the last available bid (long positions) or ask (short positions) price. |
Generally, trading in foreign instruments is substantially completed each day at various times prior to the close of trading on the NYSE. Occasionally, events affecting the values of such instruments may occur between the foreign market close and the close of trading on the NYSE that may not be reflected in the computation of the Master LLC’s net assets. Each business day, the Master LLC uses a pricing service to assist with the valuation of certain foreign exchange-traded equity securities and foreign exchange-traded and over-the-counter (“OTC”) options (the “Systematic Fair Value Price”). Using current market factors, the Systematic Fair Value Price is designed to value such foreign securities and foreign options at fair value as of the close of trading on the NYSE, which follows the close of the local markets.
| | • | | Investments in open-end U.S. mutual funds are valued at net asset value (“NAV”) each business day. |
| | | | |
| NOTESTO FINANCIAL STATEMENTS | | | 29 | |
| | |
| Notes to Financial Statements (continued) | | Master Advantage U.S. Total Market LLC |
| | • | | The Master LLC values its investment in SL Liquidity Series, LLC, Money Market Series (the “Money Market Series”) at fair value, which is ordinarily based upon its pro rata ownership in the underlying fund’s net assets. The Money Market Series seeks current income consistent with maintaining liquidity and preserving capital. Although the Money Market Series is not registered under the 1940 Act, its investments may follow the parameters of investments by a money market fund that is subject to Rule 2a-7 under the 1940 Act. |
| | • | | Futures contracts traded on exchanges are valued at their last sale price. |
If events (e.g., a company announcement, market volatility or a natural disaster) occur that are expected to materially affect the value of such investments, or in the event that the application of these methods of valuation results in a price for an investment that is deemed not to be representative of the market value of such investment, or if a price is not available, the investment will be valued by the Global Valuation Committee, or its delegate, in accordance with a policy approved by the Board as reflecting fair value (“Fair Valued Investments”). The fair valuation approaches that may be used by the Global Valuation Committee will include market approach, income approach and cost approach. Valuation techniques such as discounted cash flow, use of market comparables and matrix pricing are types of valuation approaches and are typically used in determining fair value. When determining the price for Fair Valued Investments, the Global Valuation Committee, or its delegate, seeks to determine the price that the Master LLC might reasonably expect to receive or pay from the current sale or purchase of that asset or liability in an arm’s-length transaction. Fair value determinations shall be based upon all available factors that the Global Valuation Committee, or its delegate, deems relevant and consistent with the principles of fair value measurement. The pricing of all Fair Valued Investments is subsequently reported to the Board or a committee thereof on a quarterly basis.
Fair Value Hierarchy: Various inputs are used in determining the fair value of investments and derivative financial instruments. These inputs to valuation techniques are categorized into a fair value hierarchy consisting of three broad levels for financial statement purposes as follows:
| | • | | Level 1 — Unadjusted price quotations in active markets/exchanges for identical assets or liabilities that the Master LLC has the ability to access |
| | • | | Level 2 — Other observable inputs (including, but not limited to, quoted prices for similar assets or liabilities in markets that are active, quoted prices for identical or similar assets or liabilities in markets that are not active, inputs other than quoted prices that are observable for the assets or liabilities (such as interest rates, yield curves, volatilities, prepayment speeds, loss severities, credit risks and default rates) or other market-corroborated inputs) |
| | • | | Level 3 — Unobservable inputs based on the best information available in the circumstances, to the extent observable inputs are not available (including the Master LLC’s own assumptions used in determining the fair value of investments and derivative financial instruments) |
The hierarchy gives the highest priority to unadjusted quoted prices in active markets for identical assets or liabilities (Level 1 measurements) and the lowest priority to unobservable inputs (Level 3 measurements). Accordingly, the degree of judgment exercised in determining fair value is greatest for instruments categorized in Level 3. The inputs used to measure fair value may fall into different levels of the fair value hierarchy. In such cases, for disclosure purposes, the fair value hierarchy classification is determined based on the lowest level input that is significant to the fair value measurement in its entirety. Investments classified within Level 3 have significant unobservable inputs used by the Global Valuation Committee in determining the price for Fair Valued Investments. Level 3 investments include equity or debt issued by privately held companies or funds. There may not be a secondary market, and/or there are a limited number of investors. Level 3 investments may also be adjusted to reflect illiquidity and/or non-transferability, with the amount of such discount estimated by the Global Valuation Committee in the absence of market information.
Changes in valuation techniques may result in transfers into or out of an assigned level within the hierarchy. In accordance with the Master LLC’s policy, transfers between different levels of the fair value hierarchy are deemed to have occurred as of the beginning of the reporting period. The categorization of a value determined for investments and derivative financial instruments is based on the pricing transparency of the investments and derivative financial instruments and is not necessarily an indication of the risks associated with investing in those securities.
| 4. | SECURITIES AND OTHER INVESTMENTS |
Warrants: Warrants entitle a fund to purchase a specified number of shares of common stock and are non-income producing. The purchase price and number of shares are subject to adjustment under certain conditions until the expiration date of the warrants, if any. If the price of the underlying stock does not rise above the strike price before the warrant expires, the warrant generally expires without any value and a fund will lose any amount it paid for the warrant. Thus, investments in warrants may involve more risk than investments in common stock. Warrants may trade in the same markets as their underlying stock; however, the price of the warrant does not necessarily move with the price of the underlying stock.
Securities Lending: The Master LLC may lend its securities to approved borrowers, such as brokers, dealers and other financial institutions. The borrower pledges and maintains with the Master LLC collateral consisting of cash, an irrevocable letter of credit issued by a bank, or securities issued or guaranteed by the U.S. Government. The initial collateral received by the Master LLC is required to have a value of at least 102% of the current value of the loaned securities for securities traded on U.S. exchanges and a value of at least 105% for all other securities. The collateral is maintained thereafter at a value equal to at least 100% of the current market value of the securities on loan. The market value of the loaned securities is determined at the close of each business day of the Master LLC and any additional required collateral is delivered to the Master LLC, or excess collateral returned by the Master LLC, on the next business day. During the term of the loan, the Master LLC is entitled to all distributions made on or in respect of the loaned securities, but does not receive interest income on securities received as collateral. Loans of securities are terminable at any time and the borrower, after notice, is required to return borrowed securities within the standard time period for settlement of securities transactions.
The market value of any securities on loan, all of which were classified as common stocks in the Master LLC’s Schedule of Investments, and the value of any related collateral are shown separately in the Statement of Assets and Liabilities as a component of investments at value — unaffiliated, and collateral on securities loaned at value, respectively. As of period end, any securities on loan were collateralized by cash and/or U.S. Government obligations. Cash collateral invested by the securities lending agent, BlackRock Investment Management, LLC (“BIM”), if any, is disclosed in the Schedule of Investments.
Securities lending transactions are entered into by the Master LLC under Master Securities Lending Agreements (each, an “MSLA”), which provide the right, in the event of default (including bankruptcy or insolvency), for the non-defaulting party to liquidate the collateral and calculate a net exposure to the defaulting party or request additional collateral. In the event that a borrower defaults, the Master LLC, as lender, would offset the market value of the collateral received against the market value of the securities
| | |
| 30 | | 2018 BLACKROCK ANNUAL REPORTTO SHAREHOLDERS |
| | |
Notes to Financial Statements (continued) | | Master Advantage U.S. Total Market LLC |
loaned. When the value of the collateral is greater than that of the market value of the securities loaned, the lender is left with a net amount payable to the defaulting party. However, bankruptcy or insolvency laws of a particular jurisdiction may impose restrictions on or prohibitions against such a right of offset in the event of an MSLA counterparty’s bankruptcy or insolvency. Under the MSLA, absent an event of default, the borrower can resell or re-pledge the loaned securities, and the Master LLC can reinvest cash collateral received in connection with loaned securities. Upon an event of default, the parties’ obligations to return the securities or collateral to the other party are extinguished, and the parties can resell or re-pledge the loaned securities or the collateral received in connection with the loaned securities in order to satisfy the defaulting party’s net payment obligation for all transactions under the MSLA. The defaulting party remains liable for any deficiency.
As of period end, the following table is a summary of the Master LLC’s securities lending agreements by counterparty which are subject to offset under an MSLA:
| | | | | | | | | | | | |
| Counterparty | | Securities
Loaned
at Value | | | Cash
Collateral
Received(a) | | | Net Amount | |
Citigroup Global Markets, Inc. | | $ | 62,577 | | | $ | (62,577) | | | $ | — | |
Goldman Sachs & Co. | | | 866,847 | | | | (866,847) | | | | — | |
JP Morgan Securities LLC | | | 870,938 | | | | (870,938) | | | | — | |
| | | | | | | | | | | | |
| | $ | 1,800,362 | | | $ | (1,800,362) | | | $ | — | |
| | | | | | | | | | | | |
| | (a) | Cash collateral with a value of $1,807,625 has been received in connection with securities lending agreements. Collateral received in excess of the value of securities loaned from the individual counterparty is not shown for financial reporting purposes in the above table. | |
The risks of securities lending include the risk that the borrower may not provide additional collateral when required or may not return the securities when due. To mitigate these risks, the Master LLC benefits from a borrower default indemnity provided by BIM. BIM’s indemnity allows for full replacement of the securities loaned if the collateral received does not cover the value on the securities loaned in the event of borrower default. The Master LLC could incur a loss if the value of an investment purchased with cash collateral falls below the market value of loaned securities or if the value of an investment purchased with cash collateral falls below the value of the original cash collateral received.
| 5. | DERIVATIVE FINANCIAL INSTRUMENTS |
The Master LLC engages in various portfolio investment strategies using derivative contracts both to increase the returns of the Master LLC and/or to manage its exposure to certain risks such as credit risk, equity risk, interest rate risk, foreign currency exchange rate risk, commodity price risk or other risks (e.g., inflation risk). Derivative financial instruments categorized by risk exposure are included in the Schedule of Investments. These contracts may be transacted on an exchange or OTC.
Futures Contracts: Futures contracts are purchased or sold to gain exposure to, or manage exposure to, changes in interest rates (interest rate risk), changes in the value of equity securities (equity risk) or foreign currencies (foreign currency exchange rate risk).
Futures contracts are agreements between the Master LLC and a counterparty to buy or sell a specific quantity of an underlying instrument at a specified price and on a specified date. Depending on the terms of a contract, it is settled either through physical delivery of the underlying instrument on the settlement date or by payment of a cash amount on the settlement date. Upon entering into a futures contract, the Master LLC is required to deposit initial margin with the broker in the form of cash or securities in an amount that varies depending on a contract’s size and risk profile. The initial margin deposit must then be maintained at an established level over the life of the contract.
Securities deposited as initial margin are designated in the Schedule of Investments and cash deposited, if any, is shown as cash pledged for futures contracts in the Statement of Assets and Liabilities. Pursuant to the contract, the Master LLC agrees to receive from or pay to the broker an amount of cash equal to the daily fluctuation in market value of the contract (“variation margin”). Variation margin is recorded as unrealized appreciation (depreciation) and, if any, shown as variation margin receivable (or payable) on futures contracts in the Statement of Assets and Liabilities. When the contract is closed, a realized gain or loss is recorded in the Statement of Operations equal to the difference between the notional amount of the contract at the time it was opened and the notional amount at the time it was closed. The use of futures contracts involves the risk of an imperfect correlation in the movements in the price of futures contracts and interest, foreign currency exchange rates or underlying assets.
Collateral Requirements: For derivatives traded under an International Swaps and Derivatives Association, Inc. Master Agreement (“ISDA Master Agreement”), the collateral requirements are typically calculated by netting the mark-to-market amount for each transaction under such agreement and comparing that amount to the value of any collateral currently pledged by the Master LLC and the counterparty.
Cash collateral that has been pledged to cover obligations of the Master LLC and cash collateral received from the counterparty, if any, is reported separately on the Statement of Assets and Liabilities as cash pledged as collateral and cash received as collateral, respectively. Non-cash collateral pledged by the Master LLC, if any, is noted in the Schedule of Investments. Generally, the amount of collateral due from or to a counterparty is subject to a certain minimum transfer amount threshold before a transfer is required, which is determined at the close of business of the Master LLC. Any additional required collateral is delivered to/pledged by the Master LLC on the next business day. Typically, the counterparty is not permitted to sell, re-pledge or use cash and non-cash collateral it receives. The Master LLC generally agrees not to use non-cash collateral that it receives but may, absent default or certain other circumstances defined in the underlying ISDA Master Agreement, be permitted to use cash collateral received. In such cases, interest may be paid pursuant to the collateral arrangement with the counterparty. To the extent amounts due to the Master LLC from its counterparties are not fully collateralized, it bears the risk of loss from counterparty non-performance. Likewise, to the extent the Master LLC has delivered collateral to a counterparty and stands ready to perform under the terms of its agreement with such counterparty, it bears the risk of loss from a counterparty in the amount of the value of the collateral in the event the counterparty fails to return such collateral. Based on the terms of agreements, collateral may not be required for all derivative contracts.
For financial reporting purposes, the Master LLC does not offset derivative assets and derivative liabilities that are subject to netting arrangements, if any, in the Statement of Assets and Liabilities.
| | | | |
| NOTESTO FINANCIAL STATEMENTS | | | 31 | |
| | |
Notes to Financial Statements (continued) | | Master Advantage U.S. Total Market LLC |
| 6. | INVESTMENT ADVISORY AGREEMENT AND OTHER TRANSACTIONS WITH AFFILIATES |
The PNC Financial Services Group, Inc. is the largest stockholder and an affiliate of BlackRock, Inc. (“BlackRock”) for 1940 Act purposes.
Investment Advisory: The Master LLC entered into an Investment Advisory Agreement with the Manager, the Master LLC’s investment adviser, an indirect, wholly-owned subsidiary of BlackRock, to provide investment advisory and administrative services. The Manager is responsible for the management of the Master LLC’s portfolio and provides the personnel, facilities, equipment and certain other services necessary to the operations of the Master LLC.
For such services, the Master LLC pays the Manager a monthly fee at an annual rate equal to the following percentages of the average daily value of the Master LLC’s net assets:
| | | | |
| Average Daily Net Assets | | Investment
Advisory Fee | |
First $1 Billion | | | 0.500 | % |
$1 Billion — $1.5 Billion | | | 0.475 | |
Greater than $1.5 Billion | | | 0.450 | |
Expense Waivers and Reimbursements: With respect to the Master LLC, the Manager voluntarily agreed to waive its investment advisory fees by the amount of investment advisory fees the Master LLC pays to the Manager indirectly through its investment in affiliated money market funds (the “affiliated money market fund waiver”). This amount is included in fees waived and/or reimbursed by the Manager in the Statement of Operations. However, the Manager does not waive its investment advisory fees by the amount of investment advisory fees paid in connection with the Master LLC’s investments in other affiliated investment companies, if any. For the year ended March 31, 2018, the amount waived was $2,404.
The Manager has contractually agreed to waive its investment advisory fee with respect to any portion of the Master LLC’s assets invested in affiliated equity and fixed-income mutual funds and affiliated exchange-traded funds that have a contractual management fee through July 31, 2019. The contractual agreement may be terminated upon 90 days’ notice by a majority of the independent directors who are not “interested persons” of the Master LLC, as defined in the 1940 Act (“Independent Directors”), or by a vote of a majority of the outstanding voting securities of the Master LLC. For the year ended March 31, 2018, there were no fees waived by the Manager.
For the year ended March 31, 2018, the Master LLC reimbursed the Manager $7,148 for certain accounting services, which is included in accounting services in the Statement of Operations.
Securities Lending: The U.S. Securities and Exchange Commission (“SEC”) has issued an exemptive order which permits BIM, an affiliate of the Manager, to serve as securities lending agent for the Master LLC, subject to applicable conditions. As securities lending agent, BIM bears all operational costs directly related to securities lending. The Master LLC is responsible for expenses in connection with the investment of cash collateral received for securities on loan (the “collateral investment expenses”). The cash collateral is invested in a private investment company managed by the Manager or its affiliates. However, BIM has agreed to cap the collateral investment expenses of the private investment company to an annual rate of 0.04%. The investment adviser to the private investment company will not charge any advisory fees with respect to shares purchased by the Master LLC. The private investment company in which the cash collateral has been invested may, under certain circumstances, impose a liquidity fee of up to 2% of the value withdrawn or temporarily restrict withdrawals for up to 10 business days during a 90 day period, in the event that the private investment company’s weekly liquid assets fall below certain thresholds.
Securities lending income is equal to the total of income earned from the reinvestment of cash collateral, net of fees and other payments to and from borrowers of securities, and less the collateral investment expenses. The Master LLC retains a portion of securities lending income and remits a remaining portion to BIM as compensation for its services as securities lending agent.
Pursuant to a securities lending agreement, the Master LLC retains 71.5% of securities lending income, and this amount retained can never be less than 65% of the total of securities lending income plus the collateral investment expenses.
In addition, commencing the business day following the date that the aggregate securities lending income earned across the Equity-Bond Complex in a calendar year exceeds a specified threshold, the Master LLC, pursuant to the securities lending agreement, will retain for the remainder of that calendar year securities lending income in an amount equal to 75% of securities lending income, and this amount retained can never be less than 65% of the total of securities lending income plus the collateral investment expenses.
The share of securities lending income earned by the Master LLC is shown as securities lending income — affiliated — net in the Statement of Operations. For the year ended March 31, 2018, the Master LLC paid BIM $74,159 for securities lending agent services.
Interfund Lending: In accordance with an exemptive order (the “Order”) from the SEC, the Master LLC may participate in a joint lending and borrowing facility for temporary purposes (the “Interfund Lending Program”), subject to compliance with the terms and conditions of the Order, and to the extent permitted by the Master LLC’s investment policies and restrictions. The Master LLC is currently permitted to borrow and lend under the Interfund Lending Program.
A lending BlackRock fund may lend in aggregate up to 15% of its net assets, but may not lend more than 5% of its net assets to any one borrowing fund through the Interfund Lending Program. A borrowing BlackRock fund may not borrow through the Interfund Lending Program or from any other source more than 33 1/3% of its total assets (or any lower threshold provided for by the fund’s investment restrictions). If a borrowing BlackRock fund’s total outstanding borrowings exceed 10% of its total assets, each of its outstanding interfund loans will be subject to collateralization of at least 102% of the outstanding principal value of the loan. All interfund loans are for temporary or emergency purposes and the interest rate to be charged will be the average of the highest current overnight repurchase agreement rate available to a lending fund and the bank loan rate, as calculated according to a formula established by the Board.
During the year ended March 31, 2018, the Master LLC did not participate in the Interfund Lending Program.
| | |
| 32 | | 2018 BLACKROCK ANNUAL REPORTTO SHAREHOLDERS |
| | |
Notes to Financial Statements (continued) | | Master Advantage U.S. Total Market LLC |
Directors and Officers: Certain directors and/or officers of the Master LLC are officers and/or directors of BlackRock or its affiliates.
Other Transactions: The Master LLC may purchase securities from, or sell securities to, an affiliated fund provided the affiliation is due solely to having a common investment adviser, common officers, or common directors. For the year ended March 31, 2018, the purchase transactions with affiliated funds in compliance with Rule 17a-7 under the 1940 Act were $2,782,083.
For the year ended March 31, 2018, purchases and sales of investments, excluding short-term securities, were $897,732,196 and $1,122,647,925, respectively.
The Master LLC is disregarded as an entity separate from its owner for tax purposes. As such, the owner of the Master LLC is treated as the owner of the net assets, income, expenses and realized and unrealized gains and losses of the Master LLC. Therefore, no U.S. federal income tax provision is required. It is intended that the Master LLC’s assets will be managed so the owner of the Master LLC can satisfy the requirements of Subchapter M of the Internal Revenue Code of 1986, as amended.
Prior to July 3, 2014, the Master LLC was classified as a partnership for federal income tax purposes. As such, each investor in the Master LLC was treated as the owner of its proportionate share of net assets, income, expenses and realized and unrealized gains and losses of the Master LLC.
The Master LLC has filed U.S. federal and various state and local tax returns. No income tax returns are currently under examination. The statute of limitations on the Master LLC’s U.S. federal tax returns has closed. The statutes of limitations on the Master LLC’s state and local tax returns may remain open for the period ended July 3, 2014 depending upon the jurisdiction.
Management has analyzed tax laws and regulations and their application to the Master LLC as of March 31, 2018, inclusive of the open tax return years, and does not believe that there are any uncertain tax positions that require recognition of a tax liability in the Master LLC’s financial statements.
As of March 31, 2018, gross unrealized appreciation and depreciation for investments and derivatives based on cost for U.S. federal income tax purposes were as follows:
| | | | |
Tax cost | | $ | 514,212,358 | |
| | | | |
Gross unrealized appreciation | | $ | 17,356,189 | |
Gross unrealized depreciation | | | (22,411,321 | ) |
| | | | |
Net unrealized depreciation | | $ | (5,055,132 | ) |
| | | | |
The Master LLC, along with certain other funds managed by the Manager and its affiliates (“Participating Funds”), is a party to a 364-day, $2.1 billion credit agreement with a group of lenders. Under this agreement, the Master LLC may borrow to fund shareholder redemptions. Excluding commitments designated for certain individual funds, the Participating Funds, including the Master LLC, can borrow up to an aggregate commitment amount of $1.6 billion at any time outstanding, subject to asset coverage and other limitations as specified in the agreement. The credit agreement has the following terms: a fee of 0.12% per annum on unused commitment amounts and interest at a rate equal to the higher of (a) one-month LIBOR (but, in any event, not less than 0.00%) on the date the loan is made plus 0.80% per annum or (b) the Fed Funds rate (but, in any event, not less than 0.00%) in effect from time to time plus 0.80% per annum on amounts borrowed. The agreement expires in April 2018 unless extended or renewed. Participating Funds paid administration, legal and arrangement fees, which, if applicable, are included in miscellaneous expenses in the Statement of Operations. These fees were allocated among such funds based upon portions of the aggregate commitment available to them and relative net assets of Participating Funds. During the year ended March 31, 2018, the Master LLC did not borrow under the credit agreement.
In the normal course of business, the Master LLC invests in securities or other instruments and may enter into certain transactions, and such activities subject the Master LLC to various risks, including among others, fluctuations in the market (market risk) or failure of an issuer to meet all of its obligations. The value of securities and other instruments may also be affected by various factors, including, without limitation: (i) the general economy; (ii) the overall market as well as local, regional or global political and/or social instability; (iii) regulation, taxation or international tax treaties between various countries; or (iv) currency, interest rate and price fluctuations. The Master LLC’s prospectus provides details of the risks to which the Master LLC is subject.
The Master LLC may be exposed to additional risks when reinvesting cash collateral in money market funds that do not seek to maintain a stable NAV per share of $1.00 and which may be subject to redemption gates or liquidity fees under certain circumstances.
Valuation Risk: The market values of equities, such as common stocks and preferred securities or equity related investments, such as futures and options, may decline due to general market conditions which are not specifically related to a particular company. They may also decline due to factors which affect a particular industry or industries. The Master LLC may invest in illiquid investments and may experience difficulty in selling those investments in a timely manner at the price that it believes the investments are worth. Prices may fluctuate widely over short or extended periods in response to company, market or economic news. Markets also tend to move in cycles, with periods of rising and falling prices. This volatility may cause the Master LLC’s NAV to experience significant increases or decreases over short periods of time. If there is a general decline in the securities and other markets, the NAV of the Master LLC may lose value, regardless of the individual results of the securities and other instruments in which the Master LLC invests.
| | | | |
| NOTESTO FINANCIAL STATEMENTS | | | 33 | |
| | |
Notes to Financial Statements (continued) | | Master Advantage U.S. Total Market LLC |
Counterparty Credit Risk: The Master LLC may be exposed to counterparty credit risk, or the risk that an entity may fail to or be unable to perform on its commitments related to unsettled or open transactions. The Master LLC manages counterparty credit risk by entering into transactions only with counterparties that the Manager believes have the financial resources to honor their obligations and by monitoring the financial stability of those counterparties. Financial assets, which potentially expose the Master LLC to market, issuer and counterparty credit risks, consist principally of financial instruments and receivables due from counterparties. The extent of the Master LLC’s exposure to market, issuer and counterparty credit risks with respect to these financial assets is approximately their value recorded in the Statement of Assets and Liabilities, less any collateral held by the Master LLC.
A derivative contract may suffer a mark-to-market loss if the value of the contract decreases due to an unfavorable change in the market rates or values of the underlying instrument. Losses can also occur if the counterparty does not perform under the contract.
With exchange-traded futures, there is less counterparty credit risk to the Master LLC since the exchange or clearinghouse, as counterparty to such instruments, guarantees against a possible default. The clearinghouse stands between the buyer and the seller of the contract; therefore, credit risk is limited to failure of the clearinghouse. While offset rights may exist under applicable law, the Master LLC does not have a contractual right of offset against a clearing broker or clearinghouse in the event of a default (including the bankruptcy or insolvency). Additionally, credit risk exists in exchange-traded futures with respect to initial and variation margin that is held in a clearing broker’s customer accounts. While clearing brokers are required to segregate customer margin from their own assets, in the event that a clearing broker becomes insolvent or goes into bankruptcy and at that time there is a shortfall in the aggregate amount of margin held by the clearing broker for all its clients, typically the shortfall would be allocated on a pro rata basis across all the clearing broker’s customers, potentially resulting in losses to the Master LLC.
Management’s evaluation of the impact of all subsequent events on the Master LLC’s financial statements was completed through the date the financial statements were issued and the following item was noted:
Effective April 19, 2018, the 364-day credit agreement to which the Master LLC and the Participating Funds are party was amended to (i) increase the aggregate commitment amount to $2.25 billion, (ii) increase the aggregate amount (excluding commitments designated for a certain individual fund) the Participating Funds can borrow to $1.75 billion at any time outstanding, subject to asset coverage and other limitations as specified in the agreement, (iii) decrease the fee on used commitment amounts to 0.10% and (iv) extend the termination date to April 2019. Participating Funds paid an upfront commitment fee of 0.02% on the total commitment amounts, in addition to administration, legal and arrangement fees. These fees were allocated among such funds based upon portions of the aggregate commitment available to them and relative net assets of Participating Funds.
| | |
| 34 | | 2018 BLACKROCK ANNUAL REPORTTO SHAREHOLDERS |
Report of Independent Registered Public Accounting Firm
To the Investor and Board of Directors of Master Advantage U.S. Total Market LLC:
Opinion on the Financial Statements and Financial Highlights
We have audited the accompanying statement of assets and liabilities, including the schedule of investments, of Master Advantage U.S. Total Market LLC (formerly, Master Value Opportunities LLC) (the “Fund”), as of March 31, 2018, the related statement of operations for the year then ended, the statements of changes in net assets for each of the two years in the period then ended, the financial highlights for each of the five years in the period then ended, and the related notes. In our opinion, the financial statements and financial highlights present fairly, in all material respects, the financial position of the Fund as of March 31, 2018, and the results of its operations for the year then ended, the changes in its net assets for each of the two years in the period then ended, and the financial highlights for each of the five years in the period then ended, in conformity with accounting principles generally accepted in the United States of America.
Basis for Opinion
These financial statements and financial highlights are the responsibility of the Fund’s management. Our responsibility is to express an opinion on the Fund’s financial statements and financial highlights based on our audits. We are a public accounting firm registered with the Public Company Accounting Oversight Board (United States) (PCAOB) and are required to be independent with respect to the Fund in accordance with the U.S. federal securities laws and the applicable rules and regulations of the Securities and Exchange Commission and the PCAOB.
We conducted our audits in accordance with the standards of the PCAOB. Those standards require that we plan and perform the audit to obtain reasonable assurance about whether the financial statements and financial highlights are free of material misstatement, whether due to error or fraud. The Fund is not required to have, nor were we engaged to perform, an audit of its internal control over financial reporting. As part of our audits we are required to obtain an understanding of internal control over financial reporting but not for the purpose of expressing an opinion on the effectiveness of the Fund’s internal control over financial reporting. Accordingly, we express no such opinion.
Our audits included performing procedures to assess the risks of material misstatement of the financial statements and financial highlights, whether due to error or fraud, and performing procedures that respond to those risks. Such procedures included examining, on a test basis, evidence regarding the amounts and disclosures in the financial statements and financial highlights. Our audits also included evaluating the accounting principles used and significant estimates made by management, as well as evaluating the overall presentation of the financial statements and financial highlights. Our procedures included confirmation of securities owned as of March 31, 2018, by correspondence with the custodian and brokers; when replies were not received from brokers, we performed other auditing procedures. We believe that our audits provide a reasonable basis for our opinion.
Deloitte & Touche LLP
Philadelphia, Pennsylvania
May 23, 2018
We have served as the auditor of one or more BlackRock investment companies since 1992.
| | | | |
| REPORTOF INDEPENDENT REGISTERED ACCOUNTING FIRMAND IMPORTANT TAX INFORMATION | | | 35 | |
Director and Officer Information
| | | | | | | | |
| Independent Directors(a) |
| | | | | |
Name
Year of Birth(b) | | Position(s) Held (Length of Service)(c) | | Principal Occupation(s) During Past Five Years | | Number of BlackRock- Advised Registered Investment Companies (“RICs”) Consisting of Investment Portfolios (“Portfolios”) Overseen | | Public Company
and Other
Investment
Company
Directorships Held
During
Past Five Years |
Robert M. Hernandez 1944 | | Chair of the
Board and
Director
(Since 2007) | | Director, Vice Chairman and Chief Financial Officer of USX Corporation (energy and steel business) from 1991 to 2001; Director and non-executive Chairman, RTI International Metals, Inc. from 1990 to 2015; Director, TE Connectivity (electronics) from 2006 to 2012. | | 27 RICs consisting of 95 Portfolios | | Chubb Limited (insurance company); Eastman Chemical Company |
James H. Bodurtha 1944 | | Director
(Since 2007) | | Director, The China Business Group, Inc. (consulting and investing firm) from 1996 to 2013 and Executive Vice President thereof from 1996 to 2003; Chairman of the Board, Berkshire Holding Corporation since 1980; Director, ICI Mutual since 2010. | | 27 RICs consisting of 95 Portfolios | | None |
Bruce R. Bond 1946 | | Director
(Since 2007) | | Trustee, and Member of the Governance Committee, State Street Research Mutual Funds from 1997 to 2005; Board Member of Governance, Audit and Finance Committee, Avaya Inc. (computer equipment) from 2003 to 2007. | | 27 RICs consisting of 95 Portfolios | | None |
Honorable Stuart E. Eizenstat 1943 | | Director
(Since 2007) | | Senior Counsel of Covington and Burling LLP (law firm) since 2016; Head of International Practice thereof since 2001, and Partner thereof from 2001 to 2016; Advisory Board Member, OCP S.A. (phosphates) since 2010; International Advisory Board Member, The Coca-Cola Company from 2002 to 2011; Advisory Board Member, Veracity Worldwide, LLC (risk management) from 2007 to 2012; Member of the International Advisory Board, GML Ltd. (energy) since 2003; Board of Directors, Ferroglobe (silicon metals) since 2016. | | 27 RICs consisting of 95 Portfolios | | Alcatel-Lucent (telecommunications); Global Specialty Metallurgical; UPS Corporation (delivery service) |
Henry Gabbay 1947 | | Director
(Since 2007) | | Consultant, BlackRock, Inc. from 2007 to 2008; Managing Director, BlackRock, Inc. from 1989 to 2007; Chief Administrative Officer, BlackRock Advisors, LLC from 1998 to 2007; President of BlackRock Funds and BlackRock Allocation Target Shares (formerly, BlackRock Bond Allocation Target Shares) from 2005 to 2007 and Treasurer of certain closed-end funds in the BlackRock fund complex from 1989 to 2006. | | 27 RICs consisting of 95 Portfolios | | None |
Lena G. Goldberg 1949 | | Director
(Since 2016) | | Senior Lecturer, Harvard Business School since 2008; Executive Vice President, FMR LLC/Fidelity Investments (financial services) from 2007 to 2008, Executive Vice President and General Counsel thereof from 2002 to 2007, Senior Vice President and General Counsel thereof from 1999 to 2002, Vice President and General Counsel thereof from 1997 to 1999, Senior Vice President and Deputy General Counsel thereof in 1997, and Vice President and Corporate Counsel thereof from 1996 to 1997; Partner, Sullivan & Worcester LLP from 1985 to 1996 and Associate thereof from 1979 to 1985. | | 27 RICs consisting of 95 Portfolios | | None |
| | |
| 36 | | 2018 BLACKROCK ANNUAL REPORTTO SHAREHOLDERS |
Director and Officer Information (continued)
| | | | | | | | |
| Independent Directors(a) |
| | | | | |
Name Year of Birth(b) | | Position(s) Held (Length of Service)(c) | | Principal Occupation(s) During Past Five Years | | Number of BlackRock-
Advised Registered
Investment Companies
(“RICs”) Consisting of
Investment Portfolios
(“Portfolios”) Overseen | | Public Company
and Other
Investment
Company
Directorships
Held During
Past Five Years |
Henry R. Keizer 1956 | | Director
(Since 2016) | | Director, Park Indemnity Ltd. (captive insurer) since 2010; Director, MUFG Americas Holdings Corporation and MUFG Union Bank, N.A. (financial and bank holding company) from 2014 to 2016; Director, Montpelier Re Holdings, Ltd. (publicly held property and casual reinsurance) from 2013 to 2015; Director, American Institute of Certified Public Accountants from 2009 to 2011; Director, KPMG LLP (audit, tax and advisory services) from 2004 to 2005 and 2010 to 2012; Director, KPMG International in 2012, Deputy Chairman and Chief Operating Officer thereof from 2010 to 2012 and U.S. Vice Chairman of Audit thereof from 2005 to 2010; Global Head of Audit, KPMGI (consortium of KPMG firms) from 2006 to 2010; Director, YMCA of Greater New York from 2006 to 2010. | | 27 RICs consisting of 95 Portfolios | | Hertz Global Holdings (car rental); WABCO (commercial vehicle safety systems); Sealed Air Corp. (packaging) |
John F. O’Brien 1943 | | Director
(Since 2007) | | Trustee, Woods Hole Oceanographic Institute since 2003 and Chairman thereof from 2009 to 2015; Co-Founder and Managing Director, Board Leaders LLC (director education) since 2005. | | 27 RICs consisting of 95 Portfolios | | Cabot Corporation (chemicals); LKQ Corporation (auto parts manufacturing); TJX Companies, Inc. (retailer) |
Donald C. Opatrny 1952 | | Director
(Since 2015) | | Trustee, Member of the Executive Committee and Chair of the Investment Committee, Cornell University since 2004; Member of the Board and Investment Committee, University School since 2007; Member of the Investment Committee, Mellon Foundation from 2009 to 2015; President and Trustee, the Center for the Arts, Jackson Hole since 2011; Director, Athena Capital Advisors LLC (investment management firm) since 2013; Trustee and Chair of the Investment Committee, Community Foundation of Jackson Hole since 2014; Trustee, Artstor (a Mellon Foundation affiliate) from 2010 to 2015; President, Trustee and Member of the Investment Committee, The Aldrich Contemporary Art Museum from 2007 to 2014. | | 27 RICs consisting of 95 Portfolios | | None |
| | | | |
| DIRECTORAND OFFICER INFORMATION | | | 37 | |
Director and Officer Information (continued)
| | | | | | | | |
| Interested Directors(a)(d) |
| | | | | |
Name Year of Birth(b) | | Position(s) Held (Length of Service)(c) | | Principal Occupation(s) During Past Five Years | | Number of BlackRock-Advised
Registered Investment
Companies (“RICs”) Consisting of
Investment Portfolios
(“Portfolios”) Overseen | | Public Company
and Other
Investment
Company
Directorships
Held During
Past Five Years |
Robert Fairbairn 1965 | | Director
(Since 2015) | | Senior Managing Director of BlackRock, Inc. since 2010; oversees BlackRock’s Strategic Partner Program and Strategic Product Management Group; Member of BlackRock’s Global Executive and Global Operating Committees; Co-Chair of BlackRock’s Human Capital Committee; Global Head of BlackRock’s Retail and iShares® businesses from 2012 to 2016; Head of BlackRock’s Global Client Group from 2009 to 2012; Chairman of BlackRock’s international businesses from 2007 to 2010. | | 128 RICs consisting of 312 Portfolios | | None |
John M. Perlowski 1964 | | Director
(Since 2015), President
and Chief
Executive Officer
(Since 2010) | | Managing Director of BlackRock, Inc. since 2009; Head of BlackRock Global Accounting and Product Services since 2009; Managing Director and Chief Operating Officer of the Global Product Group at Goldman Sachs Asset Management, L.P. from 2003 to 2009; Treasurer of Goldman Sachs Mutual Funds from 2003 to 2009 and Senior Vice President thereof from 2007 to 2009; Director of Goldman Sachs Offshore Funds from 2002 to 2009; Advisory Director of Family Resource Network (charitable foundation) since 2009. | | 128 RICs consisting of 312 Portfolios | | None |
(a) The address of each Director is c/o BlackRock, Inc., 55 East 52nd Street, New York, NY 10055. |
(b) Each Independent Director holds office until his or her successor is duly elected and qualifies or until his or her earlier death, resignation, retirement or removal as provided by the Fund’s/Master LLC’s by-laws or charter or statute, or until December 31 of the year in which he or she turns 75. The Board may determine to extend the terms of Independent Directors on a case-by-case basis, as appropriate. Interested Directors serve until their successor is duly elected and qualifies or until their earlier death, resignation, retirement or removal as provided by the Fund’s/Master LLC’s by-laws or statute, or until December 31 of the year in which they turn 72. |
(c) Following the combination of Merrill Lynch Investment Managers, L.P. (“MLIM”) and BlackRock, Inc. in September 2006, the various legacy MLIM and legacy BlackRock fund boards were realigned and consolidated into three new fund boards in 2007. As a result, although the chart shows certain Independent Directors as joining the Board in 2007, those Directors first became members of the boards of other legacy MLIM or legacy BlackRock funds as follows: James H. Bodurtha, 1995; Bruce R. Bond, 2005; Honorable Stuart E. Eizenstat, 2001; Robert M. Hernandez, 1996; and John F. O’Brien, 2005. |
(d) Mr. Fairbairn and Mr. Perlowski are both “interested persons,” as defined in the 1940 Act, of the Fund/Master LLC based on their positions with BlackRock, Inc. and its affiliates. Mr. Fairbairn and Mr. Perlowski are also a board members of the BlackRock Closed-End Complex and the BlackRock Equity-Liquidity Complex. |
| | |
| 38 | | 2018 BLACKROCK ANNUAL REPORTTO SHAREHOLDERS |
Director and Officer Information (continued)
| | | | |
| Officers Who Are Not Directors(a) |
| | | |
Name Year of Birth(b) | | Position(s) Held (Length of Service) | | Principal Occupation(s) During Past Five Years |
Jennifer McGovern 1977 | | Vice President
(Since 2014) | | Managing Director of BlackRock, Inc. since 2016; Director of BlackRock, Inc. from 2011 to 2015; Head of Product Structure and Oversight for BlackRock’s U.S. Wealth Advisory Group since 2013; Vice President of BlackRock, Inc. from 2008 to 2010. |
Neal J. Andrews 1966 | | Chief Financial Officer
(Since 2007) | | Managing Director of BlackRock, Inc. since 2006; Senior Vice President and Line of Business Head of Fund Accounting and Administration at PNC Global Investment Servicing (U.S.) Inc. from 1992 to 2006. |
Jay M. Fife 1970 | | Treasurer
(Since 2007) | | Managing Director of BlackRock, Inc. since 2007; Director of BlackRock, Inc. in 2006; Assistant Treasurer of the MLIM and Fund Asset Management, L.P. advised funds from 2005 to 2006; Director of MLIM Fund Services Group from 2001 to 2006. |
Charles Park 1967 | | Chief Compliance Officer
(Since 2014) | | Anti-Money Laundering Compliance Officer for the BlackRock-advised Funds in the Equity-Bond Complex, the Equity-Liquidity Complex and the Closed-End Complex from 2014 to 2015; Chief Compliance Officer of BlackRock Advisors, LLC and the BlackRock-advised Funds in the Equity-Bond Complex, the Equity-Liquidity Complex and the Closed-End Complex since 2014; Principal of and Chief Compliance Officer for iShares® Delaware Trust Sponsor LLC since 2012 and BlackRock Fund Advisors (“BFA”) since 2006; Chief Compliance Officer for the BFA-advised iShares® exchange traded funds since 2006; Chief Compliance Officer for BlackRock Asset Management International Inc. since 2012. |
Fernanda Piedra 1969 | | Anti-Money Laundering Compliance Officer
(Since 2015) | | Director of BlackRock, Inc. since 2014; Anti-Money Laundering Compliance Officer and Regional Head of Financial Crime for the Americas at BlackRock, Inc. since 2014; Head of Regulatory Changes and Remediation for the Asset Wealth Management Division of Deutsche Bank from 2010 to 2014; Vice President of Goldman Sachs (Anti-Money Laundering/Suspicious Activities Group) from 2004 to 2010. |
Benjamin Archibald 1975 | | Secretary
(Since 2012) | | Managing Director of BlackRock, Inc. since 2014; Director of BlackRock, Inc. from 2010 to 2013; Secretary of the iShares® exchange traded funds since 2015; Secretary of the BlackRock-advised mutual funds since 2012. |
(a) The address of each Officer is c/o BlackRock, Inc., 55 East 52nd Street, New York, NY 10055. |
(b) Officers of the Fund/Master LLC serve at the pleasure of the Board. |
Further information about the Fund’s/Master LLC’s Directors and Officers is available in the Fund’s/Master LLC’s Statement of Additional Information, which can be obtained without charge by calling (800) 441-7762.
Effective December 31, 2017, Roberta Cooper Ramo retired and Donald W. Burton resigned as Directors of the Fund/Master LLC.
Effective May 8, 2018, John MacKessy replaced Fernanda Piedra as the Anti-Money Laundering Compliance Officer of the Fund/Master LLC.
Investment Adviser and Administrator
BlackRock Advisors, LLC
Wilmington, DE 19809
Accounting Agent and Transfer Agent
BNY Mellon Investment Servicing (US) Inc.
Wilmington, DE 19809
Custodian
The Bank of New York Mellon
New York, NY 10286
Independent Registered Public Accounting Firm
Deloitte & Touche LLP
Philadelphia, PA 19103
Distributor
BlackRock Investments, LLC
New York, NY 10022
Legal Counsel
Willkie Farr & Gallagher LLP
New York, NY 10019
Address of the Fund/Master LLC
100 Bellevue Parkway
Wilmington, DE 19809
| | | | |
| DIRECTORAND OFFICER INFORMATION | | | 39 | |
Additional Information
Proxy Results
At the Joint Special Meeting of Shareholders of BlackRock Value Opportunities Fund, Inc. (subsequently renamed to BlackRock Advantage U.S. Total Market Fund, Inc.) (the “Fund”) and Master Value Opportunities LLC (subsequently renamed to Master Advantage U.S. Total Market LLC) (the “Master LLC”) held on October 30, 2017, shareholders were asked to vote on the following proposals:
Proposal 2. To approve a change in the investment objective of each of the Fund and the Master LLC and to make the investment objective a non-fundamental policy of each of the Fund and the Master LLC that may be changed by the Board of Directors of the Fund and the Board of Directors of the Master LLC, respectively, without shareholder approval.(a)
With respect to this Proposal, the shares of the Fund were voted as follows:
| | | | |
| For | | Against | | Abstain |
9,017,314 | | 1,019,883 | | 762,433 |
With respect to this Proposal, the assets of the Master LLC were voted as follows:
| | | | |
| For | | Against | | Abstain |
$514,032,964 | | $56,308,806 | | $43,944,989 |
Proposal 3. To provide voting instructions to the Fund to vote for the change in the Master LLC’s investment objective as contemplated by Proposal 2.
With respect to this Proposal, the shares of the Fund were voted as follows:
| | | | |
| For | | Against | | Abstain |
9,037,092 | | 989,951 | | 772,586 |
Proposal 5. To approve the amendment or elimination of certain of the Fund’s and the Master LLC’s respective fundamental investment restrictions as follows:
Proposal 5A. To amend the fundamental investment restriction regarding concentration.
With respect to this Proposal, the shares of the Fund were voted as follows:
| | | | |
| For | | Against | | Abstain |
9,173,436 | | 829,520 | | 796,674 |
With respect to this Proposal, the assets of the Master LLC were voted as follows:
| | | | |
| For | | Against | | Abstain |
$522,153,195 | | $46,459,305 | | $45,674,259 |
Proposal 5B. To amend the fundamental investment restriction regarding borrowing.
With respect to this Proposal, the shares of the Fund were voted as follows:
| | | | |
| For | | Against | | Abstain |
9,111,916 | | 887,189 | | 800,525 |
With respect to this Proposal, the assets of the Master LLC were voted as follows:
| | | | |
| For | | Against | | Abstain |
$518,771,963 | | $49,404,460 | | $46,110,337 |
Proposal 5C. To amend the fundamental investment restriction regarding the issuance of senior securities.
With respect to this Proposal, the shares of the Fund were voted as follows:
| | | | |
| For | | Against | | Abstain |
9,171,709 | | 806,014 | | 821,907 |
With respect to this Proposal, the assets of the Master LLC were voted as follows:
| | | | |
| For | | Against | | Abstain |
$522,320,921 | | $45,668,155 | | $46,297,683 |
| | |
| 40 | | 2018 BLACKROCK ANNUAL REPORTTO SHAREHOLDERS |
Additional Information (continued)
Proposal 5D. To amend the fundamental investment restriction regarding investing in real estate.
With respect to this Proposal, the shares of the Fund were voted as follows:
| | | | |
| For | | Against | | Abstain |
9,198,104 | | 799,569 | | 801,957 |
With respect to this Proposal, the assets of the Master LLC were voted as follows:
| | | | |
| For | | Against | | Abstain |
$522,234,761 | | $46,341,170 | | $45,710,828 |
Proposal 5E. To amend the fundamental investment restriction regarding underwriting.
With respect to this Proposal, the shares of the Fund were voted as follows:
| | | | |
| For | | Against | | Abstain |
9,128,499 | | 840,037 | | 831,093 |
With respect to this Proposal, the assets of the Master LLC were voted as follows:
| | | | |
| For | | Against | | Abstain |
$519,835,000 | | $48,007,419 | | $46,444,340 |
Proposal 5F. To amend the fundamental investment restriction regarding investing in commodities.
With respect to this Proposal, the shares of the Fund were voted as follows:
| | | | |
| For | | Against | | Abstain |
9,182,243 | | 820,139 | | 797,248 |
With respect to this Proposal, the assets of the Master LLC were voted as follows:
| | | | |
| For | | Against | | Abstain |
$524,140,067 | | $44,877,555 | | $45,269,138 |
Proposal 5G. To amend the fundamental investment restriction regarding lending.
With respect to this Proposal, the shares of the Fund were voted as follows:
| | | | |
| For | | Against | | Abstain |
9,104,190 | | 870,938 | | 824,502 |
With respect to this Proposal, the assets of the Master LLC were voted as follows:
| | | | |
| For | | Against | | Abstain |
$518,144,920 | | $49,921,936 | | $46,219,904 |
Proposal 5H. To eliminate the fundamental investment restriction regarding investing for the purpose of exercising control or management.
With respect to this Proposal, the shares of the Fund were voted as follows:
| | | | |
| For | | Against | | Abstain |
9,146,553 | | 880,878 | | 772,198 |
With respect to this Proposal, the assets of the Master LLC were voted as follows:
| | | | |
| For | | Against | | Abstain |
$519,430,272 | | $49,277,657 | | $45,578,831 |
| | | | |
| ADDITIONAL INFORMATION | | | 41 | |
Additional Information (continued)
Proposal 6. To provide voting instructions to the Fund to vote for the amendment or elimination of certain of the Master LLC’s fundamental investment restrictions as contemplated by Proposal 5.
Proposal 6A. To amend the fundamental investment restriction regarding concentration.
With respect to this Proposal, the shares of the Fund were voted as follows:
| | | | |
| For | | Against | | Abstain |
9,179,852 | | 816,790 | | 802,988 |
Proposal 6B. To amend the fundamental investment restriction regarding borrowing.
With respect to this Proposal, the shares of the Fund were voted as follows:
| | | | |
| For | | Against | | Abstain |
9,120,408 | | 868,568 | | 810,655 |
Proposal 6C. To amend the fundamental investment restriction regarding the issuance of senior securities.
With respect to this Proposal, the shares of the Fund were voted as follows:
| | | | |
| For | | Against | | Abstain |
9,182,801 | | 802,881 | | 813,948 |
Proposal 6D. To amend the fundamental investment restriction regarding investing in real estate.
With respect to this Proposal, the shares of the Fund were voted as follows:
| | | | |
| For | | Against | | Abstain |
9,181,286 | | 814,713 | | 803,631 |
Proposal 6E. To amend the fundamental investment restriction regarding underwriting.
With respect to this Proposal, the shares of the Fund were voted as follows:
| | | | |
| For | | Against | | Abstain |
9,139,097 | | 844,007 | | 816,527 |
Proposal 6F. To amend the fundamental investment restriction regarding investing in commodities.
With respect to this Proposal, the shares of the Fund were voted as follows:
| | | | |
| For | | Against | | Abstain |
9,214,783 | | 788,981 | | 795,866 |
Proposal 6G. To amend the fundamental investment restriction regarding lending.
With respect to this Proposal, the shares of the Fund were voted as follows:
| | | | |
| For | | Against | | Abstain |
9,109,384 | | 877,665 | | 812,581 |
Proposal 6H. To eliminate the fundamental investment restriction regarding investing for the purpose of exercising control or management.
With respect to this Proposal, the shares of the Fund were voted as follows:
| | | | |
| For | | Against | | Abstain |
9,131,981 | | 866,338 | | 801,310 |
| | (a) | On July 28, 2017 (prior to the October 30, 2017 Joint Special Meeting of Shareholders), the Board of Directors of the Fund and the Board of Directors of the Master LLC (together, the “Boards”) adopted a policy (the “Policy”) whereby, contingent on shareholder approval of Proposal 2, each Board agreed to not change the proposed investment objective of the Fund or the Master LLC, respectively, in the future without obtaining the “vote of a majority of the outstanding voting securities” of the Fund or the Master LLC, respectively, as defined in the Investment Company Act of 1940, as amended (the “1940 Act”). The “vote of a majority of the outstanding voting securities” is defined in the 1940 Act as the lesser of the vote of (i) 67% or more of the voting securities of the Fund or the Master LLC, as applicable, present at the Meeting, if the holders of more than 50% of such outstanding voting securities are present in person or represented by proxy; or (ii) more than 50% of such outstanding voting securities of the Fund or the Master LLC, as applicable (a “1940 Act Majority”). In addition, each Board agreed not to change the Policy without a 1940 Act Majority vote. The adoption of the Policy preserves the Fund’s and the Master LLC’s shareholders’ right to vote on any future investment objective change. | |
| | |
| 42 | | 2018 BLACKROCK ANNUAL REPORTTO SHAREHOLDERS |
Additional Information (continued)
General Information
Householding
The Fund will mail only one copy of shareholder documents, including prospectuses, annual and semi-annual reports and proxy statements, to shareholders with multiple accounts at the same address. This practice is commonly called “householding” and is intended to reduce expenses and eliminate duplicate mailings of shareholder documents. Mailings of your shareholder documents may be householded indefinitely unless you instruct us otherwise. If you do not want the mailing of these documents to be combined with those for other members of your household, please call the Fund at (800) 441-7762.
Availability of Quarterly Schedule of Investments
The Fund/Master LLC file their complete schedule of portfolio holdings with the SEC for the first and third quarters of each fiscal year on Form N-Q. The Fund/Master LLC’s Forms N-Q are available on the SEC’s website at http://www.sec.gov and may also be reviewed and copied at the SEC’s Public Reference Room in Washington,D.C. Information on the operation of the Public Reference Room or how to access documents on the SEC’s website without charge may be obtained by calling (800) SEC-0330. The Fund/Master LLC’s Forms N-Q may also be obtained upon request and without charge by calling (800) 441-7762.
Availability of Proxy Voting Policies and Procedures
A description of the policies and procedures that the Fund/Master LLC use to determine how to vote proxies relating to portfolio securities is available upon request and without charge (1) by calling (800) 441-7762; (2) at http://www.blackrock.com; and (3) on the SEC’s website at http://www.sec.gov.
Availability of Proxy Voting Record
Information about how the Fund/Master LLC voted proxies relating to securities held in the Fund/Master LLC’s portfolio during the most recent 12-month period ended June 30 is available upon request and without charge (1) at http://www.blackrock.com; or by calling (800) 441-7762 and (2) on the SEC’s website at http://www.sec.gov.
BlackRock’s Mutual Fund Family
BlackRock offers a diverse lineup of open-end mutual funds crossing all investment styles and managed by experts in equity, fixed-income and tax-exempt investing. Visit http://www.blackrock.com for more information.
Shareholder Privileges
Account Information
Call us at (800) 441-7762 from 8:00 AM to 6:00 PM ET on any business day to get information about your account balances, recent transactions and share prices. You can also reach us on the Web at http://www.blackrock.com.
Automatic Investment Plans
Investor Class shareholders who want to invest regularly can arrange to have $50 or more automatically deducted from their checking or savings account and invested in any of the BlackRock funds.
Systematic Withdrawal Plans
Investor Class shareholders can establish a systematic withdrawal plan and receive periodic payments of $50 or more from their BlackRock funds, as long as their account balance is at least $10,000.
Retirement Plans
Shareholders may make investments in conjunction with Traditional, Rollover, Roth, Coverdell, Simple IRAs, SEP IRAs and 403(b) Plans.
| | | | |
| ADDITIONAL INFORMATION | | | 43 | |
Additional Information (continued)
BlackRock Privacy Principles
BlackRock is committed to maintaining the privacy of its current and former fund investors and individual clients (collectively, “Clients”) and to safeguarding their non-public personal information. The following information is provided to help you understand what personal information BlackRock collects, how we protect that information and why in certain cases we share such information with select parties.
If you are located in a jurisdiction where specific laws, rules or regulations require BlackRock to provide you with additional or different privacy-related rights beyond what is set forth below, then BlackRock will comply with those specific laws, rules or regulations.
BlackRock obtains or verifies personal non-public information from and about you from different sources, including the following: (i) information we receive from you or, if applicable, your financial intermediary, on applications, forms or other documents; (ii) information about your transactions with us, our affiliates, or others; (iii) information we receive from a consumer reporting agency; and (iv) from visits to our websites.
BlackRock does not sell or disclose to non-affiliated third parties any non-public personal information about its Clients, except as permitted by law or as is necessary to respond to regulatory requests or to service Client accounts. These non-affiliated third parties are required to protect the confidentiality and security of this information and to use it only for its intended purpose.
We may share information with our affiliates to service your account or to provide you with information about other BlackRock products or services that may be of interest to you. In addition, BlackRock restricts access to non-public personal information about its Clients to those BlackRock employees with a legitimate business need for the information. BlackRock maintains physical, electronic and procedural safeguards that are designed to protect the non-public personal information of its Clients, including procedures relating to the proper storage and disposal of such information.
| | |
| 44 | | 2018 BLACKROCK ANNUAL REPORTTO SHAREHOLDERS |
This report is intended for current holders. It is not authorized for use as an offer of sale or a solicitation of an offer to buy shares of the Fund unless preceded or accompanied by the Fund’s current prospectus. Past performance results shown in this report should not be considered a representation of future performance. Investment returns and principal value of shares will fluctuate so that shares, when redeemed, may be worth more or less than their original cost. Statements and other information herein are as dated and are subject to change.

| | |
| VO-3/18-AR | |  |
| | |
| Item 2 – | | Code of Ethics – Each registrant (or each, a “Fund” or together, the “Funds” ) has adopted a code of ethics, as of the end of the period covered by this report, applicable to the registrants’ principal executive officer, principal financial officer, principal accounting officer or controller, or persons performing similar functions. During the period covered by this report, the code of ethics was amended to clarify an inconsistency as to whom persons covered by the code should report suspected violations of the code. The amendment clarifies that such reporting should be made to BlackRock Advisors, LLC’s (“Investment Adviser” or “BlackRock”) General Counsel, and retains the alternative option of anonymous reporting following “whistleblower” policies. Other non-material changes were also made in connection with this amendment. During the period covered by this report, there have been no waivers granted under the code of ethics. The registrants undertake to provide a copy of the code of ethics to any person upon request, without charge, who calls 1-800-441-7762. |
| |
| Item 3 – | | Audit Committee Financial Expert – Each registrant’s board of directors (the “board of directors”), has determined that (i) the registrant has the following audit committee financial experts serving on its audit committee and (ii) each audit committee financial expert is independent: |
| |
| | Robert M. Hernandez |
| | Henry R. Keizer |
| | Stuart E. Eizenstat |
| | Bruce R. Bond |
| |
| | Under applicable securities laws, a person determined to be an audit committee financial expert will not be deemed an “expert” for any purpose, including without limitation for the purposes of Section 11 of the Securities Act of 1933, as a result of being designated or identified as an audit committee financial expert. The designation or identification of a person as an audit committee financial expert does not impose on such person any duties, obligations, or liabilities greater than the duties, obligations, and liabilities imposed on such person as a member of the audit committee and board of directors in the absence of such designation or identification. |
| |
| Item 4 – | | Principal Accountant Fees and Services |
| |
| | The following table presents fees billed by Deloitte & Touche LLP (“D&T”) in each of the last two fiscal years for the services rendered to the Funds: |
| | | | | | | | | | | | | | | | |
| | | (a) Audit Fees | | (b) Audit-Related Fees1 | | (c) Tax Fees2 | | (d) All Other Fees |
| Entity Name | | Current Fiscal Year
End | | Previous
Fiscal Year
End | | Current
Fiscal Year
End | | Previous
Fiscal Year
End | | Current
Fiscal Year
End | | Previous
Fiscal Year
End | | Current
Fiscal Year
End | | Previous
Fiscal Year
End |
| BlackRock Advantage U.S. Total Market Fund, Inc. (Formerly BlackRock Value Opportunities Fund, Inc.) | | $8,000 | | $8,160 | | $0 | | $0 | | $13,100 | | $13,107 | | $0 | | $0 |
| Master Advantage U.S. Toal Market LLC (Formerly Master Value Opportunities LLC) | | $35,900 | | $36,636 | | $0 | | $0 | | $0 | | $0 | | $0 | | $0 |
2
The following table presents fees billed by D&T that were required to be approved by each registrant’s audit committee (the “Committee”) for services that relate directly to the operations or financial reporting of the Funds and that are rendered on behalf of BlackRock and entities controlling, controlled by, or under common control with BlackRock (not including any sub-adviser whose role is primarily portfolio management and is subcontracted with or overseen by another investment adviser) that provide ongoing services to the Funds (“Affiliated Service Providers”):
| | | | |
| | | Current Fiscal Year End | | Previous Fiscal Year End |
| (b) Audit-Related Fees1 | | $0 | | $0 |
| (c) Tax Fees2 | | $0 | | $0 |
| (d) All Other Fees3 | | $2,274,000 | | $2,129,000 |
1 The nature of the services includes assurance and related services reasonably related to the performance of the audit or review of financial statements not included in Audit Fees, including accounting consultations, agreed-upon procedure reports, attestation reports, comfort letters, out-of-pocket expenses and internal control reviews not required by regulators.
2 The nature of the services includes tax compliance and/or tax preparation, including services relating to the filing or amendment of federal, state or local income tax returns, regulated investment company qualification reviews, taxable income and tax distribution calculations.
3 Non-audit fees of $2,274,000 and $2,129,000 for the current fiscal year and previous fiscal year, respectively, were paid to each Fund’s principal accountant in their entirety by BlackRock, in connection with services provided to the Affiliated Service Providers of each Fund and of certain other funds sponsored and advised by BlackRock or its affiliates for a service organization review and an accounting research tool subscription. These amounts represent aggregate fees paid by BlackRock and were not allocated on a per fund basis.
(e)(1) Audit Committee Pre-Approval Policies and Procedures:
The Committee has adopted policies and procedures with regard to the pre-approval of services. Audit, audit-related and tax compliance services provided to the registrants on an annual basis require specific pre-approval by the Committee. The Committee also must approve other non-audit services provided to the registrants and those non-audit services provided to the Investment Adviser and Affiliated Service Providers that relate directly to the operations and the financial reporting of the registrants. Certain of these non-audit services that the Committee believes are (a) consistent with the SEC’s auditor independence rules and (b) routine and recurring services that will not impair the independence of the independent accountants may be approved by the Committee without consideration on a specific case-by-case basis (“general pre-approval”). The term of any general pre-approval is 12 months from the date of the pre-approval, unless the Committee provides for a different period. Tax or other non-audit services provided to the registrants which have a direct impact on the operations or financial reporting of the registrants will only be deemed pre-approved provided that any individual project does not exceed $10,000 attributable to the registrants or $50,000 per project. For this purpose, multiple projects will be aggregated to determine if they exceed the previously mentioned cost levels.
Any proposed services exceeding the pre-approved cost levels will require specific pre-approval by the Committee, as will any other services not subject to general pre-approval (e.g., unanticipated but permissible services). The Committee is informed of each service approved subject to general pre-approval at the next regularly scheduled in-person board meeting. At this meeting, an analysis of such services is presented to the Committee for ratification. The Committee may delegate to the Committee Chairman the authority to approve the provision of and fees for any specific engagement of permitted non-audit services, including services exceeding pre-approved cost levels.
(e)(2) None of the services described in each of Items 4(b) through (d) were approved by the Committee pursuant to the de minimis exception in paragraph (c)(7)(i)(C) of Rule 2-01 of Regulation S-X.
3
(f) Not Applicable
(g) The aggregate non-audit fees, defined as the sum of the fees shown under “Audit-Related Fees,” “Tax Fees” and “All Other Fees,” paid to the accountant for services rendered by the accountant to the registrants, the Investment Adviser and the Affiliated Service Providers were:
| | | | | | |
| Entity Name | | Current Fiscal Year End | | Previous Fiscal Year End | | |
BlackRock Value Opportunities Fund, Inc. (Formerly BlackRock Value Opportunities Fund, Inc.) | | $13,100 | | $13,107 | | |
| Master Value Opportunities LLC (Formerly Master Value Opportunities LLC) | | $0 | | $0 | | |
Additionally, the amounts billed by D&T in connection with services provided to the Affiliated Service Providers of the Fund and of other funds sponsored and advised by BlackRock or its affiliates during the current and previous fiscal years for a service organization review and accounting research subscription tool were:
| | |
Current Fiscal Year End | | Previous Fiscal Year End |
| $2,274,000 | | $2,129,000 |
| | |
| | | These amounts represent aggregate fees paid by BlackRock and were not allocated on a per fund basis. |
| |
| | | (h) The Committee has considered and determined that the provision of non-audit services that were rendered to
the Investment Adviser and the Affiliated Service Providers that were not pre-approved pursuant to
paragraph (c)(7)(ii) of Rule 2-01 of Regulation S-X is compatible with maintaining the principal accountant’s
independence. |
| |
| Item 5 – | | Audit Committee of Listed Registrants – Not Applicable |
| |
Item 6 – | | Investments |
| |
| | (a) The registrants’ Schedules of Investments are included as part of the Report to Stockholders filed under Item 1 of this Form. |
| |
| | (b) Not Applicable due to no such divestments during the semi-annual period covered since the previous Form N-CSR filing. |
| |
Item 7 – | | Disclosure of Proxy Voting Policies and Procedures for Closed-End Management Investment Companies – Not Applicable |
| |
Item 8 – | | Portfolio Managers of Closed-End Management Investment Companies – Not Applicable |
| |
Item 9 – | | Purchases of Equity Securities by Closed-End Management Investment Company and Affiliated Purchasers – Not Applicable |
4
| | |
| |
Item 10 – | | Submission of Matters to a Vote of Security Holders – There have been no material changes to these procedures. |
| |
Item 11 – | | Controls and Procedures |
| |
| | (a) The registrants’ principal executive and principal financial officers, or persons performing similar functions, have concluded that the registrants’ disclosure controls and procedures (as defined in Rule 30a-3(c) under the Investment Company Act of 1940, as amended (the “1940 Act”)) are effective as of a date within 90 days of the filing of this report based on the evaluation of these controls and procedures required by Rule 30a-3(b) under the 1940 Act and Rule 15d-15(b) under the Securities Exchange Act of 1934, as amended. |
| |
| | (b) There were no changes in the registrants’ internal control over financial reporting (as defined in Rule 30a-3(d) under the 1940 Act) that occurred during the second fiscal quarter of the period covered by this report that have materially affected, or are reasonably likely to materially affect, the registrants’ internal control over financial reporting. |
| |
Item 12 – | | Disclosure of Securities Lending Activities for Closed-End Management Investment Companies – Not Applicable |
| |
Item 13 – | | Exhibits attached hereto |
| |
| | (a)(1) Code of Ethics – See Item 2 |
| |
| | (a)(2) Certifications – Attached hereto |
| |
| | (a)(3) Not Applicable |
| |
| | (a)(4) Not Applicable |
| |
| | (b) Certifications – Attached hereto |
5
Pursuant to the requirements of the Securities Exchange Act of 1934 and the Investment Company Act of 1940, each registrant has duly caused this report to be signed on its behalf by the undersigned, thereunto duly authorized.
BlackRock Advantage U.S. Total Market Fund, Inc. (Formerly BlackRock Value Opportunities Fund, Inc.) and Master Advantage U.S. Total Market LLC (Formerly Master Value Opportunities LLC)
| | |
| By: | | /s/ John M. Perlowski |
| | | John M. Perlowski |
| | Chief Executive Officer (principal executive officer) of BlackRock Advantage U.S. Total Market Fund, Inc. and Master Advantage U.S. Total Market LLC (Formerly Master Value Opportunities LLC) |
Date: June 1, 2018
Pursuant to the requirements of the Securities Exchange Act of 1934 and the Investment Company Act of 1940, this report has been signed below by the following persons on behalf of each registrant and in the capacities and on the dates indicated.
| | |
| By: | | /s/ John M. Perlowski |
| | | John M. Perlowski |
| | Chief Executive Officer (principal executive officer) of BlackRock Advantage U.S. Total Market Fund, Inc. (Formerly BlackRock Value Opportunities Fund, Inc.) and Master Advantage U.S. Total Market LLC (Formerly Master Value Opportunities LLC) |
Date: June 1, 2018
| | |
| By: | | /s/ Neal J. Andrews |
| | | Neal J. Andrews |
| | Chief Financial Officer (principal financial officer) of BlackRock Advantage U.S. Total Market Fund, Inc. (Formerly BlackRock Value Opportunities Fund, Inc.) and Master Advantage U.S. Total Market LLC (Formerly Master Value Opportunities LLC) |
Date: June 1, 2018
6