UNITED STATES
SECURITIES AND EXCHANGE COMMISSION
Washington, D.C. 20549
FORMN-CSR
CERTIFIED SHAREHOLDER REPORT OF REGISTERED MANAGEMENT INVESTMENT COMPANIES
Investment Company Act file number:811-02809 and811-10095
Name of Fund: BlackRock Advantage U.S. Total Market Fund, Inc. and Master Advantage U.S. Total Market LLC
Fund Address: 100 Bellevue Parkway, Wilmington, DE 19809
Name and address of agent for service: John M. Perlowski, Chief Executive Officer, BlackRock Advantage U.S. Total Market Fund, Inc. and Master Advantage U.S. Total Market LLC, 55 East 52nd Street, New York, NY 10055
Registrants’ telephone number, including area code: (800)441-7762
Date of fiscal year end: 03/31/2019
Date of reporting period: 03/31/2019
Item 1 – Report to Stockholders
MARCH 31, 2019
| | |
ANNUAL REPORT | |  |
BlackRock Advantage U.S. Total Market Fund, Inc.
Beginning on January 1, 2021, as permitted by regulations adopted by the Securities and Exchange Commission, paper copies of the Fund’s shareholder reports will no longer be sent by mail, unless you specifically request paper copies of the reports from BlackRock or from your financial intermediary, such as a broker-dealer or bank. Instead, the reports will be made available on a website, and you will be notified by mail each time a report is posted and provided with a website link to access the report.
You may elect to receive all future reports in paper free of charge. If you hold accounts directly with BlackRock, you can call (800) 441-7762 to inform BlackRock that you wish to continue receiving paper copies of your shareholder reports. If you hold accounts through a financial intermediary, you can follow the instructions included with this disclosure, if applicable, or contact your financial intermediary to request that you continue to receive paper copies of your shareholder reports. Please note that not all financial intermediaries may offer this service. Your election to receive reports in paper will apply to all funds advised by BlackRock Advisors, LLC, BlackRock Fund Advisors or their affiliates, or all funds held with your financial intermediary, as applicable.
If you already elected to receive shareholder reports electronically, you will not be affected by this change and you need not take any action. You may elect to receive electronic delivery of shareholder reports and other communications by: (i) accessing the BlackRock website at www.blackrock.com/edelivery and logging into your accounts, if you hold accounts directly with BlackRock, or (ii) contacting your financial intermediary, if you hold accounts through a financial intermediary. Please note that not all financial intermediaries may offer this service.
| | |
| | | Not FDIC Insured§ May Lose Value§ No Bank Guarantee |
The Markets in Review
Dear Shareholder,
In the 12 months ended March 31, 2019, the U.S. equity and bond markets posted positive returns while weathering significant volatility. Though the market’s appetite for risk remained healthy for most of the reporting period, risk taking declined sharply in late 2018. Thereafter, global equity markets rebounded strongly, as inflation diminished and the U.S. Federal Reserve (the “Fed”) announced a shift to less restrictive monetary policy.
Volatility rose in emerging market stocks, as the rising U.S. dollar and higher interest rates in the U.S. disrupted economic growth abroad. U.S.-China trade relations and debt concerns adversely affected the Chinese stock market, while Turkey and Argentina became embroiled in currency crises, largely due to hyperin-flation in both countries. An economic slowdown in Europe also led to negative performance for European equities. However, recent economic data indicates that Europe may emerge from its economic soft patch, reinvigorated by a manufacturing rebound and China’s economic stimulus.
Volatility in the U.S. equity market spiked in October, as a wide range of risks were brought to bear on markets, ranging from rising interest rates and slowing global growth to heightened trade tensions and political turmoil in several countries, including the United States. These risks manifested in a broad-based sell-off in December, leading to the worst December performance on record since 1931.
By comparison, fixed income securities delivered modest positive returns with relatively low volatility. In fixed income markets, short-term U.S. Treasury yields rose the fastest, while longer-term yields declined slightly. This led to positive returns for U.S. Treasuries and a substantial flattening of the yield curve. Investment-grade and high-yield corporate bonds also posted positive returns, as the credit fundamentals in corporate markets remained relatively solid.
The Fed increased short-term interest rates three times during the reporting period. For its last two meetings, the Fed left interest rates unchanged and signaled a slower pace of rate hikes in response to the global economic slowdown. Relatively low inflation and modest economic growth give the Fed room to maintain support for the economy until the economic data builds the case for changing interest rates.
Although fears of recession drove equity volatility higher at the end of 2018, we continue to believe the probability of recession in 2019 remains relatively low. Economic growth and global earnings are likely to slow somewhat in 2019 because the tax cut stimulus will be less pronounced, and the Fed’s rate hikes in 2018 will gain traction in 2019. We expect profit margins to continue to contract, which tends to happen late in the business cycle.
In addition, trade frictions look more baked into asset prices than a year ago, but markets may be overlooking European political risks. As Brexit moves forward, the United Kingdom and the European Union may face significant obstacles. Most recently, Britain’s Parliament voted to extend the deadline for the separation, as policy makers continue to seek the least disruptive ways to disentangle Europe’s second-largest economy from the European Union. U.S. and emerging market equities remain relatively attractive. Within U.S. equities, we believe that companies with high-quality earnings and strong balance sheets offer the most attractive risk/reward trade-off.
In this environment, investors need to think globally, extend their scope across a broad array of asset classes, and be nimble as market conditions change. We encourage you to talk with your financial advisor and visitblackrock.comfor further insight about investing in today’s markets.
Sincerely,

Rob Kapito
President, BlackRock Advisors, LLC

Rob Kapito
President, BlackRock Advisors, LLC
| | | | |
| Total Returns as of March 31, 2019 |
| | | 6-month | | 12-month |
U.S. large cap equities
(S&P 500® Index) | | (1.72)% | | 9.50% |
U.S. small cap equities
(Russell 2000® Index) | | (8.56) | | 2.05 |
International equities
(MSCI Europe, Australasia, Far East Index) | | (3.81) | | (3.71) |
Emerging market equities
(MSCI Emerging Markets Index) | | 1.71 | | (7.41) |
3-month Treasury bills
(ICE BofAML 3-Month U.S. Treasury Bill Index) | | 1.17 | | 2.12 |
U.S. Treasury securities
(ICE BofAML 10-Year U.S. Treasury Index) | | 7.08 | | 5.59 |
U.S. investment grade bonds
(Bloomberg Barclays U.S. Aggregate Bond Index) | | 4.63 | | 4.48 |
Tax-exempt municipal bonds
(S&P Municipal Bond Index) | | 4.32 | | 5.12 |
U.S. high yield bonds
(Bloomberg Barclays U.S. Corporate High Yield 2% Issuer Capped Index) | | 2.39 | | 5.93 |
| Past performance is no guarantee of future results. Index performance is shown for illustrative purposes only. You cannot invest directly in an index. |
| | |
| 2 | | T H I S P A G E I S N O T P A R T O F Y O U R F U N D R E P O R T |
Table of Contents

| | |
| Fund Summary as of March 31, 2019 | | BlackRock Advantage U.S. Total Market Fund, Inc. |
Investment Objective
BlackRock Advantage U.S. Total Market Fund, Inc.‘s (the “Fund”)investment objective is to seek long-term capital appreciation.
Portfolio Management Commentary
How did the Fund perform?
For the 12-month period ended March 31, 2019, the Fund, through its investment in Master Advantage U.S. Total Market LLC (the “Master LLC”), underperformed its benchmark, the Russell 3000® Index.
What factors influenced performance?
Trend- and sentiment-based insights detracted from relative performance for the period, with much of that signal underperformance concentrated in the fourth quarter of 2018. The quarter was characterized by broad de-risking and a sharp market sell-off, primarily driven by slowing global growth, hawkish comments by the Fed, heightened trade tensions and fears of approaching the end of the cycle. As the sell-off was largely driven by broad geopolitical and macro-economic factors, the market movements were often disconnected with company-specific sentiment, creating a difficult environment for trend- and sentiment-based signals. Among these, a machine-learned insight that gauges broker sentiment by analyzing sell-side research reports was one of the most significant detractors for the period. Continuing a trend seen through the end of 2017 and into 2018, investors preferred growth areas of the market to value areas of the market throughout most of the 12-month period. Other than a temporary rotation out of growth during the fourth quarter, growth stocks significantly outperformed value stocks over the course of the period, creating a difficult environment for more traditional value-based insights. In particular, evaluating companies based on forward sales to enterprise value was the top individual detractor. Evaluating exchange-traded fund flows to identify crowded trades and position against these overvalued areas of the market detracted from relative returns as well. Lastly, the Master LLC’s macro thematic insights were a drag on relative performance throughout the period. Performance in the financials sector was particularly weak, as unexpected central bank policy shifts drove sector returns as opposed to company- or industry-specific factors.
Concerns around slowing global growth, weakening economic data and signs that we are approaching the end of the current market cycle has caused investors to re-focus on identifying quality companies with sustainable businesses. Although the portfolio’s fundamental insights were generally mixed, there were select quality insights that added significant value throughout the period. Rewarding companies that are more efficiently using their operating assets to grow, a measure of company quality, was a top contributing insight for the period. A text-based signal that identifies discrepancies between executive comments and company regulatory filings, an alternative quality evaluation, proved beneficial as well. Rewarding companies with positive dividend growth trends was also additive, as this is yet another measure of the health of the company and its business. Although trend- and sentiment-based insights were negative in aggregate, select signals that provide a more quality-based lens were additive. In particular, an insight that gauges sentiment from informed bond investors was the top contributing insight over the period. This effect was unsurprising, as periods of heightened interest rate volatility experienced over the period caused bond investors to flock to higher quality companies with lower risk of default. In a similar vein, a signal that conducts text-based analyses of management conference calls to determine longer-term trends in company fundamentals proved beneficial, considering the previously noted shift back toward stronger company fundamentals.
Describe recent portfolio activity.
The Master LLC maintained a balanced allocation of risk across all major return drivers. A number of new stock selection insights were added to the portfolio, including one that captures the location of hotel booking trends and invests in related stocks most sensitive to those areas. The Master LLC also added a machine-learned signal that pulls from several alternative data sources to try and more accurately gauge consumer transactions. A new macro thematic model that evaluates industries across various inputs such as labor costs and hiring activity was added as well.
Describe portfolio positioning at period end.
Relative to the Russell 3000® Index, the Master LLC was positioned essentially neutrally from a sector perspective. The Master LLC had slight overweight positions in the real estate and industrials sectors and slight underweight positions in the communication services and consumer discretionary sectors.
The views expressed reflect the opinions of BlackRock as of the date of this report and are subject to change based on changes in market, economic or other conditions. These views are not intended to be a forecast of future events and are no guarantee of future results.
| | |
| 4 | | 2 0 1 9 B L A C K R O C K A N N U A L R E P O R T T O S H A R E H O L D E R S |
| | |
| Fund Summary as of March 31, 2019 (continued) | | BlackRock Advantage U.S. Total Market Fund, Inc. |
Total Return Based on a $10,000 Investment
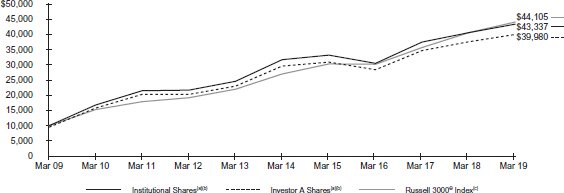
| (a) | Assuming maximum sales charges, if any, transaction costs and other operating expenses, including administration fees. Institutional Shares do not have a sales charge. |
| (b) | The Fund invests all of its assets in the Master LLC. Under normal circumstances, the Master LLC seeks to invest at least 80% of its net assets, plus the amount of any borrowings for investment purposes, in equity securities of U.S. issuers and derivatives that have similar economic characteristics to such securities. The Fund’s total returns prior to December 15, 2017 are the returns of the Fund when it followed a different investment objective and different investment strategies under the name “BlackRock Value Opportunities Fund, Inc.” |
| (c) | A float-adjusted, market capitalization–weighted index of the 3,000 largest U.S. companies based on total market capitalization that represents about 98% of the investable U.S. equity market. |
Performance Summary for the Period Ended March 31, 2019
| | | | | | | | | | | | | | | | | | | | | | | | | | | | | | | | | | | | | | | | | | | | | | | | | | |
| | | | | | | Average Annual Total Returns(a),(b) |
| | | | | | | 1 Year | | | | 5 Years | | | | 10 Years |
| | | 6-Month
Total Returns | | | | w/o sales
charge | | w/sales
charge | | | | w/o sales
charge | | w/sales
charge | | | | w/o sales
charge | | w/sales
charge |
Institutional | | | | (2.97 | )% | | | | | | | | | 6.76 | % | | | | N/A | | | | | | | | | | 6.48 | % | | | | N/A | | | | | | | | | | 15.79 | % | | | | N/A | |
Investor A | | | | (3.08 | ) | | | | | | | | | 6.52 | | | | | 0.93 | % | | | | | | | | | 6.22 | | | | | 5.08 | % | | | | | | | | | 15.49 | | | | | 14.86 | % |
Investor C | | | | (3.42 | ) | | | | | | | | | 5.73 | | | | | 4.98 | | | | | | | | | | 5.37 | | | | | 5.37 | | | | | | | | | | 14.48 | | | | | 14.48 | |
Class K | | | | (3.03 | ) | | | | | | | | | 6.74 | | | | | N/A | | | | | | | | | | 6.47 | | | | | N/A | | | | | | | | | | 15.79 | | | | | N/A | |
Class R | | | | (3.16 | ) | | | | | | | | | 6.31 | | | | | N/A | | | | | | | | | | 5.92 | | | | | N/A | | | | | | | | | | 15.14 | | | | | N/A | |
Russell 3000® Index | | | | (2.27 | ) | | | | | | | | | 8.77 | | | | | N/A | | | | | | | | | | 10.36 | | | | | N/A | | | | | | | | | | 16.00 | | | | | N/A | |
| | (a) | Assuming maximum sales charges, if any. Average annual total returns with and without sales charges reflect reductions for distribution and service fees. See “About Fund Performance” on page 6 for a detailed description of share classes, including any related sales charges and fees, and how performance was calculated for certain share classes. | |
| | (b) | The Fund invests all of its assets in the Master LLC. Under normal circumstances, the Master LLC seeks to invest at least 80% of its net assets, plus the amount of any borrowings for investment purposes, in equity securities of U.S. issuers and derivatives that have similar economic characteristics to such securities. The Fund’s total returns prior to December 15, 2017 are the returns of the Fund when it followed a different investment objective and different investment strategies under the name “BlackRock Value Opportunities Fund, Inc.” | |
N/A — Not applicable as share class and index do not have a sales charge.
Past performance is not indicative of future results.
Performance results may include adjustments made for financial reporting purposes in accordance with U.S. generally accepted accounting principles.
Expense Example
| | | | | | | | | | | | | | | | | | | | | | | | | | | | | | | | | | | | | | | | |
| | | Actual | | | | Hypothetical(b) | | |
| | | Beginning
Account Value
(10/01/18) | | Ending
Account Value
(03/31/19) | | Expenses Paid
During the Period(a) | | | | Beginning
Account Value
(10/01/18) | | Ending
Account Value
(03/31/19) | | Expenses Paid During the Period(a) | | Annualized
Expense
Ratio |
Institutional | | | | $1,000.00 | | | | | $970.30 | | | | | $2.38 | | | | | | | | | | $1,000.00 | | | | | $1,022.51 | | | | | $2.44 | | | | | 0.48 | % |
Investor A | | | | 1,000.00 | | | | | 969.20 | | | | | 3.58 | | | | | | | | | | 1,000.00 | | | | | 1,021.29 | | | | | 3.68 | | | | | 0.73 | |
Investor C | | | | 1,000.00 | | | | | 965.80 | | | | | 7.25 | | | | | | | | | | 1,000.00 | | | | | 1,017.55 | | | | | 7.45 | | | | | 1.48 | |
Class K | | | | 1,000.00 | | | | | 969.70 | | | | | 2.11 | | | | | | | | | | 1,000.00 | | | | | 1,022.79 | | | | | 2.17 | | | | | 0.43 | |
Class R | | | | 1,000.00 | | | | | 968.40 | | | | | 4.81 | | | | | | | | | | 1,000.00 | | | | | 1,020.04 | | | | | 4.94 | | | | | 0.98 | |
| | (a) | For each class of the Fund, expenses are equal to the annualized expense ratio for the class, multiplied by the average account value over the period, multiplied by 182/365 (to reflect the one-half year period shown). Because the Fund invests all of its assets in the Master LLC, the expense example reflects the net expenses of both the Fund and the Master LLC in which it invests. | |
| | (b) | Hypothetical 5% annual return before expenses is calculated by prorating the number of days in the most recent fiscal half year divided by 365. See “Disclosure of Expenses” on page 6 for further information on how expenses were calculated. | |
| | |
| About Fund Performance | | BlackRock Advantage U.S. Total Market Fund, Inc. |
Institutional and Class K Sharesare not subject to any sales charge. These shares bear no ongoing distribution or service fees and are available only to certain eligible investors. Class K Shares performance shown prior to the Class K Shares inception date of January 25, 2018 is that of Institutional Shares. The performance of the Fund’s Class K Shares would be substantially similar to Institutional Shares because Class K Shares and Institutional Shares invest in the same portfolio of securities and performance would only differ to the extent that Class K Shares and Institutional Shares have different expenses. The actual returns of Class K Shares would have been higher than those of the Institutional Shares because Class K Shares have lower expenses than the Institutional Shares.
Investor A Sharesare subject to a maximum initial sales charge (front-end load) of 5.25% and a service fee of 0.25% per year (but no distribution fee). Certain redemptions of these shares may be subject to a contingent deferred sales charge (“CDSC”) where no initial sales charge was paid at the time of purchase. These shares are generally available through financial intermediaries.
Investor C Sharesare subject to a 1.00% CDSC if redeemed within one year of purchase. In addition, these shares are subject to a distribution fee of 0.75% per year and a service fee of 0.25% per year. These shares are generally available through financial intermediaries. Effective November 8, 2018, the Fund adopted an automatic conversion feature whereby Investor C Shares held for approximately ten years will be automatically converted into Investor A Shares, and, thereafter, investors will be subject to lower ongoing fees.
Class R Sharesare not subject to any sales charge. These shares are subject to a distribution fee of 0.25% per year and a service fee of 0.25% per year. These shares are available only to certain employer-sponsored retirement plans.
Performance information reflects past performance and does not guarantee future results. Current performance may be lower or higher than the performance data quoted. Refer towww.blackrock.comto obtain performance data current to the most recent month-end. Performance results do not reflect the deduction of taxes that a shareholder would pay on fund distributions or the redemption of fund shares. Figures shown in the performance tables on the previous page assume reinvestment of all distributions, if any, at net asset value (“NAV”) on the ex-dividend date. Investment return and principal value of shares will fluctuate so that shares, when redeemed, may be worth more or less than their original cost. Distributions paid to each class of shares will vary because of the different levels of service, distribution and transfer agency fees applicable to each class, which are deducted from the income available to be paid to shareholders.
BlackRock Advisors, LLC (the “Administrator”), the Fund’s administrator, has contractually agreed to waive and/or reimburse a portion of the Fund’s expenses. Without such waiver and/or reimbursement, the Fund’s performance would have been lower. The Administrator and/or voluntarily is under no obligation to continue waiving and/or reimbursing its fees after the applicable termination date of such agreement and such voluntary waiver and/or reimbursement may be reduced or discontinued at any time. See Note 4 of the Notes to Financial Statements for additional information on waivers and/or reimbursements.
Disclosure of Expenses
Shareholders of the Fund may incur the following charges: (a) transactional expenses, such as sales charges; and (b) operating expenses, including administration fees, service and distribution fees, including 12b-1 fees, acquired fund fees and expenses, and other fund expenses. The expense example shown on the previous page (which is based on a hypothetical investment of $1,000 invested on October 1, 2018 and held through March 31, 2019) is intended to assist shareholders both in calculating expenses based on an investment in the Fund and in comparing these expenses with similar costs of investing in other mutual funds.
The expense example provides information about actual account values and actual expenses. In order to estimate the expenses a shareholder paid during the period covered by this report, shareholders can divide their account value by $1,000 and then multiply the result by the number corresponding to their share class under the heading entitled “Expenses Paid During the Period.”
The expense example also provides information about hypothetical account values and hypothetical expenses based on the Fund’s actual expense ratio and an assumed rate of return of 5% per year before expenses. In order to assist shareholders in comparing the ongoing expenses of investing in the Fund and other funds, compare the 5% hypothetical examples with the 5% hypothetical examples that appear in shareholder reports of other funds.
The expenses shown in the expense example are intended to highlight shareholders’ ongoing costs only and do not reflect transactional expenses, such as sales charges, if any. Therefore, the hypothetical example is useful in comparing ongoing expenses only, and will not help shareholders determine the relative total expenses of owning different funds. If these transactional expenses were included, shareholder expenses would have been higher.
Derivative Financial Instruments
The Master LLC may invest in various derivative financial instruments. These instruments are used to obtain exposure to a security, commodity, index, market, and/or other assets without owning or taking physical custody of securities, commodities and/or other referenced assets or to manage market, equity, credit, interest rate, foreign currency exchange rate, commodity and/or other risks. Derivative financial instruments may give rise to a form of economic leverage and involve risks, including the imperfect correlation between the value of a derivative financial instrument and the underlying asset, possible default of the counterparty to the transaction or illiquidity of the instrument. The Master LLC’s successful use of a derivative financial instrument depends on the investment adviser’s ability to predict pertinent market movements accurately, which cannot be assured. The use of these instruments may result in losses greater than if they had not been used, may limit the amount of appreciation the Master LLC can realize on an investment and/or may result in lower distributions paid to shareholders. The Master LLC’s investments in these instruments, if any, are discussed in detail in the Master LLC’s Notes to Financial Statements.
| | |
| 6 | | 2 0 1 9 B L A C K R O C K A N N U A L R E P O R T T O S H A R E H O L D E R S |
Statement of Assets and Liabilities
March 31, 2019
| | | | |
| | | BlackRock
Advantage
U.S. Total
Market Fund, Inc. | |
| |
ASSETS | | | | |
Investments at value — Master LLC | | $ | 425,912,012 | |
Receivables: | | | | |
Capital shares sold | | | 47,636 | |
From the Administrator | | | 38,665 | |
Withdrawals from the Master LLC | | | 1,121,094 | |
Prepaid expenses | | | 36,614 | |
| | | | |
Total assets | | | 427,156,021 | |
| | | | |
| |
LIABILITIES | | | | |
Payables: | | | | |
Administration fees | | | 262,057 | |
Capital shares redeemed | | | 1,168,730 | |
Officer’s fees | | | 161 | |
Other accrued expenses | | | 159,475 | |
Service and distribution fees | | | 104,036 | |
Transfer agent fees | | | 111,762 | |
| | | | |
Total liabilities | | | 1,806,221 | |
| | | | |
| |
NET ASSETS | | $ | 425,349,800 | |
| | | | |
| |
NET ASSETS CONSIST OF | | | | |
Paid-in capital | | $ | 412,423,289 | |
Accumulated earnings | | | 12,926,511 | |
| | | | |
NET ASSETS | | $ | 425,349,800 | |
| | | | |
| |
NET ASSET VALUE | | | | |
Institutional— Based on net assets of $87,248,348 and 3,184,745 shares outstanding, 100 million shares authorized, $0.10 par value | | $ | 27.40 | |
| | | | |
Investor A— Based on net assets of $279,013,680 and 10,640,822 shares outstanding, 100 million shares authorized, $0.10 par value | | $ | 26.22 | |
| | | | |
Investor C— Based on net assets of $39,413,327 and 2,341,524 shares outstanding, 100 million shares authorized, $0.10 par value | | $ | 16.83 | |
| | | | |
Class K— Based on net assets of $2,241,434 and 81,867 shares outstanding, 2 billion shares authorized, $0.10 par value | | $ | 27.38 | |
| | | | |
Class R— Based on net assets of $17,433,011 and 908,812 shares outstanding, 100 million shares authorized, $0.10 par value | | $ | 19.18 | |
| | | | |
See notes to financial statements.
| | | | |
| F U N D F I N A N C I A L S T A T E M E N T S | | | 7 | |
Statement of Operations
Year Ended March 31, 2019
| | | | |
| | | BlackRock
Advantage
U.S. Total
Market Fund, Inc. | |
| |
INVESTMENT INCOME | | | | |
Net investment income allocated from the Master LLC: | | | | |
Dividends — unaffiliated | | $ | 8,977,443 | |
Dividends — affiliated | | | 84,353 | |
Securities lending income — affiliated — net | | | 3,583 | |
Foreign taxes withheld | | | (9,838 | ) |
Expenses | | | (2,491,654 | ) |
Fees waived | | | 561,516 | |
| | | | |
Total investment income | | | 7,125,403 | |
| | | | |
| |
FUND EXPENSES | | | | |
Service and distribution — class specific | | | 1,337,587 | |
Administration | | | 1,150,523 | |
Transfer agent — class specific | | | 732,291 | |
Registration | | | 89,278 | |
Printing | | | 63,127 | |
Board realignment and consolidation | | | 40,870 | |
Professional | | | 34,601 | |
Offering | | | 34,566 | |
Accounting services | | | 5,244 | |
Officer | | | 205 | |
Miscellaneous | | | 20,802 | |
| | | | |
Total expenses | | | 3,509,094 | |
| | | | |
Less: | | | | |
Fees waived and/or reimbursed by the Administrator | | | (1,368,449 | ) |
Transfer agent fees waived and/or reimbursed — class specific | | | (502,216 | ) |
| | | | |
Total expenses after fees waived and/or reimbursed | | | 1,638,429 | |
| | | | |
Net investment income | | | 5,486,974 | |
| | | | |
| |
REALIZED AND UNREALIZED GAIN (LOSS) ALLOCATED FROM THE MASTER LLC | | | | |
Net realized loss from investments, foreign currency transactions and futures contracts | | | (2,300,573 | ) |
Net change in unrealized appreciation (depreciation) on investments, foreign currency translations and futures contracts | | | 25,823,752 | |
| | | | |
Total realized and unrealized gain | | | 23,523,179 | |
| | | | |
NET INCREASE IN NET ASSETS RESULTING FROM OPERATIONS | | $ | 29,010,153 | |
| | | | |
See notes to financial statements.
| | |
| 8 | | 2 0 1 9 B L A C K R O C K A N N U A L R E P O R T T O S H A R E H O L D E R S |
Statements of Changes in Net Assets
| | | | | | | | |
| | | BlackRock Advantage U.S. Total Market Fund, Inc. | |
| | | For the Year Ended March 31, | |
| | | 2019 | | | 2018 | |
| | |
INCREASE (DECREASE) IN NET ASSETS | | | | | | | | |
| | |
OPERATIONS | | | | | | | | |
Net investment income | | $ | 5,486,974 | | | $ | 1,222,746 | |
Net realized gain (loss) | | | (2,300,573 | ) | | | 154,603,484 | |
Net change in unrealized appreciation (depreciation) | | | 25,823,752 | | | | (106,285,347 | ) |
| | | | | | | | |
Net increase in net assets resulting from operations | | | 29,010,153 | | | | 49,540,883 | |
| | | | | | | | |
| | |
DISTRIBUTIONS TO SHAREHOLDERS(a)(b) | | | | | | | | |
Institutional | | | (22,971,347 | ) | | | (23,394,234 | ) |
Investor A | | | (66,161,942 | ) | | | (56,246,259 | ) |
Investor B | | | — | | | | (4,423 | ) |
Investor C | | | (17,092,830 | ) | | | (12,597,984 | ) |
Class K | | | (577,182 | ) | | | — | |
Class R | | | (6,060,880 | ) | | | (4,577,358 | ) |
| | | | | | | | |
Decrease in net assets resulting from distributions to shareholders | | | (112,864,181 | ) | | | (96,820,258 | ) |
| | | | | | | | |
| | |
CAPITAL SHARE TRANSACTIONS | | | | | | | | |
Net increase (decrease) in net assets derived from capital share transactions | | | 1,369,393 | | | | (123,738,303 | ) |
| | | | | | | | |
| | |
NET ASSETS(b) | | | | | | | | |
Total decrease in net assets | | | (82,484,635 | ) | | | (171,017,678 | ) |
Beginning of year | | | 507,834,435 | | | | 678,852,113 | |
| | | | | | | | |
End of year | | $ | 425,349,800 | | | $ | 507,834,435 | |
| | | | | | | | |
| (a) | Distributions for annual periods determined in accordance with U.S. federal income tax regulations. |
| (b) | Prior year distribution character information and undistributed net investment income has been modified or removed to conform with current year Regulation S-X presentation changes. Refer to Note 7 for this prior year information. |
See notes to financial statements.
| | | | |
| F U N D F I N A N C I A L S T A T E M E N T S | | | 9 | |
Financial Highlights
(For a share outstanding throughout each period)
| | | | | | | | | | | | | | | | | | | | |
| | | BlackRock Advantage U.S. Total Market Fund, Inc. | |
| |
| | | Institutional | |
| |
| | | Year Ended March 31, | |
| | | 2019 | | | 2018 | | | 2017 | | | 2016 | | | 2015 | |
| | | | | |
Net asset value, beginning of year | | $ | 32.34 | | | $ | 34.88 | | | $ | 29.38 | | | $ | 33.01 | | | $ | 31.51 | |
| | | | | | | | | | | | | | | | | | | | |
Net investment income(a) | | | 0.40 | | | | 0.17 | (b) | | | 0.06 | (c) | | | 0.04 | | | | 0.09 | |
Net realized and unrealized gain (loss) | | | 1.34 | | | | 2.66 | | | | 6.62 | | | | (2.72 | ) | | | 1.41 | |
| | | | | | | | | | | | | | | | | | | | |
Net increase (decrease) from investment operations | | | 1.74 | | | | 2.83 | | | | 6.68 | | | | (2.68 | ) | | | 1.50 | |
| | | | | | | | | | | | | | | | | | | | |
| | | | | |
Distributions(d) | | | | | | | | | | | | | | | | | | | | |
From net investment income | | | (0.45 | ) | | | (0.09 | ) | | | — | | | | (0.95 | ) | | | — | |
From net realized gain | | | (6.23 | ) | | | (5.28 | ) | | | (1.18 | ) | | | — | | | | — | |
| | | | | | | | | | | | | | | | | | | | |
Total distributions | | | (6.68 | ) | | | (5.37 | ) | | | (1.18 | ) | | | (0.95 | ) | | | — | |
| | | | | | | | | | | | | | | | | | | | |
| | | | | |
Net asset value, end of year | | $ | 27.40 | | | $ | 32.34 | | | $ | 34.88 | | | $ | 29.38 | | | $ | 33.01 | |
| | | | | | | | | | | | | | | | | | | | |
| | | | | |
Total Return(e) | | | | | | | | | | | | | | | | | | | | |
Based on net asset value | | | 6.76 | % | | | 8.48 | % | | | 22.72 | % | | | (8.11 | )% | | | 4.76 | % |
| | | | | | | | | | | | | | | | | | | | |
| | | | | |
Ratios to Average Net Assets(f) | | | | | | | | | | | | | | | | | | | | |
Total expenses | | | 0.98 | %(g) | | | 1.07 | %(h) | | | 0.94 | %(h) | | | 1.08 | %(h) | | | 1.00 | %(h) |
| | | | | | | | | | | | | | | | | | | | |
Total expenses after fees waived and/or reimbursed | | | 0.48 | %(g) | | | 0.92 | %(h) | | | 0.94 | %(h) | | | 1.08 | %(h) | | | 1.00 | %(h) |
| | | | | | | | | | | | | | | | | | | | |
Net investment income | | | 1.48 | %(g) | | | 0.52 | %(b)(h) | | | 0.19 | %(c)(h) | | | 0.12 | %(h) | | | 0.30 | %(h) |
| | | | | | | | | | | | | | | | | | | | |
| | | | | |
Supplemental Data | | | | | | | | | | | | | | | | | | | | |
Net assets, end of year (000) | | $ | 87,248 | | | $ | 113,466 | | | $ | 155,558 | | | $ | 135,744 | | | $ | 166,487 | |
| | | | | | | | | | | | | | | | | | | | |
Portfolio turnover rate of the Master LLC | | | 142 | % | | | 147 | % | | | 68 | % | | | 71 | % | | | 55 | % |
| | | | | | | | | | | | | | | | | | | | |
| (a) | Based on average shares outstanding. |
| (b) | Net investment income per share and the ratio of net investment income to average net assets includes $0.06 per share and 0.20%, respectively, resulting from a special dividend. |
| (c) | Net investment income per share and the ratio of net investment income to average net assets includes $0.03 per share and 0.08%, respectively, resulting from a special dividend. |
| (d) | Distributions for annual periods determined in accordance with U.S. federal income tax regulations. |
| (e) | Where applicable, assumes the reinvestment of distributions. |
| (f) | Includes the Fund’s share of the Master LLC’s allocated net expenses and/or net investment income. |
| (g) | Includes the Fund’s share of the Master LLC’s allocated fees waived of 0.12%. |
| (h) | Includes the Fund’s share of the Master LLC’s allocated fees waived of less than 0.01%. |
See notes to financial statements.
| | |
| 10 | | 2 0 1 9 B L A C K R O C K A N N U A L R E P O R T T O S H A R E H O L D E R S |
Financial Highlights (continued)
(For a share outstanding throughout each period)
| | | | | | | | | | | | | | | | | | | | |
| | | BlackRock Advantage U.S. Total Market Fund, Inc. (continued) | |
| |
| | | Investor A | |
| |
| | | Year Ended March 31, | |
| | | 2019 | | | 2018 | | | 2017 | | | 2016 | | | 2015 | |
| | | | | |
Net asset value, beginning of year | | $ | 31.22 | | | $ | 33.76 | | | $ | 28.55 | | | $ | 32.09 | | | $ | 30.70 | |
| | | | | | | | | | | | | | | | | | | | |
Net investment income (loss)(a) | | | 0.32 | | | | 0.08 | (b) | | | (0.03 | )(c) | | | (0.02 | ) | | | 0.00 | (d) |
Net realized and unrealized gain (loss) | | | 1.30 | | | | 2.58 | | | | 6.42 | | | | (2.64 | ) | | | 1.39 | |
| | | | | | | | | | | | | | | | | | | | |
Net increase (decrease) from investment operations | | | 1.62 | | | | 2.66 | | | | 6.39 | | | | (2.66 | ) | | | 1.39 | |
| | | | | | | | | | | | | | | | | | | | |
| | | | | |
Distributions(e) | | | | | | | | | | | | | | | | | | | | |
From net investment income | | | (0.39 | ) | | | (0.02 | ) | | | — | | | | (0.88 | ) | | | — | |
From net realized gain | | | (6.23 | ) | | | (5.18 | ) | | | (1.18 | ) | | | — | | | | — | |
| | | | | | | | | | | | | | | | | | | | |
Total distributions | | | (6.62 | ) | | | (5.20 | ) | | | (1.18 | ) | | | (0.88 | ) | | | — | |
| | | | | | | | | | | | | | | | | | | | |
| | | | | |
Net asset value, end of year | | $ | 26.22 | | | $ | 31.22 | | | $ | 33.76 | | | $ | 28.55 | | | $ | 32.09 | |
| | | | | | | | | | | | | | | | | | | | |
| | | | | |
Total Return(f) | | | | | | | | | | | | | | | | | | | | |
Based on net asset value | | | 6.52 | % | | | 8.20 | % | | | 22.36 | % | | | (8.28 | )% | | | 4.53 | % |
| | | | | | | | | | | | | | | | | | | | |
| | | | | |
Ratios to Average Net Assets(g) | | | | | | | | | | | | | | | | | | | | |
Total expenses | | | 1.25 | %(h) | | | 1.33 | %(i) | | | 1.24 | %(i) | | | 1.26 | %(i) | | | 1.24 | %(i) |
| | | | | | | | | | | | | | | | | | | | |
Total expenses after fees waived and/or reimbursed | | | 0.73 | %(h) | | | 1.19 | %(i) | | | 1.24 | %(i) | | | 1.26 | %(i) | | | 1.24 | %(i) |
| | | | | | | | | | | | | | | | | | | | |
Net investment income (loss) | | | 1.24 | %(h) | | | 0.23 | %(b)(i) | | | (0.10 | )%(c)(i) | | | (0.06 | )%(i) | | | 0.00 | %(i)(j) |
| | | | | | | | | | | | | | | | | | | | |
| | | | | |
Supplemental Data | | | | | | | | | | | | | | | | | | | | |
Net assets, end of year (000) | | $ | 279,014 | | | $ | 309,125 | | | $ | 366,669 | | | $ | 392,584 | | | $ | 458,593 | |
| | | | | | | | | | | | | | | | | | | | |
Portfolio turnover rate of the Master LLC | | | 142 | % | | | 147 | % | | | 68 | % | | | 71 | % | | | 55 | % |
| | | | | | | | | | | | | | | | | | | | |
| (a) | Based on average shares outstanding. |
| (b) | Net investment income per share and the ratio of net investment income to average net assets includes $0.06 per share and 0.20%, respectively, resulting from a special dividend. |
| (c) | Net investment income per share and the ratio of net investment income to average net assets includes $0.03 per share and 0.08%, respectively, resulting from a special dividend. |
| (d) | Amount is less than $0.005 per share. |
| (e) | Distributions for annual periods determined in accordance with U.S. federal income tax regulations. |
| (f) | Where applicable, excludes the effects of any sales charges and assumes the reinvestment of distributions. |
| (g) | Includes the Fund’s share of the Master LLC’s allocated net expenses and/or net investment income. |
| (h) | Includes the Fund’s share of the Master LLC’s allocated fees waived of 0.12%. |
| (i) | Includes the Fund’s share of the Master LLC’s allocated fees waived of less than 0.01%. |
| (j) | Amount is less than 0.005%. |
See notes to financial statements.
| | | | |
| F U N D F I N A N C I A L H I G H L I G H T S | | | 11 | |
Financial Highlights (continued)
(For a share outstanding throughout each period)
| | | | | | | | | | | | | | | | | | | | |
| | | BlackRock Advantage U.S. Total Market Fund, Inc. (continued) | |
| |
| | | Investor C | |
| |
| | | Year Ended March 31, | |
| | | 2019 | | | 2018 | | | 2017 | | | 2016 | | | 2015 | |
| | | | | |
Net asset value, beginning of year | | $ | 22.38 | | | $ | 25.28 | | | $ | 21.80 | | | $ | 24.72 | | | $ | 23.85 | |
| | | | | | | | | | | | | | | | | | | | |
Net investment income (loss)(a) | | | 0.08 | | | | (0.12 | )(b) | | | (0.22 | )(c) | | | (0.20 | ) | | | (0.20 | ) |
Net realized and unrealized gain (loss) | | | 0.83 | | | | 1.91 | | | | 4.88 | | | | (2.03 | ) | | | 1.07 | |
| | | | | | | | | | | | | | | | | | | | |
Net increase (decrease) from investment operations | | | 0.91 | | | | 1.79 | | | | 4.66 | | | | (2.23 | ) | | | 0.87 | |
| | | | | | | | | | | | | | | | | | | | |
| | | | | |
Distributions(d) | | | | | | | | | | | | | | | | | | | | |
From net investment income | | | (0.23 | ) | | | — | | | | — | | | | (0.69 | ) | | | — | |
From net realized gain | | | (6.23 | ) | | | (4.69 | ) | | | (1.18 | ) | | | — | | | | — | |
| | | | | | | | | | | | | | | | | | | | |
Total distributions | | | (6.46 | ) | | | (4.69 | ) | | | (1.18 | ) | | | (0.69 | ) | | | — | |
| | | | | | | | | | | | | | | | | | | | |
| | | | | |
Net asset value, end of year | | $ | 16.83 | | | $ | 22.38 | | | $ | 25.28 | | | $ | 21.80 | | | $ | 24.72 | |
| | | | | | | | | | | | | | | | | | | | |
| | | | | |
Total Return(e) | | | | | | | | | | | | | | | | | | | | |
Based on net asset value | | | 5.73 | % | | | 7.35 | % | | | 21.33 | % | | | (9.02 | )% | | | 3.65 | % |
| | | | | | | | | | | | | | | | | | | | |
| | | | | |
Ratios to Average Net Assets(f) | | | | | | | | | | | | | | | | | | | | |
Total expenses | | | 2.12 | %(g) | | | 2.16 | %(h) | | | 2.07 | %(h) | | | 2.09 | %(h) | | | 2.08 | % |
| | | | | | | | | | | | | | | | | | | | |
Total expenses after fees waived and/or reimbursed | | | 1.48 | %(g) | | | 2.00 | %(h) | | | 2.07 | %(h) | | | 2.09 | %(h) | | | 2.07 | % |
| | | | | | | | | | | | | | | | | | | | |
Net investment income (loss) | | | 0.46 | %(g) | | | (0.52 | )%(b)(h) | | | (0.93 | )%(c)(h) | | | (0.89 | )%(h) | | | (0.83 | )% |
| | | | | | | | | | | | | | | | | | | | |
| | | | | |
Supplemental Data | | | | | | | | | | | | | | | | | | | | |
Net assets, end of year (000) | | $ | 39,413 | | | $ | 59,781 | | | $ | 130,476 | | | $ | 136,066 | | | $ | 180,679 | |
| | | | | | | | | | | | | | | | | | | | |
Portfolio turnover rate of the Master LLC | | | 142 | % | | | 147 | % | | | 68 | % | | | 71 | % | | | 55 | % |
| | | | | | | | | | | | | | | | | | | | |
| (a) | Based on average shares outstanding. |
| (b) | Net investment income per share and the ratio of net investment income to average net assets includes $0.06 per share and 0.20%, respectively, resulting from a special dividend. |
| (c) | Net investment income per share and the ratio of net investment income to average net assets includes $0.03 per share and 0.08%, respectively, resulting from a special dividend. |
| (d) | Distributions for annual periods determined in accordance with U.S. federal income tax regulations. |
| (e) | Where applicable, excludes the effects of any sales charges and assumes the reinvestment of distributions. |
| (f) | Includes the Fund’s share of the Master LLC’s allocated net expenses and/or net investment income. |
| (g) | Includes the Fund’s share of the Master LLC’s allocated fees waived of 0.12%. |
| (h) | Includes the Fund’s share of the Master LLC’s allocated fees waived of less than 0.01%. |
See notes to financial statements.
| | |
| 12 | | 2 0 1 9 B L A C K R O C K A N N U A L R E P O R T T O S H A R E H O L D E R S |
Financial Highlights (continued)
(For a share outstanding throughout each period)
| | | | | | | | |
| | | BlackRock Advantage U.S. Total
Market Fund, Inc. (continued) | |
| |
| | | Class K | |
| | |
| | | Year
Ended
03/31/19 | | | Period
from
01/25/18(a) to
03/31/18 | |
| | | |
Net asset value, beginning of period | | $ | 32.34 | | | $ | 34.28 | |
| | | | | | | | |
Net investment income (loss)(b) | | | 0.42 | | | | (0.06 | ) |
Net realized and unrealized gain (loss) | | | 1.32 | | | | (1.88 | ) |
| | | | | | | | |
Net increase (decrease) from investment operations | | | 1.74 | | | | (1.94 | ) |
| | | | | | | | |
| | |
Distributions(c) | | | | | | | | |
From net investment income | | | (0.47 | ) | | | — | |
From net realized gain | | | (6.23 | ) | | | — | |
| | | | | | | | |
Total distributions | | | (6.70 | ) | | | — | |
| | | | | | | | |
| | |
Net asset value, end of period | | $ | 27.38 | | | $ | 32.34 | |
| | | | | | | | |
| | |
Total Return(d) | | | | | | | | |
Based on net asset value | | | 6.74 | % | | | (5.66 | )%(e) |
| | | | | | | | |
| | |
Ratios to Average Net Assets(f) | | | | | | | | |
Total expenses | | | 0.90 | %(g) | | | 0.87 | %(h) |
| | | | | | | | |
Total expenses after fees waived and/or reimbursed | | | 0.43 | %(g) | | | 0.43 | %(h) |
| | | | | | | | |
Net investment income (loss) | | | 1.53 | %(g) | | | (1.06 | )%(h) |
| | | | | | | | |
| | |
Supplemental Data | | | | | | | | |
Net assets, end of period (000) | | $ | 2,241 | | | $ | 2,736 | |
| | | | | | | | |
Portfolio turnover rate of the Master LLC. | | | 142 | % | | | 147 | % |
| | | | | | | | |
| (a) | Commencement of operations. |
| (b) | Based on average shares outstanding. |
| (c) | Distributions for annual periods determined in accordance with U.S. federal income tax regulations. |
| (d) | Where applicable, assumes the reinvestment of distributions. |
| (e) | Aggregate total return. |
| (f) | Includes the Fund’s share of the Master LLC’s allocated net expenses and/or net investment income. |
| (g) | Includes the Fund’s share of the Master LLC’s allocated fees waived of 0.12%. |
See notes to financial statements.
| | | | |
| F U N D F I N A N C I A L H I G H L I G H T S | | | 13 | |
Financial Highlights (continued)
(For a share outstanding throughout each period)
| | | | | | | | | | | | | | | | | | | | |
| | | BlackRock Advantage U.S. Total Market Fund, Inc. (continued) | |
| |
| | | Class R | |
| |
| | | Year Ended March 31, | |
| | | 2019 | | | 2018 | | | 2017 | | | 2016 | | | 2015 | |
| | | | | |
Net asset value, beginning of year | | $ | 24.61 | | | $ | 27.65 | | | $ | 23.63 | | | $ | 26.74 | | | $ | 25.66 | |
| | | | | | | | | | | | | | | | | | | | |
Net investment income (loss)(a) | | | 0.19 | | | | (0.00 | )(b)(c) | | | (0.11 | )(d) | | | (0.08 | ) | | | (0.09 | ) |
Net realized and unrealized gain (loss) | | | 0.95 | | | | 2.07 | | | | 5.31 | | | | (2.20 | ) | | | 1.17 | |
| | | | | | | | | | | | | | | | | | | | |
Net increase (decrease) from investment operations | | | 1.14 | | | | 2.07 | | | | 5.20 | | | | (2.28 | ) | | | 1.08 | |
| | | | | | | | | | | | | | | | | | | | |
| | | | | |
Distributions(e) | | | | | | | | | | | | | | | | | | | | |
From net investment income | | | (0.34 | ) | | | — | | | | — | | | | (0.83 | ) | | | — | |
From net realized gain | | | (6.23 | ) | | | (5.11 | ) | | | (1.18 | ) | | | — | | | | — | |
| | | | | | | | | | | | | | | | | | | | |
Total distributions | | | (6.57 | ) | | | (5.11 | ) | | | (1.18 | ) | | | (0.83 | ) | | | — | |
| | | | | | | | | | | | | | | | | | | | |
| | | | | |
Net asset value, end of year | | $ | 19.18 | | | $ | 24.61 | | | $ | 27.65 | | | $ | 23.63 | | | $ | 26.74 | |
| | | | | | | | | | | | | | | | | | | | |
| | | | | |
Total Return(f) | | | | | | | | | | | | | | | | | | | | |
Based on net asset value | | | 6.31 | % | | | 7.87 | % | | | 21.97 | % | | | (8.50 | )% | | | 4.21 | % |
| | | | | | | | | | | | | | | | | | | | |
| | | | | |
Ratios to Average Net Assets(g) | | | | | | | | | | | | | | | | | | | | |
Total expenses | | | 1.54 | %(h) | | | 1.60 | %(i) | | | 1.55 | %(i) | | | 1.51 | %(i) | | | 1.59 | %(i) |
| | | | | | | | | | | | | | | | | | | | |
Total expenses after fees waived and/or reimbursed | | | 0.98 | %(h) | | | 1.44 | %(i) | | | 1.55 | %(i) | | | 1.51 | %(i) | | | 1.59 | %(i) |
| | | | | | | | | | | | | | | | | | | | |
Net investment income (loss) | | | 0.98 | %(h) | | | (0.01 | )%(b)(i) | | | (0.42 | )%(d)(i) | | | (0.31 | )%(i) | | | (0.34 | )%(i) |
| | | | | | | | | | | | | | | | | | | | |
| | | | | |
Supplemental Data | | | | | | | | | | | | | | | | | | | | |
Net assets, end of year (000) | | $ | 17,433 | | | $ | 22,726 | | | $ | 26,004 | | | $ | 23,037 | | | $ | 25,624 | |
| | | | | | | | | | | | | | | | | | | | |
Portfolio turnover rate of the Master LLC | | | 142 | % | | | 147 | % | | | 68 | % | | | 71 | % | | | 55 | % |
| | | | | | | | | | | | | | | | | | | | |
| (a) | Based on average shares outstanding. |
| (b) | Net investment income per share and the ratio of net investment income to average net assets includes $0.06 per share and 0.20%, respectively, resulting from a special dividend. |
| (c) | Amount is greater than $(0.005) per share. |
| (d) | Net investment income per share and the ratio of net investment income to average net assets includes $0.03 per share and 0.08%, respectively, resulting from a special dividend. |
| (e) | Distributions for annual periods determined in accordance with U.S. federal income tax regulations. |
| (f) | Where applicable, assumes the reinvestment of distributions. |
| (g) | Includes the Fund’s share of the Master LLC’s allocated net expenses and/or net investment income. |
| (h) | Includes the Fund’s share of the Master LLC’s allocated fees waived of 0.12%. |
| (i) | Includes the Fund’s share of the Master LLC’s allocated fees waived of less than 0.01%. |
See notes to financial statements.
| | |
| 14 | | 2 0 1 9 B L A C K R O C K A N N U A L R E P O R T T O S H A R E H O L D E R S |
| | |
| Notes to Financial Statements | | BlackRock Advantage U.S. Total Market Fund, Inc. |
BlackRock Advantage U.S. Total Market Fund, Inc. (the “Fund”) is registered under the Investment Company Act of 1940, as amended (the “1940 Act”), as anopen-end management investment company. The Fund is classified as diversified. The Fund is organized as a Maryland corporation. The Fund seeks to achieve its investment objective by investing all of its assets in Master Advantage U.S. Total Market LLC (the “Master LLC”), an affiliate of the Fund, which has the same investment objective and strategies as the Fund. The value of the Fund’s investment in the Master LLC reflects the Fund’s proportionate interest in the net assets of the Master LLC. The performance of the Fund is directly affected by the performance of the Master LLC. At March 31, 2019, the percentage of the Master LLC owned by the Fund was 100%. The financial statements of the Master LLC, including the Schedule of Investments, are included elsewhere in this report and should be read in conjunction with the Fund’s financial statements.
The Fund offers multiple classes of shares. All classes of shares have identical voting, dividend, liquidation and other rights and are subject to the same terms and conditions, except that certain classes bear expenses related to the shareholder servicing and distribution of such shares. Institutional and Class K Shares are sold without a sales charge and only to certain eligible investors. Investor A Shares are generally sold with an initial sales charge, and may be subject to a contingent deferred sales charge (“CDSC”) for certain redemptions where no initial sales charge was paid at the time of purchase. Investor C Shares may be subject to a CDSC. However, the CDSC does not apply to redemptions by certain employer-sponsored retirement plans or to redemptions of shares acquired through the reinvestment of dividends and capital gains by existing shareholders. Class R Shares are sold without a sales charge and only to certain employer-sponsored retirement plans. Investor A, Investor C and Class R Shares bear certain expenses related to shareholder servicing of such shares, and Investor C and Class R Shares also bear certain expenses related to the distribution of such shares. Investor A and Investor C Shares are generally available through financial intermediaries. Effective November 8, 2018, the Fund adopted an automatic conversion feature whereby Investor C Shares held for approximately ten years will be automatically converted into Investor A Shares, and, thereafter, investors will be subject to lower ongoing fees. Each class has exclusive voting rights with respect to matters relating to its shareholder servicing and distribution expenditures (except that Investor C shareholders may vote on material changes to the Investor A Shares distribution and service plan). The Board of Directors of the Fund and the Board of Directors of the Master LLC are referred to throughout this report as the “Board of Directors” or the “Board” and the members are referred to as “Directors.”
| | | | | | | | | | | | |
| Share Class | | Initial Sales Charge | | | CDSC | | | Conversion Privilege | |
Institutional, Class K and Class R Shares | | | No | | | | No | | | | None | |
Investor A Shares | | | Yes | | | | No | (a) | | | None | |
Investor C Shares | | | No | | | | Yes | | | | To Investor A Shares after approximately 10 years | |
| | (a) | Investor A Shares may be subject to a CDSC for certain redemptions where no initial sales charge was paid at the time of purchase. | |
The Fund, together with certain other registered investment companies advised by BlackRock Advisors, LLC (the “Administrator”) or its affiliates, is included in a complex of equity, multi-asset, index and money market funds referred to as the BlackRock Multi-Asset Complex.
| 2. | SIGNIFICANT ACCOUNTING POLICIES |
The financial statements are prepared in conformity with accounting principles generally accepted in the United States of America (“U.S. GAAP”), which may require management to make estimates and assumptions that affect the reported amounts of assets and liabilities in the financial statements, disclosure of contingent assets and liabilities at the date of the financial statements and the reported amounts of increases and decreases in net assets from operations during the reporting period. Actual results could differ from those estimates. The Fund is considered an investment company under U.S. GAAP and follows the accounting and reporting guidance applicable to investment companies. Below is a summary of significant accounting policies:
Investment Transactions and Income Recognition:For financial reporting purposes, contributions to and withdrawals from the Master LLC are accounted for on a trade date basis. The Fund records its proportionate share of the Master LLC’s income, expenses and realized and unrealized gains and losses on a daily basis. In addition, the Fund accrues its own expenses. Income, expenses and realized and unrealized gains and losses are allocated daily to each class based on its relative net assets.
Distributions:Distributions paid by the Fund are recorded on theex-dividend date. The character and timing of distributions are determined in accordance with U.S. federal income tax regulations, which may differ from U.S. GAAP.
Offering Costs:Offering costs are amortized over a12-month period beginning with the commencement of operations of a class of shares.
Indemnifications:In the normal course of business, the Fund enters into contracts that contain a variety of representations that provide general indemnification. The Fund’s maximum exposure under these arrangements is unknown because it involves future potential claims against the Fund, which cannot be predicted with any certainty.
Other:Expenses directly related to the Fund or its classes are charged to the Fund or the applicable class. Other operating expenses shared by several funds, including other funds managed by the Administrator, are prorated among those funds on the basis of relative net assets or other appropriate methods. Expenses directly related to the Fund and other shared expenses prorated to the Fund are allocated daily to each class based on its relative net assets or other appropriate methods.
| 3. | INVESTMENT VALUATION AND FAIR VALUE MEASUREMENTS |
Investment Valuation Policies:The Fund’s policy is to value its financial instruments at fair value. The Fund records its investment in the Master LLC at fair value based on the Fund’s proportionate interest in the net assets of the Master LLC. Valuation of securities held by the Master LLC is discussed in Note 3 of the Master LLC’s Notes to Financial Statements, which are included elsewhere in this report.
| | | | |
| F U N D N O T E S T O F I N A N C I A L S T A T E M E N T S | | | 15 | |
| | |
| Notes to Financial Statements (continued) | | BlackRock Advantage U.S. Total Market Fund, Inc. |
| 4. | ADMINISTRATION AGREEMENT AND OTHER TRANSACTIONS WITH AFFILIATES |
Administration:The Fund entered into an Administration Agreement with the Administrator, an indirect, wholly-owned subsidiary of BlackRock, Inc. (“BlackRock”), to provide administrative services (other than investment advice and related portfolio activities).
For such services, the Fund pays the Administrator a monthly fee at an annual rate equal to 0.25% of the average daily value of the Fund’s net assets. The Fund does not pay an investment advisory fee or investment management fee.
Service and Distribution Fees:The Fund entered into a Distribution Agreement and a Distribution and Service Plan with BlackRock Investments, LLC (“BRIL”), an affiliate of the Administrator. Pursuant to the Distribution and Service Plan and in accordance withRule 12b-1 under the 1940 Act, the Fund pays BRIL ongoing service and distribution fees. The fees are accrued daily and paid monthly at annual rates based upon the average daily net assets of the relevant share class of the Fund as follows:
| | | | | | | | | | | | |
| | | Investor A | | | Investor C | | | Class R | |
Distribution Fee | | | — | % | | | 0.75 | % | | | 0.25 | % |
Service Fee | | | 0.25 | | | | 0.25 | | | | 0.25 | |
BRIL and broker-dealers, pursuant tosub-agreements with BRIL, provide shareholder servicing and distribution services to the Fund. The ongoing service and/or distribution fee compensates BRIL and each broker-dealer for providing shareholder servicing and/or distribution related services to shareholders.
For the year ended March 31, 2019, the following table shows the class specific service and distribution fees borne directly by each share class of the Fund:
| | | | | | |
| Investor A | | Investor C | | Class R | | Total |
$734,205 | | $502,404 | | $100,978 | | $1,337,587 |
Transfer Agent:Pursuant to written agreements, certain financial intermediaries, some of which may be affiliates, provide the Fund withsub-accounting, recordkeeping,sub-transfer agency and other administrative services with respect to servicing of underlying investor accounts. For these services, these entities receive an asset-based fee or an annual fee per shareholder account, which will vary depending on share class and/or net assets. For the year ended March 31, 2019, the Fund did not pay any amounts to affiliates in return for these services.
The Administrator maintains a call center that is responsible for providing certain shareholder services to the Fund. Shareholder services include responding to inquiries and processing purchases and sales based upon instructions from shareholders. For the year ended March 31, 2019, the Fund reimbursed the Administrator the following amounts for costs incurred in running the call center, which are included in transfer agent — class specific in the Statement of Operations:
| | | | | | | | | | |
| Institutional | | Investor A | | Investor C | | Class K | | Class R | | Total |
$5,517 | | $4,853 | | $945 | | $10 | | $180 | | $11,505 |
For the year ended March 31, 2019, the following table shows the class specific transfer agent fees borne directly by each share class of the Fund:
| | | | | | | | | | |
| Institutional | | Investor A | | Investor C | | Class K | | Class R | | Total |
$121,327 | | $438,653 | | $133,334 | | $1,224 | | $37,753 | | $732,291 |
Other Fees:For the year ended March 31, 2019, affiliates earned underwriting discounts, direct commissions and dealer concessions on sales of the Fund’s Investor A Shares, which totaled $3,194.
For the year ended March 31, 2019, affiliates received CDSCs on the Fund’s Investor C Shares which totaled $222.
Expense Reimbursements:With respect to the Fund, the Administrator contractually agreed to waive and/or reimburse fees or expenses in order to limit expenses, excluding interest expense, dividend expense, tax expense, acquired fund fees and expenses, and certain other fund expenses, which constitute extraordinary expenses not incurred in the ordinary course of the Fund’s business (“expense limitation”). The expense limitations as a percentage of average daily net assets are as follows:
| | | | |
Institutional | | | 0.48 | % |
Investor A | | | 0.73 | |
Investor C | | | 1.48 | |
Class K | | | 0.43 | |
Class R | | | 0.98 | |
The Administrator has agreed not to reduce or discontinue these contractual expense limitations through July 31, 2019, unless approved by the Board, including a majority of the directors who are not “interested persons” of the Fund, as defined in the 1940 Act (“Independent Directors”), or by a vote of a majority of the outstanding voting securities of the Fund. For the year ended March 31, 2019, the Administrator waived and/or reimbursed $1,348,014, which is included in fees waived and/or reimbursed by the Administrator in the Statement of Operations.
These amounts waived and/or reimbursed are included in transfer agent fees waived and/or reimbursed — class specific in the Statement of Operations. For the year ended March 31, 2019, class specific expense waivers and/or reimbursements are as follows:
| | | | | | | | | | | | | | | | | | | | | | | | |
| | | Institutional | | | Investor A | | | Investor C | | | Class K | | | Class R | | | Total | |
Transfer agent fees waived and/or reimbursed — class specific | | | $74,555 | | | | $292,827 | | | | $105,952 | | | | $1,224 | | | | $27,658 | | | | $502,216 | |
| | |
| 16 | | 2 0 1 9 B L A C K R O C K A N N U A L R E P O R T T O S H A R E H O L D E R S |
| | |
| Notes to Financial Statements (continued) | | BlackRock Advantage U.S. Total Market Fund, Inc. |
The Fund has incurred expenses in connection with the realignment and consolidation of the boards of trustees of certain BlackRock-advised funds. The Administrator has voluntarily agreed to reimburse the Fund for all or a portion of such expenses, which amounts are included in fees waived and/or reimbursed by the Administrator in the Statement of Operations. For the year ended March 31, 2019, the amount reimbursed for the Fund was $20,435.
With respect to the contractual expense limitation, if during the Fund’s fiscal year the operating expenses of a share class, that at any time during the prior two fiscal years received a waiver and/or reimbursement from the Administrator, are less than the current expense limitation for that share class, the Administrator is entitled to be reimbursed by such share class up to the lesser of: (a) the amount of fees waived and/or expenses reimbursed during those prior two fiscal years under the agreement and (b) an amount not to exceed either the current expense limitation of that share class or the expense limitation of the share class in effect at the time that the share class received the applicable waiver and/or reimbursement, provided that:
(1) the Fund, of which the share class is a part, has more than $50 million in assets for the fiscal year, and
(2) the Administrator or an affiliate continues to serve as the Fund’s investment adviser or administrator.
This repayment applies only to the contractual expense limitation on net expenses and does not apply to the contractual investment advisory fee waiver described above or any voluntary waivers that may be in effect from time to time.
On March 31, 2019, the fund level and class specific waivers and/or reimbursements subject to possible future recoupment under the expense limitation agreement are as follows:
| | | | | | | | | | |
| | | | | | |
| | | Expiring March 31, |
| | | 2020 | | 2021 |
Fund Level | | | $ | 692,991 | | | | $ | 1,348,014 | |
Institutional | | | | 50,087 | | | | | 74,555 | |
Investor A | | | | 122,752 | | | | | 292,827 | |
Investor C | | | | 36,681 | | | | | 105,952 | |
K Shares | | | | — | | | | | 1,224 | |
R Shares | | | | 10,172 | | | | | 27,658 | |
Interfund Lending:In accordance with an exemptive order (the “Order”) from the U.S. Securities and Exchange Commission (“SEC”), the Fund may participate in a joint lending and borrowing facility for temporary purposes (the “Interfund Lending Program”), subject to compliance with the terms and conditions of the Order, and to the extent permitted by the Fund’s investment policies and restrictions. The Fund is currently permitted to borrow and lend under the Interfund Lending Program.
A lending BlackRock fund may lend in aggregate up to 15% of its net assets, but may not lend more than 5% of its net assets to any one borrowing fund through the Interfund Lending Program. A borrowing BlackRock fund may not borrow through the Interfund Lending Program or from any other source more than 33 1/3% of its total assets (or any lower threshold provided for by the fund’s investment restrictions). If a borrowing BlackRock fund’s total outstanding borrowings exceed 10% of its total assets, each of its outstanding interfund loans will be subject to collateralization of at least 102% of the outstanding principal value of the loan. All interfund loans are for temporary or emergency purposes and the interest rate to be charged will be the average of the highest current overnight repurchase agreement rate available to a lending fund and the bank loan rate, as calculated according to a formula established by the Board.
During the year ended March 31, 2019, the Fund did not participate in the Interfund Lending Program.
Directors and Officers:Certain directors and/or officers of the Fund are directors and/or officers of BlackRock or its affiliates. The Fund reimburses the Administrator for a portion of the compensation paid to the Fund’s Chief Compliance Officer, which is included in Officer in the Statement of Operations.
It is the Fund’s policy to comply with the requirements of the Internal Revenue Code of 1986, as amended, applicable to regulated investment companies, and to distribute substantially all of its taxable income to its shareholders. Therefore, no U.S. federal income tax provision is required.
The Fund files U.S. federal and various state and local tax returns. No income tax returns are currently under examination. The statute of limitations on the Fund’s U.S. federal tax returns generally remains open for each of the four years ended March 31, 2019. The statutes of limitations on the Fund’s state and local tax returns may remain open for an additional year depending upon the jurisdiction.
Management has analyzed tax laws and regulations and their application to the Fund as of March 31, 2019, inclusive of the open tax return years, and does not believe that there are any uncertain tax positions that require recognition of a tax liability in the Fund’s financial statements.
U.S. GAAP requires that certain components of net assets be adjusted to reflect permanent differences between financial and tax reporting. These reclassifications have no effect on net assets or net asset values per share. As of period end, the following permanent differences attributable to distributions paid in excess of taxable income andnon-deductible expenses were reclassified to the following accounts:
| | | | |
Paid-in capital | | $ | (462,249 | ) |
Accumulated earnings | | | 462,249 | |
| | | | |
| F U N D N O T E S T O F I N A N C I A L S T A T E M E N T S | | | 17 | |
| | |
| Notes to Financial Statements (continued) | | BlackRock Advantage U.S. Total Market Fund, Inc. |
The tax character of distributions paid was as follows:
| | | | | | | | |
| | | 03/31/19 | | | 03/31/18(a) | |
Ordinary income | | $ | 26,957,982 | | | $ | 21,074,035 | |
Long-term capital gains | | | 85,906,199 | | | | 82,184,338 | |
| | | | | | | | |
| | $ | 112,864,181 | | | $ | 103,258,373 | |
| | | | | | | | |
| | (a) | Distribution amounts may include a portion of the proceeds from redeemed shares. | |
As of period end, the tax components of accumulated earnings were as follows:
| | | | |
Net unrealized gains(a) | | $ | 19,755,646 | |
Qualified late-year losses(b) | | | (6,829,135 | ) |
| | | | |
| | $ | 12,926,511 | |
| | | | |
| | (a) | The difference between book-basis andtax-basis net unrealized gains was attributable primarily to the tax deferral of losses on wash sales and the realization for tax purposes of unrealized gains/losses on certain futures contracts. | |
| | (b) | The Fund has elected to defer certain qualified late-year losses and recognize such losses in the next taxable year. | |
| 6. | CAPITAL SHARE TRANSACTIONS |
Transactions in capital shares for each class were as follows:
| | | | | | | | | | | | | | | | |
| | | Year Ended 03/31/19 | | | Year Ended 03/31/18 | |
| | | Shares | | | Amount | | | Shares | | | Amount | |
Institutional | | | | | | | | | | | | | | | | |
Shares sold | | | 270,063 | | | $ | 7,139,139 | | | | 659,587 | | | $ | 22,265,557 | |
Shares issued in reinvestment of distributions | | | 735,291 | | | | 19,359,007 | | | | 587,782 | | | | 19,330,026 | |
Shares redeemed | | | (1,329,225 | ) | | | (36,525,033 | ) | | | (2,198,880 | ) | | | (73,776,797 | ) |
| | | | | | | | | | | | | | | | |
Net decrease | | | (323,871 | ) | | $ | (10,026,887 | ) | | | (951,511 | ) | | $ | (32,181,214 | ) |
| | | | | | | | | | | | | | | | |
| | | | |
Investor A | | | | | | | | | | | | | | | | |
Shares issued from conversion(a) | | | — | | | $ | — | | | | 971 | | | $ | 30,553 | |
Shares sold and automatic conversion of shares | | | 1,132,063 | | | | 29,439,798 | | | | 2,813,655 | | | | 93,273,559 | |
Shares issued in reinvestment of distributions | | | 2,415,740 | | | | 60,954,044 | | | | 1,636,524 | | | | 52,063,299 | |
Shares redeemed. | | | (2,807,025 | ) | | | (72,207,810 | ) | | | (5,411,488 | ) | | | (176,035,090 | ) |
| | | | | | | | | | | | | | | | |
Net increase (decrease) | | | 740,778 | | | $ | 18,186,032 | | | | (960,338 | ) | | $ | (30,667,679 | ) |
| | | | | | | | | | | | | | | | |
| | | | |
Investor B | | | | | | | | | | | | | | | | |
Shares issued in reinvestment of distributions | | | — | | | $ | — | | | | 172 | | | $ | 4,423 | |
Shares converted(a) | | | — | | | | — | | | | (1,209 | ) | | | (30,553 | ) |
Shares redeemed and automatic conversion of shares | | | — | | | | — | | | | (4,299 | ) | | | (117,170 | ) |
| | | | | | | | | | | | | | | | |
Net decrease | | | — | | | $ | — | | | | (5,336 | ) | | $ | (143,300 | ) |
| | | | | | | | | | | | | | | | |
| | | | |
Investor C | | | | | | | | | | | | | | | | |
Shares sold | | | 381,485 | | | $ | 6,363,666 | | | | 251,354 | | | $ | 5,975,208 | |
Shares issued in reinvestment of distributions | | | 1,013,909 | | | | 16,646,560 | | | | 526,476 | | | | 12,194,818 | |
Shares redeemed | | | (1,725,428 | ) | | | (29,221,707 | ) | | | (3,267,645 | ) | | | (81,067,474 | ) |
| | | | | | | | | | | | | | | | |
Net decrease | | | (330,034 | ) | | $ | (6,211,481 | ) | | | (2,489,815 | ) | | $ | (62,897,448 | ) |
| | | | | | | | | | | | | | | | |
| | | |
| | | | | | | | | Period from 01/25/18(b)
to 03/31/18 | |
Class K | | | | | | | | | | | | | | | | |
Shares sold | | | 17,557 | | | $ | 479,353 | | | | 84,863 | | | $ | 2,757,506 | |
Shares issued in reinvestment of dividends | | | 21,730 | | | | 572,043 | | | | — | | | | — | |
Shares redeemed | | | (42,031 | ) | | | (1,144,005 | ) | | | (252 | ) | | | (8,067 | ) |
| | | | | | | | | | | | | | | | |
Net increase (decrease) | | | (2,744 | ) | | $ | (92,609 | ) | | | 84,611 | | | $ | 2,749,439 | |
| | | | | | | | | | | | | | | | |
| | |
| 18 | | 2 0 1 9 B L A C K R O C K A N N U A L R E P O R T T O S H A R E H O L D E R S |
| | |
| Notes to Financial Statements (continued) | | BlackRock Advantage U.S. Total Market Fund, Inc. |
| | | | | | | | | | | | | | | | |
| | | Year Ended 03/31/19 | | | Year Ended 03/31/18 | |
| | | Shares | | | Amount | | | Shares | | | Amount | |
Class R | | | | | | | | | | | | | | | | |
Shares sold | | | 175,934 | | | $ | 3,446,620 | | | | 142,833 | | | $ | 3,739,804 | |
Shares issued in reinvestment of distributions | | | 324,341 | | | | 6,038,037 | | | | 180,618 | | | | 4,576,033 | |
Shares redeemed | | | (514,881 | ) | | | (9,970,319 | ) | | | (340,583 | ) | | | (8,913,938 | ) |
| | | | | | | | | | | | | | | | |
Net decrease | | | (14,606 | ) | | $ | (485,662 | ) | | | (17,132 | ) | | $ | (598,101 | ) |
| | | | | | | | | | | | | | | | |
Total Net Increase (Decrease) | | | 69,523 | | | $ | 1,369,393 | | | | (4,339,521 | ) | | $ | (123,738,303 | ) |
| | | | | | | | | | | | | | | | |
| | (a) | On December 27, 2017, the Fund’s Investor B Shares converted into Investor A Shares. | |
| | (b) | Commencement of operations. | |
As of March 31, 2019, BlackRock Financial Management, Inc., an affiliate of the Fund, owned 7,160 Class K Shares of the Fund.
| 7. | REGULATIONS-X AMENDMENTS |
On August 17, 2018, the SEC adopted amendments to certain disclosure requirements in Securities Act ReleaseNo. 33-10532, Disclosure Update and Simplification. The Fund has adopted the amendments pertinent to RegulationS-X in this shareholder report. The amendments impacted certain disclosure presentation on the Statement of Assets and Liabilities, Statements of Changes in Net Assets and Notes to the Financial Statements.
Prior year distribution information and undistributed net investment income in the Statements of Changes in Net Assets has been modified to conform to the current year presentation in accordance with the RegulationS-X changes.
Distributions for the year ended March 31, 2018 were classified as follows:
| | | | | | | | |
| Share Class | | Net Investment Income | | | Net Realized Gain | |
Institutional | | | $403,360 | | | $ | 22,990,874 | |
Investor A | | | 172,514 | | | | 56,073,745 | |
Investor B | | | — | | | | 4,423 | |
Investor C | | | — | | | | 12,597,984 | |
Class R | | | — | | | | 4,577,358 | |
Undistributed net investment income as of March 31, 2018 was $830,463.
Management’s evaluation of the impact of all subsequent events on the Fund’s financial statements was completed through the date the financial statements were issued and the following item was noted:
Effective April 18, 2019, the credit agreement was extended until April 2020 under the same terms.
| | | | |
| F U N D N O T E S T O F I N A N C I A L S T A T E M E N T S | | | 19 | |
| | |
| Report of Independent Registered Public Accounting Firm |
To the Shareholders and Board of Directors of BlackRock Advantage U.S. Total Market Fund, Inc.:
Opinion on the Financial Statements and Financial Highlights
We have audited the accompanying statement of assets and liabilities of BlackRock Advantage U.S. Total Market Fund, Inc. (the “Fund”), as of March 31, 2019, the related statement of operations for the year then ended, the statements of changes in net assets for each of the two years in the period then ended, the financial highlights for each of the five years in the period then ended, and the related notes. In our opinion, the financial statements and financial highlights present fairly, in all material respects, the financial position of the Fund as of March 31, 2019, and the results of its operations for the year then ended, and the changes in its net assets for each of two years in the period ended and the financial highlights for each of the five years in the period then ended, in conformity with accounting principles generally accepted in the United States of America.
Basis for Opinion
These financial statements and financial highlights are the responsibility of the Fund’s management. Our responsibility is to express an opinion on the Fund’s financial statements and financial highlights based on our audits. We are a public accounting firm registered with the Public Company Accounting Oversight Board (United States) (PCAOB) and are required to be independent with respect to the Fund in accordance with the U.S. federal securities laws and the applicable rules and regulations of the Securities and Exchange Commission and the PCAOB.
We conducted our audits in accordance with the standards of the PCAOB. Those standards require that we plan and perform the audits to obtain reasonable assurance about whether the financial statements and financial highlights are free of material misstatement, whether due to error or fraud. The Fund is not required to have, nor were we engaged to perform, an audit of its internal control over financial reporting. As part of our audits we are required to obtain an understanding of internal control over financial reporting but not for the purpose of expressing an opinion on the effectiveness of the Fund’s internal control over financial reporting. Accordingly, we express no such opinion.
Our audits included performing procedures to assess the risks of material misstatement of the financial statements and financial highlights, whether due to error or fraud, and performing procedures that respond to those risks. Such procedures included examining, on a test basis, evidence regarding the amounts and disclosures in the financial statements and financial highlights. Our audits also included evaluating the accounting principles used and significant estimates made by management, as well as evaluating the overall presentation of the financial statements and financial highlights. We believe that our audits provide a reasonable basis for our opinion.
/s/Deloitte & Touche LLP
Boston, Massachusetts
May 21, 2019
We have served as the auditor of one or more BlackRock investment companies since 1992.
Important Tax Information (unaudited)
During the fiscal year ended March 31, 2019, the following information is provided with respect to the ordinary income distributions paid by the Fund:
| | | | | | | | |
| | | Payable Dates | |
| | | 04/12/18 | | | 12/07/18 | |
Qualified Dividend Income for Individuals(a) | | | 37.59% | | | | 64.66% | |
Dividends Qualifying for the Dividends Received Deduction for Corporations(a) | | | 46.28 | | | | 46.28 | |
Qualified Short-Term Capital Gains fornon-U.S. Residents(b) | | | 96.05 | | | | 37.33 | |
| | (a) | The Fund hereby designates the percentage indicated above or the maximum amount allowable by law. | |
| | (b) | Represents the portion of taxable ordinary income dividends eligible for exemption from U.S. withholding tax for nonresident aliens and foreign corporations. | |
Additionally the Fund distributed long-term capital gains of $4.943480 and $0.106755 per share to shareholders of record on April 10, 2018 and December 4, 2018 respectively.
| | |
| 20 | | 2 0 1 9 B L A C K R O C K A N N U A L R E P O R T T O S H A R E H O L D E R S |
| | |
| Portfolio Information as of March 31, 2019 | | Master Advantage U.S. Total Market LLC |
TEN LARGEST HOLDINGS
| | |
| Security | | Percent of Net Assets |
Amazon.com, Inc. | | 3% |
Apple Inc. | | 3 |
Johnson & Johnson | | 2 |
Microsoft Corp. | | 2 |
Merck & Co., Inc. | | 2 |
salesforce.com, Inc. | | 2 |
Amgen, Inc. | | 1 |
Gilead Sciences, Inc. | | 1 |
Automatic Data Processing, Inc. | | 1 |
UnitedHealth Group, Inc. | | 1 |
SECTOR ALLOCATION
| | | | |
| Sector | | Percent of Net Assets | | |
Information Technology | | 22% | | |
Health Care | | 15 | | |
Financials | | 14 | | |
Industrials | | 11 | | |
Consumer Discretionary | | 9 | | |
Communication Services | | 8 | | |
Consumer Staples | | 5 | | |
Real Estate | | 5 | | |
Energy | | 4 | | |
Materials | | 3 | | |
Utilities | | 3 | | |
Short-Term Securities | | 1 | | |
Liabilities in Excess of Other Assets | | — | | (a) |
| | (a) | Amount is greater than (0.5)%. | |
For Master LLC compliance purposes, the Master LLC’s sector classifications refer to one or more of the sectorsub-classifications used by one or more widely recognized market indexes or ratings group indexes, and/or as defined by the investment adviser. These definitions may not apply for purposes of this report, which may combine such sectorsub-classifications for reporting ease.
| | | | |
| M A S T E R L L C P O R T F O L I O I N F O R M A T I O N | | | 21 | |
| | |
Schedule of Investments March 31, 2019 | | Master Advantage U.S. Total Market LLC (Percentages shown are based on Net Assets) |
| | | | | | | | |
| Security | | Shares | | | Value | |
| | |
Common Stocks — 99.1% | | | | | | | | |
| | |
| Aerospace & Defense — 2.2% | | | | | | |
Boeing Co. | | | 7,444 | | | $ | 2,839,290 | |
General Dynamics Corp. | | | 12,399 | | | | 2,098,903 | |
Raytheon Co. | | | 23,131 | | | | 4,211,693 | |
| | | | | | | | |
| | | | | | | 9,149,886 | |
|
| Air Freight & Logistics — 0.1% | |
Forward Air Corp. | | | 7,765 | | | | 502,628 | |
| | | | | | | | |
|
| Airlines — 0.2% | |
Southwest Airlines Co. | | | 20,205 | | | | 1,048,842 | |
| | | | | | | | |
|
| Banks — 5.7% | |
Bank of America Corp. | | | 186,194 | | | | 5,137,092 | |
Bank of Hawaii Corp. | | | 7,338 | | | | 578,748 | |
BB&T Corp. | | | 108,842 | | | | 5,064,418 | |
Citizens Financial Group, Inc. | | | 115,182 | | | | 3,743,415 | |
East West Bancorp, Inc. | | | 9,524 | | | | 456,866 | |
Fifth Third Bancorp | | | 10,777 | | | | 271,796 | |
First Merchants Corp. | | | 3,975 | | | | 146,479 | |
First Republic Bank | | | 8,286 | | | | 832,412 | |
JPMorgan Chase & Co. | | | 49,973 | | | | 5,058,767 | |
PNC Financial Services Group, Inc. | | | 1,489 | | | | 182,641 | |
Republic First Bancorp, Inc.(a) | | | 63,588 | | | | 333,837 | |
Shore Bancshares, Inc. | | | 6,328 | | | | 94,351 | |
U.S. Bancorp | | | 4,949 | | | | 238,492 | |
Wells Fargo & Co. | | | 39,807 | | | | 1,923,474 | |
Western Alliance Bancorp(a) | | | 4,528 | | | | 185,829 | |
| | | | | | | | |
| | | | | | | 24,248,617 | |
|
| Beverages — 1.5% | |
Brown-Forman Corp., Class B | | | 4,873 | | | | 257,197 | |
Molson Coors Brewing Co., Class B | | | 2,596 | | | | 154,851 | |
Monster Beverage Corp.(a) | | | 22,834 | | | | 1,246,280 | |
PepsiCo, Inc. | | | 37,152 | | | | 4,552,978 | |
| | | | | | | | |
| | | | | | | 6,211,306 | |
|
| Biotechnology — 4.7% | |
AbbVie, Inc. | | | 34,617 | | | | 2,789,784 | |
Amgen, Inc. | | | 33,187 | | | | 6,304,866 | |
Biogen, Inc.(a) | | | 2,406 | | | | 568,730 | |
Celgene Corp.(a) | | | 10,458 | | | | 986,608 | |
Genomic Health, Inc.(a) | | | 13,573 | | | | 950,789 | |
Gilead Sciences, Inc. | | | 91,082 | | | | 5,921,241 | |
Incyte Corp.(a) | | | 5,801 | | | | 498,944 | |
Regeneron Pharmaceuticals, Inc.(a) | | | 1,362 | | | | 559,264 | |
Vertex Pharmaceuticals, Inc.(a) | | | 8,311 | | | | 1,528,808 | |
| | | | | | | | |
| | | | | | | 20,109,034 | |
|
| Building Products — 0.3% | |
Allegion PLC | | | 15,261 | | | | 1,384,325 | |
| | | | | | | | |
|
| Capital Markets — 3.1% | |
Charles Schwab Corp. | | | 127,356 | | | | 5,445,743 | |
CME Group, Inc. | | | 5,350 | | | | 880,503 | |
Evercore, Inc., Class A | | | 621 | | | | 56,511 | |
Moelis & Co., Class A | | | 25,921 | | | | 1,078,573 | |
Morgan Stanley | | | 87,705 | | | | 3,701,151 | |
TD Ameritrade Holding Corp. | | | 32,138 | | | | 1,606,579 | |
Westwood Holdings Group, Inc. | | | 8,645 | | | | 304,909 | |
| | | | | | | | |
| | | | | | | 13,073,969 | |
|
| Chemicals — 1.7% | |
Air Products & Chemicals, Inc. | | | 24,109 | | | | 4,603,855 | |
Eastman Chemical Co. | | | 7,311 | | | | 554,759 | |
Ecolab, Inc. | | | 6,829 | | | | 1,205,592 | |
Innospec, Inc. | | | 11,538 | | | | 961,692 | |
| | | | | | | | |
| | | | | | | 7,325,898 | |
|
| Commercial Services & Supplies — 0.4% | |
McGrath RentCorp | | | 15,073 | | | | 852,680 | |
| | | | | | | | |
| Security | | Shares | | | Value | |
| | |
| Commercial Services & Supplies (continued) | | | | | | |
Waste Connections, Inc. | | | 8,793 | | | $ | 778,972 | |
| | | | | | | | |
| | | | | | | 1,631,652 | |
|
| Communications Equipment — 0.8% | |
Calix, Inc.(a) | | | 43,085 | | | | 331,755 | |
Ciena Corp.(a) | | | 9,327 | | | | 348,270 | |
Cisco Systems, Inc. | | | 45,833 | | | | 2,474,524 | |
Motorola Solutions, Inc. | | | 3,031 | | | | 425,613 | |
| | | | | | | | |
| | | | | | | 3,580,162 | |
|
| Construction & Engineering — 0.3% | |
Comfort Systems USA, Inc. | | | 27,976 | | | | 1,465,663 | |
| | | | | | | | |
|
| Construction Materials — 0.0% | |
Vulcan Materials Co. | | | 461 | | | | 54,582 | |
| | | | | | | | |
|
| Consumer Finance — 0.5% | |
American Express Co. | | | 15,962 | | | | 1,744,647 | |
Discover Financial Services | | | 808 | | | | 57,497 | |
Regional Management Corp.(a) | | | 15,434 | | | | 376,898 | |
| | | | | | | | |
| | | | | | | 2,179,042 | |
|
| Containers & Packaging — 1.0% | |
Packaging Corp. of America | | | 6,186 | | | | 614,765 | |
Westrock Co. | | | 98,638 | | | | 3,782,767 | |
| | | | | | | | |
| | | | | | | 4,397,532 | |
|
| Diversified Consumer Services — 0.4% | |
Chegg, Inc.(a) | | | 9,877 | | | | 376,511 | |
H&R Block, Inc. | | | 52,149 | | | | 1,248,447 | |
| | | | | | | | |
| | | | | | | 1,624,958 | |
|
| Diversified Financial Services — 1.3% | |
Berkshire Hathaway, Inc., Class B(a) | | | 28,019 | | | | 5,628,737 | |
On Deck Capital, Inc.(a) | | | 14,495 | | | | 78,563 | |
| | | | | | | | |
| | | | | | | 5,707,300 | |
|
| Diversified Telecommunication Services — 1.0% | |
Cogent Communications Holdings, Inc. | | | 7,073 | | | | 383,710 | |
Verizon Communications, Inc. | | | 68,085 | | | | 4,025,866 | |
| | | | | | | | |
| | | | | | | 4,409,576 | |
|
| Electric Utilities — 1.8% | |
IDACORP, Inc. | | | 28,762 | | | | 2,862,969 | |
Pinnacle West Capital Corp. | | | 26,337 | | | | 2,517,290 | |
Xcel Energy, Inc. | | | 39,696 | | | | 2,231,312 | |
| | | | | | | | |
| | | | | | | 7,611,571 | |
|
| Electrical Equipment — 1.5% | |
AMETEK, Inc. | | | 16,969 | | | | 1,407,918 | |
Generac Holdings, Inc.(a) | | | 3,201 | | | | 163,987 | |
Rockwell Automation, Inc. | | | 28,056 | | | | 4,922,706 | |
| | | | | | | | |
| | | | | | | 6,494,611 | |
|
| Electronic Equipment, Instruments & Components — 0.9% | |
CDW Corp. | | | 24,919 | | | | 2,401,444 | |
National Instruments Corp. | | | 36,307 | | | | 1,610,579 | |
| | | | | | | | |
| | | | | | | 4,012,023 | |
|
| Energy Equipment & Services — 0.8% | |
Archrock, Inc. | | | 55,507 | | | | 542,858 | |
Halliburton Co. | | | 66,907 | | | | 1,960,375 | |
Nabors Industries Ltd. | | | 59,426 | | | | 204,425 | |
ProPetro Holding Corp.(a) | | | 23,110 | | | | 520,899 | |
| | | | | | | | |
| | | | | | | 3,228,557 | |
|
| Entertainment — 0.8% | |
Activision Blizzard, Inc. | | | 4,836 | | | | 220,183 | |
Netflix, Inc.(a) | | | 2,710 | | | | 966,278 | |
Viacom, Inc., Class A | | | 4,699 | | | | 152,483 | |
Viacom, Inc., Class B | | | 50,148 | | | | 1,407,654 | |
| | |
| 22 | | 2 0 1 9 B L A C K R O C K A N N U A L R E P O R T T O S H A R E H O L D E R S |
| | |
Schedule of Investments (continued) March 31, 2019 | | Master Advantage U.S. Total Market LLC (Percentages shown are based on Net Assets) |
| | | | | | | | |
| Security | | Shares | | | Value | |
| | |
| Entertainment (continued) | | | | | | |
Walt Disney Co. | | | 4,480 | | | $ | 497,414 | |
| | | | | | | | |
| | | | | | | 3,244,012 | |
|
| Equity Real Estate Investment Trusts (REITs) — 4.8% | |
Boston Properties, Inc. | | | 9,631 | | | | 1,289,398 | |
Equity LifeStyle Properties, Inc. | | | 5,148 | | | | 588,416 | |
First Industrial Realty Trust, Inc. | | | 14,915 | | | | 527,394 | |
Host Hotels & Resorts, Inc. | | | 90,917 | | | | 1,718,331 | |
MGM Growth Properties LLC, Class A | | | 2,808 | | | | 90,558 | |
Outfront Media, Inc. | | | 38,796 | | | | 907,826 | |
Park Hotels & Resorts, Inc. | | | 80,670 | | | | 2,507,224 | |
Prologis, Inc. | | | 73,249 | | | | 5,270,266 | |
Realty Income Corp. | | | 20,365 | | | | 1,498,049 | |
RLJ Lodging Trust | | | 63,255 | | | | 1,111,390 | |
Ryman Hospitality Properties, Inc. | | | 6,601 | | | | 542,866 | |
Simon Property Group, Inc. | | | 21,682 | | | | 3,950,677 | |
Sunstone Hotel Investors, Inc. | | | 30,125 | | | | 433,800 | |
| | | | | | | | |
| | | | | | | 20,436,195 | |
|
| Food & Staples Retailing — 0.3% | |
Costco Wholesale Corp. | | | 4,415 | | | | 1,069,048 | |
| | | | | | | | |
|
| Food Products — 2.2% | |
Archer-Daniels-Midland Co. | | | 81,850 | | | | 3,530,191 | |
Hershey Co. | | | 41,966 | | | | 4,818,956 | |
Lamb Weston Holdings, Inc. | | | 12,145 | | | | 910,146 | |
McCormick & Co., Inc.,Non-Voting Shares | | | 878 | | | | 132,253 | |
| | | | | | | | |
| | | | | | | 9,391,546 | |
|
| Gas Utilities — 0.5% | |
Atmos Energy Corp. | | | 19,072 | | | | 1,963,081 | |
| | | | | | | | |
|
| Health Care Equipment & Supplies — 1.9% | |
Danaher Corp. | | | 3,065 | | | | 404,641 | |
DexCom, Inc.(a) | | | 2,246 | | | | 267,499 | |
IDEXX Laboratories, Inc.(a) | | | 1,271 | | | | 284,196 | |
Masimo Corp.(a) | | | 1,176 | | | | 162,617 | |
Medtronic PLC | | | 29,398 | | | | 2,677,570 | |
Stryker Corp. | | | 22,705 | | | | 4,484,692 | |
| | | | | | | | |
| | | | | | | 8,281,215 | |
|
| Health Care Providers & Services — 2.9% | |
AmerisourceBergen Corp. | | | 17,438 | | | | 1,386,670 | |
Cardinal Health, Inc. | | | 43,883 | | | | 2,112,966 | |
Humana, Inc. | | | 4,242 | | | | 1,128,372 | |
McKesson Corp. | | | 13,816 | | | | 1,617,301 | |
UnitedHealth Group, Inc. | | | 23,622 | | | | 5,840,776 | |
WellCare Health Plans, Inc.(a) | | | 739 | | | | 199,345 | |
| | | | | | | | |
| | | | | | | 12,285,430 | |
|
| Health Care Technology — 0.6% | |
Cerner Corp.(a) | | | 14,510 | | | | 830,117 | |
Veeva Systems, Inc., Class A(a) | | | 14,582 | | | | 1,849,873 | |
| | | | | | | | |
| | | | | | | 2,679,990 | |
|
| Hotels, Restaurants & Leisure — 1.7% | |
Aramark | | | 1,676 | | | | 49,526 | |
Bloomin’ Brands, Inc. | | | 21,040 | | | | 430,268 | |
Boyd Gaming Corp. | | | 3,924 | | | | 107,361 | |
Carnival Corp. | | | 48,784 | | | | 2,474,324 | |
Darden Restaurants, Inc. | | | 8,351 | | | | 1,014,396 | |
Domino’s Pizza, Inc. | | | 3,067 | | | | 791,593 | |
Extended Stay America, Inc. | | | 67,680 | | | | 1,214,856 | |
Las Vegas Sands Corp. | | | 17,113 | | | | 1,043,208 | |
Norwegian Cruise Line Holdings Ltd.(a) | | | 4,316 | | | | 237,207 | |
| | | | | | | | |
| | | | | | | 7,362,739 | |
|
| Household Durables — 0.0% | |
Garmin Ltd. | | | 1,686 | | | | 145,586 | |
Whirlpool Corp. | | | 317 | | | | 42,126 | |
| | | | | | | | |
| | | | | | | 187,712 | |
| | | | | | | | |
| Security | | Shares | | | Value | |
|
| Household Products — 0.4% | |
Church & Dwight Co., Inc. | | | 21,116 | | | $ | 1,504,093 | |
| | | | | | | | |
|
| Industrial Conglomerates — 0.7% | |
3M Co. | | | 13,260 | | | | 2,755,163 | |
| | | | | | | | |
|
| Insurance — 3.2% | |
Aflac, Inc. | | | 3,007 | | | | 150,350 | |
Allstate Corp. | | | 30,210 | | | | 2,845,178 | |
Arthur J. Gallagher & Co. | | | 11,297 | | | | 882,296 | |
Athene Holding Ltd., Class A(a) | | | 24,782 | | | | 1,011,106 | |
CNO Financial Group, Inc. | | | 23,991 | | | | 388,174 | |
First American Financial Corp. | | | 2,020 | | | | 104,030 | |
Hartford Financial Services Group, Inc. | | | 33,856 | | | | 1,683,320 | |
Kinsale Capital Group, Inc. | | | 5,803 | | | | 397,912 | |
Lincoln National Corp. | | | 7,366 | | | | 432,384 | |
Travelers Cos., Inc. | | | 31,099 | | | | 4,265,539 | |
Unum Group | | | 45,865 | | | | 1,551,613 | |
| | | | | | | | |
| | | | | | | 13,711,902 | |
|
| Interactive Media & Services — 3.3% | |
Alphabet, Inc., Class A(a) | | | 852 | | | | 1,002,710 | |
Alphabet, Inc., Class C(a) | | | 4,515 | | | | 5,297,495 | |
Care.com, Inc.(a) | | | 14,216 | | | | 280,908 | |
Cargurus, Inc.(a) | | | 10,854 | | | | 434,811 | |
Facebook, Inc., Class A(a) | | | 33,125 | | | | 5,521,606 | |
Match Group, Inc. | | | 1,261 | | | | 71,385 | |
Twitter, Inc.(a) | | | 27,027 | | | | 888,648 | |
Yelp, Inc.(a) | | | 13,307 | | | | 459,092 | |
| | | | | | | | |
| | | | | | | 13,956,655 | |
|
| Internet & Direct Marketing Retail — 3.4% | |
Amazon.com, Inc.(a) | | | 8,012 | | | | 14,267,369 | |
| | | | | | | | |
|
| IT Services — 6.0% | |
Amdocs Ltd. | | | 724 | | | | 39,176 | |
Automatic Data Processing, Inc. | | | 36,666 | | | | 5,857,027 | |
Booz Allen Hamilton Holding Corp. | | | 20,187 | | | | 1,173,672 | |
Broadridge Financial Solutions, Inc. | | | 4,827 | | | | 500,512 | |
Fidelity National Information Services, Inc. | | | 24,853 | | | | 2,810,874 | |
First Data Corp., Class A(a) | | | 8,050 | | | | 211,474 | |
GoDaddy, Inc., Class A(a) | | | 18,731 | | | | 1,408,384 | |
Mastercard, Inc., Class A | | | 24,517 | | | | 5,772,528 | |
NIC, Inc. | | | 41,118 | | | | 702,707 | |
Paychex, Inc. | | | 21,147 | | | | 1,695,989 | |
PayPal Holdings, Inc.(a) | | | 9,656 | | | | 1,002,679 | |
Square, Inc., Class A(a) | | | 1,587 | | | | 118,898 | |
Total System Services, Inc. | | | 4,889 | | | | 464,504 | |
Unisys Corp.(a) | | | 4,115 | | | | 48,022 | |
VeriSign, Inc.(a) | | | 21,732 | | | | 3,945,662 | |
| | | | | | | | |
| | | | | | | 25,752,108 | |
|
| Life Sciences Tools & Services — 0.1% | |
Agilent Technologies, Inc. | | | 4,719 | | | | 379,313 | |
Mettler-Toledo International, Inc.(a) | | | 134 | | | | 96,882 | |
| | | | | | | | |
| | | | | | | 476,195 | |
|
| Machinery — 3.8% | |
Crane Co. | | | 39,587 | | | | 3,349,852 | |
Illinois Tool Works, Inc. | | | 1,242 | | | | 178,264 | |
Ingersoll-Rand PLC | | | 29,426 | | | | 3,176,537 | |
PACCAR, Inc. | | | 77,299 | | | | 5,267,154 | |
Snap-on, Inc. | | | 26,707 | | | | 4,180,180 | |
| | | | | | | | |
| | | | | | | 16,151,987 | |
|
| Media — 2.8% | |
AMC Networks, Inc., Class A(a) | | | 21,745 | | | | 1,234,246 | |
CBS Corp., Class B,Non-Voting Shares | | | 20,428 | | | | 970,943 | |
Clear Channel Outdoor Holdings, Inc., Class A(a) | | | 48,349 | | | | 258,667 | |
Comcast Corp., Class A | | | 32,279 | | | | 1,290,514 | |
| | | | |
| S C H E D U L E O F I N V E S T M E N T S | | | 23 | |
| | |
Schedule of Investments (continued) March 31, 2019 | | Master Advantage U.S. Total Market LLC (Percentages shown are based on Net Assets) |
| | | | | | | | |
| Security | | Shares | | | Value | |
|
| Media (continued) | |
Gray Television, Inc.(a) | | | 34,838 | | | $ | 744,140 | |
Interpublic Group of Cos., Inc. | | | 222,959 | | | | 4,684,369 | |
Liberty Media Corp. - Liberty SiriusXM, Class A(a) | | | 8,334 | | | | 318,192 | |
Liberty Media Corp. - Liberty SiriusXM, Class C(a) | | | 3,338 | | | | 127,645 | |
MSG Networks, Inc., Class A(a) | | | 14,628 | | | | 318,159 | |
Sinclair Broadcast Group, Inc., Class A | | | 26,804 | | | | 1,031,418 | |
Sirius XM Holdings, Inc. | | | 148,611 | | | | 842,624 | |
| | | | | | | | |
| | | | | | | 11,820,917 | |
|
| Metals & Mining — 0.1% | |
Carpenter Technology Corp. | | | 4,593 | | | | 210,589 | |
| | | | | | | | |
|
| Multiline Retail — 1.3% | |
Kohl’s Corp. | | | 4,502 | | | | 309,603 | |
Target Corp. | | | 65,487 | | | | 5,255,987 | |
| | | | | | | | |
| | | | | | | 5,565,590 | |
|
| Multi-Utilities — 0.1% | |
Avista Corp. | | | 1,011 | | | | 41,067 | |
CMS Energy Corp. | | | 9,308 | | | | 516,966 | |
| | | | | | | | |
| | | | | | | 558,033 | |
|
| Oil, Gas & Consumable Fuels — 3.3% | |
Anadarko Petroleum Corp. | | | 44,892 | | | | 2,041,688 | |
Cabot Oil & Gas Corp. | | | 3,563 | | | | 92,994 | |
Chevron Corp. | | | 28,465 | | | | 3,506,319 | |
ConocoPhillips | | | 37,770 | | | | 2,520,770 | |
CONSOL Energy, Inc.(a) | | | 14,663 | | | | 501,768 | |
Continental Resources, Inc.(a) | | | 1,279 | | | | 57,261 | |
Encana Corp. | | | 8,170 | | | | 59,151 | |
Exxon Mobil Corp. | | | 4,540 | | | | 366,832 | |
Kinder Morgan, Inc. | | | 33,003 | | | | 660,390 | |
Occidental Petroleum Corp. | | | 19,545 | | | | 1,293,879 | |
Phillips 66 | | | 20,505 | | | | 1,951,461 | |
Williams Cos., Inc. | | | 30,072 | | | | 863,668 | |
| | | | | | | | |
| | | | | | | 13,916,181 | |
|
| Paper & Forest Products — 0.0% | |
Boise Cascade Co. | | | 1,974 | | | | 52,824 | |
| | | | | | | | |
|
| Personal Products — 0.7% | |
Estee Lauder Cos., Inc., Class A | | | 4,826 | | | | 798,944 | |
Nu Skin Enterprises, Inc., Class A | | | 18,369 | | | | 879,140 | |
USANA Health Sciences, Inc.(a) | | | 16,107 | | | | 1,350,894 | |
| | | | | | | | |
| | | | | | | 3,028,978 | |
|
| Pharmaceuticals — 4.8% | |
Bristol-Myers Squibb Co. | | | 16,052 | | | | 765,841 | |
Johnson & Johnson | | | 68,147 | | | | 9,526,269 | |
Merck & Co., Inc. | | | 84,448 | | | | 7,023,540 | |
Pfizer, Inc. | | | 14,975 | | | | 635,988 | |
Zoetis, Inc. | | | 26,222 | | | | 2,639,769 | |
| | | | | | | | |
| | | | | | | 20,591,407 | |
|
| Professional Services — 0.7% | |
CRA International, Inc. | | | 6,768 | | | | 342,055 | |
Insperity, Inc. | | | 20,021 | | | | 2,475,797 | |
Robert Half International, Inc. | | | 5,249 | | | | 342,025 | |
| | | | | | | | |
| | | | | | | 3,159,877 | |
|
| Real Estate Management & Development — 0.2% | |
Marcus & Millichap, Inc.(a) | | | 17,855 | | | | 727,234 | |
| | | | | | | | |
|
| Road & Rail — 0.7% | |
Landstar System, Inc. | | | 9,818 | | | | 1,073,991 | |
Lyft, Inc., Class A(a) | | | 17,885 | | | | 1,400,217 | |
Universal Logistics Holdings, Inc. | | | 15,755 | | | | 310,058 | |
| | | | | | | | |
| | | | | | | 2,784,266 | |
|
| Semiconductors & Semiconductor Equipment — 2.5% | |
Amkor Technology, Inc.(a) | | | 109,547 | | | | 935,531 | |
| | | | | | | | |
| Security | | Shares | | | Value | |
|
| Semiconductors & Semiconductor Equipment (continued) | |
Broadcom, Inc. | | | 2,356 | | | $ | 708,473 | |
Cirrus Logic, Inc.(a) | | | 25,553 | | | | 1,075,015 | |
Intel Corp. | | | 70,193 | | | | 3,769,364 | |
Synaptics, Inc.(a) | | | 23,181 | | | | 921,445 | |
Texas Instruments, Inc. | | | 11,198 | | | | 1,187,772 | |
Xilinx, Inc. | | | 16,788 | | | | 2,128,551 | |
| | | | | | | | |
| | | | | | | 10,726,151 | |
|
| Software — 7.2% | |
ACI Worldwide, Inc.(a) | | | 13,136 | | | | 431,780 | |
Adobe, Inc.(a) | | | 14,586 | | | | 3,887,023 | |
Atlassian Corp. PLC, Class A(a) | | | 362 | | | | 40,685 | |
Dropbox, Inc., Class A(a) | | | 36,094 | | | | 786,849 | |
Intuit, Inc. | | | 7,975 | | | | 2,084,745 | |
LogMeIn, Inc. | | | 1,133 | | | | 90,753 | |
Microsoft Corp. | | | 72,831 | | | | 8,589,688 | |
New Relic, Inc.(a) | | | 7,329 | | | | 723,372 | |
Oracle Corp. | | | 37,756 | | | | 2,027,875 | |
Paylocity Holding Corp.(a) | | | 4,326 | | | | 385,836 | |
RingCentral, Inc., Class A(a) | | | 11,288 | | | | 1,216,846 | |
salesforce.com, Inc.(a) | | | 40,478 | | | | 6,410,501 | |
ServiceNow, Inc.(a) | | | 725 | | | | 178,705 | |
Splunk, Inc.(a) | | | 12,613 | | | | 1,571,580 | |
Tableau Software, Inc., Class A(a) | | | 14,735 | | | | 1,875,471 | |
Ultimate Software Group, Inc.(a) | | | 462 | | | | 152,520 | |
Workiva, Inc.(a) | | | 6,674 | | | | 338,372 | |
| | | | | | | | |
| | | | | | | 30,792,601 | |
|
| Specialty Retail — 1.1% | |
Asbury Automotive Group, Inc.(a) | | | 20,055 | | | | 1,391,015 | |
Best Buy Co., Inc. | | | 6,574 | | | | 467,148 | |
Dick’s Sporting Goods, Inc. | | | 17,835 | | | | 656,506 | |
Lithia Motors, Inc., Class A | | | 15,535 | | | | 1,440,871 | |
Sonic Automotive, Inc., Class A | | | 39,195 | | | | 580,478 | |
| | | | | | | | |
| | | | | | | 4,536,018 | |
|
| Technology Hardware, Storage & Peripherals — 4.3% | |
Apple Inc. | | | 60,717 | | | | 11,533,194 | |
Dell Technologies, Inc., Class C(a) | | | 56,894 | | | | 3,339,109 | |
HP, Inc. | | | 133,122 | | | | 2,586,560 | |
Pure Storage, Inc., Class A(a) | | | 39,052 | | | | 850,943 | |
| | | | | | | | |
| | | | | | | 18,309,806 | |
|
| Textiles, Apparel & Luxury Goods — 1.4% | |
Lululemon Athletica, Inc.(a) | | | 9,010 | | | | 1,476,469 | |
NIKE, Inc., Class B | | | 45,153 | | | | 3,802,334 | |
VF Corp. | | | 8,938 | | | | 776,802 | |
| | | | | | | | |
| | | | | | | 6,055,605 | |
|
| Thrifts & Mortgage Finance — 0.2% | |
Essent Group Ltd.(a) | | | 7,814 | | | | 339,518 | |
United Community Financial Corp. | | | 43,437 | | | | 406,136 | |
| | | | | | | | |
| | | | | | | 745,654 | |
|
| Tobacco — 0.5% | |
Philip Morris International, Inc. | | | 22,880 | | | | 2,022,363 | |
| | | | | | | | |
|
| Trading Companies & Distributors — 0.0% | |
Titan Machinery, Inc.(a) | | | 4,601 | | | | 71,592 | |
W.W. Grainger, Inc. | | | 397 | | | | 119,469 | |
| | | | | | | | |
| | | | | | | 191,061 | |
|
| Water Utilities — 0.2% | |
American Water Works Co., Inc. | | | 8,163 | | | | 851,074 | |
| | | | | | | | |
|
| Wireless Telecommunication Services — 0.2% | |
Telephone & Data Systems, Inc. | | | 20,872 | | | | 641,397 | |
| | | | | | | | |
Total Long-Term Investments — 99.1%
(Cost: $401,146,373) | | | | | | | 422,215,800 | |
| | | | | | | | |
| | |
| 24 | | 2 0 1 9 B L A C K R O C K A N N U A L R E P O R T T O S H A R E H O L D E R S |
| | |
Schedule of Investments (continued) March 31, 2019 | | Master Advantage U.S. Total Market LLC (Percentages shown are based on Net Assets) |
| | | | | | | | |
| Security | | Shares | | | Value | |
| | |
| Short-Term Securities — 1.1% | | | | | | |
BlackRock Liquidity Funds,T-Fund, Institutional
Class, 2.37%(b)(c) | | | 4,680,904 | | | $ | 4,680,904 | |
| | | | | | | | |
| |
Total Short-Term Securities — 1.1%
(Cost: $4,680,904) | | | | 4,680,904 | |
| | | | | | | | |
| | |
Total Investments — 100.2%
(Cost: $405,827,277) | | | | | | | 426,896,704 | |
| | |
Liabilities in Excess of Other Assets—(0.2)% | | | | | | | (984,692 | ) |
| | | | | | | | |
| | |
Net Assets — 100.0% | | | | | | $ | 425,912,012 | |
| | | | | | | | |
| (a) | Non-income producing security. |
| (b) | Annualized7-day yield as of period end. |
| (c) | During the year ended March 31, 2019, investments in issuers considered to be affiliates of the Master LLC for purposes of Section 2(a)(3) of the Investment Company Act of 1940, as amended, were as follows: |
| | | | | | | | | | | | | | | | | | | | | | | | | | | | |
| Affiliate | | Shares
Held at
03/31/18 | | | Net
Activity | | | Shares
Held at
03/31/19 | | | Value at
03/31/19 | | | Income | | | Net
Realized
Gain
(Loss)(a) | | | Change in
Unrealized
Appreciation
(Depreciation) | |
BlackRock Liquidity Funds,T-Fund, Institutional Class | | | 4,539,033 | | | | 141,871 | | | | 4,680,904 | | | $ | 4,680,904 | | | $ | 84,353 | | | $ | — | | | $ | — | |
SL Liquidity Series, LLC, Money Market Series | | | 1,807,819 | | | | (1,807,819 | ) | | | — | | | | — | | | | 3,583 | (b) | | | 1,911 | | | | — | |
| | | | | | | | | | | | | | | | | | | | | | | | | | | | |
| | | | | | | | | | | | | | $ | 4,680,904 | | | $ | 87,936 | | | $ | 1,911 | | | $ | — | |
| | | | | | | | | | | | | | | | | | | | | | | | | | | | |
| | (a) | Includes net capital gain distributions, if applicable. | |
| | (b) | Represents securities lending income earned from the reinvestment of cash collateral from loaned securities, net of fees and collateral investment expenses, and other payments to and from borrowers of securities. | |
For Master LLC compliance purposes, the Master LLC’s industry classifications refer to one or more of the industrysub-classifications used by one or more widely recognized market indexes or ratings group indexes, and/or as defined by the investment adviser. These definitions may not apply for purposes of this report, which may combine such industrysub-classifications for reporting ease.
Derivative Financial Instruments Outstanding as of Period End
Futures Contracts
| | | | | | | | | | | | | | |
| Description | | Number of
Contracts | | | Expiration
Date | | | Notional
Amount (000) | | Value/
Unrealized
Appreciation
(Depreciation) | |
Long Contracts | | | | | | | | | | | | | | |
S&P 500E-Mini Index | | | 33 | | | | 06/21/19 | | | $4,682 | | $ | 38,577 | |
| | | | | | | | | | | | | | |
Derivative Financial Instruments Categorized by Risk Exposure
As of period end, the fair values of derivative financial instruments located in the Statement of Assets and Liabilities were as follows:
| | | | | | | | | | | | | | | | | | | | | | | | | | | | | | | | |
| Assets — Derivative Financial Instruments | | | | | Commodity
Contracts | | | Credit
Contracts | | | Equity
Contracts | | | Foreign
Currency
Exchange
Contracts | | | Interest
Rate
Contracts | | | Other
Contracts | | | Total | |
Futures contracts | |
| Net unrealized
appreciation |
(a) | | $ | — | | | $ | — | | | $ | 38,577 | | | $ | — | | | $ | — | | | $ | — | | | $ | 38,577 | |
| | | | | | | | | | | | | | | | | | | | | | | | | | | | | | | | |
| | (a) | Includes cumulative appreciation (depreciation) on futures contracts, if any, as reported in the Schedule of Investments. Only current day’s variation margin is reported within the Statement of Assets and Liabilities. | |
| | | | |
| S C H E D U L E O F I N V E S T M E N T S | | | 25 | |
| | |
Schedule of Investments (continued) March 31, 2019 | | Master Advantage U.S. Total Market LLC |
For the year ended March 31, 2019, the effect of derivative financial instruments in the Statement of Operations were as follows:
| | | | | | | | | | | | | | | | | | | | | | | | | | | | |
| Net Realized Gain (Loss) from: | | Commodity
Contracts | | | Credit
Contracts | | | Equity
Contracts | | | Foreign
Currency
Exchange
Contracts | | | Interest
Rate
Contracts | | | Other
Contracts | | | Total | |
Futures contracts | | $ | — | | | $ | — | | | $ | 176,922 | | | $ | — | | | $ | — | | | $ | — | | | $ | 176,922 | |
| | | | | | | | | | | | | | | | | | | | | | | | | | | | |
| | | | | | | | | | | | | | | | | | | | | | | | | | | | |
| Net Change in Unrealized Appreciation (Depreciation) on: | | | | | | | | | | | | | | | | | | | | | |
Futures contracts | | $ | — | | | $ | — | | | $ | 157,176 | | | $ | — | | | $ | — | | | $ | — | | | $ | 157,176 | |
| | | | | | | | | | | | | | | | | | | | | | | | | | | | |
Average Quarterly Balances of Outstanding Derivative Financial Instruments
| | | | |
Futures contracts: | | | | |
Average notional value of contracts — long | | $ | 4,513,030 | |
For more information about the Master LLC’s investment risks regarding derivative financial instruments, refer to the Notes to Financial Statements.
Fair Value Hierarchy as of Period End
Various inputs are used in determining the fair value of investments and derivative financial instruments. For information about the Master LLC’s policy regarding valuation of investments and derivative financial instruments, refer to the Notes to Financial Statements.
The following tables summarize the Master LLC’s investments and derivative financial instruments categorized in the disclosure hierarchy:
| | | | | | | | | | | | | | | | |
| | | Level 1 | | | Level 2 | | | Level 3 | | | Total | |
Assets: | | | | | | | | | | | | | | | | |
Investments: | | | | | | | | | | | | | | | | |
Long-Term Investments(a): | | | | | | | | | | | | | | | | |
Common Stocks | | $ | 422,215,800 | | | $ | — | | | $ | — | | | $ | 422,215,800 | |
Short-Term Securities | | | 4,680,904 | | | | — | | | | — | | | | 4,680,904 | |
| | | | | | | | | | | | | | | | |
| | $ | 426,896,704 | | | $ | — | | | $ | — | | | $ | 426,896,704 | |
| | | | | | | | | | | | | | | | |
Derivative Financial Instruments(b) | | | | | | | | | | | | | | | | |
Assets: | | | | | | | | | | | | | | | | |
Equity contracts | | $ | 38,577 | | | $ | — | | | $ | — | | | $ | 38,577 | |
| | | | | | | | | | | | | | | | |
| | (a) | See above Schedule of Investments for values in each industry. | |
| | (b) | Derivative financial instruments are futures contracts, which are valued at the unrealized appreciation (depreciation) on the instrument. | |
| | During | the year ended March 31, 2019, there were no transfers between levels. | |
See notes to financial statements.
| | |
| 26 | | 2 0 1 9 B L A C K R O C K A N N U A L R E P O R T T O S H A R E H O L D E R S |
Statement ofAssets and Liabilities
March 31, 2019
| | | | |
| | | Master
Advantage U.S.
Total Market LLC | |
| |
ASSETS | | | | |
Investments at value — unaffiliated (cost — $401,146,373) | | $ | 422,215,800 | |
Investments at value — affiliated (cost $4,680,904) | | | 4,680,904 | |
Cash pledged for futures contracts | | | 200,000 | |
Receivables: | | | | |
Investment advisor | | | 81,177 | |
Investments sold | | | 5,674,013 | |
Securities lending income — affiliated | | | 275 | |
Dividends — affiliated | | | 6,785 | |
Dividends — unaffiliated | | | 463,928 | |
Variation margin on futures contracts | | | 27,720 | |
Prepaid expenses | | | 3,827 | |
| | | | |
Total assets | | | 433,354,429 | |
| | | | |
| |
LIABILITIES | | | | |
Bank overdraft | | | 210,682 | |
Payables: | | | | |
Investments purchased | | | 5,962,809 | |
Directors’ fees | | | 9,516 | |
Other accrued expenses | | | 136,887 | |
Other affiliates | | | 1,429 | |
Withdrawals to investors | | | 1,121,094 | |
| | | | |
Total liabilities | | | 7,442,417 | |
| | | | |
NET ASSETS | | $ | 425,912,012 | |
| | | | |
| |
NET ASSETS CONSIST OF | | | | |
Investors’ capital | | $ | 404,804,045 | |
Net unrealized appreciation | | | 21,107,967 | |
| | | | |
NET ASSETS | | $ | 425,912,012 | |
| | | | |
See notes to financial statements.
| | | | |
| F I N A N C I A L S T A T E M E N T S | | | 27 | |
| | |
Statement of Operations Year Ended March 31, 2019 | | |
| | | | |
| | | Master
Advantage U.S.
Total Market LLC | |
| |
INVESTMENT INCOME | | | | |
Dividends — unaffiliated | | $ | 8,977,443 | |
Dividends — affiliated | | | 84,353 | |
Securities lending income — affiliated — net | | | 3,583 | |
Foreign taxes withheld | | | (9,838 | ) |
| | | | |
Total investment income | | | 9,055,541 | |
| | | | |
| |
EXPENSES | | | | |
Investment advisory | | | 2,303,015 | |
Accounting services | | | 64,337 | |
Custodian | | | 46,728 | |
Professional | | | 34,128 | |
Directors | | | 18,762 | |
Printing | | | 16,060 | |
Miscellaneous | | | 8,624 | |
| | | | |
Total expenses | | | 2,491,654 | |
Less fees waived and/or reimbursed by the Manager | | | (561,516 | ) |
| | | | |
Total expenses after fees waived and/or reimbursed | | | 1,930,138 | |
| | | | |
Net investment income | | | 7,125,403 | |
| | | | |
| |
REALIZED AND UNREALIZED GAIN (LOSS) | | | | |
Net realized gain (loss) from: | | | | |
Investments — unaffiliated | | | (2,479,442 | ) |
Investments — affiliated | | | 1,911 | |
Foreign currency transactions | | | 36 | |
Futures contracts | | | 176,922 | |
| | | | |
| | | (2,300,573 | ) |
| | | | |
Net change in unrealized appreciation (depreciation) on: | | | | |
Investments — unaffiliated | | | 25,666,595 | |
Foreign currency translations | | | (19 | ) |
Futures contracts | | | 157,176 | |
| | | | |
| | | 25,823,752 | |
| | | | |
Total realized and unrealized gain | | | 23,523,179 | |
| | | | |
NET INCREASE IN NET ASSETS RESULTING FROM OPERATIONS | | $ | 30,648,582 | |
| | | | |
See notes to financial statements.
| | |
| 28 | | 2 0 1 9 B L A C K R O C K A N N U A L R E P O R T T O S H A R E H O L D E R S |
Statements of Changes in Net Assets
| | | | | | | | |
| | | Master Advantage U.S. Total Market LLC | |
| | | Year Ended March 31, | |
| | | 2019 | | | 2018 | |
| | |
INCREASE (DECREASE) IN NET ASSETS | | | | | | | | |
| | |
OPERATIONS | | | | | | | | |
Net investment income | | $ | 7,125,403 | | | $ | 5,405,061 | |
Net realized gain (loss) | | | (2,300,573 | ) | | | 154,603,484 | |
Net change in unrealized appreciation (depreciation) | | | 25,823,752 | | | | (106,285,347 | ) |
| | | | | | | | |
Net increase in net assets resulting from operations | | | 30,648,582 | | | | 53,723,198 | |
| | | | | | | | |
| | |
CAPITAL TRANSACTIONS | | | | | | | | |
Proceeds from contributions | | | 46,883,444 | | | | 68,970,062 | |
Value of withdrawals | | | (159,636,160 | ) | | | (294,312,380 | ) |
| | | | | | | | |
Net decrease in net assets derived from capital transactions | | | (112,752,716 | ) | | | (225,342,318 | ) |
| | | | | | | | |
| | |
NET ASSETS | | | | | | | | |
Total decrease in net assets | | | (82,104,134 | ) | | | (171,619,120 | ) |
Beginning of year | | | 508,016,146 | | | | 679,635,266 | |
| | | | | | | | |
End of year | | $ | 425,912,012 | | | $ | 508,016,146 | |
| | | | | | | | |
Financial Highlights
| | | | | | | | | | | | | | | | | | | | |
| | | Master Advantage U.S. Total Market LLC | |
| |
| | | Year Ended March 31, | |
| | | 2019 | | | 2018 | | | 2017 | | | 2016 | | | 2015 | |
| | | | | |
TOTAL RETURN | | | | | | | | | | | | | | | | | | | | |
Total return | | | 6.81 | % | | | 8.85 | % | | | 23.13 | % | | | (7.59 | )% | | | 5.21 | % |
| | | | | | | | | | | | | | | | | | | | |
| | | | | |
RATIOS TO AVERAGE NET ASSETS | | | | | | | | | | | | | | | | | | | | |
Total expenses | | | 0.54 | % | | | 0.55 | % | | | 0.55 | % | | | 0.55 | % | | | 0.54 | % |
| | | | | | | | | | | | | | | | | | | | |
Total expenses after fees waived and/or reimbursed | | | 0.42 | % | | | 0.55 | % | | | 0.54 | % | | | 0.55 | % | | | 0.54 | % |
| | | | | | | | | | | | | | | | | | | | |
Net investment income | | | 1.55 | % | | | 0.88 | %(a) | | | 0.59 | %(b) | | | 0.65 | % | | | 0.72 | % |
| | | | | | | | | | | | | | | | | | | | |
| | | | | |
SUPPLEMENTAL DATA | | | | | | | | | | | | | | | | | | | | |
Net assets, end of year (000) | | $ | 425,912 | | | $ | 508,016 | | | $ | 679,635 | | | $ | 688,633 | | | $ | 838,982 | |
| | | | | | | | | | | | | | | | | | | | |
Portfolio turnover rate | | | 142 | % | | | 147 | % | | | 68 | % | | | 71 | % | | | 55 | % |
| | | | | | | | | | | | | | | | | | | | |
| (a) | Ratio of net investment income to average net assets includes 0.20%, resulting from a special dividend. |
| (b) | Ratio of net investment income to average net assets includes 0.08%, resulting from a special dividend. |
See notes to financial statements.
| | | | |
| M A S T E R L L C F I N A N C I A L H I G H L I G H T S | | | 29 | |
| | |
| Notes to Financial Statements | | Master Advantage U.S. Total Market LLC |
Master Advantage U.S. Total Market LLC (the “Master LLC”) is registered under the Investment Company Act of 1940, as amended (the “1940 Act”), as anopen-end management investment company. The Master LLC is classified as diversified. The Master LLC is organized as a Delaware limited liability company. The Master LLC’s Limited Liability Company Agreement permits the Board of Directors of the Master LLC (the “Board”) to issuenon-transferable interests in the Master LLC, subject to certain limitations.
The Master LLC, together with certain other registered investment companies advised by BlackRock Advisors, LLC (the “Manager”) or its affiliates, is included in a complex of equity, multi-asset, index and money market funds referred to as the BlackRock Multi-Asset Complex.
| 2. | SIGNIFICANT ACCOUNTING POLICIES |
The financial statements are prepared in conformity with accounting principles generally accepted in the United States of America (“U.S. GAAP”), which may require management to make estimates and assumptions that affect the reported amounts of assets and liabilities in the financial statements, disclosure of contingent assets and liabilities at the date of the financial statements and the reported amounts of increases and decreases in net assets from operations during the reporting period. Actual results could differ from those estimates. The Master LLC is considered an investment company under U.S. GAAP and follows the accounting and reporting guidance applicable to investment companies. Below is a summary of significant accounting policies:
Investment Transactions and Income Recognition:For financial reporting purposes, investment transactions are recorded on the dates the transactions are executed. Realized gains and losses on investment transactions are determined on the identified cost basis. Dividend income is recorded on theex-dividend date. Dividends from foreign securities where theex-dividend date may have passed are subsequently recorded when the Master LLC is informed of theex-dividend date. Under the applicable foreign tax laws, a withholding tax at various rates may be imposed on capital gains, dividends and interest. Upon notification from issuers, a portion of the dividend income received from a real estate investment trust may be redesignated as a reduction of cost of the related investment and/or realized gain.
Foreign Currency Translation:The Master LLC’s books and records are maintained in U.S. dollars. Securities and other assets and liabilities denominated in foreign currencies are translated into U.S. dollars using exchange rates determined as of the close of trading on the New York Stock Exchange (“NYSE”). Purchases and sales of investments are recorded at the rates of exchange prevailing on the respective dates of such transactions. Generally, when the U.S. dollar rises in value against a foreign currency, the investments denominated in that currency will lose value; the opposite effect occurs if the U.S. dollar falls in relative value.
The Master LLC does not isolate the portion of the results of operations arising as a result of changes in the exchange rates from the changes in the market prices of investments held or sold for financial reporting purposes. Accordingly, the effects of changes in exchange rates on investments are not segregated in the Statement of Operations from the effects of changes in market prices of those investments, but are included as a component of net realized and unrealized gain (loss) from investments. The Master LLC reports realized currency gains (losses) on foreign currency related transactions as components of net realized gain (loss) for financial reporting purposes, whereas such components are generally treated as ordinary income for U.S. federal income tax purposes.
Segregation and Collateralization:In cases where the Master LLC enters into certain investments (e.g., futures contracts) that would be treated as “senior securities” for 1940 Act purposes, the Master LLC may segregate or designate on its books and records cash or liquid assets having a market value at least equal to the amount of its future obligations under such investments. Doing so allows the investment to be excluded from treatment as a “senior security.” Furthermore, if required by an exchange or counterparty agreement, the Master LLC may be required to deliver/deposit cash and/or securities to/with an exchange, or broker-dealer or custodian as collateral for certain investments or obligations.
Recent Accounting Standards:In August 2018, the Financial Accounting Standards Board issued Accounting Standards Update2018-13 “Changes to the Disclosure Requirements for Fair Value Measurement” which modifies disclosure requirements for fair value measurements. The guidance is effective for fiscal years beginning after December 15, 2019 and for interim periods within those fiscal years. Management continues to evaluate the impact of this guidance to the Master LLC.
Indemnifications:In the normal course of business, the Master LLC enters into contracts that contain a variety of representations that provide general indemnification. The Master LLC’s maximum exposure under these arrangements is unknown because it involves future potential claims against the Master LLC, which cannot be predicted with any certainty.
Other:Expenses directly related to the Master LLC are charged to the Master LLC. Other operating expenses shared by several funds, including other funds managed by the Manager, are prorated among those funds on the basis of relative net assets or other appropriate methods.
The Master LLC has an arrangement with its custodian whereby credits are earned on uninvested cash balances, which could be used to reduce custody fees and/or overdraft charges. The Master LLC may incur charges on certain uninvested cash balances and overdrafts, subject to certain conditions.
| 3. | INVESTMENT VALUATION AND FAIR VALUE MEASUREMENTS |
Investment Valuation Policies:The Master LLC’s investments are valued at fair value (also referred to as “market value” within the financial statements) as of the close of trading on the NYSE (generally 4:00 p.m., Eastern time) (or if the reporting date falls on a day the NYSE is closed, investments are valued at fair value as of the period end). U.S. GAAP defines fair value as the price the Master LLC would receive to sell an asset or pay to transfer a liability in an orderly transaction between market participants at the measurement date. The Master LLC determines the fair values of its financial instruments using various independent dealers or pricing services under policies approved by the Board. The BlackRock Global Valuation Methodologies Committee (the “Global Valuation Committee”) is the committee formed by management to develop global pricing policies and procedures and to oversee the pricing function for all financial instruments.
| | |
| 30 | | 2 0 1 9 B L A C K R O C K A N N U A L R E P O R T T O S H A R E H O L D E R S |
| | |
| Notes to Financial Statements (continued) | | Master Advantage U.S. Total Market LLC |
Fair Value Inputs and Methodologies:The following methods and inputs are used to establish the fair value of the Master LLC’s assets and liabilities:
| | • | | Equity investments traded on a recognized securities exchange are valued at the official closing price each day, if available. For equity investments traded on more than one exchange, the official closing price on the exchange where the stock is primarily traded is used. Equity investments traded on a recognized exchange for which there were no sales on that day may be valued at the last available bid (long positions) or ask (short positions) price. |
Generally, trading in foreign instruments is substantially completed each day at various times prior to the close of trading on the NYSE. Occasionally, events affecting the values of such instruments may occur between the foreign market close and the close of trading on the NYSE that may not be reflected in the computation of the Master LLC’s net assets. Each business day, the Master LLC uses a pricing service to assist with the valuation of certain foreign exchange-traded equity securities and foreign exchange-traded andover-the-counter (“OTC”) options (the “Systematic Fair Value Price”). Using current market factors, the Systematic Fair Value Price is designed to value such foreign securities and foreign options at fair value as of the close of trading on the NYSE, which follows the close of the local markets.
| | • | | Investments inopen-end U.S. mutual funds are valued at net asset value (“NAV”) each business day. |
| | • | | Futures contracts traded on exchanges are valued at their last sale price. |
If events (e.g., a company announcement, market volatility or a natural disaster) occur that are expected to materially affect the value of such investments, or in the event that the application of these methods of valuation results in a price for an investment that is deemed not to be representative of the market value of such investment, or if a price is not available, the investment will be valued by the Global Valuation Committee, or its delegate, in accordance with a policy approved by the Board as reflecting fair value (“Fair Valued Investments”). The fair valuation approaches that may be used by the Global Valuation Committee will include market approach, income approach and cost approach. Valuation techniques such as discounted cash flow, use of market comparables and matrix pricing are types of valuation approaches and are typically used in determining fair value. When determining the price for Fair Valued Investments, the Global Valuation Committee, or its delegate, seeks to determine the price that the Master LLC might reasonably expect to receive or pay from the current sale or purchase of that asset or liability in anarm’s-length transaction. Fair value determinations shall be based upon all available factors that the Global Valuation Committee, or its delegate, deems relevant and consistent with the principles of fair value measurement. The pricing of all Fair Valued Investments is subsequently reported to the Board or a committee thereof on a quarterly basis.
Fair Value Hierarchy:Various inputs are used in determining the fair value of investments and derivative financial instruments. These inputs to valuation techniques are categorized into a fair value hierarchy consisting of three broad levels for financial statement purposes as follows:
| | • | | Level 1 — Unadjusted price quotations in active markets/exchanges for identical assets or liabilities that the Master LLC has the ability to access |
| | • | | Level 2 — Other observable inputs (including, but not limited to, quoted prices for similar assets or liabilities in markets that are active, quoted prices for identical or similar assets or liabilities in markets that are not active, inputs other than quoted prices that are observable for the assets or liabilities (such as interest rates, yield curves, volatilities, prepayment speeds, loss severities, credit risks and default rates) or other market-corroborated inputs) |
| | • | | Level 3 — Unobservable inputs based on the best information available in the circumstances, to the extent observable inputs are not available (including the Master LLC’s own assumptions used in determining the fair value of investments and derivative financial instruments) |
The hierarchy gives the highest priority to unadjusted quoted prices in active markets for identical assets or liabilities (Level 1 measurements) and the lowest priority to unobservable inputs (Level 3 measurements). Accordingly, the degree of judgment exercised in determining fair value is greatest for instruments categorized in Level 3. The inputs used to measure fair value may fall into different levels of the fair value hierarchy. In such cases, for disclosure purposes, the fair value hierarchy classification is determined based on the lowest level input that is significant to the fair value measurement in its entirety. Investments classified within Level 3 have significant unobservable inputs used by the Global Valuation Committee in determining the price for Fair Valued Investments. Level 3 investments include equity or debt issued by privately held companies or funds. There may not be a secondary market, and/or there are a limited number of investors. Level 3 investments may also be adjusted to reflect illiquidity and/ornon-transferability, with the amount of such discount estimated by the Global Valuation Committee in the absence of market information.
Changes in valuation techniques may result in transfers into or out of an assigned level within the hierarchy. In accordance with the Master LLC’s policy, transfers between different levels of the fair value hierarchy are deemed to have occurred as of the beginning of the reporting period. The categorization of a value determined for investments and derivative financial instruments is based on the pricing transparency of the investments and derivative financial instruments and is not necessarily an indication of the risks associated with investing in those securities.
| 4. | SECURITIES AND OTHER INVESTMENTS |
Securities Lending:The Master LLC may lend its securities to approved borrowers, such as brokers, dealers and other financial institutions. The borrower pledges and maintains with the Master LLC collateral consisting of cash, an irrevocable letter of credit issued by a bank, or securities issued or guaranteed by the U.S. Government. The initial collateral received by the Master LLC is required to have a value of at least 102% of the current value of the loaned securities for securities traded on U.S. exchanges and a value of at least 105% for all other securities. The collateral is maintained thereafter at a value equal to at least 100% of the current market value of the securities on loan. The market value of the loaned securities is determined at the close of each business day of the Master LLC and any additional required collateral is delivered to the Master LLC, or excess collateral returned by the Master LLC, on the next business day. During the term of the loan, the Master LLC is entitled to all distributions made on or in respect of the loaned securities, but does not receive interest income on securities received as collateral. Loans of securities are terminable at any time and the borrower, after notice, is required to return borrowed securities within the standard time period for settlement of securities transactions.
The market value of any securities on loan, all of which were classified as common stocks in the Master LLC’s Schedule of Investments, and the value of any related collateral are shown separately in the Statement of Assets and Liabilities as a component of investments at value — unaffiliated, and collateral on securities loaned at value, respectively. As of period end, any securities on loan were collateralized by cash and/or U.S. Government obligations. Cash collateral invested by the securities lending agent, BlackRock Investment Management, LLC (“BIM”), if any, is disclosed in the Schedule of Investments.
| | | | |
| N O T E S T O F I N A N C I A L S T A T E M E N T S | | | 31 | |
| | |
| Notes to Financial Statements (continued) | | Master Advantage U.S. Total Market LLC |
Securities lending transactions are entered into by the Master LLC under Master Securities Lending Agreements (each, an “MSLA”), which provide the right, in the event of default (including bankruptcy or insolvency), for thenon-defaulting party to liquidate the collateral and calculate a net exposure to the defaulting party or request additional collateral. In the event that a borrower defaults, the Master LLC, as lender, would offset the market value of the collateral received against the market value of the securities loaned. When the value of the collateral is greater than that of the market value of the securities loaned, the lender is left with a net amount payable to the defaulting party. However, bankruptcy or insolvency laws of a particular jurisdiction may impose restrictions on or prohibitions against such a right of offset in the event of an MSLA counterparty’s bankruptcy or insolvency. Under the MSLA, absent an event of default, the borrower can resell orre-pledge the loaned securities, and the Master LLC can reinvest cash collateral received in connection with loaned securities. Upon an event of default, the parties’ obligations to return the securities or collateral to the other party are extinguished, and the parties can resell orre-pledge the loaned securities or the collateral received in connection with the loaned securities in order to satisfy the defaulting party’s net payment obligation for all transactions under the MSLA. The defaulting party remains liable for any deficiency.
The risks of securities lending include the risk that the borrower may not provide additional collateral when required or may not return the securities when due. To mitigate these risks, the Master LLC benefits from a borrower default indemnity provided by BIM. BIM’s indemnity allows for full replacement of the securities loaned if the collateral received does not cover the value on the securities loaned in the event of borrower default. The Master LLC could incur a loss if the value of an investment purchased with cash collateral falls below the market value of loaned securities or if the value of an investment purchased with cash collateral falls below the value of the original cash collateral received.
| 5. | DERIVATIVE FINANCIAL INSTRUMENTS |
The Master LLC engages in various portfolio investment strategies using derivative contracts both to increase the returns of the Master LLC and/or to manage its exposure to certain risks such as credit risk, equity risk, interest rate risk, foreign currency exchange rate risk, commodity price risk or other risks (e.g., inflation risk). Derivative financial instruments categorized by risk exposure are included in the Schedule of Investments. These contracts may be transacted on an exchange or OTC.
Futures Contracts:Futures contracts are purchased or sold to gain exposure to, or manage exposure to, changes in interest rates (interest rate risk) and changes in the value of equity securities (equity risk) or foreign currencies (foreign currency exchange rate risk).
Futures contracts are agreements between the Master LLC and a counterparty to buy or sell a specific quantity of an underlying instrument at a specified price and on a specified date. Depending on the terms of a contract, it is settled either through physical delivery of the underlying instrument on the settlement date or by payment of a cash amount on the settlement date. Upon entering into a futures contract, the Master LLC is required to deposit initial margin with the broker in the form of cash or securities in an amount that varies depending on a contract’s size and risk profile. The initial margin deposit must then be maintained at an established level over the life of the contract. Amounts pledged, which are considered restricted, are included in cash pledged for futures contracts in the Statement of Assets and Liabilities.
Securities deposited as initial margin are designated in the Schedule of Investments and cash deposited, if any, is shown as cash pledged for futures contracts in the Statement of Assets and Liabilities. Pursuant to the contract, the Master LLC agrees to receive from or pay to the broker an amount of cash equal to the daily fluctuation in market value of the contract (“variation margin”). Variation margin is recorded as unrealized appreciation (depreciation) and, if any, shown as variation margin receivable (or payable) on futures contracts in the Statement of Assets and Liabilities. When the contract is closed, a realized gain or loss is recorded in the Statement of Operations equal to the difference between the notional amount of the contract at the time it was opened and the notional amount at the time it was closed. The use of futures contracts involves the risk of an imperfect correlation in the movements in the price of futures contracts and interest, foreign currency exchange rates or underlying assets.
Collateral Requirements:For derivatives traded under an International Swaps and Derivatives Association, Inc. Master Agreement (“ISDA Master Agreement”), the collateral requirements are typically calculated by netting themark-to-market amount for each transaction under such agreement and comparing that amount to the value of any collateral currently pledged by the Master LLC and the counterparty.
Cash collateral that has been pledged to cover obligations of the Master LLC and cash collateral received from the counterparty, if any, is reported separately in the Statement of Assets and Liabilities as cash pledged as collateral and cash received as collateral, respectively.Non-cash collateral pledged by the Master LLC, if any, is noted in the Schedule of Investments. Generally, the amount of collateral due from or to a counterparty is subject to a certain minimum transfer amount threshold before a transfer is required, which is determined at the close of business of the Master LLC. Any additional required collateral is delivered to/pledged by the Master LLC on the next business day. Typically, the counterparty is not permitted to sell,re-pledge or use cash andnon-cash collateral it receives. The Master LLC generally agrees not to usenon-cash collateral that it receives but may, absent default or certain other circumstances defined in the underlying ISDA Master Agreement, be permitted to use cash collateral received. In such cases, interest may be paid pursuant to the collateral arrangement with the counterparty. To the extent amounts due to the Master LLC from its counterparties are not fully collateralized, it bears the risk of loss from counterpartynon-performance. Likewise, to the extent the Master LLC has delivered collateral to a counterparty and stands ready to perform under the terms of its agreement with such counterparty, it bears the risk of loss from a counterparty in the amount of the value of the collateral in the event the counterparty fails to return such collateral. Based on the terms of agreements, collateral may not be required for all derivative contracts.
For financial reporting purposes, the Master LLC does not offset derivative assets and derivative liabilities that are subject to netting arrangements, if any, in the Statement of Assets and Liabilities.
| 6. | INVESTMENT ADVISORY AGREEMENT AND OTHER TRANSACTIONS WITH AFFILIATES |
Investment Advisory:The Master LLC entered into an Investment Advisory Agreement with the Manager, the Master LLC’s investment adviser and an indirect, wholly-owned subsidiary of BlackRock, Inc. (“BlackRock”), to provide investment advisory and administrative services. The Manager is responsible for the management of the Master LLC’s portfolio and provides the personnel, facilities, equipment and certain other services necessary to the operations of the Master LLC.
| | |
| 32 | | 2 0 1 9 B L A C K R O C K A N N U A L R E P O R T T O S H A R E H O L D E R S |
| | |
| Notes to Financial Statements (continued) | | Master Advantage U.S. Total Market LLC |
For such services, the Master LLC pays the Manager a monthly fee at an annual rate equal to the following percentages of the average daily value of the Master LLC’s net assets:
| | | | |
| Average Daily Net Assets | | Investment Advisory Fee | |
First $1 Billion | | | 0.500 | % |
$1 Billion — $1.5 Billion | | | 0.475 | |
Greater than $1.5 Billion | | | 0.450 | |
Expense Waivers and Reimbursements:With respect to the Master LLC, the Manager voluntarily agreed to waive its investment advisory fees by the amount of investment advisory fees the Master LLC pays to the Manager indirectly through its investment in affiliated money market funds (the “affiliated money market fund waiver”). This amount is included in fees waived and/or reimbursed by the Manager in the Statement of Operations. However, the Manager does not waive its investment advisory fees by the amount of investment advisory fees paid in connection with the Master LLC’s investments in other affiliated investment companies, if any. For the year ended March 31, 2019, the amount waived was $3,142.
The Manager has contractually agreed to waive its investment advisory fee with respect to any portion of the Master LLC’s assets invested in affiliated equity and fixed-income mutual funds and affiliated exchange-traded funds that have a contractual management fee through July 31, 2019. The contractual agreement may be terminated upon 90 days’ notice by a majority of the directors who are not “interested persons” of the Master LLC, as defined in the 1940 Act (“Independent Directors”), or by a vote of a majority of the outstanding voting securities of the Master LLC. For the year ended March 31, 2019, there were no fees waived and/or reimbursed by the Manager pursuant to this arrangement.
The Manager has also voluntarily agreed to waive its investment advisory fees by the amount of investment advisory fees to enable the feeder that invests in the Master LLC to limit expenses, if applicable. The Manager may discontinue this voluntary waiver at any time. The amount waived is included in fees waived and/or reimbursed by the Manager in the Statement of Operations. For the year ended March 31, 2019, the amount waived and/or reimbursed was $558,374.
For the year ended March 31, 2019, the Master LLC reimbursed the Manager $4,544 for certain accounting services, which is included in accounting services in the Statement of Operations.
Securities Lending: The U.S. Securities and Exchange Commission (“SEC”) has issued an exemptive order which permits BIM, an affiliate of the Manager, to serve as securities lending agent for the Master LLC, subject to applicable conditions. As securities lending agent, BIM bears all operational costs directly related to securities lending. The Master LLC is responsible for expenses in connection with the investment of cash collateral received for securities on loan (the “collateral investment expenses”). The cash collateral is invested in a private investment company managed by the Manager or its affiliates. However, BIM has agreed to cap the collateral investment expenses of the private investment company to an annual rate of 0.04%. The investment adviser to the private investment company will not charge any advisory fees with respect to shares purchased by the Master LLC. The private investment company in which the cash collateral has been invested may, under certain circumstances, impose a liquidity fee of up to 2% of the value withdrawn or temporarily restrict withdrawals for up to 10 business days during a 90 day period, in the event that the private investment company’s weekly liquid assets fall below certain thresholds.
Securities lending income is equal to the total of income earned from the reinvestment of cash collateral, net of fees and other payments to and from borrowers of securities, and less the collateral investment expenses. The Master LLC retains a portion of securities lending income and remits a remaining portion to BIM as compensation for its services as securities lending agent.
Pursuant to the current securities lending agreement, the Master LLC retains 73.5% of securities lending income (which excludes collateral investment expenses), and this amount retained can never be less than 70% of the total of securities lending income plus the collateral investment expenses.
In addition, commencing the business day following the date that the aggregate securities lending income earned across the Multi-Asset Complex in a calendar year exceeds a specified threshold, the Master LLC, pursuant to the securities lending agreement, will retain for the remainder of that calendar year securities lending income in an amount equal to 80% of securities lending income (which excludes collateral investment expenses), and this amount retained can never be less than 70% of the total of securities lending income plus the collateral investment expenses.
Prior to January 1, 2019, the Master LLC was subject to a different securities lending fee arrangement.
The share of securities lending income earned by the Master LLC is shown as securities lending income — affiliated — net in the Statement of Operations. For the year ended March 31, 2019, the Master LLC paid BIM $1,192 for securities lending agent services.
Interfund Lending:In accordance with an exemptive order (the “Order”) from the SEC, the Master LLC may participate in a joint lending and borrowing facility for temporary purposes (the “Interfund Lending Program”), subject to compliance with the terms and conditions of the Order, and to the extent permitted by the Master LLC’s investment policies and restrictions. The Master LLC is currently permitted to borrow and lend under the Interfund Lending Program.
A lending BlackRock fund may lend in aggregate up to 15% of its net assets, but may not lend more than 5% of its net assets to any one borrowing fund through the Interfund Lending Program. A borrowing BlackRock fund may not borrow through the Interfund Lending Program or from any other source more than 33 1/3% of its total assets (or any lower threshold provided for by the fund’s investment restrictions). If a borrowing BlackRock fund’s total outstanding borrowings exceed 10% of its total assets, each of its outstanding interfund loans will be subject to collateralization of at least 102% of the outstanding principal value of the loan. All interfund loans are for temporary or emergency purposes and the interest rate to be charged will be the average of the highest current overnight repurchase agreement rate available to a lending fund and the bank loan rate, as calculated according to a formula established by the Board.
During the year ended March 31, 2019, the Master LLC did not participate in the Interfund Lending Program.
| | | | |
| N O T E S T O F I N A N C I A L S T A T E M E N T S | | | 33 | |
| | |
| Notes to Financial Statements (continued) | | Master Advantage U.S. Total Market LLC |
Directors and Officers:Certain directors and/or officers of the Master LLC are directors and/or officers of BlackRock or its affiliates.
For the year ended March 31, 2019, purchases and sales of investments, excluding short-term securities, were $649,622,021 and $752,864,177, respectively.
The Master LLC is disregarded as an entity separate from its owner for tax purposes. As such, the owner of the Master LLC is treated as the owner of the net assets, income, expenses and realized and unrealized gains and losses of the Master LLC. Therefore, no U.S. federal income tax provision is required. It is intended that the Master LLC’s assets will be managed so the owner of the Master LLC can satisfy the requirements of Subchapter M of the Internal Revenue Code of 1986, as amended. As of March 31, 2019, gross unrealized appreciation and depreciation for investments and derivatives based on cost for U.S. federal income tax purposes were as follows:
| | | | |
Tax cost | | $ | 407,141,021 | |
| | | | |
Gross unrealized appreciation | | $ | 33,385,179 | |
Gross unrealized depreciation | | | (13,629,496 | ) |
| | | | |
Net unrealized appreciation | | $ | 19,755,683 | |
| | | | |
The Master LLC, along with certain other funds managed by the Manager and its affiliates (“Participating Funds”), is a party to a364-day, $2.25 billion credit agreement with a group of lenders. Under this agreement, the Master LLC may borrow to fund shareholder redemptions. Excluding commitments designated for certain individual funds, the Participating Funds, including the Master LLC, can borrow up to an aggregate commitment amount of $1.75 billion at any time outstanding, subject to asset coverage and other limitations as specified in the agreement. The credit agreement has the following terms: a fee of 0.10% per annum on unused commitment amounts and interest at a rate equal to the higher of(a) one-month LIBOR (but, in any event, not less than 0.00%) on the date the loan is made plus 0.80% per annum or (b) the Fed Funds rate (but, in any event, not less than 0.00%) in effect from time to time plus 0.80% per annum on amounts borrowed. The agreement expires in April 2019 unless extended or renewed. Prior to April 19, 2018, the aggregate commitment amount was $2.1 billion and the fee was 0.12% per annum. Participating Funds paid an upfront commitment fee of 0.02% on the total commitment amounts, in addition to administration, legal and arrangement fees, which are included in miscellaneous expenses in the Statement of Operations. These fees were allocated among such funds based upon portions of the aggregate commitment available to them and relative net assets of Participating Funds. During the year ended March 31, 2019, the Master LLC did not borrow under the credit agreement.
In the normal course of business, the Master LLC invests in securities or other instruments and may enter into certain transactions, and such activities subject the Master LLC to various risks, including among others, fluctuations in the market (market risk) or failure of an issuer to meet all of its obligations. The value of securities or other instruments may also be affected by various factors, including, without limitation: (i) the general economy; (ii) the overall market as well as local, regional or global political and/or social instability; (iii) regulation, taxation or international tax treaties between various countries; or (iv) currency, interest rate and price fluctuations. The Master LLC’s prospectus provides details of the risks to which the Master LLC is subject.
The Master LLC may be exposed to additional risks when reinvesting cash collateral in money market funds that do not seek to maintain a stable NAV per share of $1.00, which may be subject to redemption gates or liquidity fees under certain circumstances.
Valuation Risk:The market values of equities, such as common stocks and preferred securities or equity related investments, such as futures and options, may decline due to general market conditions which are not specifically related to a particular company. They may also decline due to factors which affect a particular industry or industries. The Master LLC may invest in illiquid investments. An illiquid investment is any investment that the Master LLC reasonably expects cannot be sold or disposed of in current market conditions in seven calendar days or less without the sale or disposition significantly changing the market value of the investment. The Master LLC may experience difficulty in selling illiquid investments in a timely manner at the price that it believes the investments are worth. Prices may fluctuate widely over short or extended periods in response to company, market or economic news. Markets also tend to move in cycles, with periods of rising and falling prices. This volatility may cause the Master LLC’s NAV to experience significant increases or decreases over short periods of time. If there is a general decline in the securities and other markets, the NAV of the Master LLC may lose value, regardless of the individual results of the securities and other instruments in which the Master LLC invests.
Counterparty Credit Risk:The Master LLC may be exposed to counterparty credit risk, or the risk that an entity may fail to or be unable to perform on its commitments related to unsettled or open transactions. The Master LLC manages counterparty credit risk by entering into transactions only with counterparties that the Manager believes have the financial resources to honor their obligations and by monitoring the financial stability of those counterparties. Financial assets, which potentially expose the Master LLC to market, issuer and counterparty credit risks, consist principally of financial instruments and receivables due from counterparties. The extent of the Master LLC’s exposure to market, issuer and counterparty credit risks with respect to these financial assets is approximately their value recorded in the Statement of Assets and Liabilities, less any collateral held by the Master LLC.
A derivative contract may suffer amark-to-market loss if the value of the contract decreases due to an unfavorable change in the market rates or values of the underlying instrument. Losses can also occur if the counterparty does not perform under the contract.
With exchange-traded futures, there is less counterparty credit risk to the Master LLC since the exchange or clearinghouse, as counterparty to such instruments, guarantees against a possible default. The clearinghouse stands between the buyer and the seller of the contract; therefore, credit risk is limited to failure of the clearinghouse. While offset rights may exist under applicable law, the Master LLC does not have a contractual right of offset against a clearing broker or clearinghouse in the event of a
| | |
| 34 | | 2 0 1 9 B L A C K R O C K A N N U A L R E P O R T T O S H A R E H O L D E R S |
| | |
| Notes to Financial Statements (continued) | | Master Advantage U.S. Total Market LLC |
default (including the bankruptcy or insolvency). Additionally, credit risk exists in exchange-traded futures with respect to initial and variation margin that is held in a clearing broker’s customer accounts. While clearing brokers are required to segregate customer margin from their own assets, in the event that a clearing broker becomes insolvent or goes into bankruptcy and at that time there is a shortfall in the aggregate amount of margin held by the clearing broker for all its clients, typically the shortfall would be allocated on a pro rata basis across all the clearing broker’s customers, potentially resulting in losses to the Master LLC.
Management’s evaluation of the impact of all subsequent events on the Master LLC’s financial statements was completed through the date the financial statements were issued and the following item was noted:
Effective April 18, 2019, the credit agreement was extended until April 2020 under the same terms.
| | | | |
| N O T E S T O F I N A N C I A L S T A T E M E N T S | | | 35 | |
Report of Independent Registered Public Accounting Firm
To the Investor and Board of Directors of Master Advantage U.S. Total Market LLC:
Opinion on the Financial Statements and Financial Highlights
We have audited the accompanying statement of assets and liabilities of Master Advantage U.S. Total Market LLC (the “Fund”), including the schedule of investments, as of March 31, 2019, the related statement of operations for the year then ended, the statements of changes in net assets each of the two years in the period then ended, the financial highlights for each of the five years in the period then ended, and the related notes. In our opinion, the financial statements and financial highlights present fairly, in all material respects, the financial position of the Fund as of March 31, 2019, and the results of its operations for the year then ended, and the changes in its net assets for each of the two years in the period then ended, and the financial highlights for each of the five years in the period then ended, in conformity with accounting principles generally accepted in the United States of America.
Basis for Opinion
These financial statements and financial highlights are the responsibility of the Fund’s management. Our responsibility is to express an opinion on the Fund’s financial statements and financial highlights based on our audits. We are a public accounting firm registered with the Public Company Accounting Oversight Board (United States) (PCAOB) and are required to be independent with respect to the Fund in accordance with the U.S. federal securities laws and the applicable rules and regulations of the Securities and Exchange Commission and the PCAOB.
We conducted our audits in accordance with the standards of the PCAOB. Those standards require that we plan and perform the audits to obtain reasonable assurance about whether the financial statements and financial highlights are free of material misstatement, whether due to error or fraud. The Fund is not required to have, nor were we engaged to perform, an audit of its internal control over financial reporting. As part of our audits we are required to obtain an understanding of internal control over financial reporting but not for the purpose of expressing an opinion on the effectiveness of the Fund’s internal control over financial reporting. Accordingly, we express no such opinion.
Our audits included performing procedures to assess the risks of material misstatement of the financial statements and financial highlights, whether due to error or fraud, and performing procedures that respond to those risks. Such procedures included examining, on a test basis, evidence regarding the amounts and disclosures in the financial statements and financial highlights. Our audits also included evaluating the accounting principles used and significant estimates made by management, as well as evaluating the overall presentation of the financial statements and financial highlights. Our procedures included confirmation of securities owned as of March 31, 2019, by correspondence with the custodian and brokers; when replies were not received from brokers, we performed other auditing procedures. We believe that our audits provide a reasonable basis for our opinion.
/s/Deloitte & Touche LLP
Boston, Massachusetts
May 21, 2019
We have served as the auditor of one or more BlackRock investment companies since 1992.
| | |
| 36 | | 2 0 1 9 B L A C K R O C K A N N U A L R E P O R T T O S H A R E H O L D E R S |
Director and Officer Information
| | | | | | | | |
| Independent Directors(a) |
| | | | | |
Name
Year of Birth(b) | | Position(s) Held (Length of
Service)(c) | | Principal Occupation(s) During Past Five Years | | Number of BlackRock-Advised Registered Investment Companies (“RICs”) Consisting of Investment
Portfolios (“Portfolios”) Overseen | | Public Company
and Other
Investment
Company
Directorships Held During Past Five Years |
Mark Stalnecker 1951 | | Chair of the Board and Director (Since 2019) | | Chief Investment Officer, University of Delaware from 1999 to 2013; Trustee and Chair of the Finance and Investment Committees, Winterthur Museum and Country Estate from 2005 to 2016; Member of the Investment Committee, Delaware Public Employees’ Retirement System since 2002; Member of the Investment Committee, Christiana Care Health System from 2009 to 2017; Member of the Investment Committee, Delaware Community Foundation from 2013 to 2014; Director and Chair of the Audit Committee, SEI Private Trust Co. from 2001 to 2014. | | 41 RICs consisting of 185 Portfolios | | None |
Bruce R. Bond 1946 | | Director (Since 2007) | | Board Member, Amsphere Limited (software) since 2018; Trustee and Member of the Governance Committee, State Street Research Mutual Funds from 1997 to 2005; Board Member of Governance, Audit and Finance Committee, Avaya Inc. (computer equipment) from 2003 to 2007. | | 41 RICs consisting of 185 Portfolios | | None |
Susan J. Carter 1956 | | Director (Since 2019) | | Director, Pacific Pension Institute from 2014 to 2018; Advisory Board Member, Center for Private Equity and Entrepreneurship at Tuck School of Business since 1997; Senior Advisor, Commonfund Capital, Inc. (“CCI”) (investment adviser) in 2015; Chief Executive Officer, CCI from 2013 to 2014; President & Chief Executive Officer, CCI from 1997 to 2013; Advisory Board Member, Girls Who Invest from 2015 to 2018 and Board Member thereof since 2018; Advisory Board Member, Bridges Fund Management since 2016; Trustee, Financial Accounting Foundation since 2017; Practitioner Advisory Board Member, Private Capital Research Institute (“PCRI”) since 2017. | | 41 RICs consisting of 185 Portfolios | | None |
Collette Chilton 1958 | | Director (Since 2019) | | Chief Investment Officer, Williams College since 2006; Chief Investment Officer, Lucent Asset Management Corporation from 1998 to 2006. | | 41 RICs consisting of 185 Portfolios | | None |
Neil A. Cotty 1954 | | Director (Since 2019) | | Bank of America Corporation from 1996 to 2015, serving in various senior finance leadership roles, including Chief Accounting Officer, from 2009 to 2015, Chief Financial Officer of Global Banking, Markets and Wealth Management from 2008 to 2009, Chief Accounting Officer from 2004 to 2008, Chief Financial Officer of Consumer Bank from 2003 to 2004, Chief Financial Officer of Global Corporate Investment Bank from 1999 to 2002. | | 41 RICs consisting of 185 Portfolios | | None |
Lena G. Goldberg 1949 | | Director (Since 2016) | | Senior Lecturer, Harvard Business School, since 2008; Director, Charles Stark Draper Laboratory, Inc. since 2013; FMR LLC/Fidelity Investments (financial services) from 1996 to 2008, serving in various senior roles including Executive Vice President — Strategic Corporate Initiatives and Executive Vice President and General Counsel; Partner, Sullivan & Worcester LLP from 1985 to 1996 and Associate thereof from 1979 to 1985. | | 41 RICs consisting of 185 Portfolios | | None |
Robert M. Hernandez 1944 | | Director (Since 2007) | | Director, Vice Chairman and Chief Financial Officer of USX Corporation (energy and steel business) from 1991 to 2001; Director andnon-executive Chairman, RTI International Metals, Inc. from 1990 to 2015; Director, TE Connectivity (electronics) from 2006 to 2012. | | 41 RICs consisting of 185 Portfolios | | Chubb Limited (insurance company); Eastman Chemical Company |
| | | | |
| D I R E C T O R A N D O F F I C E R I N F O R M A T I O N | | | 37 | |
Director and Officer Information (continued)
| | | | | | | | |
| Independent Directors(a) |
| | | | | |
Name
Year of Birth(b) | | Position(s) Held (Length of Service)(c) | | Principal Occupation(s) During Past Five Years | | Number of BlackRock-Advised
Registered Investment Companies
(“RICs”) Consisting of Investment
Portfolios (“Portfolios”) Overseen | | Public Company
and Other
Investment
Company
Directorships Held During Past Five
Years |
Henry R. Keizer 1956 | | Director (Since 2016) | | Director, Park Indemnity Ltd. (captive insurer) since 2010; Director, MUFG Americas Holdings Corporation and MUFG Union Bank, N.A. (financial and bank holding company) from 2014 to 2016; Director, American Institute of Certified Public Accountants from 2009 to 2011; Director, KPMG LLP (audit, tax and advisory services) from 2004 to 2005 and 2010 to 2012; Director, KPMG International in 2012, Deputy Chairman and Chief Operating Officer thereof from 2010 to 2012 and U.S. Vice Chairman of Audit thereof from 2005 to 2010; Global Head of Audit, KPMGI (consortium of KPMG firms) from 2006 to 2010; Director, YMCA of Greater New York from 2006 to 2010. | | 41 RICs consisting of 185 Portfolios | | Hertz Global Holdings (car rental); Montpelier Re Holdings, Ltd. (publicly held property and casualty reinsurance) from 2013 until 2015; Sealed Air Corp. (packaging); WABCO (commercial vehicle safety systems) |
Cynthia A. Montgomery 1952 | | Director (Since 2019) | | Professor, Harvard Business School since 1989. | | 41 RICs consisting of 185 Portfolios | | Newell Rubbermaid, Inc. (manufacturing) |
Donald C. Opatrny 1952 | | Director (Since 2015) | | Trustee, Vice Chair, Member of the Executive Committee and Chair of the Investment Committee, Cornell University since 2004; President, Trustee and Member of the Investment Committee, The Aldrich Contemporary Art Museum from 2007 to 2014; Member of the Board and Investment Committee, University School from 2007 to 2018; Member of the Investment Committee, Mellon Foundation from 2009 to 2015; Trustee, Artstor (a Mellon Foundation affiliate) from 2010 to 2015; President and Trustee, the Center for the Arts, Jackson Hole from 2011 to 2018; Director, Athena Capital Advisors LLC (investment management firm) since 2013; Trustee and Chair of the Investment Committee, Community Foundation of Jackson Hole since 2014; Member of Affordable Housing Supply Board of Jackson, Wyoming since 2018; Member, Investment Funds Committee, State of Wyoming since 2017; Trustee, Phoenix Art Museum since 2018. | | 41 RICs consisting of 185 Portfolios | | None |
Joseph P. Platt 1947 | | Director (Since 2019) | | General Partner, Thorn Partners, LP (private investments) since 1998; Director, WQED Multi-Media (public broadcastingnot-for-profit) since 2001; Chair, Basic Health International(non-profit) since 2015. | | 41 RICs consisting of 185 Portfolios | | Greenlight Capital Re, Ltd. (reinsurance company); Consol Energy Inc. |
Kenneth L. Urish 1951 | | Director (Since 2019) | | Managing Partner, Urish Popeck & Co., LLC (certified public accountants and consultants) since 1976; Past-Chairman of the Professional Ethics Committee of the Pennsylvania Institute of Certified Public Accountants and Committee Member thereof since 2007; Member of External Advisory Board, The Pennsylvania State University Accounting Department since founding in 2001; Principal, UP Strategic Wealth Investment Advisors, LLC since 2013; Trustee, The Holy Family Institute from 2001 to 2010; President and Trustee, Pittsburgh Catholic Publishing Associates from 2003 to 2008; Director,Inter-Tel from 2006 to 2007. | | 41 RICs consisting of 185 Portfolios | | None |
Claire A. Walton 1957 | | Director (Since 2019) | | Chief Operating Officer and Chief Financial Officer of Liberty Square Asset Management, LP from 1998 to 2015; General Partner of Neon Liberty Capital Management, LLC since 2003; Director, Boston Hedge Fund Group from 2009 to 2018; Director, Woodstock Ski Runners since 2013; Director, Massachusetts Council on Economic Education from 2013 to 2015. | | 41 RICs consisting of 185 Portfolios | | None |
| | |
| 38 | | 2 0 1 9 B L A C K R O C K A N N U A L R E P O R T T O S H A R E H O L D E R S |
Director and Officer Information (continued)
| | | | | | | | |
| Interested Directors(a)(d) |
| | | | | |
Name Year of Birth(b) | | Position(s) Held (Length of Service)(c) | | Principal Occupation(s) During Past Five Years | | Number of BlackRock-Advised
Registered Investment Companies
(“RICs”) Consisting of Investment
Portfolios (“Portfolios”) Overseen | | Public Company
and Other
Investment Company
Directorships
Held During Past Five Years |
Robert Fairbairn 1965 | | Director (Since 2015) | | Senior Managing Director of BlackRock, Inc. since 2010; oversees BlackRock’s Strategic Partner Program and Strategic Product Management Group; Member of BlackRock’s Global Executive and Global Operating Committees;Co-Chair of BlackRock’s Human Capital Committee; Member of the Board of Managers of BlackRock Investments, LLC from 2011 to 2018; Global Head of BlackRock’s Retail and iShares®businesses from 2012 to 2016. | | 129 RICs consisting of 297 Portfolios | | None |
John M. Perlowski 1964 | | Director (Since 2015), President, and Chief Executive Officer (Since 2010) | | Managing Director of BlackRock, Inc. since 2009; Head of BlackRock Global Accounting and Product Services since 2009; Advisory Director of Family Resource Network (charitable foundation) since 2009. | | 129 RICs consisting of 297 Portfolios | | None |
(a) The address of each Director is c/o BlackRock, Inc., 55 East 52nd Street, New York, New York 10055. (b) Each Independent Director holds office until his or her successor is duly elected and qualifies or until his or her earlier death, resignation, retirement or removal as provided by the Fund’s/Master LLC’sby-laws or charter or statute, or until December 31 of the year in which he or she turns 75. Directors who are “interested persons,” as defined in the 1940 Act, serve until their successor is duly elected and qualifies or until their earlier death, resignation, retirement or removal as provided by the Fund’s/Master LLC’sby-laws or statute, or until December 31 of the year in which they turn 72. The Board may determine to extend the terms of Independent Directors on acase-by-case basis, as appropriate. (c) Following the combination of MLIM and BlackRock, Inc. in September 2006, the various legacy MLIM and legacy BlackRock fund boards were realigned and consolidated into three new fund boards in 2007. In addition, effective January 1, 2019, three BlackRock Fund Complexes were realigned and consolidated into two BlackRock Fund Complexes. As a result, although the chart shows the year that each Independent Director joined the Board, certain Independent Directors first became members of the boards of other BlackRock-advised Funds, legacy MLIM funds or legacy BlackRock funds as follows: Bruce R. Bond, 2005; Susan J. Carter, 2016; Collette Chilton, 2015; Neil A. Cotty, 2016; Robert M. Hernandez, 1996; Cynthia A. Montgomery, 1994; Joseph P. Platt, 1999; Mark Stalnecker, 2015; Kenneth L. Urish, 1999; Claire A. Walton, 2016. (d) Mr. Fairbairn and Mr. Perlowski are both “interested persons,” as defined in the 1940 Act, of the Fund/Master LLC based on their positions with BlackRock, Inc. and its affiliates. Mr. Fairbairn and Mr. Perlowski are also board members of the BlackRock Fixed-Income Complex. |
| | | | |
| D I R E C T O R A N D O F F I C E R I N F O R M A T I O N | | | 39 | |
Director and Officer Information (continued)
| | | | |
| Officers Who Are Not Directors(a) |
| | | |
Name
Year of Birth(b) | | Position(s) Held (Length of
Service) | | Principal Occupation(s) During Past Five Years |
Jennifer McGovern 1977 | | Vice President (Since 2014) | | Managing Director of BlackRock, Inc. since 2016; Director of BlackRock, Inc. from 2011 to 2015; Head of Product Structure and Oversight for BlackRock’s U.S. Wealth Advisory Group since 2013. |
Neal J. Andrews 1966 | | Chief Financial Officer (Since 2007) | | Chief Financial Officer of the iShares®exchange traded funds since 2019; Managing Director of BlackRock, Inc. since 2006. |
Jay M. Fife 1970 | | Treasurer (Since 2007) | | Managing Director of BlackRock, Inc. since 2007. |
Charles Park 1967 | | Chief Compliance Officer (Since 2014) | | Anti-Money Laundering Compliance Officer for certain BlackRock-advised Funds from 2014 to 2015; Chief Compliance Officer of BlackRock Advisors, LLC and the BlackRock-advised Funds in the BlackRock Multi-Asset Complex and the BlackRock Fixed-Income Complex since 2014; Principal of and Chief Compliance Officer for iShares®Delaware Trust Sponsor LLC since 2012 and BlackRock Fund Advisors (“BFA”) since 2006; Chief Compliance Officer for theBFA-advised iShares®exchange traded funds since 2006; Chief Compliance Officer for BlackRock Asset Management International Inc. since 2012. |
John MacKessy 1972 | | Anti-Money Laundering Compliance Officer (Since 2018) | | Director of BlackRock, Inc. since 2017; Global Head of Anti-Money Laundering at BlackRock, Inc. since 2017; Director of AML Monitoring and Investigations Group of Citibank from 2015 to 2017; Global Anti-Money Laundering and Economic Sanctions Officer for MasterCard from 2011 to 2015. |
Benjamin Archibald 1975 | | Secretary (Since 2012) | | Managing Director of BlackRock, Inc. since 2014; Director of BlackRock, Inc. from 2010 to 2013; Secretary of the iShares®exchange traded funds since 2015; Secretary of the BlackRock-advised mutual funds since 2012. |
(a) The address of each Officer is c/o BlackRock, Inc., 55 East 52nd Street, New York, New York 10055. |
(b) Officers of the Fund/Master LLC serve at the pleasure of the Board. |
Further information about the Fund’s/Master LLC’s Directors and Officers is available in the Fund’s/Master LLC’s Statement of Additional Information, which can be obtained without charge by calling (800)441-7762.
At a special meeting of shareholders held on November 21, 2018, the Fund’s shareholders and the Master LLC’s interestholders elected Directors who took office on January 1, 2019. The newly elected Directors include seven former Directors and eight individuals who served as directors/trustees of the funds in the BlackRock Equity-Liquidity Complex.
Investment Adviser and Administrator
BlackRock Advisors, LLC
Wilmington, DE 19809
Accounting Agent and Transfer Agent
BNY Mellon Investment Servicing (US) Inc.
Wilmington, DE 19809
Custodian
The Bank of New York Mellon
New York, NY 10286
Independent Registered Public Accounting Firm
Deloitte & Touche LLP
Boston, MA 02116
Distributor
BlackRock Investments, LLC
New York, NY 10022
Legal Counsel
Sidley Austin LLP
New York, NY 10019
Address of the Fund/Master LLC
100 Bellevue Parkway
Wilmington, DE 19809
| | |
| 40 | | 2 0 1 9 B L A C K R O C K A N N U A L R E P O R T T O S H A R E H O L D E R S |
Additional Information
Proxy Results
BlackRock Advantage U.S. Total Market Fund, Inc.
A Special Meeting of Shareholders was held on November 21, 2018, for shareholders of record on September 24, 2018, to elect a Board of Directors of the Fund. The newly elected Directors took office effective January 1, 2019.
Shareholders approved the Directors* of BlackRock Advantage U.S. Total Market Fund, Inc. with voting results as follows:
| | | | | | | | | | | | |
| | | Votes For | | | Votes Against | | | Votes Abstained | |
Bruce R. Bond | | | 16,599,422 | | | | 408,826 | | | | 328,948 | |
Susan J. Carter | | | 16,804,563 | | | | 280,226 | | | | 252,407 | |
Collette Chilton | | | 16,716,522 | | | | 347,881 | | | | 272,793 | |
Neil A. Cotty | | | 16,603,384 | | | | 406,363 | | | | 327,449 | |
Robert Fairbairn | | | 16,563,920 | | | | 446,930 | | | | 326,346 | |
Lena G. Goldberg | | | 16,670,841 | | | | 413,947 | | | | 252,408 | |
Robert M. Hernandez | | | 16,571,446 | | | | 439,666 | | | | 326,084 | |
Henry R. Keizer | | | 16,591,463 | | | | 418,442 | | | | 327,291 | |
Cynthia A. Montgomery | | | 16,742,215 | | | | 342,467 | | | | 252,514 | |
Donald C. Opatrny | | | 16,601,899 | | | | 409,211 | | | | 326,086 | |
John M. Perlowski | | | 16,621,590 | | | | 389,259 | | | | 326,347 | |
Joseph P. Platt | | | 16,610,296 | | | | 400,815 | | | | 326,085 | |
Mark Stalnecker | | | 16,552,599 | | | | 458,511 | | | | 326,086 | |
Kenneth L. Urish | | | 16,580,417 | | | | 430,433 | | | | 326,346 | |
Claire A. Walton | | | 16,706,964 | | | | 374,955 | | | | 255,277 | |
| | * | Denotes the Fund-wide proposal and voting results. | |
The above Directors, referred to as the BlackRock Multi-Asset Board, have also been elected to serve as directors for other BlackRock-advised equity, multi-asset, index and money market funds.
Master Advantage U.S. Total Market LLC
A Special Meeting of Interestholders was held on November 21, 2018, for interestholders of record on September 24, 2018, to elect a Board of Directors of the Master LLC. The newly elected Directors took office effective January 1, 2019.
Interestholders approved the Directors* of Master Advantage U.S. Total Market LLC with voting results as follows:
| | | | | | | | | | | | |
| | | Votes For | | | Votes Against | | | Votes Abstained | |
Bruce R. Bond | | | 465,956,651 | | | | 12,806,803 | | | | 9,175,187 | |
Susan J. Carter | | | 471,965,427 | | | | 8,043,256 | | | | 7,929,958 | |
Collette Chilton | | | 470,394,262 | | | | 9,962,341 | | | | 7,582,038 | |
Neil A. Cotty | | | 466,089,459 | | | | 12,716,207 | | | | 9,132,975 | |
Robert Fairbairn | | | 467,882,941 | | | | 10,885,888 | | | | 9,169,812 | |
Lena G. Goldberg | | | 469,658,517 | | | | 11,225,108 | | | | 7,055,016 | |
Robert M. Hernandez | | | 466,337,103 | | | | 12,511,515 | | | | 9,090,023 | |
Henry R. Keizer | | | 468,202,236 | | | | 10,599,691 | | | | 9,136,714 | |
Cynthia A. Montgomery | | | 471,855,950 | | | | 8,188,282 | | | | 7,894,409 | |
Donald C. Opatrny | | | 466,083,468 | | | | 12,765,121 | | | | 9,090,052 | |
John M. Perlowski | | | 468,129,765 | | | | 10,478,728 | | | | 9,330,148 | |
Joseph P. Platt | | | 467,341,845 | | | | 11,506,773 | | | | 9,090,023 | |
Mark Stalnecker | | | 466,372,001 | | | | 12,476,617 | | | | 9,090,023 | |
Kenneth L. Urish | | | 466,929,337 | | | | 11,792,801 | | | | 9,216,503 | |
Claire A. Walton | | | 469,505,586 | | | | 11,235,071 | | | | 7,197,984 | |
| | * | Denotes the MasterLLC-wide proposal and voting results. | |
The above Directors, referred to as the BlackRock Multi-Asset Board, have also been elected to serve as directors for other BlackRock-advised equity, multi-asset, index and money market funds.
General Information
Householding
The Fund will mail only one copy of shareholder documents, including prospectuses, annual and semi-annual reports and proxy statements, to shareholders with multiple accounts at the same address. This practice is commonly called “householding” and is intended to reduce expenses and eliminate duplicate mailings of shareholder documents. Mailings of your shareholder documents may be householded indefinitely unless you instruct us otherwise. If you do not want the mailing of these documents to be combined with those for other members of your household, please call the Fund at (800)441-7762.
| | | | |
| A D D I T I O N A L I N F O R M A T I O N | | | 41 | |
Additional Information (continued)
Availability of Quarterly Schedule of Investments
The Fund/Master LLC file their complete schedule of portfolio holdings with the SEC for the first and third quarters of each fiscal year on FormN-Q. The Fund/Master LLC’s FormsN-Q are available on the SEC’s website at http://www.sec.gov. The Fund/Master LLC’s FormsN-Q may also be obtained upon request and without charge by calling (800)441-7762.
Availability of Proxy Voting Policies and Procedures
A description of the policies and procedures that the Fund/Master LLC use to determine how to vote proxies relating to portfolio securities is available upon request and without charge (1) by calling (800)441-7762; (2) athttp://www.blackrock.com; and (3) on the SEC’s website at http://www.sec.gov.
Availability of Proxy Voting Record
Information about how the Fund/Master LLC voted proxies relating to securities held in the Fund/Master LLC’s portfolio during the most recent12-month period ended June 30 is available upon request and without charge (1) athttp://www.blackrock.com; or by calling (800)441-7762 and (2) on the SEC’s website at http://www.sec.gov.
BlackRock’s Mutual Fund Family
BlackRock offers a diverse lineup ofopen-end mutual funds crossing all investment styles and managed by experts in equity, fixed-income andtax-exempt investing. Visithttp://www.blackrock.comfor more information.
Shareholder Privileges
Account Information
Call us at (800)441-7762 from 8:00 AM to 6:00 PM ET on any business day to get information about your account balances, recent transactions and share prices. You can also reach us on the Web athttp://www.blackrock.com.
Automatic Investment Plans
Investor Class shareholders who want to invest regularly can arrange to have $50 or more automatically deducted from their checking or savings account and invested in any of the BlackRock funds.
Systematic Withdrawal Plans
Investor Class shareholders can establish a systematic withdrawal plan and receive periodic payments of $50 or more from their BlackRock funds, as long as their account balance is at least $10,000.
Retirement Plans
Shareholders may make investments in conjunction with Traditional, Rollover, Roth, Coverdell, Simple IRAs, SEP IRAs and 403(b) Plans.
BlackRock Privacy Principles
BlackRock is committed to maintaining the privacy of its current and former fund investors and individual clients (collectively, “Clients”) and to safeguarding theirnon-public personal information. The following information is provided to help you understand what personal information BlackRock collects, how we protect that information and why in certain cases we share such information with select parties.
If you are located in a jurisdiction where specific laws, rules or regulations require BlackRock to provide you with additional or different privacy-related rights beyond what is set forth below, then BlackRock will comply with those specific laws, rules or regulations.
BlackRock obtains or verifies personalnon-public information from and about you from different sources, including the following: (i) information we receive from you or, if applicable, your financial intermediary, on applications, forms or other documents; (ii) information about your transactions with us, our affiliates, or others; (iii) information we receive from a consumer reporting agency; and (iv) from visits to our websites.
BlackRock does not sell or disclose tonon-affiliated third parties anynon-public personal information about its Clients, except as permitted by law or as is necessary to respond to regulatory requests or to service Client accounts. Thesenon-affiliated third parties are required to protect the confidentiality and security of this information and to use it only for its intended purpose.
We may share information with our affiliates to service your account or to provide you with information about other BlackRock products or services that may be of interest to you. In addition, BlackRock restricts access tonon-public personal information about its Clients to those BlackRock employees with a legitimate business need for the information. BlackRock maintains physical, electronic and procedural safeguards that are designed to protect thenon-public personal information of its Clients, including procedures relating to the proper storage and disposal of such information.
| | |
| 42 | | 2 0 1 9 B L A C K R O C K A N N U A L R E P O R T T O S H A R E H O L D E R S |
This report is intended for current holders. It is not authorized for use as an offer of sale or a solicitation of an offer to buy shares of the Fund unless preceded or accompanied by the Fund’s current prospectus. Past performance results shown in this report should not be considered a representation of future performance. Investment returns and principal value of shares will fluctuate so that shares, when redeemed, may be worth more or less than their original cost. Statements and other information herein are as dated and are subject to change.

| | |
| VO-3/19-AR | |  |
| | |
| Item 2 – | | Code of Ethics – Each registrant (or each, a “Fund” or together, the “Funds”) has adopted a code of ethics, as of the end of the period covered by this report, applicable to the registrants’ principal executive officer, principal financial officer, principal accounting officer or controller, or persons performing similar functions. During the period covered by this report, the code of ethics was amended to update certain information and to make othernon-material changes. During the period covered by this report, there have been no waivers granted under the code of ethics. The registrants undertake to provide a copy of the code of ethics to any person upon request, without charge, who calls1-800-441-7762. |
| |
| Item 3 – | | Audit Committee Financial Expert – Each registrant’s board of directors (the “board of directors”), has determined that (i) the registrant has the following audit committee financial experts serving on its audit committee and (ii) each audit committee financial expert is independent: |
| |
| | Neil A. Cotty Robert M. Hernandez Henry R. Keizer Kenneth L. Urish Claire A. Walton |
| |
| | Under applicable securities laws, a person determined to be an audit committee financial expert will not be deemed an “expert” for any purpose, including without limitation for the purposes of Section 11 of the Securities Act of 1933, as a result of being designated or identified as an audit committee financial expert. The designation or identification of a person as an audit committee financial expert does not impose on such person any duties, obligations, or liabilities greater than the duties, obligations, and liabilities imposed on such person as a member of the audit committee and board of directors in the absence of such designation or identification. The designation or identification of a person as an audit committee financial expert does not affect the duties, obligations, or liability of any other member of the audit committee or board of directors. |
| |
| Item 4 – | | Principal Accountant Fees and Services |
The following table presents fees billed by Deloitte & Touche LLP (“D&T”) in each of the last two fiscal years for the services rendered to the Funds:
| | | | | | | | | | | | | | | | |
| | | (a) Audit Fees | | (b) Audit-Related Fees1 | | (c) Tax Fees2 | | (d) All Other Fees |
| Entity Name | | Current
Fiscal Year
End | | Previous
Fiscal Year
End | | Current
Fiscal Year
End | | Previous
Fiscal Year
End | | Current
Fiscal Year
End | | Previous
Fiscal Year
End | | Current
Fiscal Year
End | | Previous
Fiscal Year
End |
| BlackRock Advantage U.S. Total Market Fund, Inc. | | $8,160 | | $8,160 | | $4,000 | | $38 | | $13,100 | | $15,800 | | $0 | | $0 |
| Master Advantage U.S. Total Market LLC | | $36,618 | | $36,618 | | $0 | | $0 | | $0 | | $0 | | $0 | | $0 |
The following table presents fees billed by D&T that were required to be approved by each registrant’s audit committee (each a “Committee”) for services that relate directly to the operations or financial reporting of each Fund and that are rendered on behalf of BlackRock Advisors, LLC (the “investment adviser” or “BlackRock”)and entities controlling, controlled by, or under common control with BlackRock (not
2
including anysub-adviser whose role is primarily portfolio management and is subcontracted with or overseen by another investment adviser) that provide ongoing services to each Fund (“Affiliated Service Providers”):
| | | | |
| | | Current Fiscal Year End | | Previous Fiscal Year End |
(b) Audit-Related Fees1 | | $0 | | $0 |
(c) Tax Fees2 | | $0 | | $0 |
(d) All Other Fees3 | | $2,050,500 | | $2,274,000 |
1 The nature of the services includes assurance and related services reasonably related to the performance of the audit or review of financial statements not included in Audit Fees, including accounting consultations, agreed-upon procedure reports, attestation reports, comfort letters,out-of-pocket expenses and internal control reviews not required by regulators.
2 The nature of the services includes tax compliance and/or tax preparation, including services relating to the filing or amendment of federal, state or local income tax returns, regulated investment company qualification reviews, taxable income and tax distribution calculations.
3Non-audit fees of $2,050,500 and $2,274,000 for the current fiscal year and previous fiscal year, respectively, were paid to each Fund’s principal accountant in their entirety by BlackRock, in connection with services provided to the Affiliated Service Providers of each Fund and of certain other funds sponsored and advised by BlackRock or its affiliates for a service organization review and an accounting research tool subscription. These amounts represent aggregate fees paid by BlackRock and were not allocated on a per fund basis.
(e)(1) Audit CommitteePre-Approval Policies and Procedures:
The Committee has adopted policies and procedures with regard to thepre-approval of services. Audit, audit-related and tax compliance services provided to the registrants on an annual basis require specificpre-approval by the Committee. The Committee also must approve othernon-audit services provided to the registrants and thosenon-audit services provided to the Investment Adviser and Affiliated Service Providers that relate directly to the operations and the financial reporting of the registrants. Certain of thesenon-audit services that the Committee believes are (a) consistent with the SEC’s auditor independence rules and (b) routine and recurring services that will not impair the independence of the independent accountants may be approved by the Committee without consideration on a specificcase-by-case basis (“generalpre-approval”). The term of any generalpre-approval is 12 months from the date of thepre-approval, unless the Committee provides for a different period. Tax or othernon-audit services provided to the registrants which have a direct impact on the operations or financial reporting of the registrants will only be deemedpre-approved provided that any individual project does not exceed $10,000 attributable to the registrants or $50,000 per project. For this purpose, multiple projects will be aggregated to determine if they exceed the previously mentioned cost levels.
Any proposed services exceeding thepre-approved cost levels will require specificpre-approval by the Committee, as will any other services not subject to generalpre-approval (e.g., unanticipated but permissible services). The Committee is informed of each service approved subject to generalpre-approval at the next regularly scheduledin-person board meeting. At this meeting, an analysis of such services is presented to the Committee for ratification. The Committee may delegate to the Committee Chairman the authority to approve the provision of and fees for any specific engagement of permittednon-audit services, including services exceedingpre-approved cost levels.
(e)(2) None of the services described in each of Items 4(b) through (d) were approved by the Committee pursuant to the de minimis exception in paragraph (c)(7)(i)(C) of Rule2-01 of RegulationS-X.
(f) Not Applicable
3
(g) The aggregatenon-audit fees, defined as the sum of the fees shown under “Audit-Related Fees,” “Tax Fees” and “All Other Fees,” paid to the accountant for services rendered by the accountant to the registrants, the Investment Adviser and the Affiliated Service Providers were:
| | | | |
| Entity Name | | Current Fiscal Year
End | | Previous Fiscal Year
End |
| BlackRock Advantage U.S. Total Market Fund, Inc. | | $17,100 | | $15,838 |
| Master Advantage U.S. Total Market LLC | | $0 | | $0 |
Additionally, the amounts billed by D&T in connection with services provided to the Affiliated Service Providers of the Fund and of other funds sponsored and advised by BlackRock or its affiliates during the current and previous fiscal years for a service organization review and accounting research subscription tool were:
| | |
Current Fiscal Year End | | Previous Fiscal Year
End |
| $2,050,000 | | $2,274,000 |
These amounts represent aggregate fees paid by BlackRock and were not allocated on a per fund basis.
(h) The Committee has considered and determined that the provision ofnon-audit services that were rendered to the Investment Adviser and the Affiliated Service Providers that were notpre-approved pursuant to paragraph (c)(7)(ii) ofRule 2-01 of RegulationS-X is compatible with maintaining the principal accountant’s independence.
| | |
| |
| Item 5 – | | Audit Committee of Listed Registrants – Not Applicable |
| |
| Item 6 – | | Investments |
| |
| | (a) The registrants’ Schedules of Investments are included as part of the Report to Stockholders filed under Item 1 of this Form. |
| |
| | (b) Not Applicable due to no such divestments during the semi-annual period covered since the previousForm N-CSR filing. |
| |
| Item 7 – | | Disclosure of Proxy Voting Policies and Procedures forClosed-End Management Investment Companies – Not Applicable |
| |
| Item 8 – | | Portfolio Managers ofClosed-End Management Investment Companies – Not Applicable |
| |
| Item 9 – | | Purchases of Equity Securities byClosed-End Management Investment Company and Affiliated Purchasers – Not Applicable |
| |
| Item 10 – | | Submission of Matters to a Vote of Security Holders – There have been no material changes to these procedures. |
4
Item 11 – Controls and Procedures
(a) The registrants’ principal executive and principal financial officers, or persons performing similar functions, have concluded that the registrants’ disclosure controls and procedures (as defined in Rule30a-3(c) under the Investment Company Act of 1940, as amended (the “1940 Act”)) are effective as of a date within 90 days of the filing of this report based on the evaluation of these controls and procedures required by Rule30a-3(b) under the 1940 Act and Rule 15d-15(b) under the Securities Exchange Act of 1934, as amended.
(b) There were no changes in the registrants’ internal control over financial reporting (as defined inRule 30a-3(d) under the 1940 Act) that occurred during the last fiscal quarter of the period covered by this report that have materially affected, or are reasonably likely to materially affect, the registrants’ internal control over financial reporting.
| | |
| Item 12 – | | Disclosure of Securities Lending Activities forClosed-End Management Investment Companies – Not Applicable |
Item 13 – Exhibits attached hereto
(a)(1) Code of Ethics – See Item 2
(a)(2) Certifications – Attached hereto
(a)(3) Not Applicable
(a)(4) Not Applicable
(b) Certifications – Attached hereto
5
Pursuant to the requirements of the Securities Exchange Act of 1934 and the Investment Company Act of 1940, each registrant has duly caused this report to be signed on its behalf by the undersigned, thereunto duly authorized.
BlackRock Advantage U.S. Total Market Fund, Inc. and Master Advantage U.S. Total Market LLC
| | |
| By: | | /s/ John M. Perlowski |
| | John M. Perlowski |
| | |
| | Chief Executive Officer (principal executive officer) of BlackRock Advantage U.S. Total Market Fund, Inc. and Master Advantage U.S. Total Market LLC |
| |
Date: | | June 5, 2019 |
Pursuant to the requirements of the Securities Exchange Act of 1934 and the Investment Company Act of 1940, this report has been signed below by the following persons on behalf of each registrant and in the capacities and on the dates indicated.
| | |
| By: | | /s/ John M. Perlowski |
| | John M. Perlowski |
| | |
| | Chief Executive Officer (principal executive officer) of BlackRock Advantage U.S. Total Market Fund, Inc. and Master Advantage U.S. Total Market LLC |
| |
Date: | | June 5, 2019 |
| | |
| By: | | /s/ Neal J. Andrews |
| | Neal J. Andrews |
| | |
| | Chief Financial Officer (principal financial officer) of BlackRock Advantage U.S. Total Market Fund, Inc. and Master Advantage U.S. Total Market LLC |
| |
Date: | | June 5, 2019 |
6