UNITED STATES
SECURITIES AND EXCHANGE COMMISSION
Washington, D.C. 20549
FORM N-CSR
CERTIFIED SHAREHOLDER REPORT OF REGISTERED
MANAGEMENT INVESTMENT COMPANIES
Investment Company Act file number 811-02739 and 811-10179
Name of Fund: BlackRock Basic Value Fund, Inc. and Master Basic Value LLC
Fund Address: 100 Bellevue Parkway, Wilmington, DE 19809
Name and address of agent for service: John M. Perlowski, Chief Executive Officer, BlackRock Basic Value Fund,
Inc. and Master Basic Value LLC, 55 East 52nd Street, New York, NY 10055
Registrants’ telephone number, including area code: (800) 441-7762
Date of fiscal year end: 06/30/2013
Date of reporting period: 12/31/2012
Item 1 – Report to Stockholders
DECEMBER 31, 2012
| | | | |
SEMI-ANNUAL REPORT (UNAUDITED) | | | | BLACKROCK ® |
BlackRock Basic Value Fund, Inc.
| | |
Not FDIC Insured ¡ May Lose Value ¡ No Bank Guarantee | | |
Table of Contents
| | | | | | |
| | | | | | | |
| 2 | | BLACKROCK BASIC VALUE FUND, INC. | | DECEMBER 31, 2012 | | |
Financial markets substantially improved in 2012 as compared to the prior year, due largely to central bank intervention and considerable relief from the global turmoil seen in 2011. Although 2012 brought its share of headwinds, the strongest returns came from higher-risk asset classes as investors reached for yield in an environment of extremely low interest rates.
The year opened with investor confidence on the rise as global liquidity had been restored and financial news headlines became less daunting. Equity markets moved higher through the first two months of 2012, while climbing US Treasury yields pressured higher-quality fixed income assets. However, markets reversed course in the spring when Europe’s debt crisis boiled over once again. Political instability in Greece and severe deficit and liquidity problems in Spain raised the prospect of a euro collapse. Government borrowing costs in peripheral European countries soared while the region’s finance leaders deliberated over the fiscal integration of the currency bloc. Alongside the drama in Europe, investors were discouraged by gloomy economic reports from various parts of the world. A slowdown in China, a key powerhouse for global growth, emerged as a particular concern. In the United States, disappointing jobs reports signaled that the recovery was losing steam. Risk assets sold off as investors retreated to safe-haven assets.
As the outlook for the global economy worsened, investors grew increasingly optimistic that the world’s largest central banks soon would intervene to stimulate growth. This theme, along with increased cooperation among finance ministers in Europe, fueled a powerful risk-asset rebound in June. In July, the European Central Bank (“ECB”) president stated that the bank would do “whatever it takes” to preserve the euro currency bloc. This assurance along with expectations for policy stimulus from central banks in Europe and the United States drove most asset classes higher through the summer. Early in September, the ECB announced its decision to support the eurozone’s troubled peripheral countries with unlimited purchases of short term sovereign debt. Days later, the US Federal Reserve announced an aggressive stimulus package involving open-ended monthly purchases of agency mortgage-backed securities.
Going into the fall, US stocks slid on lackluster corporate earnings reports and market volatility rose leading up to the US Presidential election. Global trade slowed as many European countries fell into recession and growth continued to decelerate in China, where a once-a-decade leadership change compounded uncertainty. In the United States, automatic tax increases and spending cuts that had been scheduled to take effect at the beginning of 2013 (known as the “fiscal cliff”) threatened to push the nation into recession unless politicians could agree upon alternate measures to reduce the deficit before the end of 2012. Worries that bipartisan gridlock would preclude a budget deal prior to the deadline drove high levels of volatility in financial markets around the world in the months leading up to the last day of the year. Ultimately, the United States averted the worst of the fiscal cliff with a last-minute tax deal. Relief from US fiscal worries, however, was only partial as decisions relating to spending cuts and the debt ceiling remained pending as financial markets closed for the year.
All major asset classes generated positive returns for the 6- and 12-month periods ended December 31, 2012. Riskier assets outperformed higher quality investments as investors sought meaningful returns in a low interest rate environment. International and emerging market equities were the strongest performers. US Treasury yields were volatile, but declined overall, resulting in moderate gains for higher quality fixed income sectors. Tax-exempt municipal bonds benefited from a favorable supply-and-demand environment. Near-zero short term interest rates continued to keep yields on money market securities near their all-time lows.
The New Year brings a host of unknowns, but we believe new opportunities abound. BlackRock was built to provide the global market insight, breadth of capabilities, unbiased investment advice and deep risk management expertise these times require. With access to every asset class, geography and investment style, and extensive market intelligence, we help investors of all sizes build dynamic, diverse portfolios to achieve better, more consistent returns over time. We encourage you to visit www.blackrock.com/newworld for more information.
Sincerely,

Rob Kapito
President, BlackRock Advisors, LLC

“Although 2012 brought its share of headwinds, the strongest returns came from higher-risk asset classes as investors reached for yield in an environment of extremely low interest rates.”
Rob Kapito
President, BlackRock Advisors, LLC
Total Returns as of December 31, 2012
| | | | |
| | 6-month | | 12-month |
| US large cap equities | | 5.95% | | 16.00% |
| (S&P 500® Index) | | | | |
| US small cap equities | | 7.20 | | 16.35 |
| (Russell 2000® Index) | | | | |
| International equities | | 13.95 | | 17.32 |
| (MSCI Europe, Australasia, | | | | |
| Far East Index) | | | | |
| Emerging market | | 13.75 | | 18.22 |
| equities (MSCI Emerging | | | | |
| Markets Index) | | | | |
| 3-month Treasury bill | | 0.07 | | 0.11 |
| (BofA Merrill Lynch | | | | |
| 3-Month US Treasury | | | | |
| Bill Index) | | | | |
| US Treasury securities | | 0.71 | | 4.18 |
| (BofA Merrill Lynch 10- | | | | |
| Year US Treasury Index) | | | | |
| US investment grade | | 1.80 | | 4.21 |
| bonds (Barclays US | | | | |
| Aggregate Bond Index) | | | | |
| Tax-exempt municipal | | 3.15 | | 7.42 |
| bonds (S&P Municipal | | | | |
| Bond Index) | | | | |
| US high yield bonds | | 7.97 | | 15.78 |
| (Barclays US Corporate | | | | |
| High Yield 2% Issuer | | | | |
| Capped Index) | | | | |
Past performance is no guarantee of future results. Index performance is shown for illustrative purposes only. You cannot invest directly in an index.
| | | | | | |
| | | | | | | |
| | THIS PAGE NOT PART OF YOUR FUND REPORT | | | | 3 |
| | |
| | |
Fund Summary as of December 31, 2012 | | BlackRock Basic Value Fund, Inc. |
BlackRock Basic Value Fund, Inc.’s (the “Fund”) investment objective is to seek capital appreciation and, secondarily, income by investing in securities, primarily equity securities, that management of the Fund believes are undervalued and therefore represent basic investment value.
|
Portfolio Management Commentary |
How did the Fund perform?
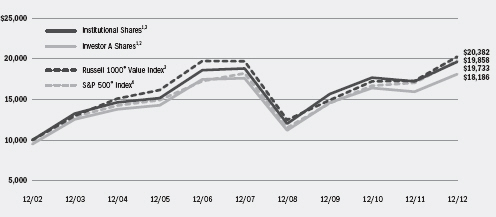
| — | | For the six-month period ended December 31, 2012, through its investment in Master Basic Value LLC (the “Master LLC”), the Fund’s Institutional Shares outperformed the benchmark, the Russell 1000® Value Index. For the same period, the Fund’s Investor A Shares performed in line with the benchmark index, while the Investor B, Investor C and R Shares underperformed. Also during the period, all of the Fund’s share classes outperformed the broad-market S&P 500® Index. The following discussion of relative performance pertains to the Russell 1000® Value Index. |
What factors influenced performance?
| — | | The Fund benefited from the Master LLC’s investments in the financials sector, with holdings in the insurance industry accounting for much of the positive performance. Most notably, shares of Hartford Financial Services Group, Inc. soared as the company successfully sold its non-core businesses and demonstrated progress toward its overall restructuring. Elsewhere in financials, a significant position in Citigroup, Inc. boosted results as the company’s new management team made efforts to increase value to its shareholders. In addition, the improving macro environment provided a tailwind as European risks waned and allowed for better-than-expected capital markets activity. Stock selection in the health care sector also had a positive impact on performance, with shares of Baxter International, Inc. (health care equipment & supplies) climbing steadily over the period after raising its quarterly dividend in July. The Master LLC’s only investment in the biotechnology industry was Amgen, Inc., which rose more than 38% before the Master LLC eliminated the stock near its peak price as it had become expensive. In the energy sector, the Master LLC’s underweight to integrated oil companies, specifically Exxon Mobil Corp. and Chevron Corp., proved beneficial, as did investments in energy services providers Ensco Plc and Halliburton Co. |
| — | | The Master LLC’s overall sector allocation detracted from relative performance during the period. The Master LLC held underweights in the strong-performing consumer discretionary and financials sectors and an overweight in the struggling information technology (“IT”) sector. Also having a negative impact on performance was stock selection in materials, where shares of E.I. du Pont de Nemours & Co. declined on a disappointing earnings report and a lowered forecast for the forthcoming year amid weakening demand for its products in the auto, construction and solar panel markets. In the IT sector, holdings of The Western Union Co. and Corning, Inc. hurt results as both companies delivered disappointing quarterly earnings results during the period. |
Describe recent portfolio activity.
| — | | During the 6-month period, the Master LLC achieved greater diversification by substantially increasing the number of holdings, which led to larger allocations to the financials and consumer discretionary sectors. These additions were offset by significant reductions in the materials and IT sectors. Notable positions initiated during the period included Northrop Grumman Corp. and Occidental Petroleum Corp. The Master LLC eliminated sizable positions in PepsiCo, Inc., The Walt Disney Co. and Micron Technology, Inc. |
Describe portfolio positioning at period end.
| — | | Relative to the Russell 1000® Value Index, the Master LLC ended the period with its largest sector overweights in health care and consumer discretionary, and its most significant underweights in utilities and materials. |
The views expressed reflect the opinions of BlackRock as of the date of this report and are subject to change based on changes in market, economic or other conditions. These views are not intended to be a forecast of future events and are no guarantee of future results.
| | | | | | |
| | | | | | | |
| 4 | | BLACKROCK BASIC VALUE FUND, INC. | | DECEMBER 31, 2012 | | |
|
Total Return Based on a $10,000 Investment |
| | |
| |  |
| |
| | 1 Assuming maximum sales charges, if any, transaction costs and other operating expenses, including investment advisory and administration fees. Institutional Shares do not have a sales charge. 2 The Fund invests all of its assets in the Master LLC. The Master LLC invests primarily in equity securities that management of the Master LLC believes are undervalued, which means that their prices are less than management of the Master LLC believes they are worth. 3 This index is a subset of the Russell 1000® Index that consists of those Russell 1000® securities with lower price-to-book ratios and lower forecasted growth values. 4 This unmanaged index covers 500 industrial, utility, transportation and financial companies of the US markets (mostly New York Stock Exchange (“NYSE”) issues), representing about 75% of NYSE market capitalization and 30% of NYSE issues. |
|
Performance Summary for the Period Ended December 31, 2012 |
| | | | | | | | | | | | | | | | | | | | | | | | | | | | |
| | | | | | Average Annual Total Returns5 | |
| | | | | | 1 Year | | | 5 Years | | | 10 Years | |
| | | 6-Month
Total Returns | | | w/o sales
charge | | | w/ sales
charge | | | w/o sales
charge | | | w/ sales
charge | | | w/o sales
charge | | | w/ sales
charge | |
| |
Institutional | | | 8.27% | | | | 14.10% | | | | N/A | | | | 0.85% | | | | N/A | | | | 7.03% | | | | N/A | |
Investor A | | | 8.15 | | | | 13.78 | | | | 7.81% | | | | 0.55 | | | | (0.53)% | | | | 6.74 | | | | 6.16% | |
Investor B | | | 7.50 | | | | 12.62 | | | | 8.12 | | | | (0.40) | | | | (0.76) | | | | 6.03 | | | | 6.03 | |
Investor C | | | 7.67 | | | | 12.83 | | | | 11.83 | | | | (0.28) | | | | (0.28) | | | | 5.88 | | | | 5.88 | |
Class R | | | 7.93 | | | | 13.36 | | | | N/A | | | | 0.17 | | | | N/A | | | | 6.44 | | | | N/A | |
S&P 500® Index | | | 5.95 | | | | 16.00 | | | | N/A | | | | 1.66 | | | | N/A | | | | 7.10 | | | | N/A | |
Russell 1000® Value Index | | | 8.13 | | | | 17.51 | | | | N/A | | | | 0.59 | | | | N/A | | | | 7.38 | | | | N/A | |
| |
| | 5 | Assuming maximum sales charges, if any. Average annual total returns with and without sales charges reflect reductions for distribution and service fees. See “About Fund Performance” on page 6 for a detailed description of share classes, including any related sales charges and fees. |
| | | N/A — Not applicable as share class and index do not have a sales charge. |
| | | Past performance is not indicative of future results. |
| | | | | | | | | | | | | | |
| | | Actual | | Hypothetical7 | | |
| | | Beginning
Account Value
July 1, 2012 | | Ending
Account Value
December 31, 2012 | | Expenses Paid
During the Period6 | | Beginning
Account Value
July 1, 2012 | | Ending
Account Value
December 31, 2012 | | Expenses Paid
During the Period6 | | Annualized
Expense
Ratio |
|
Institutional | | $1,000.00 | | $1,082.70 | | $ 2.89 | | $1,000.00 | | $1,022.43 | | $ 2.80 | | 0.55% |
Investor A | | $1,000.00 | | $1,081.50 | | $ 4.41 | | $1,000.00 | | $1,020.97 | | $ 4.28 | | 0.84% |
Investor B | | $1,000.00 | | $1,075.00 | | $10.46 | | $1,000.00 | | $1,015.12 | | $10.16 | | 2.00% |
Investor C | | $1,000.00 | | $1,076.70 | | $ 8.69 | | $1,000.00 | | $1,016.84 | | $ 8.44 | | 1.66% |
Class R | | $1,000.00 | | $1,079.30 | | $ 6.34 | | $1,000.00 | | $1,019.11 | | $ 6.16 | | 1.21% |
|
| | 6 | For each class of the Fund, expenses are equal to the annualized expense ratio for the class, multiplied by the average account value over the period, multiplied by 184/365 (to reflect the one-half year period shown). Because the Fund invests significantly in the Master LLC, the expense table example reflects the net expenses of both the Fund and the Master LLC in which it invests. |
| | 7 | Hypothetical 5% annual return before expenses is calculated by pro rating the number of days in the most recent fiscal half year divided by 365. See “Disclosure of Expenses” on page 6 for further information on how expenses were calculated. |
| | | | | | |
| | | | | | | |
| | BLACKROCK BASIC VALUE FUND, INC. | | DECEMBER 31, 2012 | | 5 |
| — | | Institutional Shares are not subject to any sales charge. These shares bear no ongoing distribution or service fees and are available only to eligible investors. |
| — | | Investor A Shares are subject to a maximum initial sales charge (front-end load) of 5.25% and a service fee of 0.25% per year (but no distribution fee). |
| — | | Investor B Shares are subject to a maximum contingent deferred sales charge (“CDSC”) of 4.50% declining to 0% after six years. In addition, these shares are subject to a distribution fee of 0.75% per year and a service fee of 0.25% per year. These shares automatically convert to Investor A Shares after approximately eight years. (There is no initial sales charge for automatic share conversions.) All returns for periods greater than eight years reflect this conversion. These shares are only available through exchanges and dividend reinvestments by existing shareholders and for purchase by certain qualified employee benefit plans. |
| — | | Investor C Shares are subject to a 1.00% CDSC if redeemed within one year of purchase. In addition, these shares are subject to a distribution fee of 0.75% per year and a service fee of 0.25% per year. |
| — | | Class R Shares are not subject to any sales charge. These shares are subject to a distribution fee of 0.25% per year and a service fee of |
0.25% per year. These shares are available only to certain retirement and other similar plans. Prior to January 3, 2003, Class R Share performance results are those of Institutional Shares (which have no distribution or service fees) restated to reflect Class R Share fees.
Performance information reflects past performance and does not guarantee future results. Current performance may be lower or higher than the performance data quoted. Refer to www.blackrock.com/funds to obtain performance data current to the most recent month-end. Performance results do not reflect the deduction of taxes that a shareholder would pay on fund distributions or the redemption of fund shares. Figures shown in the performance table on the previous page assume reinvestment of all dividends and distributions, if any, at net asset value (“NAV”) on the ex-dividend date. Investment return and principal value of shares will fluctuate so that shares, when redeemed, may be worth more or less than their original cost. Dividends paid to each class of shares will vary because of the different levels of service, distribution and transfer agency fees applicable to each class, which are deducted from the income available to be paid to shareholders.
Disclosure of Expenses
Shareholders of the Fund may incur the following charges: (a) expenses related to transactions, including sales charges and exchange fees; and (b) operating expenses, including administration fees, service and distribution fees, including 12b-1 fees, and other Fund expenses. The expense example shown on the previous page (which is based on a hypothetical investment of $1,000 invested on July 1, 2012 and held through December 31, 2012) is intended to assist shareholders both in calculating expenses based on an investment in the Fund and in comparing these expenses with similar costs of investing in other mutual funds.
The expense example provides information about actual account values and actual expenses. In order to estimate the expenses a shareholder paid during the period covered by this report, shareholders can divide their account value by $1,000 and then multiply the result by the number corresponding to their share class under the heading entitled “Expenses Paid During the Period.”
The expense example also provides information about hypothetical account values and hypothetical expenses based on the Fund’s actual expense ratio and an assumed rate of return of 5% per year before expenses. In order to assist shareholders in comparing the ongoing expenses of investing in this Fund and other funds, compare the 5% hypothetical example with the 5% hypothetical examples that appear in other funds’ shareholder reports.
The expenses shown in the expense example are intended to highlight shareholders’ ongoing costs only and do not reflect any transactional expenses, such as sales charges or exchange fees, if any. Therefore, the hypothetical example is useful in comparing ongoing expenses only, and will not help shareholders determine the relative total expenses of owning different funds. If these transactional expenses were included, shareholder expenses would have been higher.
| | | | | | |
| | | | | | | |
| 6 | | BLACKROCK BASIC VALUE FUND, INC. | | DECEMBER 31, 2012 | | |
| | |
| | |
Statement of Assets and Liabilities | | BlackRock Basic Value Fund, Inc. |
| | | | |
December 31, 2012 (Unaudited) | | | | |
| Assets | | | | |
Investments at value — Master LLC (cost — $2,842,378,396) | | $ | 3,760,330,066 | |
Withdrawals receivable from the Master LLC | | | 6,623,471 | |
Capital shares sold receivable | | | 6,196,804 | |
Prepaid expenses | | | 35,679 | |
| | | | |
Total assets | | | 3,773,186,020 | |
| | | | |
| | | | |
| Liabilities | | | | |
Capital shares redeemed payable | | | 12,820,275 | |
Transfer agent fees payable | | | 833,633 | |
Service and distribution fees payable | | | 659,403 | |
Other affiliates payable | | | 81,581 | |
Officer’s fees payable | | | 1,199 | |
Other accrued expenses payable | | | 162,887 | |
| | | | |
Total liabilities | | | 14,558,978 | |
| | | | |
Net Assets | | $ | 3,758,627,042 | |
| | | | |
| | | | |
| Net Assets Consist of | | | | |
Paid-in capital | | $ | 2,876,700,096 | |
Distributions in excess of net investment income | | | (3,547,717 | ) |
Accumulated net realized loss allocated from the Master LLC | | | (32,477,007 | ) |
Net unrealized appreciation/depreciation allocated from the Master LLC | | | 917,951,670 | |
| | | | |
Net Assets | | $ | 3,758,627,042 | |
| | | | |
| | | | |
| Net Asset Value | | | | |
Institutional – Based on net assets of $1,915,110,982 and 75,304,691 shares outstanding, 400 million shares authorized, $0.10 par value | | $ | 25.43 | |
| | | | |
Investor A – Based on net assets of $1,449,130,147 and 57,350,092 shares outstanding, 200 million shares authorized, $0.10 par value | | $ | 25.27 | |
| | | | |
Investor B – Based on net assets of $30,353,983 and 1,208,896 shares outstanding, 400 million shares authorized, $0.10 par value | | $ | 25.11 | |
| | | | |
Investor C – Based on net assets of $347,307,245 and 14,720,654 shares outstanding, 200 million shares authorized, $0.10 par value | | $ | 23.59 | |
| | | | |
Class R – Based on net assets of $16,724,685 and 683,687 shares outstanding, 400 million shares authorized, $0.10 par value | | $ | 24.46 | |
| | | | |
| | | | | | |
| See Notes to Financial Statements. | | |
| | | | | | | |
| | BLACKROCK BASIC VALUE FUND, INC. | | DECEMBER 31, 2012 | | 7 |
| | |
| | |
Statement of Operations | | BlackRock Basic Value Fund, Inc. |
| | | | |
Six Months Ended December 31, 2012 (Unaudited) | | | | |
Investment Income | | | | |
Net investment income allocated from the Master LLC: | | | | |
Dividends – unaffiliated | | $ | 52,570,593 | |
Foreign taxes withheld | | | (174,756 | ) |
Securities lending – affiliated – net | | | 35,903 | |
Dividends – affiliated | | | 37,134 | |
Expenses | | | (8,560,159 | ) |
Fees waived | | | 16,877 | |
| | | | |
Total income | | | 43,925,592 | |
| | | | |
| | | | |
Fund Expenses | | | | |
Service – Investor A | | | 1,859,040 | |
Service and distribution – Investor B | | | 181,226 | |
Service and distribution – Investor C | | | 1,828,799 | |
Service and distribution – Class R | | | 46,537 | |
Transfer agent – Institutional | | | 1,101,963 | |
Transfer agent – Investor A | | | 1,135,467 | |
Transfer agent – Investor B | | | 100,516 | |
Transfer agent – Investor C | | | 392,441 | |
Transfer agent – Class R | | | 26,981 | |
Registration | | | 47,168 | |
Printing | | | 46,587 | |
Professional | | | 41,402 | |
Officer | | | 1,749 | |
Miscellaneous | | | 11,547 | |
| | | | |
Total expenses | | | 6,821,423 | |
| | | | |
Less transfer agent fees waived and/or reimbursed – Class R | | | (2,281 | ) |
| | | | |
Total expenses after fees waived and/or reimbursed | | | 6,819,142 | |
| | | | |
Net investment income | | | 37,106,450 | |
| | | | |
| | | | |
Realized and Unrealized Gain Allocated from the Master LLC | | | | |
Net realized gain from investments | | | 130,589,788 | |
Net change in unrealized appreciation/depreciation on investments | | | 144,467,294 | |
| | | | |
Total realized and unrealized gain | | | 275,057,082 | |
| | | | |
Net Increase in Net Assets Resulting from Operations | | $ | 312,163,532 | |
| | | | |
| | | | | | |
| See Notes to Financial Statements. | | | | |
| | | | | | | |
| 8 | | BLACKROCK BASIC VALUE FUND, INC. | | DECEMBER 31, 2012 | | |
| | |
| | |
Statements of Changes in Net Assets | | BlackRock Basic Value Fund, Inc. |
| | | | | | | | |
| | | Six Months Ended | | | | |
| | | December 31, | | | Year Ended | |
| | | 2012 | | | June 30, | |
| Decrease in Net Assets: | | (Unaudited) | | | 2012 | |
| Operations | | | | | | | | |
Net investment income | | $ | 37,106,450 | | | $ | 70,113,290 | |
Net realized gain | | | 130,589,788 | | | | 242,073,243 | |
Net change in unrealized appreciation/depreciation | | | 144,467,294 | | | | (400,107,926 | ) |
| | | | |
Net increase (decrease) in net assets resulting from operations | | | 312,163,532 | | | | (87,921,393 | ) |
| | | | |
| | | | | | | | |
| Dividends to Shareholders From1 | | | | | | | | |
Net investment income: | | | | | | | | |
Institutional | | | (39,499,826 | ) | | | (44,756,218 | ) |
Investor A | | | (26,343,056 | ) | | | (23,578,643 | ) |
Investor B | | | (111,020 | ) | | | (184,732 | ) |
Investor C | | | (3,808,938 | ) | | | (3,196,739 | ) |
Class R | | | (237,160 | ) | | | (283,702 | ) |
Net realized gain: | | | | | | | | |
Institutional | | | (121,781,637 | ) | | | (21,277,704 | ) |
Investor A | | | (93,798,916 | ) | | | (13,463,688 | ) |
Investor B | | | (2,100,540 | ) | | | (541,462 | ) |
Investor C | | | (24,212,926 | ) | | | (3,852,392 | ) |
Class R | | | (1,148,060 | ) | | | (210,225 | ) |
| | | | |
Decrease in net assets resulting from dividends and distributions to shareholders | | | (313,042,079 | ) | | | (111,345,505 | ) |
| | | | |
| | | | | | | | |
| Capital Share Transactions | | | | | | | | |
Net decrease in net assets derived from capital share transactions | | | (172,217,584 | ) | | | (638,737,698 | ) |
| | | | |
| | | | | | | | |
| Net Assets | | | | | | | | |
Total decrease in net assets | | | (173,096,131 | ) | | | (838,004,596 | ) |
Beginning of period | | | 3,931,723,173 | | | | 4,769,727,769 | |
| | | | |
End of period | | $ | 3,758,627,042 | | | $ | 3,931,723,173 | |
| | | | |
Undistributed (distributions in excess of) net investment income | | $ | (3,547,717 | ) | | $ | 29,345,833 | |
| | | | |
1 Dividends and distributions are determined in accordance with federal income tax regulations.
| | | | | | |
| See Notes to Financial Statements. | | |
| | | | | | | |
| | BLACKROCK BASIC VALUE FUND, INC. | | DECEMBER 31, 2012 | | 9 |
| | |
| | |
Financial Highlights | | BlackRock Basic Value Fund, Inc. |
| | | | | | | | | | | | | | | | | | | | | | | | |
| | | Institutional | |
| | | Six Months | | | | | | | | | | | | | | | | |
| | | Ended | | | | | | | | | | | | | | | | |
| | | December 31, | | | Year Ended June 30, | |
| | | 2012 | | | | | | | | | | | | | | | | |
| | | (Unaudited) | | | 2012 | | | 2011 | | | 2010 | | | 2009 | | | 2008 | |
Per Share Operating Performance | | | | | | | | | | | | | | | | | | | | | | | | |
Net asset value, beginning of period | | $ | 25.64 | | | $ | 26.94 | | | $ | 21.27 | | | $ | 18.99 | | | $ | 26.12 | | | $ | 33.96 | |
| | | | |
Net investment income1 | | | 0.28 | | | | 0.48 | | | | 0.40 | | | | 0.43 | | | | 0.50 | | | | 0.54 | |
Net realized and unrealized gain (loss) | | | 1.81 | | | | (1.07 | ) | | | 5.68 | | | | 2.31 | | | | (6.60 | ) | | | (6.28 | ) |
| | | | |
Net increase (decrease) from investment operations | | | 2.09 | | | | (0.59 | ) | | | 6.08 | | | | 2.74 | | | | (6.10 | ) | | | (5.74 | ) |
| | | | |
Dividends and distributions from:2 | | | | | | | | | | | | | | | | | | | | | | | | |
Net investment income | | | (0.56 | ) | | | (0.48 | ) | | | (0.41 | ) | | | (0.46 | ) | | | (0.57 | ) | | | (0.28 | ) |
Net realized gain | | | (1.74 | ) | | | (0.23 | ) | | | – | | | | – | | | | (0.46 | ) | | | (1.82 | ) |
| | | | |
Total dividends and distributions | | | (2.30 | ) | | | (0.71 | ) | | | (0.41 | ) | | | (0.46 | ) | | | (1.03 | ) | | | (2.10 | ) |
| | | | |
Net asset value, end of period | | $ | 25.43 | | | $ | 25.64 | | | $ | 26.94 | | | $ | 21.27 | | | $ | 18.99 | | | $ | 26.12 | |
| | | | |
| | | | | | | | | | | | | | | | | | | | | | | | |
Total Investment Return3 | | | | | | | | | | | | | | | | | | | | | | | | |
Based on net asset value | | | 8.27%4 | | | | (2.05)% | | | | 28.76% | | | | 14.28% | | | | (23.67)% | | | | (17.84)% | |
| | | | |
| | | | | | | | | | | | | | | | | | | | | | | | |
Ratios to Average Net Assets5 | | | | | | | | | | | | | | | | | | | | | | | | |
Total expenses | | | 0.55% | 6,7 | | | 0.56% | 6 | | | 0.55% | 6 | | | 0.55% | | | | 0.58% | | | | 0.53% | |
| | | | |
Total expenses after fees waived and/or reimbursed | | | 0.55% | 6,7 | | | 0.56% | 6 | | | 0.55% | 6 | | | 0.55% | | | | 0.58% | | | | 0.53% | |
| | | | |
Net investment income | | | 2.11% | 6,7 | | | 1.88% | 6 | | | 1.57% | 6 | | | 1.93% | | | | 2.54% | | | | 1.76% | |
| | | | |
| | | | | | | | | | | | | | | | | | | | | | | | |
Supplemental Data | | | | | | | | | | | | | | | | | | | | | | | | |
Net assets, end of period (000) | | $ | 1,915,111 | | | $ | 2,066,925 | | | $ | 2,552,926 | | | $ | 1,956,794 | | | $ | 1,747,444 | | | $ | 2,721,795 | |
| | | | |
Portfolio turnover of the Master LLC | | | 24% | | | | 38% | | | | 64% | | | | 48% | | | | 38% | | | | 45% | |
| | | | |
| | 1 | Based on average shares outstanding. |
| | 2 | Dividends and distributions are determined in accordance with federal income tax regulations. |
| | 3 | Where applicable, total investment returns exclude the effects of any sales charges and include the reinvestment of dividends and distributions. |
| | 4 | Aggregate total investment return. |
| | 5 | Includes the Fund’s share of the Master LLC’s allocated net expenses and/or net investment income. |
| | 6 | Includes the Fund’s share of the Master LLC’s allocated fees waived of less than 0.01%. |
| | | | | | |
| See Notes to Financial Statements. | | |
| | | | | | | |
| 10 | | BLACKROCK BASIC VALUE FUND, INC. | | DECEMBER 31, 2012 | | |
| | |
| | |
Financial Highlights (continued) | | BlackRock Basic Value Fund, Inc. |
| | | | | | | | | | | | | | | | | | | | | | | | |
| | | Investor A | |
| | | Six Months | | | | | | | | | | | | | | | | |
| | | Ended | | | | | | | | | | | | | | | | |
| | | December 31, | | | Year Ended June 30, | |
| | | 2012 | | | | | | | | | | | | | | | | |
| | | (Unaudited} | | | 2012 | | | 2011 | | | 2010 | | | 2009 | | | 2008 | |
Per Share Operating Performance | | | | | | | | | | | | | | | | | | | | | | | | |
Net asset value, beginning of period | | $ | 25.45 | | | $ | 26.75 | | | $ | 21.12 | | | $ | 18.86 | | | $ | 25.94 | | | $ | 33.78 | |
| | | | |
Net investment income1 | | | 0.24 | | | | 0.40 | | | | 0.32 | | | | 0.36 | | | | 0.44 | | | | 0.45 | |
Net realized and unrealized gain (loss) | | | 1.81 | | | | (1.07 | ) | | | 5.64 | | | | 2.30 | | | | (6.56 | ) | | | (6.24 | ) |
| | | | |
Net increase (decrease) from investment operations | | | 2.05 | | | | (0.67 | ) | | | 5.96 | | | | 2.66 | | | | (6.12 | ) | | | (5.79 | ) |
| | | | |
Dividends and distributions from:2 | | | | | | | | | | | | | | | | | | | | | | | | |
Net investment income | | | (0.49 | ) | | | (0.40 | ) | | | (0.33 | ) | | | (0.40 | ) | | | (0.50 | ) | | | (0.23 | ) |
Net realized gain | | | (1.74 | ) | | | (0.23 | ) | | | – | | | | – | | | | (0.46 | ) | | | (1.82 | ) |
| | | | |
Total dividends and distributions | | | (2.23 | ) | | | (0.63 | ) | | | (0.33 | ) | | | (0.40 | ) | | | (0.96 | ) | | | (2.05 | ) |
| | | | |
Net asset value, end of period | | $ | 25.27 | | | $ | 25.45 | | | $ | 26.75 | | | $ | 21.12 | | | $ | 18.86 | | | $ | 25.94 | |
| | | | |
| | | | | | | | | | | | | | | | | | | | | | | | |
Total Investment Return3 | | | | | | | | | | | | | | | | | | | | | | | | |
Based on net asset value | | | 8.15% | 4 | | | (2.39 | )% | | | 28.36% | | | | 13.97% | | | | (23.93)% | | | | (18.08)% | |
| | | | |
| | | | | | | | | | | | | | | | | | | | | | | | |
Ratios to Average Net Assets5 | | | | | | | | | | | | | | | | | | | | | | | | |
Total expenses | | | 0.85% | 6,7 | | | 0.86% | 6 | | | 0.84% | 6 | | | 0.86% | | | | 0.89% | | | | 0.82% | |
| | | | |
Total expenses after fees waived and/or reimbursed | | | 0.84% | 6,7 | | | 0.86% | 6 | | | 0.84% | 6 | | | 0.86% | | | | 0.89% | | | | 0.82% | |
| | | | |
Net investment income | | | 1.83% | 6,7 | | | 1.59% | 6 | | | 1.28% | 6 | | | 1.62% | | | | 2.24% | | | | 1.48% | |
| | | | |
| | | | | | | | | | | | | | | | | | | | | | | | |
Supplemental Data | | | | | | | | | | | | | | | | | | | | | | | | |
Net assets, end of period (000) | | $ | 1,449,130 | | | $ | 1,439,411 | | | $ | 1,652,159 | | | $ | 1,461,423 | | | $ | 1,388,725 | | | $ | 2,026,095 | |
| | | | |
Portfolio turnover of the Master LLC | | | 24% | | | | 38% | | | | 64% | | | | 48% | | | | 38% | | | | 45% | |
| | | | |
| | 1 | Based on average shares outstanding. |
| | 2 | Dividends and distributions are determined in accordance with federal income tax regulations. |
| | 3 | Where applicable, total investment returns exclude the effects of any sales charges and include the reinvestment of dividends and distributions. |
| | 4 | Aggregate total investment return. |
| | 5 | Includes the Fund’s share of the Master LLC’s allocated net expenses and/or net investment income. |
| | 6 | Includes the Fund’s share of the Master LLC’s allocated fees waived of less than 0.01%. |
| | | | | | |
| See Notes to Financial Statements. | | |
| | | | | | | |
| | BLACKROCK BASIC VALUE FUND, INC. | | DECEMBER 31, 2012 | | 11 |
| | |
| | |
Financial Highlights (continued) | | BlackRock Basic Value Fund, Inc. |
| | | | | | | | | | | | | | | | | | | | | | | | |
| | | Investor B | |
| | | Six Months | | | | | | | | | | | | | | | | |
| | | Ended | | | | | | | | | | | | | | | | |
| | | December 31, | | | Year Ended June 30, | |
| | | 2012 | | | | | | | | | | | | | | | | |
| | | (Unaudited} | | | 2012 | | | 2011 | | | 2010 | | | 2009 | | | 2008 | |
Per Share Operating Performance | | | | | | | | | | | | | | | | | | | | | | | | |
Net asset value, beginning of period | | $ | 25.08 | | | $ | 26.27 | | | $ | 20.69 | | | $ | 18.45 | | | $ | 25.30 | | | $ | 33.10 | |
| | | | |
Net investment income1 | | | 0.09 | | | | 0.14 | | | | 0.08 | | | | 0.16 | | | | 0.26 | | | | 0.19 | |
Net realized and unrealized gain (loss) | | | 1.77 | | | | (1.02 | ) | | | 5.53 | | | | 2.23 | | | | (6.41 | ) | | | (6.10 | ) |
| | | | |
Net increase (decrease) from investment operations | | | 1.86 | | | | (0.88 | ) | | | 5.61 | | | | 2.39 | | | | (6.15 | ) | | | (5.91 | ) |
| | | | |
Dividends and distributions from:2 | | | | | | | | | | | | | | | | | | | | | | | | |
Net investment income | | | (0.09 | ) | | | (0.08 | ) | | | (0.03 | ) | | | (0.15 | ) | | | (0.24 | ) | | | (0.07 | ) |
Net realized gain | | | (1.74 | ) | | | (0.23 | ) | | | — | | | | — | | | | (0.46 | ) | | | (1.82 | ) |
| | | | |
Total dividends and distributions | | | (1.83 | ) | | | (0.31 | ) | | | (0.03 | ) | | | (0.15 | ) | | | (0.70 | ) | | | (1.89 | ) |
| | | | |
Net asset value, end of period | | $ | 25.11 | | | $ | 25.08 | | | $ | 26.27 | | | $ | 20.69 | | | $ | 18.45 | | | $ | 25.30 | |
| | | | |
| | | | | | | | | | | | | | | | | | | | | | | | |
Total Investment Return3 | | | | | | | | | | | | | | | | | | | | | | | | |
Based on net asset value | | | 7.50% | 4 | | | (3.31)% | | | | 27.15% | | | | 12.88% | | | | (24.60)% | | | | (18.76)% | |
| | | | |
| | | | | | | | | | | | | | | | | | | | | | | | |
Ratios to Average Net Assets5 | | | | | | | | | | | | | | | | | | | | | | | | |
Total expenses | | | 2.00% | 6,7 | | | 1.87% | 6 | | | 1.81% | 6 | | | 1.79% | | | | 1.79% | | | | 1.66% | |
| | | | |
Total expenses after fees waived and/or reimbursed | | | 2.00% | 6,7 | | | 1.86% | 6 | | | 1.81% | 6 | | | 1.79% | | | | 1.79% | | | | 1.66% | |
| | | | |
Net investment income | | | 0.65% | 6,7 | | | 0.58% | 6 | | | 0.32% | 6 | | | 0.73% | | | | 1.34% | | | | 0.62% | |
| | | | |
| | | | | | | | | | | | | | | | | | | | | | | | |
Supplemental Data | | | | | | | | | | | | | | | | | | | | | | | | |
Net assets, end of period (000) | | $ | 30,354 | | | $ | 41,283 | | | $ | 75,481 | | | $ | 101,508 | | | $ | 168,115 | | | $ | 389,812 | |
| | | | |
Portfolio turnover of the Master LLC | | | 24% | | | | 38% | | | | 64% | | | | 48% | | | | 38% | | | | 45% | |
| | | | |
| | 1 | Based on average shares outstanding. |
| | 2 | Dividends and distributions are determined in accordance with federal income tax regulations. |
| | 3 | Where applicable, total investment returns exclude the effects of any sales charges and include the reinvestment of dividends and distributions. |
| | 4 | Aggregate total investment return. |
| | 5 | Includes the Fund’s share of the Master LLC’s allocated net expenses and/or net investment income. |
| | 6 | Includes the Fund’s share of the Master LLC’s allocated fees waived of less than 0.01%. |
| | | | | | |
| See Notes to Financial Statements. | | |
| | | | | | | |
| 12 | | BLACKROCK BASIC VALUE FUND, INC. | | DECEMBER 31, 2012 | | |
| | |
| | |
Financial Highlights (continued) | | BlackRock Basic Value Fund, Inc. |
| | | | | | | | | | | | | | | | | | | | | | | | |
| | | Investor C | |
| | | Six Months | | | | | | | | | | | | | | | | |
| | | Ended | | | | | | | | | | | | | | | | |
| | | December 31, | | | Year Ended June 30, | |
| | | 2012 | | | | | | | | | | | | | | | | |
| | | (Unaudited} | | | 2012 | | | 2011 | | | 2010 | | | 2009 | | | 2008 | |
Per Share Operating Performance | | | | | | | | | | | | | | | | | | | | | | | | |
Net asset value, beginning of period | | $ | 23.80 | | | $ | 25.03 | | | $ | 19.78 | | | $ | 17.70 | | | $ | 24.37 | | | $ | 31.97 | |
| | | | |
Net investment income1 | | | 0.13 | | | | 0.18 | | | | 0.11 | | | | 0.17 | | | | 0.26 | | | | 0.19 | |
Net realized and unrealized gain (loss) | | | 1.67 | | | | (0.99 | ) | | | 5.29 | | | | 2.15 | | | | (6.17 | ) | | | (5.87 | ) |
| | | | |
Net increase (decrease) from investment operations | | | 1.80 | | | | (0.81 | ) | | | 5.40 | | | | 2.32 | | | | (5.91 | ) | | | (5.68 | ) |
| | | | |
Dividends and distributions from:2 | | | | | | | | | | | | | | | | | | | | | | | | |
Net investment income | | | (0.27 | ) | | | (0.19 | ) | | | (0.15 | ) | | | (0.24 | ) | | | (0.30 | ) | | | (0.10 | ) |
Net realized gain | | | (1.74 | ) | | | (0.23 | ) | | | – | | | | – | | | | (0.46 | ) | | | (1.82 | ) |
| | | | |
Total dividends and distributions | | | (2.01 | ) | | | (0.42 | ) | | | (0.15 | ) | | | (0.24 | ) | | | (0.76 | ) | | | (1.92 | ) |
| | | | |
Net asset value, end of period | | $ | 23.59 | | | $ | 23.80 | | | $ | 25.03 | | | $ | 19.78 | | | $ | 17.70 | | | $ | 24.37 | |
| | | | |
| | | | | | | | | | | | | | | | | | | | | | | | |
Total Investment Return3 | | | | | | | | | | | | | | | | | | | | | | | | |
Based on net asset value | | | 7.67% | 4 | | | (3.16)% | | | | 27.36% | | | | 13.01% | | | | (24.57)% | | | | (18.71)% | |
| | | | |
| | | | | | | | | | | | | | | | | | | | | | | | |
Ratios to Average Net Assets5 | | | | | | | | | | | | | | | | | | | | | | | | |
Total expenses | | | 1.66% | 6,7 | | | 1.67% | 6 | | | 1.66% | 6 | | | 1.68% | | | | 1.72% | | | | 1.62% | |
| | | | |
Total expenses after fees waived and/or reimbursed | | | 1.66% | 6,7 | | | 1.67% | 6 | | | 1.66% | 6 | | | 1.68% | | | | 1.72% | | | | 1.62% | |
| | | | |
Net investment income | | | 1.01% | 6,7 | | | 0.77% | 6 | | | 0.46% | 6 | | | 0.80% | | | | 1.40% | | | | 0.68% | |
| | | | |
| | | | | | | | | | | | | | | | | | | | | | | | |
Supplemental Data | | | | | | | | | | | | | | | | | | | | | | | | |
Net assets, end of period (000) | | $ | 347,307 | | | $ | 365,319 | | | $ | 465,007 | | | $ | 413,806 | | | $ | 413,576 | | | $ | 675,654 | |
| | | | |
Portfolio turnover of the Master LLC | | | 24% | | | | 38% | | | | 64% | | | | 48% | | | | 38% | | | | 45% | |
| | | | |
| | 1 | Based on average shares outstanding. |
| | 2 | Dividends and distributions are determined in accordance with federal income tax regulations. |
| | 3 | Where applicable, total investment returns exclude the effects of any sales charges and include the reinvestment of dividends and distributions. |
| | 4 | Aggregate total investment return. |
| | 5 | Includes the Fund’s share of the Master LLC’s allocated net expenses and/or net investment income. |
| | 6 | Includes the Fund’s share of the Master LLC’s allocated fees waived of less than 0.01%. |
| | | | | | |
| See Notes to Financial Statements. | | |
| | | | | | | |
| | BLACKROCK BASIC VALUE FUND, INC. | | DECEMBER 31, 2012 | | 13 |
| | |
| | |
Financial Highlights (concluded) | | BlackRock Basic Value Fund, Inc. |
| | | | | | | | | | | | | | | | | | | | | | | | |
| | | Class R | |
| | | Six Months | | | | |
| | | Ended | | | Year Ended June 30, | |
| | | December 31, | | | | | | | | | | | | | | | | |
| | | 2012 | | | | | | | | | | | | | | | | |
| | | (Unaudited) | | | 2012 | | | 2011 | | | 2010 | | | 2009 | | | 2008 | |
Per Share Operating Performance | | | | | | | | | | | | | | | | | | | | | | | | |
Net asset value, beginning of period | | $ | 24.63 | | | $ | 25.90 | | | $ | 20.48 | | | $ | 18.31 | | | $ | 25.19 | | | $ | 32.92 | |
| | | | |
Net investment income1 | | | 0.19 | | | | 0.30 | | | | 0.23 | | | | 0.27 | | | | 0.35 | | | | 0.33 | |
Net realized and unrealized gain (loss) | | | 1.74 | | | | (1.03 | ) | | | 5.46 | | | | 2.23 | | | | (6.37 | ) | | | (6.06 | ) |
| | | | |
Net increase (decrease) from investment operations | | | 1.93 | | | | (0.73 | ) | | | 5.69 | | | | 2.50 | | | | (6.02 | ) | | | (5.73 | ) |
| | | | |
Dividends and distributions from:2 | | | | | | | | | | | | | | | | | | | | | | | | |
Net investment income | | | (0.36 | ) | | | (0.31 | ) | | | (0.27 | ) | | | (0.33 | ) | | | (0.40 | ) | | | (0.18 | ) |
Net realized gain | | | (1.74 | ) | | | (0.23 | ) | | | – | | | | – | | | | (0.46 | ) | | | (1.82 | ) |
| | | | |
Total dividends and distributions | | | (2.10 | ) | | | (0.54 | ) | | | (0.27 | ) | | | (0.33 | ) | | | (0.86 | ) | | | (2.00 | ) |
| | | | |
Net asset value, end of period | | $ | 24.46 | | | $ | 24.63 | | | $ | 25.90 | | | $ | 20.48 | | | $ | 18.31 | | | $ | 25.19 | |
| | | | |
| | | | | | | | | | | | | | | | | | | | | | | | |
Total Investment Return3 | | | | | | | | | | | | | | | | | | | | | | | | |
Based on net asset value | | | 7.93% | 4 | | | (2.73)% | | | | 27.89% | | | | 13.51% | | | | (24.21)% | | | | (18.37)% | |
| | | | |
| | | | | | | | | | | | | | | | | | | | | | | | |
Ratios to Average Net Assets5 | | | | | | | | | | | | | | | | | | | | | | | | |
Total expenses | | | 1.23% | 6,7 | | | 1.22% | 6 | | | 1.23% | 6 | | | 1.22% | | | | 1.29% | | | | 1.18% | |
| | | | |
Total expenses after fees waived and/or reimbursed | | | 1.21% | 6,7 | | | 1.20% | 6 | | | 1.23% | 6 | | | 1.22% | | | | 1.29% | | | | 1.18% | |
| | | | |
Net investment income | | | 1.44% | 6,7 | | | 1.23% | 6 | | | 0.93% | 6 | | | 1.27% | | | | 1.83% | | | | 1.12% | |
| | | | |
| | | | | | | | | | | | | | | | | | | | | | | | |
Supplemental Data | | | | | | | | | | | | | | | | | | | | | | | | |
Net assets, end of period (000) | | $ | 16,725 | | | $ | 18,785 | | | $ | 24,155 | | | $ | 19,858 | | | $ | 18,918 | | | $ | 27,849 | |
| | | | |
Portfolio turnover of the Master LLC | | | 24% | | | | 38% | | | | 64% | | | | 48% | | | | 38% | | | | 45% | |
| | | | |
| | 1 | Based on average shares outstanding. |
| | 2 | Dividends and distributions are determined in accordance with federal income tax regulations. |
| | 3 | Where applicable, total investment returns include the reinvestment of dividends and distributions. |
| | 4 | Aggregate total investment return. |
| | 5 | Includes the Fund’s share of the Master LLC’s allocated net expenses and/or net investment income. |
| | 6 | Includes the Fund’s share of the Master LLC’s allocated fees waived of less than 0.01%. |
| | | | | | |
| See Notes to Financial Statements. | | |
| | | | | | | |
| 14 | | BLACKROCK BASIC VALUE FUND, INC. | | DECEMBER 31, 2012 | | |
| | |
| | |
Notes to Financial Statements (Unaudited) | | BlackRock Basic Value Fund, Inc. |
1. Organization and Significant Accounting Policies:
BlackRock Basic Value Fund, Inc. (the “Fund”) is registered under the Investment Company Act of 1940, as amended (the “1940 Act”), as a diversified, open-end management investment company. The Fund is organized as a Maryland corporation. The Fund seeks to achieve its investment objective by investing all of its assets in Master Basic Value LLC (the “Master LLC”), which has the same investment objective and strategies as the Fund. The value of the Fund’s investment in the Master LLC reflects the Fund’s proportionate interest in the net assets of the Master LLC. The performance of the Fund is directly affected by the performance of the Master LLC. The percentage of the Master LLC owned by the Fund at December 31, 2012 was 99.5%. The financial statements of the Master LLC, including the Schedule of Investments, are included elsewhere in this report and should be read in conjunction with the Fund’s financial statements. The Fund’s financial statements are prepared in conformity with accounting principles generally accepted in the United States of America (“US GAAP”), which may require management to make estimates and assumptions that affect the reported amounts of assets and liabilities in the financial statements and the reported amounts of increases and decreases in net assets from operations during the reporting period. Actual results could differ from those estimates. The Fund offers multiple classes of shares. Institutional Shares are sold without a sales charge and only to certain eligible investors. Investor A Shares are generally sold with a front-end sales charge. Investor B and Investor C Shares may be subject to a CDSC. Class R Shares are sold without a sales charge and only to certain retirement and other similar plans. All classes of shares have identical voting, dividend, liquidation and other rights and the same terms and conditions, except that Investor A, Investor B, Investor C and Class R Shares bear certain expenses related to the shareholder servicing of such shares, and Investor B, Investor C and Class R Shares also bear certain expenses related to the distribution of such shares. Investor B Shares automatically convert to Investor A Shares after approximately eight years. Investor B Shares are only available through exchanges and dividend reinvestments by existing shareholders and for purchase by certain qualified employee benefit plans. Each class has exclusive voting rights with respect to matters relating to its shareholder servicing and distribution expenditures (except that Investor B shareholders may vote on material changes to the Investor A distribution and service plan).
Reorganization: The Board of Directors (the “Board”) of the Fund and the Board of Directors and shareholders of BlackRock Focus Value Fund, Inc. (“Focus Value”) approved the reorganization of Focus Value into the Fund pursuant to which the Fund acquired substantially all of the assets and assumed certain stated liabilities of Focus Value in exchange for an equal aggregate value of the Fund’s shares.
Each shareholder of Focus Value received shares of the Fund with the same class designation and an amount equal to the aggregate NAV of such shareholder’s Focus Value shares, as determined at the close of business on September 9, 2011.
On September 12, 2011, all of the portfolio securities previously held by Focus Value were subsequently contributed by the Fund to the Master LLC in exchange for an investment in the Master LLC.
The reorganization was accomplished by a tax-free exchange of shares of the Fund in the following amounts and at the following conversion ratios:
| | | | | | | | | | | | |
| | | Focus Value
Shares Prior to
Reorganization | | | Conversion
Ratio | | | Shares of
the Fund | |
Institutional | | | 5,618,400 | | | | 0.42495008 | | | | 2,387,540 | |
Investor A | | | 5,701,161 | | | | 0.42393549 | | | | 2,416,924 | |
Investor B | | | 137,632 | | | | 0.38962308 | | | | 53,625 | |
Investor C | | | 1,275,602 | | | | 0.39145529 | | | | 499,341 | |
Class R | | | 99,019 | | | | 0.39815134 | | | | 39,425 | |
Focus Value’s net assets and composition of net assets on September 9, 2011, the date of the reorganization, were as follows:
| | | | | | | | | | |
| Net Assets | | Paid-In Capital | | Accumulated
Net Realized
Loss | | | Net
Unrealized
Appreciation | |
$122,440,102 | | $161,536,656 | | | $(43,595,011) | | | | $4,498,457 | |
For financial reporting purposes, assets received and shares issued by the Fund were recorded at fair value. However, the cost basis of the investments received from Focus Value was carried forward by the Master to align ongoing reporting of the Fund’s realized and unrealized gains and losses with amounts distributable to shareholders for tax purposes.
The net assets of the Fund before the acquisition were $3,951,974,980. The aggregate net assets of the Fund immediately after the acquisition amounted to $4,074,415,082. Focus Value’s fair value and cost of investments prior to the reorganization were $122,671,903 and $118,173,446, respectively.
The purpose of this transaction was to combine two funds managed by BlackRock Advisors, LLC, Focus Value’s manager and the Fund’s administrator (the “Administrator”), with the same or substantially similar (but not identical) investment objectives, investment policies, strategies, risks and restrictions. The reorganization was a tax-free event and was effective on September 12, 2011.
Assuming the acquisition had been completed on July 1, 2011, the beginning of the annual reporting period of the Fund, the pro forma results of operations for the year ended June 30, 2012, are as follows:
| — | | Net investment income: $70,184,616 |
| — | | Net realized and change in unrealized gain/loss on investments: $(186,300,888) |
| — | | Net decrease in net assets resulting from operations: $(116,116,272) |
| | | | | | |
| | | | | | | |
| | BLACKROCK BASIC VALUE FUND, INC. | | DECEMBER 31, 2012 | | 15 |
| | |
| | |
Notes to Financial Statements (continued) | | BlackRock Basic Value Fund, Inc. |
Because the combined investment portfolios have been managed as a single integrated portfolio since the acquisition was completed, it is not practicable to separate the amounts of revenue and earnings of Focus Value that have been included in the Fund’s Statement of Changes in Net Assets since September 12, 2011. Reorganization costs incurred by the Fund in connection with the reorganization were expensed by the Fund.
In connection with the reorganization, the Administrator contractually agreed to waive and/or reimburse fees or expenses, excluding interest expense, dividend expense, acquired fund fees and expenses and certain other fund expenses, which constitute extraordinary expenses not incurred in the ordinary course of the Fund’s business, in order to limit expenses of Class R Shares to 1.22% of Class R Shares average daily net assets. The Administrator has agreed not to reduce or discontinue this contractual waiver or reimbursement prior to November 1, 2013 unless approved by the Board, including a majority of the independent directors.
The following is a summary of significant accounting policies followed by the Fund:
Valuation: US GAAP defines fair value as the price the Fund would receive to sell an asset or pay to transfer a liability in an orderly transaction between market participants at the measurement date. The Fund’s policy is to fair value its financial instruments at market value. The Fund records its investment in the Master LLC at fair value based on the Fund’s proportionate interest in the net assets of the Master LLC. Valuation of securities held by the Master LLC is discussed in Note 1 of the Master LLC’s Notes to Financial Statements, which are included elsewhere in this report.
Investment Transactions and Investment Income: For financial reporting purposes, contributions to and withdrawals from the Master LLC are accounted on a trade date basis. The Fund records daily its proportionate share of the Master LLC’s income, expenses and realized and unrealized gains and losses. Realized and unrealized gains and losses are adjusted for utilizing partnership tax allocation rules. In addition, the Fund accrues its own expenses. Income, expenses and realized and unrealized gains and losses are allocated daily to each class based on its relative net assets.
Dividends and Distributions: Dividends and distributions paid by the Fund are recorded on the ex-dividend dates. The portion of distributions that exceeds the Fund’s current and accumulated earnings and profits, which are measured on a tax basis, will constitute a nontaxable return of capital. Distributions in excess of the Fund’s taxable income and net capital gains, but not in excess of the Fund’s earnings and profits, will be taxable to shareholders as ordinary income and will not constitute a nontaxable return of capital. Capital losses carried forward from years beginning before 2011 do not reduce earnings and profits, even if such carried forward losses offset current year realized gains. The character
and timing of dividends and distributions are determined in accordance with federal income tax regulations, which may differ from US GAAP.
Income Taxes: It is the Fund’s policy to comply with the requirements of the Internal Revenue Code of 1986, as amended, applicable to regulated investment companies and to distribute substantially all of its taxable income to its shareholders. Therefore, no federal income tax provision is required.
The Fund files US federal and various state and local tax returns. No income tax returns are currently under examination. The statute of limitations on the Fund’s US federal tax returns remains open for each of the four years ended June 30, 2012. The statutes of limitations on the Fund’s state and local tax returns may remain open for an additional year depending upon the jurisdiction. Management does not believe there are any uncertain tax positions that require recognition of a tax liability.
Other: Expenses directly related to the Fund or its classes are charged to the Fund or class. Other operating expenses shared by several funds are pro rated among those funds on the basis of relative net assets or other appropriate methods. Expenses directly related to the Fund and other shared expenses pro rated to the Fund are allocated daily to each class based on its relative net assets or other appropriate methods.
2. Administration Agreements and Other Transactions with Affiliates:
The PNC Financial Services Group, Inc. (“PNC”) is the largest stockholder and an affiliate, for 1940 Act purposes, of BlackRock, Inc. (“BlackRock”).
The Fund entered into an Administration Agreement with BlackRock Advisors, LLC (“the Administrator”), an indirect, wholly owned subsidiary of BlackRock, to provide administrative services (other than investment advice and related portfolio activities). Currently the Fund pays the Administrator no fees pursuant to the agreement. The Fund does not pay an investment advisory fee or investment management fee.
The Administrator contractually agreed to waive and/or reimburse fees or expenses, excluding interest expense, dividend expense, acquired fund fees and expenses and certain other fund expenses, which constitute extraordinary expenses not incurred in the ordinary course of the Fund’s business, in order to limit expenses of Class R Shares to 1.22% of Class R Shares average daily net assets. The Administrator has agreed not to reduce or discontinue this contractual waiver or reimbursement prior to November 1, 2013 unless approved by the Board, including a majority of the independent directors. For the six months ended December 31, 2012, the Administrator waived $2,281, which is shown as transfer agent fees waived and/or reimbursed – Class R.
The Fund entered into a Distribution Agreement and Distribution and Service Plan with BlackRock Investments, LLC (“BRIL”), an affiliate of the Administrator. Pursuant to the Distribution and Service Plan and in accordance with Rule 12b-1 under the 1940 Act, the Fund pays BRIL ongoing service and distribution fees. The fees are accrued daily and paid
| | | | | | |
| | | | | | | |
| 16 | | BLACKROCK BASIC VALUE FUND, INC. | | DECEMBER 31, 2012 | | |
| | |
| | |
Notes to Financial Statements (continued) | | BlackRock Basic Value Fund, Inc. |
monthly at annual rates based upon the average daily net assets of the shares of the Fund as follows:
| | | | |
| | | Service
Fee | | Distribution
Fee |
Investor A | | 0.25% | | – |
Investor B | | 0.25% | | 0.75% |
Investor C | | 0.25% | | 0.75% |
Class R | | 0.25% | | 0.25% |
Pursuant to sub-agreements with BRIL, broker-dealers and BRIL provide shareholder servicing and distribution services to the Fund. The ongoing service and/or distribution fee compensates BRIL and each broker-dealer for providing shareholder servicing and/or distribution related services to Investor A, Investor B, Investor C and Class R shareholders.
For the six months ended December 31, 2012, affiliates earned underwriting discounts, direct commissions and dealer concessions on sales of the Fund’s Investor A Shares of $26,917.
For the six months ended December 31, 2012, affiliates received CDSCs as follows:
| | | | |
Investor A | | $ | 1,700 | |
Investor B | | $ | 8,012 | |
Investor C | | $ | 7,785 | |
Pursuant to written agreements, certain financial intermediaries, some of which may be affiliates, provide the Fund with sub-accounting, recordkeeping, sub-transfer agency and other administrative services with respect to sub-accounts they service. For these services, these entities receive an annual fee per shareholder account, which will vary depending on share class and/or net assets. For the six months ended December 31, 2012, the Fund paid the following to affiliates in return for these services, which is included in transfer agent – class specific in the Statement of Operations:
| | | | |
Institutional | | $ | 185,649 | |
Investor A | | $ | 79 | |
The Administrator maintains a call center, which is responsible for providing certain shareholder services to the Fund, such as responding to shareholder inquiries and processing transactions based upon instructions from shareholders with respect to the subscription and redemption of Fund shares. For the six months ended December 31, 2012, the Fund reimbursed the Administrator the following amounts for costs incurred in running the call center, which are included in transfer agent – class specific in the Statement of Operations:
| | | | |
Institutional | | $ | 9,144 | |
Investor A | | $ | 10,782 | |
Investor B | | $ | 699 | |
Investor C | | $ | 3,019 | |
Class R | | $ | 156 | |
Certain officers and/or directors of the Fund are officers and/or directors of BlackRock or its affiliates. The Fund reimburses the Administrator for a portion of the compensation paid to the Fund’s Chief Compliance Officer.
3. Income Tax Information:
As of June 30, 2012, the Fund had a capital loss carryforward, subject to limitation, available to offset future realized capital gains of $23,640,800, all of which is due to expire June 30, 2017.
| | | | | | |
| | | | | | | |
| | BLACKROCK BASIC VALUE FUND, INC. | | DECEMBER 31, 2012 | | 17 |
| | |
| | |
Notes to Financial Statements (concluded) | | BlackRock Basic Value Fund, Inc. |
4. Capital Share Transactions:
Transactions in capital shares for each class were as follows:
| | | | | | | | | | | | | | | | |
| | | Six Months Ended
December 31, 2012 | | | Year Ended
June 30, 2012 | |
| | | Shares | | | Amount | | | Shares | | | Amount | |
Institutional | | | | | | | | | | | | | | | | |
Shares sold | | | 4,930,749 | | | $ | 131,461,743 | | | | 21,796,353 | | | $ | 550,202,743 | |
Shares issued resulting from reorganization | | | – | | | | – | | | | 2,387,540 | | | | 54,759,174 | |
Shares issued in reinvestment of dividends and distributions | | | 5,857,925 | | | | 147,326,300 | | | | 2,478,311 | | | | 60,098,058 | |
Shares redeemed | | | (16,103,415 | ) | | | (435,444,457 | ) | | | (40,799,999 | ) | | | (1,058,403,160 | ) |
| | | | | | | | |
Net decrease | | | (5,314,741 | ) | | $ | (156,656,414 | ) | | | (14,137,795 | ) | | $ | (393,343,185 | ) |
| | | | | | | | |
| | | | | | | | | | | | | | | | |
Investor A | | | | | | | | | | | | | | | | |
Shares sold and automatic conversion of shares | | | 2,965,413 | | | $ | 78,188,708 | | | | 6,830,671 | | | $ | 169,378,542 | |
Shares issued resulting from reorganization | | | – | | | | – | | | | 2,416,924 | | | | 55,001,948 | |
Shares issued in reinvestment of dividends and distributions | | | 4,298,067 | | | | 107,407,079 | | | | 1,366,578 | | | | 32,948,465 | |
Shares redeemed | | | (6,461,420 | ) | | | (170,684,555 | ) | | | (15,833,447 | ) | | | (391,777,378 | ) |
| | | | | | | | |
Net increase (decrease) | | | 802,060 | | | $ | 14,911,232 | | | | (5,219,274 | ) | | $ | (134,448,423 | ) |
| | | | | | | | |
| | | | | | | | | | | | | | | | |
Investor B | | | | | | | | | | | | | | | | |
Shares sold | | | 42,614 | | | $ | 1,108,585 | | | | 146,038 | | | $ | 3,587,851 | |
Shares issued resulting from reorganization | | | – | | | | – | | | | 53,625 | | | | 1,196,214 | |
Shares issued in reinvestment of dividends and distributions | | | 76,373 | | | | 1,897,876 | | | | 25,961 | | | | 619,956 | |
Shares redeemed and automatic conversion of shares | | | (556,067 | ) | | | (14,423,427 | ) | | | (1,452,669 | ) | | | (35,817,961 | ) |
| | | | | | | | |
Net decrease | | | (437,080 | ) | | $ | (11,416,966 | ) | | | (1,227,045 | ) | | $ | (30,413,940 | ) |
| | | | | | | | |
| | | | | | | | | | | | | | | | |
Investor C | | | | | | | | | | | | | | | | |
Shares sold | | | 427,840 | | | $ | 10,514,689 | | | | 1,766,212 | | | $ | 40,906,527 | |
Shares issued resulting from reorganization | | | – | | | | – | | | | 499,341 | | | | 10,614,793 | |
Shares issued in reinvestment of dividends and distributions | | | 1,020,527 | | | | 23,828,536 | | | | 261,740 | | | | 5,928,542 | |
Shares redeemed | | | (2,077,055 | ) | | | (51,317,705 | ) | | | (5,759,013 | ) | | | (133,715,238 | ) |
| | | | | | | | |
Net decrease | | | (628,688 | ) | | $ | (16,974,480 | ) | | | (3,231,720 | ) | | $ | (76,265,376 | ) |
| | | | | | | | |
| | | | | | | | | | | | | | | | |
Class R | | | | | | | | | | | | | | | | |
Shares sold | | | 77,190 | | | $ | 1,968,913 | | | | 266,312 | | | $ | 6,483,991 | |
Shares issued in the reorganization | | | – | | | | – | | | | 39,425 | | | | 867,973 | |
Shares issued in reinvestment of dividends and distributions | | | 57,241 | | | | 1,385,218 | | | | 21,084 | | | | 492,930 | |
Shares redeemed | | | (213,366 | ) | | | (5,435,087 | ) | | | (496,978 | ) | | | (12,111,668 | ) |
| | | | | | | | |
Net decrease | | | (78,935 | ) | | $ | (2,080,956 | ) | | | (170,157 | ) | | $ | (4,266,774 | ) |
Total Net Decrease | | | (5,657,384 | ) | | $ | (172,217,584 | ) | | | (23,985,991 | ) | | $ | (638,737,698 | ) |
| | | | | | | | |
5. Subsequent Events:
Management has evaluated the impact of all subsequent events on the Fund through the date the financial statements were issued and has determined that there were no subsequent events requiring adjustment or additional disclosure in the financial statements.
| | | | | | |
| | | | | | | |
| 18 | | BLACKROCK BASIC VALUE FUND, INC. | | DECEMBER 31, 2012 | | |
| | |
| | |
Master LLC Portfolio Information | | Master Basic Value LLC |
| | | | | |
| Ten Largest Holdings | | Percent of
Long-Term
Investments |
JPMorgan Chase & Co. | | | | 4 | % |
Pfizer, Inc. | | | | 4 | |
Citigroup, Inc. | | | | 4 | |
Wells Fargo & Co. | | | | 3 | |
Merck & Co., Inc. | | | | 3 | |
Exxon Mobil Corp. | | | | 3 | |
General Electric Co. | | | | 3 | |
Johnson & Johnson | | | | 3 | |
Marathon Oil Corp. | | | | 3 | |
Medtronic, Inc. | | | | 3 | |
| | | | | |
| Sector Allocation1 | | Percent of
Long-Term
Investments |
Financials | | | | 28 | % |
Health Care | | | | 18 | |
Energy | | | | 15 | |
Industrials | | | | 10 | |
Consumer Discretionary | | | | 10 | |
Information Technology | | | | 8 | |
Consumer Staples | | | | 6 | |
Utilities | | | | 2 | |
Telecommunication Services | | | | 2 | |
Materials | | | | 1 | |
| | 1 | For Master LLC compliance purposes, the Master LLC’s sector classifications refer to any one or more of the sector sub-classifications used by one or more widely recognized market indexes or ratings group indexes, and/or as defined by Master LLC management. These definitions may not apply for purposes of this report, which may combine sector sub-classifications for reporting ease. |
| | | | | | |
| | | | | | | |
| | BLACKROCK BASIC VALUE FUND, INC. | | DECEMBER 31, 2012 | | 19 |
| | |
| | |
Schedule of Investments December 31,2012 (Unaudited) | | Master Basic Value LLC (Percentages shown are based on Net Assets) |
| | | | | | | | |
| Common Stocks | | Shares | | | Value | |
Aerospace & Defense – 3.2% | |
Honeywell International, Inc. | | | 975,000 | | | $ | 61,883,250 | |
Northrop Grumman Corp. | | | 617,400 | | | | 41,723,892 | |
Raytheon Co. | | | 303,500 | | | | 17,469,460 | |
| | | | | | | | |
| | | | | | | 121,076,602 | |
Airlines – 0.2% | |
Delta Air Lines, Inc. (a) | | | 500,300 | | | | 5,938,561 | |
Auto Components – 0.9% | |
Lear Corp. | | | 554,300 | | | | 25,963,412 | |
TRW Automotive Holdings Corp. (a) | | | 160,800 | | | | 8,620,488 | |
| | | | | | | | |
| | | | | | | 34,583,900 | |
Automobiles – 1.3% | |
Ford Motor Co. | | | 3,200,200 | | | | 41,442,590 | |
General Motors Co. (a) | | | 227,100 | | | | 6,547,293 | |
| | | | | | | | |
| | | | | | | 47,989,883 | |
Capital Markets – 0.4% | |
State Street Corp. | | | 326,200 | | | | 15,334,662 | |
Chemicals – 0.4% | |
E.I. du Pont de Nemours & Co. | | | 353,000 | | | | 15,874,410 | |
Commercial Banks – 5.2% | |
Regions Financial Corp. | | | 2,975,900 | | | | 21,188,408 | |
U.S. Bancorp | | | 1,631,175 | | | | 52,099,729 | |
Wells Fargo & Co. | | | 3,642,500 | | | | 124,500,650 | |
| | | | | | | | |
| | | | | | | 197,788,787 | |
Commercial Services & Supplies – 1.9% | |
The ADT Corp. | | | 695,887 | | | | 32,351,787 | |
Tyco International Ltd. | | | 1,304,775 | | | | 38,164,669 | |
| | | | | | | | |
| | | | | | | 70,516,456 | |
Communications Equipment – 2.4% | |
Cisco Systems, Inc. | | | 4,508,000 | | | | 88,582,200 | |
Construction & Engineering – 0.4% | |
Jacobs Engineering Group, Inc. (a)(b) | | | 384,800 | | | | 16,380,936 | |
Consumer Finance – 0.6% | |
Capital One Financial Corp. | | | 367,100 | | | | 21,266,103 | |
Diversified Financial Services – 8.1% | |
Citigroup, Inc. | | | 3,577,730 | | | | 141,534,999 | |
JPMorgan Chase & Co. | | | 3,406,800 | | | | 149,796,996 | |
The NASDAQ OMX Group, Inc. | | | 631,800 | | | | 15,801,318 | |
| | | | | | | | |
| | | | | | | 307,133,313 | |
Diversified Telecommunication Services – 2.0% | |
AT&T Inc. | | | 844,300 | | | | 28,461,353 | |
Verizon Communications, Inc. | | | 1,113,600 | | | | 48,185,472 | |
| | | | | | | | |
| | | | | | | 76,646,825 | |
Electric Utilities – 1.0% | |
FirstEnergy Corp. | | | 54,600 | | | | 2,280,096 | |
NV Energy, Inc. | | | 498,100 | | | | 9,035,534 | |
| | | | | | | | |
| Common Stocks | | Shares | | | Value | |
Electric Utilities (concluded) | |
PPL Corp. | | | 466,600 | | | $ | 13,358,758 | |
The Southern Co. | | | 283,000 | | | | 12,115,230 | |
| | | | | | | | |
| | | | | | | 36,789,618 | |
Electronic Equipment, Instruments & Components – 1.2% | |
Corning, Inc. | | | 3,665,000 | | | | 46,252,300 | |
Energy Equipment & Services – 2.8% | |
Ensco Plc, Class A | | | 422,133 | | | | 25,024,044 | |
Halliburton Co. | | | 1,096,800 | | | | 38,047,992 | |
Noble Corp. | | | 925,669 | | | | 32,231,795 | |
Transocean Ltd. | | | 270,000 | | | | 12,055,500 | |
| | | | | | | | |
| | | | | | | 107,359,331 | |
Food & Staples Retailing – 1.7% | |
The Kroger Co. | | | 2,162,700 | | | | 56,273,454 | |
Walgreen Co. | | | 203,900 | | | | 7,546,339 | |
| | | | | | | | |
| | | | | | | 63,819,793 | |
Food Products – 1.7% | |
Archer-Daniels-Midland Co. | | | 83,100 | | | | 2,276,109 | |
Unilever NV - NY Regular Shares | | | 1,650,400 | | | | 63,210,320 | |
| | | | | | | | |
| | | | | | | 65,486,429 | |
Gas Utilities – 0.3% | |
UGI Corp. | | | 324,300 | | | | 10,607,853 | |
Health Care Equipment & Supplies – 5.0% | |
Baxter International, Inc. | | | 227,200 | | | | 15,145,152 | |
Medtronic, Inc. | | | 2,359,441 | | | | 96,784,270 | |
St. Jude Medical, Inc. | | | 669,200 | | | | 24,184,888 | |
Stryker Corp. | | | 458,800 | | | | 25,151,416 | |
Zimmer Holdings, Inc. | | | 426,400 | | | | 28,423,824 | |
| | | | | | | | |
| | | | | | | 189,689,550 | |
Health Care Providers & Services – 0.7% | |
Aetna, Inc. | | | 530,700 | | | | 24,571,410 | |
Household Durables – 0.2% | |
Garmin Ltd. | | | 165,600 | | | | 6,759,792 | |
Household Products – 2.7% | |
Energizer Holdings, Inc. | | | 362,640 | | | | 29,003,947 | |
Kimberly-Clark Corp. | | | 529,700 | | | | 44,722,571 | |
The Procter & Gamble Co. | | | 416,600 | | | | 28,282,974 | |
| | | | | | | | |
| | | | | | | 102,009,492 | |
Industrial Conglomerates – 3.1% | |
General Electric Co. | | | 5,598,000 | | | | 117,502,020 | |
Insurance – 12.5% | |
ACE Ltd. | | | 883,300 | | | | 70,487,340 | |
Aflac, Inc. | | | 904,600 | | | | 48,052,352 | |
Hartford Financial Services Group, Inc. | | | 3,723,031 | | | | 83,544,816 | |
Lincoln National Corp. | | | 1,648,240 | | | | 42,689,416 | |
MetLife, Inc. | | | 1,847,247 | | | | 60,848,316 | |
PartnerRe Ltd. (b) | | | 231,400 | | | | 18,625,386 | |
ADR American Depositary Receipts
| | | | | | |
See Notes to Financial Statements. |
| | | | | | | |
| 20 | | BLACKROCK BASIC VALUE FUND, INC. | | DECEMBER 31, 2012 | | |
| | |
| | |
Schedule of Investments (continued) | | Master Basic Value LLC (Percentages shown are based on Net Assets) |
| | | | | | | | |
| Common Stocks | | Shares | | | Value | |
Insurance (concluded) | |
Prudential Financial, Inc. | | | 1,185,400 | | | $ | 63,217,382 | |
The Travelers Cos., Inc. | | | 759,576 | | | | 54,552,748 | |
Willis Group Holdings Plc | | | 386,600 | | | | 12,962,698 | |
XL Group Plc | | | 732,600 | | | | 18,358,956 | |
| | | | | | | | |
| | | | | | | 473,339,410 | |
IT Services – 1.1% | |
The Western Union Co. | | | 3,053,400 | | | | 41,556,774 | |
Leisure Equipment & Products – 0.2% | |
Hasbro, Inc. (b) | | | 200,800 | | | | 7,208,720 | |
Life Sciences Tools & Services – 0.8% | |
Agilent Technologies, Inc. | | | 777,900 | | | | 31,847,226 | |
Machinery – 0.3% | |
Stanley Black & Decker, Inc. | | | 144,000 | | | | 10,651,680 | |
Media – 6.4% | |
CBS Corp., Class B | | | 50,600 | | | | 1,881,622 | |
Comcast Corp., Special Class A | | | 1,752,100 | | | | 62,987,995 | |
The Interpublic Group of Cos., Inc. | | | 1,488,600 | | | | 16,404,372 | |
Omnicom Group, Inc. | | | 170,800 | | | | 8,533,168 | |
Time Warner, Inc. | | | 1,273,766 | | | | 60,924,228 | |
Viacom, Inc., Class B | | | 1,708,100 | | | | 90,085,194 | |
| | | | | | | | |
| | | | | | | 240,816,579 | |
Metals & Mining – 0.3% | |
Nucor Corp. | | | 262,800 | | | | 11,347,704 | |
Multiline Retail – 0.3% | |
Kohl’s Corp. | | | 296,700 | | | | 12,752,166 | |
Multi-Utilities – 1.0% | |
Dominion Resources, Inc. | | | 584,698 | | | | 30,287,356 | |
Public Service Enterprise Group, Inc. | | | 275,200 | | | | 8,421,120 | |
| | | | | | | | |
| | | | | | | 38,708,476 | |
Oil, Gas & Consumable Fuels – 11.7% | |
Apache Corp. | | | 135,500 | | | | 10,636,750 | |
Chevron Corp. | | | 210,300 | | | | 22,741,842 | |
Devon Energy Corp. | | | 364,500 | | | | 18,968,580 | |
Exxon Mobil Corp. | | | 1,380,400 | | | | 119,473,620 | |
Hess Corp. | | | 900,200 | | | | 47,674,592 | |
Marathon Oil Corp. | | | 3,622,022 | | | | 111,051,194 | |
Marathon Petroleum Corp. | | | 146,600 | | | | 9,235,800 | |
Occidental Petroleum Corp. | | | 375,000 | | | | 28,728,750 | |
Peabody Energy Corp. | | | 1,347,216 | | | | 35,849,418 | |
Royal Dutch Shell Plc - ADR | | | 245,700 | | | | 16,941,015 | |
| | | | | | | | |
| Common Stocks | | Shares | | | Value | |
Oil, Gas & Consumable Fuels (concluded) | |
Valero Energy Corp. | | | 577,400 | | | $ | 19,700,888 | |
| | | | | | | | |
| | | | | | | 441,002,449 | |
Pharmaceuticals – 10.8% | |
Eli Lilly & Co. | | | 571,700 | | | | 28,196,244 | |
Johnson & Johnson | | | 1,610,500 | | | | 112,896,050 | |
Merck & Co., Inc. | | | 2,999,916 | | | | 122,816,561 | |
Pfizer, Inc. | | | 5,690,070 | | | | 142,706,956 | |
Warner Chilcott Plc, Class A | | | 127,700 | | | | 1,537,508 | |
| | | | | | | | |
| | | | | | | 408,153,319 | |
Professional Services – 0.3% | |
The Dun & Bradstreet Corp. | | | 57,200 | | | | 4,498,780 | |
Towers Watson & Co., Class A | | | 147,900 | | | | 8,313,459 | |
| | | | | | | | |
| | | | | | | 12,812,239 | |
Semiconductors & Semiconductor Equipment – 0.2% | |
Broadcom Corp., Class A | | | 46,100 | | | | 1,530,981 | |
LSI Corp. (a) | | | 562,766 | | | | 3,984,383 | |
| | | | | | | | |
| | | | | | | 5,515,364 | |
Software – 2.5% | |
Microsoft Corp. | | | 1,982,580 | | | | 52,994,363 | |
Oracle Corp. | | | 1,226,200 | | | | 40,856,984 | |
| | | | | | | | |
| | | | | | | 93,851,347 | |
Total Long-Term Investments (Cost – $2,696,885,708) – 95.8% | | | | 3,619,523,679 | |
| | | | | | | | |
| | | | | | | | |
|
Short-Term Securities | |
BlackRock Liquidity Funds, TempFund, Institutional
Class, 0.11% (c)(d) | | | 127,801,091 | | | | 127,801,091 | |
| | | Beneficial
Interest (000) | | | | |
BlackRock Liquidity Series LLC, Money Market
Series, 0.29% (c)(d)(e) | | $ | 16,209 | | | | 16,209,413 | |
Total Short-Term Securities (Cost – $144,010,504) – 3.8% | | | | 144,010,504 | |
Total Investments (Cost – $2,840,896,212*) – 99.6% | | | | 3,763,534,183 | |
Other Assets Less Liabilities – 0.4% | | | | 15,127,806 | |
| | | | | | | | |
Net Assets – 100.0% | | | | | | $ | 3,778,661,989 | |
| | | | | | | | |
|
Notes to Schedule of Investments |
| * | As of December 31, 2012, gross unrealized appreciation and gross unrealized depreciation based on cost for federal income tax purposes were as follows: |
| | | | |
Tax cost | | $ | 2,924,066,931 | |
| | | | |
Gross unrealized appreciation | | $ | 866,668,556 | |
Gross unrealized depreciation | | | (27,201,304 | ) |
| | | | |
Net unrealized appreciation | | $ | 839,467,252 | |
| | | | |
| (a) | Non-income producing security. |
| (b) | Security, or a portion of security, is on loan. |
| | | | | | |
| See Notes to Financial Statements. | | |
| | | | | | | |
| | BLACKROCK BASIC VALUE FUND, INC. | | DECEMBER 31, 2012 | | 21 |
| | |
| | |
Schedule of Investments (concluded) | | Master Basic Value LLC |
| (c) | Investments in issuers considered to be an affiliate of the Master LLC during the period ended December 31, 2012, for purposes of Section 2(a)(3) of the Investment Company Act of 1940, as amended, were as follows: |
| | | | | | | | | | | | | | | | | | | | |
| Affiliate | | Shares/
Beneficial
Interest Held at June 30, 2012 | | | Net Activity | | | Shares/
Beneficial
Interest Held at
December 31, 2012 | | | Income | | | Realized
Gain | |
BlackRock Liquidity Funds, TempFund, Institutional Class | | | 1,060,695 | | | | 126,740,396 | | | | 127,801,091 | | | $ | 37,281 | | | $ | 1,182 | |
BlackRock Liquidity Series LLC, Money Market Series | | $ | 36,138,350 | | | $ | (19,928,937 | ) | | $ | 16,209,413 | | | $ | 36,138 | | | | – | |
| (d) | Represents the current yield as of report date. |
| (e) | Security was purchased with the cash collateral from loaned securities. The Master LLC may withdraw up to 25% of its investment daily, although the manager of the BlackRock Liquidity Series LLC, Money Market Series, in its sole discretion, may permit an investor to withdraw more than 25% on any one day. |
| — | | For Master LLC compliance purposes, the Master LLC’s industry classifications refer to any one or more of the industry sub-classifications used by one or more widely recognized market indexes or rating group indexes, and/or as defined by Master LLC management. These definitions may not apply for purposes of this report, which may combine such industry sub-classifications for reporting ease. |
| — | | Fair Value Measurements – Various inputs are used in determining the fair value of investments. These inputs to valuation techniques are categorized into a disclosure hierarchy consisting of three broad levels for financial statement purposes as follows: |
| | — | | Level 1 - unadjusted price quotations in active markets/exchanges for identical assets and liabilities that the Master LLC has the ability to access |
| | — | | Level 2 - other observable inputs (including, but not limited to, quoted prices for similar assets or liabilities in markets that are active, quoted prices for identical or similar assets or liabilities in markets that are not active, inputs other than quoted prices that are observable for the assets or liabilities (such as interest rates, yield curves, volatilities, prepayment speeds, loss severities, credit risks and default rates) or other market–corroborated inputs) |
| | — | | Level 3 - unobservable inputs based on the best information available in the circumstances, to the extent observable inputs are not available (including the Master LLC’s own assumptions used in determining the fair value of investments) |
The hierarchy gives the highest priority to unadjusted quoted prices in active markets for identical assets or liabilities (Level 1 measurements) and the lowest priority to unobservable inputs (Level 3 measurements). Accordingly, the degree of judgment exercised in determining fair value is greatest for instruments categorized in Level 3. The inputs used to measure fair value may fall into different levels of the fair value hierarchy. In such cases, for disclosure purposes, the level in the fair value hierarchy within which the fair value measurement falls in its entirety is determined based on the lowest level input that is significant to the fair value measurement in its entirety.
Changes in valuation techniques may result in transfers into or out of an assigned level within the disclosure hierarchy. In accordance with the Master LLC’s policy, transfers between different levels of the fair value disclosure hierarchy are deemed to have occurred as of the beginning of the reporting period. The categorization of a value determined for investments is based on the pricing transparency of the investment and is not necessarily an indication of the risks associated with investing in those securities. For information about the Master LLC’s policy regarding valuation of investments and other significant accounting policies, please refer to Note 1 of the Notes to Financial Statements.
The following table summarizes the Master LLC’s investments categorized in the disclosure hierarchy as of December 31, 2012:
| | | | | | | | | | | | | | |
| | | Level 1 | | | Level 2 | | | Level 3 | | Total | |
Assets: | | | | | | | | | | | | | | |
Investments: | | | | | | | | | | | | | | |
Long Term Investments1 | | $ | 3,619,523,679 | | | | – | | | – | | $ | 3,619,523,679 | |
Short-Term Securities | | | 127,801,091 | | | $ | 16,209,413 | | | – | | | 144,010,504 | |
Total | | $ | 3,747,324,770 | | | $ | 16,209,413 | | | – | | $ | 3,763,534,183 | |
| 1 | See above Schedule of Investments for values in each industry. |
Certain of the Master LLC’s assets and/or liabilities are held at carrying amount, which approximates fair value for financial statement purposes. As of December 31, 2012, such assets and/or liabilities are categorized within the disclosure hierarchy as follows:
| | | | | | | | | | | | | | |
| | | Level 1 | | | Level 2 | | | Level 3 | | Total | |
Assets: | | | | | | | | | | | | | | |
Cash | | $ | 7,108 | | | | – | | | – | | $ | 7,108 | |
Liabilities: | | | | | | | | | | | | | | |
Collateral on securities loaned at value | | | – | | | $ | (16,209,413 | ) | | – | | | (16,209,413 | ) |
Total | | $ | 7,108 | | | $ | (16,209,413 | ) | | – | | $ | (16,202,305 | ) |
There were no transfers between levels during the six months ended December 31, 2012.
| | | | | | |
| See Notes to Financial Statements. | | |
| | | | | | | |
| 22 | | BLACKROCK BASIC VALUE FUND, INC. | | DECEMBER 31, 2012 | | |
| | |
| | |
Statement of Assets and Liabilities | | Master Basic Value LLC |
| | | | |
December 31, 2012 (Unaudited) | | | | |
Assets | | | | |
Investments at value – unaffiliated (including securities loaned of $16,047,296) (cost – $2,696,885,708) | | $ | 3,619,523,679 | |
Investments at value – affiliated (cost – $144,010,504) | | | 144,010,504 | |
Cash | | | 7,108 | |
Contributions receivable from investors | | | 47,827 | |
Investments sold receivable | | | 116,283,242 | |
Dividends receivable – unaffiliated | | | 5,119,287 | |
Dividends receivable – affiliated | | | 12,627 | |
Securities lending income receivable – affiliated | | | 1,492 | |
Prepaid expenses | | | 71,173 | |
| | | | |
Total assets | | | 3,885,076,939 | |
| | | | |
Liabilities | | | | |
Collateral on securities loaned at value | | | 16,209,413 | |
Investments purchased payable | | | 81,960,614 | |
Withdrawals payable to investors | | | 6,623,471 | |
Investment advisory fees payable | | | 1,310,398 | |
Directors’ fees payable | | | 12,063 | |
Other affiliates payable | | | 10,681 | |
Other accrued expenses payable | | | 288,310 | |
| | | | |
Total liabilities | | | 106,414,950 | |
| | | | |
Net Assets | | $ | 3,778,661,989 | |
| | | | |
Net Assets Consist of | | | | |
Investors’ capital | | $ | 2,856,024,018 | |
Net unrealized appreciation/depreciation | | | 922,637,971 | |
| | | | |
Net Assets | | $ | 3,778,661,989 | |
| | | | |
| | | | | | |
| See Notes to Financial Statements. | | |
| | | | | | | |
| | BLACKROCK BASIC VALUE FUND, INC. | | DECEMBER 31, 2012 | | 23 |
| | |
| | |
Statement of Operations | | Master Basic Value LLC |
| | | | |
Six Months Ended December 31, 2012 (Unaudited) | | | | |
Investment Income | | | | |
Dividends – unaffiliated | | $ | 52,860,643 | |
Foreign taxes withheld | | | (175,714 | ) |
Securities lending – affiliated – net | | | 36,138 | |
Dividends – affiliated | | | 37,281 | |
| | | | |
Total income | | | 52,758,348 | |
| | | | |
Expenses | | | | |
Investment advisory | | | 8,072,938 | |
Accounting services | | | 321,745 | |
Custodian | | | 89,399 | |
Printing | | | 2,144 | |
Directors | | | 47,606 | |
Professional | | | 45,961 | |
Miscellaneous | | | 28,996 | |
| | | | |
Total expenses | | | 8,608,789 | |
Less fees waived by Manager | | | (16,944 | ) |
| | | | |
Total expenses after fees waived | | | 8,591,845 | |
| | | | |
Net investment income | | | 44,166,503 | |
| | | | |
Realized and Unrealized Gain | | | | |
Net realized gain from: | | | | |
Investments – unaffiliated | | | 131,280,418 | |
Capital gain distributions received from affiliated investment companies | | | 1,182 | |
| | | | |
| | | 131,281,600 | |
| | | | |
Net change in unrealized appreciation/depreciation on investments | | | 146,258,229 | |
| | | | |
Total realized and unrealized gain | | | 277,539,829 | |
| | | | |
Net Increase in Net Assets Resulting from Operations | | $ | 321,706,332 | |
| | | | |
| | | | | | |
| See Notes to Financial Statements. | | |
| | | | | | | |
| 24 | | BLACKROCK BASIC VALUE FUND, INC. | | DECEMBER 31, 2012 | | |
| | |
| | |
Statements of Changes in Net Assets | | Master Basic Value LLC |
| | | | | | | | |
| | | Six Months | | | | |
| | | Ended | | | Year Ended | |
| | | December 31, 2012 | | | June 30, | |
| Decrease in Net Assets: | | (Unaudited) | | | 2012 | |
Operations | | | | | | | | |
Net investment income | | $ | 44,166,503 | | | $ | 85,470,174 | |
Net realized gain | | | 131,281,600 | | | | 239,962,318 | |
Net change in unrealized appreciation/depreciation | | | 146,258,229 | | | | (400,364,013 | ) |
| | | | |
Net increase (decrease) in net assets resulting from operations | | | 321,706,332 | | | | (74,931,521 | ) |
| | | | |
| | | | | | | | |
Capital Share Transactions | | | | | | | | |
Proceeds from contributions | | | 298,514,128 | | | | 913,262,519 | |
Value of withdrawals | | | (806,970,882 | ) | | | (1,673,540,701 | ) |
| | | | |
Net decrease in net assets derived from capital share transactions | | | (508,456,754 | ) | | | (760,278,182 | ) |
| | | | |
| | | | | | | | |
Net Assets | | | | | | | | |
Total decrease in net assets | | | (186,750,422 | ) | | | (835,209,703 | ) |
Beginning of period | | | 3,965,412,411 | | | | 4,800,622,114 | |
| | | | |
End of period | | $ | 3,778,661,989 | | | $ | 3,965,412,411 | |
| | | | |
Financial Highlights | Master Basic Value LLC |
| | | | | | | | | | | | | | | | | | | | | | | | |
| | | Six Months | | | | | | | | | | | | | | | | |
| | | Ended | | | | | | | | | | | | | | | | |
| | | December 31, | | | | | | | | | | | | | | | | |
| | | 2012 | | | Year Ended June 30, | |
| | | (Unaudited) | | | 2012 | | | 2011 | | | 2010 | | | 2009 | | | 2008 | |
Total Investment Return | | | | | | | | | | | | | | | | | | | | | | | | |
Total investment return | | | 8.33% | 1 | | | (1.95 | )% | | | 28.91% | | | | 14.40% | | | | (23.55)% | | | | (17.73)% | |
| | | | | | | | | | | | | | | | | | | | | | | | |
Ratios to Average Net Assets | | | | | | | | | | | | | | | | | | | | | | | | |
Total expenses | | | 0.43% | 2 | | | 0.44% | | | | 0.43% | | | | 0.43% | | | | 0.44% | | | | 0.43% | |
Total expenses after fees waived | | | 0.43% | 2 | | | 0.44% | | | | 0.43% | | | | 0.43% | | | | 0.44% | | | | 0.43% | |
Net investment income | | | 2.23% | 2 | | | 2.00% | | | | 1.69% | | | | 2.05% | | | | 2.69% | | | | 1.87% | |
| | | | | | | | | | | | | | | | | | | | | | | | |
Supplemental Data | | | | | | | | | | | | | | | | | | | | | | | | |
Net assets, end of period (000) | | $ | 3,778,662 | | | $ | 3,965,412 | | | $ | 4,800,622 | | | $ | 3,966,370 | | | $ | 3,744,860 | | | $ | 5,846,705 | |
Portfolio turnover | | | 24% | | | | 38% | | | | 64% | | | | 48% | | | | 38% | | | | 45% | |
| 1 | Aggregate total investment return |
| | | | | | |
See Notes to Financial Statements. | | |
| | | | | | | |
| | BLACKROCK BASIC VALUE FUND | | DECEMBER 31, 2012 | | 25 |
| | |
| | |
Notes to Financial Statements (Unaudited) | | Master Basic Value LLC |
1. Organization and Significant Accounting Policies:
Master Basic Value LLC (the “Master LLC”) is registered under the Investment Company Act of 1940, as amended (the “1940 Act”), as a diversified, open-end management investment company. The Master LLC is organized as a Delaware limited liability company. The Limited Liability Company Agreement permits the Board of Directors of the Master LLC (the “Board”) to issue non-transferable interests in the Master LLC, subject to certain limitations. The Master LLC’s financial statements are prepared in conformity with accounting principles generally accepted in the United States of America (“US GAAP”), which may require management to make estimates and assumptions that affect the reported amounts of assets and liabilities in the financial statements and the reported amounts of increases and decreases in net assets from operations during the reporting period. Actual results could differ from those estimates.
The following is a summary of significant accounting policies followed by the Master LLC:
Valuation: US GAAP defines fair value as the price the Master LLC would receive to sell an asset or pay to transfer a liability in an orderly transaction between market participants at the measurement date. The Master LLC determines the fair values of its financial instruments at market value using independent dealers or pricing services under policies approved by the Board. The BlackRock Global Valuation Methodologies Committee (the “Global Valuation Committee”) is the committee formed by management to develop global pricing policies and procedures and to provide oversight of the pricing function for the Master LLC for all financial instruments.
Equity investments traded on a recognized securities exchange or the NASDAQ Global Market System (“NASDAQ”) are valued at the last reported sale price that day or the NASDAQ official closing price, if applicable. For equity investments traded on more than one exchange, the last reported sale price on the exchange where the stock is primarily traded is used. Equity investments traded on a recognized exchange for which there were no sales on that day are valued at the last available bid price. If no bid price is available, the prior day’s price will be used, unless it is determined that such prior day’s price no longer reflects the fair value of the security. Investments in open-end registered investment companies are valued at NAV each business day. Short-term securities with remaining maturities of 60 days or less may be valued at amortized cost, which approximates fair value.
The Master LLC values its investments in BlackRock Liquidity Series, LLC Money Market Series (the “Money Market Series”) at fair value, which is ordinarily based upon its pro rata ownership in the underlying fund’s net assets. The Money Market Series seeks current income consistent with maintaining liquidity and preserving capital. Although the Money Market Series is not registered under the 1940 Act, its investments will follow the parameters of investments by a money market fund that is subject to Rule 2a-7 under the 1940 Act. The Master LLC may withdraw up to 25%
of its investment daily, although the manager of the Money Market Series, in its sole discretion, may permit an investor in the Money Market Series to withdraw more than 25% on any one day.
In the event that application of these methods of valuation results in a price for an investment that is deemed not to be representative of the market value of such investment, or if a price is not available, the investment will be valued by the Global Valuation Committee, or its delegate, in accordance with a policy approved by the Board as reflecting fair value (“Fair Value Assets”). When determining the price for Fair Value Assets, the Global Valuation Committee, or its delegate, seeks to determine the price that the Master LLC might reasonably expect to receive from the current sale of that asset in an arm’s-length transaction. Fair value determinations shall be based upon all available factors that the investment advisor and/or sub-advisor deem relevant consistent with the principles of fair value measurement which include the market approach, income approach and/or in the case of recent investments, the cost approach, as appropriate. A market approach generally consists of using comparable market transactions. The income approach generally is used to discount future cash flows to present value and adjusted for liquidity as appropriate. These factors include but are not limited to: (i) attributes specific to the investment or asset; (ii) the principal market for the investment or asset; (iii) the customary participants in the principal market for the investment or asset; (iv) data assumptions by market participants for the investment or asset, if reasonably available; (v) quoted prices for similar investments or assets in active markets; and (vi) other factors, such as future cash flows, interest rates, yield curves, volatilities, prepayment speeds, loss severities, credit risks, recovery rates, liquidation amounts and/or default rates. Due to the inherent uncertainty of valuations of such investments, the fair values may differ from the values that would have been used had an active market existed. The Global Valuation Committee, or its delegate, employs various methods for calibrating valuation approaches for investments where an active market does not exist, including regular due diligence of the Master LLC’s pricing vendors, a regular review of key inputs and assumptions, transactional back-testing or disposition analysis to compare unrealized gains and losses to realized gains and losses, reviews of missing or stale prices and large movements in market values and reviews of any market related activity. The pricing of all Fair Value Assets is subsequently reported to the Board or a committee thereof on a quarterly basis.
Investment Transactions and Investment Income: For financial reporting purposes, investment transactions are recorded on the dates the transactions are entered into (the trade dates). Realized gains and losses on investment transactions are determined on the identified cost basis. Dividend income is recorded on the ex-dividend dates. Dividends from foreign securities where the ex-dividend date may have passed are subsequently recorded when the Master LLC is informed of the ex-dividend date. Under the applicable foreign tax laws, a withholding tax at various rates may be imposed on capital gains, dividends and interest.
| | | | | | |
| | | | | | | |
| 26 | | BLACKROCK BASIC VALUE FUND, INC. | | DECEMBER 31, 2012 | | |
| | |
| | |
Notes to Financial Statements (continued) | | Master Basic Value LLC |
Securities Lending: The Master LLC may lend securities to approved borrowers, such as banks, brokers and other financial institutions. The borrower pledges cash, securities issued or guaranteed by the US government or irrevocable letters of credit issued by a bank as collateral. The initial collateral received by the Master LLC is required to have a value of at least 102% of the current value of the loaned securities for securities traded on U.S. exchanges and a value of at least 105% for all other securities. The collateral is maintained thereafter in an amount equal to at least 100% of the current market value of the loaned securities. The market value of the loaned securities is determined at the close of business of the Master LLC and any additional required collateral is delivered to the Master LLC on the next business day. Securities lending income, as disclosed in the Statement of Operations, represents the income earned from the investment of the cash collateral, net of rebates paid to, or fees paid by, borrowers and less the fees paid to the securities lending agent. During the term of the loan, the Master LLC earns dividend or interest income on the securities loaned but does not receive dividend or interest income on the securities received as collateral. Loans of securities are terminable at any time and the borrower, after notice, is required to return borrowed securities within the standard time period for settlement of securities transactions. The risks of securities lending include the risk that the borrower may not provide additional collateral when required or may not return the securities when due To mitigate this risk the Master LLC benefits from a borrower default indemnity provided by BlackRock, Inc. BlackRock’s indemnity allows for full replacement of securities lent. The Master LLC also could suffer a loss if the value of an investment purchased with cash collateral falls below the market value of loaned securities or if the value of an investment purchased with cash collateral falls below the value of the original cash collateral received. During the six months ended December 31, 2012, any securities on loan were collateralized by cash.
Income Taxes: The Master LLC is classified as a partnership for federal income tax purposes. As such, each investor in the Master LLC is treated as the owner of its proportionate share of the net assets, income, expenses and realized and unrealized gains and losses of the Master LLC. Therefore, no federal income tax provision is required. It is intended that the Master LLC’s assets will be managed so an investor in the Master LLC can satisfy the requirements of Subchapter M of the Internal Revenue Code of 1986, as amended.
The Master LLC files US federal and various state and local tax returns. No income tax returns are currently under examination. The statute of limitations on the Master LLC’s US federal tax returns remains open for each of the four years ended June 30, 2012. The statutes of limitations on the Master LLC’s state and local tax returns may remain open for an additional year depending upon the jurisdiction. Management does not believe there are any uncertain tax positions that require recognition of a tax liability.
Recent Accounting Standards: In December 2011, the Financial Accounting Standards Board (the “FASB”) issued guidance that will expand current disclosure requirements on the offsetting of certain
assets and liabilities. The new disclosures will be required for investments and derivative financial instruments subject to master netting or similar agreements which are eligible for offset in the Statement of Assets and Liabilities and will require an entity to disclose both gross and net information about such investments and transactions in the financial statements. In January 2013, the FASB issued guidance that clarifies which investments and transactions are subject to the offsetting disclosure requirements. The scope of the disclosure requirements for offsetting will be limited to derivative instruments, repurchase agreements and reverse repurchase agreements, and securities borrowing and securities lending transactions. The guidance is effective for financial statements with fiscal years beginning on or after January 1, 2013, and interim periods within those fiscal years. Management is evaluating the impact of this guidance on the Master LLC’s financial statement disclosures.
Other: Expenses directly related to the Master LLC are charged to the Master LLC. Other operating expenses shared by several funds are pro rated among those funds on the basis of relative net assets or other appropriate methods.
The Master LLC has an arrangement with the custodian whereby fees may be reduced by credits earned on uninvested cash balances, which, if applicable, are shown as fees paid indirectly in the Statement of Operations. The custodian imposes fees on overdrawn cash balances, which can be offset by accumulated credits earned or may result in additional custody charges.
2. Investment Advisory Agreement and Other Transactions with Affiliates:
The PNC Financial Services Group, Inc. (“PNC”) is the largest stockholder and an affiliate, for 1940 Act purposes, of BlackRock, Inc. (“BlackRock”).
The Master LLC entered into an Investment Advisory Agreement with BlackRock Advisors, LLC (the “Manager”), the Master LLC’s investment advisor, an indirect, wholly owned subsidiary of BlackRock, to provide investment advisory and administration services. The Manager is responsible for the management of the Master LLC’s portfolio and provides the necessary personnel, facilities, equipment and certain other services necessary to the operations of the Master LLC. For such services, the Master LLC pays the Manager a monthly fee based on a percentage of the Master LLC’s average daily net assets at the following annual rates:
| | | | |
| | | Investment | |
| Average Daily Net Assets | | Advisory Fee | |
First $100 Million | | | 0.60% | |
$100 — $200 Million | | | 0.50% | |
Greater than $200 Million | | | 0.40% | |
The Manager voluntarily agreed to waive its investment advisory fees by the amount of investment advisory fees the Master LLC pays to the Manager indirectly through its investment in affiliated money market funds. However, the Manager does not waive its investment advisory fees by the amount of investment advisory fees paid in connection with the Master
| | | | | | |
| | | | | | | |
| | BLACKROCK BASIC VALUE FUND, INC. | | DECEMBER 31, 2012 | | 27 |
| | |
| | |
Notes to Financial Statements (continued) | | Master Basic Value LLC |
LLC’s investment in other affiliated investment companies, if any. This amount is shown as fees waived by Manager in the Statement of Operations. For the six months ended December 31, 2012, the amount waived was $16,944.
The Manager entered into a sub-advisory agreement with BlackRock Investment Management, LLC (“BIM”), an affiliate of the Manager. The Manager pays BIM, for services it provides, a monthly fee that is a percentage of the investment advisory fees paid by the Master LLC to the Manager.
For the six months ended December 31, 2012, the Master LLC reimbursed the Manager $21,363 for certain accounting services, which is included in accounting services in the Statement of Operations.
The Master LLC received an exemptive order from the SEC permitting it, among other things, to pay an affiliated securities lending agent a fee based on a share of the income derived from the securities lending activities and has retained BIM as the securities lending agent. BIM may, on behalf of the Master LLC, invest cash collateral received by the Master LLC for such loans, among other things, in a private investment company managed by the Manager or in registered money market funds advised by the Manager or its affiliates. The market value of securities on loan and the value of the related collateral, if applicable, are shown in the Statement of Assets and Liabilities as securities loaned at value and collateral on securities loaned at value, respectively. The cash collateral invested by BIM is disclosed in the Schedule of Investments, if any. Securities lending income is equal to the total of income earned from the reinvestment of cash collateral, net of rebates paid to, or fees paid by, borrowers of securities. The Master LLC retains 65% of securities lending income and pays a fee to BIM equal to 35% of such income. The Master LLC benefits from a borrower default indemnity provided by BlackRock, Inc. As securities lending agent, BIM bears all operational costs directly related to securities lending as well as the cost of borrower default indemnification. BIM does not receive any fees for managing the cash collateral. The share of income earned by the Master LLC is shown as securities lending – affiliated – net in the Statement of Operations. For the six months ended December 31, 2012, BIM received $20,300 in securities lending agent fees related to securities lending activities for the Master LLC.
Certain officers and/or directors of the Master LLC are officers and/or directors of BlackRock or its affiliates.
3. Investments:
Purchases and sales of investments, excluding short-term securities, for the six months ended December 31, 2012, were $918,574,958 and $1,514,964,818, respectively.
4. Borrowings:
The Master LLC, along with certain other funds managed by the Manager and its affiliates, is a party to a $500 million credit agreement with a group of lenders. The Master LLC may borrow under the credit agreement
to fund shareholder redemptions. Effective November 2011 to November 2012, the credit agreement had the following terms: a commitment fee of 0.065% per annum based on the Master LLC’s pro rata share of the unused portion of the credit agreement and interest at a rate equal to the higher of (a) the one-month London Interbank Offered Rate (“LIBOR”) plus 0.80% per annum or (b) the Fed Funds rate plus 0.80% per annum on amounts borrowed. In addition, the Master LLC paid administration and arrangement fees which were allocated to the Master LLC based on its net assets as of October 31, 2011. The credit agreement, which expired in November 2012, was renewed with the same terms until November 2013. Effective November 2012 to November 2013, the credit agreement has the following terms: a commitment fee of 0.065% per annum based on the Master LLC’s pro rata share of the unused portion of the credit agreement and interest at a rate equal to the higher of (a) the one-month LIBOR plus 0.80% per annum or (b) the Fed Funds rate plus 0.80% per annum on amounts borrowed. In addition, the Master LLC paid administration and arrangement fees which were allocated to the Master LLC based on its net assets as of October 31, 2012. The Master LLC did not borrow under the credit agreement during the six months ended December 31, 2012.
5. Concentration, Market and Credit Risk:
In the normal course of business, the Master LLC invests in securities and enters into transactions where risks exist due to fluctuations in the market (market risk) or failure of the issuer of a security to meet all its obligations (issuer credit risk). The value of securities held by the Master LLC may decline in response to certain events, including those directly involving the issuers whose securities are owned by the Master LLC; conditions affecting the general economy; overall market changes; local, regional or global political, social or economic instability; and currency and interest rate and price fluctuations. Similar to issuer credit risk, the Master LLC may be exposed to counterparty credit risk, or the risk that an entity with which the Master LLC has unsettled or open transactions may fail to or be unable to perform on its commitments. The Master LLC manages counterparty credit risk by entering into transactions only with counterparties that it believes have the financial resources to honor their obligations and by monitoring the financial stability of those counterparties. Financial assets, which potentially expose the Master LLC to market, issuer and counterparty credit risks, consist principally of financial instruments and receivables due from counterparties. The extent of the Master LLC’s exposure to market, issuer and counterparty credit risks with respect to these financial assets is generally approximated by their value recorded in the Statement of Assets and Liabilities, less any collateral held by the Master LLC.
As of December 31, 2012, the Master LLC invested a significant portion of its assets in securities in the financials sector. Changes in economic conditions affecting the financials sector would have a greater impact on the Master LLC and could affect the value, income and/or liquidity of positions in such securities.
| | | | | | |
| | | | | | | |
| 28 | | BLACKROCK BASIC VALUE FUND, INC. | | DECEMBER 31, 2012 | | |
| | |
| | |
Notes to Financial Statements (concluded) | | Master Basic Value LLC |
6. Reorganization:
On September 12, 2011, an investor of the Master LLC acquired all of the net assets of BlackRock Focus Value Fund, Inc., pursuant to a plan of reorganization. As a result of the reorganization, which included $4,498,457 of net unrealized appreciation, the Master LLC received an in-kind contribution of portfolio securities of $118,173,446.
7. Subsequent Events:
Management has evaluated the impact of all subsequent events on the Master LLC through the date the financial statements were issued and has determined that there were no subsequent events requiring adjustment or additional disclosure in the financial statements.
| | | | | | |
| | | | | | | |
| | BLACKROCK BASIC VALUE FUND, INC. | | DECEMBER 31, 2012 | | 29 |
Robert M. Hernandez, Chairman of the Board and Director
Fred G. Weiss, Vice Chairman of the Board and Director
Paul L. Audet, Director
James H. Bodurtha, Director
Bruce R. Bond, Director
Donald W. Burton, Director
Honorable Stuart E. Eizenstat, Director
Laurence D. Fink, Director
Kenneth A. Froot, Director
Henry Gabbay, Director
John F. O’Brien, Director
Roberta Cooper Ramo, Director
David H. Walsh, Director
John M. Perlowski, President and Chief Executive Officer
Brendan Kyne, Vice President
Neal Andrews, Chief Financial Officer
Jay Fife, Treasurer
Brian Kindelan, Chief Compliance Officer and Anti-Money Laundering Officer
Benjamin Archibald, Secretary
Investment Advisor and Administrator
BlackRock Advisors, LLC
Wilmington, DE 19809
Sub-Advisor
BlackRock Investment Management, LLC
Princeton, NJ 08540
Accounting Agent and Transfer Agent
BNY Mellon Investment Servicing (US) Inc.
Wilmington, DE 19809
Custodian
The Bank of New York Mellon
New York, NY 10286
Distributor
BlackRock Investments, LLC
New York, NY 10022
Legal Counsel
Willkie Farr & Gallagher LLP
New York, NY 10019
Independent Registered Public Accounting Firm
Deloitte & Touche LLP
Philadelphia, PA 19103
Address of the Fund
100 Bellevue Parkway
Wilmington, DE 19809
| | | | | | |
| | | | | | | |
| 30 | | BLACKROCK BASIC VALUE FUND, INC. | | DECEMBER 31, 2012 | | |
Electronic Delivery
Electronic copies of most financial reports and prospectuses are available on the Fund’s website or shareholders can sign up for e-mail notifications of quarterly statements, annual and semi-annual reports and prospectuses by enrolling in the Fund’s electronic delivery program.
To enroll:
Shareholders Who Hold Accounts with Investment Advisors, Banks or Brokerages:
Please contact your financial advisor. Please note that not all investment advisors, banks or brokerages may offer this service.
Shareholders Who Hold Accounts Directly with BlackRock:
| 1) | Access the BlackRock website at |
| | http://www.blackrock.com/ edelivery |
| 2) | Select “eDelivery” under the “More Information” section |
Householding
The Fund will mail only one copy of shareholder documents, including prospectuses, annual and semi-annual reports and proxy statements, to shareholders with multiple accounts at the same address. This practice is commonly called “householding” and is intended to reduce expenses and eliminate duplicate mailings of shareholder documents. Mailings of your shareholder documents may be householded indefinitely unless you instruct us otherwise. If you do not want the mailing of these documents to be combined with those for other members of your household, please call the Fund at (800) 441-7762.
Availability of Quarterly Schedule of Investments
The Fund/Master LLC files its complete schedule of portfolio holdings with the SEC for the first and third quarters of each fiscal year on Form N-Q. The Fund’s/Master LLC’s Forms N-Q are available on the SEC’s website at http://www.sec.gov and may also be reviewed and copied at the SEC’s Public Reference Room in Washington, DC. Information on how to access documents on the SEC’s website without charge may be obtained by calling (800) SEC-0330. The Fund’s/Master LLC’s Forms N-Q may also be obtained upon request and without charge by calling (800) 441-7762.
Availability of Proxy Voting Policies and Procedures
A description of the policies and procedures that the Fund/Master LLC uses to determine how to vote proxies relating to portfolio securities is available (1) without charge, upon request, by calling (800) 441-7762; (2) at http://www.blackrock.com; and (3) on the SEC’s website at http://www.sec.gov.
Availability of Proxy Voting Record
Information about how the Fund/Master LLC voted proxies relating to securities held in the Fund’s/Master LLC’s portfolios during the most recent 12-month period ended June 30 is available upon request and without charge (1) at http://www.blackrock.com or by calling (800) 441-7762 and (2) on the SEC’s website at http://www.sec.gov.
Account Information
Call us at (800) 441-7762 from 8:00 AM to 6:00 PM EST on any business day to get information about your account balances, recent transactions and share prices. You can also reach us on the Web at
http:// www.blackrock.com/funds.
Automatic Investment Plans
Investor Class shareholders who want to invest regularly can arrange to have $50 or more automatically deducted from their checking or savings account and invested in any of the BlackRock funds.
Systematic Withdrawal Plan
Investor Class shareholders can establish a systematic withdrawal plan and receive periodic payments of $50 or more from their BlackRock funds, as long as their account balance is at least $10,000.
Retirement Plans
Shareholders may make investments in conjunction with Traditional, Rollover, Roth, Coverdell, Simple IRAs, SEP IRAs and 403(b) Plans.
| | | | | | |
| | | | | | | |
| | BLACKROCK BASIC VALUE FUND, INC. | | DECEMBER 31, 2012 | | 31 |
| | |
| | |
Additional Information (concluded) | | |
|
BlackRock Privacy Principles |
BlackRock is committed to maintaining the privacy of its current and former fund investors and individual clients (collectively, “Clients”) and to safeguarding their non-public personal information. The following information is provided to help you understand what personal information BlackRock collects, how we protect that information and why in certain cases we share such information with select parties.
If you are located in a jurisdiction where specific laws, rules or regulations require BlackRock to provide you with additional or different privacy-related rights beyond what is set forth below, then BlackRock will comply with those specific laws, rules or regulations.
BlackRock obtains or verifies personal non-public information from and about you from different sources, including the following: (i) information we receive from you or, if applicable, your financial intermediary, on applications, forms or other documents; (ii) information about your transactions with us, our affiliates, or others; (iii) information we receive from a consumer reporting agency; and (iv) from visits to our websites.
BlackRock does not sell or disclose to non-affiliated third parties any non-public personal information about its Clients, except as permitted by law or as is necessary to respond to regulatory requests or to service Client accounts. These non-affiliated third parties are required to protect the confidentiality and security of this information and to use it only for its intended purpose.
We may share information with our affiliates to service your account or to provide you with information about other BlackRock products or services that may be of interest to you. In addition, BlackRock restricts access to non-public personal information about its Clients to those BlackRock employees with a legitimate business need for the information. BlackRock maintains physical, electronic and procedural safeguards that are designed to protect the non-public personal information of its Clients, including procedures relating to the proper storage and disposal of such information.
| | | | | | |
| | | | | | | |
| 32 | | BLACKROCK BASIC VALUE FUND, INC. | | DECEMBER 31, 2012 | | |
| | |
| | |
A World-Class Mutual Fund Family | | |
BlackRock offers a diverse lineup of open-end mutual funds crossing all investment styles and managed by experts in equity, fixed income and tax-exempt investing.
| | | | |
Equity Funds | | | | |
| BlackRock ACWI ex-US Index Fund | | BlackRock Global Opportunities Portfolio | | BlackRock Mid-Cap Value Opportunities Fund |
| BlackRock All-Cap Energy & Resources Portfolio | | BlackRock Global SmallCap Fund | | BlackRock Natural Resources Trust |
| BlackRock Basic Value Fund | | BlackRock Health Sciences Opportunities Portfolio | | BlackRock Pacific Fund |
| BlackRock Capital Appreciation Fund | | BlackRock Index Equity Portfolio | | BlackRock Real Estate Securities Fund |
| BlackRock China Fund | | BlackRock India Fund | | BlackRock Russell 1000 Index Fund |
| BlackRock Commodity Strategies Fund | | BlackRock International Fund | | BlackRock Science & Technology |
| BlackRock Emerging Markets Fund | | BlackRock International Index Fund | | Opportunities Portfolio |
| BlackRock Emerging Markets Long/Short | | BlackRock International Opportunities Portfolio | | BlackRock Small Cap Growth Equity Portfolio |
| Equity Fund | | BlackRock Large Cap Core Fund | | BlackRock Small Cap Growth Fund II |
| BlackRock Energy & Resources Portfolio | | BlackRock Large Cap Core Plus Fund | | BlackRock Small Cap Index Fund |
| BlackRock Equity Dividend Fund | | BlackRock Large Cap Growth Fund | | BlackRock S&P 500 Index Fund |
| BlackRock EuroFund | | BlackRock Large Cap Value Fund | | BlackRock S&P 500 Stock Fund |
| BlackRock Flexible Equity Fund | | BlackRock Latin America Fund | | BlackRock U.S. Opportunities Portfolio |
| BlackRock Focus Growth Fund | | BlackRock Long-Horizon Equity Fund | | BlackRock Value Opportunities Fund |
| BlackRock Global Dividend Income Portfolio | | BlackRock Mid-Cap Growth Equity Portfolio | | BlackRock World Gold Fund |
| BlackRock Global Long/Short Equity Fund | | | | |
| | | | | |
Taxable Fixed Income Funds | | | | |
| BlackRock Bond Index Fund | | BlackRock High Yield Bond Portfolio | | BlackRock Strategic Income |
| BlackRock Core Bond Portfolio | | BlackRock Inflation Protected Bond Portfolio | | Opportunities Portfolio |
| BlackRock CoreAlpha Bond Fund | | BlackRock International Bond Portfolio | | BlackRock Total Return Fund |
| BlackRock Emerging Market Local Debt Portfolio | | BlackRock Long Duration Bond Portfolio | | BlackRock U.S. Government Bond Portfolio |
| BlackRock Floating Rate Income Portfolio | | BlackRock Low Duration Bond Portfolio | | BlackRock U.S. Mortgage Portfolio |
| BlackRock Global Long/Short Credit Fund | | BlackRock Secured Credit Portfolio | | BlackRock World Income Fund |
| BlackRock GNMA Portfolio | | | | |
| | | | | |
Municipal Fixed Income Funds | | | | |
| BlackRock California Municipal Bond Fund | | BlackRock National Municipal Fund | | BlackRock Pennsylvania Municipal Bond Fund |
| BlackRock High Yield Municipal Fund | | BlackRock New Jersey Municipal Bond Fund | | BlackRock Short-Term Municipal Fund |
| BlackRock Intermediate Municipal Fund | | BlackRock New York Municipal Bond Fund | | |
| | | | | |
Mixed Asset Funds | | | | |
| BlackRock Balanced Capital Fund | | LifePath Active Portfolios | | LifePath Index Portfolios |
| BlackRock Global Allocation Fund | | 2015 2035 | | Retirement 2040 |
| BlackRock Managed Volatility Portfolio | | 2020 2040 | | 2020 2045 |
| BlackRock Multi-Asset Income Portfolio | | 2025 2045 | | 2025 2050 |
| BlackRock Multi-Asset Real Return Fund | | 2030 2050 | | 2030 2055 |
| BlackRock Strategic Risk Allocation Fund | | | | 2035 |
| | | | | |
| BlackRock Prepared Portfolios | | LifePath Portfolios | | |
| Conservative Prepared Portfolio | | Retirement 2040 | | |
| Moderate Prepared Portfolio | | 2020 2045 | | |
| Growth Prepared Portfolio | | 2025 2050 | | |
| Aggressive Growth Prepared Portfolio | | 2030 2055 | | |
| | 2035 | | |
BlackRock mutual funds are currently distributed by BlackRock Investments, LLC. You should consider the investment objectives, risks, charges and expenses of the funds under consideration carefully before investing. Each fund’s prospectus contains this and other information and is available at www.blackrock.com or by calling (800) 441-7762 or from your financial advisor. The prospectus should be read carefully before investing.
| | | | | | |
| | | | | | | |
| | BLACKROCK BASIC VALUE FUND, INC. | | DECEMBER 31, 2012 | | 33 |
This report is transmitted to shareholders only. It is not authorized for use as an offer of sale or a solicitation of an offer to buy shares of the Fund unless accompanied or preceded by the Fund’s current prospectus. Past performance results shown in this report should not be considered a representation of future performance. Investment returns and principal value of shares will fluctuate so that shares, when redeemed, may be worth more or less than their original cost. Statements and other information herein are as dated and are subject to change.
BV-12/12-SAR

| | |
| Item 2 – | | Code of Ethics – Not Applicable to this semi-annual report |
| |
| Item 3 – | | Audit Committee Financial Expert – Not Applicable to this semi-annual report |
| |
| Item 4 – | | Principal Accountant Fees and Services – Not Applicable to this semi-annual report |
| |
| Item 5 – | | Audit Committee of Listed Registrants – Not Applicable |
| |
| Item 6 – | | Investments |
| |
| | (a) The registrants’ Schedules of Investments are included as part of the Report to Stockholders filed under Item 1 of this Form. |
| |
| | (b) Not Applicable due to no such divestments during the semi-annual period covered since the previous Form N-CSR filing. |
| |
| Item 7 – | | Disclosure of Proxy Voting Policies and Procedures for Closed-End Management Investment Companies – Not Applicable |
| |
| Item 8 – | | Portfolio Managers of Closed-End Management Investment Companies – Not Applicable |
| |
| Item 9 – | | Purchases of Equity Securities by Closed-End Management Investment Company and Affiliated Purchasers – Not Applicable |
| |
| Item 10 – | | Submission of Matters to a Vote of Security Holders – There have been no material changes to these procedures. |
| |
| Item 11 – | | Controls and Procedures |
| |
| | (a) – The registrants’ principal executive and principal financial officers, or persons performing similar functions, have concluded that the registrants’ disclosure controls and procedures (as defined in Rule 30a-3(c) under the Investment Company Act of 1940, as amended (the “1940 Act”)) are effective as of a date within 90 days of the filing of this report based on the evaluation of these controls and procedures required by Rule 30a-3(b) under the 1940 Act and Rule 15d-15(b) under the Securities Exchange Act of 1934, as amended. |
| |
| | (b) – There were no changes in the registrants’ internal control over financial reporting (as defined in Rule 30a-3(d) under the 1940 Act) that occurred during the second fiscal quarter of the period covered by this report that have materially affected, or are reasonably likely to materially affect, the registrants’ internal control over financial reporting. |
| |
| Item 12 – | | Exhibits attached hereto |
| |
| | (a)(1) – Code of Ethics – Not Applicable to this semi-annual report |
| |
| | (a)(2) – Certifications – Attached hereto |
| |
| | (a)(3) – Not Applicable |
| |
| | (b) – Certifications – Attached hereto |
2
Pursuant to the requirements of the Securities Exchange Act of 1934 and the Investment Company Act of 1940, each registrant has duly caused this report to be signed on its behalf by the undersigned, thereunto duly authorized.
| | |
| BlackRock Basic Value Fund, Inc. and Master Basic Value LLC |
| |
| By: | | /s/ John M. Perlowski |
| | John M. Perlowski |
| | Chief Executive Officer (principal executive officer) of |
| | BlackRock Basic Value Fund, Inc. and Master Basic Value LLC |
| |
| Date: | | February 28, 2013 |
Pursuant to the requirements of the Securities Exchange Act of 1934 and the Investment Company Act of 1940, this report has been signed below by the following persons on behalf of each registrant and in the capacities and on the dates indicated.
| | |
| By: | | /s/ John M. Perlowski |
| | John M. Perlowski |
| | Chief Executive Officer (principal executive officer) of |
| | BlackRock Basic Value Fund, Inc. and Master Basic Value LLC |
|
| Date: February 28, 2013 |
| |
| By: | | /s/ Neal J. Andrews |
| | Neal J. Andrews |
| | Chief Financial Officer (principal financial officer) of |
| | BlackRock Basic Value Fund, Inc. and Master Basic Value LLC |
| |
| Date: | | February 28, 2013 |
3