UNITED STATES
SECURITIES AND EXCHANGE COMMISSION
Washington, D.C. 20549
FORM N-CSR
CERTIFIED SHAREHOLDER REPORT OF REGISTERED MANAGEMENT INVESTMENT COMPANIES
Investment Company Act file number: 811-02739 and 811-10179
Name of Fund: BlackRock Basic Value Fund, Inc. and Master Basic Value LLC
Fund Address: 100 Bellevue Parkway, Wilmington, DE 19809
Name and address of agent for service: John M. Perlowski, Chief Executive Officer, BlackRock Basic Value Fund, Inc. and Master Basic Value LLC, 55 East 52nd Street, New York, NY 10055
Registrants’ telephone number, including area code: (800) 441-7762
Date of fiscal year end: 06/30/2014
Date of reporting period: 12/31/2013
Item 1 – Report to Stockholders
DECEMBER 31, 2013
| | | | |
SEMI-ANNUAL REPORT (UNAUDITED) | | | | BLACKROCK® |
BlackRock Basic Value Fund, Inc.
| | |
| Not FDIC Insured ¡ May Lose Value ¡ No Bank Guarantee | | |
| | | | | | |
| 2 | | BLACKROCK BASIC VALUE FUND, INC. | | DECEMBER 31, 2013 | | |
Dear Shareholder
Risk assets (such as equities) powered higher in 2013, for the most part unscathed by ongoing political and economic uncertainty. While monetary policy was the main driving force behind the rally in risk assets, it was also the main culprit for the bouts of volatility during the year.
Equity markets rallied right out of the gate in January with cash pouring back in from the sidelines after a potential US fiscal crisis (i.e., the “fiscal cliff”) was averted with a last-minute tax deal. Key indicators signaling modest but broad-based improvements in the world’s major economies and a calming in Europe’s debt troubles fostered an aura of comfort for investors. Global economic momentum slowed in February, however, and the pace of the rally moderated. In the months that followed, US stocks outperformed international stocks, as the US showed greater stability than most other regions. Slow but positive growth was sufficient to support corporate earnings, while uncomfortably high unemployment reinforced expectations that the Federal Reserve would continue its aggressive monetary stimulus program. International markets experienced higher levels of volatility given a resurgence of political instability in Italy, a banking crisis in Cyprus and a generally poor outlook for European economies. Emerging markets significantly lagged the rest of the world as growth in these economies fell short of expectations.
Financial markets were rattled in May when Fed Chairman Bernanke mentioned the possibility of reducing — or “tapering” — the central bank’s asset purchase programs — comments that were widely misinterpreted as signaling an end to the Fed’s zero-interest-rate policy. US Treasury yields rose sharply, triggering a steep sell-off across fixed income markets. (Bond prices move in the opposite direction of yields.) Equity prices also suffered as investors feared the implications of a potential end of a program that had greatly supported the markets. Risk assets rebounded in late June, however, when the Fed’s tone turned more dovish, and improving economic indicators and better corporate earnings helped extend gains through most of the summer.
The fall was a surprisingly positive period for most asset classes as the Fed defied market expectations with its decision to delay tapering. Easing of political tensions that had earlier surfaced in Egypt and Syria and the re-election of Angela Merkel as Chancellor of Germany also boosted investor sentiment. Higher volatility returned in late September when the US Treasury Department warned that the national debt would soon breach its statutory maximum. The ensuing political brinksmanship led to a partial government shutdown, roiling global financial markets through the first half of October, but the rally quickly resumed when politicians engineered a compromise to reopen the government and extend the debt ceiling, at least temporarily.
The remainder of the year was generally positive for stock markets in the developed world, although investors continued to grapple with uncertainty about when and how much the Fed would scale back on stimulus. On the one hand, persistent weak growth and low inflation provided significant latitude for monetary policy decisions and investors were encouraged by dovish comments from Fed Chair-to-be Janet Yellen. On the other hand, US housing and manufacturing reports had begun to signal fundamental improvement in the economy. The long-awaited taper announcement ultimately came in mid-December. The Fed reduced the amount of its monthly asset purchases, but at the same time, extended its time horizon for maintaining low short-term interest rates. Markets reacted positively as this move signaled the Fed’s perception of real improvement in the economy and investors felt relief from the tenacious anxiety that had gripped them throughout the year.
Accommodative monetary policy and the avoidance of major risks made 2013 a strong year for most equity markets. US stocks were the strongest performers for the six- and 12-month periods ended December 31. In contrast, emerging markets were weighed down by uneven growth and structural imbalances. Rising US Treasury yields led to a rare annual loss in 2013 for Treasury bonds and other high-quality fixed income sectors including tax-exempt municipals and investment grade corporate bonds. High yield bonds, to the contrary, generated gains driven by income-oriented investors seeking yield in the low-rate environment. Short-term interest rates remained near zero, keeping yields on money market securities near historical lows.
At BlackRock, we believe investors need to think globally and extend their scope across a broader array of asset classes and be prepared to move freely as market conditions change over time. We encourage you to talk with your financial advisor and visit www.blackrock.com for further insight about investing in today’s world.
Sincerely,

Rob Kapito
President, BlackRock Advisors, LLC

“While monetary policy was the main driving force behind the rally in risk assets, it was also the main culprit for the bouts of volatility during the year.”
Rob Kapito
President, BlackRock Advisors, LLC
| | | | | | | | |
| Total Returns as of December 31, 2013 | |
| | | 6-month | | | 12-month | |
US large cap equities
(S&P 500® Index) | | | 16.31 | % | | | 32.39 | % |
US small cap equities
(Russell 2000® Index) | | | 19.82 | | | | 38.82 | |
International equities
(MSCI Europe, Australasia, Far East Index) | | | 17.94 | | | | 22.78 | |
Emerging market equities
(MSCI Emerging Markets Index) | | | 7.70 | | | | (2.60 | ) |
3-month Treasury bill
(BofA Merrill Lynch
3-Month US Treasury
Bill Index) | | | 0.03 | | | | 0.07 | |
US Treasury securities
(BofA Merrill Lynch
10-Year US Treasury
Index) | | | (3.10 | ) | | | (7.83 | ) |
US investment grade
bonds (Barclays US
Aggregate Bond Index) | | | 0.43 | | | | (2.02 | ) |
Tax-exempt municipal
bonds (S&P Municipal Bond Index) | | | 0.00 | | | | (2.55 | ) |
US high yield bonds
(Barclays US Corporate
High Yield 2% Issuer
Capped Index) | | | 5.94 | | | | 7.44 | |
|
| Past performance is no guarantee of future results. Index performance is shown for illustrative purposes only. You cannot invest directly in an index. | |
| | | | | | | | |
| | | THIS PAGE NOT PART OF YOUR FUND REPORT | | | | | 3 | |
| | | | |
| Fund Summary as of December 31, 2013 | | | BlackRock Basic Value Fund, Inc. | |
BlackRock Basic Value Fund, Inc.’s (the “Fund”) investment objective is to seek capital appreciation and, secondarily, income by investing in securities, primarily equity securities, that management of the Fund believes are undervalued and therefore represent basic investment value.
Effective February 14, 2014, Fund management has determined to remove the S&P 500® Index as a benchmark against which the Fund measures its performance. Fund management believes the S&P 500® Index no longer has characteristics similar to the current investment strategy of the Fund.
|
| Portfolio Management Commentary |
How did the Fund perform?
| Ÿ | | For the six-month period ended December 31, 2013, through its investment in Master Basic Value LLC (the “Master LLC”), the Fund outperformed the Russell 1000® Value Index benchmark. For the same period, the Fund’s Institutional Shares outperformed the broad-market S&P 500® Index, while the Fund’s Investor A, Investor B, Investor C and Class R Shares underperformed the S&P 500® Index. The following discussion of relative performance pertains to the Russell 1000® Value Index. |
What factors influenced performance?
| Ÿ | | Stock selection in financials had the largest impact on performance during the period. An underweight in real estate investment trusts (“REITs”) continued to benefit returns as interest rate-sensitive areas of the market declined with rising US Treasury yields. In addition, the Master LLC’s insurance industry holdings advanced from improving equity markets and continued positive earnings. |
| Ÿ | | The Master LLC’s substantial underweight in utilities contributed positively as the sector continued to underperform the broader Russell 1000® Value Index. Stock selection within the sector also contributed positively to relative performance. In energy, an investment in refiners generated outperformance. Valero Energy Corp. and Marathon Petroleum Corp. benefited from a change in the spread between the cost of domestic and international crude oil. This dynamic increased expected profit |
| | | margins and led the companies to rebound from seasonal weakness experienced throughout the summer of 2013. |
| Ÿ | | Stock selection in information technology (“IT”) had the largest negative impact during the period. An investment in Cisco Systems, Inc. declined 11% during the period after delivering a disappointing quarterly earnings report in November 2013 in which the company provided a weak outlook. In addition, an underweight in Apple Inc. detracted from performance as the stock rebounded 28%. The Master LLC’s underweight exposure to industrials, one of the top-performing sectors during the six months, detracted from relative performance. |
Describe recent portfolio activity.
| Ÿ | | A combination of trading activity and market movement led to a number of changes to the Master LLC’s sector weightings during the six-month period. The Master LLC’s allocations to the energy and IT sectors increased notably while industrials, consumer discretionary and consumer staples experienced a decline. |
Describe portfolio positioning at period end.
| Ÿ | | Relative to the Russell 1000® Value Index, the Master LLC ended the period with its largest sector overweights in the health care, consumer discretionary and financials sectors, and its most significant underweights in industrials, utilities and telecommunication services. |
The views expressed reflect the opinions of BlackRock as of the date of this report and are subject to change based on changes in market, economic or other conditions. These views are not intended to be a forecast of future events and are no guarantee of future results.
| | | | | | |
| 4 | | BLACKROCK BASIC VALUE FUND, INC. | | DECEMBER 31, 2013 | | |
| | | | |
| | | | BlackRock Basic Value Fund, Inc. | |
|
| Total Return Based on a $10,000 Investment |
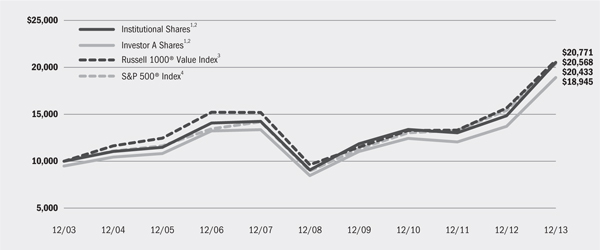
| | 1 | Assuming maximum sales charges, if any, transaction costs and other operating expenses, including administration fees, if any. Institutional Shares do not have a sales charge. |
| | 2 | The Fund invests all of its assets in the Master LLC. The Master LLC invests primarily in equity securities that the investment advisor of the Master LLC believes are undervalued, which means that their prices are less than the investment advisor of the Master LLC believes they are worth. |
| | 3 | This unmanaged index measures the performance of the large cap value segment of the US equity universe and includes those Russell 1000® Index companies with lower price-to-book ratios and lower forecasted growth values. |
| | 4 | This unmanaged index covers 500 industrial, utility, transportation and financial companies of the US markets (mostly New York Stock Exchange (“NYSE”) issues), representing about 75% of NYSE market capitalization and 30% of NYSE issues. |
| | | | | | | | | | | | | | | | | | | | | | | | | | | | |
| Performance Summary for the Period Ended December 31, 2013 | |
| | | | | | Average Annual Total Returns5 | |
| | | | | 1 Year | | | 5 Years | | | 10 Years | |
| | 6-Month
Total Returns | | | w/o sales
charge | | | w/ sales
charge | | | w/o sales
charge | | | w/ sales
charge | | | w/o sales
charge | | | w/ sales
charge | |
Institutional | | | 16.39 | % | | | 38.32 | % | | | N/A | | | | 17.82 | % | | | N/A | | | | 7.48 | % | | | N/A | |
Investor A | | | 16.24 | | | | 37.96 | | | | 30.71 | % | | | 17.47 | | | | 16.21 | % | | | 7.17 | | | | 6.60 | % |
Investor B | | | 15.56 | | | | 36.45 | | | | 31.95 | | | | 16.32 | | | | 16.10 | | | | 6.44 | | | | 6.44 | |
Investor C | | | 15.80 | | | | 36.91 | | | | 35.91 | | | | 16.53 | | | | 16.53 | | | | 6.32 | | | | 6.32 | |
Class R | | | 16.06 | | | | 37.55 | | | | N/A | | | | 17.06 | | | | N/A | | | | 6.83 | | | | N/A | |
S&P 500® Index | | | 16.31 | | | | 32.39 | | | | N/A | | | | 17.94 | | | | N/A | | | | 7.41 | | | | N/A | |
Russell 1000® Value Index | | | 14.34 | | | | 32.53 | | | | N/A | | | | 16.67 | | | | N/A | | | | 7.58 | | | | N/A | |
| | 5 | Assuming maximum sales charges, if any. Average annual total returns with and without sales charges reflect reductions for distribution and service fees. See “About Fund Performance” on page 6 for a detailed description of share classes, including any related sales charges and fees. |
| | | N/A—Not applicable as share class and index do not have a sales charge. |
| | | Past performance is not indicative of future results. |
| | | | | | | | | | | | | | |
| Expense Example | | | | | | | | | | | | | | |
| | | Actual | | Hypothetical7 | | |
| | | Beginning
Account Value
July 1, 2013 | | Ending
Account Value
December 31, 2013 | | Expenses Paid
During the Period6 | | Beginning
Account Value
July 1, 2013 | | Ending
Account Value
December 31, 2013 | | Expenses Paid
During the Period6 | | Annualized
Expense Ratio |
Institutional | | $1,000.00 | | $1,163.90 | | $2.89 | | $1,000.00 | | $1,022.53 | | $2.70 | | 0.53% |
Investor A | | $1,000.00 | | $1,162.40 | | $4.41 | | $1,000.00 | | $1,021.12 | | $4.13 | | 0.81% |
Investor B | | $1,000.00 | | $1,155.60 | | $10.81 | | $1,000.00 | | $1,015.17 | | $10.11 | | 1.99% |
Investor C | | $1,000.00 | | $1,158.00 | | $8.70 | | $1,000.00 | | $1,017.14 | | $8.13 | | 1.60% |
Class R | | $1,000.00 | | $1,160.60 | | $6.15 | | $1,000.00 | | $1,019.51 | | $5.75 | | 1.13% |
| | 6 | For each class of the Fund, expenses are equal to the annualized expense ratio for the class, multiplied by the average account value over the period, multiplied by 184/365 (to reflect the one-half year period shown). Because the Fund invests significantly in the Master LLC, the expense table reflects the net expenses of both the Fund and the Master LLC in which it invests. |
| | 7 | Hypothetical 5% annual return before expenses is calculated by pro rating the number of days in the most recent fiscal half year divided by 365. |
| | | See “Disclosure of Expenses” on page 6 for further information on how expenses were calculated. |
| | | | | | |
| | | BLACKROCK BASIC VALUE FUND, INC. | | DECEMBER 31, 2013 | | 5 |
| Ÿ | | Institutional Shares are not subject to any sales charge. These shares bear no ongoing distribution or service fees and are available only to certain eligible investors. |
| Ÿ | | Investor A Shares are subject to a maximum initial sales charge (front- end load) of 5.25% and a service fee of 0.25% per year (but no distri- bution fee). Certain redemptions of these shares may be subject to a contingent deferred sales charge (“CDSC”) where no initial sales charge was paid at the time of purchase. |
| Ÿ | | Investor B Shares are subject to a maximum CDSC of 4.50% declining to 0% after six years. In addition, these shares are subject to a distribu- tion fee of 0.75% per year and a service fee of 0.25% per year. These shares automatically convert to Investor A Shares after approximately eight years. (There is no initial sales charge for automatic share conver- sions.) All returns for periods greater than eight years reflect this conver- sion. These shares are only available through exchanges and dividend reinvestments by current holders and for purchase by certain employer- sponsored retirement plans. |
| Ÿ | | Investor C Shares are subject to a 1.00% CDSC if redeemed within one year of purchase. In addition, these shares are subject to a distribution fee of 0.75% per year and a service fee of 0.25% per year. |
| Ÿ | | Class R Shares are not subject to any sales charge. These shares are subject to a distribution fee of 0.25% per year and a service fee of 0.25% per year. These shares are available only to certain employer- sponsored retirement plans. |
Performance information reflects past performance and does not guaran- tee future results. Current performance may be lower or higher than the performance data quoted. Refer to www.blackrock.com/funds to obtain performance data current to the most recent month-end. Perfor- mance results do not reflect the deduction of taxes that a shareholder would pay on fund distributions or the redemption of fund shares. Fig- ures shown in the performance table on the previous page assume rein- vestment of all dividends and distributions, if any, at net asset value (“NAV”) on the ex-dividend dates. Investment return and principal value of shares will fluctuate so that shares, when redeemed, may be worth more or less than their original cost. Dividends paid to each class of shares will vary because of the different levels of service, distribution and transfer agency fees applicable to each class, which are deducted from the income available to be paid to shareholders.
Shareholders of the Fund may incur the following charges: (a) transactional expenses, such as sales charges; and (b) operating expenses, including administration fees, service and distribution fees, including 12b-1 fees, acquired fund fees and expenses, and other Fund expenses. The expense example shown on the previous page (which is based on a hypothetical investment of $1,000 invested on July 1, 2013 and held through December 31, 2013) is intended to assist shareholders both in calculating expenses based on an investment in the Fund and in comparing these expenses with similar costs of investing in other mutual funds.
The expense example provides information about actual account values and actual expenses. In order to estimate the expenses a shareholder paid during the period covered by this report, shareholders can divide their account value by $1,000 and then multiply the result by the number corresponding to their share class under the heading entitled “Expenses Paid During the Period.”
The expense example also provides information about hypothetical account values and hypothetical expenses based on the Fund’s actual expense ratio and an assumed rate of return of 5% per year before expenses. In order to assist shareholders in comparing the ongoing expenses of investing in this Fund and other funds, compare the 5% hypothetical example with the 5% hypothetical examples that appear in other funds’ shareholder reports.
The expenses shown in the expense example are intended to highlight shareholders’ ongoing costs only and do not reflect any transactional expenses, such as sales charges, if any. Therefore, the hypothetical example is useful in comparing ongoing expenses only, and will not help shareholders determine the relative total expenses of owning different funds. If these transactional expenses were included, shareholder expenses would have been higher.
| | | | | | |
| 6 | | BLACKROCK BASIC VALUE FUND, INC. | | DECEMBER 31, 2013 | | |
| | | | |
| Statement of Assets and Liabilities | | | BlackRock Basic Value Fund, Inc. | |
| | | | |
| December 31, 2013 (Unaudited) | | | |
| | | | |
| Assets | | | | |
Investments at value — Master LLC (cost — $3,058,436,171) | | $ | 4,534,576,292 | |
Withdrawals receivable from the Master LLC | | | 8,313,255 | |
Capital shares sold receivable | | | 4,263,727 | |
Prepaid expenses | | | 53,762 | |
| | | | |
Total assets | | | 4,547,207,036 | |
| | | | |
| | | | |
| Liabilities | | | | |
Capital shares redeemed payable | | | 12,576,982 | |
Service and distribution fees payable | | | 750,937 | |
Other affiliates payable | | | 104,087 | |
Officer’s fees payable | | | 1,167 | |
Other accrued expenses payable | | | 694,618 | |
| | | | |
Total liabilities | | | 14,127,791 | |
| | | | |
Net Assets | | $ | 4,533,079,245 | |
| | | | |
| | | | |
| Net Assets Consist of | | | | |
Paid-in capital | | $ | 2,982,833,346 | |
Distributions in excess of net investment income | | | (3,987,799 | ) |
Accumulated net realized gain allocated from the Master LLC | | | 78,093,577 | |
Net unrealized appreciation/depreciation allocated from the Master LLC | | | 1,476,140,121 | |
| | | | |
Net Assets | | $ | 4,533,079,245 | |
| | | | |
| | | | |
| Net Asset Value | | | | |
Institutional — Based on net assets of $2,331,529,311 and 75,887,246 shares outstanding, 400 million shares authorized, $0.10 par value | | $ | 30.72 | |
| | | | |
Investor A — Based on net assets of $1,729,384,670 and 56,707,481 shares outstanding, 200 million shares authorized, $0.10 par value | | $ | 30.50 | |
| | | | |
Investor B — Based on net assets of $18,865,945 and 620,324 shares outstanding, 400 million shares authorized, $0.10 par value | | $ | 30.41 | |
| | | | |
Investor C — Based on net assets of $434,692,694 and 15,438,815 shares outstanding, 200 million shares authorized, $0.10 par value | | $ | 28.16 | |
| | | | |
Class R — Based on net assets of $18,606,625 and 633,346 shares outstanding, 400 million shares authorized, $0.10 par value | | $ | 29.38 | |
| | | | |
See Notes to Financial Statements.
| | | | | | |
| | | BLACKROCK BASIC VALUE FUND, INC. | | DECEMBER 31, 2013 | | 7 |
| | | | |
| Statement of Operations | | | BlackRock Basic Value Fund, Inc. | |
| | | | |
| Six Months Ended December 31, 2013 (Unaudited) | | | |
| | | | |
| Investment Income | | | | |
Net investment income allocated from the Master LLC: | | | | |
Dividends — unaffiliated | | $ | 45,398,231 | |
Foreign taxes withheld | | | (622,577 | ) |
Securities lending — affiliated — net | | | 22,261 | |
Dividends — affiliated | | | 12,951 | |
Other income — affiliated | | | 9,612 | |
Expenses | | | (9,377,237 | ) |
Fees waived | | | 22,916 | |
| | | | |
Total income | | | 35,466,157 | |
| | | | |
| | | | |
| Fund Expenses | | | | |
Service — Investor A | | | 2,100,962 | |
Service and distribution — Investor B | | | 104,671 | |
Service and distribution — Investor C | | | 2,076,597 | |
Service and distribution — Class R | | | 44,394 | |
Transfer agent — Institutional | | | 1,103,082 | |
Transfer agent — Investor A | | | 1,102,353 | |
Transfer agent — Investor B | | | 59,644 | |
Transfer agent — Investor C | | | 352,427 | |
Transfer agent — Class R | | | 17,956 | |
Registration | | | 43,654 | |
Professional | | | 37,211 | |
Printing | | | 35,826 | |
Officer | | | 594 | |
Miscellaneous | | | 14,727 | |
| | | | |
Total expenses | | | 7,094,098 | |
| | | | |
Net investment income | | | 28,372,059 | |
| | | | |
| | | | |
| Realized and Unrealized Gain Allocated from the Master LLC | | | | |
Net realized gain from investments | | | 274,221,233 | |
Net change in unrealized appreciation/depreciation on investments | | | 348,202,680 | |
| | | | |
Total realized and unrealized gain | | | 622,423,913 | |
| | | | |
Net Increase in Net Assets Resulting from Operations | | $ | 650,795,972 | |
| | | | |
See Notes to Financial Statements.
| | | | | | |
| 8 | | BLACKROCK BASIC VALUE FUND, INC. | | DECEMBER 31, 2013 | | |
| | | | |
| Statements of Changes in Net Assets | | | BlackRock Basic Value Fund, Inc. | |
| | | | | | | | |
| Increase in Net Assets: | | Six Months
Ended
December 31,
2013
(Unaudited) | | | Year Ended
June 30, 2013 | |
| | | | | | | | |
| Operations | | | | | | | | |
Net investment income | | $ | 28,372,059 | | | $ | 64,994,404 | |
Net realized gain | | | 274,221,233 | | | | 557,916,538 | |
Net change in unrealized appreciation/depreciation | | | 348,202,680 | | | | 354,453,065 | |
| | | | |
Net increase in net assets resulting from operations | | | 650,795,972 | | | | 977,364,007 | |
| | | | |
| | | | | | | | |
| Dividends and Distributions to Shareholders From | | | | | | | | |
Net investment income: | | | | | | | | |
Institutional | | | (33,276,128 | ) | | | (39,499,826 | )1 |
Investor A | | | (20,610,513 | ) | | | (26,343,056 | )1 |
Investor B | | | — | | | | (111,020 | )1 |
Investor C | | | (2,640,700 | ) | | | (3,808,938 | )1 |
Class R | | | (172,754 | ) | | | (237,160 | )1 |
Net realized gain: | | | | | | | | |
Institutional | | | (254,868,337 | ) | | | (121,781,637 | )1 |
Investor A | | | (192,471,471 | ) | | | (93,798,916 | )1 |
Investor B | | | (2,158,252 | ) | | | (2,100,540 | )1 |
Investor C | | | (52,030,010 | ) | | | (24,212,926 | )1 |
Class R | | | (2,078,707 | ) | | | (1,148,060 | )1 |
| | | | |
Decrease in net assets resulting from dividends and distributions to shareholders | | | (560,306,872 | ) | | | (313,042,079 | ) |
| | | | |
| | | | | | | | |
| Capital Share Transactions | | | | | | | | |
Net increase (decrease) in net assets derived from capital share transactions | | | 350,804,401 | | | | (504,259,357 | ) |
| | | | |
| | | | | | | | |
| Net Assets | | | | | | | | |
Total increase in net assets | | | 441,293,501 | | | | 160,062,571 | |
Beginning of period | | | 4,091,785,744 | | | | 3,931,723,173 | |
| | | | |
End of period | | $ | 4,533,079,245 | | | $ | 4,091,785,744 | |
| | | | |
Undistributed (distributions in excess of) net investment income, end of period | | $ | (3,987,799 | ) | | $ | 24,340,237 | |
| | | | |
| | 1 | Determined in accordance with federal income tax regulations. |
See Notes to Financial Statements.
| | | | | | |
| | | BLACKROCK BASIC VALUE FUND, INC. | | DECEMBER 31, 2013 | | 9 |
| | | | |
| Financial Highlights | | | BlackRock Basic Value Fund, Inc. | |
| | | | | | | | | | | | | | | | | | | | | | | | |
| | | Institutional | |
| | | Six Months
Ended
December 31,
2013
(Unaudited) | | | Year Ended June 30, | |
| | | 2013 | | | 2012 | | | 2011 | | | 2010 | | | 2009 | |
| Per Share Operating Performance | | | | | | | | | | | | | | | | | | | | | | | | |
Net asset value, beginning of period | | $ | 30.22 | | | $ | 25.64 | | | $ | 26.94 | | | $ | 21.27 | | | $ | 18.99 | | | $ | 26.12 | |
| | | | |
Net investment income1 | | | 0.25 | | | | 0.52 | | | | 0.48 | | | | 0.40 | | | | 0.43 | | | | 0.50 | |
Net realized and unrealized gain (loss) | | | 4.53 | | | | 6.36 | | | | (1.07 | ) | | | 5.68 | | | | 2.31 | | | | (6.60 | ) |
| | | | |
Net increase (decrease) from investment operations | | | 4.78 | | | | 6.88 | | | | (0.59 | ) | | | 6.08 | | | | 2.74 | | | | (6.10 | ) |
| | | | |
Dividends and distributions from: | | | | | | | | | | | | | | | | | | | | | | | | |
Net investment income | | | (0.49 | ) | | | (0.56 | )2 | | | (0.48 | )2 | | | (0.41 | )2 | | | (0.46 | )2 | | | (0.57 | )2 |
Net realized gain | | | (3.79 | ) | | | (1.74 | )2 | | | (0.23 | )2 | | | — | | | | — | | | | (0.46 | )2 |
| | | | |
Total dividends and distributions | | | (4.28 | ) | | | (2.30 | ) | | | (0.71 | ) | | | (0.41 | ) | | | (0.46 | ) | | | (1.03 | ) |
| | | | |
Net asset value, end of period | | $ | 30.72 | | | $ | 30.22 | | | $ | 25.64 | | | $ | 26.94 | | | $ | 21.27 | | | $ | 18.99 | |
| | | | |
| | | | | | | | | | | | | | | | | | | | | | | | |
| Total Investment Return3 | | | | | | | | | | | | | | | | | | | | | | | | |
Based on net asset value | | | 16.39 | %4 | | | 28.67 | % | | | (2.05 | )% | | | 28.76 | % | | | 14.28 | % | | | (23.67 | )% |
| | | | |
| | | | | | | | | | | | | | | | | | | | | | | | |
| Ratios to Average Net Assets5 | | | | | | | | | | | | | | | | | | | | | | | | |
Total expenses | | | 0.53 | %6,7 | | | 0.55 | %6 | | | 0.56 | %6 | | | 0.55 | %6 | | | 0.55 | % | | | 0.58 | % |
| | | | |
Total expenses after fees waived and/or reimbursed | | | 0.53 | %6,7 | | | 0.55 | %6 | | | 0.56 | %6 | | | 0.55 | %6 | | | 0.55 | % | | | 0.58 | % |
| | | | |
Net investment income | | | 1.51 | %6,7 | | | 1.89 | %6 | | | 1.88 | %6 | | | 1.57 | %6 | | | 1.93 | % | | | 2.54 | % |
| | | | |
| | | | | | | | | | | | | | | | | | | | | | | | |
| Supplemental Data | | | | | | | | | | | | | | | | | | | | | | | | |
Net assets, end of period (000) | | $ | 2,331,529 | | | $ | 2,069,166 | | | $ | 2,066,925 | | | $ | 2,552,926 | | | $ | 1,956,794 | | | $ | 1,747,444 | |
| | | | |
Portfolio turnover of the Master LLC | | | 23 | % | | | 53 | % | | | 38 | % | | | 64 | % | | | 48 | % | | | 38 | % |
| | | | |
| | 1 | Based on average shares outstanding. |
| | 2 | Determined in accordance with federal income tax regulations. |
| | 3 | Where applicable, assumes the reinvestment of dividends and distributions. |
| | 4 | Aggregate total investment return. |
| | 5 | Includes the Fund’s share of the Master LLC’s allocated net expenses and/or net investment income. |
| | 6 | Includes the Fund’s share of the Master LLC’s allocated fees waived of less than 0.01%. |
See Notes to Financial Statements.
| | | | | | |
| 10 | | BLACKROCK BASIC VALUE FUND, INC. | | DECEMBER 31, 2013 | | |
| | | | |
| Financial Highlights (continued) | | | BlackRock Basic Value Fund, Inc. | |
| | | | | | | | | | | | | | | | | | | | | | | | |
| | | Investor A | |
| | | Six Months
Ended
December 31,
2013
(Unaudited) | | | Year Ended June 30, | |
| | | 2013 | | | 2012 | | | 2011 | | | 2010 | | | 2009 | |
| Per Share Operating Performance | | | | | | | | | | | | | | | | | | | | | | | | |
Net asset value, beginning of period | | $ | 29.99 | | | $ | 25.45 | | | $ | 26.75 | | | $ | 21.12 | | | $ | 18.86 | | | $ | 25.94 | |
| | | | |
Net investment income1 | | | 0.20 | | | | 0.44 | | | | 0.40 | | | | 0.32 | | | | 0.36 | | | | 0.44 | |
Net realized and unrealized gain (loss) | | | 4.51 | | | | 6.33 | | | | (1.07 | ) | | | 5.64 | | | | 2.30 | | | | (6.56 | ) |
| | | | |
Net increase (decrease) from investment operations | | | 4.71 | | | | 6.77 | | | | (0.67 | ) | | | 5.96 | | | | 2.66 | | | | (6.12 | ) |
| | | | |
Dividends and distributions from: | | | | | | | | | | | | | | | | | | | | | | | | |
Net investment income | | | (0.41 | ) | | | (0.49 | )2 | | | (0.40 | )2 | | | (0.33 | )2 | | | (0.40 | )2 | | | (0.50 | )2 |
Net realized gain | | | (3.79 | ) | | | (1.74 | )2 | | | (0.23 | )2 | | | — | | | | — | | | | (0.46 | )2 |
| | | | |
Total dividends and distributions | | | (4.20 | ) | | | (2.23 | ) | | | (0.63 | ) | | | (0.33 | ) | | | (0.40 | ) | | | (0.96 | ) |
| | | | |
Net asset value, end of period | | $ | 30.50 | | | $ | 29.99 | | | $ | 25.45 | | | $ | 26.75 | | | $ | 21.12 | | | $ | 18.86 | |
| | | | |
| | | | | | | | | | | | | | | | | | | | | | | | |
| Total Investment Return3 | | | | | | | | | | | | | | | | | | | | | | | | |
Based on net asset value | | | 16.24 | %4 | | | 28.35 | % | | | (2.39 | )% | | | 28.36 | % | | | 13.97 | % | | | (23.93 | )% |
| | | | |
| | | | | | | | | | | | | | | | | | | | | | | | |
| Ratios to Average Net Assets5 | | | | | | | | | | | | | | | | | | | | | | | | |
Total expenses | | | 0.81 | %6,7 | | | 0.83 | %6 | | | 0.86 | %6 | | | 0.84 | %6 | | | 0.86 | % | | | 0.89 | % |
| | | | |
Total expenses after fees waived and/or reimbursed | | | 0.81 | %6,7 | | | 0.83 | %6 | | | 0.86 | %6 | | | 0.84 | %6 | | | 0.86 | % | | | 0.89 | % |
| | | | |
Net investment income | | | 1.24 | %6,7 | | | 1.61 | %6 | | | 1.59 | %6 | | | 1.28 | %6 | | | 1.62 | % | | | 2.24 | % |
| | | | |
| | | | | | | | | | | | | | | | | | | | | | | | |
| Supplemental Data | | | | | | | | | | | | | | | | | | | | | | | | |
Net assets, end of period (000) | | $ | 1,729,385 | | | $ | 1,594,656 | | | $ | 1,439,411 | | | $ | 1,652,159 | | | $ | 1,461,423 | | | $ | 1,388,725 | |
| | | | |
Portfolio turnover of the Master LLC | | | 23 | % | | | 53 | % | | | 38 | % | | | 64 | % | | | 48 | % | | | 38 | % |
| | | | |
| | 1 | Based on average shares outstanding. |
| | 2 | Determined in accordance with federal income tax regulations. |
| | 3 | Where applicable, excludes the effects of any sale charges and assumes the reinvestment of dividends and distributions. |
| | 4 | Aggregate total investment return. |
| | 5 | Includes the Fund’s share of the Master LLC’s allocated net expenses and/or net investment income. |
| | 6 | Includes the Fund’s share of the Master LLC’s allocated fees waived of less than 0.01%. |
See Notes to Financial Statements.
| | | | | | |
| | | BLACKROCK BASIC VALUE FUND, INC. | | DECEMBER 31, 2013 | | 11 |
| | | | |
| Financial Highlights (continued) | | | BlackRock Basic Value Fund, Inc. | |
| | | | | | | | | | | | | | | | | | | | | | | | |
| | | Investor B | |
| | | Six Months
Ended
December 31,
2013
(Unaudited) | | | Year Ended June 30, | |
| | | 2013 | | | 2012 | | | 2011 | | | 2010 | | | 2009 | |
| Per Share Operating Performance | | | | | | | | | | | | | | | | | | | | | | | | |
Net asset value, beginning of period | | $ | 29.65 | | | $ | 25.08 | | | $ | 26.27 | | | $ | 20.69 | | | $ | 18.45 | | | $ | 25.30 | |
| | | | |
Net investment income1 | | | 0.01 | | | | 0.15 | | | | 0.14 | | | | 0.08 | | | | 0.16 | | | | 0.26 | |
Net realized and unrealized gain (loss) | | | 4.45 | | | | 6.25 | | | | (1.02 | ) | | | 5.53 | | | | 2.23 | | | | (6.41 | ) |
| | | | |
Net increase (decrease) from investment operations | | | 4.46 | | | | 6.40 | | | | (0.88 | ) | | | 5.61 | | | | 2.39 | | | | (6.15 | ) |
| | | | |
Dividends and distributions from: | | | | | | | | | | | | | | | | | | | | | | | | |
Net investment income | | | — | | | | (0.09 | )2 | | | (0.08 | )2 | | | (0.03 | )2 | | | (0.15 | )2 | | | (0.24 | )2 |
Net realized gain | | | (3.70 | ) | | | (1.74 | )2 | | | (0.23 | )2 | | | — | | | | — | | | | (0.46 | )2 |
| | | | |
Total dividends and distributions | | | (3.70 | ) | | | (1.83 | ) | | | (0.31 | ) | | | (0.03 | ) | | | (0.15 | ) | | | (0.70 | ) |
| | | | |
Net asset value, end of period | | $ | 30.41 | | | $ | 29.65 | | | $ | 25.08 | | | $ | 26.27 | | | $ | 20.69 | | | $ | 18.45 | |
| | | | |
| | | | | | | | | | | | | | | | | | | | | | | | |
| Total Investment Return3 | | | | | | | | | | | | | | | | | | | | | | | | |
Based on net asset value | | | 15.56 | %4 | | | 26.94 | % | | | (3.31 | )% | | | 27.15 | % | | | 12.88 | % | | | (24.60 | )% |
| | | | |
| | | | | | | | | | | | | | | | | | | | | | | | |
| Ratios to Average Net Assets5 | | | | | | | | | | | | | | | | | | | | | | | | |
Total expenses | | | 1.99 | %6,7 | | | 1.92 | %6 | | | 1.87 | %6 | | | 1.81 | %6 | | | 1.79 | % | | | 1.79 | % |
| | | | |
Total expenses after fees waived and/or reimbursed | | | 1.99 | %6,7 | | | 1.92 | %6 | | | 1.86 | %6 | | | 1.81 | %6 | | | 1.79 | % | | | 1.79 | % |
| | | | |
Net investment income | | | 0.08 | %6,7 | | | 0.54 | %6 | | | 0.58 | %6 | | | 0.32 | %6 | | | 0.73 | % | | | 1.34 | % |
| | | | |
| | | | | | | | | | | | | | | | | | | | | | | | |
| Supplemental Data | | | | | | | | | | | | | | | | | | | | | | | | |
Net assets, end of period (000) | | $ | 18,866 | | | $ | 24,282 | | | $ | 41,283 | | | $ | 75,481 | | | $ | 101,508 | | | $ | 168,115 | |
| | | | |
Portfolio turnover of the Master LLC | | | 23 | % | | | 53 | % | | | 38 | % | | | 64 | % | | | 48 | % | | | 38 | % |
| | | | |
| | 1 | Based on average shares outstanding. |
| | 2 | Determined in accordance with federal income tax regulations. |
| | 3 | Where applicable, excludes the effects of any sale charges and assumes the reinvestment of dividends and distributions. |
| | 4 | Aggregate total investment return. |
| | 5 | Includes the Fund’s share of the Master LLC’s allocated net expenses and/or net investment income. |
| | 6 | Includes the Fund’s share of the Master LLC’s allocated fees waived of less than 0.01%. |
See Notes to Financial Statements.
| | | | | | |
| 12 | | BLACKROCK BASIC VALUE FUND, INC. | | DECEMBER 31, 2013 | | |
| | | | |
| Financial Highlights (continued) | | | BlackRock Basic Value Fund, Inc. | |
| | | | | | | | | | | | | | | | | | | | | | | | |
| | | Investor C | |
| | | Six Months
Ended
December 31,
2013
(Unaudited) | | | Year Ended June 30, | |
| | | 2013 | | | 2012 | | | 2011 | | | 2010 | | | 2009 | |
| Per Share Operating Performance | | | | | | | | | | | | | | | | | | | | | | | | |
Net asset value, beginning of period | | $ | 27.89 | | | $ | 23.80 | | | $ | 25.03 | | | $ | 19.78 | | | $ | 17.70 | | | $ | 24.37 | |
| | | | |
Net investment income1 | | | 0.07 | | | | 0.21 | | | | 0.18 | | | | 0.11 | | | | 0.17 | | | | 0.26 | |
Net realized and unrealized gain (loss) | | | 4.18 | | | | 5.89 | | | | (0.99 | ) | | | 5.29 | | | | 2.15 | | | | (6.17 | ) |
| | | | |
Net increase (decrease) from investment operations | | | 4.25 | | | | 6.10 | | | | (0.81 | ) | | | 5.40 | | | | 2.32 | | | | (5.91 | ) |
| | | | |
Dividends and distributions from: | | | | | | | | | | | | | | | | | | | | | | | | |
Net investment income | | | (0.19 | ) | | | (0.27 | )2 | | | (0.19 | )2 | | | (0.15 | )2 | | | (0.24 | )2 | | | (0.30 | )2 |
Net realized gain | | | (3.79 | ) | | | (1.74 | )2 | | | (0.23 | )2 | | | — | | | | — | | | | (0.46 | )2 |
| | | | |
Total dividends and distributions | | | (3.98 | ) | | | (2.01 | ) | | | (0.42 | ) | | | (0.15 | ) | | | (0.24 | ) | | | (0.76 | ) |
| | | | |
Net asset value, end of period | | $ | 28.16 | | | $ | 27.89 | | | $ | 23.80 | | | $ | 25.03 | | | $ | 19.78 | | | $ | 17.70 | |
| | | | |
| | | | | | | | | | | | | | | | | | | | | | | | |
| Total Investment Return3 | | | | | | | | | | | | | | | | | | | | | | | | |
Based on net asset value | | | 15.80 | %4 | | | 27.29 | % | | | (3.16 | )% | | | 27.36 | % | | | 13.01 | % | | | (24.57 | )% |
| | | | |
| | | | | | | | | | | | | | | | | | | | | | | | |
| Ratios to Average Net Assets5 | | | | | | | | | | | | | | | | | | | | | | | | |
Total expenses | | | 1.60 | %6,7 | | | 1.63 | %6 | | | 1.67 | %6 | | | 1.66 | %6 | | | 1.68 | % | | | 1.72 | % |
| | | | |
Total expenses after fees waived and/or reimbursed | | | 1.60 | %6,7 | | | 1.63 | %6 | | | 1.67 | %6 | | | 1.66 | %6 | | | 1.68 | % | | | 1.72 | % |
| | | | |
Net investment income | | | 0.46 | %6,7 | | | 0.81 | %6 | | | 0.77 | %6 | | | 0.46 | %6 | | | 0.80 | % | | | 1.40 | % |
| | | | |
| | | | | | | | | | | | | | | | | | | | | | | | |
| Supplemental Data | | | | | | | | | | | | | | | | | | | | | | | | |
Net assets, end of period (000) | | $ | 434,693 | | | $ | 387,027 | | | $ | 365,319 | | | $ | 465,007 | | | $ | 413,806 | | | $ | 413,576 | |
| | | | |
Portfolio turnover of the Master LLC | | | 23 | % | | | 53 | % | | | 38 | % | | | 64 | % | | | 48 | % | | | 38 | % |
| | | | |
| | 1 | Based on average shares outstanding. |
| | 2 | Determined in accordance with federal income tax regulations. |
| | 3 | Where applicable, excludes the effects of any sale charges and assumes the reinvestment of dividends and distributions. |
| | 4 | Aggregate total investment return. |
| | 5 | Includes the Fund’s share of the Master LLC’s allocated net expenses and/or net investment income. |
| | 6 | Includes the Fund’s share of the Master LLC’s allocated fees waived of less than 0.01%. |
See Notes to Financial Statements.
| | | | | | |
| | | BLACKROCK BASIC VALUE FUND, INC. | | DECEMBER 31, 2013 | | 13 |
| | | | |
| Financial Highlights (concluded) | | | BlackRock Basic Value Fund, Inc. | |
| | | | | | | | | | | | | | | | | | | | | | | | |
| | | Class R | |
| | | Six Months
Ended
December 31,
2013
(Unaudited) | | | Year Ended June 30, | |
| | | 2013 | | | 2012 | | | 2011 | | | 2010 | | | 2009 | |
| Per Share Operating Performance | | | | | | | | | | | | | | | | | | | | | | | | |
Net asset value, beginning of period | | $ | 28.99 | | | $ | 24.63 | | | $ | 25.90 | | | $ | 20.48 | | | $ | 18.31 | | | $ | 25.19 | |
| | | | |
Net investment income1 | | | 0.14 | | | | 0.34 | | | | 0.30 | | | | 0.23 | | | | 0.27 | | | | 0.35 | |
Net realized and unrealized gain (loss) | | | 4.35 | | | | 6.12 | | | | (1.03 | ) | | | 5.46 | | | | 2.23 | | | | (6.37 | ) |
| | | | |
Net increase (decrease) from investment operations | | | 4.49 | | | | 6.46 | | | | (0.73 | ) | | | 5.69 | | | | 2.50 | | | | (6.02 | ) |
| | | | |
Dividends and distributions from: | | | | | | | | | | | | | | | | | | | | | | | | |
Net investment income | | | (0.31 | ) | | | (0.36 | )2 | | | (0.31 | )2 | | | (0.27 | )2 | | | (0.33 | )2 | | | (0.40 | )2 |
Net realized gain | | | (3.79 | ) | | | (1.74 | )2 | | | (0.23 | )2 | | | — | | | | — | | | | (0.46 | )2 |
| | | | |
Total dividends and distributions | | | (4.10 | ) | | | (2.10 | ) | | | (0.54 | ) | | | (0.27 | ) | | | (0.33 | ) | | | (0.86 | ) |
| | | | |
Net asset value, end of period | | $ | 29.38 | | | $ | 28.99 | | | $ | 24.63 | | | $ | 25.90 | | | $ | 20.48 | | | $ | 18.31 | |
| | | | |
| | | | | | | | | | | | | | | | | | | | | | | | |
| Total Investment Return3 | | | | | | | | | | | | | | | | | | | | | | | | |
Based on net asset value | | | 16.06 | %4 | | | 27.92 | % | | | (2.73 | )% | | | 27.89 | % | | | 13.51 | % | | | (24.21 | )% |
| | | | |
| | | | | | | | | | | | | | | | | | | | | | | | |
| Ratios to Average Net Assets5 | | | | | | | | | | | | | | | | | | | | | | | | |
Total expenses | | | 1.13 | %6,7 | | | 1.18 | %6 | | | 1.22 | %6 | | | 1.23 | %6 | | | 1.22 | % | | | 1.29 | % |
| | | | |
Total expenses after fees waived and/or reimbursed | | | 1.13 | %6,7 | | | 1.16 | %6 | | | 1.20 | %6 | | | 1.23 | %6 | | | 1.22 | % | | | 1.29 | % |
| | | | |
Net investment income | | | 0.92 | %6,7 | | | 1.29 | %6 | | | 1.23 | %6 | | | 0.93 | %6 | | | 1.27 | % | | | 1.83 | % |
| | | | |
| | | | | | | | | | | | | | | | | | | | | | | | |
| Supplemental Data | | | | | | | | | | | | | | | | | | | | | | | | |
Net assets, end of period (000) | | $ | 18,607 | | | $ | 16,655 | | | $ | 18,785 | | | $ | 24,155 | | | $ | 19,858 | | | $ | 18,918 | |
| | | | |
Portfolio turnover of the Master LLC | | | 23 | % | | | 53 | % | | | 38 | % | | | 64 | % | | | 48 | % | | | 38 | % |
| | | | |
| | 1 | Based on average shares outstanding. |
| | 2 | Determined in accordance with federal income tax regulations. |
| | 3 | Where applicable, assumes the reinvestment of dividends and distributions. |
| | 4 | Aggregate total investment return. |
| | 5 | Includes the Fund’s share of the Master LLC’s allocated net expenses and/or net investment income. |
| | 6 | Includes the Fund’s share of the Master LLC’s allocated fees waived of less than 0.01%. |
See Notes to Financial Statements.
| | | | | | |
| 14 | | BLACKROCK BASIC VALUE FUND, INC. | | DECEMBER 31, 2013 | | |
| | | | |
| Notes to Financial Statements (Unaudited) | | | BlackRock Basic Value Fund, Inc. | |
1. Organization:
BlackRock Basic Value Fund, Inc. (the “Fund”) is registered under the Investment Company Act of 1940, as amended (the “1940 Act”), as a diversified, open-end management investment company. The Fund is organized as a Maryland corporation. The Fund seeks to achieve its investment objective by investing all of its assets in Master Basic Value LLC (the “Master LLC”), an affiliate of the Fund, which has the same investment objective and strategies as the Fund. The value of the Fund’s investment in the Master LLC reflects the Fund’s proportionate interest in the net assets of the Master LLC. The performance of the Fund is directly affected by the performance of the Master LLC. The percentage of the Master LLC owned by the Fund at December 31, 2013 was 98.7%. As such, the financial statements of the Master LLC, including the Schedule of Investments, are included elsewhere in this report and should be read in conjunction with the Fund’s financial statements.
The Fund offers multiple classes of shares. Institutional Shares are sold without a sales charge and only to certain eligible investors. Investor A Shares are generally sold with an initial sales charge, but may be subject to a CDSC for certain redemptions where no initial sales charge was paid at the time of purchase. Investor B and Investor C Shares may be subject to a CDSC. Class R Shares are sold without a sales charge and only to certain employer-sponsored retirement plans. All classes of shares have identical voting, dividend, liquidation and other rights and are subject to the same terms and conditions, except that Investor A, Investor B, Investor C and Class R Shares bear certain expenses related to the shareholder servicing of such shares, and Investor B, Investor C and Class R Shares also bear certain expenses related to the distribution of such shares. Investor B Shares automatically convert to Investor A Shares after approximately eight years. Investor B Shares are only available through exchanges and dividend reinvestments by current holders and for purchase by certain employer-sponsored retirement plans. Each class has exclusive voting rights with respect to matters relating to its shareholder servicing and distribution expenditures (except that Investor B shareholders may vote on material changes to the Investor A distribution and service plan).
2. Significant Accounting Policies:
The Fund’s financial statements are prepared in conformity with accounting principles generally accepted in the United States of America (“US GAAP”), which may require management to make estimates and assumptions that affect the reported amounts of assets and liabilities in the financial statements and the reported amounts of increases and decreases in net assets from operations during the reporting period. Actual results could differ from those estimates. The following is a summary of significant accounting policies followed by the Fund:
Valuation: US GAAP defines fair value as the price the Fund would receive to sell an asset or pay to transfer a liability in an orderly transaction between market participants at the measurement date. The Fund’s policy is to fair value its financial instruments at market value. The Fund records its investment in the Master LLC at fair value based on the
Fund’s proportionate interest in the net assets of the Master LLC. Valuation of securities held by the Master LLC is discussed in Note 2 of the Master LLC’s Notes to Financial Statements, which are included elsewhere in this report.
Investment Transactions and Investment Income: For financial reporting purposes, contributions to and withdrawals from the Master LLC are accounted on a trade date basis. The Fund records daily its proportionate share of the Master LLC’s income, expenses and realized and unrealized gains and losses. Realized and unrealized gains and losses are adjusted utilizing partnership tax allocation rules. In addition, the Fund accrues its own expenses. Income, expenses and realized and unrealized gains and losses are allocated daily to each class based on its relative net assets.
Dividends and Distributions: Dividends and distributions paid by the Fund are recorded on the ex-dividend dates. The character and timing of dividends and distributions are determined in accordance with federal income tax regulations, which may differ from US GAAP.
Income Taxes: It is the Fund’s policy to comply with the requirements of the Internal Revenue Code of 1986, as amended, applicable to regulated investment companies and to distribute substantially all of its taxable income to its shareholders. Therefore, no federal income tax provision is required.
The Fund files US federal and various state and local tax returns. No income tax returns are currently under examination. The statute of limitations on the Fund’s US federal tax returns remains open for each of the four years ended June 30, 2013. The statutes of limitations on the Fund’s state and local tax returns may remain open for an additional year depending upon the jurisdiction.
Management has analyzed tax laws and regulations and their application to the Fund’s facts and circumstances and does not believe there are any uncertain tax positions that require recognition of a tax liability.
Other: Expenses directly related to the Fund or its classes are charged to the Fund or class. Other operating expenses shared by several funds are pro rated among those funds on the basis of relative net assets or other appropriate methods. Expenses directly related to the Fund and other shared expenses pro rated to the Fund are allocated daily to each class based on its relative net assets or other appropriate methods.
3. Investment Advisory Agreement and Other Transactions with Affiliates:
The PNC Financial Services Group, Inc. is the largest stockholder and an affiliate, for 1940 Act purposes, of BlackRock, Inc. (“BlackRock”).
The Fund entered into an Administration Agreement with the BlackRock Advisors, LLC (the “Administrator”), an indirect, wholly owned subsidiary of BlackRock, to provide administrative services (other than investment advice and related portfolio activities). The Fund pays the Administrator
| | | | | | |
| | | BLACKROCK BASIC VALUE FUND, INC. | | DECEMBER 31, 2013 | | 15 |
| | | | |
| Notes to Financial Statements (continued) | | | BlackRock Basic Value Fund, Inc. | |
no fees pursuant to the agreement. The Fund does not pay an investment advisory fee or investment management fee.
The Fund entered into a Distribution Agreement and a Distribution and Service Plan with BlackRock Investments, LLC (“BRIL”), an affiliate of the Administrator. Pursuant to the Distribution and Service Plan and in accordance with Rule 12b-1 under the 1940 Act, the Fund pays BRIL ongoing service and distribution fees. The fees are accrued daily and paid monthly at annual rates based upon the average daily net assets of the shares of the Fund as follows:
| | | | | | | | |
| | | Service
Fee | | | Distribution
Fee | |
Investor A | | | 0.25 | % | | | — | |
Investor B | | | 0.25 | % | | | 0.75 | % |
Investor C | | | 0.25 | % | | | 0.75 | % |
Class R | | | 0.25 | % | | | 0.25 | % |
Pursuant to sub-agreements with BRIL, broker-dealers and BRIL provide shareholder servicing and distribution services to the Fund. The ongoing service and/or distribution fee compensates BRIL and each broker-dealer for providing shareholder servicing and/or distribution related services to Investor A, Investor B, Investor C and Class R shareholders.
Pursuant to written agreements, certain financial intermediaries, some of which may be affiliates, provide the Fund with sub-accounting, recordkeeping, sub-transfer agency and other administrative services with respect to sub-accounts they service. For these services, these entities receive an asset based fee or an annual fee per shareholder account, which will vary depending on share class and/or net assets. For the six months ended December 31, 2013, the Fund paid the following to affiliates in return for these services, which is included in transfer agent — class specific in the Statement of Operations:
| | | | |
Institutional | | $ | 229,916 | |
Investor A | | $ | 96 | |
The Administrator maintains a call center, which is responsible for providing certain shareholder services to the Fund, such as responding to shareholder inquiries and processing transactions based upon instructions from shareholders with respect to the subscription and redemption of Fund shares. For the six months ended December 31, 2013, the Fund reimbursed the Administrator the following amounts for costs incurred in running the call center, which are included in transfer agent — class specific in the Statement of Operations:
| | | | |
Institutional | | $ | 15,398 | |
Investor A | | $ | 15,935 | |
Investor B | | $ | 903 | |
Investor C | | $ | 2,739 | |
Class R | | $ | 260 | |
The Administrator contractually agreed to waive and/or reimburse fees or expenses in order to limit expenses of Class R Shares to 1.22% of Class R Shares average daily net assets, excluding interest expense, dividend expense, income tax expense, acquired fund fees and expenses and certain other fund expenses, which constitute extraordinary expenses not incurred in the ordinary course of the Fund’s business. The Administrator has agreed not to reduce or discontinue this contractual waiver or reimbursement prior to November 1, 2014 unless approved by the Board, including a majority of the independent directors.
For the six months ended December 31, 2013, affiliates earned underwriting discounts, direct commissions and dealer concessions on sales of the Fund’s Investor A Shares of $65,294.
For the six months ended December 31, 2013, affiliates received CDSCs as follows:
| | | | |
Investor A | | $ | 1,990 | |
Investor B | | $ | 2,716 | |
Investor C | | $ | 8,001 | |
Certain officers and/or directors of the Fund are officers and/or directors of BlackRock or its affiliates. The Fund reimburses the Administrator for a portion of the compensation paid to the Fund’s Chief Compliance Officer, which is included in officer in the Statement of Operations.
4. Income Tax Information:
As of June 30, 2013, the Fund had a capital loss carryforward, subject to annual limitation, available to offset future realized capital gains of $18,912,640, all of which is due to expire June 30, 2017.
| | | | | | |
| 16 | | BLACKROCK BASIC VALUE FUND, INC. | | DECEMBER 31, 2013 | | |
| | | | |
| Notes to Financial Statements (concluded) | | | BlackRock Basic Value Fund, Inc. | |
5. Capital Share Transactions:
Transactions in capital shares for each class were as follows:
| | | | | | | | | | | | | | | | | | |
| | | Six Months Ended
December 31, 2013 | | | | | Year Ended
June 30, 2013 | |
| | | Shares | | | Amount | | | | | Shares | | | Amount | |
Institutional | | | | | | | | | | | | | | | | | | |
Shares sold | | | 10,178,155 | | | $ | 334,070,778 | | | | | | 16,994,597 | | | $ | 478,200,942 | |
Shares issued in reinvestment of dividends and distributions | | | 8,929,415 | | | | 263,684,657 | | | | | | 5,857,925 | | | | 147,326,302 | |
Shares redeemed | | | (11,690,419 | ) | | | (381,568,755 | ) | | | | | (35,001,859 | ) | | | (959,508,676 | ) |
| | | | | | | | | | |
Net increase (decrease) | | | 7,417,151 | | | $ | 216,186,680 | | | | | | (12,149,337 | ) | | $ | (333,981,432 | ) |
| | | | | | | | | | |
| | | | | | | | | | | | | | | | | | |
Investor A | | | | | | | | | | | | | | | | | | |
Shares sold and automatic conversion of shares | | | 3,385,762 | | | $ | 108,308,738 | | | | | | 6,949,426 | | | $ | 190,442,306 | |
Shares issued in reinvestment of dividends and distributions | | | 6,542,336 | | | | 191,818,553 | | | | | | 4,298,019 | | | | 107,405,885 | |
Shares redeemed | | | (6,394,811 | ) | | | (202,767,831 | ) | | | | | (14,621,283 | ) | | | (401,765,648 | ) |
| | | | | | | | | | |
Net increase (decrease) | | | 3,533,287 | | | $ | 97,359,460 | | | | | | (3,373,838 | ) | | $ | (103,917,457 | ) |
| | | | | | | | | | |
| | | | | | | | | | | | | | | | | | |
Investor B | | | | | | | | | | | | | | | | | | |
Shares sold | | | 28,065 | | | $ | 888,146 | | | | | | 102,235 | | | $ | 2,759,615 | |
Shares issued in reinvestment of dividends and distributions | | | 63,395 | | | | 1,854,287 | | | | | | 76,373 | | | | 1,897,875 | |
Shares redeemed and automatic conversion of shares | | | (289,994 | ) | | | (9,063,295 | ) | | | | | (1,005,726 | ) | | | (26,961,449 | ) |
| | | | | | | | | | |
Net decrease | | | (198,534 | ) | | $ | (6,320,862 | ) | | | | | (827,118 | ) | | $ | (22,303,959 | ) |
| | | | | | | | | | |
| | | | | | | | | | | | | | | | | | |
Investor C | | | | | | | | | | | | | | | | | | |
Shares sold | | | 1,007,731 | | | $ | 29,813,513 | | | | | | 1,200,080 | | | $ | 31,022,005 | |
Shares issued in reinvestment of dividends and distributions | | | 1,751,728 | | | | 47,435,058 | | | | | | 1,020,527 | | | | 23,828,536 | |
Shares redeemed | | | (1,196,322 | ) | | | (35,252,085 | ) | | | | | (3,694,271 | ) | | | (93,989,310 | ) |
| | | | | | | | | | |
Net increase (decrease) | | | 1,563,137 | | | $ | 41,996,486 | | | | | | (1,473,664 | ) | | $ | (39,138,769 | ) |
| | | | | | | | | | |
| | | | | | | | | | | | | | | | | | |
Class R | | | | | | | | | | | | | | | | | | |
Shares sold | | | 93,148 | | | $ | 2,873,873 | | | | | | 212,037 | | | $ | 5,651,992 | |
Shares issued in reinvestment of dividends and distributions | | | 79,698 | | | | 2,251,455 | | | | | | 57,241 | | | | 1,385,218 | |
Shares redeemed | | | (114,013 | ) | | | (3,542,691 | ) | | | | | (457,387 | ) | | | (11,954,950 | ) |
| | | | | | | | | | |
Net increase (decrease) | | | 58,833 | | | $ | 1,582,637 | | | | | | (188,109 | ) | | $ | (4,917,740 | ) |
| | | | | | | | | | |
Total Net Increase (Decrease) | | | 12,373,874 | | | $ | 350,804,401 | | | | | | (18,012,066 | ) | | $ | (504,259,357 | ) |
| | | | | | | | | | |
6. Subsequent Events:
Management has evaluated the impact of all subsequent events on the Fund through the date the financial statements were issued and has determined that there were no subsequent events requiring adjustment or additional disclosure in the financial statements.
| | | | | | |
| | | BLACKROCK BASIC VALUE FUND, INC. | | DECEMBER 31, 2013 | | 17 |
| | | | |
| Master LLC Portfolio Information | �� | | Master Basic Value LLC | |
| | |
| Ten Largest Holdings | | Percent of
Long-Term Investments |
| | | | |
JPMorgan Chase & Co. | | | 4 | % |
Citigroup, Inc. | | | 4 | |
Exxon Mobil Corp. | | | 4 | |
Pfizer, Inc. | | | 3 | |
Marathon Oil Corp. | | | 3 | |
Medtronic, Inc. | | | 3 | |
Cisco Systems, Inc. | | | 3 | |
Wells Fargo & Co. | | | 3 | |
Viacom, Inc., Class B | | | 2 | |
Microsoft Corp. | | | 2 | |
| | |
| Sector Allocation | | Percent of Long-Term Investments |
| | | | |
Financials | | | 31 | % |
Health Care | | | 17 | |
Energy | | | 17 | |
Consumer Discretionary | | | 11 | |
Information Technology | | | 10 | |
Industrials | | | 5 | |
Consumer Staples | | | 4 | |
Utilities | | | 3 | |
Materials | | | 2 | |
For Master LLC compliance purposes, the Master LLC’s sector classifications refer to any one or more of the sector sub-classifications used by one or more widely recognized market indexes or ratings group indexes, and/or as defined by the investment advisor. These definitions may not apply for purposes of this report, which may combine such sector sub-classifications for reporting ease.
| | | | | | |
| 18 | | BLACKROCK BASIC VALUE FUND, INC. | | DECEMBER 31, 2013 | | |
| | | | |
| Schedule of Investments December 31, 2013 (Unaudited) | | | Master Basic Value LLC | |
| | | (Percentages shown are based on Net Assets) | |
| | | | | | | | |
| Common Stocks | | Shares | | | Value | |
Aerospace & Defense — 3.9% | | | | | | | | |
The Boeing Co. | | | 176,000 | | | $ | 24,022,240 | |
Honeywell International, Inc. | | | 523,855 | | | | 47,864,631 | |
Northrop Grumman Corp. | | | 533,623 | | | | 61,158,532 | |
Raytheon Co. | | | 521,004 | | | | 47,255,063 | |
| | | | | | | | |
| | | | | | | | 180,300,466 | |
Airlines — 0.4% | | | | | | | | |
Delta Air Lines, Inc. | | | 652,585 | | | | 17,926,510 | |
Auto Components — 1.9% | | | | | | | | |
Lear Corp. | | | 802,725 | | | | 64,996,643 | |
TRW Automotive Holdings Corp. (a) | | | 276,674 | | | | 20,581,779 | |
| | | | | | | | |
| | | | | | | | 85,578,422 | |
Automobiles — 1.9% | | | | | | | | |
Ford Motor Co. | | | 780,973 | | | | 12,050,413 | |
General Motors Co. (a) | | | 1,831,979 | | | | 74,872,982 | |
| | | | | | | | |
| | | | | | | | 86,923,395 | |
Capital Markets — 1.0% | | | | | | | | |
Morgan Stanley | | | 921,000 | | | | 28,882,560 | |
State Street Corp. | | | 210,782 | | | | 15,469,291 | |
| | | | | | | | |
| | | | | | | | 44,351,851 | |
Chemicals — 2.0% | | | | | | | | |
AKZO Nobel NV — ADR | | | 1,253,200 | | | | 32,420,284 | |
Ashland, Inc. | | | 243,000 | | | | 23,580,720 | |
Celanese Corp., Series A | | | 8,100 | | | | 448,011 | |
LyondellBasell Industries NV, Class A | | | 420,900 | | | | 33,789,852 | |
| | | | | | | | |
| | | | | | | | 90,238,867 | |
Commercial Banks — 3.8% | | | | | | | | |
Regions Financial Corp. | | | 4,035,514 | | | | 39,911,233 | |
U.S. Bancorp | | | 514,475 | | | | 20,784,790 | |
Wells Fargo & Co. | | | 2,548,824 | | | | 115,716,610 | |
| | | | | | | | |
| | | | | | | | 176,412,633 | |
Communications Equipment — 3.6% | | | | | | | | |
Cisco Systems, Inc. | | | 5,749,560 | | | | 129,077,622 | |
Telefonaktiebolaget LM Ericsson — ADR | | | 2,824,500 | | | | 34,571,880 | |
| | | | | | | | |
| | | | | | | | 163,649,502 | |
Computers & Peripherals — 0.1% | | | | | | | | |
Apple Inc. | | | 8,300 | | | | 4,657,213 | |
Consumer Finance — 4.3% | | | | | | | | |
Capital One Financial Corp. | | | 1,328,288 | | | | 101,760,144 | |
Discover Financial Services | | | 1,736,355 | | | | 97,149,062 | |
| | | | | | | | |
| | | | | | | | 198,909,206 | |
Diversified Financial Services — 9.6% | | | | | | | | |
Citigroup, Inc. | | | 3,580,641 | | | | 186,587,202 | |
JPMorgan Chase & Co. | | | 3,336,224 | | | | 195,102,380 | |
The NASDAQ OMX Group, Inc. | | | 1,523,807 | | | | 60,647,519 | |
| | | | | | | | |
| | | | | | | | 442,337,101 | |
| | | | | | | | |
Common Stocks | | | Shares | | | | Value | |
Electric Utilities — 0.4% | | | | | |
Edison International | | | 408,520 | | | $ | 18,914,476 | |
Electronic Equipment, Instruments & Components — 0.4% | |
Corning, Inc. | | | 998,150 | | | | 17,787,033 | |
Energy Equipment & Services — 0.5% | |
Halliburton Co. | | | 459,394 | | | | 23,314,245 | |
Food & Staples Retailing — 2.5% | |
CVS Caremark Corp. | | | 312,900 | | | | 22,394,253 | |
The Kroger Co. | | | 2,136,675 | | | | 84,462,763 | |
Walgreen Co. | | | 139,175 | | | | 7,994,212 | |
| | | | | | | | |
| | | | | | | | 114,851,228 | |
Gas Utilities — 0.7% | |
UGI Corp. | | | 798,756 | | | | 33,116,424 | |
Health Care Equipment & Supplies — 7.3% | |
Baxter International, Inc. | | | 99,000 | | | | 6,885,450 | |
Hologic, Inc. (a) | | | 259,100 | | | | 5,790,885 | |
Medtronic, Inc. | | | 2,367,406 | | | | 135,865,430 | |
St. Jude Medical, Inc. | | | 1,509,161 | | | | 93,492,524 | |
Zimmer Holdings, Inc. | | | 973,156 | | | | 90,688,408 | |
| | | | | | | | |
| | | | | | | | 332,722,697 | |
Health Care Providers & Services — 0.7% | |
Quest Diagnostics, Inc. | | | 584,400 | | | | 31,288,776 | |
Household Durables — 1.5% | |
Garmin Ltd. | | | 123,730 | | | | 5,718,801 | |
Newell Rubbermaid, Inc. | | | 1,959,802 | | | | 63,517,183 | |
| | | | | | | | |
| | | | | | | | 69,235,984 | |
Household Products — 1.3% | |
Energizer Holdings, Inc. | | | 555,739 | | | | 60,153,189 | |
Kimberly-Clark Corp. | | | 8,727 | | | | 911,622 | |
| | | | | | | | |
| | | | | | | | 61,064,811 | |
Independent Power Producers & Energy Traders — 1.8% | |
AES Corp. | | | 5,744,200 | | | | 83,348,342 | |
Industrial Conglomerates — 1.0% | |
General Electric Co. | | | 1,593,546 | | | | 44,667,094 | |
Insurance — 11.4% | |
ACE Ltd. | | | 602,873 | | | | 62,415,442 | |
Aflac, Inc. | | | 860,903 | | | | 57,508,320 | |
Genworth Financial, Inc., Class A (a) | | | 3,922,300 | | | | 60,913,319 | |
Hartford Financial Services Group, Inc. | | | 1,942,523 | | | | 70,377,608 | |
Lincoln National Corp. | | | 1,242,251 | | | | 64,124,997 | |
MetLife, Inc. | | | 423,216 | | | | 22,819,807 | |
PartnerRe Ltd. | | | 43,680 | | | | 4,605,182 | |
Prudential Financial, Inc. | | | 844,653 | | | | 77,893,900 | |
The Travelers Cos., Inc. | | | 632,025 | | | | 57,223,543 | |
XL Group PLC | | | 1,360,713 | | | | 43,325,102 | |
| | | | | | | | |
| | | | | | | | 521,207,220 | |
| | |
| ADR | | American Depositary Receipts |
See Notes to Financial Statements.
| | | | | | |
| | | BLACKROCK BASIC VALUE FUND, INC. | | DECEMBER 31, 2013 | | 19 |
| | | | |
| Schedule of Investments (continued) | | | Master Basic Value LLC | |
| | | (Percentages shown are based on Net Assets) | |
| | | | | | | | |
| Common Stocks | | Shares | | | Value | |
IT Services — 0.9% | | | | | | | | |
The Western Union Co. | | | 2,510,619 | | | $ | 43,308,178 | |
Machinery — 0.1% | | | | | | | | |
Stanley Black & Decker, Inc. (a) | | | 31,000 | | | | 3,199,200 | |
Media — 4.5% | | | | | | | | |
Comcast Corp., Special Class A | | | 749,387 | | | | 37,379,424 | |
Time Warner, Inc. | | | 854,694 | | | | 59,589,266 | |
Viacom, Inc., Class B | | | 1,260,251 | | | | 110,070,322 | |
| | | | | | | | |
| | | | | | | | 207,039,012 | |
Metals & Mining — 0.3% | | | | | | | | |
Reliance Steel & Aluminum Co. | | | 201,300 | | | | 15,266,592 | |
Multiline Retail — 0.7% | | | | | | | | |
Kohl’s Corp. | | | 485,168 | | | | 27,533,284 | |
Macy’s, Inc. | | | 86,800 | | | | 4,635,120 | |
| | | | | | | | |
| | | | | | | | 32,168,404 | |
Office Electronics — 0.7% | | | | | | | | |
Xerox Corp. | | | 2,643,100 | | | | 32,166,527 | |
Oil, Gas & Consumable Fuels — 16.1% | |
Apache Corp. | | | 501,896 | | | | 43,132,942 | |
Cobalt International Energy, Inc. (a) | | | 2,088,200 | | | | 34,350,890 | |
Exxon Mobil Corp. | | | 1,626,744 | | | | 164,626,493 | |
Gulfport Energy Corp. (a) | | | 790,700 | | | | 49,932,705 | |
Marathon Oil Corp. | | | 4,297,483 | | | | 151,701,150 | |
Marathon Petroleum Corp. | | | 853,766 | | | | 78,315,955 | |
Phillips 66 | | | 174,700 | | | | 13,474,611 | |
Suncor Energy, Inc. | | | 1,844,100 | | | | 64,635,705 | |
Total SA — ADR | | | 1,050,240 | | | | 64,348,205 | |
Valero Energy Corp. | | | 1,437,250 | | | | 72,437,400 | |
| | | | | | | | |
| | | | | | | | 736,956,056 | |
Paper & Forest Products — 0.0% | | | | | | | | |
International Paper Co. | | | 30,800 | | | | 1,510,124 | |
Pharmaceuticals — 9.1% | | | | | | | | |
AstraZeneca PLC — ADR | | | 1,360,700 | | | | 80,784,759 | |
Eli Lilly & Co. | | | 1,795,700 | | | | 91,580,700 | |
Hospira, Inc. (a)(b) | | | 390,991 | | | | 16,140,108 | |
Johnson & Johnson | | | 380,100 | | | | 34,813,359 | |
Merck & Co., Inc. | | | 129,200 | | | | 6,466,460 | |
| | | | | | | | |
| Common Stocks | | Shares | | | Value | |
Pharmaceuticals (concluded) | | | | | | | | |
Pfizer, Inc. | | | 5,115,625 | | | $ | 156,691,594 | |
Teva Pharmaceutical Industries Ltd. — ADR | | | 804,200 | | | | 32,232,336 | |
| | | | | | | | |
| | | | | | | | 418,709,316 | |
Real Estate Management & Development — 0.9% | |
CBRE Group, Inc., Class A (a) | | | 337,100 | | | | 8,865,730 | |
Jones Lang LaSalle, Inc. | | | 327,000 | | | | 33,481,530 | |
| | | | | | | | |
| | | | | | | | 42,347,260 | |
Semiconductors & Semiconductor Equipment — 0.6% | |
KLA-Tencor Corp. | | | 51,100 | | | | 3,293,906 | |
Teradyne, Inc. (a)(b) | | | 1,320,400 | | | | 23,265,448 | |
| | | | | | | | |
| | | | | | | | 26,559,354 | |
Software — 3.8% | | | | | | | | |
Microsoft Corp. | | | 2,850,401 | | | | 106,690,509 | |
Oracle Corp. | | | 948,587 | | | | 36,292,939 | |
Symantec Corp. | | | 1,385,700 | | | | 32,674,806 | |
| | | | | | | | |
| | | | | | | | 175,658,254 | |
Total Long-Term Investments (Cost — $3,091,180,386) — 99.7% | | | | 4,577,691,773 | |
| | | | | | | | |
| Short-Term Securities | | | | | | |
BlackRock Liquidity Funds, TempFund, Institutional Class, 0.03% (c)(d) | | | 689,278 | | | | 689,278 | |
| | |
| | | Beneficial
Interest
(000) | | | | |
BlackRock Liquidity Series, LLC, Money Market Series, 0.19% (c)(d)(e) | | $ | 24,191 | | | | 24,191,049 | |
Total Short-Term Securities (Cost — $24,880,327) — 0.5% | | | | | | | 24,880,327 | |
Total Investments (Cost — $3,116,060,713*) — 100.2% | | | | 4,602,572,100 | |
Liabilities in Excess of Other Assets — (0.2)% | | | | (9,402,395 | ) |
| | | | | | | | |
Net Assets — 100.0% | | | $ | 4,593,169,705 | |
| | | | | | | | |
|
| Notes to Schedule of Investments |
| * | As of December 31, 2013, gross unrealized appreciation and depreciation based on cost for federal income tax purposes were as follows: |
| | | | |
Tax cost | | $ | 3,162,031,566 | |
| | | | |
Gross unrealized appreciation | | $ | 1,454,375,796 | |
Gross unrealized depreciation | | | (13,835,262 | ) |
| | | | |
Net unrealized appreciation | | $ | 1,440,540,534 | |
| | | | |
See Notes to Financial Statements.
| | | | | | |
| 20 | | BLACKROCK BASIC VALUE FUND, INC. | | DECEMBER 31, 2013 | | |
| | | | |
| Schedule of Investments (concluded) | | | Master Basic Value LLC | |
| (a) | Non-income producing security. |
| (b) | Security, or a portion of security, is on loan. |
| (c) | Investments in issuers considered to be an affiliate of the Master LLC during the period ended December 31, 2013, for purposes of Section 2(a)(3) of the Investment Company Act of 1940, as amended, were as follows: |
| | | | | | | | | | | | | | | | |
| Affiliate | | Shares/
Beneficial
Interest Held at
June 30, 2013 | | | Net Activity | | | Shares/ Beneficial Interest Held at
December 31, 2013 | | | Income | |
BlackRock Liquidity Funds, TempFund, Institutional Class | | | 19,946,821 | | | | (19,257,543 | ) | | | 689,278 | | | $ | 13,110 | |
BlackRock Liquidity Series, LLC, Money Market Series | | $ | 55,675,507 | | | $ | (31,484,458 | ) | | $ | 24,191,049 | | | $ | 22,536 | |
| (d) | Represents the current yield as of report date. |
| (e) | Security was purchased with the cash collateral from loaned securities. The Master LLC may withdraw up to 25% of its investment daily, although the manager of the BlackRock Liquidity Series, LLC, Money Market Series, in its sole discretion, may permit an investor to withdraw more than 25% on any one day. |
| Ÿ | | For Master LLC compliance purposes, the Master LLC’s industry classifications refer to any one or more of the industry sub-classifications used by one or more widely recognized market indexes or ratings group indexes, and/or as defined by the investment advisor. These definitions may not apply for purposes of this report, which may combine such industry sub-classifications for reporting ease. |
| Ÿ | | Fair Value Measurements — Various inputs are used in determining the fair value of investments. These inputs to valuation techniques are categorized into a disclosure hierarchy consisting of three broad levels for financial statement purposes as follows: |
| | Ÿ | | Level 1 — unadjusted price quotations in active markets/exchanges for identical assets or liabilities that the Master LLC has the ability to access |
| | Ÿ | | Level 2 — other observable inputs (including, but not limited to, quoted prices for similar assets or liabilities in markets that are active, quoted prices for identical or similar assets or liabilities in markets that are not active, inputs other than quoted prices that are observable for the assets or liabilities (such as interest rates, yield curves, volatilities, prepayment speeds, loss severities, credit risks and default rates) or other market–corroborated inputs) |
| | Ÿ | | Level 3 — unobservable inputs based on the best information available in the circumstances, to the extent observable inputs are not available (including the Master LLC’s own assumptions used in determining the fair value of investments) |
The hierarchy gives the highest priority to unadjusted quoted prices in active markets for identical assets or liabilities (Level 1 measurements) and the lowest priority to unobservable inputs (Level 3 measurements). Accordingly, the degree of judgment exercised in determining fair value is greatest for instruments categorized in Level 3. The inputs used to measure fair value may fall into different levels of the fair value hierarchy. In such cases, for disclosure purposes, the fair value hierarchy classification is determined based on the lowest level input that is significant to the fair value measurement in its entirety.
Changes in valuation techniques may result in transfers into or out of an assigned level within the disclosure hierarchy. In accordance with the Master LLC’s policy, transfers between different levels of the fair value disclosure hierarchy are deemed to have occurred as of the beginning of the reporting period. The categorization of a value determined for investments is based on the pricing transparency of the investment and is not necessarily an indication of the risks associated with investing in those securities. For information about the Master LLC’s policy regarding valuation of investments, please refer to Note 2 of the Notes to Financial Statements.
The following table summarizes the Master LLC’s investments categorized in the disclosure hierarchy as of December 31, 2013:
| | | | | | | | | | | | | | | | |
| | | Level 1 | | | Level 2 | | | Level 3 | | | Total | |
Assets: | | | | | | | | | | | | | | | | |
Investments: | | | | | | | | | | | | | | | | |
Long-Term Investments1 | | $ | 4,577,691,773 | | | | — | | | | — | | | $ | 4,577,691,773 | |
Short-Term Securities | | | 689,278 | | | $ | 24,191,049 | | | | — | | | | 24,880,327 | |
Total | | $ | 4,578,381,051 | | | $ | 24,191,049 | | | | — | | | $ | 4,602,572,100 | |
| | | | |
1 See above Schedule of Investments for values in each industry. | | | | | | | | | | | | | | | | |
|
The carrying amount for certain of the Master LLC’s liabilities approximates fair value for financial statement purposes. As of December 31, 2013, such liabilities are categorized within the disclosure hierarchy as follows: | |
| | | Level 1 | | | Level 2 | | | Level 3 | | | Total | |
Liabilities: | | | | | | | | | | | | | | | | |
Bank overdraft | | | — | | | $ | (68,898 | ) | | | — | | | $ | (68,898 | ) |
Collateral on securities loaned at value | | | — | | | | (24,191,049 | ) | | | — | | | | (24,191,049 | ) |
Total | | | — | | | $ | (24,259,947 | ) | | | — | | | $ | (24,259,947 | ) |
| | | | |
There were no transfers between levels during the six months ended December 31, 2013.
See Notes to Financial Statements.
| | | | | | |
| | | BLACKROCK BASIC VALUE FUND, INC. | | DECEMBER 31, 2013 | | 21 |
| | | | |
| Statement of Assets and Liabilities | | | Master Basic Value LLC | |
| | | | |
| December 31, 2013 (Unaudited) | | | |
| | | | |
| Assets | | | | |
Investments at value — unaffiliated (including securities loaned at value of $23,660,392) (cost — $3,091,180,386) | | $ | 4,577,691,773 | |
Investments at value — affiliated (cost — $24,880,327) | | | 24,880,327 | |
Investments sold receivable | | | 42,962,777 | |
Dividends receivable — unaffiliated | | | 4,243,643 | �� |
Dividends receivable — affiliated | | | 1,112 | |
Income receivable — affiliated | | | 9,730 | |
Securities lending income receivable — affiliated | | | 4,148 | |
Prepaid expenses | | | 68,645 | |
| | | | |
Total assets | | | 4,649,862,155 | |
| | | | |
| | | | |
| Liabilities | | | | |
Bank overdraft | | | 68,898 | |
Collateral on securities loaned at value | | | 24,191,049 | |
Investments purchased payable | | | 22,355,464 | |
Withdrawals payable to investors | | | 8,313,255 | |
Investment advisory fees payable | | | 1,572,543 | |
Directors’ fees payable | | | 20,943 | |
Other affiliates payable | | | 10,940 | |
Other accrued expenses payable | | | 159,358 | |
| | | | |
Total liabilities | | | 56,692,450 | |
| | | | |
Net Assets | | $ | 4,593,169,705 | |
| | | | |
| | | | |
| Net Assets Consist of | | | | |
Investors’ capital | | $ | 3,106,658,318 | |
Net unrealized appreciation/depreciation | | | 1,486,511,387 | |
| | | | |
Net Assets | | $ | 4,593,169,705 | |
| | | | |
See Notes to Financial Statements.
| | | | | | |
| 22 | | BLACKROCK BASIC VALUE FUND, INC. | | DECEMBER 31, 2013 | | |
| | | | |
| Statement of Operations | | | Master Basic Value LLC | |
| | | | |
| Six Months Ended December 31, 2013 (Unaudited) | | | |
| | | | |
| Investment Income | | | | |
Dividends — unaffiliated | | $ | 45,953,866 | |
Foreign taxes withheld | | | (630,121 | ) |
Securities lending — affiliated — net | | | 22,536 | |
Dividends — affiliated | | | 13,110 | |
Other income — affiliated | | | 9,730 | |
| | | | |
Total income | | | 45,369,121 | |
| | | | |
| | | | |
| Expenses | | | | |
Investment advisory | | | 9,011,262 | |
Accounting services | | | 272,931 | |
Custodian | | | 96,968 | |
Directors | | | 38,995 | |
Professional | | | 39,508 | |
Printing | | | 2,568 | |
Miscellaneous | | | 30,217 | |
| | | | |
Total expenses | | | 9,492,449 | |
Less fees waived by Manager | | | (23,199 | ) |
| | | | |
Total expenses after fees waived | | | 9,469,250 | |
| | | | |
Net investment income | | | 35,899,871 | |
| | | | |
| | | | |
| Realized and Unrealized Gain | | | | |
Net realized gain from investments | | | 278,187,666 | |
Net change in unrealized appreciation/depreciation on investments | | | 352,064,848 | |
| | | | |
Total realized and unrealized gain | | | 630,252,514 | |
| | | | |
Net Increase in Net Assets Resulting from Operations | | $ | 666,152,385 | |
| | | | |
See Notes to Financial Statements.
| | | | | | |
| | | BLACKROCK BASIC VALUE FUND, INC. | | DECEMBER 31, 2013 | | 23 |
| | | | |
| Statements of Changes in Net Assets | | | Master Basic Value LLC | |
| | | | | | | | |
| Increase in Net Assets: | | Six Months
Ended December 31, 2013 (Unaudited) | | | Year Ended
June 30, 2013 | |
| | | | | | | | |
| Operations | | | | | | | | |
Net investment income | | $ | 35,899,871 | | | $ | 78,934,144 | |
Net realized gain | | | 278,187,666 | | | | 561,027,997 | |
Net change in unrealized appreciation/depreciation | | | 352,064,848 | | | | 358,066,797 | |
| | | | |
Net increase in net assets resulting from operations | | | 666,152,385 | | | | 998,028,938 | |
| | | | |
| | | | | | | | |
| Capital Transactions | | | | | | | | |
Proceeds from contributions | | | 488,672,582 | | | | 921,898,797 | |
Value of withdrawals | | | (703,535,484 | ) | | | (1,743,459,924 | ) |
| | | | |
Net decrease in net assets derived from capital transactions | | | (214,862,902 | ) | | | (821,561,127 | ) |
| | | | |
| | | | | | | | |
| Net Assets | | | | | | | | |
Total increase in net assets | | | 451,289,483 | | | | 176,467,811 | |
Beginning of period | | | 4,141,880,222 | | | | 3,965,412,411 | |
| | | | |
End of period | | $ | 4,593,169,705 | | | $ | 4,141,880,222 | |
| | | | |
| | | | |
| Financial Highlights | | | Master Basic Value LLC | |
| | | | | | | | | | | | | | | | | | | | | | | | |
| | | Six Months Ended December 31, 2013 (Unaudited) | | | Year Ended June 30, | |
| | | 2013 | | | 2012 | | | 2011 | | | 2010 | | | 2009 | |
| | | | | | | | | | | | | | | | | | | | | | | | |
| Total Investment Return | | | | | | | | | | | | | | | | | | | | | | | | |
Total investment return | | | 16.45 | %1 | | | 28.81 | % | | | (1.95 | )% | | | 28.91 | % | | | 14.40 | % | | | (23.55 | )% |
| | | | |
| | | | | | | | | | | | | | | | | | | | | | | | |
| Ratios to Average Net Assets | | | | | | | | | | | | | | | | | | | | | | | | |
Total expenses | | | 0.43 | %2 | | | 0.43 | % | | | 0.44 | % | | | 0.43 | % | | | 0.43 | % | | | 0.44 | % |
| | | | |
Total expenses after fees waived | | | 0.43 | %2 | | | 0.43 | % | | | 0.44 | % | | | 0.43 | % | | | 0.43 | % | | | 0.44 | % |
| | | | |
Net investment income | | | 1.62 | %2 | | | 2.01 | % | | | 2.00 | % | | | 1.69 | % | | | 2.05 | % | | | 2.69 | % |
| | | | |
| | | | | | | | | | | | | | | | | | | | | | | | |
| Supplemental Data | | | | | | | | | | | | | | | | | | | | | | | | |
Net assets, end of period (000) | | $ | 4,593,170 | | | $ | 4,141,880 | | | $ | 3,965,412 | | | $ | 4,800,622 | | | $ | 3,966,370 | | | $ | 3,744,860 | |
| | | | |
Portfolio turnover | | | 23 | % | | | 53 | % | | | 38 | % | | | 64 | % | | | 48 | % | | | 38 | % |
| | | | |
| | 1 | Aggregate total investment return. |
See Notes to Financial Statements.
| | | | | | |
| 24 | | BLACKROCK BASIC VALUE FUND, INC. | | DECEMBER 31, 2013 | | |
| | | | |
| Notes to Financial Statements (Unaudited) | | | Master Basic Value LLC | |
1. Organization:
Master Basic Value LLC (the “Master LLC”) is registered under the Investment Company Act of 1940, as amended (the “1940 Act”), as a diversified, open-end management investment company. The Master LLC is organized as a Delaware limited liability company. The Limited Liability Company Agreement permits the Board of Directors of the Master LLC (the “Board”) to issue non-transferable interests in the Master LLC, subject to certain limitations.
2. Significant Accounting Policies:
The Master LLC’s financial statements are prepared in conformity with accounting principles generally accepted in the United States of America (“US GAAP”), which may require management to make estimates and assumptions that affect the reported amounts of assets and liabilities in the financial statements and the reported amounts of increases and decreases in net assets from operations during the reporting period. Actual results could differ from those estimates. The following is a summary of significant accounting policies followed by the Master LLC:
Valuation: US GAAP defines fair value as the price the Master LLC would receive to sell an asset or pay to transfer a liability in an orderly transaction between market participants at the measurement date. The Master LLC determines the fair values of its financial instruments at market value using independent dealers or pricing services under policies approved by the Board. The BlackRock Global Valuation Methodologies Committee (the “Global Valuation Committee”) is the committee formed by management to develop global pricing policies and procedures and to provide oversight of the pricing function for the Master LLC for all financial instruments.
Equity investments traded on a recognized securities exchange or the NASDAQ Stock Market (“NASDAQ”) are valued at the last reported sale price that day or the NASDAQ official closing price, if applicable. For equity investments traded on more than one exchange, the last reported sale price on the exchange where the stock is primarily traded is used. Equity investments traded on a recognized exchange for which there were no sales on that day are valued at the last available bid (long positions) or ask (short positions) price. Investments in open-end registered investment companies are valued at NAV each business day.
The Master LLC values its investment in BlackRock Liquidity Series, LLC, Money Market Series (the “Money Market Series”) at fair value, which is ordinarily based upon its pro rata ownership in the underlying fund’s net assets. The Money Market Series seeks current income consistent with maintaining liquidity and preserving capital. Although the Money Market Series is not registered under the 1940 Act, its investments will follow the parameters of investments by a money market fund that is subject to Rule 2a-7 under the 1940 Act. The Master LLC may withdraw up to 25% of its investment daily, although the manager of the Money Market Series, in its sole discretion, may permit an investor to withdraw more than 25% on any one day.
In the event that application of these methods of valuation results in a price for an investment that is deemed not to be representative of the market value of such investment, or if a price is not available, the investment will be valued by the Global Valuation Committee, or its delegate, in accordance with a policy approved by the Board as reflecting fair value (“Fair Value Assets”). When determining the price for Fair Value Assets, the Global Valuation Committee, or its delegate, seeks to determine the price that the Master LLC might reasonably expect to receive from the current sale of that asset in an arm’s-length transaction. Fair value determinations shall be based upon all available factors that the Global Valuation Committee, or its delegate, deem relevant consistent with the principles of fair value measurement, which include the market approach, income approach and/or in the case of recent investments, the cost approach, as appropriate. The market approach generally consists of using comparable market transactions. The income approach generally is used to discount future cash flows to present value and is adjusted for liquidity as appropriate. These factors include but are not limited to: (i) attributes specific to the investment or asset; (ii) the principal market for the investment or asset; (iii) the customary participants in the principal market for the investment or asset; (iv) data assumptions by market participants for the investment or asset, if reasonably available; (v) quoted prices for similar investments or assets in active markets; and (vi) other factors, such as future cash flows, interest rates, yield curves, volatilities, prepayment speeds, loss severities, credit risks, recovery rates, liquidation amounts and/or default rates. Due to the inherent uncertainty of valuations of such investments, the fair values may differ from the values that would have been used had an active market existed. The Global Valuation Committee, or its delegate, employs various methods for calibrating valuation approaches for investments where an active market does not exist, including regular due diligence of the Master LLC’s pricing vendors, regular reviews of key inputs and assumptions, transactional back-testing or disposition analysis to compare unrealized gains and losses to realized gains and losses, reviews of missing or stale prices and large movements in market values and reviews of any market related activity. The pricing of all Fair Value Assets is subsequently reported to the Board or a committee thereof on a quarterly basis.
Investment Transactions and Investment Income: For financial reporting purposes, investment transactions are recorded on the dates the transactions are entered into (the trade dates). Realized gains and losses on investment transactions are determined on the identified cost basis. Dividend income is recorded on the ex-dividend dates. Dividends from foreign securities where the ex-dividend date may have passed are subsequently recorded when the Master LLC is informed of the ex-dividend date. Under the applicable foreign tax laws, a withholding tax at various rates may be imposed on capital gains, dividends and interest.
Income Taxes: The Master LLC is classified as a partnership for federal income tax purposes. As such, each investor in the Master LLC is treated as the owner of its proportionate share of net assets, income, expenses and realized and unrealized gains and losses of the Master LLC. Therefore, no federal income tax provision is required. It is intended that the Master LLC’s assets will be managed so an investor in the Master LLC
| | | | | | |
| | | BLACKROCK BASIC VALUE FUND, INC. | | DECEMBER 31, 2013 | | 25 |
| | | | |
| Notes to Financial Statements (continued) | | | Master Basic Value LLC | |
can satisfy the requirements of Subchapter M of the Internal Revenue Code of 1986, as amended.
The Master LLC files US federal and various state and local tax returns. No income tax returns are currently under examination. The statute of limitations on the Fund’s US federal tax returns remains open for each of the four years ended June 30, 2013. The statutes of limitations on the Fund’s state and local tax returns may remain open for an additional year depending upon the jurisdiction.
Management has analyzed tax laws and regulations and their application to the Master LLC ‘s facts and circumstances and does not believe there are any uncertain tax positions that require recognition of a tax liability.
Other: Expenses directly related to the Master LLC are charged to the Master LLC. Other operating expenses shared by several funds are pro rated among those funds on the basis of relative net assets or other appropriate methods.
The Master LLC has an arrangement with the custodian whereby fees may be reduced by credits earned on uninvested cash balances, which, if applicable, are shown as fees paid indirectly in the Statement of Operations. The custodian imposes fees on overdrawn cash balances, which can be offset by accumulated credits earned or may result in additional custody charges.
3. Securities and Other Investments:
Securities Lending: The Master LLC may lend securities to approved borrowers, such as banks, brokers and other financial institutions. The borrower pledges cash, securities issued or guaranteed by the US government or irrevocable letters of credit issued by a bank as collateral. The initial collateral received by the Master LLC should have a value of at least 102% of the current value of the loaned securities for securities traded on US exchanges and a value of at least 105% for all other securities. The collateral is maintained thereafter in an amount equal to at least 100% of the current market value of the loaned securities. The market value of the loaned securities is determined at the close of business of the Master LLC and any additional required collateral is delivered to the Master LLC on the next business day. Securities lending income, as disclosed in the Statement of Operations, represents the income earned from the investment of the cash collateral, net of rebates paid to, or fees paid by, borrowers and less the fees paid to the securities lending agent. During the term of the loan, the Master LLC earns dividend or interest income on the securities loaned but does not receive interest income on the securities received as collateral. Loans of securities are terminable at any time and the borrower, after notice, is required to return borrowed securities within the standard time period for settlement of securities transactions.
The market value of securities on loan and the value of the related collateral are shown separately in the Statement of Assets and Liabilities as a component of investments at value, and collateral on securities loaned
at value, respectively. The cash collateral invested by the securities lending agent, BlackRock Investment Management, LLC (“BIM”), if any, is disclosed in the Schedule of Investments.
Securities lending transactions are entered into by the Master LLC under Master Securities Lending Agreements (“MSLA”) which provide the right, in the event of default (including bankruptcy or insolvency) for the non-defaulting party to liquidate the collateral and calculate a net exposure to the defaulting party or request additional collateral. In the event that a borrower defaults, the Master LLC, as lender, would offset the market value of the collateral received against the market value of the securities loaned. The value of the collateral is typically greater than that of the market value of the securities loaned, leaving the lender with a net amount payable to the defaulting party. However, bankruptcy or insolvency laws of a particular jurisdiction may impose restrictions on or prohibitions against such a right of offset in the event of a MSLA counterparty’s bankruptcy or insolvency. Under the MSLA, the borrower can resell or re-pledge the loaned securities, and the Master LLC can reinvest cash collateral, or, upon an event of default, resell or re-pledge the collateral.
The following table is a summary of the Master LLC’s securities lending agreements by counterparty which are subject to offset under a MSLA as of December 31, 2013:
| | | | | | | | | | | | |
| Counterparty | | Securities Loaned
at Value | | | Cash Collateral
Received1 | | | Net Amount | |
BNP Paribas S.A. | | $ | 13,105,756 | | | $ | (13,105,756 | ) | | | — | |
Morgan Stanley | | | 10,554,636 | | | | (10,554,636 | ) | | | — | |
| | | | |
Total | | $ | 23,660,392 | | | $ | (23,660,392 | ) | | | — | |
| | | | |
| | 1 | Collateral with a value of $24,191,049 has been received in connection with securities lending agreements. Excess of collateral received from the individual counterparty is not shown for financial reporting purposes. |
The risks of securities lending also include the risk that the borrower may not provide additional collateral when required or may not return the securities when due. To mitigate this risk, the Master LLC benefits from a borrower default indemnity provided by BlackRock, Inc. (“BlackRock”). BlackRock’s indemnity allows for full replacement of the securities lent. The Master LLC also could suffer a loss if the value of an investment purchased with cash collateral falls below the market value of loaned securities or if the value of an investment purchased with cash collateral falls below the value of the original cash collateral received. During the six months ended December 31, 2013, any securities on loan were collateralized by cash.
4. Investment Advisory Agreement and Other Transactions with Affiliates:
The PNC Financial Services Group, Inc. is the largest stockholder and an affiliate, for 1940 Act purposes, of BlackRock.
The Master LLC entered into an Investment Advisory Agreement with BlackRock Advisors, LLC (the “Manager”), the Master LLC’s investment advisor, an indirect, wholly owned subsidiary of BlackRock, to provide
| | | | | | |
| 26 | | BLACKROCK BASIC VALUE FUND, INC. | | DECEMBER 31, 2013 | | |
| | | | |
| Notes to Financial Statements (continued) | | | Master Basic Value LLC | |
investment advisory and administration services. The Manager is responsible for the management of the Master LLC’s portfolio and provides the necessary personnel, facilities, equipment and certain other services necessary to the operations of the Master LLC. For such services, the Master LLC pays the Manager a monthly fee based on a percentage of the Master LLC’s average daily net assets at the following annual rates:
| | | | |
| Average Daily Net Assets | | Investment
Advisory Fee | |
First $100 Million | | | 0.60 | % |
$100 - $200 Million | | | 0.50 | % |
Greater than $200 Million | | | 0.40 | % |
The Manager voluntarily agreed to waive its investment advisory fees by the amount of investment advisory fees the Master LLC pays to the Manager indirectly through its investment in affiliated money market funds. However, the Manager does not waive its investment advisory fees by the amount of investment advisory fees paid in connection with the Master LLC’s investment in other affiliated investment companies, if any. This amount is shown as fees waived by Manager in the Statement of Operations.
The Manager entered into a sub-advisory agreement with BIM, an affiliate of the Manager. The Manager pays BIM, for services it provides, a monthly fee that is a percentage of the investment advisory fees paid by the Master LLC to the Manager.
For the six months ended December 31, 2013, the Master LLC reimbursed the Manager $21,280 for certain accounting services, which is included in accounting services in the Statement of Operations.
The Master LLC received an exemptive order from the SEC permitting it, among other things, to pay an affiliated securities lending agent a fee based on a share of the income derived from the securities lending activities and has retained BIM as the securities lending agent. BIM may, on behalf of the Master LLC, invest cash collateral received by the Master LLC for such loans in a private investment company managed by the Manager or in registered money market funds advised by the Manager or its affiliates. The market value of securities on loan and the value of the related collateral, if applicable, is shown in the Statement of Assets and Liabilities as securities loaned at value and collateral on securities loaned at value, respectively. The cash collateral invested by BIM, if any, is disclosed in the Schedule of Investments. Securities lending income is equal to the total of income earned from the reinvestment of cash collateral, net of rebates paid to, or fees paid by, borrowers of securities. The Master LLC retains 65% of securities lending income and pays a fee to BIM equal to 35% of such income. The Master LLC benefits from a borrower default indemnity provided by BlackRock. As securities lending agent, BIM bears all operational costs directly related to securities lending as well as the cost of borrower default indemnification. BIM does not receive any fees for managing the cash collateral. The share of income earned by the Master LLC is shown as securities lending — affiliated — net in the Statement of Operations. For the six months ended December 31,
2013, BIM received $12,135 in securities lending agent fees related to securities lending activities for the Master LLC.
The Master LLC recorded payments from an affiliate to compensate for foregone securities lending revenue, which is shown as Other income — affiliated in the Statement of Operations.
Certain officers and/or directors of the Master LLC are officers and/or directors of BlackRock or its affiliates.
5. Purchases and Sales:
Purchases and sales of investments excluding short-term securities for the six months ended December 31, 2013 were $1,001,194,966 and $1,078,290,014, respectively.
6. Bank Borrowings:
The Master LLC, along with certain other funds managed by the Manager and its affiliates (“Participating Funds”), is a party to a 364-day, $800 million credit agreement with a group of lenders, under which the Master LLC may borrow to fund shareholder redemptions. The agreement expires in April 2014. Excluding commitments designated for a certain individual fund, other Participating Funds, including the Master LLC, can borrow up to an aggregate commitment amount of $500 million, subject to asset coverage and other limitations as specified in the agreement. The credit agreement has the following terms: a fee of 0.065% per annum on unused commitment amounts and interest at a rate equal to the higher of (a) the one-month LIBOR plus 0.80% per annum or (b) the Fed Funds rate plus 0.80% per annum on amounts borrowed. Participating Funds paid administration and arrangement fees, which, along with commitment fees, were allocated among such funds based upon portions of the aggregate commitment available to them and relative net assets of Participating Funds. The Master LLC did not borrow under the credit agreement during the six months ended December 31, 2013.
7. Concentration, Market and Credit Risk:
In the normal course of business, the Master LLC invests in securities and enters into transactions where risks exist due to fluctuations in the market (market risk) or failure of the issuer of a security to meet all its obligations (issuer credit risk). The value of securities held by the Master LLC may decline in response to certain events, including those directly involving the issuers whose securities are owned by the Master LLC; conditions affecting the general economy; overall market changes; local, regional or global political, social or economic instability; and currency and interest rate and price fluctuations. Similar to issuer credit risk, the Master LLC may be exposed to counterparty credit risk, or the risk that an entity with which the Master LLC has unsettled or open transactions may fail to or be unable to perform on its commitments. The Master LLC manages counterparty credit risk by entering into transactions only with counterparties that it believes have the financial resources to honor their obligations and by monitoring the financial stability of those counterparties. Financial assets, which potentially expose the Master LLC to market, issuer and counterparty credit risks, consist principally of financial instruments and receivables due from counterparties. The
| | | | | | |
| | | BLACKROCK BASIC VALUE FUND, INC. | | DECEMBER 31, 2013 | | 27 |
| | | | |
| Notes to Financial Statements (concluded) | | | Master Basic Value LLC | |
extent of the Master LLC’s exposure to market, issuer and counterparty credit risks with respect to these financial assets is generally approximated by their value recorded in the Statement of Assets and Liabilities, less any collateral held by the Master LLC.
As of December 31, 2013, the Master LLC invested a significant portion of its assets in securities in the financials sector. Changes in economic conditions affecting the financials sector would have a greater impact on the Master LLC and could affect the value, income and/or liquidity of positions in such securities.
8. Subsequent Events:
Management has evaluated the impact of all subsequent events on the Master LLC through the date the financial statements were issued and has determined that there were no subsequent events requiring adjustment or additional disclosure in the financial statements.
| | | | | | |
| 28 | | BLACKROCK BASIC VALUE FUND, INC. | | DECEMBER 31, 2013 | | |
Robert M. Hernandez, Chairman of the Board and Director
Fred G. Weiss, Vice Chairman of the Board and Director
Paul L. Audet, Director
James H. Bodurtha, Director
Bruce R. Bond, Director
Donald W. Burton, Director
Honorable Stuart E. Eizenstat, Director
Laurence D. Fink, Director
Kenneth A. Froot, Director
Henry Gabbay, Director
John F. O’Brien, Director
Roberta Cooper Ramo, Director
David H. Walsh, Director
John M. Perlowski, President and Chief Executive Officer
Brendan Kyne, Vice President
Neal Andrews, Chief Financial Officer
Jay Fife, Treasurer
Brian Kindelan, Chief Compliance Officer and Anti-Money Laundering Officer
Benjamin Archibald, Secretary
Investment Advisor and Administrator
BlackRock Advisors, LLC
Wilmington, DE 19809
Sub-Advisor
BlackRock Investment Management, LLC
Princeton, NJ 08540
Accounting Agent and Transfer Agent
BNY Mellon Investment Servicing (US) Inc.
Wilmington, DE 19809
Custodian
The Bank of New York Mellon
New York, NY 10286
Distributor
BlackRock Investments, LLC
New York, NY 10022
Legal Counsel
Willkie Farr & Gallagher LLP
New York, NY 10019
Independent Registered Public Accounting Firm
Deloitte & Touche LLP
Philadelphia, PA 19103
Address of the Fund
100 Bellevue Parkway
Wilmington, DE 19809
| | | | | | |
| | | BLACKROCK BASIC VALUE FUND, INC. | | DECEMBER 31, 2013 | | 29 |
Electronic Delivery
Electronic copies of most financial reports and prospectuses are available on the Fund’s website or shareholders can sign up for e-mail notifications of quarterly statements, annual and semi-annual reports and prospectuses by enrolling in the Fund’s electronic delivery program.
To enroll:
Shareholders Who Hold Accounts with Investment Advisors, Banks or Brokerages:
Please contact your financial advisor. Please note that not all investment advisors, banks or brokerages may offer this service.
Shareholders Who Hold Accounts Directly with BlackRock:
| 1) | Access the BlackRock website at |
http://www.blackrock.com/ edelivery
| 2) | Select “eDelivery” under the “More Information” section |
Householding
The Fund will mail only one copy of shareholder documents, including prospectuses, annual and semi-annual reports and proxy statements, to shareholders with multiple accounts at the same address. This practice is commonly called “householding” and is intended to reduce expenses and eliminate duplicate mailings of shareholder documents. Mailings of your shareholder documents may be householded indefinitely unless you instruct us otherwise. If you do not want the mailing of these documents to be combined with those for other members of your household, please call the Fund at (800) 441-7762.
Availability of Quarterly Schedule of Investments
The Fund/Master LLC files its complete schedule of portfolio holdings with the SEC for the first and third quarters of each fiscal year on Form N-Q. The Fund’s/Master LLC’s Forms N-Q are available on the SEC’s website at http://www.sec.gov and may also be reviewed and copied at the SEC’s Public Reference Room in Washington, D.C. Information on how to access documents on the SEC’s website without charge may be obtained by calling (800) SEC-0330. The Fund’s/Master LLC’s Forms N-Q may also be obtained upon request and without charge by calling (800) 441-7762.
Availability of Proxy Voting Policies and Procedures
A description of the policies and procedures that the Fund/Master LLC uses to determine how to vote proxies relating to portfolio securities is available (1) without charge, upon request, by calling (800) 441-7762; (2) at http://www.blackrock.com; and (3) on the SEC’s website at http://www.sec.gov.
Availability of Proxy Voting Record
Information about how the Fund/Master LLC voted proxies relating to securities held in the Fund’s/Master LLC’s portfolios during the most recent 12-month period ended June 30 is available upon request and without charge (1) at http://www.blackrock.com or by calling (800) 441-7762 and (2) on the SEC’s website at http://www.sec.gov.
Account Information
Call us at (800) 441-7762 from 8:00 AM to 6:00 PM EST on any business day to get information about your account balances, recent transactions and share prices. You can also reach us on the Web at http:// www.blackrock.com/funds.
Automatic Investment Plans
Investor Class shareholders who want to invest regularly can arrange to have $50 or more automatically deducted from their checking or savings account and invested in any of the BlackRock funds.
Systematic Withdrawal Plans
Investor Class shareholders can establish a systematic withdrawal plan and receive periodic payments of $50 or more from their BlackRock funds, as long as their account balance is at least $10,000.
Retirement Plans
Shareholders may make investments in conjunction with Traditional, Rollover, Roth, Coverdell, Simple IRAs, SEP IRAs and 403(b) Plans.
| | | | | | |
| 30 | | BLACKROCK BASIC VALUE FUND, INC. | | DECEMBER 31, 2013 | | |
| | |
| Additional Information (concluded) | | |
|
| BlackRock Privacy Principles |
BlackRock is committed to maintaining the privacy of its current and former fund investors and individual clients (collectively, “Clients”) and to safeguarding their non-public personal information. The following information is provided to help you understand what personal information BlackRock collects, how we protect that information and why in certain cases we share such information with select parties.
If you are located in a jurisdiction where specific laws, rules or regulations require BlackRock to provide you with additional or different privacy-related rights beyond what is set forth below, then BlackRock will comply with those specific laws, rules or regulations.
BlackRock obtains or verifies personal non-public information from and about you from different sources, including the following: (i) information we receive from you or, if applicable, your financial intermediary, on applications, forms or other documents; (ii) information about your transactions with us, our affiliates, or others; (iii) information we receive from a consumer reporting agency; and (iv) from visits to our websites.
BlackRock does not sell or disclose to non-affiliated third parties any non-public personal information about its Clients, except as permitted by law or as is necessary to respond to regulatory requests or to service Client accounts. These non-affiliated third parties are required to protect the confidentiality and security of this information and to use it only for its intended purpose.
We may share information with our affiliates to service your account or to provide you with information about other BlackRock products or services that may be of interest to you. In addition, BlackRock restricts access to non-public personal information about its Clients to those BlackRock employees with a legitimate business need for the information. BlackRock maintains physical, electronic and procedural safeguards that are designed to protect the non-public personal information of its Clients, including procedures relating to the proper storage and disposal of such information.
| | | | | | |
| | | BLACKROCK BASIC VALUE FUND, INC. | | DECEMBER 31, 2013 | | 31 |
| | |
| A World-Class Mutual Fund Family | | |
BlackRock offers a diverse lineup of open-end mutual funds crossing all investment styles and managed by experts in equity, fixed income and tax-exempt investing.
BlackRock ACWI ex-US Index Fund
BlackRock All-Cap Energy & Resources Portfolio
BlackRock Basic Value Fund
BlackRock Capital Appreciation Fund
BlackRock Commodity Strategies Fund
BlackRock Disciplined Small Cap Core Fund
BlackRock Emerging Markets Dividend Fund
BlackRock Emerging Markets Fund
BlackRock Emerging Markets Long/Short Equity Fund
BlackRock Energy & Resources Portfolio
BlackRock Equity Dividend Fund
BlackRock EuroFund
BlackRock Flexible Equity Fund
BlackRock Focus Growth Fund
BlackRock Global Dividend Portfolio
BlackRock Global Long/Short Equity Fund
BlackRock Global Opportunities Portfolio
BlackRock Global SmallCap Fund
BlackRock Health Sciences Opportunities Portfolio
BlackRock International Fund
BlackRock International Index Fund
BlackRock International Opportunities Portfolio
BlackRock Large Cap Core Fund
BlackRock Large Cap Core Plus Fund
BlackRock Large Cap Growth Fund
BlackRock Large Cap Value Fund
BlackRock Latin America Fund
BlackRock Long-Horizon Equity Fund
BlackRock Mid-Cap Growth Equity Portfolio
BlackRock Mid-Cap Value Opportunities Fund
BlackRock Natural Resources Trust
BlackRock Pacific Fund
BlackRock Real Estate Securities Fund
BlackRock Russell 1000 Index Fund
BlackRock Science & Technology Opportunities Portfolio
BlackRock Small Cap Growth Equity Portfolio
BlackRock Small Cap Growth Fund II
BlackRock Small Cap Index Fund
BlackRock S&P 500 Stock Fund
BlackRock U.S. Opportunities Portfolio
BlackRock Value Opportunities Fund
| | | | |
| Taxable Fixed Income Funds | | | | |
BlackRock Bond Index Fund
BlackRock Core Bond Portfolio
BlackRock CoreAlpha Bond Fund
BlackRock CoRI Funds
2015
2017
2019
2021
2023
BlackRock Emerging Markets Flexible Dynamic Bond Portfolio
BlackRock Floating Rate Income Portfolio
BlackRock Global Long/Short Credit Fund
BlackRock GNMA Portfolio
BlackRock High Yield Bond Portfolio
BlackRock Inflation Protected Bond Portfolio
BlackRock International Bond Portfolio
BlackRock Investment Grade Bond Portfolio
BlackRock Low Duration Bond Portfolio
BlackRock Secured Credit Portfolio
BlackRock Short Obligations Fund
BlackRock Short-Term Treasury Fund
BlackRock Strategic Income Opportunities Portfolio
BlackRock Total Return Fund
BlackRock U.S. Government Bond Portfolio
BlackRock U.S. Mortgage Portfolio
BlackRock Ultra-Short Obligations Fund
BlackRock World Income Fund
| | | | |
| Municipal Fixed Income Funds | | | | |
BlackRock California Municipal Bond Fund
BlackRock High Yield Municipal Fund
BlackRock National Municipal Fund
BlackRock New Jersey Municipal Bond Fund
BlackRock New York Municipal Bond Fund
BlackRock Pennsylvania Municipal Bond Fund
BlackRock Short-Term Municipal Fund
BlackRock Strategic Municipal Opportunities Fund
| | | | | | | | | | | | | | |
| BlackRock Balanced Capital Fund | | LifePath Active Portfolios | | LifePath Index Portfolios |
| BlackRock Emerging Market Allocation Portfolio | | 2015 | | | 2040 | | | | | Retirement | | 2040 | | |
| BlackRock Global Allocation Fund | | 2020 | | | 2045 | | | | | 2020 | | 2045 | | |
| BlackRock Managed Volatility Portfolio | | 2025 | | | 2050 | | | | | 2025 | | 2050 | | |
| BlackRock Multi-Asset Income Portfolio | | 2030 | | | 2055 | | | | | 2030 | | 2055 | | |
| BlackRock Multi-Asset Real Return Fund | | 2035 | | | | | | | | 2035 | | | | |
| BlackRock Strategic Risk Allocation Fund | | | | | | | | | | | | | | |
| | | | | |
| BlackRock Prepared Portfolios | | LifePath Portfolios | | | | | | | | | |
Conservative Prepared Portfolio | | Retirement | | | 2040 | | | | | | | | | |
Moderate Prepared Portfolio | | 2020 | | | 2045 | | | | | | | | | |
Growth Prepared Portfolio | | 2025 | | | 2050 | | | | | | | | | |
Aggressive Growth Prepared Portfolio | | 2030 | | | 2055 | | | | | | | | | |
| | 2035 | | | | | | | | | | | | |
BlackRock mutual funds are currently distributed by BlackRock Investments, LLC. You should consider the investment objectives, risks, charges and expenses of the funds under consideration carefully before investing. Each fund’s prospectus contains this and other information and is available at www.blackrock.com or by calling (800) 441-7762 or from your financial advisor. The prospectus should be read carefully before investing.
| | | | | | |
| 32 | | BLACKROCK BASIC VALUE FUND, INC. | | DECEMBER 31, 2013 | | |
| | |
| This report is transmitted to shareholders only. It is not authorized for use as an offer of sale or a solicitation of an offer to buy shares of a Fund unless accompanied or preceded by that Fund’s current prospectus. Past performance results shown in this report should not be considered a representation of future performance. Investment returns and principal value of shares will fluctuate so that shares, when redeemed, may be worth more or less than their original cost. Statements and other information herein are as dated and are subject to change. | |  |
| | |
| BV-12/13-SAR | |  |
| | |
| |
| Item 2 – | | Code of Ethics – Not Applicable to this semi-annual report |
| |
| Item 3 – | | Audit Committee Financial Expert – Not Applicable to this semi-annual report |
| |
| Item 4 – | | Principal Accountant Fees and Services – Not Applicable to this semi-annual report |
| |
| Item 5 – | | Audit Committee of Listed Registrants – Not Applicable |
| |
| Item 6 – | | Investments |
| | (a) The registrants’ Schedules of Investments are included as part of the Report to Stockholders filed under Item 1 of this Form. |
| | (b) Not Applicable due to no such divestments during the semi-annual period covered since the previous Form N-CSR filing. |
| |
| Item 7 – | | Disclosure of Proxy Voting Policies and Procedures for Closed-End Management Investment Companies – Not Applicable |
| |
| Item 8 – | | Portfolio Managers of Closed-End Management Investment Companies – Not Applicable |
| |
| Item 9 – | | Purchases of Equity Securities by Closed-End Management Investment Company and Affiliated Purchasers – Not Applicable |
| |
| Item 10 – | | Submission of Matters to a Vote of Security Holders – There have been no material changes to these procedures. |
| |
| Item 11 – | | Controls and Procedures |
| |
| | (a) – The registrants’ principal executive and principal financial officers, or persons performing similar functions, have concluded that the registrants’ disclosure controls and procedures (as defined in Rule 30a-3(c) under the Investment Company Act of 1940, as amended (the “1940 Act”)) are effective as of a date within 90 days of the filing of this report based on the evaluation of these controls and procedures required by Rule 30a-3(b) under the 1940 Act and Rule 15d-15(b) under the Securities Exchange Act of 1934, as amended. |
| |
| | (b) – There were no changes in the registrants’ internal control over financial reporting (as defined in Rule 30a-3(d) under the 1940 Act) that occurred during the second fiscal quarter of the period covered by this report that have materially affected, or are reasonably likely to materially affect, the registrants’ internal control over financial reporting. |
| |
| Item 12 – | | Exhibits attached hereto |
| |
| | (a)(1) – Code of Ethics – Not Applicable to this semi-annual report |
| |
| | (a)(2) – Certifications – Attached hereto |
| |
| | (a)(3) – Not Applicable |
| |
| | (b) – Certifications – Attached hereto |
2
Pursuant to the requirements of the Securities Exchange Act of 1934 and the Investment Company Act of 1940, each registrant has duly caused this report to be signed on its behalf by the undersigned, thereunto duly authorized.
| | |
| BlackRock Basic Value Fund, Inc. and Master Basic Value LLC |
| |
| By: | | /s/ John M. Perlowski |
| | John M. Perlowski |
| | Chief Executive Officer (principal executive officer) of |
| | BlackRock Basic Value Fund, Inc. and Master Basic Value LLC |
|
| Date: February 28, 2014 |
Pursuant to the requirements of the Securities Exchange Act of 1934 and the Investment Company Act of 1940, this report has been signed below by the following persons on behalf of each registrant and in the capacities and on the dates indicated.
| | |
| By: | | /s/ John M. Perlowski |
| | John M. Perlowski |
| | Chief Executive Officer (principal executive officer) of |
| | BlackRock Basic Value Fund, Inc. and Master Basic Value LLC |
|
| Date: February 28, 2014 |
| |
| By: | | /s/ Neal J. Andrews |
| | Neal J. Andrews |
| | Chief Financial Officer (principal financial officer) of |
| | BlackRock Basic Value Fund, Inc. and Master Basic Value LLC |
|
| Date: February 28, 2014 |
3