| UNITED STATES |
| SECURITIES AND EXCHANGE COMMISSION |
| Washington, D.C. 20549 |
FORM N-CSR |
CERTIFIED SHAREHOLDER REPORT OF REGISTERED |
MANAGEMENT INVESTMENT COMPANIES |
| Investment Company Act File Number: 811-09995 |
| T. Rowe Price Global Technology Fund, Inc. |
| (Exact name of registrant as specified in charter) |
| 100 East Pratt Street, Baltimore, MD 21202 |
| (Address of principal executive offices) |
| David Oestreicher |
| 100 East Pratt Street, Baltimore, MD 21202 |
| (Name and address of agent for service) |
| Registrant’s telephone number, including area code: (410) 345-2000 |
| Date of fiscal year end: December 31 |
| Date of reporting period: December 31, 2008 |
Item 1: Report to Shareholders
 |
| Global Technology Fund | December 31, 2008 |
The views and opinions in this report were current as of December 31, 2008. They are not guarantees of performance or investment results and should not be taken as investment advice. Investment decisions reflect a variety of factors, and the managers reserve the right to change their views about individual stocks, sectors, and the markets at any time. As a result, the views expressed should not be relied upon as a forecast of the fund’s future investment intent. The report is certified under the Sarbanes-Oxley Act, which requires mutual funds and other public companies to affirm that, to the best of their knowledge, the information in their financial reports is fairly and accurately stated in all material respects.
REPORTS ON THE WEB
Sign up for our E-mail Program, and you can begin to receive updated fund reports and prospectuses online rather than through the mail. Log in to your account at troweprice.com for more information.
Manager’s Letter
Fellow Shareholders
The challenging environment of the year’s first half evolved into a financial crisis of historic proportions. Loaded with debt and unable to roll over their maturing loans, a number of venerable banks and investment houses collapsed or were taken over. Lending dried up, and the end of an extended period of easy credit severely curtailed consumer, enterprise, and infrastructure spending on technology. Risk-averse investors sought safe havens and fled sectors—such as technology—that were perceived to be risky. Overseas technology stocks underperformed U.S. technology stocks. The combination of these factors made 2008 one of the most difficult periods for your fund.
HIGHLIGHTS
• Severe illiquidity in global credit markets and a worldwide economic recession devastated equity markets and global technology stocks in 2008.
• The Global Technology Fund suffered a substantial loss for the 6- and 12-month periods ended December 31, 2008, but the fund beat its Lipper peer group benchmark in both periods.
• The hard-hit semiconductor and software industries pulled down our absolute performance for the second half of the year, but our decision to increase exposure to software and decrease exposure to hardware helped our relative performance.
• The combined pressures of a recession and inflation are likely to weigh on global technology shares for the first half of 2009, but we believe attractive valuations and a lean supply chain offer long-term growth opportunities.
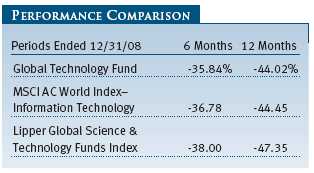
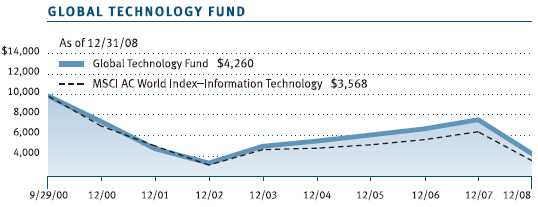
Our fund outperformed the Lipper Global Technology Stock Index of similar funds and the MSCI AC World Index–Information Technology, which tracks global technology stocks in various international markets, for the 6- and 12-month periods ended December 31, 2008. As a fellow shareholder in the fund, I take little consolation from our relative outperformance when the fund delivered a substantial negative absolute return.
Software and information services stocks outperformed hardware, semiconductor, and telecommunication equipment stocks. Software companies’ relatively more stable and recurring revenue base helped them to better handle the slowing economic growth of 2008. Large-cap technology stocks held up better than small-cap technology stocks.
As announced in the last shareholder report, I assumed management of the Global Technology Fund in October 2008. I started my investment career as a technology analyst in 2000, and I have been a T. Rowe Price technology analyst covering U.S. and overseas telecommunications equipment companies since 2003. I recommend that you view the Global Technology Fund as a component that provides concentrated exposure to global technology stocks within a larger, diversified portfolio.
PORTFOLIO REVIEW
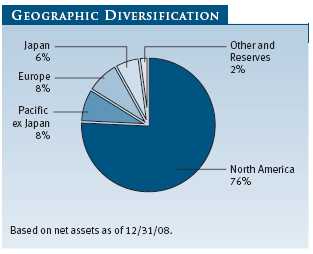
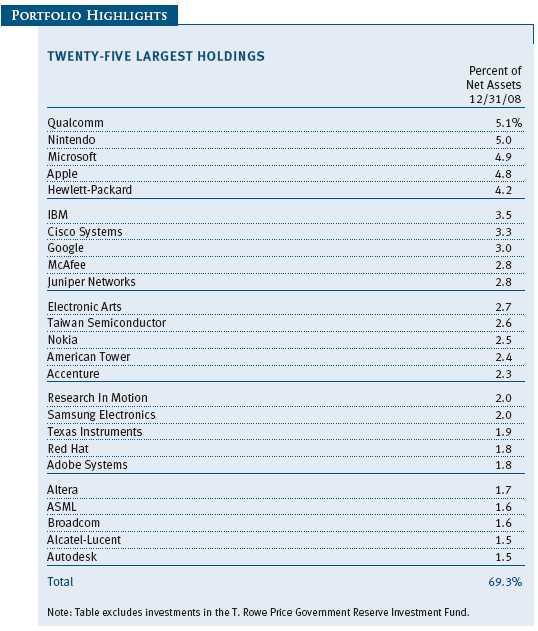
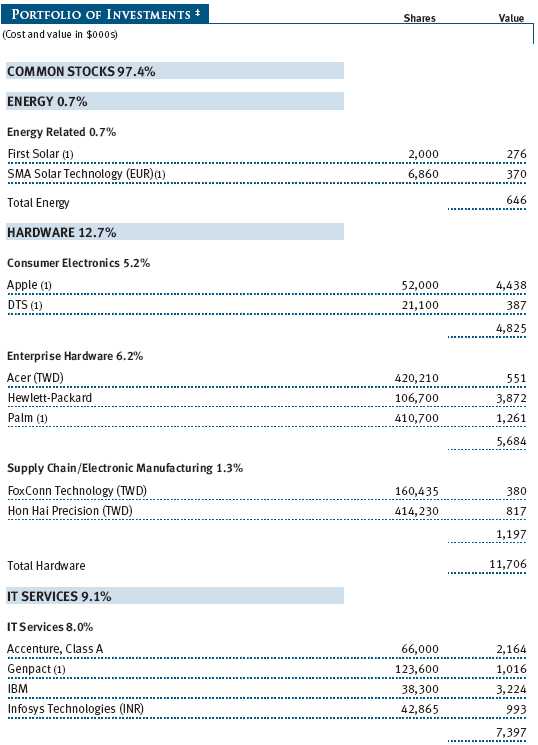
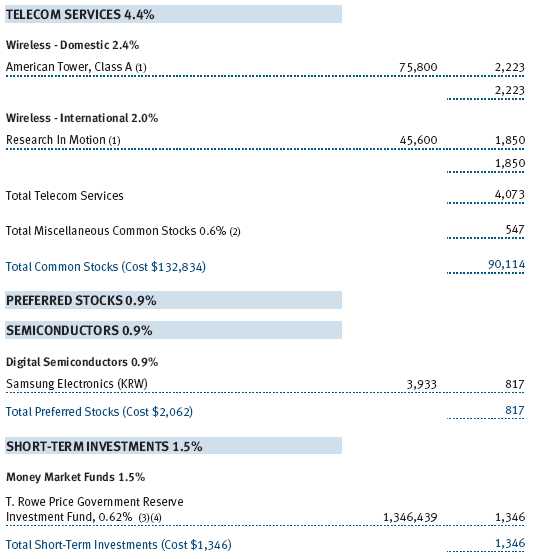
During the second half of 2008, the fund remained broadly diversified across the principal segments of the technology sector and, in terms of geography, more focused on the U.S. than the rest of the world. As of December 31, 2008, the major industries in the fund were software at 28%, semiconductors 20%, telecommunication equipment 19%, hardware 13%, and 9% in IT services. The most significant changes we made in the past six months were decreasing our cash balance and reallocating money from telecommunication equipment into software. From a geographical perspective, the U.S. represented 76% of assets, the Pacific Rim 8%, Europe 8%, and Japan 6%. In the past year, we have increased our weighting in the U.S. by reducing our cash and holdings in the Pacific Rim.
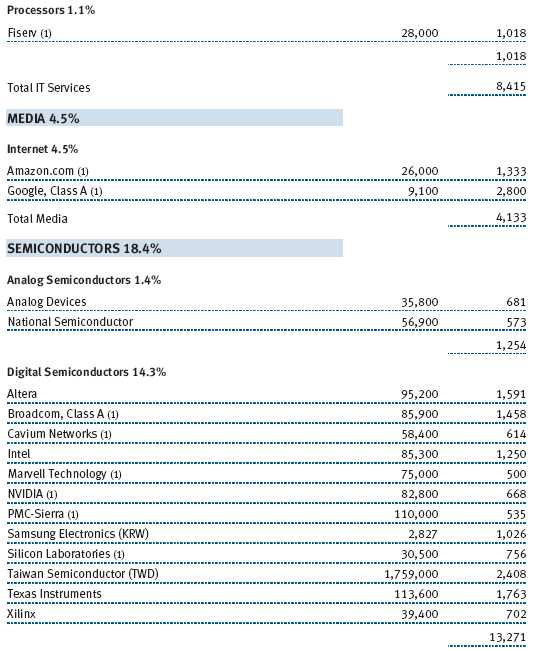
Relative to the benchmark, the fund benefited by being overweight software and underweight hardware. Stock selection among semiconductors made that industry the largest positive contributor to relative performance. Our holdings in semiconductor companies PMC-Sierra, Xilinx, and Taiwan Semiconductor were the largest positive contributions for the past six-month period. (Please see the portfolio of investments for a complete listing of holdings and the amount each represents in the portfolio.)
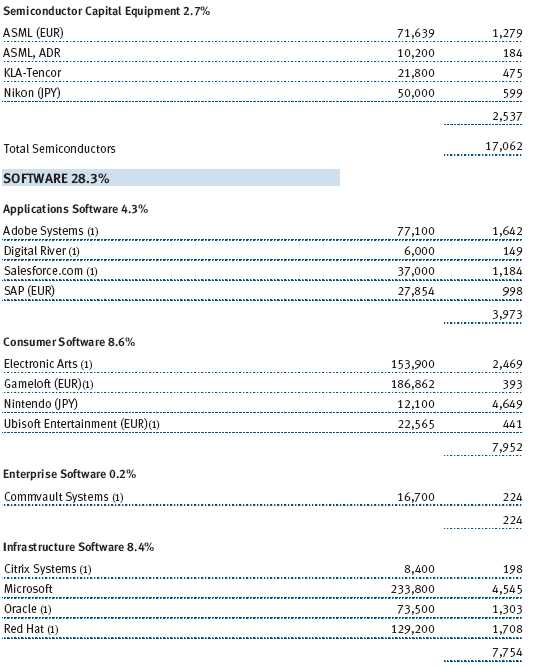
Consumer software was the biggest relative detractor, as electronic game maker Electronic Arts struggled with its turnaround and weaker consumer spending on gaming. We believe the company’s core franchises are undervalued, and we have added shares on weakness.
We were underweight IT services, and this hurt our relative performance. The fund has three key services holdings: Accenture, Genpact, and Infosys. We have been adding to Accenture and Genpact on weakness. Both companies have strong exposure to global outsourcing trends, and a high percentage of their sales are recurring and less dependent on the economic cycle.
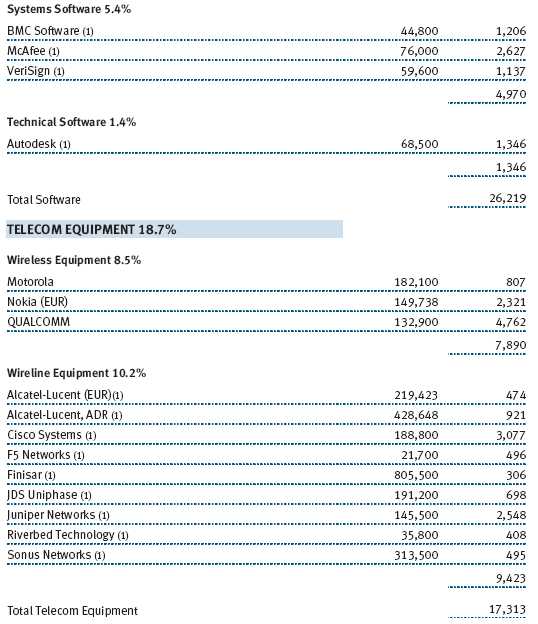
Wireline telecom equipment also detracted from performance. Networking companies Juniper Networks and Cisco Systems struggled as global telecom services companies became more conservative in their infrastructure spending. Juniper Networks is one of our larger overweight holdings because we are confident that their world-class products and global Internet traffic growth will drive longer-term success.

In the fourth quarter, we made several large purchases—Taiwan Semiconductor, National Semiconductor, and JDS Uniphase. We significantly increased our exposure to Palm prior to its launch of a new cell phone operating system. The fund also increased positions in Nintendo, Apple, and Qualcomm. We believe that Nintendo and Apple are long-term consumer franchises that are trading at attractive valuations. Qualcomm is well positioned with a broad and strong patent portfolio and revenues from both royalty and chip sales as the world moves to third- and fourth-generation broadband wireless.
We lowered weightings in Intel and Microsoft, which are likely to see pressure on their product pricing as the popularity of low-cost notebooks grows—particularly the low-cost, energy-efficient netbooks that rely on Web-based applications. We also reduced our exposure to Google on concerns that its share price has yet to reflect the probable severe advertising slowdown in 2009. We eliminated holdings in EMC, Maxim Integrated Products, Silicon Precision, and eBay to fund the purchase of better ideas.
OUTLOOK
The intersection of historically low valuations, minor excess capacity, a natural recovery in the supply chain, and unprecedented global fiscal and monetary stimulus creates conditions that are ripe for a recovery in global technology stocks. The unknown is the timing of end-markets’ stability, but we believe that technology stocks will react positively long before the consensus outlook becomes more positive.
Tech inventories factor large in our outlook. As distributors and retail buyers sought to reduce inventory risk in the second half of 2008 and into early 2009, the tech hardware and semiconductor supply chain experienced a severe correction. Some semiconductor companies experienced as much as a 40% decline in orders in the final quarter of 2008 along with another step down in the first quarter of 2009. The scale and speed of inventory clearing is unprecedented in the global technology supply chain.
This severe reversal of technology supply chain dynamics indeed paints a dire short-term picture but overstates the sector’s medium-term prospects. We do not believe that the technology supply chain is experiencing the extreme overcapacity that it did at the beginning of this decade. As the supply stabilizes and demand normalizes, albeit at a lower level in the short run, we expect to see reversals in supply chain dynamics. The fund is gradually and selectively overweighting semiconductor stocks to take advantage of a normalization of the supply chain.
We also believe that Asian and emerging markets will again drive the bulk of incremental medium- and long-term technology spending and that technology companies based in these regions will continue to mature and offer excellent longer-term investment potential for the fund.
One of the fund’s main goals is to invest in global technology stocks when the market fails to appreciate either the magnitude of the growth potential or the strategic value of the technology assets. We believe that the current valuation environment offers a rare opportunity to own marquee technology stocks where we believe recovery and growth is a “when” not “if” proposition.
We also believe that we have identified significant opportunities in misunderstood technology assets where we believe that the market will gradually come to a more optimistic view. Smartphone maker Palm is an excellent example of fundamental mis-pricing because the market does not grasp the beneficial change in senior management or the potential of software assets the company has developed.
We will look to underweight or avoid technology companies where we see structural vulnerabilities. For example, the fund is underweight Intel, which may be forced to slash the price of its chips in order to compete with low-priced processors used to supply netbooks. We decided to not own any Dell Computer shares because of the company’s lack of research and development investment over time.
This year will be an exciting year for global technology investing. We believe that as the year unfolds, conditions will be ripe for a recovery in global technology stocks. The fund will seek to maximize return by investing in global technology stocks and to be a good steward of your capital.
Thank you for your trust and confidence.
Respectfully submitted,

David J. Eiswert
President of the fund and chairman of its Investment Advisory Committee
January 20, 2009
The committee chairman has day-to-day responsibility for managing the portfolio and works with committee members in developing and executing the fund’s investment program.
RISKS OF INVESTING IN THE FUND
Funds that invest only in specific industries will experience greater volatility than funds investing in a broad range of industries. Technology stocks, historically, have experienced unusually wide price swings, both up and down. The potential for wide variation in performance reflects the special risks common to companies in the rapidly changing field of technology. For example, products or services that at first appear promising may not prove to be commercially successful and may become obsolete quickly. Earnings disappointments and intense competition for market share can result in sharp price declines.
GLOSSARY
Lipper index: An index of mutual fund performance returns for specified periods in defined categories as tracked by Lipper Inc.
MSCI AC World Index—Information Technology: An index that tracks information technology stocks in developed and emerging markets.
Price/earnings ratio: Calculated by dividing a stock’s market value per share by the company’s earnings per share for the past 12 months or by expected earnings for the coming year.
Performance and Expenses
| GROWTH OF $10,000 |
This chart shows the value of a hypothetical $10,000 investment in the fund over the past 10 fiscal year periods or since inception (for funds lacking 10-year records). The result is compared with benchmarks, which may include a broad-based market index and a peer group average or index. Market indexes do not include expenses, which are deducted from fund returns as well as mutual fund averages and indexes.
| AVERAGE ANNUAL COMPOUND TOTAL RETURN |
This table shows how the fund would have performed each year if its actual (or cumulative) returns for the periods shown had been earned at a constant rate.

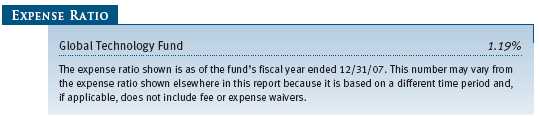
| FUND EXPENSE EXAMPLE |
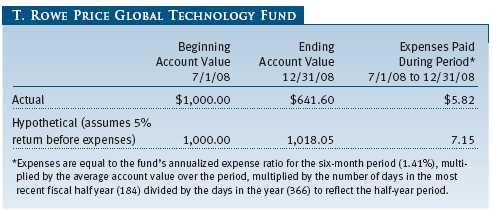
As a mutual fund shareholder, you may incur two types of costs: (1) transaction costs, such as redemption fees or sales loads, and (2) ongoing costs, including management fees, distribution and service (12b-1) fees, and other fund expenses. The following example is intended to help you understand your ongoing costs (in dollars) of investing in the fund and to compare these costs with the ongoing costs of investing in other mutual funds. The example is based on an investment of $1,000 invested at the beginning of the most recent six-month period and held for the entire period.
Actual Expenses
The first line of the following table (“Actual”) provides information about actual account values and expenses based on the fund’s actual returns. You may use the information in this line, together with your account balance, to estimate the expenses that you paid over the period. Simply divide your account value by $1,000 (for example, an $8,600 account value divided by $1,000 = 8.6), then multiply the result by the number in the first line under the heading “Expenses Paid During Period” to estimate the expenses you paid on your account during this period.
Hypothetical Example for Comparison Purposes
The information on the second line of the table (“Hypothetical”) is based on hypothetical account values and expenses derived from the fund’s actual expense ratio and an assumed 5% per year rate of return before expenses (not the fund’s actual return). You may compare the ongoing costs of investing in the fund with other funds by contrasting this 5% hypothetical example and the 5% hypothetical examples that appear in the shareholder reports of the other funds. The hypothetical account values and expenses may not be used to estimate the actual ending account balance or expenses you paid for the period.
Note: T. Rowe Price charges an annual small-account maintenance fee of $10, generally for accounts with less than $2,000 ($500 for UGMA/UTMA). The fee is waived for any investor whose T. Rowe Price mutual fund accounts total $25,000 or more, accounts employing automatic investing, and IRAs and other retirement plan accounts that utilize a prototype plan sponsored by T. Rowe Price (although a separate custodial or administrative fee may apply to such accounts). This fee is not included in the accompanying table. If you are subject to the fee, keep it in mind when you are estimating the ongoing expenses of investing in the fund and when comparing the expenses of this fund with other funds.
You should also be aware that the expenses shown in the table highlight only your ongoing costs and do not reflect any transaction costs, such as redemption fees or sales loads. Therefore, the second line of the table is useful in comparing ongoing costs only and will not help you determine the relative total costs of owning different funds. To the extent a fund charges transaction costs, however, the total cost of owning that fund is higher.
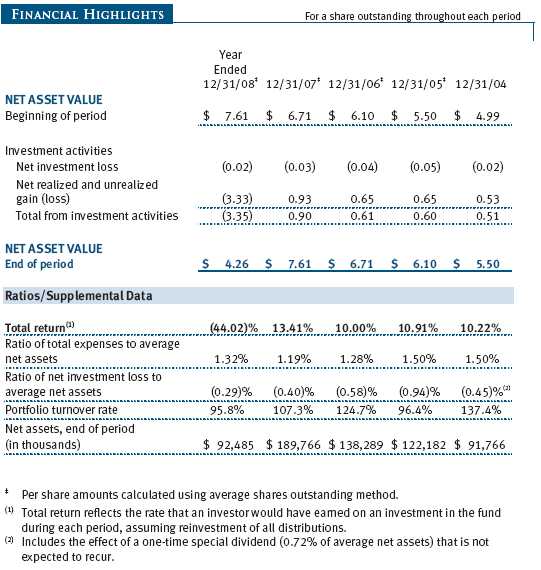
The accompanying notes are an integral part of these financial statements.
The accompanying notes are an integral part of these financial statements.
The accompanying notes are an integral part of these financial statements.
The accompanying notes are an integral part of these financial statements.
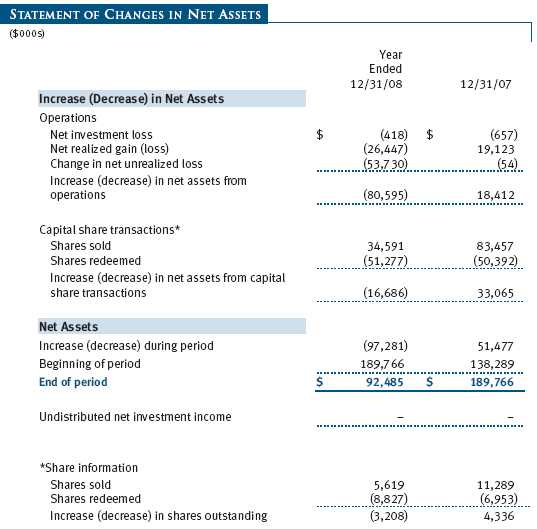
The accompanying notes are an integral part of these financial statements.
| NOTES TO FINANCIAL STATEMENTS |
T. Rowe Price Global Technology Fund, Inc. (the fund), is registered under the Investment Company Act of 1940 (the 1940 Act) as a diversified, open-end management investment company. The fund commenced operations on September 29, 2000. The fund seeks to provide long-term capital growth.
NOTE 1 - SIGNIFICANT ACCOUNTING POLICIES
Basis of Preparation The accompanying financial statements were prepared in accordance with accounting principles generally accepted in the United States of America, which require the use of estimates made by fund management. Fund management believes that estimates and security valuations are appropriate; however, actual results may differ from those estimates, and the security valuations reflected in the financial statements may differ from the value the fund ultimately realizes upon sale of the securities.
Investment Transactions, Investment Income, and Distributions Income and expenses are recorded on the accrual basis. Dividends received from mutual fund investments are reflected as dividend income; capital gain distributions are reflected as realized gain/loss. Dividend income and capital gain distributions are recorded on the ex-dividend date. Income tax-related interest and penalties, if incurred, would be recorded as income tax expense. Investment transactions are accounted for on the trade date. Realized gains and losses are reported on the identified cost basis. Distributions to shareholders are recorded on the ex-dividend date. Income distributions are declared and paid on an annual basis. Capital gain distributions, if any, are declared and paid by the fund, typically on an annual basis.
Currency Translation Assets, including investments, and liabilities denominated in foreign currencies are translated into U.S. dollar values each day at the prevailing exchange rate, using the mean of the bid and asked prices of such currencies against U.S. dollars as quoted by a major bank. Purchases and sales of securities, income, and expenses are translated into U.S. dollars at the prevailing exchange rate on the date of the transaction. The effect of changes in foreign currency exchange rates on realized and unrealized security gains and losses is reflected as a component of security gains and losses.
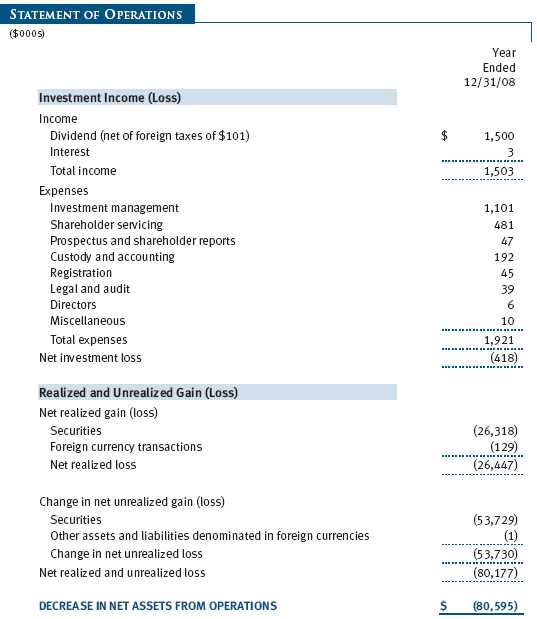
Rebates Subject to best execution, the fund may direct certain security trades to brokers who have agreed to rebate a portion of the related brokerage commission to the fund in cash. Commission rebates are reflected as realized gain on securities in the accompanying financial statements and totaled $17,000 for the year ended December 31, 2008.
New Accounting Pronouncements On January 1, 2008, the fund adopted Statement of Financial Accounting Standards No. 157 (FAS 157), Fair Value Measurements. FAS 157 defines fair value, establishes the framework for measuring fair value, and expands the disclosures of fair value measurements in the financial statements. Adoption of FAS 157 did not have a material impact on the fund’s net assets or results of operations.
In March 2008, the Financial Accounting Standards Board issued Statement of Financial Accounting Standards No. 161 (FAS 161), Disclosures about Derivative Instruments and Hedging Activities, which is effective for fiscal years and interim periods beginning after November 15, 2008. FAS 161 requires enhanced disclosures about derivative and hedging activities, including how such activities are accounted for and their effect on financial position, performance and cash flows. Management is currently evaluating the impact the adoption of FAS 161 will have on the fund’s financial statements and related disclosures.
NOTE 2 - VALUATION
The fund’s investments are reported at fair value as defined under FAS 157. The fund values its investments and computes its net asset value per share at the close of the New York Stock Exchange (NYSE), normally 4 p.m. ET, each day that the NYSE is open for business.
Valuation Methods Equity securities listed or regularly traded on a securities exchange or in the over-the-counter (OTC) market are valued at the last quoted sale price or, for certain markets, the official closing price at the time the valuations are made, except for OTC Bulletin Board securities, which are valued at the mean of the latest bid and asked prices. A security that is listed or traded on more than one exchange is valued at the quotation on the exchange determined to be the primary market for such security. Listed securities not traded on a particular day are valued at the mean of the latest bid and asked prices for domestic securities and the last quoted sale price for international securities.
Investments in mutual funds are valued at the mutual fund’s closing net asset value per share on the day of valuation.
Other investments, including restricted securities, and those for which the above valuation procedures are inappropriate or are deemed not to reflect fair value are stated at fair value as determined in good faith by the T. Rowe Price Valuation Committee, established by the fund’s Board of Directors.
For valuation purposes, the last quoted prices of non-U.S. equity securities may be adjusted under the circumstances described below. If the fund determines that developments between the close of a foreign market and the close of the NYSE will, in its judgment, materially affect the value of some or all of its portfolio securities, the fund will adjust the previous closing prices to reflect what it believes to be the fair value of the securities as of the close of the NYSE. In deciding whether it is necessary to adjust closing prices to reflect fair value, the fund reviews a variety of factors, including developments in foreign markets, the performance of U.S. securities markets, and the performance of instruments trading in U.S. markets that represent foreign securities and baskets of foreign securities. A fund may also fair value securities in other situations, such as when a particular foreign market is closed but the fund is open. The fund uses outside pricing services to provide it with closing prices and information to evaluate and/or adjust those prices. The fund cannot predict how often it will use closing prices and how often it will determine it necessary to adjust those prices to reflect fair value. As a means of evaluating its security valuation process, the fund routinely compares closing prices, the next day’s opening prices in the same markets, and adjusted prices.
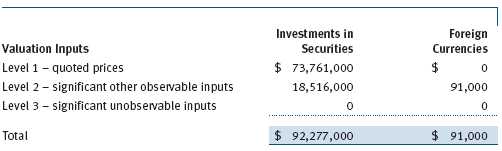
Valuation Inputs Various inputs are used to determine the value of the fund’s investments. These inputs are summarized in the three broad levels listed below:
Level 1 – quoted prices in active markets for identical securities
Level 2 – observable inputs other than Level 1 quoted prices (including, but not limited to, quoted prices for similar securities, interest rates, prepayment speeds, credit risk)
Level 3 – unobservable inputs
Observable inputs are those based on market data obtained from sources independent of the fund, and unobservable inputs reflect the fund’s own assumptions based on the best information available. The input levels are not necessarily an indication of the risk or liquidity associated with investments at that level. For example, non-U.S. equity securities actively traded in foreign markets generally are reflected in Level 2 despite the availability of closing prices, because the fund evaluates and determines whether those closing prices reflect fair value at the close of the NYSE or require adjustment, as described above. The following table summarizes the fund’s investments, based on the inputs used to determine their values on December 31, 2008:
NOTE 3 - INVESTMENT TRANSACTIONS
Purchases and sales of portfolio securities, other than short-term securities, aggregated $134,650,000 and $143,554,000, respectively, for the year ended December 31, 2008.
NOTE 4 - FEDERAL INCOME TAXES
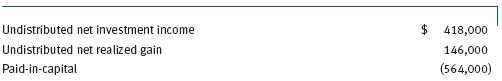
No provision for federal income taxes is required since the fund intends to continue to qualify as a regulated investment company under Subchapter M of the Internal Revenue Code and distribute to shareholders all of its taxable income and gains. Distributions are determined in accordance with Federal income tax regulations, which differ from generally accepted accounting principles, and, therefore, may differ significantly in amount or character from net investment income and realized gains for financial reporting purposes. Financial reporting records are adjusted for permanent book/tax differences to reflect tax character but are not adjusted for temporary differences.
Reclassifications to paid-in capital relate primarily to the current net operating loss. For the year ended December 31, 2008, the following reclassifications, which had no impact on results of operations or net assets, were recorded to reflect tax character:
There were no distributions in the years ended December 31, 2008 and December 31, 2007. At December 31, 2008, the tax-basis cost of investments and components of net assets were as follows:
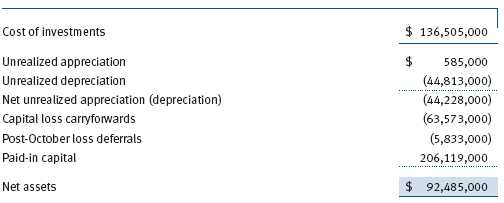
The difference between book-basis and tax-basis net unrealized appreciation (depreciation) is attributable to the deferral of losses from wash sales for tax purposes. The fund intends to retain realized gains to the extent of available capital loss carryforwards. As of December 31, 2008, unused capital loss carryforwards expire as follows: $9,758,000 in fiscal 2009, $33,582,000 in fiscal 2010, and $20,233,000 in fiscal 2016. Pursuant to federal income tax regulations applicable to investment companies, recognition of capital losses on certain transactions is deferred until the subsequent tax year. Consequently, realized losses reflected in the accompanying financial statements include net capital losses realized between November 1 and the fund’s fiscal year-end that have not been recognized for tax purposes (Post-October loss deferrals).
NOTE 5 - FOREIGN TAXES
The fund is subject to foreign income taxes imposed by certain countries in which it invests. Additionally, capital gains realized by the fund upon disposition of securities issued in or by certain foreign countries are subject to capital gains tax imposed by those countries. All taxes are computed in accordance with the applicable foreign tax law, and, to the extent permitted, capital losses are used to offset capital gains. Tax expense attributable to income is accrued by the fund as a reduction of income. Current and deferred tax expense attributable to net capital gains is reflected as a component of realized and/or change in unrealized gain/loss on securities in the accompanying financial statements. At December 31, 2008, the fund had no deferred tax liability attributable to foreign securities and $1,612,000 of foreign capital loss carryforwards, including $21,000 that expire in 2013, $809,000 that expire in 2014, $764,000 that expire in 2015 and $18,000 that expire in 2017.
NOTE 6 - RELATED PARTY TRANSACTIONS
The fund is managed by T. Rowe Price Associates, Inc. (the manager or Price Associates), a wholly owned subsidiary of T. Rowe Price Group, Inc. The investment management agreement between the fund and the manager provides for an annual investment management fee, which is computed daily and paid monthly. The fee consists of an individual fund fee, equal to 0.45% of the fund’s average daily net assets, and a group fee. The group fee rate is calculated based on the combined net assets of certain mutual funds sponsored by Price Associates (the group) applied to a graduated fee schedule, with rates ranging from 0.48% for the first $1 billion of assets to 0.285% for assets in excess of $220 billion. The fund’s group fee is determined by applying the group fee rate to the fund’s average daily net assets. At December 31, 2008, the effective annual group fee rate was 0.31%.
In addition, the fund has entered into service agreements with Price Associates and two wholly owned subsidiaries of Price Associates (collectively, Price). Price Associates computes the daily share price and provides certain other administrative services to the fund. T. Rowe Price Services, Inc., provides shareholder and administrative services in its capacity as the fund’s transfer and dividend disbursing agent. T. Rowe Price Retirement Plan Services, Inc., provides subaccounting and recordkeeping services for certain retirement accounts invested in the fund. For the year ended December 31, 2008, expenses incurred pursuant to these service agreements were $139,000 for Price Associates, $366,000 for T. Rowe Price Services, Inc., and $9,000 for T. Rowe Price Retirement Plan Services, Inc. The total amount payable at period-end pursuant to these service agreements is reflected as Due to Affiliates in the accompanying financial statements.
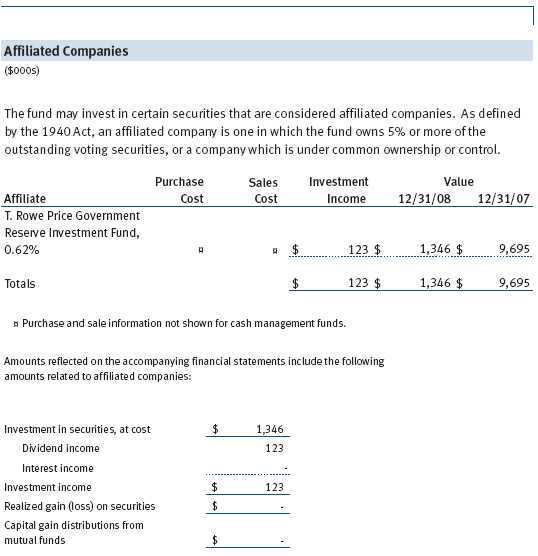
The fund may invest in the T. Rowe Price Reserve Investment Fund and the T. Rowe Price Government Reserve Investment Fund (collectively, the T. Rowe Price Reserve Investment Funds), open-end management investment companies managed by Price Associates and considered affiliates of the fund. The T. Rowe Price Reserve Investment Funds are offered as cash management options to mutual funds, trusts, and other accounts managed by Price Associates and/or its affiliates and are not available for direct purchase by members of the public. The T. Rowe Price Reserve Investment Funds pay no investment management fees.
As of December 31, 2008, T. Rowe Price Group, Inc., and/or its wholly owned subsidiaries owned 539,179 shares of the fund, representing 2% of the fund’s net assets.
| REPORT OF INDEPENDENT REGISTERED PUBLIC ACCOUNTING FIRM |
To the Board of Directors and Shareholders of T. Rowe Price Global Technology Fund, Inc.
In our opinion, the accompanying statement of assets and liabilities, including the schedule of investments, and the related statements of operations and of changes in net assets and the financial highlights present fairly, in all material respects, the financial position of T. Rowe Price Global Technology Fund, Inc. (the “Fund”) at December 31, 2008, the results of its operations for the year then ended, the changes in its net assets for each of the two years in the period then ended and the financial highlights for each of the five years in the period then ended, in conformity with accounting principles generally accepted in the United States of America. These financial statements and financial highlights (hereafter referred to as “financial statements”) are the responsibility of the Fund’s management; our responsibility is to express an opinion on these financial statements based on our audits. We conducted our audits of these financial statements in accordance with the standards of the Public Company Accounting Oversight Board (United States). Those standards require that we plan and perform the audit to obtain reasonable assurance about whether the financial statements are free of material misstatement. An audit includes examining, on a test basis, evidence supporting the amounts and disclosures in the financial statements, assessing the accounting principles used and significant estimates made by management, and evaluating the overall financial statement presentation. We believe that our audits, which included confirmation of securities at December 31, 2008 by correspondence with the custodian and confirmation of the underlying fund by correspondence with the transfer agent, provide a reasonable basis for our opinion.
PricewaterhouseCoopers LLP
Baltimore, Maryland
February 12, 2009
| INFORMATION ON PROXY VOTING POLICIES, PROCEDURES, AND RECORDS |
A description of the policies and procedures used by T. Rowe Price funds and portfolios to determine how to vote proxies relating to portfolio securities is available in each fund’s Statement of Additional Information, which you may request by calling 1-800-225-5132 or by accessing the SEC’s Web site, www.sec.gov. The description of our proxy voting policies and procedures is also available on our Web site, www.troweprice.com. To access it, click on the words “Our Company” at the top of our corporate homepage. Then, when the next page appears, click on the words “Proxy Voting Policies” on the left side of the page.
Each fund’s most recent annual proxy voting record is available on our Web site and through the SEC’s Web site. To access it through our Web site, follow the directions above, then click on the words “Proxy Voting Records” on the right side of the Proxy Voting Policies page.
| HOW TO OBTAIN QUARTERLY PORTFOLIO HOLDINGS |
The fund files a complete schedule of portfolio holdings with the Securities and Exchange Commission for the first and third quarters of each fiscal year on Form N-Q. The fund’s Form N-Q is available electronically on the SEC’s Web site (www.sec.gov); hard copies may be reviewed and copied at the SEC’s Public Reference Room, 450 Fifth St. N.W., Washington, DC 20549. For more information on the Public Reference Room, call 1-800-SEC-0330.
| ABOUT THE FUND’S DIRECTORS AND OFFICERS |
Your fund is governed by a Board of Directors (Board) that meets regularly to review a wide variety of matters affecting the fund, including performance, investment programs, compliance matters, advisory fees and expenses, service providers, and other business affairs. The Board elects the fund’s officers, who are listed in the final table. At least 75% of Board members are independent of T. Rowe Price Associates, Inc. (T. Rowe Price), and T. Rowe Price International, Inc. (T. Rowe Price International); “inside” or “interested” directors are employees or officers of T. Rowe Price. The business address of each director and officer is 100 East Pratt Street, Baltimore, Maryland 21202. The Statement of Additional Information includes additional information about the directors and is available without charge by calling a T. Rowe Price representative at 1-800-225-5132.
| Independent Directors | |
| Name | |
| (Year of Birth) | Principal Occupation(s) During Past Five Years and Directorships of |
| Year Elected* | Other Public Companies |
| Jeremiah E. Casey | Director, National Life Insurance (2001 to 2005); Director, The Rouse |
| (1940) | Company, real estate developers (1990 to 2004) |
| 2005 | |
| Anthony W. Deering | Chairman, Exeter Capital, LLC, a private investment firm (2004 |
| (1945) | to present); Director, Under Armour (8/08 to present); Director, |
| 2001 | Vornado Real Estate Investment Trust (3/04 to present); Director, |
| Mercantile Bankshares (2002 to 2007); Member, Advisory Board, | |
| Deutsche Bank North America (2004 to present); Director, Chairman | |
| of the Board, and Chief Executive Officer, The Rouse Company, real | |
| estate developers (1997 to 2004) | |
| Donald W. Dick, Jr. | Principal, EuroCapital Advisors, LLC, an acquisition and manage- |
| (1943) | ment advisory firm (10/95 to present); Chairman, The Haven Group, |
| 2000 | a custom manufacturer of modular homes (1/04 to present) |
| David K. Fagin | Chairman and President, Nye Corporation (6/88 to present); Director, |
| (1938) | Golden Star Resources Ltd. (5/92 to present); Director, Pacific Rim |
| 2000 | Mining Corp. (2/02 to present); Director, B.C. Corporation (3/08 |
| to present); Chairman, Canyon Resources Corp. (8/07 to 3/08); | |
| Director, Atna Resources Ltd. (3/08 to present) | |
| Karen N. Horn | Director, Eli Lilly and Company (1987 to present); Director, Simon |
| (1943) | Property Group (2004 to present); Director, Federal National |
| 2003 | Mortgage Association (9/06 to present); Director, Norfolk Southern |
| (2/08 to present); Director, Georgia Pacific (5/04 to 12/05); | |
| Managing Director and President, Global Private Client Services, | |
| Marsh Inc. (1999 to 2003) | |
| Theo C. Rodgers | President, A&R Development Corporation (1977 to present) |
| (1941) | |
| 2005 | |
| John G. Schreiber | Owner/President, Centaur Capital Partners, Inc., a real estate invest- |
| (1946) | ment company (1991 to present); Partner, Blackstone Real Estate |
| 2001 | Advisors, L.P. (10/92 to present) |
| * Each independent director oversees 126 T. Rowe Price portfolios (except for Mr. Fagin, who oversees | |
| 125 T. Rowe Price portfolios) and serves until retirement, resignation, or election of a successor. | |
| Inside Directors | |
| Name | |
| (Year of Birth) | |
| Year Elected* | |
| [Number of T. Rowe Price | Principal Occupation(s) During Past Five Years and Directorships of |
| Portfolios Overseen] | Other Public Companies |
| Edward C. Bernard | Director and Vice President, T. Rowe Price; Vice Chairman of the |
| (1956) | Board, Director, and Vice President, T. Rowe Price Group, Inc.; |
| 2006 | Chairman of the Board, Director, and President, T. Rowe Price |
| [126] | Investment Services, Inc.; Chairman of the Board and Director, |
| T. Rowe Price Global Asset Management Limited, T. Rowe Price | |
| Global Investment Services Limited, T. Rowe Price Retirement Plan | |
| Services, Inc., T. Rowe Price Savings Bank, and T. Rowe Price | |
| Services, Inc.; Director, T. Rowe Price International, Inc.; Chief | |
| Executive Officer, Chairman of the Board, Director, and President, | |
| T. Rowe Price Trust Company; Chairman of the Board, all funds | |
| Brian C. Rogers, CFA, CIC | Chief Investment Officer, Director, and Vice President, T. Rowe Price; |
| (1955) | Chairman of the Board, Chief Investment Officer, Director, and Vice |
| 2006 | President, T. Rowe Price Group, Inc.; Vice President, T. Rowe Price |
| [71] | Trust Company |
| *Each inside director serves until retirement, resignation, or election of a successor. | |
| Officers | |
| Name (Year of Birth) | |
| Title and Fund(s) Served | Principal Occupation(s) |
| Kennard W. Allen (1977) | Vice President, T. Rowe Price and T. Rowe Price |
| Vice President, Global Technology Fund | Group, Inc. |
| Christopher W. Carlson (1967) | Vice President, T. Rowe Price and T. Rowe Price |
| Vice President, Global Technology Fund | Group, Inc. |
| David J. Eiswert, CFA (1972) | Vice President, T. Rowe Price and T. Rowe Price |
| President, Global Technology Fund | Group, Inc.; formerly Analyst, Mellon Growth |
| Advisors and Fidelity Management and | |
| Research (to 2003) | |
| Henry M. Ellenbogen (1973) | Vice President, T. Rowe Price and T. Rowe Price |
| Vice President, Global Technology Fund | Group, Inc. |
| Roger L. Fiery III, CPA (1959) | Vice President, T. Rowe Price, T. Rowe Price |
| Vice President, Global Technology Fund | Group, Inc., T. Rowe Price International, Inc., |
| and T. Rowe Price Trust Company | |
| Daniel Flax (1974) | Vice President, T. Rowe Price; formerly |
| Vice President, Global Technology Fund | student, Columbia Business School (to |
| 2006); Equity Analyst/Trader, Madoff | |
| Securities International (London) (to 2004) | |
| Robert N. Gensler (1957) | Vice President, T. Rowe Price, T. Rowe Price |
| Vice President, Global Technology Fund | Group, Inc., and T. Rowe Price International, Inc. |
| John R. Gilner (1961) | Chief Compliance Officer and Vice President, |
| Chief Compliance Officer, | T. Rowe Price; Vice President, T. Rowe Price |
| Global Technology Fund | Group, Inc., and T. Rowe Price Investment |
| Services, Inc. | |
| Gregory S. Golczewski (1966) | Vice President, T. Rowe Price and T. Rowe Price |
| Vice President, Global Technology Fund | Trust Company |
| Gregory K. Hinkle, CPA (1958) | Vice President, T. Rowe Price, T. Rowe Price |
| Treasurer, Global Technology Fund | Group, Inc., T. Rowe Price Investment Services, |
| Inc., and T. Rowe Price Trust Company; formerly | |
| Partner, PricewaterhouseCoopers LLP (to 2007) | |
| Rhett K. Hunter (1977) | Employee, T. Rowe Price; formerly student, MIT |
| Vice President, Global Technology Fund | Sloan School of Management (to 2007) and |
| Bowdoin College (to 2005) | |
| Patricia B. Lippert (1953) | Assistant Vice President, T. Rowe Price and |
| Secretary, Global Technology Fund | T. Rowe Price Investment Services, Inc. |
| Daniel Martino, CFA (1974) | Vice President, T. Rowe Price and T. Rowe |
| Vice President, Global Technology Fund | Price Group, Inc.; formerly Research Analyst |
| and Co-portfolio Manager, Taurus Asset | |
| Management and ONEX (to 2006) | |
| David Oestreicher (1967) | Director and Vice President, T. Rowe Price |
| Vice President, Global Technology Fund | Investment Services, Inc., T. Rowe Price |
| Trust Company, and T. Rowe Price Services, | |
| Inc.; Vice President, T. Rowe Price, | |
| T. Rowe Price Global Asset Management | |
| Limited, T. Rowe Price Global Investment | |
| Services Limited, T. Rowe Price Group, | |
| Inc., T. Rowe Price International, Inc., and | |
| T. Rowe Price Retirement Plan Services, Inc. | |
| Hiroaki Owaki, CFA (1962) | Vice President, T. Rowe Price Global Investment |
| Vice President, Global Technology Fund | Services Limited and T. Rowe Price Group, Inc.; |
| formerly Senior Investment Analyst, ABN Amro | |
| Asset Management (to 2004) | |
| Deborah D. Seidel (1962) | Vice President, T. Rowe Price Investment |
| Vice President, Global Technology Fund | Services, Inc. |
| Joshua K. Spencer, CFA (1973) | Vice President, T. Rowe Price and T. Rowe |
| Vice President, Global Technology Fund | Price Group, Inc.; formerly Research Analyst |
| and Sector Fund Portfolio Manager, Fidelity | |
| Investments (to 2004) | |
| Julie L. Waples (1970) | Vice President, T. Rowe Price |
| Vice President, Global Technology Fund | |
| Thomas H. Watson (1977) | Employee, T. Rowe Price; formerly Strategy |
| Vice President, Global Technology Fund | Analyst, Forrester Research (2002 to 2005) |
| Alison Mei Ling Yip (1966) | Vice President, T. Rowe Price Group, Inc., |
| Vice President, Global Technology Fund | and T. Rowe Price International, Inc.; formerly |
| Analyst, Credit Suisse First Boston (to 2006) | |
| Nalin Yogasundram (1975) | Employee, T. Rowe Price; formerly Equity |
| Vice President, Global Technology Fund | Analyst intern, American Century Investments |
| (to 2006); Project Lead, Ceterus Networks (to | |
| 2005); Project Lead, Mahi Networks (to 2004) | |
| Unless otherwise noted, officers have been employees of T. Rowe Price or T. Rowe Price International for at least | |
| five years. | |
Item 2. Code of Ethics.
The registrant has adopted a code of ethics, as defined in Item 2 of Form N-CSR, applicable to its principal executive officer, principal financial officer, principal accounting officer or controller, or persons performing similar functions. A copy of this code of ethics is filed as an exhibit to this Form N-CSR. No substantive amendments were approved or waivers were granted to this code of ethics during the period covered by this report.
Item 3. Audit Committee Financial Expert.
The registrant’s Board of Directors/Trustees has determined that Ms. Karen N. Horn qualifies as an audit committee financial expert, as defined in Item 3 of Form N-CSR. Ms. Horn is considered independent for purposes of Item 3 of Form N-CSR.
Item 4. Principal Accountant Fees and Services.
(a) – (d) Aggregate fees billed to the registrant for the last two fiscal years for professional services rendered by the registrant’s principal accountant were as follows:
Audit fees include amounts related to the audit of the registrant’s annual financial statements and services normally provided by the accountant in connection with statutory and regulatory filings. Audit-related fees include amounts reasonably related to the performance of the audit of the registrant’s financial statements and specifically include the issuance of a report on internal controls and, if applicable, agreed-upon procedures related to fund acquisitions. Tax fees include amounts related to services for tax compliance, tax planning, and tax advice. The nature of these services specifically includes the review of distribution calculations and the preparation of Federal, state, and excise tax returns. All other fees include the registrant’s pro-rata share of amounts for agreed-upon procedures in conjunction with service contract approvals by the registrant’s Board of Directors/Trustees.
(e)(1) The registrant’s audit committee has adopted a policy whereby audit and non-audit services performed by the registrant’s principal accountant for the registrant, its investment adviser, and any entity controlling, controlled by, or under common control with the investment adviser that provides ongoing services to the registrant require pre-approval in advance at regularly scheduled audit committee meetings. If such a service is required between regularly scheduled audit committee meetings, pre-approval may be authorized by one audit committee member with ratification at the next scheduled audit committee meeting. Waiver of pre-approval for audit or non-audit services requiring fees of a de minimis amount is not permitted.
(2) No services included in (b) – (d) above were approved pursuant to paragraph (c)(7)(i)(C) of Rule 2-01 of Regulation S-X.
(f) Less than 50 percent of the hours expended on the principal accountant’s engagement to audit the registrant’s financial statements for the most recent fiscal year were attributed to work performed by persons other than the principal accountant’s full-time, permanent employees.
(g) The aggregate fees billed for the most recent fiscal year and the preceding fiscal year by the registrant’s principal accountant for non-audit services rendered to the registrant, its investment adviser, and any entity controlling, controlled by, or under common control with the investment adviser that provides ongoing services to the registrant were $1,922,000 and $1,486,000, respectively.
(h) All non-audit services rendered in (g) above were pre-approved by the registrant’s audit committee. Accordingly, these services were considered by the registrant’s audit committee in maintaining the principal accountant’s independence.
Item 5. Audit Committee of Listed Registrants.
Not applicable.
Item 6. Investments.
(a) Not applicable. The complete schedule of investments is included in Item 1 of this Form N-CSR.
(b) Not applicable.
Item 7. Disclosure of Proxy Voting Policies and Procedures for Closed-End Management Investment Companies.
Not applicable.
Item 8. Portfolio Managers of Closed-End Management Investment Companies.
Not applicable.
Item 9. Purchases of Equity Securities by Closed-End Management Investment Company and Affiliated Purchasers.
Not applicable.
Item 10. Submission of Matters to a Vote of Security Holders.
Not applicable.
Item 11. Controls and Procedures.
(a) The registrant’s principal executive officer and principal financial officer have evaluated the registrant’s disclosure controls and procedures within 90 days of this filing and have concluded that the registrant’s disclosure controls and procedures were effective, as of that date, in ensuring that information required to be disclosed by the registrant in this Form N-CSR was recorded, processed, summarized, and reported timely.
(b) The registrant’s principal executive officer and principal financial officer are aware of no change in the registrant’s internal control over financial reporting that occurred during the registrant’s second fiscal quarter covered by this report that has materially affected, or is reasonably likely to materially affect, the registrant’s internal control over financial reporting.
Item 12. Exhibits.
(a)(1) The registrant’s code of ethics pursuant to Item 2 of Form N-CSR is attached.
(2) Separate certifications by the registrant's principal executive officer and principal financial officer, pursuant to Section 302 of the Sarbanes-Oxley Act of 2002 and required by Rule 30a-2(a) under the Investment Company Act of 1940, are attached.
(3) Written solicitation to repurchase securities issued by closed-end companies: not applicable.
(b) A certification by the registrant's principal executive officer and principal financial officer, pursuant to Section 906 of the Sarbanes-Oxley Act of 2002 and required by Rule 30a-2(b) under the Investment Company Act of 1940, is attached.
SIGNATURES | |
| Pursuant to the requirements of the Securities Exchange Act of 1934 and the Investment | |
| Company Act of 1940, the registrant has duly caused this report to be signed on its behalf by the | |
| undersigned, thereunto duly authorized. | |
| T. Rowe Price Global Technology Fund, Inc. | |
| By | /s/ Edward C. Bernard |
| Edward C. Bernard | |
| Principal Executive Officer | |
| Date | February 19, 2009 |
| Pursuant to the requirements of the Securities Exchange Act of 1934 and the Investment | |
| Company Act of 1940, this report has been signed below by the following persons on behalf of | |
| the registrant and in the capacities and on the dates indicated. | |
| By | /s/ Edward C. Bernard |
| Edward C. Bernard | |
| Principal Executive Officer | |
| Date | February 19, 2009 |
| By | /s/ Gregory K. Hinkle |
| Gregory K. Hinkle | |
| Principal Financial Officer | |
| Date | February 19, 2009 |