| UNITED STATES |
| SECURITIES AND EXCHANGE COMMISSION |
| Washington, D.C. 20549 |
FORM N-CSR |
CERTIFIED SHAREHOLDER REPORT OF REGISTERED |
MANAGEMENT INVESTMENT COMPANIES |
| Investment Company Act File Number: 811-09995 |
| T. Rowe Price Global Technology Fund, Inc. |
| (Exact name of registrant as specified in charter) |
| 100 East Pratt Street, Baltimore, MD 21202 |
| (Address of principal executive offices) |
| David Oestreicher |
| 100 East Pratt Street, Baltimore, MD 21202 |
| (Name and address of agent for service) |
| Registrant’s telephone number, including area code: (410) 345-2000 |
| Date of fiscal year end: December 31 |
| Date of reporting period: December 31, 2009 |
Item 1: Report to Shareholders
 |
| Global Technology Fund | December 31, 2009 |
The views and opinions in this report were current as of December 31, 2009. They are not guarantees of performance or investment results and should not be taken as investment advice. Investment decisions reflect a variety of factors, and the managers reserve the right to change their views about individual stocks, sectors, and the markets at any time. As a result, the views expressed should not be relied upon as a forecast of the fund’s future investment intent. The report is certified under the Sarbanes-Oxley Act, which requires mutual funds and other public companies to affirm that, to the best of their knowledge, the information in their financial reports is fairly and accurately stated in all material respects.
REPORTS ON THE WEB
Sign up for our E-mail Program, and you can begin to receive updated fund reports and prospectuses online rather than through the mail. Log in to your account at troweprice.com for more information.
Manager’s Letter
Fellow Shareholders
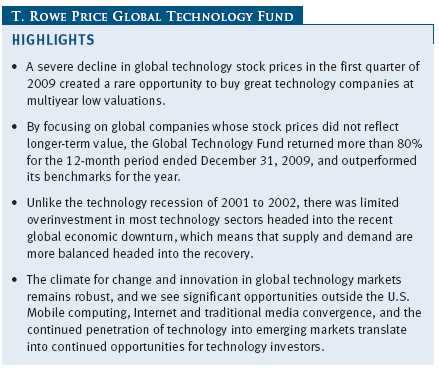
The year 2009 began with a heavy dose of uncertainty and panic, but late in the first quarter, the market rebounded with a rally that continued through the end of the year. Meanwhile, the global economy, particularly the developed countries, remained mired with high levels of unemployment, declining levels of industrial production, and subdued consumer and business spending. By the third quarter, the economy began to show signs of growth.
Given their experiences in the decade’s early years after the collapse of the Internet bubble, technology companies slashed their costs and preserved their cash. Once signs of economic stabilization appeared, they found themselves well positioned to respond to strengthening demand. Reacting to improved conditions throughout the technology supply chain, companies began to revise their outlooks upward. Technology stocks responded with a steep rally.
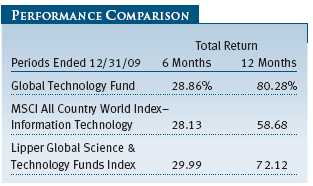
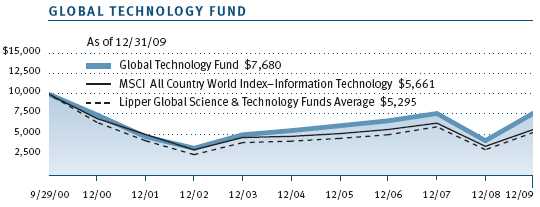
Our fund generated strong returns for the 12-month period ended December 31, 2009, and outperformed the Lipper Global Science & Technology Funds Index and the MSCI All Country World Index–Information Technology, which tracks global technology stocks in various international markets. In the six-month period ended December 31, 2009, the fund modestly outperformed the MSCI index but lagged the Lipper Index.
Semiconductor, hardware, and telecommunications equipment stocks were key areas of the fund’s outperformance. The fund’s small-cap stocks outperformed large-caps. U.S. and Asian stocks outperformed European and Japanese stocks.
My first full year of management of the Global Technology Fund was challenging but rewarding. T. Rowe Price’s model of deep fundamental research helped our fund outperform and deliver solid absolute returns.
MARKET ENVIRONMENT
Excessive financial risk taking and balance sheet leverage left many global financial institutions on the brink of disaster at the beginning of the year. Consumers in the U.S. and Europe found themselves in debt and at risk of losing their jobs and their homes.
The environment felt less like an economic “slowdown” and more like an economic “stop.” The global economy was frozen in the headlights of uncertainty. Global companies liquidated inventory, cut labor forces, shut down capacity, and canceled orders. For technology companies, the reaction to the crisis was even more draconian given that the brutal experience of the 2000–2002 technology recession was fresh in managements’ mind. Technology companies rapidly shifted to survival mode.
Global governments and central banks launched a synchronized response to stabilize bank balance sheets by shoring up the value of financial assets, especially corporate and derivative debt. These efforts paid off by midyear as financial markets began to normalize.
The extreme reaction by technology companies to uncertainty in late 2008 and early 2009 meant that as global financial markets stabilized, companies suddenly found themselves behind the demand for their products and services. This started a positive domino effect across the supply chain. By late summer, we began to see shortages in semiconductor parts and even semiconductor machines. Global prices for memory semiconductors began to soar as supply could not catch up to demand. Stock prices reacted swiftly to improving fundamentals, especially in semiconductors and components.
PORTFOLIO REVIEW
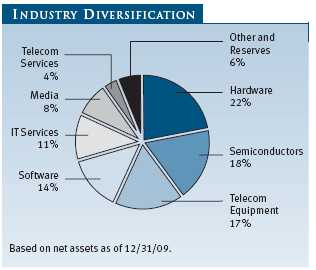
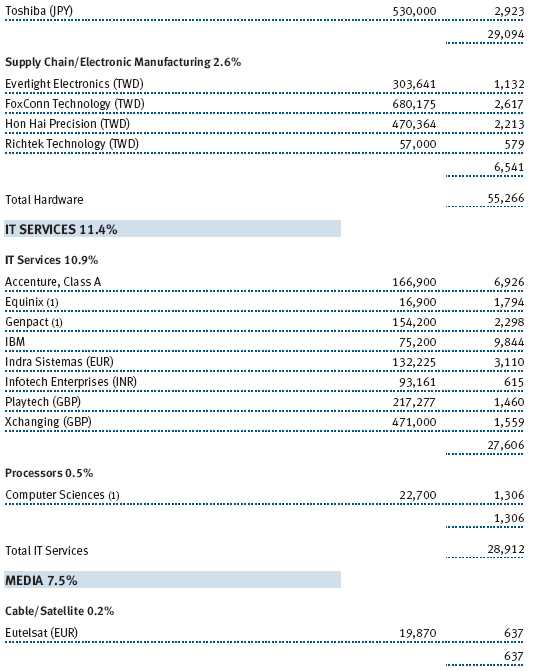
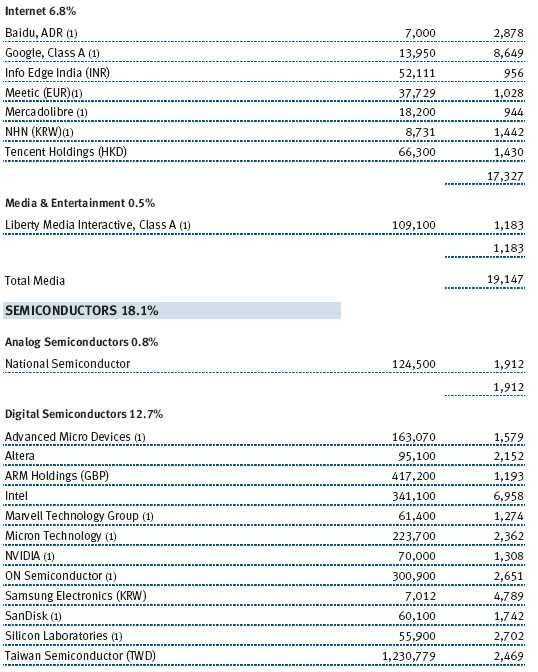
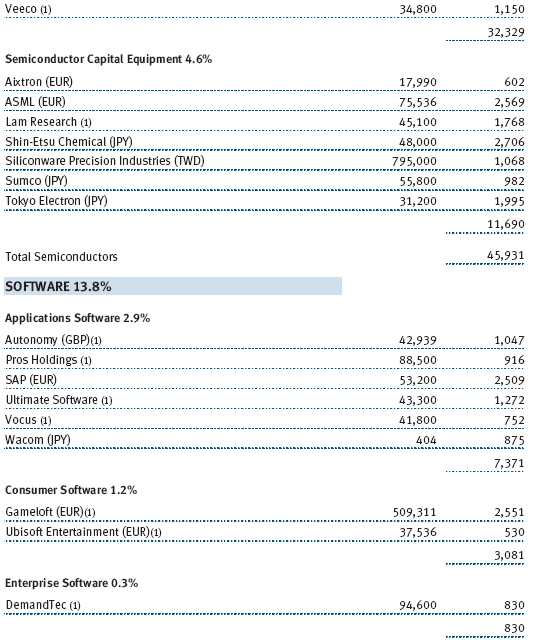
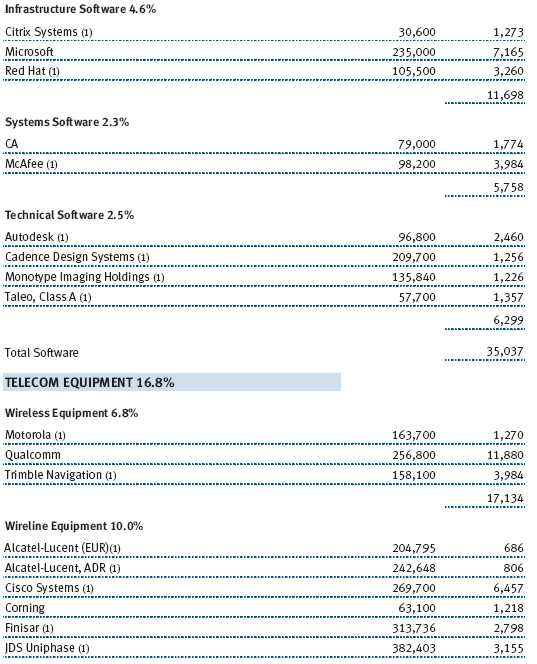
In the beginning of 2009, the portfolio was somewhat skewed to larger-cap equities and stocks of software companies (30%). Early in the year, we shifted the sector weights to favor more semiconductor and hardware businesses. As of December 31, 2009, 22% of the fund was in hardware, 18% in semiconductors, 17% in telecommunications equipment, 14% in software, and 11% in information technology (IT) services. We significantly reduced the cash position of the portfolio early in 2009.
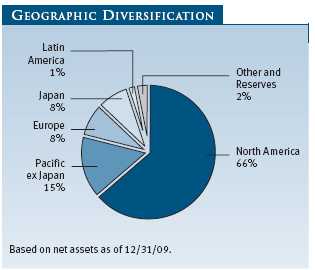
One of our goals in 2009 was to increase the fund’s exposure to investments outside the U.S. We spent a lot of time traveling in Asia and Europe and working with our international research team to find opportunities. As a result, our U.S. portfolio weight fell from 76% of assets early in 2009 to 66% at the end of the year. Asia had the biggest increase. We raised the weight for Pacific ex-Japan from 8% to 15% and from 6% to 8% for Japan. We continue to believe T. Rowe Price’s strong international research organization will help us find compelling opportunities in technology outside the U.S.
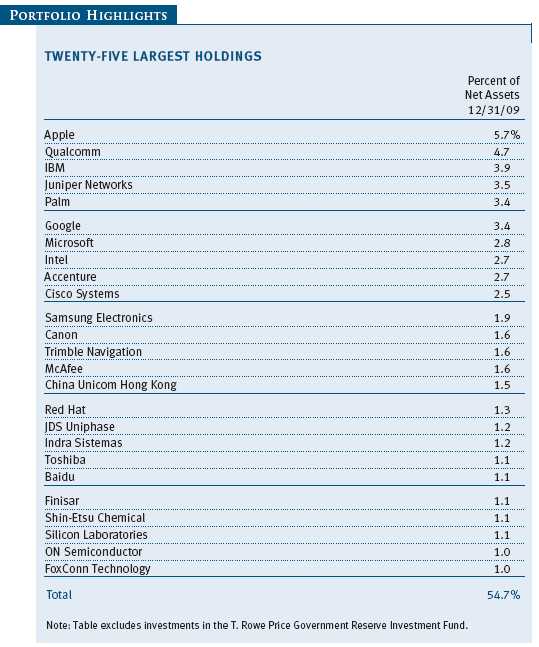
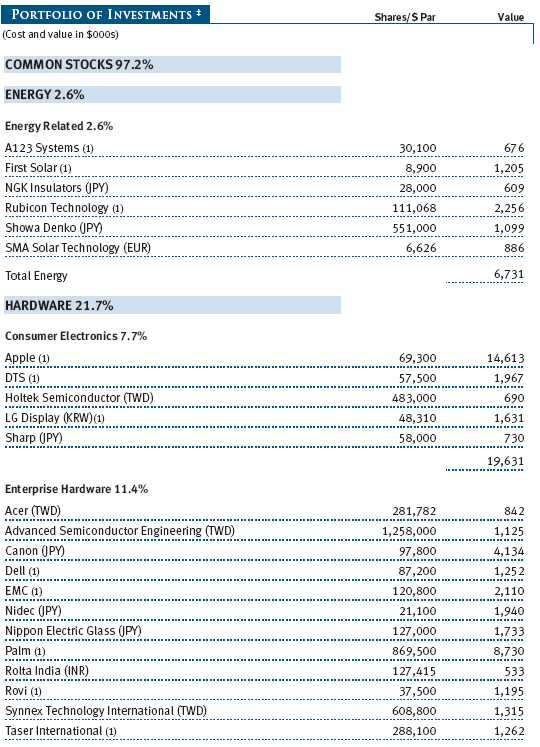
Semiconductors, hardware, and telecommunications equipment were strong contributors to the fund’s performance. Our sector weights were a function of both bottom-up and business-cycle analysis and our perception of longer-term technology trends. Aixtron, a German producer of equipment for making light-emitting diodes (LEDs) was our best-performing semiconductor stock. Aixtron is well positioned to benefit from the significant shift toward using LEDs to backlight LCD televisions. LEDs allow TVs to be thinner, have a better picture, and use less electricity. We have reduced the fund’s position in Aixtron based on valuation, but we continue to look for opportunities to own undervalued stocks that can take advantage of the adoption of LED technology. (Please see the portfolio of investments for a complete listing of holdings and the amount each represents in the portfolio.)
In hardware, Apple and Palm were key contributors. Apple continued to gain market share in mobile computing with the iPhone. Palm, led by a former senior executive at Apple, introduced a next-generation computing platform called WebOS that we think will prove to be a key asset in the competitive smartphone market. We continue to own both stocks and think that the trend toward mass-market mobile computing is in its early days.
We eliminated Nintendo, which was a significant detractor from the fund’s performance. The slowdown in adoption rates for the Wii and the DS handheld gaming systems hurt Nintendo’s growth prospects. We are concerned that Nintendo will lose share in the gaming market as Apple, Google, and others introduce next-generation platforms using capacitive touch and downloadable game software.
Nokia also hurt performance early in the year as the company struggled with its technology platform and with new competition from Apple, Research In Motion, and Google’s Android platform. We eliminated the stock because we were concerned that Nokia’s 37% global market share in mobile phones may shrink in the near term.
OUTLOOK
Technology stocks have a history of volatility and extreme change. In many ways, the rebound from the March 2009 lows represents just another cycle for the technology sector. However, for some key reasons, we think this cycle will be different.
We find valuations for most mid- and large-cap technology stocks reasonable by historical standards, considering the magnitude of positive earnings revisions we anticipate. The supply and demand dynamics for the semiconductor and component markets have rarely been this stable. In the past, overcapacity plagued these markets, but now they face undercapacity, which should help pricing power.
We believe the trend toward the globalization of commerce and the unlocking of emerging market consumption will be key drivers of technology spending. The downturn put pressure on global consumer electronics prices and accelerated the shift of manufacturing and operations to lower-cost countries. This migration is especially true for Japanese technology companies that traditionally have resisted moving manufacturing outside of Japan. We are already seeing labor shortages in China and other developing Asian markets, as well as the potential for rising disposable income. Consumer technologies, including notebook PCs, digital SLR cameras, LCD TVs, and broadband and wireless Internet access, will be especially attractive to these emerging consumers. The portfolio is focused on stocks that should participate in these trends.
One of the critical components of our strategy is to look for technology companies driving or benefiting from innovation and change in big global markets. We think innovation is alive and well in technology, and we are actively looking for chances to capitalize on change. That said, we are wary of historically high operating margins and peaking year-over-year growth rates for many technology companies. It is more important than ever that we use our global research team and the discipline of fundamental research to buy stocks where expectations are too low and earnings estimates have significant upside.
One place in which we are making a significant new investment is Japanese technology exporters. These stocks appear cheap relative to global peers and on a historical basis and tend to have very high market shares in their segments along with strong intellectual property portfolios. We think these companies are mis-priced relative to their opportunity to capitalize on global growth. Sumco, Shin-Etsu Chemical, Showa Denko, Canon, and Nippon Electric Glass are a few examples of the fund’s Japanese investments for 2010.
From a thematic perspective, mobile computing and smartphones continue to represent a massive shift in how consumers use technology. Qualcomm, Palm, and Apple are the fund’s biggest holdings in this segment. LEDs also represent a continuing shift in technology substitution from less-efficient lighting technologies. We expect a multiyear shift to LED technologies with the potential for significant winners. Global IT services is an area of focus and represents a less volatile and more late-cycle technology opportunity. It also gives less-risky access to emerging market growth. Accenture and IBM are our key investments in this area.
We think merger and acquisition activity will accelerate in 2010 as large-cap technology companies look to enter new markets and transform legacy product portfolios. Palm, Riverbed, Citrix, and Red Hat could be interesting acquisition targets.
We will continue to underweight or avoid technology companies where we see structural vulnerabilities. We are particularly concerned with companies losing share in their core markets.
The year 2009 was exciting and volatile for technology investing. It is hard to imagine that we could see a repetition of the fund’s outstanding 2009 absolute returns. The year 2010 is likely to be less rewarding, but we are optimistic about the portfolio and the potential for solid absolute performance. We think that in a reasonable global macroeconomic environment, technology stocks continue to offer a good mix of valuation and growth potential. Our goal this year is to patiently add to our best long-term ideas.
Thank you for your trust and confidence.
Respectfully submitted,
David J. Eiswert
President of the fund and chairman of its Investment Advisory Committee
January 20, 2010
The committee chairman has day-to-day responsibility for managing the portfolio and works with committee members in developing and executing the fund’s investment program.
RISKS OF INVESTING IN THE FUND
Funds that invest only in specific industries will experience greater volatility than funds investing in a broad range of industries. Technology stocks, historically, have experienced unusually wide price swings, both up and down. The potential for wide variation in performance reflects the special risks common to companies in the rapidly changing field of technology. For example, products or services that at first appear promising may not prove commercially successful and may become obsolete quickly. Earnings disappointments and intense competition for market share can result in sharp price declines.
GLOSSARY
Lipper Global Science & Technology Funds Index: An index of science and technology mutual fund performance returns of funds that invest in technology companies around the world for specified periods as tracked by Lipper Inc.
MSCI All Country World Index—Information Technology: An index that tracks information technology stocks in developed and emerging markets.
Price/earnings ratio: Calculated by dividing a stock’s market value per share by the company’s earnings per share for the past 12 months or by expected earnings for the coming year.
S&P 500 Stock Index: A market cap-weighted index of 500 widely held stocks often used as a proxy for the overall stock market. Performance is reported on a total return basis.
Performance and Expenses
| GROWTH OF $10,000 |
This chart shows the value of a hypothetical $10,000 investment in the fund over the past 10 fiscal year periods or since inception (for funds lacking 10-year records). The result is compared with benchmarks, which may include a broad-based market index and a peer group average or index. Market indexes do not include expenses, which are deducted from fund returns as well as mutual fund averages and indexes.
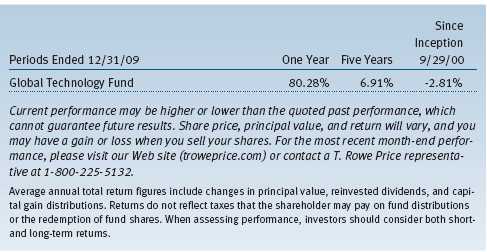
| AVERAGE ANNUAL COMPOUND TOTAL RETURN |
This table shows how the fund would have performed each year if its actual (or cumulative) returns for the periods shown had been earned at a constant rate.
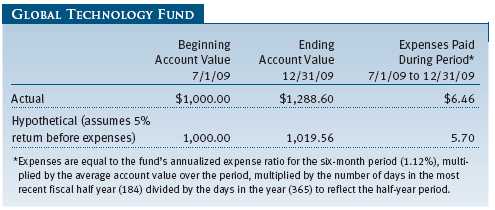
| FUND EXPENSE EXAMPLE |
As a mutual fund shareholder, you may incur two types of costs: (1) transaction costs, such as redemption fees or sales loads, and (2) ongoing costs, including management fees, distribution and service (12b-1) fees, and other fund expenses. The following example is intended to help you understand your ongoing costs (in dollars) of investing in the fund and to compare these costs with the ongoing costs of investing in other mutual funds. The example is based on an investment of $1,000 invested at the beginning of the most recent six-month period and held for the entire period.
Actual Expenses
The first line of the following table (“Actual”) provides information about actual account values and expenses based on the fund’s actual returns. You may use the information in this line, together with your account balance, to estimate the expenses that you paid over the period. Simply divide your account value by $1,000 (for example, an $8,600 account value divided by $1,000 = 8.6), then multiply the result by the number in the first line under the heading “Expenses Paid During Period” to estimate the expenses you paid on your account during this period.
Hypothetical Example for Comparison Purposes
The information on the second line of the table (“Hypothetical”) is based on hypothetical account values and expenses derived from the fund’s actual expense ratio and an assumed 5% per year rate of return before expenses (not the fund’s actual return). You may compare the ongoing costs of investing in the fund with other funds by contrasting this 5% hypothetical example and the 5% hypothetical examples that appear in the shareholder reports of the other funds. The hypothetical account values and expenses may not be used to estimate the actual ending account balance or expenses you paid for the period.
Note: T. Rowe Price charges an annual small-account maintenance fee of $10, generally for accounts with less than $2,000 ($500 for UGMA/UTMA). The fee is waived for any investor whose T. Rowe Price mutual fund accounts total $25,000 or more, accounts employing automatic investing, and IRAs and other retirement plan accounts that utilize a prototype plan sponsored by T. Rowe Price (although a separate custodial or administrative fee may apply to such accounts). This fee is not included in the accompanying table. If you are subject to the fee, keep it in mind when you are estimating the ongoing expenses of investing in the fund and when comparing the expenses of this fund with other funds.
You should also be aware that the expenses shown in the table highlight only your ongoing costs and do not reflect any transaction costs, such as redemption fees or sales loads. Therefore, the second line of the table is useful in comparing ongoing costs only and will not help you determine the relative total costs of owning different funds. To the extent a fund charges transaction costs, however, the total cost of owning that fund is higher.
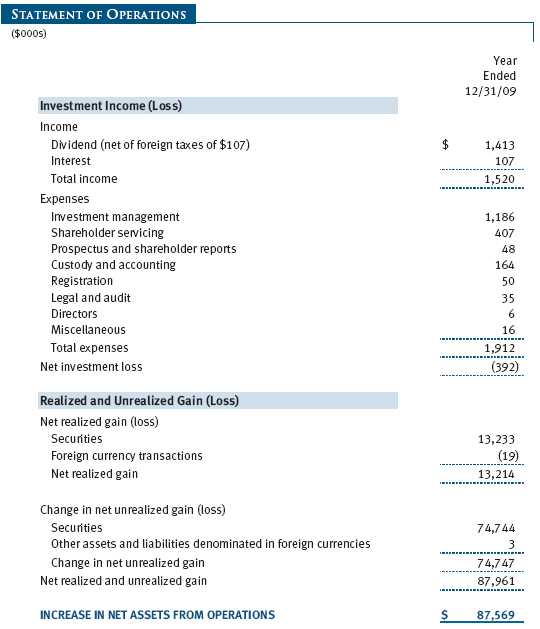
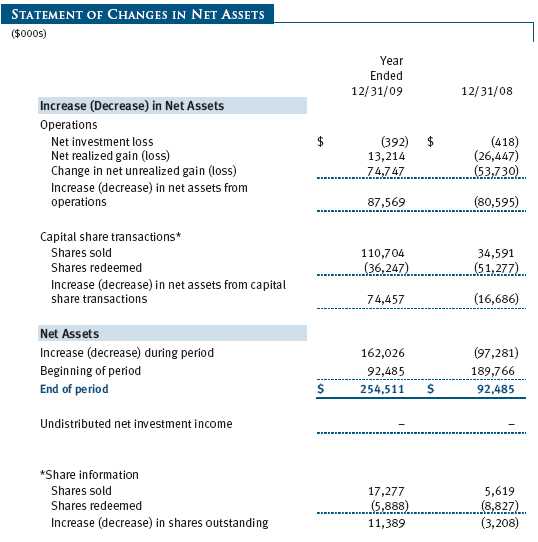
The accompanying notes are an integral part of these financial statements.
The accompanying notes are an integral part of these financial statements.
The accompanying notes are an integral part of these financial statements.
The accompanying notes are an integral part of these financial statements.
The accompanying notes are an integral part of these financial statements.
| NOTES TO FINANCIAL STATEMENTS |
T. Rowe Price Global Technology Fund, Inc. (the fund), is registered under the Investment Company Act of 1940 (the 1940 Act) as a diversified, open-end management investment company. The fund commenced operations on September 29, 2000. The fund seeks to provide long-term capital growth.
NOTE 1 - SIGNIFICANT ACCOUNTING POLICIES
Basis of Preparation The accompanying financial statements were prepared in accordance with accounting principles generally accepted in the United States of America (GAAP), which require the use of estimates made by fund management. Fund management believes that estimates and security valuations are appropriate; however, actual results may differ from those estimates, and the security valuations reflected in the accompanying financial statements may differ from the value ultimately realized upon sale of the securities. Further, fund management believes that no events have occurred between December 31, 2009, the date of this report, and February 25, 2010, the date of issuance of the financial statements, that require adjustment of, or disclosure in, the accompanying financial statements.
Investment Transactions, Investment Income, and Distributions Income and expenses are recorded on the accrual basis. Premiums and discounts on debt securities are amortized for financial reporting purposes. Dividends received from mutual fund investments are reflected as dividend income; capital gain distributions are reflected as realized gain/loss. Dividend income and capital gain distributions are recorded on the ex-dividend date. Income tax-related interest and penalties, if incurred, would be recorded as income tax expense. Investment transactions are accounted for on the trade date. Realized gains and losses are reported on the identified cost basis. Distributions to shareholders are recorded on the ex-dividend date. Income distributions are declared and paid annually. Capital gain distributions, if any, are generally declared and paid by the fund, annually.
Currency Translation Assets, including investments, and liabilities denominated in foreign currencies are translated into U.S. dollar values each day at the prevailing exchange rate, using the mean of the bid and asked prices of such currencies against U.S. dollars as quoted by a major bank. Purchases and sales of securities, income, and expenses are translated into U.S. dollars at the prevailing exchange rate on the date of the transaction. The effect of changes in foreign currency exchange rates on realized and unrealized security gains and losses is reflected as a component of security gains and losses.
Rebates and Credits Subject to best execution, the fund may direct certain security trades to brokers who have agreed to rebate a portion of the related brokerage commission to the fund in cash. Commission rebates are reflected as realized gain on securities in the accompanying financial statements and totaled $10,000 for the year ended December 31, 2009. Additionally, the fund earns credits on temporarily uninvested cash balances held at the custodian, which reduce the fund’s custody charges. Custody expense in the accompanying financial statements is presented before reduction for credits.
New Accounting Pronouncement On January 1, 2009, the fund adopted new accounting guidance that requires enhanced disclosures about derivative and hedging activities, including how such activities are accounted for and their effect on financial position, performance, and cash flows. Adoption of this guidance had no impact on the fund’s net assets or results of operations.
NOTE 2 - VALUATION
The fund’s investments are reported at fair value as defined under GAAP. The fund determines the values of its assets and liabilities and computes its net asset value per share at the close of the New York Stock Exchange (NYSE), normally 4 p.m. ET, each day that the NYSE is open for business.
Valuation Methods Equity securities listed or regularly traded on a securities exchange or in the over-the-counter (OTC) market are valued at the last quoted sale price or, for certain markets, the official closing price at the time the valuations are made, except for OTC Bulletin Board securities, which are valued at the mean of the latest bid and asked prices. A security that is listed or traded on more than one exchange is valued at the quotation on the exchange determined to be the primary market for such security. Listed securities not traded on a particular day are valued at the mean of the latest bid and asked prices for domestic securities and the last quoted sale price for international securities.
Debt securities are generally traded in the OTC market. Securities with remaining maturities of one year or more at the time of acquisition are valued at prices furnished by dealers who make markets in such securities or by an independent pricing service, which considers the yield or price of bonds of comparable quality, coupon, maturity, and type, as well as prices quoted by dealers who make markets in such securities. Securities with remaining maturities of less than one year at the time of acquisition generally use amortized cost in local currency to approximate fair value. However, if amortized cost is deemed not to reflect fair value or the fund holds a significant amount of such securities with remaining maturities of more than 60 days, the securities are valued at prices furnished by dealers who make markets in such securities or by an independent pricing service.
Investments in mutual funds are valued at the mutual fund’s closing net asset value per share on the day of valuation.
Other investments, including restricted securities, and those financial instruments for which the above valuation procedures are inappropriate or are deemed not to reflect fair value are stated at fair value as determined in good faith by the T. Rowe Price Valuation Committee, established by the fund’s Board of Directors.
For valuation purposes, the last quoted prices of non-U.S. equity securities may be adjusted under the circumstances described below. If the fund determines that developments between the close of a foreign market and the close of the NYSE will, in its judgment, materially affect the value of some or all of its portfolio securities, the fund will adjust the previous closing prices to reflect what it believes to be the fair value of the securities as of the close of the NYSE. In deciding whether it is necessary to adjust closing prices to reflect fair value, the fund reviews a variety of factors, including developments in foreign markets, the performance of U.S. securities markets, and the performance of instruments trading in U.S. markets that represent foreign securities and baskets of foreign securities. A fund may also fair value securities in other situations, such as when a particular foreign market is closed but the fund is open. The fund uses outside pricing services to provide it with closing prices and information to evaluate and/or adjust those prices. The fund cannot predict how often it will use closing prices and how often it will determine it necessary to adjust those prices to reflect fair value. As a means of evaluating its security valuation process, the fund routinely compares closing prices, the next day’s opening prices in the same markets, and adjusted prices.
Valuation Inputs Various inputs are used to determine the value of the fund’s financial instruments. These inputs are summarized in the three broad levels listed below:
Level 1 – quoted prices in active markets for identical securities
Level 2 – observable inputs other than Level 1 quoted prices (including, but not limited to, quoted prices for similar securities, interest rates, prepayment speeds, and credit risk)
Level 3 – unobservable inputs
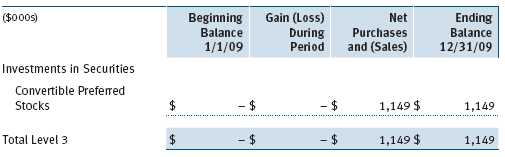
Observable inputs are those based on market data obtained from sources independent of the fund, and unobservable inputs reflect the fund’s own assumptions based on the best information available. The input levels are not necessarily an indication of the risk or liquidity associated with financial instruments at that level. For example, non-U.S. equity securities actively traded in foreign markets generally are reflected in Level 2 despite the availability of closing prices because the fund evaluates and determines whether those closing prices reflect fair value at the close of the NYSE or require adjustment, as described above. The following table summarizes the fund’s financial instruments, based on the inputs used to determine their values on December 31, 2009:
![]()
Following is a reconciliation of the fund’s Level 3 holdings for the year ended December 31, 2009. Gain (loss) reflects both realized and change in unrealized gain (loss) on Level 3 holdings during the period, if any, and is included on the accompanying Statement of Operations. The change in unrealized gain/loss on Level 3 instruments held at December 31, 2009, totaled $0 for the year ended December 31, 2009.
NOTE 3 - OTHER INVESTMENT TRANSACTIONS
Consistent with its investment objective, the fund engages in the following practices to manage exposure to certain risks and/or to enhance performance. The investment objective, policies, program, and risk factors of the fund are described more fully in the fund’s prospectus and Statement of Additional Information.
Emerging Markets At December 31, 2009, approximately 15% of the fund’s net assets were invested, either directly or indirectly, in securities of companies located in emerging markets, securities issued by governments of emerging market countries, and/or securities denominated in or linked to the currencies of emerging market countries. Emerging market securities are often subject to greater price volatility, less liquidity, and higher rates of inflation than U.S. securities. In addition, emerging markets may be subject to greater political, economic and social uncertainty, and differing regulatory environments that may potentially impact the fund’s ability to buy or sell certain securities or repatriate proceeds to U.S. dollars.
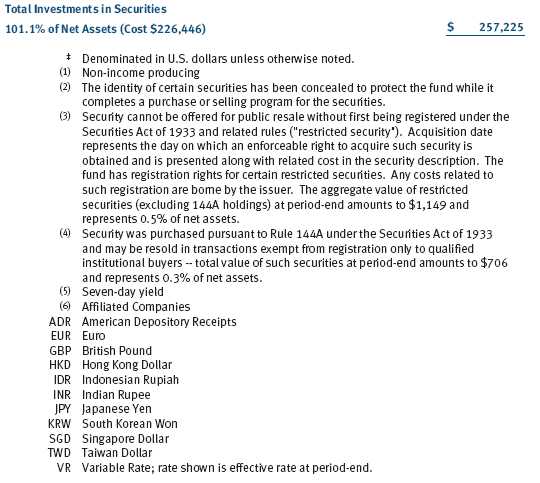
Restricted Securities The fund may invest in securities that are subject to legal or contractual restrictions on resale. Prompt sale of such securities at an acceptable price may be difficult and may involve substantial delays and additional costs.
Other Purchases and sales of portfolio securities other than short-term securities aggregated $239,980,000 and $168,573,000, respectively, for the year ended December 31, 2009.
NOTE 4 - FEDERAL INCOME TAXES
No provision for federal income taxes is required since the fund intends to continue to qualify as a regulated investment company under Subchapter M of the Internal Revenue Code and distribute to shareholders all of its taxable income and gains. Distributions determined in accordance with federal income tax regulations may differ in amount or character from net investment income and realized gains for financial reporting purposes. Financial reporting records are adjusted for permanent book/tax differences to reflect tax character but are not adjusted for temporary differences.
The fund files U.S. federal, state, and local tax returns as required. The fund’s tax returns are subject to examination by the relevant tax authorities until expiration of the applicable statute of limitations, which is generally three years after filing of the tax return but could be longer in certain circumstances.
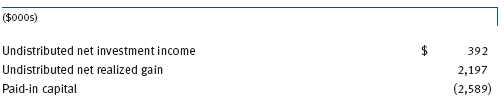
Reclassifications to paid-in capital relate primarily to the current net operating loss and expiring capital loss carryforwards. For the year ended December 31, 2009, the following reclassifications were recorded to reflect tax character; there was no impact on results of operations or net assets:
There were no distributions in the years ended December 31, 2009, and December 31, 2008. At December 31, 2009, the tax-basis cost of investments and components of net assets were as follows:
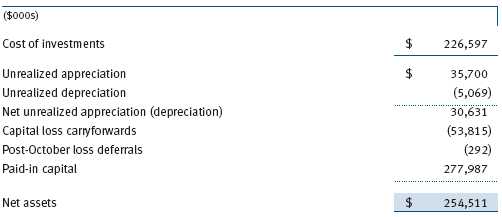
The fund intends to retain realized gains to the extent of available capital loss carryforwards. During the year ended December 31, 2009, the fund utilized $7,588,000 of capital loss carryforwards. The fund’s unused capital loss carryforwards as of December 31, 2009, expire: $33,582,000 in fiscal 2010, and $20,233,000 in fiscal 2016. In accordance with federal income tax regulations applicable to investment companies, recognition of capital losses on certain transactions realized between November 1 and the fund’s fiscal year end is deferred for tax purposes until the subsequent year (post-October loss deferrals); however, such losses are recognized for financial reporting purposes in the year realized.
NOTE 5 - FOREIGN TAXES
The fund is subject to foreign income taxes imposed by certain countries in which it invests. Acquisition of certain foreign currencies related to security transactions are also subject to tax. Additionally, capital gains realized by the fund upon disposition of securities issued in or by certain foreign countries are subject to capital gains tax imposed by those countries. All taxes are computed in accordance with the applicable foreign tax law, and, to the extent permitted, capital losses are used to offset capital gains. Tax expense attributable to income is accrued by the fund as a reduction of income. Taxes incurred on the purchase of foreign currencies are recorded as realized loss on foreign currency transactions. Current and deferred tax expense attributable to net capital gains is reflected as a component of realized and/or change in unrealized gain/loss on securities in the accompanying financial statements. At December 31, 2009, the fund had no deferred tax liability attributable to foreign securities and $1,623,000 of foreign capital loss carryforwards, including $805,000 that expire in 2014, $799,000 that expire in 2015, and $19,000 that expire in 2017.
NOTE 6 - RELATED PARTY TRANSACTIONS
The fund is managed by T. Rowe Price Associates, Inc. (the manager or Price Associates), a wholly owned subsidiary of T. Rowe Price Group, Inc. The investment management agreement between the fund and the manager provides for an annual investment management fee, which is computed daily and paid monthly. The fee consists of an individual fund fee, equal to 0.45% of the fund’s average daily net assets, and a group fee. The group fee rate is calculated based on the combined net assets of certain mutual funds sponsored by Price Associates (the group) applied to a graduated fee schedule, with rates ranging from 0.48% for the first $1 billion of assets to 0.285% for assets in excess of $220 billion. The fund’s group fee is determined by applying the group fee rate to the fund’s average daily net assets. At December 31, 2009, the effective annual group fee rate was 0.30%.
In addition, the fund has entered into service agreements with Price Associates and two wholly owned subsidiaries of Price Associates (collectively, Price). Price Associates computes the daily share price and provides certain other administrative services to the fund. T. Rowe Price Services, Inc., provides shareholder and administrative services in its capacity as the fund’s transfer and dividend disbursing agent. T. Rowe Price Retirement Plan Services, Inc., provides subaccounting and recordkeeping services for certain retirement accounts invested in the fund. For the year ended December 31, 2009, expenses incurred pursuant to these service agreements were $101,000 for Price Associates; $278,000 for T. Rowe Price Services, Inc.; and $17,000 for T. Rowe Price Retirement Plan Services, Inc. The total amount payable at period-end pursuant to these service agreements is reflected as Due to Affiliates in the accompanying financial statements.
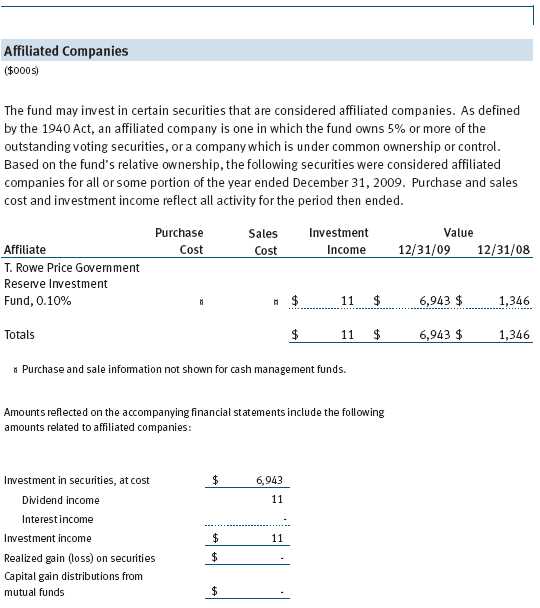
The fund may invest in the T. Rowe Price Reserve Investment Fund and the T. Rowe Price Government Reserve Investment Fund (collectively, the T. Rowe Price Reserve Investment Funds), open-end management investment companies managed by Price Associates and considered affiliates of the fund. The T. Rowe Price Reserve Investment Funds are offered as cash management options to mutual funds, trusts, and other accounts managed by Price Associates and/or its affiliates and are not available for direct purchase by members of the public. The T. Rowe Price Reserve Investment Funds pay no investment management fees.
As of December 31, 2009, T. Rowe Price Group, Inc., and/or its wholly owned subsidiaries owned 539,179 shares of the fund, representing 2% of the fund’s net assets.
| REPORT OF INDEPENDENT REGISTERED PUBLIC ACCOUNTING FIRM |
To the Board of Directors and Shareholders of
T. Rowe Price Global Technology Fund, Inc.
In our opinion, the accompanying statement of assets and liabilities, including the schedule of investments, and the related statements of operations and of changes in net assets and the financial highlights present fairly, in all material respects, the financial position of T. Rowe Price Global Technology Fund, Inc. (the “Fund”) at December 31, 2009, the results of its operations for the year then ended, the changes in its net assets for each of the two years in the period then ended and the financial highlights for each of the five years in the period then ended, in conformity with accounting principles generally accepted in the United States of America. These financial statements and financial highlights (hereafter referred to as “financial statements”) are the responsibility of the Fund’s management; our responsibility is to express an opinion on these financial statements based on our audits. We conducted our audits of these financial statements in accordance with the standards of the Public Company Accounting Oversight Board (United States). Those standards require that we plan and perform the audit to obtain reasonable assurance about whether the financial statements are free of material misstatement. An audit includes examining, on a test basis, evidence supporting the amounts and disclosures in the financial statements, assessing the accounting principles used and significant estimates made by management, and evaluating the overall financial statement presentation. We believe that our audits, which included confirmation of securities at December 31, 2009 by correspondence with the custodian, and confirmation of the underlying fund by correspondence with the transfer agent, provide a reasonable basis for our opinion.
PricewaterhouseCoopers LLP
Baltimore, Maryland
February 25, 2010
| INFORMATION ON PROXY VOTING POLICIES, PROCEDURES, AND RECORDS |
A description of the policies and procedures used by T. Rowe Price funds and portfolios to determine how to vote proxies relating to portfolio securities is available in each fund’s Statement of Additional Information, which you may request by calling 1-800-225-5132 or by accessing the SEC’s Web site, www.sec.gov. The description of our proxy voting policies and procedures is also available on our Web site, www.troweprice.com. To access it, click on the words “Our Company” at the top of our corporate homepage. Then, when the next page appears, click on the words “Proxy Voting Policies” on the left side of the page.
Each fund’s most recent annual proxy voting record is available on our Web site and through the SEC’s Web site. To access it through our Web site, follow the directions above, then click on the words “Proxy Voting Records” on the right side of the Proxy Voting Policies page.
| HOW TO OBTAIN QUARTERLY PORTFOLIO HOLDINGS |
The fund files a complete schedule of portfolio holdings with the Securities and Exchange Commission for the first and third quarters of each fiscal year on Form N-Q. The fund’s Form N-Q is available electronically on the SEC’s Web site (www.sec.gov); hard copies may be reviewed and copied at the SEC’s Public Reference Room, 450 Fifth St. N.W., Washington, DC 20549. For more information on the Public Reference Room, call 1-800-SEC-0330.
| ABOUT THE FUND’S DIRECTORS AND OFFICERS |
Your fund is governed by a Board of Directors (Board) that meets regularly to review a wide variety of matters affecting the fund, including performance, investment programs, compliance matters, advisory fees and expenses, service providers, and other business affairs. The Board elects the fund’s officers, who are listed in the final table. At least 75% of Board members are independent of T. Rowe Price Associates, Inc. (T. Rowe Price), and T. Rowe Price International, Inc. (T. Rowe Price International); “inside” or “interested” directors are employees or officers of T. Rowe Price. The business address of each director and officer is 100 East Pratt Street, Baltimore, Maryland 21202. The Statement of Additional Information includes additional information about the directors and is available without charge by calling a T. Rowe Price representative at 1-800-225-5132.
| Independent Directors | |
| Name | |
| (Year of Birth) | Principal Occupation(s) During Past Five Years and Directorships of |
| Year Elected* | Other Public Companies |
| William R. Brody, M.D., Ph.D. | President and Trustee, Salk Institute for Biological Studies (2009 |
| (1944) | to present); Director, Novartis, Inc. (2009 to present); Director, IBM |
| 2009 | (2007 to present); President and Trustee, Johns Hopkins University |
| (1996 to 2009); Chairman of Executive Committee and Trustee, | |
| Johns Hopkins Health System (1996 to 2009) | |
| Jeremiah E. Casey | Director, National Life Insurance (2001 to 2005); Director, The Rouse |
| (1940) | Company, real estate developers (1990 to 2004) |
| 2005 | |
| Anthony W. Deering | Chairman, Exeter Capital, LLC, a private investment firm (2004 to |
| (1945) | present); Director, Under Armour (2008 to present); Director, Vornado |
| 2001 | Real Estate Investment Trust (2004 to present); Director, Mercantile |
| Bankshares (2002 to 2007); Member, Advisory Board, Deutsche | |
| Bank North America (2004 to present); Director, Chairman of the | |
| Board, and Chief Executive Officer, The Rouse Company, real estate | |
| developers (1997 to 2004) | |
| Donald W. Dick, Jr. | Principal, EuroCapital Advisors, LLC, an acquisition and management |
| (1943) | advisory firm (1995 to present) |
| 2000 | |
| Karen N. Horn | Director, Eli Lilly and Company (1987 to present); Director, Simon |
| (1943) | Property Group (2004 to present); Director, Norfolk Southern (2008 |
| 2003 | to present); Director, Georgia Pacific (2004 to 2005) |
| Theo C. Rodgers | President, A&R Development Corporation (1977 to present) |
| (1941) | |
| 2005 | |
| John G. Schreiber | Owner/President, Centaur Capital Partners, Inc., a real estate invest- |
| (1946) | ment company (1991 to present); Partner, Blackstone Real Estate |
| 2001 | Advisors, L.P. (1992 to present) |
| Mark R. Tercek | President and Chief Executive Officer, The Nature Conservancy (2008 |
| (1957) | to present); Managing Director, The Goldman Sachs Group, Inc. |
| 2009 | (1984 to 2008) |
| *Each independent director oversees 124 T. Rowe Price portfolios and serves until retirement, resignation, | |
| or election of a successor. | |
| Inside Directors | |
| Name | |
| (Year of Birth) | |
| Year Elected* | |
| [Number of T. Rowe Price | Principal Occupation(s) During Past Five Years and Directorships of |
| Portfolios Overseen] | Other Public Companies |
| Edward C. Bernard | Director and Vice President, T. Rowe Price; Vice Chairman of the |
| (1956) | Board, Director, and Vice President, T. Rowe Price Group, Inc.; |
| 2006 | Chairman of the Board, Director, and President, T. Rowe Price |
| [124] | Investment Services, Inc.; Chairman of the Board and Director, |
| T. Rowe Price Global Asset Management Limited, T. Rowe Price | |
| Global Investment Services Limited, T. Rowe Price Retirement | |
| Plan Services, Inc., T. Rowe Price Savings Bank, and T. Rowe Price | |
| Services, Inc.; Director, T. Rowe Price International, Inc.; Chief | |
| Executive Officer, Chairman of the Board, Director, and President, | |
| T. Rowe Price Trust Company; Chairman of the Board, all funds | |
| Brian C. Rogers, CFA, CIC | Chief Investment Officer, Director, and Vice President, T. Rowe Price; |
| (1955) | Chairman of the Board, Chief Investment Officer, Director, and Vice |
| 2006 | President, T. Rowe Price Group, Inc.; Vice President, T. Rowe Price |
| [69] | Trust Company |
| *Each inside director serves until retirement, resignation, or election of a successor. | |
| Officers | |
| Name (Year of Birth) | |
| Position Held With Global | |
| Technology Fund | Principal Occupation(s) |
| Kennard W. Allen (1977) | Vice President, T. Rowe Price and T. Rowe Price |
| Vice President | Group, Inc. |
| Christopher W. Carlson (1967) | Vice President, T. Rowe Price and T. Rowe Price |
| Vice President | Group, Inc. |
| David J. Eiswert, CFA (1972) | Vice President, T. Rowe Price, T. Rowe Price |
| President | Global Investment Services Limited, and |
| T. Rowe Price Group, Inc. | |
| Henry M. Ellenbogen (1973) | Vice President, T. Rowe Price and T. Rowe Price |
| Vice President | Group, Inc. |
| Roger L. Fiery III, CPA (1959) | Vice President, T. Rowe Price, T. Rowe Price |
| Vice President | Group, Inc., T. Rowe Price International, Inc., |
| and T. Rowe Price Trust Company | |
| Daniel Flax (1974) | Vice President, T. Rowe Price and T. Rowe Price |
| Vice President | Group, Inc.; formerly student, Columbia |
| Business School (to 2006); Equity Analyst/ | |
| Trader, Madoff Securities International (London) | |
| (to 2004) | |
| Robert N. Gensler (1957) | Vice President, T. Rowe Price, T. Rowe Price |
| Vice President | Global Investment Services Limited, |
| T. Rowe Price Group, Inc., and T. Rowe Price | |
| International, Inc. | |
| John R. Gilner (1961) | Chief Compliance Officer and Vice President, |
| Chief Compliance Officer | T. Rowe Price; Vice President, T. Rowe Price |
| Group, Inc., and T. Rowe Price Investment | |
| Services, Inc. | |
| Gregory S. Golczewski (1966) | Vice President, T. Rowe Price and T. Rowe Price |
| Vice President | Trust Company |
| Gregory K. Hinkle, CPA (1958) | Vice President, T. Rowe Price, T. Rowe Price |
| Treasurer | Group, Inc., and T. Rowe Price Trust Company; |
| formerly Partner, PricewaterhouseCoopers LLP | |
| (to 2007) | |
| Rhett K. Hunter (1977) | Vice President, T. Rowe Price; formerly student, |
| Vice President | MIT Sloan School of Management (to 2007), |
| and Bowdoin College (to 2005) | |
| Patricia B. Lippert (1953) | Assistant Vice President, T. Rowe Price and |
| Secretary | T. Rowe Price Investment Services, Inc. |
| Daniel Martino, CFA (1974) | Vice President, T. Rowe Price and T. Rowe |
| Vice President | Price Group, Inc.; formerly Research Analyst |
| and Co-portfolio Manager, Taurus Asset | |
| Management (to 2006), Onex Public Markets | |
| Group (to 2006), and MFS Investment | |
| Management (to 2005) | |
| David Oestreicher (1967) | Director and Vice President, T. Rowe Price |
| Vice President | Investment Services, Inc., T. Rowe Price Trust |
| Company, and T. Rowe Price Services, Inc.; Vice | |
| President, T. Rowe Price, T. Rowe Price Global | |
| Asset Management Limited, T. Rowe Price | |
| Global Investment Services Limited, T. Rowe | |
| Price Group, Inc., T. Rowe Price International, | |
| Inc., and T. Rowe Price Retirement Plan | |
| Services, Inc. | |
| Hiroaki Owaki, CFA (1962) | Vice President, T. Rowe Price Global Investment |
| Vice President | Services Limited and T. Rowe Price Group, Inc. |
| Deborah D. Seidel (1962) | Vice President, T. Rowe Price, T. Rowe Price |
| Vice President | Investment Services, Inc., and T. Rowe Price |
| Services, Inc. | |
| Joshua K. Spencer, CFA (1973) | Vice President, T. Rowe Price and T. Rowe Price |
| Vice President | Group, Inc. |
| Julie L. Waples (1970) | Vice President, T. Rowe Price |
| Vice President | |
| Thomas H. Watson (1977) | Vice President, T. Rowe Price; formerly Strategy |
| Vice President | Analyst, Forrester Research (to 2005) |
| Alison Mei Ling Yip (1966) | Vice President, T. Rowe Price Group, Inc., and |
| Vice President | T. Rowe Price International, Inc.; formerly |
| Analyst, Credit Suisse First Boston (to 2006) | |
| Nalin Yogasundram (1975) | Vice President, T. Rowe Price; formerly Equity |
| Vice President | Analyst intern, American Century Investments |
| (to 2006); Project Lead, Ceterus Networks (to | |
| 2005); Project Lead, Mahi Networks (to 2004) | |
| Unless otherwise noted, officers have been employees of T. Rowe Price or T. Rowe Price International for at | |
| least five years. | |
Item 2. Code of Ethics.
The registrant has adopted a code of ethics, as defined in Item 2 of Form N-CSR, applicable to its principal executive officer, principal financial officer, principal accounting officer or controller, or persons performing similar functions. A copy of this code of ethics is filed as an exhibit to this Form N-CSR. No substantive amendments were approved or waivers were granted to this code of ethics during the period covered by this report.
Item 3. Audit Committee Financial Expert.
The registrant’s Board of Directors/Trustees has determined that Mr. Anthony W. Deering qualifies as an audit committee financial expert, as defined in Item 3 of Form N-CSR. Mr. Deering is considered independent for purposes of Item 3 of Form N-CSR.
Item 4. Principal Accountant Fees and Services.
(a) – (d) Aggregate fees billed to the registrant for the last two fiscal years for professional services rendered by the registrant’s principal accountant were as follows:
Audit fees include amounts related to the audit of the registrant’s annual financial statements and services normally provided by the accountant in connection with statutory and regulatory filings. Audit-related fees include amounts reasonably related to the performance of the audit of the registrant’s financial statements and specifically include the issuance of a report on internal controls and, if applicable, agreed-upon procedures related to fund acquisitions. Tax fees include amounts related to services for tax compliance, tax planning, and tax advice. The nature of these services specifically includes the review of distribution calculations and the preparation of Federal, state, and excise tax returns. All other fees include the registrant’s pro-rata share of amounts for agreed-upon procedures in conjunction with service contract approvals by the registrant’s Board of Directors/Trustees.
(e)(1) The registrant’s audit committee has adopted a policy whereby audit and non-audit services performed by the registrant’s principal accountant for the registrant, its investment adviser, and any entity controlling, controlled by, or under common control with the investment adviser that provides ongoing services to the registrant require pre-approval in advance at regularly scheduled audit committee meetings. If such a service is required between regularly scheduled audit committee meetings, pre-approval may be authorized by one audit committee member with ratification at the next scheduled audit committee meeting. Waiver of pre-approval for audit or non-audit services requiring fees of a de minimis amount is not permitted.
(2) No services included in (b) – (d) above were approved pursuant to paragraph (c)(7)(i)(C) of Rule 2-01 of Regulation S-X.
(f) Less than 50 percent of the hours expended on the principal accountant’s engagement to audit the registrant’s financial statements for the most recent fiscal year were attributed to work performed by persons other than the principal accountant’s full-time, permanent employees.
(g) The aggregate fees billed for the most recent fiscal year and the preceding fiscal year by the registrant’s principal accountant for non-audit services rendered to the registrant, its investment adviser, and any entity controlling, controlled by, or under common control with the investment adviser that provides ongoing services to the registrant were $1,879,000 and $1,922,000, respectively.
(h) All non-audit services rendered in (g) above were pre-approved by the registrant’s audit committee. Accordingly, these services were considered by the registrant’s audit committee in maintaining the principal accountant’s independence.
Item 5. Audit Committee of Listed Registrants.
Not applicable.
Item 6. Investments.
(a) Not applicable. The complete schedule of investments is included in Item 1 of this Form N-CSR.
(b) Not applicable.
Item 7. Disclosure of Proxy Voting Policies and Procedures for Closed-End Management Investment Companies.
Not applicable.
Item 8. Portfolio Managers of Closed-End Management Investment Companies.
Not applicable.
Item 9. Purchases of Equity Securities by Closed-End Management Investment Company and Affiliated Purchasers.
Not applicable.
Item 10. Submission of Matters to a Vote of Security Holders.
Not applicable.
Item 11. Controls and Procedures.
(a) The registrant’s principal executive officer and principal financial officer have evaluated the registrant’s disclosure controls and procedures within 90 days of this filing and have concluded that the registrant’s disclosure controls and procedures were effective, as of that date, in ensuring that information required to be disclosed by the registrant in this Form N-CSR was recorded, processed, summarized, and reported timely.
(b) The registrant’s principal executive officer and principal financial officer are aware of no change in the registrant’s internal control over financial reporting that occurred during the registrant’s second fiscal quarter covered by this report that has materially affected, or is reasonably likely to materially affect, the registrant’s internal control over financial reporting.
Item 12. Exhibits.
(a)(1) The registrant’s code of ethics pursuant to Item 2 of Form N-CSR is attached.
(2) Separate certifications by the registrant's principal executive officer and principal financial officer, pursuant to Section 302 of the Sarbanes-Oxley Act of 2002 and required by Rule 30a-2(a) under the Investment Company Act of 1940, are attached.
(3) Written solicitation to repurchase securities issued by closed-end companies: not applicable.
(b) A certification by the registrant's principal executive officer and principal financial officer, pursuant to Section 906 of the Sarbanes-Oxley Act of 2002 and required by Rule 30a-2(b) under the Investment Company Act of 1940, is attached.
SIGNATURES | |
| Pursuant to the requirements of the Securities Exchange Act of 1934 and the Investment | |
| Company Act of 1940, the registrant has duly caused this report to be signed on its behalf by the | |
| undersigned, thereunto duly authorized. | |
| T. Rowe Price Global Technology Fund, Inc. | |
| By | /s/ Edward C. Bernard |
| Edward C. Bernard | |
| Principal Executive Officer | |
| Date | February 25, 2010 |
| Pursuant to the requirements of the Securities Exchange Act of 1934 and the Investment | |
| Company Act of 1940, this report has been signed below by the following persons on behalf of | |
| the registrant and in the capacities and on the dates indicated. | |
| By | /s/ Edward C. Bernard |
| Edward C. Bernard | |
| Principal Executive Officer | |
| Date | February 25, 2010 |
| By | /s/ Gregory K. Hinkle |
| Gregory K. Hinkle | |
| Principal Financial Officer | |
| Date | February 25, 2010 |