UNITED STATES
SECURITIES AND EXCHANGE COMMISSION
Washington, D.C. 20549
FORM N-CSR
CERTIFIED SHAREHOLDER REPORT OF REGISTERED
MANAGEMENT INVESTMENT COMPANIES
Investment Company Act file number | 811-10041 |
|
JNL Investors Series Trust |
(Exact name of registrant as specified in charter) |
|
1 Corporate Way, Lansing, Michigan | | 48951 |
(Address of principal executive offices) | | (Zip code) |
|
225 West Wacker Drive, Suite 1200, Chicago, Illinois 60606 |
(Mailing Address) |
|
Steven J. Fredricks Jackson National Asset Management, LLC 225 West Wacker Drive, Suite 1200 Chicago, Illinois 60606 |
(Name and address of agent for service) |
|
Registrant’s telephone number, including area code: | (312) 338-5800 | |
|
Date of fiscal year end: | December 31 | |
|
Date of reporting period: | December 31, 2015 | |
| | | | | | | | | |
Form N-CSR is to be used by management investment companies to file reports with the Commission not later than 10 days after the transmission to stockholders of any report that is required to be transmitted to stockholders under Rule 30e-1 under the Investment Company Act of 1940 (17 CFR 270.30e-1). The Commission may use the information provided on Form N-CSR in its regulatory, disclosure review, inspection, and policymaking roles.
A registrant is required to disclose the information specified by Form N-CSR, and the Commission will make this information public. A registrant is not required to respond to the collection of information contained in Form N-CSR unless the Form displays a currently valid Office of Management and Budget (“OMB”) control number. Please direct comments concerning the accuracy of the information collection burden estimate and any suggestions for reducing the burden to Secretary, Securities and Exchange Commission, 450 Fifth Street, NW, Washington, DC 20549-0609. The OMB has reviewed this collection of information under the clearance requirements of 44 U.S.C. §3507.
Item 1. Report to Shareholders.

ANNUAL REPORT
December 31, 2015
· JNL® Investors Series Trust
This report is for the general information of qualified and non-qualified plan participants, as well as contract/policyowners of the PerspectiveSM, Perspective II®, Perspective AdvisorsSM, Perspective Advisors IISM, PerspectiveSM L Series, Perspective Rewards®, Elite Access®, Elite Access Brokerage Edition®, Perspective AdvantageSM, Perspective Focus®, Fifth Third Perspective, Retirement Latitudes®, Perspective II (New York), Perspective Advisors II (New York), Perspective L Series (New York), Perspective Rewards (New York), Elite Access (New York), Elite Access Brokerage Edition (New York), Perspective Advisors (New York), and Perspective Focus (New York). Not all the portfolios are available in all of the products. Jackson® is the marketing name for Jackson National Life Insurance Company® (Home Office: Lansing, Michigan) and Jackson National Life Insurance Company of New York® (Home Office: Purchase, New York).

JNL Investors Series Trust
December 31, 2015
President’s Letter

Dear Investor,
Enclosed is the annual report for the JNL Investors Series Trust for the year ended December 31, 2015, together with Management’s Discussion of Fund Performance for each of the Funds.
December 2015 marked the much anticipated hike in the U.S. Federal Reserve (“Fed”) Funds rate, which conveyed the Fed’s stance that domestic economic conditions have sufficiently improved to warrant the commencement of interest policy normalization. Throughout 2015, the U.S. economy displayed a positive growth trend, albeit somewhat moderate, across many key factors. The unemployment rate fell to 5.0% in Q4 from 5.5% during Q1 2015. Non-farm payrolls surprised to the upside, the Conference Board’s consumer confidence measure ticked up on job and wage optimism, while domestic industries (such as housing and consumer spending) also remained robust. As 2015 drew to a close, however, an appreciating U.S. Dollar, weaker global demand precipitated by a slowdown in China, and drastically lower commodity prices weighed on the manufacturing sector, which slipped to contractionary levels. Against this backdrop, U.S. inflation expectations also remained fairly muted.
Domestic equities, as represented by the Russell 3000 Index, eked out their seventh consecutive year of gains, returning 0.48% for the year on a total return basis. After reaching new record highs in May, equities suffered a correction in the 3rd quarter, initially triggered by a surprise devaluation of the Chinese Yuan. Blue chip, large-cap equities broadly outperformed small- and mid-cap equities, despite earnings pressure from a stronger U.S. Dollar, which created headwinds for large multi-national companies. Consumer discretionary was the leading sector, returning 10.11%, while energy returned -21.12% due to sharply falling oil prices. From a style standpoint, growth significantly outperformed value equities, due in part to the significantly higher energy exposure within value equity indices.
Despite the continued growth in the U.S., most international markets were hampered by slowing growth, geopolitical tensions, falling commodity prices and deflation in some areas, including the Eurozone. Growth was also mixed for emerging market countries. Developed international equities, as represented by the Morgan Stanley Capital International (“MSCI”) EAFE Index, returned -0.81% during the year (in U.S. Dollar terms). However, in local currency terms, it returned 5.33%, reflecting slightly improving corporate fundamentals in addition to continued accommodative monetary policy by the European Central Bank and the Bank of Japan. Japanese equities fared the best, returning 9.57% (in U.S. Dollar terms). Australian equities, which were hampered by a commodity downturn, returned -9.95% (in U.S. Dollar terms).
Emerging market equities suffered their worst performance year since 2011, returning -14.92%. There were numerous headwinds for the asset class during 2015, including a strengthening U.S. Dollar, a slowdown of growth in China, sharply lower commodity prices, deteriorating fundamentals in certain countries, heightened geopolitical tensions and investor outflows. Within the “BRIC” countries, returns varied significantly: Brazilian equities returned -41.37%, Chinese equities returned -7.82%, Indian equities returned -6.12%, and Russian equities returned 4.21% (all in U.S. Dollar terms).
U.S. bonds, as represented by the Barclays U.S. Aggregate Bond Index, managed a slightly positive return of 0.55%. Treasury yields rose across the board, especially at the front end of the yield curve, as markets priced in an eventual Fed tightening that occurred late in the year. Agency mortgages and Treasuries were the leading sectors, returning 1.51% and 0.84% as measured by the Barclays U.S. Agency Fixed Rate MBS Index and Barclays U.S. Treasury Index, respectively. Meanwhile, both investment grade corporate and high yield bonds underperformed, with the latter falling sharply due in part to exposure to poor performing energy and materials sectors as well as pickup on volatility that led to spread widening. High yield bonds, as represented by the Barclays U.S. Corporate High Yield Bond Index, returned -4.47%. Non-U.S. Dollar bonds, including emerging markets debt, significantly underperformed due in part to a strengthening U.S. Dollar. For the second consecutive year, local currency emerging markets debt was the worst performing sector for the year, down 14.92% as measured by the JPMorgan GBI — Emerging Markets Global Diversified Index.
Alternative assets were mixed during the year and generally underperformed the broad market. A strengthening U.S. Dollar created significant headwinds for various alternative assets including commodities and global infrastructure. Commodities suffered their worst year since 2008, as the Bloomberg Commodity Index returned -24.66%. Global developed real estate managed to produce a slightly positive return of 0.05%, as measured by the FTSE/EPRA NAREIT Developed Index. Most alternative strategies also produced negative returns during the year, with the Wilshire Liquid Alternative Index returning -3.47%. Relative value strategies returned -2.80%; multi-strategy funds returned -2.95%, global macro strategies returned -2.96%, event driven strategies returned -4.00%, and equity hedged strategies returned -5.04%, all as measured by their respective Wilshire Liquid Alternative sub-index.
Looking ahead to 2016, we expect divergent economic growth and monetary policy among major developed and emerging market countries. Our base case is that the U.S. will have another year of modest gross domestic product (“GDP”) growth and the Fed will continue on the path of rate normalization in a gradual fashion. Meanwhile, Europe and Japan will likely continue their quantitative easing programs, which should be supportive of modest economic growth. We continue to expect weakness within emerging markets as China’s economy pivots more toward services and less infrastructure spending, which will present challenging conditions for countries tied to the commodity complex. How China transitions its economy and the impact of Fed rate normalization will be critical issues to monitor over the course of the year that could impact our outlook.
Ultimately, these converging trends may lead to heightened volatility in 2016. While this may cause gyrations in returns and uncertainty over the short term, it could also present long-term opportunities for active managers who are able to take advantage of valuation anomalies that are presented by dislocations.
Thank you for choosing Jackson for your investment needs.

| |
| |
Mark D. Nerud | |
Trustee, President and Chief Executive Officer | |
JNL Investors Series Trust | |

JNL/PPM America Funds
PPM America, Inc. (Unaudited)
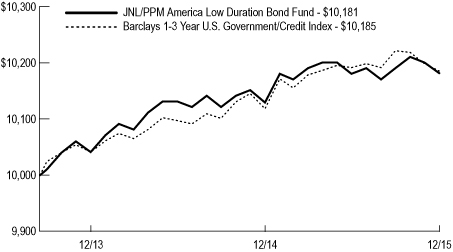
Market Summary: Market returns for the Barclays 1-3 Year U.S. Government/Credit Index and the Barclays U.S. Aggregate Bond Index were 0.65% and 0.55%, respectively, for the year ended December 31, 2015. U.S. bonds managed a modestly positive return for 2015, despite rising Treasury yields across the board and the Fed's much anticipated rate hike in December. Government-backed mortgage securities and U.S. Treasuries were the leading sectors, returning 1.51% and 0.84%, respectively. Corporate bonds, both
investment grade and high yield, fell sharply, with high yield bonds negatively affected by falling energy prices that raised concerns about the stability of energy companies and their ability to service their debt. Foreign bonds, especially emerging markets debt, significantly underperformed in the face of the continued strength of the U.S. Dollar that reduced the value of locally-priced debt securities.
JNL/PPM America Low Duration Bond Fund
Portfolio Composition†:
Financials | | | 30.7 | % | |
Non-U.S. Government Agency ABS | | | 28.9 | | |
Government Securities | | | 12.7 | | |
Health Care | | | 3.7 | | |
Consumer Staples | | | 3.2 | | |
U.S. Government Agency
Mortgage-Backed Securities | | | 2.9 | | |
Utilities | | | 2.5 | | |
Energy | | | 2.4 | | |
Materials | | | 2.3 | | |
Industrials | | | 2.3 | | |
Consumer Discretionary | | | 1.4 | | |
Information Technology | | | 1.1 | | |
Telecommunication Services | | | 0.8 | | |
Short Term Investments | | | 5.1 | | |
Total Investments | | | 100.0 | % | |
†Total Investments as of December 31, 2015.
For the year ended December 31, 2015, JNL/PPM America Low Duration Bond Fund underperformed its benchmark by posting a return of 0.51% compared to 0.65% for the Barclays 1-3 Year U.S. Government/Credit Index. The investment results were positively impacted primarily by an overweight to corporate bonds and to the out-of-index allocation to asset-backed securities. Within corporate bonds, the Fund's investments in the banking sector contributed to relative performance. The Fund's cash position detracted from relative performance. The Fund invested in futures contracts, which are used to manage duration.
Positioning among sectors and credit quality was stable throughout the year. At the beginning of the year, the Fund held approximately 52% in corporate bonds, 26% in asset-backed securities ("ABS"), and 10% in Treasuries; this allocation
migrated to 53%, 23% and 6% by year end. Similarly, the Fund's average credit quality remained consistent during the year. The Fund's top five segments represented 56% of total assets: banking 22%, ABS car loan 10%, ABS other 9%, Treasuries 8% and consumer non-cyclical 7%.
JNL/PPM America Total Return Fund
Portfolio Composition†:
Financials | | | 25.2 | % | |
U.S. Government Agency
Mortgage-Backed Securities | | | 17.5 | | |
Government Securities | | | 14.7 | | |
Energy | | | 5.9 | | |
Non-U.S. Government Agency ABS | | | 5.1 | | |
Consumer Discretionary | | | 5.1 | | |
Utilities | | | 4.1 | | |
Industrials | | | 4.0 | | |
Health Care | | | 3.5 | | |
Materials | | | 2.6 | | |
Telecommunication Services | | | 2.4 | | |
Consumer Staples | | | 2.2 | | |
Information Technology | | | 2.0 | | |
Short Term Investments | | | 5.7 | | |
Total Investments | | | 100.0 | % | |
†Total Investments as of December 31, 2015.
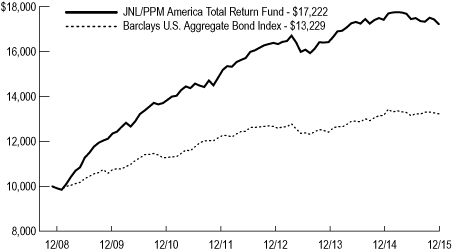
For the year ended December 31, 2015, JNL/PPM America Total Return Fund underperformed its benchmark by posting a return of -1.11% compared to 0.55% for the Barclays U.S Aggregate Bond Index. The Fund's overweight to high yield corporate bonds and security selection within investment grade corporate bonds were the primary detractors from relative return. The Fund's non-allocation to agency and security selection within commercial mortgage-backed securities were positive contributors to relative return for the year. By sector, security selection within energy and basic industries were the top detractors, while security selection within banking and finance companies were positive contributors. The Fund also saw strong performance through security selection within the consumer non-cyclical sector. The Fund invested in futures to manage duration.
Positioning among sectors and credit quality was stable throughout the year. At the beginning of the year, the Fund held approximately 64% in corporate bonds, 19% in mortgage-backed securities and 12% in U.S. government bonds which migrated to 59%, 19% and 15%, respectively, by year end. Similarly, the Fund's average credit quality remained consistent during the year. The Fund was well diversified among industries at year end with the top five segments representing 32% of total assets: banking 17%, electric 5%, automotive 4%, finance companies 3% and cable and satellite 3%.

JNL/PPM America Funds (continued)
PPM America, Inc. (Unaudited)
JNL/PPM America Low Duration Bond Fund
Average Annual Total Returns | |
| 1 Year | | | 0.51 | % | |
Since Inception | | | 0.78 | | |
(Inception date September 16, 2013) | |
JNL/PPM America Total Return Fund
Average Annual Total Returns | |
| 1 Year | | | -1.11 | % | |
| 5 Year | | | 4.67 | | |
Since Inception | | | 8.07 | | |
(Inception date December 29, 2008) | |
Past performance is not predictive of future performance. Investment return and principal value will fluctuate so that an investor's shares, when redeemed, may be worth more or less than their original cost. Performance numbers are net of all Fund operating expenses, but not do not reflect the deduction of insurance charges.
JNL Investors Series Trust
Schedules of Investments
December 31, 2015
| | Shares/Par † | | Value | |
JNL/PPM America Low Duration Bond Fund | | | | | |
NON-U.S. GOVERNMENT AGENCY ASSET-BACKED SECURITIES - 30.1% | | | | | |
AEP Texas Central Transition Funding III LLC, 0.88%, 12/01/17 | | $ | 395,653 | | $ | 394,082 | |
American Express Credit Account Master Trust, 1.26%, 06/15/17 | | 206,000 | | 205,573 | |
American Express Issuance Trust II, 0.78%, 03/15/18 (a) | | 1,775,000 | | 1,765,205 | |
AmeriCredit Automobile Receivables Trust | | | | | |
1.12%, 01/08/16 | | 334,645 | | 334,651 | |
0.90%, 09/08/16 | | 557,896 | | 557,077 | |
1.69%, 09/08/16 | | 1,493,000 | | 1,495,601 | |
1.31%, 11/08/17 | | 775,615 | | 775,635 | |
2.67%, 01/08/18 | | 93,742 | | 93,867 | |
0.96%, 04/09/18 | | 211,444 | | 211,357 | |
1.19%, 05/08/18 | | 775,000 | | 774,393 | |
1.58%, 09/10/18 | | 190,000 | | 190,005 | |
1.66%, 09/10/18 | | 960,000 | | 959,818 | |
1.79%, 03/08/19 | | 1,825,000 | | 1,826,537 | |
2.38%, 06/10/19 | | 219,000 | | 220,204 | |
Ascentium Equipment Receivables LLC | | | | | |
1.04%, 01/10/17 (b) | | 52,959 | | 52,931 | |
1.15%, 07/10/17 (b) | | 285,562 | | 284,852 | |
1.57%, 12/11/17 (b) | | 3,750,000 | | 3,736,895 | |
2.46%, 11/13/18 (b) | | 200,000 | | 200,791 | |
Banc of America Commercial Mortgage Trust REMIC, 5.49%, 10/10/17 | | 2,547,120 | | 2,638,068 | |
Bank of America Auto Trust, 2.99%, 03/15/19 | | 2,340,000 | | 2,344,472 | |
Bank of the West Auto Trust, 0.87%, 04/16/18 (b) | | 4,867,818 | | 4,860,062 | |
Bank of The West Auto Trust, 1.31%, 10/15/19 (b) | | 478,000 | | 475,046 | |
Bear Stearns Commercial Mortgage Securities Trust REMIC | | | | | |
5.74%, 09/11/17 (a) | | 575,656 | | 604,651 | |
5.20%, 12/11/38 | | 1,913,934 | | 1,950,837 | |
5.47%, 01/12/45 (a) | | 1,044,139 | | 1,074,646 | |
5.69%, 06/11/50 (a) | | 2,655,451 | | 2,769,443 | |
California Republic Auto Receivables Trust | | | | | |
0.63%, 02/15/16 | | 78,946 | | 78,915 | |
3.00%, 10/15/16 (b) | | 750,000 | | 756,843 | |
1.62%, 05/15/18 | | 3,000,000 | | 2,976,341 | |
1.57%, 08/15/18 | | 3,000,000 | | 2,976,473 | |
1.79%, 10/15/18 | | 1,458,000 | | 1,450,792 | |
REMIC, 0.77%, 09/15/17 | | 153,564 | | 153,396 | |
Capital One Multi-Asset Execution Trust, 0.61%, 03/15/16 (a) | | 5,557,000 | | 5,553,567 | |
CarMax Auto Owner Trust | | | | | |
2.08%, 03/15/18 | | 585,000 | | 587,710 | |
0.97%, 04/16/18 | | 1,642,283 | | 1,639,408 | |
1.91%, 03/15/19 | | 705,000 | | 706,312 | |
1.16%, 06/17/19 | | 1,826,000 | | 1,819,143 | |
Centerpoint Energy Transition Bond Co. III LLC, 4.19%, 02/01/17 | | 281,526 | | 284,334 | |
CenterPoint Energy Transition Bond Co. IV LLC, 0.90%, 04/15/17 | | 3,921,736 | | 3,910,894 | |
Chase Issuance Trust | | | | | |
0.58%, 02/15/17 (a) | | 5,952,000 | | 5,921,563 | |
0.79%, 02/15/17 (a) | | 3,523,000 | | 3,508,275 | |
Chrysler Capital Auto Receivables Trust | | | | | |
1.91%, 08/15/18 (b) | | 2,169,000 | | 2,162,113 | |
0.83%, 09/17/18 (b) | | 2,027,269 | | 2,023,385 | |
1.22%, 07/15/19 (b) | | 3,600,000 | | 3,581,070 | |
Citigroup Commercial Mortgage Trust REMIC | | | | | |
3.55%, 11/10/23 | | 1,000,000 | | 1,028,889 | |
5.43%, 10/15/49 | | 3,960,307 | | 4,013,249 | |
Citigroup/Deutsche Bank Commercial Mortgage Trust REMIC, 5.65%, 10/15/48 | | 3,000,000 | | 3,041,048 | |
CNH Equipment Trust | | | | | |
1.01%, 02/15/17 | | 6,750,000 | | 6,716,801 | |
0.99%, 11/15/18 | | 1,960,000 | | 1,944,723 | |
1.50%, 05/15/20 | | 325,000 | | 322,872 | |
COMM Mortgage Trust REMIC | | | | | |
5.80%, 07/10/17 (a) | | 2,547,654 | | 2,642,508 | |
0.72%, 09/10/17 | | 582,256 | | 578,167 | |
Commercial Mortgage Pass-Through Certificates REMIC, 5.31%, 12/10/16 | | 924,376 | | 940,816 | |
Commercial Mortgage Trust REMIC | | | | | |
3.45%, 05/15/23 | | 1,165,000 | | 1,194,892 | |
3.53%, 07/10/23 | | 517,000 | | 531,584 | |
3.65%, 11/10/23 | | 1,849,000 | | 1,900,776 | |
Credit Suisse First Boston Mortgage Securities Corp. REMIC, 5.57%, 05/15/36 (a) (b) | | 147,469 | | 147,980 | |
Dell Equipment Finance Trust | | | | | |
1.31%, 12/22/17 (a) (b) | | 3,000,000 | | 3,000,233 | |
1.30%, 03/23/20 (b) | | 842,000 | | 835,470 | |
1.81%, 03/23/20 (b) | | 481,000 | | 477,253 | |
0.94%, 06/22/20 (b) | | 1,290,000 | | 1,289,015 | |
1.36%, 06/22/20 (b) | | 100,000 | | 99,669 | |
Ford Credit Auto Owner Trust | | | | | |
1.11%, 05/15/17 | | 500,000 | | 499,001 | |
1.32%, 05/15/17 | | 440,000 | | 437,438 | |
1.95%, 04/15/18 | | 1,549,000 | | 1,549,483 | |
1.54%, 03/15/19 | | 2,500,000 | | 2,490,278 | |
1.71%, 05/15/19 | | 415,000 | | 413,648 | |
1.90%, 09/15/19 | | 185,000 | | 185,208 | |
1.97%, 04/15/20 | | 553,000 | | 553,615 | |
2.20%, 11/15/20 | | 3,000,000 | | 2,991,344 | |
Ford Credit Floorplan Master Owner Trust | | | | | |
1.50%, 09/15/16 | | 1,000,000 | | 1,001,609 | |
1.20%, 02/15/17 | | 3,111,000 | | 3,099,440 | |
1.42%, 01/15/18 | | 2,422,000 | | 2,403,169 | |
FREMF Mortgage Trust REMIC, 3.40%, 11/25/16 (a) (b) | | 229,000 | | 230,524 | |
GE Equipment Midticket LLC | | | | | |
0.95%, 04/22/16 | | 665,800 | | 665,224 | |
1.14%, 05/22/18 | | 3,000,000 | | 2,986,119 | |
GMF Floorplan Owner Revolving Trust, 0.83%, 05/15/18 (a) (b) | | 3,000,000 | | 2,989,464 | |
Golden Credit Card Trust | | | | | |
0.75%, 07/17/17 (a) (b) | | 3,000,000 | | 2,991,727 | |
2.02%, 04/15/20 (b) | | 2,922,000 | | 2,875,698 | |
GreatAmerica Leasing Receivables Funding LLC | | | | | |
1.16%, 12/15/16 (b) | | 1,365,378 | | 1,362,396 | |
0.89%, 01/15/17 (b) | | 3,702,101 | | 3,690,283 | |
1.47%, 01/15/18 (b) | | 545,000 | | 541,473 | |
1.54%, 07/20/18 (b) | | 5,180,000 | | 5,152,984 | |
2.02%, 06/21/21 (b) | | 620,000 | | 616,637 | |
Greenwich Capital Commercial Funding Corp. REMIC, 5.44%, 01/10/17 | | 593,299 | | 606,500 | |
GS Mortgage Securities Trust REMIC, 4.75%, 01/10/21 (b) | | 1,400,000 | | 1,519,132 | |
Harley-Davidson Motorcycle Trust, 1.41%, 06/15/20 | | 3,000,000 | | 2,988,570 | |
Huntington Auto Trust | | | | | |
1.07%, 06/15/16 | | 275,000 | | 274,445 | |
1.71%, 08/15/17 | | 200,000 | | 200,034 | |
Hyundai Auto Receivables Trust | | | | | |
1.42%, 12/15/16 | | 315,000 | | 314,836 | |
1.13%, 04/15/17 | | 590,000 | | 587,241 | |
1.35%, 04/15/17 | | 300,000 | | 299,266 | |
2.10%, 06/15/17 | | 2,248,000 | | 2,251,457 | |
| | | | | | | |
See accompanying Notes to Financial Statements.
| | Shares/Par † | | Value | |
1.39%, 03/15/18 | | 395,000 | | 396,089 | |
0.90%, 12/17/18 | | 2,901,510 | | 2,895,226 | |
2.02%, 08/15/19 | | 560,000 | | 561,418 | |
JPMBB Commercial Mortgage Securities Trust REMIC, 3.71%, 09/15/23 | | 1,100,000 | | 1,142,177 | |
JPMorgan Chase Commercial Mortgage Securities Trust REMIC, 3.46%, 04/15/24 | | 3,430,000 | | 3,502,089 | |
JPMorgan Mortgage Trust REMIC | | | | | |
3.00%, 04/25/22 (a) (b) | | 2,632,250 | | 2,629,825 | |
3.50%, 08/25/22 (a) (b) | | 2,922,273 | | 2,948,264 | |
3.00%, 10/25/26 (a) (b) | | 2,053,167 | | 2,080,035 | |
Kubota Credit Owner Trust REMIC | | | | | |
0.94%, 12/15/17 (b) | | 449,081 | | 448,221 | |
1.54%, 03/15/19 (b) | | 7,000,000 | | 6,955,434 | |
Merrill Lynch Mortgage Investors Trust REMIC, 1.04%, 10/25/28 (a) | | 1,011,236 | | 966,417 | |
MMCA Auto Owner Trust, 1.21%, 12/16/19 (b) | | 6,631,989 | | 6,606,560 | |
Morgan Stanley Bank of America Merrill Lynch Trust REMIC, 3.65%, 12/15/23 | | 360,000 | | 373,542 | |
Morgan Stanley Capital I Trust REMIC | | | | | |
5.92%, 07/11/17 (a) | | 2,087,853 | | 2,168,926 | |
5.33%, 11/12/41 | | 2,402,701 | | 2,421,598 | |
5.64%, 06/11/42 (a) | | 3,934,564 | | 4,110,592 | |
4.98%, 06/12/47 (a) | | 40,290 | | 40,271 | |
Sierra Receivables Funding Co. LLC | | | | | |
2.84%, 05/20/19 (b) | | 2,374,975 | | 2,385,422 | |
2.38%, 03/20/29 (b) | | 856,601 | | 856,734 | |
Sierra Timeshare Receivables Funding LLC | | | | | |
3.26%, 02/20/19 (c) (d) | | 448,716 | | 450,800 | |
3.37%, 02/20/21 (b) | | 1,843,995 | | 1,858,027 | |
2.20%, 05/20/21 (b) | | 689,837 | | 685,681 | |
2.28%, 11/20/25 (b) | | 497,818 | | 496,729 | |
3.51%, 11/20/25 (b) | | 420,233 | | 420,640 | |
3.35%, 04/20/26 (b) | | 83,241 | | 83,303 | |
2.30%, 10/20/31 (b) | | 344,216 | | 343,349 | |
Springleaf Mortgage Loan Trust REMIC, 1.87%, 09/25/57 (a) (b) | | 1,591,629 | | 1,586,903 | |
SunTrust Auto Receivables Trust, 1.42%, 04/16/18 (b) | | 3,000,000 | | 2,969,504 | |
UBS-Barclays Commercial Mortgage Trust REMIC, 2.69%, 11/10/22 | | 900,000 | | 899,993 | |
USAA Auto Owner Trust, 1.34%, 08/17/20 | | 1,000,000 | | 996,054 | |
Volvo Financial Equipment LLC | | | | | |
0.74%, 01/15/16 (b) | | 77,959 | | 77,958 | |
0.95%, 11/15/17 (b) | | 951,933 | | 950,970 | |
0.82%, 04/16/18 (b) | | 2,311,031 | | 2,304,304 | |
1.51%, 06/17/19 (b) | | 3,275,000 | | 3,270,083 | |
Wells Fargo Mortgage-Backed Securities Trust REMIC | | | | | |
2.85%, 12/25/34 (a) | | 577,190 | | 567,634 | |
2.74%, 06/25/35 (a) | | 501,188 | | 504,296 | |
World Omni Auto Receivables Trust, 1.49%, 04/15/16 | | 565,000 | | 565,603 | |
World Omni Automobile Lease Securitization Trust, 1.54%, 02/15/18 | | 3,000,000 | | 2,978,921 | |
Total Non-U.S. Government Agency Asset- Backed Securities (cost $217,949,118) | | | | 215,861,013 | |
CORPORATE BONDS AND NOTES - 52.4% | | | | | |
CONSUMER DISCRETIONARY - 1.4% | | | | | |
CCO Safari II LLC, 3.58%, 07/23/20 (b) | | 3,000,000 | | 2,982,816 | |
Dollar General Corp., 1.88%, 04/15/18 | | 1,484,000 | | 1,469,725 | |
Mattel Inc., 2.50%, 11/01/16 | | 1,000,000 | | 1,009,779 | |
MGM Resorts International, 7.50%, 06/01/16 (e) | | 2,000,000 | | 2,036,880 | |
Time Warner Cable Inc., 6.75%, 07/01/18 | | 2,500,000 | | 2,728,183 | |
| | | | 10,227,383 | |
CONSUMER STAPLES - 3.4% | | | | | |
Altria Group Inc., 2.63%, 01/14/20 | | 5,000,000 | | 5,009,115 | |
Bunge Ltd. Finance Corp., 3.20%, 06/15/17 | | 3,000,000 | | 3,029,520 | |
HJ Heinz Co., 2.80%, 07/02/20 (b) | | 5,500,000 | | 5,487,108 | |
JM Smucker Co., 2.50%, 03/15/20 (e) | | 902,000 | | 895,662 | |
Kroger Co. | | | | | |
0.85%, 10/17/16 (a) | | 1,000,000 | | 999,362 | |
1.20%, 10/17/16 | | 2,844,000 | | 2,838,414 | |
Reynolds American Inc., 3.25%, 06/12/20 | | 3,500,000 | | 3,557,417 | |
WM Wrigley Jr. Co. | | | | | |
1.40%, 10/21/16 (b) | | 1,909,000 | | 1,907,017 | |
2.00%, 10/20/17 (b) | | 468,000 | | 468,782 | |
| | | | 24,192,397 | |
ENERGY - 2.5% | | | | | |
Anadarko Petroleum Corp., 6.38%, 09/15/17 | | 3,000,000 | | 3,145,803 | |
Canadian Natural Resources Ltd., 5.70%, 05/15/17 | | 1,000,000 | | 1,021,342 | |
Chevron Phillips Chemical Co. LLC, 1.70%, 05/01/18 (b) | | 3,000,000 | | 2,962,773 | |
Energy Transfer Partners LP, 4.15%, 10/01/20 | | 3,000,000 | | 2,768,640 | |
EnLink Midstream Partners LP, 2.70%, 04/01/19 | | 2,000,000 | | 1,824,780 | |
Enterprise Products Operating LLC, 1.65%, 05/07/18 | | 3,500,000 | | 3,414,323 | |
Shell International Finance BV, 1.25%, 11/10/17 (e) | | 3,000,000 | | 2,984,400 | |
| | | | 18,122,061 | |
FINANCIALS - 31.9% | | | | | |
Abbey National Treasury Services Plc, 2.35%, 09/10/19 | | 2,308,000 | | 2,310,460 | |
ABN AMRO Bank NV, 4.25%, 02/02/17 (b) | | 5,550,000 | | 5,699,245 | |
AerCap Ireland Capital Ltd., 2.75%, 05/15/17 (e) | | 2,698,000 | | 2,681,137 | |
Ally Financial Inc. | | | | | |
2.75%, 01/30/17 | | 3,000,000 | | 2,992,500 | |
3.25%, 11/05/18 (e) | | 2,000,000 | | 1,962,500 | |
American Express Credit Corp., 2.38%, 05/26/20 | | 3,390,000 | | 3,365,331 | |
Bank of America Corp. | | | | | |
3.63%, 03/17/16 | | 655,000 | | 658,367 | |
6.50%, 08/01/16 | | 1,500,000 | | 1,543,713 | |
6.00%, 09/01/17 | | 5,000,000 | | 5,320,940 | |
Bank of America NA | | | | | |
5.30%, 03/15/17 | | 1,500,000 | | 1,560,390 | |
1.65%, 03/26/18 | | 436,000 | | 433,032 | |
1.75%, 06/05/18 | | 527,000 | | 524,037 | |
Bank of Montreal, 1.80%, 07/31/18 | | 3,000,000 | | 2,993,721 | |
Barclays Plc, 2.75%, 11/08/19 | | 3,000,000 | | 2,989,041 | |
BioMed Realty LP, 3.85%, 04/15/16 | | 300,000 | | 300,917 | |
Brandywine Operating Partnership LP, 5.70%, 05/01/17 | | 850,000 | | 886,594 | |
Caisse Centrale Desjardins, 1.55%, 09/12/17 (b) | | 3,000,000 | | 2,980,365 | |
Camden Property Trust, 5.70%, 05/15/17 (f) | | 825,000 | | 861,441 | |
Capital One Bank USA NA | | | | | |
1.20%, 02/13/17 | | 2,000,000 | | 1,990,120 | |
2.25%, 02/13/19 | | 4,500,000 | | 4,481,212 | |
2.40%, 09/05/19 | | 2,627,000 | | 2,599,348 | |
Caterpillar Financial Services Corp., 2.25%, 12/01/19 | | 3,000,000 | | 3,008,067 | |
Citigroup Inc. | | | | | |
0.75%, 06/09/16 (a) | | 4,000,000 | | 3,988,216 | |
1.35%, 03/10/17 | | 2,000,000 | | 1,992,450 | |
1.80%, 02/05/18 | | 1,525,000 | | 1,519,695 | |
2.50%, 09/26/18 | | 627,000 | | 632,456 | |
See accompanying Notes to Financial Statements.
| | Shares/Par † | | Value | |
CNH Capital LLC, 6.25%, 11/01/16 | | 2,000,000 | | 2,037,500 | |
CNH Industrial America LLC, 7.25%, 01/15/16 | | 3,000,000 | | 3,004,611 | |
CommonWealth REIT, 6.25%, 08/15/16 | | 430,000 | | 431,830 | |
Compass Bank, 1.85%, 09/29/17 | | 2,000,000 | | 1,982,858 | |
Corp. Andina de Fomento, 1.50%, 08/08/17 | | 2,250,000 | | 2,238,401 | |
Countrywide Financial Corp., 6.25%, 05/15/16 | | 1,560,000 | | 1,586,278 | |
Daimler Finance North America LLC | | | | | |
0.84%, 03/02/18 (a) (b) (e) | | 2,500,000 | | 2,471,653 | |
2.00%, 08/03/18 (b) | | 3,000,000 | | 2,980,242 | |
Discover Bank | | | | | |
2.00%, 02/21/18 | | 6,500,000 | | 6,457,041 | |
2.60%, 11/13/18 (e) | | 1,277,000 | | 1,276,238 | |
Equity Commonwealth, 6.25%, 06/15/17 | | 1,800,000 | | 1,859,105 | |
Equity One Inc., 6.25%, 01/15/17 | | 3,053,000 | | 3,179,281 | |
ERP Operating LP, 2.38%, 07/01/19 | | 2,000,000 | | 2,005,554 | |
Fifth Third Bank, 2.38%, 04/25/19 | | 2,000,000 | | 2,006,820 | |
First Horizon National Corp., 3.50%, 12/15/20 | | 3,500,000 | | 3,470,120 | |
Ford Motor Credit Co. LLC | | | | | |
1.50%, 01/17/17 | | 6,000,000 | | 5,957,760 | |
2.55%, 10/05/18 | | 2,000,000 | | 1,985,758 | |
1.26%, 11/04/19 (a) | | 2,000,000 | | 1,942,548 | |
General Motors Financial Co. Inc. | | | | | |
2.40%, 04/10/18 (e) | | 3,540,000 | | 3,522,562 | |
3.20%, 07/13/20 | | 2,000,000 | | 1,969,202 | |
Glencore Funding LLC, 1.57%, 05/27/16 (a) (b) | | 1,470,000 | | 1,446,155 | |
Goldman Sachs Group Inc. | | | | | |
5.38% (callable at 100 beginning 05/10/20) (g) | | 1,675,000 | | 1,664,531 | |
2.38%, 01/22/18 | | 2,500,000 | | 2,521,768 | |
2.75%, 09/15/20 (e) | | 2,000,000 | | 1,999,120 | |
HBOS Plc, 6.75%, 05/21/18 (b) | | 3,000,000 | | 3,272,301 | |
HCP Inc., 6.30%, 09/15/16 | | 1,500,000 | | 1,550,750 | |
Highwoods Realty LP, 5.85%, 03/15/17 | | 1,000,000 | | 1,042,497 | |
Hospitality Properties Trust | | | | | |
6.30%, 06/15/16 | | 1,500,000 | | 1,505,127 | |
5.63%, 03/15/17 | | 3,352,000 | | 3,466,910 | |
6.70%, 01/15/18 | | 1,978,000 | | 2,092,655 | |
HSBC USA Inc. | | | | | |
0.87%, 03/03/17 (a) | | 2,045,000 | | 2,041,002 | |
2.63%, 09/24/18 | | 3,000,000 | | 3,043,647 | |
Huntington Bancshares Inc., 2.88%, 08/20/20 | | 3,166,000 | | 3,143,103 | |
International Lease Finance Corp., 5.75%, 05/15/16 | | 1,000,000 | | 1,013,750 | |
Intesa Sanpaolo SpA | | | | | |
3.13%, 01/15/16 | | 3,640,000 | | 3,643,079 | |
2.38%, 01/13/17 | | 2,650,000 | | 2,658,536 | |
JPMorgan Chase & Co. | | | | | |
5.30% (callable at 100 beginning 05/01/20) (g) | | 3,000,000 | | 2,988,750 | |
0.87%, 04/25/18 (a) | | 3,000,000 | | 2,979,051 | |
2.55%, 10/29/20 | | 3,000,000 | | 2,973,291 | |
Liberty Property LP, 5.50%, 12/15/16 | | 3,405,000 | | 3,516,899 | |
Lloyds Bank Plc, 4.20%, 03/28/17 | | 2,000,000 | | 2,061,530 | |
Mid-America Apartments LP, 6.05%, 09/01/16 | | 800,000 | | 820,658 | |
Mizuho Bank Ltd., 1.70%, 09/25/17 (b) | | 3,000,000 | | 2,985,459 | |
Morgan Stanley | | | | | |
4.75%, 03/22/17 | | 3,054,000 | | 3,163,342 | |
5.55%, 04/27/17 | | 4,000,000 | | 4,197,120 | |
2.65%, 01/27/20 | | 1,562,000 | | 1,558,298 | |
2.80%, 06/16/20 | | 2,000,000 | | 2,007,124 | |
PPF Funding Inc., 5.70%, 04/15/17 (b) | | 1,273,000 | | 1,316,125 | |
Pricoa Global Funding I, 1.90%, 09/21/18 (b) | | 3,000,000 | | 2,989,482 | |
Prologis International Funding II, 4.88%, 02/15/20 (b) | | 2,400,000 | | 2,532,060 | |
Reliance Standard Life Global Funding II, 2.15%, 10/15/18 (b) | | 2,500,000 | | 2,485,273 | |
Royal Bank of Scotland Plc | | | | | |
4.38%, 03/16/16 | | 260,000 | | 261,696 | |
1.88%, 03/31/17 (e) | | 7,000,000 | | 6,970,943 | |
Santander Holdings USA Inc., 4.63%, 04/19/16 | | 2,000,000 | | 2,017,546 | |
Skandinaviska Enskilda Banken AB, 2.63%, 11/17/20 (b) | | 3,000,000 | | 2,990,523 | |
SLM Corp., 6.25%, 01/25/16 (e) | | 1,000,000 | | 1,001,537 | |
SunTrust Bank, 1.35%, 02/15/17 | | 4,000,000 | | 3,991,648 | |
Toronto-Dominion Bank | | | | | |
1.75%, 07/23/18 | | 3,000,000 | | 2,996,127 | |
2.50%, 12/14/20 | | 2,000,000 | | 1,999,104 | |
UBS AG | | | | | |
1.38%, 06/01/17 | | 3,604,000 | | 3,587,072 | |
1.80%, 03/26/18 | | 1,250,000 | | 1,247,985 | |
UBS Group AG, 2.95%, 09/24/20 (b) | | 1,852,000 | | 1,834,908 | |
Union Bank NA, 2.63%, 09/26/18 | | 3,000,000 | | 3,029,469 | |
Wells Fargo & Co. | | | | | |
0.57%, 05/16/16 (a) | | 1,500,000 | | 1,499,031 | |
2.15%, 01/30/20 (e) | | 3,000,000 | | 2,974,770 | |
2.55%, 12/07/20 | | 2,000,000 | | 1,989,970 | |
Westpac Banking Corp., 0.82%, 05/25/18 (a) | | 3,000,000 | | 2,981,022 | |
| | | | 228,693,401 | |
HEALTH CARE - 3.8% | | | | | |
AbbVie Inc. | | | | | |
1.80%, 05/14/18 | | 2,273,000 | | 2,262,683 | |
2.50%, 05/14/20 | | 3,500,000 | | 3,465,399 | |
Actavis Funding SCS | | | | | |
1.30%, 06/15/17 | | 3,500,000 | | 3,466,865 | |
2.45%, 06/15/19 | | 1,000,000 | | 989,340 | |
Gilead Sciences Inc., 2.55%, 09/01/20 (e) | | 3,500,000 | | 3,500,322 | |
Mylan Inc., 1.35%, 11/29/16 | | 5,000,000 | | 4,958,200 | |
Perrigo Co. Plc, 1.30%, 11/08/16 | | 2,523,000 | | 2,505,261 | |
Thermo Fisher Scientific Inc., 2.40%, 02/01/19 | | 1,307,000 | | 1,306,778 | |
UnitedHealth Group Inc., 0.77%, 01/17/17 (a) | | 3,000,000 | | 3,002,001 | |
Ventas Realty LP, 1.55%, 09/26/16 | | 1,895,000 | | 1,896,345 | |
| | | | 27,353,194 | |
INDUSTRIALS - 2.4% | | | | | |
BAE Systems Holdings Inc., 2.85%, 12/15/20 (b) (e) | | 2,644,000 | | 2,638,368 | |
Cobham Plc, 2.68%, 10/28/17 (d) (h) | | 2,500,000 | | 2,484,450 | |
Eaton Corp., 1.50%, 11/02/17 | | 3,000,000 | | 2,981,214 | |
Lockheed Martin Corp., 2.50%, 11/23/20 | | 3,500,000 | | 3,487,684 | |
Penske Truck Leasing Co. LP | | | | | |
3.75%, 05/11/17 (b) | | 2,000,000 | | 2,040,334 | |
3.05%, 01/09/20 (b) | | 2,000,000 | | 1,984,184 | |
Union Pacific Corp., 1.80%, 02/01/20 | | 1,304,000 | | 1,283,882 | |
| | | | 16,900,116 | |
INFORMATION TECHNOLOGY - 1.2% | | | | | |
Hewlett Packard Enterprise Co., 2.45%, 10/05/17 (b) | | 3,500,000 | | 3,497,204 | |
Visa Inc., 2.20%, 12/14/20 | | 5,000,000 | | 4,996,200 | |
| | | | 8,493,404 | |
MATERIALS - 2.4% | | | | | |
Anglo American Capital Plc, 1.27%, 04/15/16 (a) (b) | | 1,216,000 | | 1,204,103 | |
Freeport-McMoRan Inc., 2.15%, 03/01/17 | | 2,000,000 | | 1,830,000 | |
LyondellBasell Industries NV, 5.00%, 04/15/19 | | 6,000,000 | | 6,382,632 | |
Martin Marietta Materials Inc., 1.70%, 06/30/17 (a) | | 3,468,000 | | 3,443,873 | |
Monsanto Co., 2.13%, 07/15/19 | | 2,500,000 | | 2,497,025 | |
Xstrata Finance Canada Ltd., 2.70%, 10/25/17 (b) (e) (i) | | 2,000,000 | | 1,830,000 | |
| | | | 17,187,633 | |
See accompanying Notes to Financial Statements.
| | Shares/Par † | | Value | |
TELECOMMUNICATION SERVICES - 0.8% | | | | | |
AT&T Inc., 2.45%, 06/30/20 | | 3,000,000 | | 2,955,609 | |
Verizon Communications Inc., 2.63%, 02/21/20 | | 3,000,000 | | 3,011,010 | |
| | | | 5,966,619 | |
UTILITIES - 2.6% | | | | | |
Berkshire Hathaway Energy Co., 2.40%, 02/01/20 | | 3,000,000 | | 2,972,103 | |
Dominion Gas Holdings LLC, 2.50%, 12/15/19 | | 2,000,000 | | 1,998,088 | |
Exelon Corp. | | | | | |
1.55%, 06/09/17 | | 3,000,000 | | 2,987,469 | |
2.85%, 06/15/20 | | 1,395,000 | | 1,387,756 | |
Exelon Generation Co. LLC, 2.95%, 01/15/20 (e) | | 767,000 | | 764,481 | |
NextEra Energy Capital Holdings Inc., 1.59%, 06/01/17 | | 3,000,000 | | 2,989,206 | |
Northeast Utilities, 1.60%, 01/15/18 | | 2,000,000 | | 1,979,066 | |
Southern California Edison Co. | | | | | |
1.13%, 05/01/17 | | 1,517,000 | | 1,507,167 | |
1.85%, 02/01/22 | | 1,954,643 | | 1,936,597 | |
| | | | 18,521,933 | |
Total Corporate Bonds and Notes (cost $378,042,486) | | | | 375,658,141 | |
GOVERNMENT AND AGENCY OBLIGATIONS - 16.2% | | | | | |
GOVERNMENT SECURITIES - 13.2% | | | | | |
Federal Home Loan Bank - 1.2% (j) | | | | | |
Federal Home Loan Bank | | | | | |
2.00%, 09/09/16 | | 3,835,000 | | 3,867,367 | |
1.13%, 12/08/17 | | 1,000,000 | | 999,601 | |
2.63%, 12/08/17 | | 2,000,000 | | 2,053,986 | |
3.13%, 12/08/17 | | 1,315,000 | | 1,361,434 | |
| | | | 8,282,388 | |
Federal Home Loan Mortgage Corp. - 2.2% (j) | | | | | |
Federal Home Loan Mortgage Corp. | | | | | |
1.00%, 03/08/17 - 12/15/17 | | 6,000,000 | | 5,987,905 | |
0.88%, 03/07/18 | | 7,000,000 | | 6,951,441 | |
1.75%, 05/30/19 | | 1,000,000 | | 1,007,652 | |
1.25%, 10/02/19 | | 2,000,000 | | 1,973,174 | |
| | | | 15,920,172 | |
Federal National Mortgage Association - 1.5% (j) | | | | | |
Federal National Mortgage Association | | | | | |
1.13%, 04/27/17 - 12/14/18 | | 6,200,000 | | 6,164,211 | |
0.88%, 10/26/17 | | 4,930,000 | | 4,908,619 | |
| | | | 11,072,830 | |
Sovereign - 0.6% | | | | | |
Korea Land & Housing Corp., 1.88%, 08/02/17 (b) | | 1,905,000 | | 1,900,613 | |
Kreditanstalt fur Wiederaufbau, 0.50%, 07/15/16 | | 2,193,000 | | 2,189,318 | |
| | | | 4,089,931 | |
U.S. Treasury Securities - 7.7% | | | | | |
U.S. Treasury Note | | | | | |
0.63%, 12/31/16 - 09/30/17 | | 25,577,000 | | 25,417,783 | |
0.88%, 11/30/17 (e) | | 6,250,000 | | 6,232,513 | |
1.00%, 12/31/17 | | 3,250,000 | | 3,246,305 | |
0.75%, 04/15/18 | | 13,100,000 | | 12,974,174 | |
0.88%, 10/15/18 | | 7,500,000 | | 7,418,108 | |
| | | | 55,288,883 | |
U.S. GOVERNMENT AGENCY MORTGAGE-BACKED SECURITIES - 3.0% | | | | | |
Federal Home Loan Mortgage Corp. - 0.9% | | | | | |
Federal Home Loan Mortgage Corp. | | | | | |
4.00%, 02/01/26 | | 214,608 | | 226,463 | |
2.50%, 02/15/31, TBA (k) | | 4,000,000 | | 4,026,908 | |
REMIC, 4.00%, 12/15/38 | | 100,000 | | 105,970 | |
REMIC, 3.00%, 02/15/39 | | 1,188,596 | | 1,208,843 | |
REMIC, 2.00%, 03/15/41 | | 925,123 | | 904,037 | |
| | | | 6,472,221 | |
Federal National Mortgage Association - 1.9% | | | | | |
Federal National Mortgage Association | | | | | |
4.00%, 04/01/26 - 01/01/31 | | 2,290,986 | | 2,429,610 | |
4.50%, 05/01/26 | | 180,955 | | 194,928 | |
3.50%, 03/01/27 - 03/01/30 | | 4,119,832 | | 4,327,182 | |
3.00%, 05/01/30 | | 1,839,757 | | 1,896,504 | |
2.73%, 02/01/44 (a) | | 1,592,199 | | 1,636,062 | |
3.08%, 04/01/45 (a) | | 1,803,130 | | 1,851,272 | |
REMIC, 4.00%, 09/25/29 | | 173,000 | | 177,751 | |
REMIC, 2.50%, 01/25/41 | | 451,686 | | 455,475 | |
REMIC, 2.00%, 03/25/42 | | 683,046 | | 679,470 | |
| | | | 13,648,254 | |
Government National Mortgage Association - 0.2% | | | | | |
Government National Mortgage Association | | | | | |
2.50%, 11/20/42 (a) | | 512,335 | | 524,925 | |
REMIC, 4.50%, 11/20/39 | | 994,138 | | 1,053,801 | |
| | | | 1,578,726 | |
Total Government and Agency Obligations (cost $116,786,967) | | | | 116,353,405 | |
SHORT TERM INVESTMENTS - 5.2% | | | | | |
Investment Company - 2.7% | | | | | |
JNL Money Market Fund, 0.19% (l) (m) | | 19,694,333 | | 19,694,333 | |
Securities Lending Collateral - 2.5% | | | | | |
State Street Navigator Securities Lending Prime Portfolio, 0.29% (l) | | 18,228,193 | | 18,228,193 | |
Total Short Term Investments (cost $37,922,526) | | | | 37,922,526 | |
Total Investments - 103.9% (cost $750,701,097) | | | | 745,795,085 | |
Other Assets and Liabilities, Net - (3.9%) | | | | (28,229,234 | ) |
Total Net Assets - 100.0% | | | | $ | 717,565,851 | |
| | | | | | |
(a) | Variable rate security. Rate stated was in effect as of December 31, 2015. |
(b) | The Sub-Adviser has deemed this security which is exempt from registration under the Securities Act of 1933 (“1933 Act”), as amended, to be liquid based on procedures approved by the Board. As of December 31, 2015, the aggregate value of these liquid securities was $150,798,960 which represented 21.0% of net assets. |
(c) | Security is restricted to resale to institutional investors. See Restricted Securities in the Notes to Schedules of Investments. |
(d) | The Sub-Adviser has deemed this security to be illiquid based on procedures approved by the Trust’s Board of Trustees. |
(e) | All or a portion of the security was on loan. |
(f) | The interest rate for this security is inversely affected by upgrades or downgrades to the credit rating of the issuer. |
(g) | Perpetual security. |
(h) | Security fair valued in good faith in accordance with the procedures approved by the Trust’s Board of Trustees. Good faith fair valued securities may be classified as Level 2 or Level 3 for Financial Accounting Standards Board (“FASB”) Accounting Standards Codification (“ASC”) Topic 820 “Fair Value Measurement,” based on applicable valuation inputs. See FASB Topic 820 in the Notes to Financial Statements. |
(i) | Security is a “step-up” bond where the coupon may increase or step up at a future date or as the result of an upgrade or downgrade to the credit rating of the issuer. Rate stated was the coupon as of December 31, 2015. |
(j) | Securities in this category are direct debt of the agency and not collateralized by mortgages. |
See accompanying Notes to Financial Statements.
(k) | All or a portion of the investment was purchased on a delayed delivery basis. As of December 31, 2015, the total payable of investments purchased on a delayed delivery basis was $4,027,500. |
(l) | Yield changes daily to reflect current market conditions. Rate was the quoted yield as of December 31, 2015. |
(m) | Investment in affiliate. |
| | Shares/Par † | | Value | |
JNL/PPM America Total Return Fund | | | | | |
NON-U.S. GOVERNMENT AGENCY ASSET-BACKED SECURITIES - 5.3% | | | | | |
American Airlines Pass-Through Trust | | | | | |
5.60%, 07/15/20 (a) | | $ | 2,879,857 | | $ | 2,937,454 | |
4.95%, 01/15/23 | | 1,457,086 | | 1,537,226 | |
American Tower Trust I, 3.07%, 03/15/23 (a) | | 6,596,000 | | 6,458,752 | |
AmeriCredit Automobile Receivables Trust | | | | | |
1.31%, 11/08/17 | | 238,227 | | 238,234 | |
1.07%, 03/08/18 | | 778,973 | | 778,338 | |
Banc of America Commercial Mortgage Trust REMIC, 5.74%, 07/10/17 (b) | | 549,678 | | 571,877 | |
Banc of America Re-REMIC Trust REMIC, 3.49%, 04/16/25 (a) | | 1,985,000 | | 1,944,503 | |
Bear Stearns Commercial Mortgage Securities Trust REMIC | | | | | |
5.74%, 09/11/17 (b) | | 488,672 | | 513,286 | |
5.69%, 06/11/50 (b) | | 1,419,410 | | 1,480,342 | |
Citigroup Mortgage Loan Trust REMIC, 3.50%, 08/25/23 (a) | | 2,756,668 | | 2,747,967 | |
CNH Equipment Trust, 1.05%, 05/15/18 | | 3,000,000 | | 2,980,945 | |
Continental Airlines Inc. Pass-Through Trust | | | | | |
6.25%, 04/11/20 | | 565,937 | | 594,233 | |
4.15%, 04/11/24 | | 1,810,908 | | 1,857,992 | |
4.00%, 10/29/24 | | 1,593,918 | | 1,633,765 | |
Crown Castle Towers LLC, 4.88%, 08/15/20 (a) | | 1,450,000 | | 1,550,153 | |
DBUBS Mortgage Trust REMIC, 3.74%, 06/01/17 (a) | | 768,978 | | 770,357 | |
Dell Equipment Finance Trust | | | | | |
1.30%, 03/23/20 (a) | | 1,177,000 | | 1,167,872 | |
1.81%, 03/23/20 (a) | | 867,000 | | 860,247 | |
0.94%, 06/22/20 (a) | | 565,000 | | 564,569 | |
1.36%, 06/22/20 (a) | | 166,000 | | 165,451 | |
Delta Air Lines Inc. Pass-Through Trust | | | | | |
6.20%, 07/02/18 | | 678 | | 726 | |
4.95%, 05/23/19 | | 145,585 | | 152,864 | |
Ford Credit Auto Owner Trust | | | | | |
1.97%, 04/15/20 | | 1,256,000 | | 1,257,397 | |
2.21%, 01/15/21 | | 1,009,000 | | 1,001,500 | |
Ford Credit Floorplan Master Owner Trust, 1.40%, 08/15/17 | | 5,420,000 | | 5,395,253 | |
Greenwich Capital Commercial Funding Corp. REMIC, 5.44%, 01/10/17 | | 117,310 | | 119,920 | |
JPMorgan Chase Commercial Mortgage Securities Trust REMIC, 5.69%, 04/12/17 (b) | | 1,791,308 | | 1,847,534 | |
JPMorgan Mortgage Trust REMIC, 3.00%, 10/25/26 (a) (b) | | 2,463,801 | | 2,496,042 | |
Morgan Stanley Capital I Trust REMIC, 5.92%, 07/11/17 (b) | | 3,966,922 | | 4,120,960 | |
Morgan Stanley Re-REMIC Trust REMIC, 5.99%, 04/12/17 (a) (b) | | 1,281,489 | | 1,316,445 | |
MVW Owner Trust, 2.15%, 04/22/30 (a) | | 736,232 | | 723,906 | |
SBA Tower Trust, 2.90%, 10/15/44 (a) | | 5,000,000 | | 4,886,948 | |
Sierra Receivables Funding Co. LLC | | | | | |
2.84%, 05/20/19 (a) | | 292,122 | | 293,407 | |
2.38%, 03/20/29 (a) | | 155,730 | | 155,754 | |
United Air Lines Pass-Through Trust, 9.75%, 01/15/17 | | 39,437 | | 41,606 | |
Total Non-U.S. Government Agency Asset- Backed Securities (cost $55,262,485) | | | | 55,163,825 | |
CORPORATE BONDS AND NOTES - 56.4% | | | | | |
CONSUMER DISCRETIONARY - 4.7% | | | | | |
A&E Television Networks LLC | | | | | |
3.11%, 08/22/19 (c) (d) | | 1,000,000 | | 966,944 | |
3.63%, 08/22/22 (c) (d) | | 1,000,000 | | 950,294 | |
3.78%, 08/22/24 (c) (d) | | 1,000,000 | | 937,541 | |
ARAMARK Services Inc., 5.13%, 01/15/24 (a) | | 374,000 | | 381,013 | |
British Sky Broadcasting Group Plc | | | | | |
2.63%, 09/16/19 (a) | | 1,435,000 | | 1,428,911 | |
3.75%, 09/16/24 (a) | | 1,970,000 | | 1,925,161 | |
CCO Holdings LLC, 5.88%, 05/01/27 (a) | | 1,500,000 | | 1,492,500 | |
CCO Safari II LLC | | | | | |
6.38%, 10/23/35 (a) | | 3,335,000 | | 3,365,799 | |
6.83%, 10/23/55 (a) | | 3,550,000 | | 3,492,962 | |
Comcast Corp., 3.38%, 08/15/25 | | 1,270,000 | | 1,286,476 | |
Delphi Automotive Plc, 3.15%, 11/19/20 | | 675,000 | | 674,201 | |
Delphi Corp., 5.00%, 02/15/23 | | 1,867,000 | | 1,975,286 | |
Dollar General Corp., 3.25%, 04/15/23 | | 915,000 | | 871,450 | |
General Motors Co. | | | | | |
5.00%, 04/01/35 | | 3,500,000 | | 3,262,438 | |
6.25%, 10/02/43 | | 1,285,000 | | 1,355,852 | |
Grupo Televisa SAB, 6.13%, 01/31/46 | | 1,709,000 | | 1,698,917 | |
KB Home | | | | | |
4.75%, 05/15/19 | | 2,316,000 | | 2,246,520 | |
7.50%, 09/15/22 (e) | | 409,000 | | 406,955 | |
Levi Strauss & Co., 5.00%, 05/01/25 (e) | | 726,000 | | 722,370 | |
NAI Entertainment Holdings, 5.00%, 08/01/18 (a) | | 228,000 | | 231,420 | |
NBCUniversal Enterprise Inc., 5.25%, (callable at 100 beginning 03/19/21) (a) (f) | | 1,589,000 | | 1,684,340 | |
Numericable Group SA | | | | | |
4.88%, 05/15/19 (a) | | 1,247,000 | | 1,236,089 | |
5.38%, 05/15/22 (a), EUR | | 1,000,000 | | 1,108,491 | |
NVR Inc., 3.95%, 09/15/22 | | 4,573,000 | | 4,613,009 | |
Sally Holdings LLC, 5.63%, 12/01/25 | | 498,000 | | 502,980 | |
Schaeffler Finance BV | | | | | |
3.25%, 05/15/19 (a), EUR | | 1,296,000 | | 1,424,280 | |
3.50%, 05/15/22 (a), EUR | | 570,000 | | 632,645 | |
Schaeffler Holding Finance BV, 5.75%, 11/15/21 (a), EUR | | 1,007,000 | | 1,172,336 | |
Scientific Games International Inc., 7.00%, 01/01/22 (a) | | 1,022,000 | | 976,010 | |
Seminole Indian Tribe of Florida, 6.54%, 10/01/20 (a) | | 720,000 | | 748,800 | |
SES SA | | | | | |
3.60%, 04/04/23 (a) | | 652,000 | | 635,126 | |
5.30%, 04/04/43 (a) | | 464,000 | | 445,713 | |
Sirius XM Radio Inc., 6.00%, 07/15/24 (a) | | 2,926,000 | | 3,057,670 | |
Tenneco Inc., 5.38%, 12/15/24 | | 1,065,000 | | 1,080,975 | |
Time Warner Cable Inc., 6.75%, 06/15/39 | | 371,000 | | 372,319 | |
| | | | 49,363,793 | |
CONSUMER STAPLES - 2.3% | | | | | |
Bunge Ltd. Finance Co., 8.50%, 06/15/19 (g) | | 100,000 | | 115,755 | |
CVS Health Corp. | | | | | |
4.75%, 12/01/22 (a) | | 266,000 | | 285,054 | |
5.00%, 12/01/24 (a) | | 174,000 | | 188,341 | |
HJ Heinz Co. | | | | | |
3.95%, 07/15/25 (a) (e) | | 1,981,000 | | 2,000,178 | |
5.00%, 07/15/35 (a) | | 1,605,000 | | 1,644,478 | |
5.20%, 07/15/45 (a) | | 1,941,000 | | 2,026,779 | |
| | | | | | | |
See accompanying Notes to Financial Statements.
| | Shares/Par † | | Value | |
JBS Investments GmbH, 7.25%, 04/03/24 (a) (e) | | 1,276,000 | | 1,157,970 | |
JM Smucker Co. | | | | | |
2.50%, 03/15/20 | | 631,000 | | 626,566 | |
3.50%, 03/15/25 | | 868,000 | | 864,040 | |
4.38%, 03/15/45 (e) | | 816,000 | | 793,899 | |
Mars Inc. | | | | | |
2.19%, 10/11/17 (c) (d) | | 2,850,000 | | 2,855,657 | |
3.74%, 10/11/27 (c) (d) | | 1,200,000 | | 1,214,576 | |
Post Holdings Inc., 8.00%, 07/15/25 (a) | | 2,222,000 | | 2,355,320 | |
Reynolds American Inc. | | | | | |
3.25%, 06/12/20 | | 1,000,000 | | 1,016,405 | |
4.45%, 06/12/25 | | 2,316,000 | | 2,423,502 | |
5.70%, 08/15/35 | | 975,000 | | 1,068,214 | |
7.00%, 08/04/41 | | 812,000 | | 912,622 | |
Tyson Foods Inc. | | | | | |
3.95%, 08/15/24 | | 679,000 | | 697,195 | |
4.88%, 08/15/34 | | 1,010,000 | | 1,030,140 | |
5.15%, 08/15/44 | | 549,000 | | 573,320 | |
| | | | 23,850,011 | |
ENERGY - 5.7% | | | | | |
Access Midstream Partners LP, 4.88%, 05/15/23 | | 133,000 | | 107,829 | |
California Resources Corp. | | | | | |
5.00%, 01/15/20 (e) | | 437,000 | | 155,681 | |
5.50%, 09/15/21 (e) | | 512,000 | | 161,280 | |
8.00%, 12/15/22 (a) (e) | | 3,661,000 | | 1,926,601 | |
6.00%, 11/15/24 (e) | | 418,000 | | 127,490 | |
Calumet Specialty Products Partners LP, 6.50%, 04/15/21 | | 2,025,000 | | 1,761,750 | |
Chesapeake Energy Corp., 8.00%, 12/15/22 (a) | | 1,750,000 | | 857,500 | |
CITGO Holding Inc., 10.75%, 02/15/20 (a) | | 2,694,000 | | 2,613,180 | |
Columbia Pipeline Group Inc. | | | | | |
3.30%, 06/01/20 (a) | | 743,000 | | 723,757 | |
4.50%, 06/01/25 (a) | | 746,000 | | 676,161 | |
5.80%, 06/01/45 (a) | | 933,000 | | 818,976 | |
Concho Resources Inc., 5.50%, 04/01/23 | | 1,664,000 | | 1,539,200 | |
Continental Resources Inc., 4.50%, 04/15/23 | | 876,000 | | 629,737 | |
DCP Midstream LLC, 5.85%, 05/21/43 (a) (b) | | 2,485,000 | | 1,901,025 | |
Devon Energy Corp., 5.85%, 12/15/25 (e) | | 2,293,000 | | 2,230,243 | |
Energy Transfer Partners LP | | | | | |
4.75%, 01/15/26 | | 1,379,000 | | 1,186,915 | |
4.90%, 03/15/35 | | 1,950,000 | | 1,417,133 | |
5.15%, 03/15/45 | | 1,189,000 | | 840,493 | |
6.13%, 12/15/45 | | 2,600,000 | | 2,115,482 | |
Energy XXI Gulf Coast Inc., 6.88%, 03/15/24 | | 959,000 | | 105,490 | |
EnLink Midstream Partners LP, 4.15%, 06/01/25 | | 1,666,000 | | 1,282,337 | |
Enterprise Products Operating LLC | | | | | |
3.75%, 02/15/25 (e) | | 1,837,000 | | 1,681,259 | |
3.70%, 02/15/26 | | 1,738,000 | | 1,560,284 | |
4.95%, 10/15/54 | | 937,000 | | 732,980 | |
EP Energy LLC, 6.38%, 06/15/23 | | 2,246,000 | | 1,123,000 | |
Halliburton Co. | | | | | |
3.38%, 11/15/22 | | 2,600,000 | | 2,558,964 | |
3.80%, 11/15/25 | | 1,304,000 | | 1,270,546 | |
5.00%, 11/15/45 | | 920,000 | | 908,804 | |
Jupiter Resources Inc., 8.50%, 10/01/22 (a) (e) | | 1,500,000 | | 600,000 | |
Memorial Production Partners LP, 6.88%, 08/01/22 | | 2,017,000 | | 605,100 | |
Oneok Inc., 7.50%, 09/01/23 (e) | | 4,690,000 | | 3,904,425 | |
Petrobras Global Finance BV, 4.38%, 05/20/23 (e) | | 2,381,000 | | 1,571,460 | |
Petroleos Mexicanos, 2.29%, 02/15/24 | | 2,771,850 | | 2,776,069 | |
Plains Exploration & Production Co., 6.75%, 02/01/22 | | 5,119,000 | | 3,148,185 | |
Regency Energy Partners LP | | | | | |
5.88%, 03/01/22 | | 3,534,000 | | 3,331,286 | |
5.00%, 10/01/22 | | 1,080,000 | | 957,164 | |
Sanchez Energy Corp., 7.75%, 06/15/21 (e) | | 412,000 | | 251,320 | |
Seadrill Ltd., 6.13%, 09/15/17 (a) (h) | | 1,250,000 | | 631,250 | |
SM Energy Co., 6.13%, 11/15/22 | | 1,856,000 | | 1,364,160 | |
Spectra Energy Partners LP | | | | | |
3.50%, 03/15/25 | | 2,332,000 | | 2,041,148 | |
4.50%, 03/15/45 | | 2,542,000 | | 1,952,950 | |
Transocean Inc. | | | | | |
3.00%, 10/15/17 (e) (g) | | 500,000 | | 443,438 | |
7.13%, 12/15/21 (e) (g) | | 1,824,000 | | 1,178,760 | |
4.30%, 10/15/22 (g) | | 2,015,000 | | 1,067,950 | |
Ultra Petroleum Corp., 6.13%, 10/01/24 (a) | | 2,451,000 | | 557,603 | |
| | | | 59,396,365 | |
FINANCIALS - 25.8% | | | | | |
Abbey National Treasury Services Plc, 4.00%, 03/13/24 (e) | | 3,354,000 | | 3,500,291 | |
ABN AMRO Bank NV, 2.45%, 06/04/20 (a) | | 5,622,000 | | 5,573,718 | |
AerCap Ireland Capital Ltd. | | | | | |
2.75%, 05/15/17 | | 152,000 | | 151,050 | |
4.63%, 10/30/20 | | 1,750,000 | | 1,791,563 | |
4.50%, 05/15/21 | | 288,000 | | 292,680 | |
AIG SunAmerica Global Financing X, 6.90%, 03/15/32 (a) | | 1,696,000 | | 2,176,796 | |
Ally Financial Inc., 5.75%, 11/20/25 | | 5,500,000 | | 5,568,750 | |
Altice Financing SA, 7.88%, 12/15/19 (a) | | 324,000 | | 336,960 | |
Bank of America Corp. | | | | | |
6.25% (callable at 100 beginning 09/05/24) (f) | | 1,683,000 | | 1,687,208 | |
6.50% (callable at 100 beginning 10/23/24) (f) | | 1,567,000 | | 1,651,226 | |
3.30%, 01/11/23 | | 3,428,000 | | 3,379,891 | |
4.20%, 08/26/24 | | 4,077,000 | | 4,082,920 | |
3.95%, 04/21/25 | | 2,317,000 | | 2,256,431 | |
Barclays Bank Plc | | | | | |
7.63%, 11/21/22 | | 679,000 | | 773,211 | |
7.75%, 04/10/23 (b) (i) | | 1,009,000 | | 1,077,108 | |
3.75%, 05/15/24 | | 4,150,000 | | 4,232,228 | |
Barclays Plc | | | | | |
8.25% (callable at 100 beginning 12/15/18) (f) (i) | | 5,300,000 | | 5,642,915 | |
3.65%, 03/16/25 | | 1,450,000 | | 1,393,486 | |
BlackRock Inc., 3.38%, 06/01/22 | | 1,062,000 | | 1,098,687 | |
BNP Paribas SA, 7.37%, (callable at 100 beginning 08/19/25) (a) (e) (f) | | 1,344,000 | | 1,379,280 | |
Capital One Bank USA NA, 2.40%, 09/05/19 | | 6,268,000 | | 6,202,023 | |
Cemex Finance LLC | | | | | |
9.38%, 10/12/22 (a) (e) | | 355,000 | | 373,638 | |
6.00%, 04/01/24 (a) (e) | | 1,171,000 | | 1,004,133 | |
Citigroup Inc. | | | | | |
5.90% (callable at 100 beginning 02/15/23) (e) (f) | | 1,375,000 | | 1,350,938 | |
6.13% (callable at 100 beginning 11/15/20) (f) | | 5,500,000 | | 5,610,000 | |
4.05%, 07/30/22 | | 1,325,000 | | 1,353,616 | |
CME Group Inc., 3.00%, 03/15/25 | | 2,750,000 | | 2,699,686 | |
Credit Suisse, 3.63%, 09/09/24 | | 1,000,000 | | 1,008,219 | |
Credit Suisse AG | | | | | |
7.50% (callable at 100 beginning 12/11/23) (a) (f) | | 4,248,000 | | 4,459,686 | |
6.50%, 08/08/23 (a) | | 7,411,000 | | 7,985,352 | |
Daimler Finance North America LLC | | | | | |
2.00%, 08/03/18 (a) | | 4,800,000 | | 4,768,387 | |
2.25%, 03/02/20 (a) (e) | | 7,000,000 | | 6,843,445 | |
See accompanying Notes to Financial Statements.
| | Shares/Par † | | Value | |
Discover Financial Services, 3.95%, 11/06/24 | | 1,460,000 | | 1,439,808 | |
Five Corners Funding Trust, 4.42%, 11/15/23 (a) | | 5,695,000 | | 5,946,132 | |
Ford Motor Credit Co. LLC | | | | | |
5.00%, 05/15/18 | | 5,898,000 | | 6,181,682 | |
2.24%, 06/15/18 | | 2,750,000 | | 2,725,181 | |
2.38%, 03/12/19 | | 1,600,000 | | 1,577,709 | |
GE Capital International Funding Co., 3.37%, 11/15/25 (a) | | 2,060,000 | | 2,097,622 | |
General Electric Capital Corp., 3.10%, 01/09/23 | | 792,000 | | 803,888 | |
General Motors Financial Co. Inc., 4.38%, 09/25/21 | | 2,419,000 | | 2,454,225 | |
GFI Group Inc., 8.63%, 07/19/18 (g) | | 2,250,000 | | 2,435,625 | |
Goldman Sachs Group Inc. | | | | | |
5.38% (callable at 100 beginning 05/10/20) (f) | | 3,786,000 | | 3,762,338 | |
2.38%, 01/22/18 | | 4,608,000 | | 4,648,122 | |
4.00%, 03/03/24 | | 2,064,000 | | 2,119,540 | |
4.25%, 10/21/25 | | 2,741,000 | | 2,721,753 | |
6.75%, 10/01/37 | | 1,500,000 | | 1,752,230 | |
5.15%, 05/22/45 | | 4,331,000 | | 4,204,132 | |
Hospitality Properties Trust, 4.50%, 03/15/25 | | 3,338,000 | | 3,205,184 | |
HSBC Holdings Plc | | | | | |
5.63% (callable at 100 beginning 01/17/20) (e) (f) (i) | | 2,037,000 | | 2,039,546 | |
6.37% (callable at 100 beginning 03/30/25) (e) (f) | | 4,499,000 | | 4,493,376 | |
Icahn Enterprises LP, 4.88%, 03/15/19 | | 2,518,000 | | 2,495,338 | |
International Lease Finance Corp. | | | | | |
6.75%, 09/01/16 (a) | | 1,100,000 | | 1,130,250 | |
7.13%, 09/01/18 (a) | | 1,000,000 | | 1,096,250 | |
4.63%, 04/15/21 | | 2,237,000 | | 2,292,925 | |
8.63%, 01/15/22 | | 750,000 | | 907,500 | |
Intesa Sanpaolo SpA, 5.02%, 06/26/24 (a) | | 6,500,000 | | 6,398,255 | |
Invesco Finance Plc, 3.13%, 11/30/22 | | 1,778,000 | | 1,754,036 | |
Janus Capital Group Inc., 4.88%, 08/01/25 | | 2,027,000 | | 2,080,440 | |
JPMorgan Chase & Co. | | | | | |
5.30% (callable at 100 beginning 05/01/20) (f) | | 5,250,000 | | 5,230,313 | |
7.90% (callable at 100 beginning 04/30/18) (f) | | 1,757,000 | | 1,788,626 | |
3.20%, 01/25/23 | | 3,609,000 | | 3,599,194 | |
Legg Mason Inc., 2.70%, 07/15/19 | | 1,883,000 | | 1,878,411 | |
Liberty Mutual Group Inc. | | | | | |
4.25%, 06/15/23 (a) | | 204,000 | | 207,428 | |
4.85%, 08/01/44 (a) | | 664,000 | | 615,055 | |
Mid-America Apartments LP, 4.00%, 11/15/25 | | 2,178,000 | | 2,163,813 | |
Mizuho Bank Ltd., 1.70%, 09/25/17 (a) | | 1,300,000 | | 1,293,699 | |
Mizuho Financial Group Cayman 3 Ltd., 4.60%, 03/27/24 (a) (e) | | 1,850,000 | | 1,905,411 | |
Morgan Stanley | | | | | |
2.38%, 07/23/19 | | 6,946,000 | | 6,924,280 | |
4.88%, 11/01/22 | | 4,381,000 | | 4,652,201 | |
4.10%, 05/22/23 | | 3,860,000 | | 3,902,198 | |
3.88%, 04/29/24 | | 6,271,000 | | 6,393,065 | |
Murray Street Investment Trust I, 4.65%, 03/09/17 (h) | | 3,500,000 | | 3,606,159 | |
National Rural Utilities Cooperative Finance Corp., 4.75%, 04/30/43 (b) | | 3,146,000 | | 3,103,214 | |
PNC Financial Services Group Inc., 4.85%, (callable at 100 beginning 06/01/23) (f) | | 581,000 | | 544,763 | |
Prologis International Funding II, 4.88%, 02/15/20 (a) | | 2,222,000 | | 2,344,266 | |
Prudential Financial Inc., 5.87%, 09/15/42 (b) | | 1,252,000 | | 1,301,454 | |
Royal Bank of Scotland Group Plc | | | | | |
7.50% (callable at 100 beginning 08/10/20) (f) (i) | | 3,520,000 | | 3,665,200 | |
8.00% (callable at 100 beginning 08/10/25) (e) (f) (i) | | 2,259,000 | | 2,388,893 | |
6.13%, 12/15/22 | | 1,880,000 | | 2,046,773 | |
6.10%, 06/10/23 | | 1,669,000 | | 1,794,046 | |
6.00%, 12/19/23 | | 737,000 | | 793,753 | |
5.13%, 05/28/24 | | 2,884,000 | | 2,923,058 | |
Santander UK Plc, 5.00%, 11/07/23 (a) | | 1,152,000 | | 1,199,176 | |
SAP Ireland US-Financial Services Ltd. | | | | | |
2.82%, 11/15/20 (c) (d) | | 2,485,000 | | 2,495,007 | |
3.18%, 11/15/22 (c) (d) | | 2,485,000 | | 2,462,218 | |
Shell International Finance BV, 3.25%, 05/11/25 | | 2,285,000 | | 2,231,108 | |
Stena AB, 7.00%, 02/01/24 (a) | | 1,332,000 | | 1,132,200 | |
Swedbank AB, 2.20%, 03/04/20 (a) (e) | | 2,600,000 | | 2,569,588 | |
UBS Group AG, 4.13%, 09/24/25 (a) | | 2,463,000 | | 2,461,985 | |
USAA Capital Corp., 2.13%, 06/03/19 (a) | | 500,000 | | 499,706 | |
WEA Finance LLC, 3.25%, 10/05/20 (a) | | 7,818,000 | | 7,851,054 | |
Wells Fargo & Co. | | | | | |
5.87% (callable at 100 beginning 06/15/25) (f) | | 3,161,000 | | 3,326,953 | |
4.48%, 01/16/24 | | 355,000 | | 373,553 | |
4.30%, 07/22/27 | | 3,396,000 | | 3,469,506 | |
4.90%, 11/17/45 | | 1,626,000 | | 1,641,135 | |
Westpac Banking Corp., 2.60%, 11/23/20 | | 8,000,000 | | 7,996,928 | |
ZF North America Capital Inc., 4.50%, 04/29/22 (a) | | 537,000 | | 524,918 | |
| | | | 269,768,917 | |
HEALTH CARE - 3.6% | | | | | |
AbbVie Inc. | | | | | |
2.90%, 11/06/22 | | 1,631,000 | | 1,579,035 | |
3.60%, 05/14/25 | | 3,530,000 | | 3,484,329 | |
4.70%, 05/14/45 (e) | | 1,415,000 | | 1,383,782 | |
Actavis Funding SCS | | | | | |
3.85%, 06/15/24 | | 1,319,000 | | 1,321,911 | |
4.75%, 03/15/45 | | 2,557,000 | | 2,492,714 | |
Becton Dickinson and Co. | | | | | |
3.73%, 12/15/24 | | 633,000 | | 638,810 | |
4.69%, 12/15/44 | | 1,109,000 | | 1,118,811 | |
Endo Finance LLC, 6.00%, 07/15/23 (a) | | 1,209,000 | | 1,202,955 | |
Forest Laboratories Inc., 5.00%, 12/15/21 (a) | | 1,268,000 | | 1,378,442 | |
Gilead Sciences Inc. | | | | | |
4.80%, 04/01/44 | | 1,302,000 | | 1,306,107 | |
4.50%, 02/01/45 | | 1,194,000 | | 1,168,426 | |
HCA Inc. | | | | | |
3.75%, 03/15/19 | | 3,369,000 | | 3,394,267 | |
4.25%, 10/15/19 | | 2,464,000 | | 2,513,280 | |
Howard Hughes Medical Institute, 3.50%, 09/01/23 | | 2,046,000 | | 2,125,254 | |
Mayo Clinic Rochester, 3.77%, 11/15/43 | | 600,000 | | 557,471 | |
MEDNAX Inc., 5.25%, 12/01/23 (a) | | 551,000 | | 553,755 | |
Memorial Sloan-Kettering Cancer Center, 5.00%, 07/01/42 | | 997,000 | | 1,066,996 | |
Merck & Co. Inc., 4.15%, 05/18/43 | | 1,520,000 | | 1,526,021 | |
Perrigo Finance Plc, 4.90%, 12/15/44 | | 1,143,000 | | 1,031,504 | |
Quest Diagnostics Inc., 4.70%, 03/30/45 | | 439,000 | | 395,322 | |
Tenet Healthcare Corp. | | | | | |
4.01%, 06/15/20 (a) (b) | | 653,000 | | 636,675 | |
6.75%, 06/15/23 (e) | | 1,283,000 | | 1,189,982 | |
VRX Escrow Corp. | | | | | |
5.88%, 05/15/23 (a) | | 2,649,000 | | 2,364,232 | |
6.13%, 04/15/25 (a) | | 914,000 | | 815,745 | |
WellCare Health Plans Inc., 5.75%, 11/15/20 | | 1,853,000 | | 1,908,590 | |
| | | | 37,154,416 | |
INDUSTRIALS - 3.8% | | | | | |
AECOM, 5.88%, 10/15/24 | | 1,203,000 | | 1,227,060 | |
Aircastle Ltd., 4.63%, 12/15/18 | | 1,270,000 | | 1,298,575 | |
See accompanying Notes to Financial Statements.
| | Shares/Par † | | Value | |
BAE Systems Holdings Inc., 2.85%, 12/15/20 (a) | | 1,322,000 | | 1,319,184 | |
Bombardier Inc. | | | | | |
5.50%, 09/15/18 (a) (e) | | 829,000 | | 760,690 | |
4.75%, 04/15/19 (a) (e) | | 4,607,000 | | 3,789,258 | |
6.13%, 01/15/23 (a) | | 759,000 | | 523,710 | |
7.50%, 03/15/25 (a) | | 1,370,000 | | 959,000 | |
CNH Industrial Capital LLC, 3.88%, 07/16/18 | | 2,366,000 | | 2,289,105 | |
Florida East Coast Holdings Corp., 6.75%, 05/01/19 (a) | | 1,583,000 | | 1,448,445 | |
General Electric Co. | | | | | |
4.00% (callable at 100 beginning 06/15/22) (f) | | 4,721,000 | | 4,721,000 | |
4.10% (callable at 100 beginning 12/15/22) (e) (f) | | 9,171,000 | | 9,148,073 | |
3.50%, 10/02/18 | | 4,600,000 | | 4,646,184 | |
Lockheed Martin Corp. | | | | | |
3.10%, 01/15/23 | | 3,750,000 | | 3,747,911 | |
4.50%, 05/15/36 | | 1,934,000 | | 1,956,558 | |
4.70%, 05/15/46 | | 1,642,000 | | 1,689,646 | |
| | | | 39,524,399 | |
INFORMATION TECHNOLOGY - 2.0% | | | | | |
CDK Global Inc., 3.30%, 10/15/19 | | 1,382,000 | | 1,371,719 | |
Hewlett Packard Enterprise Co. | | | | | |
6.20%, 10/15/35 (a) | | 1,400,000 | | 1,348,364 | |
6.35%, 10/15/45 (a) | | 2,890,000 | | 2,743,454 | |
Microsoft Corp., 3.13%, 11/03/25 | | 2,597,000 | | 2,612,086 | |
ViaSat Inc., 6.88%, 06/15/20 | | 2,692,000 | | 2,792,950 | |
Visa Inc. | | | | | |
2.80%, 12/14/22 | | 3,600,000 | | 3,606,473 | |
3.15%, 12/14/25 | | 2,200,000 | | 2,204,649 | |
4.15%, 12/14/35 | | 1,864,000 | | 1,881,700 | |
4.30%, 12/14/45 | | 2,761,000 | | 2,798,516 | |
| | | | 21,359,911 | |
MATERIALS - 2.3% | | | | | |
Anglo American Capital Plc, 2.63%, 09/27/17 (a) | | 2,750,000 | | 2,406,250 | |
Anglo American Plc, 3.63%, 05/14/20 (a) (e) | | 1,695,000 | | 1,203,450 | |
Ardagh Packaging Finance Plc, 3.51%, 12/15/19 (a) (b) (e) | | 2,850,000 | | 2,785,875 | |
Ball Corp., 4.38%, 12/15/20 | | 2,885,000 | | 2,930,078 | |
Barrick Gold Corp., 4.10%, 05/01/23 (e) | | 449,000 | | 385,207 | |
Cemex SAB de CV, 6.50%, 12/10/19 (a) | | 2,815,000 | | 2,716,475 | |
FMG Resources August 2006 Pty Ltd. | | | | | |
8.25%, 11/01/19 (a) (e) | | 1,450,000 | | 1,150,938 | |
9.75%, 03/01/22 (a) (e) | | 548,000 | | 501,420 | |
Freeport-McMoRan Copper & Gold Inc., 3.88%, 03/15/23 | | 484,000 | | 275,880 | |
Freeport-McMoRan Inc. | | | | | |
4.55%, 11/14/24 | | 1,070,000 | | 612,575 | |
5.40%, 11/14/34 | | 7,478,000 | | 3,963,340 | |
Methanex Corp., 5.65%, 12/01/44 (e) | | 1,569,000 | | 1,269,608 | |
Rain CII Carbon LLC, 8.25%, 01/15/21 (a) | | 3,508,000 | | 2,736,240 | |
Samarco Mineracao SA | | | | | |
4.13%, 11/01/22 (a) | | 345,000 | | 110,400 | |
5.38%, 09/26/24 (a) | | 340,000 | | 112,200 | |
Trinseo Materials Operating SCA, 6.75%, 05/01/22 (a) | | 778,000 | | 766,330 | |
| | | | 23,926,266 | |
TELECOMMUNICATION SERVICES - 2.1% | | | | | |
AT&T Inc. | | | | | |
4.50%, 05/15/35 (e) | | 1,965,000 | | 1,817,539 | |
4.75%, 05/15/46 | | 650,000 | | 595,026 | |
Frontier Communications Corp. | | | | | |
10.50%, 09/15/22 (a) | | 1,007,000 | | 1,000,706 | |
11.00%, 09/15/25 (a) | | 1,007,000 | | 996,930 | |
SES Global Americas Holdings GP, 5.30%, 03/25/44 (a) | | 1,524,000 | | 1,452,652 | |
T-Mobile USA Inc., 6.50%, 01/15/26 | | 1,299,000 | | 1,311,327 | |
Verizon Communications Inc. | | | | | |
6.40%, 09/15/33 | | 171,000 | | 194,825 | |
4.27%, 01/15/36 | | 2,592,000 | | 2,339,555 | |
6.55%, 09/15/43 | | 164,000 | | 194,697 | |
4.86%, 08/21/46 | | 5,948,000 | | 5,627,212 | |
5.01%, 08/21/54 | | 2,973,000 | | 2,721,514 | |
4.67%, 03/15/55 | | 3,995,000 | | 3,465,539 | |
| | | | 21,717,522 | |
UTILITIES - 4.1% | | | | | |
Abengoa Yield Plc, 7.00%, 11/15/19 (a) (e) | | 2,315,000 | | 2,037,200 | |
Atlantic City Electric Co., 3.38%, 09/01/24 | | 3,386,000 | | 3,327,822 | |
Dynegy Inc., 6.75%, 11/01/19 | | 1,010,000 | | 949,400 | |
Electricite de France SA, 5.25%, (callable at 100 beginning 01/29/23) (a) (f) | | 7,570,000 | | 7,115,800 | |
Enel SpA, 8.75%, 09/24/73 (d) (j) | | 1,872,000 | | 2,131,740 | |
Exelon Corp. | | | | | |
3.95%, 06/15/25 (d) (j) | | 2,209,000 | | 2,207,345 | |
5.10%, 06/15/45 (a) | | 1,831,000 | | 1,826,818 | |
FirstEnergy Corp. | | | | | |
4.25%, 03/15/23 (g) | | 883,000 | | 898,828 | |
7.38%, 11/15/31 | | 1,575,000 | | 1,918,245 | |
FirstEnergy Transmission LLC, 5.45%, 07/15/44 (a) | | 1,680,000 | | 1,691,416 | |
NextEra Energy Capital Holdings Inc., 1.59%, 06/01/17 | | 2,000,000 | | 1,992,804 | |
Oglethorpe Power Corp., 4.55%, 06/01/44 | | 2,344,000 | | 2,221,371 | |
Oncor Electric Delivery Co. LLC | | | | | |
6.80%, 09/01/18 | | 2,250,000 | | 2,501,046 | |
4.10%, 06/01/22 | | 1,679,000 | | 1,744,921 | |
2.95%, 04/01/25 | | 4,900,000 | | 4,604,128 | |
Pacific Gas & Electric Co., 4.30%, 03/15/45 | | 2,007,000 | | 1,980,897 | |
PPL Energy Supply LLC, 6.50%, 06/01/25 (a) (e) | | 940,000 | | 620,400 | |
PPL WEM Holdings Plc, 3.90%, 05/01/16 (a) | | 200,000 | | 200,800 | |
RJS Power Holdings LLC, 4.63%, 07/15/19 (a) (e) | | 2,850,000 | | 2,137,500 | |
Wisconsin Energy Corp., 3.55%, 06/15/25 | | 920,000 | | 925,326 | |
| | | | 43,033,807 | |
Total Corporate Bonds and Notes (cost $620,760,126) | | | | 589,095,407 | |
GOVERNMENT AND AGENCY OBLIGATIONS - 33.2% | | | | | |
GOVERNMENT SECURITIES - 15.1% | | | | | |
Municipals - 0.1% | | | | | |
Port Authority of New York & New Jersey, 4.46%, 10/01/62 | | 1,490,000 | | 1,431,994 | |
U.S. Treasury Securities - 15.0% | | | | | |
U.S. Treasury Bond | | | | | |
3.75%, 08/15/41 | | 10,048,000 | | 11,519,560 | |
3.13%, 11/15/41 | | 8,720,000 | | 8,990,259 | |
2.50%, 02/15/45 | | 2,350,000 | | 2,104,176 | |
U.S. Treasury Note | | | | | |
1.63%, 03/31/19 - 06/30/19 | | 41,144,000 | | 41,390,269 | |
1.50%, 05/31/19 - 05/31/20 | | 11,668,000 | | 11,665,728 | |
1.38%, 02/29/20 - 04/30/20 | | 17,710,000 | | 17,487,633 | |
2.00%, 11/15/21 - 02/15/22 | | 14,392,000 | | 14,421,604 | |
1.75%, 05/15/22 | | 16,835,000 | | 16,561,179 | |
2.75%, 02/15/24 | | 23,754,000 | | 24,741,074 | |
2.50%, 05/15/24 | | 7,250,000 | | 7,407,840 | |
| | | | 156,289,322 | |
See accompanying Notes to Financial Statements.
| | Shares/Par † | | Value | |
U.S. GOVERNMENT AGENCY MORTGAGE-BACKED SECURITIES - 18.1% | | | | | |
Federal Home Loan Mortgage Corp. - 3.8% | | | | | |
Federal Home Loan Mortgage Corp. | | | | | |
3.00%, 04/01/30 - 07/01/45 | | 14,406,067 | | 14,539,031 | |
3.00%, 01/15/31, TBA (k) | | 244,000 | | 251,391 | |
6.00%, 07/01/37 - 09/01/37 | | 154,868 | | 174,383 | |
5.00%, 02/01/38 - 11/01/41 | | 3,726,278 | | 4,089,582 | |
4.50%, 03/01/42 - 10/01/43 | | 5,778,918 | | 6,234,709 | |
3.50%, 04/01/42 - 06/01/42 | | 5,088,605 | | 5,246,148 | |
4.00%, 03/01/43 - 02/01/45 | | 8,156,741 | | 8,634,641 | |
| | | | 39,169,885 | |
Federal National Mortgage Association - 10.0% | | | | | |
Federal National Mortgage Association | | | | | |
4.00%, 04/01/26 - 06/01/45 | | 20,216,757 | | 21,407,365 | |
2.50%, 01/01/28 - 05/01/28 | | 1,791,021 | | 1,816,251 | |
3.50%, 03/01/30 - 12/01/45 | | 24,473,756 | | 25,305,102 | |
3.00%, 05/01/30 - 05/01/43 | | 18,261,060 | | 18,432,536 | |
2.50%, 01/15/31, TBA (k) | | 6,126,000 | | 6,173,114 | |
5.50%, 12/01/33 - 08/01/38 | | 2,621,954 | | 2,938,808 | |
5.00%, 06/01/35 - 05/01/42 | | 4,544,330 | | 5,019,230 | |
6.00%, 08/01/37 - 01/01/38 | | 307,971 | | 347,964 | |
4.50%, 08/01/40 - 08/01/44 | | 14,071,637 | | 15,219,999 | |
4.00%, 04/01/44, TBA (k) | | 3,863,108 | | 4,089,556 | |
3.08%, 04/01/45 (b) | | 2,877,391 | | 2,954,215 | |
4.50%, 01/15/46, TBA (k) | | 347,000 | | 374,653 | |
| | | | 104,078,793 | |
Government National Mortgage Association - 4.3% | | | | | |
Government National Mortgage Association | | | | | |
5.00%, 08/20/41 - 01/20/43 | | 1,754,532 | | 1,938,387 | |
3.50%, 08/20/42 - 06/20/43 | | 10,952,572 | | 11,447,923 | |
2.50%, 05/20/43 (b) | | 1,595,305 | | 1,629,004 | |
3.00%, 05/20/43 - 07/20/45 | | 15,004,026 | | 15,226,247 | |
4.00%, 05/20/44 | | 4,057,566 | | 4,361,991 | |
4.00%, 08/20/45 | | 1,831,886 | | 1,946,025 | |
4.50%, 08/20/45 | | 3,290,500 | | 3,540,087 | |
3.50%, 01/15/46, TBA (k) | | 4,925,000 | | 5,132,414 | |
| | | | 45,222,078 | |
Total Government and Agency Obligations (cost $345,036,189) | | | | 346,192,072 | |
PREFERRED STOCKS - 0.2% | | | | | |
ENERGY - 0.1% | | | | | |
NuStar Logistics LP, 7.63%, (callable at 25 beginning 01/15/18) | | 48,000 | | 994,560 | |
FINANCIALS - 0.1% | | | | | |
Goldman Sachs Group Inc., 5.50%, (callable at 25 beginning 05/10/23) (e) (f) | | 10,000 | | 258,900 | |
U.S. Bancorp - Series G, 6.00%, (callable at 25 beginning 04/15/17) (e) (f) | | 44,500 | | 1,193,490 | |
| | | | 1,452,390 | |
Total Preferred Stocks (cost $2,623,000) | | | | 2,446,950 | |
VARIABLE RATE SENIOR LOAN INTERESTS - 2.1% (b) | | | | | |
CONSUMER DISCRETIONARY - 0.6% | | | | | |
Charter Communications Operating LLC Term Loan H, 3.25%, 07/23/23 | | $ | 963,000 | | 953,543 | |
Charter Communications Operating LLC Term Loan I, 3.50%, 01/23/23 | | 578,000 | | 576,798 | |
Four Seasons Hotels Ltd. New Term Loan, 3.50%, 06/27/20 | | 1,137,418 | | 1,114,670 | |
JC Penney Corp. Inc. Term Loan, 6.00%, 05/22/18 | | 867,750 | | 851,046 | |
PetSmart Inc. Term Loan B-1, 4.25%, 03/10/22 | | 839,780 | | 816,476 | |
Schaeffler AG New Term Loan B, 4.25%, 05/15/20 | | 406,154 | | 406,357 | |
Univision Communications Inc. Incremental Term Loan, 4.00%, 03/01/20 | | 1,040,074 | | 1,015,934 | |
| | | | 5,734,824 | |
ENERGY - 0.3% | | | | | |
CITGO Holding Inc. Term Loan B, 9.50%, 05/09/18 | | 2,178,000 | | 2,158,028 | |
Fieldwood Energy LLC 1st Lien Term Loan, 3.88%, 09/28/18 | | 1,568,998 | | 1,019,848 | |
Linden Term Loan B, 3.75%, 12/01/20 | | 425,056 | | 410,179 | |
| | | | 3,588,055 | |
FINANCIALS - 0.0% | | | | | |
Guggenheim Partners LLC Initial Term Loan, 4.25%, 07/17/20 | | 489,998 | | 485,711 | |
INDUSTRIALS - 0.3% | | | | | |
Gol LuxCo SA Fixed Rate Term Loan, 6.00%, 08/18/20 (c) | | 3,100,000 | | 3,007,000 | |
MATERIALS - 0.4% | | | | | |
Arch Coal Inc. Term Loan B, 6.25%, 05/14/18 | | 967,473 | | 425,959 | |
FMG Resources (August 2006) Pty Ltd. New Term Loan B, 4.25%, 06/30/19 | | 5,314,273 | | 3,926,450 | |
| | | | 4,352,409 | |
TELECOMMUNICATION SERVICES - 0.4% | | | | | |
Neptune Finco Corp. Term Loan B, 4.75%, 09/16/22 | | 2,750,000 | | 2,742,273 | |
T-Mobile USA Inc. Term Loan B, 3.50%, 11/03/22 | | 937,500 | | 936,478 | |
| | | | 3,678,751 | |
UTILITIES - 0.1% | | | | | |
Texas Competitive Electric Holdings Co. LLC Term Loan, 3.75%, 05/05/16 | | 1,269,802 | | 1,257,104 | |
Total Variable Rate Senior Loan Interests (cost $24,300,494) | | | | 22,103,854 | |
SHORT TERM INVESTMENTS - 5.9% | | | | | |
Investment Company - 3.3% | | | | | |
JNL Money Market Fund, 0.19% (l) (m) | | 34,606,249 | | 34,606,249 | |
Securities Lending Collateral - 2.6% | | | | | |
State Street Navigator Securities Lending Prime Portfolio, 0.29% (m) | | 27,187,615 | | 27,187,615 | |
Total Short Term Investments (cost $61,793,864) | | | | 61,793,864 | |
Total Investments - 103.1% (cost $1,109,776,158) | | | | 1,076,795,972 | |
Other Assets and Liabilities, Net - (3.1%) | | | | (32,489,354 | ) |
Total Net Assets - 100.0% | | | | $ | 1,044,306,618 | |
| | | | | | | |
(a) | The Sub-Adviser has deemed this security which is exempt from registration under the 1933 Act to be liquid based on procedures approved by the Board. As of December 31, 2015, the aggregate value of these liquid securities was $203,031,365 which represented 19.4% of net assets. |
(b) | Variable rate security. Rate stated was in effect as of December 31, 2015. |
(c) | Security fair valued in good faith in accordance with the procedures approved by the Trust’s Board of Trustees. Good faith fair valued securities may be classified as Level 2 or Level 3 for FASB ASC Topic 820 “Fair Value Measurement,” based on applicable valuation inputs. See FASB Topic 820 in the Notes to Financial Statements. |
(d) | The Sub-Adviser has deemed this security to be illiquid based on procedures approved by the Board. |
(e) | All or a portion of the security was on loan. |
See accompanying Notes to Financial Statements.
(f) | Perpetual security. |
(g) | The interest rate for this security is inversely affected by upgrades or downgrades to the credit rating of the issuer. |
(h) | Security is a “step-up” bond where the coupon may increase or step up at a future date or as the result of an upgrade or downgrade to the credit rating of the issuer. Rate stated was the coupon as of December 31, 2015. |
(i) | Convertible security. |
(j) | Security is restricted to resale to institutional investors. See Restricted Securities in the Notes to Schedules of Investments. |
(k) | All or a portion of the investment was purchased on a delayed delivery basis. As of December 31, 2015, the total payable of investments purchased on a delayed delivery basis was $16,030,131. |
(l) | Investment in affiliate. |
(m) | Yield changes daily to reflect current market conditions. Rate was the quoted yield as of December 31, 2015. |
| | Shares/Par † | | Value | |
JNL Money Market Fund | | | | | |
CORPORATE BONDS AND NOTES - 11.2% | | | | | |
CONSUMER STAPLES - 1.1% | | | | | |
PepsiCo Inc., 0.62%, 02/26/16 (a) | | $ | 32,000,000 | | $ | 32,009,007 | |
FINANCIALS - 7.9% | | | | | |
American Honda Finance Corp. | | | | | |
0.34%, 01/11/16 (a) | | 15,000,000 | | 14,999,979 | |
0.78%, 05/26/16 (a) (d) | | 34,635,000 | | 34,680,984 | |
Bank of New York Mellon Corp., 2.30%, 07/28/16 | | 9,000,000 | | 9,089,736 | |
Bank of Tokyo-Mitsubishi UFJ Ltd., 0.86%, 02/26/16 (a) (d) | | 4,000,000 | | 4,000,886 | |
BNP Paribas SA, 3.60%, 02/23/16 | | 9,850,000 | | 9,891,799 | |
Cooperatieve Centrale Raiffeisen-Boerenleenbank BA, 1.01%, 03/18/16 (a) | | 9,160,000 | | 9,168,361 | |
Credit Suisse, 0.79%, 03/11/16 (a) | | 15,000,000 | | 14,999,444 | |
General Electric Capital Corp. | | | | | |
0.92%, 01/08/16 (a) | | 4,000,000 | | 4,000,305 | |
1.21%, 05/09/16 (a) | | 7,320,000 | | 7,343,139 | |
JPMorgan Chase Bank NA, 0.83%, 06/13/16 (a) | | 8,000,000 | | 7,992,348 | |
MassMutual Global Funding II, 3.13%, 04/14/16 (d) | | 9,884,000 | | 9,959,650 | |
Metropolitan Life Global Funding I, 0.72%, 06/23/16 (a) (d) | | 18,500,000 | | 18,507,506 | |
New York Life Global Funding, 0.38%, 08/05/16 (a) (d) | | 31,000,000 | | 31,000,000 | |
PNC Bank NA | | | | | |
0.63%, 01/28/16 (a) | | 11,320,000 | | 11,320,835 | |
0.80%, 01/28/16 | | 13,400,000 | | 13,400,000 | |
Principal Life Global Funding II, 0.54%, 02/22/16 (a) (d) | | 1,000,000 | | 1,000,091 | |
Royal Bank of Canada | | | | | |
0.83%, 03/08/16 (a) | | 2,625,000 | | 2,626,692 | |
2.30%, 07/20/16 | | 13,705,000 | | 13,832,083 | |
Wells Fargo Bank NA, 0.57%, 06/02/16 (a) | | 25,040,000 | | 25,046,459 | |
| | | | 242,860,297 | |
HEALTH CARE - 0.3% | | | | | |
GlaxoSmithKline Capital Inc., 0.70%, 03/18/16 | | 10,250,000 | | 10,258,060 | |
INFORMATION TECHNOLOGY - 1.9% | | | | | |
International Business Machines Corp. | | | | | |
0.40%, 02/05/16 (a) | | 7,780,000 | | 7,780,568 | |
1.95%, 07/22/16 | | 50,400,000 | | 50,783,325 | |
| | | | 58,563,893 | |
Total Corporate Bonds and Notes (cost $343,691,257) | | | | 343,691,257 | |
GOVERNMENT AND AGENCY OBLIGATIONS - 8.4% | | | | | |
GOVERNMENT SECURITIES - 8.4% | | | | | |
Federal Home Loan Bank - 4.1% (b) | | | | | |
Federal Home Loan Bank | | | | | |
0.25%, 02/09/16 (a) | | 65,000,000 | | 65,000,000 | |
0.25%, 05/11/16 | | 20,000,000 | | 19,998,252 | |
0.38%, 06/24/16 - 08/25/16 | | 24,300,000 | | 24,293,450 | |
0.41%, 08/05/16 | | 9,815,000 | | 9,812,818 | |
0.50%, 09/28/16 | | 6,145,000 | | 6,143,288 | |
| | | | 125,247,808 | |
Federal Home Loan Mortgage Corp. - 1.1% (b) | | | | | |
Federal Home Loan Mortgage Corp. | | | | | |
0.40%, 03/15/16 | | 14,300,000 | | 14,303,511 | |
2.00%, 08/25/16 | | 20,000,000 | | 20,193,138 | |
| | | | 34,496,649 | |
Federal National Mortgage Association - 0.6% (b) | | | | | |
Federal National Mortgage Association, 0.50%, 03/30/16 | | 20,000,000 | | 20,008,642 | |
Treasury Inflation Index Securities - 1.0% | | | | | |
U.S. Treasury Inflation Indexed Note, 2.00%, 01/15/16 (c) | | 29,957,750 | | 29,959,936 | |
U.S. Treasury Securities - 1.6% | | | | | |
U.S. Treasury Note | | | | | |
0.34%, 07/31/17 (a) | | 10,000,000 | | 9,993,107 | |
0.43%, 10/31/17 (a) | | 40,000,000 | | 40,007,424 | |
| | | | 50,000,531 | |
Total Government and Agency Obligations (cost $259,713,566) | | | | 259,713,566 | |
SHORT TERM INVESTMENTS - 59.6% | | | | | |
Certificates of Deposit - 20.7% | | | | | |
Bank of Montreal | | | | | |
0.25%, 01/05/16 | | 29,500,000 | | 29,500,000 | |
0.36%, 01/06/16 (a) | | 24,000,000 | | 24,000,000 | |
0.71%, 06/22/16 (a) | | 17,000,000 | | 17,000,000 | |
Bank of Nova Scotia | | | | | |
0.48%, 04/18/16 (a) | | 32,000,000 | | 32,000,000 | |
0.69%, 06/28/16 (a) | | 27,000,000 | | 27,000,000 | |
BNP Paribas SA, 0.58%, 02/01/16 | | 27,000,000 | | 27,000,000 | |
Canadian Imperial Bank of Commerce | | | | | |
0.35%, 02/04/16 (a) | | 20,000,000 | | 20,000,000 | |
0.42%, 03/10/16 (a) | | 26,000,000 | | 26,000,000 | |
Credit Suisse, 0.86%, 03/21/16 (a) | | 25,000,000 | | 25,000,000 | |
Credit Suisse Group AG, 0.67%, 05/09/16 (a) | | 28,000,000 | | 28,000,000 | |
Natixis | | | | | |
0.48%, 02/02/16 | | 35,000,000 | | 35,000,000 | |
0.49%, 03/10/16 (a) | | 23,500,000 | | 23,500,000 | |
Nordea Bank Finland Plc, 0.57%, 05/19/16 (a) | | 12,000,000 | | 12,000,000 | |
Rabobank Nederland NV | | | | | |
0.46%, 03/11/16 (a) | | 34,000,000 | | 34,000,000 | |
0.52%, 03/18/16 (a) | | 24,500,000 | | 24,500,000 | |
Royal Bank of Canada | | | | | |
0.42%, 04/04/16 (a) | | 35,000,000 | | 35,000,000 | |
0.40%, 04/08/16 (a) | | 28,000,000 | | 28,000,000 | |
Societe Generale SA, 0.49%, 03/10/16 (a) | | 25,000,000 | | 25,000,000 | |
Standard Chartered Plc, 0.36%, 02/12/16 | | 20,000,000 | | 20,000,000 | |
Sumitomo Mitsui Banking Corp., 0.51%, 03/10/16 (a) | | 25,000,000 | | 25,000,000 | |
Svenska Handelsbanken AB, 0.25%, 02/02/16 | | 25,000,000 | | 25,000,000 | |
Toronto-Dominion Bank | | | | | |
0.52%, 01/25/16 (a) | | 19,000,000 | | 19,000,000 | |
0.36%, 05/02/16 (a) | | 50,000,000 | | 50,000,000 | |
Wells Fargo Bank NA, 0.48%, 06/01/16 (a) | | 26,000,000 | | 26,000,000 | |
| | | | 637,500,000 | |
| | | | | | | |
See accompanying Notes to Financial Statements.
| | Shares/Par † | | Value | |
Commercial Paper - 15.7% | | | | | |
BPCE SA, 0.54%, 02/18/16 (d) | | 45,000,000 | | 44,967,600 | |
Chevron Corp., 0.20%, 02/08/16 (d) | | 30,000,000 | | 29,993,825 | |
DNB Bank ASA, 0.23%, 01/05/16 (d) | | 35,000,000 | | 34,999,105 | |
Fairway Finance Corp. | | | | | |
0.30%, 02/24/16 (d) | | 26,000,000 | | 25,988,300 | |
0.37%, 03/16/16 (d) | | 26,000,000 | | 25,979,958 | |
HSBC USA Inc. | | | | | |
0.46%, 02/17/16 (d) | | 20,000,000 | | 19,987,989 | |
0.62%, 03/29/16 | | 30,000,000 | | 30,000,000 | |
0.62%, 04/22/16 | | 25,000,000 | | 25,000,000 | |
JPMorgan Securities LLC | | | | | |
0.48%, 01/11/16 | | 22,500,000 | | 22,497,000 | |
0.49%, 02/12/16 | | 15,000,000 | | 14,991,600 | |
Kreditanstalt fur Wiederaufbau, 0.28%, 03/01/16 (d) | | 34,000,000 | | 33,984,417 | |
MetLife Short Term Funding LLC, 0.52%, 02/22/16 | | 37,859,000 | | 37,830,564 | |
Old Line Funding LLC, 0.60%, 03/18/16 (d) | | 28,000,000 | | 27,964,067 | |
Societe Generale SA, 0.47%, 04/19/16 | | 25,000,000 | | 24,964,423 | |
Thunder Bay Funding LLC | | | | | |
0.35%, 01/07/16 (d) | | 23,500,000 | | 23,498,629 | |
0.48%, 03/21/16 (d) | | 35,000,000 | | 34,962,667 | |
Walt Disney Co., 0.36%, 01/25/16 (d) | | 27,000,000 | | 26,993,520 | |
| | | | 484,603,664 | |
Federal Home Loan Bank - 11.7% (b) | | | | | |
Federal Home Loan Bank | | | | | |
0.16%, 01/13/16 - 01/25/16 | | 95,500,000 | | 95,491,612 | |
0.13%, 01/27/16 - 02/12/16 | | 78,529,000 | | 78,520,399 | |
0.14%, 01/29/16 | | 12,000,000 | | 11,998,740 | |
0.23%, 02/17/16 | | 30,000,000 | | 29,990,913 | |
0.26%, 02/24/16 | | 20,000,000 | | 19,992,200 | |
0.35%, 03/04/16 | | 30,000,000 | | 29,981,625 | |
0.51%, 05/20/16 | | 30,000,000 | | 29,940,500 | |
0.29%, 06/08/16 | | 24,000,000 | | 23,969,260 | |
0.42%, 07/01/16 | | 40,000,000 | | 39,915,067 | |
| | | | 359,800,316 | |
Repurchase Agreements - 11.5% | | | | | |
Repurchase Agreement with BCL, 0.32% (Collateralized by $8,022,500 U.S. Treasury Note, 0.50-4.25%, due 06/30/16-11/15/23, value $8,364,069) acquired on 12/31/15, due on 01/04/16 at $8,200,292 | | 8,200,000 | | 8,200,000 | |
Repurchase Agreement with BMO, 0.30% (Collateralized by $2,006,100 U.S. Treasury Note, 0.63-7.25%, due 05/15/16-05/15/23, value $1,987,354 and $5,016,166 Federal National Mortgage Association 2.00-4.00%, due 06/01/23-04/01/45, value $5,356,709) acquired on 12/31/15, due on 01/04/16 at $7,200,240 | | 7,200,000 | | 7,200,000 | |
Repurchase Agreement with BNP, 0.30% (Collateralized by $17,865 Government National Mortgage Association, 2.50-6.00%, due 09/15/37-07/15/43, value $19,465 and $2,517,559 Federal National Mortgage Association 3.00-4.00%, due 02/01/26-01/01/42, value $2,632,536) acquired on 12/31/15, due on 01/04/16 at $2,600,087 | | 2,600,000 | | 2,600,000 | |
Repurchase Agreement with BOA, 0.30% (Collateralized by $24,313,318 Government National Mortgage Association, 3.50%, due 03/20/45, value $25,398,000) acquired on 12/31/15, due on 01/04/16 at $24,900,830 | | 24,900,000 | | 24,900,000 | |
Repurchase Agreement with DUB, 0.36% (Collateralized by $6,032,283 Government National Mortgage Association, 4.00%, due 12/20/45, value $6,426,000) acquired on 12/31/15, due on 01/04/16 at $6,300,252 | | 6,300,000 | | 6,300,000 | |
Repurchase Agreement with GSC, 0.30% (Collateralized by $42,534,488 Government National Mortgage Association, 4.00-4.50%, due 06/15/39-09/20/44, value $45,833,368 and $60,284 Federal National Mortgage Association 4.50%, due 12/01/45, value $66,633) acquired on 12/28/15, due on 01/04/16 at $45,002,625 | | 45,000,000 | | 45,000,000 | |
Repurchase Agreement with GSC, 0.30% (Collateralized by $48,742,068 Government National Mortgage Association, 3.50%, due 06/20/45-07/20/45, value $50,916,581 and $78,211 Federal Home Loan Mortgage Corp. 3.50-4.00%, due 10/01/44-06/20/45, value $83,420) acquired on 12/30/15, due on 01/06/16 at $50,002,917 | | 50,000,000 | | 50,000,000 | |
Repurchase Agreement with GSC, 0.32% (Collateralized by $28,798,480 Government National Mortgage Association, 3.00-4.00%, due 12/15/28-07/15/45, value $30,539,672 and $54,722 Federal National Mortgage Association 4.50%, due 10/01/44, value $60,329) acquired on 12/31/15, due on 01/07/16 at $30,001,867 | | 30,000,000 | | 30,000,000 | |
Repurchase Agreement with GSC, 0.32% (Collateralized by $740,315 Federal National Mortgage Association, 3.00-3.50%, due 11/01/26-12/01/34, value $771,282 and $521,604 Federal Home Loan Mortgage Corp. 3.50-6.50%, due 09/01/17-12/01/43, value $554,718) acquired on 12/31/15, due on 01/04/16 at $1,300,046 | | 1,300,000 | | 1,300,000 | |
Repurchase Agreement with HSB, 0.29% (Collateralized by $67,450,000 U.S. Treasury Note, 0.63-2.63%, due 02/15/17-08/31/22, value $68,952,675) acquired on 12/31/15, due on 01/04/16 at $67,602,178 | | 67,600,000 | | 67,600,000 | |
Repurchase Agreement with RBC, 0.28% (Collateralized by $9,981,965 Federal National Mortgage Association, 0.00-4.00%, due 04/01/36-12/01/45, value $10,398,044 and $2,078,733 Federal Home Loan Mortgage Corp. 2.19-3.14%, due 05/01/36-10/01/44, value $2,147,957) acquired on 12/31/15, due on 01/04/16 at $12,300,383 | | 12,300,000 | | 12,300,000 | |
Repurchase Agreement with RBS, 0.30% (Collateralized by $82,467,000 U.S. Treasury Note, 1.38-3.63%, due 08/31/18-02/15/20, value $86,906,780) acquired on 12/31/15, due on 01/04/16 at $85,202,840 | | 85,200,000 | | 85,200,000 | |
See accompanying Notes to Financial Statements.
| | Shares/Par † | | Value | |
Repurchase Agreement with TDS, 0.32% (Collateralized by $13,595,700 U.S. Treasury Bill, 0.00%, due 06/23/16, value $13,566,061) acquired on 12/31/15, due on 01/04/16 at $13,300,473 | | 13,300,000 | | 13,300,000 | |
| | | | 353,900,000 | |
Total Short Term Investments (cost $1,835,803,980) | | | | 1,835,803,980 | |
Total Investments - 79.2% (cost $2,439,208,803) | | | | 2,439,208,803 | |
Other Assets and Liabilities, Net - 20.8% | | | | 641,461,348 | |
Total Net Assets - 100.0% | | | | $ | 3,080,670,151 | |
| | | | | | |
Portfolio Composition: | | Percentage of Total
Investments | |
Government Securities | | 10.6 | % |
Financials | | 10.0 | |
Information Technology | | 2.4 | |
Consumer Staples | | 1.3 | |
Health Care | | 0.4 | |
Short Term Investments | | 75.3 | |
Total Investments | | 100.0 | % |
(a) | Variable rate security. Rate stated was in effect as of December 31, 2015. |
(b) | Securities in this category are direct debt of the agency and not collateralized by mortgages. |
(c) | Treasury inflation indexed note, par amount is adjusted for inflation. |
(d) | The Sub-Adviser has deemed this security which is exempt from registration under the 1933 Act to be liquid based on procedures approved by the Board. As of December 31, 2015, the aggregate value of these liquid securities was $428,469,194 which represented 13.9% of net assets. |
See accompanying Notes to Financial Statements.
JNL Investors Series Trust
Notes to Schedules of Investments
December 31, 2015
Currency Abbreviations:
EUR - European Currency Unit (Euro)
Abbreviations:
REMIC - Real Estate Mortgage Investment Conduit
TBA -To Be Announced (Securities purchased on a delayed delivery basis)
Counterparty Abbreviations:
BMO - BMO Capital Markets Corp.
BNP - BNP Paribas Securities
BOA - Bancamerica Securities/Bank of America NA
DUB - Deutsche Bank Alex Brown Inc.
GSC - Goldman Sachs & Co.
HSB - HSBC Securities Inc.
RBC - Royal Bank of Canada
RBS - Royal Bank Of Scotland
TDS - TD Securities Inc.
† Par amounts are listed in United States Dollars unless otherwise noted.
Restricted Securities - The Funds invest in securities that are restricted under the 1933 Act, or which are subject to legal, contractual, or other agreed upon restrictions on resale. Restricted securities are often purchased in private placement transactions and cannot be sold without prior registration unless the sale is pursuant to an exemption under the 1933 Act. As of December 31, 2015, the following Funds held investments in restricted securities, excluding certain securities exempt from registration under the 1933 Act which are deemed to be liquid, as follows:
| | Initial
Acquisition
Date | | Cost | | Ending
Value | | Percent of
Net Assets | |
JNL/PPM America Low Duration Bond Fund | | | | | | | | | |
Sierra Timeshare Receivables Funding LLC, 3.26%, 02/20/19 | | 05/05/2015 | | $ | 453,973 | | $ | 450,800 | | 0.1 | % |
JNL/PPM America Total Return Fund | | | | | | | | | |
Enel SpA, 8.75%, 09/24/73 | | 09/18/2013 | | $ | 1,857,283 | | $ | 2,131,740 | | 0.2 | % |
Exelon Corp., 3.95%, 06/15/25 | | 12/07/2015 | | 2,204,680 | | 2,207,345 | | 0.2 | |
| | | | $ | 4,061,963 | | $ | 4,339,085 | | 0.4 | % |
Schedule of Open Futures Contracts
| | Expiration | | Contracts
Long /
(Short) | | Unrealized
Appreciation /
(Depreciation) | |
JNL/PPM America Low Duration Bond Fund | | | | | | | |
U.S. Treasury Note Future, 2-Year | | March 2016 | | 560 | | $ | (167,725 | ) |
U.S. Treasury Note Future, 5-Year | | March 2016 | | (720 | ) | 253,216 | |
| | | | | | $ | 85,491 | |
JNL/PPM America Total Return Fund | | | | | | | |
Euro FX Currency Future | | March 2016 | | (34 | ) | $ | 71,779 | |
U.S. Treasury Long Bond Future | | March 2016 | | 95 | | (9,191 | ) |
U.S. Treasury Note Future, 10-Year | | March 2016 | | (849 | ) | 375,901 | |
U.S. Treasury Note Future, 2-Year | | March 2016 | | (88 | ) | 31,506 | |
U.S. Treasury Note Future, 5-Year | | March 2016 | | (277 | ) | 81,821 | |
Ultra Long Term U.S. Treasury Bond Future | | March 2016 | | (147 | ) | (96,355 | ) |
| | | | | | $ | 455,461 | |
See accompanying Notes to Financial Statements.
JNL Investors Series Trust
Statements of Assets and Liabilities
December 31, 2015
| | JNL/PPM America
Low Duration
Bond Fund | | JNL/PPM America
Total Return Fund | | JNL Money
Market Fund | |
Assets | | | | | | | |
Investments - unaffiliated, at value (a) (d) | | $ | 726,100,752 | | $ | 1,042,189,723 | | $ | 2,085,308,803 | |
Investments - affiliated, at value (b) | | 19,694,333 | | 34,606,249 | | — | |
Repurchase agreements (a) | | — | | — | | 353,900,000 | |
Total investments, at value (c) | | 745,795,085 | | 1,076,795,972 | | 2,439,208,803 | |
Cash | | 47,971 | | 1,114,502 | | 642,350,324 | |
Foreign currency (e) | | — | | 473,086 | | — | |
Receivable for investments sold | | 5,099,980 | | 4,099,602 | | 51,077 | |
Receivable for fund shares sold | | 453,100 | | 415,850 | | — | |
Receivable for dividends and interest | | 3,325,779 | | 8,287,548 | | 2,118,848 | |
Receivable for variation margin | | 23,397 | | 72,150 | | — | |
Receivable for deposits with brokers and counterparties | | 432,520 | | 2,170,740 | | — | |
Total assets | | 755,177,832 | | 1,093,429,450 | | 3,083,729,052 | |
| | | | | | | |
Liabilities | | | | | | | |
Payable for advisory fees | | 264,711 | | 443,061 | | 459,463 | |
Payable for administrative fees | | 60,869 | | 89,021 | | — | |
Payable for 12b-1 fee (Class A) | | 43,183 | | 62,836 | | — | |
Payable for investment securities purchased | | 18,494,796 | | 20,490,879 | | 2,118,150 | |
Payable for fund shares redeemed | | 408,397 | | 385,683 | | — | |
Payable for dividends | | — | | — | | 388,051 | |
Payable for trustee fees | | 5,747 | | 15,706 | | 81,577 | |
Payable for other expenses | | 2,188 | | 4,363 | | 11,660 | |
Payable for variation margin | | 103,897 | | 443,668 | | — | |
Payable upon return of securities loaned | | 18,228,193 | | 27,187,615 | | — | |
Total liabilities | | 37,611,981 | | 49,122,832 | | 3,058,901 | |
Net assets | | $ | 717,565,851 | | $ | 1,044,306,618 | | $ | 3,080,670,151 | |
| | | | | | | |
Net assets consist of: | | | | | | | |
Paid-in capital | | $ | 723,230,019 | | $ | 1,049,283,762 | | $ | 3,080,699,346 | |
Undistributed (excess of distributions over) net investment income (loss) | | (4,310 | ) | 33,768,615 | | (32,761 | ) |
Accumulated net realized gain (loss) | | (839,322 | ) | (6,225,830 | ) | 3,566 | |
Net unrealized depreciation on investments and foreign currency | | (4,820,536 | ) | (32,519,929 | ) | — | |
| | $ | 717,565,851 | | $ | 1,044,306,618 | | $ | 3,080,670,151 | |
| | | | | | | |
Shares outstanding (no par value), unlimited shares authorized | | 72,058,485 | | 91,389,543 | | 3,080,699,653 | |
Net asset value per share | | $ | 9.96 | | $ | 11.43 | | $ | 1.00 | |
(a) Investments - unaffiliated, at cost | | $ | 731,006,764 | | $ | 1,075,169,909 | | $ | 2,439,208,803 | |
(b) Investments - affiliated, at cost | | 19,694,333 | | 34,606,249 | | — | |
(c) Total investments, at cost | | $ | 750,701,097 | | $ | 1,109,776,158 | | $ | 2,439,208,803 | |
(d) Including value of securities on loan | | $ | 17,861,167 | | $ | 49,045,401 | | $ | — | |
(e) Foreign currency, at cost | | — | | 467,992 | | — | |
See accompanying Notes to Financial Statements.
JNL Investors Series Trust
Statements of Operations
For the For the Year Ended December 31, 2015
| | JNL/PPM
America Low
Duration Bond
Fund | | JNL/PPM
America Total
Return Fund | | JNL Money
Market Fund | |
Investment income | | | | | | | |
Dividends(a) | | $ | 5,997 | | $ | 274,094 | | $ | — | |
Interest | | 11,522,308 | | 40,549,760 | | 7,184,036 | |
Securities lending (a) | | 55,139 | | 268,488 | | — | |
Total investment income | | 11,583,444 | | 41,092,342 | | 7,184,036 | |
| | | | | | | |
Expenses | | | | | | | |
Advisory fees | | 2,943,929 | | 5,597,361 | | 5,446,386 | |
Administrative fees | | 673,474 | | 1,132,738 | | — | |
12b-1 fee (Class A) | | 1,346,973 | | 2,265,518 | | — | |
Legal fees | | 2,751 | | 4,796 | | 11,666 | |
Trustee fees | | 8,538 | | 15,415 | | 37,224 | |
Other expenses | | (300 | )(b) | (58,346 | )(b) | 32,930 | |
Total expenses | | 4,975,365 | | 8,957,482 | | 5,528,206 | |
Contractual expense waiver recovered | | — | | — | | 227,597 | |
Voluntary expense waiver | | — | | — | | (2,583 | ) |
Net expenses | | 4,975,365 | | 8,957,482 | | 5,753,220 | |
Net investment income | | 6,608,079 | | 32,134,860 | | 1,430,816 | |
| | | | | | | |
Realized and unrealized gain (loss) | | | | | | | |
Net realized gain (loss) on: | | | | | | | |
Unaffiliated investments | | 1,228,534 | | (442,230 | ) | 9,853 | |
Foreign currency related items | | — | | (40,110 | ) | — | |
Futures contracts | | (1,103,571 | ) | (5,018,150 | ) | — | |
Net change in unrealized appreciation (depreciation) on: | | | | | | | |
Investments | | (3,544,310 | ) | (43,088,822 | ) | — | |
Foreign currency related items | | (14 | ) | 8,301 | | — | |
Futures contracts | | 96,422 | | 1,664,640 | | — | |
Net realized and unrealized gain (loss) | | (3,322,939 | ) | (46,916,371 | ) | 9,853 | |
| | | | | | | |
Net increase (decrease) in net assets from operations | | $ | 3,285,140 | | $ | (14,781,511 | ) | $ | 1,440,669 | |
(a) Income from affiliated investments | | $ | 40,692 | | $ | 139,365 | | $ | — | |
(b) Includes reimbursed 24f-2 fees of $9,241 and $74,258 for JNL/PPM America Low Duration Bond Fund and JNL/PPM America Total Return Fund, respectively.
See accompanying Notes to Financial Statements.
JNL Investors Series Trust
Statements of Changes in Net Assets
For the Year Ended December 31, 2015
| | JNL/PPM America Low
Duration Bond Fund | | JNL/PPM America
Total Return Fund | | JNL Money
Market Fund | |
Operations | | | | | | | |
Net investment income | | $ | 6,608,079 | | $ | 32,134,860 | | $ | 1,430,816 | |
Net realized gain (loss) | | 124,963 | | (5,500,490 | ) | 9,853 | |
Net change in unrealized depreciation | | (3,447,902 | ) | (41,415,881 | ) | — | |
Net increase (decrease) in net assets from operations | | 3,285,140 | | (14,781,511 | ) | 1,440,669 | |
Distributions to shareholders | | | | | | | |
From net investment income | | | | | | | |
Class A | | (7,075,746 | ) | (25,394,394 | ) | — | |
Institutional Class | | — | | — | | (1,431,528 | ) |
From net realized gains | | | | | | | |
Class A | | — | | (533,835 | ) | — | |
From return of capital | | | | | | | |
Class A | | (91,942 | ) | — | | — | |
Total distributions to shareholders | | (7,167,688 | ) | (25,928,229 | ) | (1,431,528 | ) |
Share transactions(1) | | | | | | | |
Proceeds from the sale of shares | | | | | | | |
Class A | | 225,246,334 | | 324,844,398 | | — | |
Institutional Class | | — | | — | | 37,951,942,164 | |
Reinvestment of distributions | | | | | | | |
Class A | | 7,167,688 | | 25,928,229 | | — | |
Cost of shares redeemed | | | | | | | |
Class A | | (134,006,361 | ) | (360,477,594 | ) | — | |
Institutional Class | | — | | — | | (37,191,546,458 | ) |
Net increase (decrease) in net assets from share transactions | | 98,407,661 | | (9,704,967 | ) | 760,395,706 | |
Net increase (decrease) net assets | | 94,525,113 | | (50,414,707 | ) | 760,404,847 | |
Net assets beginning of year | | 623,040,738 | | 1,094,721,325 | | 2,320,265,304 | |
Net assets end of year | | $ | 717,565,851 | | $ | 1,044,306,618 | | $ | 3,080,670,151 | |
Undistributed (excess of distributions over) net investment income (loss) | | $ | (4,310 | ) | $ | 33,768,615 | | $ | (32,761 | ) |
(1)Share transactions | | | | | | | |
Shares sold | | | | | | | |
Class A | | 22,380,524 | | 27,196,434 | | — | |
Institutional Class | | — | | — | | 37,951,942,164 | |
Reinvestment of distributions | | | | | | | |
Class A | | 719,647 | | 2,250,714 | | — | |
Shares redeemed | | | | | | | |
Class A | | (13,313,662 | ) | (30,458,878 | ) | — | |
Institutional Class | | — | | — | | (37,191,546,458 | ) |
Net increase (decrease) | | | | | | | |
Class A | | 9,786,509 | | (1,011,730 | ) | — | |
Institutional Class | | — | | — | | 760,395,706 | |
Purchase and sales of investment securities (excluding short-term and dollar roll securities): | | | | | | | |
Purchase of securities | | $ | 826,356,272 | (a) | $ | 961,009,731 | (b) | $ | 1,207,442,397 | (c) |
Proceeds from sales of securities | | 737,238,171 | (a) | 1,008,425,509 | (b) | 1,213,291,327 | (c) |
| | | | | | | | | | |
(a) | Amounts include $275,834,720 and $271,229,064 of purchases and sales, respectively, of U.S. Government Securities. Amounts exclude $48,857,188 and $48,956,563 of purchases and sales, respectively, of dollar roll transaction securities. |
(b) | Amounts include $212,131,399 and $184,028,374 of purchases and sales, respectively, of U.S. Government Securities. Amounts exclude $358,030,635 and $360,926,723 of purchases and sales, respectively, of dollar roll transaction securities. |
(c) | Amounts include $629,330,898 and $605,005,327 of purchases and sales, respectively, of U.S. Government Securities. |
See accompanying Notes to Financial Statements.
JNL Investors Series Trust
Statements of Changes in Net Assets
For the Year Ended December 31, 2014
| | JNL/PPM America Low
Duration Bond Fund | | JNL/PPM America
Total Return Fund | | JNL Money
Market Fund | |
Operations | | | | | | | |
Net investment income | | $ | 4,011,835 | | $ | 24,635,631 | | $ | 103,096 | |
Net realized gain | | 1,200,965 | | 4,811,751 | | 35,257 | |
Net change in unrealized appreciation (depreciation) | | (1,762,930 | ) | 12,747,886 | | — | |
Net increase in net assets from operations | | 3,449,870 | | 42,195,268 | | 138,353 | |
Distributions to shareholders | | | | | | | |
From net investment income | | | | | | | |
Class A | | (4,228,679 | ) | (17,982,481 | ) | — | |
Institutional Class | | — | | — | | (222,605 | ) |
From net realized gains | | | | | | | |
Class A | | (1,732,765 | ) | (26,722 | ) | — | |
Institutional Class | | — | | — | | (54,974 | ) |
Total distributions to shareholders | | (5,961,444 | ) | (18,009,203 | ) | (277,579 | ) |
Share transactions(1) | | | | | | | |
Proceeds from the sale of shares | | | | | | | |
Class A | | 220,715,215 | | 587,478,985 | | — | |
Institutional Class | | — | | — | | 30,793,325,228 | |
Reinvestment of distributions | | | | | | | |
Class A | | 5,961,444 | | 18,009,203 | | — | |
Cost of shares redeemed | | | | | | | |
Class A | | (34,030,962 | ) | (130,793,954 | ) | — | |
Institutional Class | | — | | — | | (30,950,613,314 | ) |
Net increase (decrease) in net assets from share transactions | | 192,645,697 | | 474,694,234 | | (157,288,086 | ) |
Net increase (decrease) net assets | | 190,134,123 | | 498,880,299 | | (157,427,312 | ) |
Net assets beginning of year | | 432,906,615 | | 595,841,026 | | 2,477,692,616 | |
Net assets end of year | | $ | 623,040,738 | | $ | 1,094,721,325 | | $ | 2,320,265,304 | |
Undistributed (excess of distributions over) net investment income (loss) | | $ | 95,708 | | $ | 25,385,403 | | $ | (68,147 | ) |
(1)Share transactions | | | | | | | |
Shares sold | | | | | | | |
Class A | | 21,841,444 | | 49,500,724 | | — | |
Institutional Class | | — | | — | | 30,793,325,228 | |
Reinvestment of distributions | | | | | | | |
Class A | | 596,741 | | 1,521,048 | | — | |
Shares redeemed | | | | | | | |
Class A | | (3,373,139 | ) | (11,054,503 | ) | — | |
Institutional Class | | — | | — | | (30,950,613,314 | ) |
Net increase (decrease) | | | | | | | |
Class A | | 19,065,046 | | 39,967,269 | | — | |
Institutional Class | | — | | — | | (157,288,086 | ) |
See accompanying Notes to Financial Statements.
JNL Investors Series Trust
Financial Highlights
| | | | Increase (Decrease) from
Investment Operations | | Distributions from | | | | | | Supplemental Data | | Ratios(b) | |
Period
Ended | | Net Asset
Value,
Beginning
of Period | | Net
Investment
Income
(Loss)(a) | | Net Realized
& Unrealized
Gains
(Losses) | | Total from
Investment
Operations | | Net
Investment
Income | | Net Realized
Gains on
Investment
Transactions | | Net Asset
Value, End
of Period | | Total
Return(c) | | Net Assets,
End of
Period (in
thousands) | | Portfolio
Turnover (d) | | Net
Expenses to
Average Net
Assets | | Total
Expenses to
Average Net
Assets | | Net
Investment
Income
(Loss)
to Average
Net Assets | |
JNL/PPM America Low Duration Bond Fund | | | | | | | | | | | | | | | | | | | | | |
Class A | | | | | | | | | | | | | | | | | | | | | | | | | | | |
12/31/2015 | | $ | 10.01 | | $ | 0.10 | | $ | (0.05 | ) | $ | 0.05 | | $ | (0.10 | )(l) | $ | — | | $ | 9.96 | | 0.51 | % | $ | 717,566 | | 113 | %(e) | 0.74 | %(m) | 0.74 | %(m) | 0.98 | % |
12/31/2014 | | 10.02 | | 0.09 | | — | | 0.09 | | (0.07 | ) | (0.03 | ) | 10.01 | | 0.88 | | 623,041 | | 164 | (e) | 0.77 | | 0.77 | | 0.86 | |
12/31/2013 (f) | | 10.00 | | 0.02 | | 0.02 | | 0.04 | | (0.02 | ) | (0.00 | )(g) | 10.02 | | 0.41 | | 432,907 | | 125 | (e) | 0.75 | | 0.75 | | 0.57 | |
JNL/PPM America Total Return Fund | | | | | | | | | | | | | | | | | | | |
Class A | | | | | | | | | | | | | | | | | | | | | | | | | | | |
12/31/2015 | | 11.85 | | 0.34 | | (0.47 | ) | (0.13 | ) | (0.28 | ) | (0.01 | ) | 11.43 | | (1.11 | ) | 1,044,307 | | 88 | (i) | 0.79 | (m) | 0.79 | (m) | 2.84 | |
12/31/2014 | | 11.36 | | 0.34 | | 0.35 | | 0.69 | | (0.20 | ) | (0.00 | )(g) | 11.85 | | 6.06 | | 1,094,721 | | 94 | (i) | 0.81 | | 0.81 | | 2.86 | |
12/31/2013 | | 11.83 | | 0.33 | | (0.31 | ) | 0.02 | | (0.19 | ) | (0.30 | ) | 11.36 | | 0.20 | | 595,841 | | 102 | (i) | 0.80 | | 0.80 | | 2.84 | |
12/31/2012 | | 10.72 | | 0.25 | | 0.86 | | 1.11 | | (0.00 | )(g) | (0.00 | )(g) | 11.83 | | 10.44 | | 487,664 | | 229 | (i) | 0.80 | | 0.80 | | 2.15 | |
12/31/2011 (j) | | 11.73 | | 0.04 | | 0.04 | | 0.08 | | (0.49 | ) | (0.60 | ) | 10.72 | | 0.87 | | 301,591 | | 33 | (i) | 0.76 | (h) | 0.76 | (h) | 2.41 | |
10/31/2011 | | 12.38 | | 0.50 | | 0.27 | | 0.77 | | (0.54 | ) | (0.88 | ) | 11.73 | | 7.25 | | 29,476 | | 302 | (i) | 0.61 | | 0.61 | | 4.36 | |
JNL Money Market Fund | | | | | | | | | | | | | | | | | | | | | |
Institutional Class | | | | | | | | | | | | | | | | | | | | | | | | | |
12/31/2015 | | 1.00 | | — | | — | | — | | (0.00 | )(g) | — | | 1.00 | | 0.05 | | 3,080,670 | | N/A | | 0.20 | (k) | 0.19 | | 0.05 | |
12/31/2014 | | 1.00 | | — | | — | | — | | (0.00 | )(g) | — | | 1.00 | | 0.01 | | 2,320,265 | | N/A | | 0.17 | (k) | 0.19 | | 0.00 | |
12/31/2013 | | 1.00 | | — | | — | | — | | (0.00 | )(g) | — | | 1.00 | | 0.01 | | 2,477,693 | | N/A | | 0.18 | | 0.19 | | 0.01 | |
12/31/2012 | | 1.00 | | — | | — | | — | | (0.00 | )(g) | — | | 1.00 | | 0.05 | | 2,124,182 | | N/A | | 0.19 | | 0.19 | | 0.05 | |
12/31/2011 (j) | | 1.00 | | — | | — | | — | | (0.00 | )(g) | — | | 1.00 | | 0.01 | | 2,040,502 | | N/A | | 0.19 | | 0.19 | | 0.03 | |
10/31/2011 | | 1.00 | | — | | — | | — | | (0.00 | )(g) | — | | 1.00 | | 0.05 | | 1,894,400 | | N/A | | 0.19 | | 0.20 | | 0.05 | |
| | | | | | | | | | | | | | | | | | | | | | | | | | | | | | | | | | | |
(a) | Calculated using the average shares method. |
(b) | Annualized for periods less than one year. |
(c) | Total return assumes reinvestment of all distributions for the period. Total return is not annualized for periods less than one year. |
(d) | Portfolio turnover is not annualized for periods of less than one year. Dollar roll transaction securities are excluded for purposes of calculating portfolio turnover. |
(e) | Portfolio turnover including dollar roll transactions for JNL/PPM America Low Duration Bond Fund was 129%, 175% and 121% in 2013, 2014 and 2015, respectively. |
(f) | Commencement of operations for JNL/PPM America Low Duration Bond Fund was September 16, 2013. |
(g) | Amount represents less than $0.005. |
(h) | The JNL/PPM America Total Return Fund began charging an annual 12b-1 fee of 0.20% of average daily net assets on December 12, 2011. |
(i) | Portfolio turnover including dollar roll transactions for JNL/PPM America Total Return Fund was 410% for the year ended October 31, 2011, 56% for the period ended December 31, 2011, 328% for the year ended December 31, 2012, 168% for the year ended December 31, 2013, 125% for the year ended December 31, 2014 and 121% for the year ended December 31, 2015. |
(j) | For the two months ended December 31, 2011. |
(k) | Includes payments for recovery of contractual expense waivers. |
(l) | Distribution amount for the JNL/PPM America Low Duration Bond Fund includes a return of capital distribution which was less than $0.005 per share for the year ended December 31, 2015. |
(m) | The ratio of net and total expenses to average net assets for the JNL/PPM American Low Duration Bond Fund and the JNL/PPM America Total Return Fund excluding the reimbursement of 24f-2 fees was 0.74% and 0.80%, respectively. |
See accompanying Notes to Financial Statements.
JNL Investors Series Trust
Notes to Financial Statements
December 31, 2015
NOTE 1. ORGANIZATION
The JNL Investors Series Trust (“Trust”) was organized under the laws of Massachusetts, by a Declaration of Trust, dated July 28, 2000. The Trust is registered with the U.S. Securities and Exchange Commission (“SEC”) under the Investment Company Act of 1940, as amended (“1940 Act”), and the Securities Act of 1933, as amended (“1933 Act”), as an open-end management investment company issuing its shares in various series. Each series is known as a “Fund” (collectively, “Funds”) and represents a distinct portfolio with its own investment objectives and policies. The Trust currently consists of three (3) separate Funds, JNL/PPM America Low Duration Bond Fund and JNL/PPM America Total Return Fund, for which PPM America, Inc. serves as the Sub-Adviser, and JNL Money Market Fund, for which Wellington Management Company, LLP serves as Sub-Adviser. JNL/PPM America Low Duration Bond Fund, JNL/PPM America Total Return Fund and JNL Money Market Fund are diversified investment companies as defined in the 1940 Act.
Jackson National Asset Management, LLC (“JNAM” or “Adviser”), a wholly-owned subsidiary of Jackson National Life Insurance Company® (“Jackson”), serves as investment adviser to each of the Funds. Jackson is an indirect wholly owned subsidiary of Prudential plc, a publicly traded company incorporated in the United Kingdom. Prudential plc is not affiliated in any manner with Prudential Financial Inc., a company whose principal place of business is in the United States of America. PPM America, Inc., the Sub-Adviser for JNL/PPM America Low Duration Bond Fund and JNL/PPM America Total Return Fund, is an affiliate of JNAM.
JNL/PPM America Low Duration Bond Fund and JNL/PPM America Total Return Fund presently offer Class A shares. Shares of JNL/PPM America Total Return Fund are sold to Jackson and its separate accounts and other affiliated registered investment companies to fund the benefits of variable annuity contracts and variable life insurance policies. Shares may also be sold directly to Jackson and to other affiliated funds. Shares of JNL/PPM America Low Duration Bond Fund are available for sale to Jackson and to certain Funds in the JNL Series Trust and Jackson Variable Series Trust, open end management investment companies advised by JNAM. JNL Money Market Fund presently offers an Institutional Class of shares. Institutional Class shares are not sold to retail investors but are available for investment by affiliated Funds. At December 31, 2015, affiliated investment companies or Jackson owned 100% of the outstanding capital shares of JNL/PPM America Low Duration Bond Fund and JNL Money Market Fund.
NOTE 2. SIGNIFICANT ACCOUNTING POLICIES
The Funds are investment companies and follow accounting and reporting guidance under Financial Accounting Standards Board (“FASB”) Accounting Standards Codification (“ASC”) Topic 946, “Financial Services-Investment Companies”. The following is a summary of significant accounting policies consistently followed by the Trust in the preparation of its financial statements in conformity with U.S. generally accepted accounting principles (“GAAP”).
Security Valuation - Under the Trust’s valuation policy and procedures, the Trust’s Board of Trustees (“Board” or “Trustees”) has delegated the daily operational oversight of the securities valuation function to the JNAM Pricing Committee (“Pricing Committee”), which consists of certain officers of the Trust and JNAM management. The Pricing Committee is responsible for determining fair valuations for any security for which market quotations are not readily available. For those securities fair valued under procedures adopted by the Board, the Pricing Committee reviews and affirms the reasonableness of the fair valuation determinations after considering all relevant information that is reasonably available. The Pricing Committee’s fair valuation determinations are subject to review by the Board at its next regularly scheduled meeting covering the calendar quarter in which the fair valuation was determined. For fair valuation determinations that are deemed significant, the Board is promptly notified, in detail, of the fair valuation.
The net asset value (“NAV”) of each Fund shall be determined as of the close of trading (generally, 4:00 PM Eastern Time) on each day the New York Stock Exchange (“NYSE”) is open for trading. Debt securities are generally valued by independent pricing services approved by the Board. Pricing services utilized to value debt securities may use various pricing techniques which take into account appropriate factors such as: yield; credit quality; coupon rate; maturity; type of issue; trading characteristics; call features; credit ratings; broker quotes; and other relevant data. If pricing services are unable to provide valuations, debt securities are valued at the most recent bid quotation for a long position and ask quotation for a short position or an evaluated price, as applicable, obtained from each Fund’s Sub-Adviser, a broker/dealer or widely used quotation system. All securities in the JNL Money Market Fund, as permitted by compliance with applicable provisions of Rule 2a-7 under the 1940 Act, and other short-term securities maturing within sixty (60) days are valued at amortized cost, unless it is determined that such practice does not approximate market value. Futures contracts traded on an exchange are generally valued at the exchange’s settlement price. If the settlement price is not available, exchange traded futures are valued at the last sales price as of the close of business on the local exchange. Stocks traded on an exchange are generally valued at the official closing price of the exchange where the security is principally traded. If there is no official closing price for the security, the security may be valued at the last quoted sale price on the exchange where the security is principally traded or final bid price in the absence of a sale. Stocks not listed on a national or foreign stock exchange may be valued at the closing bid price on the over the counter market. Investments in mutual funds are valued at the NAV per share determined as of the close of the NYSE on each valuation date.
Market quotations may not be readily available for certain investments or it may be determined that a quotation of an investment does not represent market value. In such instances, the investment is valued as determined in good faith using procedures approved by the Board. Situations that may require an investment to be fair valued may include instances where a security is thinly traded, halted or restricted as to resale. In addition, investments may be fair valued based on the occurrence of a significant event. Significant events may be specific to a particular issuer, such as mergers, restructurings or defaults. Alternatively, significant events may affect an entire market, such as natural disasters, government action and significant changes in value of U.S. securities markets. Securities are fair valued based on observable and unobservable inputs, including the Adviser’s or Pricing Committee’s own assumptions in determining the fair value of an investment. Under the procedures approved by the Board, the Adviser may utilize pricing services or other sources, including each Fund’s Sub-Adviser, to assist in determining the fair value of an investment. Factors considered to determine fair value may include the correlation with price movement of similar securities in the same or other markets; the type, cost and investment characteristics of the security; the business and financial condition of the issuer; and trading or other market data.
JNL Investors Series Trust
Notes to Financial Statements
December 31, 2015
If an investment is valued at a fair value for purposes of calculating a Fund’s NAV, the value may be different from the last quoted price for the investment depending on the source and method used to determine the value. Although there can be no assurance, in general, the fair value of the investment is the amount the owner of such investment might reasonably expect to receive in an orderly transaction between market participants upon its current sale.
Distributions to Shareholders - The amount and timing of distributions are determined in accordance with federal income tax regulations, which may differ from GAAP. JNL/PPM America Low Duration Bond Fund and JNL/PPM America Total Return Fund generally declare and pay dividends from net investment income annually, but may pay more frequently to avoid excise tax. JNL Money Market Fund declares dividends daily and pays dividends monthly. Distributions of net realized capital gains, if any, will be distributed at least annually, to the extent they exceed available capital loss carryforwards.
Security Transactions and Investment Income - Security transactions are recorded on the trade date for financial reporting purposes. Dividend income, net of applicable withholding taxes, is recorded on the ex-dividend date. Income received in lieu of dividends for securities loaned is included in dividends in the Statements of Operations. Interest income, including level-yield amortization of discounts and premiums, is accrued daily. A Fund may place a debt obligation on non-accrual status and reduce related interest income by ceasing current accruals and writing off interest receivables when the collection of all or a portion of interest has become doubtful. A debt obligation is removed from non-accrual status when the issuer resumes interest payments or when collectability of interest is reasonably assured. Realized gains and losses are determined on the specific identification basis.
Expenses - Expenses are recorded on an accrual basis. Expenses of the Trust that are directly attributable to a specific Fund are charged to that Fund. Other Trust level expenses are allocated to the Funds based on the average daily net assets of each Fund.
Guarantees and Indemnifications - In the normal course of business, the Trust may enter into contracts that contain a variety of representations which provide general indemnifications for certain liabilities. Under the Trust’s organizational documents, its officers and Trustees are indemnified against certain liabilities arising out of the performance of their duties to the Funds. However, since their commencement of operations, the Funds have not had claims or losses pursuant to their contracts and expect the risk of loss to be remote. The Funds’ maximum exposure under these arrangements is unknown since the amount of any future claims that may be made against the Funds cannot be determined and the Funds have no historical basis for predicting the likelihood of any such claims.
Use of Estimates - The preparation of financial statements in conformity with GAAP requires management to make estimates and assumptions that affect the reported amounts of assets and liabilities and disclosure of contingent assets and liabilities at the date of the financial statements and the reported amounts of increases and decreases in net assets from operations during the reporting period. Actual results could differ from those estimates.
Recent Accounting Pronouncements - In June 2014, FASB released Accounting Standards Update (“ASU”) 2014-11 “Repurchase-to-Maturity Transactions, Repurchase Financings and Disclosures”. The amendments in this ASU change the accounting for repurchase-to-maturity transactions and linked repurchase financings to secured borrowing accounting, which is consistent with the accounting for other repurchase agreements. The amendments also require two new disclosures. The first disclosure requires an entity to disclose information on transfers accounted for as sales in transactions that are economically similar to repurchase agreements. The second disclosure provides increased transparency about the types of collateral pledged in repurchase agreements and similar transactions accounted for as secured borrowings. ASU 2014-11 is effective for the first interim and annual period beginning on or after December 15, 2014, and the required disclosures were incorporated into this report.
NOTE 3. FASB ASC TOPIC 820, “FAIR VALUE MEASUREMENT”
This standard establishes a single authoritative definition of fair value, sets out a framework for measuring fair value and requires additional disclosures about fair value measurements. Various inputs are used in determining the value of a Fund’s investments under FASB ASC Topic 820 guidance. The inputs are summarized into three broad categories.
Level 1 includes valuations based on quoted prices of identical securities in active markets including valuations for securities listed on a national or foreign stock exchange or investments in mutual funds and securities lending collateral, which is valued as a practical expedient at its daily reported NAV.
Level 2 includes valuations determined from significant direct or indirect observable inputs. Direct observable inputs include broker quotes, third party prices, closing prices of similar securities in active markets, closing prices for identical or similar securities in non-active markets or corporate action or reorganization entitlement values. Indirect significant observable inputs include factors such as interest rates, yield curves, prepayment speeds or credit ratings. Level 2 includes valuations for fixed income securities, broker quotes in active markets, securities subject to corporate actions, or securities valued at amortized cost.
Level 3 includes valuations determined from significant unobservable inputs including the Adviser’s own assumptions in determining the fair value of the investment. Inputs used to determine the fair value of Level 3 securities include security specific inputs such as: credit quality, credit rating spreads, issuer news, trading characteristics, call features, maturity or anticipated cash flows; or industry specific inputs such as: trading activity of similar markets or securities, changes in the security’s underlying index or changes in comparable securities’ models. Level 3 valuations include securities that are priced based on single source broker quotes; securities where prices may be unavailable due to halted trading, restricted to resale due to market events, or newly issued; or investments for which reliable quotes are otherwise not available.
JNL Investors Series Trust
Notes to Financial Statements
December 31, 2015
To assess the continuing appropriateness of security valuation, the Adviser regularly compares prior day prices with current day prices, transaction prices and alternative vendor prices. When the comparison results exceed pre-defined thresholds, the Adviser challenges the prices exceeding tolerance levels with the pricing service or broker. To verify Level 3 unobservable inputs, the Adviser uses a variety of techniques as appropriate to substantiate these valuation approaches including a regular review of key inputs and assumptions, transaction back-testing or disposition analysis and review of related market activity.
The inputs or methodology used for valuing securities are not necessarily an indication of the risk associated with investing in those securities.
The following table summarizes each Fund’s investments in securities and other financial instruments as of December 31, 2015 by valuation level.
| | Assets - Securities | |
| | Level 1 | | Level 2 | | Level 3 | | Total | |
JNL/PPM America Low Duration Bond Fund | | | | | | | | | |
Non-U.S. Government Agency Asset-Backed Securities | | $ | — | | $ | 215,861,013 | | $ | — | | $ | 215,861,013 | |
Corporate Bonds and Notes | | — | | 373,173,691 | | 2,484,450 | | 375,658,141 | |
Government and Agency Obligations | | — | | 116,353,405 | | — | | 116,353,405 | |
Short Term Investments | | 37,922,526 | | — | | — | | 37,922,526 | |
Fund Total | | $ | 37,922,526 | | $ | 705,388,109 | | $ | 2,484,450 | | $ | 745,795,085 | |
JNL/PPM America Total Return Fund | | | | | | | | | |
Non-U.S. Government Agency Asset-Backed Securities | | $ | — | | $ | 55,163,825 | | $ | — | | $ | 55,163,825 | |
Corporate Bonds and Notes | | — | | 577,213,170 | | 11,882,237 | | 589,095,407 | |
Government and Agency Obligations | | — | | 346,192,072 | | — | | 346,192,072 | |
Preferred Stocks | | 2,446,950 | | — | | — | | 2,446,950 | |
Variable Rate Senior Loan Interests | | — | | 19,096,854 | | 3,007,000 | | 22,103,854 | |
Short Term Investments | | 61,793,864 | | — | | — | | 61,793,864 | |
Fund Total | | $ | 64,240,814 | | $ | 997,665,921 | | $ | 14,889,237 | | $ | 1,076,795,972 | |
JNL Money Market Fund | | | | | | | | | |
Corporate Bonds and Notes | | $ | — | | $ | 343,691,257 | | $ | — | | $ | 343,691,257 | |
Government and Agency Obligations | | — | | 259,713,566 | | — | | 259,713,566 | |
Short Term Investments | | — | | 1,835,803,980 | | — | | 1,835,803,980 | |
Fund Total | | $ | — | | $ | 2,439,208,803 | | $ | — | | $ | 2,439,208,803 | |
| | Assets - Other Financial Instruments(1) | |
| | Level 1 | | Level 2 | | Level 3 | | Total | |
JNL/PPM America Low Duration Bond Fund | | | | | | | | | |
Open Futures Contracts | | $ | 253,216 | | $ | — | | $ | — | | $ | 253,216 | |
Fund Total | | $ | 253,216 | | $ | — | | $ | — | | $ | 253,216 | |
JNL/PPM America Total Return Fund | | | | | | | | | |
Open Futures Contracts | | $ | 561,007 | | $ | — | | $ | — | | $ | 561,007 | |
Fund Total | | $ | 561,007 | | $ | — | | $ | — | | $ | 561,007 | |
| | Liabilities - Other Financial Instruments(1) | |
| | Level 1 | | Level 2 | | Level 3 | | Total | |
JNL/PPM America Low Duration Bond Fund | | | | | | | | | |
Open Futures Contracts | | $ | (167,725 | ) | $ | — | | $ | — | | $ | (167,725 | ) |
Fund Total | | $ | (167,725 | ) | $ | — | | $ | — | | $ | (167,725 | ) |
JNL/PPM America Total Return Fund | | | | | | | | | |
Open Futures Contracts | | $ | (105,546 | ) | $ | — | | $ | — | | $ | (105,546 | ) |
Fund Total | | $ | (105,546 | ) | $ | — | | $ | — | | $ | (105,546 | ) |
(1)Investments in other financial instruments include futures contracts which are reflected at the unrealized appreciation/ (depreciation) on the instrument.
Significant changes in unobservable valuation inputs to a different amount might result in a significantly higher or lower fair value measurement than the one used in a security’s valuation. The Funds recognize transfers between levels as of the beginning of the period for financial reporting purposes. There were no significant transfers into or out of Level 1, 2, or 3 for the period. There were no significant Level 3 valuations for which significant unobservable valuation inputs were developed at December 31, 2015.
NOTE 4. SECURITIES INVESTMENTS, INVESTMENT RISKS AND REGULATORY MATTERS
U.S. Government Agencies or Government Sponsored Enterprises - Certain Funds may invest in U.S. government agencies or government sponsored enterprises. U.S. Government securities are obligations of, and in certain cases, guaranteed by, the U.S. government, its agencies or instrumentalities. Some U.S. Government securities, such as Treasury bills, notes and bonds, and securities guaranteed by the Government National Mortgage Association, are supported by the full faith and credit of the U.S. government; others, such as those of the Federal Home Loan Bank, are supported by the right of the issuer to borrow from the U.S. Department of the Treasury (“U.S. Treasury”); others, such as those of the Federal National Mortgage Association (“FNMA” or “Fannie Mae”), are supported by the discretionary authority of the U.S. government to purchase the agency’s obligations; and still others, such as those of the Student Loan Marketing Association, are supported only by the credit of the instrumentality. U.S.
JNL Investors Series Trust
Notes to Financial Statements
December 31, 2015
Government securities may include zero coupon securities, which do not distribute interest on a current basis and tend to be subject to greater risk than interest paying securities of similar maturities.
Government-related guarantors (i.e., guarantors that are not backed by the full faith and credit of the U.S. government) include FNMA and the Federal Home Loan Mortgage Corporation (“FHLMC” or “Freddie Mac”). FNMA purchases conventional (i.e., not insured or guaranteed by any government agency) residential mortgages from a list of approved seller/servicers, which include state and federally chartered savings and loan associations, mutual savings banks, commercial banks and credit unions and mortgage bankers. Pass-through securities issued by FNMA are guaranteed as to timely payment of principal and interest by FNMA, but are not backed by the full faith and credit of the U.S. government. FHLMC issues Participation Certificates (“PCs”), which are pass-through securities, each representing an undivided interest in a pool of residential mortgages. FHLMC guarantees the timely payment of interest and ultimate collection of principal, but PCs are not backed by the full faith and credit of the U.S. government.
FNMA and FHMLC were placed into conservatorship by the Federal Housing Finance Agency (“FHFA”). As the conservator, FHFA succeeded to all rights, titles, powers and privileges of FNMA and FHLMC and of any stockholder, officer or director of FNMA and FHLMC with respect to FNMA and FHLMC and each enterprise’s assets. In connection with the conservatorship, the U.S. Treasury entered into a Senior Preferred Stock Purchase Agreement with FNMA and FHLMC. This agreement contains various covenants that severely limit each enterprise’s operations. In exchange for entering into these agreements, the U.S. Treasury received senior preferred stock in each enterprise and warrants to purchase each enterprise’s common stock. The U.S. Treasury created a new secured lending facility, which is available to FNMA and FHLMC as a liquidity backstop and created a temporary program to purchase mortgage-backed securities issued by FNMA and FHLMC. FNMA and FHLMC are continuing to operate as going concerns while in conservatorship and each remains liable for all of its obligations, including its guaranty obligations, associated with its mortgage-backed securities.
Unregistered Securities - A Fund may own certain investment securities that are unregistered and thus restricted to resale. These securities may also be referred to as “private placements”. Unregistered securities may be “illiquid” because there is no readily available market for sale of the securities. Where future dispositions of the securities require registration under the 1933 Act, as amended, the Funds have the right to include those securities in such registration generally without cost to the Funds. The Funds have no right to require registration of unregistered securities.
Repurchase Agreements - Certain Funds may invest in repurchase agreements. In a repurchase agreement, a Fund receives debt securities (collateral) subject to an obligation of the seller to repurchase, and the Fund to resell, the securities at an agreed upon price and date. The underlying securities used as collateral for repurchase agreements may be held in safekeeping by the Fund’s Custodian or designated sub-custodians under triparty repurchase agreements. Earnings on collateral and compensation to the seller are based on agreed upon rates between the seller and the Fund. Interest earned on repurchase agreements is recorded as interest income to the Fund. When a repurchase agreement is entered into, a Fund typically receives securities with a value that approximates or exceeds the repurchase price, including any accrued interest earned on the repurchase agreement. The value of such securities will be marked to market daily, and cash or additional securities will be exchanged between the parties with a frequency and in amounts prescribed in the repurchase agreement. In the event of a default by the counterparty, realization of the collateral proceeds could be delayed, during which time the value of such collateral may decline.
Delayed-Delivery Securities - JNL/PPM America Low Duration Bond Fund and JNL/PPM America Total Return Fund may purchase or sell securities on a delayed-delivery basis, including To Be Announced (“TBA”) or “To Be Acquired” securities. These transactions involve a commitment by a Fund to purchase or sell securities for a predetermined price or yield, with payment and delivery taking place beyond the customary settlement period. In TBA transactions, the Fund commits to purchasing or selling securities for which all specific information is not yet known at the time of the trade, particularly the face amount and maturity date of the underlying security transactions. When delayed-delivery purchases are outstanding, a Fund is required to have sufficient cash and/or liquid securities to cover its commitments on these transactions. When purchasing a security on a delayed-delivery basis, the Fund assumes the rights of ownership of the security, including the risk of price and yield fluctuations, and considers such fluctuations when determining its NAV. A Fund may dispose of or renegotiate a delayed-delivery transaction after it is entered into, and may sell delayed-delivery securities before they are delivered, which may result in a realized gain or loss. When a Fund has sold a security on a delayed-delivery basis, the Fund does not participate in future gains or losses with respect to the security. Securities purchased on a TBA basis are not settled until they are delivered to the Fund. In connection with TBA transactions, Funds may maintain a short position related to certain securities. In connection with these transactions, the Fund owns an equal amount of the securities or holds securities convertible (or exchangeable) into an equal amount of the securities, of the same issuer, as the position held short.
Mortgage-Backed Dollar and Treasury Roll Transactions - JNL/PPM America Low Duration Bond Fund and JNL/PPM America Total Return Fund may sell mortgage-backed or treasury securities and simultaneously contract to repurchase securities at a future date at an agreed upon price. The Funds may only enter into covered rolls. A “covered roll” is a type of dollar or Treasury roll for which a Fund maintains offsetting positions in cash, U.S. Government securities, or other liquid assets which mature on or before the forward repurchase settlement date of the dollar or Treasury roll transaction. During the period between the sale and repurchase, a Fund foregoes interest and principal paid on the mortgage-backed or Treasury securities. A Fund is compensated by the interest earned on the cash proceeds of the initial sale and from negotiated fees paid by brokers offered as an inducement to the Fund to “roll over” its purchase commitments. A Fund may dispose of “covered roll” securities after they are entered into and close these positions before their maturity, which may result in a realized gain or loss.
Dollar or Treasury roll transactions involve the risk that the market value of the securities sold by a Fund may decline below the repurchase price of those securities which the Fund is obligated to purchase or that the return earned by the Fund with the proceeds of a dollar roll may not exceed transaction costs.
JNL Investors Series Trust
Notes to Financial Statements
December 31, 2015
In a mortgage-backed or treasury securities roll transaction, if the repurchased security is determined to be similar, but not substantially the same, the transaction is accounted for as a purchase and sale. Any gains, losses and any income or fees earned are recorded to realized gain or loss. If the repurchased security is determined to be substantially the same, the transaction is accounted for as a secured borrowing, rather than as a purchase and sales transaction. Any income or fees earned are recorded to investment income and financing costs associated with the transaction are recorded to interest expense. For the year ended December 31, 2015, JNL/PPM America Low Duration Bond Fund and JNL/PPM America Total Return Fund did not transact in treasury transactions characterized as secured borrowing transactions.
Securities Lending and Securities Lending Collateral - The JNL/PPM America Low Duration Bond Fund and JNL/PPM America Total Return Fund participate in an agency based securities lending program. Per the securities lending agreements, the securities lending agent is authorized to loan securities on behalf of the Funds to approved borrowers and is required to maintain collateral. Each Fund receives either cash or non- cash collateral against the loaned securities in an amount equal to at least 100% of the market value of the loaned securities. Generally, cash and non-cash collateral received for the following types of securities on loan are as follows: U.S. equity – 102%; U.S. corporate fixed income – 102%; U.S. government fixed income – 102%; international equities – 105%; international corporate fixed income – 105%; sovereign fixed income – 102%; and asset backed investments – 102%. Collateral is maintained over the life of the loan as determined at the close of Fund business each day; any additional collateral required due to changes in security values is delivered to the Fund on the next business day. The duration of each loan is determined by the agent and borrower and generally may be terminated at any time. Certain loans may be negotiated to mature on a specified date. The securities lending agents have agreed to indemnify the Fund in the event of default by a third party borrower. A Fund may experience a delay in the recovery of its securities or incur a loss if the borrower breaches its agreement with the Fund or becomes insolvent. For cash collateral, the Funds receive income from the investment of cash collateral, in addition to lending fees and rebates negotiated with the borrower. The Fund bears the market risk with respect to the collateral investment and securities loaned. The Fund also bears the risk that the agent may default on its obligations to the Fund. Non-cash collateral which a Fund receives may include U.S., UK and certain Eurozone government securities; U.S. government agencies’ debt securities; and U.S. government-sponsored agencies’ debt securities and mortgaged back securities. For non-cash collateral, the Fund receives lending fees negotiated with the borrower. The securities lending agent has agreed to indemnify the Fund with respect to the market risk related to the non-cash collateral investments.
State Street Bank and Trust Company (“State Street” or “Custodian”) serves as custodian and securities lending agent to the Funds. The cash collateral is invested in the State Street Navigator Lending Trust — Prime Portfolio, a money market fund and a series of State Street Navigator Securities Lending Trust which is an open end management company registered under the 1940 Act. Each Fund also bears the risk of any deficiency in the amount of collateral available for return to a borrower due to a decline in value of the State Street Navigator Lending Trust — Prime Portfolio.
Cash collateral received from the borrower is recorded in the Statements of Assets and Liabilities as payable upon return of securities loaned. Investments acquired with such cash collateral are reported in a manner consistent with other portfolio investments held by each Fund as investment - at value on the Statements of Assets and Liabilities. The value of securities on loan is disclosed under footnote (d) on the Statements of Assets and Liabilities. Each Fund’s net exposure to a borrower is determined by the amount of any excess or shortfall in cash collateral received compared to the value of securities on loan. Certain Funds receive non-cash collateral in the form of securities, which the Funds may not sell or re-pledge and accordingly are not reflected in the Statements of Assets and Liabilities.
Market, Credit and Counterparty Risk - In the normal course of business, the Funds trade financial instruments and enter into financial transactions where the risk of potential loss exists due to changes in the market (“market risk”) or failure of the other party to a transaction to perform (“credit risk”). Similar to credit risk, the Funds may be exposed to counterparty risk, or the risk that an institution or other entity with which the Funds have unsettled or open transactions will default. Financial assets, which potentially expose the Funds to credit risk, consist principally of investments and cash due from counterparties (“counterparty risk”). The extent of the Funds’ exposure to credit and counterparty risks in respect to these financial assets is incorporated within their carrying value as recorded in the Funds’ Statements of Assets and Liabilities. For certain derivative contracts, the potential loss could exceed the value of the financial assets recorded in the financial statements.
Money Market Fund Reform - In July 2014, the SEC voted to amend the rules under the 1940 Act applicable to money market funds which are intended to address perceived systemic risks associated with money market funds and to improve transparency for money market fund investors. The new rules require a floating net asset value (NAV) for institutional prime money market funds, along with the potential use of liquidity fees and redemption gates for all prime money market funds in times of market stress. The SEC also adopted additional diversification, stress-testing and disclosure measures for money market funds. Government money market funds, defined under the new rules as having 99.5% of total assets in cash, government securities, and/or repurchase agreements that are collateralized by cash or government securities are exempt from the new rules. Additionally, the Financial Stability Oversight Council (“FSOC”), a board of U.S. regulators established by the Dodd-Frank Act, had proposed certain recommendations for money market fund reform. The amendments have staggered compliance dates with a majority of these amendments requiring compliance on October 14, 2016, two years after the effective date for the amendments. At a November 6, 2015 shareholder meeting, a conversion of the JNL Money Market Fund to a government money market fund was approved by shareholders. The expected conversion date is in September 2016.
NOTE 5. INVESTMENT TRANSACTION AGREEMENTS AND COLLATERAL
Under various agreements, certain investment transactions require collateral to be pledged to/from a Fund and a counterparty or segregated at the custodian and the collateral is managed pursuant to the terms of the agreement. U.S. Treasury Bills and U.S. dollar cash are generally the preferred forms of collateral, although other forms of high quality or sovereign securities may be used. Securities held by a Fund that are used as collateral are identified as such within the Schedules of Investments.
JNL Investors Series Trust
Notes to Financial Statements
December 31, 2015
Master Netting Agreements (“Master Agreements”) - Certain Funds are subject to various Master Agreements, which govern the terms of certain transactions and mitigate the counterparty risk associated with relevant transactions by specifying credit protection mechanisms and providing standardization that improves legal certainty. Since different types of financial transactions have different mechanics and are sometimes traded out of different legal entities of a particular counterparty organization, each type of transaction may be covered by a different Master Agreement, resulting in the need for multiple agreements with a single counterparty. A Fund may net exposure and collateralize multiple transaction types governed by the same Master Agreement with the same counterparty and may close out and net its total exposure to a counterparty in the event of a default and/or termination event with respect to all the transactions governed under a single agreement with a counterparty. Each Master Agreement defines whether the Fund is contractually able to net settle daily payments. Additionally, certain circumstances, such as laws of a particular jurisdiction or settlement of amounts due in different currencies, may prohibit or restrict the right of offset as defined in the Master Agreements.
Master Agreements also help limit credit and counterparty risk by specifying collateral posting arrangements at pre-arranged exposure levels. Under the Master Agreements, collateral is routinely transferred if the total net exposure to certain transactions (net of existing collateral) governed under the relevant master agreement with a counterparty in a given account exceeds a specified threshold depending on the counterparty and the type of Master Agreement. A Fund’s overall exposure to counterparty risk can change substantially within a short period, as it is affected by each transaction subject to the relevant Master Agreement. To the extent amounts due to a Fund from its counterparties are not fully collateralized, contractually or otherwise, the Fund bears the risk of loss from counterparty non-performance. The Funds’ Sub-Advisers attempt to limit counterparty risk by only entering into Master Agreements with counterparties which the Sub-Adviser believes to have the financial resources to honor their obligations and by monitoring the financial stability of those counterparties.
Master Repurchase Agreements and Global Master Repurchase Agreements (individually and collectively “Master Repo Agreements”) - Master Repo Agreements govern repurchase, reverse repurchase and treasury roll transactions between a Fund and select counterparties. The Master Repo Agreements maintain provisions for, among other things, initiation and confirmation, income payments and transfer, events of default, termination, and maintenance of collateral. In the event of default, the total value exposure will be offset against collateral exchanged to date, which would result in a net receivable/(payable) that would be due from/to the counterparty. Securities purchased under repurchase agreements are reflected as an asset on a Fund’s Statement of Assets and Liabilities. The value of repurchase agreements and collateral pledged or received by a counterparty are disclosed in the Schedules of Investments. A Fund’s net exposure to the counterparty is determined by the amount of any excess or shortfall in collateral compared to the value of the repurchase agreement.
Customer Account Agreements - Customer Account Agreements and related addendums govern cleared derivative transactions such as futures. Cleared derivatives transactions require posting an amount of cash or cash equivalents equal to a certain percentage of the contract amount known as the “initial margin” as determined by each relevant clearing agency and is segregated at a Futures Commissions Merchant (“FCM”) which is registered with the Commodity Futures Trading Commission (“CFTC”) or the applicable regulator. The Fund receives from, or pays to, the FCM an amount of cash equal to the daily fluctuation in the value of the contracts. Such receipts or payments are known as the “variation margin”. In the event of default, counterparty risk is significantly reduced as creditors to the FCM do not have claim to the Fund’s assets in the segregated account. Additionally, portability of exposure in the event of default further reduces risk.
NOTE 6. FINANCIAL DERIVATIVE INSTRUMENTS
FASB ASC Topic 815, “Derivatives and Hedging” - This standard includes the requirement for enhanced qualitative disclosures about objectives and strategies for using derivative instruments and disclosures regarding credit related contingent features in derivative instruments; as well as quantitative disclosures in the semi-annual and annual financial statements about fair value, gains and losses, and volume of activity for derivative instruments. Information about these instruments is disclosed in the context of each instrument’s primary underlying risk exposure which may be categorized as credit, equity price, interest rate and foreign currency exchange rate risk. The objectives, strategies and underlying risks for futures held by the Funds are discussed in the following paragraph.
Futures Contracts - During the year, the JNL/PPM America Low Duration Bond Fund entered into futures contracts to obtain exposure to or hedge changes in interest rates and foreign currency rates and to replicate Treasury bond positions. JNL/PPM America Total Return Fund entered into futures contracts to obtain exposure to or hedge changes in interest rates and foreign currency rates and to replicate Treasury bond positions. A futures contract is a standardized contract obligating two parties to exchange a specified asset at an agreed upon price and date. Variation margin is recorded by each Fund until the contracts are terminated at which time realized gains and losses are recognized. Futures contracts involve to varying degrees, risk of loss in excess of the variation margin recorded by the Fund. The primary risks associated with the use of futures contracts are the imperfect correlation between the change in value of the securities held by the Fund or the change in the value of an underlying entity and the prices of the futures contracts and the possibility the Fund may not be able to enter into a closing transaction because of an illiquid market. With futures, counterparty risk is reduced to the Fund since futures contracts are exchange traded and the exchange’s clearinghouse, acting as counterparty to all exchange traded futures, guarantees the futures contracts against default.
At December 31, 2015, variation margin related to futures contracts is reflected as receivable or payable for variation margin in the Statements of Assets and Liabilities. None of the futures contracts held by the Funds are subject to master netting agreements or a similar agreement and are not eligible for offset in the Statements of Assets and Liabilities as of December 31, 2015. During the year ended December 31, 2015, realized gains and change in unrealized appreciation in futures contracts is reflected for such investments in the Statements of Operations. Net exposure to the Funds for futures contracts is the variation margin receivable or payable in addition to any collateral pledged for the initial margin on the futures contracts. At December 31, 2015, the JNL/PPM America Low Duration Bond Fund and JNL/PPM America Total Return Fund had $432,520 and $2,170,740, respectively, of cash
JNL Investors Series Trust
Notes to Financial Statements
December 31, 2015
pledged as collateral for futures contracts. The futures contracts outstanding as of December 31, 2015, as disclosed in the Notes to the Schedules of Investments and the amounts of realized and changes in unrealized gains and losses on futures contracts during the year as disclosed in the Statements of Operations serve as indicators of the volume of activity for the Funds. For the year ended December 31, 2015, the average monthly notional value at purchase of futures in the JNL/PPM America Low Duration Bond Fund and JNL/PPM America Total Return Fund was $144,787,277 and $177,261,670, respectively.
NOTE 7. INVESTMENT ADVISORY FEES AND TRANSACTIONS WITH AFFILIATES
Advisory Fee - The Trust has an investment advisory and management agreement with JNAM, whereby JNAM provides investment management services. Each Fund pays JNAM an annual fee, accrued daily and paid monthly, based on a specified percentage of the average daily net assets of each Fund. A portion of this fee is paid by JNAM to the Sub-Advisers as compensation for their services. The JNL/PPM America Low Duration Bond Fund is obligated to pay JNAM an annual rate of 0.45% for net assets up to $500 million and 0.40% for net assets over $500 million. The JNL/PPM America Total Return Fund is obligated to pay JNAM an annual rate of 0.50% for net assets up to $1 billion and 0.45% for net assets over $1 billion. The JNL Money Market Fund is obligated to pay JNAM an annual rate of 0.20% for net assets up to $750 million and 0.18% for net assets over $750 million.
Administrative Fee - JNAM also serves as the “Administrator” to the Funds. Effective October 1, 2015, JNL/PPM America Low Duration Bond Fund and JNL/PPM America Total Return Fund pay JNAM an Administrative Fee at an annual rate of 0.10% of average daily net assets under $3 billion and 0.09% of average daily net assets over $3 billion of each Fund. Prior to October 1, 2015 JNL/PPM America Low Duration Bond Fund and JNL/PPM America Total Return Fund paid JNAM an Administrative Fee at an annual rate of 0.10% of average daily net assets of each Fund. The fee is accrued daily and paid monthly. JNAM provides or procures most of the necessary administrative functions and services for the operations of the JNL Money Market Fund at no additional cost. In accordance with the administration agreement, JNAM is responsible for payment of the following expenses: fund accounting, shareholder reporting, shareholder servicing, certain legal, insurance, custody, audit, and tax fees. Additionally, JNAM provides transfer agency services.
Fee Waiver and Expense Reimbursements - Pursuant to a contractual expense limitation agreement, effective November 1, 2010, JNAM agreed to waive fees and reimburse expenses of the JNL Money Market Fund to the extent necessary to limit operating expenses of the Fund (excluding brokerage expense, interest, taxes and dividend, and extraordinary expenses) to an annual rate as a percentage of average daily net assets equal to or less than the Fund’s net investment income for the year. JNAM also voluntarily waived certain fees and reimbursed expenses of the Fund during the year ended December 31, 2015. In addition, when the Fund receives income sufficient to pay a dividend, under the contractual expense limitation agreement JNAM may recapture previously waived fees and reimbursed expenses from the Fund for a period of three years following the reimbursement period. During the year ended December 31, 2015, JNAM recovered $227,015 of previously reimbursed expenses. At December 31, 2015, there were no previously waived fees available for recapture. The contractual amount of recovered reimbursed expenses are recorded as contractual expense waiver recovered in the Fund’s Statement of Operations.
Distribution Fees - JNL/PPM America Low Duration Bond Fund and JNL/PPM America Total Return Fund have adopted a Distribution Plan (the “Plan”) pursuant to the provisions of Rule 12b-1 under the 1940 Act. Pursuant to the Plan, the Funds will pay a distribution and/or service fee (“Rule 12b-1 fee”) to Jackson National Life Distributors LLC (the “Distributor” or “JNLD”), an affiliate of the Adviser, for the purpose of reimbursement of certain distribution, administrative, or related service expenses from the sale and distribution of each Fund’s Class A shares. To the extent consistent with existing law and the Plan, JNLD may use the Rule 12b-1 fees to reimburse or compensate broker-dealers, administrators or others for providing distribution, administrative or other services. Under the Plan, each Fund accrues the Rule 12b-1 fee daily, at the maximum annual rate of 0.20% of the average daily net assets attributable to Class A shares, and pays the fee monthly to JNLD. JNLD also is the principal underwriter of the variable annuity insurance products issued by Jackson and its subsidiaries. Amounts charged pursuant to the Plan are reflected as 12b-1 fees (Class A) in each Fund’s Statement of Operations. Institutional Class shares of JNL Money Market Fund have no Rule 12b-1 Fees.
Deferred Compensation Plan - Effective January 1, 2007, the Funds adopted a Deferred Compensation Plan whereby a disinterested Trustee may defer the receipt of all or a portion of their compensation. These deferred amounts, which remain as liabilities of the Funds, are treated as if invested and reinvested in shares of one or more funds at the discretion of the applicable Trustees. These amounts represent general, unsecured liabilities of the Funds and vary according to the total returns of the selected funds. Liabilities related to deferred balances are included in payable for Trustees fees in the Statements of Assets and Liabilities. Increases or decreases related to the changes in value of deferred balances are included in Trustees fees set forth in the Statements of Operations.
Investments in Affiliates - During the year ended December 31, 2015, JNL/PPM America Low Duration Bond Fund and JNL/PPM America Total Return Fund invested in a money market fund which is managed by the Adviser. The JNL Money Market Fund is offered as a cash management tool to the Funds and their affiliates and is not available for direct purchase by members of the public. The total value and cost of such affiliated investments is disclosed separately in the Statements of Assets and Liabilities, and the associated income and realized gain (loss) are disclosed separately in the Statements of Operations.
JNL Investors Series Trust
Notes to Financial Statements
December 31, 2015
The following table details cash management investments in affiliates held at December 31, 2015. There was no realized gain or loss relating to transactions in these investments during the year ended December 31, 2015.
| | JNL Money Market Fund | |
Fund | | Beginning
Amortized Cost | | Ending
Amortized Cost | | Dividend
Income | |
JNL/PPM America Low Duration Bond Fund | | $ | 23,606,728 | | $ | 19,694,333 | | $ | 5,997 | |
JNL/PPM America Total Return Fund | | 27,883,831 | | 34,606,249 | | 20,625 | |
| | | | | | | | | | |
NOTE 8. BORROWING ARRANGEMENTS
The Trust is a party to a Syndicated Credit Agreement (“SCA”) with a group of lenders. The Funds participate in the SCA with other funds managed by JNAM in a credit facility which is available solely to finance shareholder redemptions or for other temporary or emergency purposes. The Funds may borrow up to the lesser of $450,000,000, the amount available under the facility; the limits set for borrowing by the Funds’ prospectuses and the 1940 Act; or an amount prescribed within the SCA. The Funds pay an annual fee of 0.10% of the available commitments and an annual administration fee to JPM Chase. Prior to June 5, 2015, the Funds paid an annual fee of 0.075% of the available commitments and an annual administrative fee to JPM Chase. These expenses are allocated to the participating Funds based on each Fund’s net assets as a percentage of the participating Funds’ total net assets and are included in other expenses in each Fund’s Statement of Operations. No amounts were borrowed under the facility during the year.
Effective October 1, 2015 and pursuant to an Exemptive Order issued by the SEC, the Funds, along with certain other funds advised by JNAM, may participate in an InterFund Lending Program (“Program”). The Program provides an alternative credit facility allowing a Fund to borrow from, or lend money to, other participating affiliated funds. Any open loans at period end are included in Receivable for interfund lending or Payable for interfund lending, as appropriate, in the respective Fund’s Statement of Assets and Liabilities. No amounts were borrowed through the Program during the period.
NOTE 9. INCOME TAX MATTERS
Each Fund is a separate taxpayer for federal income tax purposes. Each Fund intends to qualify as a regulated investment company (“RIC”) and to distribute substantially all net investment income and net capital gains, if any, to its shareholders and otherwise comply with Subchapter M of the Internal Revenue Code of 1986, as amended, applicable to regulated investment companies. Therefore, no federal income tax provision is required. Under current tax law, interest, dividends and capital gains paid by the Funds are not currently taxable to shareholders when left to accumulate within a variable annuity contract or variable life insurance policies.
The following information is presented on an income tax basis. Differences between amounts for financial statements and federal income tax purposes are primarily due to timing and character differences in recognizing certain gains and losses on investment transactions. Permanent differences between financial statement and federal income tax reporting are reclassified within the capital accounts based on their federal income tax treatment. Temporary differences do not require reclassification. Permanent differences may include but are not limited to the following: expired capital loss carryforwards, paydown reclassifications, non-deductible offering costs and distribution adjustments. These reclassifications have no impact on net assets.
| | Net Increase (Decrease) | |
| | Undistributed Net
Investment
Income | | Accumulated Net
Realized Loss | | Paid-in Capital | |
JNL/PPM America Low Duration Bond Fund | | $ | 459,591 | | $ | (367,649 | ) | $ | (91,942 | ) |
JNL/PPM America Total Return Fund | | 1,642,747 | | (1,642,747 | ) | — | |
JNL Money Market Fund | | 36,098 | | (36,098 | ) | — | |
| | | | | | | | | | |
At December 31, 2015, the following Fund had net capital loss carryforwards (in thousands) available for U.S. federal income tax purposes to offset future net realized capital gains. Details of the capital loss carryforwards are listed in the table below.
| | No Expirations | | | |
| | Short Term | | Long Term | | Total | |
JNL/PPM America Low Duration Bond Fund | | $ | 41,198 | | $ | 675,636 | | $ | 716,834 | |
JNL/PPM America Total Return Fund | | — | | 5,645,948 | | 5,645,948 | |
| | | | | | | | | | |
At December 31, 2015, the Funds did not elect to defer capital, currency and/or passive foreign investment company mark-to-market losses realized after October 31, 2015 (“Post-October losses”).
JNL Investors Series Trust
Notes to Financial Statements
December 31, 2015
As of December 31, 2015, the cost of investments and the components of net unrealized appreciation/(depreciation) were as follows:
| | Tax Cost of
Investments | | Gross Unrealized
Appreciation | | Gross Unrealized
Depreciation | | Net Unrealized
Depreciation | |
JNL/PPM America Low Duration Bond Fund | | $ | 750,738,094 | | $ | 304,759 | | $ | (5,247,768 | ) | $ | (4,943,009 | ) |
JNL/PPM America Total Return Fund | | 1,109,795,331 | | 12,477,504 | | (45,476,863 | ) | (32,999,359 | ) |
JNL Money Market Fund | | 2,439,208,803 | | 7,982 | | (7,982 | ) | — | |
| | | | | | | | | | | | | |
As of December 31, 2015, the components of distributable taxable earnings for U.S. federal income tax purposes were as follows:
| | Undistributed Net
Ordinary Income* | | Undistributed
Net Long-Term
Capital Gain | | Unrealized
Losses** | | Capital Loss
Carryforward | |
JNL/PPM America Low Duration Bond Fund | | $ | — | | $ | — | | $ | (4,947,334 | ) | $ | (716,834 | ) |
JNL/PPM America Total Return Fund | | 33,781,799 | | — | | (33,112,995 | ) | (5,645,948 | ) |
JNL Money Market Fund | | 46,590 | | — | | (75,785 | ) | — | |
| | | | | | | | | | | | | |
* | Undistributed net ordinary income consists of net taxable income derived from dividends, interest and net short-term capital gains, if any. |
** | Unrealized gains (losses) are adjusted for open wash sale loss deferrals and accelerated recognition of unrealized gain on certain futures contracts for federal income tax purposes. |
The tax character of distributions paid during the Funds’ fiscal year ended December 31, 2015 was as follows:
| | Net Ordinary
Income* | | Long-term
Capital Gain | | Return
of Capital | |
JNL/PPM America Low Duration Bond Fund | | $ | 7,075,746 | | $ | — | | $ | 91,942 | |
JNL/PPM America Total Return Fund | | 25,928,229 | | — | | — | |
JNL Money Market Fund | | 1,431,376 | | 152 | | — | |
| | | | | | | | | | |
* | Net ordinary income consists of net taxable income derived from dividends, interest and net short-term capital gains, if any. |
The tax character of distributions paid during the Funds’ fiscal year ended December 31, 2014 was as follows:
| | Net Ordinary
Income* | | Long-term
Capital Gain | |
JNL/PPM America Low Duration Bond Fund | | $ | 5,837,058 | | $ | 124,386 | |
JNL/PPM America Total Return Fund | | 17,982,560 | | 26,643 | |
JNL Money Market Fund | | 277,579 | | — | |
| | | | | | | |
* Net ordinary income consists of net taxable income derived from dividends, interest and net short-term capital gains, if any.
FASB ASC Topic 740 “Income Taxes” provides guidance for how uncertain tax positions should be recognized, measured, presented and disclosed in the financial statements. FASB ASC Topic 740 requires the evaluation of tax positions taken or expected to be taken in the course of preparing each Fund’s tax return to determine whether the tax positions are “more-likely-than-not” of being sustained by the applicable tax authority. Tax positions not deemed to meet the “more-likely-than-not” threshold would result in the Funds recording a tax expense in the current year. FASB ASC Topic 740 requires that management evaluate the tax positions taken in returns for 2012, 2013, 2014 and 2015, which remain subject to examination by the Internal Revenue Service and certain other jurisdictions. Management completed an evaluation of the Funds’ tax positions and based on that evaluation, determined that no provision for federal income tax was required in the Funds’ financial statements during the year ended December 31, 2015.
NOTE 10. SUBSEQUENT EVENTS
Management has evaluated subsequent events for the Funds through the date the financial statements are issued and the following event occurred:
At a meeting held December 9, 2015, the Board voted to approve the merger of JNL/PPM America Total Return Fund into JNL/PPM America Total Return Fund, a separate series of JNL Series Trust which is also advised by JNAM, effective after close of business on April 22, 2016.
No other events were noted that required adjustments to the financial statements or disclosures in the notes.
Report of Independent Registered Public Accounting Firm
To the Shareholders and Board of Trustees
JNL Investors Series Trust:
We have audited the accompanying statements of assets and liabilities of JNL/PPM America Low Duration Bond Fund, JNL/PPM America Total Return Fund and JNL Money Market Fund (the “Funds”) (series of JNL Investors Series Trust), including the schedules of investments, as of December 31, 2015, and the related statements of operations for the year then ended, the statements of changes in net assets for the each of the years in the two-year period then ended, and the financial highlights for each of the years or periods in the five-year period then ended. These financial statements and financial highlights are the responsibility of the Funds’ management. Our responsibility is to express an opinion on these financial statements and financial highlights based on our audits.
We conducted our audits in accordance with the standards of the Public Company Accounting Oversight Board (United States). Those standards require that we plan and perform the audit to obtain reasonable assurance about whether the financial statements and financial highlights are free of material misstatement. An audit includes examining, on a test basis, evidence supporting the amounts and disclosures in the financial statements. Our procedures included confirmation of securities owned as of December 31, 2015, by correspondence with the custodian, transfer agents and brokers or other appropriate auditing procedures. An audit also includes assessing the accounting principles used and significant estimates made by management, as well as evaluating the overall financial statement presentation. We believe that our audits provide a reasonable basis for our opinion.
In our opinion, the financial statements and financial highlights referred to above present fairly, in all material respects, the financial position of the Funds as of December 31, 2015, the results of their operations, changes in their net assets and the financial highlights for each of the years or periods indicated above, in conformity with U.S. generally accepted accounting principles.
/s/ KPMG LLP
Chicago, Illinois
February 26, 2016
JNL Investors Series Trust
Additional Disclosures (Unaudited)
December 31, 2015
Disclosure of Fund Expenses. Shareholders incur ongoing costs, which include costs for portfolio management, administrative services, Rule 12b-1 fees and other operating expenses. Operating expenses such as these are deducted from each Fund’s gross income and directly reduce the final investment return. These expenses are expressed as a percentage of the Fund’s average net assets; this percentage is known as the Fund’s expense ratio. The examples below use the expense ratio and are intended to help the investor understand the ongoing costs (in dollars) of investing in a Fund and to compare these costs with the ongoing costs of investing in other mutual funds. The examples are based on an investment of $1,000 made at the beginning of the period shown and held for the entire period.
Expenses Using Actual Fund Return. This section provides information about the actual account values and actual expenses incurred by each Fund. Use the information in this section, together with the amount invested, to estimate the expenses paid over the period. Simply divide the account value by $1,000 (for example, an $8,600 account value divided by $1,000 = 8.6), then multiply the result by the number in the first section under the heading entitled “Expenses Paid During Period” to estimate the expenses paid during this period.
Expenses Using Hypothetical 5% Return. This section provides information that can be used to compare each Fund’s costs with those of other mutual funds. It assumes that the Fund’s expense ratio for the period is unchanged and assumes an annual 5% return before expenses, which is not the Fund’s actual return. This example is useful in making comparisons because the SEC requires all mutual funds to make the 5% calculation.
| | Expenses Using Actual Fund Return | | Expenses Using Hypothetical 5% Return | |
| | Beginning | | Ending | | | | Expenses | | Beginning | | Ending | | | | Expenses | |
| | Account | | Account | | Annualized | | Paid | | Account | | Account | | Annualized | | Paid | |
| | Value | | Value | | Expense | | During | | Value | | Value | | Expense | | During | |
| | 7/01/2015 | | 12/31/2015 | | Ratios | | Period† | | 7/01/2015 | | 12/31/2015 | | Ratios | | Period† | |
JNL/PPM America Low Duration Bond Fund | | | | | | | | | | | | | | | | | |
Class A | | $ | 1,000.00 | | $ | 1,000.10 | | 0.74 | % | $ | 3.73 | | $ | 1,000.00 | | $ | 1,021.47 | | 0.74 | % | $ | 3.77 | |
JNL/PPM America Total Return Fund | | | | | | | | | | | | | | | | | |
Class A | | 1,000.00 | | 987.20 | | 0.80 | | 4.01 | | 1,000.00 | | 1,021.17 | | 0.80 | | 4.08 | |
JNL Money Market Fund | | | | | | | | | | | | | | | | | |
Institutional Class | | 1,000.00 | | 1,000.40 | | 0.20 | | 1.01 | | 1,000.00 | | 1,024.20 | | 0.20 | | 1.02 | |
| | | | | | | | | | | | | | | | | | | | | | | |
† Expenses paid by each Fund during the period are equal to the Fund’s annualized net expense ratio, multiplied by the average account value over the period, then multiplied by 184/365 (to reflect the most recent 6-month period).
Quarterly Portfolio Holdings. The Funds file a complete schedule of portfolio holdings with the SEC for the first and third quarters of each fiscal year on Form N-Q. The Funds’ Forms N-Q are available on the SEC’s website at www.sec.gov. The Forms N-Q may be reviewed and copied at the SEC’s Public Reference Room in Washington, DC, and information on the operation of the Public Reference Room may be obtained by calling 800-SEC-0330. It is also available upon request from the registrant by calling the Funds toll-free at 1-866-255-1935.
Proxy Voting Policies and Procedures and Proxy Voting Record. A description of the Policy of the Funds’ Adviser (and sub-advisers) used to vote proxies relating to the portfolio securities and information on how the Funds voted proxies relating to portfolio securities during the 12-month period ended June 30, 2015, are available (1) without charge, upon request by calling 1-800-392-2909; (2) on Jackson National Life Insurance Company’s or Jackson National Life Insurance Company of New York’s website at www.jackson.com; and (3) on the SEC’s website at www.sec.gov.
TRUSTEES AND OFFICERS OF JNL INVESTORS SERIES TRUST (“TRUST”)
NAME, ADDRESS AND (AGE) | | POSITION(S) HELD WITH TRUST
(LENGTH OF TIME SERVED) | | NUMBER OF PORTFOLIOS IN FUND COMPLEX TO BE
OVERSEEN BY TRUSTEE |
Interested Trustee | | | | |
Mark D. Nerud (49) (1)
1 Corporate Way
Lansing, MI 48951 | | Trustee (2)
(01/2007 to present) President and Chief Executive Officer
(12/2006 to present) | | 115 |
PRINCIPAL OCCUPATION(S) DURING PAST 5 YEARS:
Chief Executive Officer of the Adviser (01/2010 to present); President of the Adviser (01/2007 to present); Managing Board Member of Curian Capital, LLC (01/2011 to 04/2015) and Curian Clearing LLC (01/2011 to 04/2015); Managing Board Member of the Adviser (05/2015 to present); President and CEO of other Investment Companies advised by the Adviser (12/2006 to present); President and Chief Executive Officer of other Investment Companies advised by Curian Capital, LLC (08/2014 to present)
OTHER DIRECTORSHIPS HELD BY TRUSTEE DURING PAST 5 YEARS: None
Independent Trustees | | | | |
Michael Bouchard (59) 1 Corporate Way Lansing, MI 48951 | | Trustee (2) (12/2003 to present) | | 115 |
PRINCIPAL OCCUPATION(S) DURING PAST 5 YEARS:
Sheriff, Oakland County, Michigan (01/1999 to present)
OTHER DIRECTORSHIPS HELD BY TRUSTEE DURING PAST 5 YEARS: None
Ellen Carnahan (60) 1 Corporate Way Lansing, MI 48951 | | Trustee (2) (12/2013 to present) | | 115 |
PRINCIPAL OCCUPATION(S) DURING PAST 5 YEARS:
Principal, Machrie Enterprises LLC (07/07 to present)
OTHER DIRECTORSHIPS HELD BY TRUSTEE DURING PAST 5 YEARS:
Director, ENOVA International Inc. (05/2015 to present); Audit Committee Member, ENOVA International Inc. (05/2015 to present); Governance Committee Member, ENOVA International Inc. (05/2015 to present); Director, Integrys Energy Group (05/2003 to 06/2015); Governance Committee Member, Integrys Energy Group (05/2003 to 05/2013); Governance Committee Chair, Integrys Energy Group (05/2010 to 05/2013); Finance Committee Member, Integrys Energy Group (05/2003 to 2012); Audit Committee Member, Integrys Energy Group (12/2003 to 06/2015); Environmental Committee Member, Integrys Energy Group (05/2013 to 06/2015)
William J. Crowley, Jr. (70) 1 Corporate Way Lansing, MI 48951 | | Chair of the Board (3) (01/2014 to present) Trustee (2) (01/2007 to present) | | 115 |
PRINCIPAL OCCUPATION(S) DURING PAST 5 YEARS:
Board Member of various corporate boards (see below) (2002 to present)
OTHER DIRECTORSHIPS HELD BY TRUSTEE DURING PAST 5 YEARS:
Director of Alpha Natural Resources (07/2009 to present)
Michelle Engler (57) 1 Corporate Way Lansing, MI 48951 | | Chair of the Board (3) (01/2011 to 12/2013) Trustee (2) (12/2003 to present) | | 115 |
PRINCIPAL OCCUPATION(S) DURING PAST 5 YEARS:
Attorney (1983 to present)
OTHER DIRECTORSHIPS HELD BY TRUSTEE DURING PAST 5 YEARS: NONE
TRUSTEES AND OFFICERS OF JNL INVESTORS SERIES TRUST (“TRUST”)
NAME, ADDRESS AND (AGE) | | POSITION(S) HELD WITH TRUST
(LENGTH OF TIME SERVED) | | NUMBER OF PORTFOLIOS IN FUND COMPLEX TO BE
OVERSEEN BY TRUSTEE |
John Gillespie (62) 1 Corporate Way Lansing, MI 48951 | | Trustee (2) (12/2013 to present) | | 115 |
PRINCIPAL OCCUPATION(S) DURING PAST 5 YEARS:
Investor, Business Writer and Advisor (2006 to present); Entrepreneur-in-Residence, UCLA Office of Intellectual Property (2013 to present)
OTHER DIRECTORSHIPS HELD BY TRUSTEE DURING PAST 5 YEARS: None
Richard McLellan (73) 1 Corporate Way Lansing, MI 48951 | | Trustee (2) (12/1994 to present) | | 115 |
PRINCIPAL OCCUPATION(S) DURING PAST 5 YEARS:
Attorney (1968 to present)
OTHER DIRECTORSHIPS HELD BY TRUSTEE DURING PAST 5 YEARS:
Member of the Board of Directors of ITC Holdings Corp. (11/2007 to 08/2012)
William R. Rybak (64) 1 Corporate Way Lansing, MI 48951 | | Trustee (2) (01/2007 to present) | | 115 |
PRINCIPAL OCCUPATION(S) DURING PAST 5 YEARS:
Board Member of various corporate boards (see below) (2002 to present)
OTHER DIRECTORSHIPS HELD BY TRUSTEE DURING PAST 5 YEARS:
Member of the Board of Directors of Christian Brothers Investment Services, Inc. (2010 to present); Chair of Audit Committee of Christian Brothers Investment Services, Inc. (2012 to present); Member of the Board of Trustees of Lewis University (1983 to 2009 and 2012 to present), Chair (2000 to 2009) and Chair Emeritus (2009 to present); Member of the Board of Directors of Howe Barnes Hoefer Arnett (2001 to 03/2011); Member of the Boards of each of the Calamos Mutual Funds (2002 to present); Chair of Governance Committee, each of the Calamos Mutual Funds (2004 to present); Member of the Board of Directors of The PrivateBancorp (2003 to present); Chair of Audit Committee of The PrivateBancorp (05/2013 to present); Chair of Business Risk Committee of The PrivateBancorp (2009 to 05/2013)
Edward Wood (59) 1 Corporate Way Lansing, MI 48951 | | Trustee (2) (12/2013 to present) | | 115 |
PRINCIPAL OCCUPATION(S) DURING PAST 5 YEARS:
Chief Operating Officer, McDonnell Investment Management, LLC (08/2010 to 04/2015); Managing Director, Morgan Stanley Investment Management (12/2003 to 01/2011)
OTHER DIRECTORSHIPS HELD BY TRUSTEE DURING PAST 5 YEARS: None
Patricia A. Woodworth (60) 1 Corporate Way Lansing, MI 48951 | | Trustee (2) (01/2007 to present) | | 115 |
PRINCIPAL OCCUPATION(S) DURING PAST 5 YEARS:
Vice President, Chief Financial Officer and Chief Operating Officer, The J. Paul Getty Trust (12/2007 to present)
OTHER DIRECTORSHIPS HELD BY TRUSTEE DURING PAST 5 YEARS: None
(1) | Mr. Nerud is an “interested person” of the Trust due to his position with Jackson National Asset Management, LLC, the Adviser. |
(2) | The interested and Independent Trustees are elected to serve for an indefinite term. |
(3) | Beginning January 1, 2011, the Chairperson shall serve as Chairperson for no more than three consecutive years and may not be re-elected as Chairperson until at least one year has elapsed since the end of the Chairperson’s term. Chairperson Crowley’s term will lapse at the end of 2016. |
TRUSTEES AND OFFICERS OF JNL INVESTORS SERIES TRUST (“TRUST”)
NAME, ADDRESS AND (AGE) | | POSITION(S) HELD WITH TRUST
(LENGTH OF TIME SERVED) |
Officers | | |
Karen J. Buiter (50) 1 Corporate Way Lansing, MI 48951 | | Assistant Treasurer (12/2008 to present) |
PRINCIPAL OCCUPATION(S) DURING PAST 5 YEARS:
Vice President — Financial Reporting of the Adviser (07/2011 to present); Assistant Vice President — Financial Reporting of the Adviser (04/2008 to 06/2011); Assistant Treasurer of other Investment Companies advised by the Adviser (12/2008 to present); Assistant Treasurer of other Investment Companies advised by Curian Capital, LLC (11/2010 to present)
Kelly L. Crosser (43) 1 Corporate Way Lansing, MI 48951 | | Assistant Secretary (09/2007 to present) |
PRINCIPAL OCCUPATION(S) DURING PAST 5 YEARS:
Assistant Secretary of other Investment Companies advised by the Adviser (09/2007 to present); Assistant Secretary of other Investment Companies advised by Curian Capital, LLC (11/2010 to present); Senior Compliance Analyst of Jackson National Life Insurance Company (04/2007 to 12/2013); Manager, Jackson National Life Insurance Company (12/2013 to present)
Steven J. Fredricks (45) 1 Corporate Way Lansing, MI 48951 | | Chief Compliance Officer (01/2005 to present) Anti-Money Laundering Officer (12/2015 to present) |
PRINCIPAL OCCUPATION(S) DURING PAST 5 YEARS:
Chief Compliance Officer of the Adviser and other Investment Companies advised by the Adviser (01/2005 to present); Senior Vice President of the Adviser (02/2013 to present); Anti-Money Laundering Officer of other Investment Companies advised by the Adviser (12/2015 to present); Chief Compliance Officer of other Investment Companies advised by Curian Capital, LLC (10/2011 to 05/2012)
William Harding (41) 1 Corporate Way Lansing, MI 48951 | | Vice President (11/2012 to present) |
PRINCIPAL OCCUPATION(S) DURING PAST 5 YEARS:
Senior Vice President and Chief Investment Officer of the Adviser (07/2014 to present); Vice President of the Adviser (10/2012 to 06/2014); Vice President of Curian Capital, LLC (02/2013 to present);Vice President of other Investment Companies advised by the Adviser (11/2012 to present); Vice President of other Investment Companies advised by Curian Capital, LLC (05/2014 to present); Head of Manager Research, Morningstar Associates (08/2011 to 10/2012); Director of Research, Morningstar Investment Services (01/2007 to 08/2011)
Daniel W. Koors (45) 1 Corporate Way Lansing, MI 48951 | | Vice President (12/2006 to present) |
PRINCIPAL OCCUPATION(S) DURING PAST 5 YEARS:
Senior Vice President of the Adviser (01/2009 to present) and Chief Operating Officer of the Adviser (04/2011 to present); Chief Financial Officer of the Adviser (01/2007 to 04/2011); Treasurer and Chief Financial Officer of the Trust (12/2006 to 11/2011); Treasurer and Chief Financial Officer (Principal Financial Officer) of other Investment Companies advised by Curian Capital, LLC (11/2010 to present); Vice President of the Adviser (01/2007 to 12/2008); Vice President of other Investment Companies advised by the Adviser (12/2006 to present); Treasurer and Chief Financial Officer of other Investment Companies advised by the Adviser (12/2006 to 11/2011)
Kristen K. Leeman (40) 1 Corporate Way Lansing, MI 48951 | | Assistant Secretary (08/2012 to present) |
PRINCIPAL OCCUPATION(S) DURING PAST 5 YEARS:
Assistant Secretary of other Investment Companies advised by the Adviser (06/2012 to present); Regulatory Analyst of Jackson National Life Insurance Company (2/2014 to present); Senior Paralegal of Jackson National Life Insurance Company (03/2006 to 01/2014)
TRUSTEES AND OFFICERS OF JNL INVESTORS SERIES TRUST (“TRUST”)
NAME, ADDRESS AND (AGE) | | POSITION(S) HELD WITH TRUST
(LENGTH OF TIME SERVED) |
Officers | | |
Gerard A. M. Oprins (56) 1 Corporate Way Lansing, MI 48951 | | Vice President (06/2012 to present) Treasurer and Chief Financial Officer (11/2011 to present) |
PRINCIPAL OCCUPATION(S) DURING PAST 5 YEARS:
Senior Vice President and Chief Financial Officer of the Adviser (04/2011 to present); Vice President of other funds sponsored by Curian Capital, LLC that are in the same group of other investment companies advised by JNAM (03/2012 to present); Business Consultant (2009 to 03/2011)
Michael Piszczek (58) 1 Corporate Way Lansing, MI 48951 | | Vice President (11/2007 to present) |
PRINCIPAL OCCUPATION(S) DURING PAST 5 YEARS:
Vice President — Tax of the Adviser (07/2011 to present); Assistant Vice President — Tax of the Adviser (11/2007 to 06/2011); Vice President of other Investment Companies advised by the Adviser (11/2007 to present); Vice President of other Investment Companies advised by Curian Capital, LLC (11/2010 to present)
Susan S. Rhee (44) 1 Corporate Way Lansing, MI 48951 | | Vice President, Counsel and Secretary (02/2004 to present) |
PRINCIPAL OCCUPATION(S) DURING PAST 5 YEARS:
Senior Vice President and General Counsel of the Adviser (01/2010 to present); Chief Legal Officer (07/2004 to 12/2009) and Secretary (11/2000 to present) of the Adviser; Vice President, Counsel (Chief Legal Officer) and Secretary of other Investment Companies advised by Curian Capital, LLC (11/2010 to present); Vice President, Counsel, and Secretary of other Investment Companies advised by the Adviser (02/2004 to present)
The Statement of Additional Information includes additional information about Fund Trustees and may be obtained at no charge by calling 1-800-873-5654 (Annuity and Life Service Center), 1-800-599-5651 (NY Annuity and Life Service Center), 1-800-777-7779 (for contracts purchased through a bank or financial institution) or 1-888-464-7779 (for NY contracts purchased through a bank or financial institution), by writing JNL Investors Series Trust, P.O. Box 30314, Lansing, Michigan 48951 or by visiting www.jackson.com.
TRUSTEES AND OFFICERS OF JNL INVESTORS SERIES TRUST (“TRUST”)
The interested Trustee and the Officers of the Trust or the Adviser do not receive any compensation from the Trust for their services as Trustees or Officers. The following persons, who are independent Trustees of the Trust, received from the Trust the compensation amounts indicated for the services as such for the 12-month period ended December 31, 2015:
TRUSTEE | | AGGREGATE COMPENSATION
FROM THE TRUST(1) | | PENSION OR
RETIREMENT BENEFITS
ACCRUED AS PART OF
TRUST EXPENSES | | ESTIMATED
ANNUAL BENEFITS
UPON RETIREMENT | | TOTAL COMPENSATION
FROM THE TRUST AND
FUND COMPLEX (1) | |
Michael Bouchard | | $ | 5,570 | | $ | 0 | | $ | 0 | | $ | 260,500 | (3) |
Ellen Carnahan | | $ | 5,560 | | $ | 0 | | $ | 0 | | $ | 260,000 | (4) |
William J. Crowley, Jr. (2) | | $ | 6,522 | | $ | 0 | | $ | 0 | | $ | 305,000 | (5) |
Michelle Engler | | $ | 5,346 | | $ | 0 | | $ | 0 | | $ | 250,000 | |
John Gillespie | | $ | 5,186 | | $ | 0 | | $ | 0 | | $ | 242,500 | (6) |
Richard McLellan | | $ | 5,399 | | $ | 0 | | $ | 0 | | $ | 252,500 | |
William R. Rybak | | $ | 5,731 | | $ | 0 | | $ | 0 | | $ | 268,000 | |
Edward Wood | | $ | 5,560 | | $ | 0 | | $ | 0 | | $ | 260,000 | (7) |
Patricia Woodworth | | $ | 5,186 | | $ | 0 | | $ | 0 | | $ | 242,500 | (8) |
(1) The fees paid to the independent Trustees are paid for combined service on the Boards of the Trust, JNL Series Trust, JNL Variable Fund LLC, and JNL Strategic Income Fund LLC (the “Fund Complex”). The fees are allocated to the Fund Complex and affiliated investment companies on a pro-rata basis based on net assets. The total fees to all the independent Trustees are $2,341,000.
(2) Mr. Crowley an ex-officio member of the Governance Committee and the Audit Committee. Therefore, he does not receive any compensation as a member of the Governance Committee or Audit Committee.
(3) Amount includes $19,350 deferred by Mr. Bouchard.
(4) Amount includes $130,000 deferred by Ms. Carnahan.
(5) Amount includes $274,000 deferred by Mr. Crowley.
(6) Amount includes $121,250 deferred by Mr. Gillespie.
(7) Amount includes $260,000 deferred by Mr. Wood.
(8) Amount includes $51,000 deferred by Ms. Woodworth.
JNL INVESTORS SERIES TRUST (“TRUST”)
APPROVAL OF THE TRUST’S
INVESTMENT ADVISORY AND SUB-ADVISORY AGREEMENTS
The Board of Trustees of the Trust (“Board”) oversees the management of the Trust and its separate Funds (each a “Fund” and collectively the “Funds”) and, as required by law, determines annually whether to approve the Trust’s advisory agreement (“Advisory Agreement”) with Jackson National Asset Management, LLC (“JNAM”) and each Fund’s Sub-Adviser(s) (“Sub-Advisory Agreements” and, collectively with the Advisory Agreement, the “Agreements”).
At meetings on June 1-3, 2015 and August 17-19, 2015, the Board, including all of the independent trustees, who are not interested persons of the Funds (as defined in the Investment Company Act of 1940, as amended) (“Independent Trustees”) considered information relating to the continuation of these Agreements. In advance of the meetings, independent legal counsel for the Independent Trustees requested that certain information be provided to the Board relating to the Agreements. The Board received, and had the opportunity to review, this and other materials, ask questions and request further information in connection with its consideration. At the conclusion of the Board’s discussion, the Board approved the Agreements through September 30, 2016.
In reviewing the Agreements and considering the information, the Board was advised by outside independent legal counsel. The Board considered the factors it deemed relevant, including: (1) the nature, quality and extent of the services to be provided, (2) the investment performance of each Fund, (3) cost of services of each Fund, (4) profitability data, (5) whether economies of scale may be realized and shared, in some measure, with investors as each Fund grows, and (6) other benefits that may accrue to JNAM or each Sub-Adviser through its relationship with the Trust. In its deliberations, the Board, in exercising its business judgment did not identify any single factor that alone was responsible for the Board’s decision to approve the Agreements.
Before approving the Agreements, the Independent Trustees met in executive session with their independent legal counsel to consider the materials provided by JNAM and the terms of the Agreements. Based on its evaluation of those materials, the Board, including the interested and Independent Trustees, concluded that the Agreements are in the best interests of the shareholders of the applicable Fund. In reaching its conclusions, the Board considered numerous factors, including the following:
Nature, Quality and Extent of Services
The Board examined the nature, quality and extent of the services to be provided by JNAM and the Sub-Advisers.
For each Fund, the Board considered the services to be provided by JNAM, including but not limited to the oversight of the Sub-Advisers pursuant to the “Manager of Managers” exemption, as well as the provision of recordkeeping and compliance services to the Funds. The Board also took into account that JNAM would monitor the performance of the various organizations that would provide services to the Funds, including the Funds’ distributor, transfer agent, and custodian. With respect to JNAM’s oversight of the Sub-Advisers, the Board noted that JNAM would be responsible for screening and recommending new sub-advisers when appropriate, as well as monitoring and reporting to the Board on the performance and operations of the existing Sub-Advisers. The Board also considered the investment sub-advisory services to be provided by each Sub-Adviser. The Board noted JNAM’s evaluation of the Sub-Advisers, as well as JNAM’s recommendations, based on its review of the Sub-Advisers, to approve the Sub-Advisory Agreements.
The Board reviewed the qualifications, backgrounds and responsibilities of JNAM’s senior management that would be responsible for oversight of the Funds and each Sub-Adviser, and also reviewed the qualifications, backgrounds and responsibilities of the Sub-Advisers’ portfolio managers who would be responsible for the day-to-day management of each Fund. The Board reviewed information pertaining to JNAM’s and each Sub-Adviser’s organizational structure, senior management, financial stability, investment operations, and other relevant information pertaining to both JNAM and each Sub-Adviser. The Board considered compliance reports about JNAM and the Sub-Advisers from the Funds’ Chief Compliance Officer.
Based on the foregoing, the Board concluded that (i) each Fund is likely to continue to benefit from the nature, extent and quality of the services to be provided by JNAM under the Advisory Agreement and (ii) each Fund is likely to benefit from the nature, extent and quality of the services to be provided by each Sub-Adviser under the applicable Sub-Advisory Agreement.
Investment Performance of the Funds
The Board considered the performance of each Fund as described in quarterly reports prepared by JNAM. The Board noted that JNAM reviews with the Board on a quarterly basis detailed information about each Fund’s performance results and investment strategies. The Board also considered the performance of each Fund, including how the Fund performed versus the average performance of a group of comparable funds (“peer group”) selected by an independent data service and how the Fund performed versus its primary benchmark index (“benchmark”). The performance reviewed by the Board was for periods ended on December 31, 2014 (unless otherwise noted). When available, the Board considered one-, three-, five-, and ten-year performance.
JNL Money Market Fund. The Board considered that, while the Fund underperformed its benchmark for all periods, this is due mostly to low Treasury yields. The Board further considered that the Adviser is waiving a portion of its advisory fee to attain a positive total return for the Fund. The Board concluded that it would be in the best interests of the Fund and its shareholders to renew the Agreements.
JNL/PPM America Low Duration Bond Fund. The Board considered that the Fund outperformed its benchmark for the one-year period, though it underperformed its peer group. The Board concluded that it would be in the best interest of the Fund and its shareholders to approve the Agreements.
JNL/PPM America Total Return Fund. The Board considered that the Fund outperformed its benchmark and the peer group for the one-, three- and five-year periods. The Board concluded that it would be in the best interests of the Fund and its shareholders to renew the Agreements.
Costs of Services
The Board reviewed the fees to be paid to JNAM and each Fund’s Sub-Adviser. For each Fund, the Board reviewed fee and expense information as compared to that of comparable funds managed by other advisers, as well as fees charged by each Sub-Adviser to similar clients, if any. The Board also noted that JNAM does not manage any institutional accounts with which the Funds’ fees could be compared. Using information provided by an independent data service, the Board evaluated each Fund’s advisory fees compared to the average advisory fees for other funds similar in size, character and investment strategy (the “peer group”). While the Board also considered each Fund’s sub-advisory fee and compared that to the average sub-advisory fee of the peer group, the Board noted that each Fund’s sub-advisory fee would be paid by JNAM (not the Fund) and, therefore, would be neither a direct shareholder expense nor a direct influence on a Fund’s total expense ratio.
Further detail considered by the Board regarding the advisory and sub-advisory fees of each Fund is set forth below:
JNL Money Market Fund. The Board considered that the Fund’s sub-advisory fee is lower than the peer group average (though its advisory fee is higher). The Board also noted that the Fund’s total expense ratio is only one basis point higher than the peer group average. The Board further considered that JNAM is waiving a portion of its advisory fee to attain a positive total return for the Fund. The Board concluded that the fees are in the best interests of the Fund and its shareholders in light of the services provided.
JNL/PPM America Low Duration Bond Fund. The Board considered that the Fund’s advisory and sub-advisory fees are lower than the respective peer group averages. The Board also noted that the Fund’s total expense ratio is lower than the peer group average. The Board concluded that the fees are in the best interests of the Fund and its potential shareholders in light of the services to be provided.
JNL/PPM America Total Return Fund. The Board considered that the Fund’s advisory fee is higher than the peer group average and the sub-advisory fee is equal to the peer group average. The Board noted that the Fund’s total expense ratio is lower than the peer group average. The Board concluded that the fees are in the best interests of the Fund and its shareholders in light of the services provided.
Economies of Scale
The Board considered whether each Fund’s proposed advisory fee reflects the potential for economies of scale for the benefit of Fund shareholders. Based on information provided by JNAM, the Board noted that the fee arrangement for each Fund contains breakpoints that decrease the fee rate as assets increase. The Board concluded that the advisory fees in some measure share economies of scale with shareholders. The Board also considered that economies of scale can be shared with the Funds in other ways, including low management fees from inception, additional technological and personnel investments to enhance shareholder services, and maintaining existing expense structures in the face of a rising cost environment.
Other Benefits to JNAM and the Sub-Advisers
In evaluating the benefits that may accrue to JNAM through its relationship with the Funds, the Board noted that JNAM and certain of its affiliates would serve the Funds in various capacities, including as adviser, administrator, transfer agent and distributor, and receive compensation from the Funds in connection with providing services to the Funds. The Board noted that each service to be provided to the Funds by JNAM or one of its affiliates would be pursuant to a written agreement, which the Board would evaluate periodically as required by law. The Board also noted that certain Sub-Advisers may from time to time pay for portions of meetings organized by the Funds’ distributor to educate wholesalers about the Fund(s) that each of those Sub-Advisers manage. The Board considered JNAM’s assertion that those meetings would not yield a profit to the Funds’ distributor, Sub-Advisers would not be required to participate in the meetings and recommendations to hire or fire Sub-Advisers would not be influenced by a Sub-Adviser’s willingness to participate in the meetings. In addition, certain affiliates of the Sub-Advisers participate in the sale of funds or insurance contracts and are compensated by the Funds’ distributor for its activities, in addition to payments for marketing and conferences. The Board reviewed the monetary values of these transactions. Lastly, certain affiliates of JNAM may receive benefits under the federal income tax laws with respect to tax deductions and credits.
In evaluating the benefits that may accrue to the Sub-Advisers through their relationship with the Fund(s), the Board noted that each Sub-Adviser may receive indirect benefits in the form of soft dollar arrangements for portfolio securities trades placed with the Funds’ assets and may also develop additional investment advisory business with JNAM, the Funds or other clients of the sub-adviser as a result of its relationship with the Fund(s).
SUPPLEMENT DATED NOVEMBER 4, 2015
TO THE PROSPECTUS DATED APRIL 27, 2015
JNL® INVESTORS SERIES TRUST
Please note that the changes apply to your variable annuity product(s).
Effective October 15, 2015, in the section entitled, “Summary Overview of Each Fund” for the JNL/PPM America Total Return Fund under “Portfolio Managers,” please delete the table in its entirety and replace it with the following:
Portfolio Managers:
Name: | | Joined
Fund Management
Team In: | | Title: |
Michael T. Kennedy | | 2009 | | Senior Managing Director and Portfolio Manager |
Anthony Balestrieri | | 2015 | | Executive Vice President and Chief Investment Officer-Total Return and Portfolio Manager |
(To be used with JMV7698 04/15, VC5869 04/15, JMV7697 04/15, VC5890 04/15, VC5890ML 04/15, VC4224 04/15, JMV8798 04/15, JMV9476 04/15, JMV5763ML 04/15, JMV9476ML 04/15, JMV5763WF 04/15, JMV9476WF 04/15, VC5995 04/15, JMV5765 04/15, JMV2731 04/15, JMV8037 04/15, JMV8037BE 04/15, JMV9476L 04/15, JMV7698NY 04/15, NV5869 04/15, JMV7697NY 04/15, NV5890 04/15, NV4224 04/15, JMV9476NY 04/15, NV4224WF 04/15, JMV9476WFNY 04/15, NMV2731 04/15, JMV8037NY 04/15, JMV8037BENY 04/15, JMV9476LNY 04/15, FVC4224FT 04/15, VC5526 04/15, VC3656 04/15, VC3657 04/15, VC3723 04/15, NV5526 04/15, and NV3784 04/15.)
CMV16428 11/15
This Supplement is dated November 4, 2015.
JNL Investor Series Trust
One Corporate Way
Lansing, MI 48951 | PRSRT STD
U.S. POSTAGE
PAID JACKSON NATIONAL
ASSET MANAGEMENT
L.L.C. |
CMV8381 01/16
Item 2. Code of Ethics.
As of the end of the period covered by this report, the registrant had adopted a code of ethics, as defined in Item 2 of Form N-CSR, applicable to its principal executive officer, principal financial officer, principal accounting officer or controller, or persons performing similar functions. There were no substantive amendments or any waivers to this code of ethics during the period covered by this report. A copy of this code of ethics is filed as exhibit 12(a)(1) to this Form N-CSR.
Item 3. Audit Committee Financial Expert.
The registrant has named William R. Rybak as an Audit Committee financial expert serving on its Audit Committee. William R. Rybak is not an “interested person” of the Trust, as that term is defined by Section 2(a)(19) of the Investment Company Act of 1940, as amended, and is considered “independent” for purposes of this Item.
An “audit committee financial expert” is not an “expert” for any purpose, including for purposes of Section 11 of the Securities Act of 1933, as amended, as a result of being designated as an “audit committee financial expert.” Further, the designation of a person as an “audit committee financial expert” does not mean that the person has any greater duties, obligations, or liability than those imposed on the person without the “audit committee financial expert” designation. Similarly, the designation of a person as an “audit committee financial expert” does not affect the duties, obligations, or liability of any other member of the Audit Committee or Board of Trustees.
Item 4. Principal Accountant Fees and Services.
(a)-(d)
In accordance with the terms of the Trust’s Amended and Restated Administration Agreement dated December 15, 2006, for the JNL Money Market Fund, JNAM, the Fund’s administrator, was responsible for the payment of all expenses associated with the annual audit and other required services of the independent registered public accounting firm, and all expenses associated with the preparation and filing of the tax returns.
KPMG LLP (“KPMG”) was appointed by the Board of Trustees as the independent registered public accounting firm of the registrant for the fiscal years ended December 31, 2014 and December 31, 2015. The following table sets forth aggregate fees billed by KPMG for the respective period for professional services rendered to the registrant.
Fees for Services Rendered to the Registrant by KPMG
Fiscal Year | | Audit Fees | | Audit-Related Fees | | Tax Fees | | All Other Fees | |
2014 | | $ | 45,499 | | $ | 0 | | $ | 11,750 | | $ | 0 | |
2015 | | 52,769 | | $ | 0 | | $ | 12,702 | | $ | 0 | |
| | | | | | | | | | | | | |
The above Tax Fees for 2014 and 2015 are the aggregate fees billed for professional services by KPMG to the registrant for tax compliance, tax advice, and tax return review.
Fees for Services Rendered to Adviser Entities by KPMG
The following table sets forth the amount of fees that were billed by KPMG for the respective period to any entity controlling, controlled by, or under common control with the investment adviser that provided
ongoing services to the registrant (“Adviser Entities”) that were directly related to the registrant’s operations and financial reporting.
Fiscal Year | | Audit-Related Fees | | Tax Fees | | All Other Fees | |
2014 | | $ | 134,017 | | $ | 10,500 | | $ | 0 | |
2015 | | $ | 140,795 | | $ | 17,000 | | $ | 0 | |
The above Audit-Related Fees are the aggregate fees billed to Adviser Entities for the performance of an attestation on the suitability of design and operating effectiveness of control pursuant to Statement on Standards for Attestation Engagements No. 16 of the registrant’s adviser and administrator and an audit of a non-registered affiliated investment company.
The above Tax Fees for 2014 and 2015 are the aggregate fees billed for professional services by KPMG to Adviser Entities for tax compliance, tax advice, and tax return review.
(e)(1) The Audit Committee is authorized to pre-approve non-audit services provided by the registrant’s auditors, if they find it appropriate in light of their fiduciary duties and in the exercise of their good faith business judgment and compatible with the auditors’ independence. The Chairman of the Audit Committee is authorized to approve audit and non-audit services for newly established Funds of the registrant on the same terms as the full Audit Committee previously had approved for the then existing Funds.
(e)(2) 0%
(f) Not applicable.
(g) As detailed in the tables above, the aggregate fees billed for all non-audit fees to the registrant and Adviser Entities for the fiscal year ended December 31, 2014, was $156,267. As detailed in the tables above, the aggregate fees billed for all non-audit fees to the registrant and Adviser Entities for the fiscal year ended December 31, 2015 was $170,497.
(h) For the fiscal years ended December 31, 2014 and December 31, 2015, the Audit Committee of the registrant’s Board of Trustees considered the provision of non-audit services that were rendered to the Adviser Entities that were not pre-approved pursuant to paragraph (c)(7)(ii) of Rule 2-01 of Regulation S-X, and concluded that such services were compatible with maintaining KPMG’s independence.
Item 5. Audit Committee of Listed Registrants.
Not applicable.
Item 6. Investments.
(a) Included as a part of the report to shareholders filed under Item 1.
(b) Not applicable.
Item 7. Disclosure of Proxy Voting Policies and Procedures for Closed-End Management Investment Companies.
Not applicable.
Item 8. Portfolio Managers of Closed-End Management Investment Companies.
Not applicable.
Item 9. Purchases of Equity Securities by Closed-End Management Investment Company and Affiliated Purchasers.
Not applicable.
Item 10. Submission of Matters to a Vote of Security Holders.
No material changes have been made.
Item 11. Controls and Procedures.
(a) The registrant maintains disclosure controls and procedures that are designed to ensure that information required to be disclosed in the registrant’s filings under the Securities Exchange Act of 1934, as amended, and the Investment Company Act of 1940, as amended, is recorded, processed, summarized, and reported within the periods specified in the rules and forms of the U.S. Securities and Exchange Commission. Such information is accumulated and communicated to the registrant’s management, including its principal executive officer and principal financial officer, as appropriate, to allow timely decisions regarding required disclosure. The registrant’s management, including the principal executive officer and the principal financial officer, recognizes that any set of controls and procedures, no matter how well designed and operated, can provide only reasonable assurance of achieving the desired control objectives.
Within ninety (90) days prior to the filing date of this report on Form N-CSR, the registrant had carried out an evaluation, under the supervision and with the participation of the registrant’s management, including the registrant’s principal executive officer and the registrant’s principal financial officer, of the effectiveness of the design and operation of the registrant’s disclosure controls and procedures. Based on such evaluation, the registrant’s principal executive officer and principal financial officer concluded that the registrant’s disclosure controls and procedures are effective.
(b) There have been no significant changes in the registrant’s internal controls over financial reporting during the registrant’s second fiscal quarter of the period covered by this report that have materially affected, or are reasonably likely to materially affect, the registrant’s internal controls over financial reporting. There have been no significant changes in the registrant’s internal controls or in other factors that could significantly affect the internal controls subsequent to the date of their evaluation in connection with the preparation of this report on Form N-CSR.
Item 12. Exhibits.
(a) | (1) Code of Ethics pursuant to Section 406 of the Sarbanes-Oxley Act of 2002 (as defined in Item 2(b) of Form N-CSR) is attached hereto. |
| (2) The certifications required by Rule 30a-2(a) under the Investment Company Act of 1940, as amended, are attached hereto. |
| (3) Not applicable. |
| |
(b) | The certification required by Rule 30a-2(b) under the Investment Company Act of 1940, as amended, is attached hereto. |
SIGNATURES
Pursuant to the requirements of the Securities Exchange Act of 1934, as amended, and the Investment Company Act of 1940, as amended, the registrant has duly caused this report to be signed on its behalf by the undersigned, thereunto duly authorized.
JNL Investors Series Trust |
|
|
By: | /s/ Mark D. Nerud | |
| Mark D. Nerud | |
| Principal Executive Officer | |
| | |
Date: | March 7, 2016 | |
Pursuant to the requirements of the Securities Exchange Act of 1934, as amended, and the Investment Company Act of 1940, as amended, this report has been signed below by the following persons on behalf of the registrant and in the capacities and on the dates indicated.
By: | /s/ Mark D. Nerud | |
| Mark D. Nerud | |
| Principal Executive Officer | |
| | |
Date: | March 7, 2016 | |
| | |
| | |
By: | /s/ Gerard A.M. Oprins | |
| Gerard A.M. Oprins | |
| Principal Financial Officer | |
| | |
Date: | March 7, 2016 | |
EXHIBIT LIST
Exhibit 12(a)(1) | Registrant’s Code of Ethics pursuant to Section 406 of the Sarbanes-Oxley Act of 2002. |
| |
Exhibit 12(a)(2) | Certification of the Principal Executive Officer required by Rule 30a-2(a) under the Investment Company Act of 1940, as amended. |
| |
| Certification of the Principal Financial Officer required by Rule 30a-2(a) under the Investment Company Act of 1940, as amended. |
| |
Exhibit 12(b) | Certification required by Rule 30a-2(b) under the Investment Company Act of 1940, as amended. |